Notebookcheck Logo

AMD Radeon HD 8350G

The AMD Radeon HD 8350G is a processor graphics card in the AMD Richland APUs (A4-5150M). It offers only 128 VLIW4 shader cores (8650G: 384). The 8350G has no dedicated graphics memory, but shares the main memory with the CPU cores.

The integrated UVD3 video decoder allows the full decoding of Multi-View Codec (MVC), MPEG-4 Part 2 (DivX, xVid), MPEG-4 AVC/H.264 and Adobe Flash HD videos.

According to the clock rates of 514 - 720 MHz (Turbo), the performance is only a few percent above a Radeon HD 7420G. Thus, the Radeon HD 8350G performs similar to a dedicated Radeon HD 7450M. Modern and demanding games (2013) will be only playable in very low settings and resolutions. Without fast dual-channel memory the performance drops even more.

The shaders of the chip can also be used for general computing.

The APU is manufactured in 32nm and rated at a TDP of 35 watts. This allows the chip to be used in notebooks from 13 to 14 inches or bigger.

Radeon HD 8000G Series

Radeon HD 8650G compare 384 @ 0.53 - 0.72 GHz
Radeon HD 8510G compare 384 @ 0.45 - 0.55 GHz
Radeon HD 8550G compare 256 @ 0.52 - 0.72 GHz
Radeon HD 8610G compare 384 @ 0.53 - 0.63 GHz
Radeon HD 8450G compare 192 @ 0.53 - 0.72 GHz
Radeon HD 8410G compare 192 @ 0.45 - 0.6 GHz
Radeon HD 8350G 128 @ 0.51 - 0.72 GHz
Radeon HD 8310G compare 128 @ 0.42 - 0.55 GHz
CodenameRichland
ArchitectureTerascale 3
Pipelines128 - unified
Core Speed514 - 720 (Boost) MHz
Shared Memoryyes
APIDirectX 11, Shader 5.0, OpenGL 4.2
technology32 nm
Notebook Sizemedium sized
Date of Announcement12.03.2013
CPU in Radeon HD 8350GGPU Base SpeedGPU Boost / Turbo
AMD A4-5150M2 x 2700 MHz, 35 W514 MHz720 MHz

Benchmarks

Performance Rating - 3DMark 11 + Fire Strike + Time Spy
0.2 pt (1%)
3DMark Vantage
3DM Vant. Perf. total +
3DM Vant. Perf. GPU no PhysX +
3DMark 06 3DMark 06 - Standard 1280x1024 +
Cinebench R10 Cinebench R10 Shading (32bit) +
Cinebench R11.5 Cinebench R11.5 OpenGL 64 Bit +
Cinebench R15
Cinebench R15 OpenGL 64 Bit +
Cinebench R15 OpenGL Ref. Match 64 Bit +
- Range of benchmark values for this graphics card
- Average benchmark values for this graphics card
* Smaller numbers mean a higher performance

Game Benchmarks

The following benchmarks stem from our benchmarks of review laptops. The performance depends on the used graphics memory, clock rate, processor, system settings, drivers, and operating systems. So the results don't have to be representative for all laptops with this GPU. For detailed information on the benchmark results, click on the fps number.

low 1280x720
11.5 11.6 ~ 12 fps    + Compare
med. 1920x1080
6.6  fps    + Compare
high 1920x1080
6.1  fps    + Compare
» The benchmarks indicate that the game is not playable in the tested settings.
low 1024x768
27.7  fps    + Compare
med. 1366x768
22.8  fps    + Compare
» The benchmarks indicate that the game is not playable in the tested settings.
Mad Max

Mad Max

2015
med. 1366x768
11  fps    + Compare
» The benchmarks indicate that the game is not playable in the tested settings.
low 1280x720
32.3  fps    + Compare
med. 1366x768
21.7  fps    + Compare
high 1920x1080
10.8  fps    + Compare
ultra 1920x1080
9.9  fps    + Compare
» The benchmarks indicate that the game is not playable in the tested settings.
low 1024x768
55.2  fps    + Compare
med. 1366x768
18  fps    + Compare
» With all tested laptops playable in detail settings low.
low 1024x768
18.7  fps    + Compare
med. 1366x768
11.8  fps    + Compare
» The benchmarks indicate that the game is not playable in the tested settings.
low 1024x768
25.8  fps    + Compare
med. 1366x768
8.7  fps    + Compare
» The benchmarks indicate that the game is not playable in the tested settings.
F1 2014

F1 2014

2014
low 1024x768
31  fps    + Compare
med. 1366x768
22  fps    + Compare
high 1920x1080
17  fps    + Compare
ultra 1920x1080
12  fps    + Compare
» The benchmarks indicate that the game is not playable in the tested settings.
low 1024x768
11.5  fps    + Compare
» The benchmarks indicate that the game is not playable in the tested settings.
low 1024x768
24.9  fps    + Compare
med. 1366x768
15.2  fps    + Compare
» The benchmarks indicate that the game is not playable in the tested settings.
low 1280x720
18  fps    + Compare
» The benchmarks indicate that the game is not playable in the tested settings.
Fifa 15

Fifa 15

2014
low 1280x720
29 (!)  fps    + Compare
» The benchmarks indicate that the game is not playable in the tested settings.
Sims 4

Sims 4

2014
low 1024x768
81  fps    + Compare
med. 1366x768
26.5  fps    + Compare
high 1920x1080
13.5  fps    + Compare
ultra 1920x1080
11.4  fps    + Compare
» With all tested laptops playable in detail settings low.
low 1024x768
22  fps    + Compare
med. 1366x768
12.5  fps    + Compare
» The benchmarks indicate that the game is not playable in the tested settings.
low 1024x768
57  fps    + Compare
med. 1366x768
23  fps    + Compare
high 1920x1080
13.3  fps    + Compare
ultra 1920x1080
12.5  fps    + Compare
» With all tested laptops playable in detail settings low.
low 1024x768
11.2  fps    + Compare
» The benchmarks indicate that the game is not playable in the tested settings.
low 1280x720
24.5  fps    + Compare + 📈 Graph
med. 1280x720
22.9  fps    + Compare
high 1920x1080
8.7  fps    + Compare
» The benchmarks indicate that the game is not playable in the tested settings.
low 1024x768
37  fps    + Compare
med. 1366x768
22.2  fps    + Compare
high 1366x768
12.3  fps    + Compare
» With all tested laptops playable in detail settings low.
Titanfall

Titanfall

2014
low 1024x768
31.9  fps    + Compare
» The benchmarks indicate that the game is not playable in the tested settings.
Thief

Thief

2014
low 1024x768
10.1  fps    + Compare
med. 1366x768
7.6  fps    + Compare
» The benchmarks indicate that the game is not playable in the tested settings.
low 1024x768
36.7  fps    + Compare
med. 1366x768
15.5  fps    + Compare
» With all tested laptops playable in detail settings low.
low 1024x768
15.5  fps    + Compare
» The benchmarks indicate that the game is not playable in the tested settings.
low 1024x768
20  fps    + Compare
med. 1366x768
13  fps    + Compare
» The benchmarks indicate that the game is not playable in the tested settings.
low 1024x768
25.8  fps    + Compare
med. 1366x768
18.2  fps    + Compare
high 1366x768
13.1  fps    + Compare
» The benchmarks indicate that the game is not playable in the tested settings.
F1 2013

F1 2013

2013
low 1024x768
33  fps    + Compare
med. 1366x768
22  fps    + Compare
high 1366x768
20  fps    + Compare
ultra 1920x1080
12  fps    + Compare
» The benchmarks indicate that the game is not playable in the tested settings.
low 1024x768
32.5 (!)  fps    + Compare
med. 1366x768
24.8  fps    + Compare
high 1366x768
19.7  fps    + Compare
» The benchmarks indicate that the game is not playable in the tested settings.
Dota 2

Dota 2

2013
low 1024x768
34  fps    + Compare
med. 1366x768
23.7  fps    + Compare
ultra 1920x1080
11.1  fps    + Compare
» The benchmarks indicate that the game is not playable in the tested settings.
low 1024x768
10.7  fps    + Compare
med. 1366x768
9  fps    + Compare
» The benchmarks indicate that the game is not playable in the tested settings.
SimCity

SimCity

2013
low 1024x768
36  fps    + Compare
med. 1366x768
17  fps    + Compare
» With all tested laptops playable in detail settings low.
low 1024x768
43.7  fps    + Compare
med. 1366x768
20.9  fps    + Compare
high 1366x768
14  fps    + Compare
ultra 1920x1080
4.9  fps    + Compare
» With all tested laptops playable in detail settings low.
Crysis 3

Crysis 3

2013
low 1024x768
21.2  fps    + Compare
med. 1366x768
12.7  fps    + Compare
» The benchmarks indicate that the game is not playable in the tested settings.
Anno 2070

Anno 2070

2011
low 1024x768
58  fps    + Compare
med. 1366x768
23  fps    + Compare
high 1366x768
15.1  fps    + Compare
ultra 1920x1080
5.9  fps    + Compare
» With all tested laptops playable in detail settings low.
low 1280x720
33.2  fps    + Compare
med. 1366x768
24  fps    + Compare
high 1366x768
16.1  fps    + Compare
ultra 1920x1080
8  fps    + Compare
» The benchmarks indicate that the game is not playable in the tested settings.
Supreme Commander - FA Bench

Supreme Commander - FA Bench

2007
low 1024x768
32.2  fps    + Compare
high 1024x768
21.4  fps    + Compare
» The benchmarks indicate that the game is not playable in the tested settings.
lowmed.highultraQHD4K
X-Plane 11.11126.566.08
Metal Gear Solid V27.722.8
Mad Max11
Dota 2 Reborn32.321.710.89.9
Dirt Rally55.218
Battlefield Hardline18.711.8
Civilization: Beyond Earth25.88.7
F1 201431221712
The Evil Within11.5
Alien: Isolation24.915.2
Middle-earth: Shadow of Mordor18
Fifa 1529
Sims 48126.513.511.4
Risen 3: Titan Lords2212.5
GRID: Autosport572313.312.5
Watch Dogs11.2
Wolfenstein: The New Order24.522.98.7
The Elder Scrolls Online3722.212.3
Titanfall31.9
Thief10.17.6
X-Plane 10.2536.715.5
Need for Speed: Rivals15.5
Call of Duty: Ghosts2013
Battlefield 425.818.213.1
F1 201333222012
Total War: Rome II32.524.819.7
Dota 23423.711.1
Company of Heroes 210.79
SimCity3617
Tomb Raider43.720.9144.9
Crysis 321.212.7
Anno 2070582315.15.9
The Elder Scrolls V: Skyrim33.22416.18
Supreme Commander - FA Bench32.221.4
< 30 fps
< 60 fps
< 120 fps
≥ 120 fps
17
15
1
27


14


9


For more games that might be playable and a list of all games and graphics cards visit our Gaming List

Add one or more devices and compare

In the following list you can select (and also search for) devices that should be added to the comparison. You can select more than one device.

restrict list:

show all (including archived), 2024, 2023
v1.26
log 05. 19:53:38

#0 no ids found in url (should be separated by "_") +0s ... 0s

#1 not redirecting to Ajax server +0s ... 0s

#2 did not recreate cache, as it is less than 5 days old! Created at Mon, 04 Mar 2024 05:34:43 +0100 +0.001s ... 0.001s

#3 composed specs +0.044s ... 0.045s

#4 did output specs +0s ... 0.045s

#5 start showIntegratedCPUs +0s ... 0.045s

#6 getting avg benchmarks for device 4044 +0.029s ... 0.074s

#7 got single benchmarks 4044 +0.007s ... 0.081s

#8 got avg benchmarks for devices +0s ... 0.081s

#9 min, max, avg, median took s +0.37s ... 0.451s

#10 before gaming benchmark output +0s ... 0.451s

#11 Got 84 rows for game benchmarks. +0.005s ... 0.456s

#12 composed SQL query for gamebenchmarks +0s ... 0.456s

#13 got data and put it in $dataArray +0.021s ... 0.476s

#14 benchmarks composed for output. +0.77s ... 1.247s

#15 return log +0.048s ... 1.294s

League of Legends (LoL)

Playing LoL 5.3 a 5 vs 5 map against bots in the highest settings including AA and 1920x1080 resulted in slightly stuttering 25 fps with a min of 16. Reducing the details to high and turning off anti-aliasing, the game was fluid at 33 fps (min 21 fps). With minimum settings and still full HD resolution we recorded an average of 52 fps.
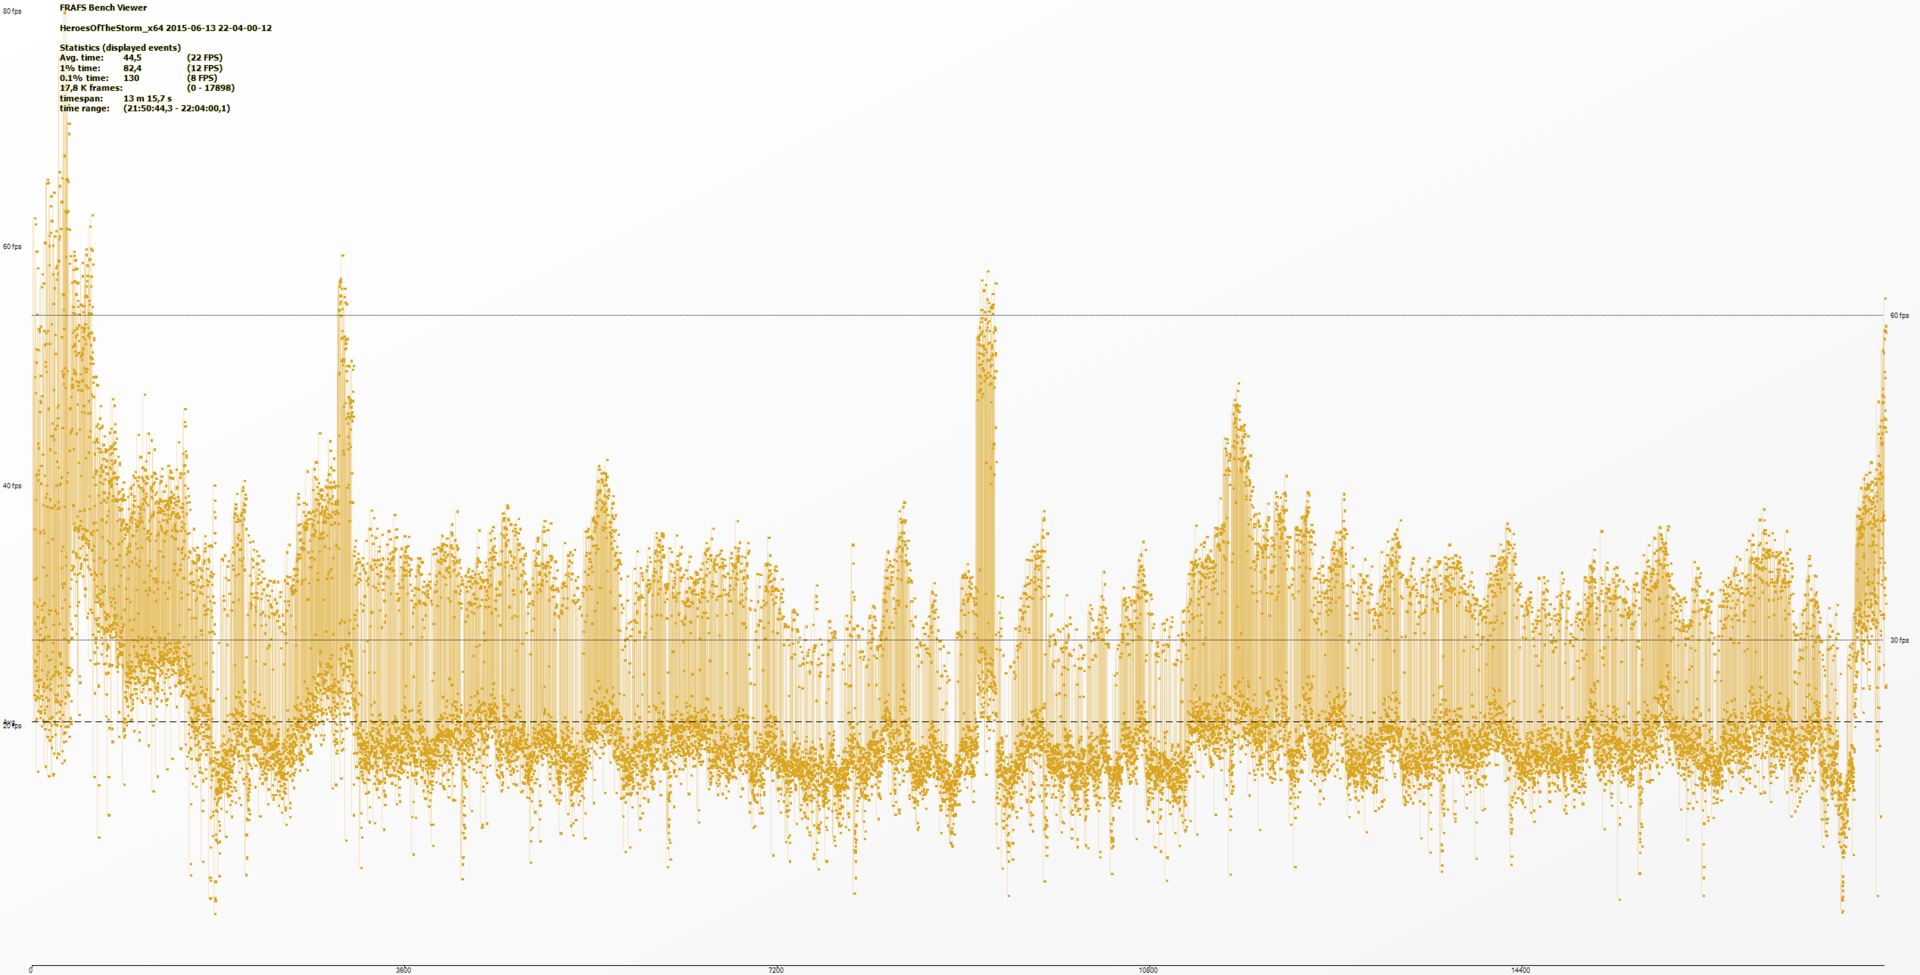
Heroes of the Storm

In medium detail settings with 1366x768 we benchmarked only 22 fps on average on a 5 vs 5 game with bots. Still the game was playable. Reducing the details and resolution resulted in a much better framerate.

Heroes of the Storm was playable in 1366x768 and medium detail settings with the A4-5150M altough the average fps rate was only 22.

No reviews found for this graphics card.

Please share our article, every link counts!

» Comparison of GPUs
Detailed list of all laptop GPUs sorted by class and performance.

» Benchmark List
Sort and restrict laptop GPUs based on performance in synthetic benchmarks.

» Notebook Gaming List
Playable games for each graphics card and their average FPS results.

Class 1

Class 2

Radeon PRO W6600M *

Class 3

UHD Graphics 32EUs
UHD Graphics 750

Class 4

Class 5

* Approximate position of the graphics adapter