Notebook reviews with NVIDIA GeForce RTX 2060 Mobile graphics card
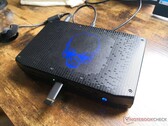
Kaby Lake-G Is History: Intel Phantom Canyon NUC11PHKi7C Review
Instead of developing a second generation Kaby Lake-G, Intel has simply swapped out AMD for Nvidia to essentially put an end to the short-lived Intel-AMD chipset. The results are worthwhile even if the new NUC is a bit thicker and heavier than before.
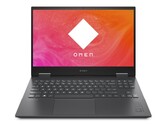
Intel Core i7-1165G7, NVIDIA GeForce RTX 2060 Mobile, 1.4 kgHP Omen 15 laptop Review: Strong AMD processor makes Intel tremble
The AMD version of the HP Omen 15 scores with powerful components at a fair price on paper. In the test configuration, the GeForce RTX 2060 is accompanied by a Ryzen 7 4800H. Find out here whether the cooling system plays along and which strengths and weaknesses the 15-incher has otherwise.
AMD Ryzen 7 4800H, NVIDIA GeForce RTX 2060 Mobile, 15.6", 2.2 kgAcer Predator Triton 300 PT315 Laptop Review: A 120 Hz Panel Could Be Better
The Acer Predator Triton 300 is yet another Gaming laptop upgraded with a Comet Lake CPU. At around $1,400 you get an up-to-date CPU, a 120 Hz panel, and an Nvidia GeForce RTX 2060. Find out how well this hardware performs in everyday use in our review.
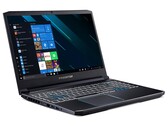
Intel Core i7-10750H, NVIDIA GeForce RTX 2060 Mobile, 15.6", 2.1 kgAcer Predator Helios 300 PH315-53 in review: Fast gaming machine with extra performance
The Predator Helios 300 brings all modern computer games smoothly onto the matte screen (Full HD, IPS, 144 Hz). Since Acer only uses one RAM module, memory runs in single-channel mode.
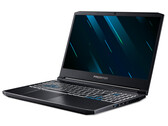
Intel Core i7-10750H, NVIDIA GeForce RTX 2060 Mobile, 15.6", 2.5 kgAcer Predator Helios 300 PH317-54 Review: GPU overclocking with a press of a button
The Predator Helios 300 can run all current games smoothly. It features a 17.3-inch 144-Hz Full HD screen. Users can install up to three storage devices in the Acer laptop.
Intel Core i7-10750H, NVIDIA GeForce RTX 2060 Mobile, 17.3", 2.8 kgAorus 5 KB: Intel Core i7-10750H, 15.60", 2.1 kg
Review » Aorus 5 KB laptop in review: Gigabyte builds upon Clevo barebone with the RTX 2060
Aorus 7 KB: Intel Core i7-10750H, 17.30", 2.5 kg
Review » Aorus 7 KB in review: Well-rounded gaming laptop with upgrade options
Gateway Creator Series 15.6 GWTN156-3BK: Intel Core i5-10300H, 15.60", 2 kg
Review » Walmart Gateway Creator Series 15 Laptop Review: GeForce RTX 2060 For Under $1000 USD
Schenker XMG Core 15 GK5NR0O: AMD Ryzen 7 4800H, 15.60", 2 kg
Review » Schenker XMG Core 15 (Tongfang GK5NR0O) Laptop Review: AMD gamer with a good price-performance ratio
Dell G3 15 3500-G4DG2: Intel Core i7-10750H, 15.60", 2.3 kg
Review » Dell G3 15 3500 laptop in review: Robust gaming notebook with 144 Hz screen
Eluktronics RP-17: AMD Ryzen 7 4800H, 17.30", 2.6 kg
Review » Eluktronics Matrix RP-17 Laptop Review: Core i9 Performance Without The Core i9 Price
MSI GS66 Stealth 10SE-045: Intel Core i7-10750H, 15.60", 2.2 kg
Review » MSI GS66 Stealth 10SE in review: Classy gaming laptop with a 240 Hz display
Lenovo Legion 5 15IMH05H: Intel Core i5-10300H, 15.60", 2.5 kg
Review » Lenovo Legion 5 15IMH05H Review: Excellent power delivery and good battery life
MSI GE75 Raider 10SE-008US: Intel Core i7-10750H, 17.30", 2.6 kg
Review » MSI GE75 Raider 10SE Laptop Review: 10th Gen Core i7 and GeForce RTX Combo
Acer Nitro 5 AN517-52-77DS: Intel Core i7-10750H, 17.30", 2.2 kg
Review » Acer Nitro 5 AN517-52 in review: Largely well-rounded gaming laptop offers decent battery life
Asus TUF Gaming A15 FA506IV-HN172: AMD Ryzen 7 4800H, 15.60", 2.2 kg
Review » Asus TUF A15 with AMD Renoir and Nvidia Graphics in Review
Eluktronics RP-15: AMD Ryzen 7 4800H, 15.60", 1.9 kg
Review » Eluktronics RP-15 Laptop Review: The Ryzen 7 4800H Impresses Yet Again
Acer ConceptD 5 CN517-71-74YA: Intel Core i7-9750H, 17.30", 2.8 kg
Review » Acer ConceptD 5 17 inch Review: Creativity in large format
Schenker XMG Pro 17 PB71RD-G: Intel Core i7-9750H, 17.30", 2.8 kg
Review » Schenker XMG Pro 17 (Clevo PB71RD-G) Laptop Review: Temperature vs. Noise
Walmart EVOO Gaming 17: Intel Core i7-9750H, 17.30", 2.5 kg
Review » Walmart EVOO Gaming 17 Review: Chinese Laptop with Walmart's Name Slapped On
Schenker XMG Neo 17 XNE17M19: Intel Core i7-9750H, 17.30", 2.5 kg
Review » Schenker XMG Neo 17 (Tongfang GK7CP0S) Laptop Review: A good package
Xiaomi Mi Gaming Laptop 2019: Intel Core i7-9750H, 15.60", 2.6 kg
Review » Xiaomi Mi Gaming Laptop 2019 Review: Return of the Exotic
Acer ConceptD 7 CN715-71-743N: Intel Core i7-9750H, 15.60", 2.2 kg
Review » Acer ConceptD 7 Laptop in Review: Top-of-the-line Intel CPU with throttling behavior
Lenovo Legion Y740-17IRH: Intel Core i7-9750H, 17.30", 3 kg
Review » Lenovo Legion Y740-17IRH Review: Gaming bolide gets high marks for its great power delivery and low heat development
Dell G7 7590: Intel Core i7-9750H, 15.60", 2.5 kg
Review » Dell G7 15 7590 Laptop Review: Alienware Performance for Less
MSI GL75 9SEK-056US: Intel Core i7-9750H, 17.30", 2.5 kg
Review » MSI GL75 9SEK Laptop Review - An average mid-range gaming laptop with loud fans
MSI GL65 9SEK: Intel Core i7-9750H, 15.60", 2.3 kg
Review » MSI GL65 9SEK Laptop Review: Much More Portable than the GL63
Asus ZenBook Pro Duo UX581GV: Intel Core i9-9980HK, 15.60", 2.5 kg
Review » ZenBook on Steroids: Asus ZenBook Pro Duo UX581 Laptop Review
MSI GP65 Leopard 9SE-225US: Intel Core i7-9750H, 15.60", 2.3 kg
Review » MSI GP65 Leopard 9SE Laptop Review - The best screen on a mid-tier gaming laptop
Asus Strix Hero III G731GV: Intel Core i7-9750H, 17.30", 2.9 kg
Review » Asus Strix Hero III G731GV RTX 2060 Laptop Review - Not that Much Better than the G731GU GTX 1660 Ti
Razer Blade Pro 17 RTX 2060: Intel Core i7-9750H, 17.30", 2.8 kg
Review » Razer Blade Pro 17 RTX 2060 Laptop Review: How does it Compare to the RTX 2080 Max-Q?
Lenovo Legion Y540-15IRH: Intel Core i7-9750H, 15.60", 2.3 kg
Review » Lenovo Legion Y540 with RTX 2060 laptop review: Gaming laptop with good sound and 144 Hz panel
Asus Strix GL531GV-PB74: Intel Core i7-9750H, 15.60", 2.4 kg
Review » Asus ROG Strix G GL531GV Laptop Review: Like a Zephyrus, but Cheaper
Dell G5 15 5590: Intel Core i7-8750H, 15.60", 2.7 kg
Review » Dell G5 15 5590 (i7-8750H, RTX 2060, SSD, FHD) Laptop Review
Aorus 15 W9: Intel Core i7-8750H, 15.60", 2.2 kg
Review » Aorus 15-W9 (i7-8750H, RTX 2060) Laptop Review
MSI GL73 8SE-010US: Intel Core i7-8750H, 17.30", 2.7 kg
Review » MSI GL73 8SE (i7-8750H, RTX 2060) Laptop Review
Dell G3 15 3500-G4DG2: Intel Core i7-10750H, 15.60", 2.3 kg
External Review » Dell G3 15 3500-G4DG2
BTO Notebooks X-Book 15X1187-AMD: AMD Ryzen 7 4800H, 15.60"
External Review » BTO Notebooks X-Book 15X1187-AMD
Acer Nitro 5 AN517-51-76V6: Intel Core i7-9750H, 17.30", 2.7 kg
External Review » Acer Nitro 5 AN517-51-76V6
MSI GS66 Stealth 10SE-092NL: Intel Core i7-10750H, 15.60", 2.1 kg
External Review » MSI GS66 Stealth 10SE-092NL
HP Omen 15-en825no: AMD Ryzen 7 4800H, 15.60", 2.5 kg
External Review » HP Omen 15-en825no
Acer Nitro 5 AN515-55-524P: Intel Core i5-10300H, 15.60", 2.3 kg
External Review » Acer Nitro 5 AN515-55-524P
Lenovo Legion Y540 15IRH-81SX007YMH: Intel Core i7-9750H, 15.60", 2.3 kg
External Review » Lenovo Legion Y540 15IRH-81SX007YMH
Asus TUF Gaming A15 FA506IV-AS76: AMD Ryzen 7 4800H, 15.60", 2.3 kg
External Review » Asus TUF Gaming A15 FA506IV-AS76
Acer Nitro 5 AN517-52-758K: Intel Core i7-10750H, 17.30", 2.2 kg
External Review » Acer Nitro 5 AN517-52-758K
HP Omen 15-en0016ns: AMD Ryzen 7 4800H, 15.60", 2.4 kg
External Review » HP Omen 15-en0016ns
MSI Stealth 15M A11SEK-055XES: Intel Core i7-1185G7, 15.60", 1.7 kg
External Review » MSI Stealth 15M A11SEK-055XES
Lenovo Legion C7 15IMH05-82EH002CUK: Intel Core i7-10750H, 15.60", 2.2 kg
External Review » Lenovo Legion C7 15IMH05-82EH002CUK
Dell G7 15 7500, i7-10750H RTX 2060: Intel Core i7-10750H, 15.60", 2.3 kg
External Review » Dell G7 15 7500, i7-10750H RTX 2060
MSI GF75 Thin 10SER-427XES: Intel Core i7-10750H, 17.30", 2.3 kg
External Review » MSI GF75 Thin 10SER-427XES
Gigabyte Aorus 7 KB-7ES1130SD: Intel Core i7-10750H, 17.30", 2.5 kg
External Review » Gigabyte Aorus 7 KB-7ES1130SD
HP Omen 15-en0017ns: AMD Ryzen 7 4800H, 15.60", 2.5 kg
External Review » HP Omen 15-en0017ns
Asus Strix G712LV-H7077: Intel Core i7-10750H, 17.30", 2.9 kg
External Review » Asus Strix G712LV-H7077
Lenovo Legion Y540-15IRH-HASP: Intel Core i7-9750H, 15.60", 2.3 kg
External Review » Lenovo Legion Y540-15IRH-HASP
MSI GL75 10SER-257XTR: Intel Core i7-10750H, 17.30", 2.6 kg
External Review » MSI GL75 10SER-257XTR
Lenovo Legion 5 15IMH05H-81Y60043GE: Intel Core i5-10300H, 15.60", 2.5 kg
External Review » Lenovo Legion 5 15IMH05H-81Y60043GE
Medion Akoya S15801, i7-10750H RTX 2060: Intel Core i7-10750H, 15.60", 1.8 kg
External Review » Medion Akoya S15801, i7-10750H RTX 2060
Acer Nitro 5 AN517-51-77QV: Intel Core i7-9750H, 17.30", 2.7 kg
External Review » Acer Nitro 5 AN517-51-77QV
Lenovo Legion Slim 7i: Intel Core i7-10870H, 15.60", 1.9 kg
External Review » Lenovo Legion Slim 7i
HP Omen 15-ek0600nd: Intel Core i7-10750H, 15.60", 2.4 kg
External Review » HP Omen 15-ek0600nd
Lenovo Legion 5 15IMH05H-81Y600J7SP: Intel Core i7-10750H, 15.60", 2.5 kg
External Review » Lenovo Legion 5 15IMH05H-81Y600J7SP
MSI GF65 Thin 10SER-884XES: Intel Core i7-10750H, 15.60", 1.9 kg
External Review » MSI GF65 Thin 10SER-884XES
HP Omen 15-en0009ns: AMD Ryzen 7 4800H, 15.60", 2.5 kg
External Review » HP Omen 15-en0009ns
HP Omen 15-en0004ns: AMD Ryzen 7 4800H, 15.60", 2.5 kg
External Review » HP Omen 15-en0004ns
Asus ROG Strix G15 G512LV-HN090: Intel Core i7-10750H, 15.60", 2.4 kg
External Review » Asus ROG Strix G15 G512LV-HN090
Asus Strix G17 G712LV-H7007: Intel Core i7-10750H, 17.30", 2.9 kg
External Review » Asus Strix G17 G712LV-H7007
Acer Nitro 5 AN515-54-70KK: Intel Core i7-9750H, 15.60", 2.3 kg
External Review » Acer Nitro 5 AN515-54-70KK
MSI Creator 15M A10SE-646IT: Intel Core i7-10750H, 15.60", 1.9 kg
External Review » MSI Creator 15M A10SE-646IT
Asus ROG Strix G15 G512LV-AZ125T: Intel Core i7-10750H, 15.60", 2.4 kg
External Review » Asus ROG Strix G15 G512LV-AZ125T
MSI GL75 Leopard 10SEK-261XES: Intel Core i7-10750H, 17.30", 2.6 kg
External Review » MSI GL75 Leopard 10SEK-261XES
Asus ROG Strix G15 G512LV-HN221: Intel Core i7-10875H, 15.60", 2.4 kg
External Review » Asus ROG Strix G15 G512LV-HN221
Lenovo Legion 5 15ARH05H-82B1000RRU: AMD Ryzen 5 4600H, 15.60", 2.5 kg
External Review » Lenovo Legion 5 15ARH05H-82B1000RRU
Honor Hunter V700: Intel Core i7-10750H, 16.10", 2.5 kg
External Review » Honor Hunter V700
Gigabyte Aorus 5 KB-7ES1130SD: Intel Core i7-10750H, 15.60"
External Review » Gigabyte Aorus 5 KB-7ES1130SD
HP Omen 15-en0046nf: AMD Ryzen 7 4800H, 15.60", 2.4 kg
External Review » HP Omen 15-en0046nf
Lenovo Legion 5P AMD 4900H: AMD Ryzen 9 4900H, 15.60", 2.5 kg
External Review » Lenovo Legion 5P AMD 4900H
Lenovo Legion 5 15ARH05H-82B1003EMH: AMD Ryzen 7 4800H, 15.60", 2.5 kg
External Review » Lenovo Legion 5 15ARH05H-82B1003EMH
Lenovo Legion 5 15ARH05H-82B1008ASP: AMD Ryzen 7 4800H, 15.60", 2.5 kg
External Review » Lenovo Legion 5 15ARH05H-82B1008ASP
Gateway Creator Series 15.6 GWTN156-3BK: Intel Core i5-10300H, 15.60", 2 kg
External Review » Gateway Creator Series 15.6 GWTN156-3BK
Acer Nitro 5 AN517-51-75JE: Intel Core i7-9750H, 17.30", 2.7 kg
External Review » Acer Nitro 5 AN517-51-75JE
MSI GL65 10SER, i5-10300H RTX 2060: Intel Core i5-10300H, 15.60", 2.3 kg
External Review » MSI GL65 10SER, i5-10300H RTX 2060
Origin PC NS-15: AMD Ryzen 7 3700X, 15.60", 2.2 kg
External Review » Origin PC NS-15
Monster Tulpar T5 V19.2: Intel Core i7-10750H, 15.60", 2.1 kg
External Review » Monster Tulpar T5 V19.2
MSI GS66 Stealth 10SE-616XES: Intel Core i7-10875H, 15.60", 2.1 kg
External Review » MSI GS66 Stealth 10SE-616XES
Acer Predator Helios 300 PH315-53-71NT: Intel Core i7-10750H, 15.60", 2.5 kg
External Review » Acer Predator Helios 300 PH315-53-71NT
MSI GF65 Thin 9SEXR-687XES: Intel Core i5-9300H, 14.00", 1.5 kg
External Review » MSI GF65 Thin 9SEXR-687XES
Lenovo Legion Y740SI-81YX000VGE: Intel Core i7-10750H, 15.60", 1.7 kg
External Review » Lenovo Legion Y740SI-81YX000VGE
Lenovo Legion Y540-15IRH-81SX014NSP: Intel Core i5-9300H, 15.60", 2.3 kg
External Review » Lenovo Legion Y540-15IRH-81SX014NSP
Lenovo Legion 5 15IMH05H-81Y600ALMH: Intel Core i7-10750H, 15.60", 2.5 kg
External Review » Lenovo Legion 5 15IMH05H-81Y600ALMH
HP Omen 15-en0013ax: AMD Ryzen 7 4800H, 15.60", 2.4 kg
External Review » HP Omen 15-en0013ax
HP Omen 15-ek0005ns: Intel Core i7-10750H, 15.60", 2.4 kg
External Review » HP Omen 15-ek0005ns
Lenovo Legion Y540-15IRH-81SX00HVSP: Intel Core i7-9750H, 15.60", 2.3 kg
External Review » Lenovo Legion Y540-15IRH-81SX00HVSP
Dell G7 17 7700, i7-10750H RTX 2060: Intel Core i7-10750H, 17.30", 3.3 kg
External Review » Dell G7 17 7700, i7-10750H RTX 2060
MSI GF65 Thin 9SEXR-249: Intel Core i5-9300H, 15.60", 1.9 kg
External Review » MSI GF65 Thin 9SEXR-249
Asus ROG Strix G15 G512LW-HN852: Intel Core i7-10875H, 15.60", 2.3 kg
External Review » Asus ROG Strix G15 G512LW-HN852
Lenovo Legion Y540-15IRH-81SX012LGE: Intel Core i5-9300HF, 15.60", 2.3 kg
External Review » Lenovo Legion Y540-15IRH-81SX012LGE
HP Pavilion Gaming 16-a0025ns: Intel Core i7-10750H, 16.10", 2.4 kg
External Review » HP Pavilion Gaming 16-a0025ns
Acer Nitro 5 AN515-55-71M0: Intel Core i7-10750H, 15.60", 2.3 kg
External Review » Acer Nitro 5 AN515-55-71M0
Aorus 7 KB: Intel Core i7-10750H, 17.30", 2.5 kg
External Review » Aorus 7 KB
Asus Strix G15 G512LV-AZ126T: Intel Core i7-10750H, 15.60", 2.4 kg
External Review » Asus Strix G15 G512LV-AZ126T
Asus TUF Gaming A15 FA506IV-HN337: AMD Ryzen 7 4800H, 15.60", 2.3 kg
External Review » Asus TUF Gaming A15 FA506IV-HN337
Acer Nitro 5 AN517-52: Intel Core i5-10300H, 17.30", 2.2 kg
External Review » Acer Nitro 5 AN517-52
MSI GL75 10SEK-039ES: Intel Core i7-10750H, 17.30", 2.6 kg
External Review » MSI GL75 10SEK-039ES
Asus ROG Zephyrus M15 GU502GV-AZ037T: Intel Core i7-9750H, 15.60", 1.9 kg
External Review » Asus ROG Zephyrus M GU502GV-AZ037T
Lenovo Legion 5 15IMH05H-81Y60093MH: Intel Core i7-10750H, 15.60", 2.5 kg
External Review » Lenovo Legion 5 15IMH05H-81Y60093MH
Dell G5 15 5500-RVHTJ: Intel Core i7-10750H, 15.60", 2.4 kg
External Review » Dell G5 15 5500-RVHTJ
MSI GF65 Thin 9SEXR-686XES: Intel Core i7-9750H, 15.60"
External Review » MSI GF65 Thin 9SEXR-686XES
Asus TUF Gaming F15 FX506IV-BQ123T: AMD Ryzen 7 4800H, 15.60", 2.3 kg
External Review » Asus TUF Gaming A15 FX506IV-BQ123T
Asus Zephyrus M15: Intel Core i7-10750H, 15.60", 1.9 kg
External Review » Asus Zephyrus M15
MSI GF65 10SER-690: Intel Core i7-10750H, 15.60", 1.9 kg
External Review » MSI GF65 10SER-690
Lenovo Legion 7 15IMH05-81YT005BMH: Intel Core i7-10750H, 15.60", 2.3 kg
External Review » Lenovo Legion 7 15IMH05-81YT005BMH
Asus ROG Strix G15 G512LV-AL007: Intel Core i7-10750H, 15.60", 2.4 kg
External Review » Asus ROG Strix G15 G512LV-AL007
MSI GF65 Thin 9SEXR-441RU: Intel Core i5-9300H, 15.60", 1.9 kg
External Review » MSI GF65 Thin 9SEXR-441RU
Acer Nitro 7 AN715-52-78D5: Intel Core i7-10750H, 15.60", 2.5 kg
External Review » Acer Nitro 7 AN715-52-78D5
MSI GL65 10SEK-241XES: Intel Core i7-10750H, 15.60", 2.3 kg
External Review » MSI GL65 10SEK-241XES
Acer Nitro 5 AN515-55-73Y6: Intel Core i7-10750H, 15.60", 2.3 kg
External Review » Acer Nitro 5 AN515-55-73Y6
Lenovo Legion 5i 15-81Y6000FUS: Intel Core i7-10750H, 15.60", 2.3 kg
External Review » Lenovo Legion 5i 15-81Y6000FUS
HP Omen 17-cb1055ng: Intel Core i7-10750H, 17.30", 3.3 kg
External Review » HP Omen 17-cb1055ng
HP Omen 15-dh1059nr: Intel Core i7-10750H, 15.60", 2.4 kg
External Review » HP Omen 15-dh1059nr
MSI Creator 17 A10SE-256: Intel Core i7-10875H, 17.30", 2.5 kg
External Review » MSI Creator 17 A10SE-256
Acer Predator Helios 300 PH315-53-700X: Intel Core i7-10750H, 15.60", 2.3 kg
External Review » Acer Predator Helios 300 PH315-53-700X
Acer Predator Helios 300 PH317-54-71AE: Intel Core i7-10750H, 17.30", 2.9 kg
External Review » Acer Predator Helios 300 PH317-54-71AE
Asus Strix G17 G712LV-EV047T: Intel Core i7-10750H, 17.30", 2.9 kg
External Review » Asus Strix G17 G712LV-EV047T
MSI Creator 17M A10SE-214: Intel Core i7-10750H, 17.30", 2.2 kg
External Review » MSI Creator 17M A10SE-214
Aorus 7 KB-7DE1130SH: Intel Core i7-10750H, 17.30", 2.5 kg
External Review » Aorus 7 KB-7DE1130SH
Asus TUF FX505DV-AL116: AMD Ryzen 7 3750H, 15.60", 2.2 kg
External Review » Asus TUF FX505DV-AL116
Acer Nitro 5 AN517-52-77DS: Intel Core i7-10750H, 17.30", 2.2 kg
External Review » Acer Nitro 5 AN517-52-77DS
Asus TUF Gaming A15 FA506IV-HN320T: AMD Ryzen 9 4900H, 15.60", 2.3 kg
External Review » Asus TUF Gaming A15 FA506IV-HN320T
Acer Predator Helios 300 PH317-54-728H: Intel Core i7-10750H, 17.30", 2.9 kg
External Review » Acer Predator Helios 300 PH317-54-728H
MSI GP75 Leopard 10SEK: Intel Core i7-10750H, 17.30", 2.6 kg
External Review » MSI GP75 Leopard 10SEK
Asus TUF Gaming A15 566IV-AL155T: AMD Ryzen 7 4800H, 15.60", 2.1 kg
External Review » Asus TUF Gaming A15 566IV-AL155T
Asus TUF Gaming A15 FA506IV-AL064T: AMD Ryzen 7 4800H, 15.60", 2.3 kg
External Review » Asus TUF Gaming A15 FA506IV-AL064T
Asus TUF Gaming F15 FX506IV: AMD Ryzen 7 4800H, 15.60", 2.3 kg
External Review » Asus TUF Gaming A15 FX506IV
MSI GE66 Raider 10SE: Intel Core i7-10750H, 15.60"
External Review » MSI GE66 Raider 10SE
Lenovo Legion 5 15IMH05H-81Y6003QMH: Intel Core i7-10750H, 15.60", 2.5 kg
External Review » Lenovo Legion 5 15IMH05H-81Y6003QMH
Aorus 5 KB-7US1130SH: Intel Core i7-10750H, 15.60", 2.2 kg
External Review » Aorus 5 KB-7US1130SH
Gigabyte Aero 15 OLED KB-8NL5130SP: Intel Core i7-10875H, 15.60", 2 kg
External Review » Gigabyte Aero 15 OLED KB-8NL5130SP
Asus Zephyrus G14 GA401IV-011T: AMD Ryzen 9 4900HS, 14.00", 1.7 kg
External Review » Asus Zephyrus G14 GA401IV-011T
MSI GL65 10SEK: Intel Core i7-10750H, 15.60", 2.3 kg
External Review » MSI GL65 10SEK
MSI GS66 Stealth 10SE-045: Intel Core i7-10750H, 15.60", 2.2 kg
External Review » MSI GS66 Stealth 10SE-045
Asus ProArt StudioBook 15 H500GV-HC012R: Intel Core i7-9750H, 15.60", 2 kg
External Review » Asus ProArt StudioBook 15 H500GV-HC012R
Asus ProArt StudioBook 15 H500GV-XS76: Intel Core i7-9750H, 15.60", 2 kg
External Review » Asus ProArt StudioBook 15 H500GV-XS76
MSI GL75 10SEK-040XES: Intel Core i7-10750H, 17.30", 2.6 kg
External Review » MSI GL75 10SEK-040XES
Schenker XMG Apex 15 Ryzen 5 3600, RTX 2060: unknown, 15.60", 2.6 kg
External Review » Schenker XMG Apex 15 Ryzen 5 3600, RTX 2060
Asus ROG Zephyrus M15 GU502GV-AZ038T: Intel Core i7-9750H, 15.60", 1.9 kg
External Review » Asus ROG Zephyrus M GU502GV-AZ038T
Asus TUF Gaming A15 FA506IV-AL029T: AMD Ryzen 7 4800H, 15.60", 1.7 kg
External Review » Asus TUF Gaming A15 FA506IV-AL029T
Asus ZenBook Pro Duo UX581GV-H2002R: Intel Core i7-9750H, 15.60", 2.5 kg
External Review » Asus ZenBook Pro Duo UX581GV-H2002R
MSI GF65 Thin 9SEXR-236XES: Intel Core i7-9750H, 15.60", 1.9 kg
External Review » MSI GF65 Thin 9SEXR-236XES
Asus TUF Gaming A15 FA506IV-AL032T: AMD Ryzen 7 4800H, 15.60", 2.3 kg
External Review » Asus TUF Gaming A15 FA506IV-AL032T
Acer Predator Helios 300 PH315-52-79H8: Intel Core i7-9750H, 15.60", 2.4 kg
External Review » Acer Predator Helios 300 PH315-52-79H8
MSI GF65 Thin 9SEXR-237XES: Intel Core i5-9300H, 15.60", 1.9 kg
External Review » MSI GF65 Thin 9SEXR-237XES
Gigabyte Aero 15 OLED WA-7BE5130SP: Intel Core i7-9750H, 15.60", 2 kg
External Review » Gigabyte Aero 15 OLED WA-7BE5130SP
Acer Predator Helios 300 PH315-52-73ZX: Intel Core i7-8750H, 15.60", 2.5 kg
External Review » Acer Predator Helios 300 PH315-52-73ZX
Asus ROG Zephyrus M15 GU502GV-AZ088T: Intel Core i7-9750H, 15.60", 1.9 kg
External Review » Asus Zephyrus M GU502GV-AZ088T
Asus Zephyrus G14 GA401IV-HA026T: AMD Ryzen 7 4800HS, 14.00", 1.7 kg
External Review » Asus Zephyrus G14 GA401IV-HA026T
Lenovo Legion Y540-15IRH-81SX00HRSP: Intel Core i7-9750H, 15.60", 2.3 kg
External Review » Lenovo Legion Y540-15IRH-81SX00HRSP
Asus ROG Strix G531GV-AL172: Intel Core i7-9750H, 15.60", 2.4 kg
External Review » Asus ROG Strix G531GV-AL172
MSI GL65 9SEK-255XES: Intel Core i7-9750H, 15.60", 2.3 kg
External Review » MSI GL65 9SEK-255XES
Asus ROG Zephyrus M15 GU502GV-ES004T: Intel Core i7-9750H, 15.60", 2 kg
External Review » Asus ROG Zephyrus M GU502GV-ES004T
Asus TUF Gaming FX505DV-AL014: AMD Ryzen 7 3750H, 15.60", 2.2 kg
External Review » Asus TUF Gaming FX505DV-AL014
Asus ROG Strix Scar III G731GV-EV106T: Intel Core i7-9750H, 17.30", 2.9 kg
External Review » Asus ROG Strix Scar III G731GV-EV106T
HP Omen 15-dc1041nl: Intel Core i7-8750H, 15.60", 2.4 kg
External Review » HP Omen 15-dc1041nl
Asus TUF FX505DD: AMD Ryzen 7 3750H, 15.60", 2.2 kg
External Review » Asus TUF FX505DD
Lenovo Legion Y540-17IRH-81Q4002CGE: Intel Core i7-9750H, 17.30", 2.8 kg
External Review » Lenovo Legion Y540-17IRH-81Q4002CGE
MSI GE65 Raider-052: Intel Core i7-9750H, 15.60", 2.3 kg
External Review » MSI GE65 Raider-052
Asus TUF FX505DV-BQ099T: AMD Ryzen 7 3750H, 15.60", 2.2 kg
External Review » Asus TUF FX505DV-BQ099T
HP Omen 15-dh0001ns: Intel Core i7-9750H, 15.60", 2.7 kg
External Review » HP Omen 15-dh0001ns
Asus Zenbook Pro Duo UX581GV-H2004T: Intel Core i7-9750H, 15.60", 2.5 kg
External Review » Asus Zenbook Pro Duo UX581GV-H2004T
Asus ZenBook Pro Duo UX581GV-H2003R: Intel Core i7-9750H, 15.60", 2.5 kg
External Review » Asus ZenBook Pro Duo UX581GV-H2003R
MSI GL65 9SEK-210XES: Intel Core i7-9750H, 15.60", 2.3 kg
External Review » MSI GL65 9SEK-210XES
Asus ROG Strix Scar III G531GV-AZ177T: Intel Core i7-9750H, 15.60", 2.4 kg
External Review » Asus ROG Strix Scar III G531GV-AZ177T
Lenovo Legion Y740-17IRH: Intel Core i7-9750H, 17.30", 3 kg
External Review » Lenovo Legion Y740-17IRH
Acer Predator Helios 300 PH315-52-78T7: Intel Core i7-9750H, 15.60", 2.4 kg
External Review » Acer Predator Helios 300 PH315-52-78T7
Asus ROG Zephyrus S GX502GV-ES047T: Intel Core i7-9750H, 15.60", 2 kg
External Review » Asus ROG Zephyrus S GX502GV-ES047T
Asus TUF FX505DV-AL019: AMD Ryzen 7 3750H, 15.60", 2.3 kg
External Review » Asus TUF FX505DV-AL019
HP Omen 15-dc1002ns: Intel Core i7-8750H, 15.60", 2.5 kg
External Review » HP Omen 15-dc1002ns
Asus ZenBook Pro Duo UX581GV-H2002T: Intel Core i7-9750H, 15.60", 2.5 kg
External Review » Asus ZenBook Pro Duo UX581GV-H2002T
Asus ZenBook Pro Duo UX581GV-H2004R: Intel Core i7-9750H, 15.60", 2.5 kg
External Review » Asus ZenBook Pro Duo UX581GV-H2004R
Lenovo Legion Y740-15ICHg-81HE003YGE: Intel Core i5-8300H, 15.60", 2.2 kg
External Review » Lenovo Legion Y740-15ICHg-81HE003YGE
Lenovo Legion Y740-15IRHg-81UH001XGE: Intel Core i7-9750H, 15.60", 2.2 kg
External Review » Lenovo Legion Y740-15IRHg-81UH001XGE
MSI GL75 9SEK-074XES: Intel Core i7-9750H, 15.60", 2.5 kg
External Review » MSI GL75 9SEK-074XES
MSI GE75 Raider 8SG-059FR: Intel Core i7-9750H, 17.30", 2.6 kg
External Review » MSI GE75 Raider 8SG-059FR
Asus Strix Hero III G731GV: Intel Core i7-9750H, 17.30", 2.9 kg
External Review » Asus Strix Hero III G731GV
MSI P75 Creator 9SE-279DE: Intel Core i7-9750H, 17.30", 2.3 kg
External Review » MSI P75 Creator 9SE-279DE
HP Omen 15-dh0105tx : Intel Core i7-9750H, 15.60", 2.4 kg
External Review » HP Omen 15-dh0105tx
Acer Predator Helios 300 PH315-52-71KD: Intel Core i7-9750H, 15.60", 2.5 kg
External Review » Acer Predator Helios 300 PH315-52-71KD
Acer ConceptD 7 CN715-71-743N: Intel Core i7-9750H, 15.60", 2.2 kg
External Review » Acer ConceptD 7 CN715-71-743N
Acer Predator Triton 500 PT515-51-73G6: Intel Core i7-8750H, 15.60", 2.1 kg
External Review » Acer Predator Triton 500 PT515-51-73G6
Hyperbook SL504: Intel Core i7-9750H, 15.60", 2.4 kg
External Review » Hyperbook SL504
Asus Zephyrus S GX502GV-PB74: Intel Core i7-9750H, 15.60", 2 kg
External Review » Asus Zephyrus S GX502GV-PB74
Dell G5 15 5590-FJJN8: Intel Core i7-9750H, 15.60", 2.8 kg
External Review » Dell G5 15 5590-FJJN8
Lenovo Legion Y540-15IRH: Intel Core i7-9750H, 15.60", 2.3 kg
External Review » Lenovo Legion Y540-15IRH
MSI GP75 Leopard 9SE-660XES: Intel Core i7-9750H, 17.30", 2.6 kg
External Review » MSI GP75 Leopard 9SE-660XES
MSI GE63 Raider RGB-053: Intel Core i7-8750H, 15.60", 2.6 kg
External Review » MSI GE63 Raider RGB-053
Asus ROG Zephyrus M15 GU502GV-BI7N10: Intel Core i7-9750H, 15.60", 1.9 kg
External Review » Asus Zephyrus M GU502GV-BI7N10
Asus Zephyrus S GX701GVR-EV003R: Intel Core i7-8750H, 17.30", 2.7 kg
External Review » Asus Zephyrus S GX701GVR-EV003R
Dell G7 15 7590 (i7-9750H, RTX 2060): Intel Core i7-9750H, 15.60", 2.5 kg
External Review » Dell G7 15 7590 (i7-9750H, RTX 2060)
Schenker XMG Pro 15-M19mbm: Intel Core i7-9750H, 15.60", 2.5 kg
External Review » Schenker XMG Pro 15-M19mbm
Alienware m17 9JX63: Intel Core i7-8750H, 17.30", 2.6 kg
External Review » Alienware m17 9JX63
MSI GS65 Stealth 8SE-037ES: Intel Core i7-8750H, 15.60", 1.9 kg
External Review » MSI GS65 Stealth 8SE-037ES
Razer Blade Pro 17 RTX 2060: Intel Core i7-9750H, 17.30", 2.8 kg
External Review » Razer Blade Pro 17 RTX 2060
MSI GS75 9SE-278 Stealth: Intel Core i7-9750H, 17.30", 2.3 kg
External Review » MSI GS75 9SE-278 Stealth
MSI GE75 Raider 9SE-402NL: Intel Core i7-9750H, 17.30", 2.6 kg
External Review » MSI GE75 Raider 9SE-402NL
Acer Predator Helios 300 PH317-53-79Y1: Intel Core i7-9750H, 17.30", 2.9 kg
External Review » Acer Predator Helios 300 PH317-53-79Y1
Acer Predator Helios 300 PH315-52-73XY: Intel Core i7-9750H, 15.60", 2.4 kg
External Review » Acer Predator Helios 300 PH315-52-73XY
Asus ROG Strix SCAR II GL504GV-ES020: Intel Core i7-8750H, 15.60", 2.4 kg
External Review » Asus ROG Strix SCAR II GL504GV-ES020
Dell G5 15 5590: Intel Core i7-8750H, 15.60", 2.7 kg
External Review » Dell G5 15 5590
MSI GS65 8SE-060: Intel Core i7-8750H, 15.60", 1.9 kg
External Review » MSI GS65 8SE-060
Dell G7 15-7590 (i7-8750H, RTX 2060): Intel Core i7-8750H, 15.60", 2.5 kg
External Review » Dell G7 15-7590 (i7-8750H, RTX 2060)
Asus ZenBook Pro Duo UX581GV: Intel Core i9-9980HK, 15.60", 2.5 kg
External Review » Asus ZenBook Pro Duo UX581GV
MSI GL73 8SE-010US: Intel Core i7-8750H, 17.30", 2.7 kg
External Review » MSI GL73 8SE-010US
MSI GE75 Raider 8SE-035XES: Intel Core i7-8750H, 17.30", 2.7 kg
External Review » MSI GE75 Raider 8SE-035XES
MSI GS75 Stealth 8SE-066ES: Intel Core i7-8750H, 17.30", 2.3 kg
External Review » MSI GS75 Stealth 8SE-066ES
BTO Notebooks X-Book 16X885: Intel Core i7-8750H, 16.10", 2.1 kg
External Review » BTO Notebooks X-Book 16X885
Dell G5 15 5590-650GJ: Intel Core i7-8750H, 15.60", 2.8 kg
External Review » Dell G5 15 5590-650GJ
Acer Predator Triton 500 PT515-51-73G6: Intel Core i7-8750H, 15.60", 2.1 kg
External Review » Acer Predator Triton 500 PT515-51-73G6
Asus ROG Strix Hero II G515GV-ES048T: Intel Core i7-8750H, 15.60", 2.4 kg
External Review » Asus ROG Strix Hero II G515GV-ES048T
Dell G7 17-7790-WMGG1: Intel Core i7-8750H, 17.30", 3.3 kg
External Review » Dell G7 17-7790-WMGG1
Razer Blade 15 RTX 2060: Intel Core i7-8750H, 15.60", 2.1 kg
External Review » Razer Blade 15 RTX 2060
Lenovo Legion Y740-15ICHg-81HE0000US: Intel Core i7-8750H, 15.60", 2.2 kg
External Review » Lenovo Legion Y740-15ICHg-81HE0000US
Lenovo Legion Y540-15ICH: Intel Core i7-8750H, 15.60", 2.4 kg
External Review » Lenovo Legion Y540-15ICH
MSI GE75 8SE-047: Intel Core i7-8750H, 17.30", 2.6 kg
External Review » MSI GE75 8SE-047
Asus ROG Strix Scar II GL704GV-EV024T: Intel Core i7-8750H, 17.30", 2.9 kg
External Review » Asus ROG Strix Scar II GL704GV-EV024T
Aorus 15 W9: Intel Core i7-8750H, 15.60", 2.2 kg
External Review » Aorus 15 W9
Dell G5 15 5590-931WJ: Intel Core i7-8750H, 15.60", 2.8 kg
External Review » Dell G5 15 5590-931WJ
MSI GL73 8SE-008XES: Intel Core i7-8750H, 17.30", 2.9 kg
External Review » MSI GL73 8SE-008XES
MSI GL63 8SE-026XES: Intel Core i7-8750H, 15.60", 2.3 kg
External Review » MSI GL63 8SE-026XES
Asus Strix Scar II GL504GV-ES087T : Intel Core i7-8750H, 15.60", 2.4 kg
External Review » Asus Strix Scar II GL504GV-ES087T
Asus Strix Scar II GL704GV-EV052T: Intel Core i7-8750H, 17.30", 2.9 kg
External Review » Asus Strix Scar II GL704GV-EV052T
MSI GL63 8SE-071: Intel Core i7-8750H, 15.60", 2.3 kg
External Review » MSI GL63 8SE-071
Acer Predator Triton 500 PT515-51-557V: Intel Core i5-8300H, 15.60", 2.1 kg
External Review » Acer Predator Triton 500 PT515-51-557V
MSI GS75 8SE-073: Intel Core i7-8750H, 17.30", 2.3 kg
External Review » MSI GS75 8SE-073
MSI GE75 Raider 10SE-008US: Intel Core i7-10750H, 17.30", 2.6 kg
Article » Staying secure in the new normal: How AMD Ryzen Pro processors ensure 24x7 protection for your critical data
Article » MSI laptops are the ideal Holiday season gifts for the avid gamer or content producer in your life
Intel NUC11PHKi7C: Intel Core i7-1165G7, 1.4 kg
» 100 W Core i7-8809G vs. 28 W Core i7-1165G7: Can Tiger Lake outperform the exotic Intel-AMD chipset?
Acer Predator Triton 300 PT315-52-79LP: Intel Core i7-10750H, 15.60", 2.1 kg
» Acer Predator Triton 300: Affordable 15-inch Gamer
Acer Predator Helios 300 PH315-53-77N5: Intel Core i7-10750H, 15.60", 2.5 kg
» Memory in the Acer Predator Helios 300 PH315-53 runs in single-channel mode
Acer Predator Helios 300 PH317-54-75G8: Intel Core i7-10750H, 17.30", 2.8 kg
» The Acer Predator Helios 300 PH317-54 supports RAID 0
Aorus 5 KB: Intel Core i7-10750H, 15.60", 2.1 kg
» Aorus 5 KB: A lot of space for storage devices
Aorus 7 KB: Intel Core i7-10750H, 17.30", 2.5 kg
» The Aorus 7 KB offers space for up to three storage drives
Gateway Creator Series 15.6 GWTN156-3BK: Intel Core i5-10300H, 15.60", 2 kg
» Is a $999 Walmart Gateway gaming laptop any good? We try one out ourselves to see
Schenker XMG Core 15 GK5NR0O: AMD Ryzen 7 4800H, 15.60", 2 kg
» The Ryzen 7 in the Schenker XMG Core 15 budget gamer brings the satisfying moments
Dell G3 15 3500-G4DG2: Intel Core i7-10750H, 15.60", 2.3 kg
» Dell G3 15 3500: For everyday gaming
Eluktronics RP-17: AMD Ryzen 7 4800H, 17.30", 2.6 kg
» Where are all the AMD Ryzen 7 GeForce RTX 2070 laptops? These Eluktronics models are proof that we're ready for them
MSI GS66 Stealth 10SE-045: Intel Core i7-10750H, 15.60", 2.2 kg
» The MSI GS66 Stealth 10SE comes with a 99.9 Wh battery and can't do anything with it
Lenovo Legion 5 15IMH05H: Intel Core i5-10300H, 15.60", 2.5 kg
» Wish you could turn Nvidia Optimus on and off? The Lenovo Legion 5 15IMH05H lets you do just that
MSI GE75 Raider 10SE-008US: Intel Core i7-10750H, 17.30", 2.6 kg
» MSI GE65/GE75 Raider costs over $1500 USD, has one of the slowest SD card readers we've seen
Acer Nitro 5 AN517-52-77DS: Intel Core i7-10750H, 17.30", 2.2 kg
» The 120 Hz display of the Nitro 5 only delivers poor response times - The Acer Nitro 5 AN517-52 in review
Asus TUF Gaming A15 FA506IV-HN172: AMD Ryzen 7 4800H, 15.60", 2.2 kg
» Asus TUF A15 FA506 with AMD Renoir SoC offers great value for its price
Eluktronics RP-15: AMD Ryzen 7 4800H, 15.60", 1.9 kg
» Every AMD Ryzen 7 4800H laptop we've tested thus far have been outperforming the Intel Core i7-10875H and Core i9-10980HK, but there's a catch
Acer ConceptD 5 CN517-71-74YA: Intel Core i7-9750H, 17.30", 2.8 kg
» Acer ConceptD 5 17 inch: Good is not good enough
Schenker XMG Pro 17 PB71RD-G: Intel Core i7-9750H, 17.30", 2.8 kg
» Schenker XMG Pro 17: Simple gaming laptop with powerful components
Asus Zephyrus G14 GA401IV-HA026T: AMD Ryzen 7 4800HS, 14.00", 1.7 kg
» How Intel can get back on top