MSI GL65 9SEK Laptop Review: Much More Portable than the GL63
The MSI GL65 directly succeeds the GL63 by introducing a brand new narrow bezel design to the 15.6-inch GL6x series. Aside from the new look, it also brings Intel 9th gen Core i7 CPUs and Nvidia Turing GPUs to supplant the 8th gen CPUs and Pascal GPUs of the previous generation model. The mid-range GL65 is designed to sit below the higher-end GS65 in terms of looks and specifications.
All current SKUs can be configured with the Core i5-9300H or i7-9750H CPU and the GeForce GTX 1650, GTX 1660 Ti, or RTX 2060 GPU. Display options include only 1080p IPS at either 60 Hz or 120 Hz. Our specific test unit is the higher-end configuration with the Core i7 CPU, RTX 2060 GPU, and 1080p120 display retailing for about $1450 USD.
Direct competitors to the MSI GL65 include other mid-range 15.6-inch gaming laptops like the Lenovo Legion Y740-15ICH, Dell G7 15, Gigabyte Aorus 5 or Aorus 15, Asus Zephyrus G GU502, and the recently released Razer Blade 15 GTX 1660 Ti.
We recommend checking out our existing review on the MSI GP65 since it shares a very similar chassis design with the GL65.
More MSI reviews:
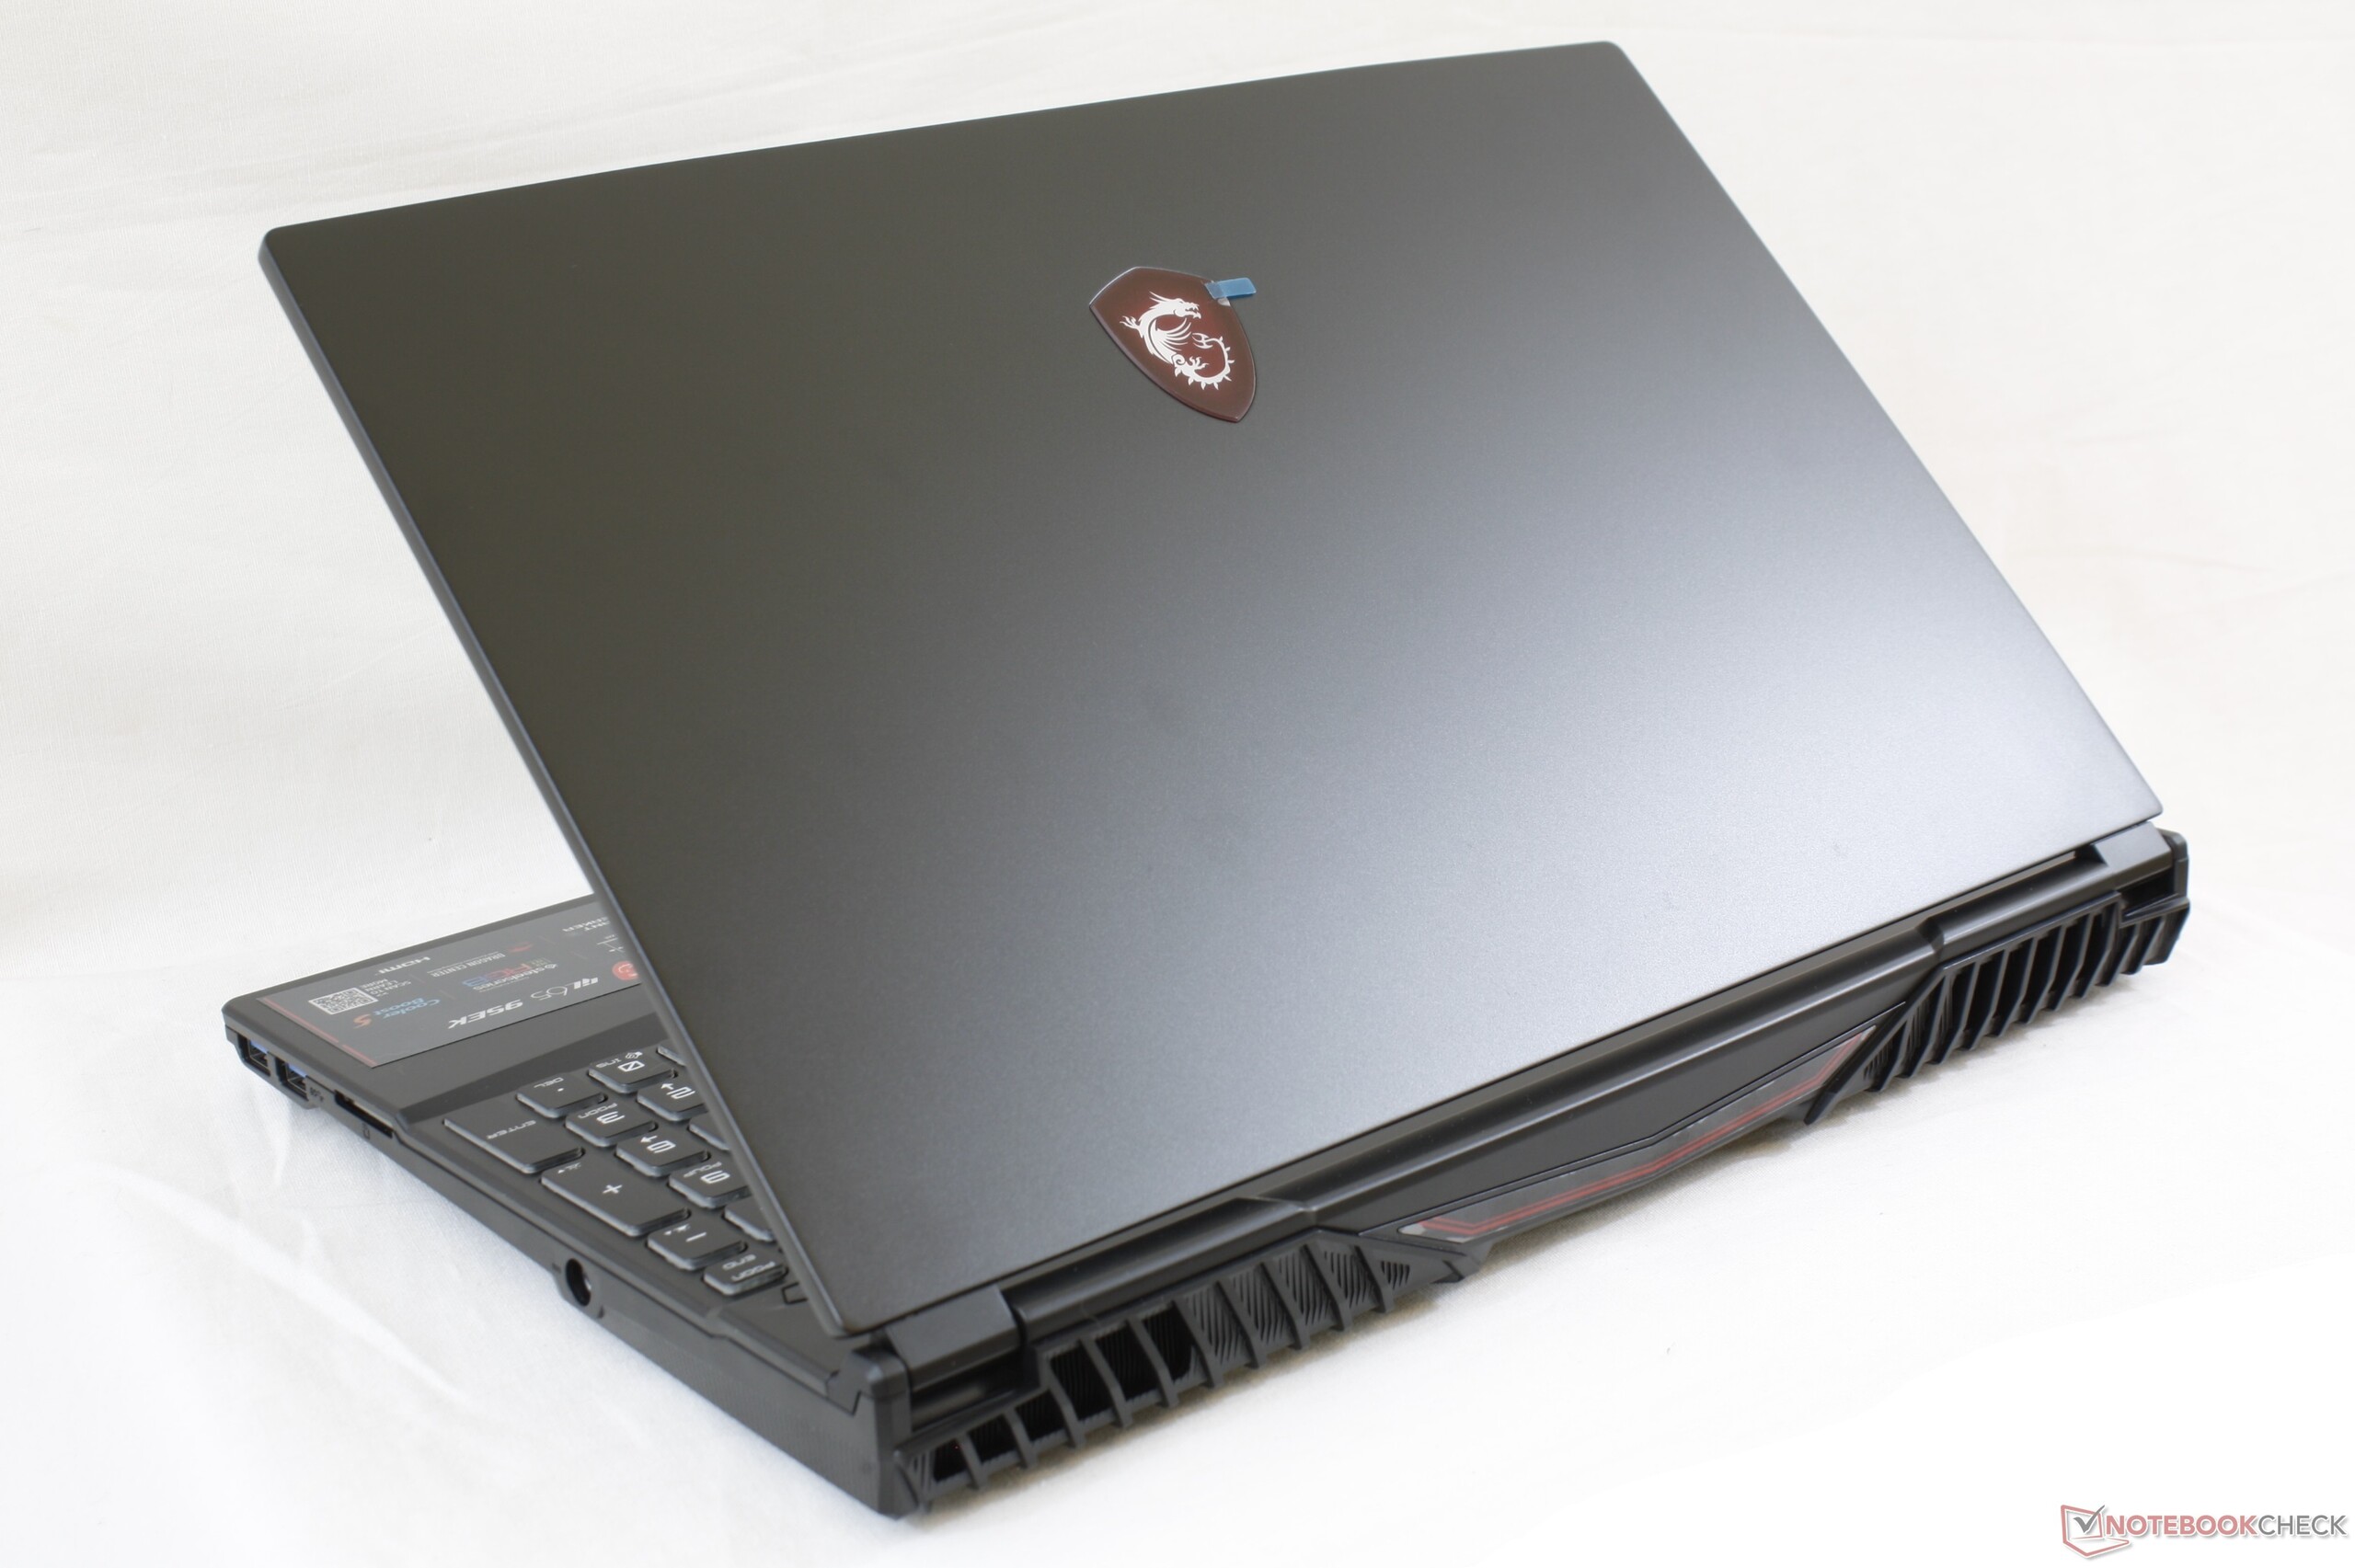
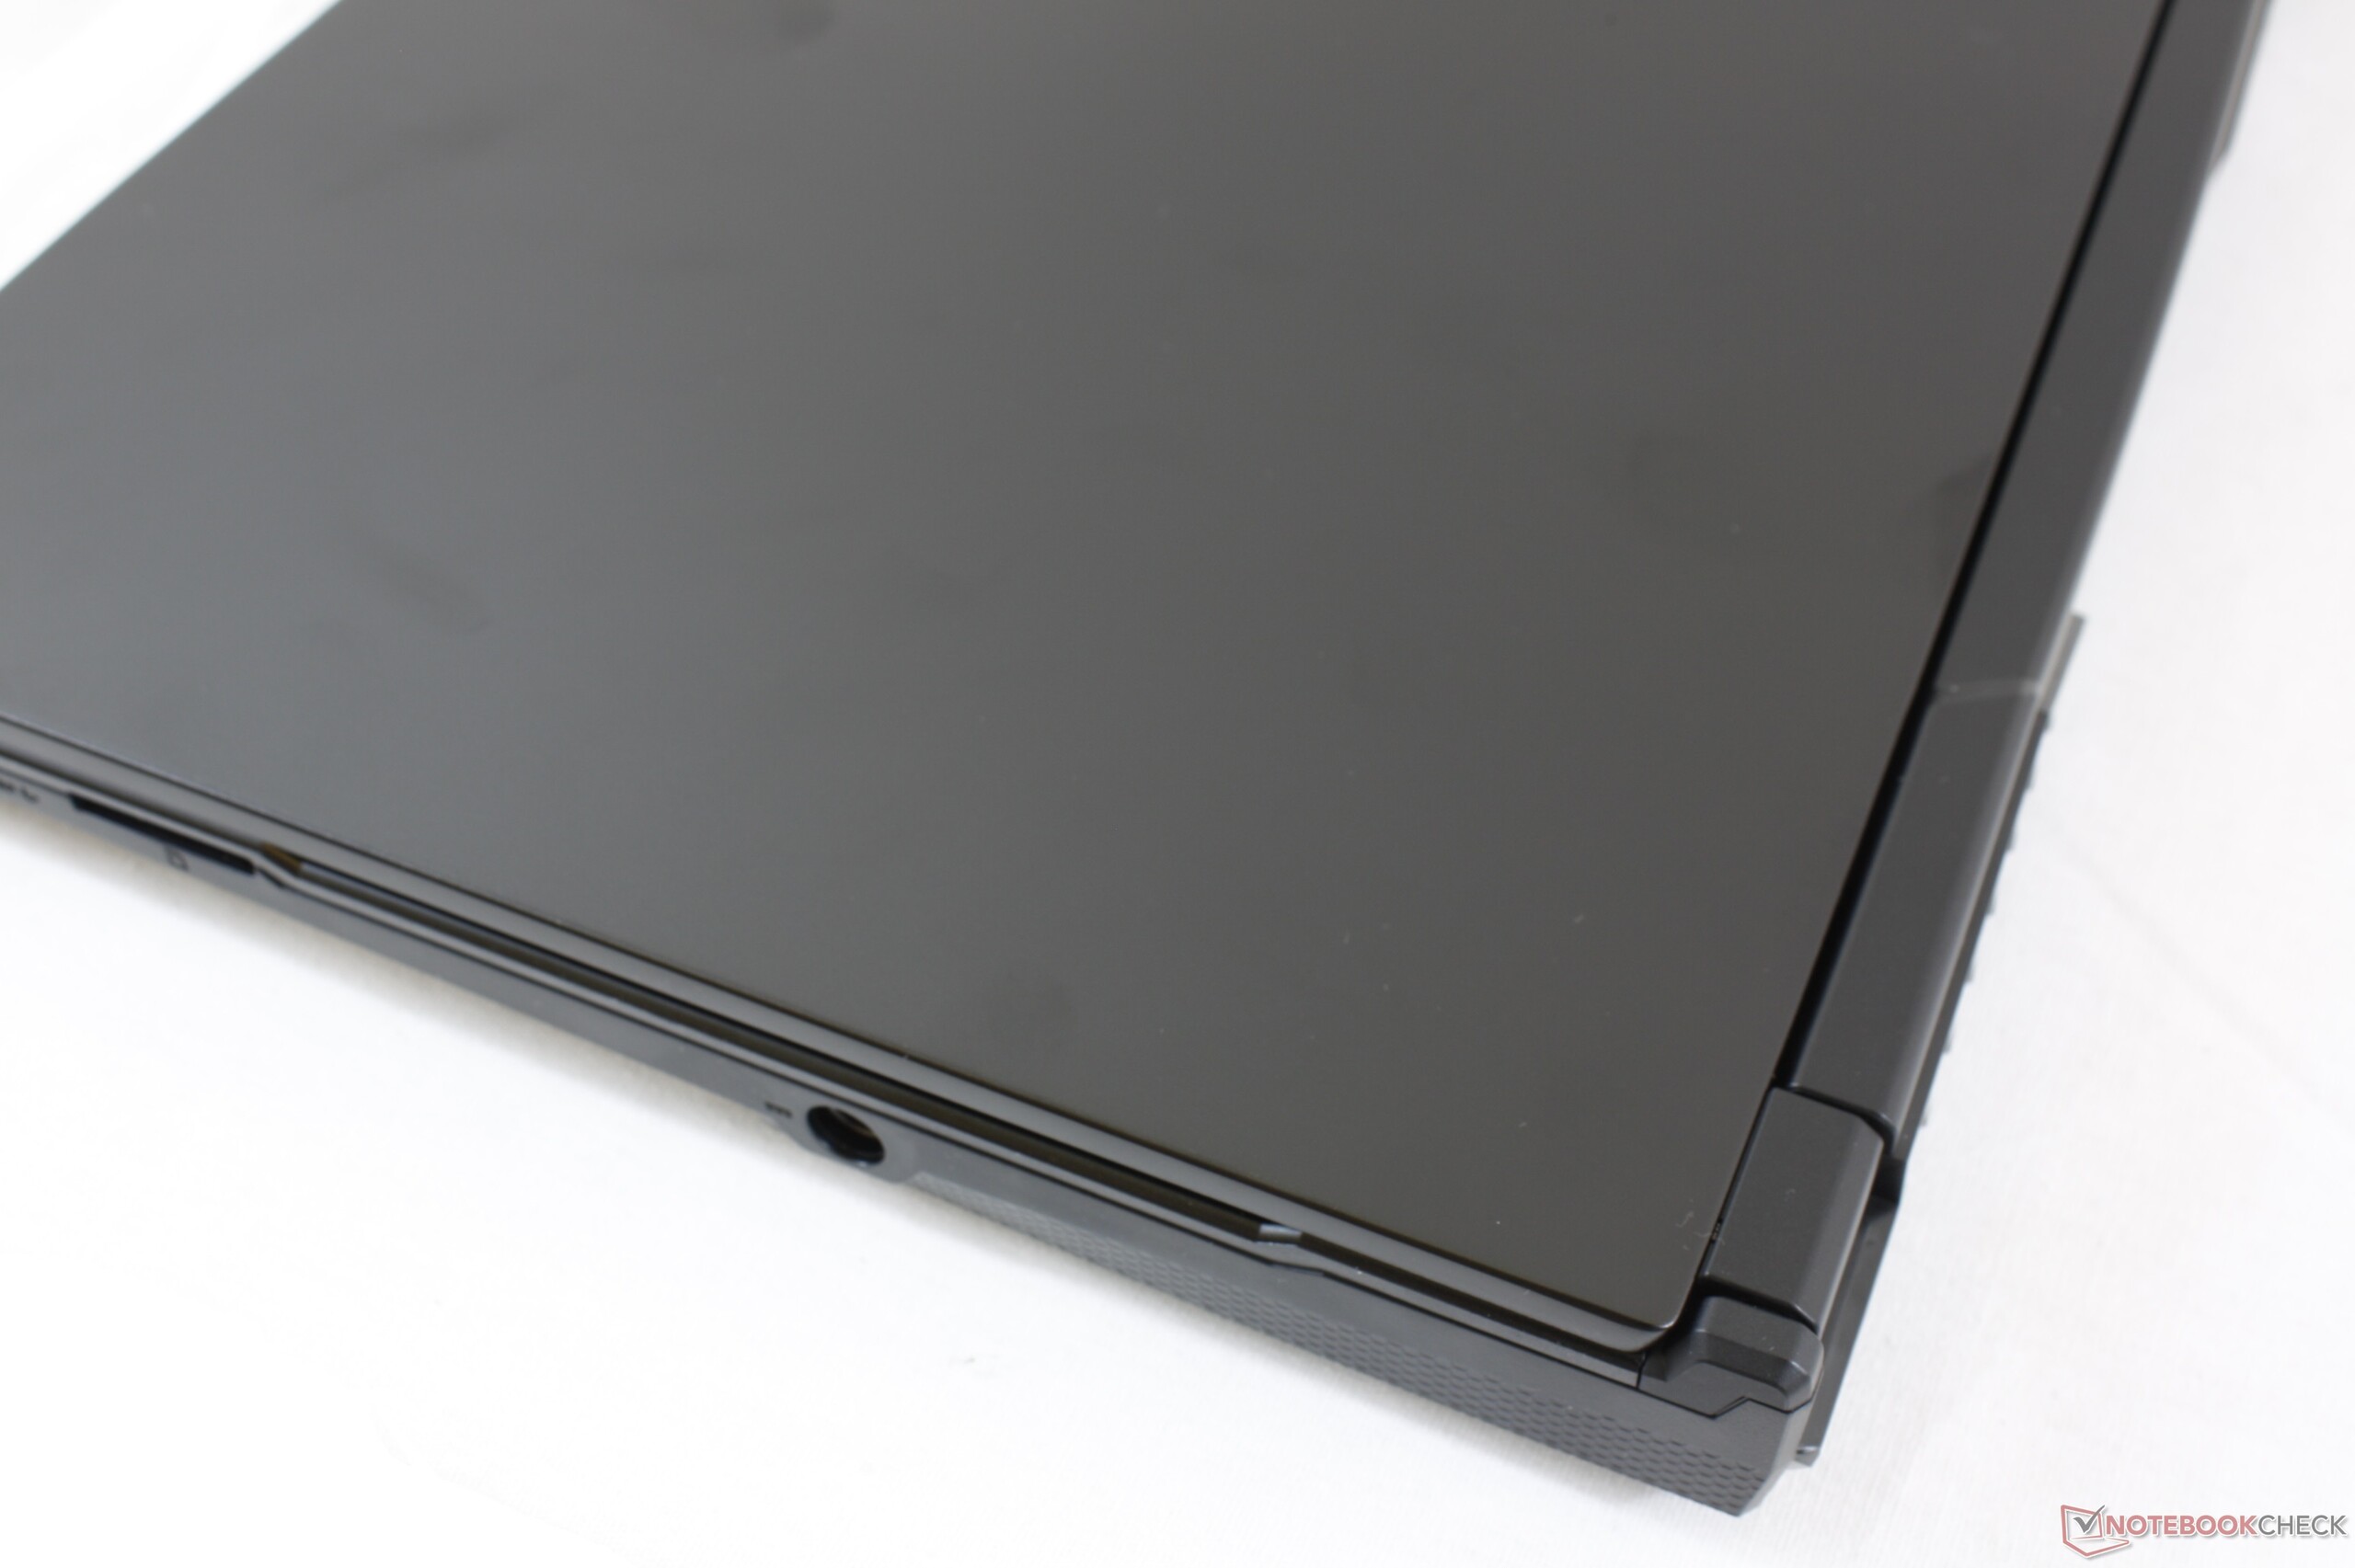
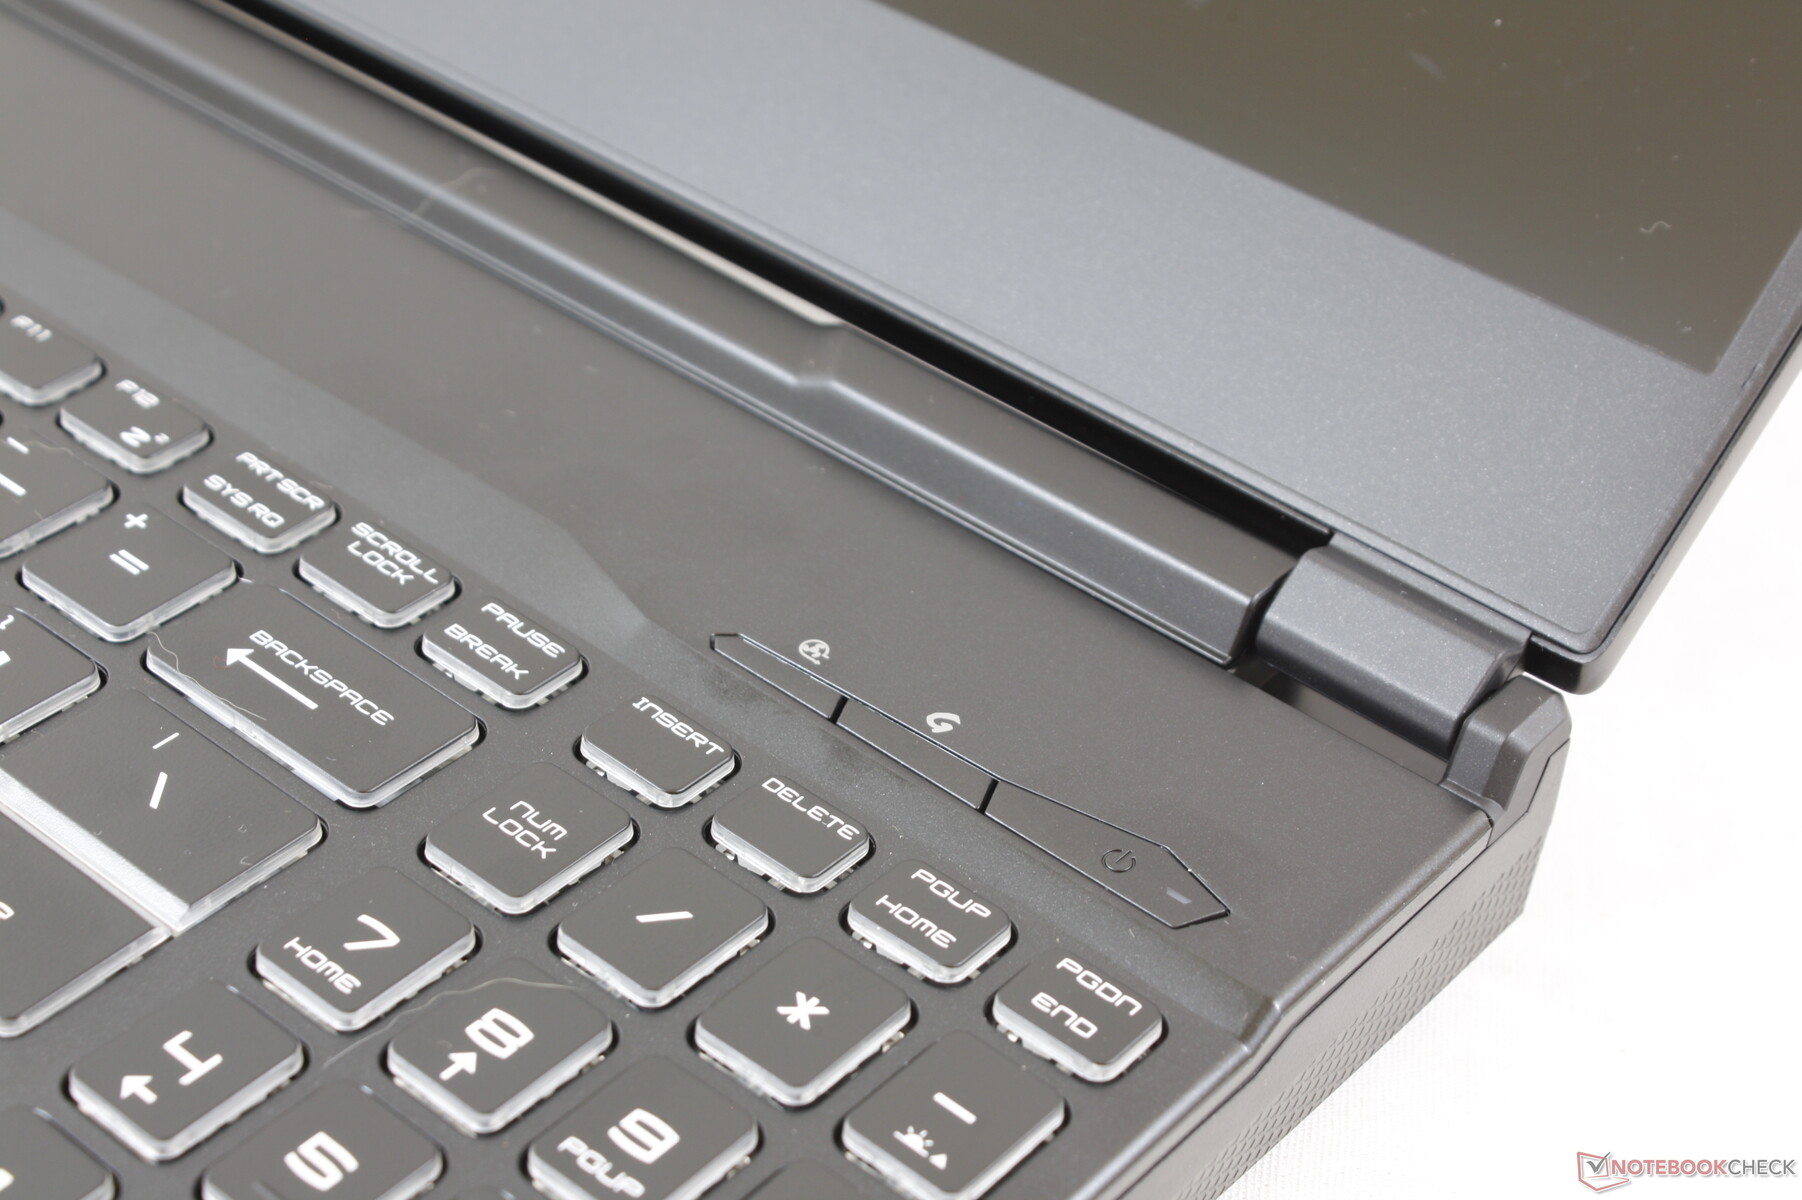
Case
Most of our comments on the GP65 chassis apply here on the GL65. The main visual difference between them is that the outer lid of the former incorporates additional design elements whereas the outer lid of the GL65 is completely flat. Chassis materials and texture are otherwise identical.
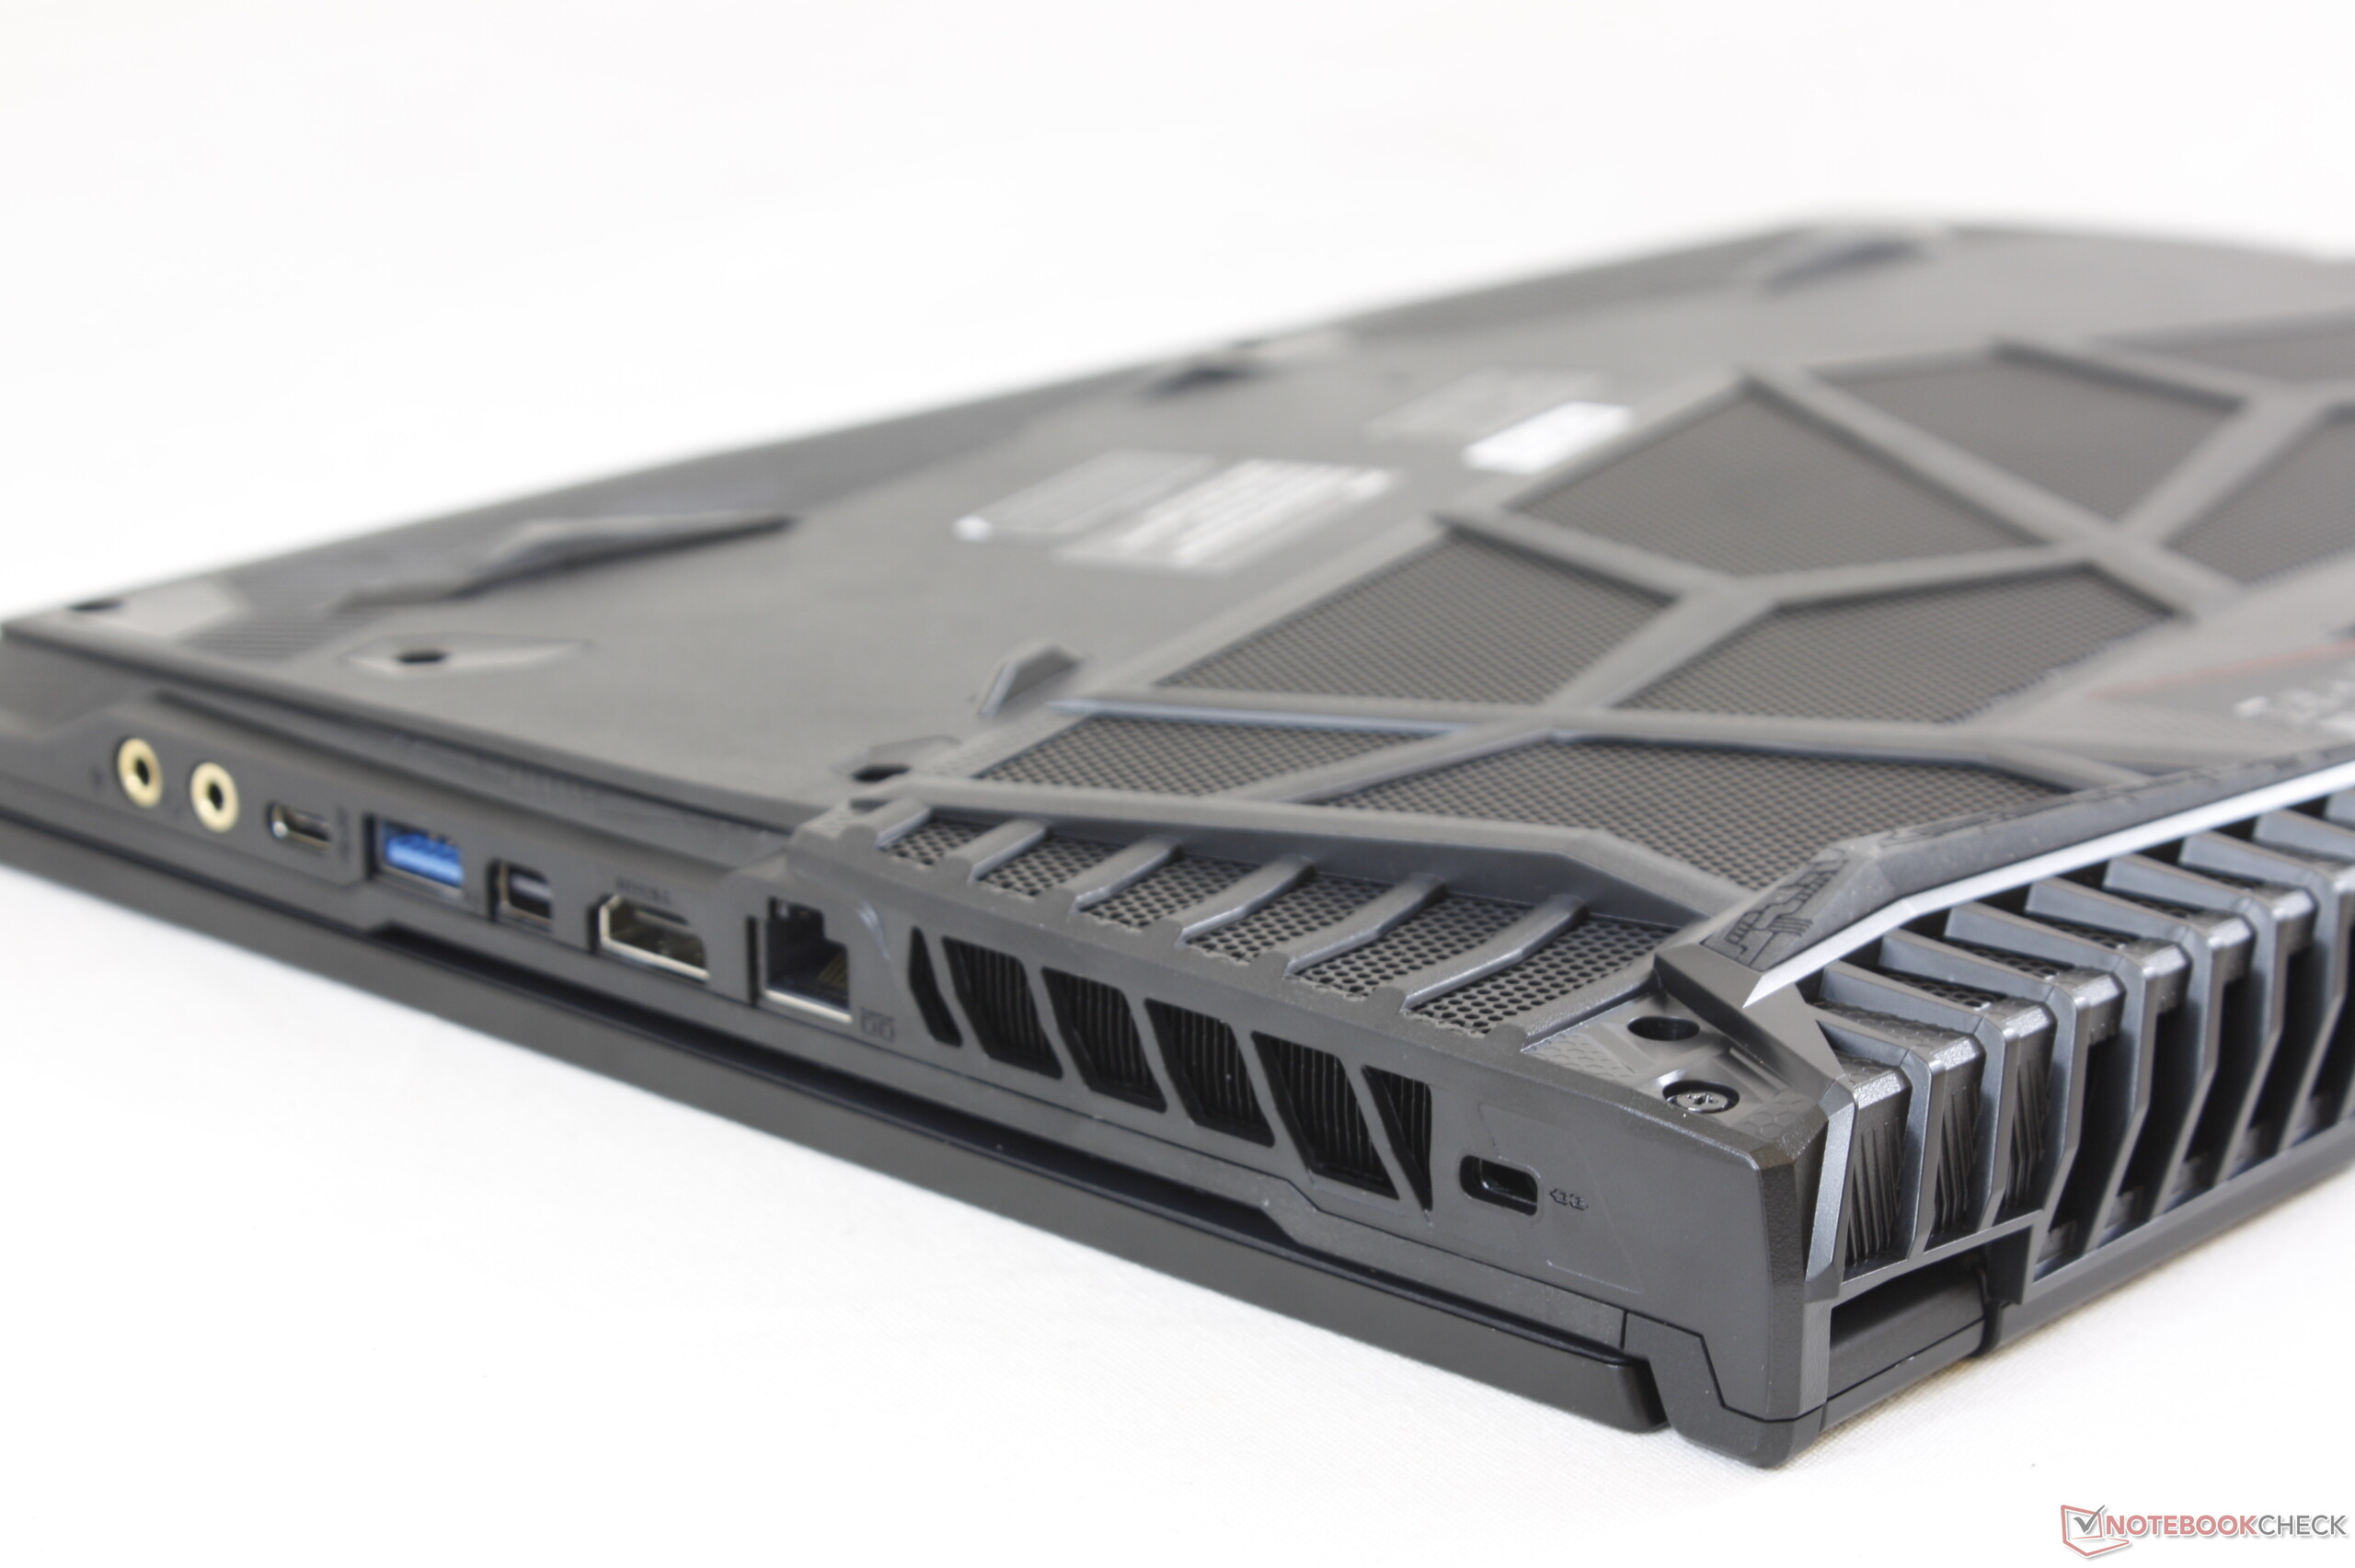
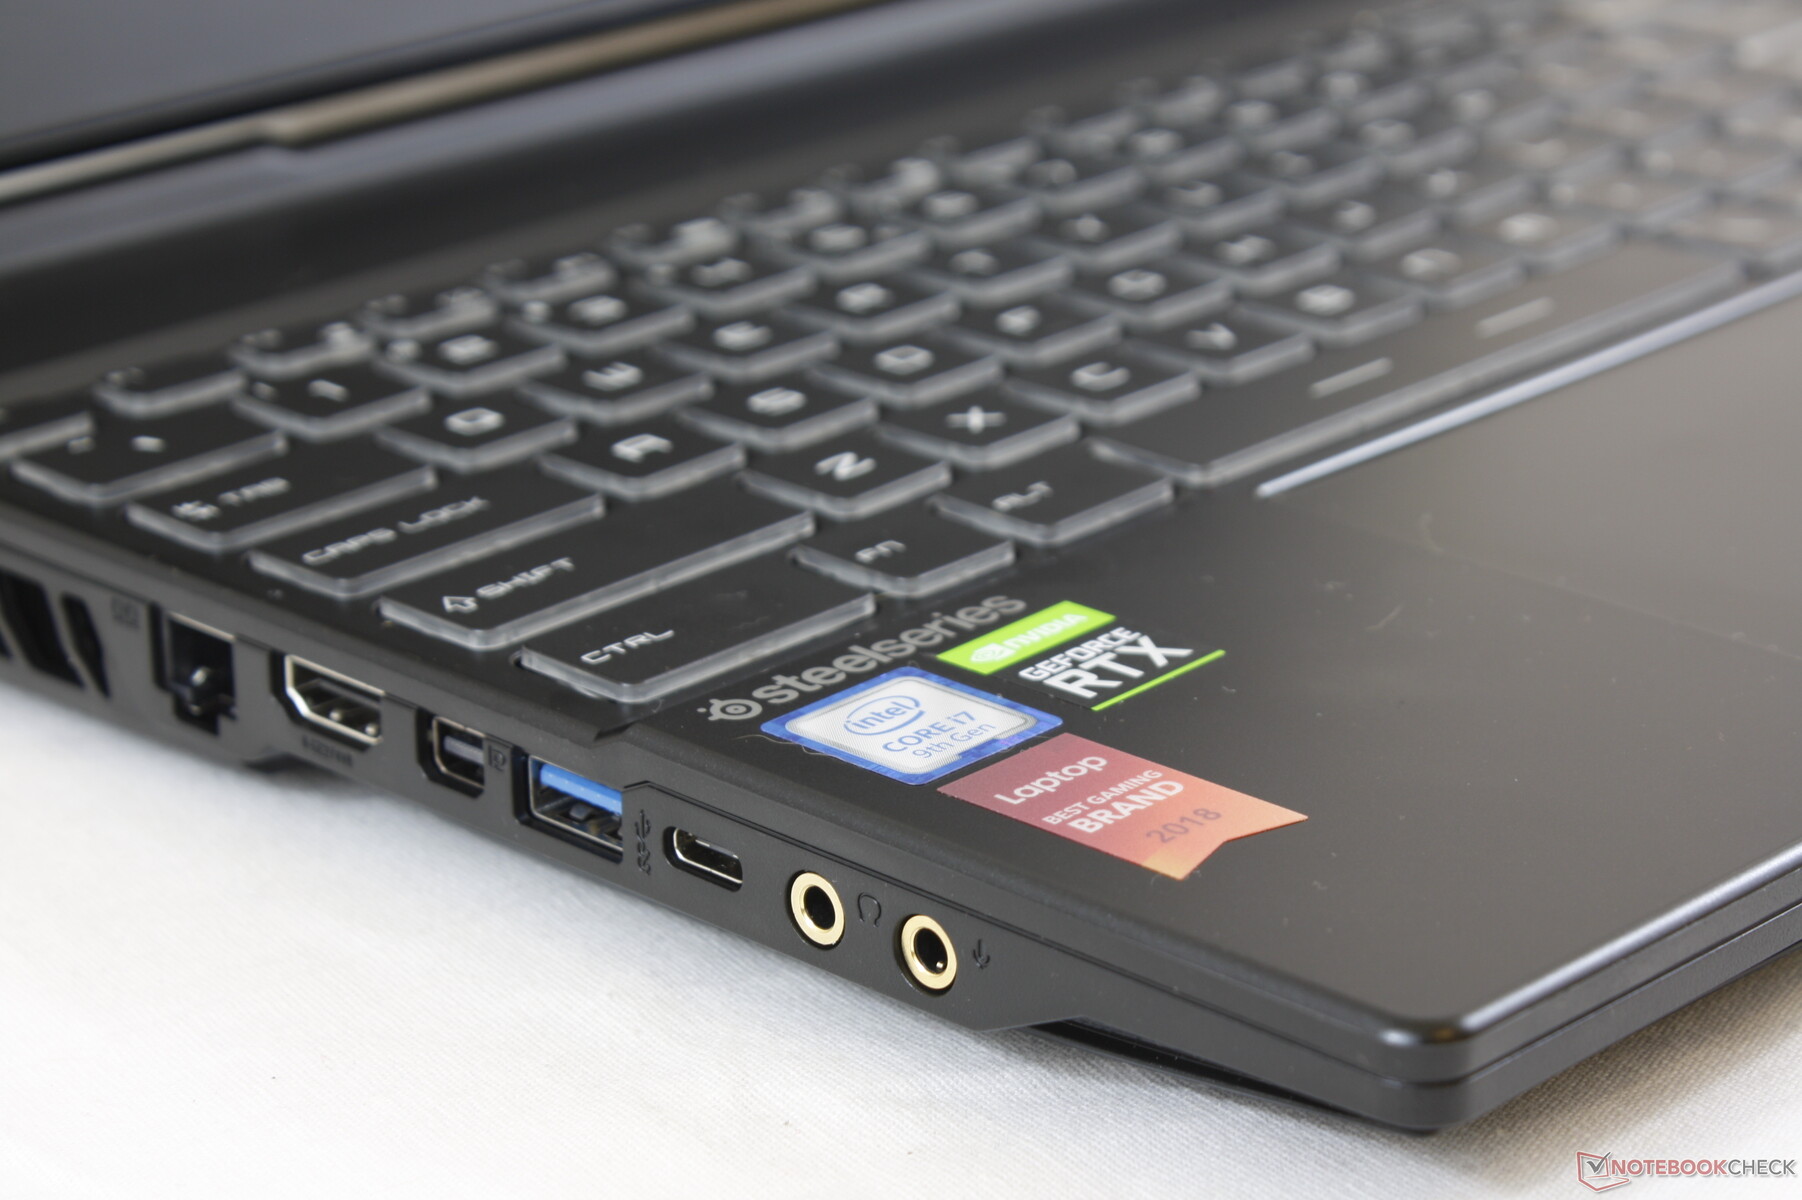
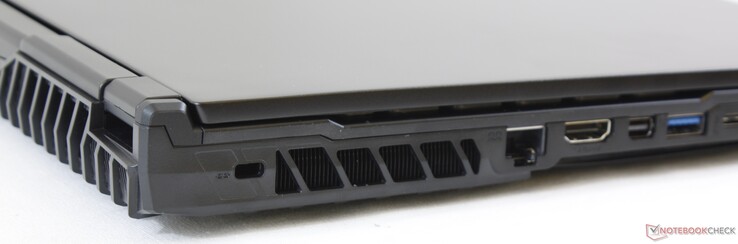
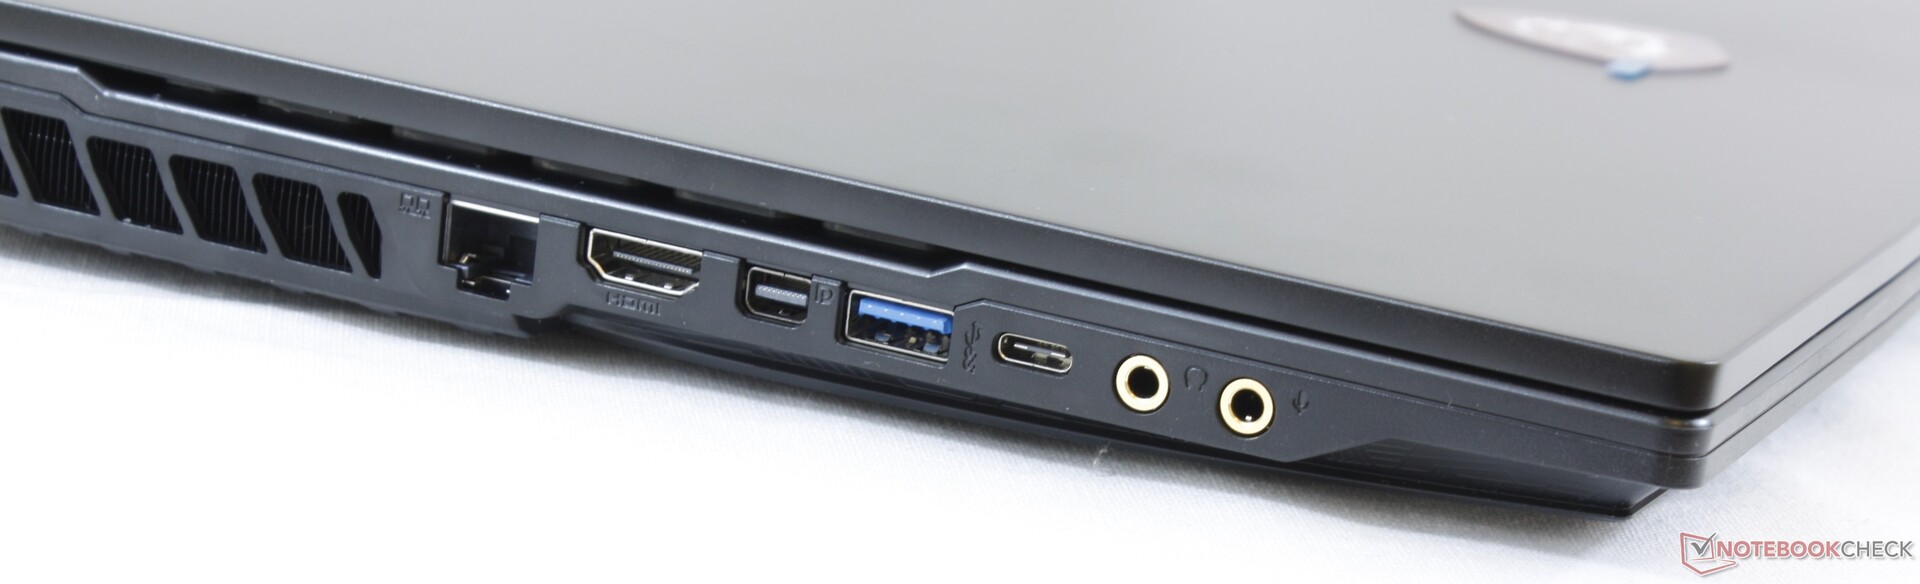
Connectivity
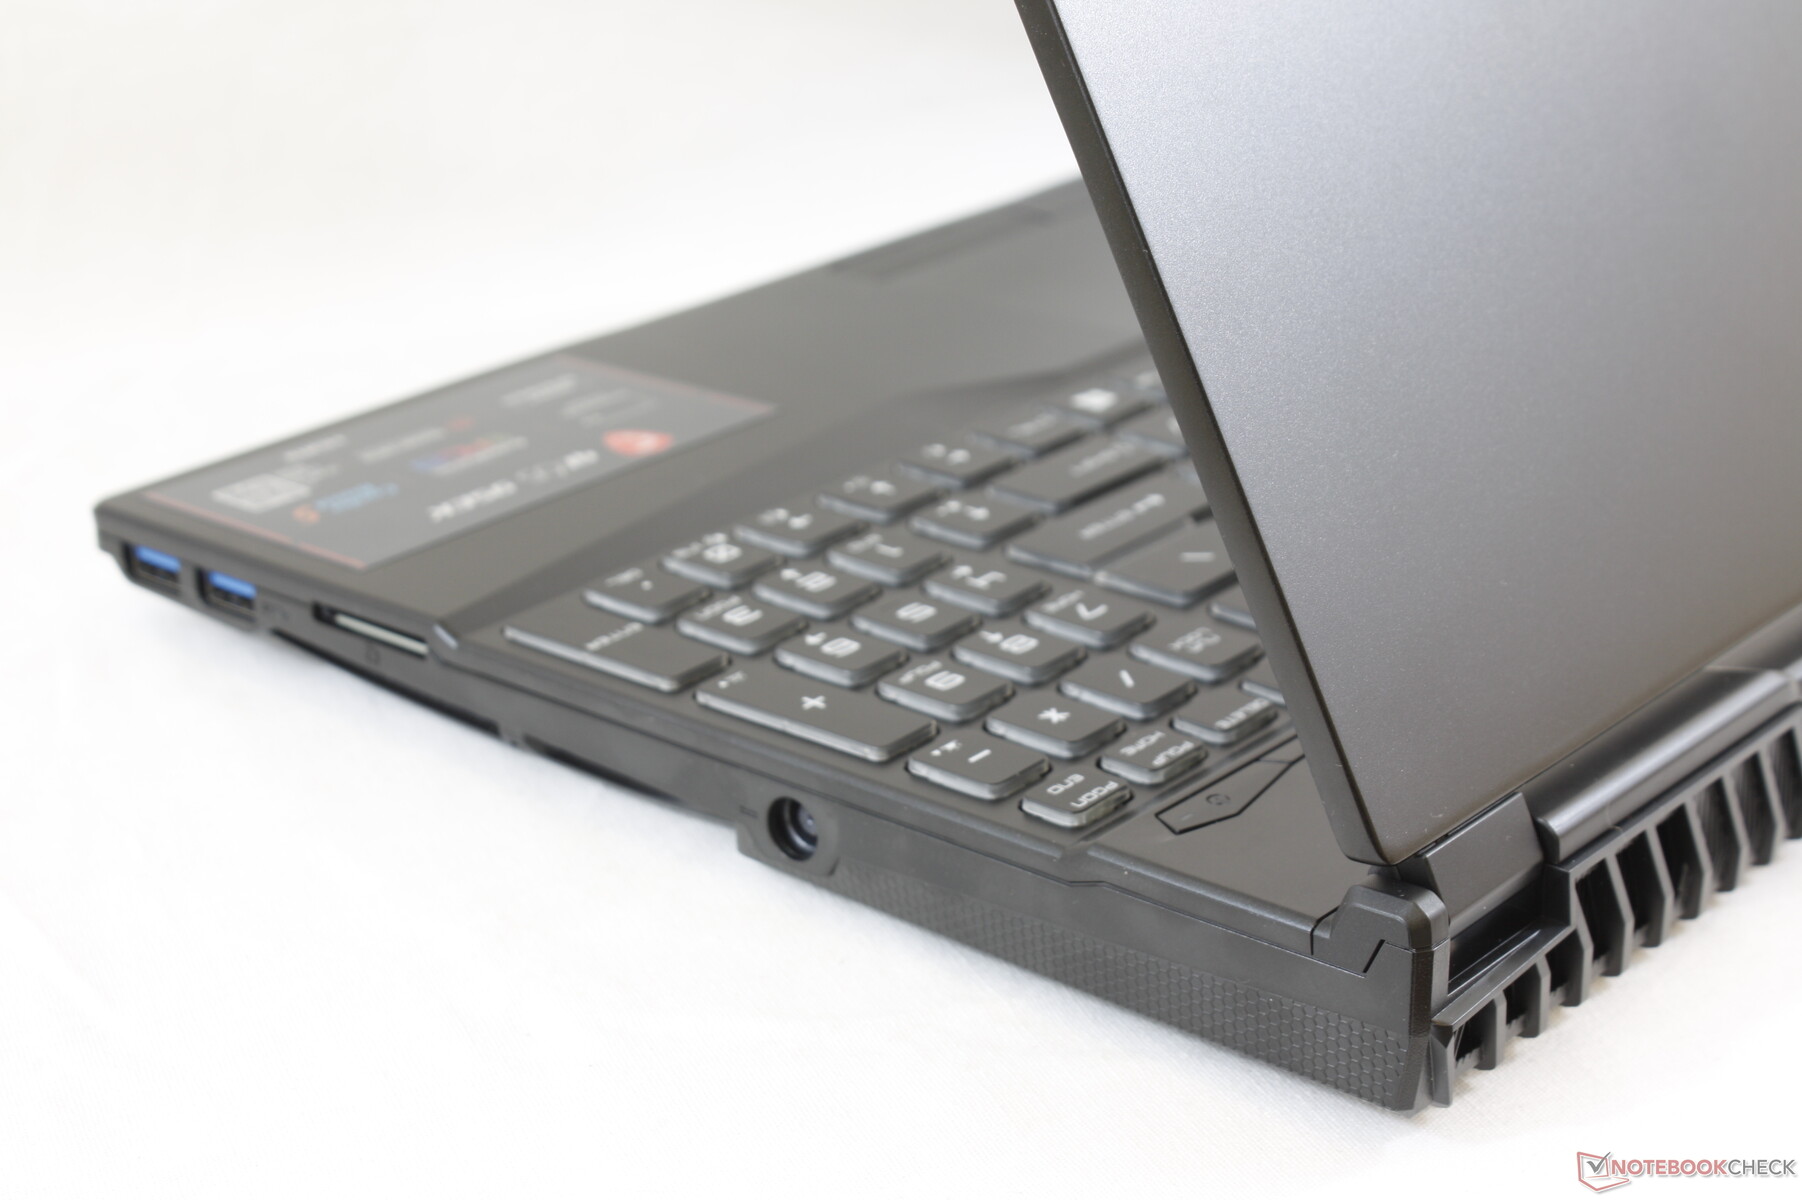
Port options and even positioning are almost identical to the last generation GL63. The only main difference is that the AC adapter port is now closer to the front instead of towards the rear corner. It's not recommended to use the GL63 AC adapter on the GL65 since the latter ships with a more capable adapter (180 W vs. 135 W).
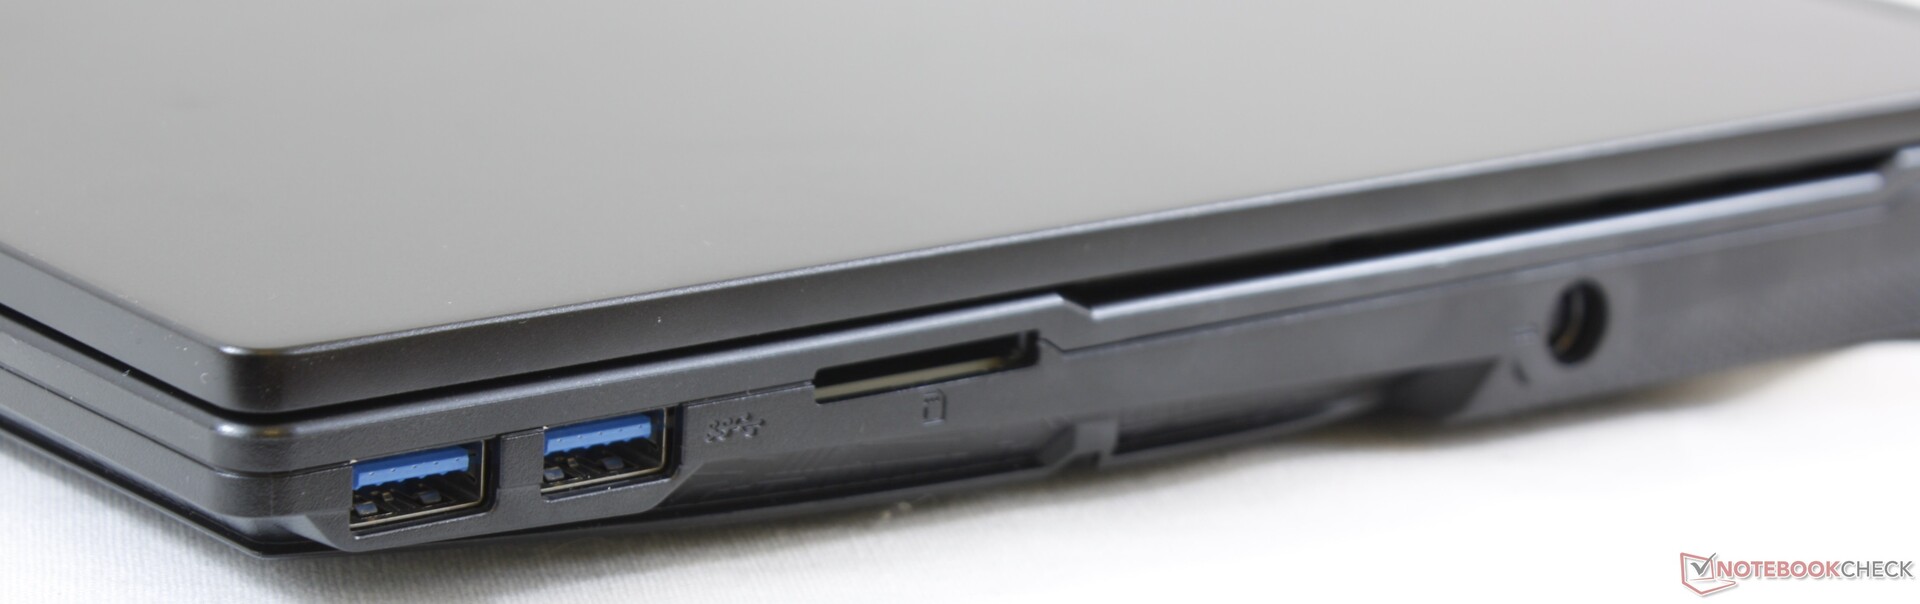
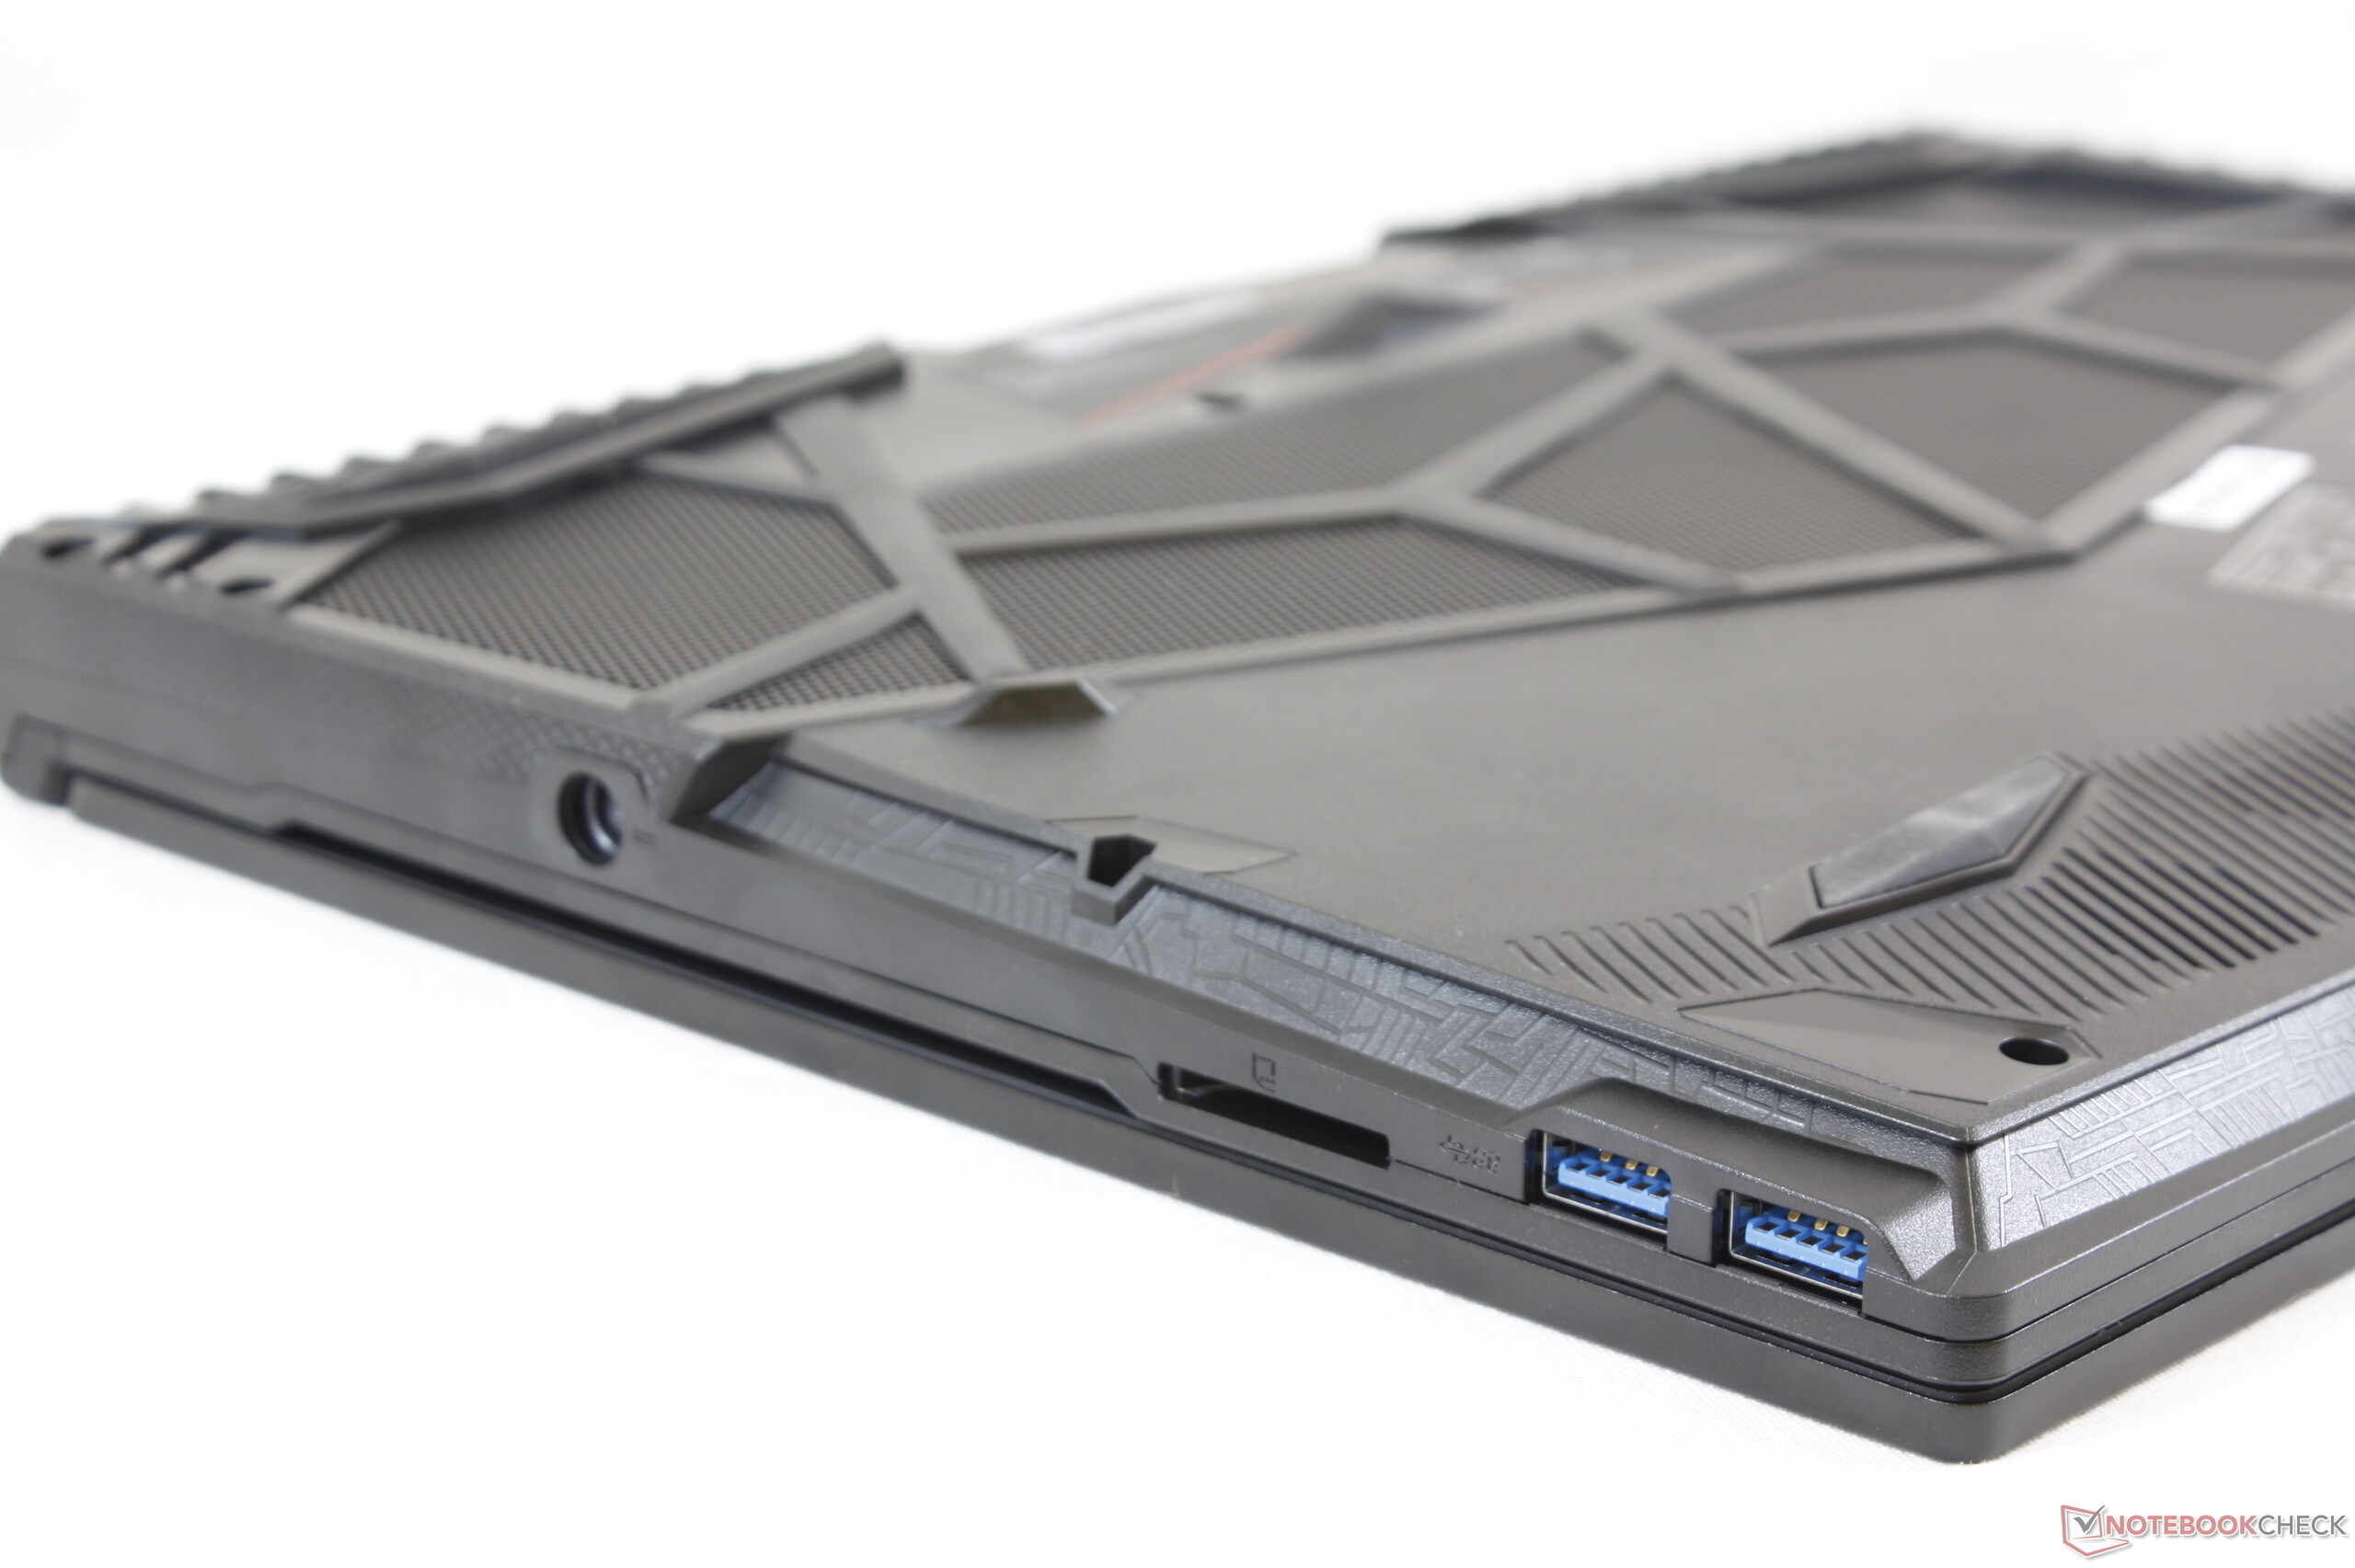
SD Card Reader
While we appreciate the fact that the system integrates a full-size spring-loaded SD card reader, its very slow transfer rates are hard to forgive. Transferring 1 GB worth of images from our UHS-II test card to desktop takes about 45 seconds compared to just ~8 seconds on the Dell XPS 15. The slow speed can be frustrating for content creators who rely on SD readers.
| SD Card Reader | |
| average JPG Copy Test (av. of 3 runs) | |
| Gigabyte Aero 15 Classic-XA (Toshiba Exceria Pro SDXC 64 GB UHS-II) | |
| Dell XPS 15 7590 9980HK GTX 1650 (Toshiba Exceria Pro SDXC 64 GB UHS-II) | |
| MSI GL65 9SEK (Toshiba Exceria Pro SDXC 64 GB UHS-II) | |
| MSI GL63 8RC-069US (Toshiba Exceria Pro SDXC 64 GB UHS-II) | |
| maximum AS SSD Seq Read Test (1GB) | |
| Gigabyte Aero 15 Classic-XA (Toshiba Exceria Pro SDXC 64 GB UHS-II) | |
| Dell XPS 15 7590 9980HK GTX 1650 (Toshiba Exceria Pro SDXC 64 GB UHS-II) | |
| MSI GL65 9SEK (Toshiba Exceria Pro SDXC 64 GB UHS-II) | |
| MSI GL63 8RC-069US (Toshiba Exceria Pro SDXC 64 GB UHS-II) | |
Communication
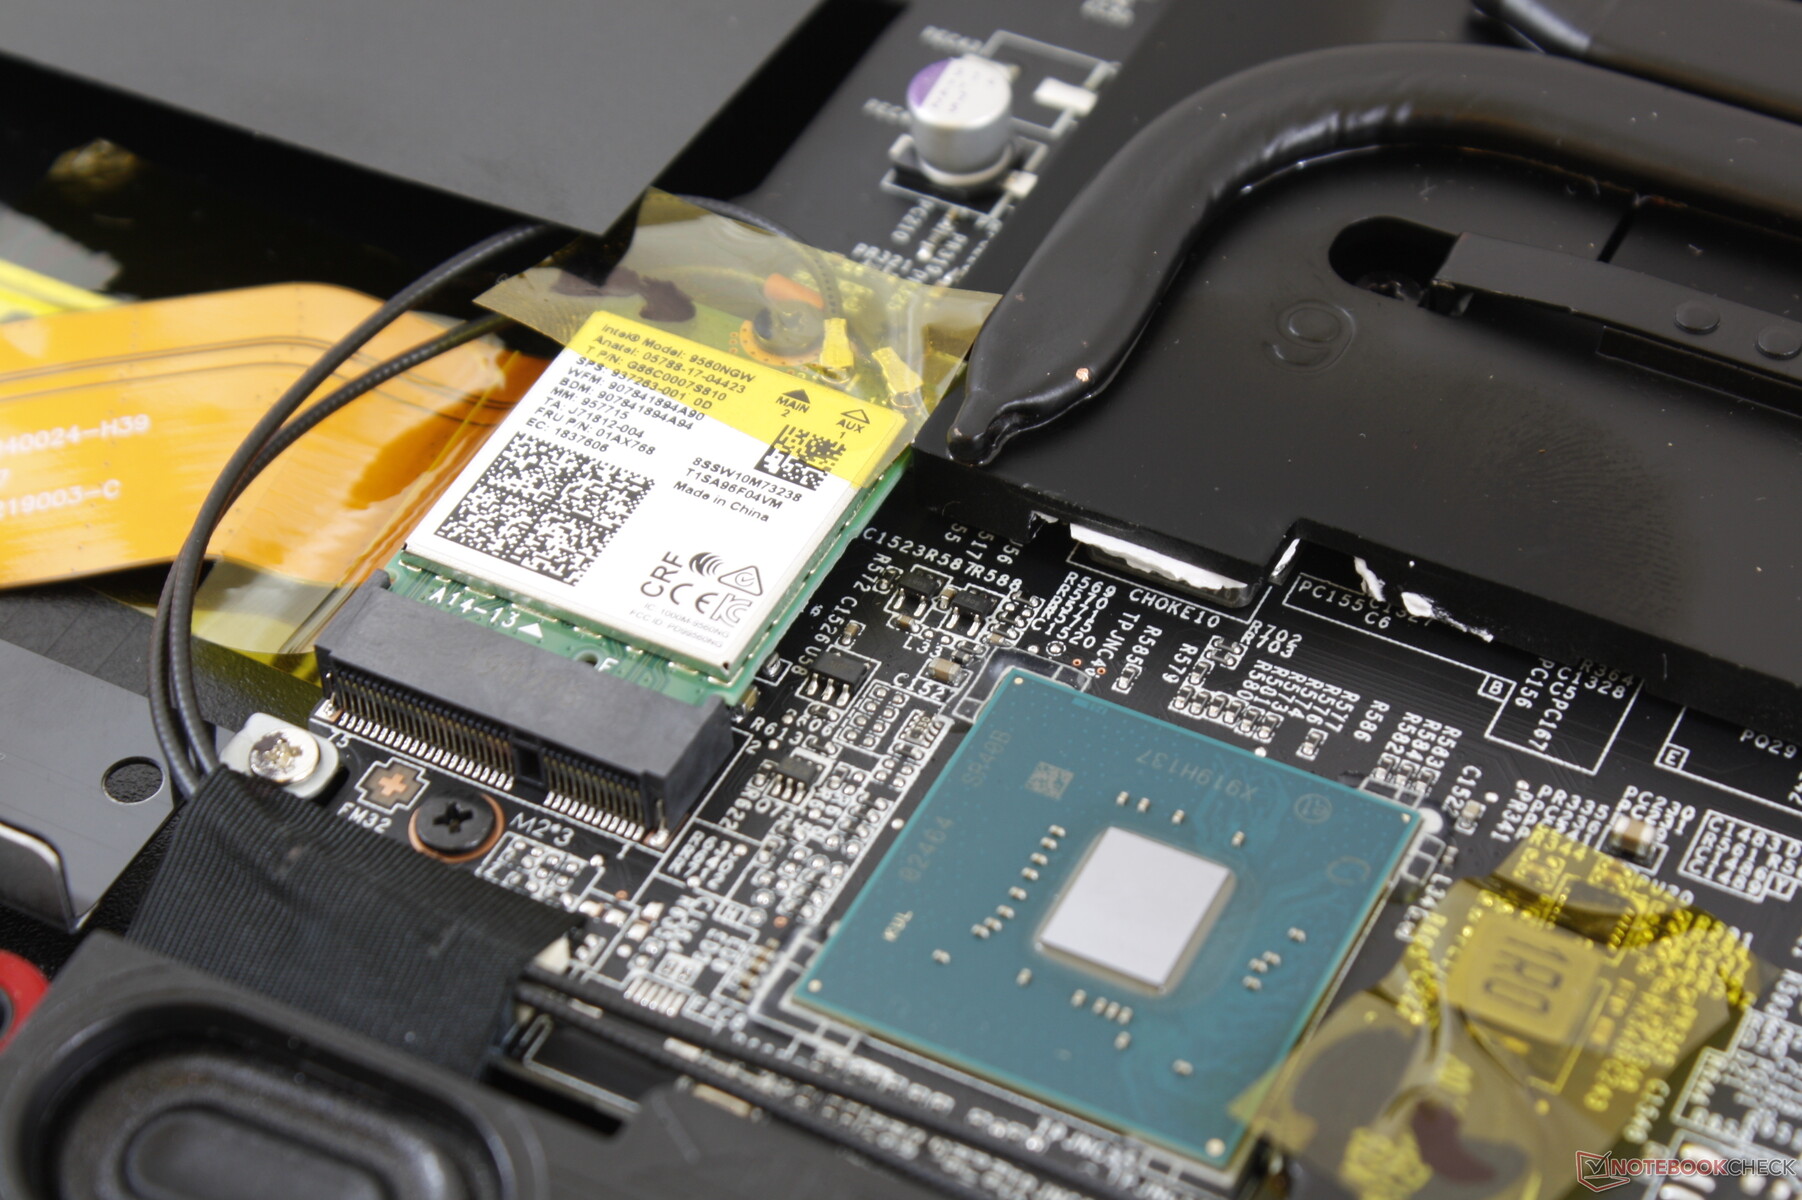
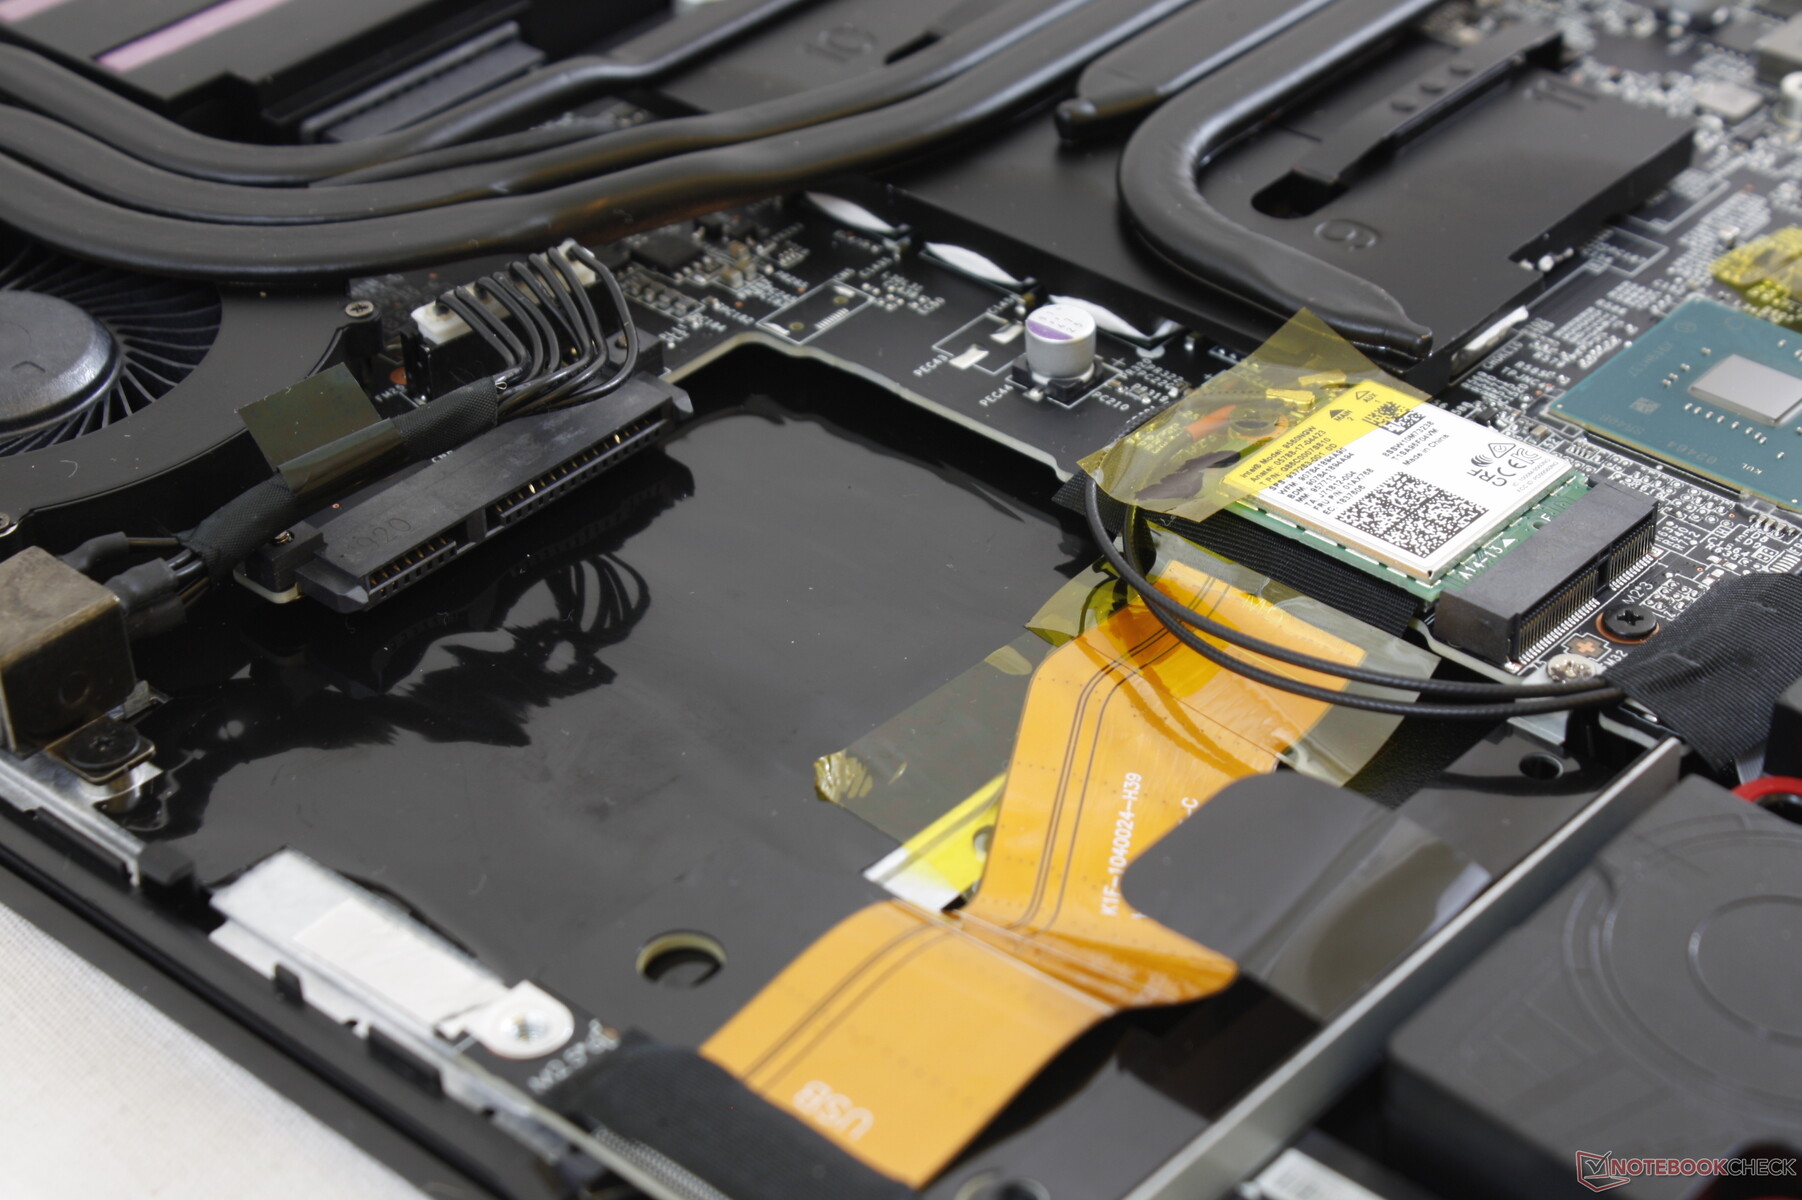
The Intel 9560 offers Wi-Fi 5 and Bluetooth 5 connectivity. Strangely, transmit speeds are only about half of what the module is capable of. We're able to record an average transmit rate of 355 Mbps compared to 620 Mbps on the MSI GS65 equipped with the exact same Intel 9560. Other than this performance oddity, we experienced no wireless issues with the GL65.
| Networking | |
| iperf3 transmit AX12 | |
| Gigabyte Aero 15 Classic-XA | |
| MSI GS65 Stealth 9SG | |
| MSI GL65 9SEK | |
| MSI GL63 8RC-069US | |
| iperf3 receive AX12 | |
| Gigabyte Aero 15 Classic-XA | |
| MSI GS65 Stealth 9SG | |
| MSI GL65 9SEK | |
| MSI GL63 8RC-069US | |
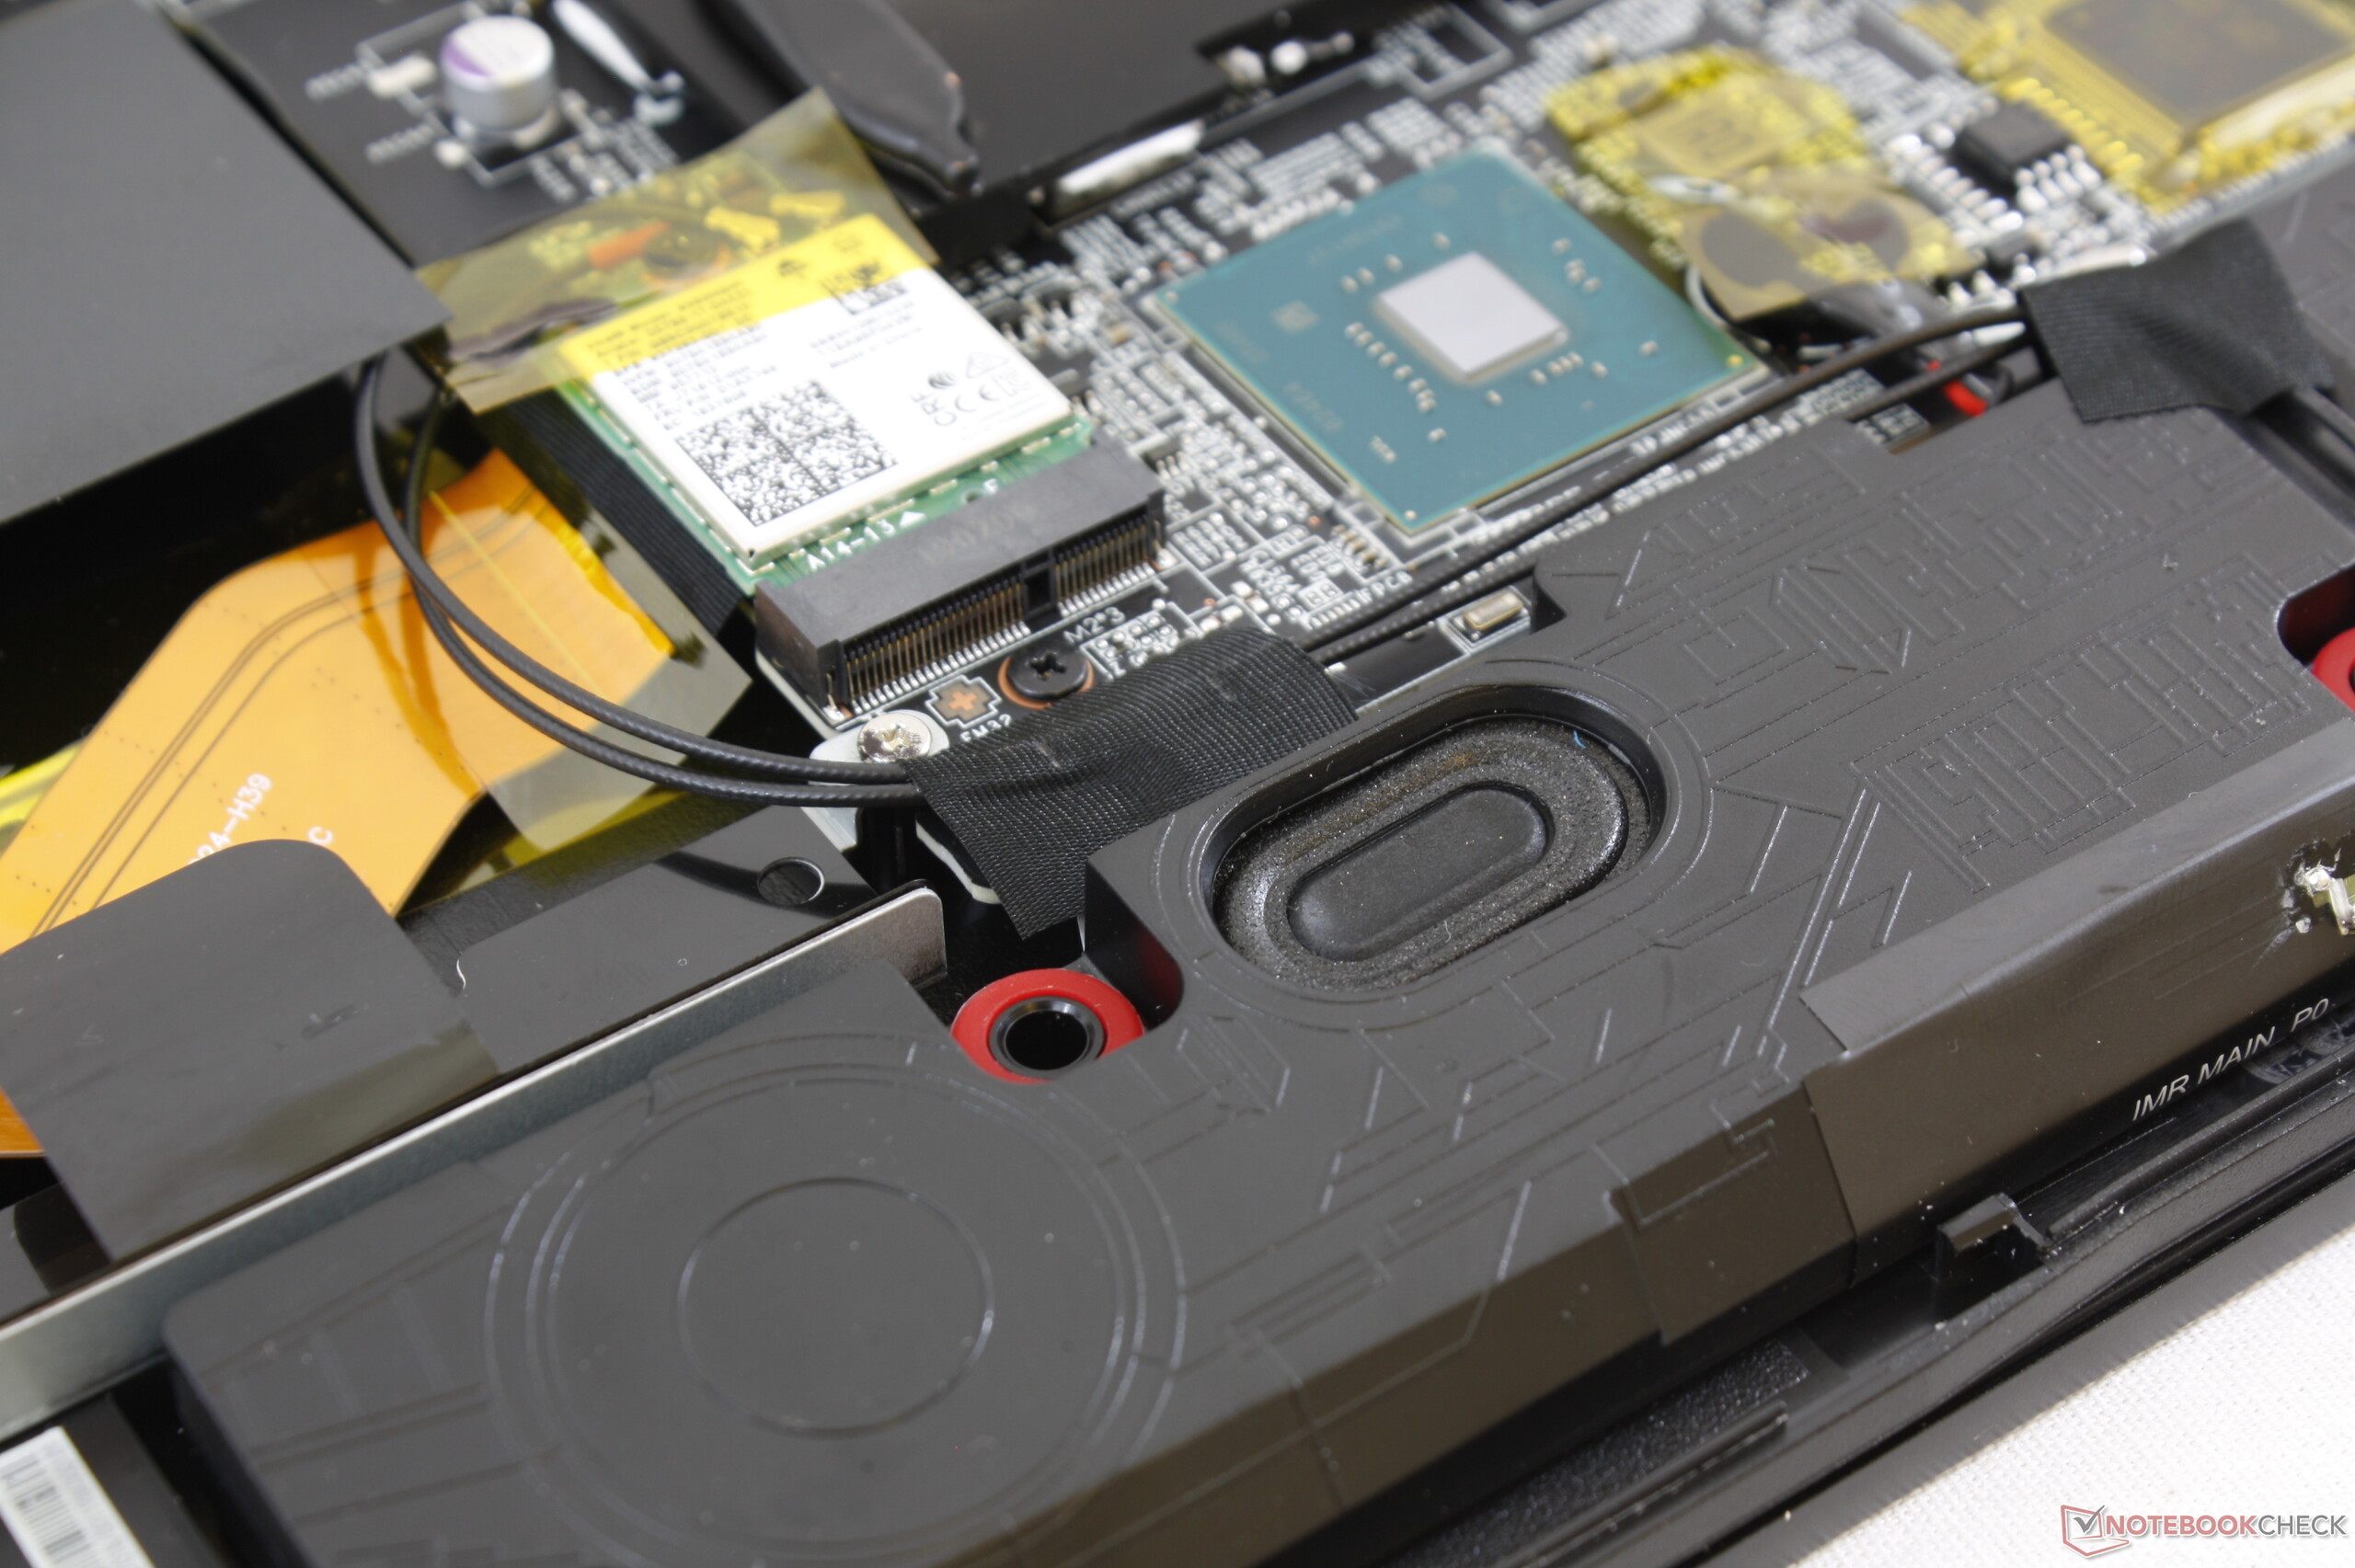
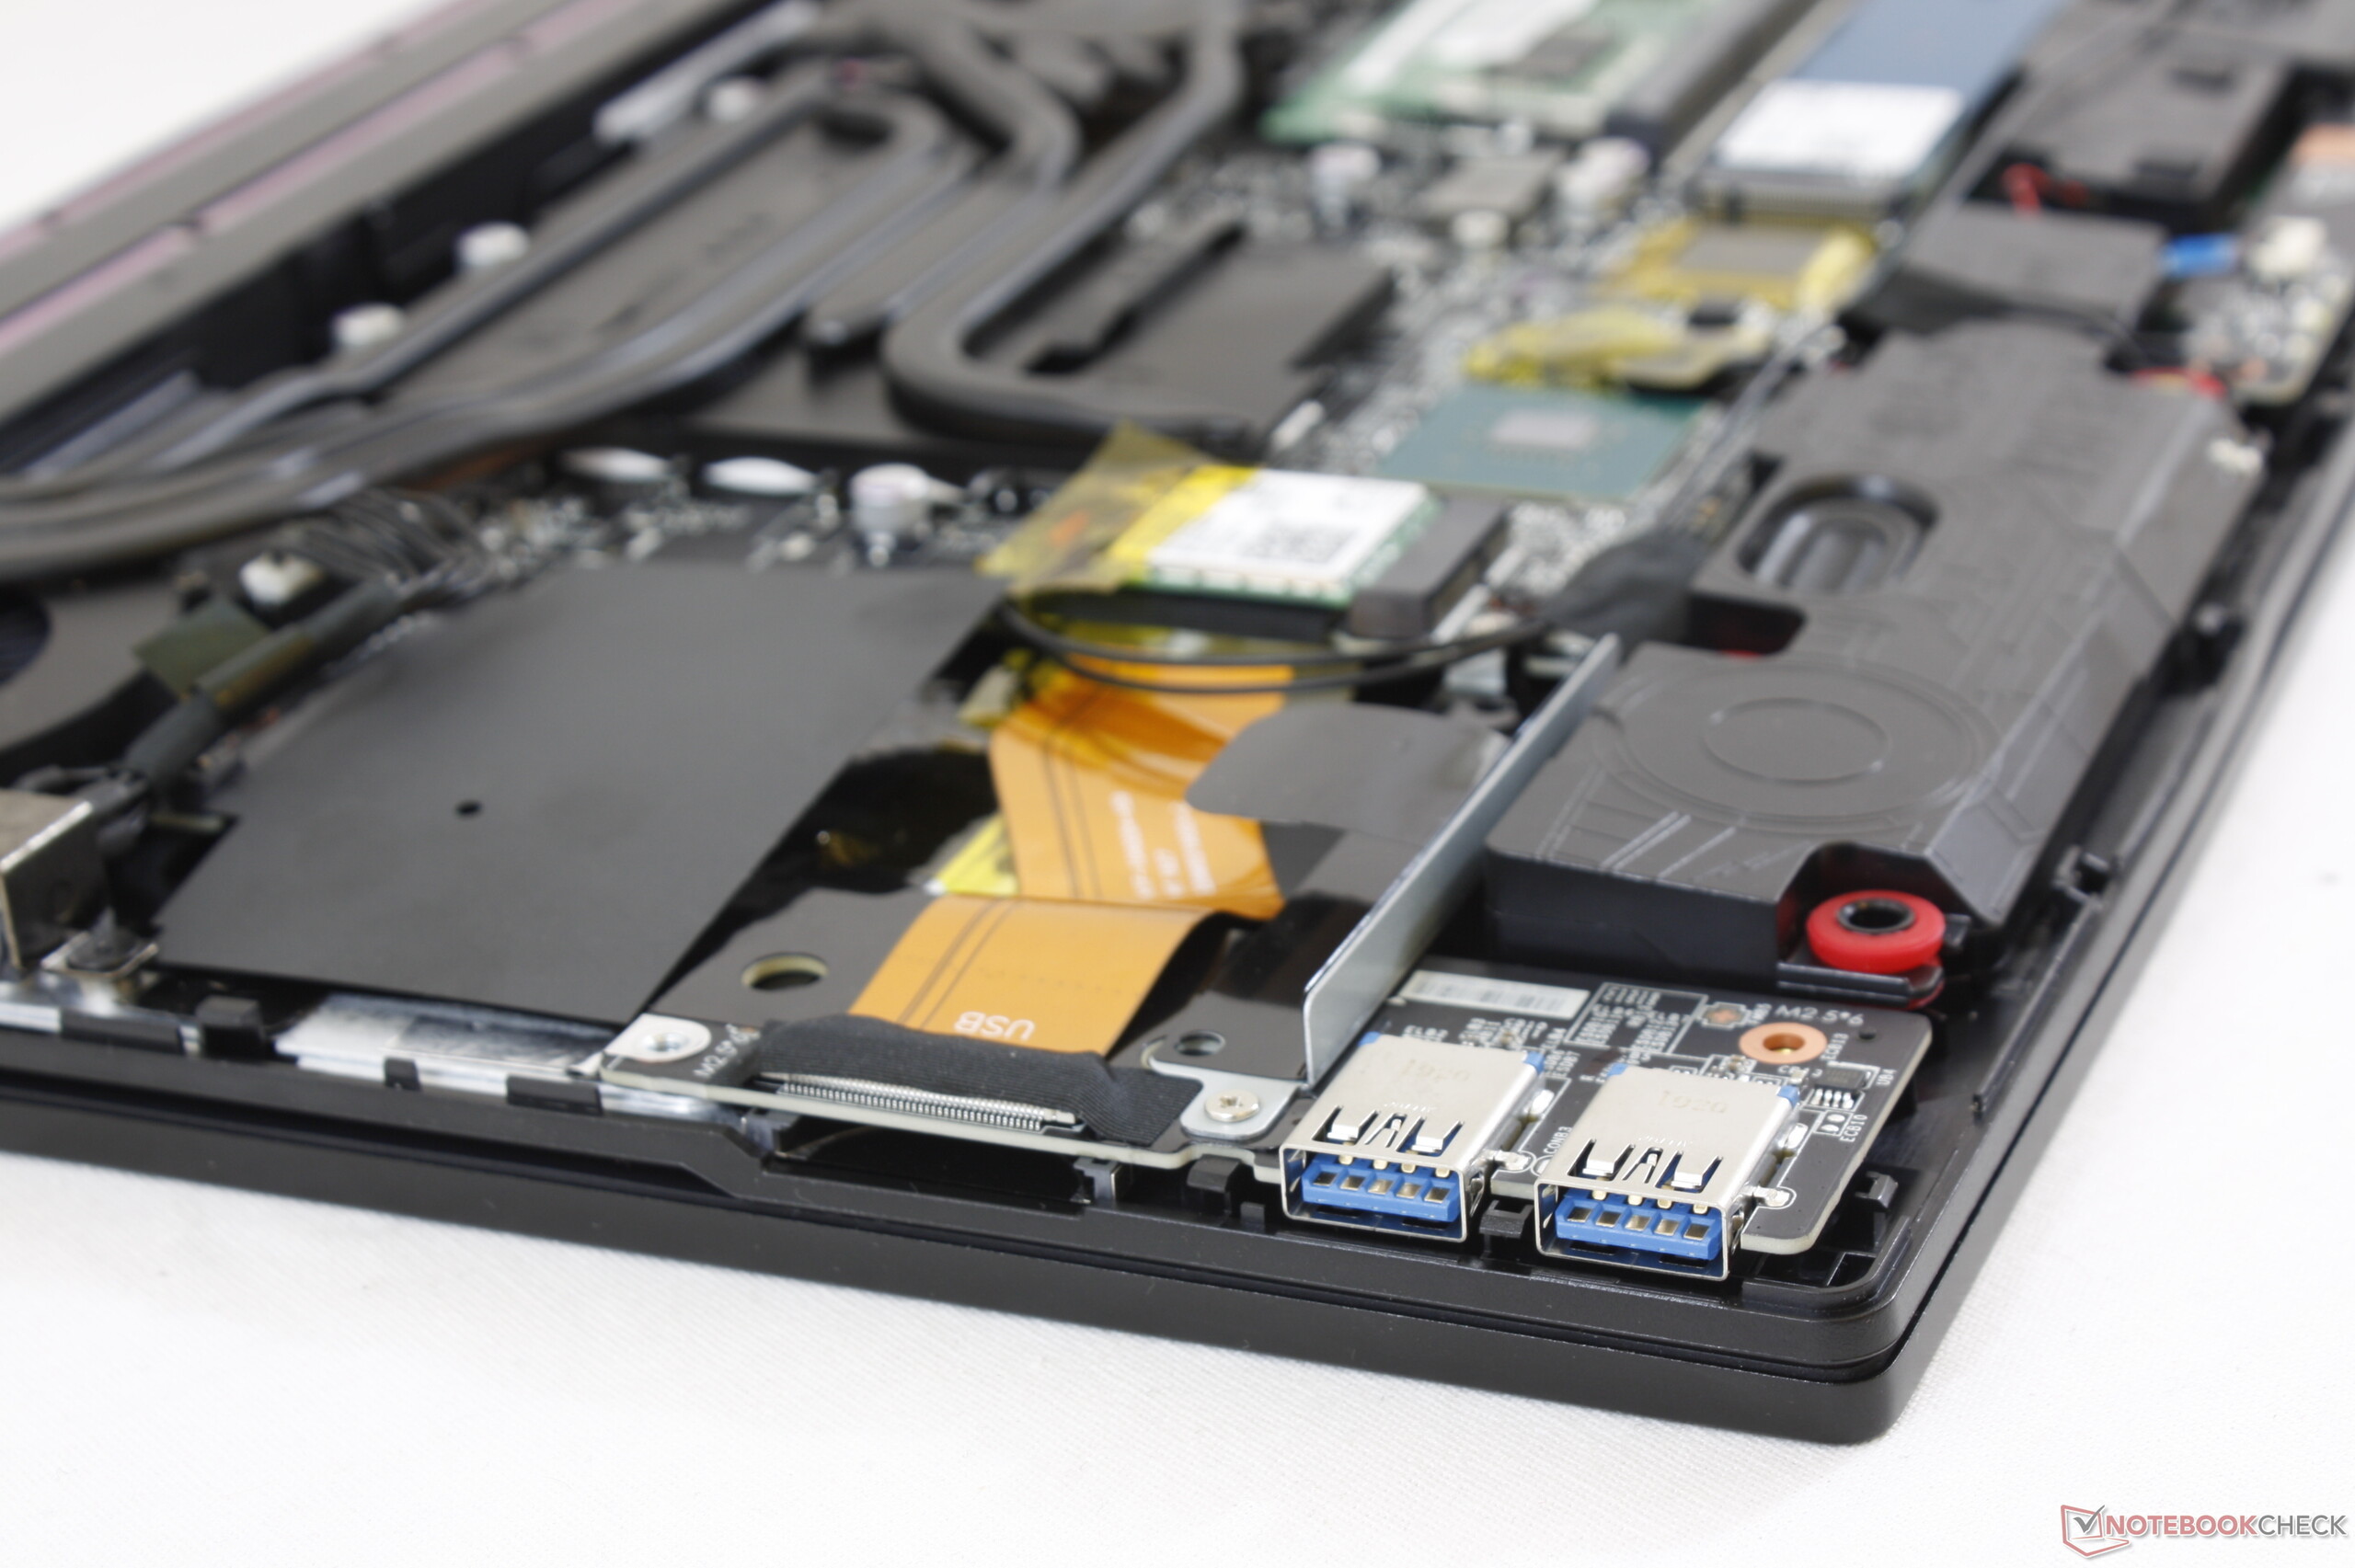
Maintenance
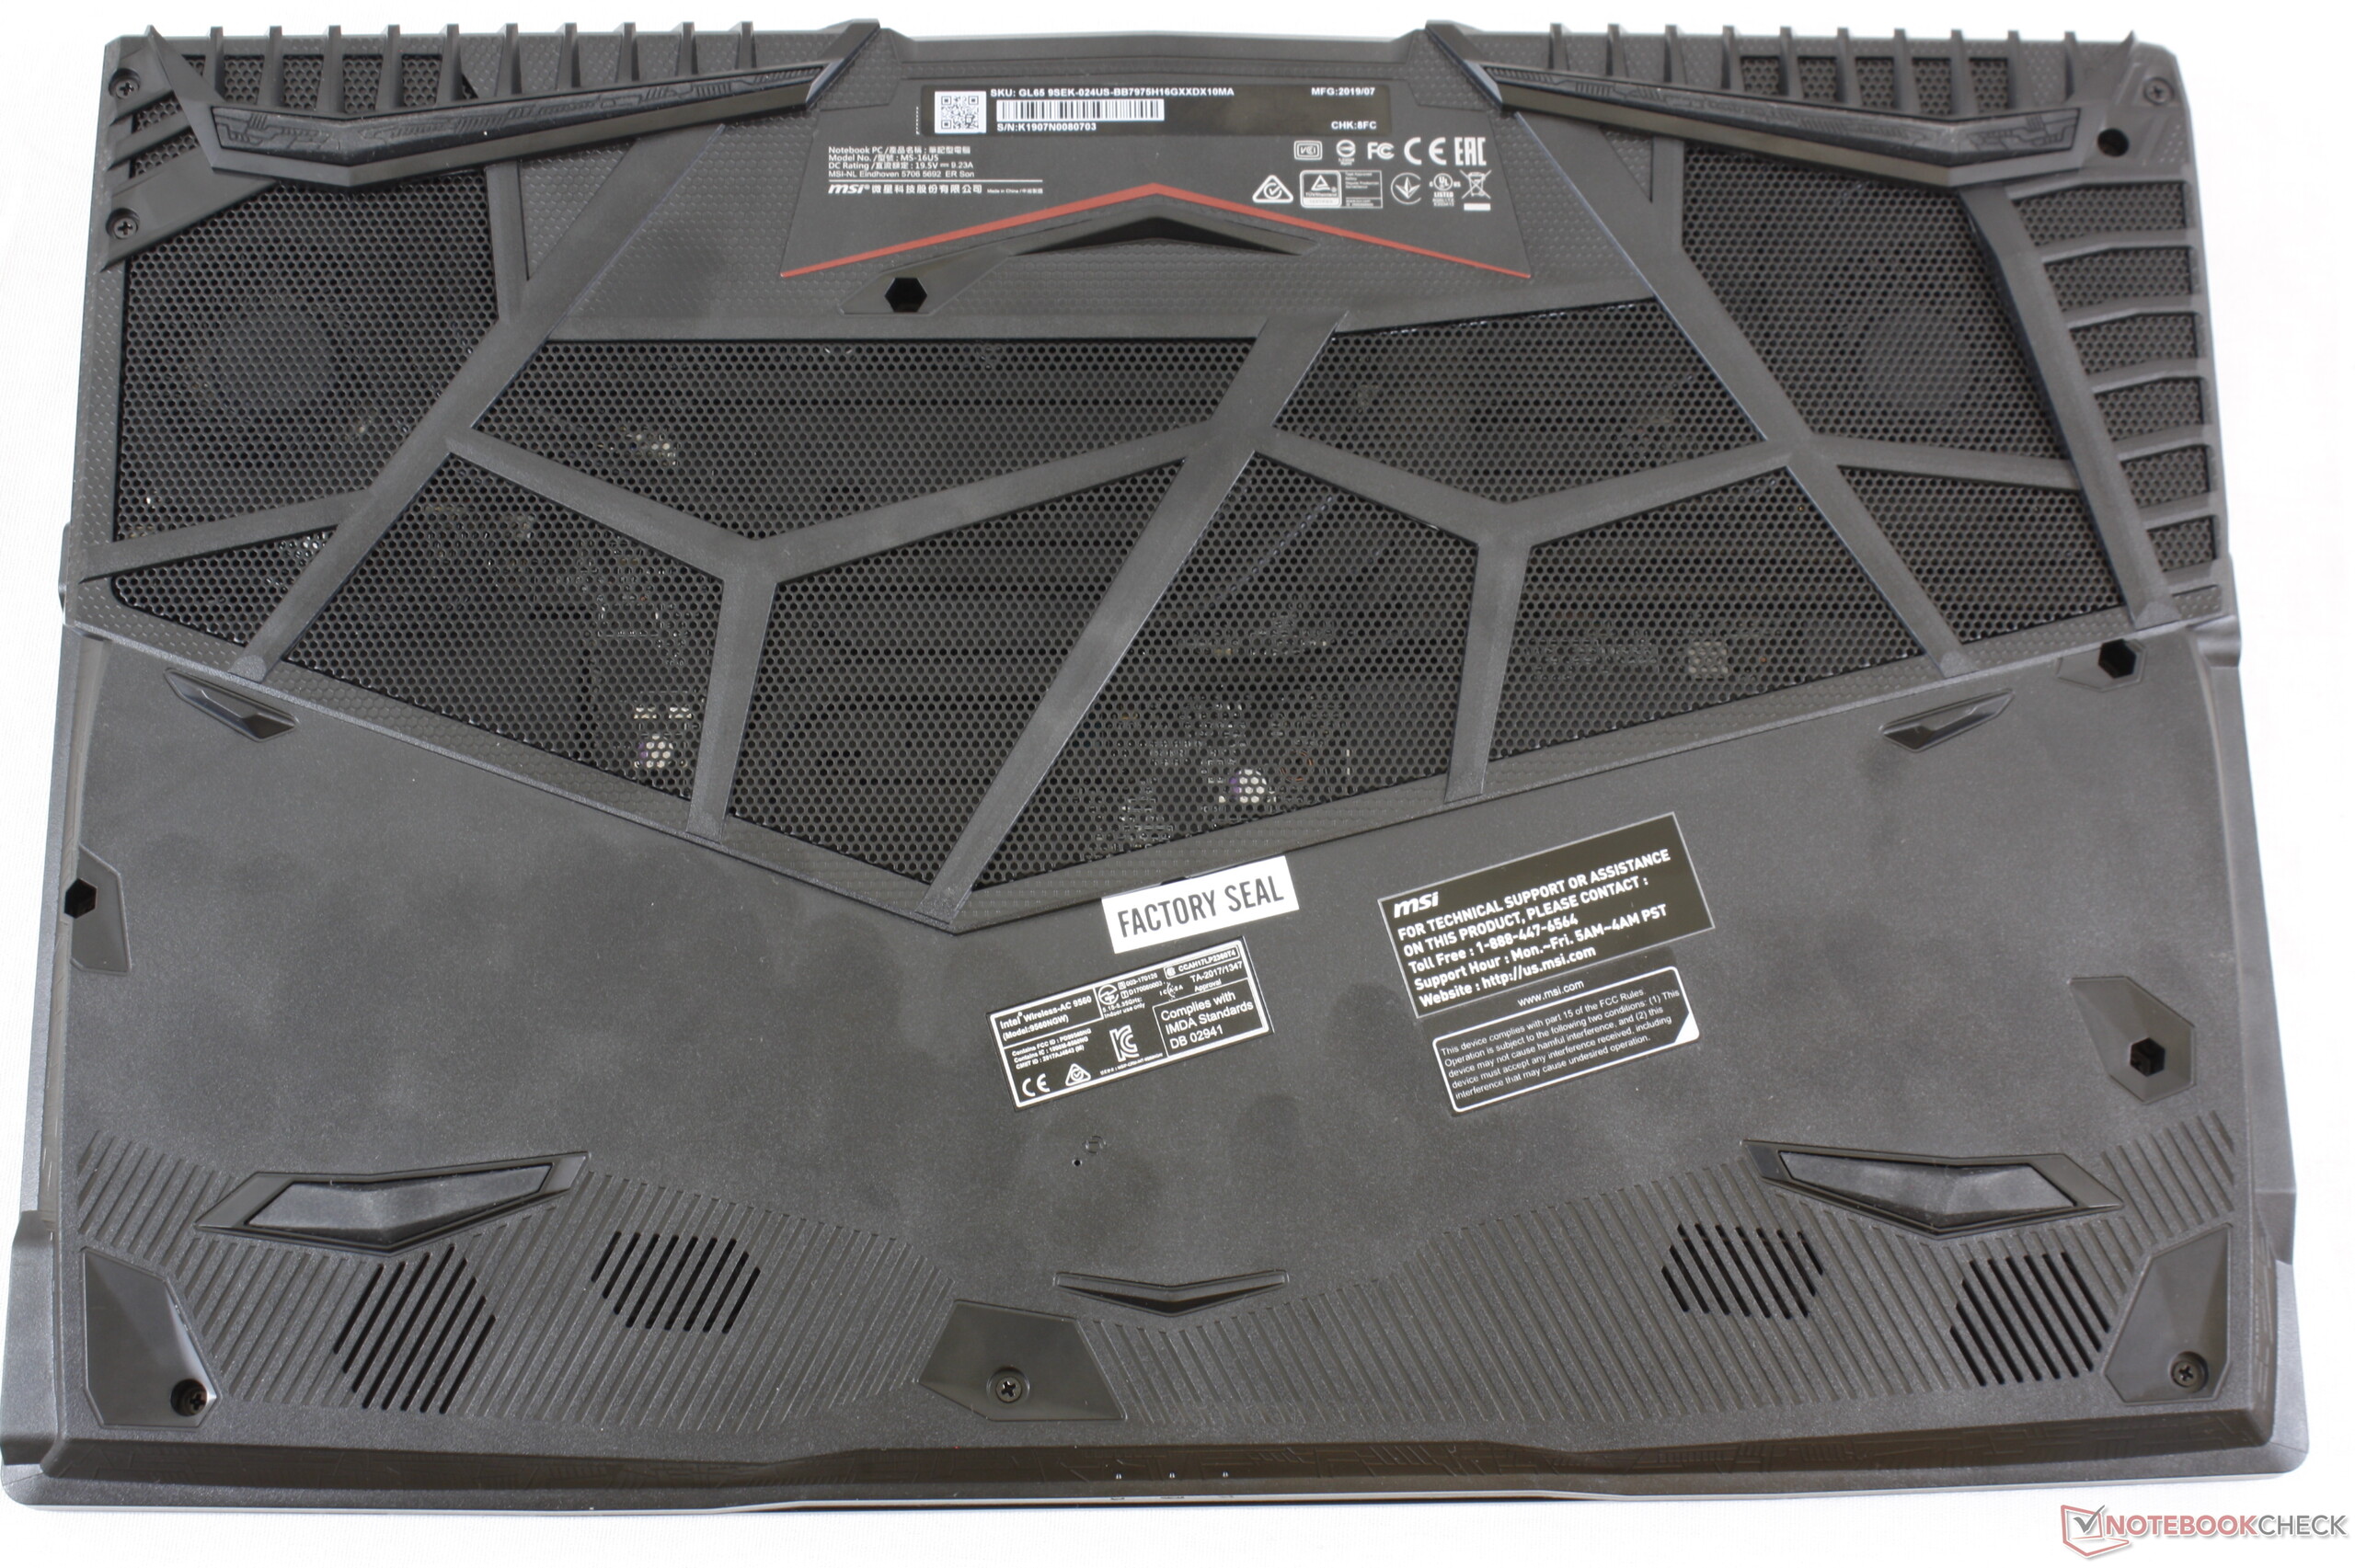
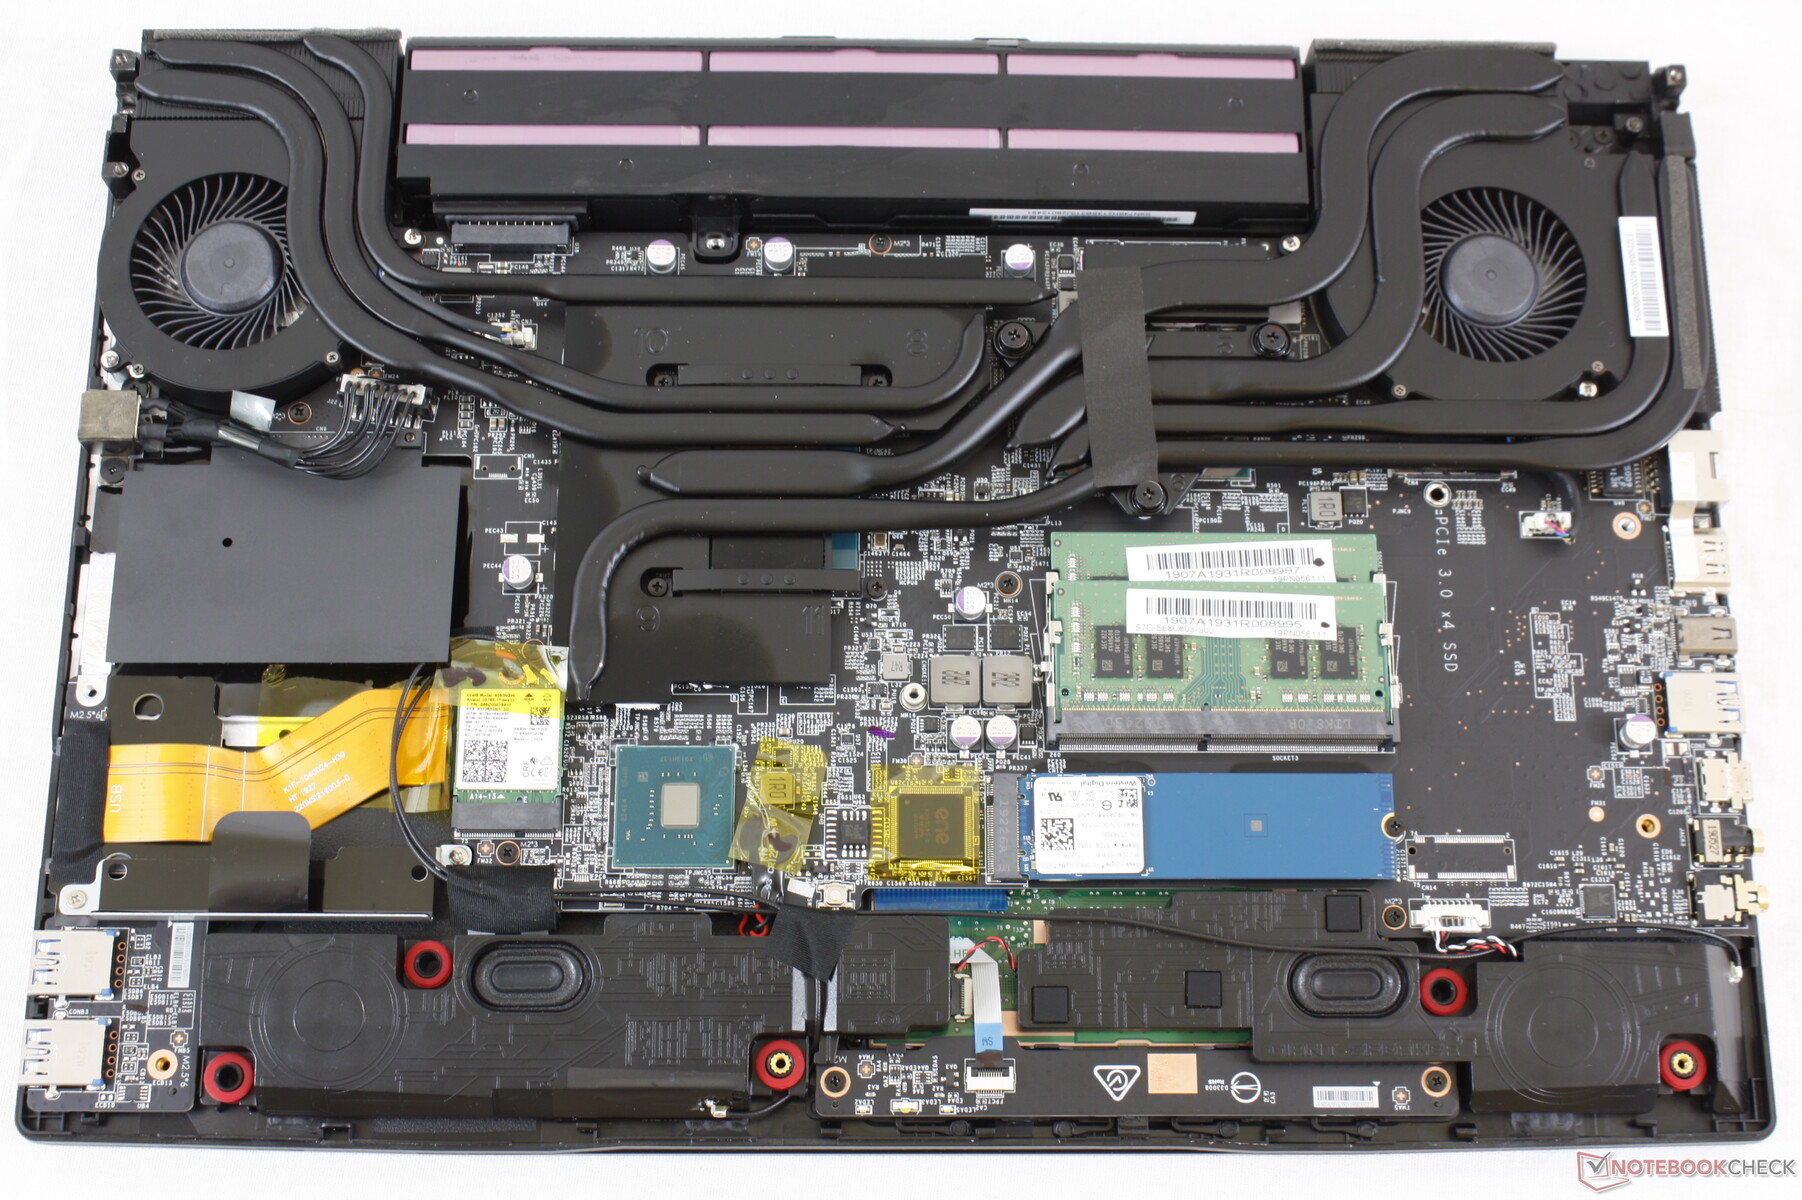
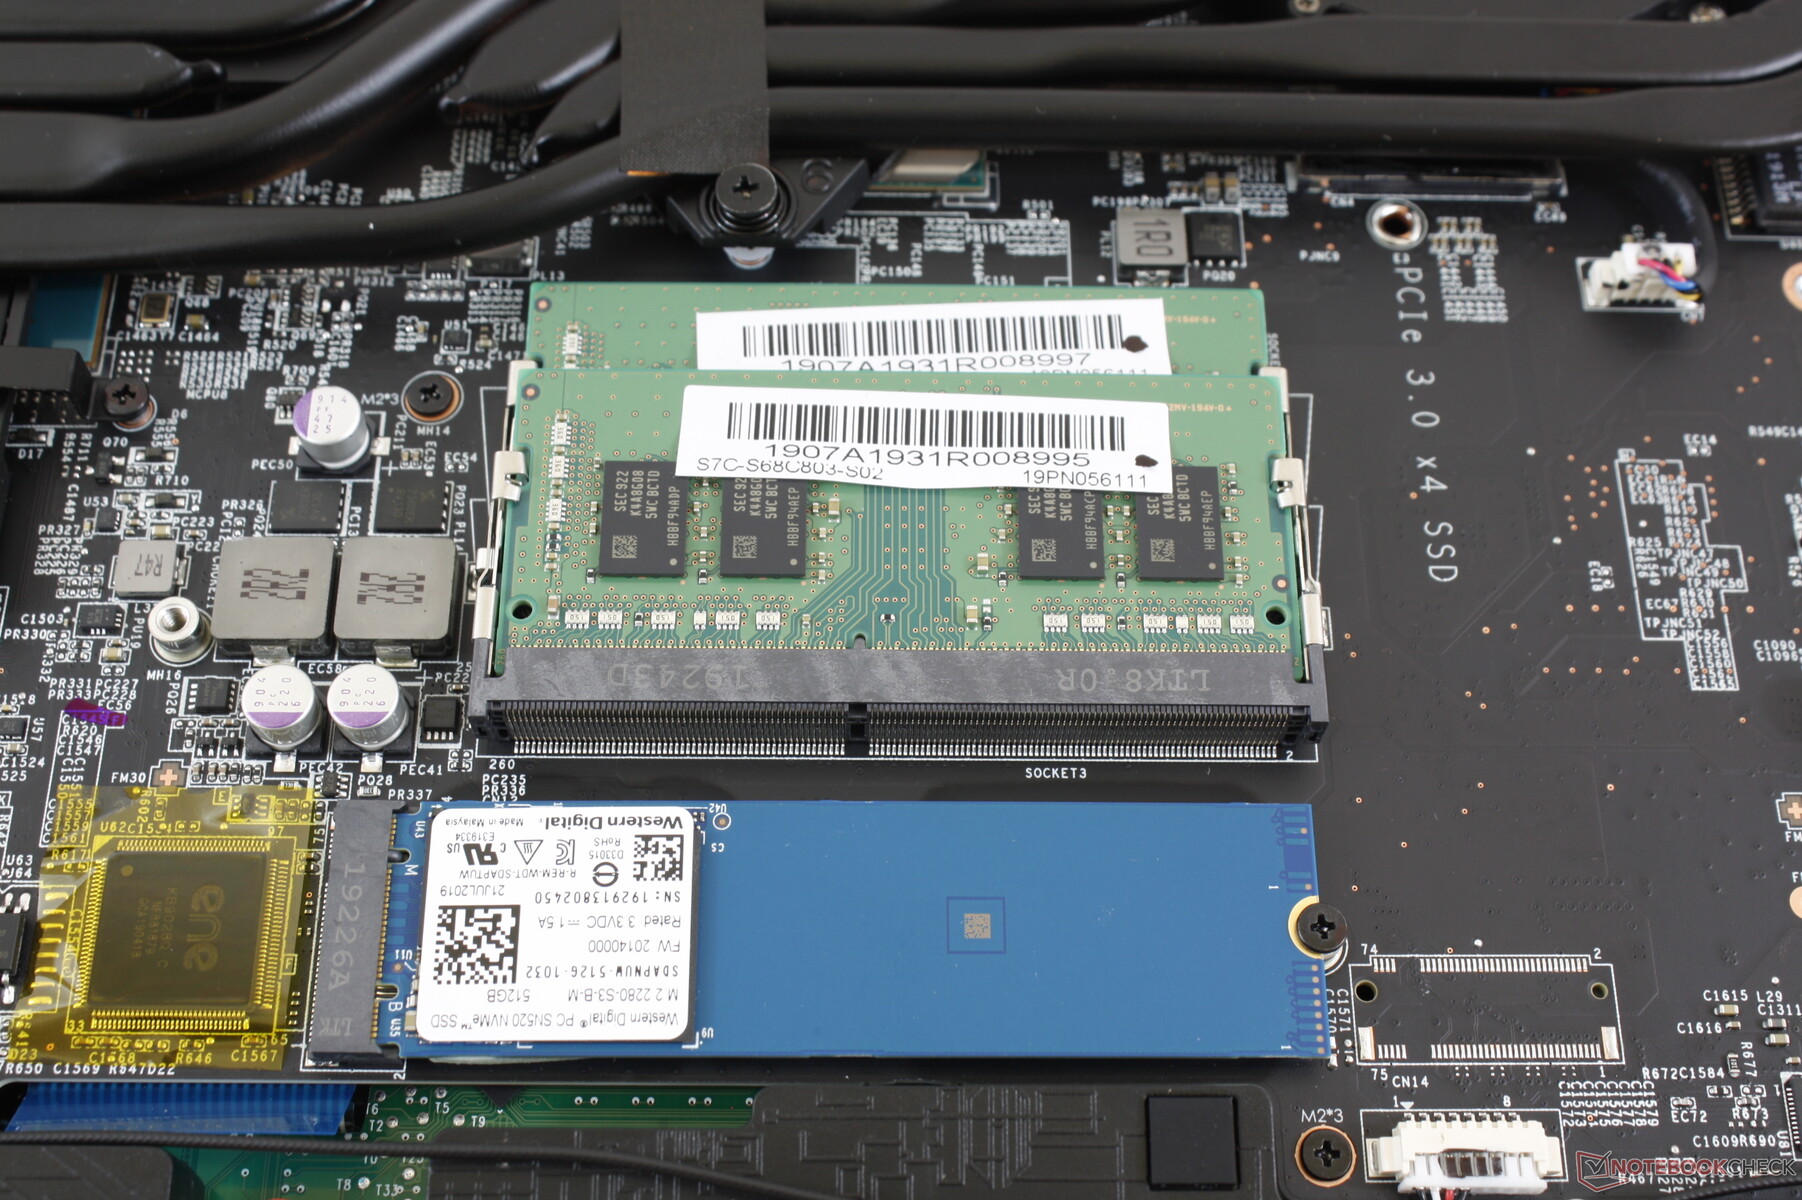
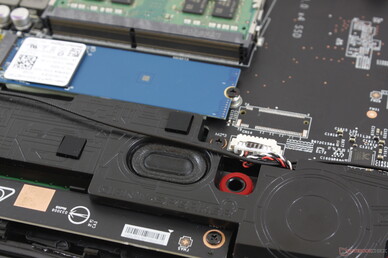
The bottom panel is secured by 12 Philips screws that will unfortunately require tearing a factory seal sticker to service. Once inside, upgrading core components like RAM, WLAN, battery, or the two storage bays becomes simple.
Accessories and Warranty
There are no extras included in the retail box. The standard one-year limited manufacturer warranty applies.
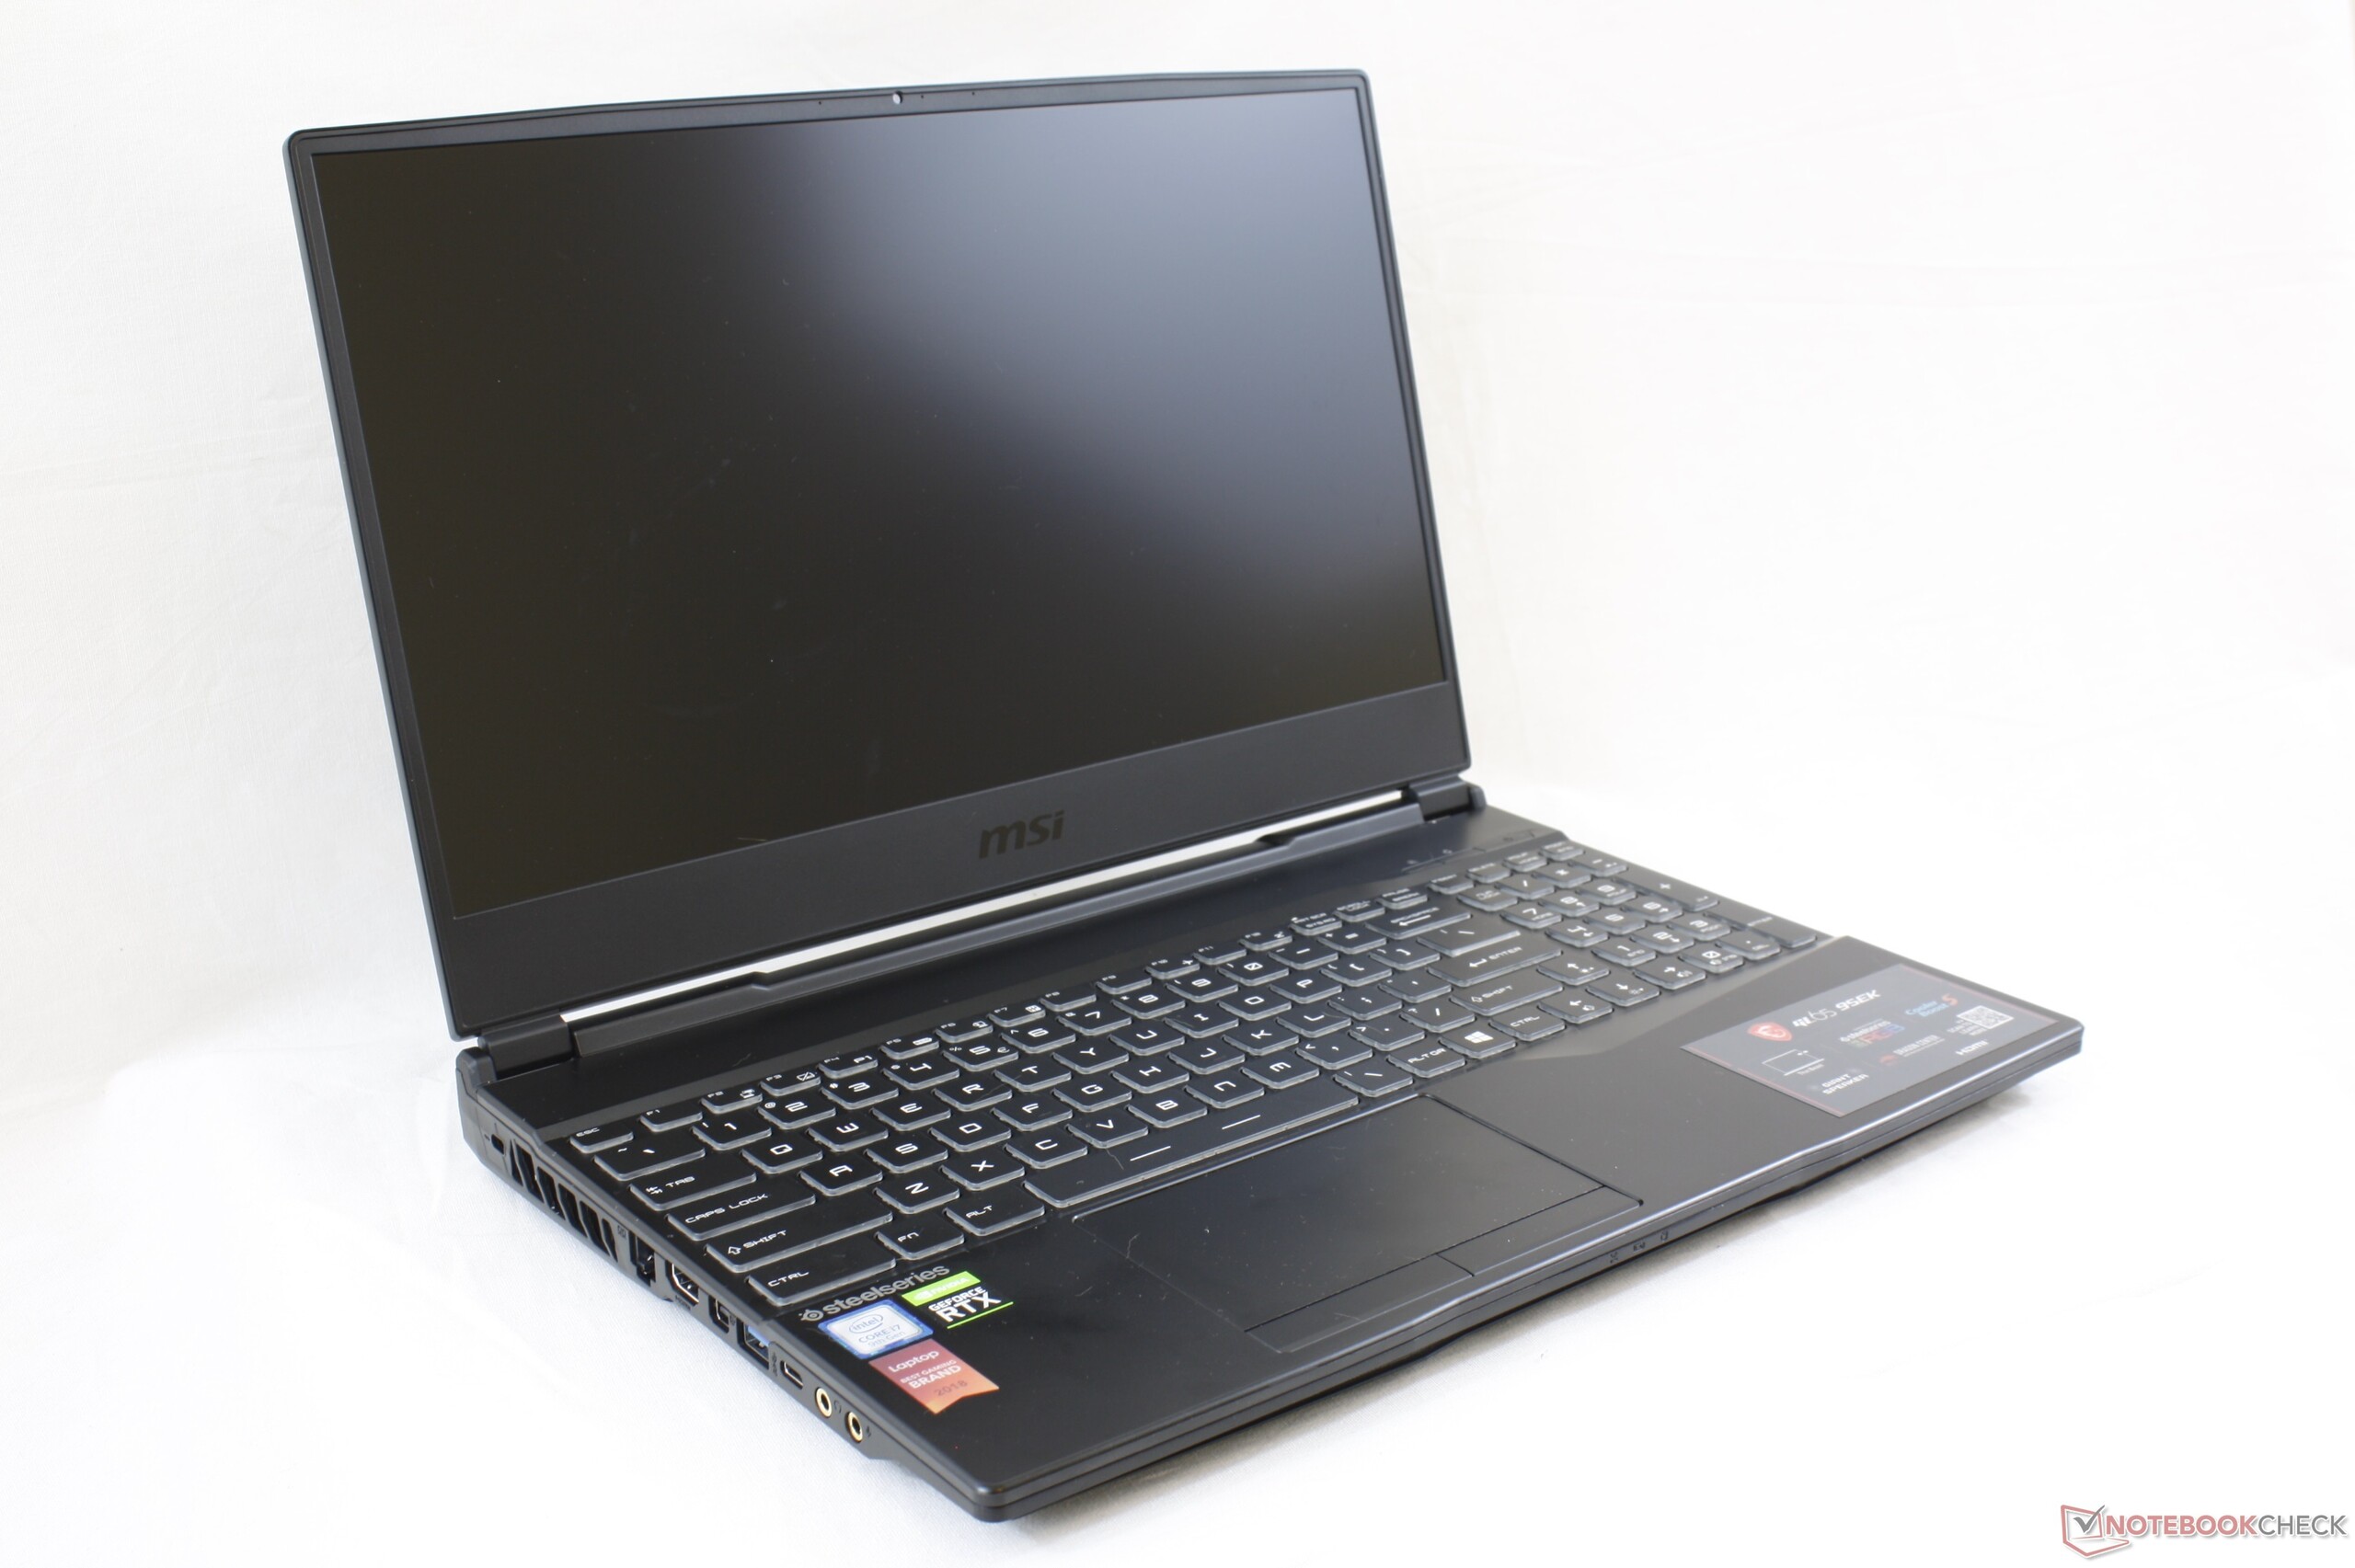
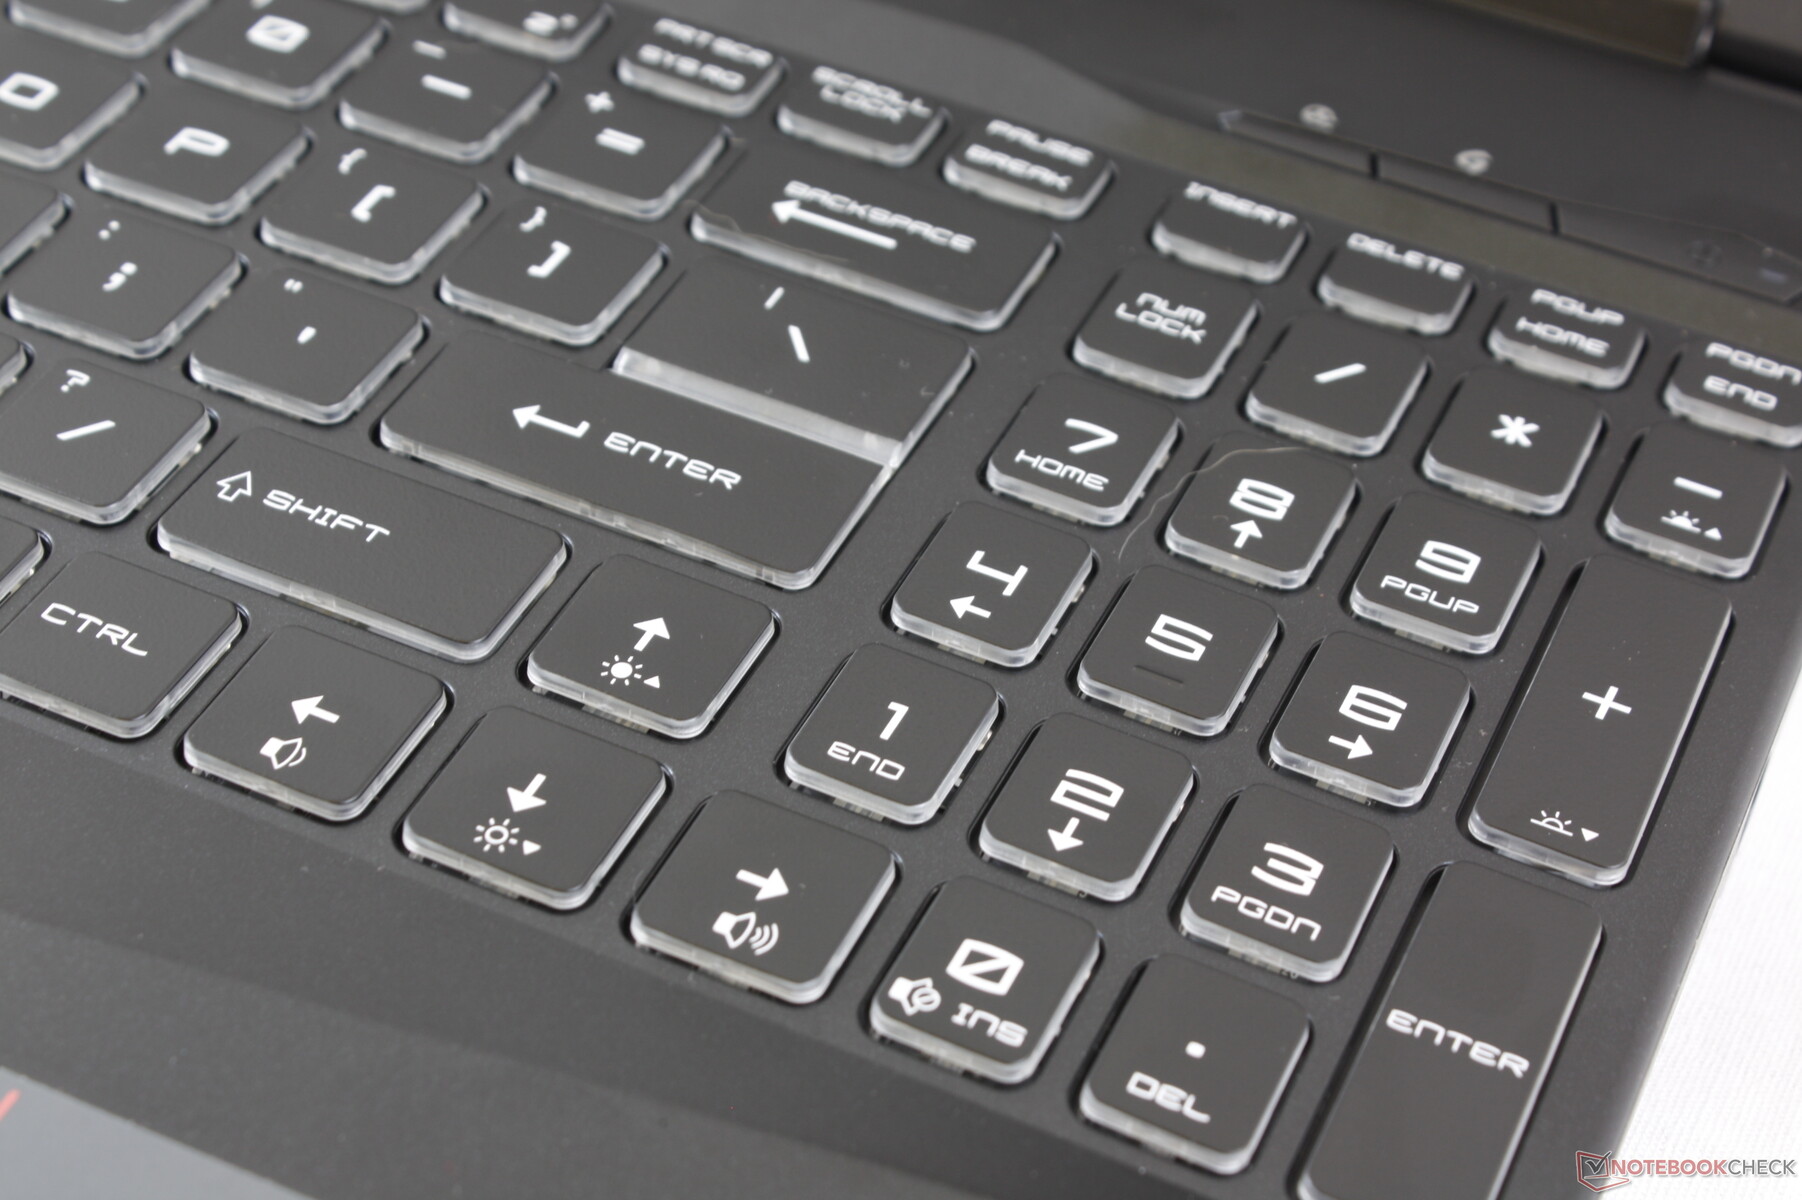
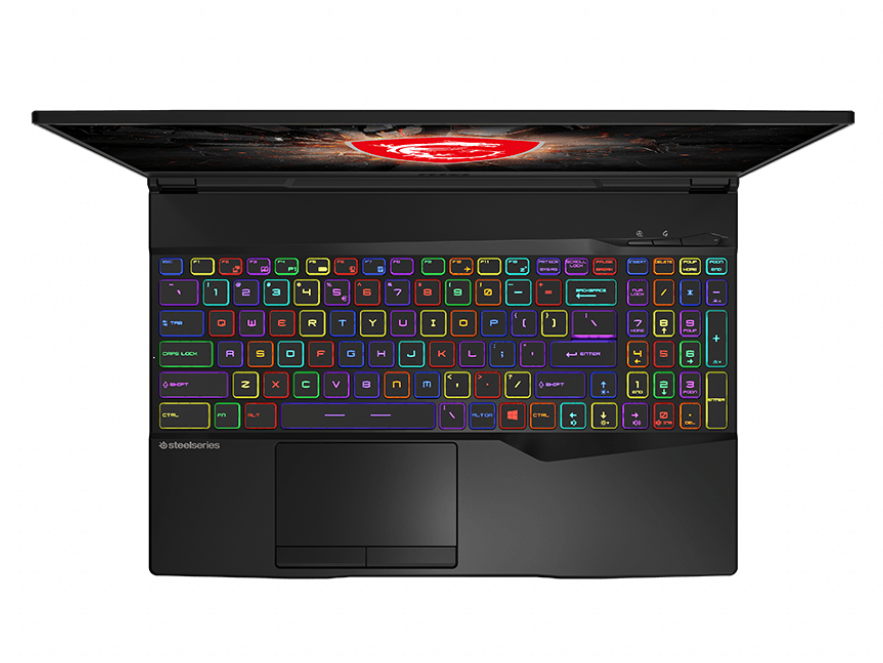
Input Devices
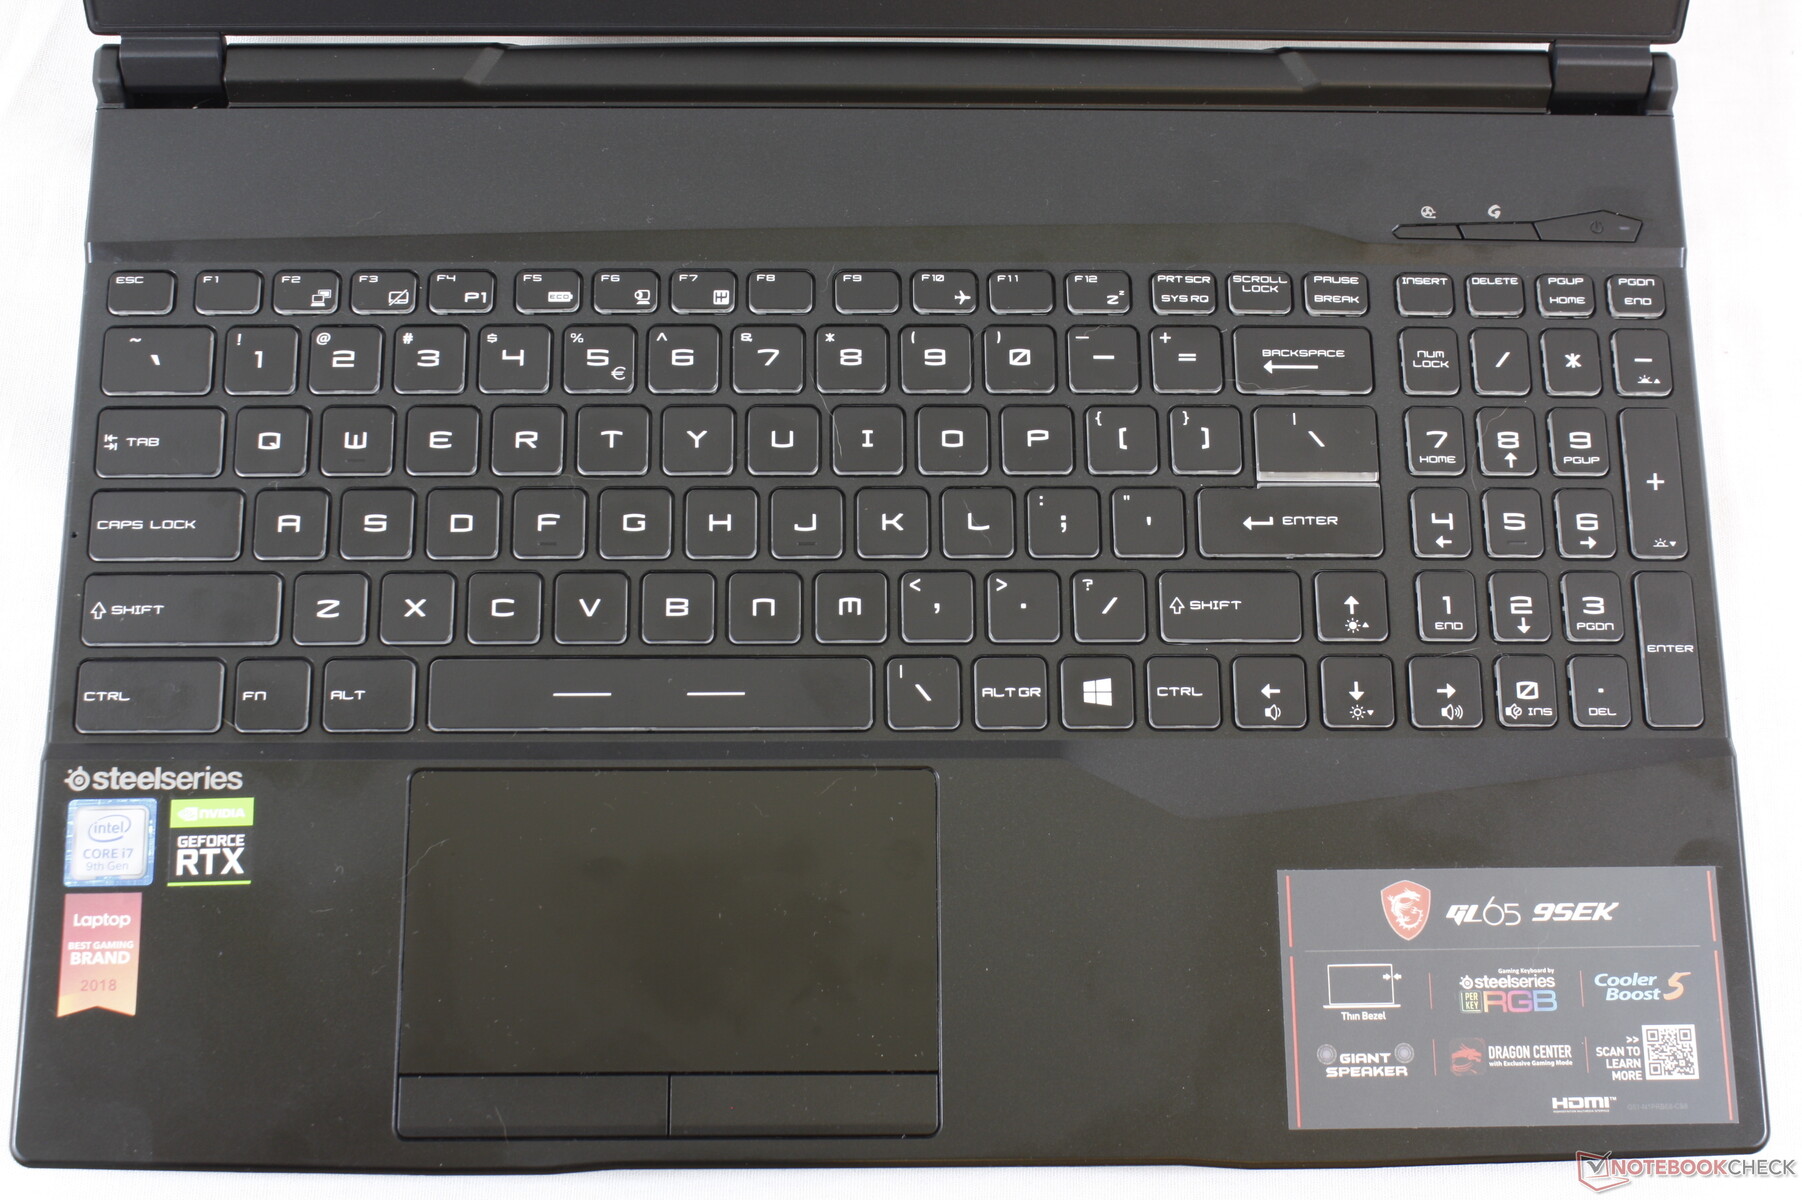
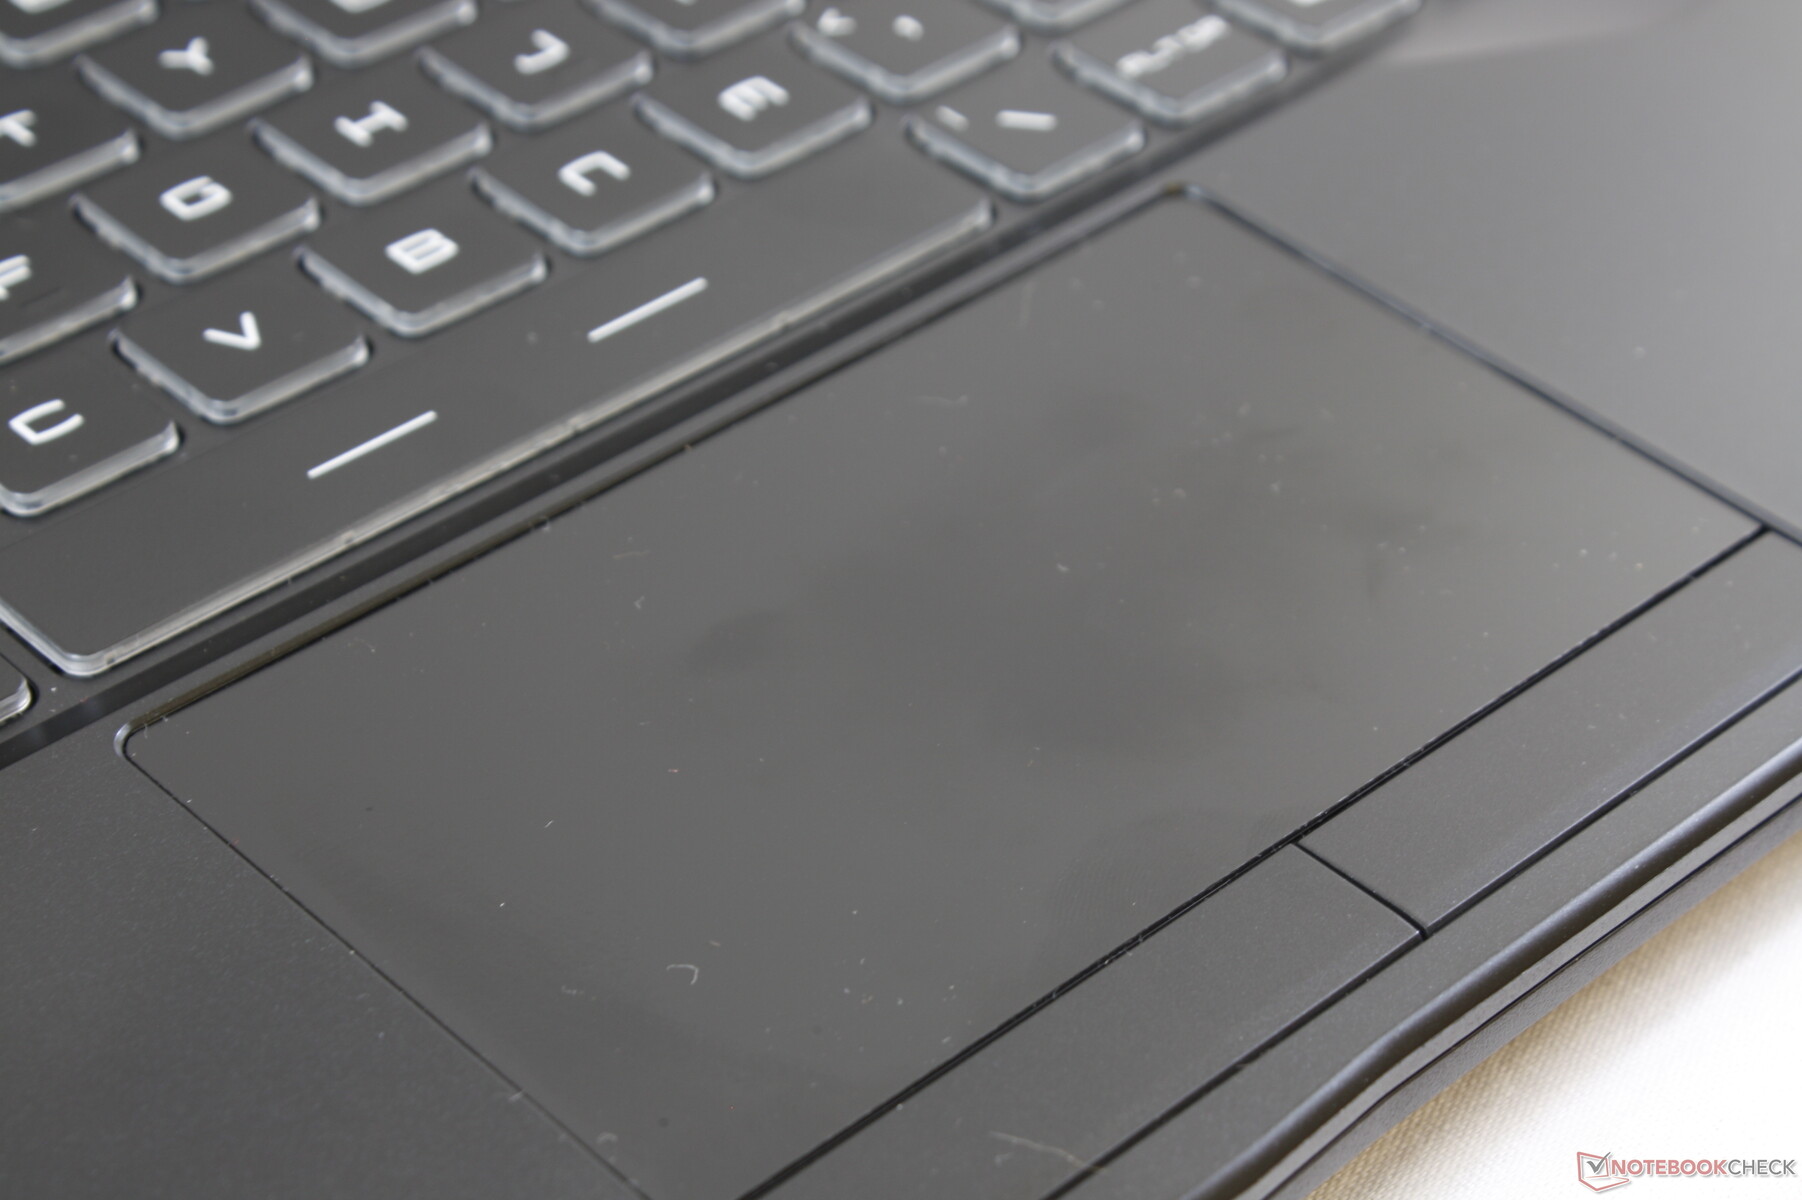
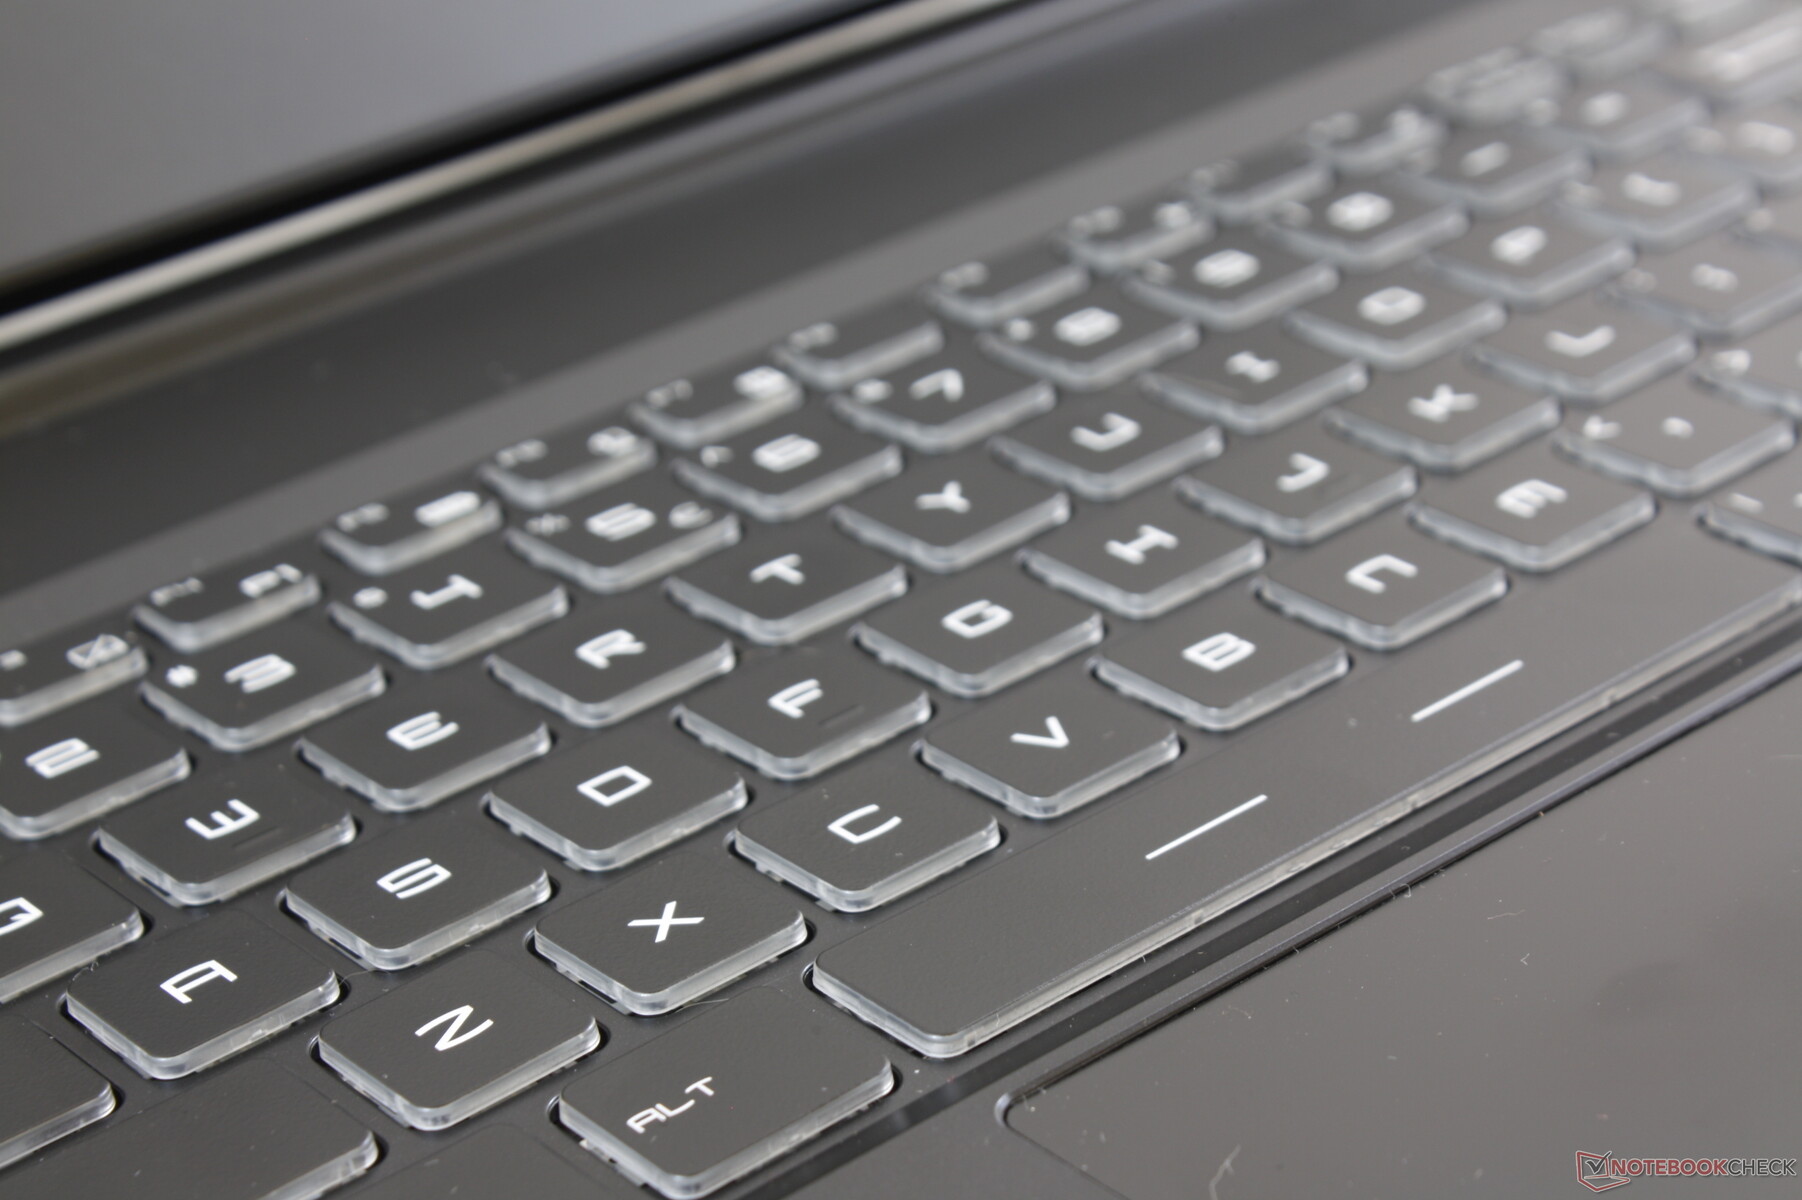
Keyboard and Touchpad
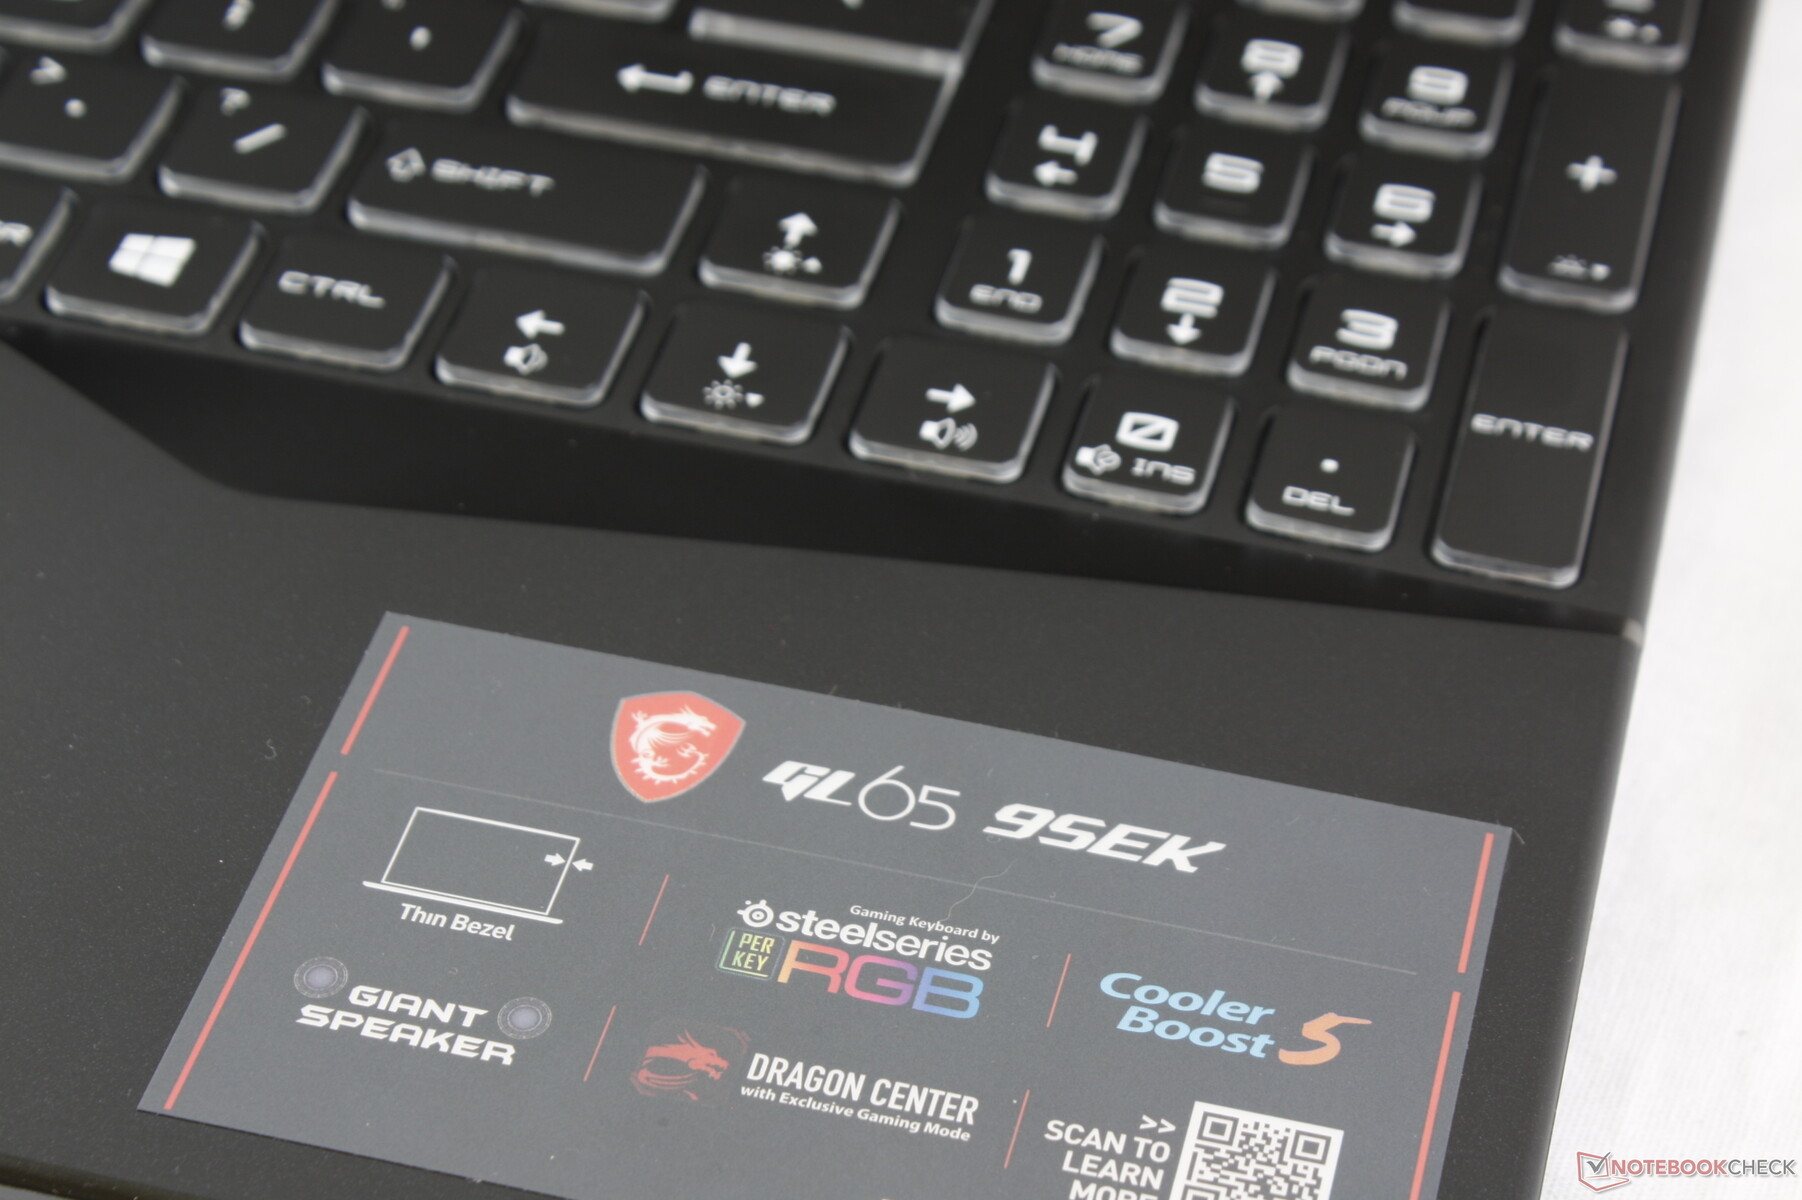
The keyboard and trackpad (11 x 6.3 cm) are identical to the GP65. Keep in mind that some lower-end SKUs have single-zone red keyboard backlight only whereas this GeForce RTX SKU includes per-key RGB lighting.
We applaud MSI for using the SteelSeries keyboard across most G series laptops in order to give a consistent look and feel between models and generations. If you have typed on an MSI G series laptop before, then you will already have a good idea of how the GL65 keyboard will feel.
Display
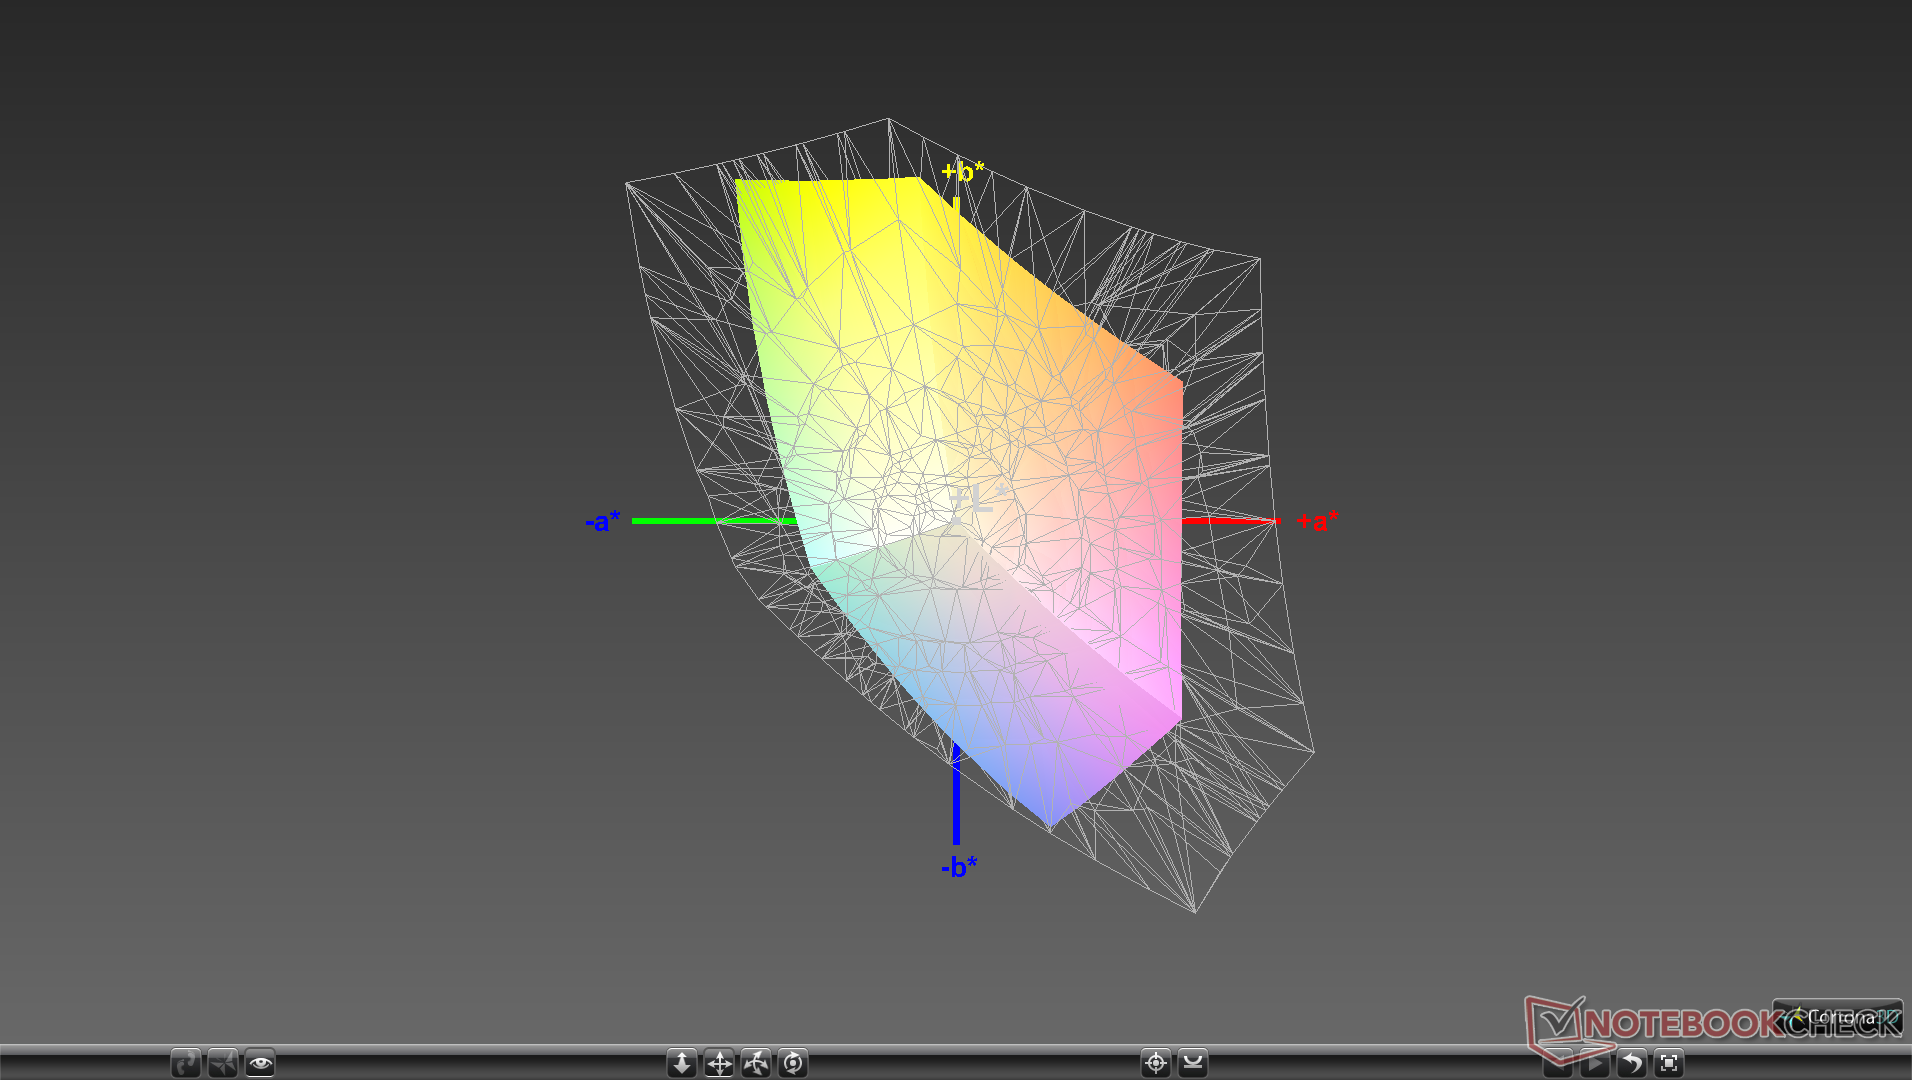
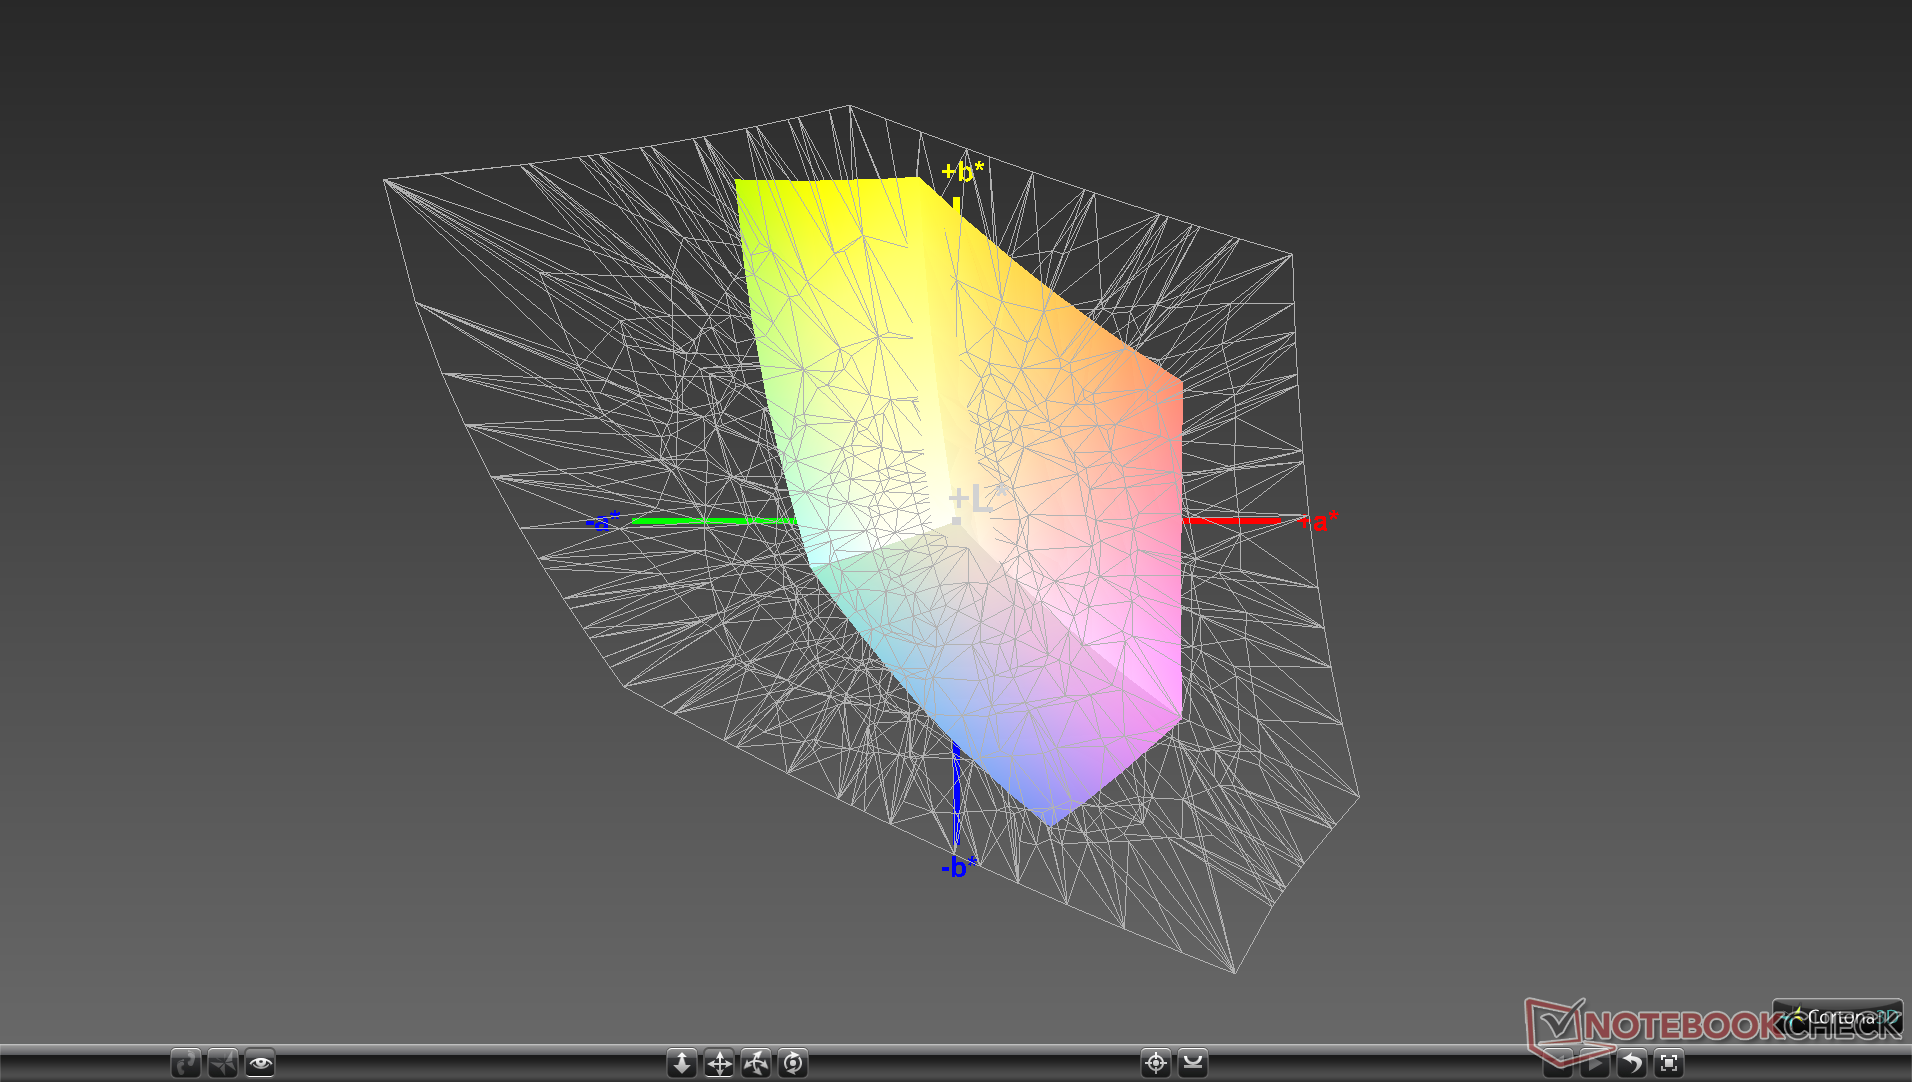
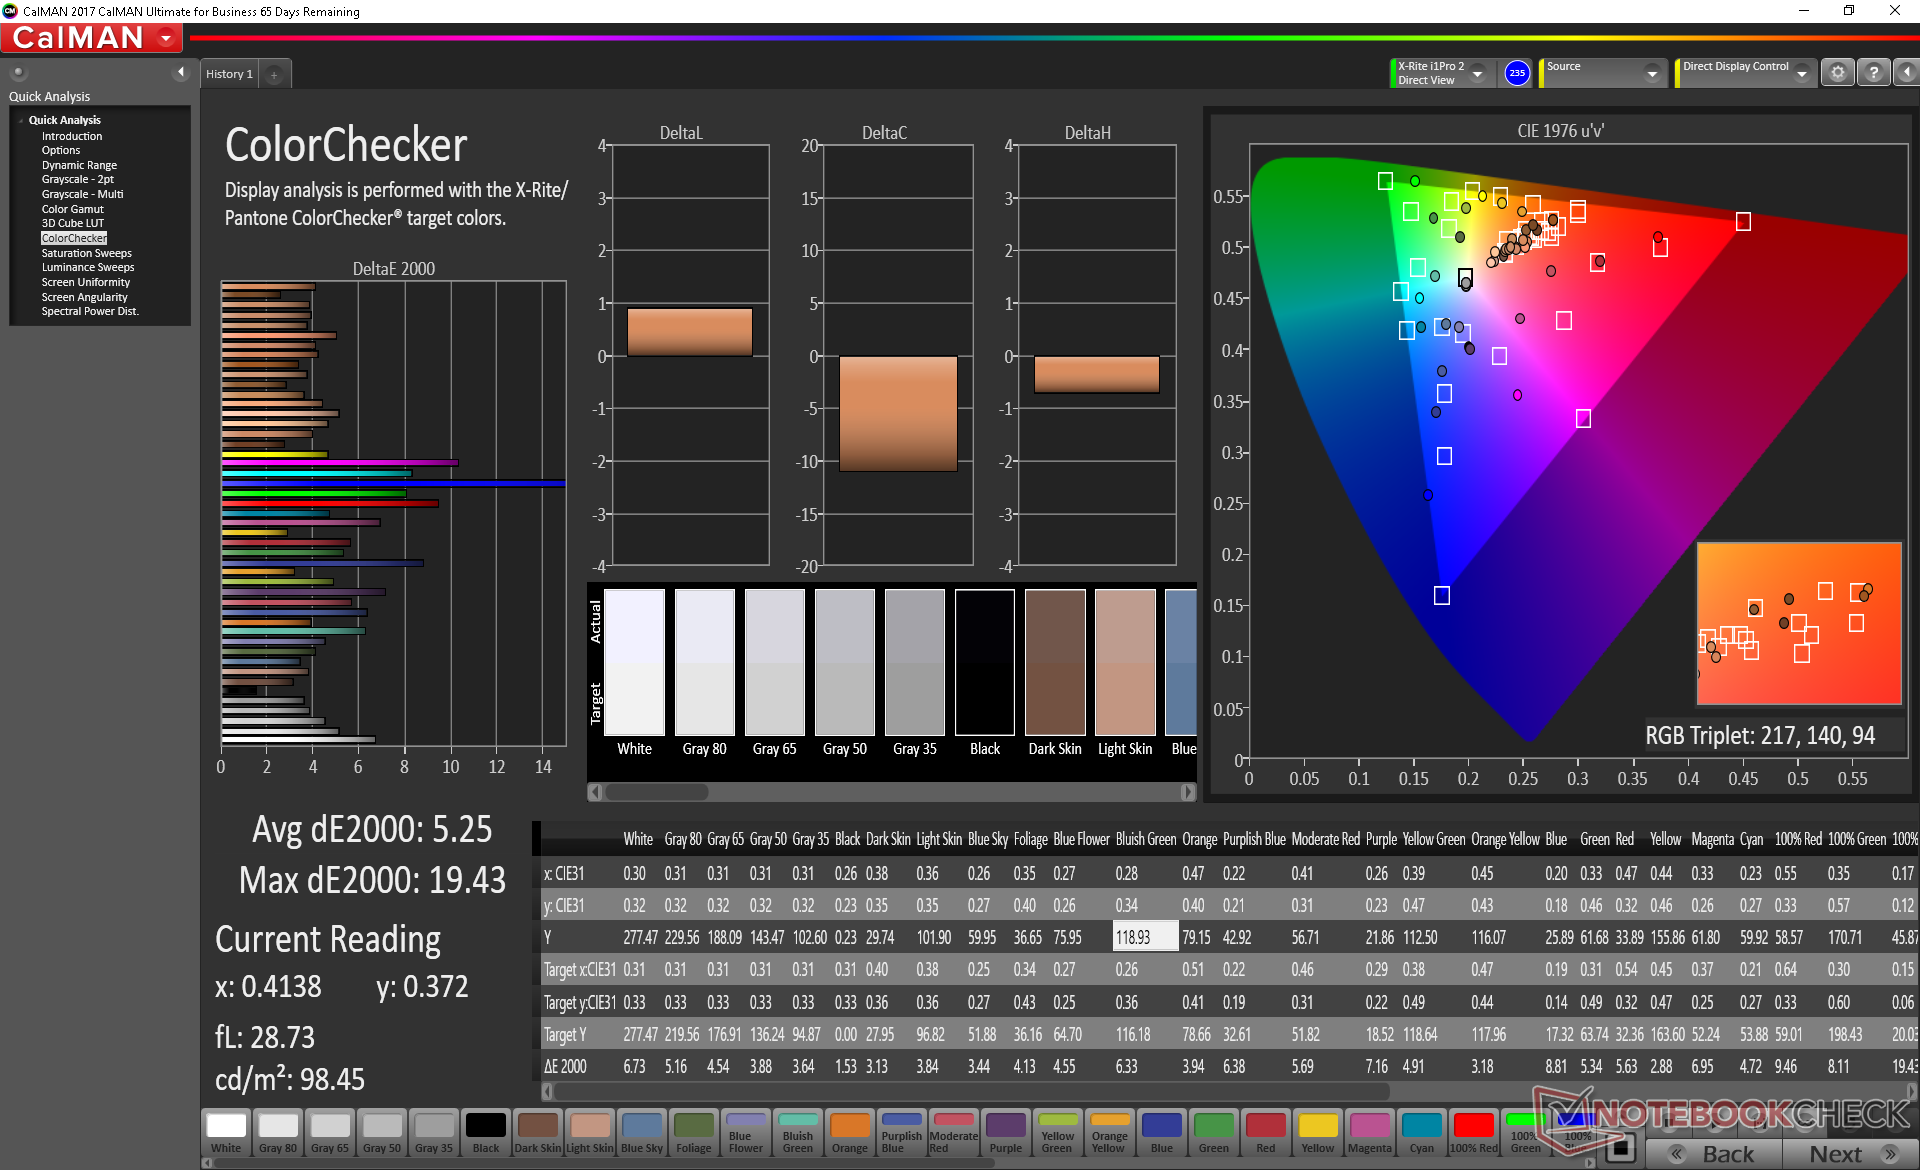
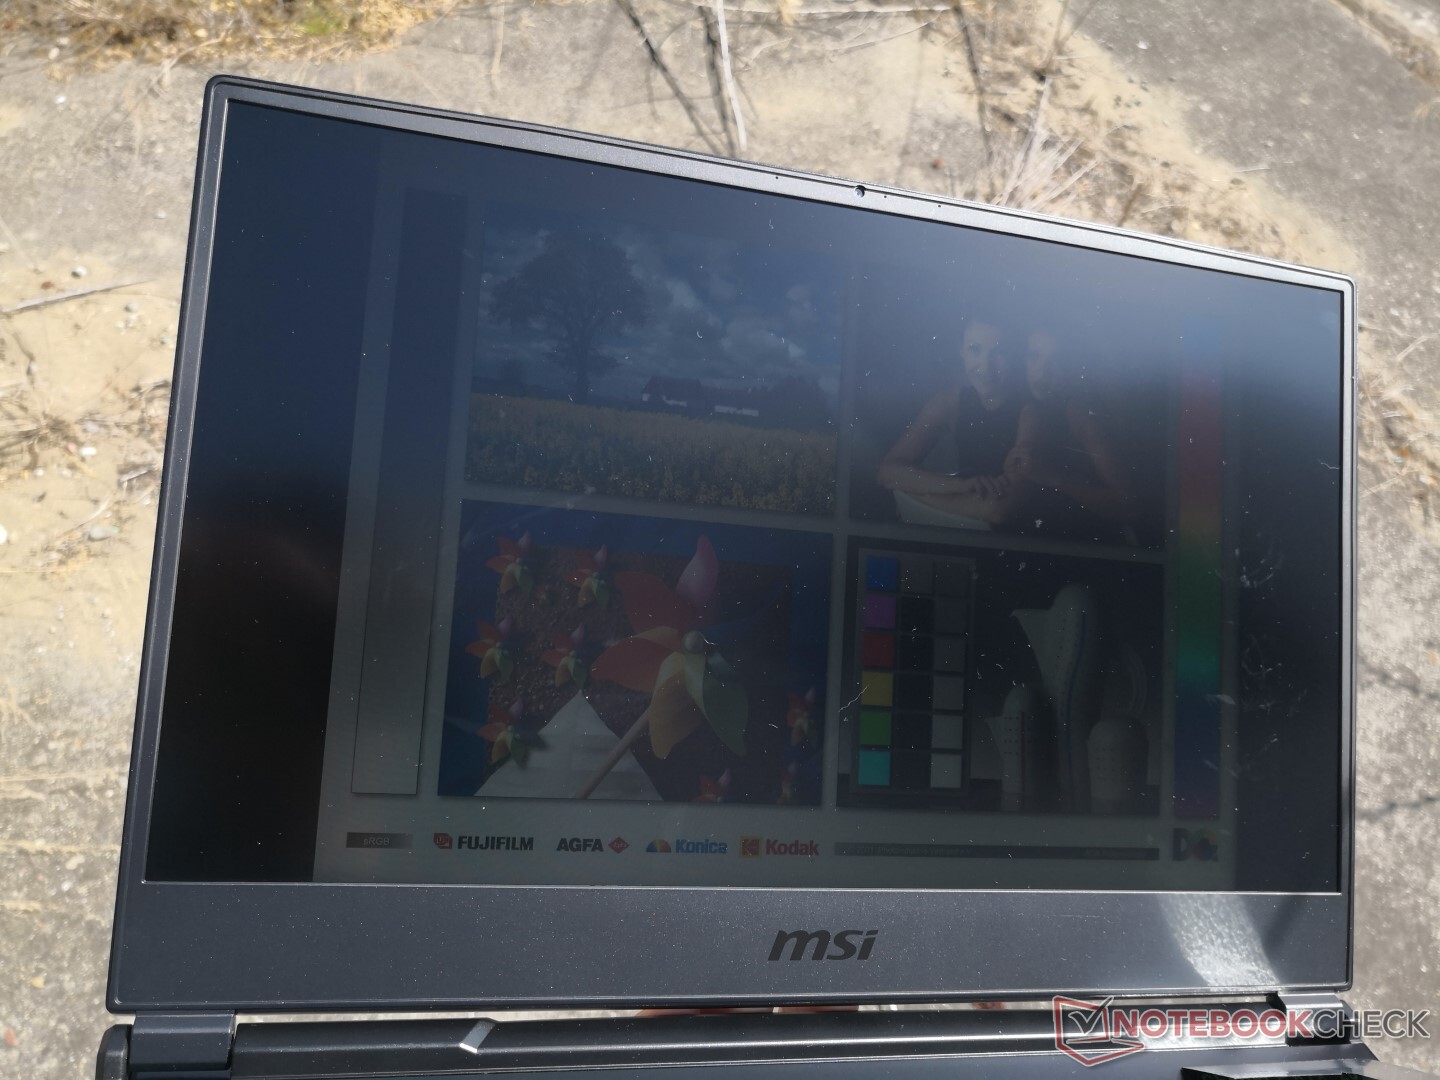
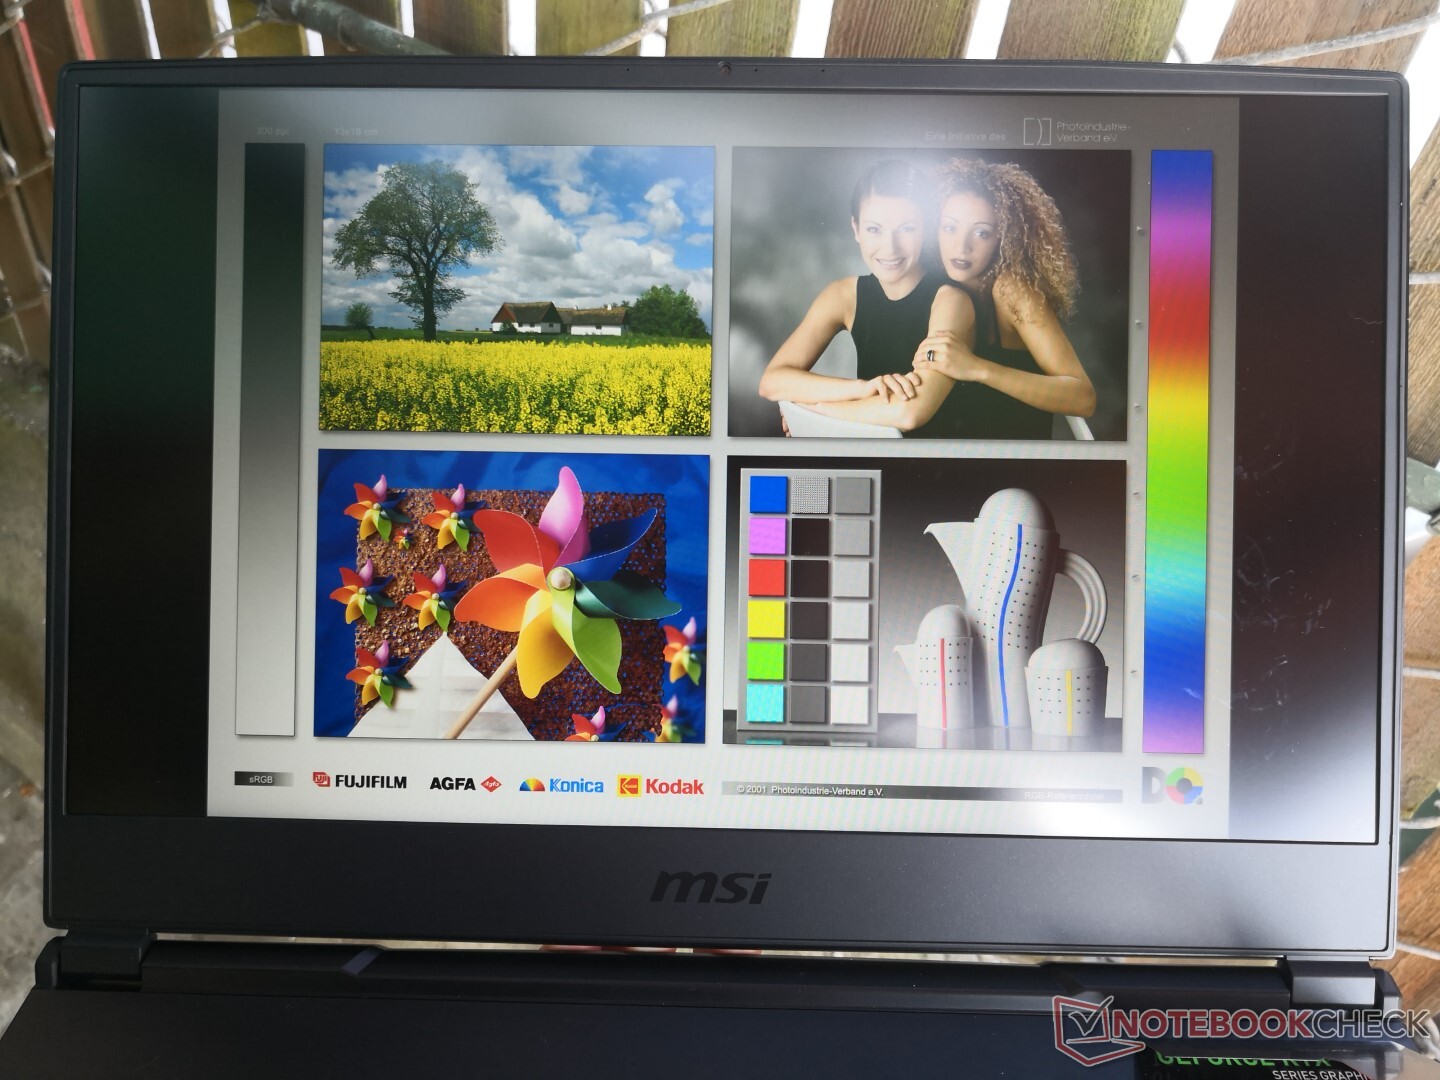
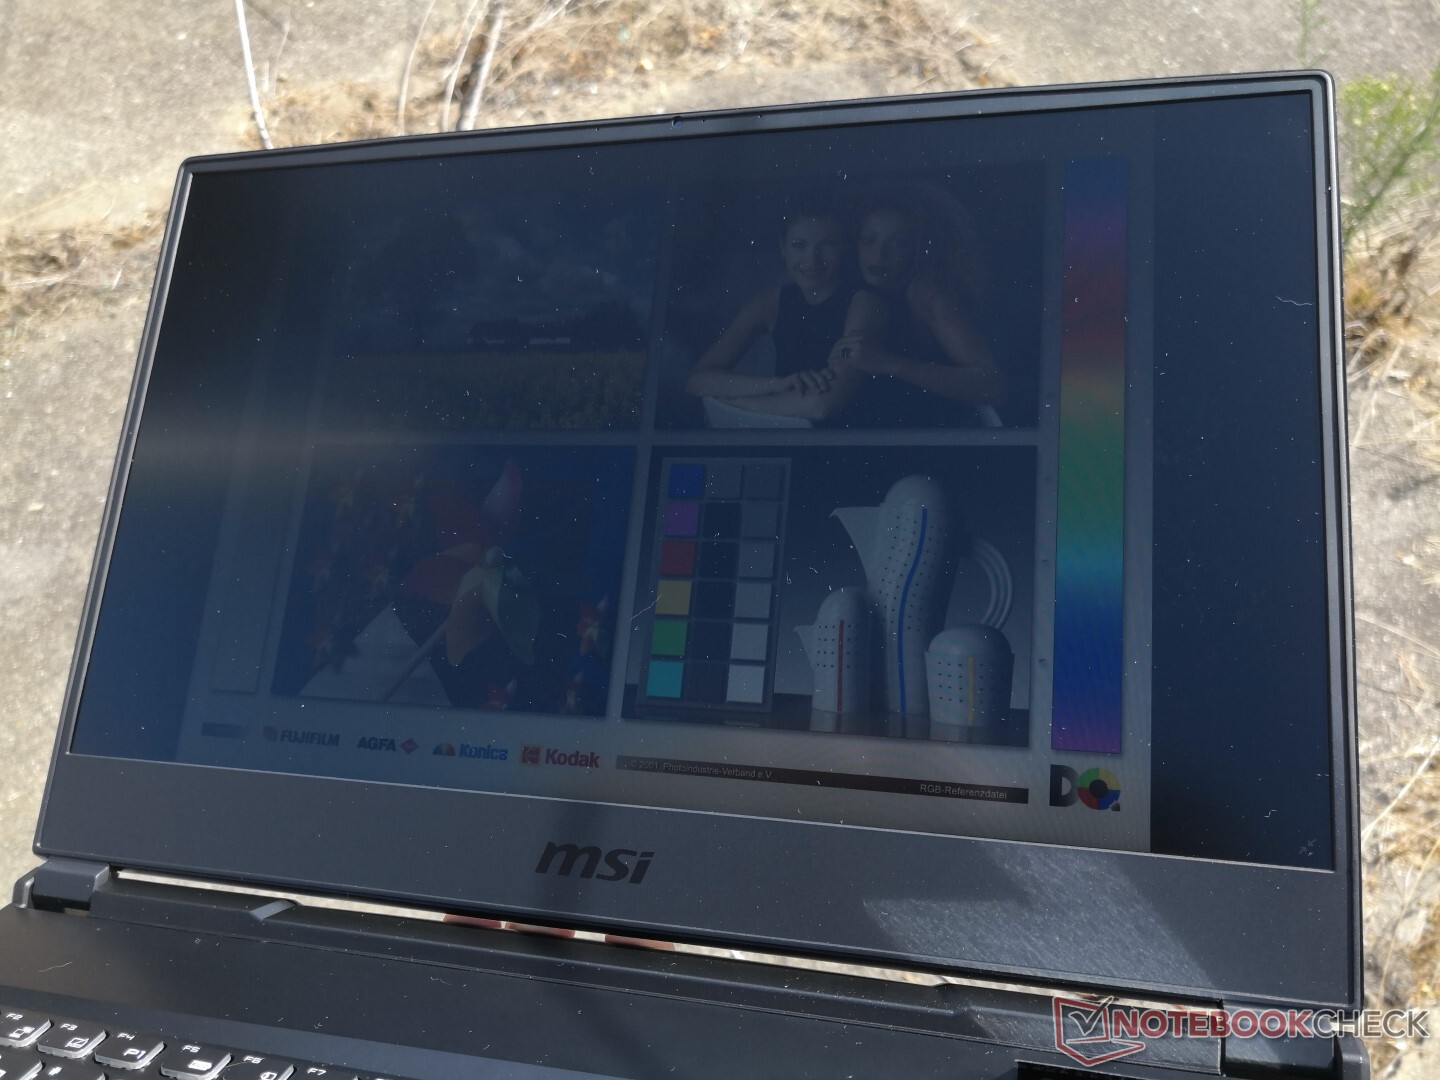
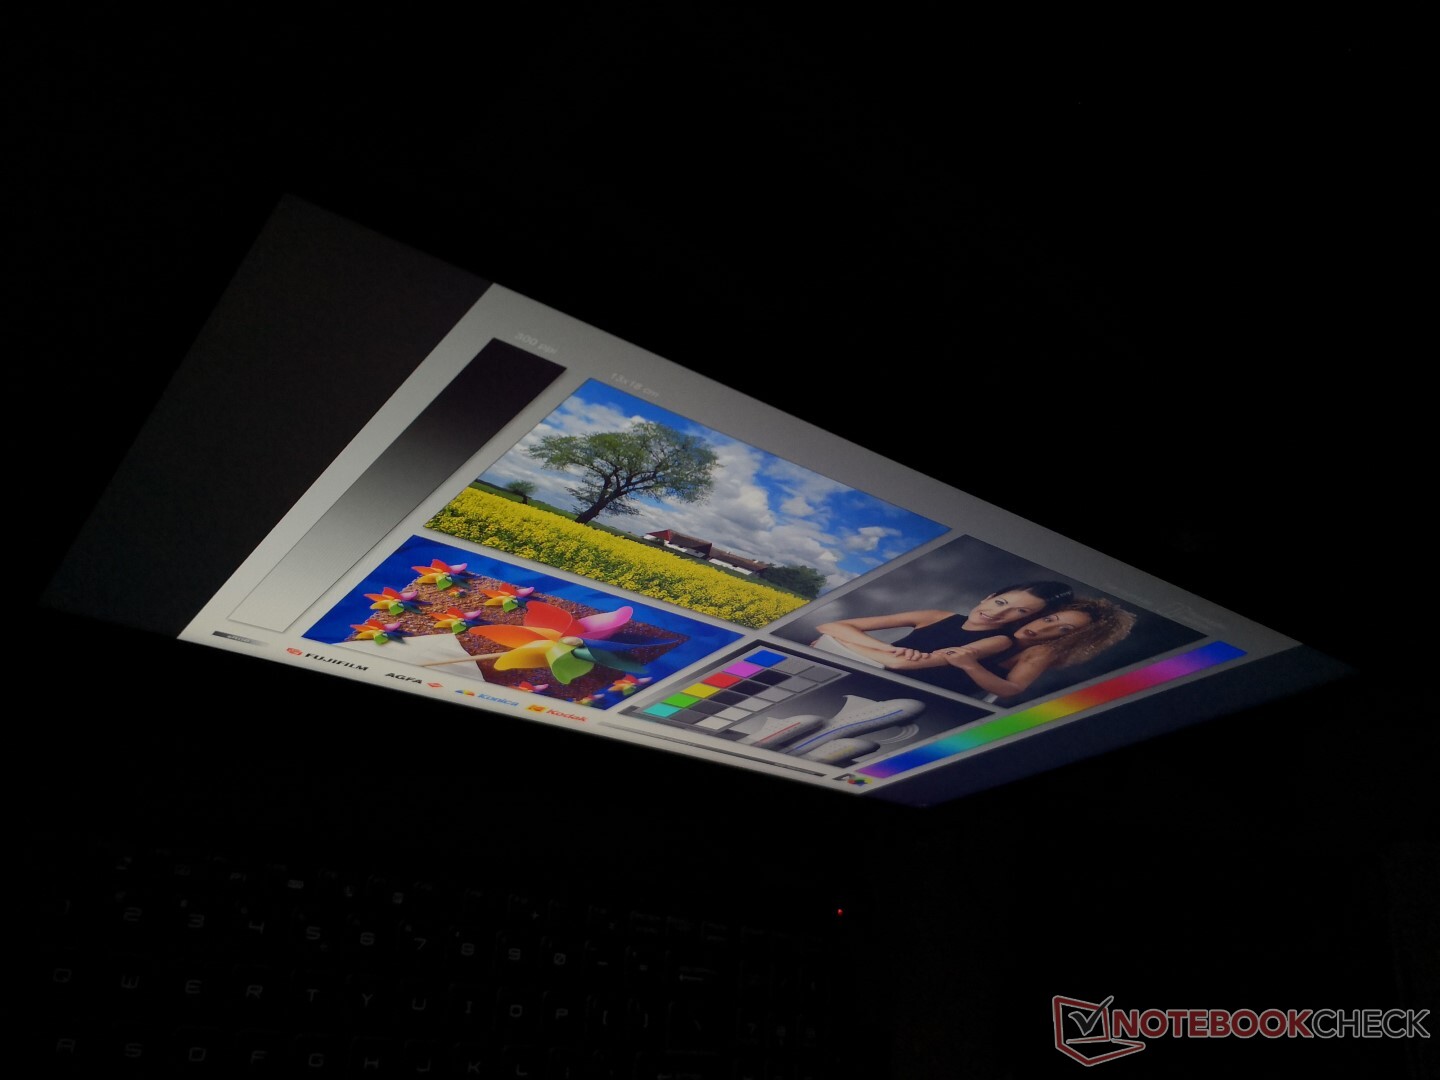
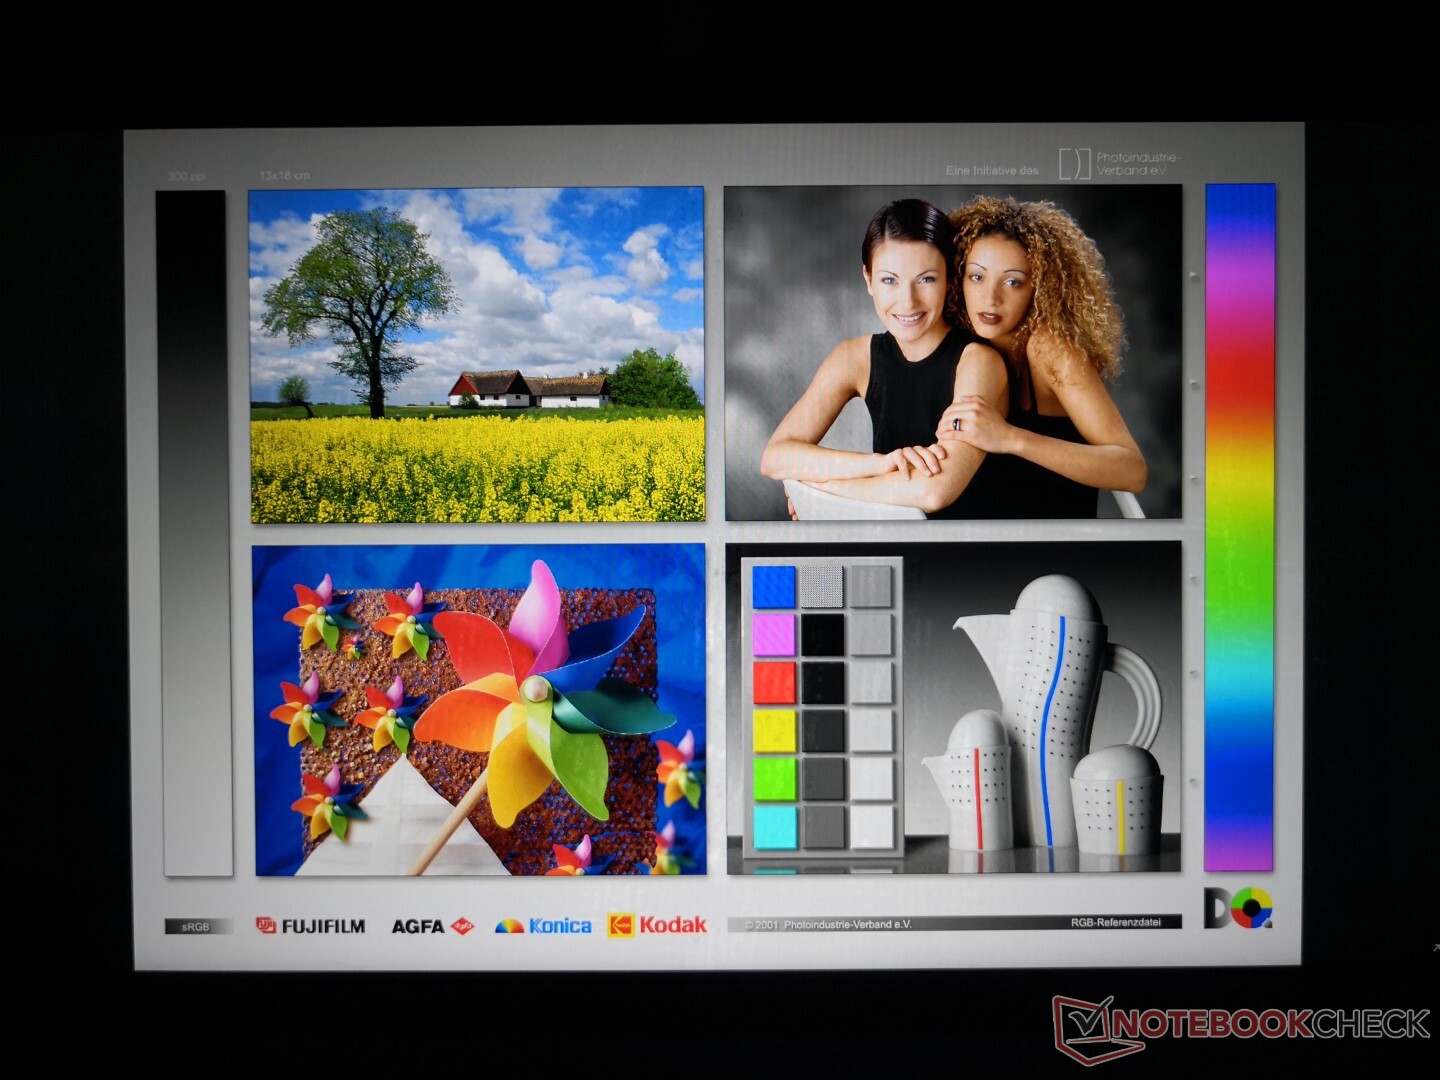
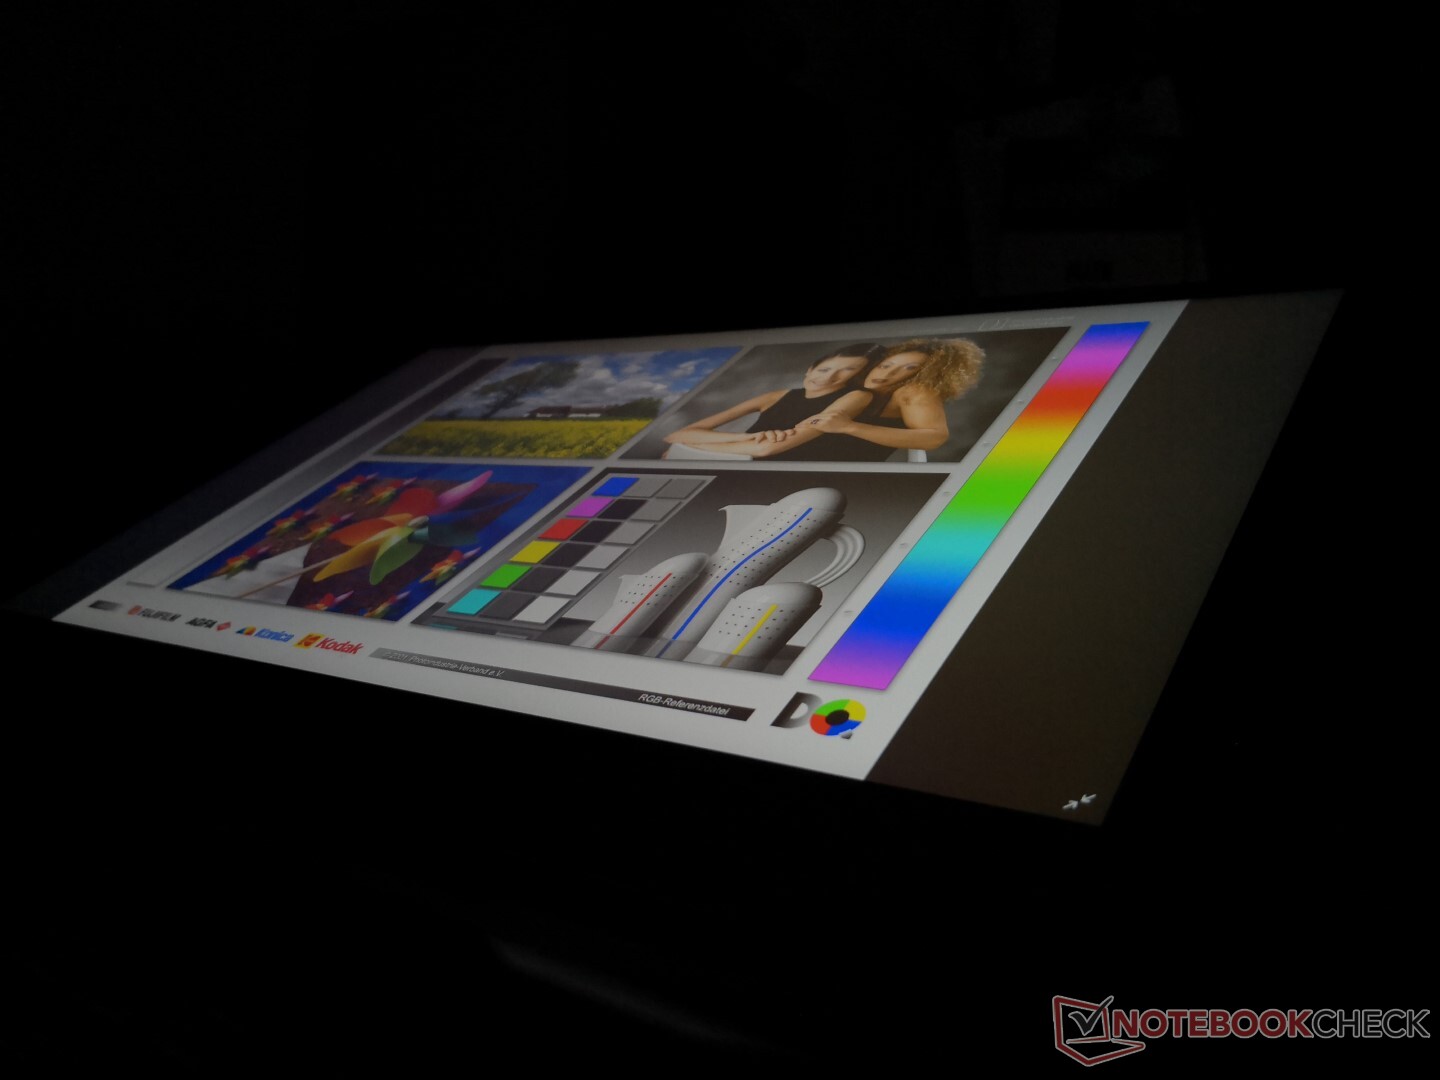
Unlike the LG Philips LP156WF6-SPK6 IPS panel on the GL63, the GL65 ships with an AU Optronics B156HAN13.0 IPS panel instead. This particular 120 Hz panel can be found on no other laptop in our database as of this writing. Unfortunately, this is a budget-midrange panel with its slow response times and narrow gamut as shown by our table below. The Sharp LQ156M1JW03 panel on the more expensive MSI GS65 offers both significantly faster black-white response times to reduce ghosting and more accurate colors.
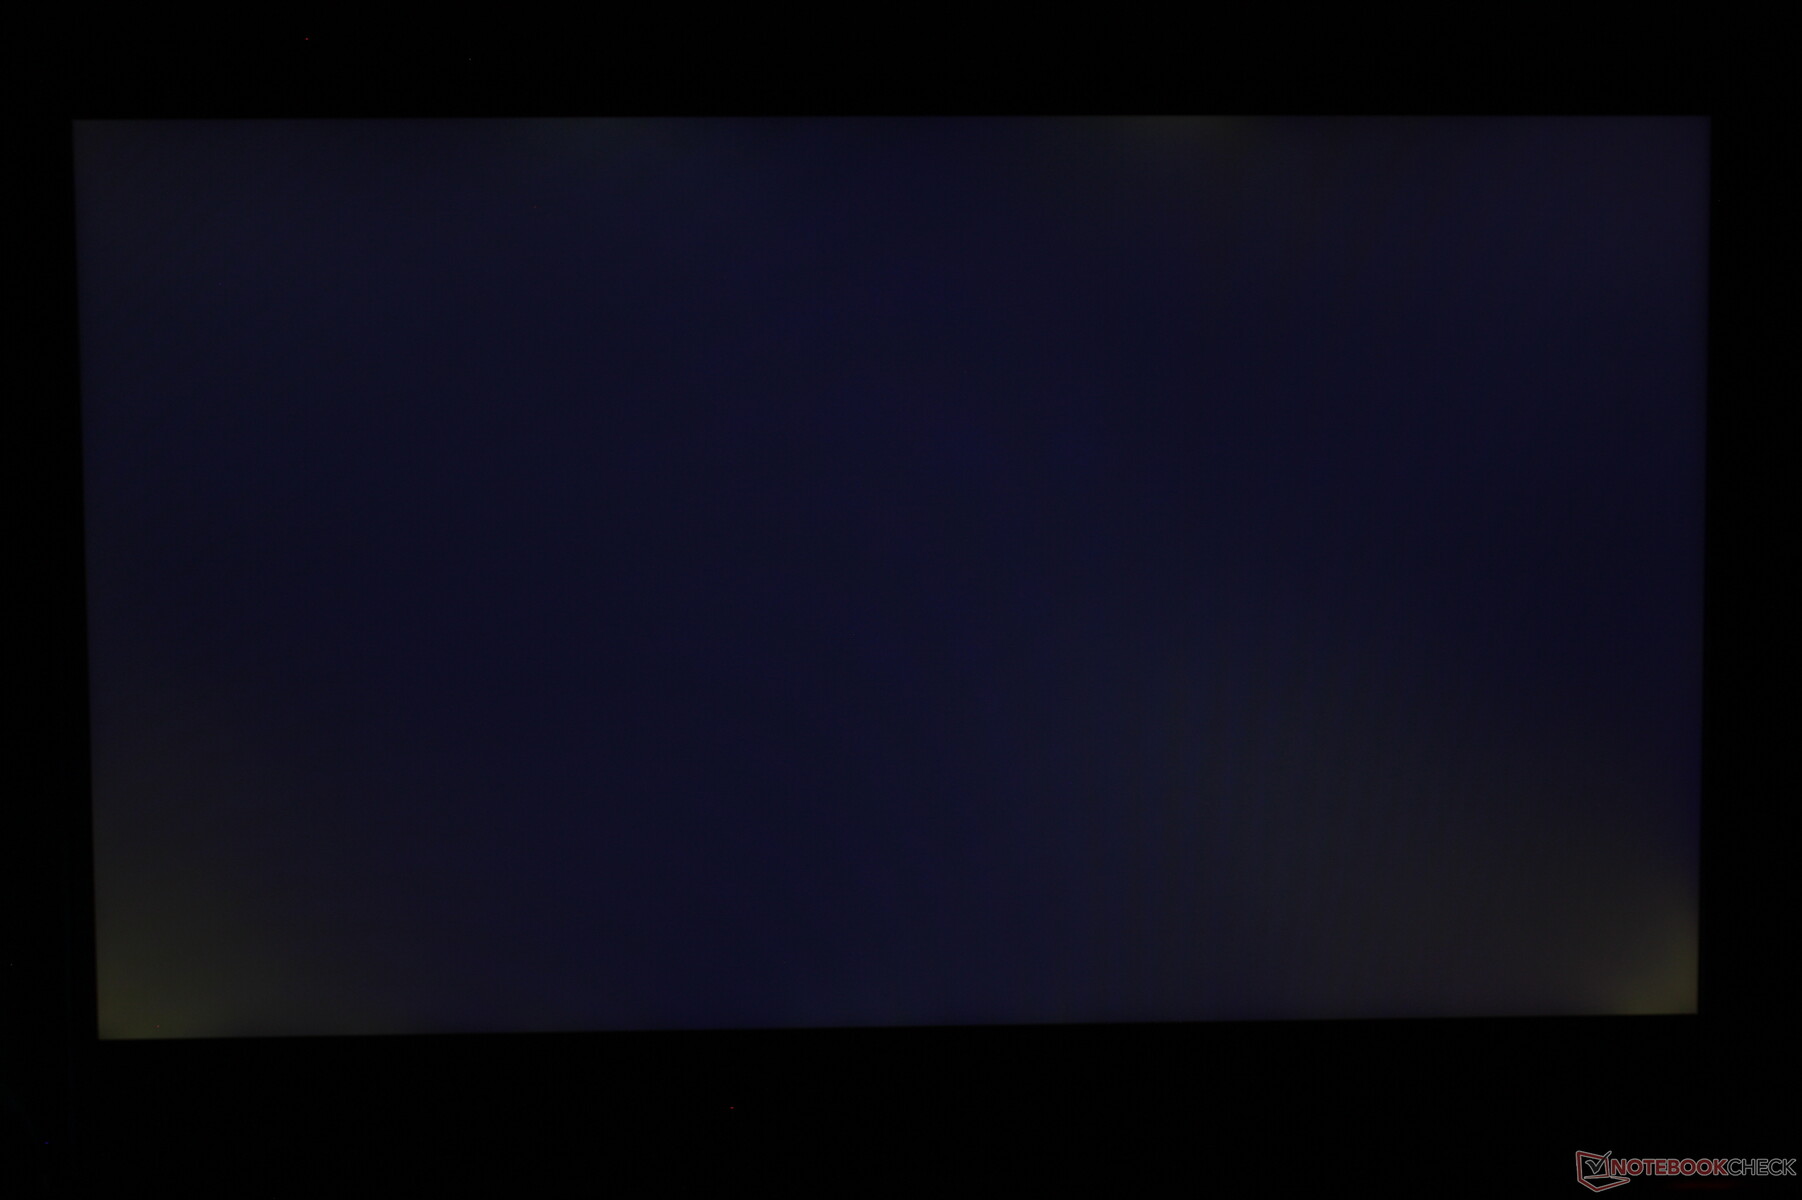
Subjectively, onscreen content looks crisp despite the matte overlay. Colors, however, are not as deep as what you'd find on the GS65 or the pricier Razer Blade 15 OLED. Perhaps the most disappointing aspect of the display is its moderate-heavy uneven backlight bleeding along the bottom corners. The bleeding is immediately noticeable during a cold boot or when viewing videos with black borders. This would be easy to forgive on a cheap multimedia laptop, but MSI has no excuse on this RTX-powered laptop retailing for almost $1500 USD.

| |||||||||||||||||||||||||
Brightness Distribution: 86 %
Center on Battery: 277.3 cd/m²
Contrast: 1387:1 (Black: 0.2 cd/m²)
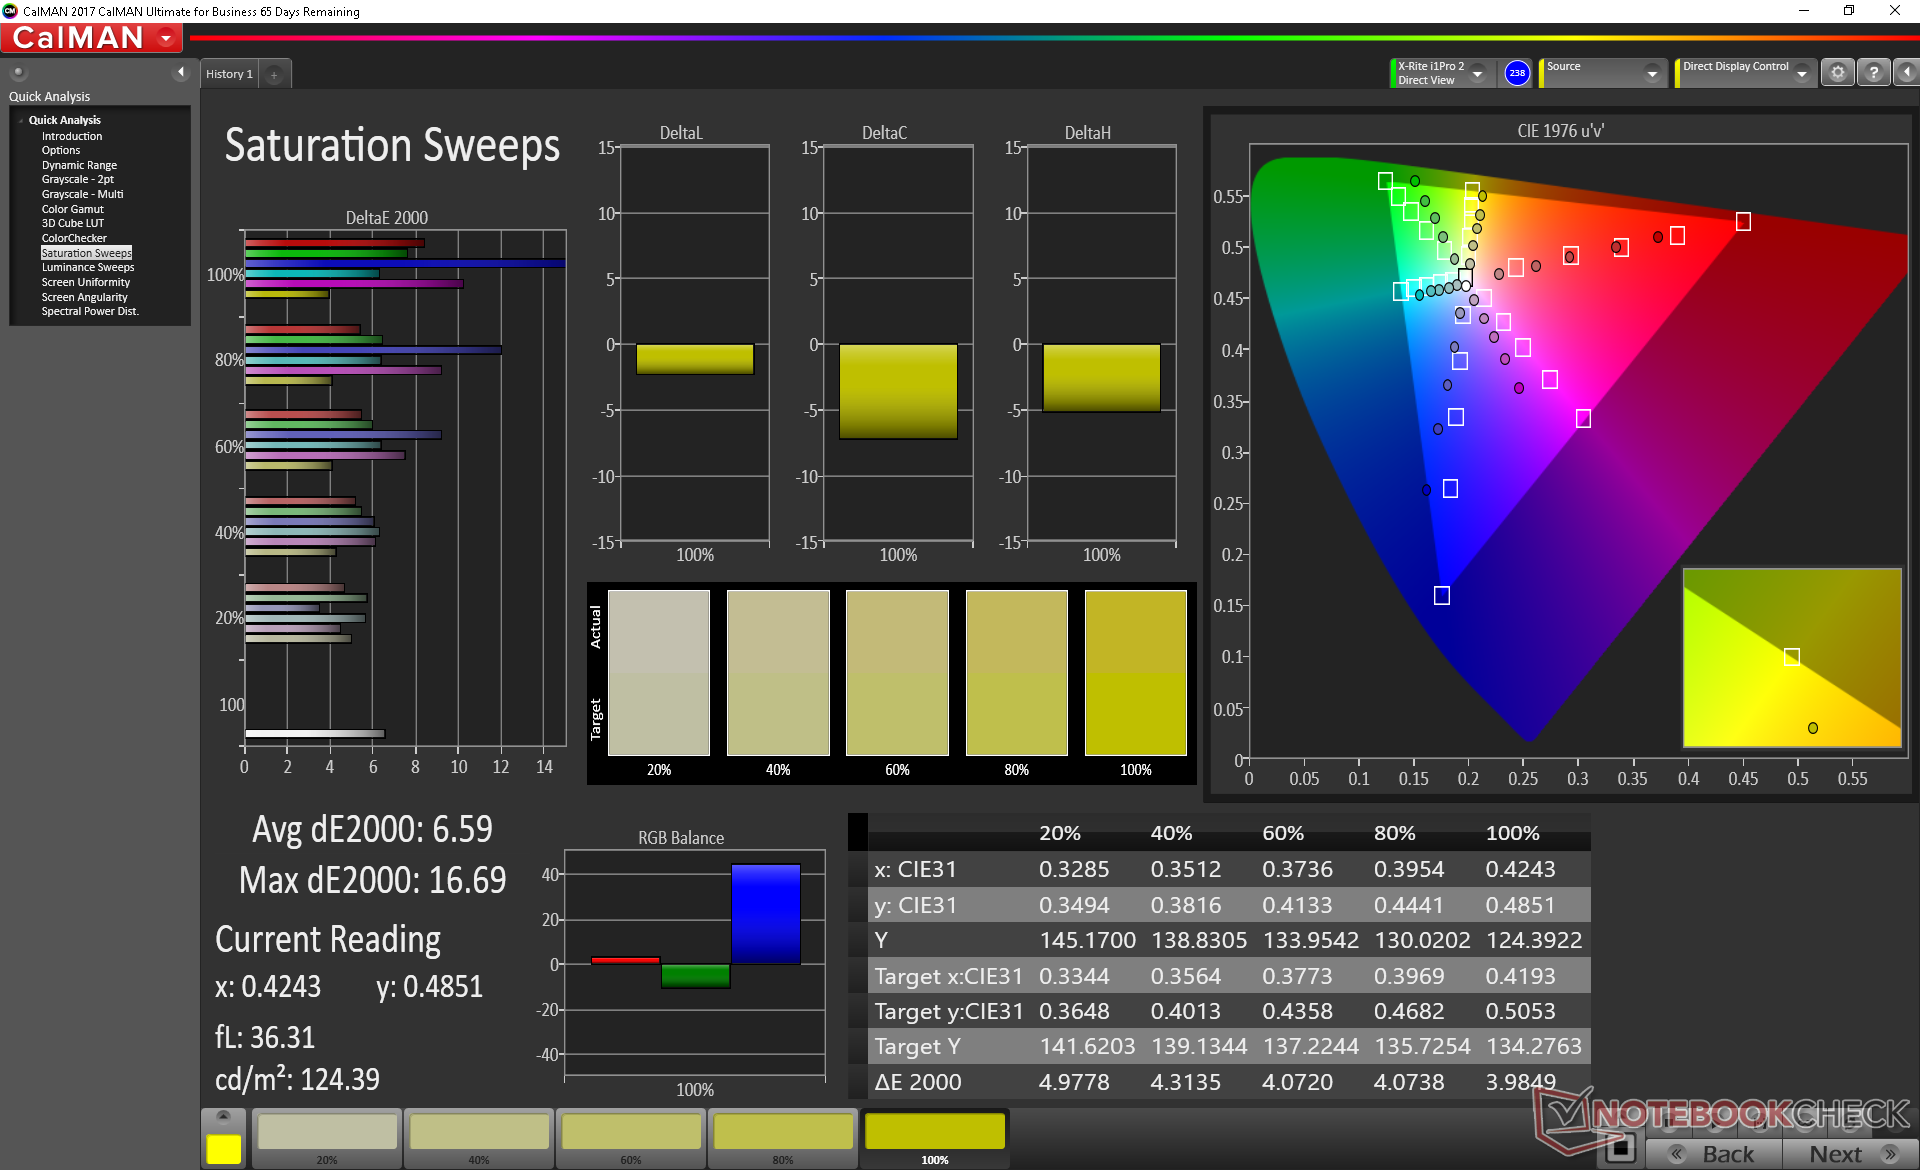
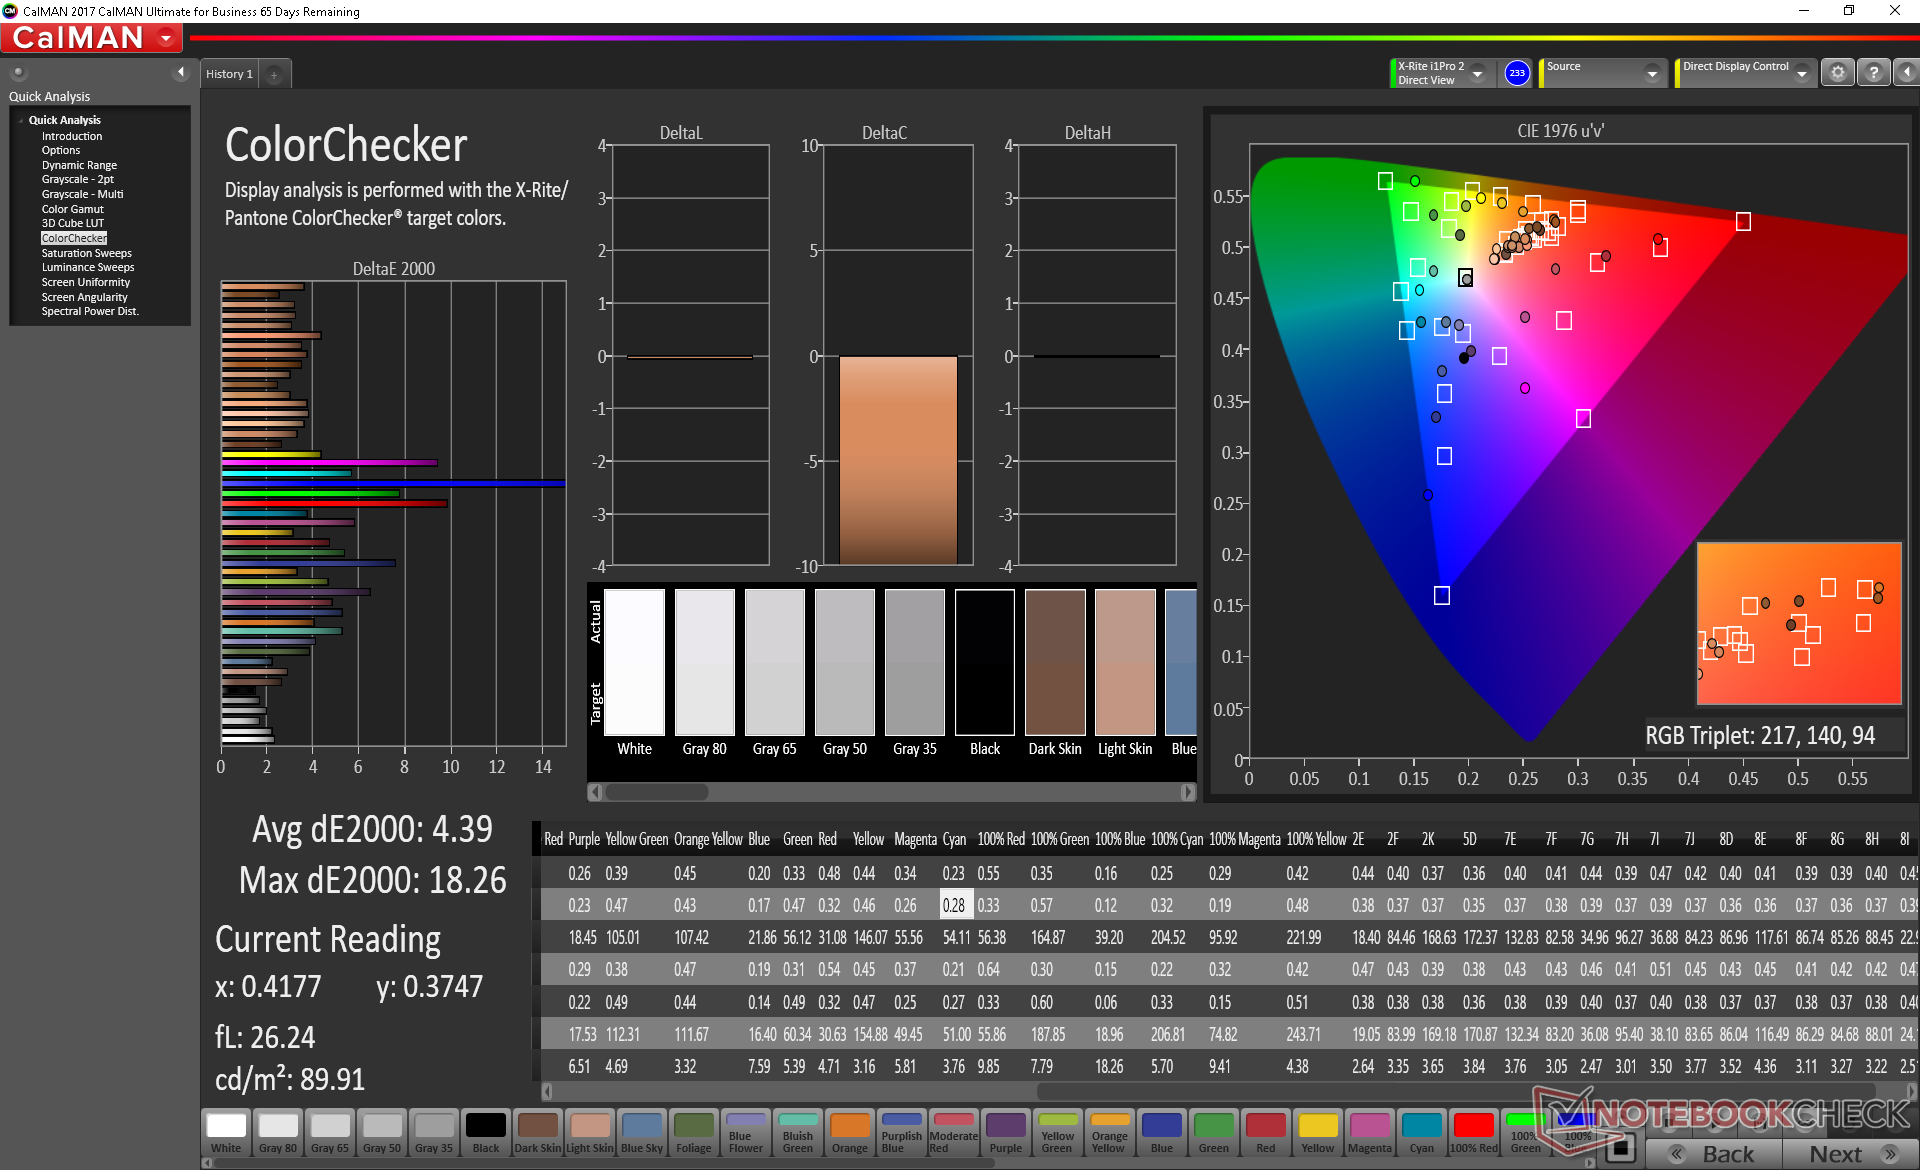
ΔE ColorChecker Calman: 5.25 | ∀{0.5-29.43 Ø4.71}
calibrated: 4.39
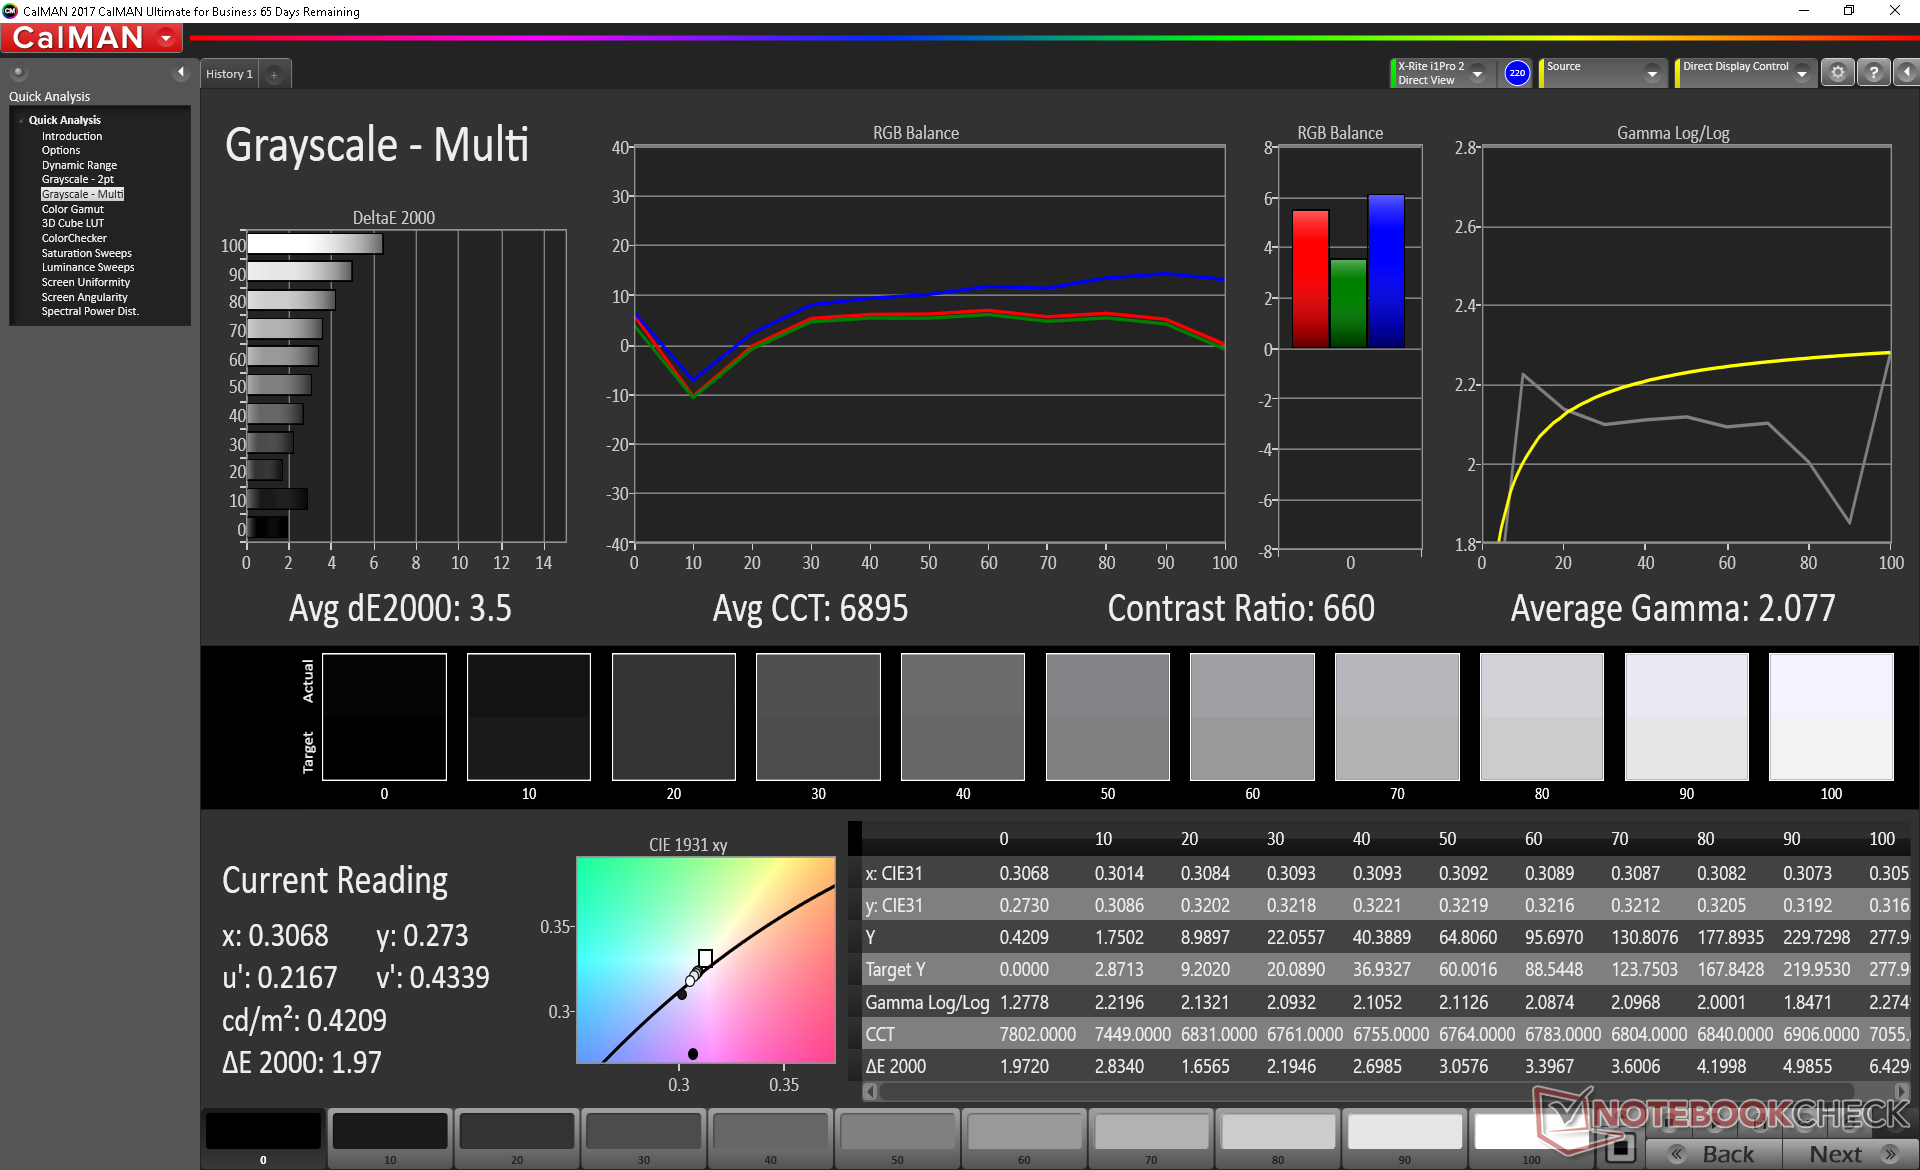
ΔE Greyscale Calman: 3.5 | ∀{0.09-98 Ø4.96}
55% sRGB (Argyll 1.6.3 3D)
35% AdobeRGB 1998 (Argyll 1.6.3 3D)
37.85% AdobeRGB 1998 (Argyll 3D)
55% sRGB (Argyll 3D)
36.63% Display P3 (Argyll 3D)
Gamma: 2.1
CCT: 6895 K
| MSI GL65 9SEK AU Optronics B156HAN13.0, IPS, 15.6", 1920x1080 | MSI GL63 8RC-069US LG Philips LP156WF6-SPK6, IPS, 15.6", 1920x1080 | MSI GS65 Stealth 9SG Sharp LQ156M1JW03 (SHP14C5), IPS, 15.6", 1920x1080 | Gigabyte Aero 15 Classic-XA Sharp LQ156M1JW03 (SHP14C5), IGZO, 15.6", 1920x1080 | Asus Zephyrus S GX531GX AU Optronics B156HAN08.2, IPS, 15.6", 1920x1080 | Alienware m15 R2 P87F Sharp LQ156M1, IPS, 15.6", 1920x1080 | |
|---|---|---|---|---|---|---|
| Display | 8% | 81% | 76% | 75% | 75% | |
| Display P3 Coverage (%) | 36.63 | 39.4 8% | 67.6 85% | 65.3 78% | 65.6 79% | 65.3 78% |
| sRGB Coverage (%) | 55 | 59.2 8% | 97.5 77% | 95.5 74% | 92.2 68% | 95.1 73% |
| AdobeRGB 1998 Coverage (%) | 37.85 | 40.72 8% | 68.9 82% | 66.5 76% | 66.9 77% | 65.9 74% |
| Response Times | -4% | 54% | 53% | 71% | 55% | |
| Response Time Grey 50% / Grey 80% * (ms) | 26.4 ? | 33.6 ? -27% | 13.6 ? 48% | 15.2 ? 42% | 7 ? 73% | 16.4 ? 38% |
| Response Time Black / White * (ms) | 30 ? | 24 ? 20% | 12 ? 60% | 11.2 ? 63% | 9.6 ? 68% | 8.8 ? 71% |
| PWM Frequency (Hz) | 23260 ? | 23580 ? | 23810 ? | |||
| Screen | -10% | 34% | 23% | 26% | 3% | |
| Brightness middle (cd/m²) | 277.3 | 286.5 3% | 282.3 2% | 266 -4% | 323.6 17% | 324.2 17% |
| Brightness (cd/m²) | 256 | 258 1% | 269 5% | 248 -3% | 315 23% | 304 19% |
| Brightness Distribution (%) | 86 | 82 -5% | 90 5% | 89 3% | 91 6% | 90 5% |
| Black Level * (cd/m²) | 0.2 | 0.34 -70% | 0.32 -60% | 0.31 -55% | 0.29 -45% | 0.38 -90% |
| Contrast (:1) | 1387 | 843 -39% | 882 -36% | 858 -38% | 1116 -20% | 853 -39% |
| Colorchecker dE 2000 * | 5.25 | 5.57 -6% | 1.17 78% | 2.78 47% | 3.31 37% | 5.01 5% |
| Colorchecker dE 2000 max. * | 19.43 | 16.8 14% | 3.29 83% | 5.96 69% | 5.74 70% | 12.7 35% |
| Colorchecker dE 2000 calibrated * | 4.39 | 4.16 5% | 1.06 76% | 0.91 79% | 2.73 38% | 1.64 63% |
| Greyscale dE 2000 * | 3.5 | 4.6 -31% | 1.3 63% | 3.58 -2% | 2.9 17% | 7.9 -126% |
| Gamma | 2.1 105% | 2.15 102% | 2.2 100% | 2.46 89% | 2.29 96% | 2.35 94% |
| CCT | 6895 94% | 7564 86% | 6643 98% | 7186 90% | 6765 96% | 8455 77% |
| Color Space (Percent of AdobeRGB 1998) (%) | 35 | 37.4 7% | 63.8 82% | 62 77% | 59.7 71% | 60.8 74% |
| Color Space (Percent of sRGB) (%) | 55 | 58.9 7% | 97.5 77% | 96 75% | 91.8 67% | 95.5 74% |
| Total Average (Program / Settings) | -2% /
-6% | 56% /
45% | 51% /
36% | 57% /
40% | 44% /
23% |
* ... smaller is better
Color space is narrow at just 55 percent and 35 percent of sRGB and AdobeRGB, respectively, compared to >95 percent sRGB from the Sharp LQ156M1 panel on the Alienware m15 R2. This is definitely not the panel to use for any sort of professional graphics work.
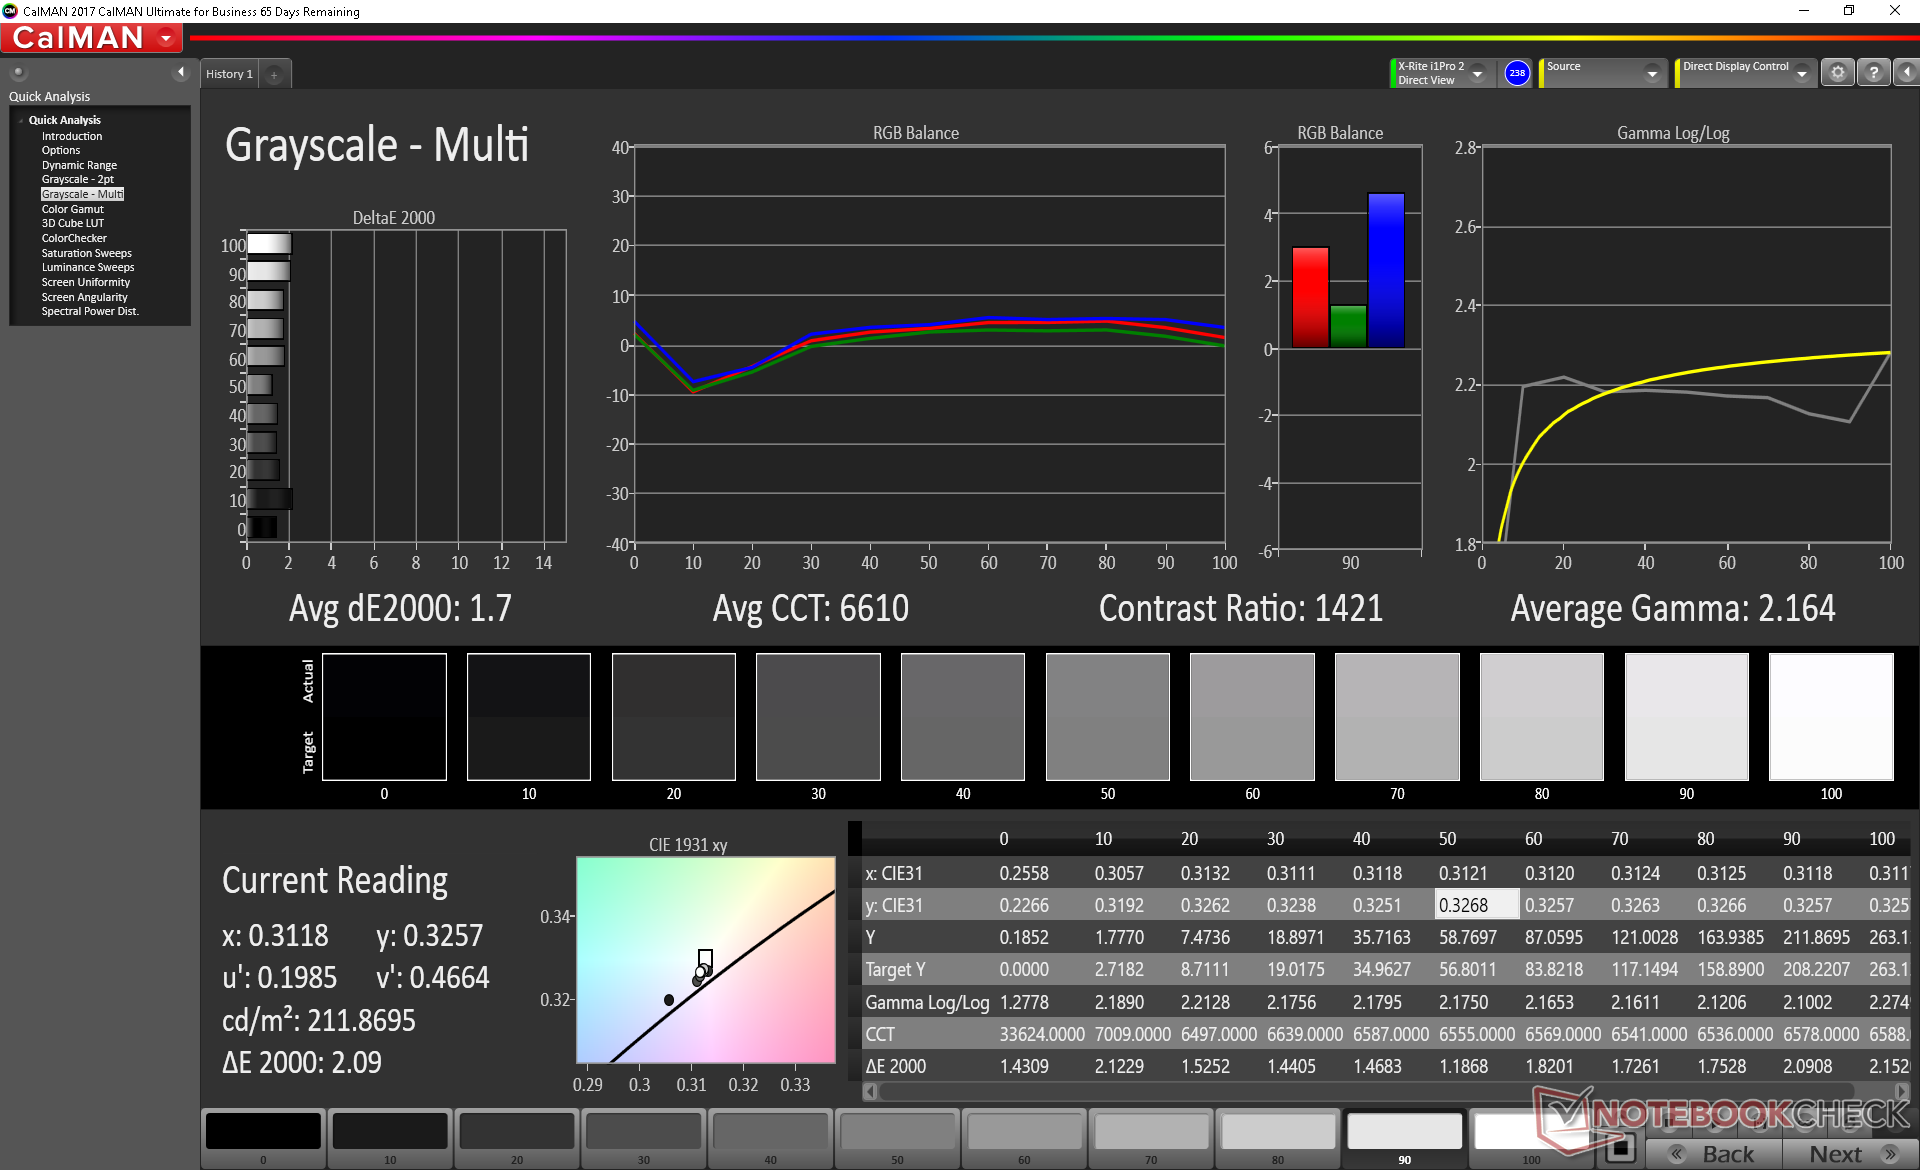
Further measurements with an X-Rite colorimeter reveal average grayscale and relatively poor color accuracy. While our calibration attempt significantly improves average grayscale (DeltaE from 3.5 to 1.7), colors are still inaccurate at higher saturation levels due to the narrow gamut of the panel.

Display Response Times
| ↔ Response Time Black to White | ||
|---|---|---|
| 30 ms ... rise ↗ and fall ↘ combined | ↗ 17.6 ms rise | 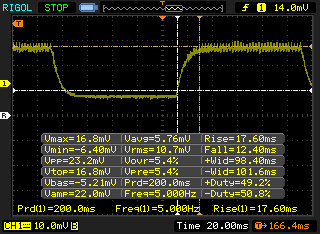 |
| ↘ 12.4 ms fall | ||
| The screen shows slow response rates in our tests and will be unsatisfactory for gamers. In comparison, all tested devices range from 0.1 (minimum) to 240 (maximum) ms. » 80 % of all devices are better. This means that the measured response time is worse than the average of all tested devices (19.8 ms). | ||
| ↔ Response Time 50% Grey to 80% Grey | ||
| 26.4 ms ... rise ↗ and fall ↘ combined | ↗ 13.2 ms rise | 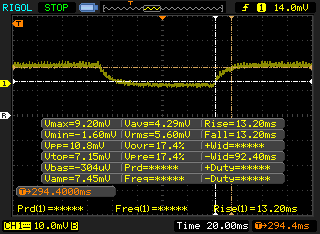 |
| ↘ 13.2 ms fall | ||
| The screen shows relatively slow response rates in our tests and may be too slow for gamers. In comparison, all tested devices range from 0.165 (minimum) to 636 (maximum) ms. » 36 % of all devices are better. This means that the measured response time is better than the average of all tested devices (31 ms). | ||
Screen Flickering / PWM (Pulse-Width Modulation)
| Screen flickering / PWM not detected | 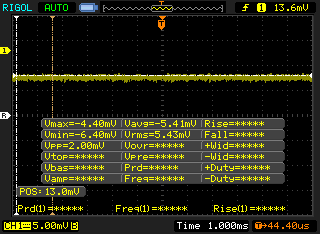 | ||
In comparison: 52 % of all tested devices do not use PWM to dim the display. If PWM was detected, an average of 7757 (minimum: 5 - maximum: 343500) Hz was measured. | |||
Outdoor visibility is about the same as the GL63 since brightness and colors haven't improved by all that much on the GL65. This is kind of a bummer because the GL65 is so much smaller than the GL63 and yet the display isn't any brighter when outdoors.
Performance
The Core i7-9750H CPU and GeForce RTX 2060 GPU are high-end specifications aimed at enthusiasts. For even faster GPU options like the RTX 2070 or RTX 2080, however, MSI fans will have to turn towards the pricier GS65 series instead.
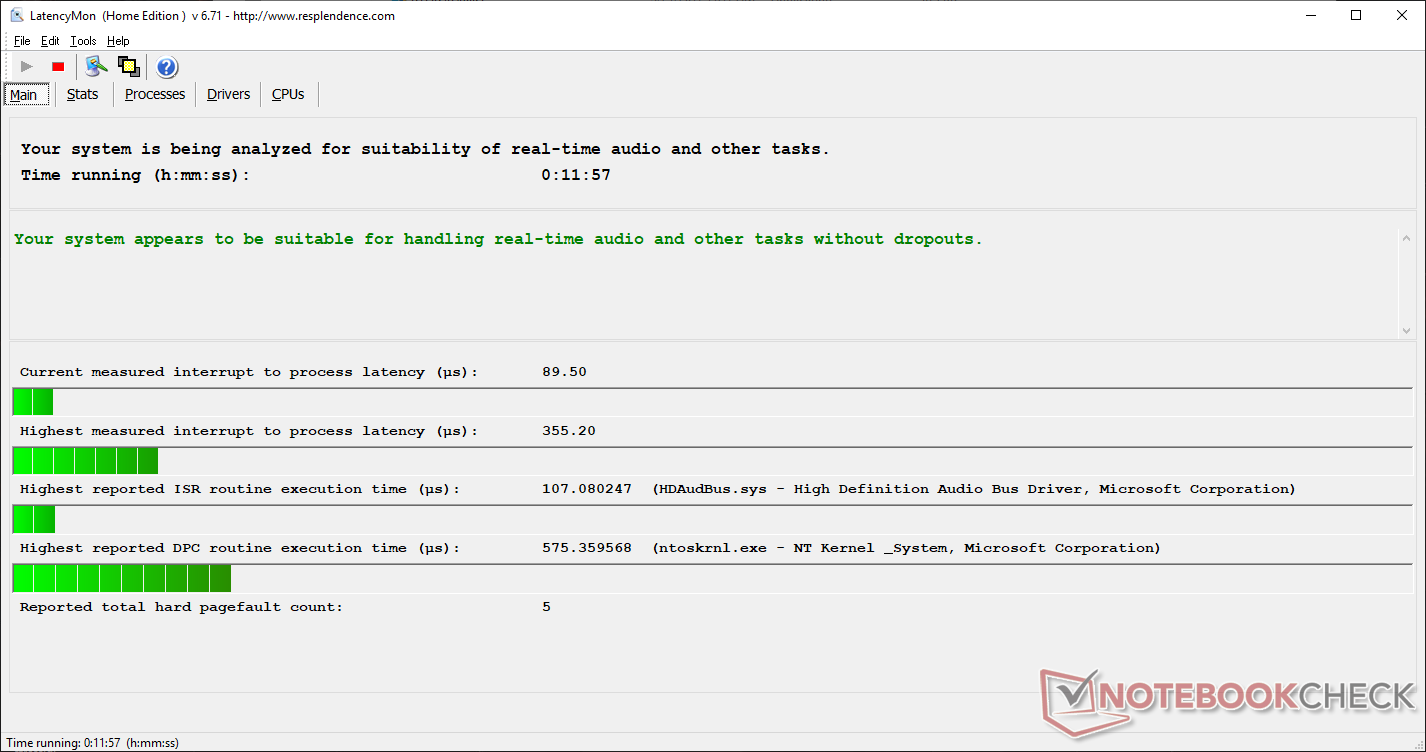
Nvidia Optimus comes standard on all SKUs to automatically exclude G-Sync. LatencyMon shows no DPC latency issues even when wireless is enabled.
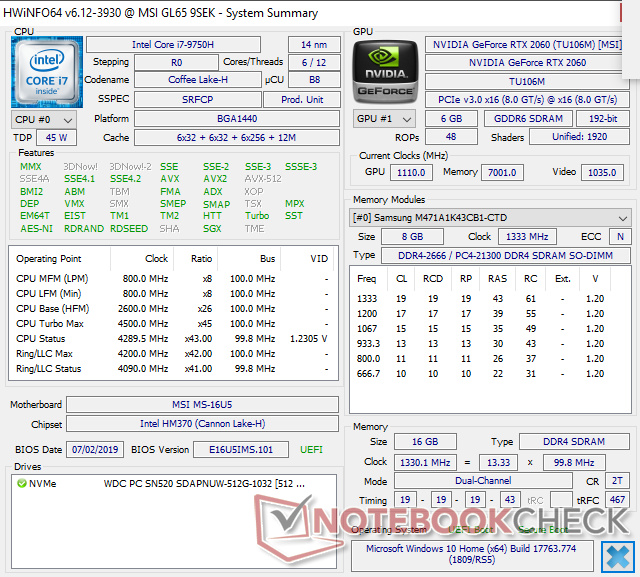
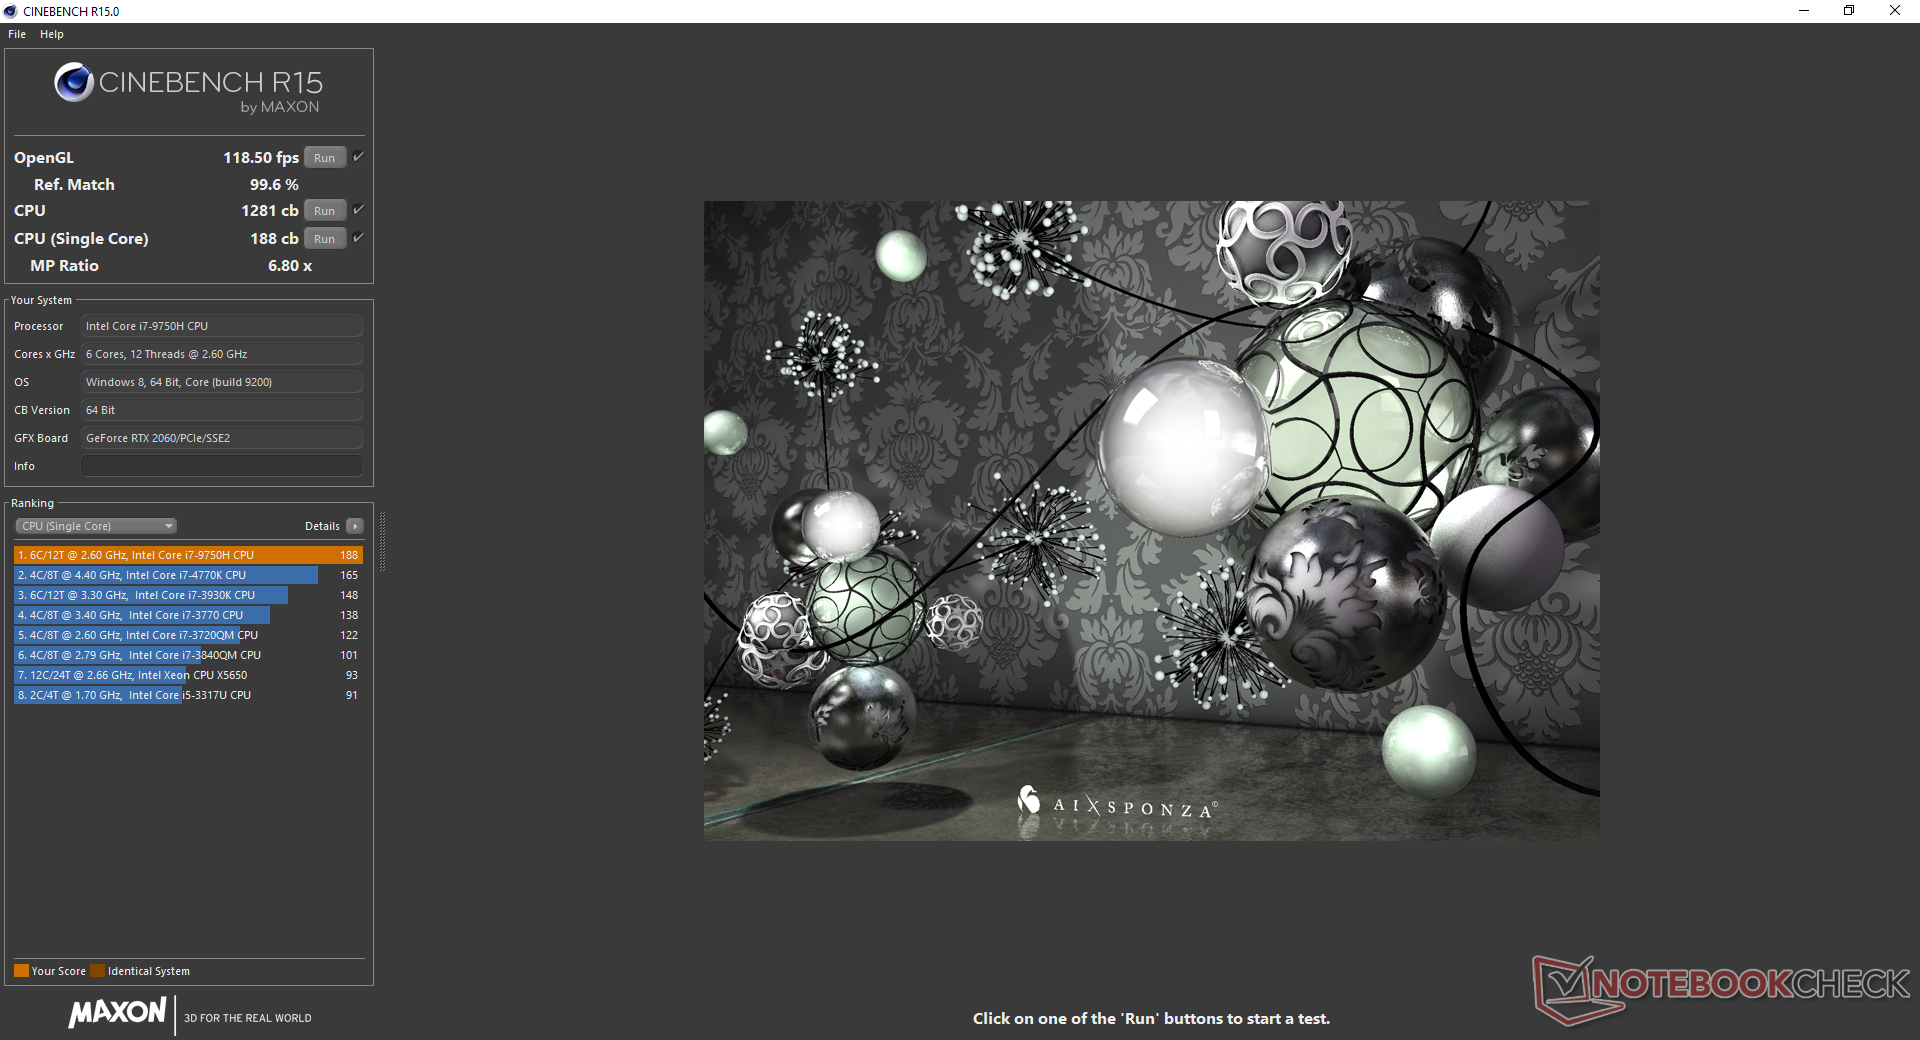
Processor
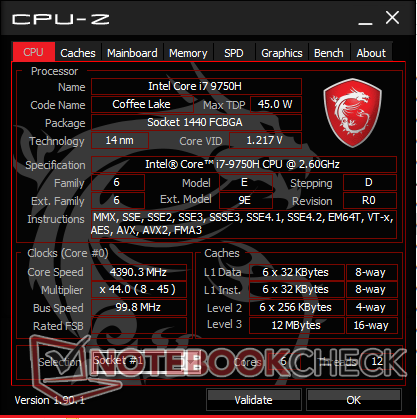
The Core i7-9750H in the MSI performs above average when compared to other laptops equipped with the same processor. When running CineBench R15 Multi-Thread in a loop, for example, we're able to record an initial peak of 1279 points before dropping and stabilizing at about 1180 points to represent a dip of only 8 percent. The GS65 with the same CPU stabilizes at a slightly lower score.
See our dedicated page on the Core i7-9750H for more technical information and benchmark comparisons.
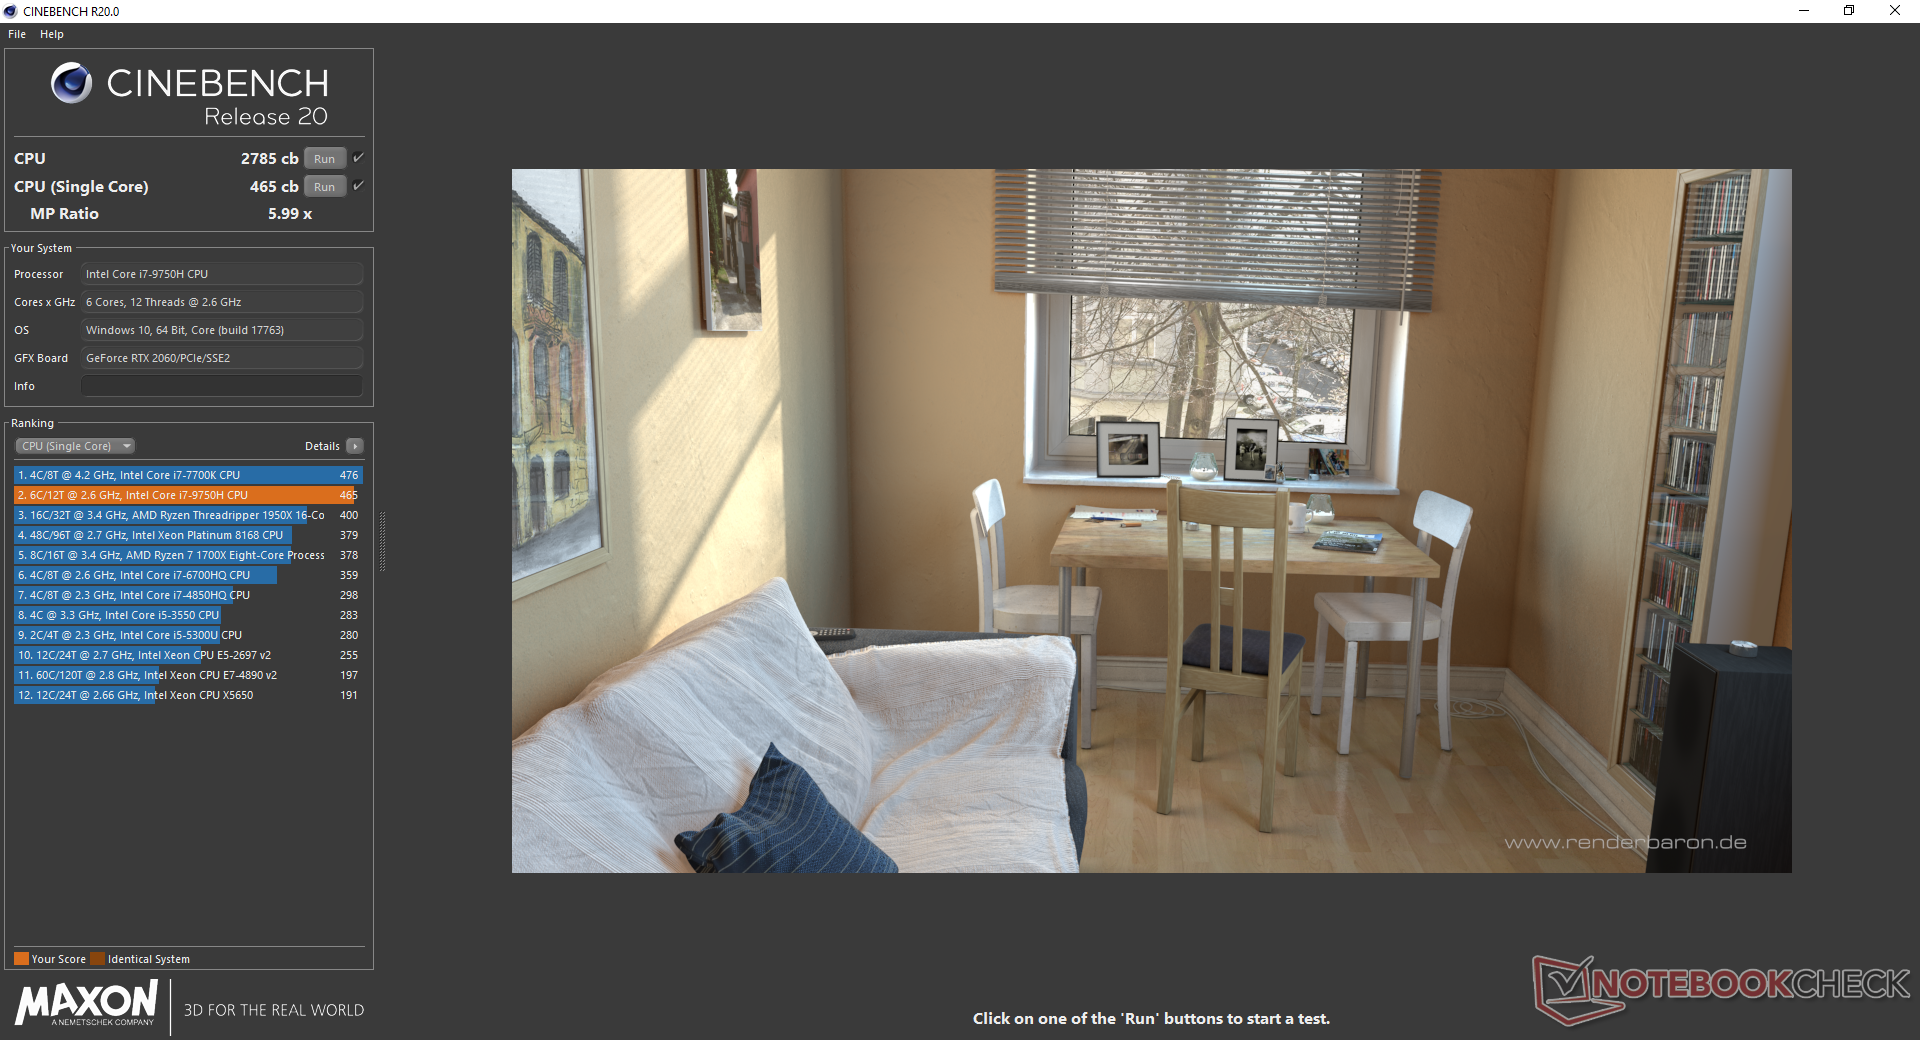
System Performance
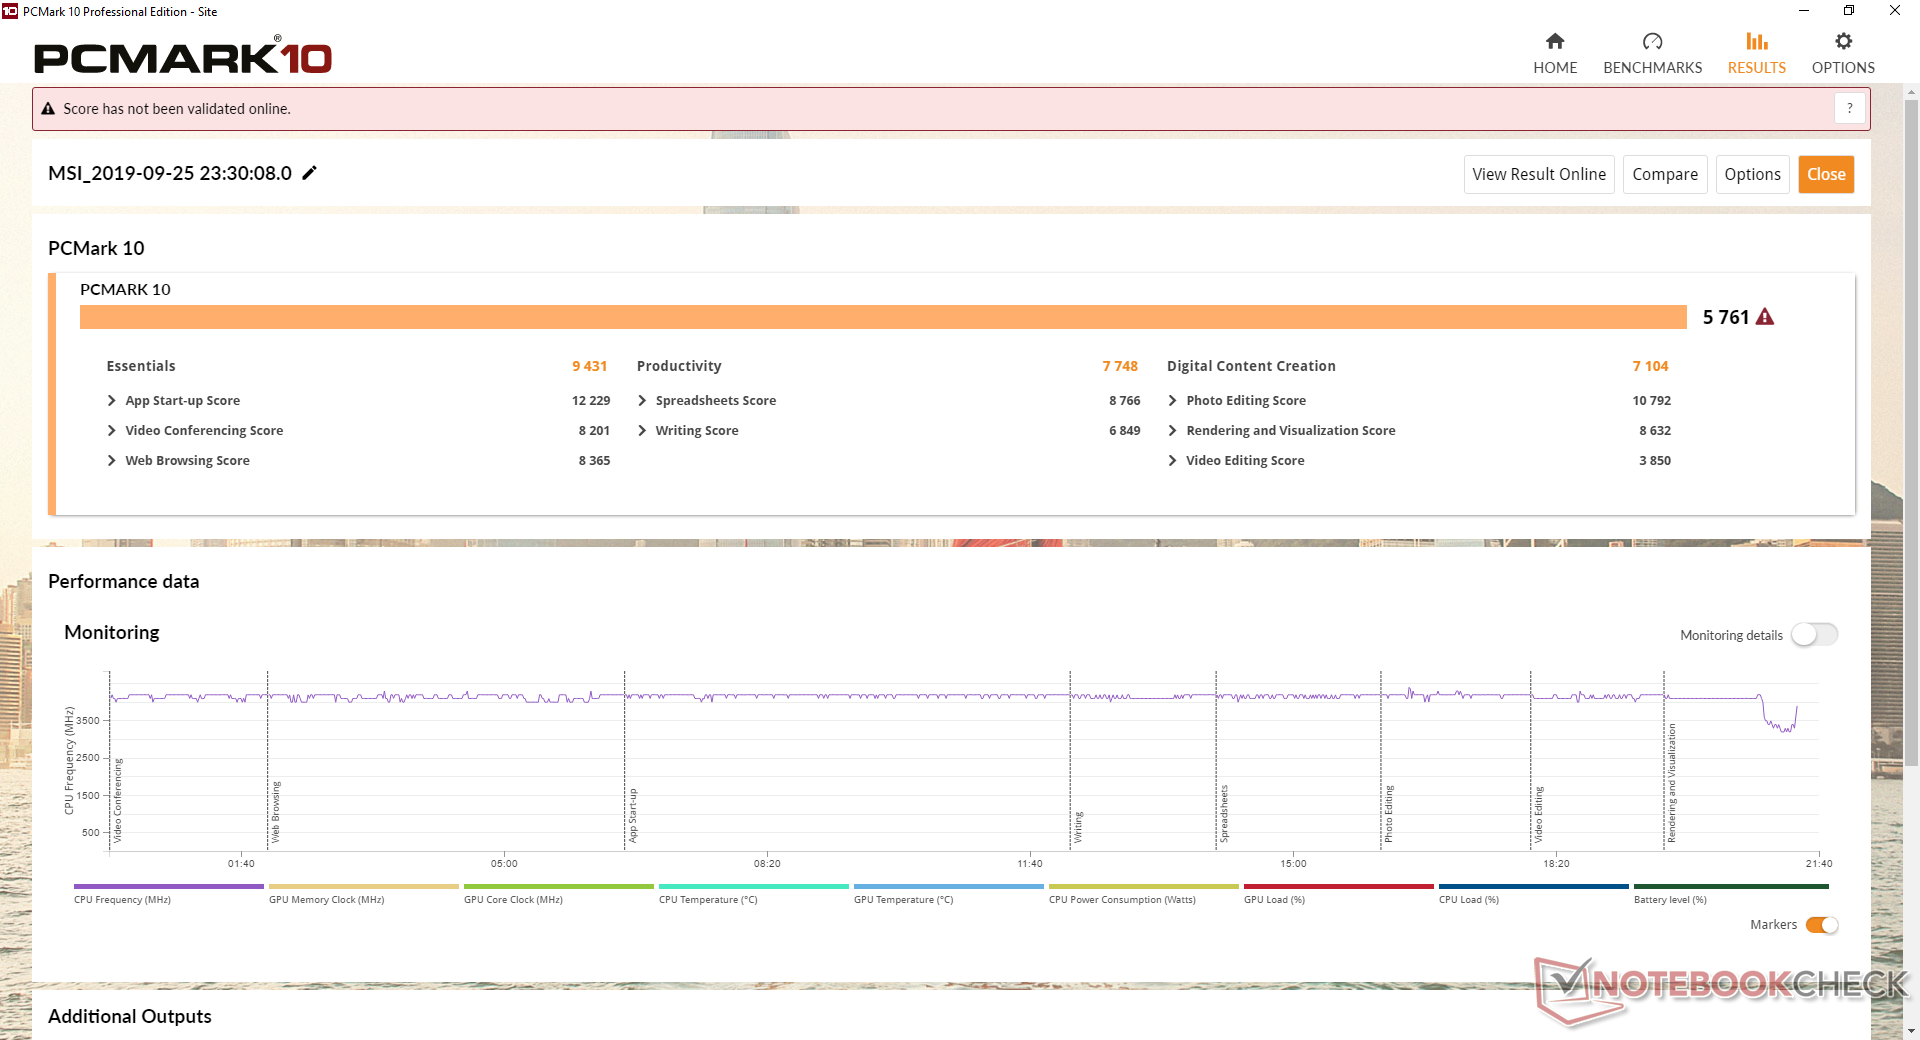
PCMark results are in the same ballpark as other high-performance laptops like the Gigabyte Aero 15 or MSI GS65 even though the GL65 is a cheaper alternative. We experienced no software issues during our time with the unit.
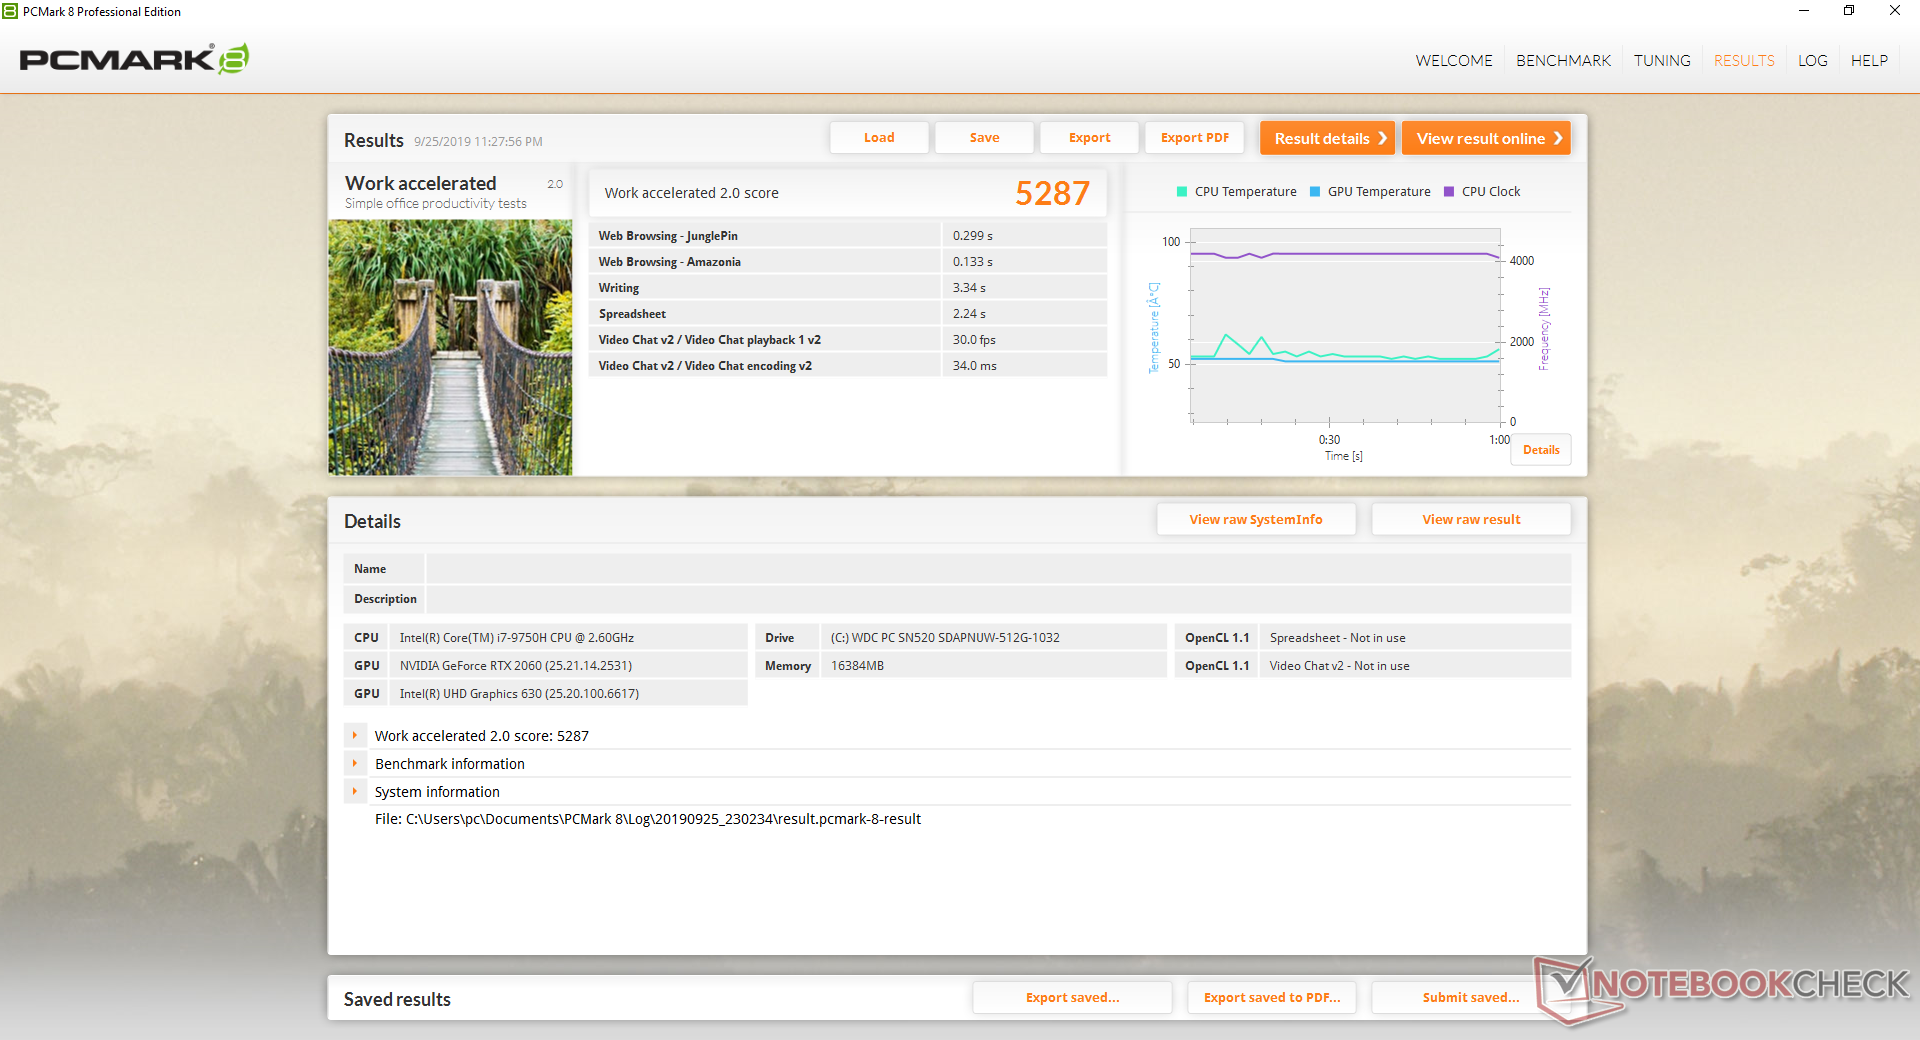
| PCMark 8 Home Score Accelerated v2 | 4136 points | |
| PCMark 8 Work Score Accelerated v2 | 5287 points | |
| PCMark 10 Score | 5761 points | |
Help | ||
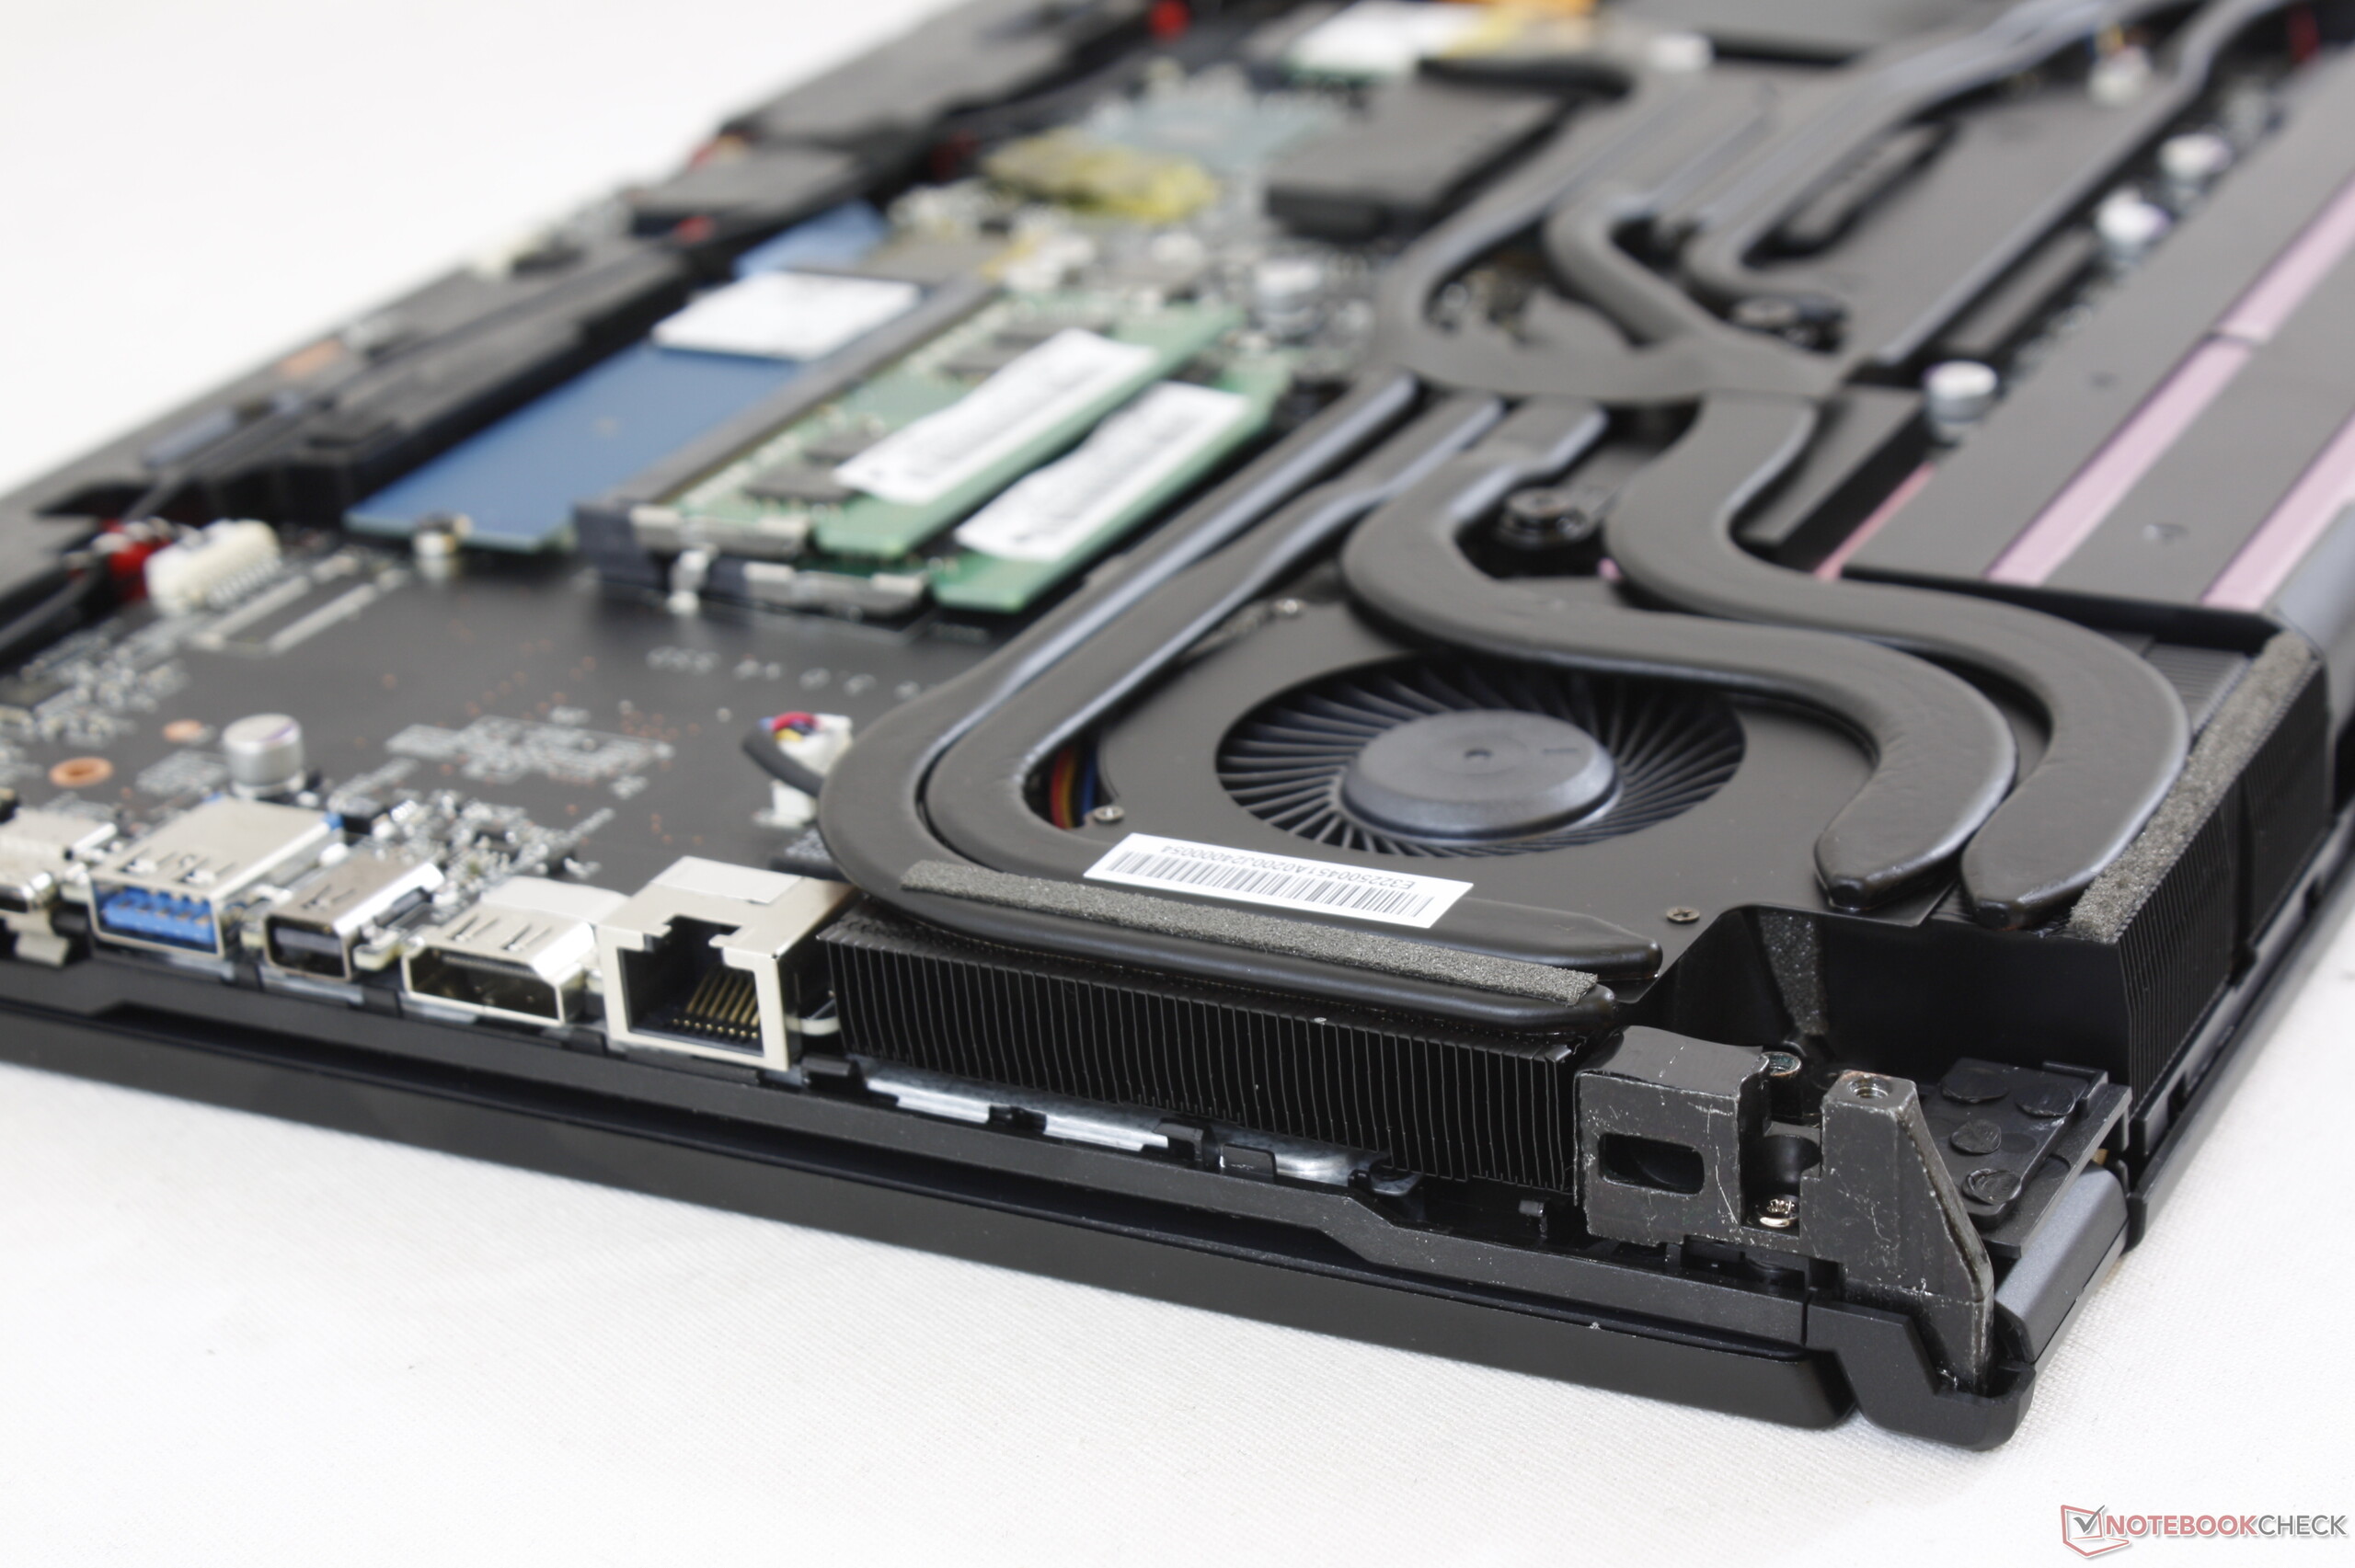
Storage Devices
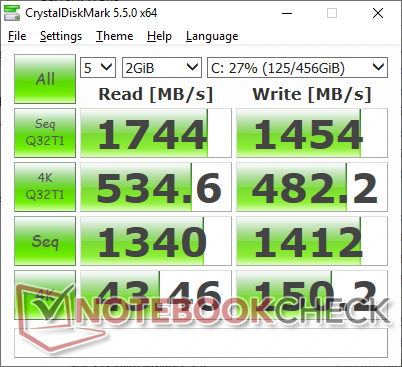
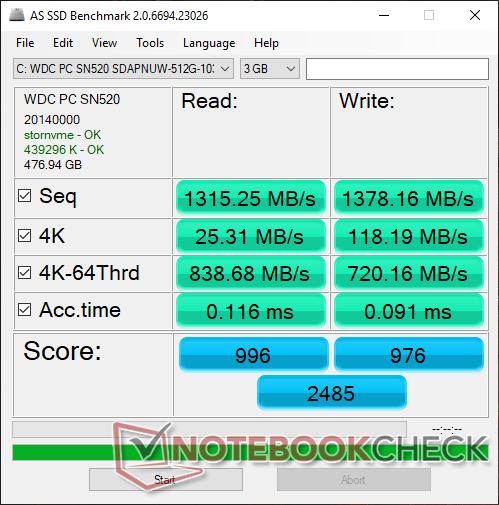
Internal storage options include an M.2 2280 NVMe slot and a 2.5-inch SATA III bay. The 512 GB Western Digital SN520 SSD in our test unit returns good sequential read and write rates for an NVMe drive, but pricier alternatives like the Samsung PM981 in the GS65 can be even faster as shown by the table below.
See our table of HDDs and SSDs for more benchmark comparisons.
| MSI GL65 9SEK WDC PC SN520 SDAPNUW-512G | MSI GL63 8RC-069US Toshiba HG6 THNSNJ256G8NY | MSI GS65 Stealth 9SG Samsung SSD PM981 MZVLB512HAJQ | Gigabyte Aero 15 Classic-XA Intel SSD 760p SSDPEKKW512G8 | Asus Zephyrus S GX531GX Intel SSD 660p SSDPEKNW512G8 | Alienware m15 R2 P87F 2x Toshiba XG6 KXG60ZNV512G (RAID 0) | |
|---|---|---|---|---|---|---|
| AS SSD | -60% | 59% | 27% | -7% | 33% | |
| Seq Read (MB/s) | 1315 | 512 -61% | 2005 52% | 2517 91% | 1239 -6% | 1925 46% |
| Seq Write (MB/s) | 1378 | 456.4 -67% | 1580 15% | 924 -33% | 920 -33% | 2371 72% |
| 4K Read (MB/s) | 25.31 | 16.18 -36% | 49.33 95% | 59.1 134% | 45.74 81% | 37.2 47% |
| 4K Write (MB/s) | 118.2 | 57.1 -52% | 103.8 -12% | 126.5 7% | 95.7 -19% | 108.9 -8% |
| 4K-64 Read (MB/s) | 839 | 342.3 -59% | 1241 48% | 876 4% | 322 -62% | 1177 40% |
| 4K-64 Write (MB/s) | 720 | 127.3 -82% | 1730 140% | 922 28% | 722 0% | 1135 58% |
| Access Time Read * (ms) | 0.116 | 0.197 -70% | 0.054 53% | 0.042 64% | 0.073 37% | 0.065 44% |
| Access Time Write * (ms) | 0.091 | 0.061 33% | 0.036 60% | 0.065 29% | 0.047 48% | 0.108 -19% |
| Score Read (Points) | 996 | 410 -59% | 1490 50% | 1186 19% | 492 -51% | 1407 41% |
| Score Write (Points) | 976 | 230 -76% | 1991 104% | 1141 17% | 910 -7% | 1481 52% |
| Score Total (Points) | 2485 | 850 -66% | 4230 70% | 2870 15% | 1654 -33% | 3633 46% |
| Copy ISO MB/s (MB/s) | 1279 | 325.6 -75% | 3025 137% | 2086 63% | 1236 -3% | 2073 62% |
| Copy Program MB/s (MB/s) | 889 | 84.8 -90% | 713 -20% | 454.2 -49% | 703 -21% | 576 -35% |
| Copy Game MB/s (MB/s) | 1218 | 202.6 -83% | 1554 28% | 1141 -6% | 812 -33% | 1426 17% |
* ... smaller is better

GPU Performance
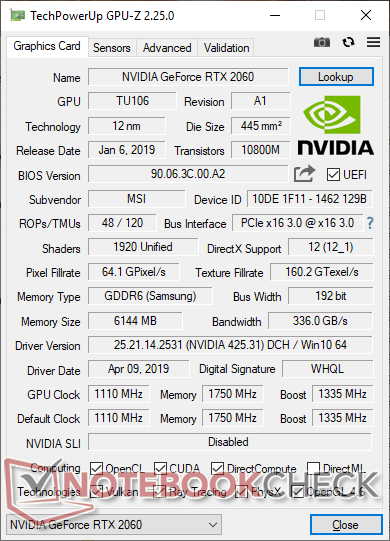
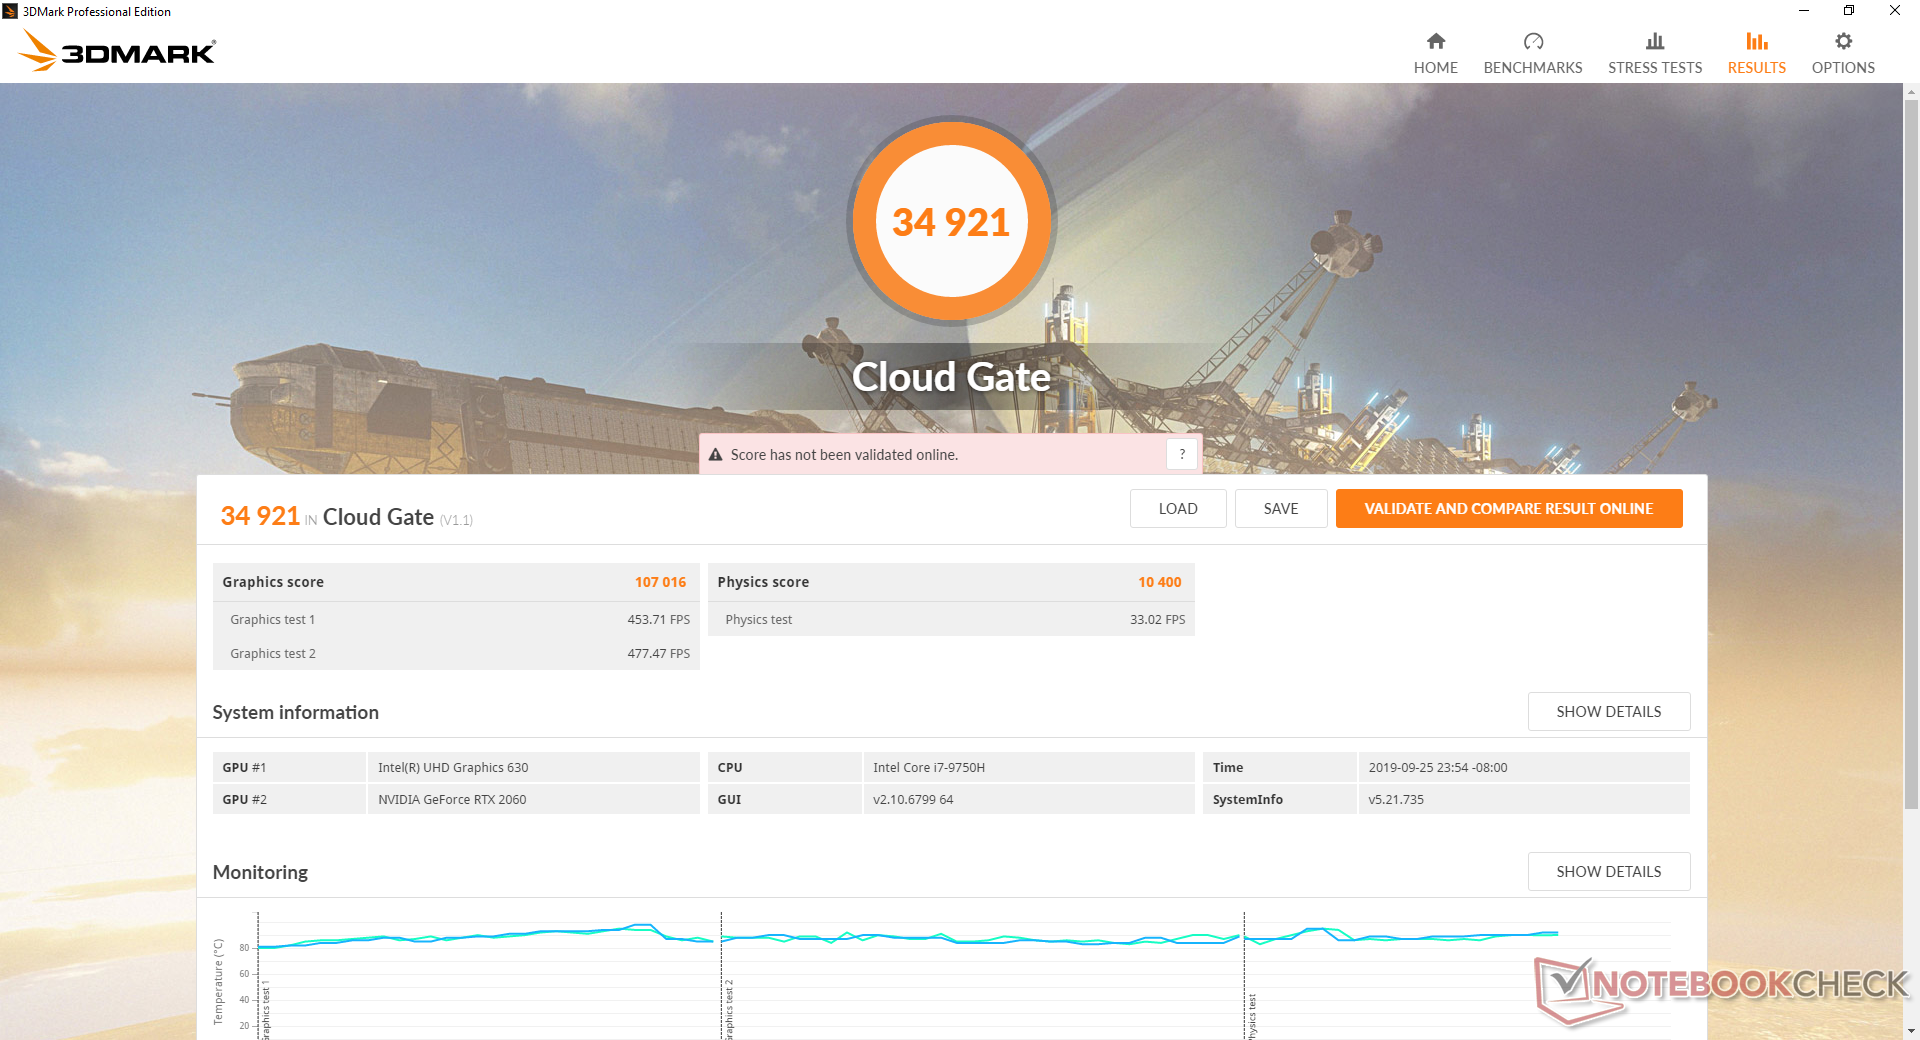
The mobile GeForce RTX 2060 is performing where we expect it to be at within 2 percent of the average mobile RTX 2060 in our database. Keep in mind that the desktop RTX 2060 can offer 25 to 30 percent faster performance than our mobile RTX 2060 version. If you have no interest in RTX-specific features, then the mobile GTX 1660 Ti can offer very nearly the same performance as the mobile RTX 2060 for hundreds less.
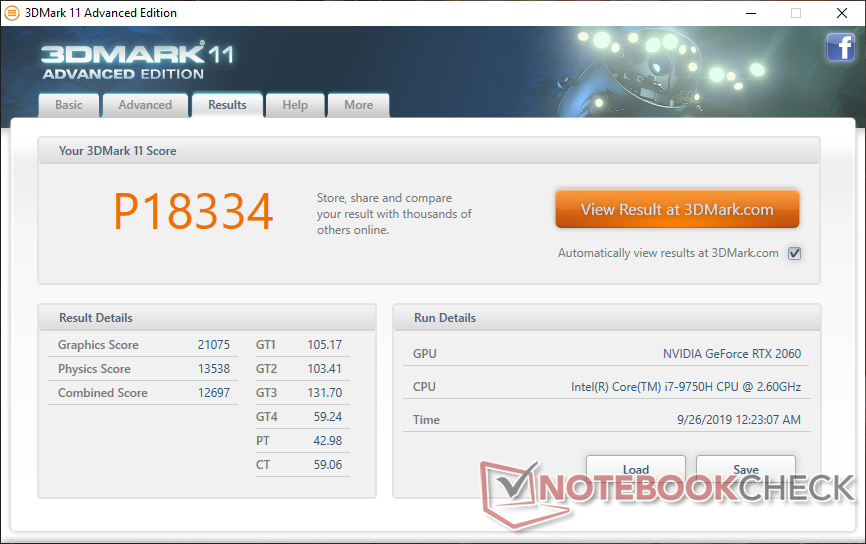
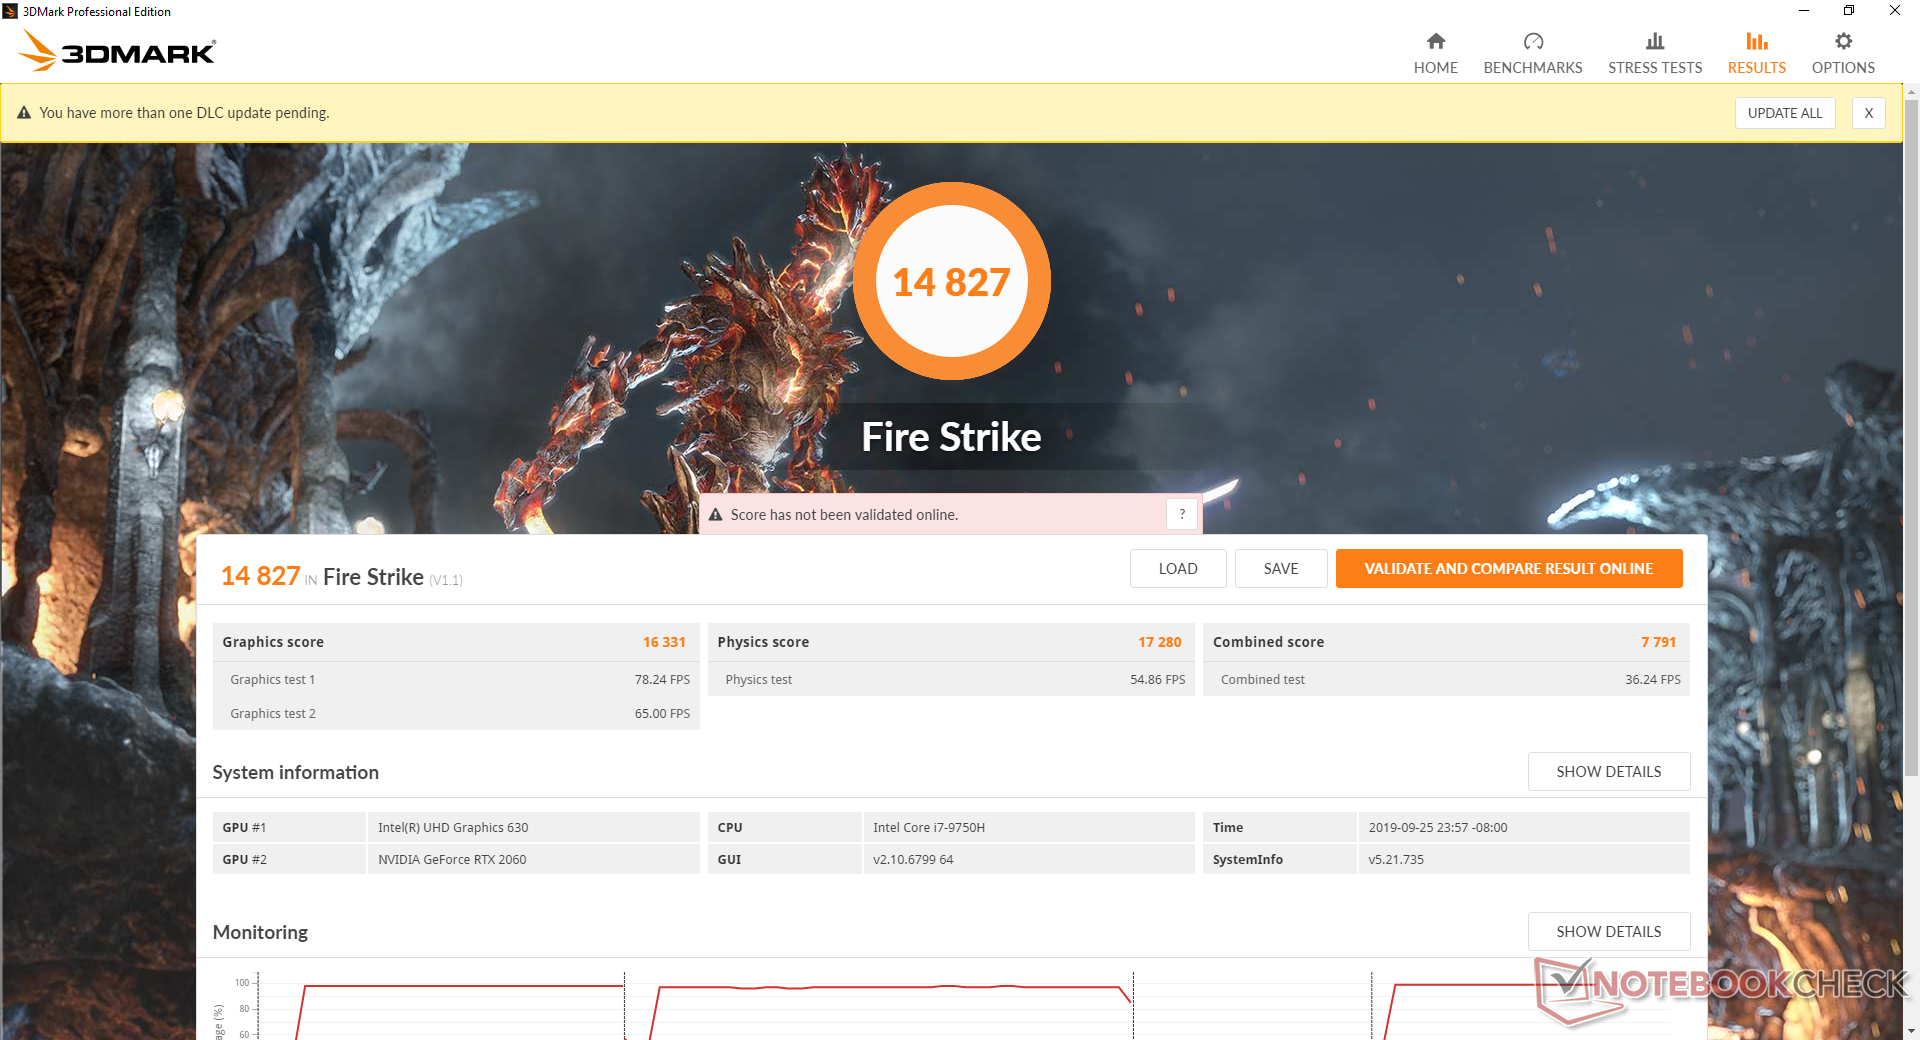
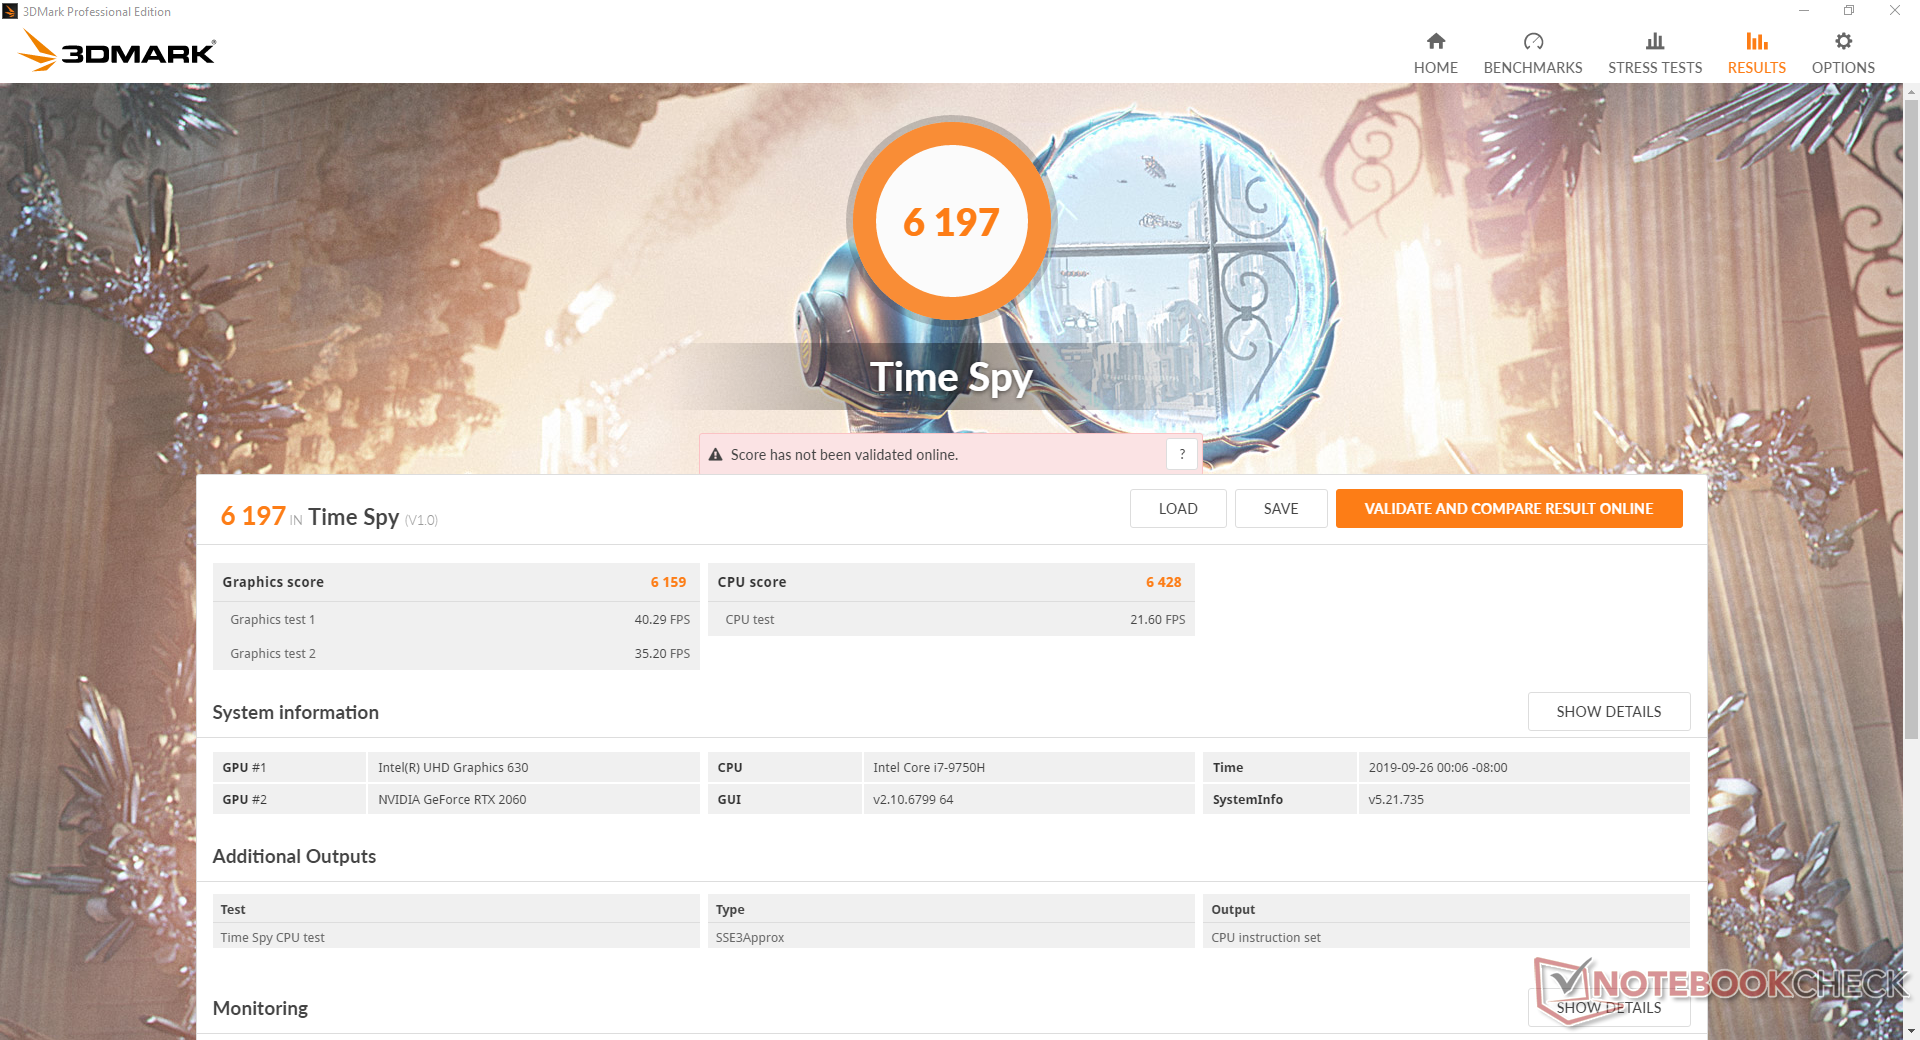
| 3DMark 11 Performance | 18334 points | |
| 3DMark Cloud Gate Standard Score | 34921 points | |
| 3DMark Fire Strike Score | 14827 points | |
| 3DMark Time Spy Score | 6197 points | |
Help | ||
Gaming Performance
The mobile GeForce RTX 2060 is able to play any title at the native 1080p resolution. Maintaining 60 FPS on most titles is possible as well at Medium settings or higher. Even so, performance is unfortunately closer to the GTX 1660 Ti than it is to the "proper" desktop RTX 2060.
Idling on Witcher 3 shows no recurring frame dips to suggest no interrupting background activity. See our dedicated page on the mobile GeForce RTX 2060 for more technical information and benchmark comparisons.
| Shadow of the Tomb Raider - 1920x1080 Highest Preset AA:T | |
| MSI GE75 9SG | |
| Eurocom Nightsky RX15 | |
| MSI RTX 2060 Gaming Z 6G | |
| MSI GS65 Stealth 9SG | |
| MSI GL65 9SEK | |
| Eurocom Nightsky Ti15 | |
| Asus ROG Zephyrus G15 GA502DU | |
| Dell XPS 15 7590 9980HK GTX 1650 | |
| Asus TUF FX705GE-EW096T | |
| low | med. | high | ultra | |
|---|---|---|---|---|
| BioShock Infinite (2013) | 345.1 | 285.1 | 277.4 | 150.3 |
| The Witcher 3 (2015) | 286 | 204 | 117.5 | 58.7 |
| Rocket League (2017) | 244 | 249.3 | 246.9 | |
| Shadow of the Tomb Raider (2018) | 130 | 96 | 88 | 76 |
Emissions
System Noise
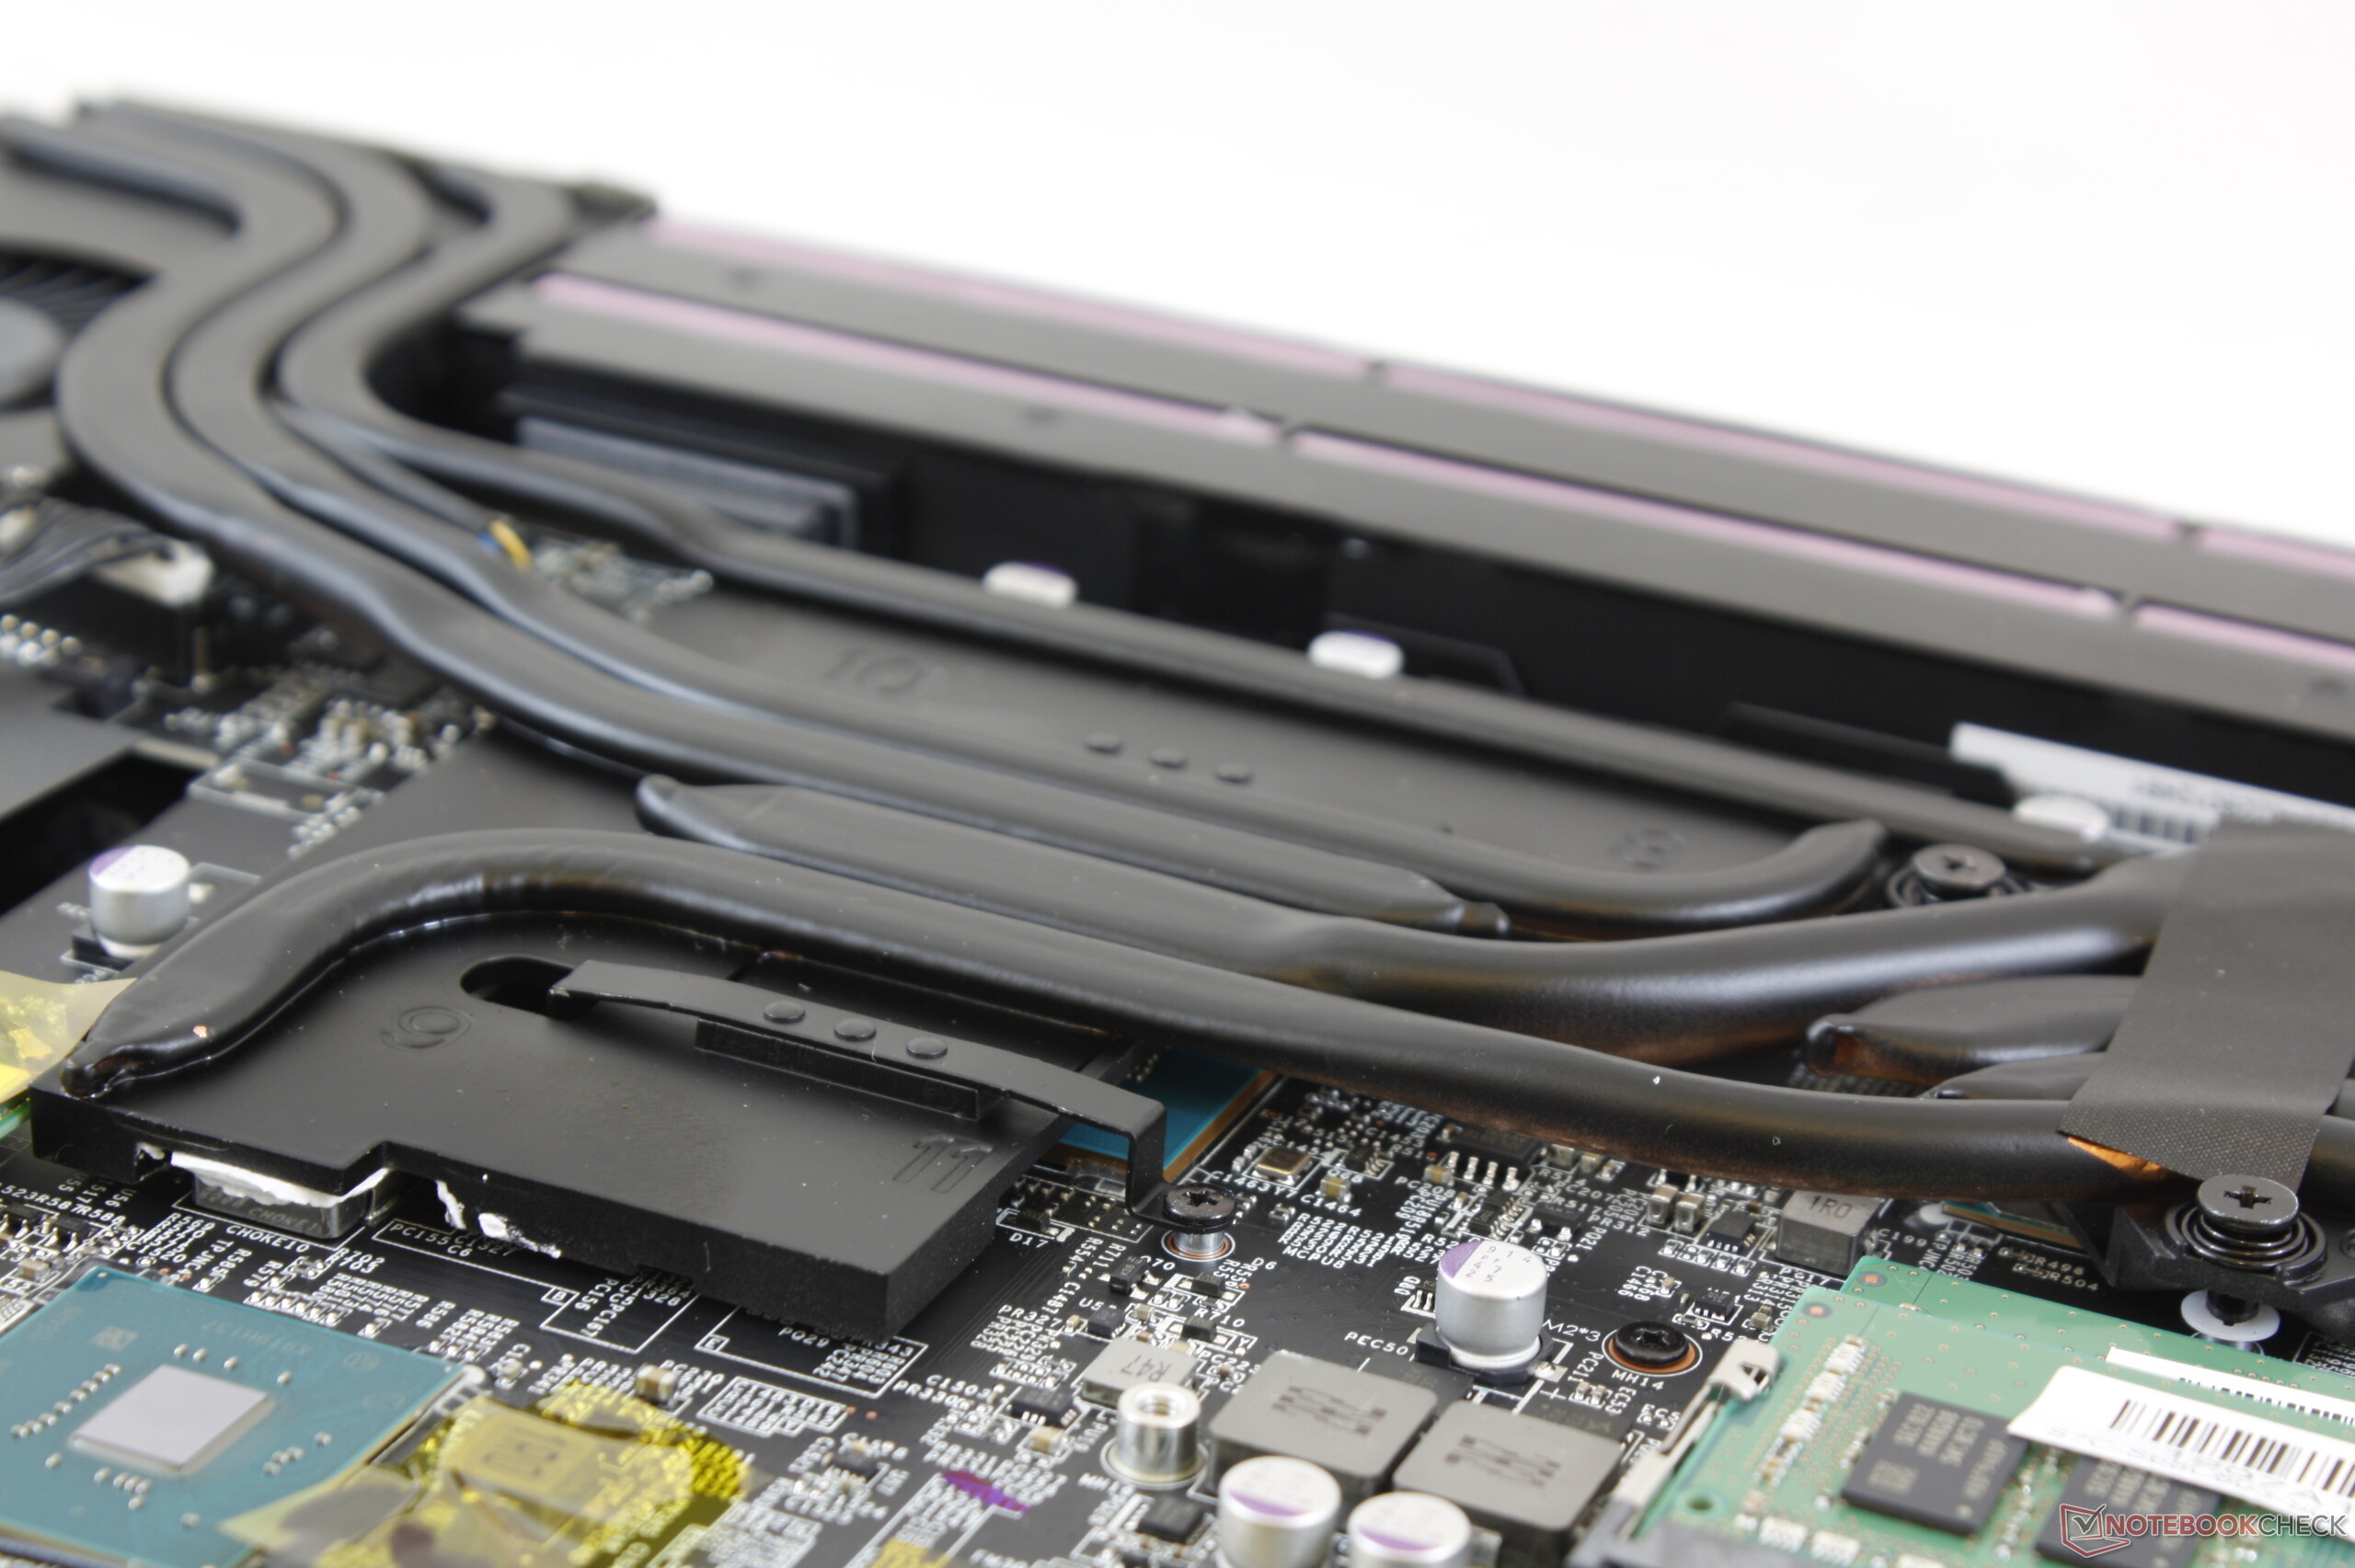
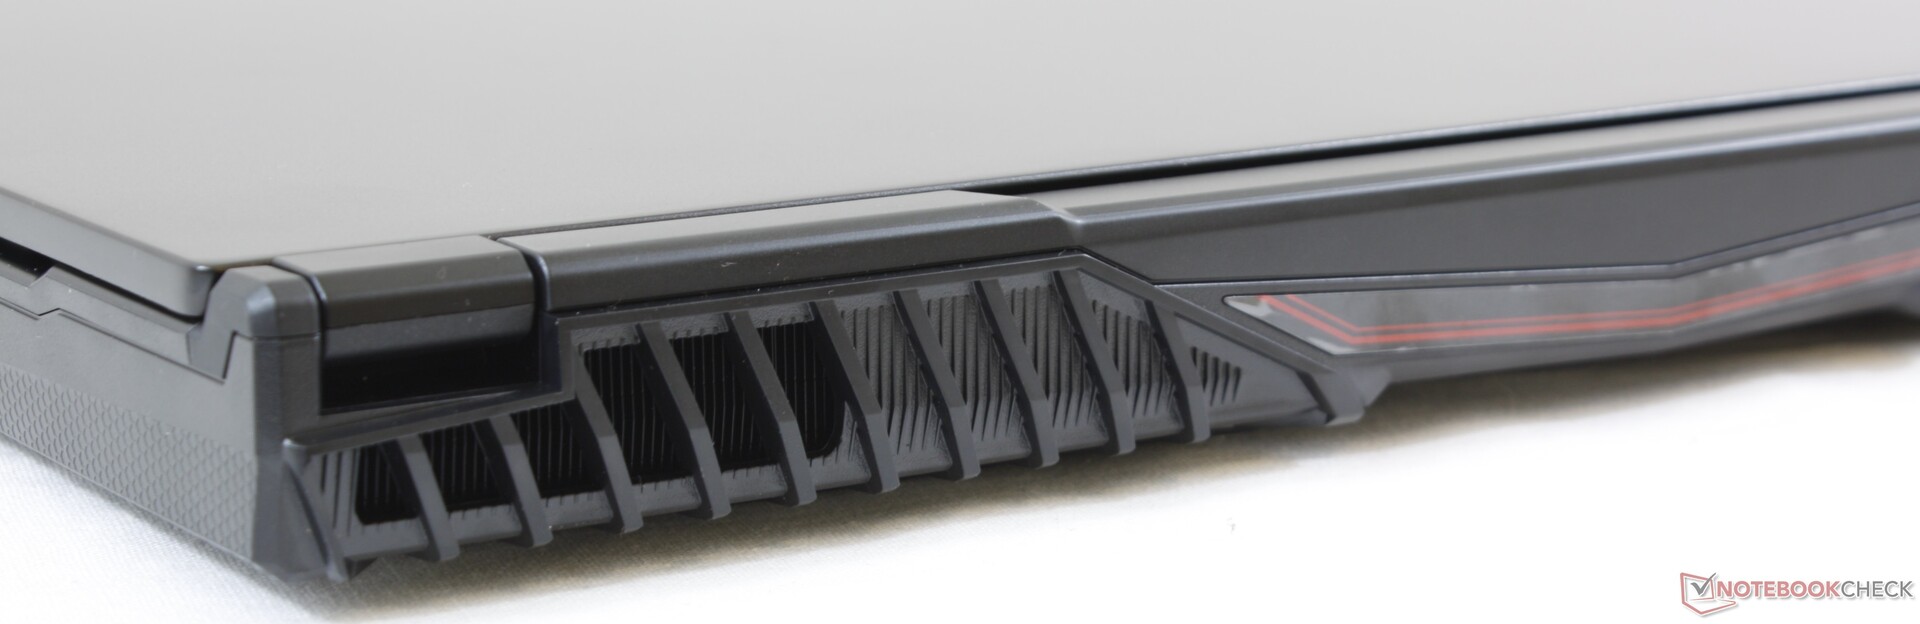
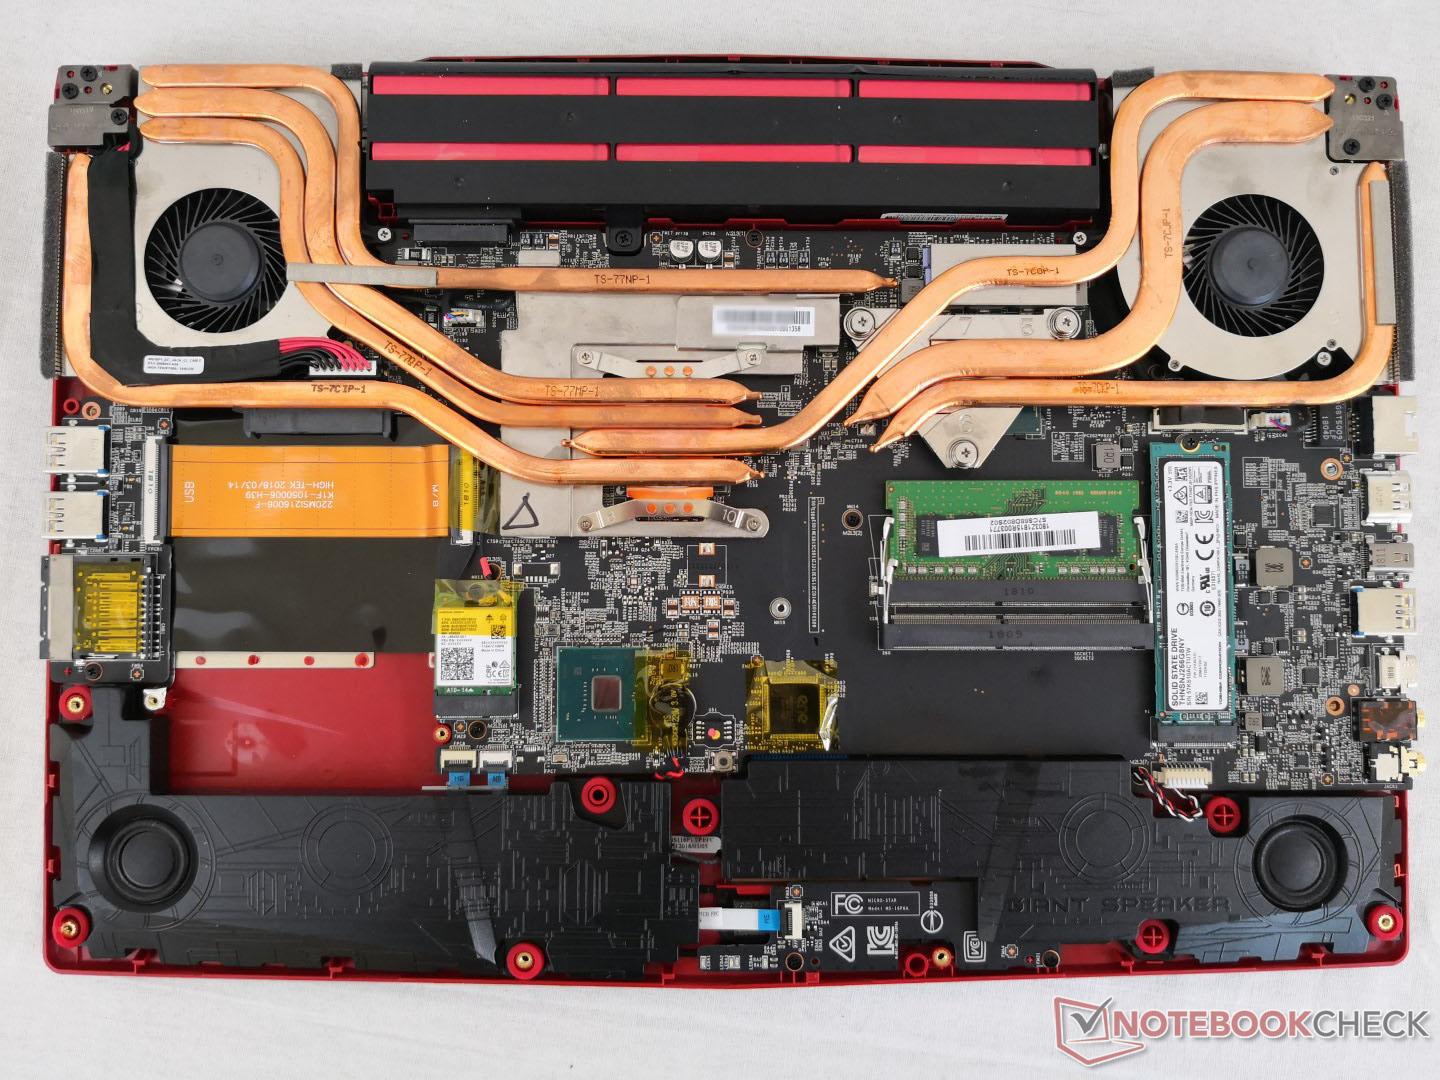
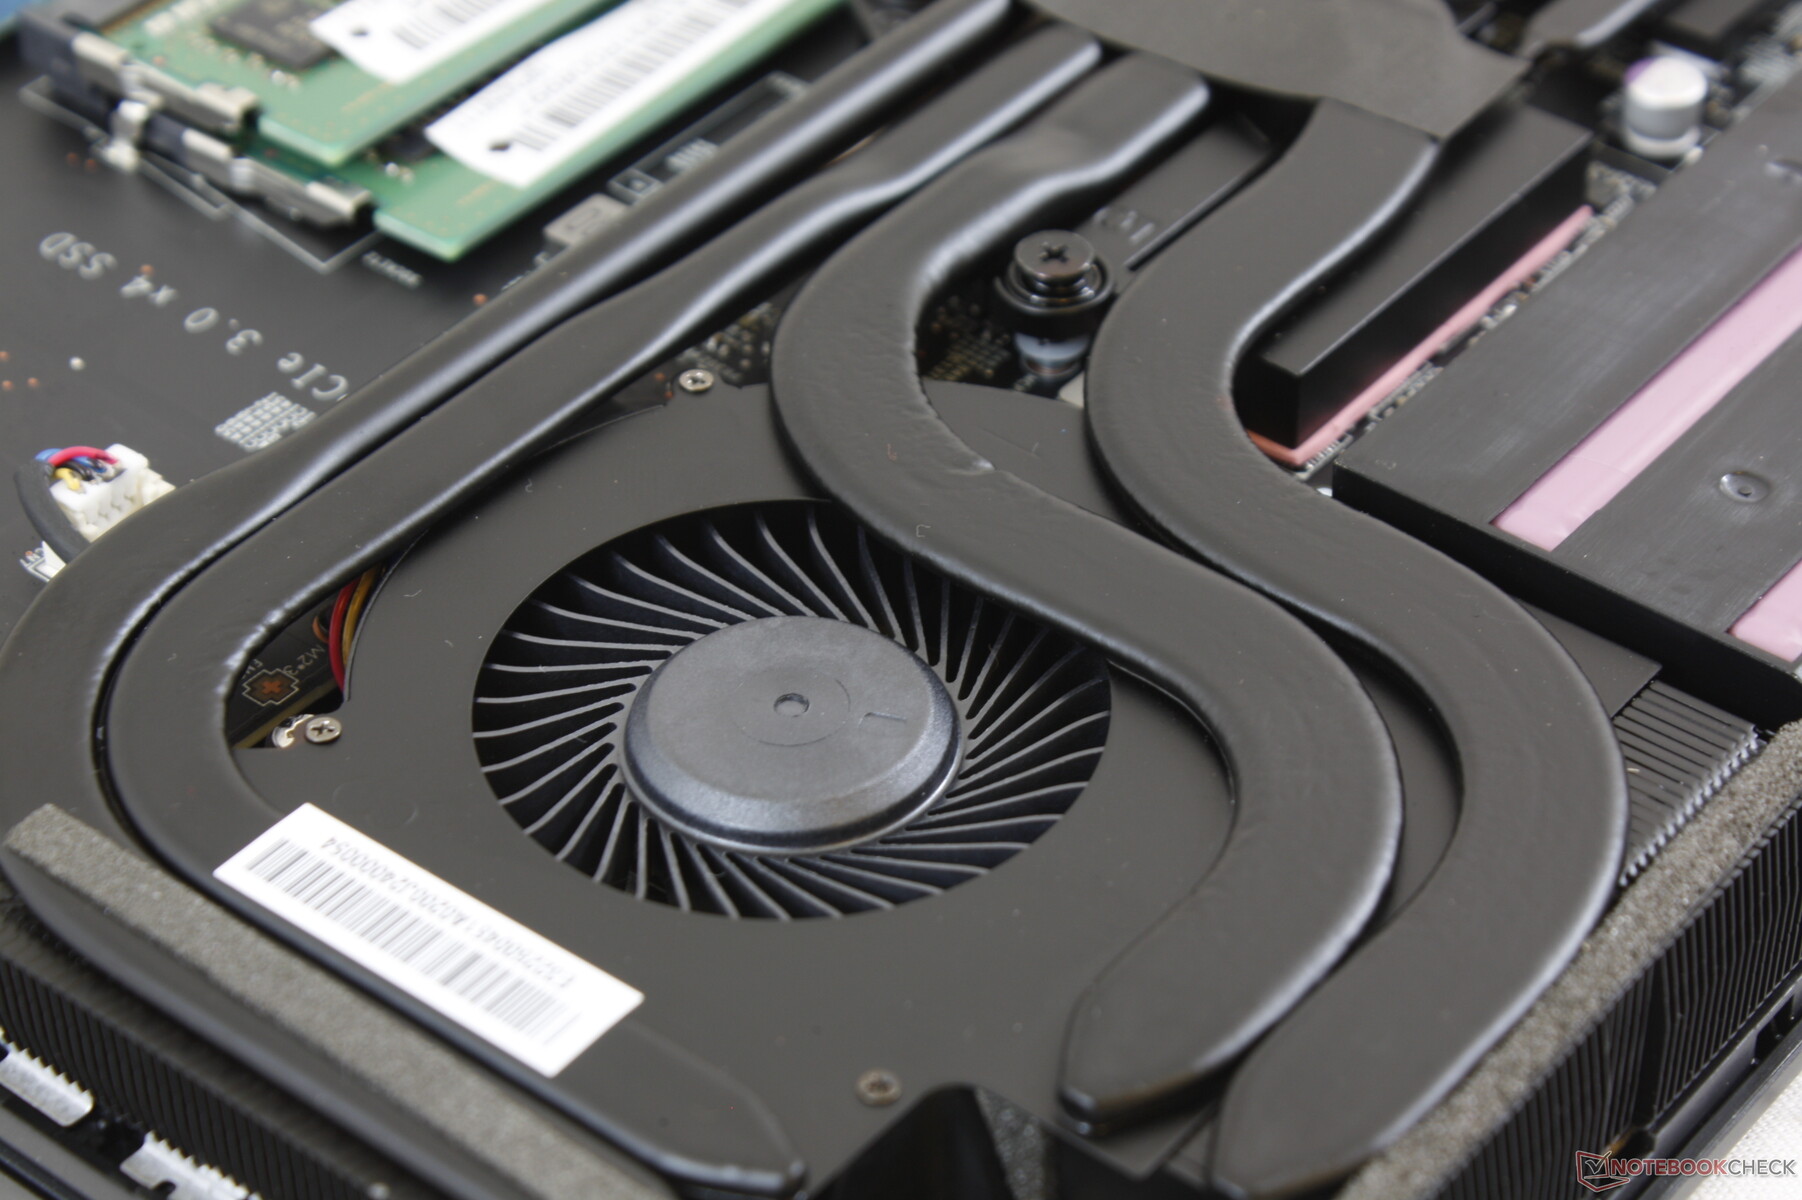
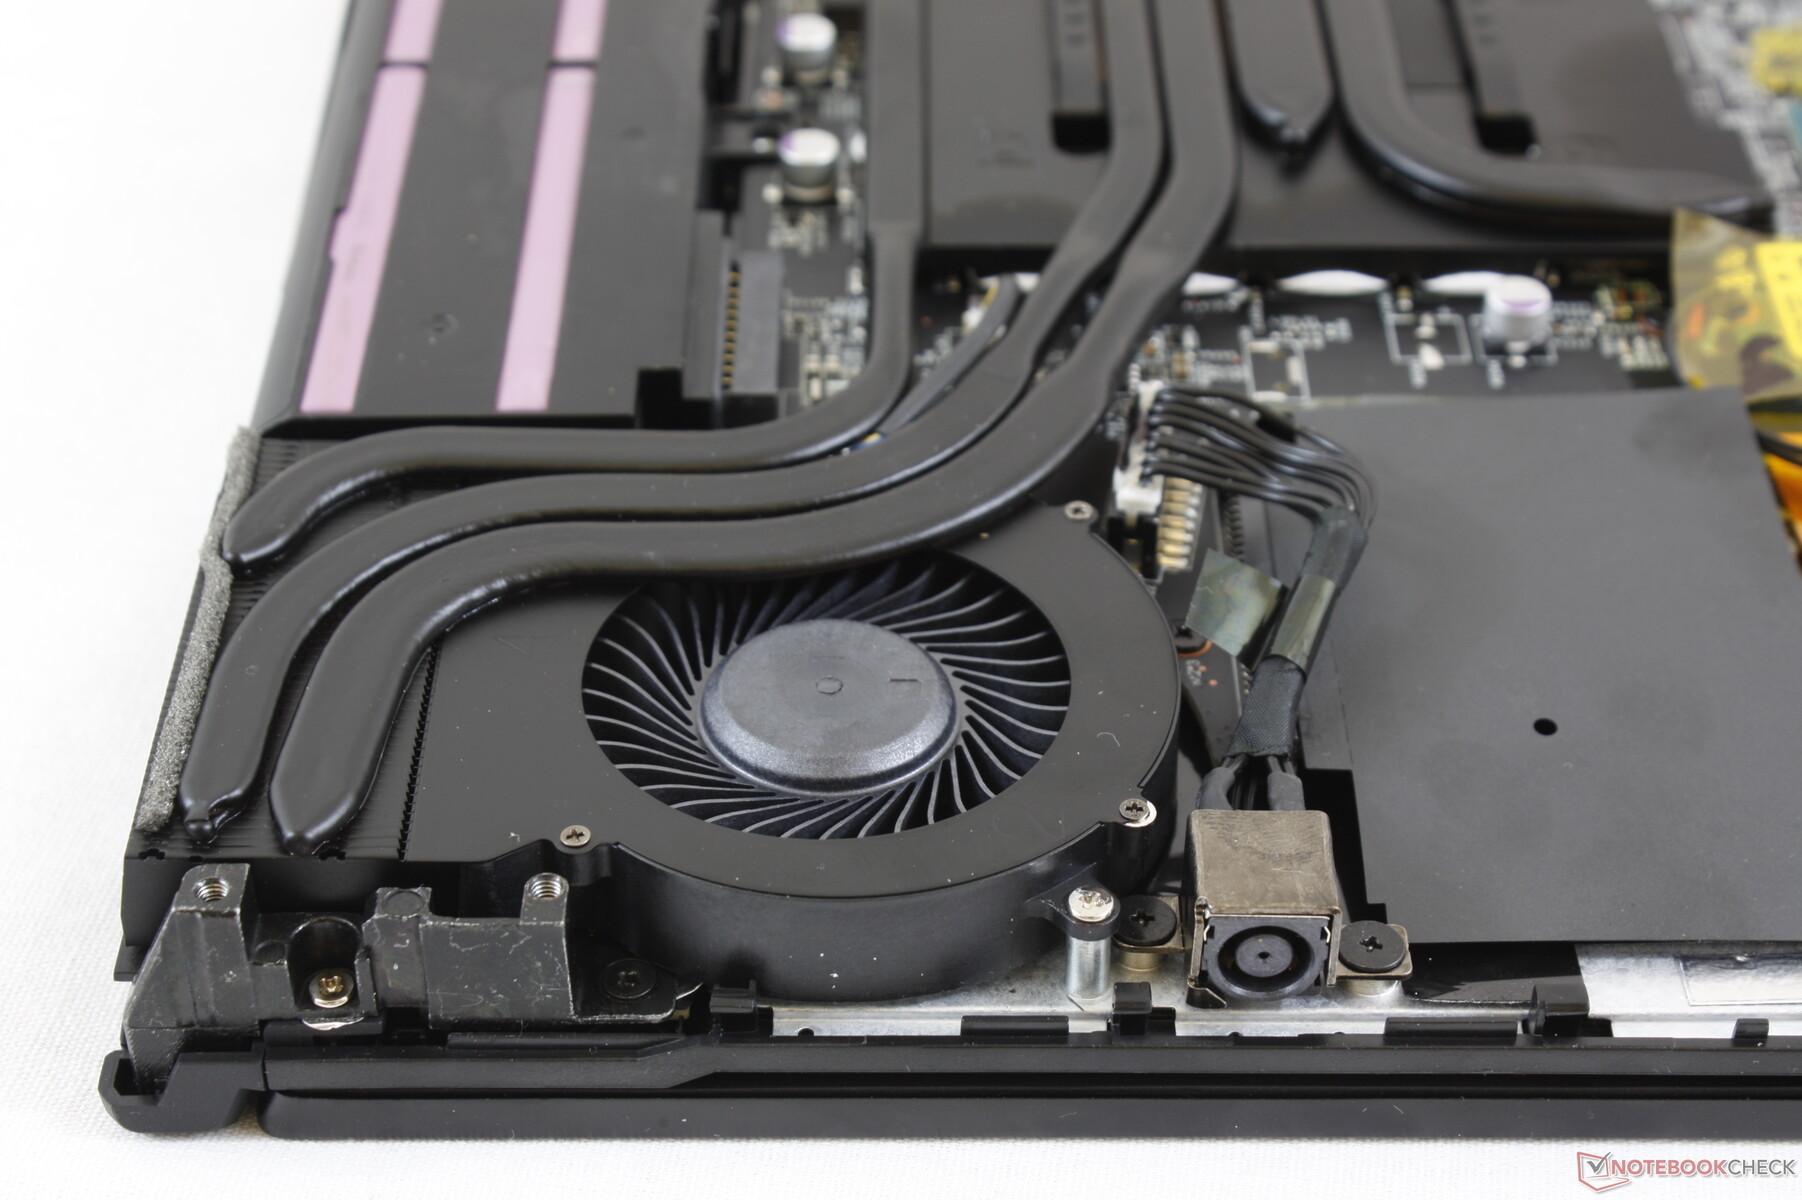
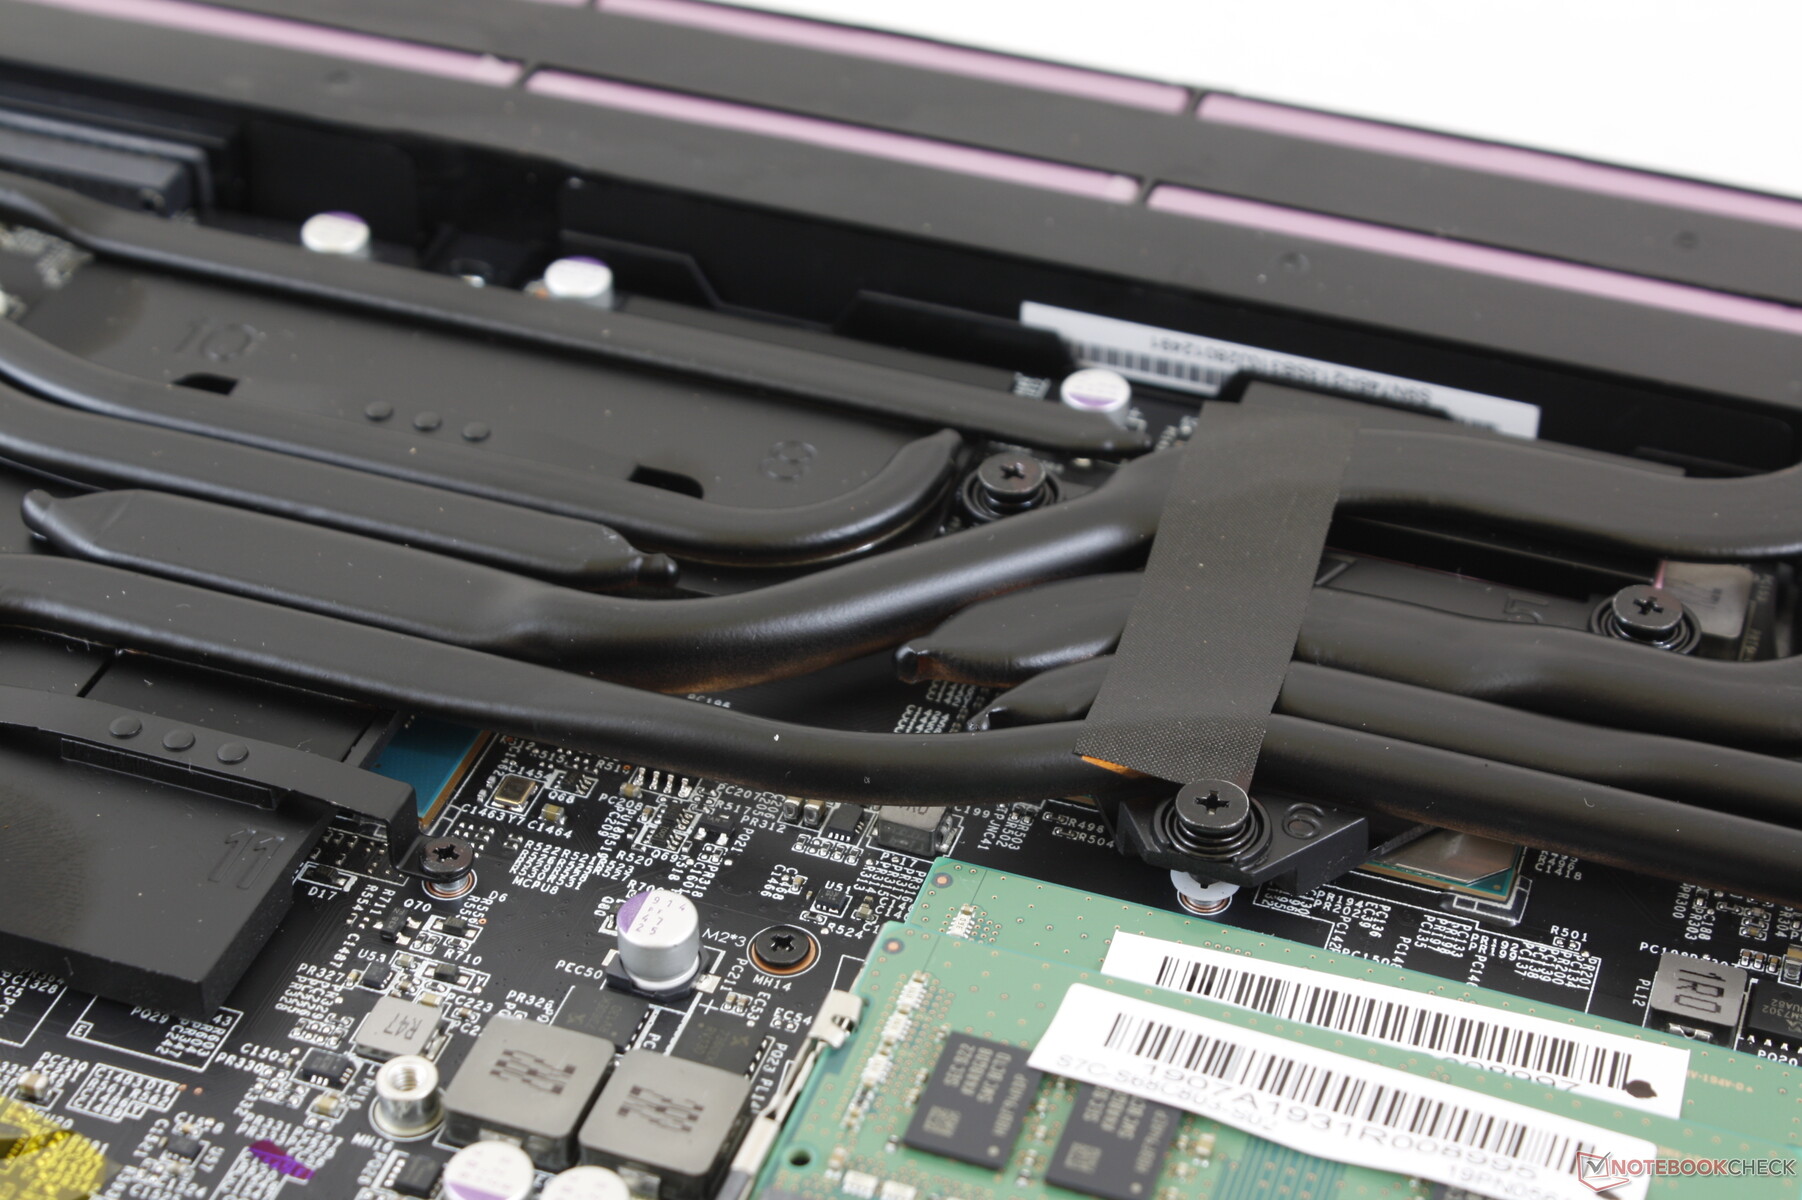
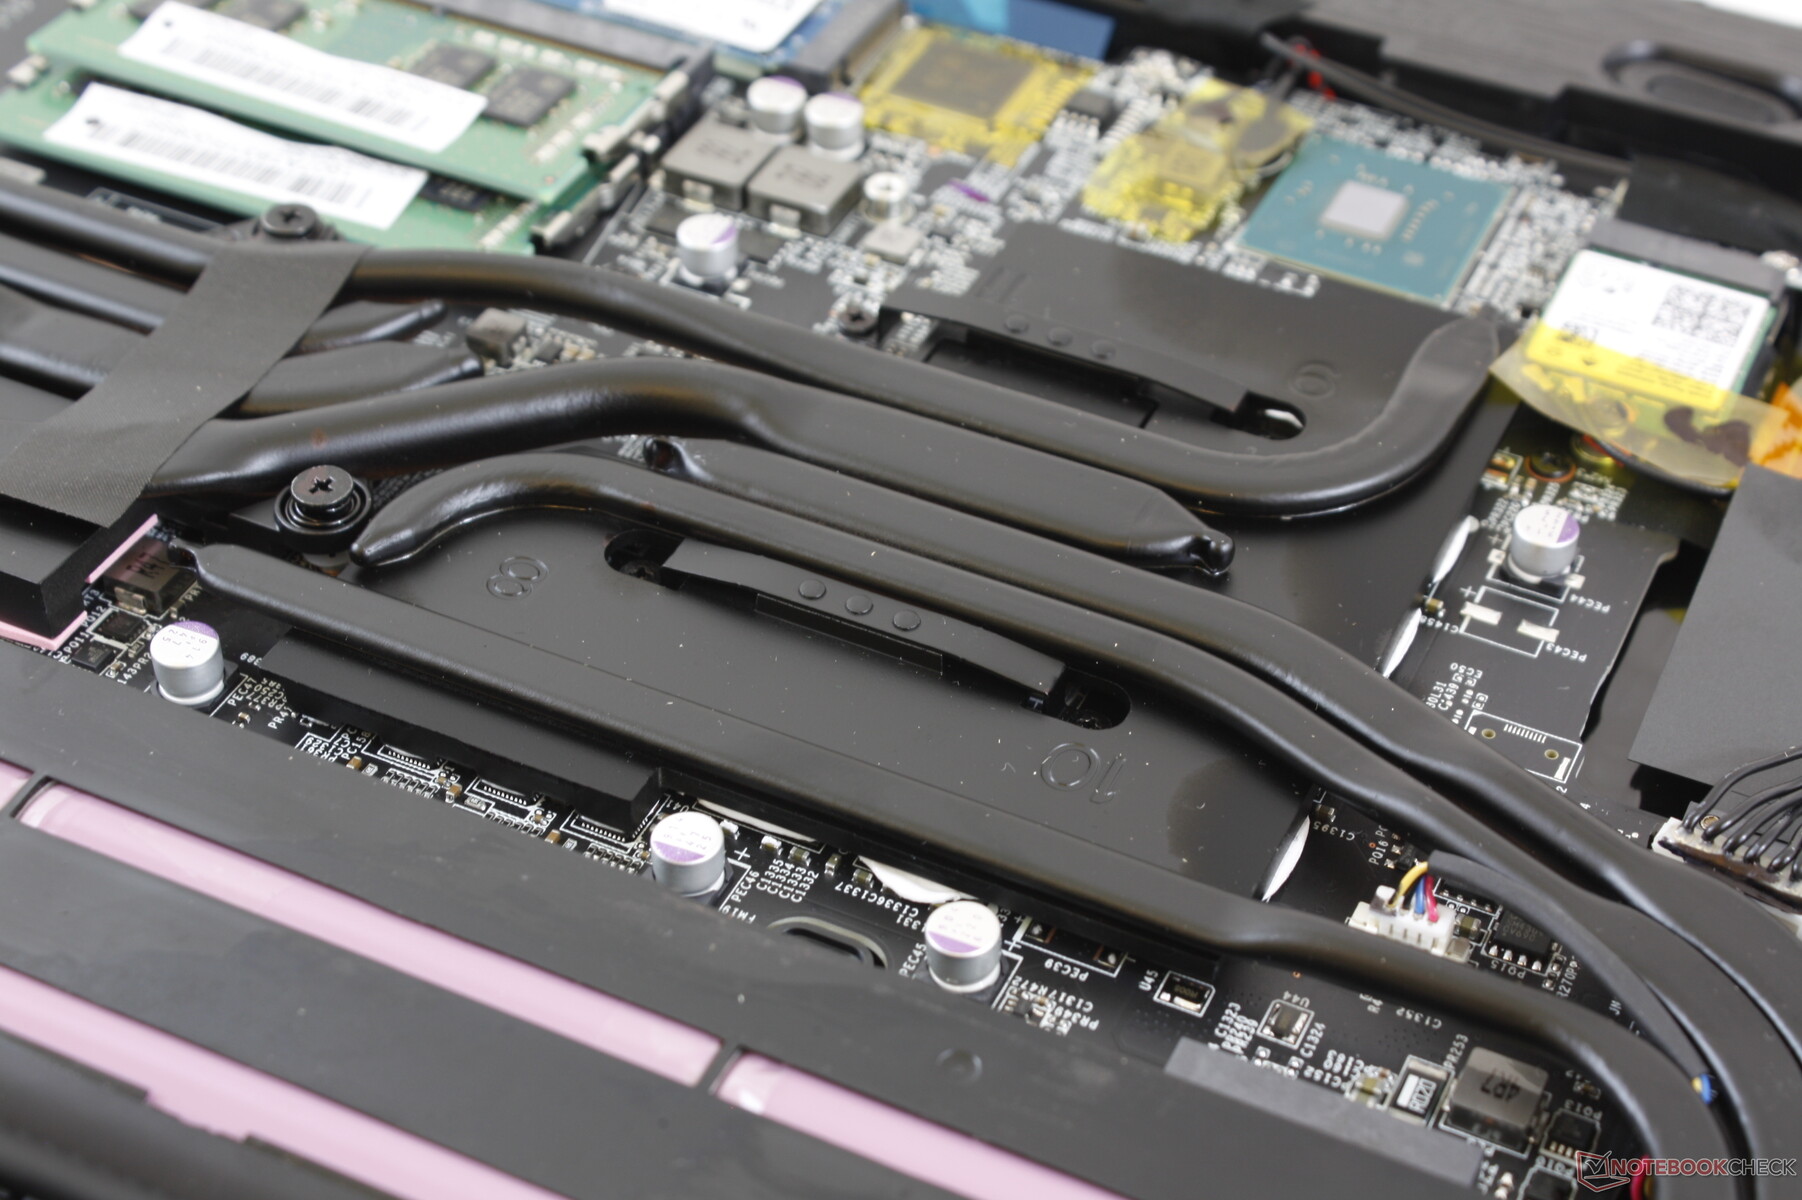
The cooling solution consists of twin fans and seven heat pipes between them. Interestingly, the left fan has two sets of ventilation grilles while the right fan only has one for an asymmetric setup.
The fans are almost always active for a constant level of noise no matter the processing load or power profile. Expect an audible fan noise of up to 33.5 dB(A) when browsing or video streaming. If gaming, fan noise will jump to 51 dB(A) to be louder than the MSI GS65 but quieter than the Asus Zephyrus S GX531GX. The system is louder than the outgoing GL63 GTX 1050 as well likely due to its more demanding RTX 2060 GPU. Enabling Turbo Fan mode will induce a constant fan noise of 58 dB(A) regardless of onscreen activity.
We can notice no electronic noise or coil whine from our test unit.
| MSI GL65 9SEK GeForce RTX 2060 Mobile, i7-9750H, WDC PC SN520 SDAPNUW-512G | MSI GL63 8RC-069US GeForce GTX 1050 Mobile, i5-8300H, Toshiba HG6 THNSNJ256G8NY | MSI GS65 Stealth 9SG GeForce RTX 2080 Max-Q, i7-9750H, Samsung SSD PM981 MZVLB512HAJQ | Gigabyte Aero 15 Classic-XA GeForce RTX 2070 Max-Q, i7-9750H, Intel SSD 760p SSDPEKKW512G8 | Asus Zephyrus S GX531GX GeForce RTX 2080 Max-Q, i7-8750H, Intel SSD 660p SSDPEKNW512G8 | Alienware m15 R2 P87F GeForce RTX 2080 Max-Q, i7-9750H, 2x Toshiba XG6 KXG60ZNV512G (RAID 0) | |
|---|---|---|---|---|---|---|
| Noise | 8% | 8% | -3% | 0% | -3% | |
| off / environment * (dB) | 28.1 | 28.6 -2% | 28.3 -1% | 30 -7% | 28.7 -2% | 28.3 -1% |
| Idle Minimum * (dB) | 31.4 | 28.6 9% | 30.4 3% | 31 1% | 29.8 5% | 28.5 9% |
| Idle Average * (dB) | 31.5 | 31.6 -0% | 30.5 3% | 34 -8% | 32.4 -3% | 28.5 10% |
| Idle Maximum * (dB) | 33.5 | 31.6 6% | 30.6 9% | 39 -16% | 38 -13% | 49 -46% |
| Load Average * (dB) | 49.3 | 38.6 22% | 37.6 24% | 46 7% | 38.2 23% | 49 1% |
| Witcher 3 ultra * (dB) | 51.3 | 40.6 21% | 46 10% | 53 -3% | 56.6 -10% | 49 4% |
| Load Maximum * (dB) | 58 | 56.8 2% | 55.1 5% | 55 5% | 56.6 2% | 55 5% |
* ... smaller is better
Noise level
| Idle |
| 31.4 / 31.5 / 33.5 dB(A) |
| Load |
| 49.3 / 58 dB(A) |
 | ||
30 dB silent 40 dB(A) audible 50 dB(A) loud |
||
min: | ||
Temperature
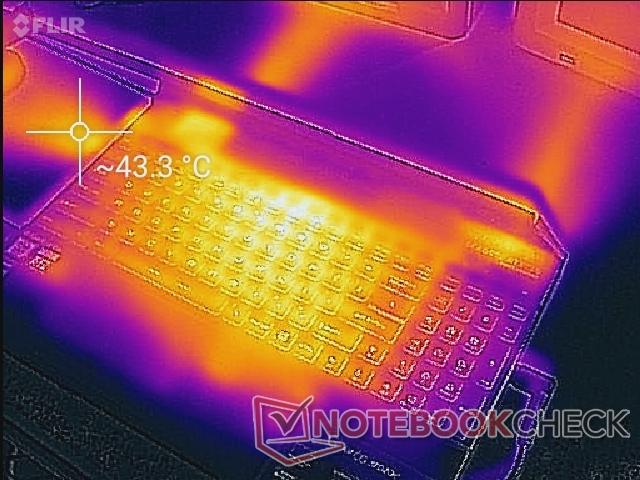
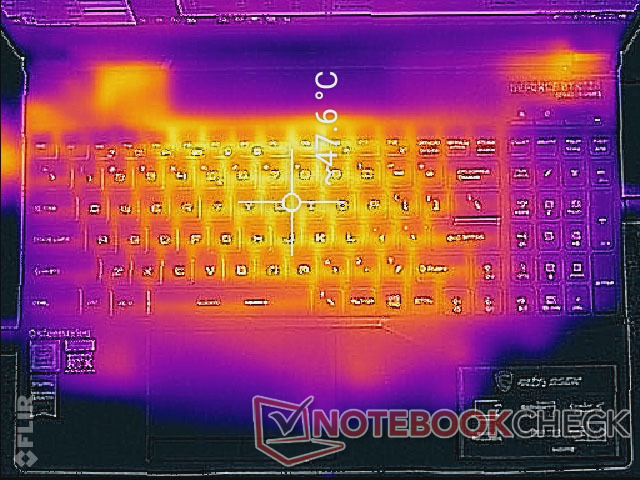
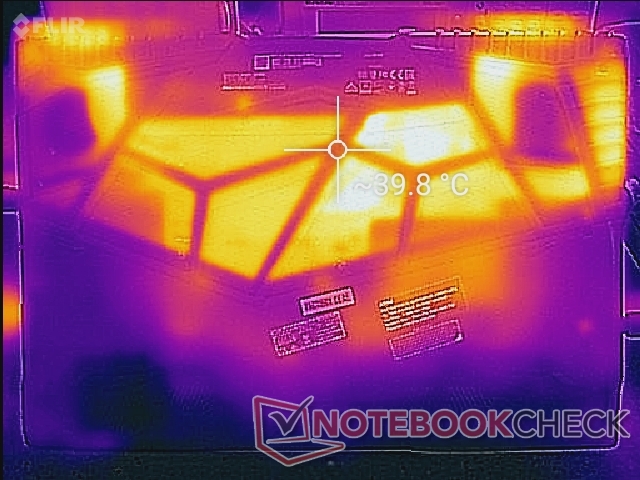
Surface temperatures are quite warm even when just idling on desktop. We're able to record a temperature of 40 C near the center of the keyboard from doing absolutely nothing on the laptop for half an hour. The unusually high idling temperatures back up our unusually high idling power consumption results in our Power Consumption section. In comparison, the hot spots on the GS65 are only 28 C to 33 C when under the same idling loads.
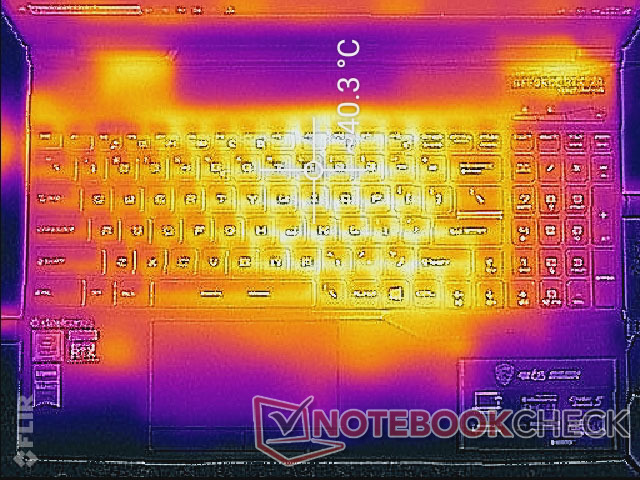
Running Witcher 3 results in a maximum surface temperature of 49 C near the center of the keyboard or 39 C near the WASD keys. Fortunately, the palm rests remain much cooler.
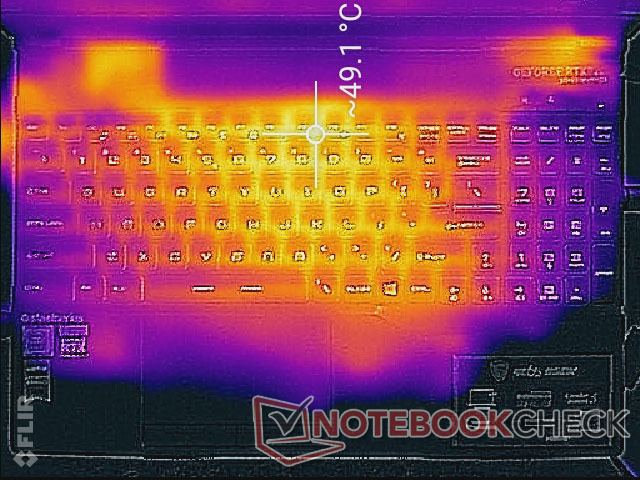
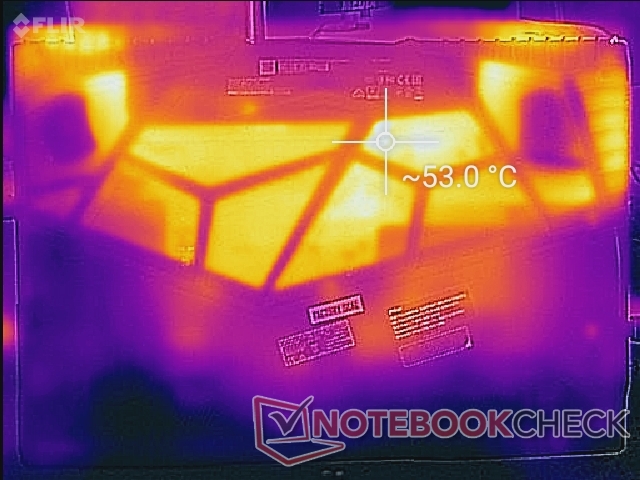
(-) The maximum temperature on the upper side is 49 °C / 120 F, compared to the average of 40.4 °C / 105 F, ranging from 21.2 to 68.8 °C for the class Gaming.
(-) The bottom heats up to a maximum of 54.2 °C / 130 F, compared to the average of 43.2 °C / 110 F
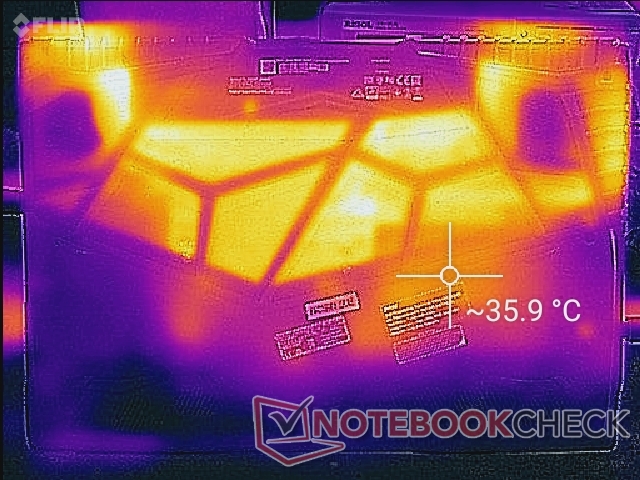
(±) In idle usage, the average temperature for the upper side is 35.9 °C / 97 F, compared to the device average of 33.9 °C / 93 F.
(-) Playing The Witcher 3, the average temperature for the upper side is 38.4 °C / 101 F, compared to the device average of 33.9 °C / 93 F.
(±) The palmrests and touchpad can get very hot to the touch with a maximum of 36 °C / 96.8 F.
(-) The average temperature of the palmrest area of similar devices was 28.8 °C / 83.8 F (-7.2 °C / -13 F).
Stress Test
We stress the laptop with synthetic loads to identify for any potential throttling or stability issues. When running Prime95, clock rates would spike to 4 GHz for the first few seconds until hitting a core temperature of 95 C. Thereafter, clock rate drops to 3.5 GHz in order to maintain a cooler core temperature of 88 C. When Turbo Fan is enabled, core temperature drops further to 83 C while clock rate remains the same. Turbo Fan is therefore not necessary for maximum performance since it impacts temperature more so than clock rates to be consistent with what we observed on the GT series.
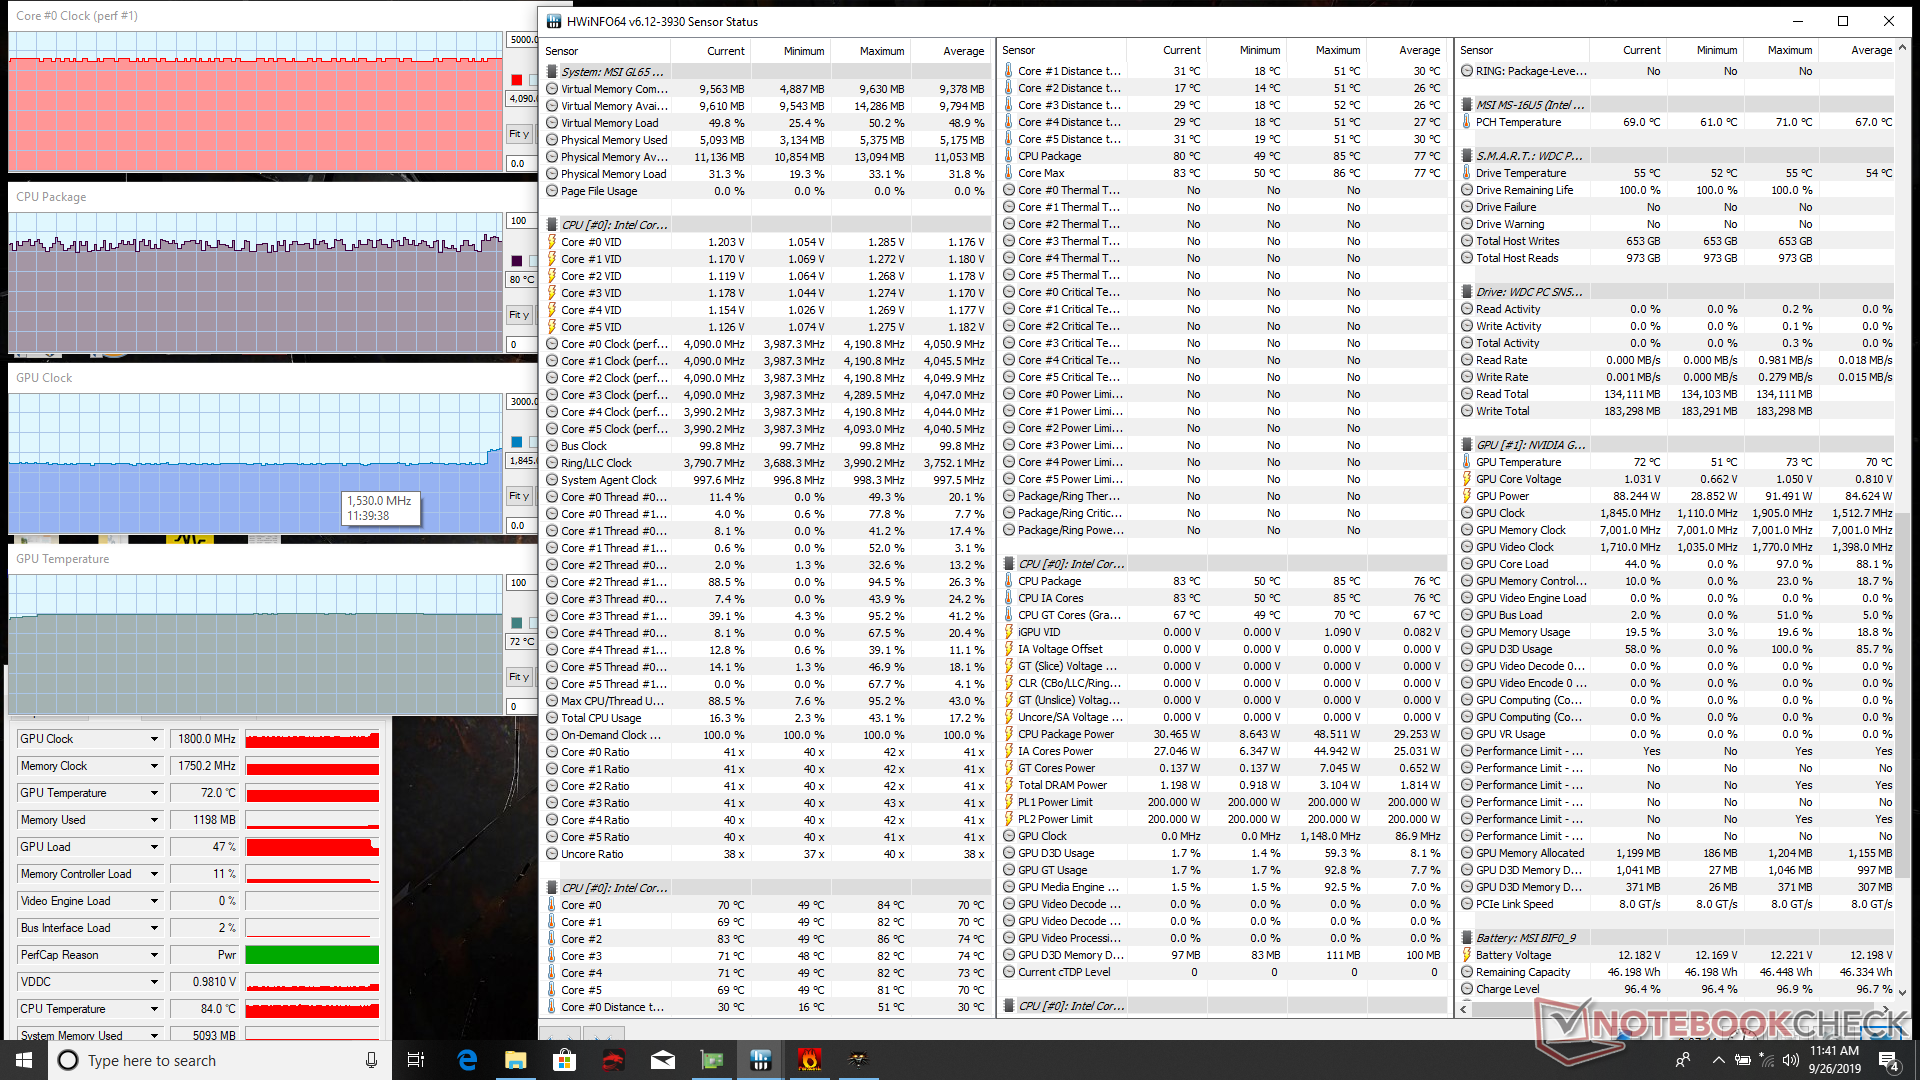
When running Witcher 3, CPU and GPU temperatures hover around 80 C and 72 C, respectively, or 67 C and 61 C when Turbo Fan is enabled. Running on battery power will impact overall performance. A 3DMark Fire Strike run on batteries returns Physics and Graphics scores of 10287 and 4565 points, respectively, compared to 17280 and 16331 points when on mains.
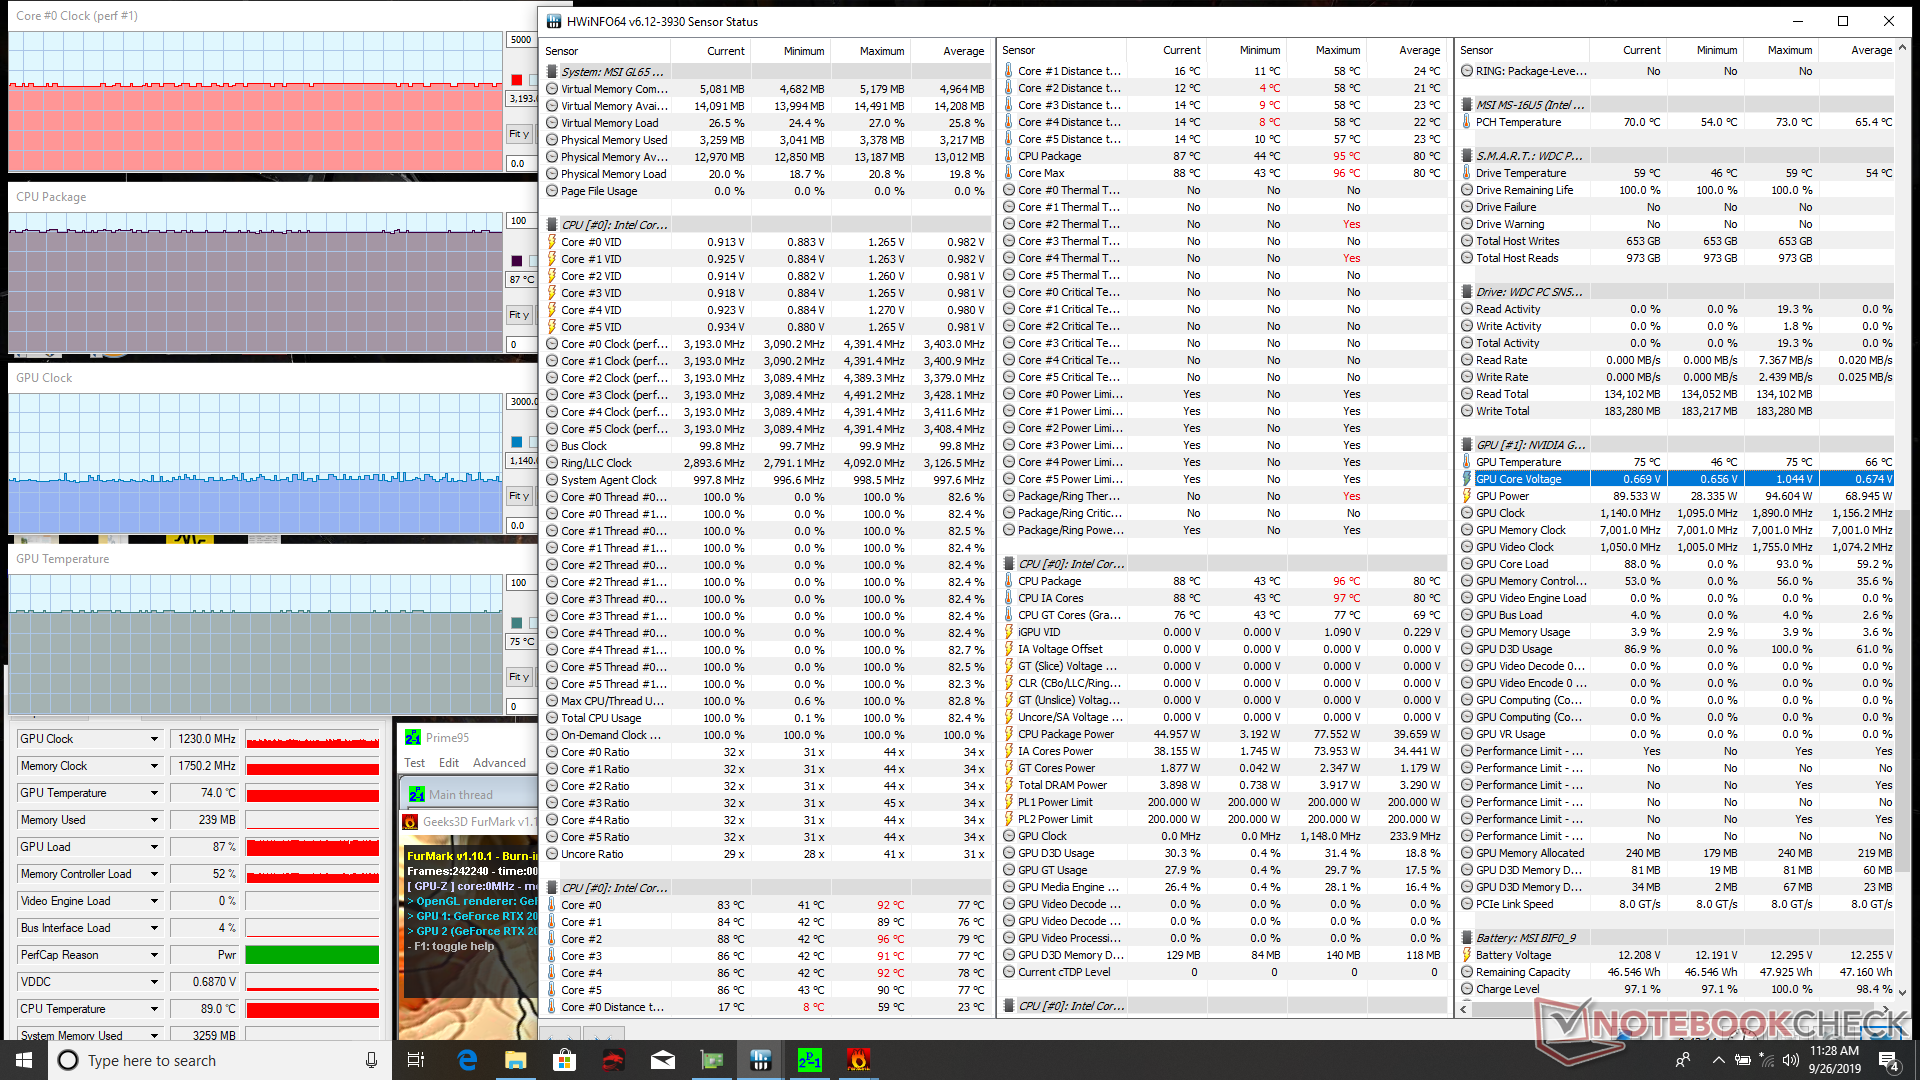
A strange bug we encountered was that the laptop would not recognize the AC adapter when both Prime95 and FurMark are initiated simultaneously even though the AC adapter is still physically connected. This would only occur when Turbo Mode is active and never during any of our real-world gaming tests.
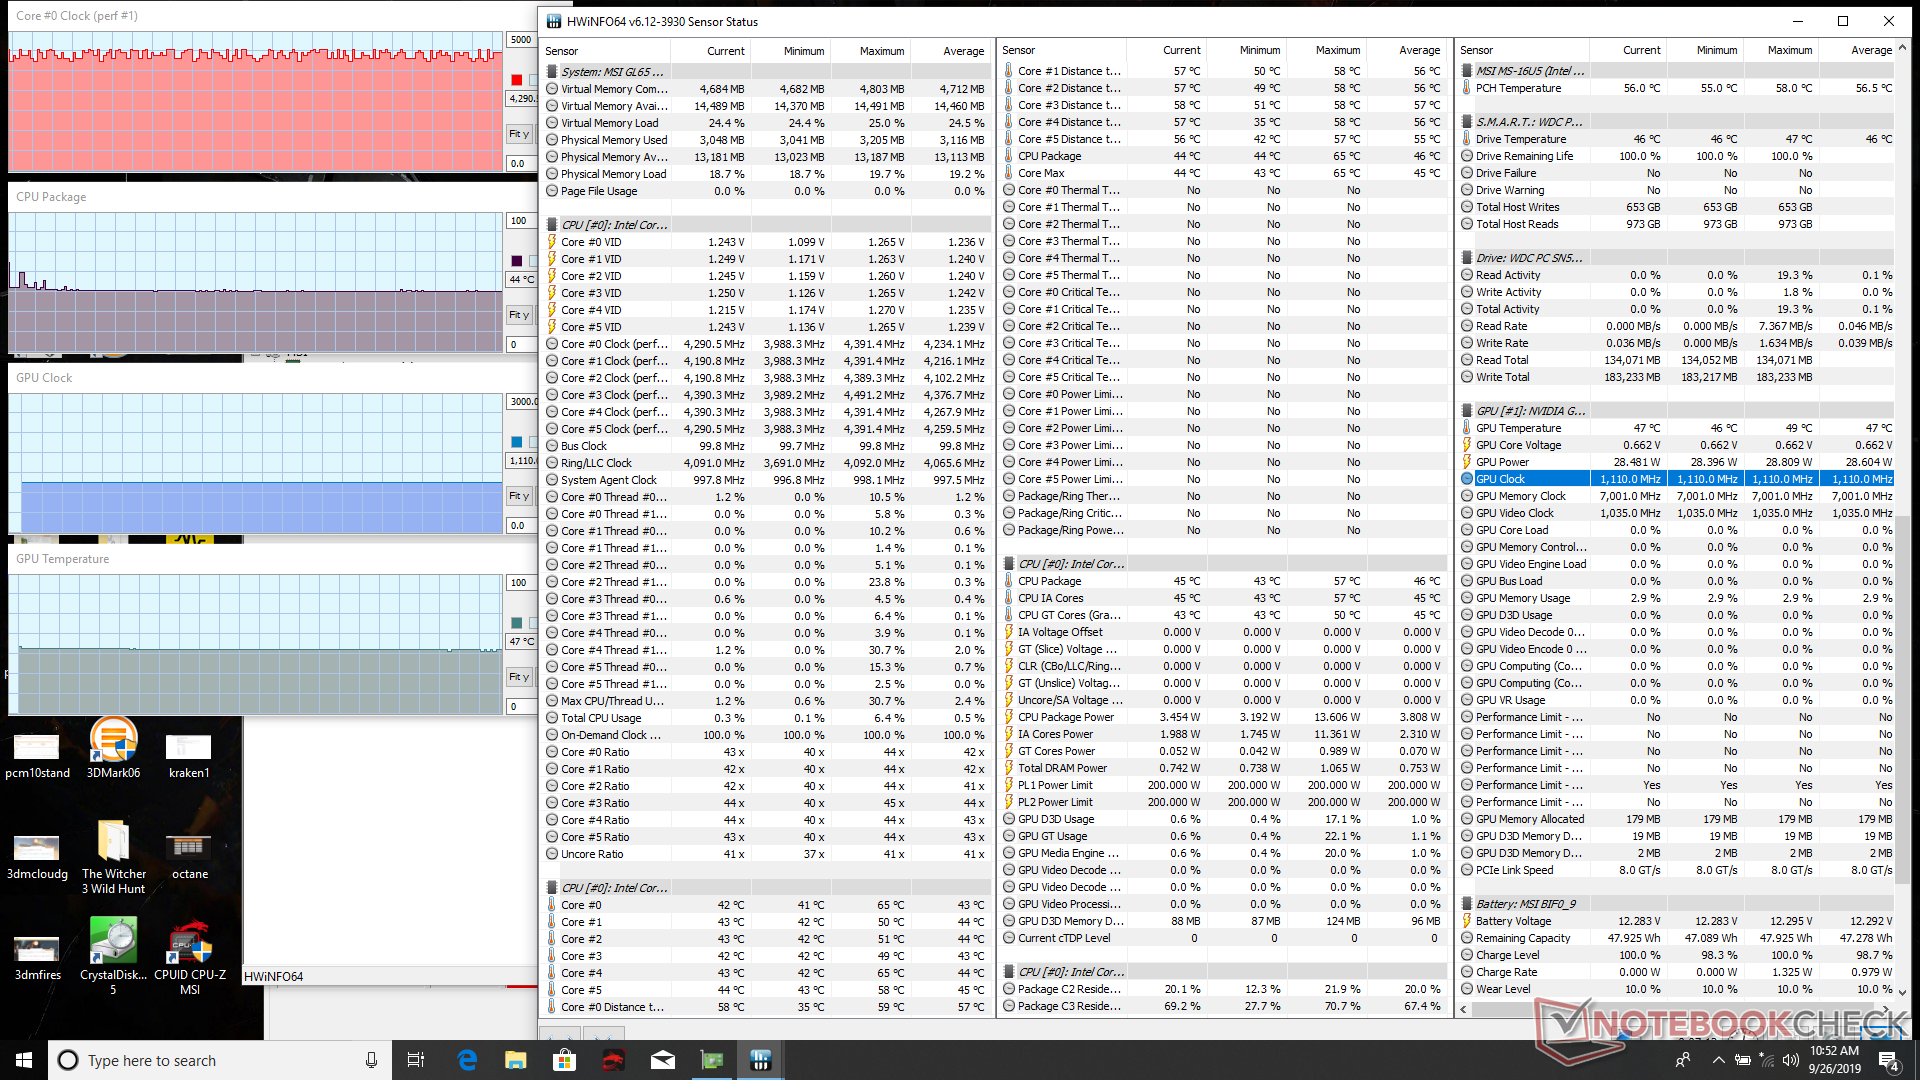
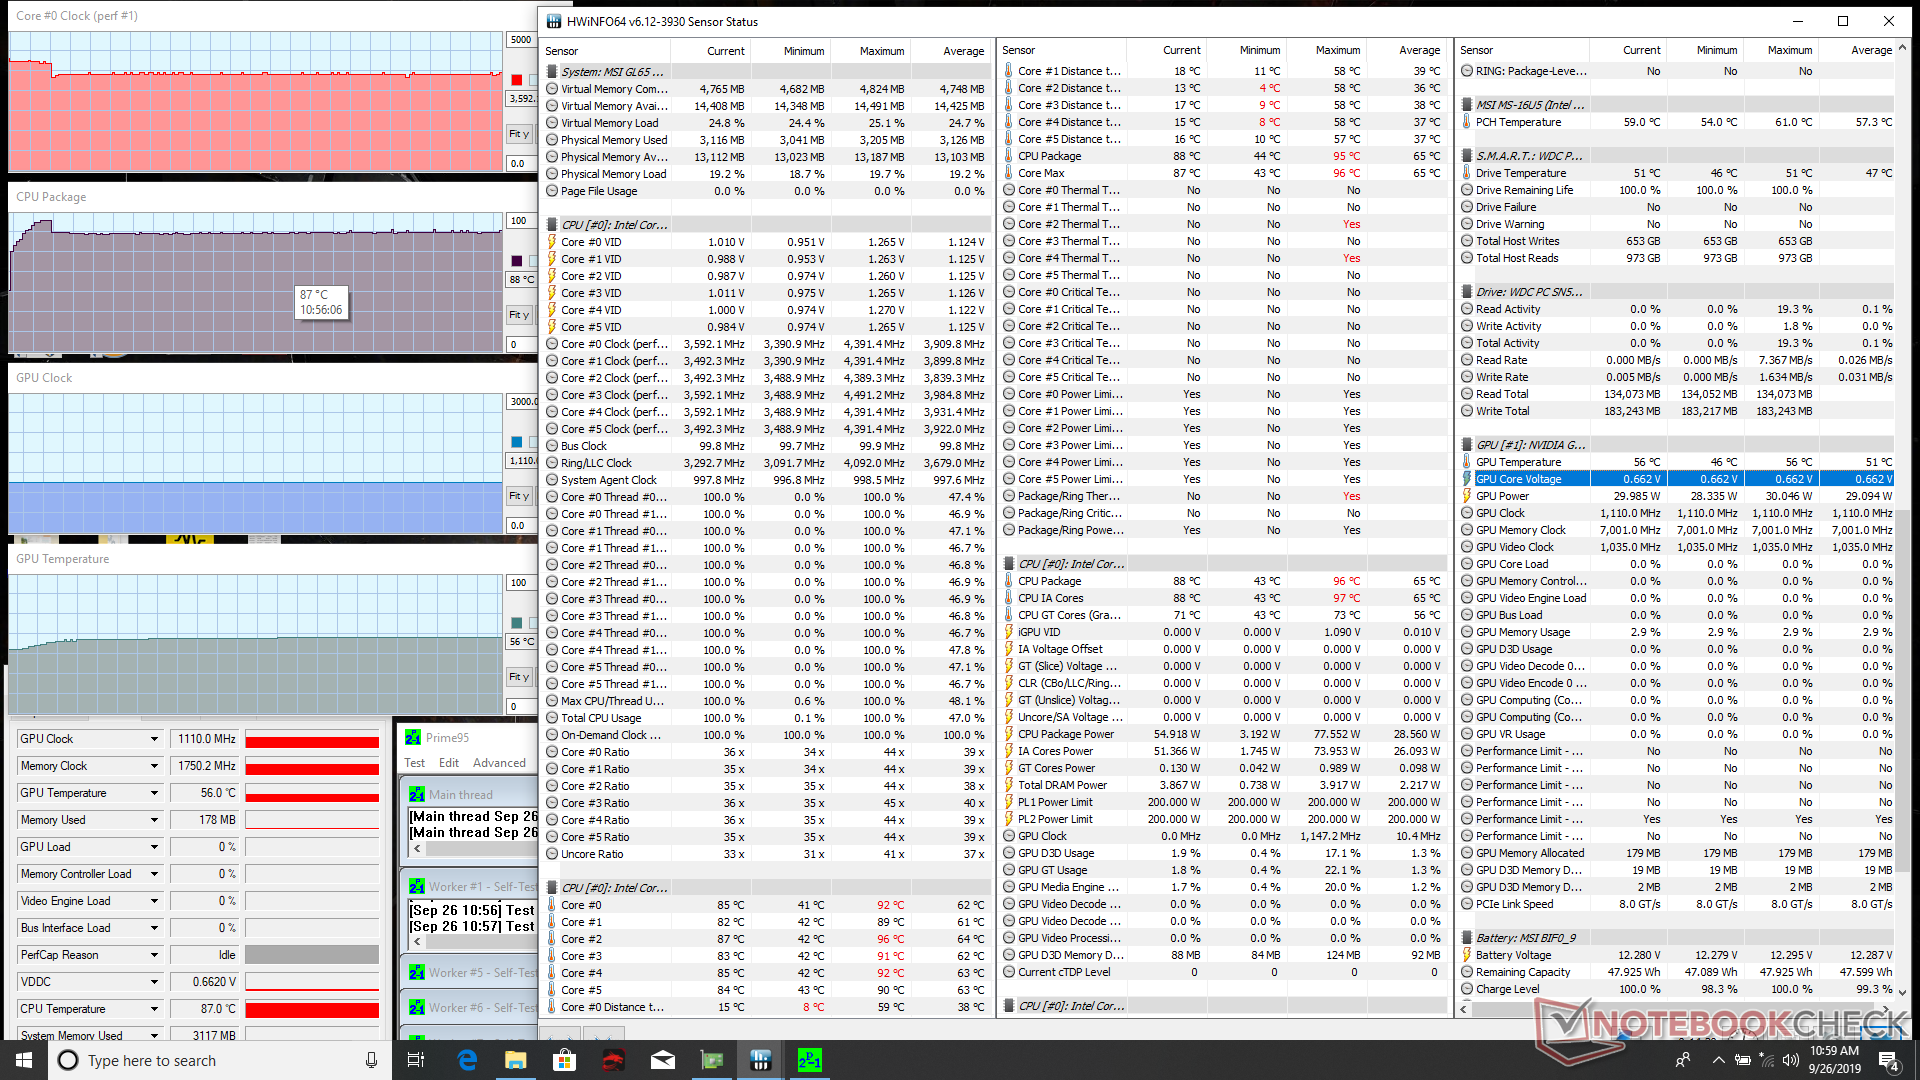
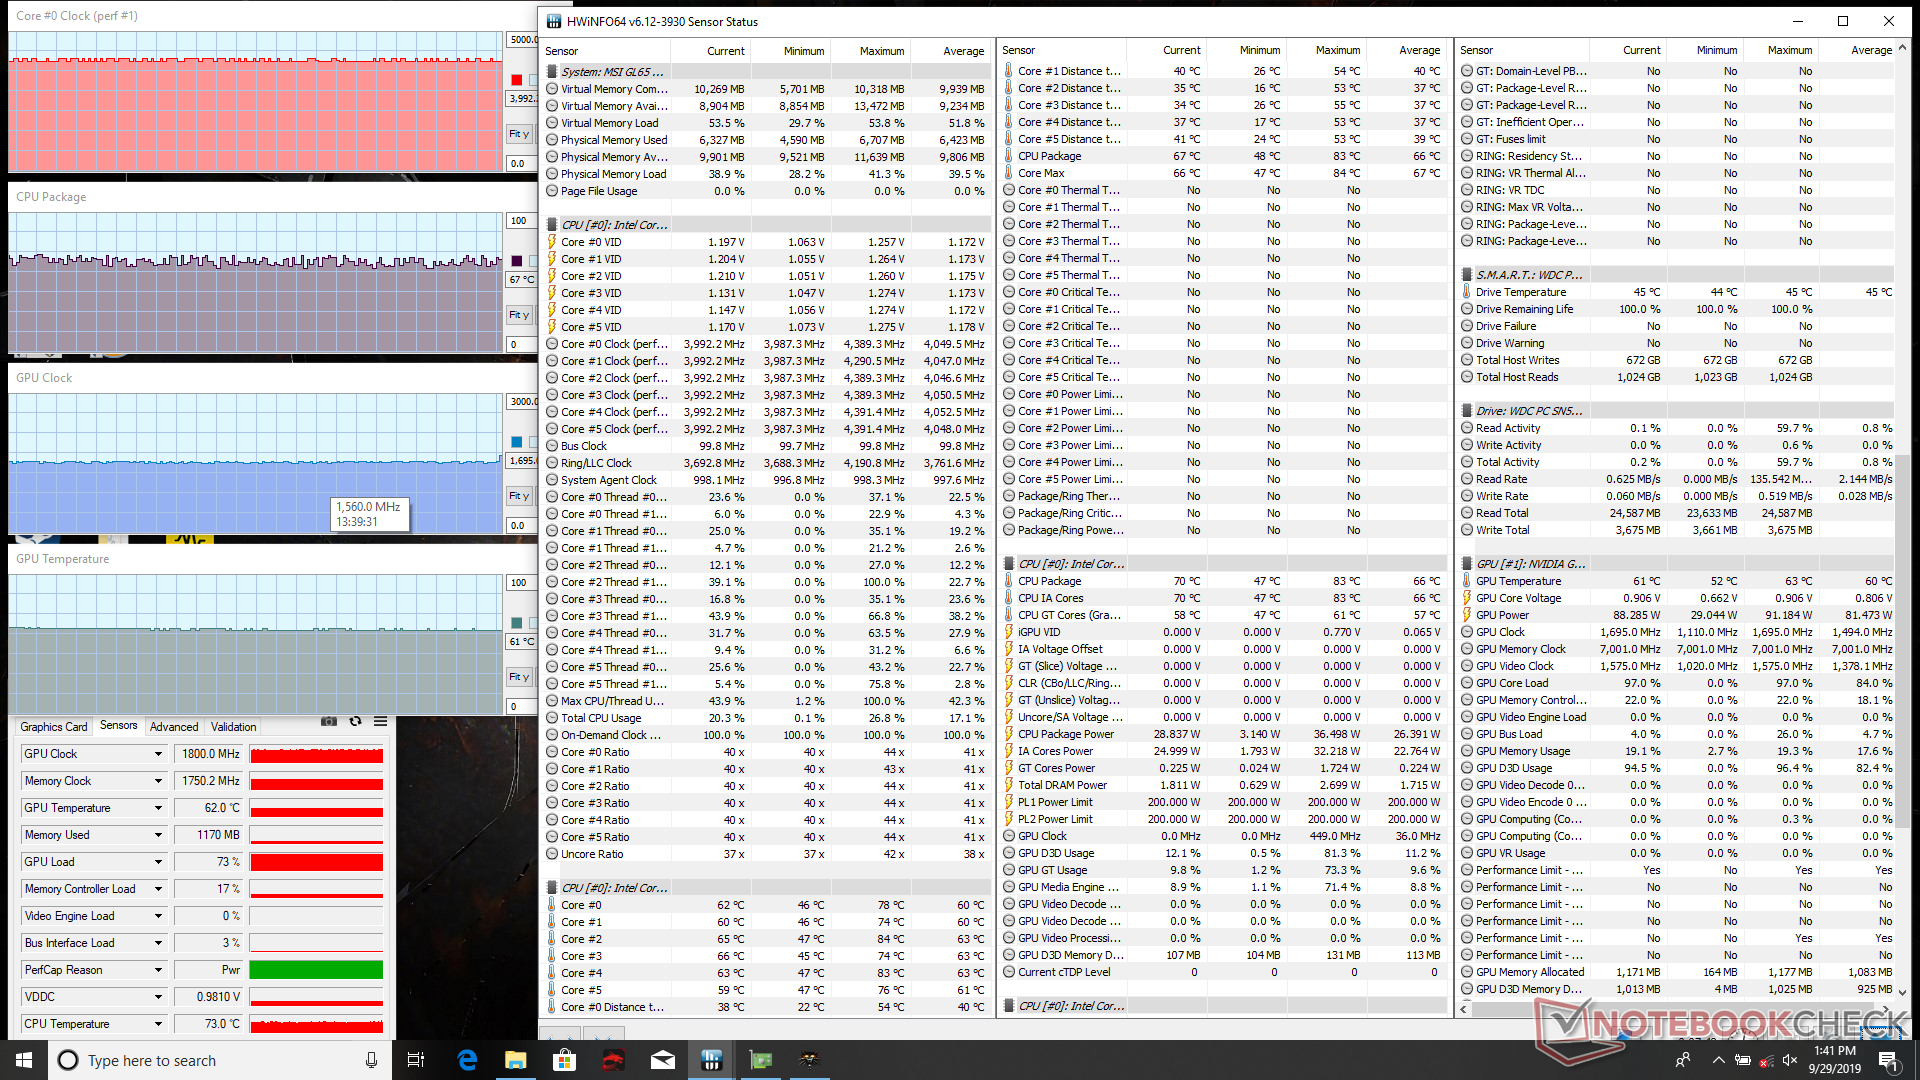
| CPU Clock (GHz) | GPU Clock (MHz) | Average CPU Temperature (°C) | Average GPU Temperature (°C) | |
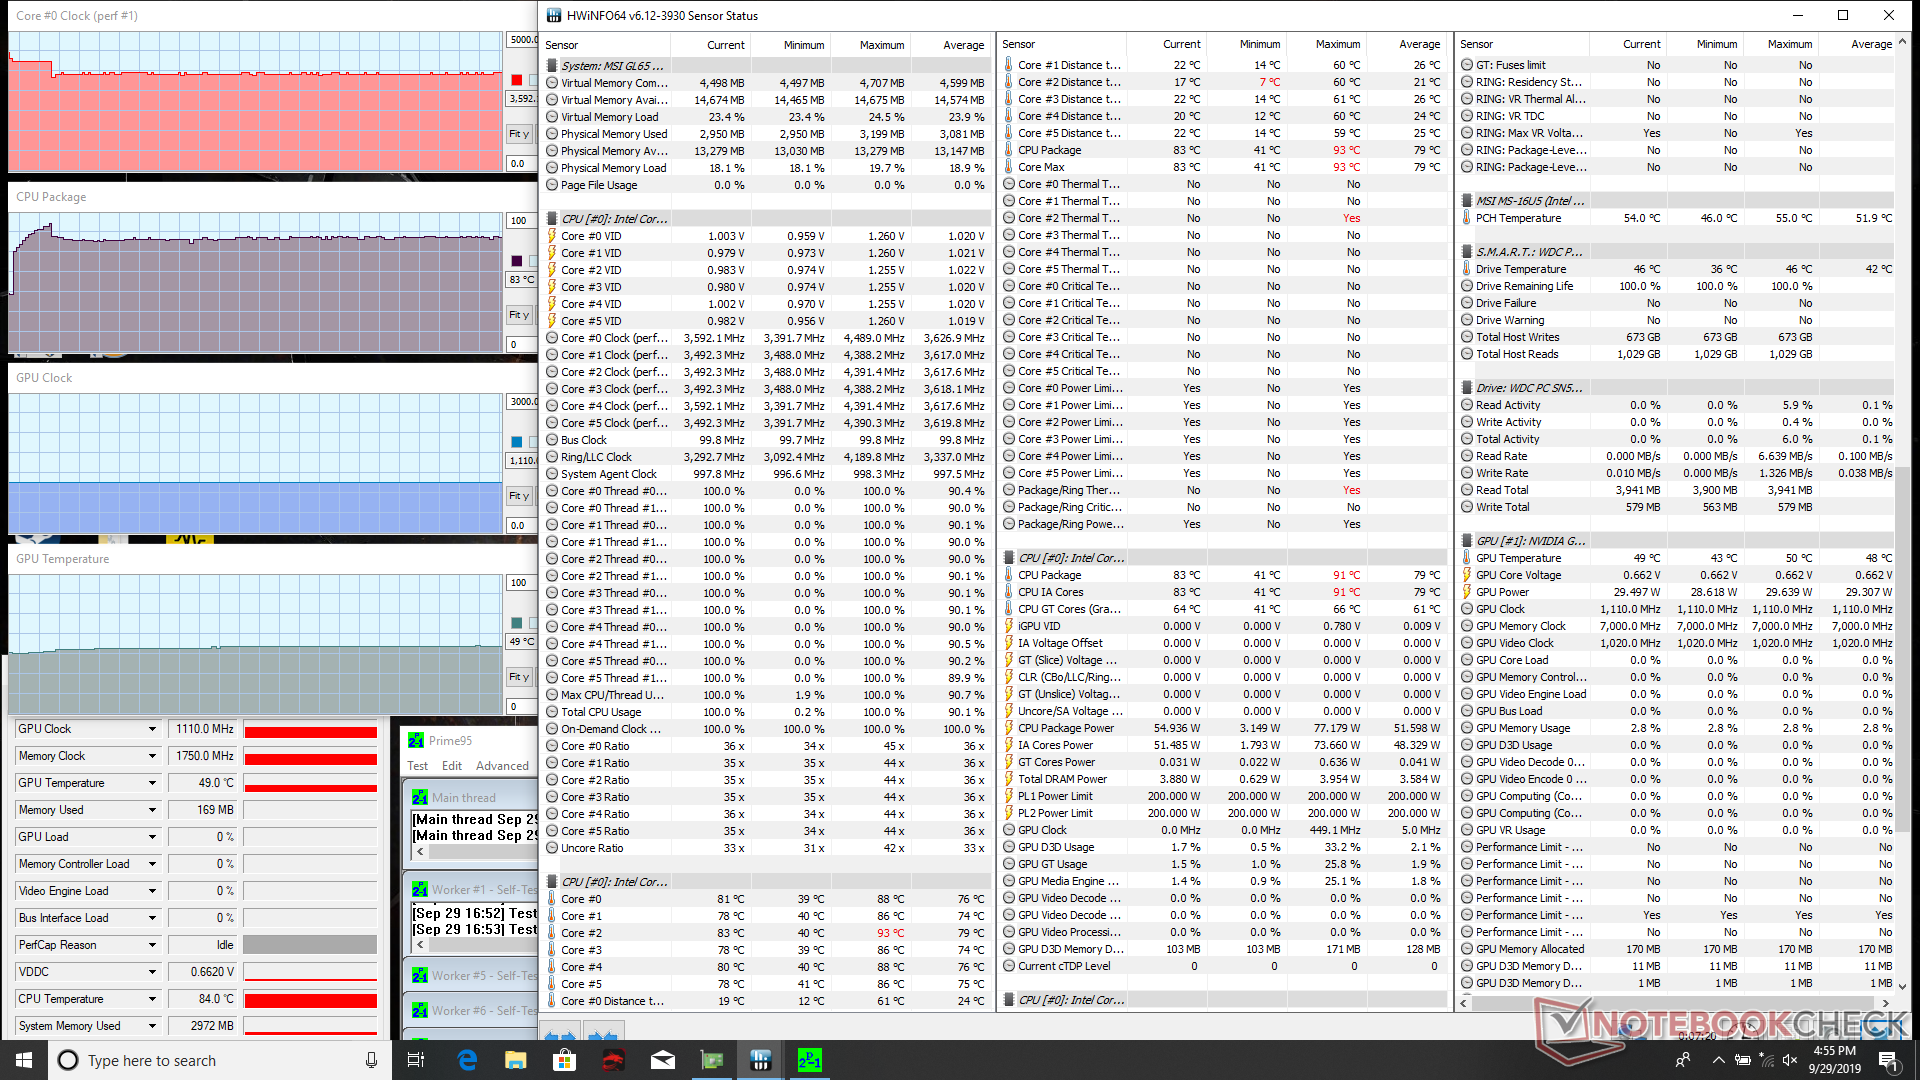
| System Idle | -- | -- | 44 | 47 |
| Prime95 Stress | 3.6 | -- | 88 | -- |
| Prime95 Stress (Turbo Fan) | 3.6 | -- | 83 | -- |
| Prime95 + FurMark Stress | 3.1 - 3.2 | ~1140 | 87 | 75 |
| Witcher 3 Stress | 4.0 - 4.1 | 1530 | ~80 | 72 |
Speakers
Unlike the 3 W stereo speakers on the 17.3-inch GL75, the 15.6-inch GL65 uses 2 W speakers instead. Volume is fairly loud but also severely lacking in bass reproduction. Bass roll-off begins at almost 1k Hz compared to 500 Hz or 250 Hz on other multimedia laptops like the HP Spectre x360 15. On the other hand, there are no vibrations on the palm rest when set to maximum volume likely because bass is already so poor. We expected more from a dedicated 15.6-inch gaming laptop.

MSI GL65 9SEK audio analysis
(+) | speakers can play relatively loud (85.3 dB)
Bass 100 - 315 Hz
(-) | nearly no bass - on average 25.1% lower than median
(±) | linearity of bass is average (9.9% delta to prev. frequency)
Mids 400 - 2000 Hz
(±) | higher mids - on average 5.8% higher than median
(±) | linearity of mids is average (9.8% delta to prev. frequency)
Highs 2 - 16 kHz
(+) | balanced highs - only 4.1% away from median
(±) | linearity of highs is average (11.7% delta to prev. frequency)
Overall 100 - 16.000 Hz
(±) | linearity of overall sound is average (25.4% difference to median)
Compared to same class
» 91% of all tested devices in this class were better, 2% similar, 7% worse
» The best had a delta of 6%, average was 18%, worst was 132%
Compared to all devices tested
» 78% of all tested devices were better, 5% similar, 17% worse
» The best had a delta of 4%, average was 23%, worst was 134%
Apple MacBook 12 (Early 2016) 1.1 GHz audio analysis
(+) | speakers can play relatively loud (83.6 dB)
Bass 100 - 315 Hz
(±) | reduced bass - on average 11.3% lower than median
(±) | linearity of bass is average (14.2% delta to prev. frequency)
Mids 400 - 2000 Hz
(+) | balanced mids - only 2.4% away from median
(+) | mids are linear (5.5% delta to prev. frequency)
Highs 2 - 16 kHz
(+) | balanced highs - only 2% away from median
(+) | highs are linear (4.5% delta to prev. frequency)
Overall 100 - 16.000 Hz
(+) | overall sound is linear (10.2% difference to median)
Compared to same class
» 7% of all tested devices in this class were better, 2% similar, 90% worse
» The best had a delta of 5%, average was 18%, worst was 53%
Compared to all devices tested
» 5% of all tested devices were better, 1% similar, 94% worse
» The best had a delta of 4%, average was 23%, worst was 134%
Energy Management
Power Consumption
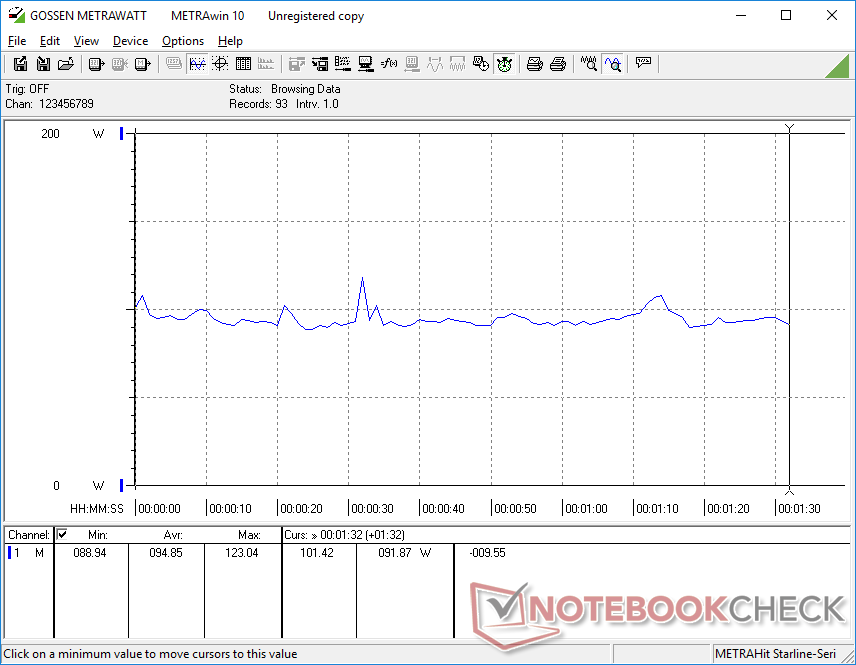
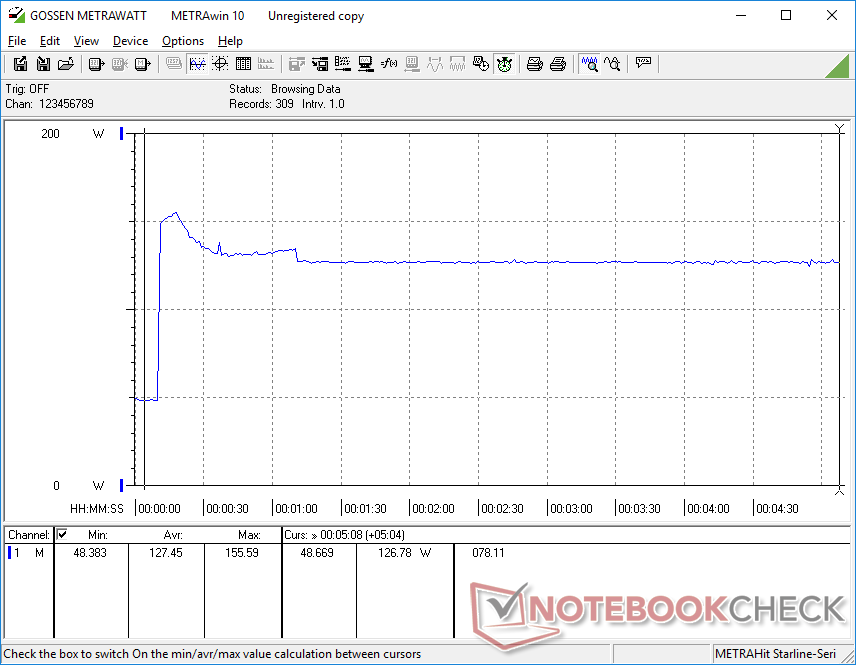
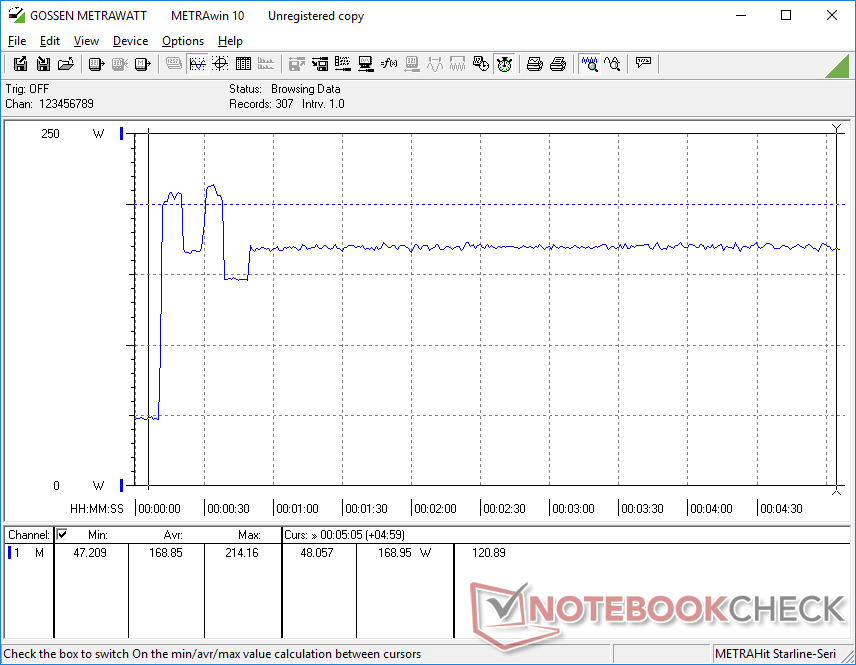
Consumption when idling is very high at 41 W to 47 W compared to just 7 W to 11 W on the older GL63. We disabled wireless and made sure all Windows Updates were complete but our results did not change. MSI may want to double-check some of its background activity or software behavior to get to the bottom of the high consumption rates.
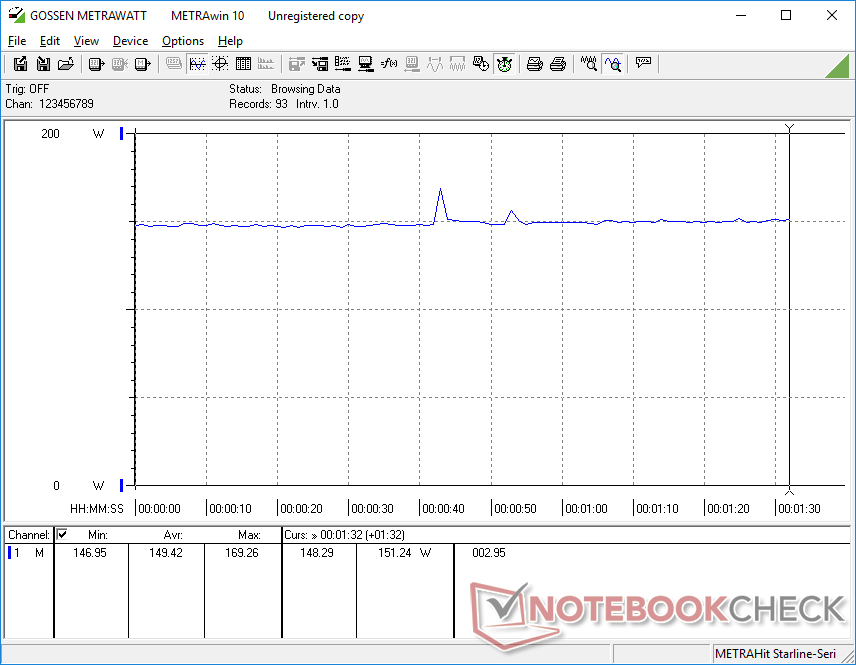
Consumption when gaming is otherwise normal. When running Witcher 3, the GL65 pulls in a steady 149 W to be very similar to the GP65 equipped with the same CPU and GPU. Note that the GS65 and its RTX 2080 Max-Q consumes about the same amount even though it offers 15 to 20 percent faster gaming performance and even faster ray-tracing performance.
We're able to record a maximum consumption of 214 W from the medium-sized (~16.5 x 8 x 2.5 cm) 180 W AC adapter.
| Off / Standby | |
| Idle | |
| Load |
|
Key:
min: | |
| MSI GL65 9SEK i7-9750H, GeForce RTX 2060 Mobile, WDC PC SN520 SDAPNUW-512G, IPS, 1920x1080, 15.6" | MSI GL63 8RC-069US i5-8300H, GeForce GTX 1050 Mobile, Toshiba HG6 THNSNJ256G8NY, IPS, 1920x1080, 15.6" | MSI GS65 Stealth 9SG i7-9750H, GeForce RTX 2080 Max-Q, Samsung SSD PM981 MZVLB512HAJQ, IPS, 1920x1080, 15.6" | Gigabyte Aero 15 Classic-XA i7-9750H, GeForce RTX 2070 Max-Q, Intel SSD 760p SSDPEKKW512G8, IGZO, 1920x1080, 15.6" | MSI GP65 Leopard 9SE-225US i7-9750H, GeForce RTX 2060 Mobile, Toshiba KBG30ZMT512G, IPS, 1920x1080, 15.6" | MSI GS65 Stealth Thin 8RE-051US i7-8750H, GeForce GTX 1060 Mobile, Samsung SSD PM981 MZVLB256HAHQ, IPS, 1920x1080, 15.6" | |
|---|---|---|---|---|---|---|
| Power Consumption | 54% | 25% | 22% | 30% | 42% | |
| Idle Minimum * (Watt) | 41 | 7.1 83% | 18.3 55% | 21 49% | 13.6 67% | 8.7 79% |
| Idle Average * (Watt) | 45.3 | 9.8 78% | 22 51% | 23 49% | 17.9 60% | 13 71% |
| Idle Maximum * (Watt) | 47.1 | 10.4 78% | 28.8 39% | 32 32% | 20.6 56% | 14.3 70% |
| Load Average * (Watt) | 94.9 | 88.8 6% | 93 2% | 97 -2% | 96 -1% | 107.4 -13% |
| Witcher 3 ultra * (Watt) | 149.4 | 93.3 38% | 142.6 5% | 148 1% | 154.6 -3% | 129 14% |
| Load Maximum * (Watt) | 214.2 | 132.5 38% | 215.9 -1% | 213 1% | 218.6 -2% | 151.5 29% |
* ... smaller is better
Battery Life
Runtimes are downright terrible likely due to the high power consumption values we recorded above during low processing loads. Expect just under 4 hours of real-world WLAN use even though battery capacity has increased gen-to-gen from 41 Wh to 51 Wh. Idling on Power Saver mode at the minimum display brightness with the integrated GPU enabled results in a pathetic runtime of just 4 hours and 22 minutes.
Recharging from empty to full capacity takes about 1.5 hours. Attempting to recharge the system via USB Type-C will not work.
| MSI GL65 9SEK i7-9750H, GeForce RTX 2060 Mobile, 51 Wh | MSI GL63 8RC-069US i5-8300H, GeForce GTX 1050 Mobile, 41 Wh | MSI GS65 Stealth 9SG i7-9750H, GeForce RTX 2080 Max-Q, 82 Wh | Gigabyte Aero 15 Classic-XA i7-9750H, GeForce RTX 2070 Max-Q, 94.24 Wh | Asus Zephyrus S GX531GX i7-8750H, GeForce RTX 2080 Max-Q, 50 Wh | Alienware m15 R2 P87F i7-9750H, GeForce RTX 2080 Max-Q, 76 Wh | |
|---|---|---|---|---|---|---|
| Battery runtime | 16% | 58% | 130% | -21% | 41% | |
| Reader / Idle (h) | 4.4 | 7.3 66% | 9.1 107% | 9.2 109% | ||
| WiFi v1.3 (h) | 3.8 | 4.3 13% | 6 58% | 7 84% | 3 -21% | 5.5 45% |
| Load (h) | 1 | 0.7 -30% | 3 200% | 0.7 -30% |
Pros
Cons
Verdict

The biggest and most notable improvement that the GL65 offers over the GL63 is its smaller and more portable chassis design. It's approximately 16 percent smaller than its predecessor while offering upgraded processor options for a tangible performance boost.
Everything else about the GL65 remains almost the same as the GL63. MSI had the chance to improve the display or poor battery life, integrate quieter fans, or offer a faster SD card reader but they are all nearly unchanged gen-to-gen. You'd have to invest in the higher-end GS65 series if such features are important to your daily workloads.
Mid-range gaming machine with great looks and performance but with cut corners on battery life, and display. You'll be sacrificing long runtimes and accurate colors with the MSI GL65.
MSI GL65 9SEK
- 10/02/2019 v7 (old)
Allen Ngo
Price comparison
