Eurocom Nightsky RX15 (Clevo PB51RF, Core i9, 4K OLED) Laptop Review
")
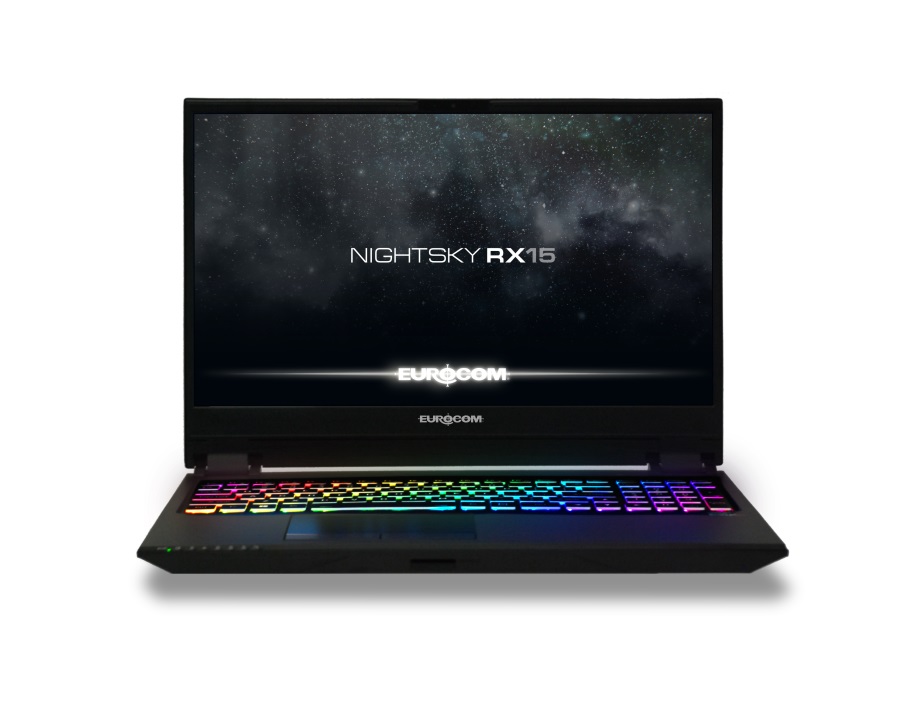
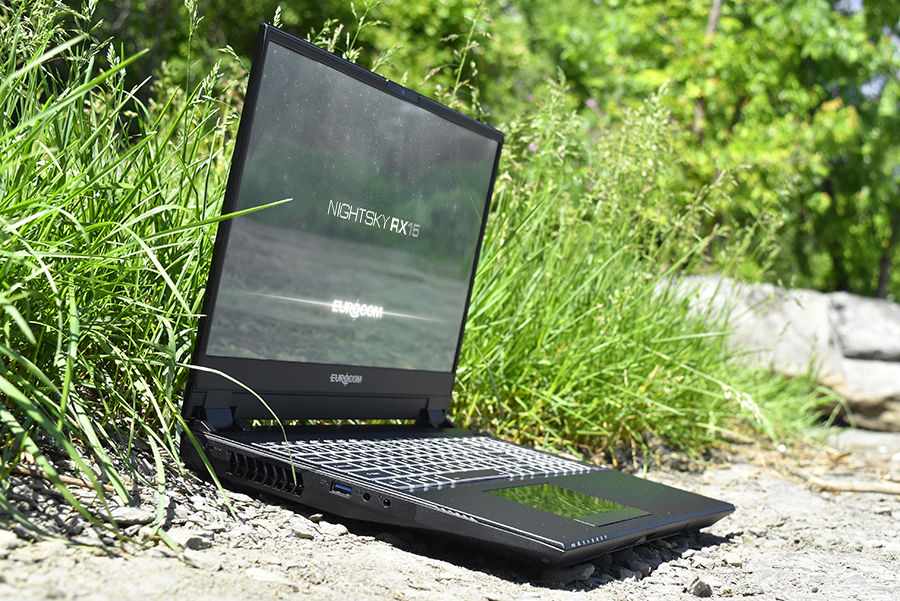
In contrast to the larger Eurocom Sky series of desktop replacements, the Eurocom Nightsky series consists of more traditional gaming laptops with many features users have come to expect from a high-end offering including per-key RGB lighting, narrow bezels, and GeForce RTX graphics. Our test unit today is the highest-end configuration of the 15.6-inch Nightsky RX15 equipped with an unlocked Core i9-9980HK CPU, 4K UHD OLED display, and GeForce RTX 2070 graphics.
The Nightsky RX15 Clevo PB51RF chassis is identical to the Nightsky Ti15 and so we recommend checking out our existing review on the Nightsky Ti15 here to learn more about its port options, serviceability, keyboard, speakers, and other physical features. For this review, we'll be focusing on the performance and OLED display of the Nightsky RX15 to see how they compare to the base Nightsky Ti15 configuration. Direct competitors in this space include other mid-size 15.6-inch gaming laptops like the Lenovo Legion Y740, Dell Alienware m15, Asus ROG GL531, and HP Omen 15.
See the product page of the Nightsky RX15 here for the full configuration options and price range.
More Eurocom reviews:
Case
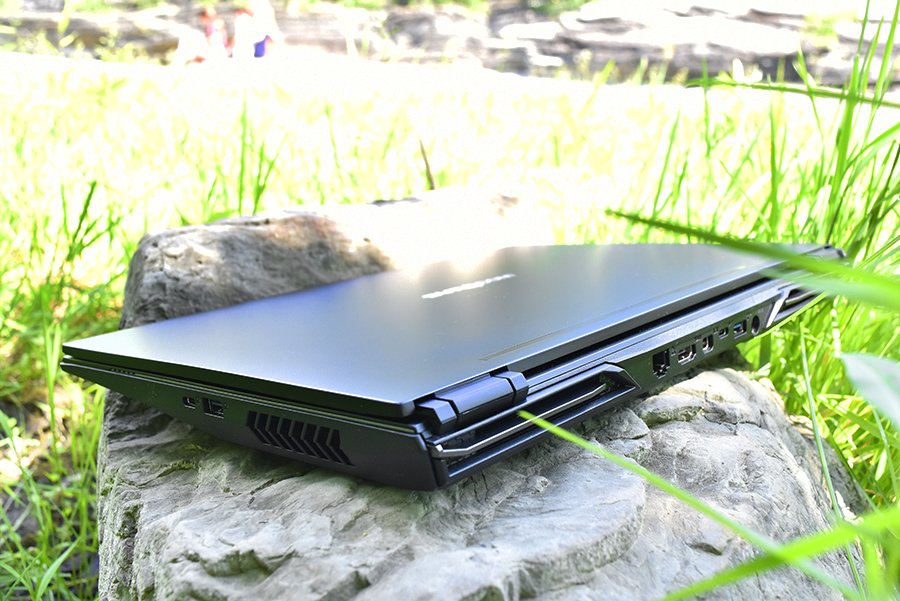
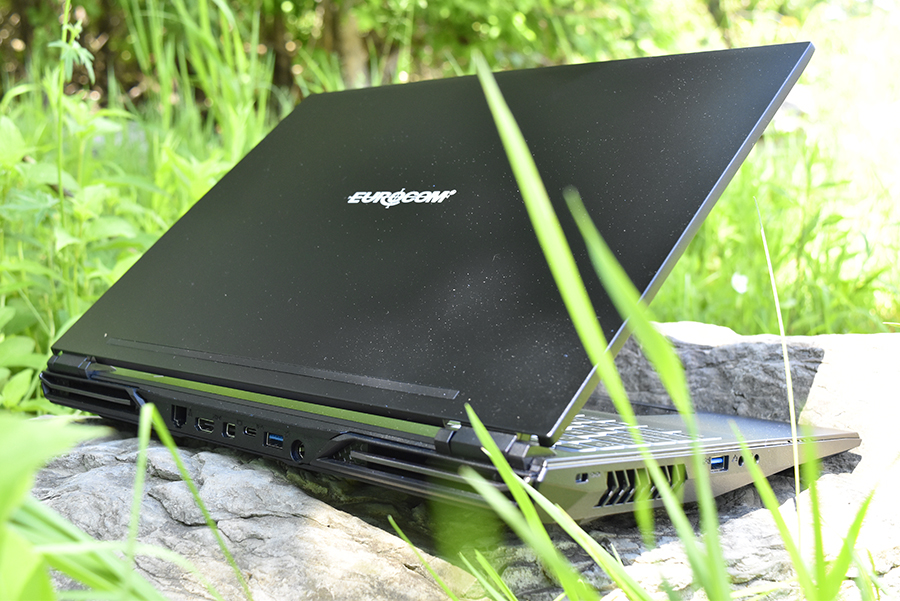
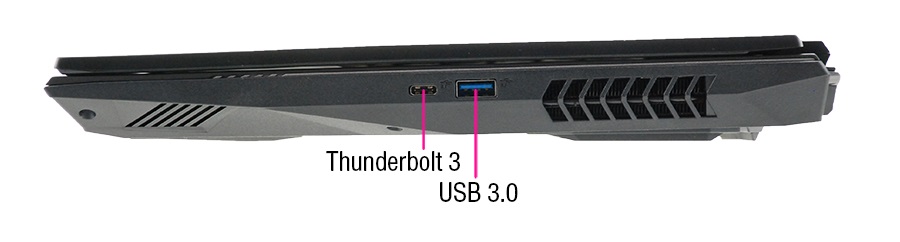
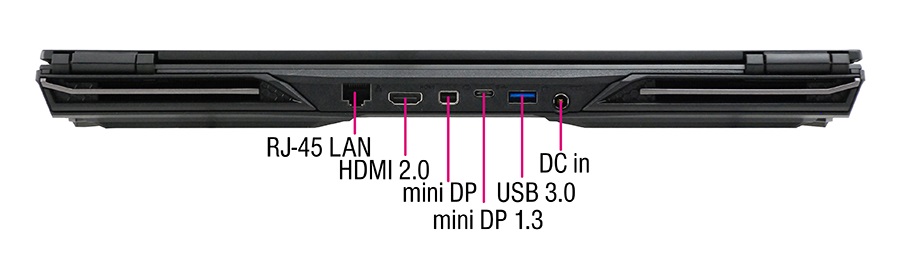
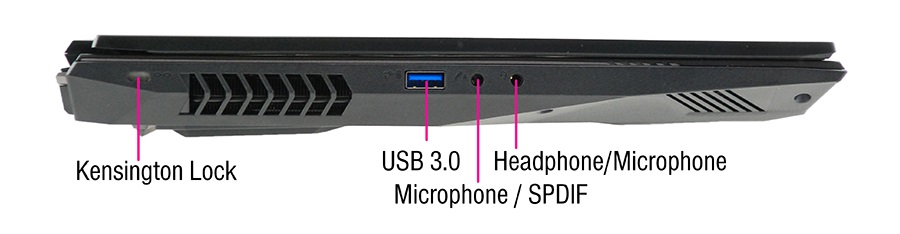
Connectivity
SD Card Reader
| SD Card Reader | |
| average JPG Copy Test (av. of 3 runs) | |
| Eurocom Sky X4C (Toshiba Exceria Pro SDXC 64 GB UHS-II) | |
| Eurocom Nightsky RX15 (Toshiba Exceria Pro SDXC 64 GB UHS-II) | |
| HP Omen 15-dc1303ng (Toshiba Exceria Pro SDXC 64 GB UHS-II) | |
| HP Gaming Pavilion 15-dk0009ng (Toshiba Exceria Pro SDXC 64 GB UHS-II) | |
| MSI GE63 Raider RGB 8RF-008 (Toshiba Exceria Pro SDXC 64 GB UHS-II) | |
| maximum AS SSD Seq Read Test (1GB) | |
| Eurocom Nightsky RX15 (Toshiba Exceria Pro SDXC 64 GB UHS-II) | |
| Eurocom Sky X4C (Toshiba Exceria Pro SDXC 64 GB UHS-II) | |
| HP Omen 15-dc1303ng (Toshiba Exceria Pro SDXC 64 GB UHS-II) | |
| HP Gaming Pavilion 15-dk0009ng (Toshiba Exceria Pro SDXC 64 GB UHS-II) | |
| MSI GE63 Raider RGB 8RF-008 (Toshiba Exceria Pro SDXC 64 GB UHS-II) | |
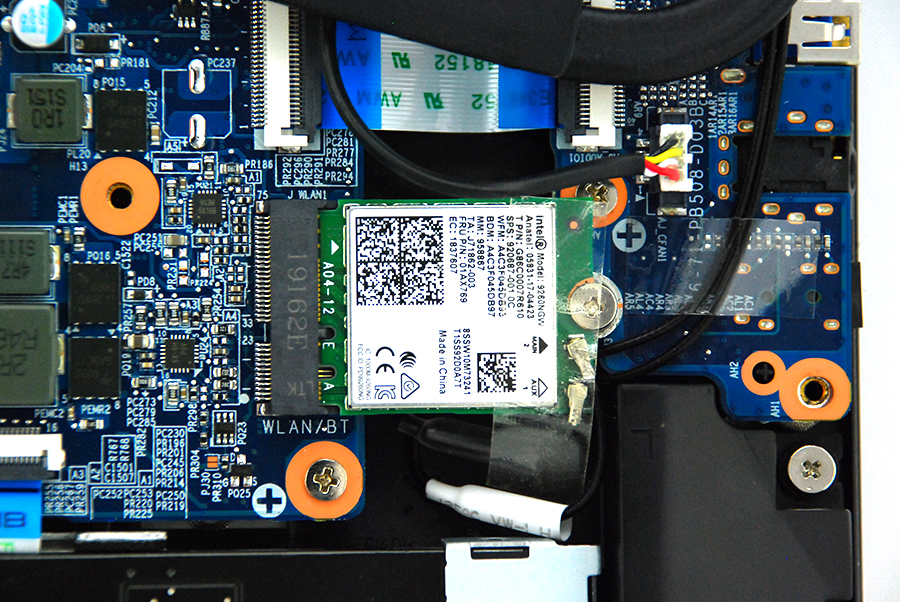
Communication
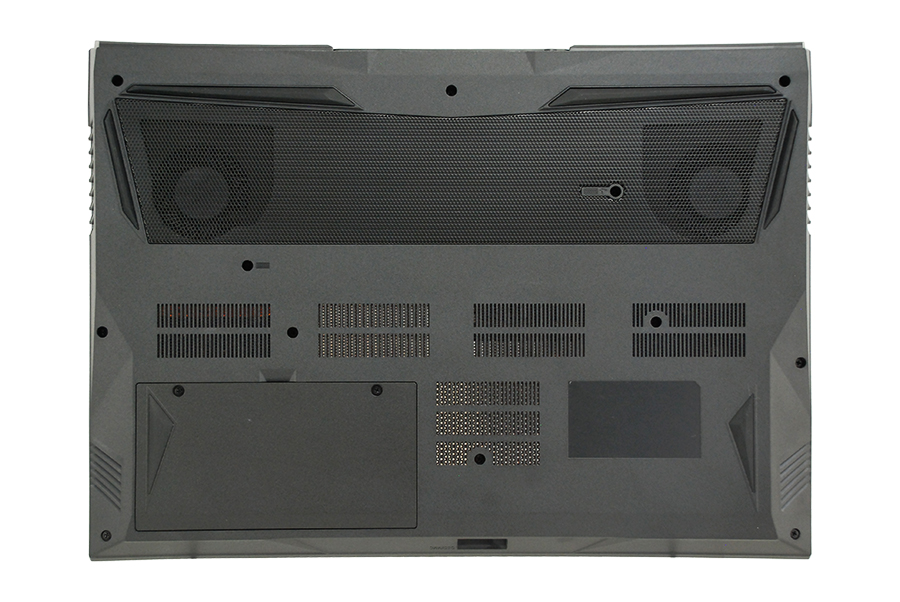
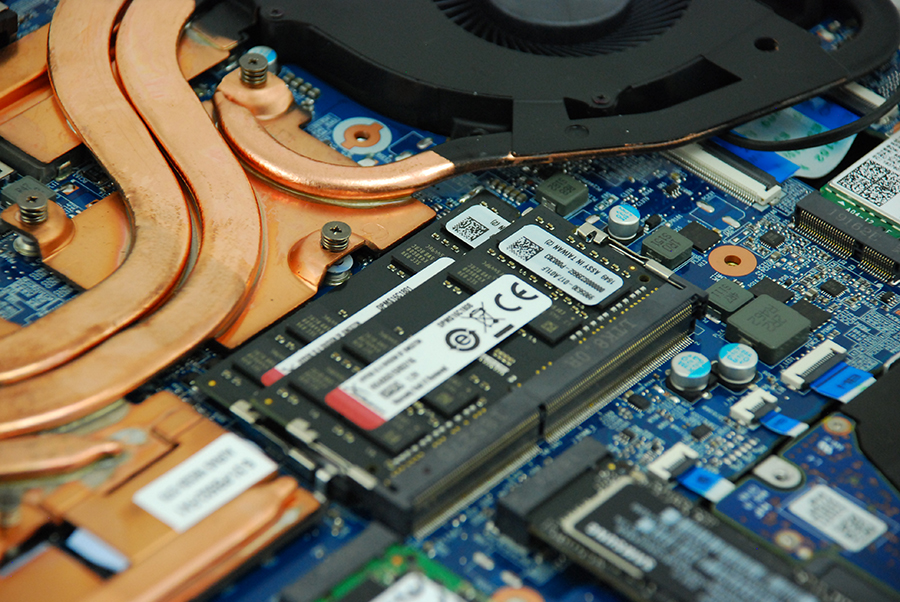
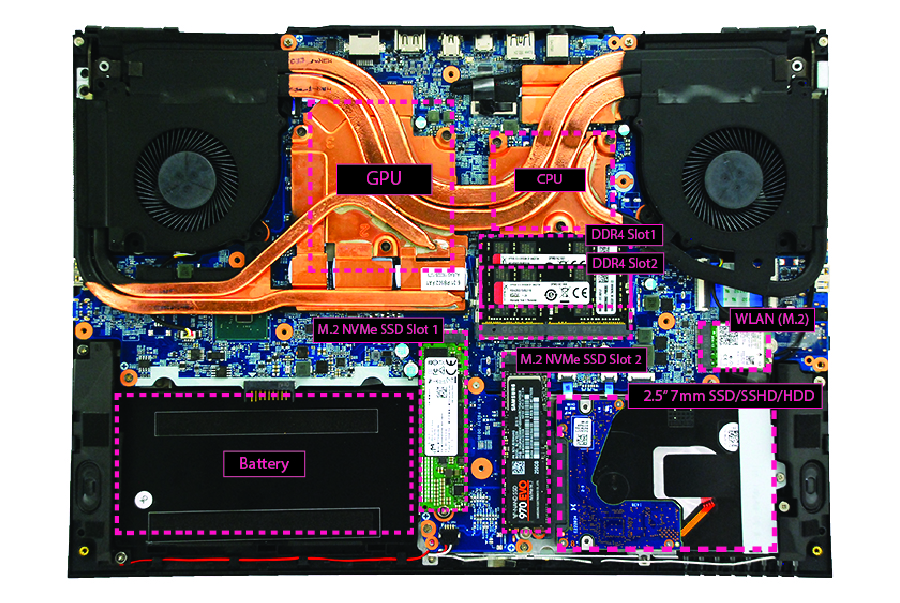
Maintenance
Display
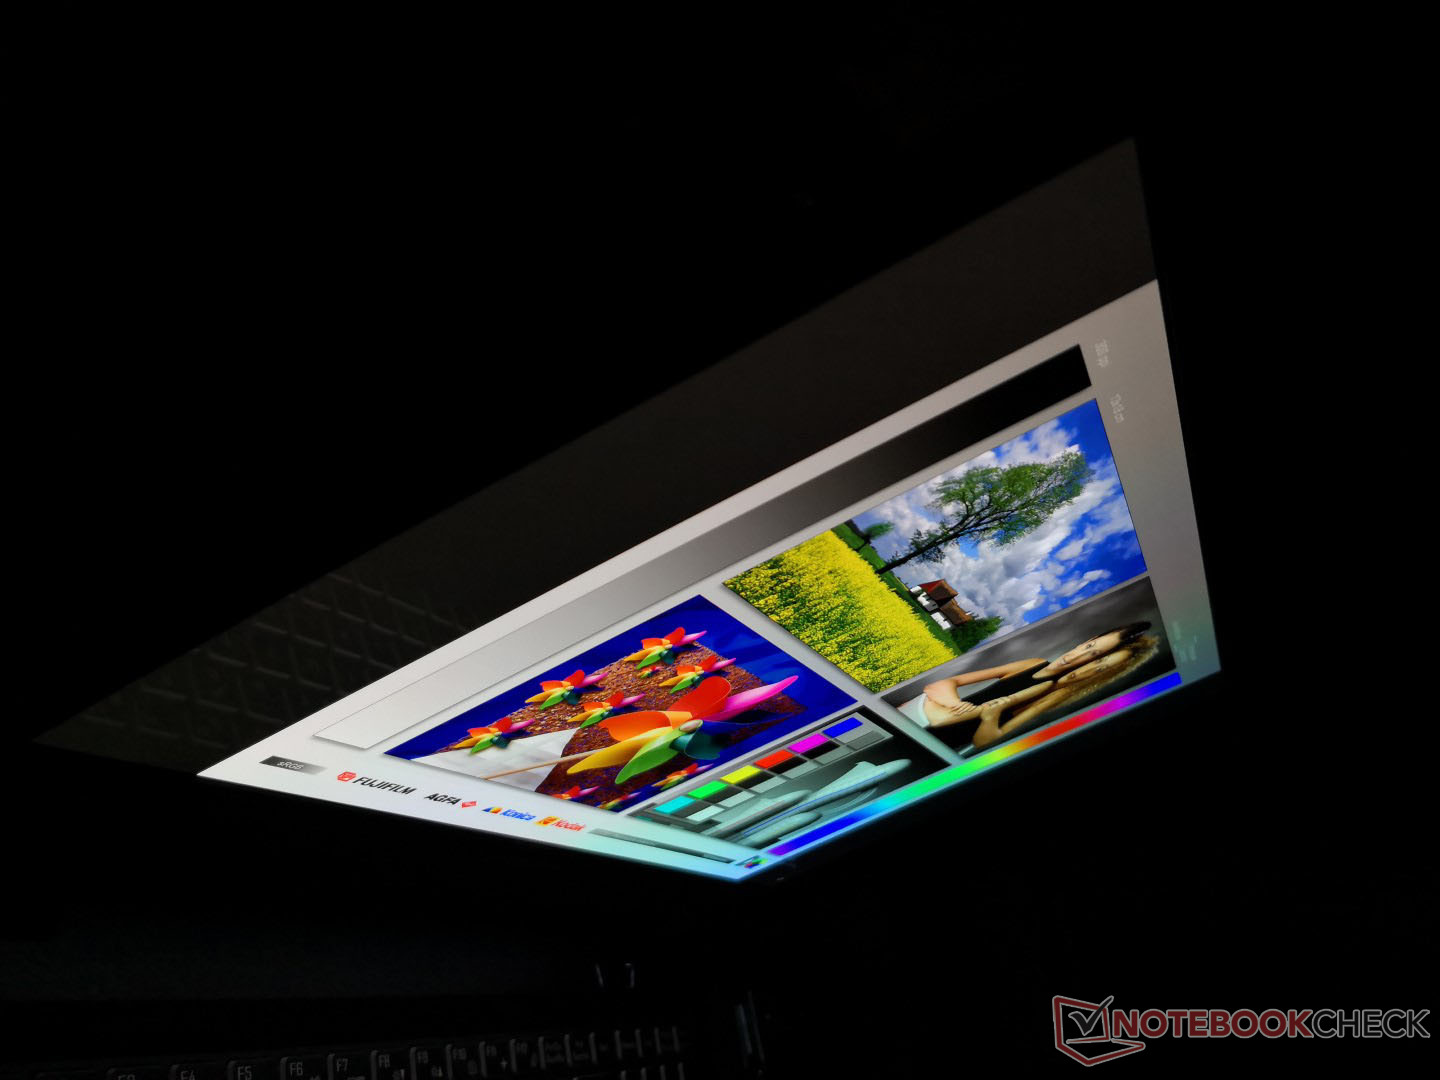
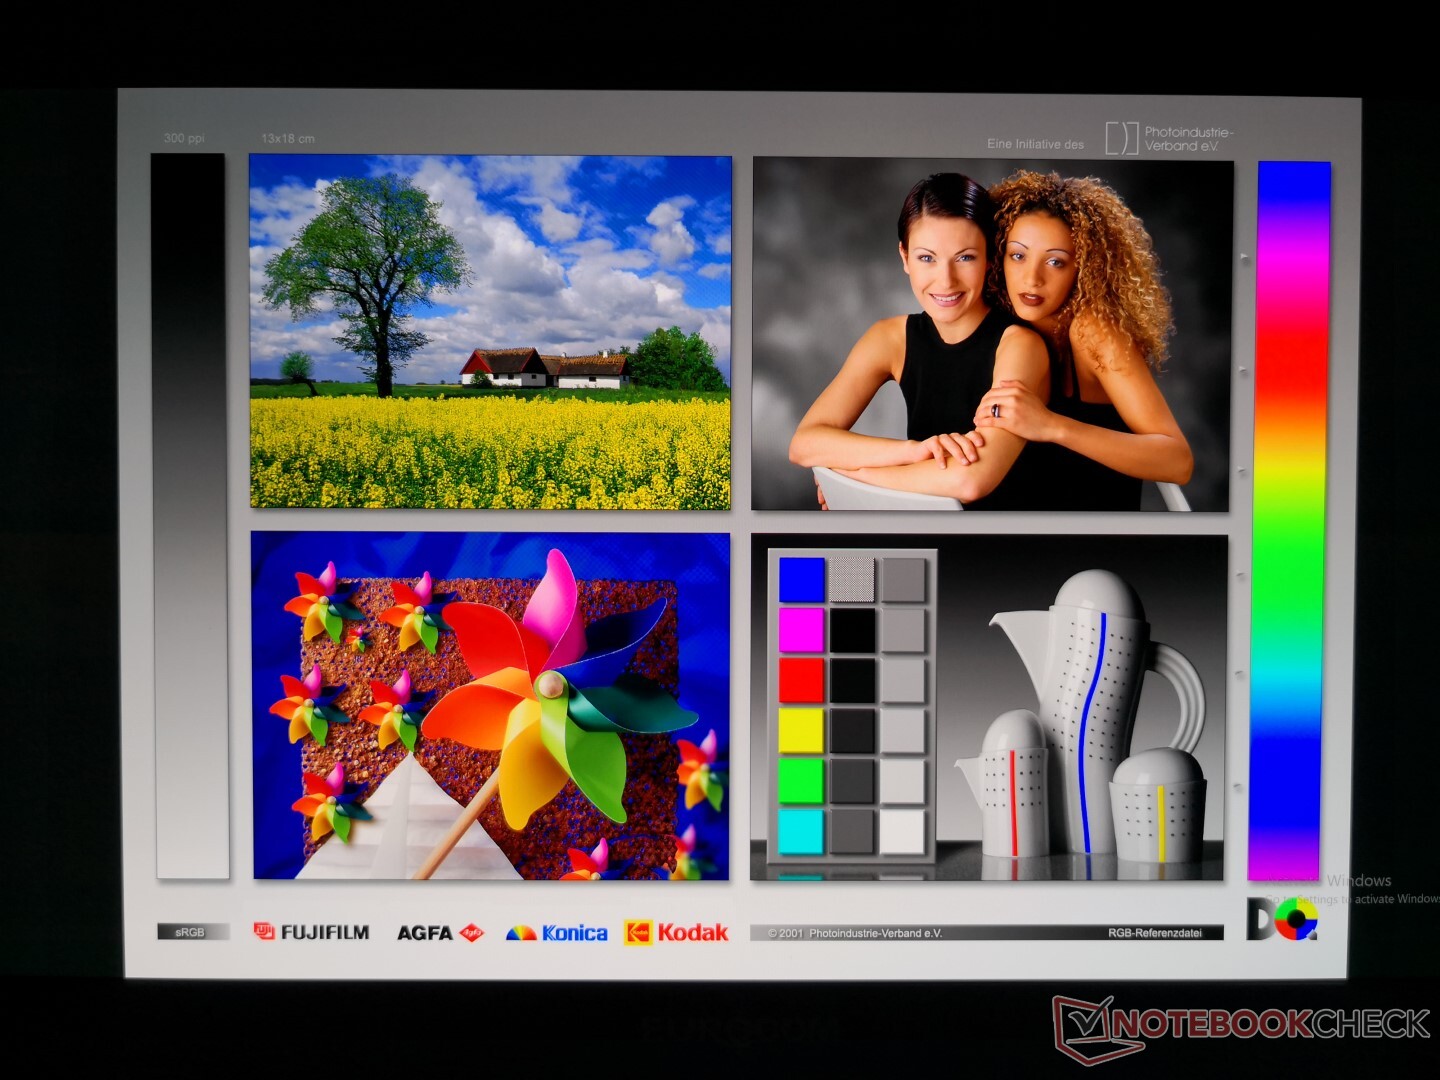
OLED offers a number of advantages - and disadvantages - when compared to the IPS option on the Nightsky series. It's 20 percent brighter with significantly deeper colors, pitch dark blacks, a higher native resolution, and almost no ghosting. Furthermore, the glossy overlay allows for crisper texts and images especially when compared to matte 4K UHD IPS panels. The result is a picture quality that is noticeably superior to even the best 15.6-inch laptop IPS panels currently in the market. The differences are perceptible to the naked eye.
A major drawback to OLED laptops at the moment is that the panel is limited to a refresh rate of only 60 Hz. The latest 144 Hz and 240 Hz IPS panels feel smoother and more responsive as a result especially when playing fast-paced games.
It's important to note that Samsung is currently the only mass market supplier of 15.6-inch 4K UHD OLED panels for laptops at the time of writing. Thus, this same Samsung SDCA029 controller or panel can also be found on the XPS 15 7590, Gigabyte Aero 15, Alienware m15, and Razer Blade 15 for very similar visual experiences between them.


| |||||||||||||||||||||||||
Brightness Distribution: 88 %
Center on Battery: 414.9 cd/m²
Contrast: ∞:1 (Black: 0 cd/m²)
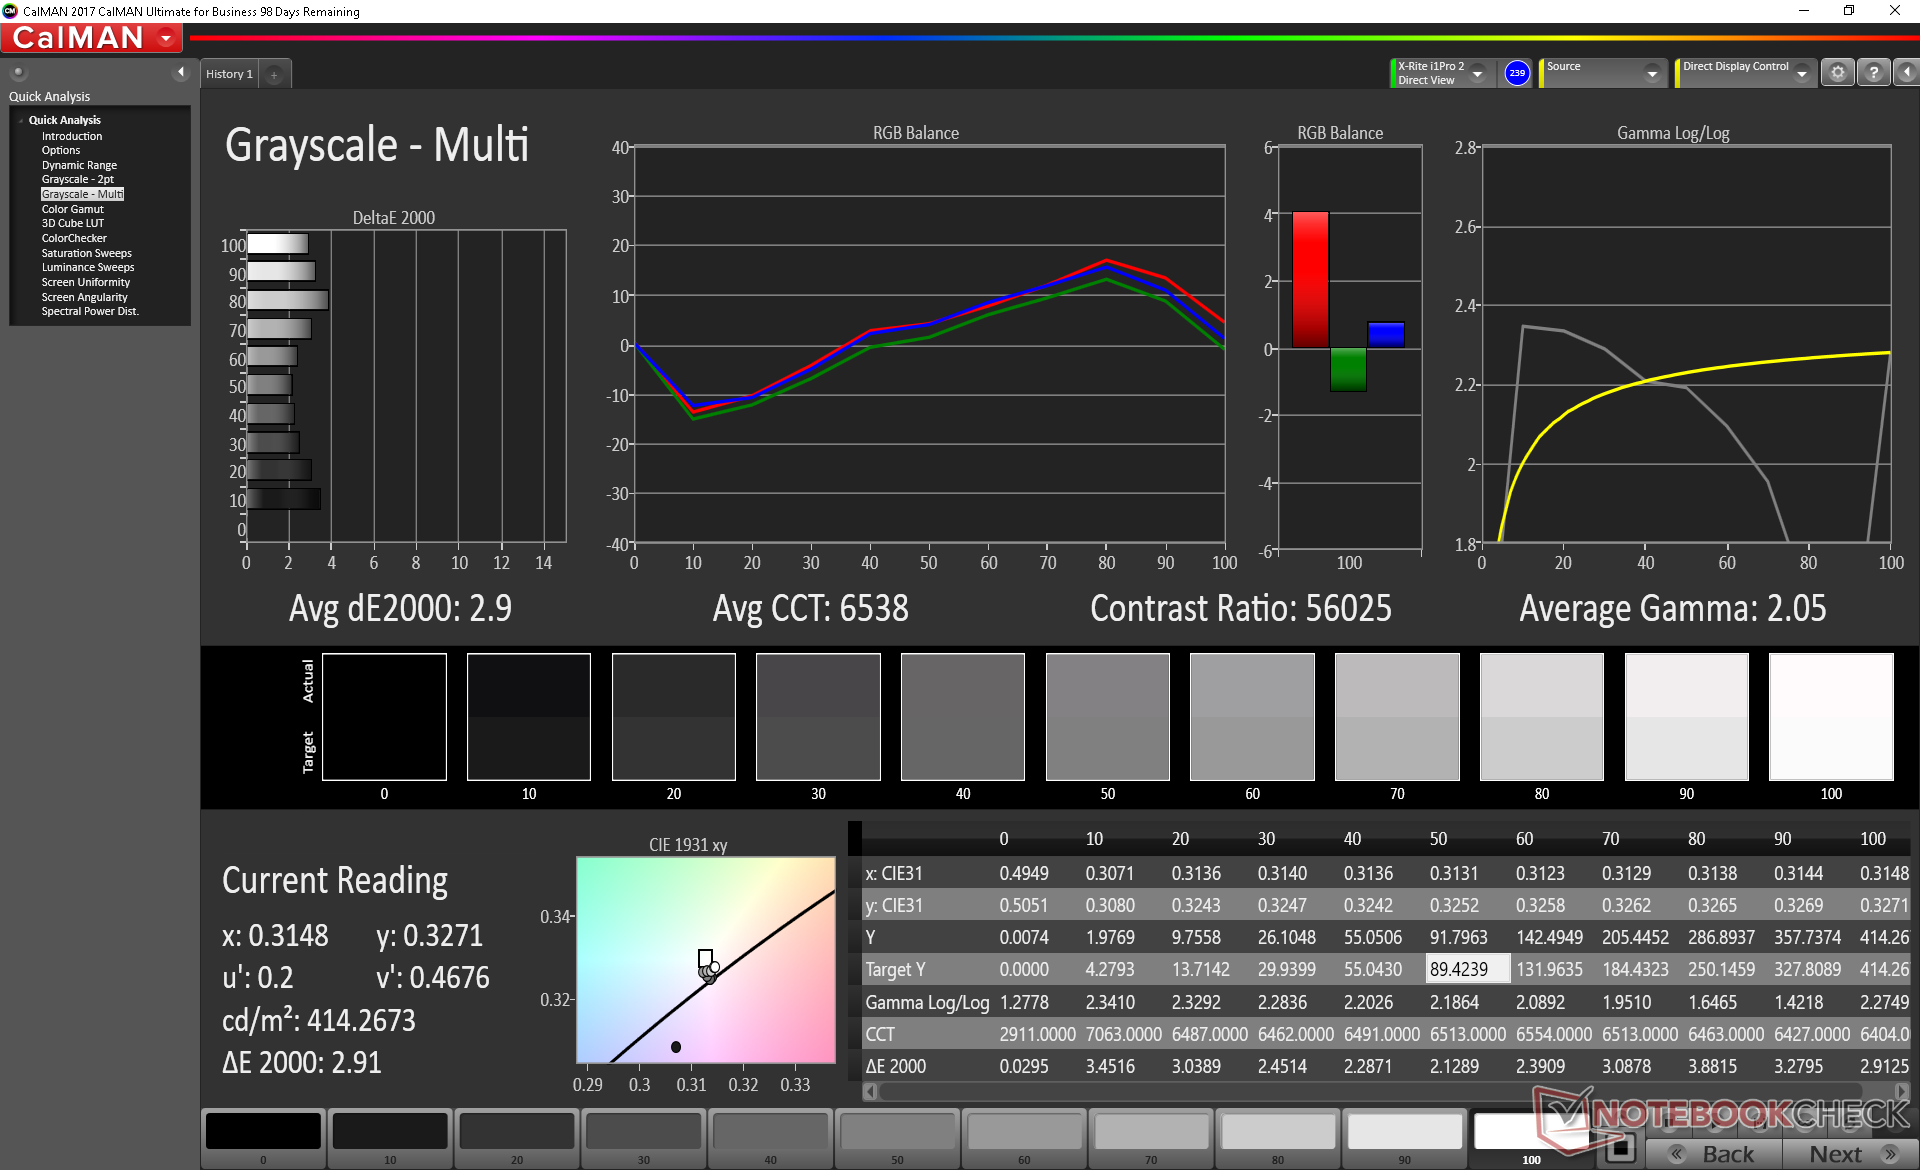
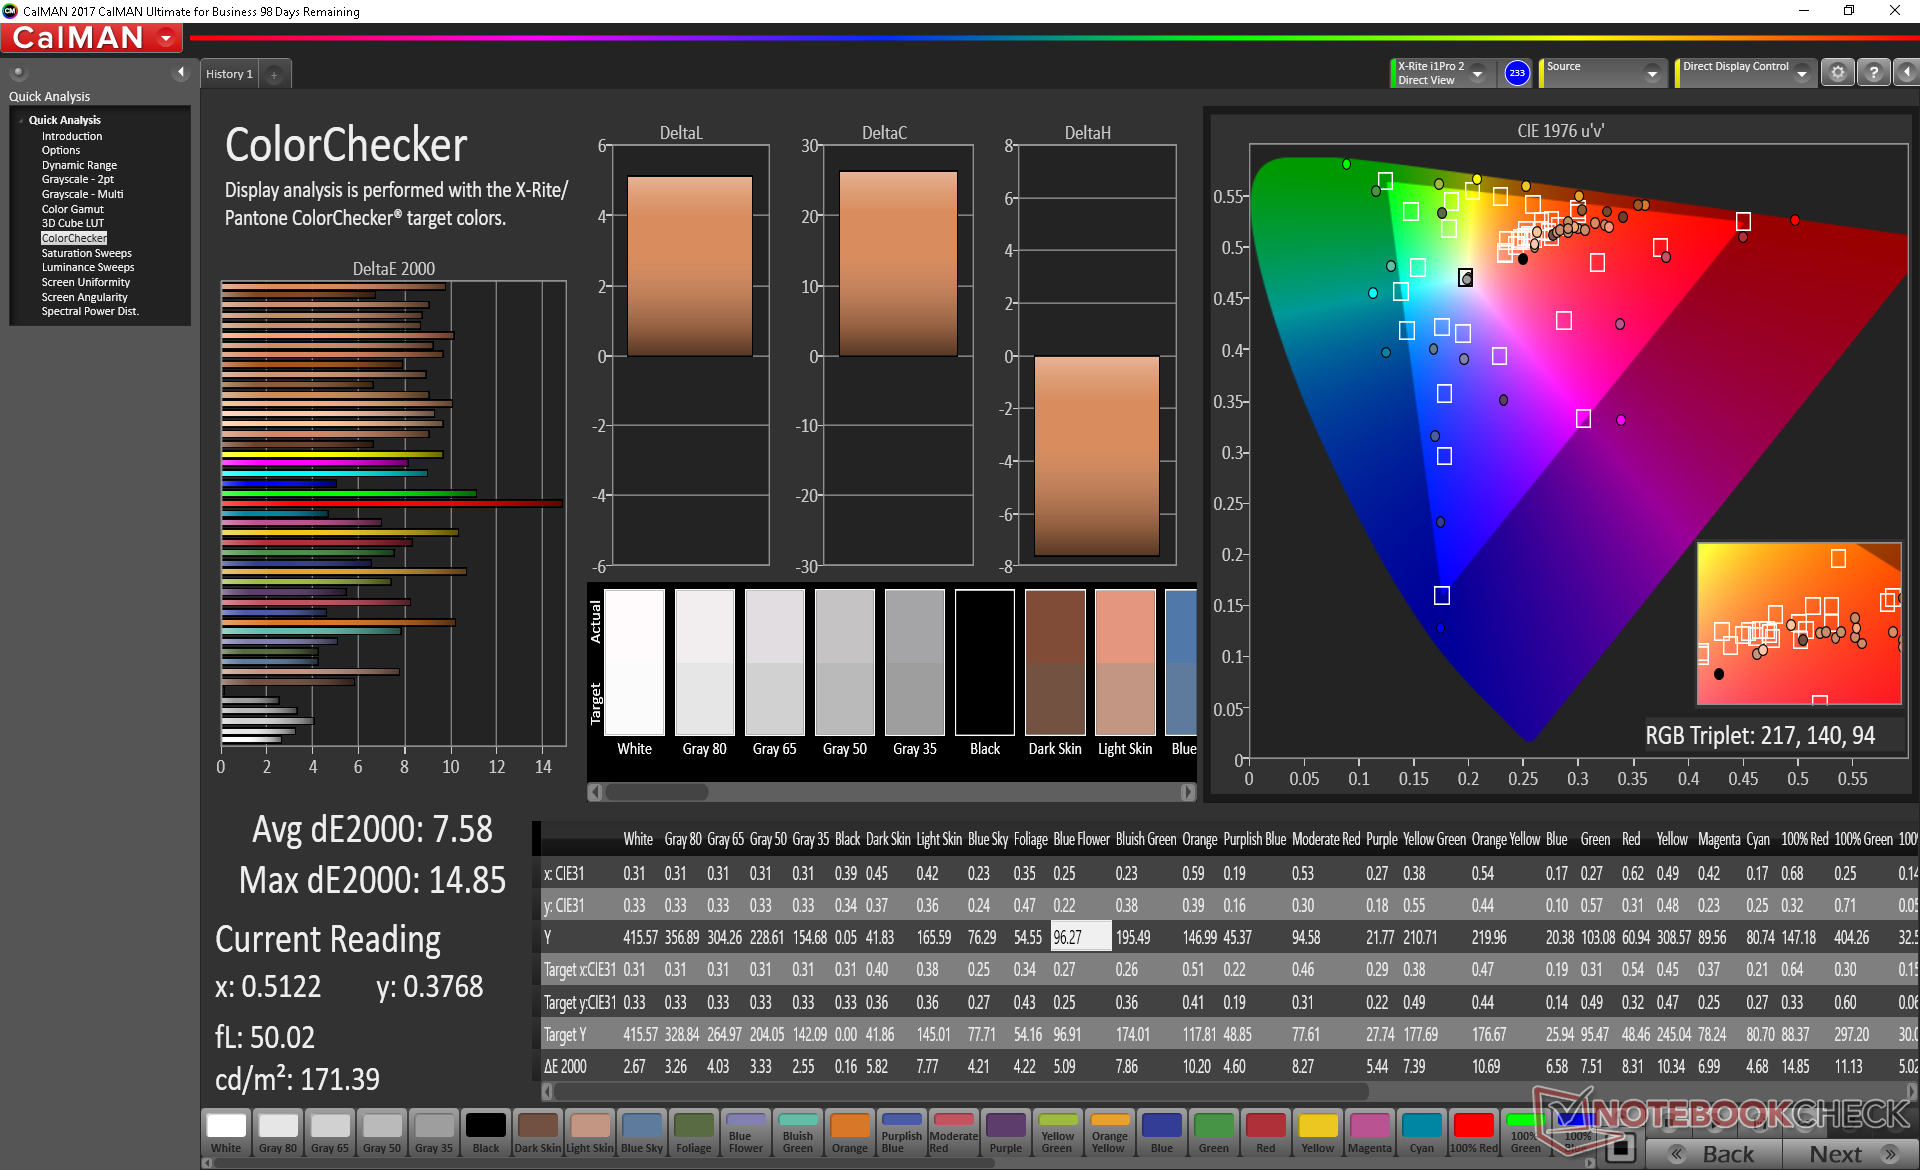
ΔE ColorChecker Calman: 7.58 | ∀{0.5-29.43 Ø4.73}
ΔE Greyscale Calman: 2.9 | ∀{0.09-98 Ø4.98}
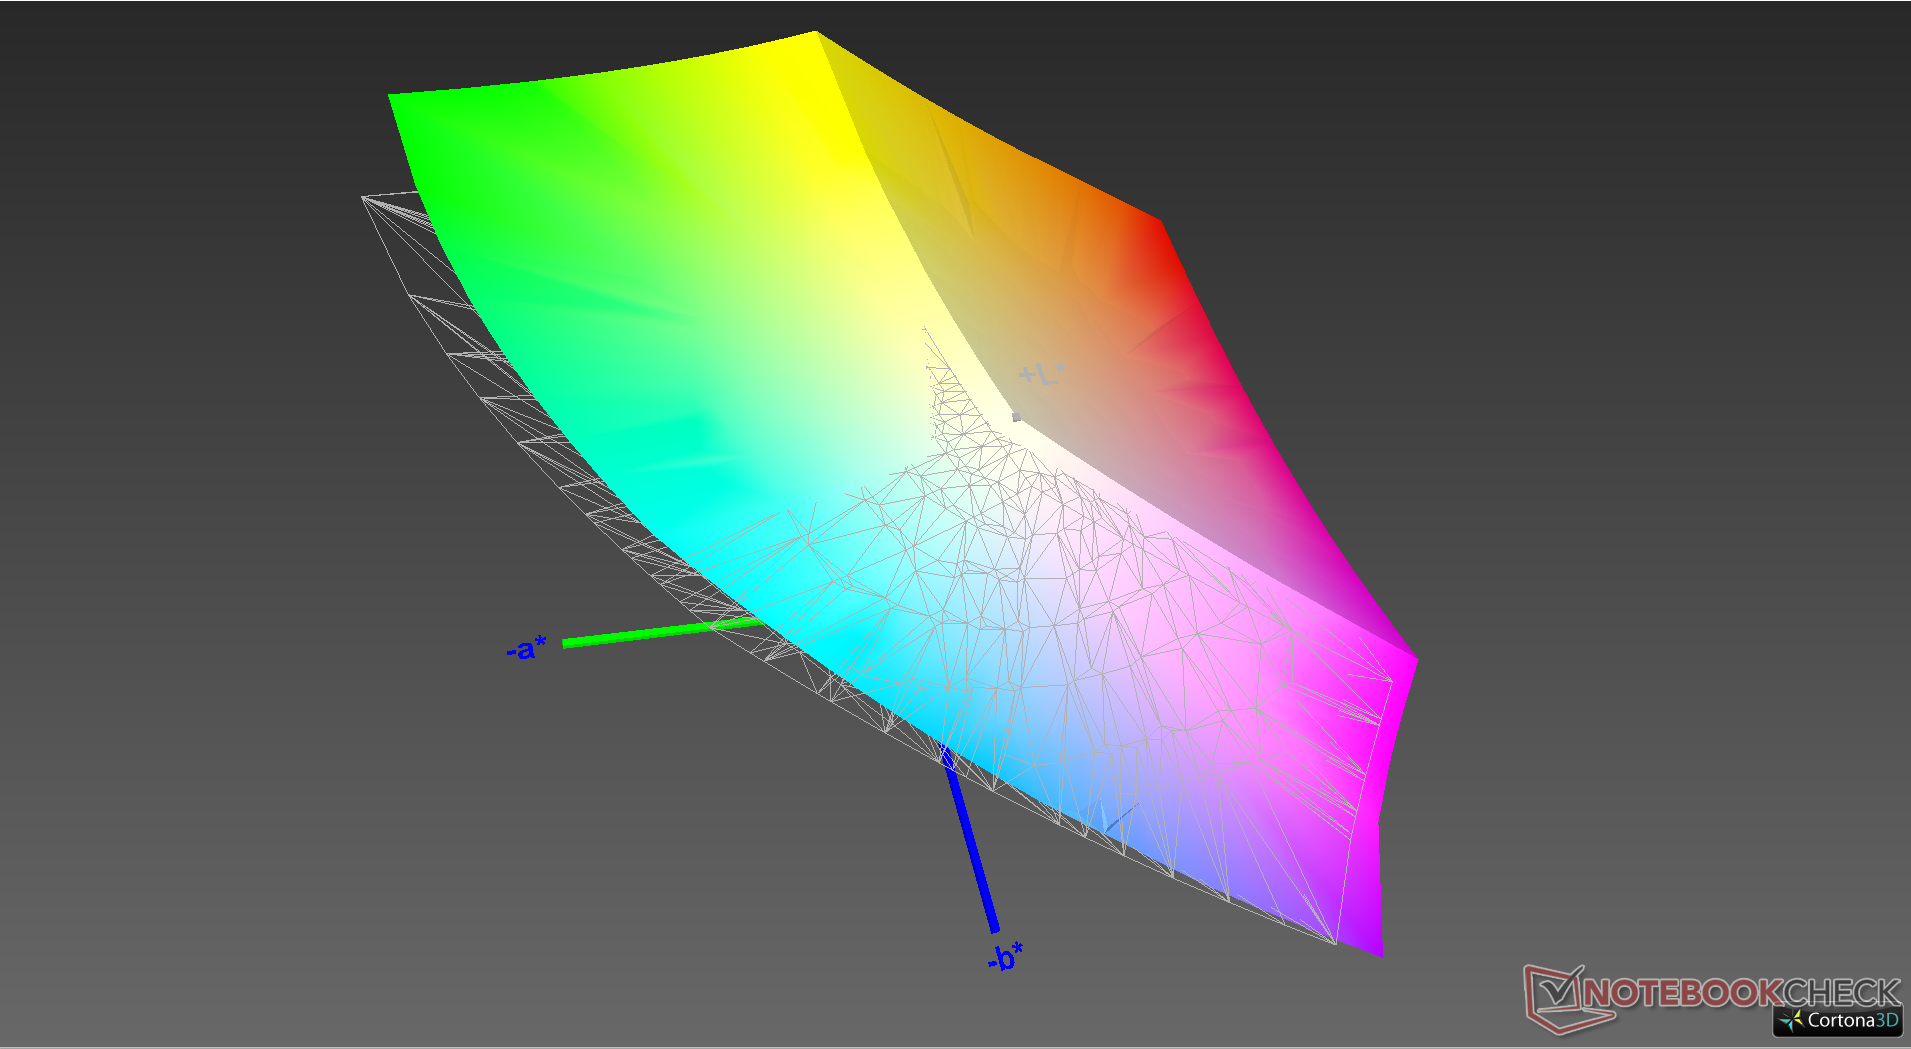
100% sRGB (Argyll 1.6.3 3D)
88.2% AdobeRGB 1998 (Argyll 1.6.3 3D)
99.1% AdobeRGB 1998 (Argyll 3D)
100% sRGB (Argyll 3D)
99.9% Display P3 (Argyll 3D)
Gamma: 2.05
CCT: 6538 K
| Eurocom Nightsky RX15 Samsung SDCA029, OLED, 15.6", 3840x2160 | Eurocom Nightsky Ti15 AU Optronics B156HAN, IPS, 15.6", 1920x1080 | Eurocom Sky X4C ID: SHP142A, Name: LQ156D1JX01B, IPS, 15.6", 3840x2160 | Dell XPS 15 7590 9980HK GTX 1650 Samsung 156WR04, SDCA029, OLED, 15.6", 3840x2160 | HP Omen 15-dc1303ng LG Philips LGD05C0, IPS, 15.6", 1920x1080 | MSI GE63 Raider RGB 8RF-008 CMN N156HHE-GA1 (CMN15F4), TN, 15.6", 1920x1080 | |
|---|---|---|---|---|---|---|
| Display | -26% | -23% | -6% | -26% | -8% | |
| Display P3 Coverage (%) | 99.9 | 65.2 -35% | 65.1 -35% | 88.1 -12% | 63.8 -36% | 90 -10% |
| sRGB Coverage (%) | 100 | 90.9 -9% | 96.5 -3% | 99.6 0% | 93.4 -7% | 100 0% |
| AdobeRGB 1998 Coverage (%) | 99.1 | 66.3 -33% | 67.2 -32% | 91.8 -7% | 65 -34% | 86 -13% |
| Response Times | -385% | -1239% | 6% | -403% | -713% | |
| Response Time Grey 50% / Grey 80% * (ms) | 2.4 ? | 14.4 ? -500% | 33.6 ? -1300% | 2.3 ? 4% | 14 ? -483% | 24.4 ? -917% |
| Response Time Black / White * (ms) | 2.6 ? | 9.6 ? -269% | 33.2 ? -1177% | 2.4 ? 8% | 11 ? -323% | 15.8 ? -508% |
| PWM Frequency (Hz) | 59.5 ? | 1000 ? | 59.5 ? | 25510 ? | ||
| Screen | -3% | -13% | 6% | 6% | -11% | |
| Brightness middle (cd/m²) | 414.9 | 331 -20% | 324.7 -22% | 421.2 2% | 316 -24% | 292 -30% |
| Brightness (cd/m²) | 404 | 327 -19% | 318 -21% | 417 3% | 295 -27% | 258 -36% |
| Brightness Distribution (%) | 88 | 83 -6% | 81 -8% | 94 7% | 84 -5% | 81 -8% |
| Black Level * (cd/m²) | 0.35 | 0.26 | 0.42 | 0.23 | ||
| Colorchecker dE 2000 * | 7.58 | 4.22 44% | 4.67 38% | 6.06 20% | 2.7 64% | 5.82 23% |
| Colorchecker dE 2000 max. * | 14.85 | 6.95 53% | 8.16 45% | 11.89 20% | 5.65 62% | 9.05 39% |
| Greyscale dE 2000 * | 2.9 | 3.9 -34% | 5.9 -103% | 2.8 3% | 2.35 19% | 4.61 -59% |
| Gamma | 2.05 107% | 2.26 97% | 2.14 103% | 2.15 102% | 2.41 91% | 2.65 83% |
| CCT | 6538 99% | 7392 88% | 7176 91% | 6235 104% | 6904 94% | 6950 94% |
| Color Space (Percent of AdobeRGB 1998) (%) | 88.2 | 59 -33% | 61.1 -31% | 81 -8% | 60 -32% | 76 -14% |
| Color Space (Percent of sRGB) (%) | 100 | 90.5 -9% | 96.1 -4% | 99.6 0% | 93 -7% | 100 0% |
| Contrast (:1) | 946 | 1249 | 752 | 1270 | ||
| Colorchecker dE 2000 calibrated * | 3.27 | 1.58 | 2.82 | |||
| Total Average (Program / Settings) | -138% /
-67% | -425% /
-204% | 2% /
3% | -141% /
-64% | -244% /
-118% |
* ... smaller is better
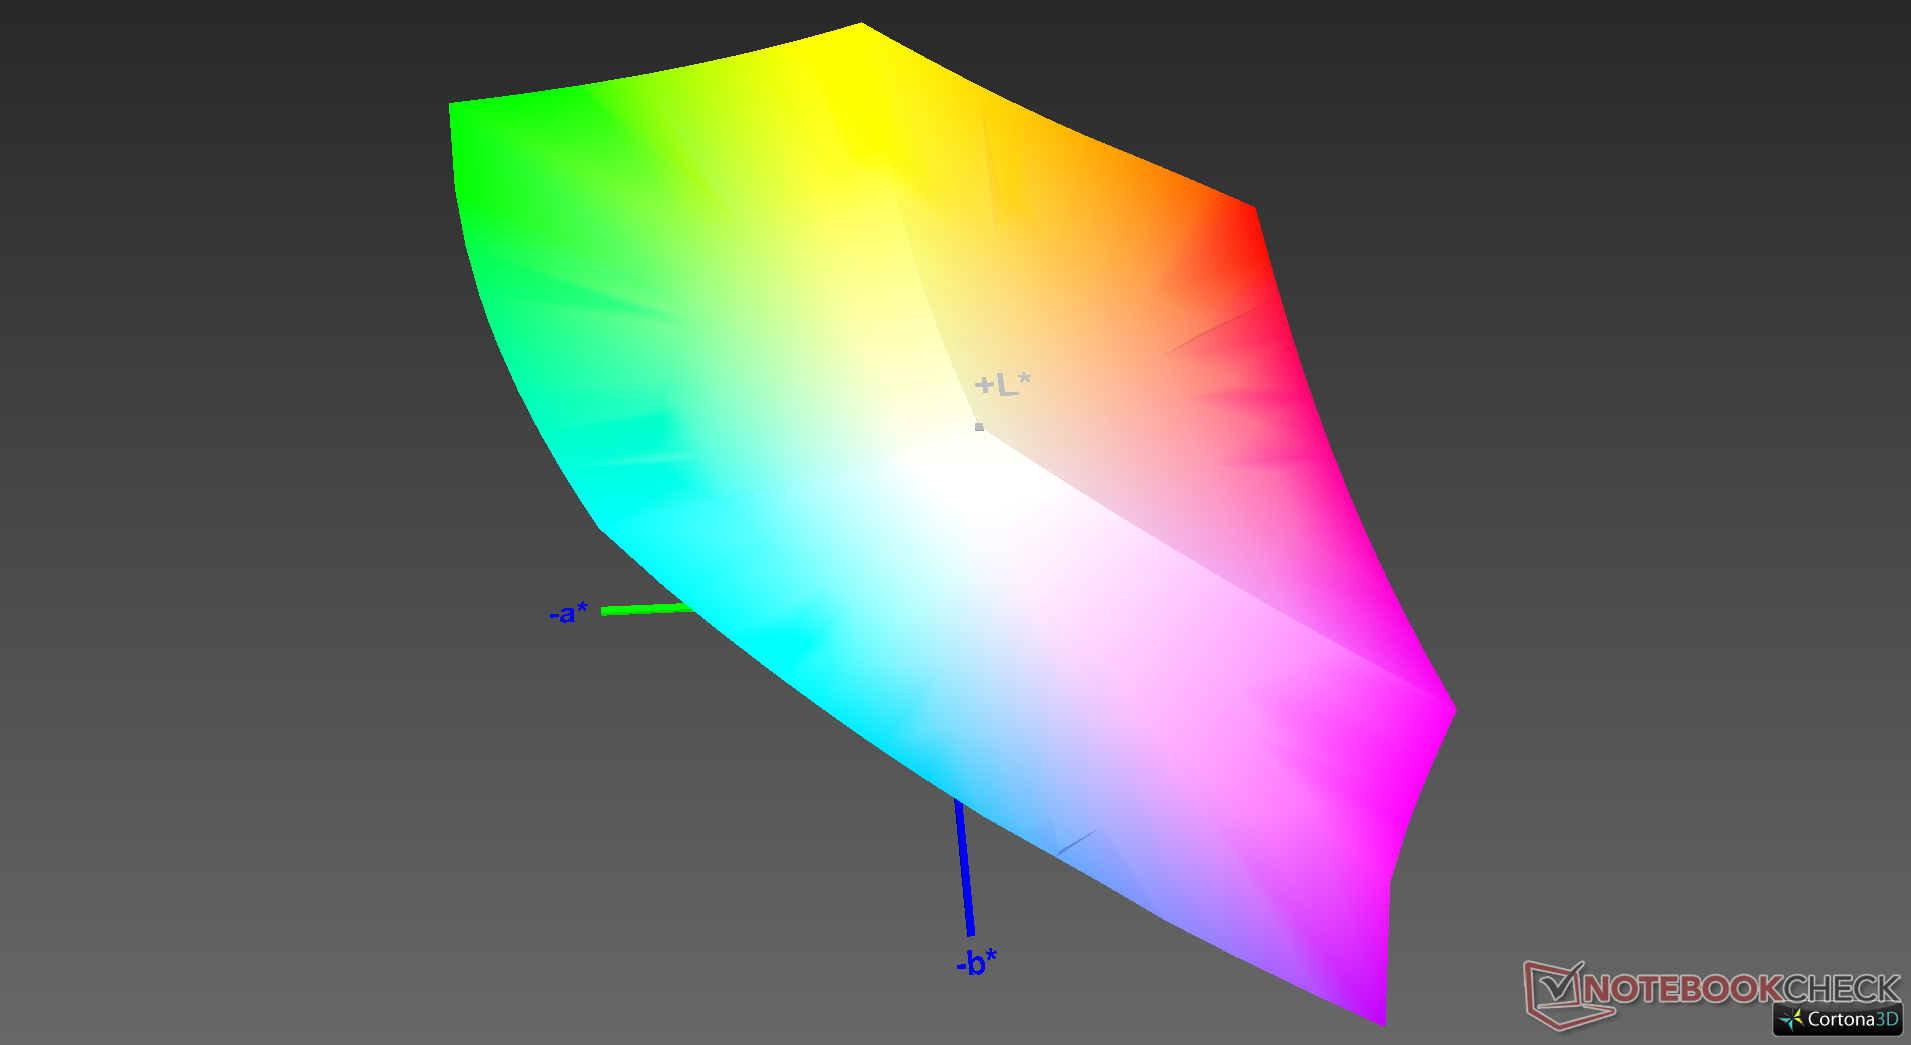
Eurocom advertises 100 percent DCI-P3 coverage not unlike other 15.6-inch OLED laptops in the market with the same Samsung panel. Our own measurements show 88 percent 3D coverage of the AdobeRGB standard with a large portion of the color space not overlapping AdobeRGB since DCI-P3 is wider than AdobeRGB.
Display Response Times
| ↔ Response Time Black to White | ||
|---|---|---|
| 2.6 ms ... rise ↗ and fall ↘ combined | ↗ 1.3 ms rise | 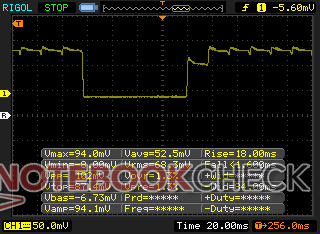 |
| ↘ 1.3 ms fall | ||
| The screen shows very fast response rates in our tests and should be very well suited for fast-paced gaming. In comparison, all tested devices range from 0.1 (minimum) to 240 (maximum) ms. » 13 % of all devices are better. This means that the measured response time is better than the average of all tested devices (19.9 ms). | ||
| ↔ Response Time 50% Grey to 80% Grey | ||
| 2.4 ms ... rise ↗ and fall ↘ combined | ↗ 1.2 ms rise | 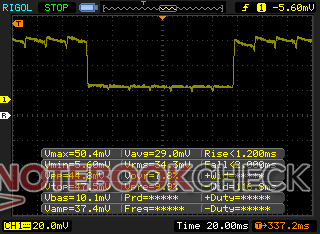 |
| ↘ 1.2 ms fall | ||
| The screen shows very fast response rates in our tests and should be very well suited for fast-paced gaming. In comparison, all tested devices range from 0.165 (minimum) to 636 (maximum) ms. » 11 % of all devices are better. This means that the measured response time is better than the average of all tested devices (31.1 ms). | ||
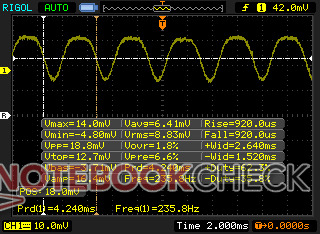
Screen Flickering / PWM (Pulse-Width Modulation)
| Screen flickering / PWM detected | 59.5 Hz | ≤ 100 % brightness setting | 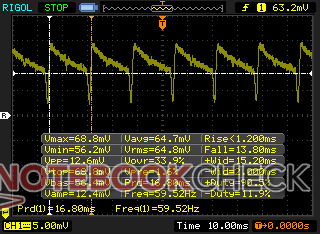 |
The display backlight flickers at 59.5 Hz (worst case, e.g., utilizing PWM) Flickering detected at a brightness setting of 100 % and below. There should be no flickering or PWM above this brightness setting. The frequency of 59.5 Hz is very low, so the flickering may cause eyestrain and headaches after extended use. In comparison: 52 % of all tested devices do not use PWM to dim the display. If PWM was detected, an average of 7816 (minimum: 5 - maximum: 343500) Hz was measured. | |||
Much like what we discovered on the XPS 15 7590 OLED and Razer Blade 15 OLED, the Nightsky RX15 OLED exhibits similar PWM behavior that changes depending on the brightness level. At 49 percent brightness and up, frequency is stable at 59.52 Hz while frequency changes abruptly to 235.8 Hz when set to 48 percent and below. This behavior is not observed on laptops with IPS panels.

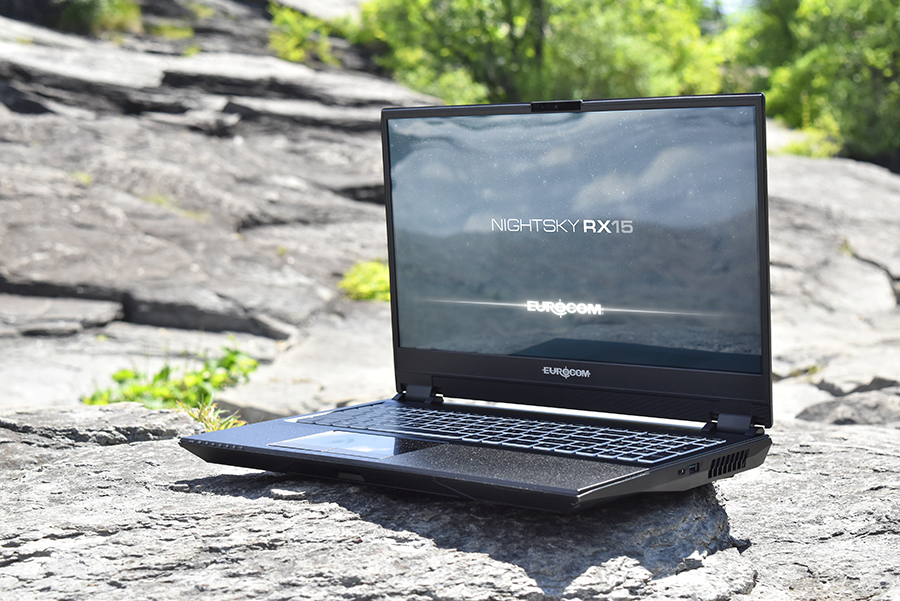
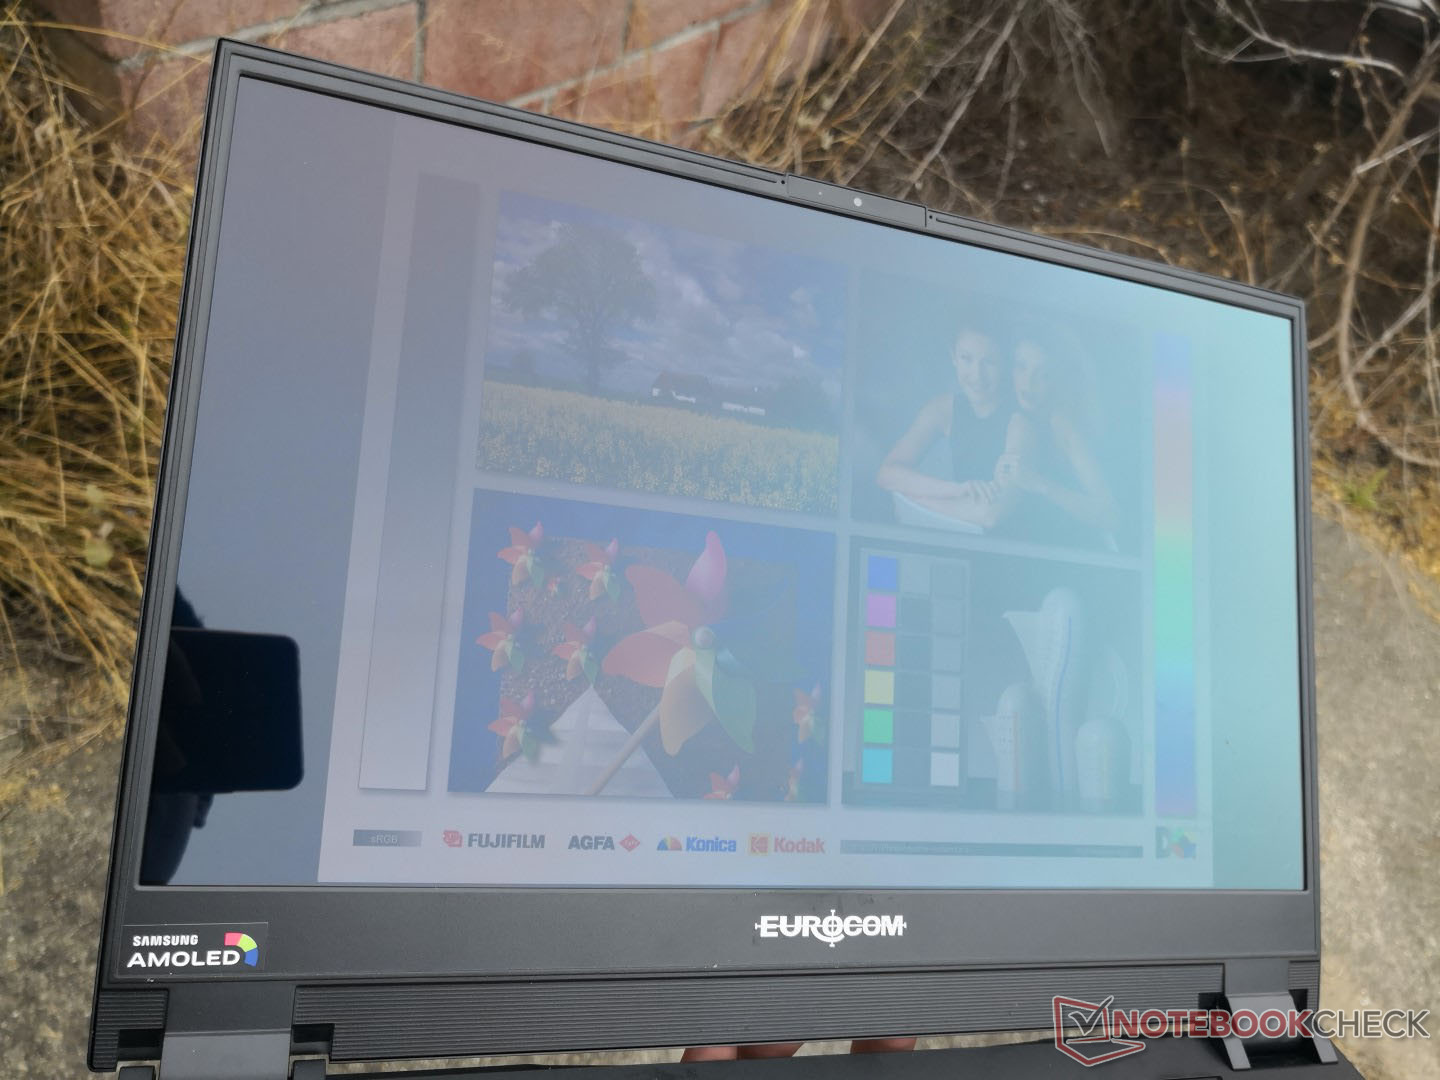
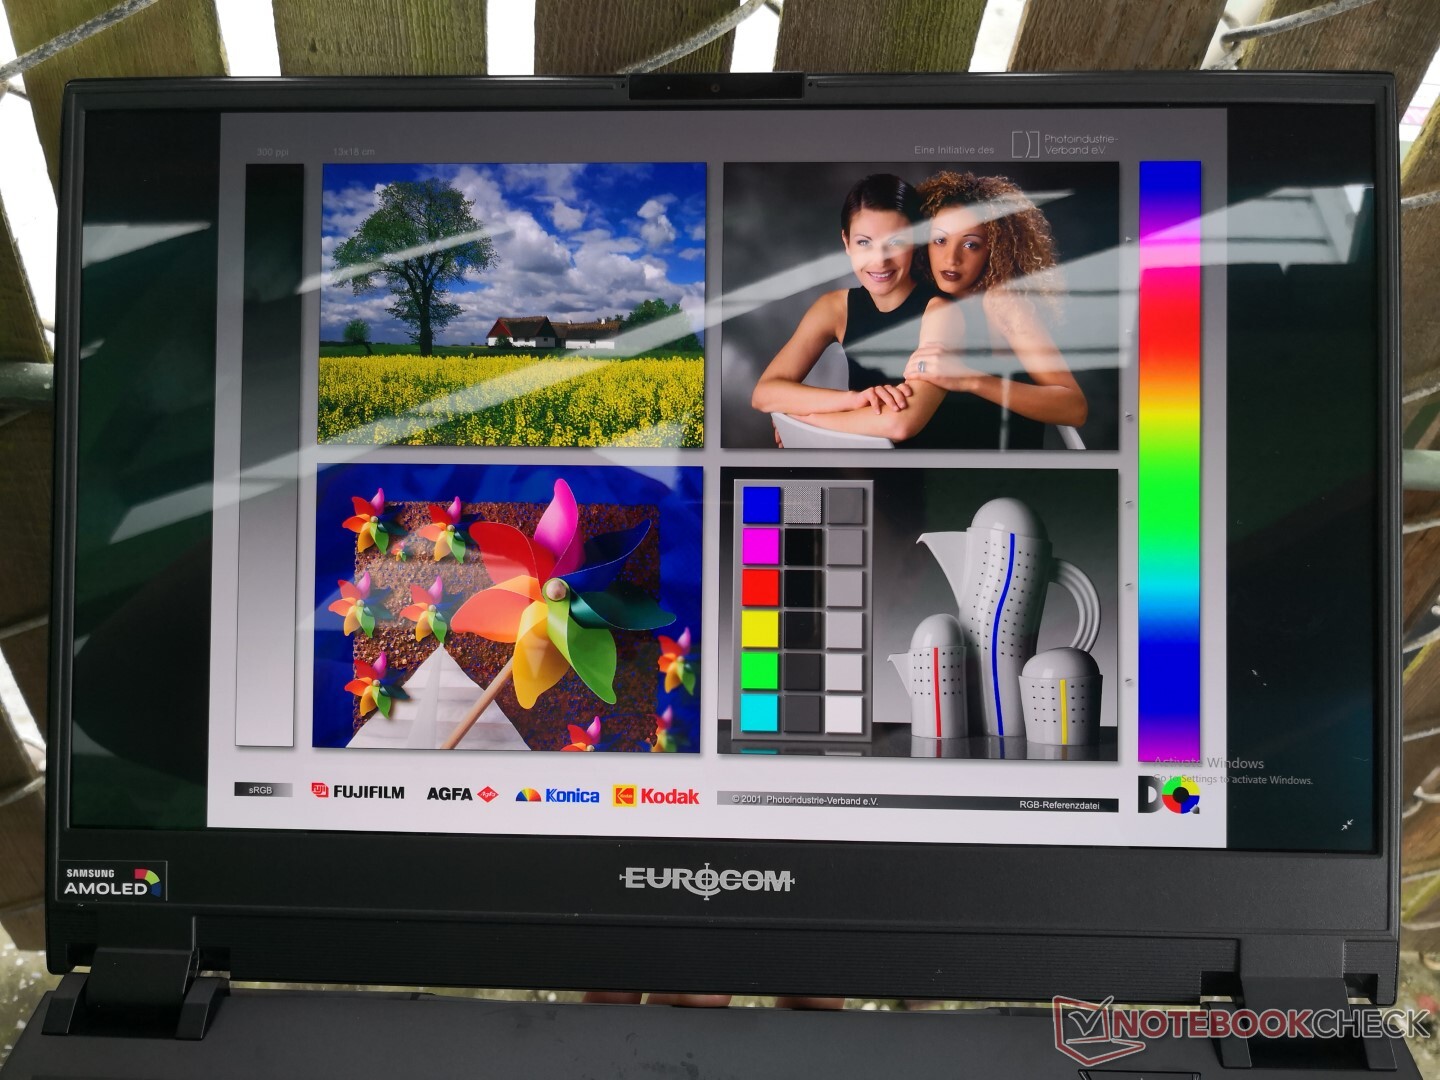
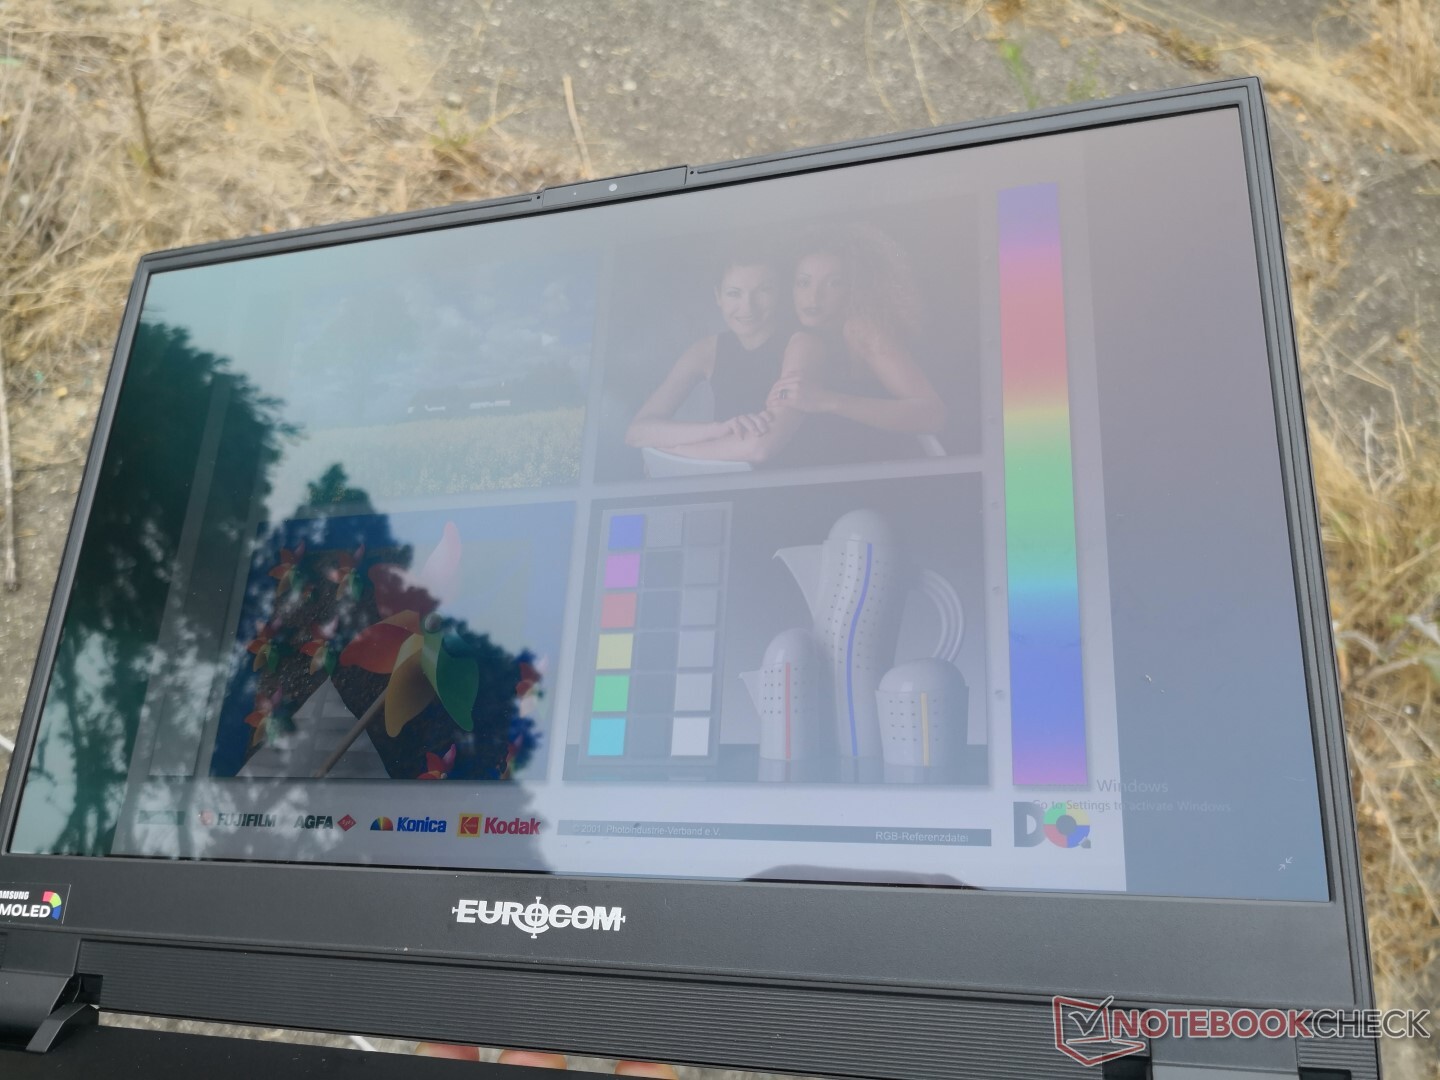
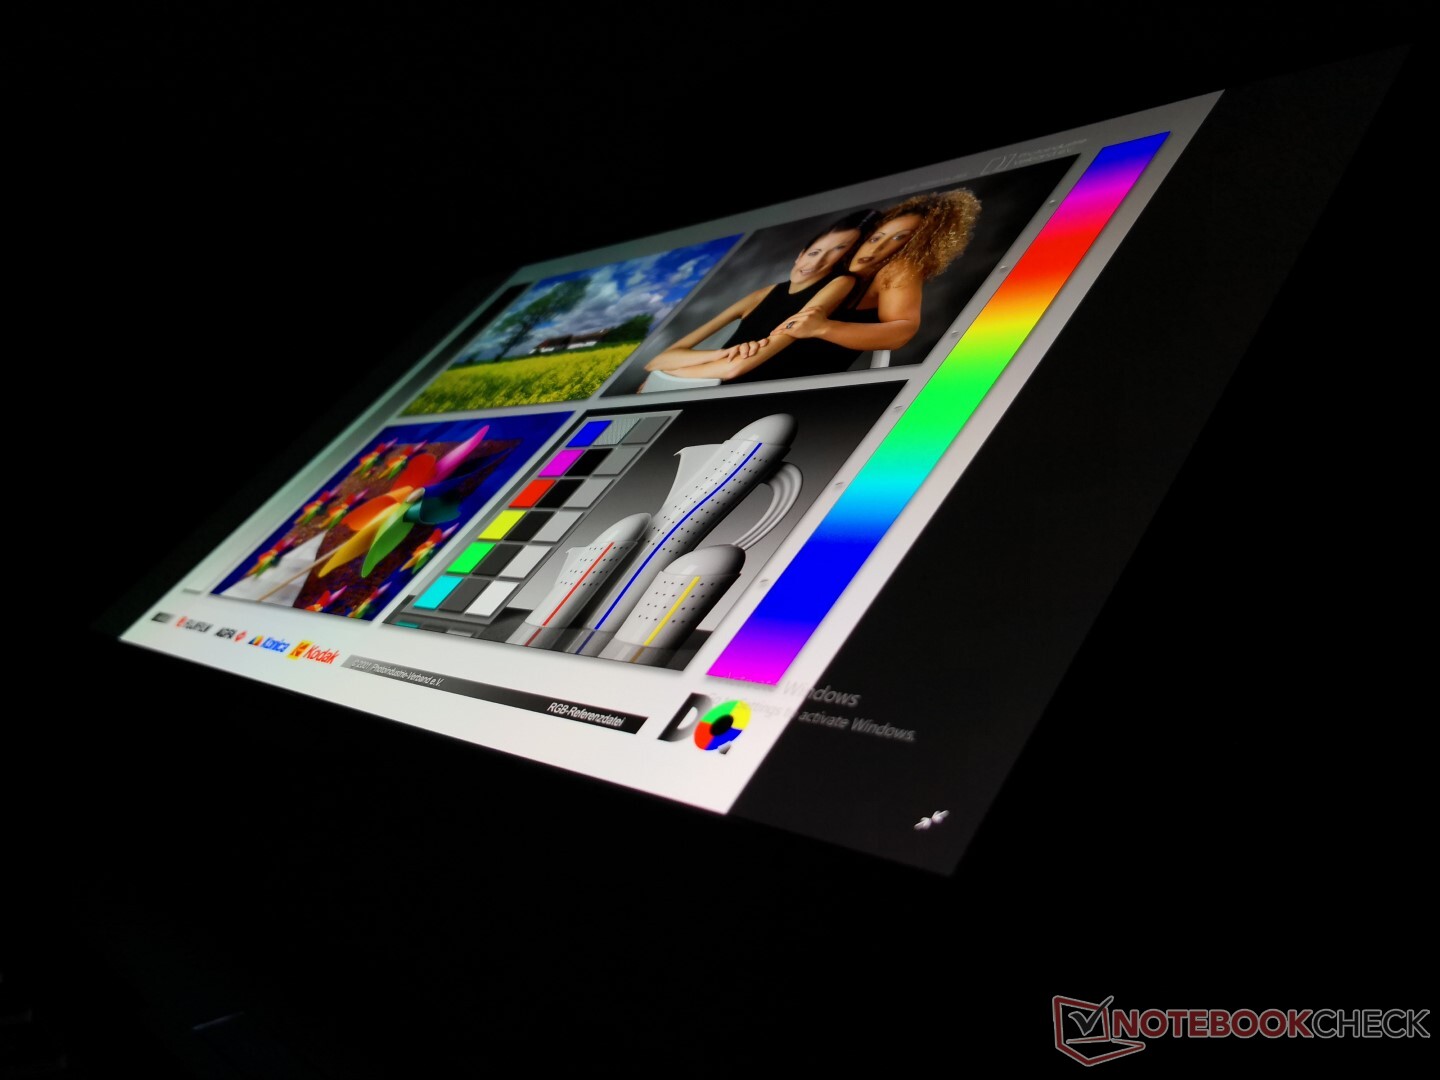
Outdoor visibility is better than the matte IPS panel on the Nightsky Ti15 when under shade. When under sunlight or on an overcast day, however, outdoor visibility is not any better or worse than the aforementioned Nightsky Ti15 due to the heavier glare on the glossy OLED screen. The wide viewing angles are identical to the Dell XPS 15 7590.
Annoyingly, display brightness will sometimes automatically drop to the minimum when the system is waking from a sleep state. You'll have to manually adjust the brightness each time to fix the issue.
Performance
The Nightsky RX15 is one of the few 15.6-inch laptops with an unlocked Core i9-9980HK option. Strangely enough, its GPU currently maxes out at the GeForce RTX 2070 instead of the RTX 2080 despite having the fastest mobile Coffee Lake-H CPU available.
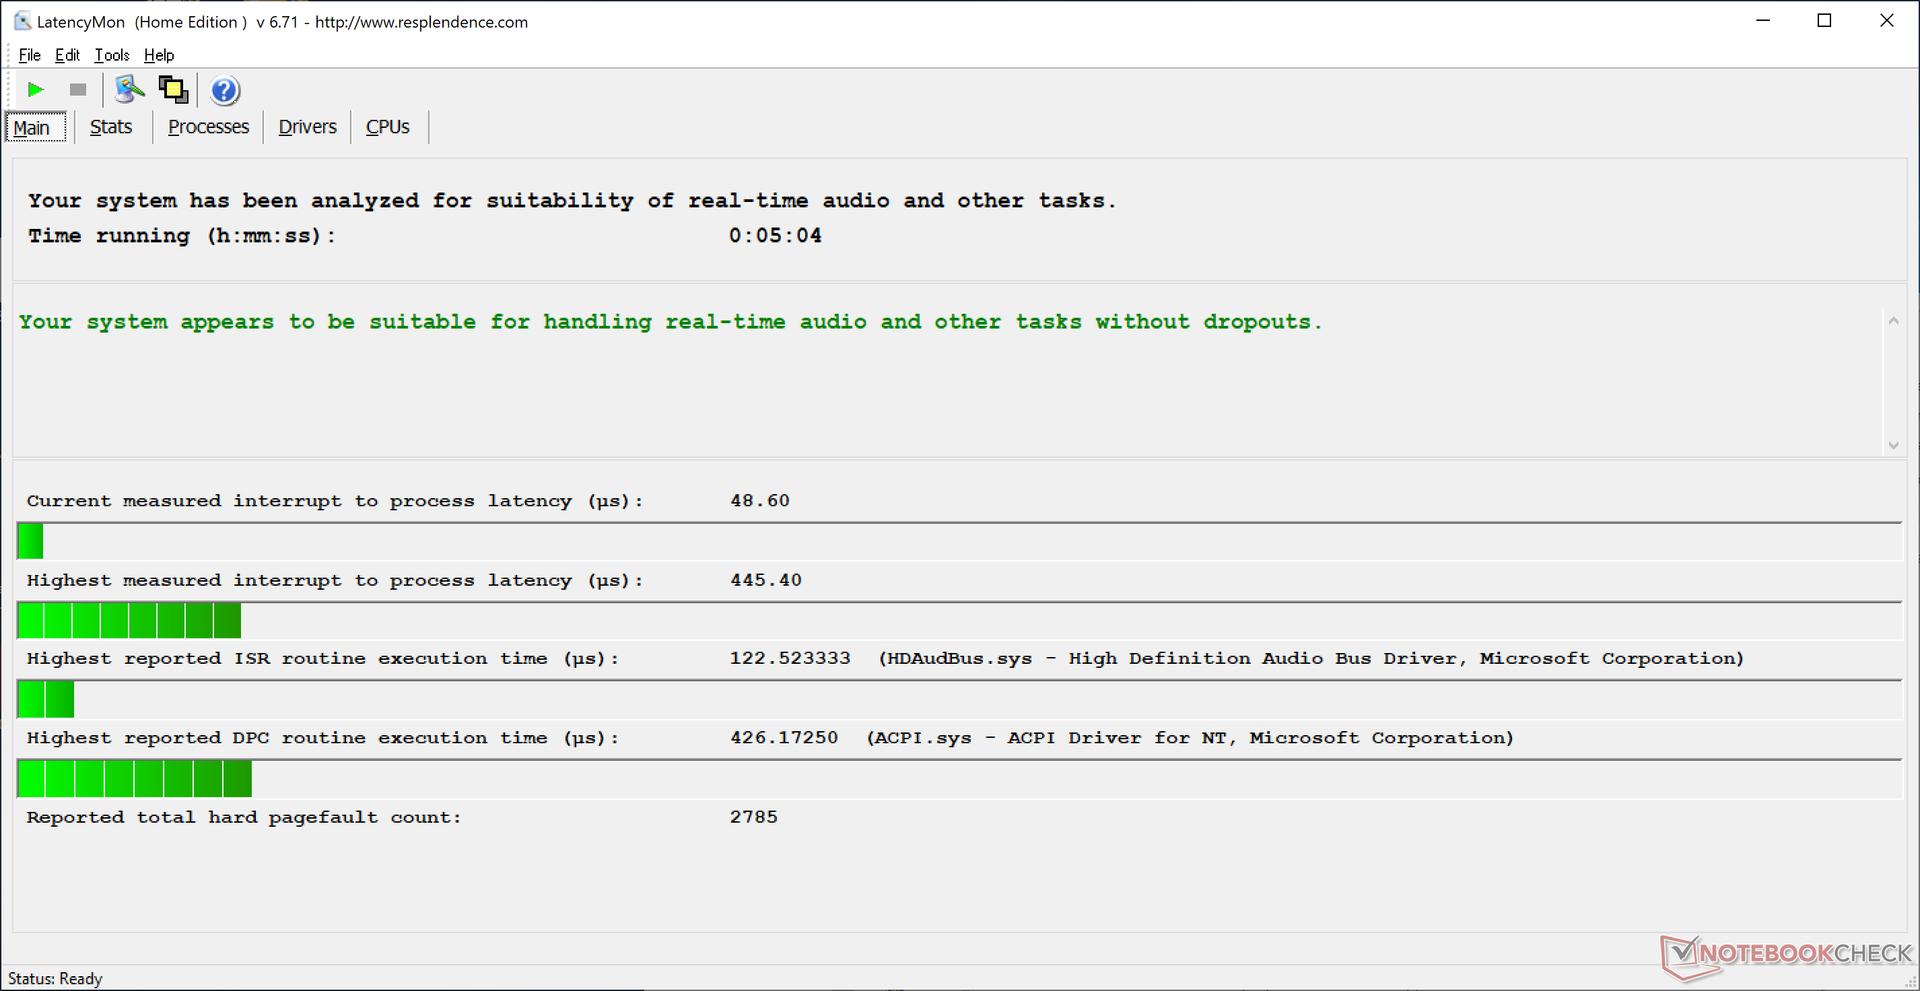
LatencyMon shows no DPC latency issues as expected from a Clevo system. Laptops from major OEMs like Dell, HP, and others are more likely to have undesirable background activity and bloatware.
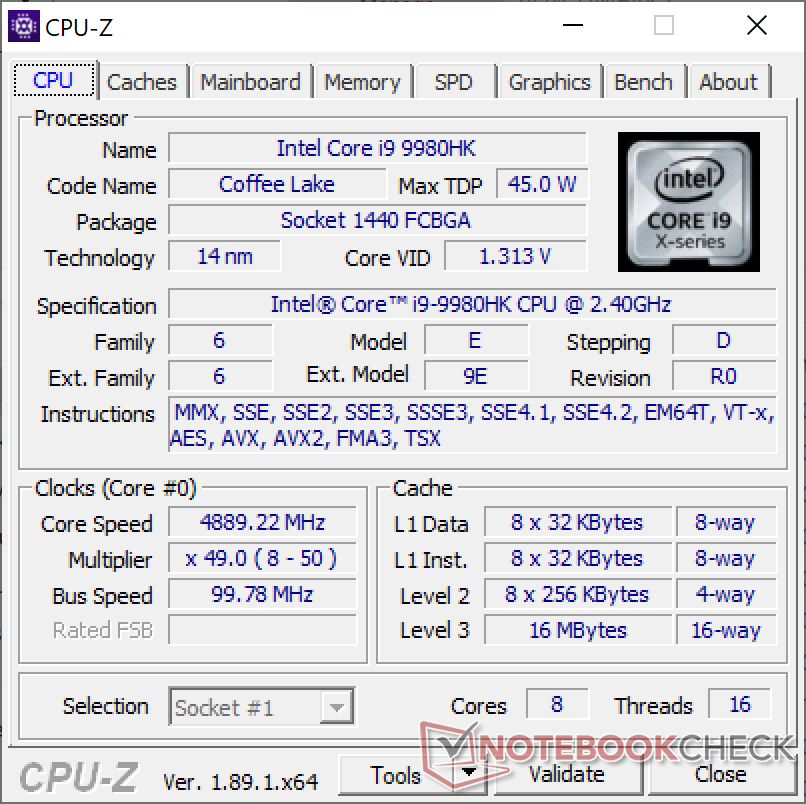
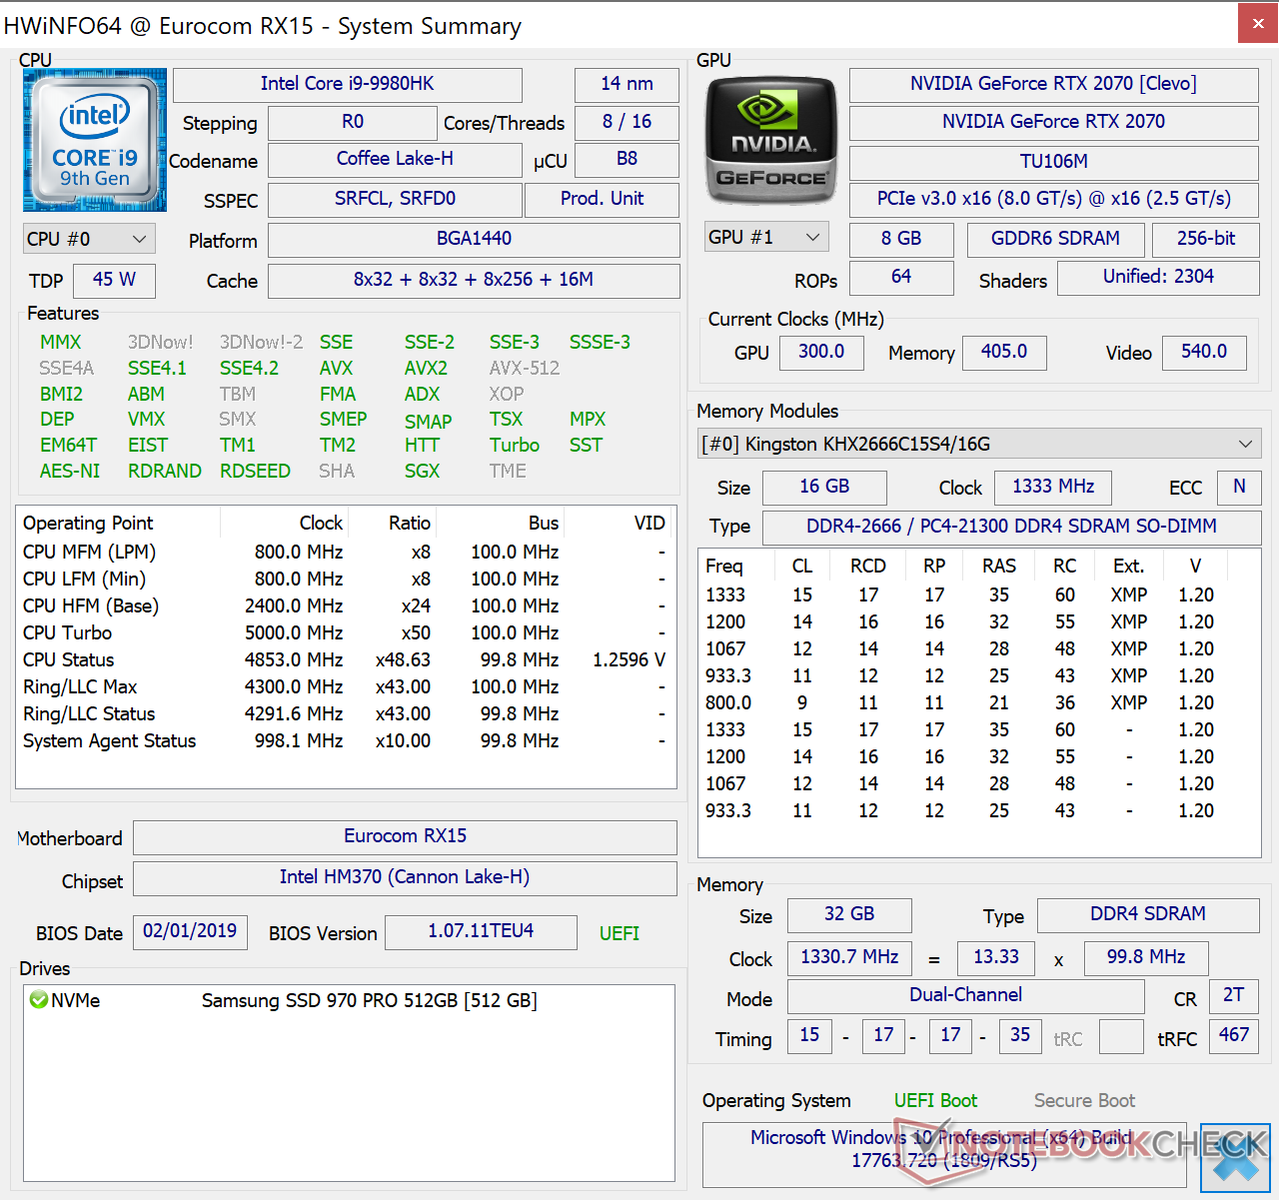
Processor
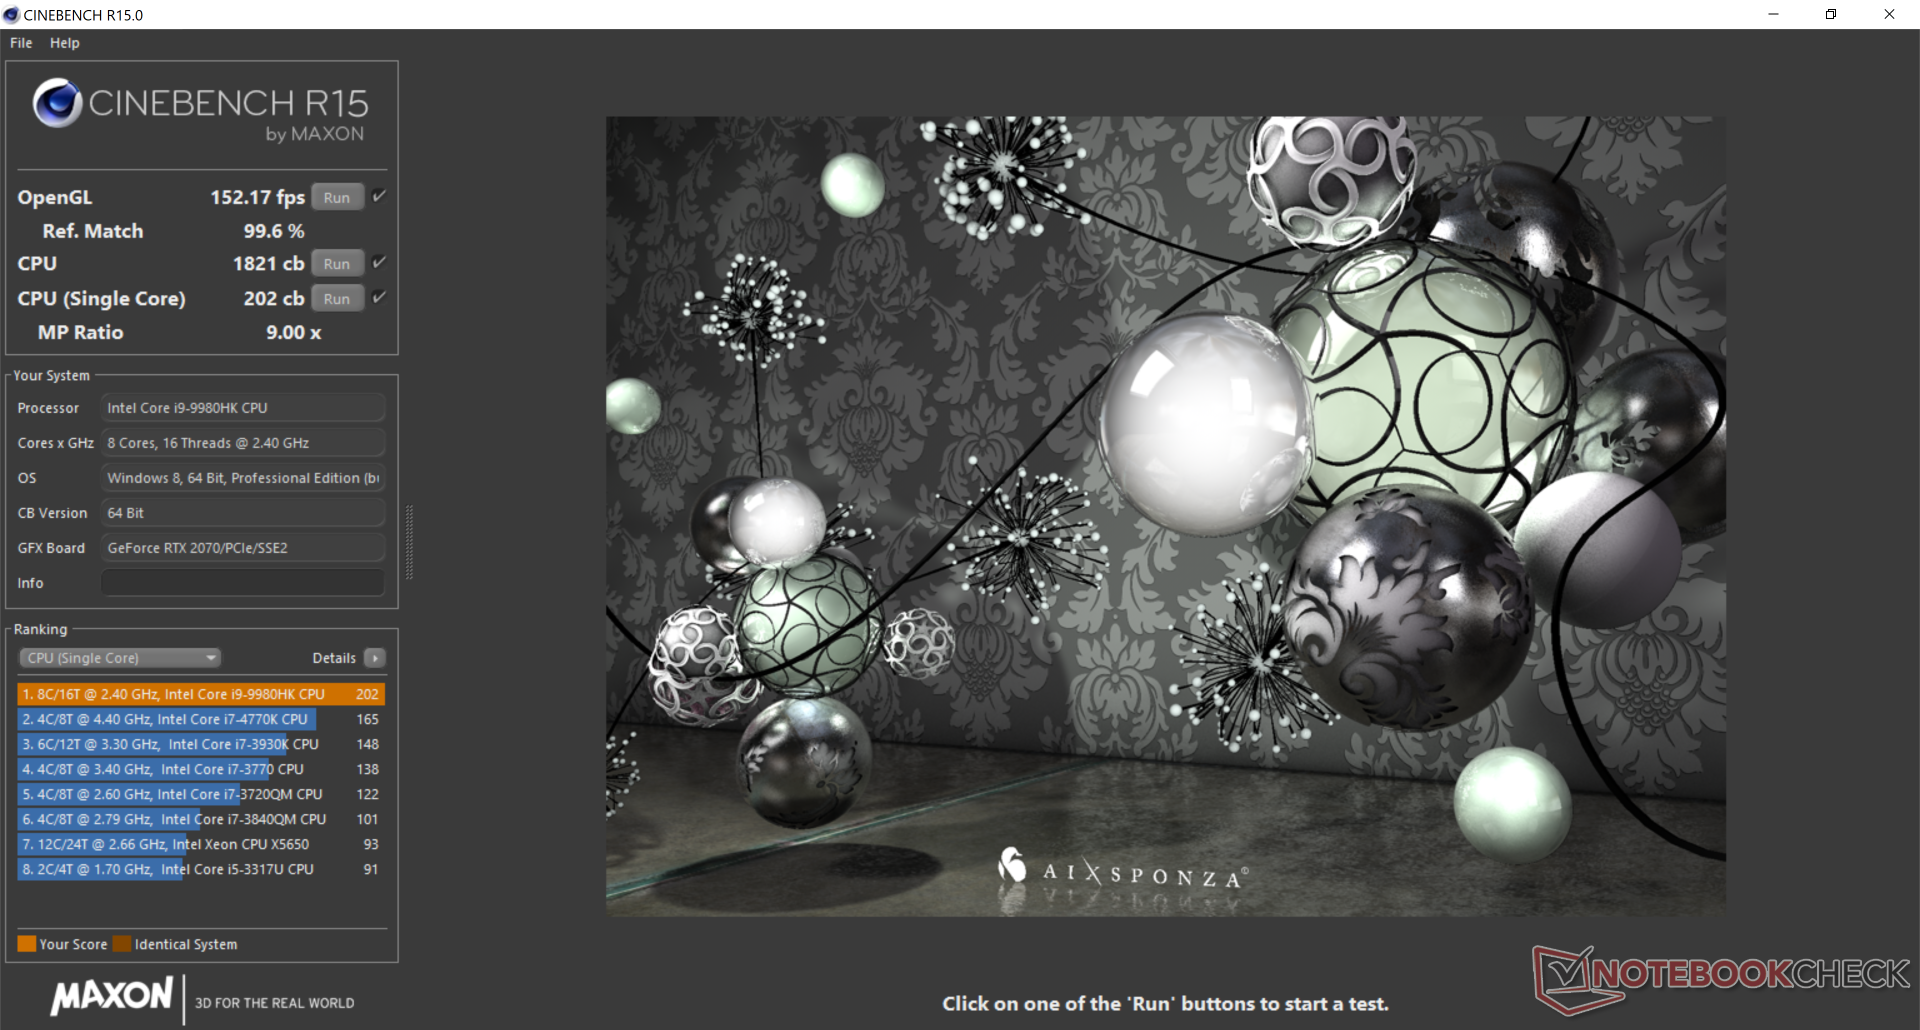
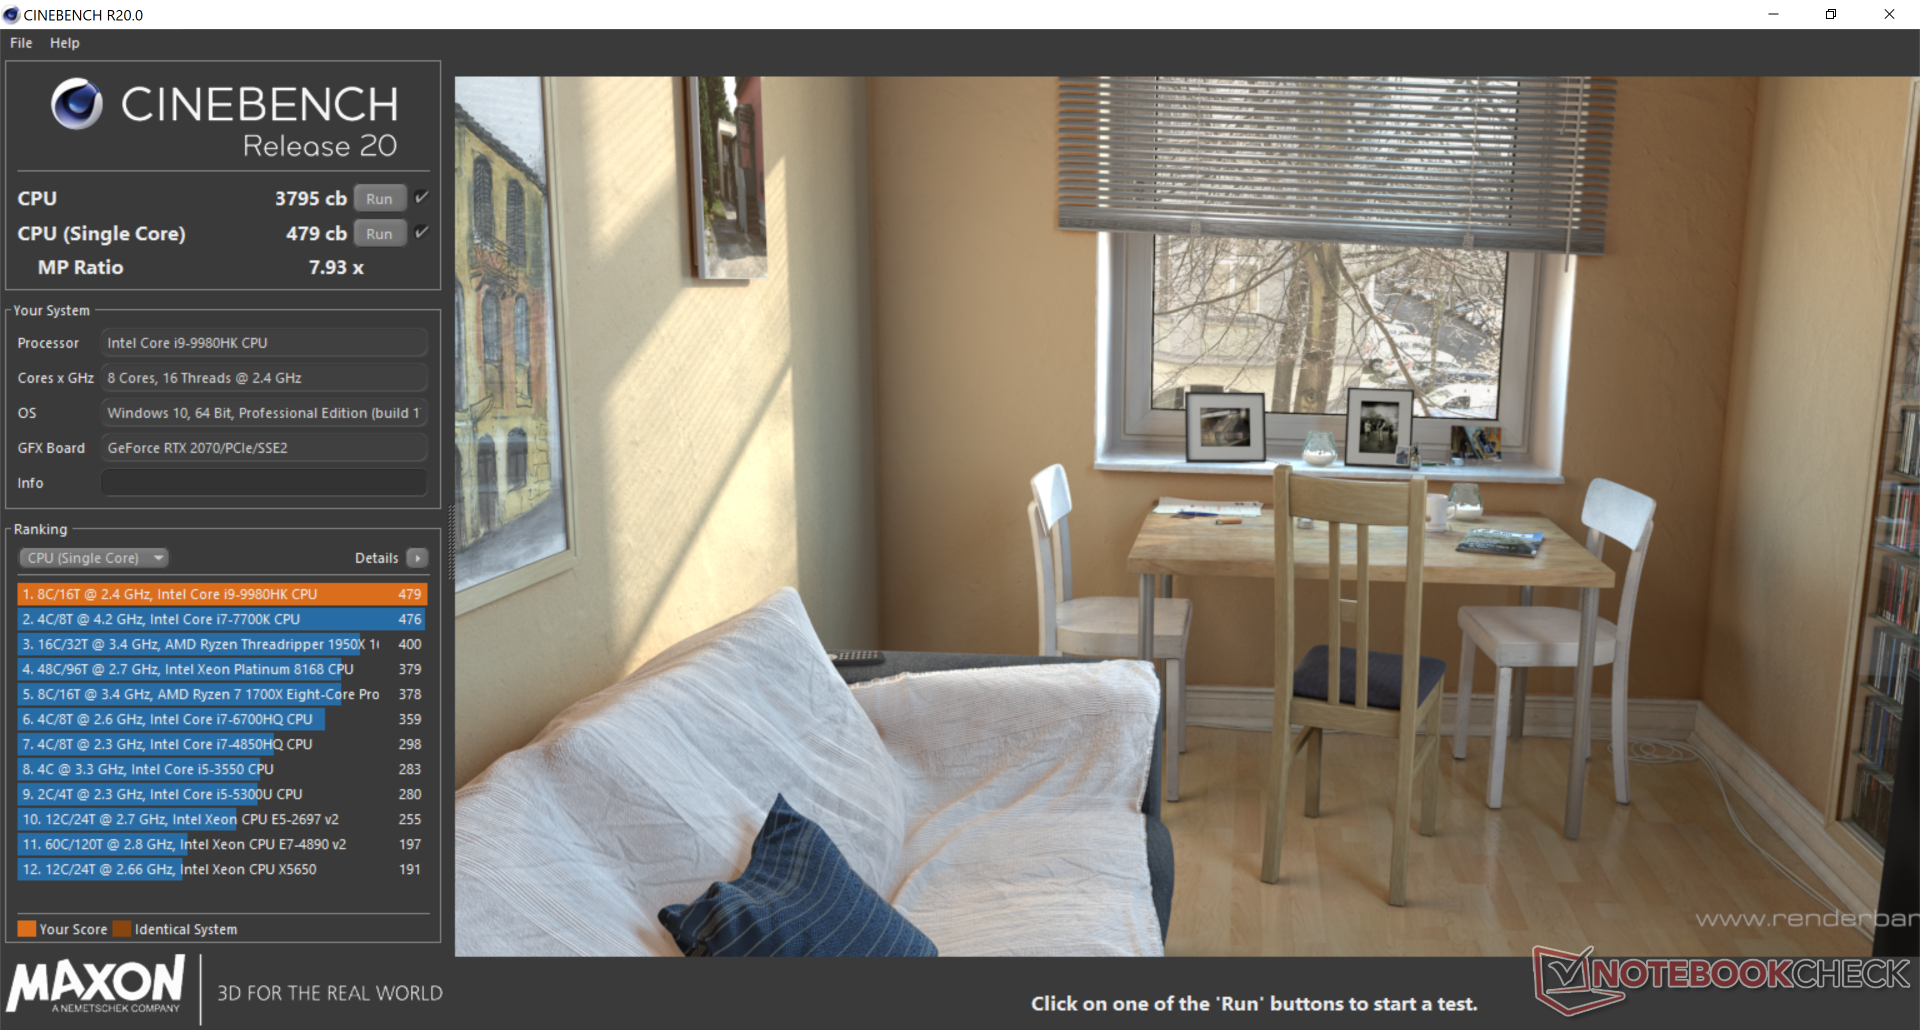
The Core i9-9980HK is unquestionably fast, but it's a mixed bag relatively speaking because of its steep drop in raw performance after maximum Turbo Boost ends. As shown by our CineBench R15 Multi-Thread loop graph below, CPU performance drops by 18 percent after the first two loops and never recovers thereafter. Nonetheless, performance remains much faster than the Core i7-9750H and Core i9-9980HK in the Nightsky Ti15 and Dell XPS 15 7590, respectively, even after accounting for throttling.
Some laptops with the "slower" Core i9-9880H like the MSI GE75 9SG can run faster than than the Core i9-9980HK if they can maintain faster clock rates for longer when under stress.
See our dedicated page on the Core i9-9980HK for more technical information and benchmarks.
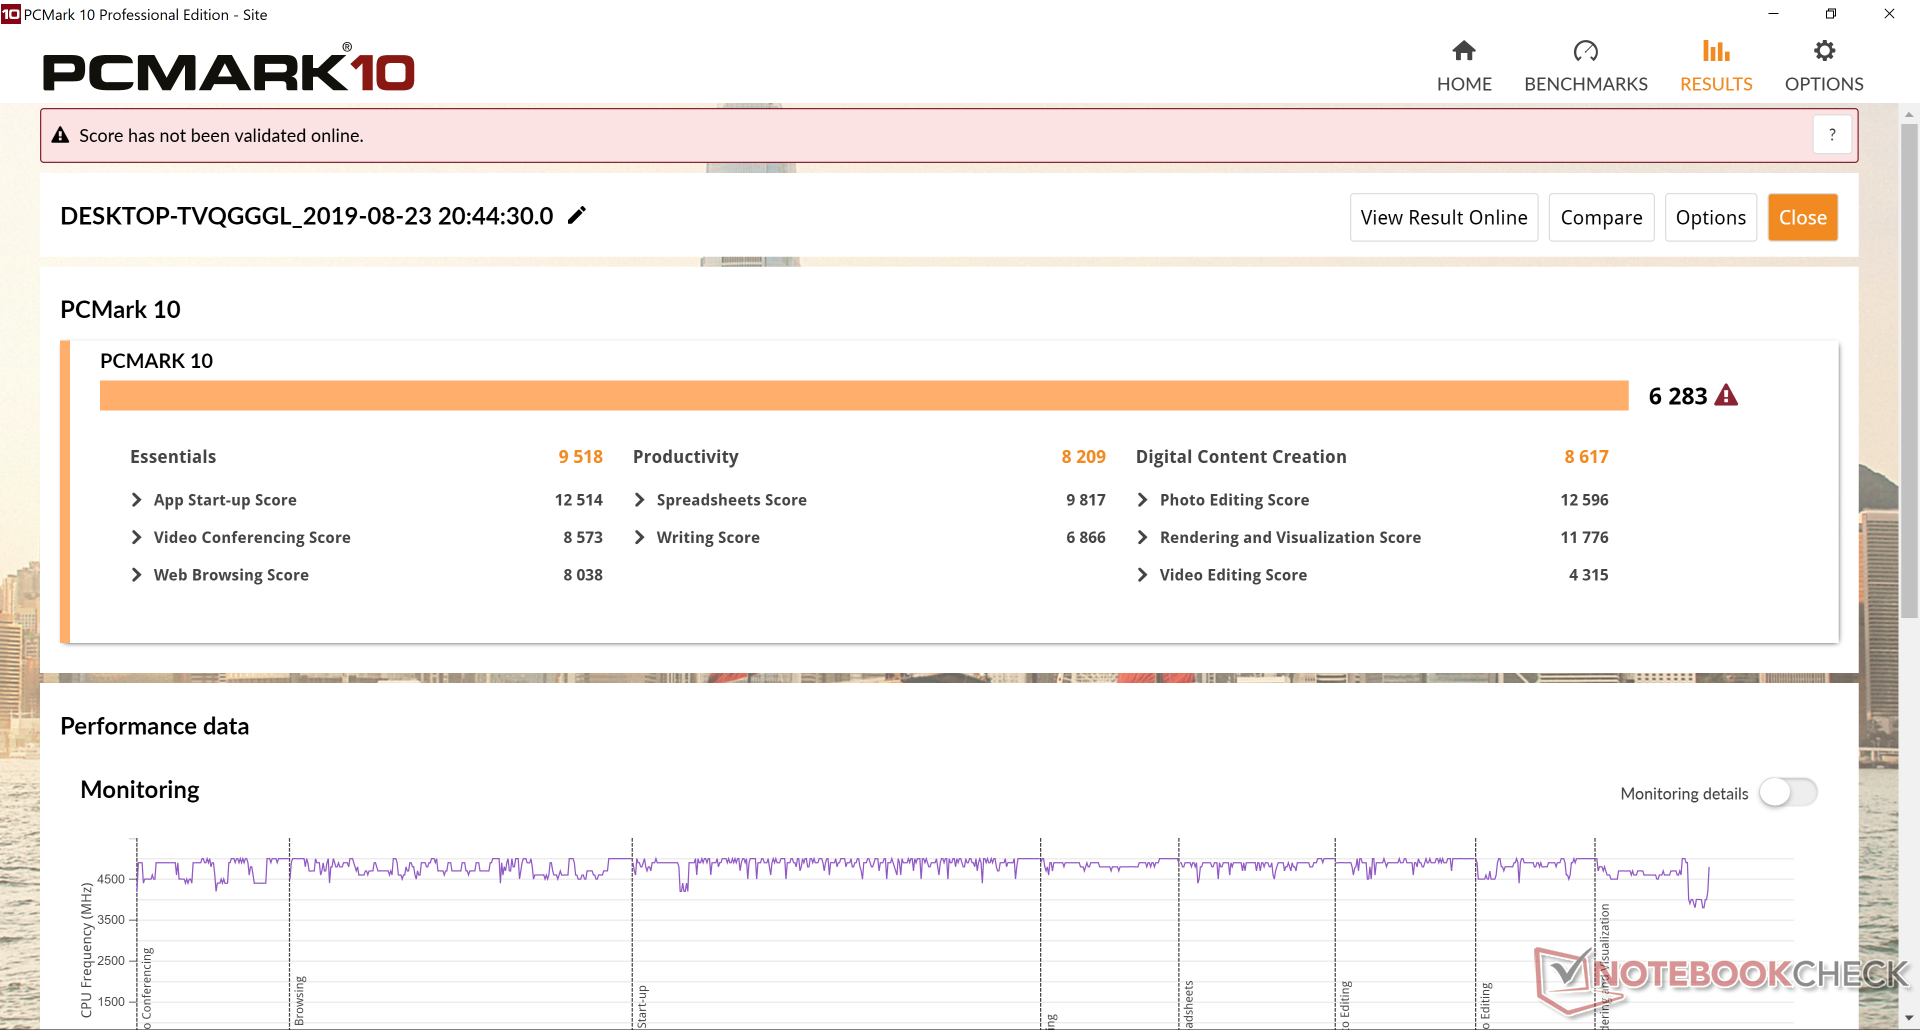
System Performance
PCMark benchmarks are consistently higher than the Nightsky Ti15 especially in Digital Content Creation where the RTX 2070 can flex its performance benefits over the GTX 1660 Ti.
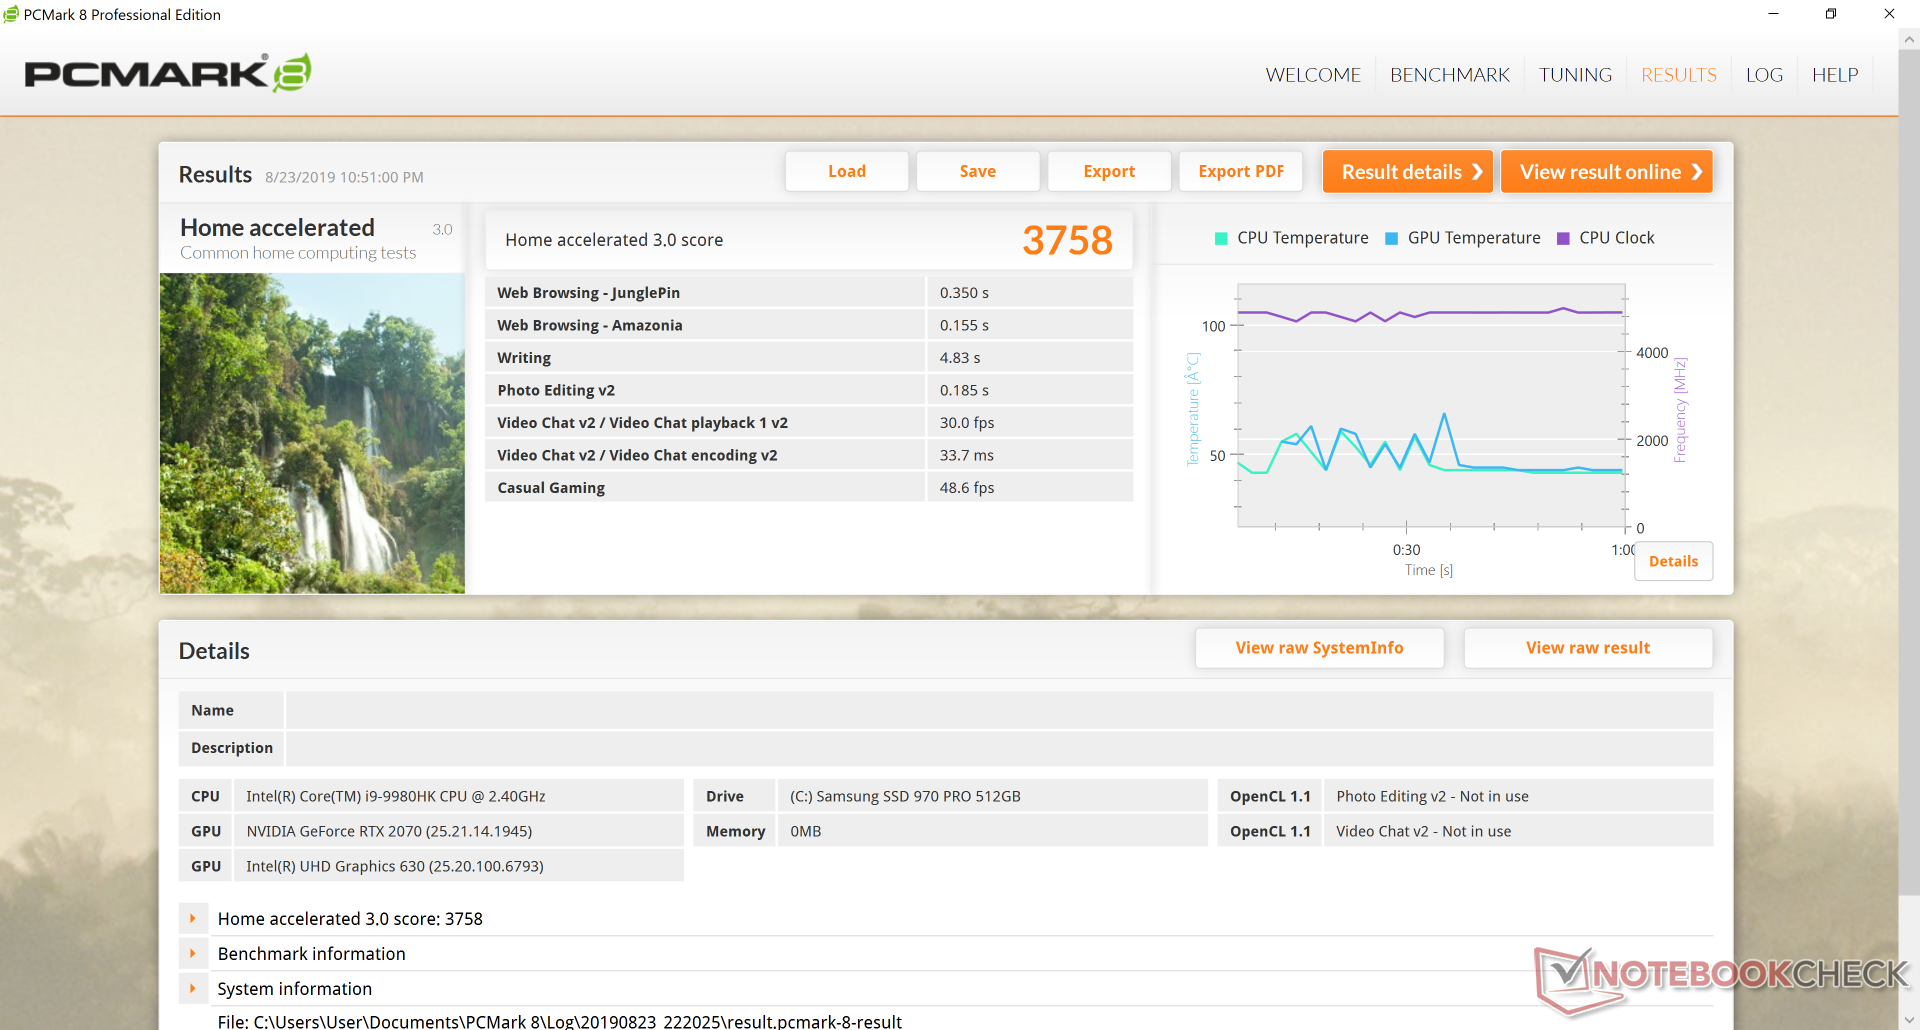
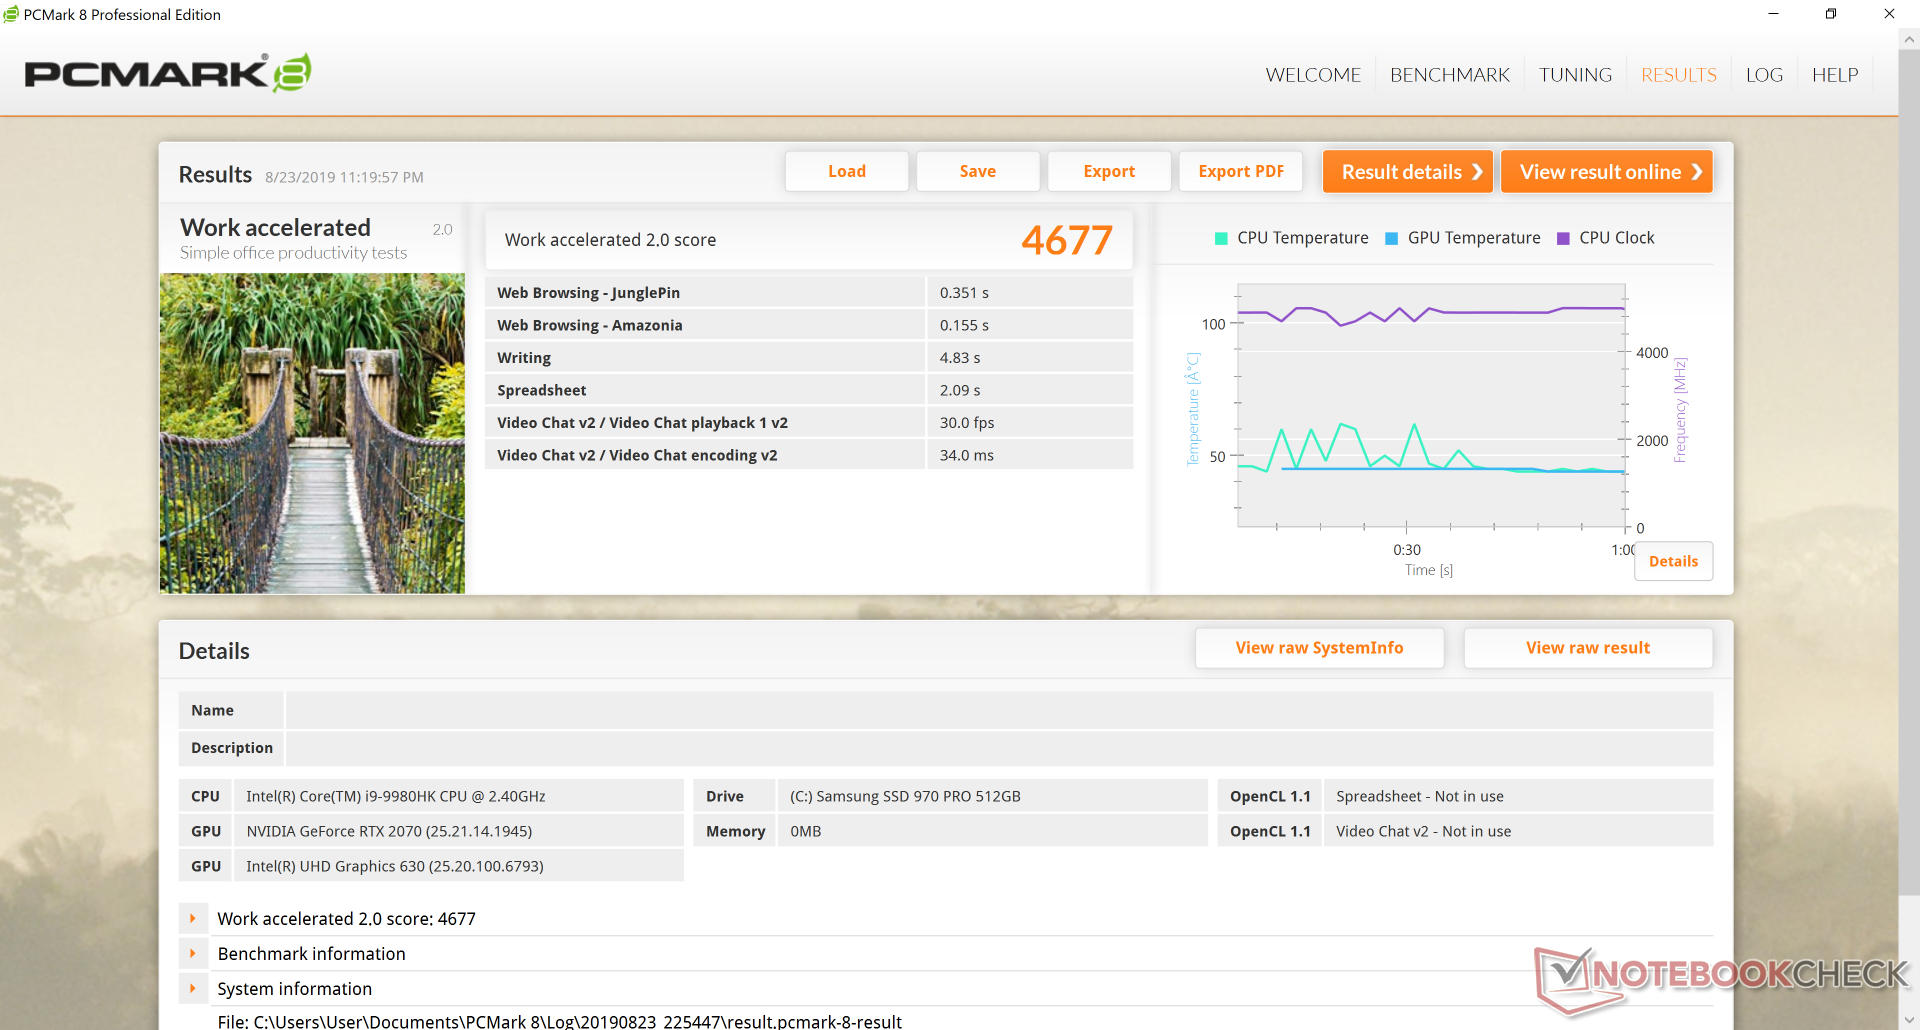
| PCMark 8 Home Score Accelerated v2 | 3758 points | |
| PCMark 8 Work Score Accelerated v2 | 4677 points | |
| PCMark 10 Score | 6283 points | |
Help | ||
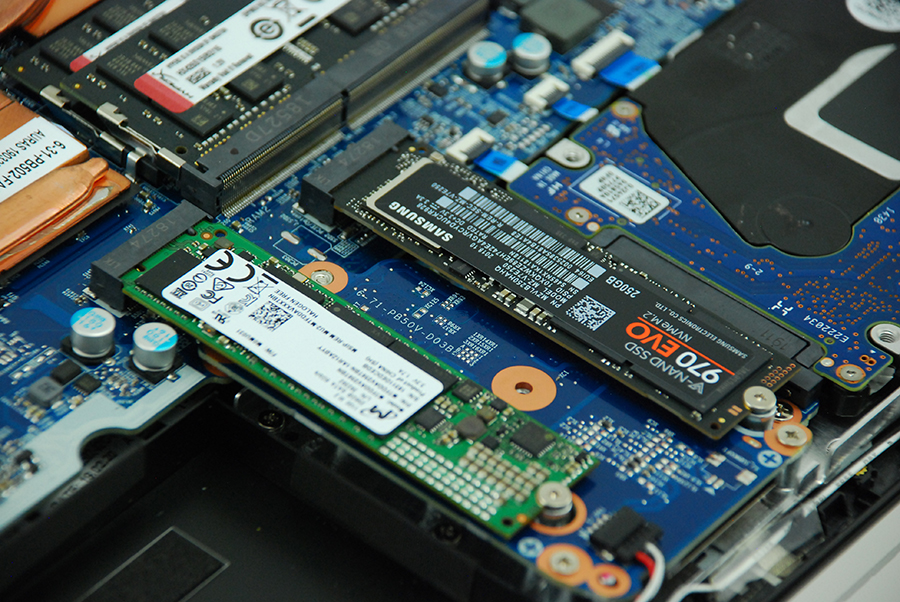
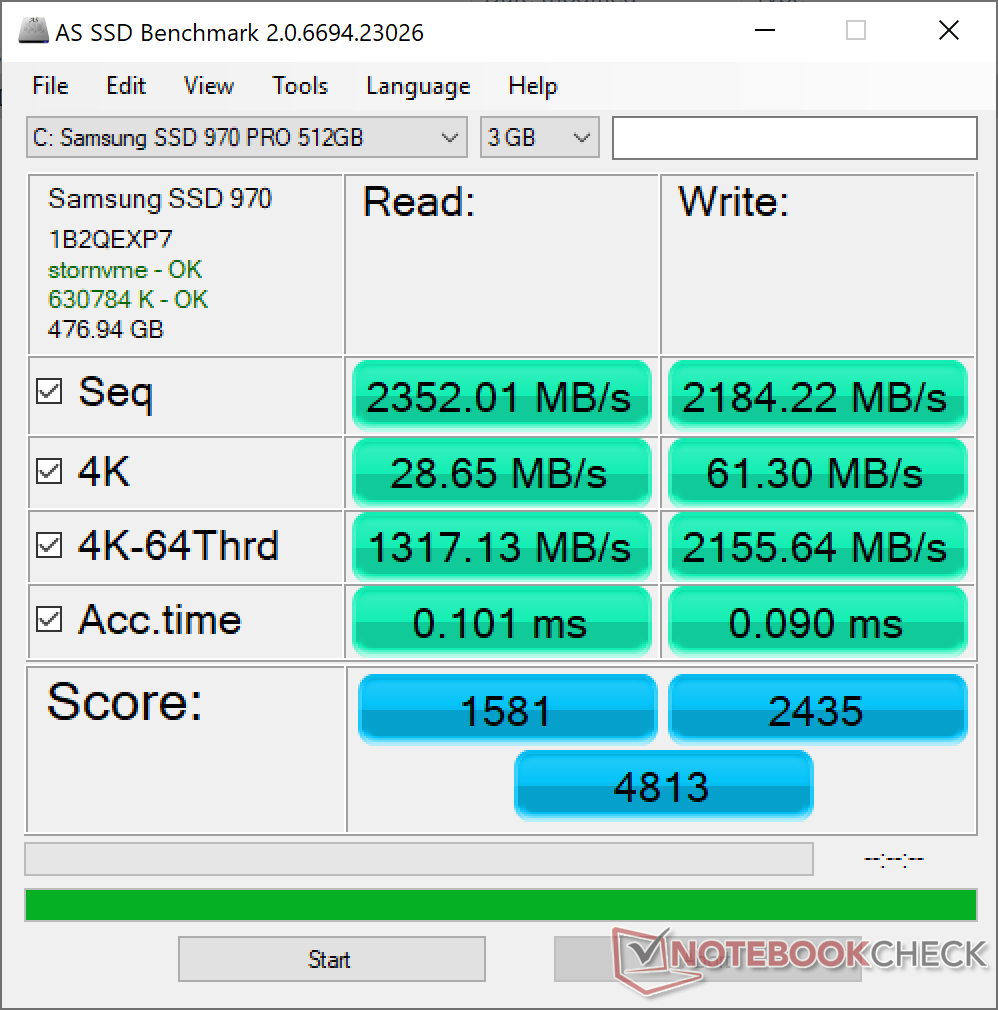
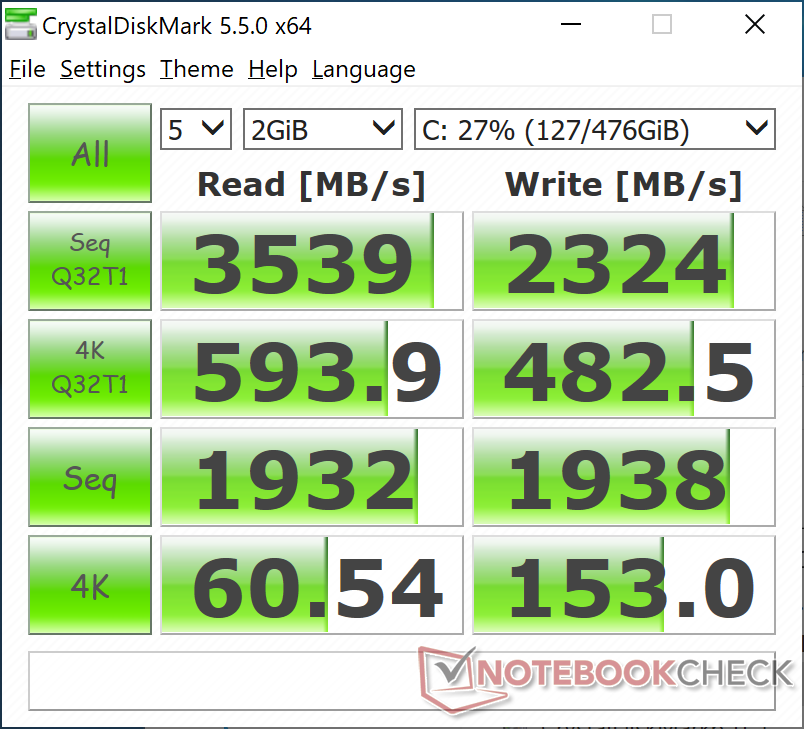
Storage Devices
| Eurocom Nightsky RX15 Samsung SSD 970 Pro 512GB | Eurocom Sky X4C Samsung SSD 960 Pro 1TB m.2 NVMe | Razer Blade 15 RTX 2080 Max-Q Samsung SSD PM981 MZVLB512HAJQ | MSI GE63 Raider RGB 8RF-008 Samsung SSD PM871a MZNLN256HMHQ | Dell XPS 15 7590 9980HK GTX 1650 Toshiba XG6 KXG60ZNV1T02 | |
|---|---|---|---|---|---|
| AS SSD | 13% | 6% | -44% | 8% | |
| Seq Read (MB/s) | 2352 | 2541 8% | 1832 -22% | 512 -78% | 1723 -27% |
| Seq Write (MB/s) | 2184 | 1989 -9% | 1864 -15% | 462.8 -79% | 1386 -37% |
| 4K Read (MB/s) | 28.65 | 44.83 56% | 52.1 82% | 32.36 13% | 43.25 51% |
| 4K Write (MB/s) | 61.3 | 129.6 111% | 108.3 77% | 68.6 12% | 98.3 60% |
| 4K-64 Read (MB/s) | 1317 | 1646 25% | 1159 -12% | 348.6 -74% | 1078 -18% |
| 4K-64 Write (MB/s) | 2156 | 1375 -36% | 1807 -16% | 294.3 -86% | 1456 -32% |
| Access Time Read * (ms) | 0.101 | 0.032 68% | 0.05 50% | 0.101 -0% | 0.05 50% |
| Access Time Write * (ms) | 0.09 | 0.03 67% | 0.034 62% | 0.051 43% | 0.039 57% |
| Score Read (Points) | 1581 | 1945 23% | 1394 -12% | 432 -73% | 1294 -18% |
| Score Write (Points) | 2435 | 1703 -30% | 2102 -14% | 409 -83% | 1693 -30% |
| Score Total (Points) | 4813 | 4615 -4% | 4221 -12% | 1071 -78% | 3638 -24% |
| Copy ISO MB/s (MB/s) | 2705 | 1908 -29% | 2083 -23% | 3182 18% | |
| Copy Program MB/s (MB/s) | 666 | 467.2 -30% | 496.5 -25% | 984 48% | |
| Copy Game MB/s (MB/s) | 1583 | 1055 -33% | 977 -38% | 1824 15% |
* ... smaller is better

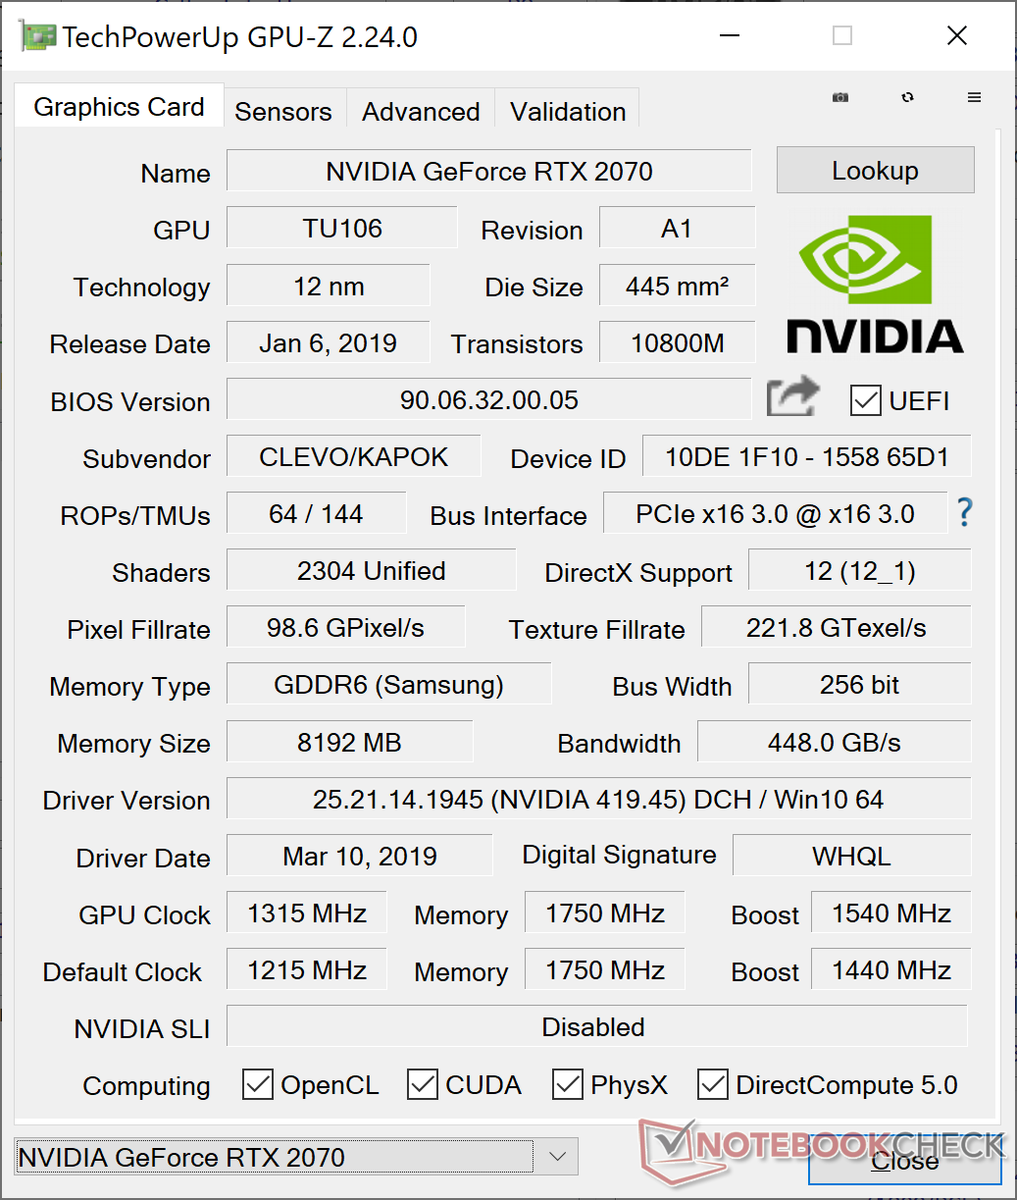
GPU Performance
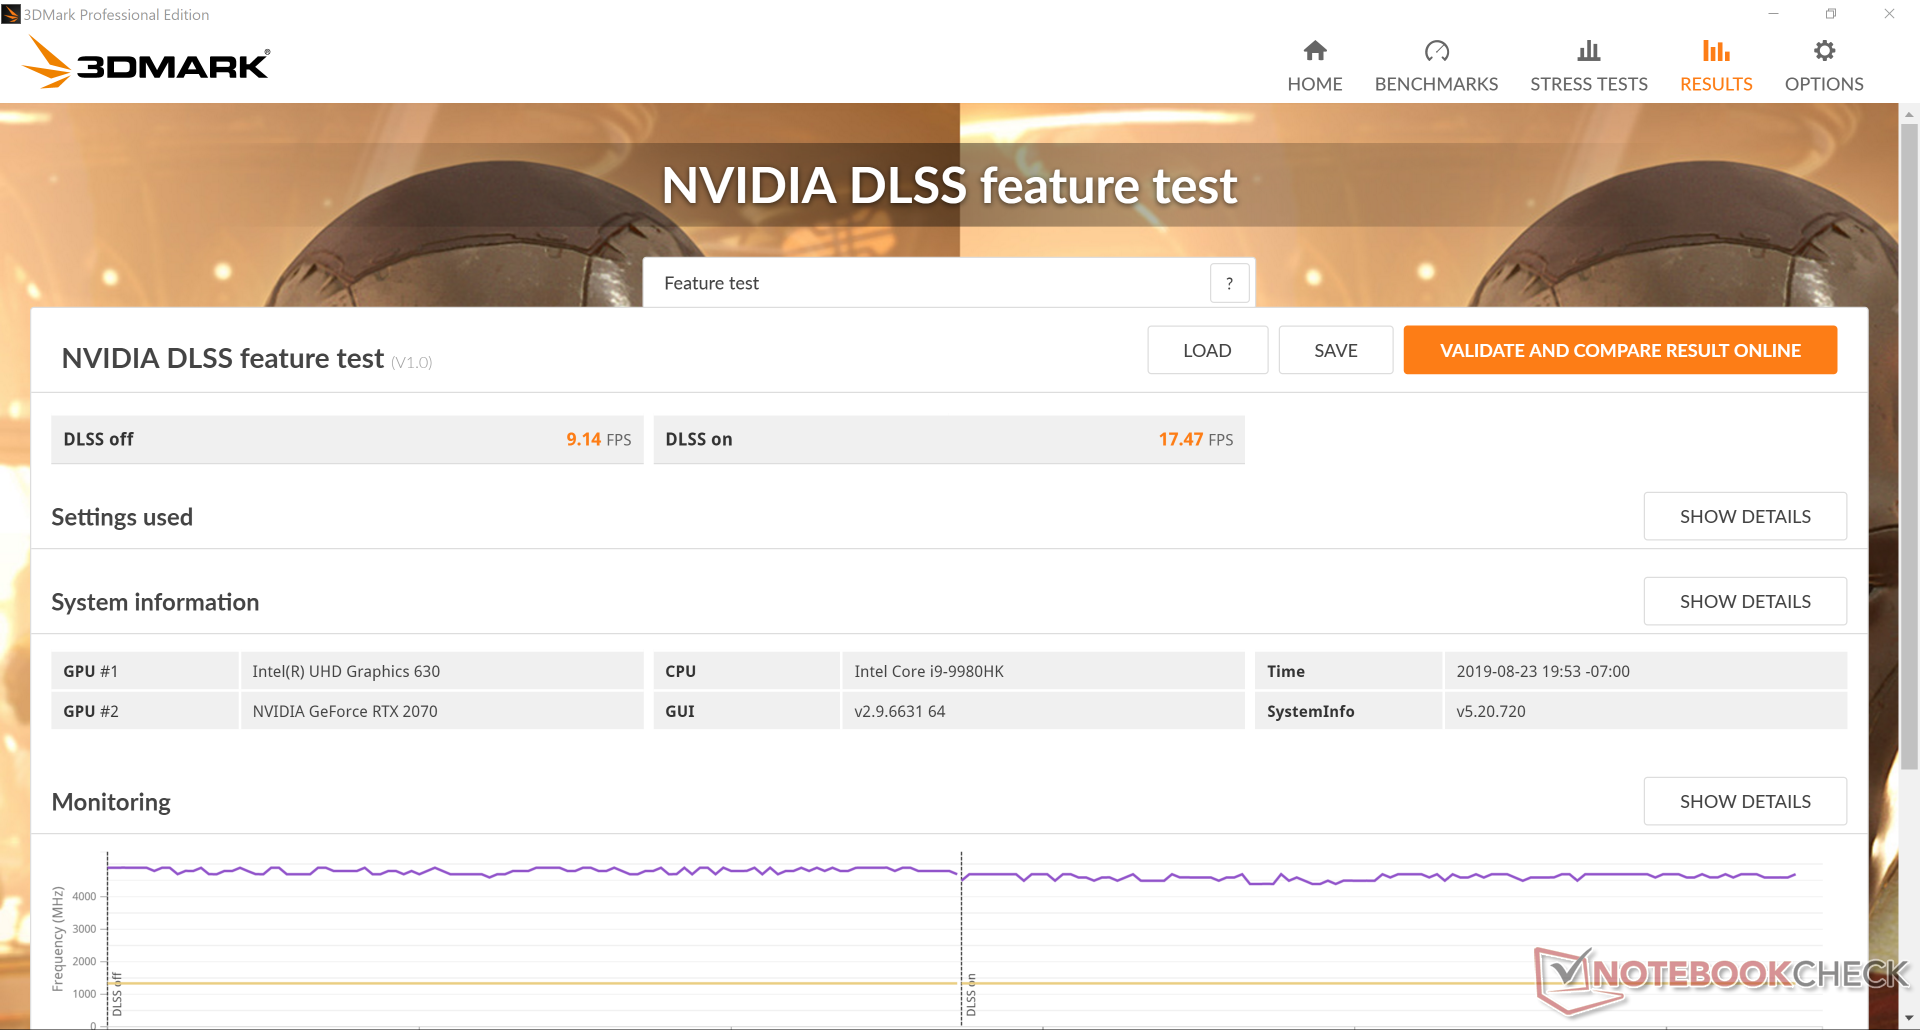
The mobile GeForce RTX 2070 is performing exactly where we expect it to be relative to other gaming laptops with the same GPU. Users can expect performance to be about 15 to 20 percent slower than the desktop GeForce RTX 2070. Upgrading from the Nightsky Ti15 GTX 1660 Ti SKU will see a raw performance boost of about 36 percent. There is enough power to play any title at 1080p60 with most or all settings at maximum. 4K gaming is also possible albeit with most settings turned to Low or Low-Medium.
See our dedicated page on the mobile GeForce RTX 2070 for more technical information and benchmark comparisons.
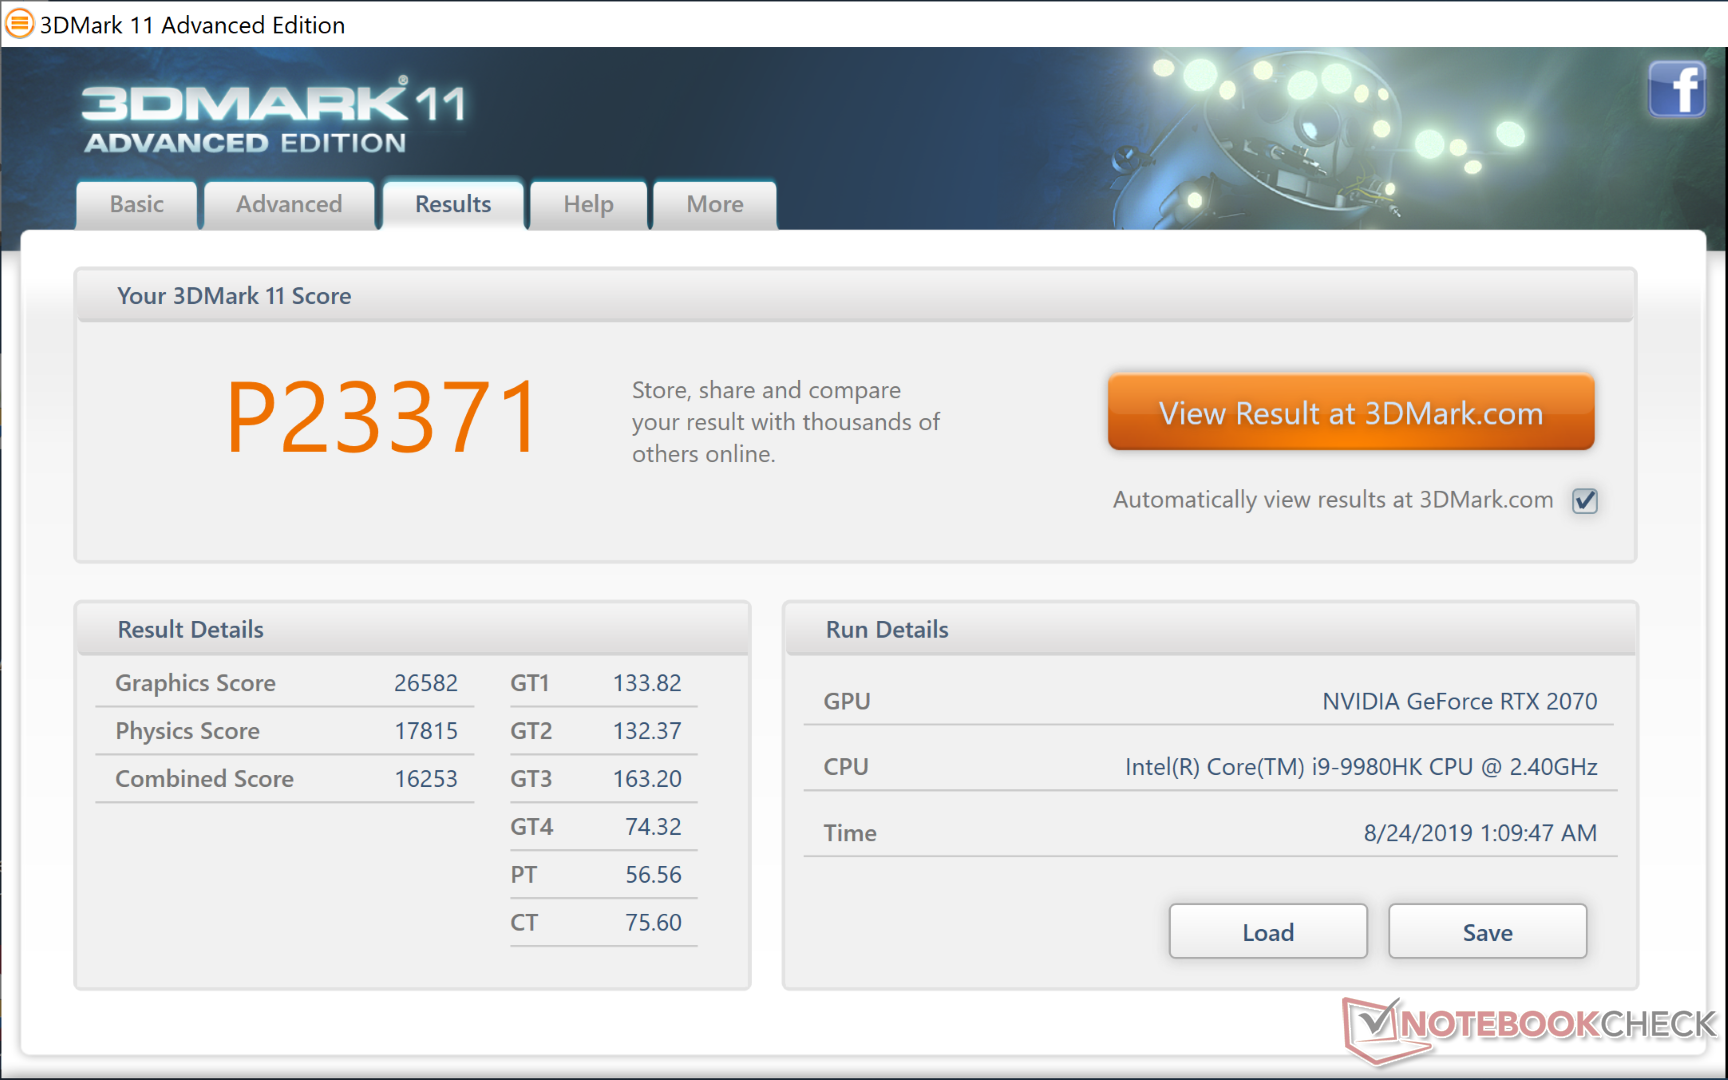
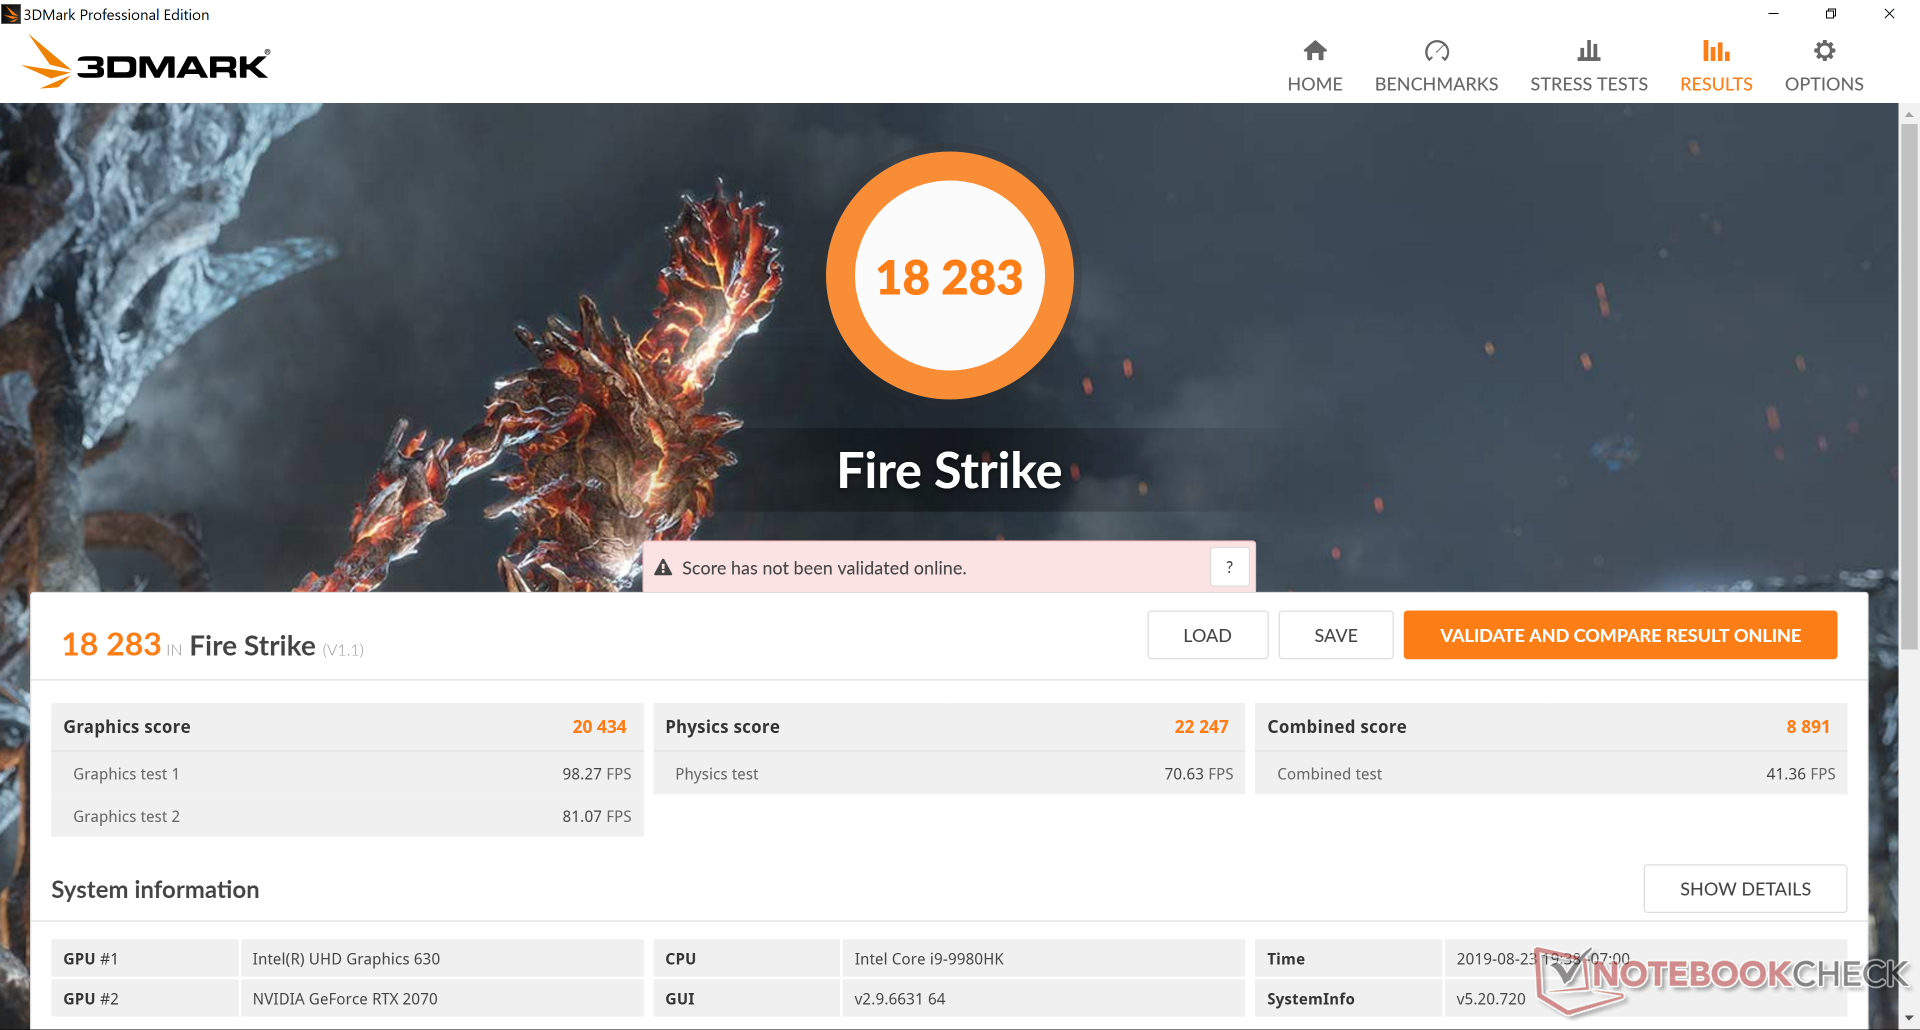
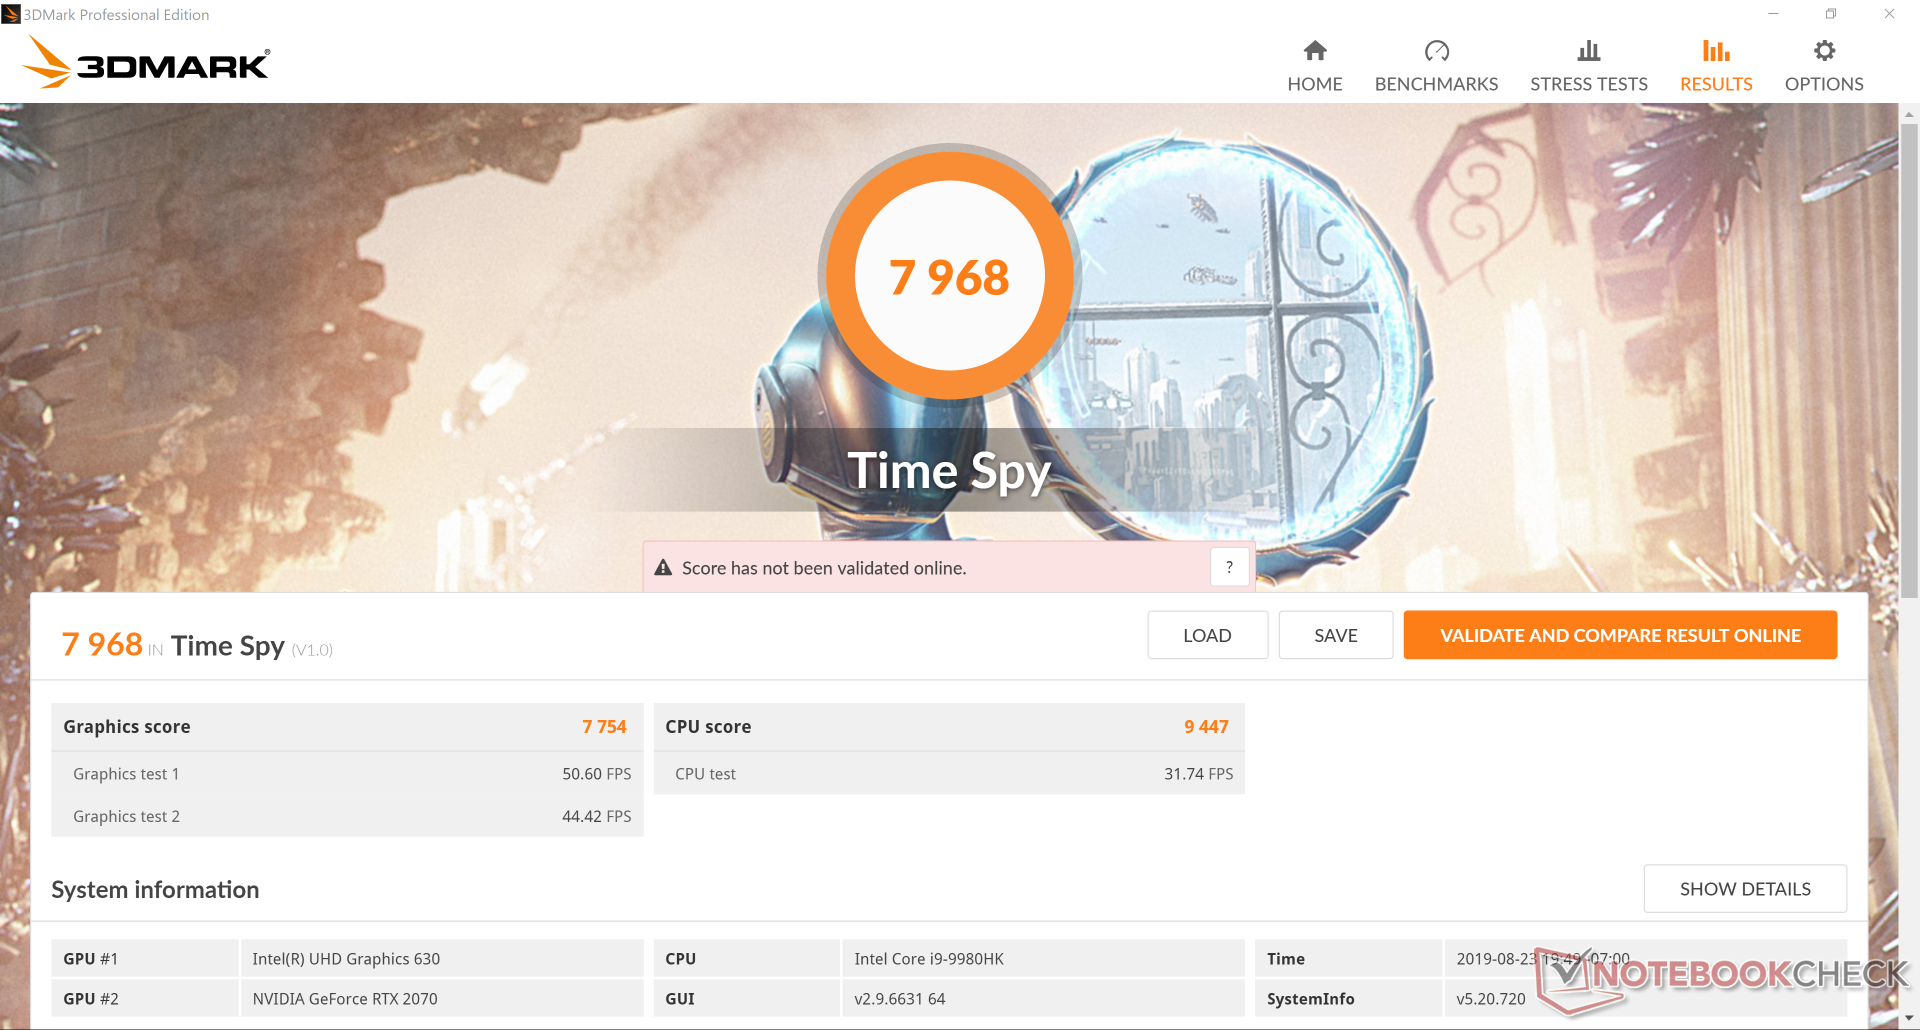
| 3DMark 11 Performance | 23371 points | |
| 3DMark Cloud Gate Standard Score | 40808 points | |
| 3DMark Fire Strike Score | 18283 points | |
| 3DMark Time Spy Score | 7968 points | |
Help | ||
| low | med. | high | ultra | 4K | |
|---|---|---|---|---|---|
| BioShock Infinite (2013) | 391.4 | 345.6 | 320.2 | 181.3 | |
| The Witcher 3 (2015) | 329.3 | 244.8 | 155.8 | 80.6 | 57.4 |
| Shadow of the Tomb Raider (2018) | 160 | 114 | 107 | 97 | 34 |
Emissions
System Noise
Fan noise when gaming is identical to the Nightsky Ti15 meaning that users get faster graphics performance from the Nightsky RX15 without necessarily running any louder. The fans will, however, ramp up faster to become loud more quickly when under heavy processing stress. At 53.7 dB(A), the Eurocom is louder than we would like even for a gaming laptop.
We recommend setting the system to Quiet mode if not gaming to prevent the fans from pulsing. Fan noise maxes out at 33.4 dB(A) when set to this mode.
| Eurocom Nightsky RX15 GeForce RTX 2070 Mobile, i9-9980HK, Samsung SSD 970 Pro 512GB | Eurocom Sky X4C GeForce GTX 1080 Mobile, i7-8700K, Samsung SSD 960 Pro 1TB m.2 NVMe | HP Omen 15-dc1303ng GeForce RTX 2070 Max-Q, i7-8750H, Samsung SSD PM981 MZVLB256HAHQ | Razer Blade 15 RTX 2080 Max-Q GeForce RTX 2080 Max-Q, i7-9750H, Samsung SSD PM981 MZVLB512HAJQ | MSI GE63 Raider RGB 8RF-008 GeForce GTX 1070 Mobile, i7-8750H, Samsung SSD PM871a MZNLN256HMHQ | Eurocom Nightsky Ti15 GeForce GTX 1660 Ti Mobile, i7-9750H, Samsung SSD 970 Pro 512GB | Dell XPS 15 7590 9980HK GTX 1650 GeForce GTX 1650 Mobile, i9-9980HK, Toshiba XG6 KXG60ZNV1T02 | |
|---|---|---|---|---|---|---|---|
| Noise | 4% | -2% | 11% | -5% | 3% | 7% | |
| off / environment * (dB) | 28.2 | 28.6 -1% | 30.5 -8% | 28.3 -0% | 30 -6% | 28.4 -1% | 28.2 -0% |
| Idle Minimum * (dB) | 28.2 | 28.6 -1% | 32.8 -16% | 28.8 -2% | 30 -6% | 28.6 -1% | 28.2 -0% |
| Idle Average * (dB) | 28.2 | 28.6 -1% | 32.8 -16% | 28.8 -2% | 35 -24% | 28.6 -1% | 28.2 -0% |
| Idle Maximum * (dB) | 31.7 | 31.1 2% | 32.8 -3% | 29 9% | 36 -14% | 28.6 10% | 30.4 4% |
| Load Average * (dB) | 53.7 | 42.2 21% | 42.5 21% | 33.5 38% | 42 22% | 47.8 11% | 43.8 18% |
| Witcher 3 ultra * (dB) | 53.7 | 53.8 -0% | 45 16% | 54 -1% | 53.7 -0% | 47.2 12% | |
| Load Maximum * (dB) | 53.7 | 50 7% | 47.5 12% | 45.2 16% | 56 -4% | 53.7 -0% | 47.2 12% |
* ... smaller is better
Noise level
| Idle |
| 28.2 / 28.2 / 31.7 dB(A) |
| HDD |
| 0 dB(A) |
| Load |
| 53.7 / 53.7 dB(A) |
 | ||
30 dB silent 40 dB(A) audible 50 dB(A) loud |
||
min: | ||
Temperature
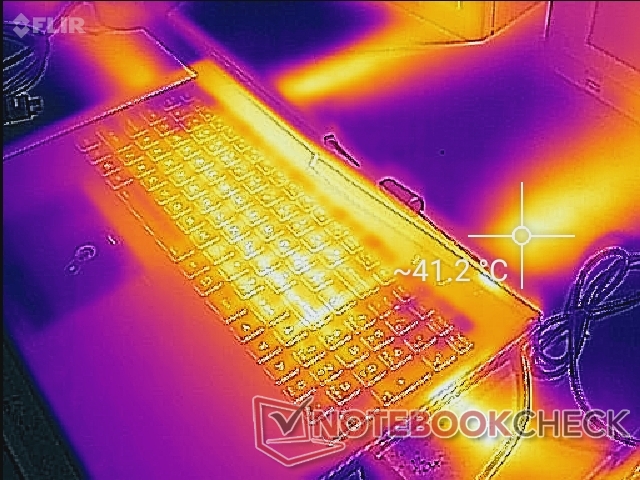
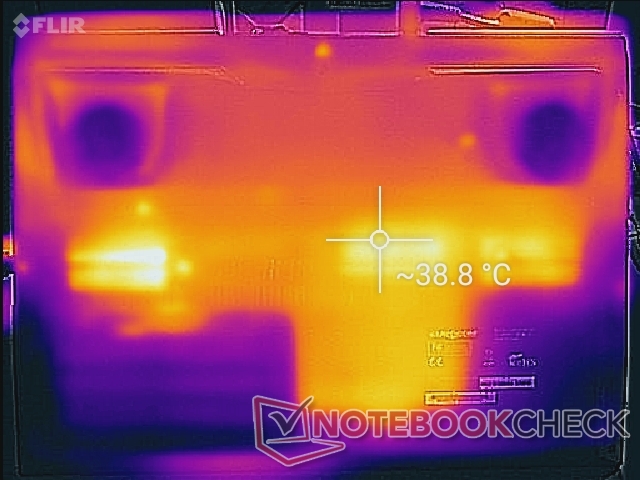
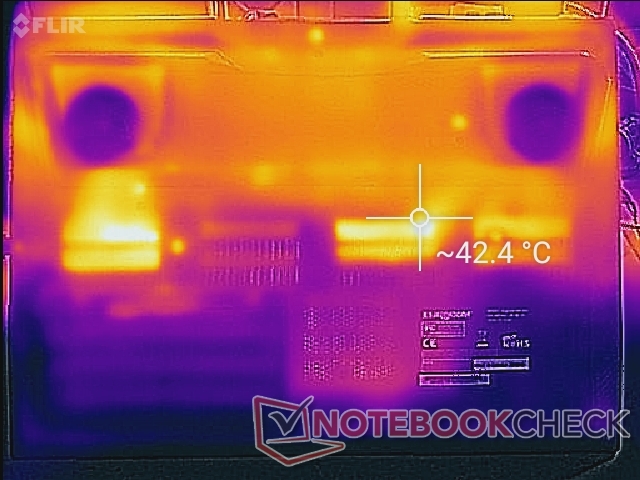
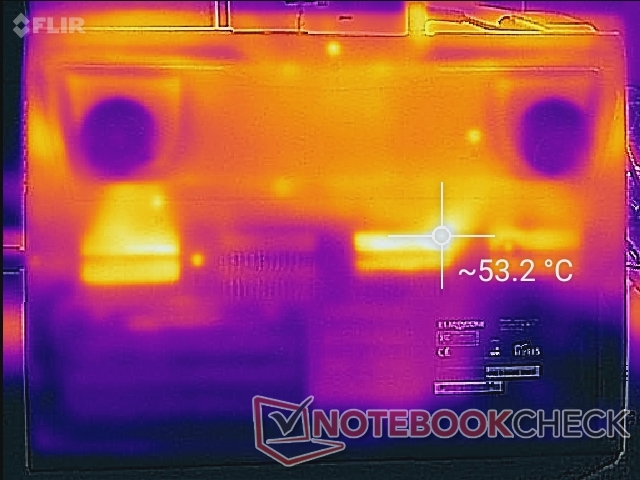
Surface temperatures are nearly the same as on the Nightsky Ti15. When at maximum stress, surface temperatures are actually slightly cooler than expected since core temperatures are cooler as our next section will show. The WASD keys, NumPad, and palm rests remain cool no matter the load, but be sure to not block any of the many ventilation grilles on the sides or bottom.
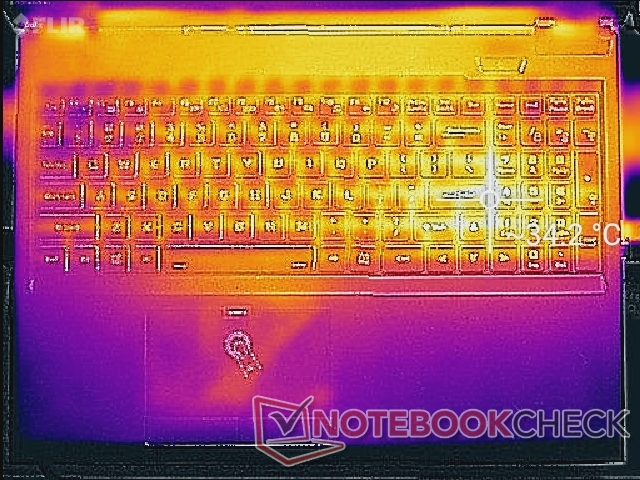
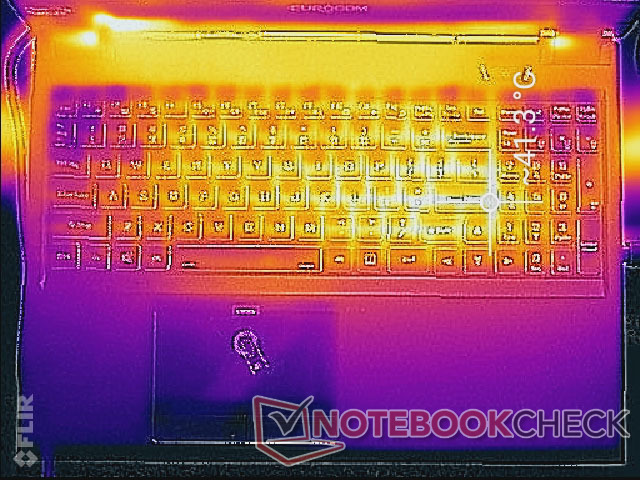
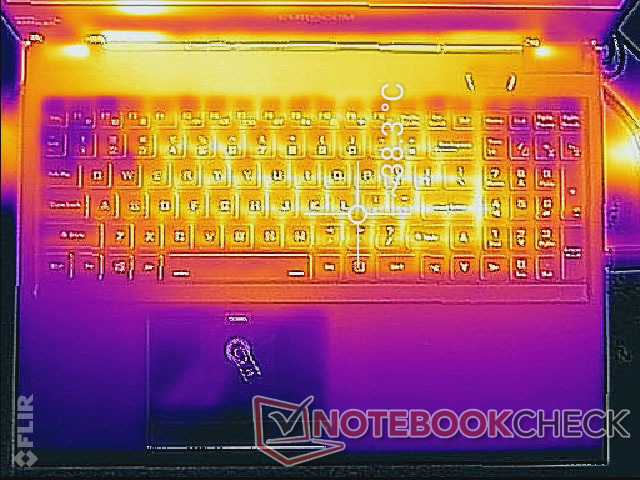
(±) The maximum temperature on the upper side is 40.2 °C / 104 F, compared to the average of 40.4 °C / 105 F, ranging from 21.2 to 68.8 °C for the class Gaming.
(-) The bottom heats up to a maximum of 53 °C / 127 F, compared to the average of 43.2 °C / 110 F
(+) In idle usage, the average temperature for the upper side is 30.6 °C / 87 F, compared to the device average of 33.9 °C / 93 F.
(±) Playing The Witcher 3, the average temperature for the upper side is 34.9 °C / 95 F, compared to the device average of 33.9 °C / 93 F.
(+) The palmrests and touchpad are cooler than skin temperature with a maximum of 29.4 °C / 84.9 F and are therefore cool to the touch.
(±) The average temperature of the palmrest area of similar devices was 28.8 °C / 83.8 F (-0.6 °C / -1.1 F).
Stress Test
We stress the system to identify for any potential throttling or stability issues. When running Prime95, the CPU can be observed running as high as 4.2 GHz for the first minute or so until hitting a core temperature of 83 C. Thereafter, clock rate and temperature drop to 3.3 GHz and 65 C, respectively, much like what we observed on the Nightsky Ti15 with the Core i7-9750H. There is thermal headroom for overclocking if desired.
When running both Prime95 and FurMark simultaneously, CPU clock rates can occasionally fall to just 2.4 GHz for very short periods which is unusual for a laptop. GPU temperature is also curiously much cooler than on the Nightsky Ti15 by about 12 C to explain the cooler surface temperatures above.
When running Witcher 3, CPU and GPU clock rates remain relatively steady with core temperatures not unlike the Nightsky Ti15 despite the faster hardware of the Nightsky RX15. The Asus Strix G531GW with the same RTX 2070 GPU runs slightly warmer at 77 C when under the same gaming load.
Running on batteries will limit performance. A 3DMark Fire Strike run on battery power returns Physics and Graphics scores of 10148 and 5553 points, respectively, compared to 22247 and 20434 points when on mains.
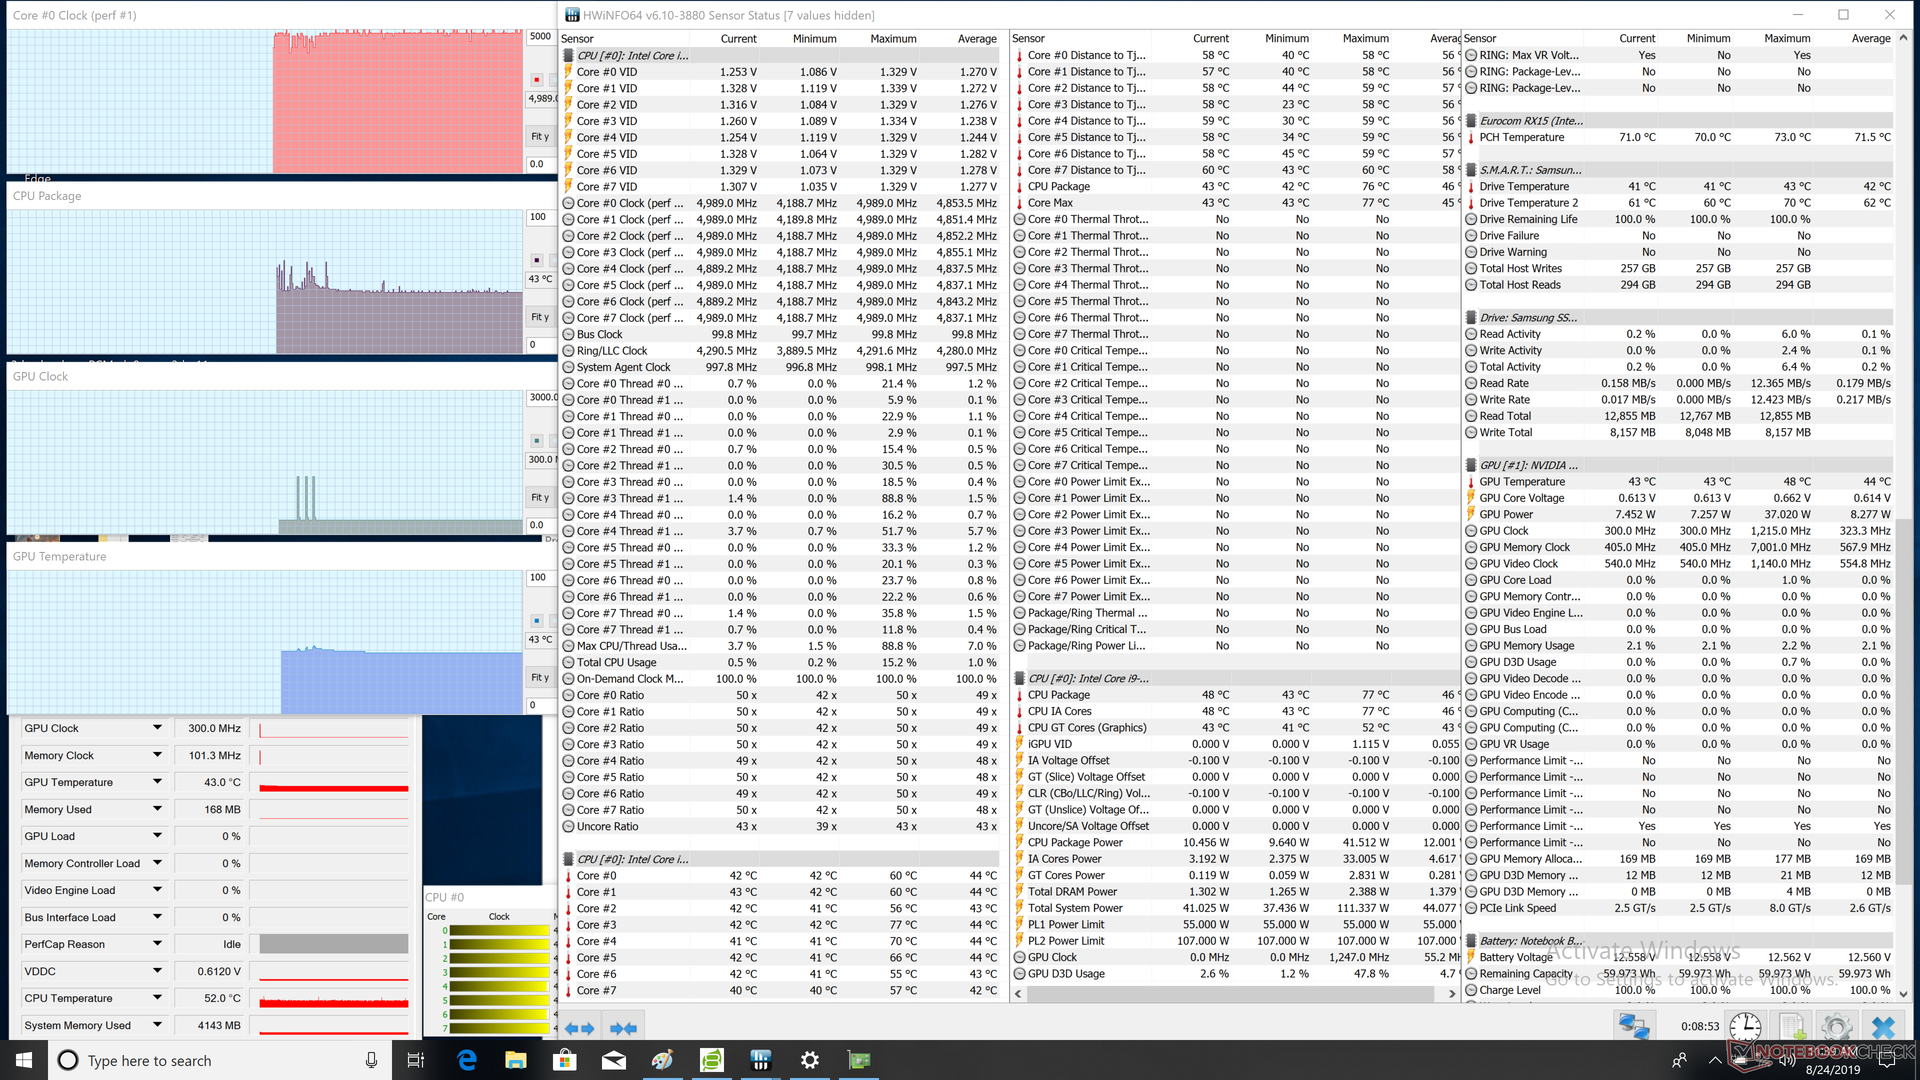
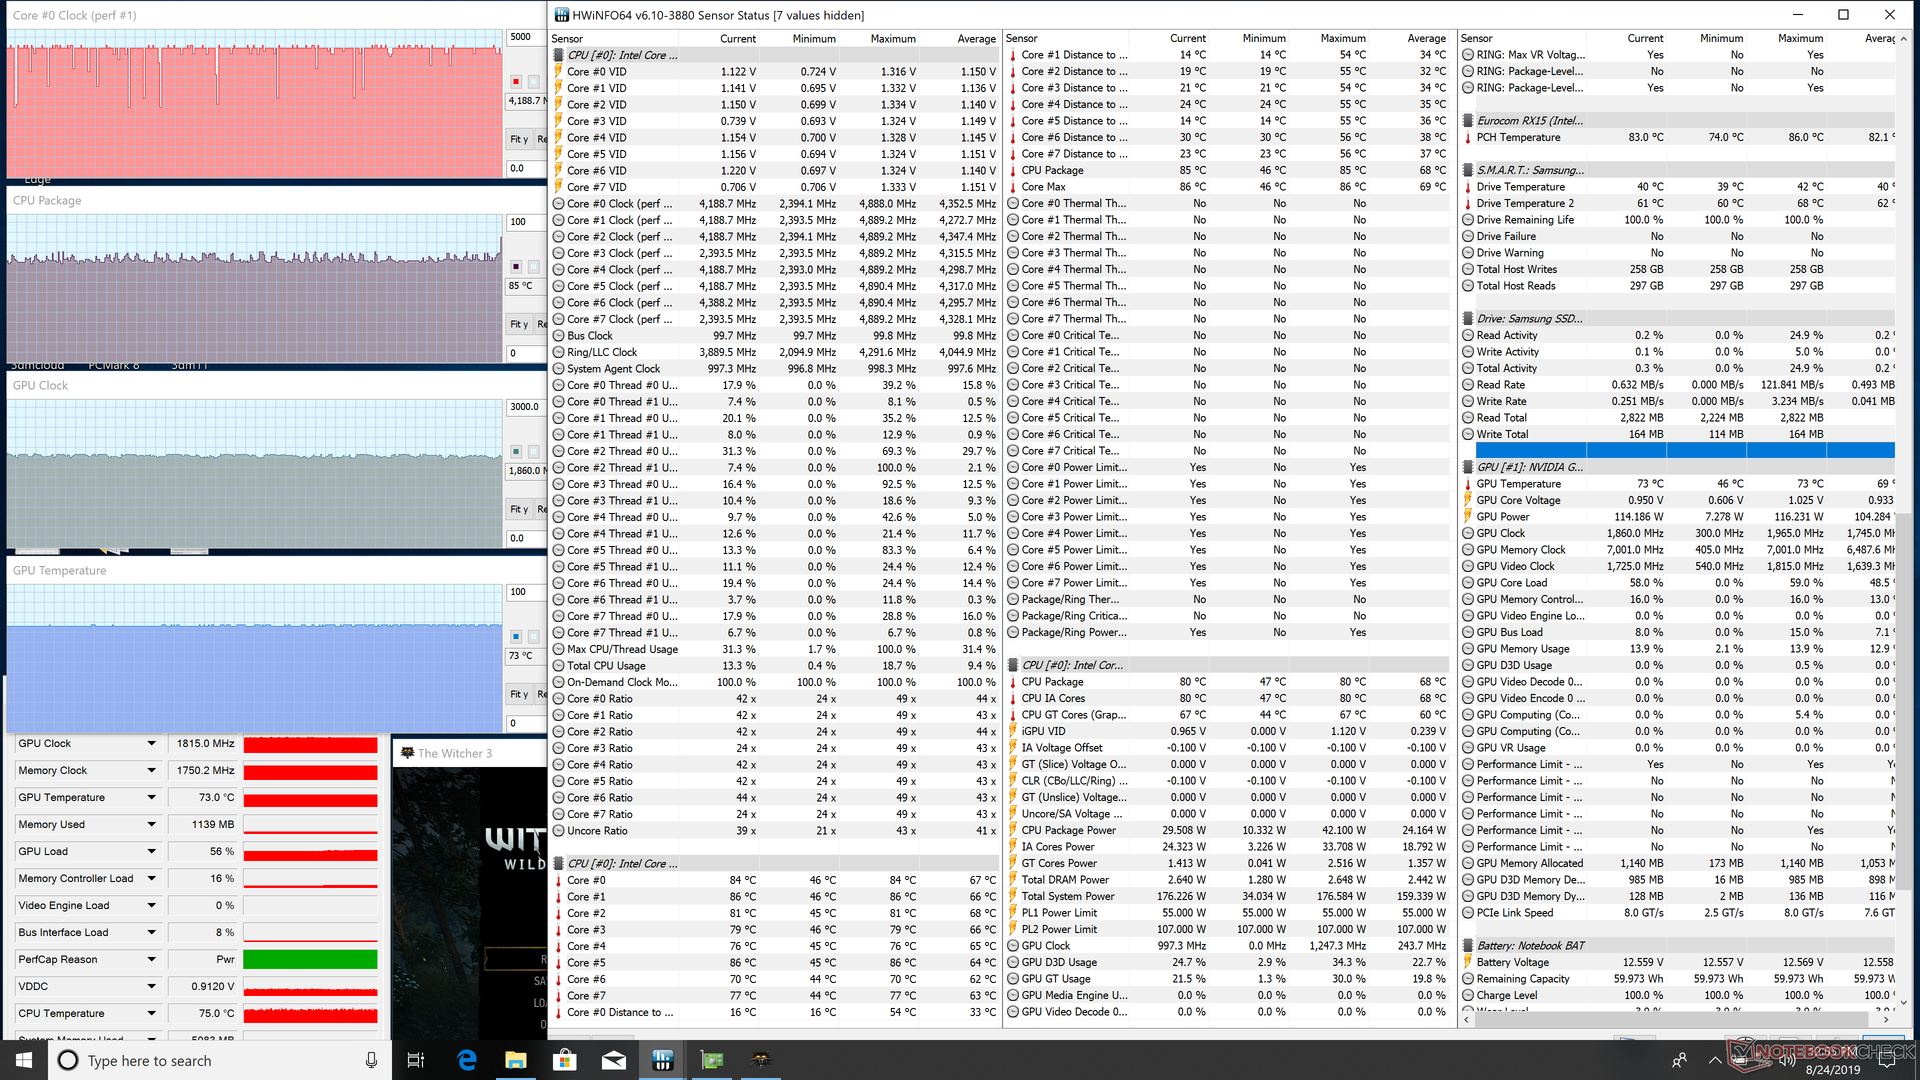
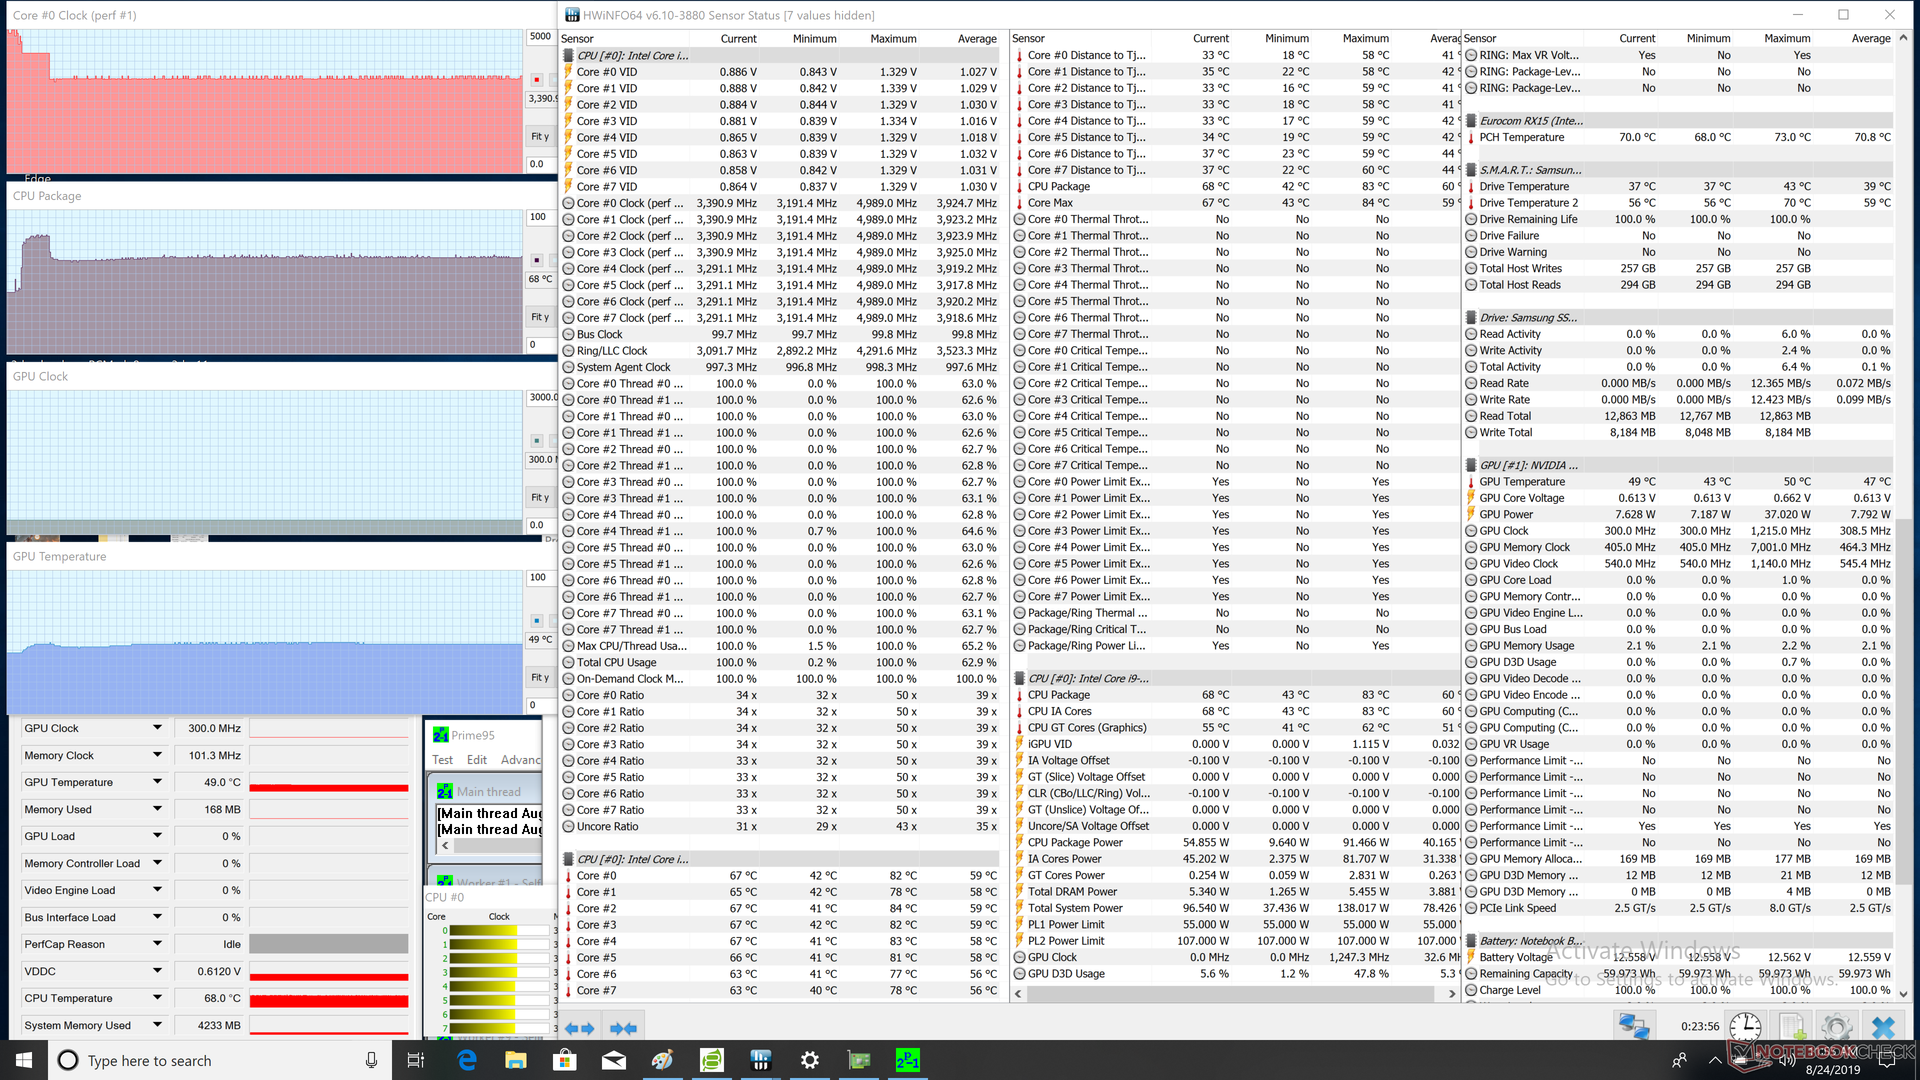
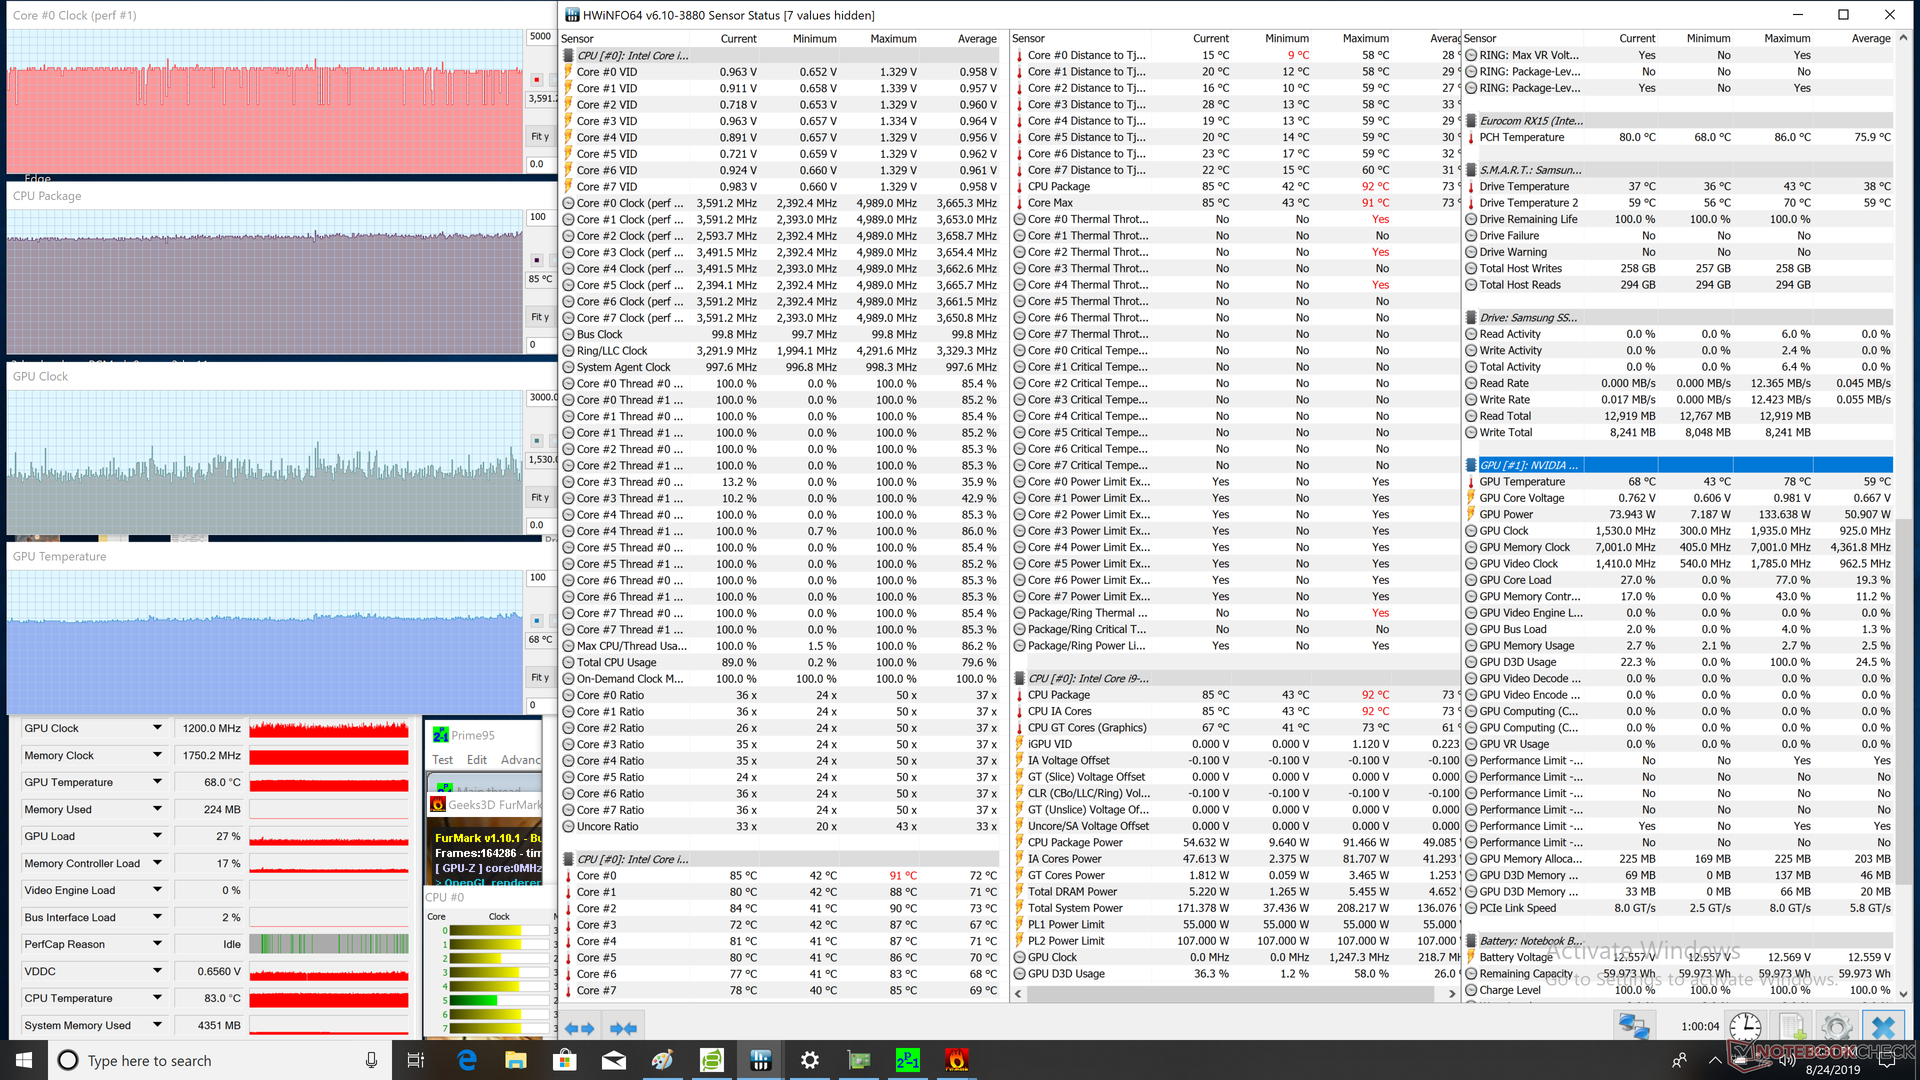
| CPU Clock (GHz) | GPU Clock (MHz) | Average CPU Temperature (°C) | Average GPU Temperature (°C) | |
| System Idle | -- | -- | 43 | 43 |
| Prime95 Stress | 3.3 - 3.4 | -- | 68 | -- |
| Prime95 + FurMark Stress | 2.4 - 3.6 | ~1200 | 85 | 68 |
| Witcher 3 Stress | ~4.2 | 1815 | ~79 | 73 |
Speakers

Eurocom Nightsky RX15 audio analysis
(+) | speakers can play relatively loud (85.6 dB)
Bass 100 - 315 Hz
(-) | nearly no bass - on average 28.4% lower than median
(±) | linearity of bass is average (12.4% delta to prev. frequency)
Mids 400 - 2000 Hz
(+) | balanced mids - only 4.5% away from median
(±) | linearity of mids is average (7% delta to prev. frequency)
Highs 2 - 16 kHz
(+) | balanced highs - only 1.6% away from median
(+) | highs are linear (5.7% delta to prev. frequency)
Overall 100 - 16.000 Hz
(±) | linearity of overall sound is average (24.4% difference to median)
Compared to same class
» 88% of all tested devices in this class were better, 3% similar, 8% worse
» The best had a delta of 6%, average was 18%, worst was 132%
Compared to all devices tested
» 74% of all tested devices were better, 6% similar, 20% worse
» The best had a delta of 4%, average was 24%, worst was 134%
Apple MacBook 12 (Early 2016) 1.1 GHz audio analysis
(+) | speakers can play relatively loud (83.6 dB)
Bass 100 - 315 Hz
(±) | reduced bass - on average 11.3% lower than median
(±) | linearity of bass is average (14.2% delta to prev. frequency)
Mids 400 - 2000 Hz
(+) | balanced mids - only 2.4% away from median
(+) | mids are linear (5.5% delta to prev. frequency)
Highs 2 - 16 kHz
(+) | balanced highs - only 2% away from median
(+) | highs are linear (4.5% delta to prev. frequency)
Overall 100 - 16.000 Hz
(+) | overall sound is linear (10.2% difference to median)
Compared to same class
» 7% of all tested devices in this class were better, 2% similar, 91% worse
» The best had a delta of 5%, average was 18%, worst was 53%
Compared to all devices tested
» 5% of all tested devices were better, 1% similar, 94% worse
» The best had a delta of 4%, average was 24%, worst was 134%
Energy Management
Power Consumption
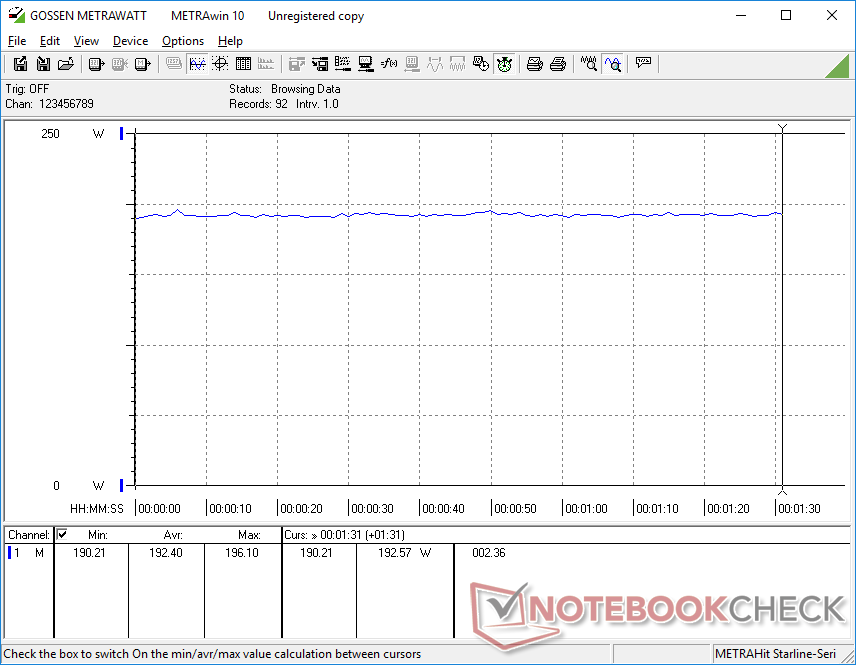
When gaming, power consumption is relatively steady at about 192 W to be 36 percent more demanding than the Nightsky Ti15 with GTX 1660 Ti graphics. Perhaps not coincidentally, the RTX 2070 outscores the GTX 1660 Ti by 36 percent in the 3DMark Time Spy benchmark.
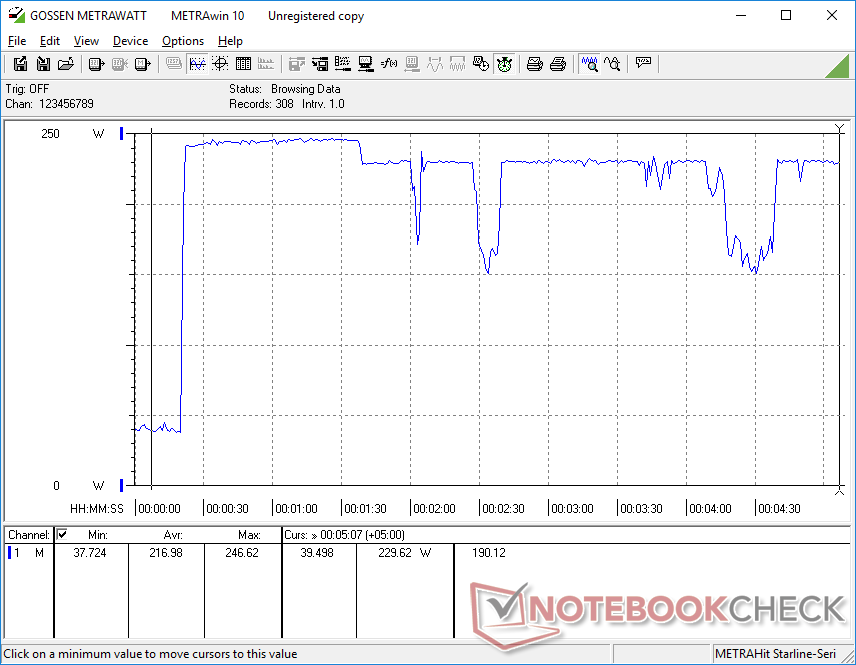
We're able to record a maximum consumption of 246 W from the medium-sized (~15 x 7.5 x 3 cm) 230 W AC adapter when running both Prime95 and FurMark simultaneously. After about 1 minute, consumption drops to the 150 W to 230 W range. Battery recharge rate becomes very slow when the CPU and GPU are at 100 percent utilization since power consumption can be so high relative to the output of the AC adapter. We would have preferred a higher watt output overhead since this system ships with an unlocked Core i9 CPU.
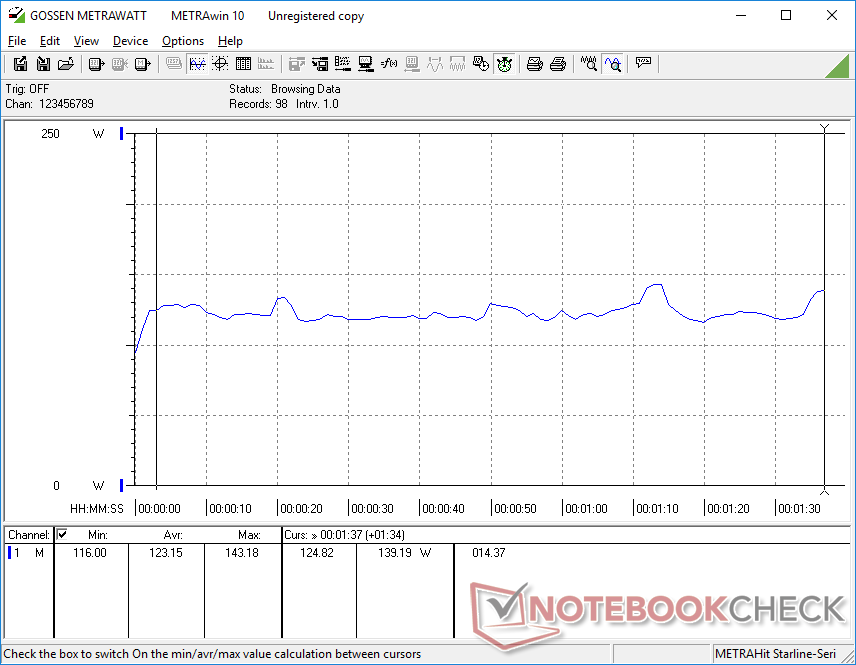
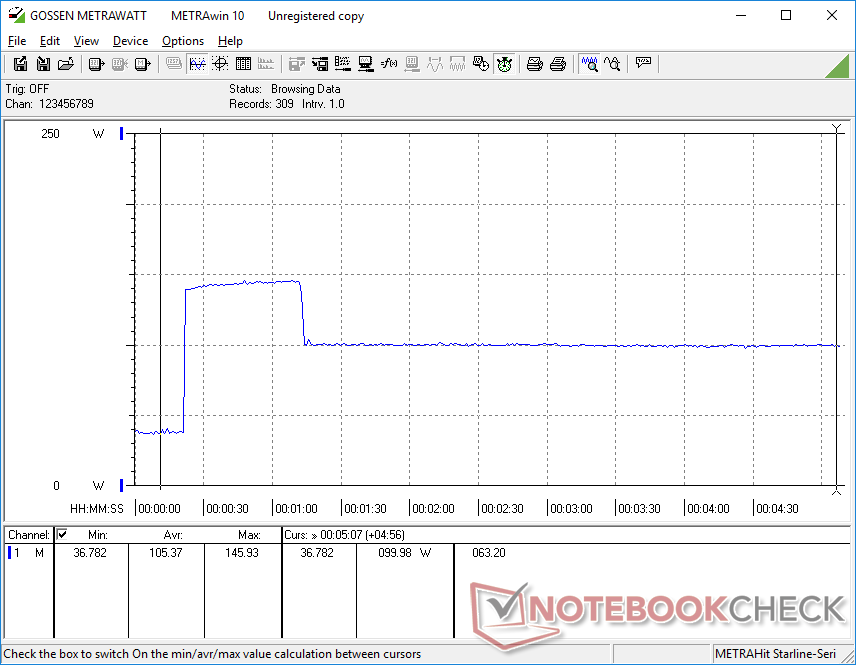
When running Prime95, consumption spikes to 145 W for the first minute before dropping and stabilizing at 100 W. This behavior mirrors our Turbo Boost clock rate observations and CineBench R15 graph above.
Note that the 230 W AC adapter here is larger than the 180 W AC adapter that ships with the less demanding Nightsky Ti15.
| Off / Standby | |
| Idle | |
| Load |
|
Key:
min: | |
| Eurocom Nightsky RX15 i9-9980HK, GeForce RTX 2070 Mobile, Samsung SSD 970 Pro 512GB, OLED, 3840x2160, 15.6" | Eurocom Sky X4C i7-8700K, GeForce GTX 1080 Mobile, Samsung SSD 960 Pro 1TB m.2 NVMe, IPS, 3840x2160, 15.6" | Razer Blade 15 RTX 2080 Max-Q i7-9750H, GeForce RTX 2080 Max-Q, Samsung SSD PM981 MZVLB512HAJQ, IPS, 1920x1080, 15.6" | MSI GE63 Raider RGB 8RF-008 i7-8750H, GeForce GTX 1070 Mobile, Samsung SSD PM871a MZNLN256HMHQ, TN, 1920x1080, 15.6" | Eurocom Nightsky Ti15 i7-9750H, GeForce GTX 1660 Ti Mobile, Samsung SSD 970 Pro 512GB, IPS, 1920x1080, 15.6" | Asus Strix Scar III G531GW i9-9880H, GeForce RTX 2070 Mobile, Intel SSD 660p 1TB SSDPEKNW010T8, IPS, 1920x1080, 15.6" | |
|---|---|---|---|---|---|---|
| Power Consumption | -33% | 21% | 24% | 3% | -32% | |
| Idle Minimum * (Watt) | 12.6 | 30.2 -140% | 12.5 1% | 9 29% | 16.8 -33% | 29 -130% |
| Idle Average * (Watt) | 21.4 | 34.7 -62% | 15.3 29% | 14 35% | 29 -36% | 32 -50% |
| Idle Maximum * (Watt) | 34.4 | 37.8 -10% | 20.7 40% | 19 45% | 30.8 10% | 37 -8% |
| Load Average * (Watt) | 123.2 | 130.3 -6% | 90.2 27% | 91 26% | 89.2 28% | 157 -27% |
| Witcher 3 ultra * (Watt) | 192.4 | 172.2 10% | 162 16% | 182 5% | 141.1 27% | 173 10% |
| Load Maximum * (Watt) | 246.6 | 217.7 12% | 209.3 15% | 238 3% | 192.3 22% | 217 12% |
* ... smaller is better
Battery Life
Real-world WLAN runtimes are nearly identical to the Nightsky Ti15 at about 3.5 hours even though the latter is the lesser equipped SKU. For this test, we set both systems to 150 nits while looping the same web pages until automatic shutdown. The higher power consumption of OLED versus IPS does not come into play until brightness settings are very high.
It's worth repeating that the 62 Wh battery is removable and easily replaceable unlike most other laptops these days.
| Eurocom Nightsky RX15 i9-9980HK, GeForce RTX 2070 Mobile, 62 Wh | Eurocom Sky X4C i7-8700K, GeForce GTX 1080 Mobile, 82 Wh | HP Omen 15-dc1303ng i7-8750H, GeForce RTX 2070 Max-Q, 70 Wh | Razer Blade 15 RTX 2080 Max-Q i7-9750H, GeForce RTX 2080 Max-Q, 80 Wh | MSI GE63 Raider RGB 8RF-008 i7-8750H, GeForce GTX 1070 Mobile, 51 Wh | Eurocom Nightsky Ti15 i7-9750H, GeForce GTX 1660 Ti Mobile, 62 Wh | Dell XPS 15 7590 9980HK GTX 1650 i9-9980HK, GeForce GTX 1650 Mobile, 97 Wh | |
|---|---|---|---|---|---|---|---|
| Battery runtime | -24% | -3% | 94% | 18% | 6% | 129% | |
| WiFi v1.3 (h) | 3.4 | 2.6 -24% | 3.3 -3% | 6.6 94% | 4 18% | 3.6 6% | 7.8 129% |
| Reader / Idle (h) | 3 | 5 | 15.9 | 5.7 | 15.2 | ||
| Load (h) | 1.4 | 1.2 | 1.7 | 0.8 | 3.3 |
Pros
Cons
Verdict
Many of our same conclusions about the Nightsky Ti15 apply here for the Nightsky RX15 including the difficult serviceability, excellent keyboard feedback, average battery life, great performance, and loud fans when gaming. We instead want to answer the question: Are the Core i9 and OLED worthwhile upgrades over the base Core i7 and IPS?
The most appropriate SKU will depend on your usage scenario. If you plan on using the Nightsky RX15 primarily for gaming at 60 FPS, then the Core i7 with either IPS or OLED will do the trick. If you're aiming for frame rates greater than 60 FPS, however, then the additional CPU horsepower of the Core i9 and faster native refresh rate of the 144 Hz or 240 Hz IPS panel will serve you better. For a mixed usage scenario between demanding professional workloads, multimedia playback, and gaming, the Core i9 and OLED SKU like the one we have here would be optimal. It's just too bad that servicing is more difficult than it needs to be for an enthusiast offering.
OLED offers noticeably deeper colors, deeper blacks, less ghosting, denser pixels per inch, a brighter picture, and crisper image quality than any current 144 Hz or 240 Hz IPS alternative. For hardcore competitive gamers who value very high frame rates, however, IPS is still the better option.
Eurocom Nightsky RX15
- 08/27/2019 v6 (old)
Allen Ngo
Price comparison
