Asus ROG Strix RTX 2070 OC Desktop Graphics Card Review

A good two years have passed since Nvidia launched its Pascal GPUs. The company introduced its next-generation chips, which are based on its new Turing architecture, at this year’s Gamescom in Cologne. Nvidia promises that the new architecture will offer new features and more power compared to its Pascal GPUs, but most OEMs are yet to bring their customised versions to market. The headline features of Nvidia’s new GPUs are DLSS and raytracing, which promises spectacular light reflections that are calculated in real time. Battlefield V will likely be the first game that takes advantage of these new features, while other games will eventually profit from the new architecture once they have been patched. Further information on this can be found here (in German).
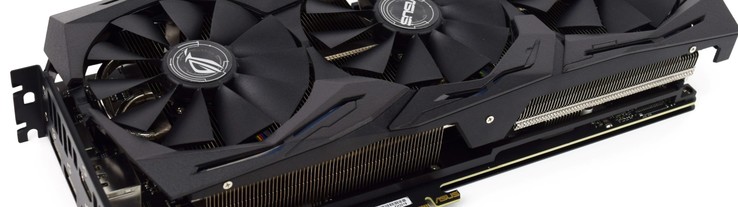
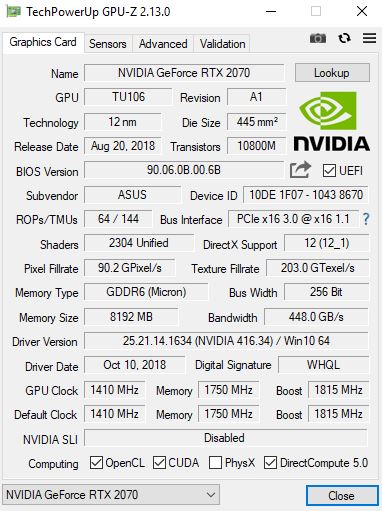
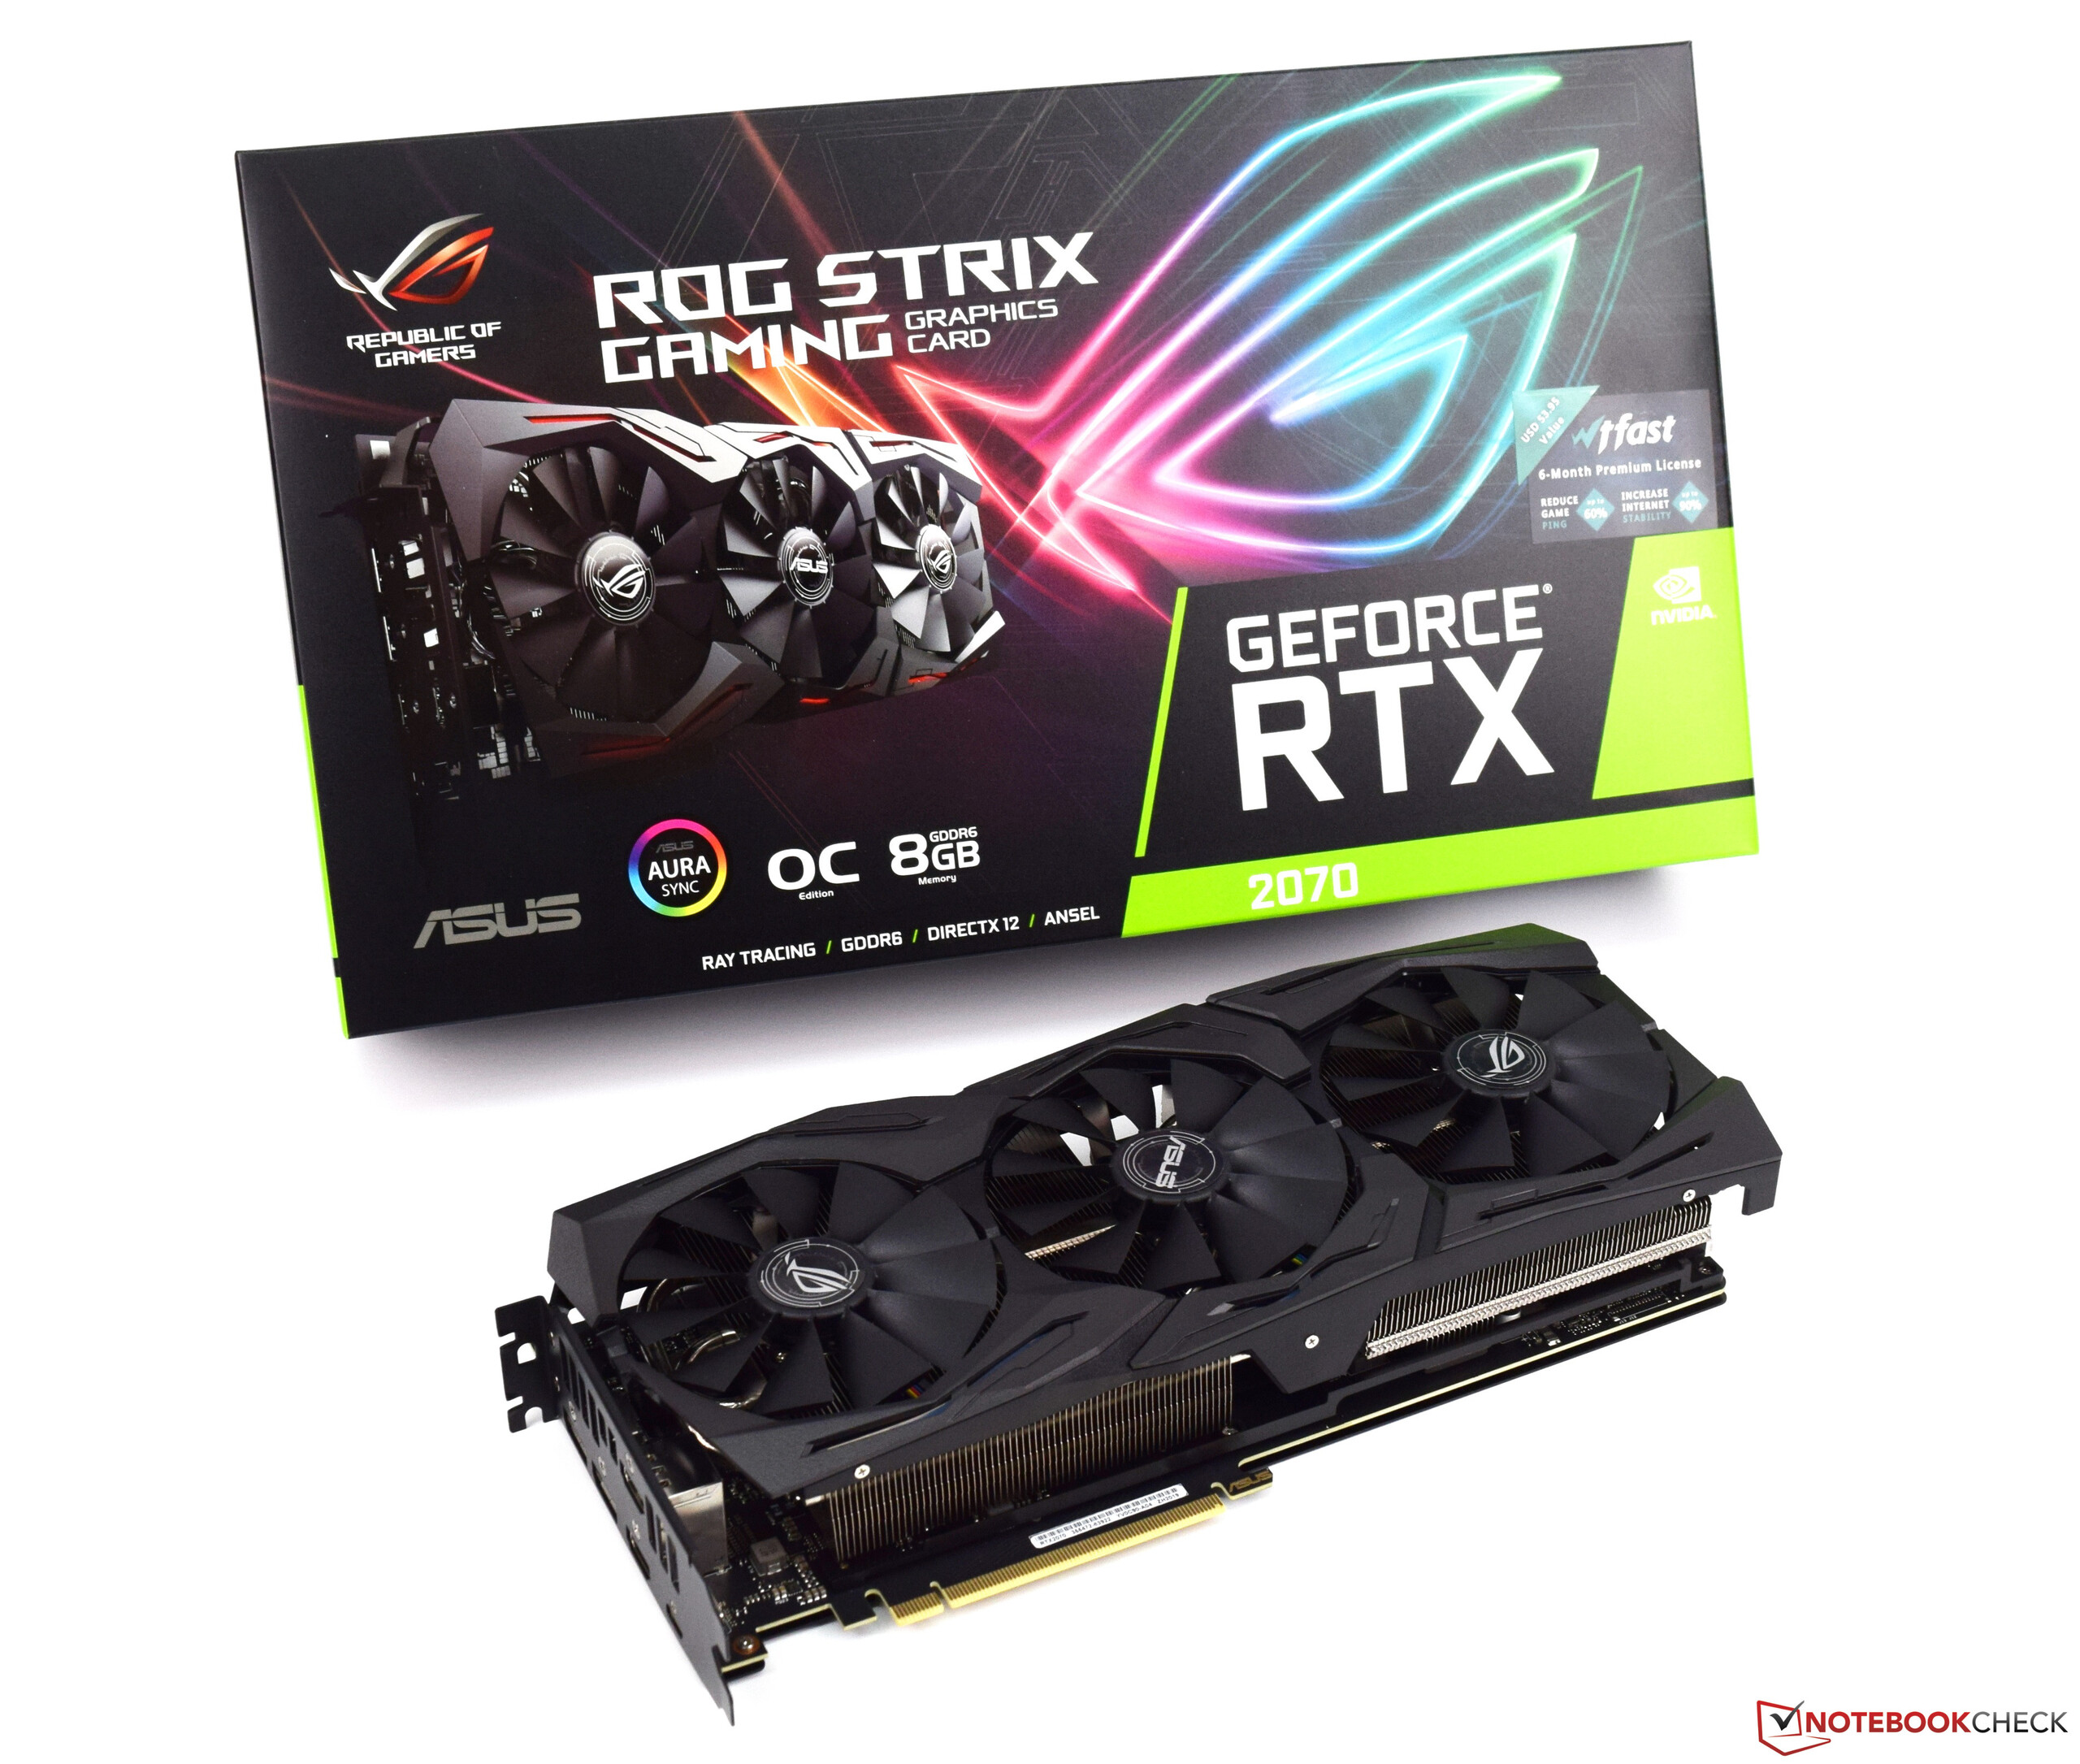
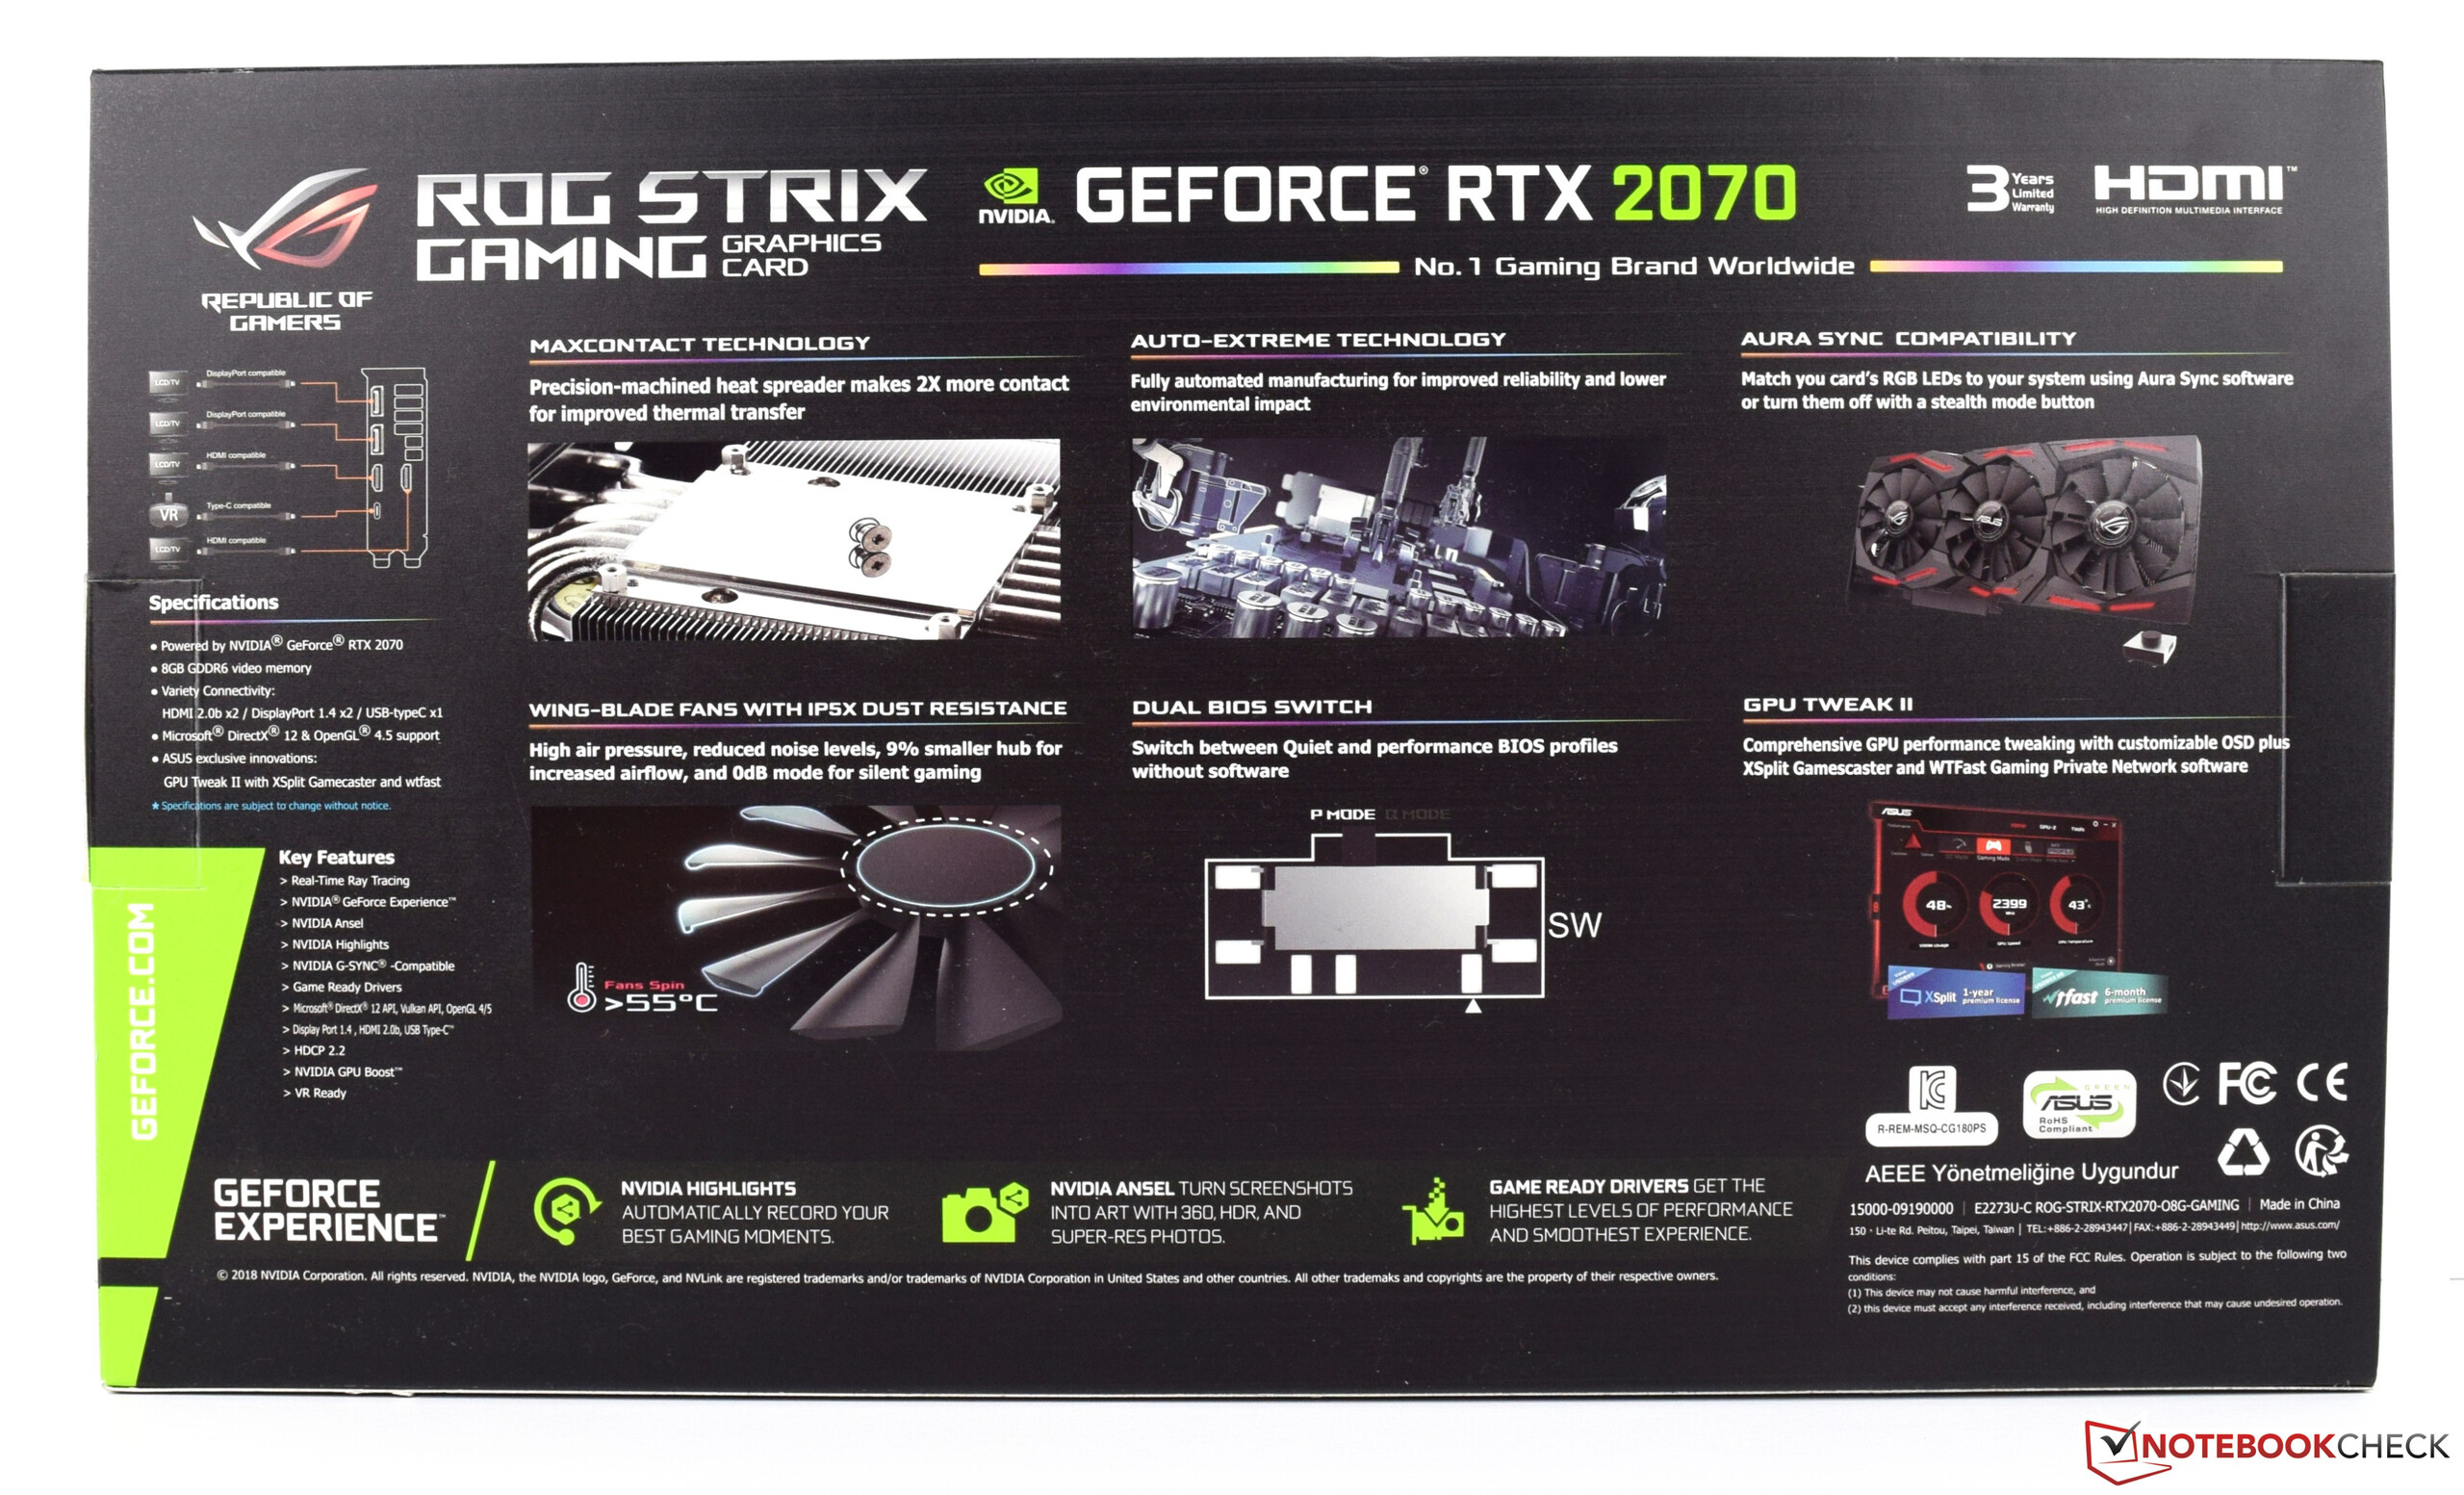
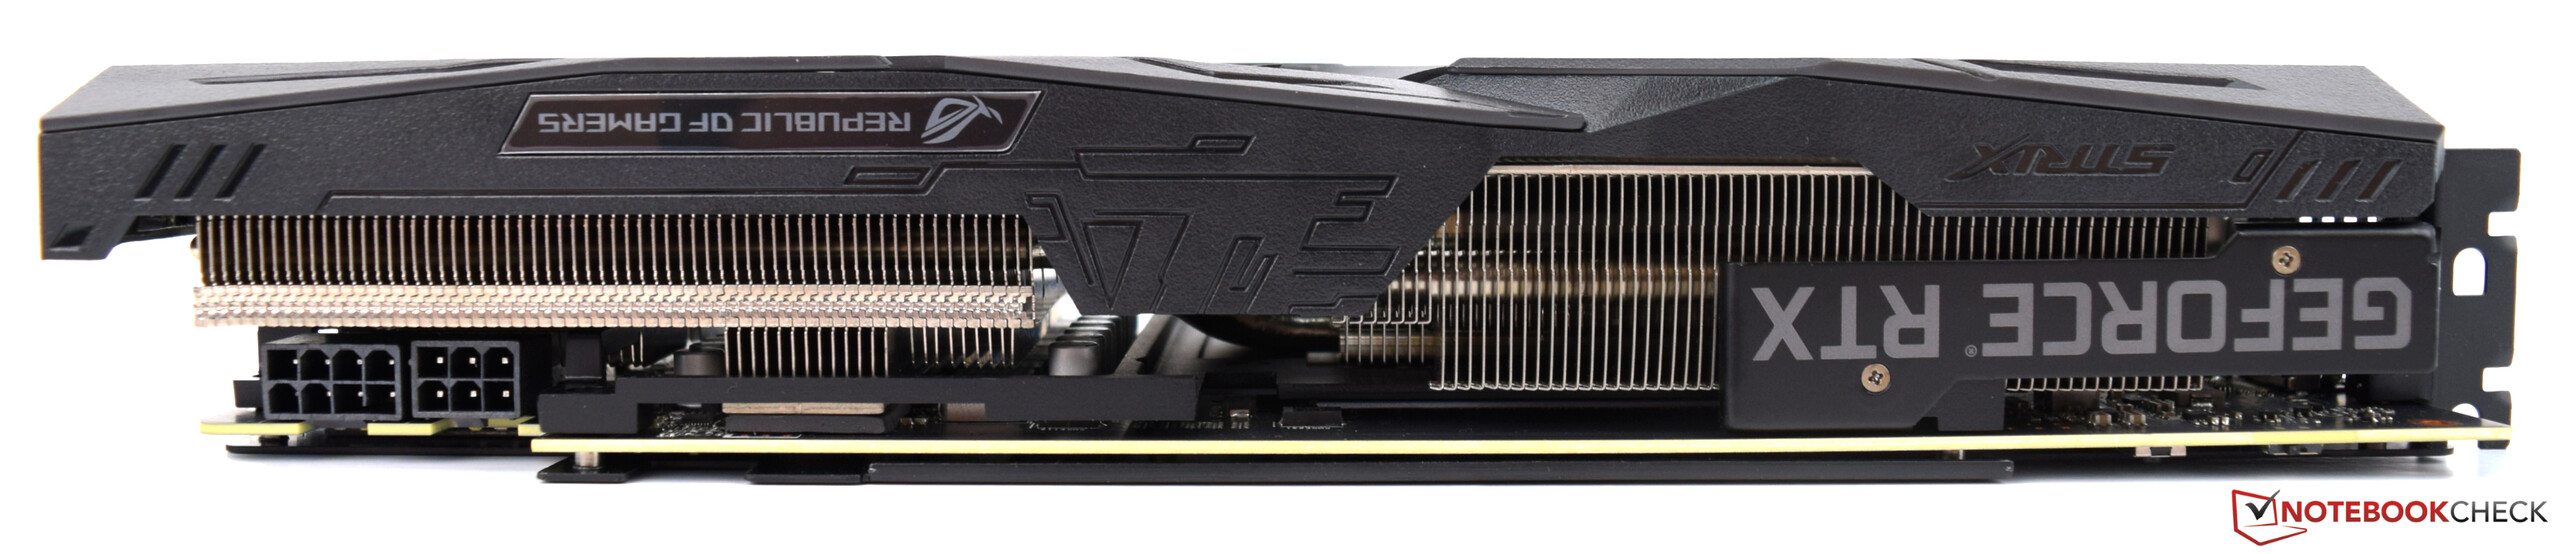
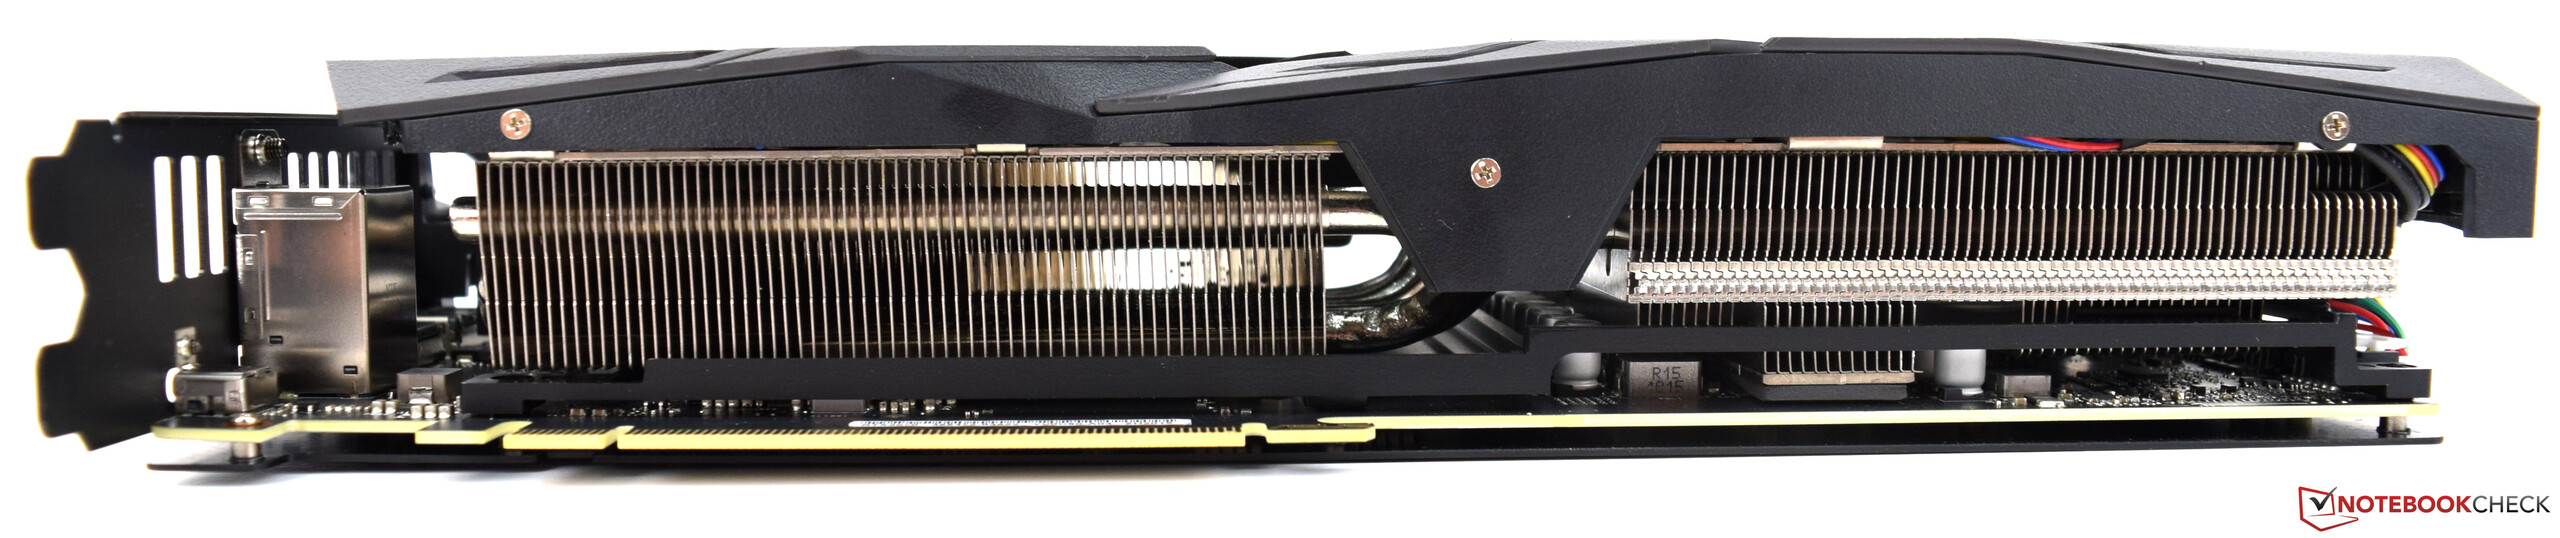
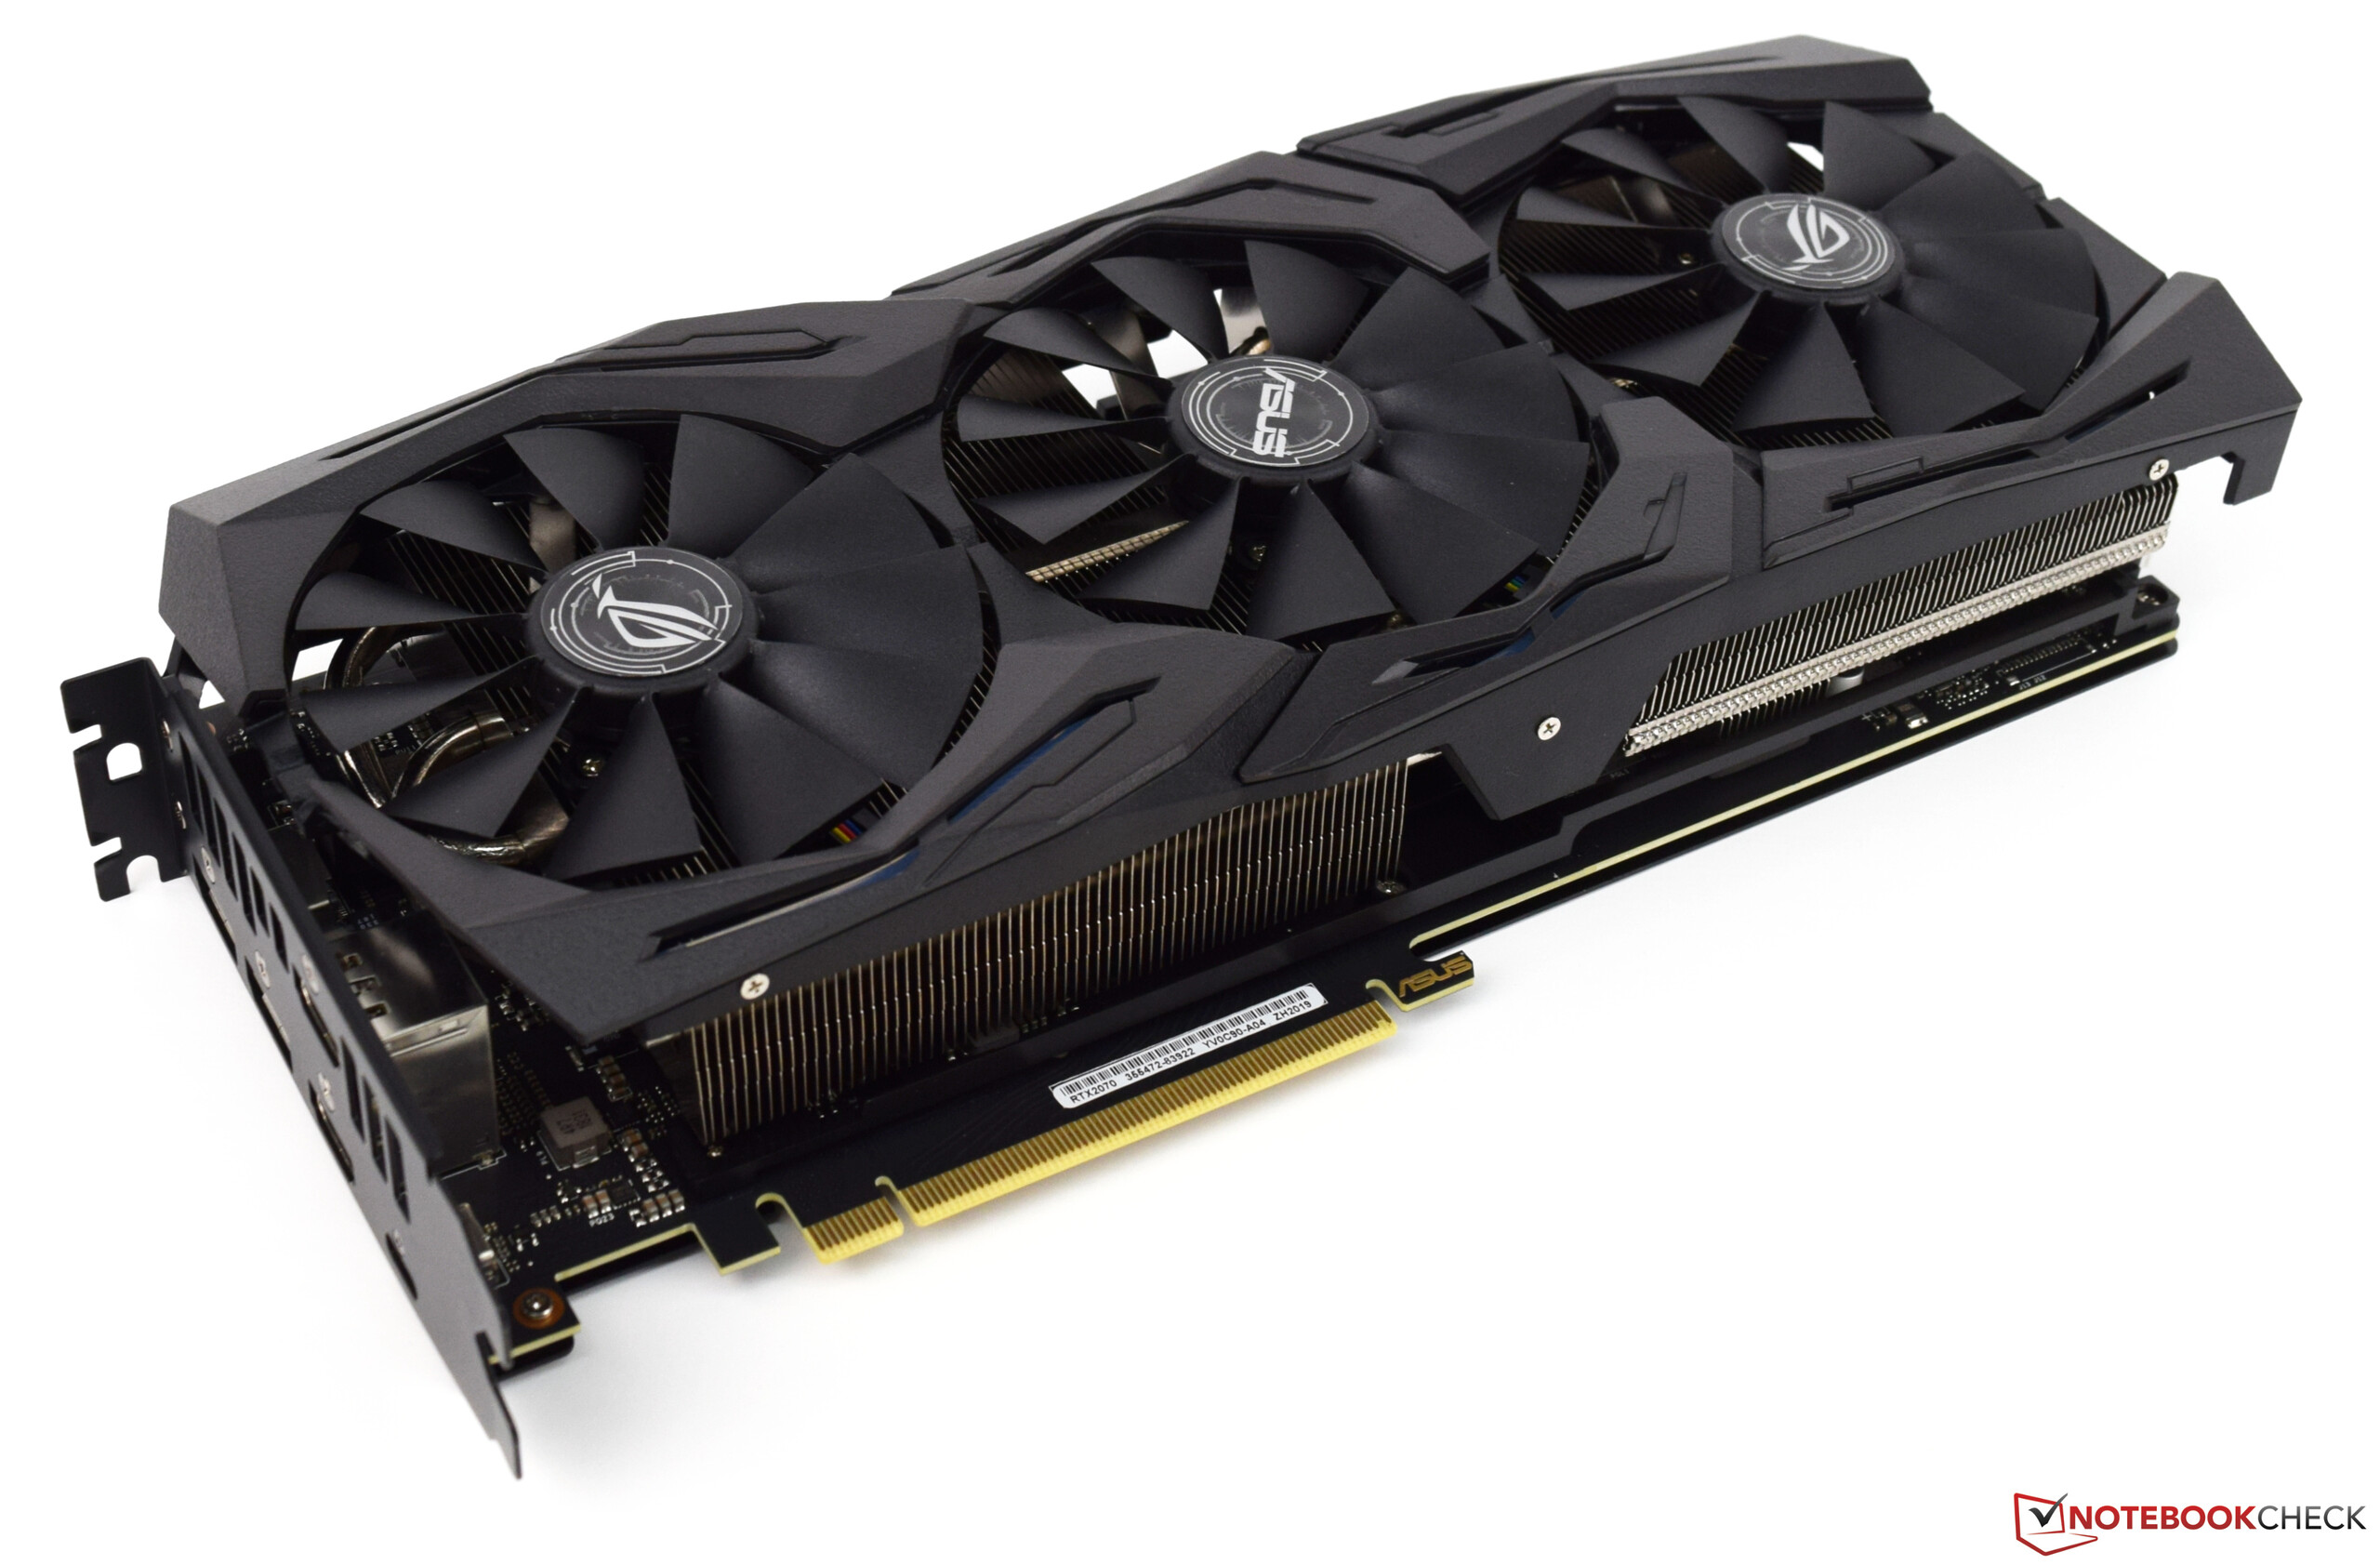
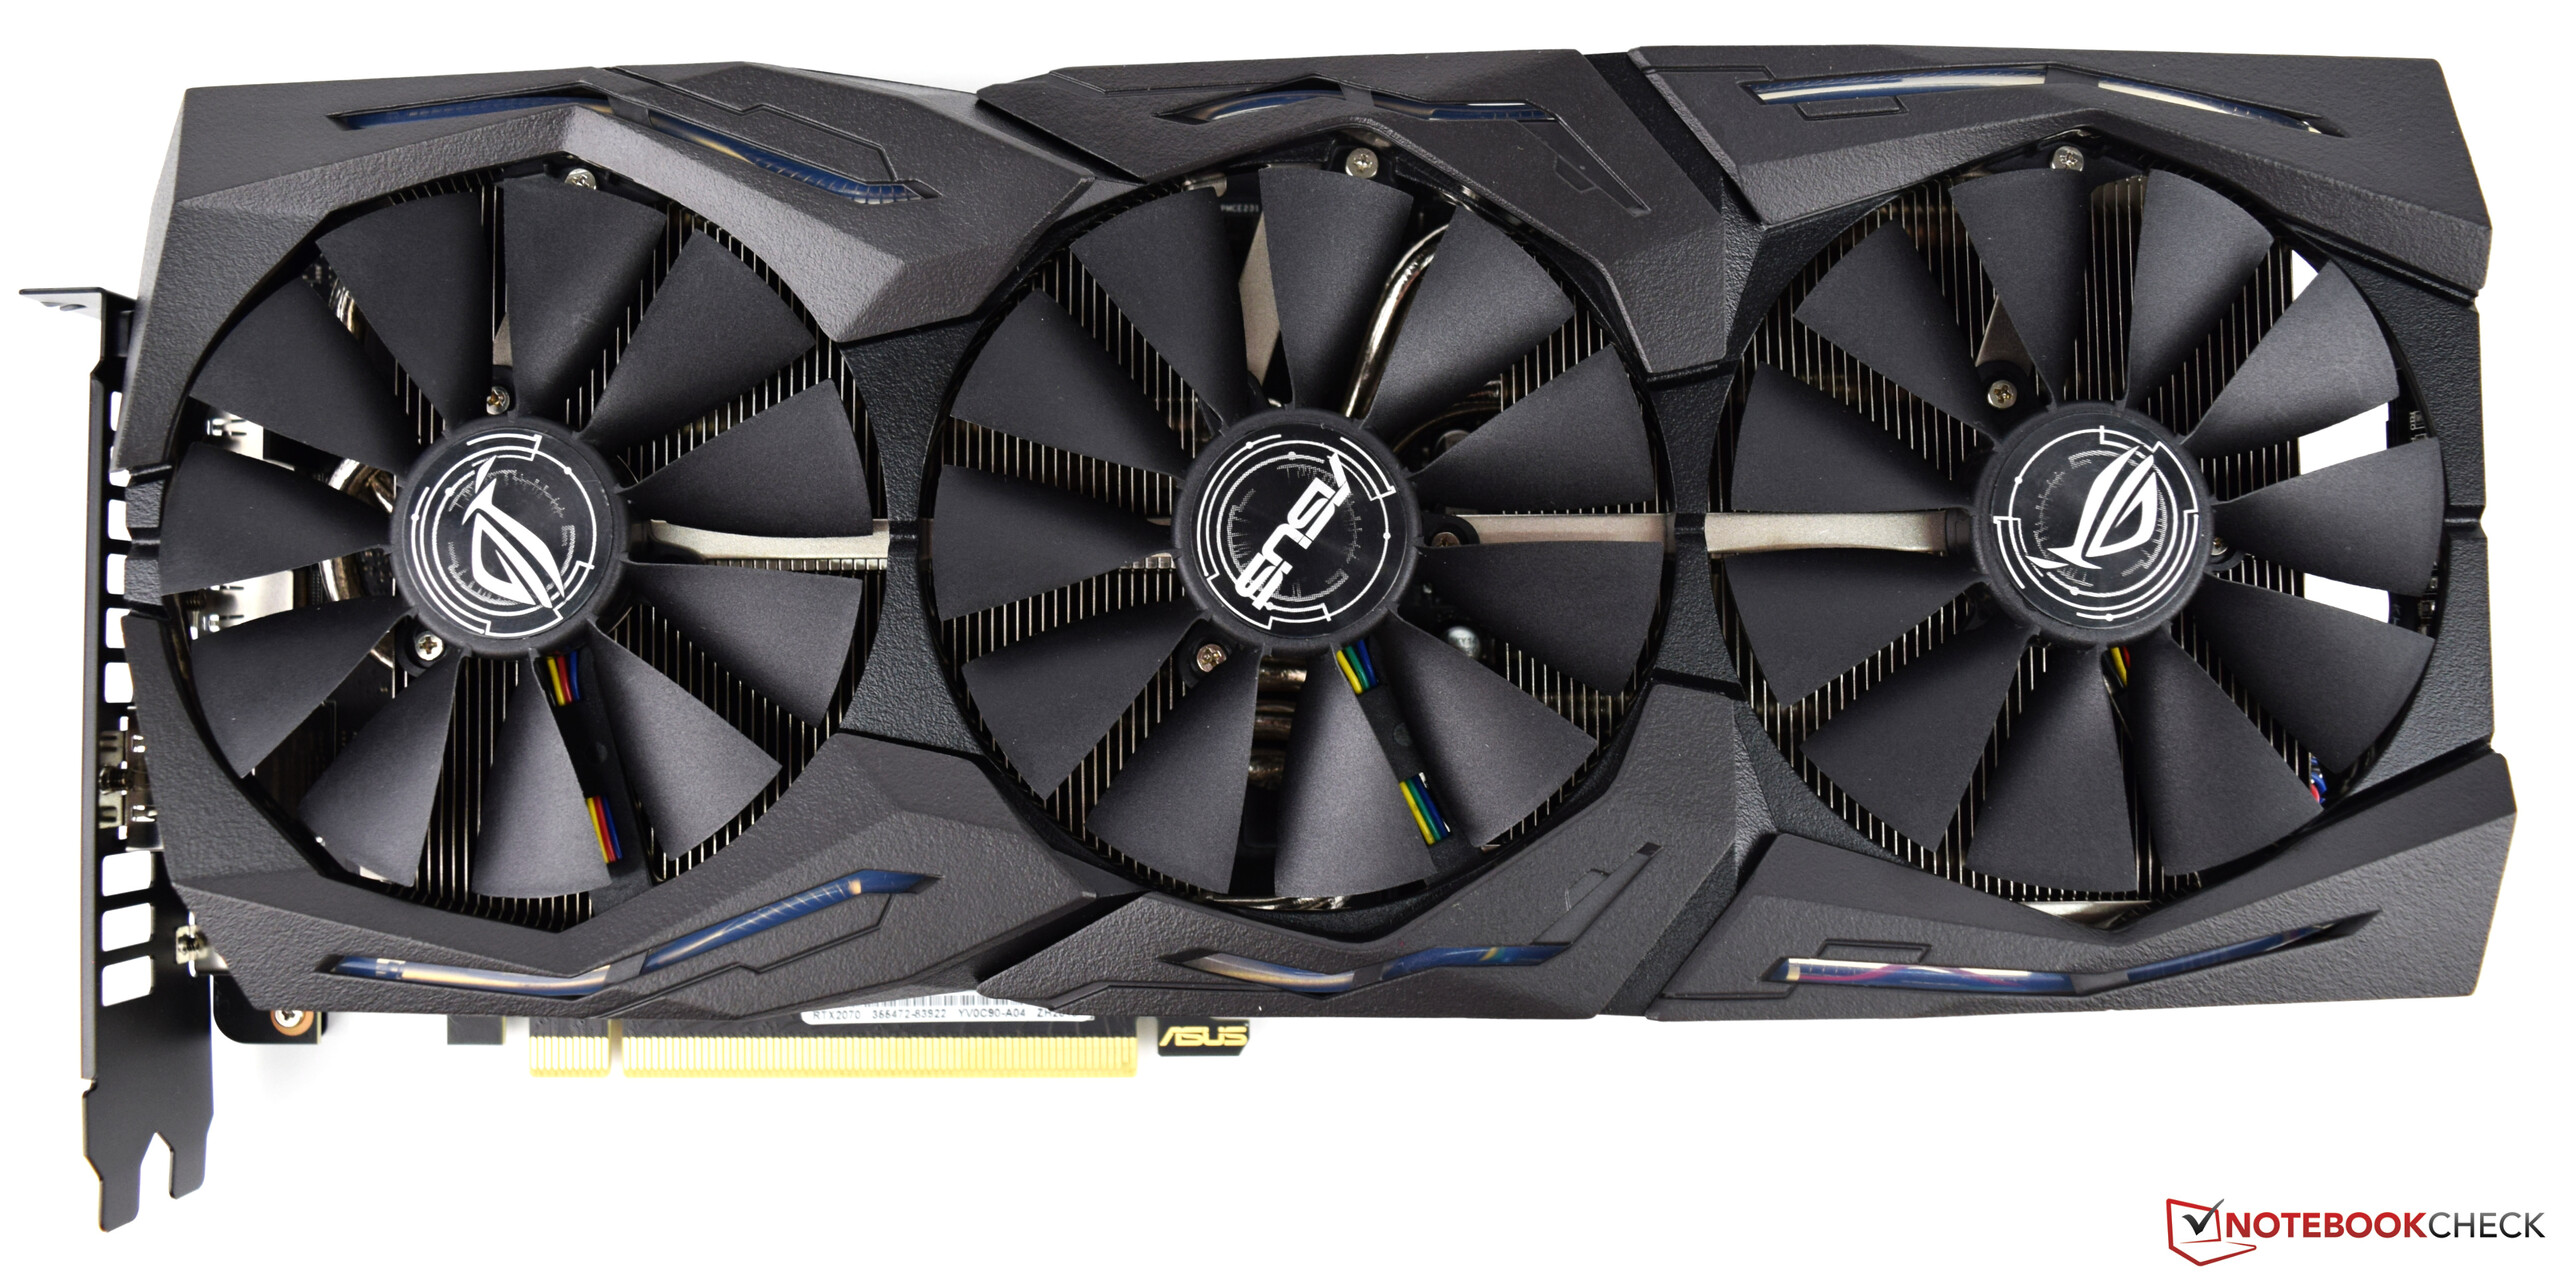
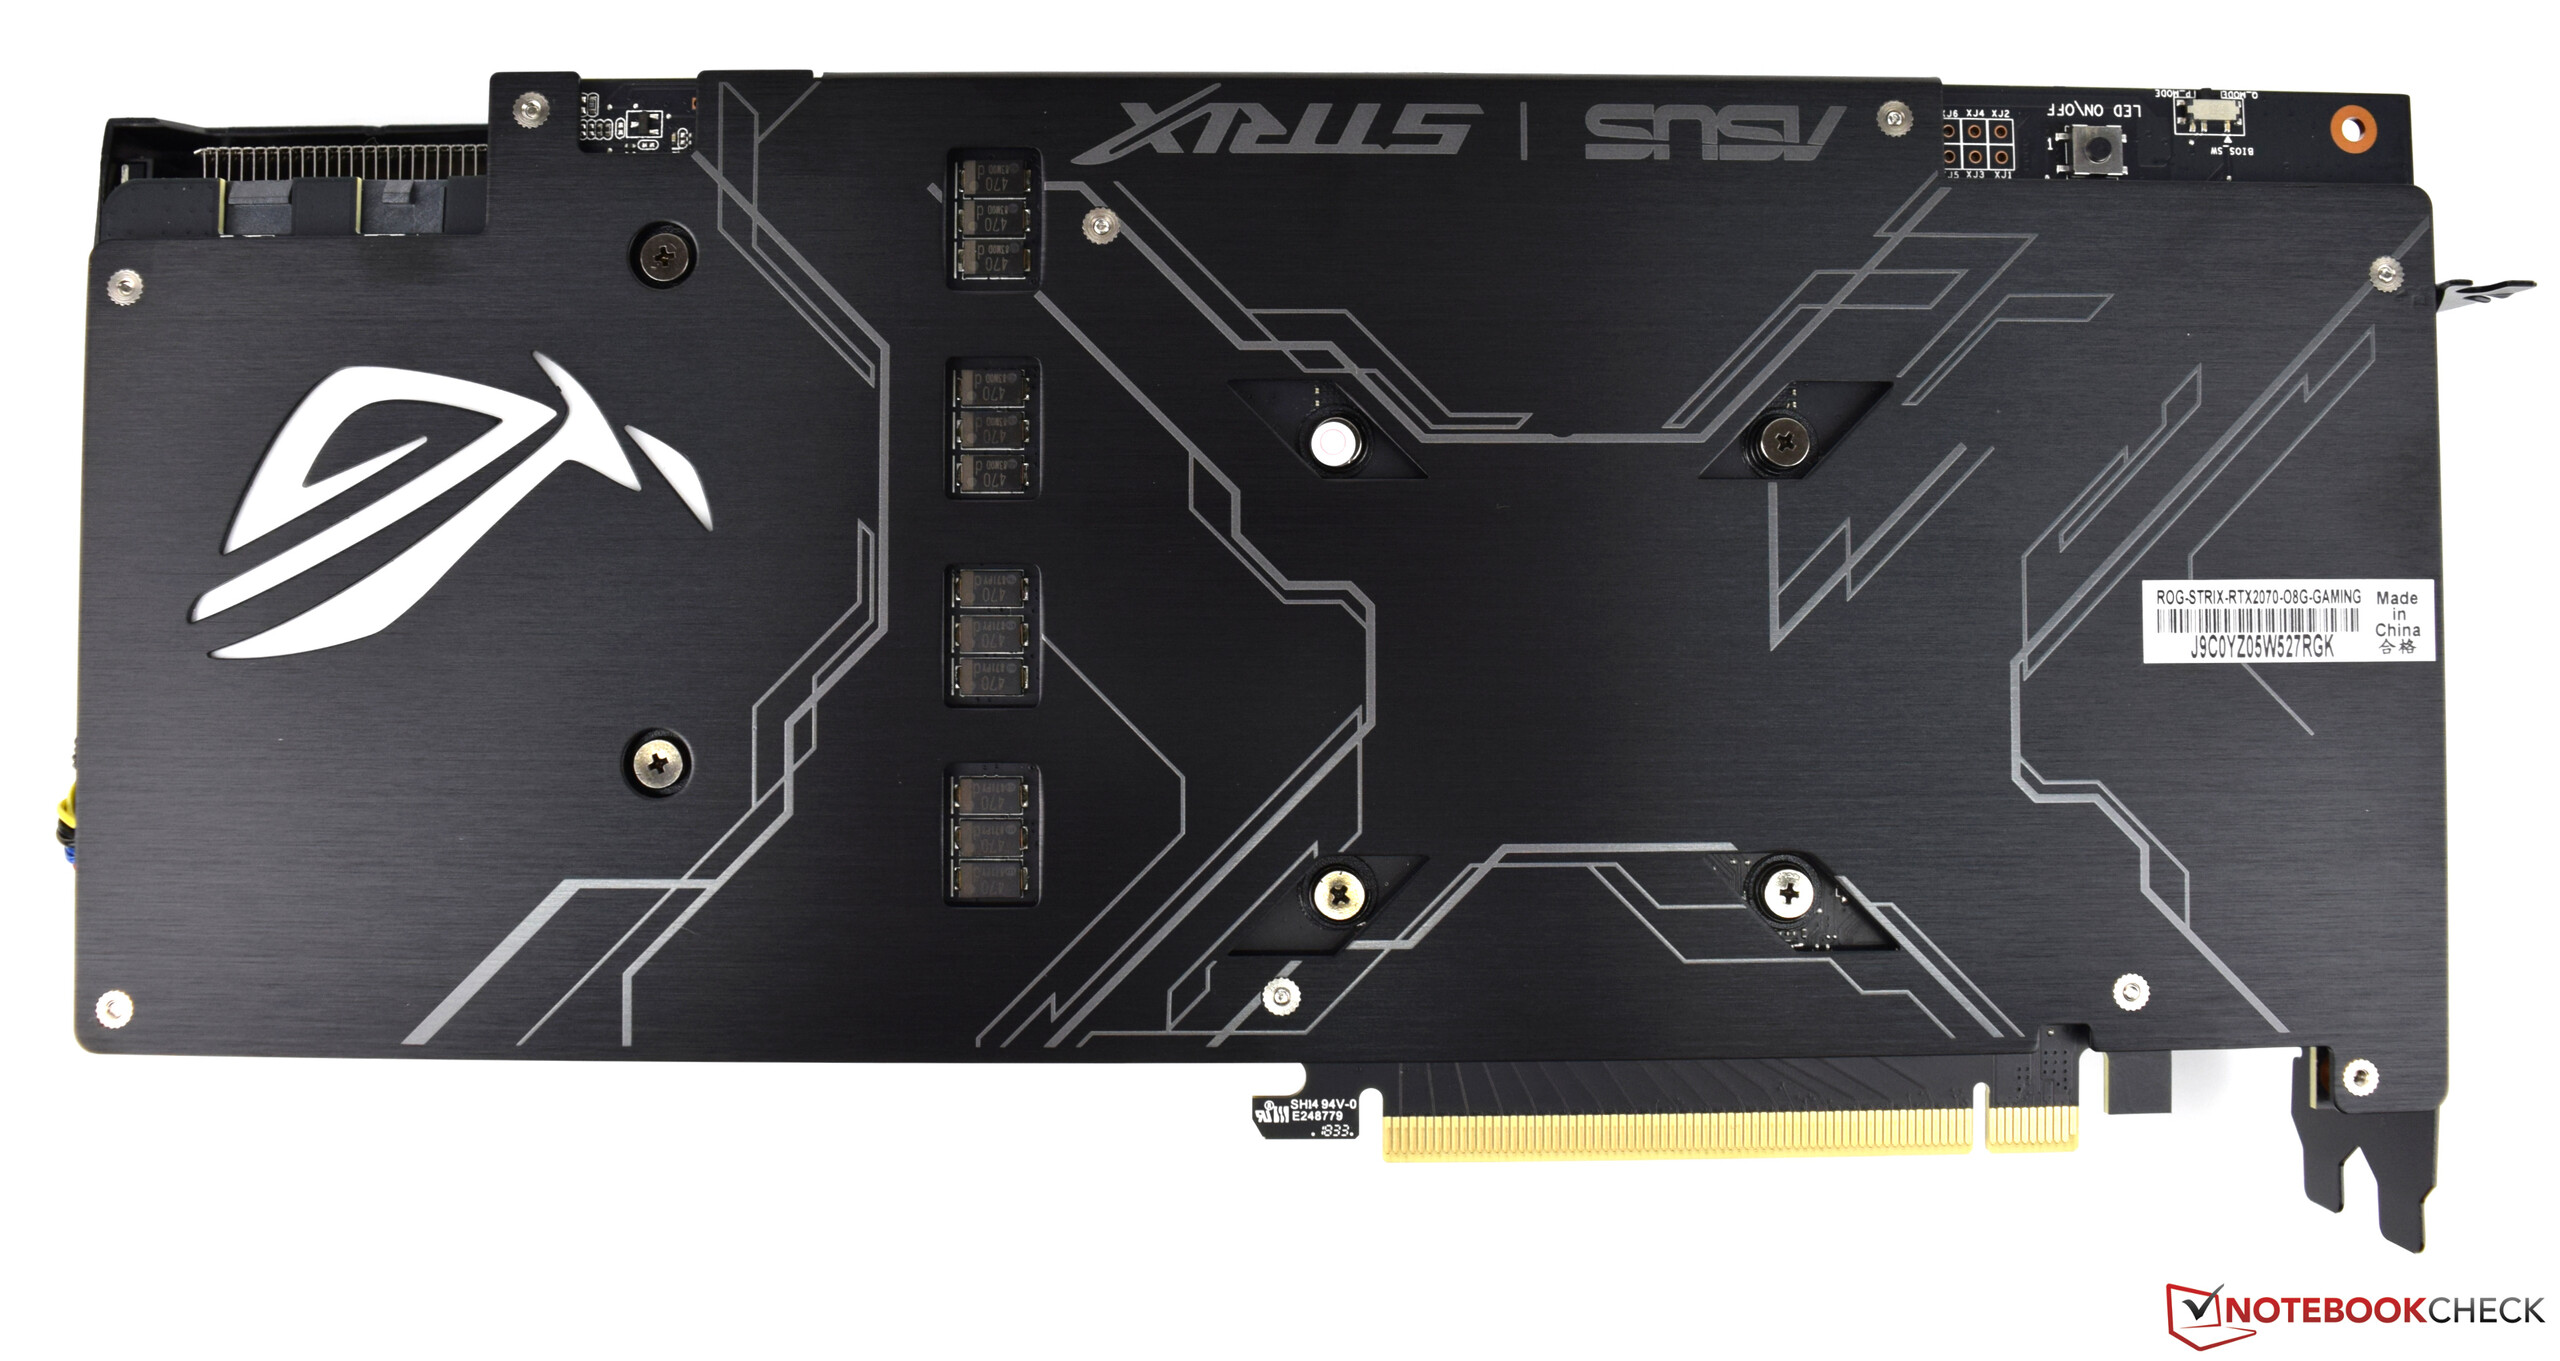
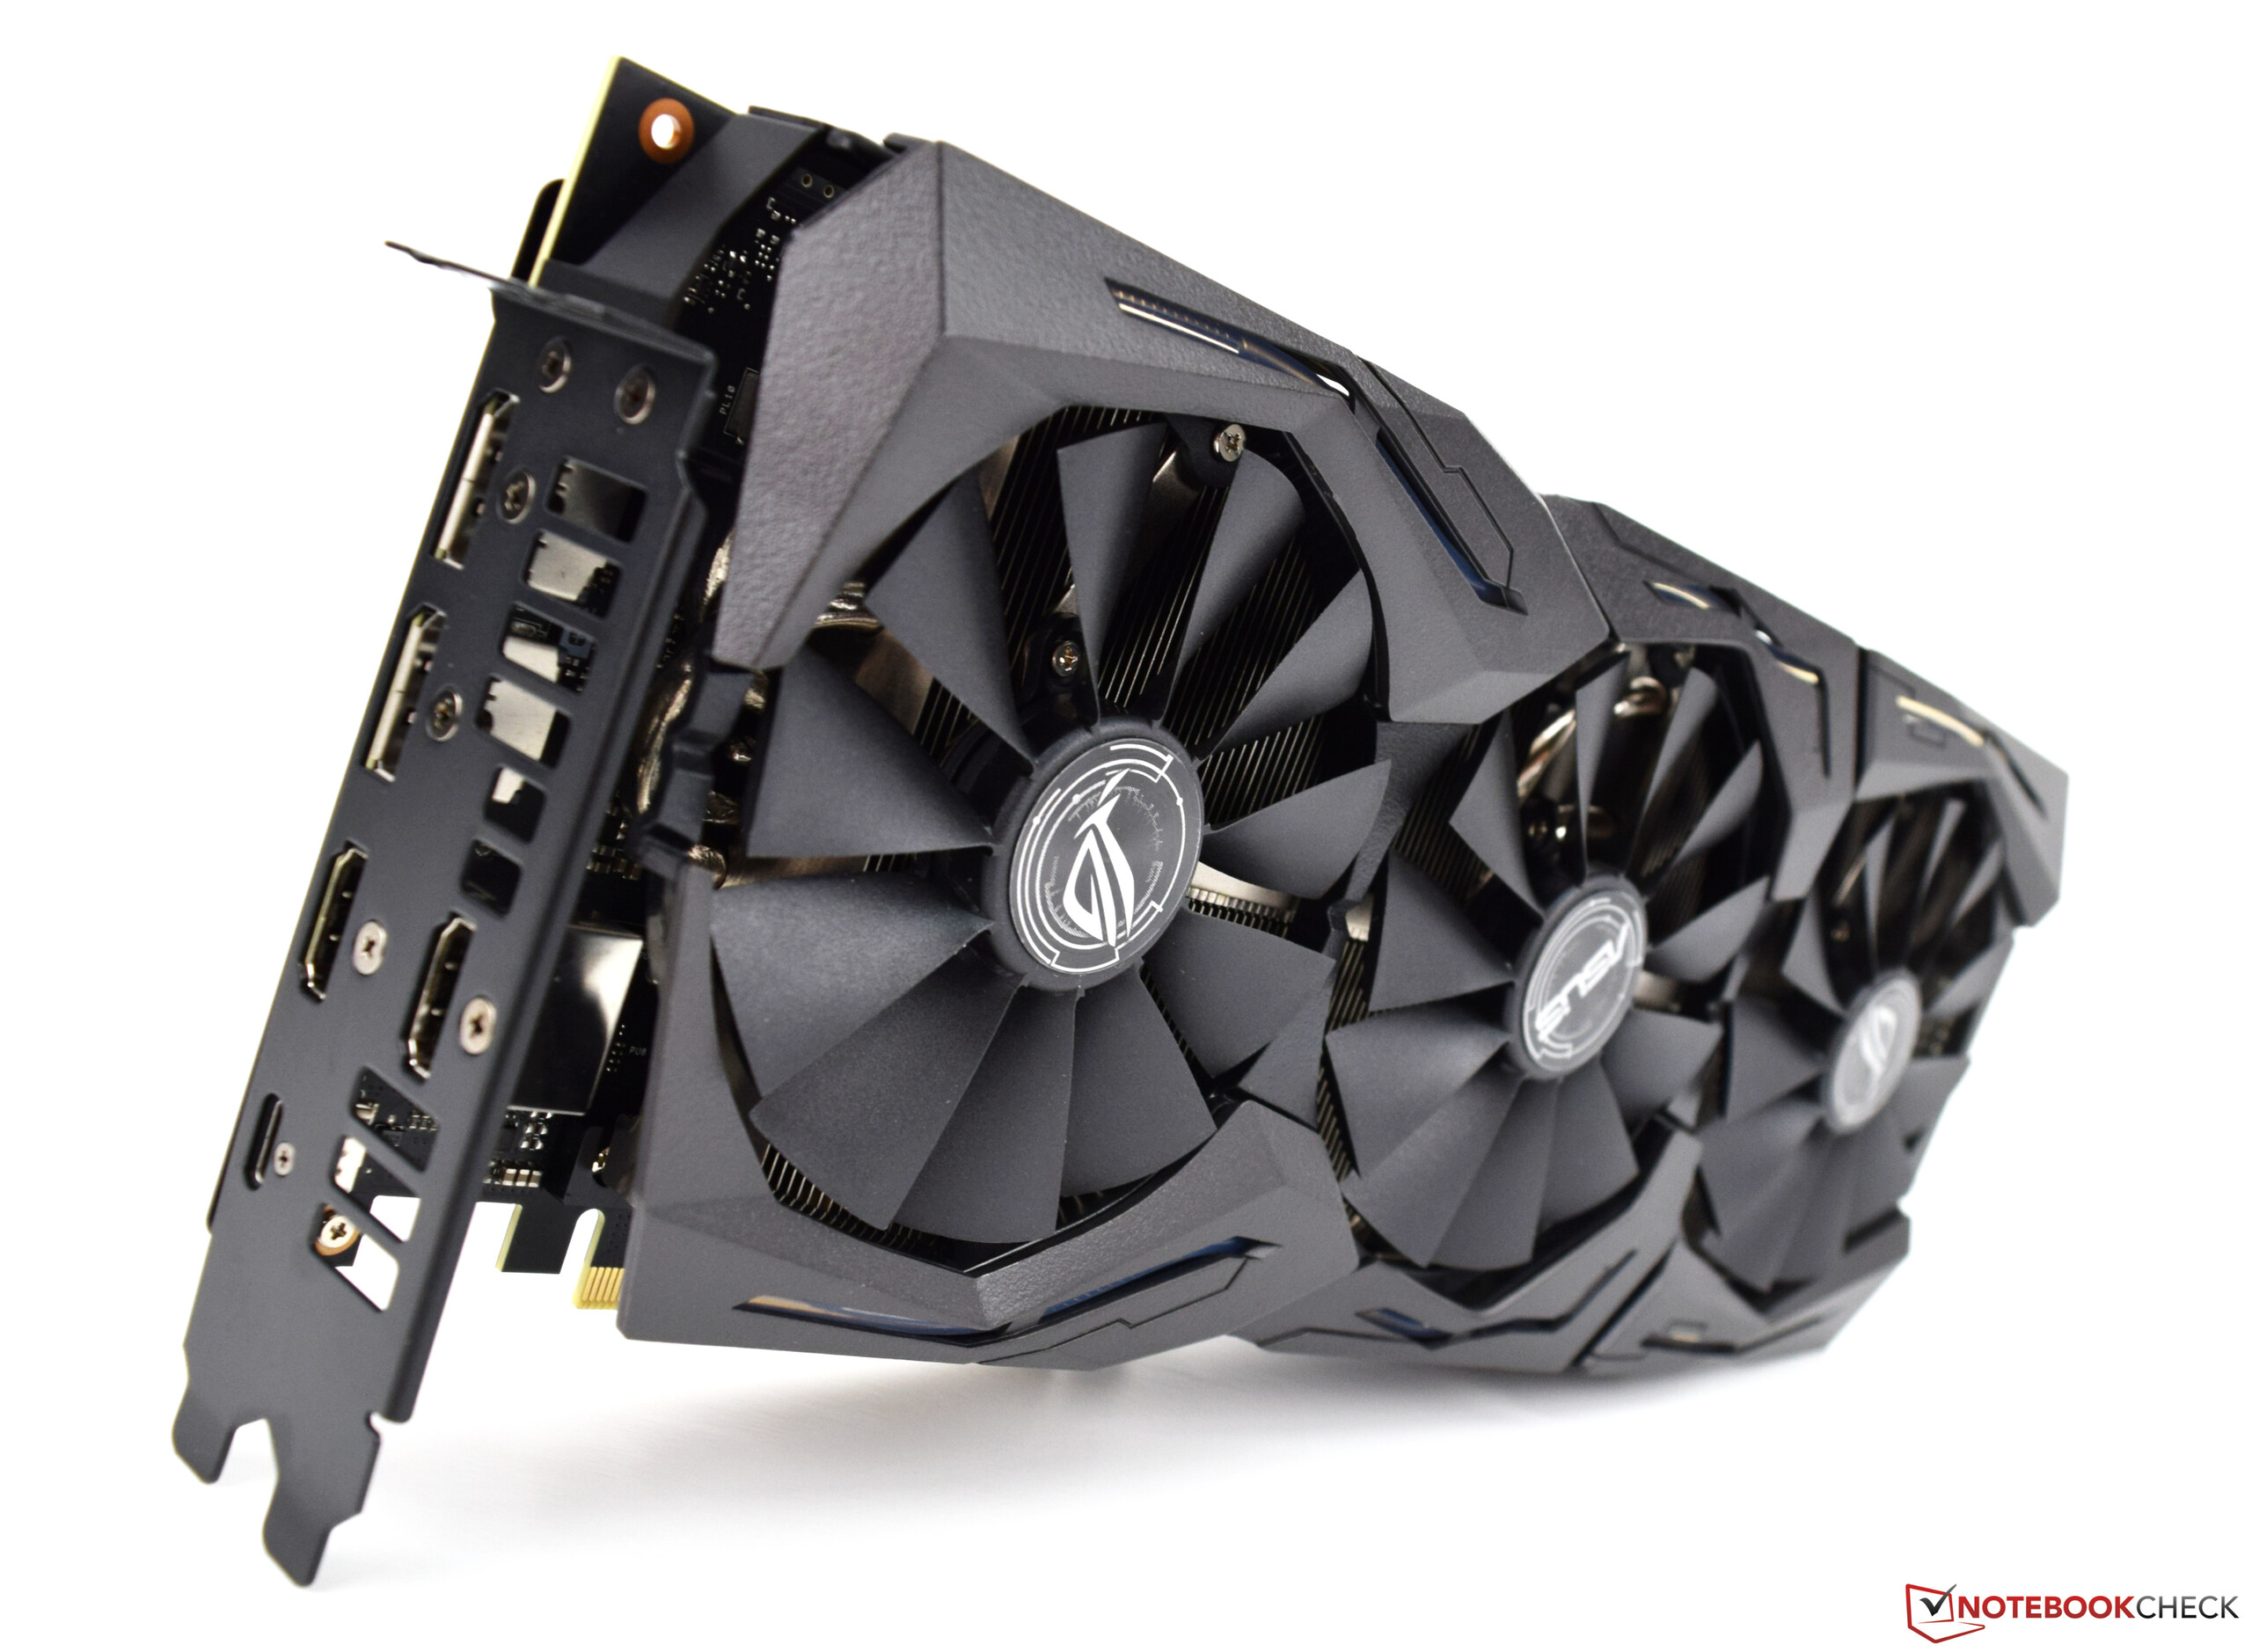
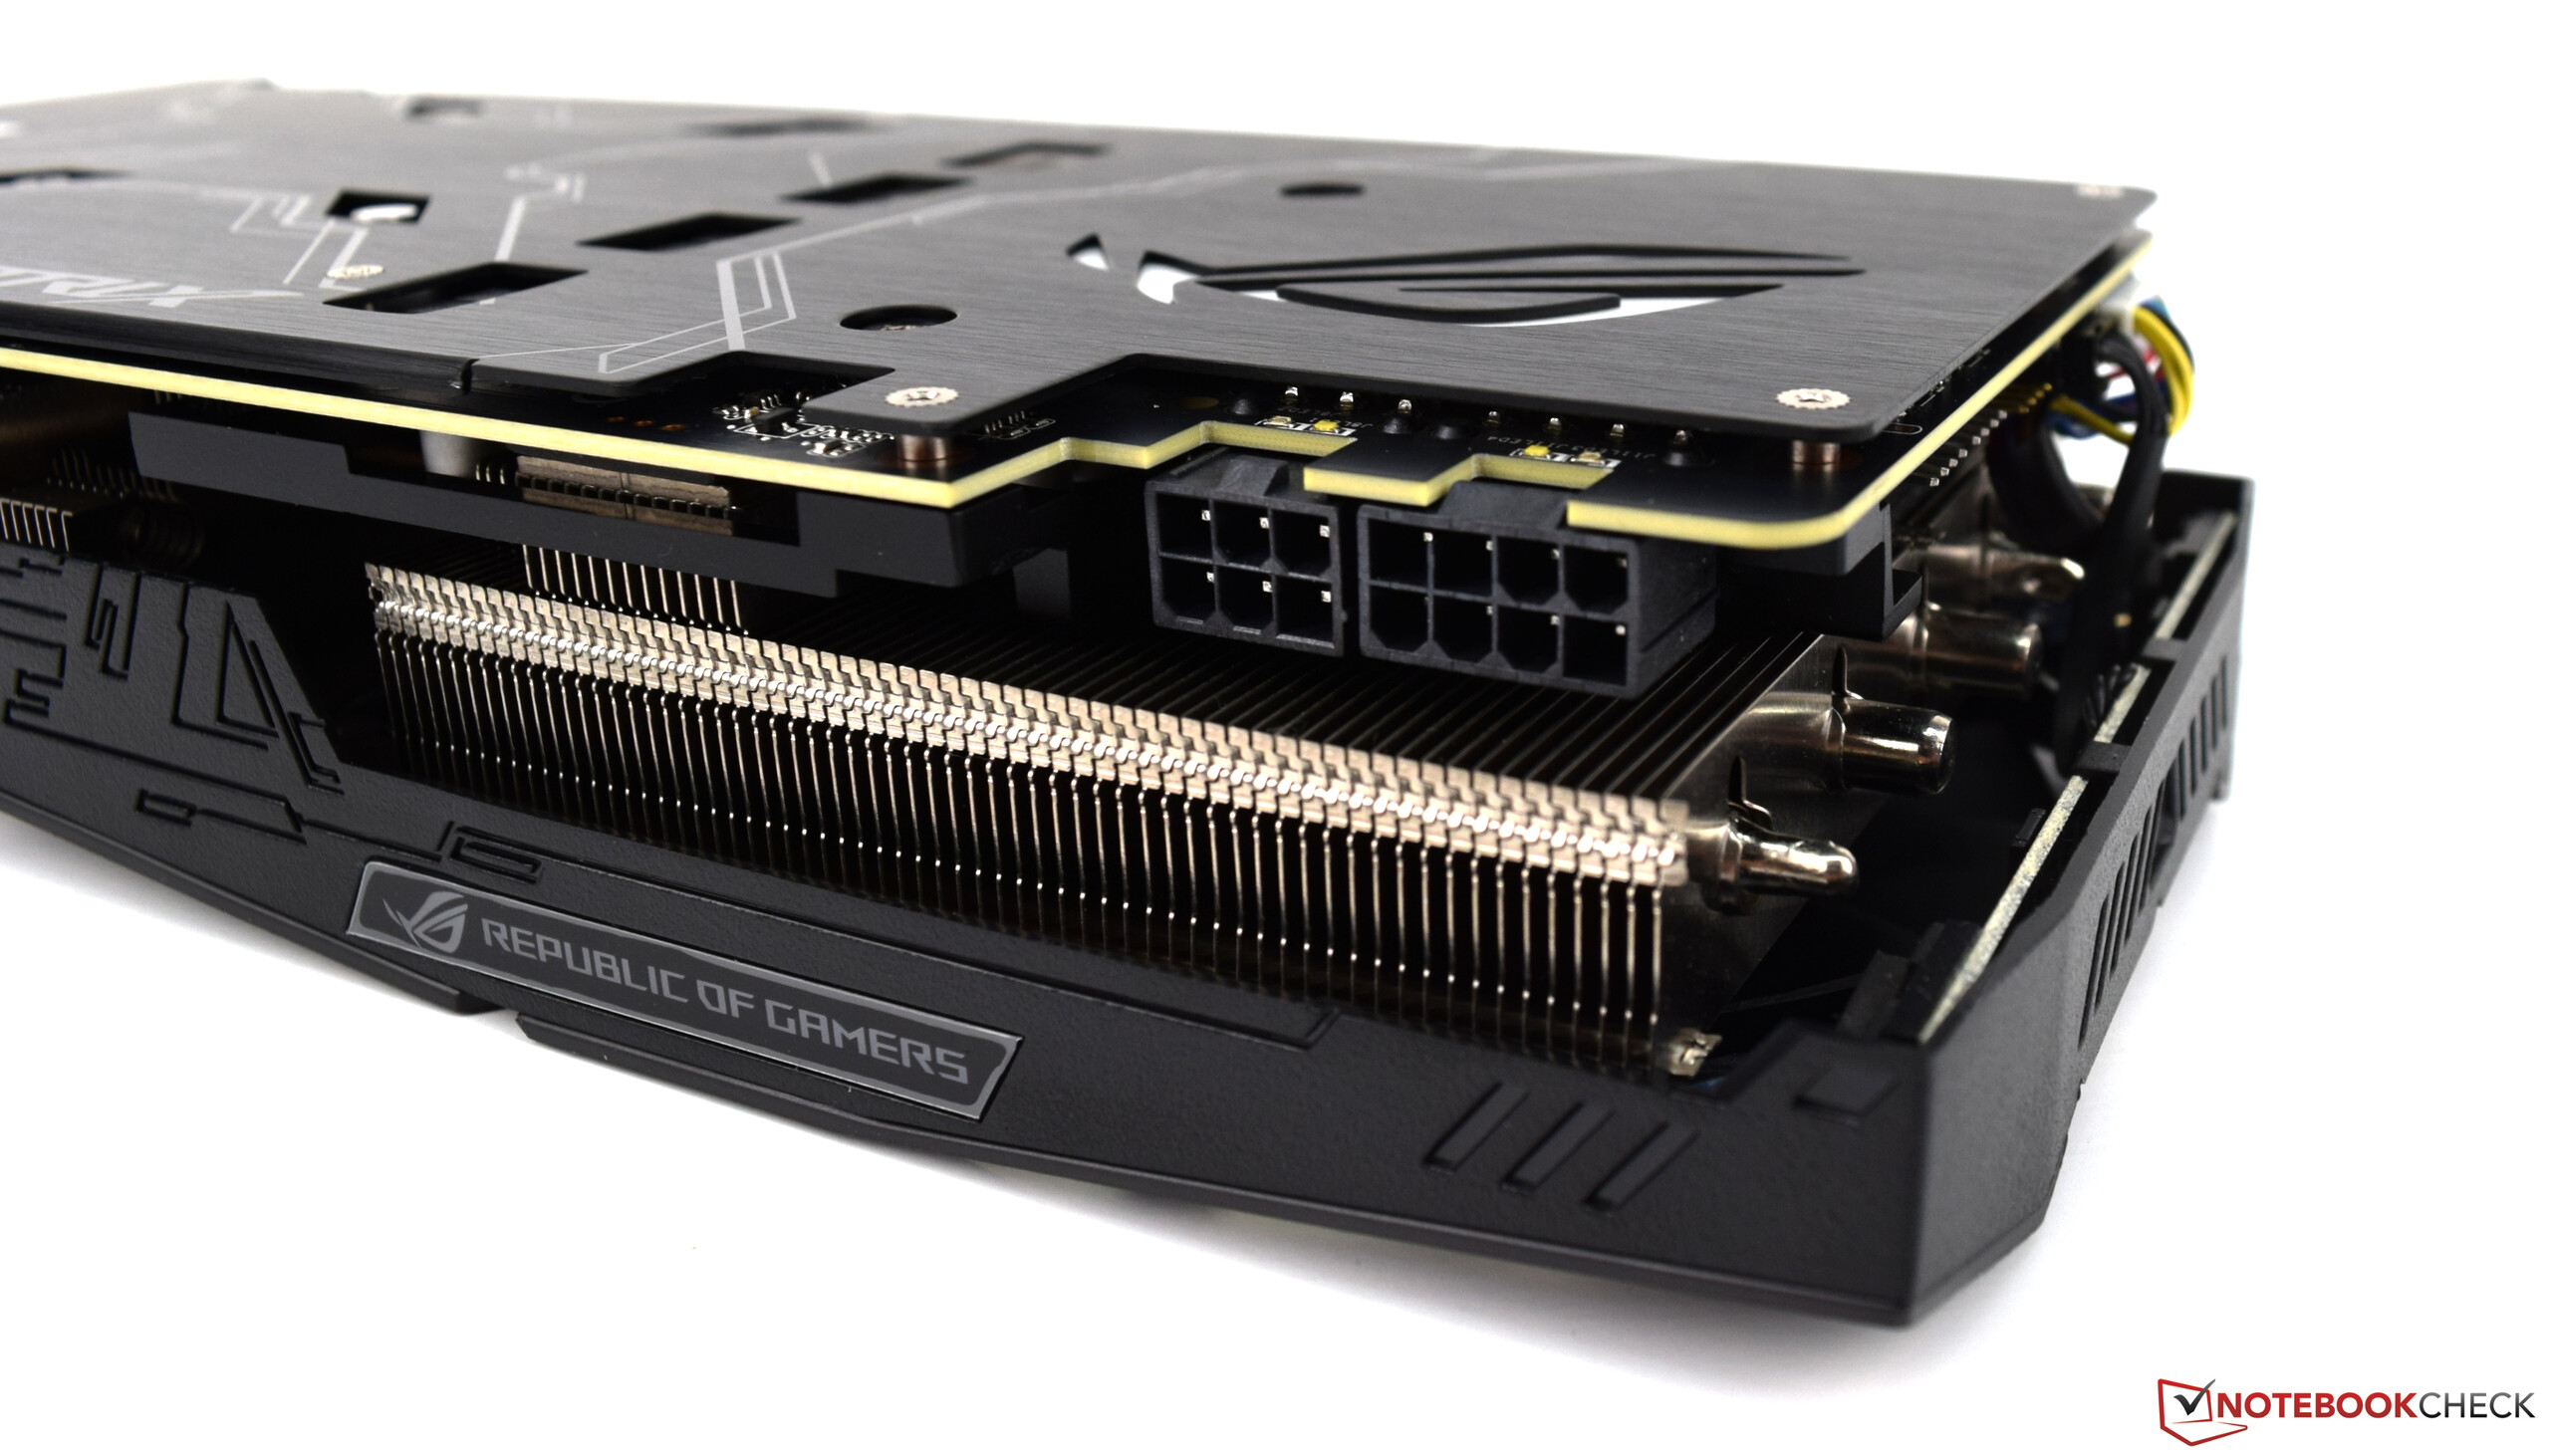
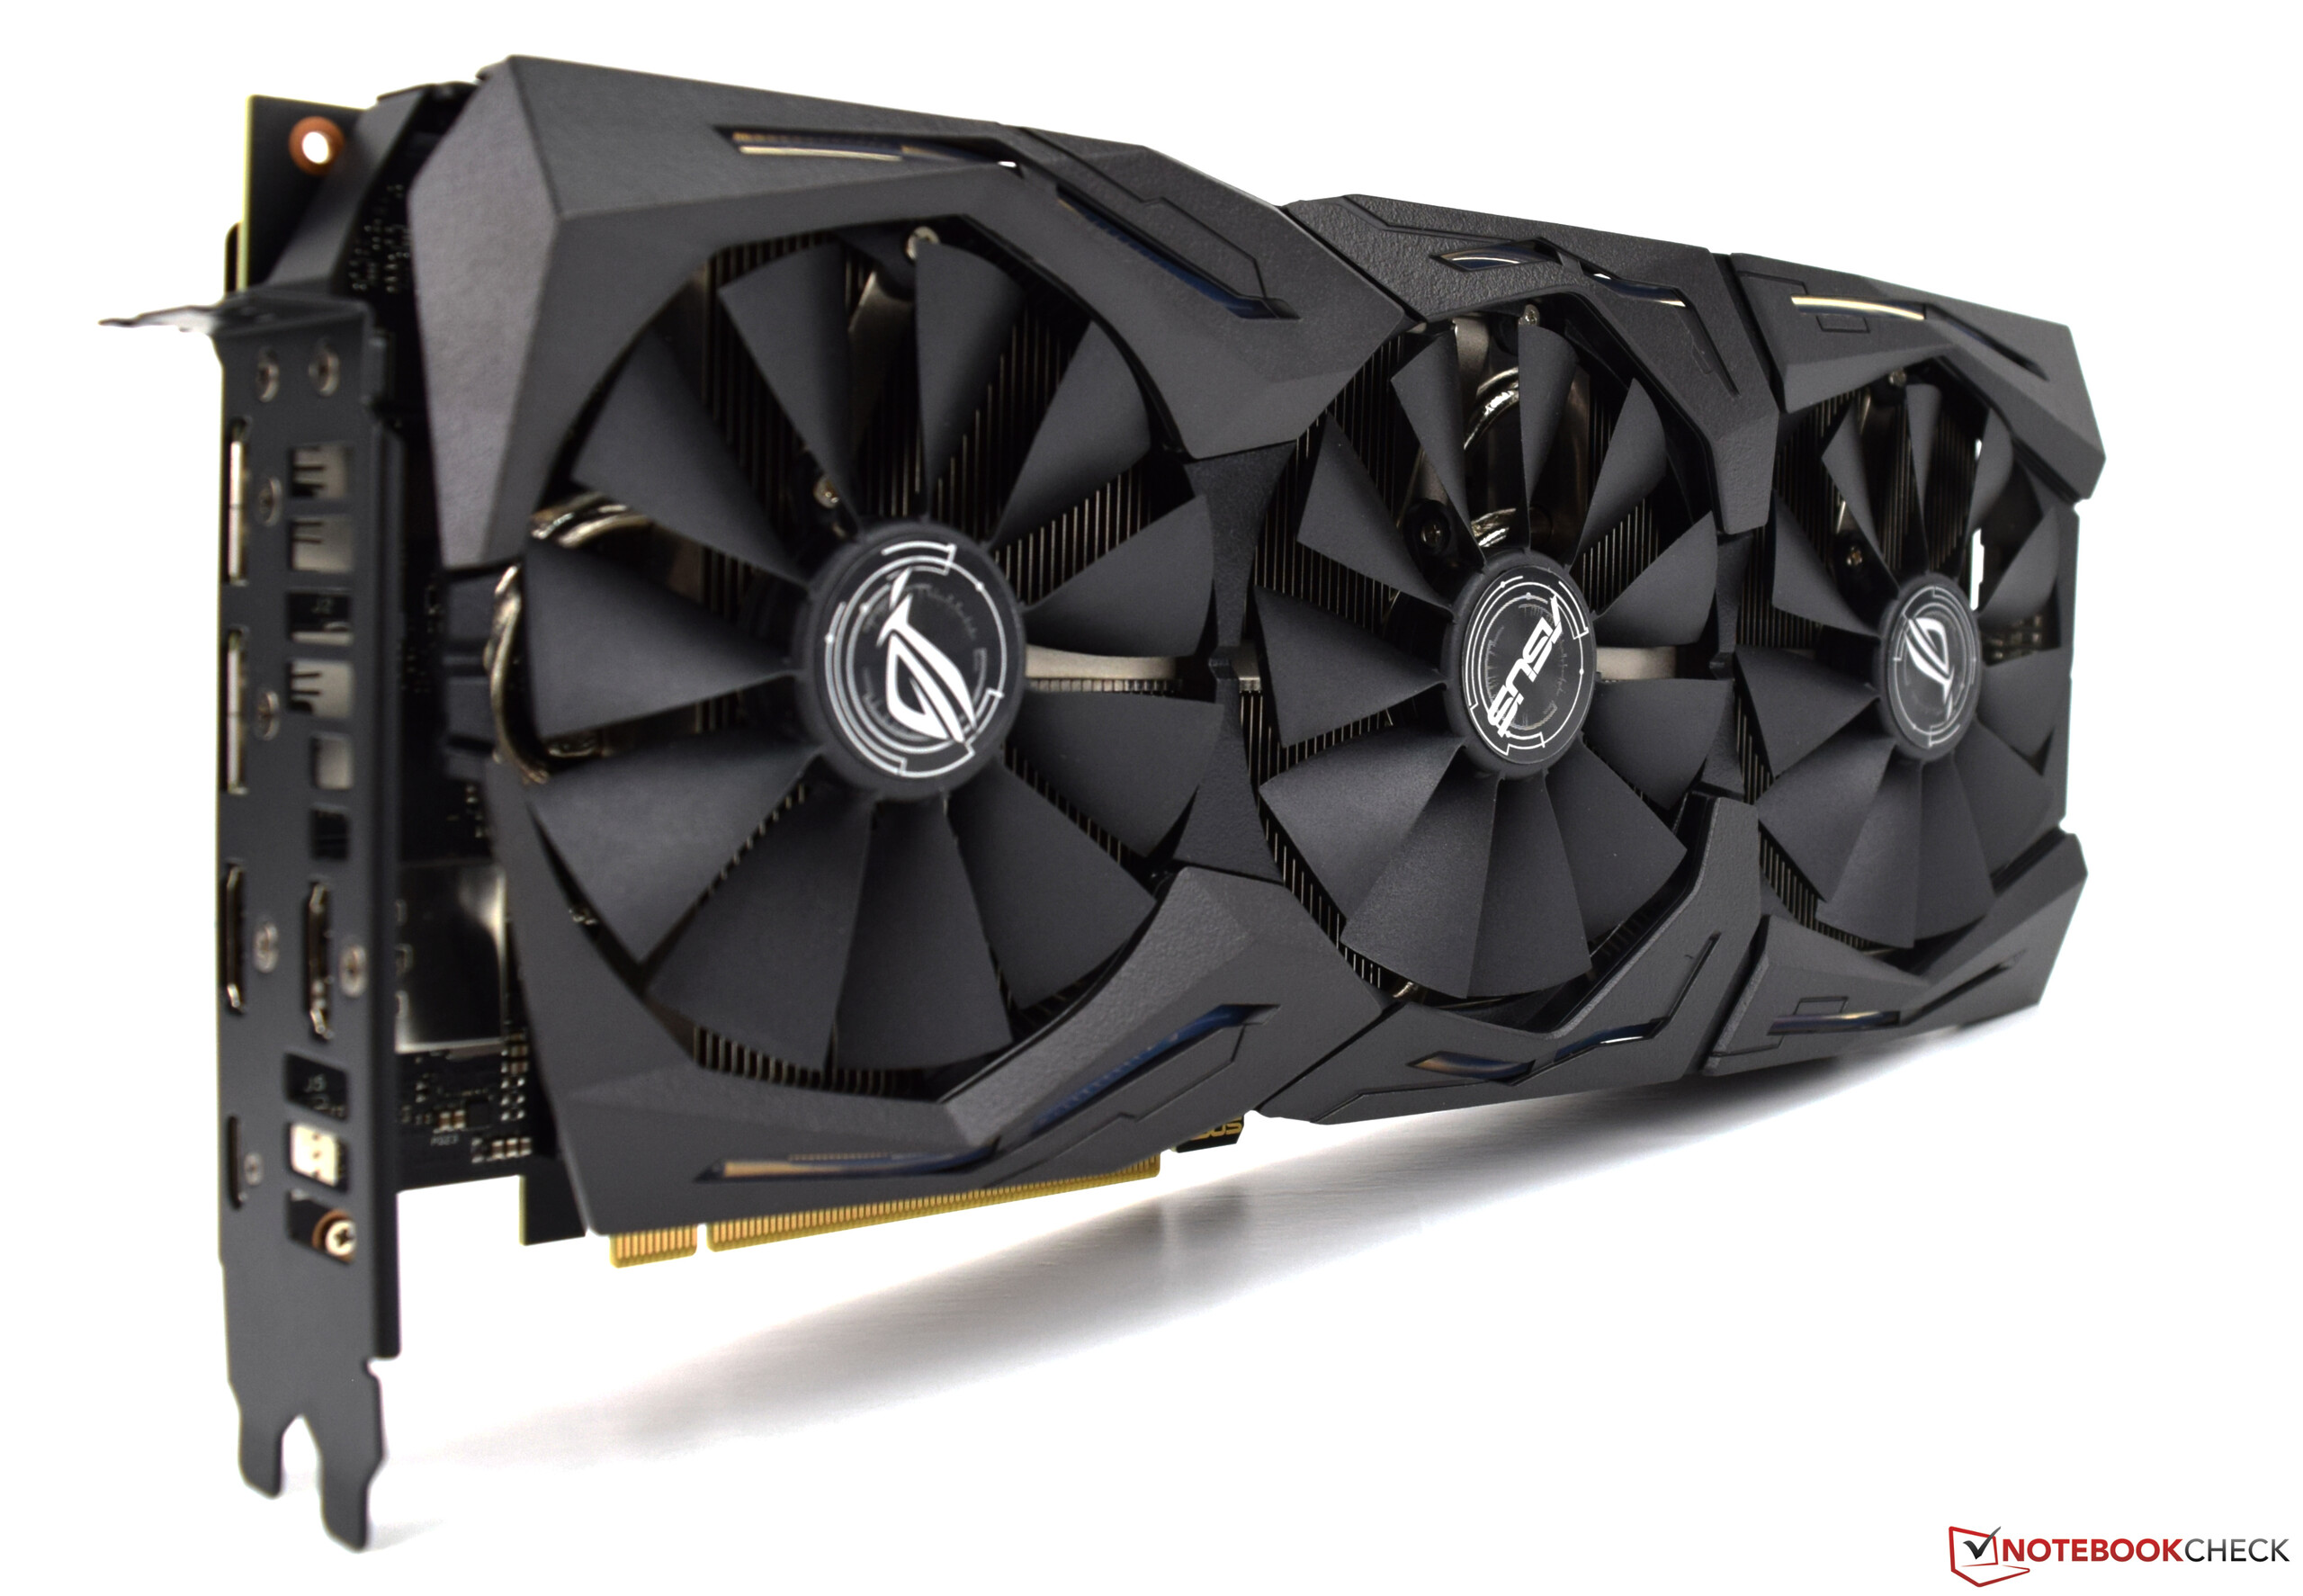
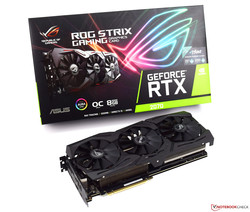
Asus has sent us its ROG RTX Strix 2070 OC card, which is currently the company’s fastest RTX chip. The card has a 1,410 MHz base clock speed that can boost up to 1,845 MHz and 8 GB of GDDR6 VRAM, which is connected by a 256-bit memory interface. Asus has departed from Nvidia’s reference design, developing its own custom cooler that includes three fans and numerous heat pipes. The card is also rather large thanks to its huge cooling system and takes up three PCIe slots, so make sure that your case is large enough to house it.
The ROG RTX Strix 2070 OC has five ports: two DisplayPort 1.4, two HDMI 2.0b and a USB Type-C port for VR devices. Internally, the card needs 6- and 8-pin power connections.

ASUS ROG Strix OC Series vs. NVIDIA GTX Founders Edition
| Specifications | RTX 2070 | RTX 2080 | RTX 2080 Ti | GTX 1070 FE | GTX 1080 FE | GTX 1080 Ti FE |
| Chip | TU106 | TU104 | TU 102 | GP104 | GP104 | GP102 |
| Fabrication | 12 nm | 12 nm | 12 nm | 16 nm | 16 nm | 16 nm |
| Shaders | 2,304 | 2,304 | 2,944 | 1,920 | 2,560 | 3,584 |
| Texture Units | 144 | 184 | 272 | 120 | 160 | 224 |
| GPU Base Clock | 1,410 MHz | 1,515 MHz | 1,350 MHz | 1,506 MHz | 1,607 MHz | 1,481 MHz |
| GPU Boost Clock | 1,815 MHz | 1,860 MHz | 1,650 MHz | 1,863 MHz | 1,733 MHz | 1,582 MHz |
| Memory Bandwidth | 448 GB/s | 448 GB/s | 616 GB/s | 256 GB/s | 320 GB/s | 484 GB/s |
| Memory Size | 8 GB GDDR6 | 8 GB GDDR6 | 11 GB GDDR6 | 8 GB GDDR5 | 8 GB GDDR5X | 11 GB GDDR5X |
| Wattage | 175 W | 225 W | 260 W | 150 W | 180 W | 250 W |
The Test System
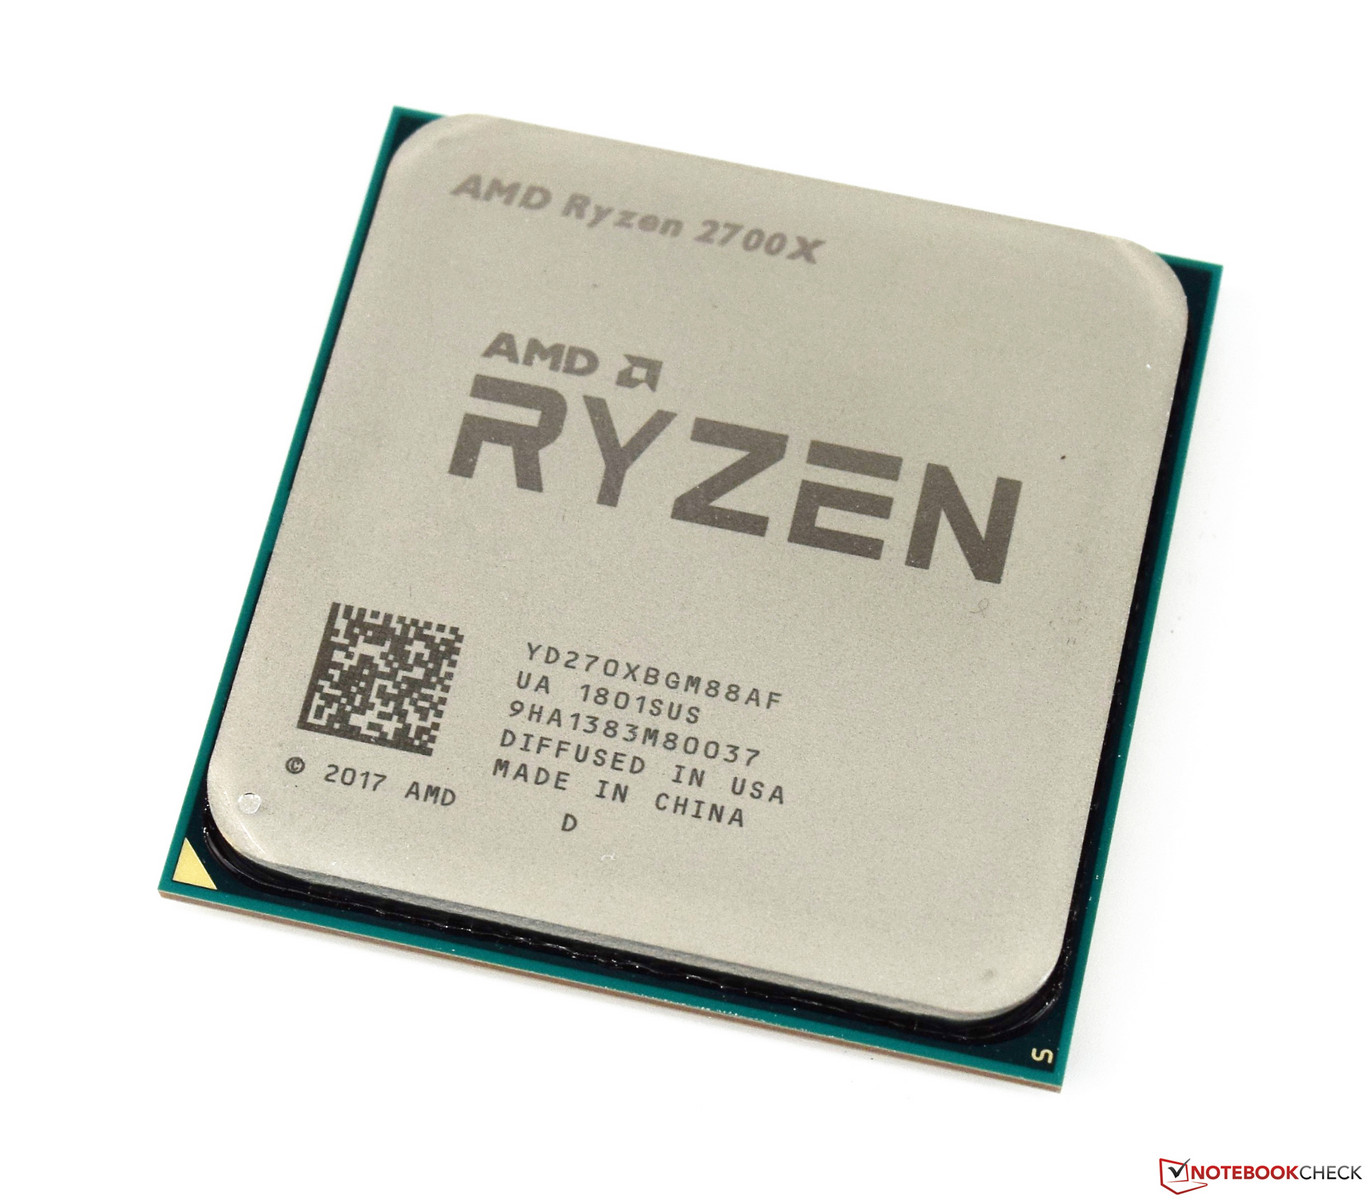
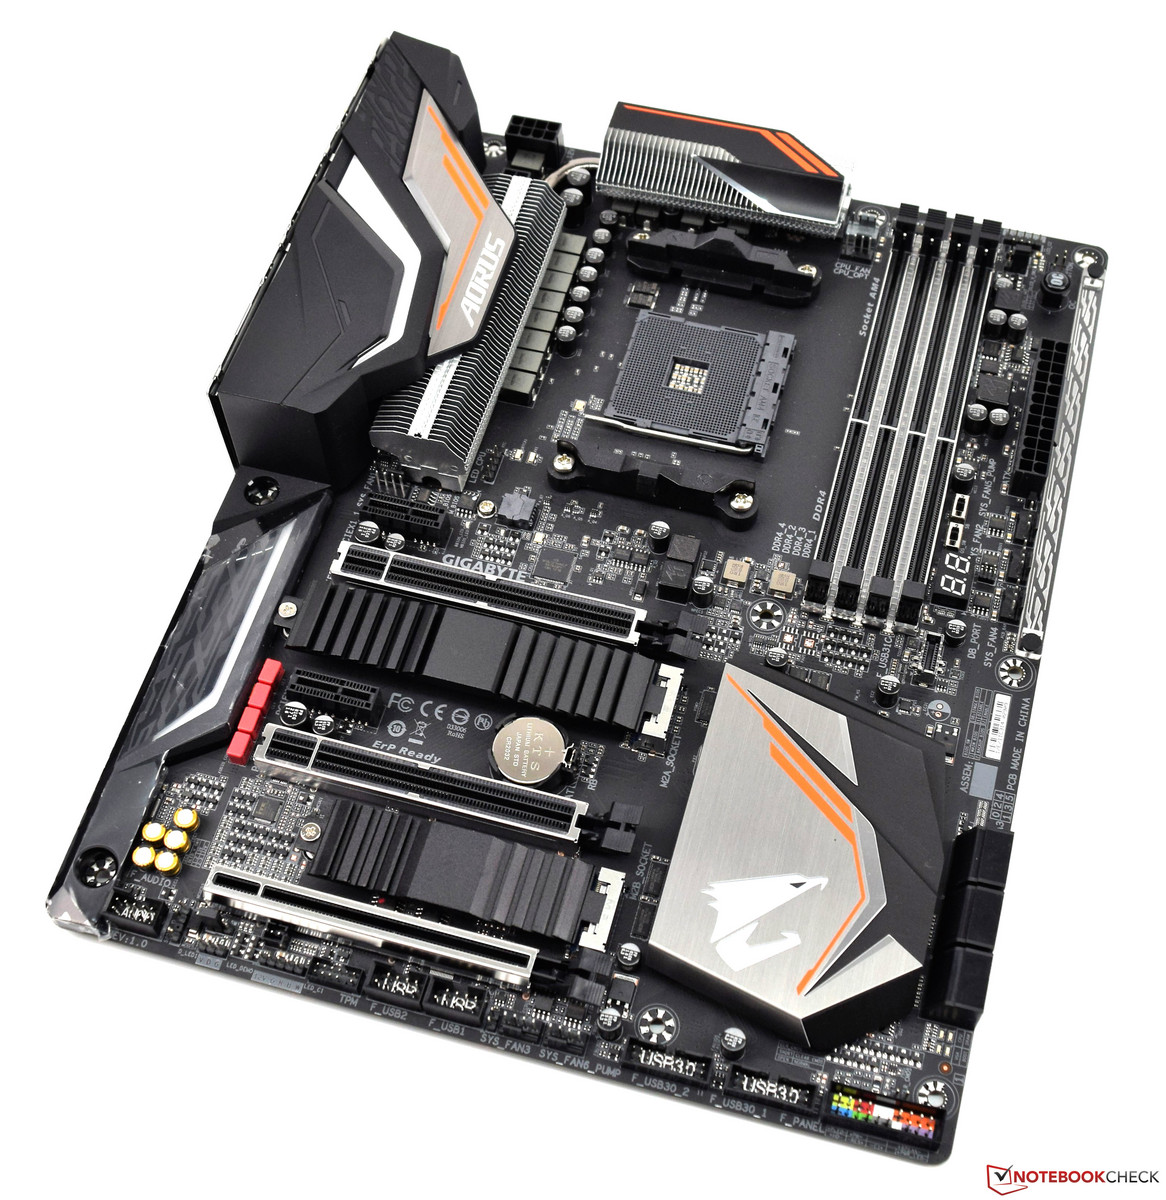
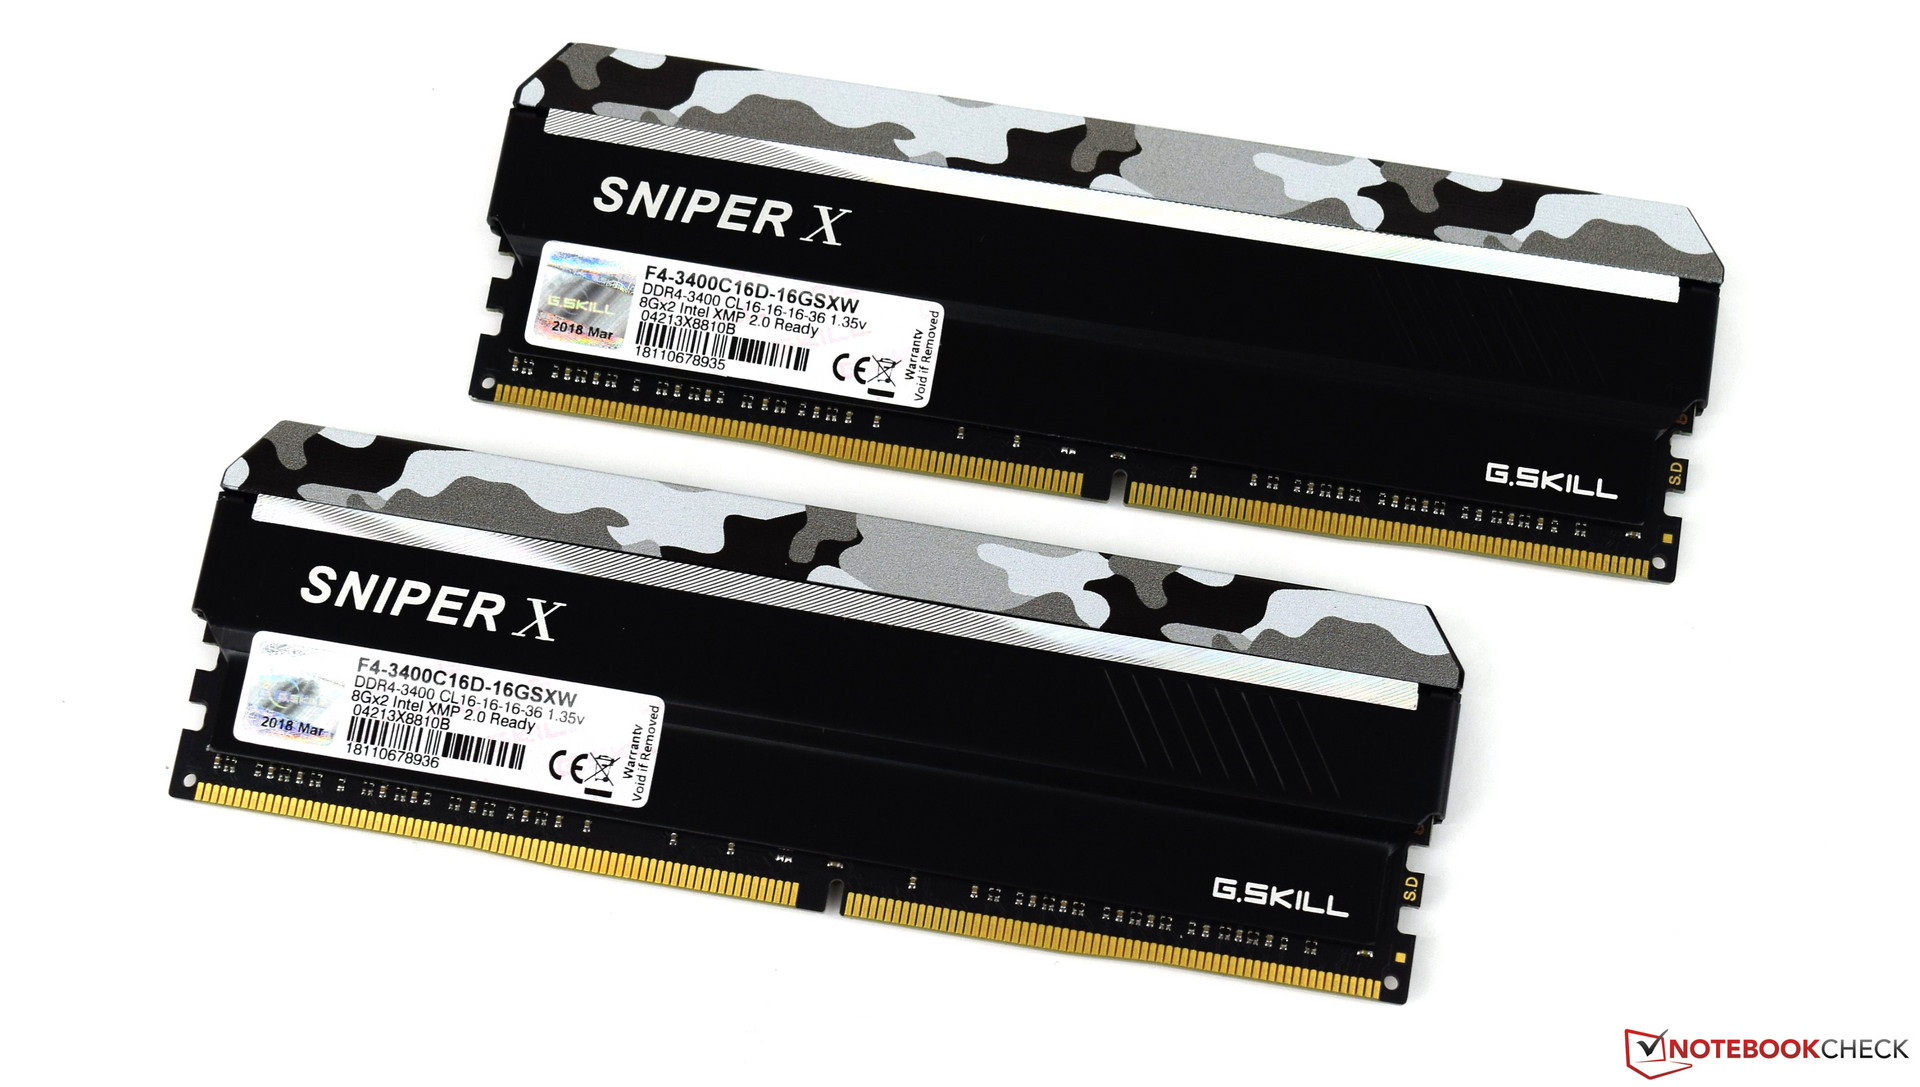
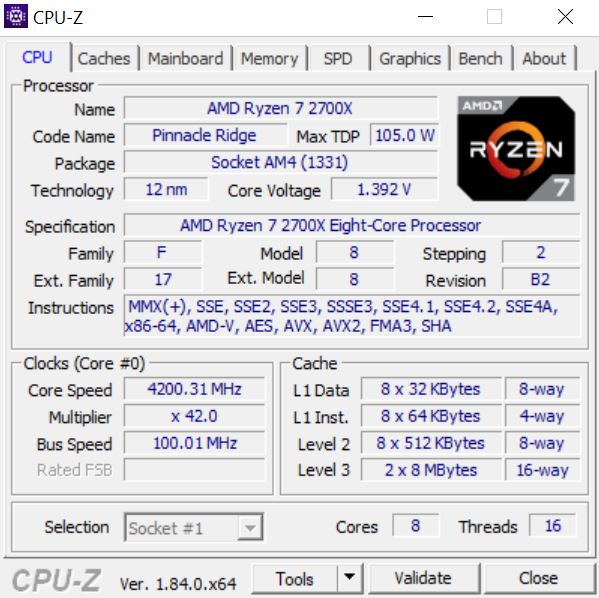
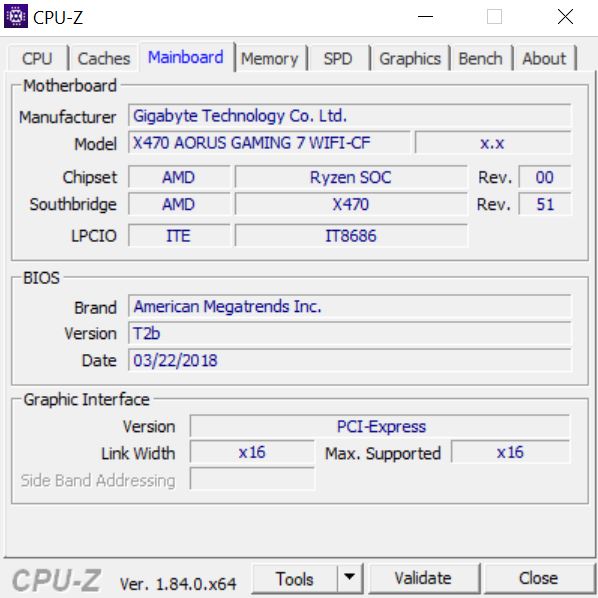
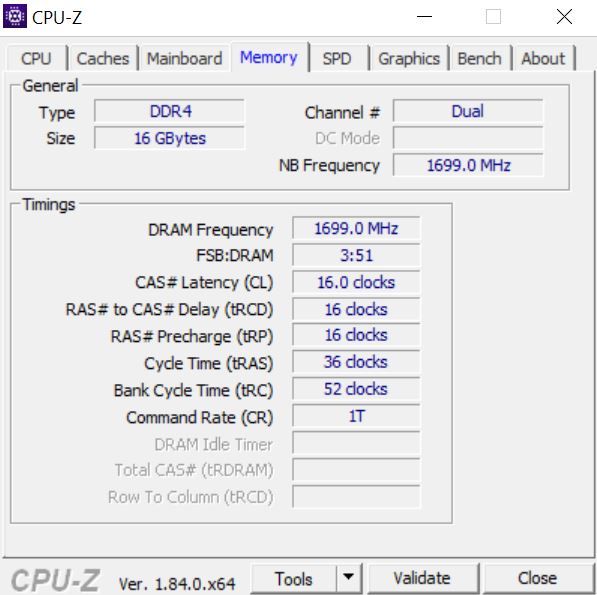
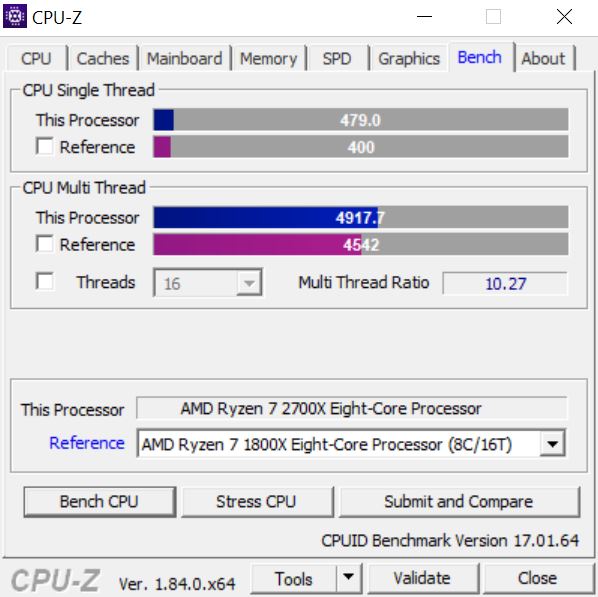
Our test system is built on a Gigabyte X470 Aorus Gaming 7 WiFi. Our CPU is an AMD Ryzen 2700X, a CPU that offers performance, which we have paired with a Be Quiet Silent Loop 280 mm cooler. We have equipped the system with 16 GB of G-Skill Sniper X DDR4 3,400 MHz RAM and we will be testing the card on an Acer Predator XB321HK 4K monitor.
Big thanks to AMD for providing us with our test platform.
| Case | Corsair Carbide Air 540 ATX Cube |
| CPU | AMD RYZEN 7 2700X |
| CPU cooler | Be Quiet Silent Loop 280mm |
| RAM | G-Skill Sniper X 16 GB DDR4 3,400 MHz |
| Mainboard | Gigabyte X470 Aorus Gaming 7 WiFi |
| Monitor | Acer Predator XB321HK 4K |
| SSD | ADATA SP900 M.2 SSD |
| HDD | 2 TB Western Digital (for storing games) |
| OS | Microsoft Windows 10 Professional 64-Bit (Version 1809) |
| Driver | NVIDIA 416.34 |


Clock Speeds
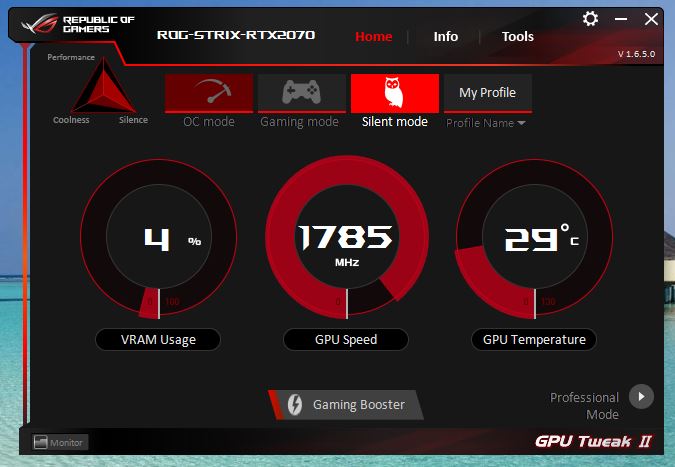
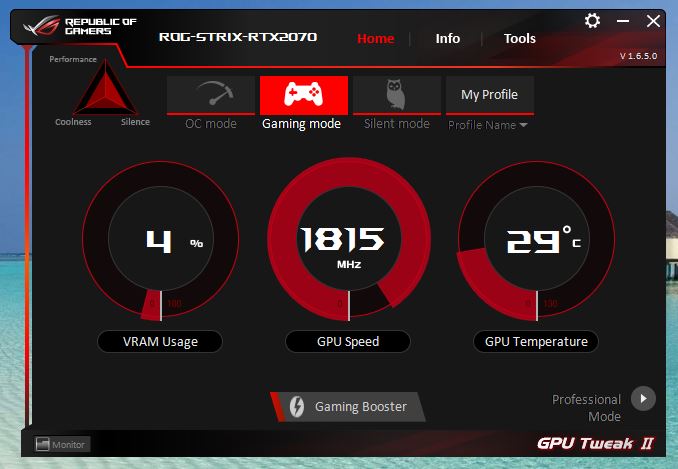
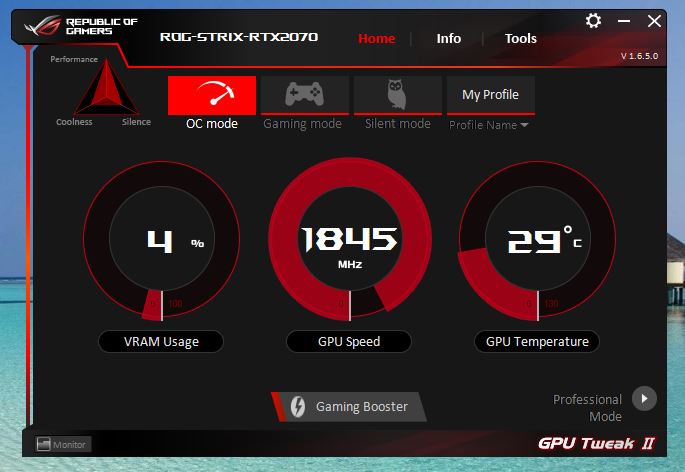
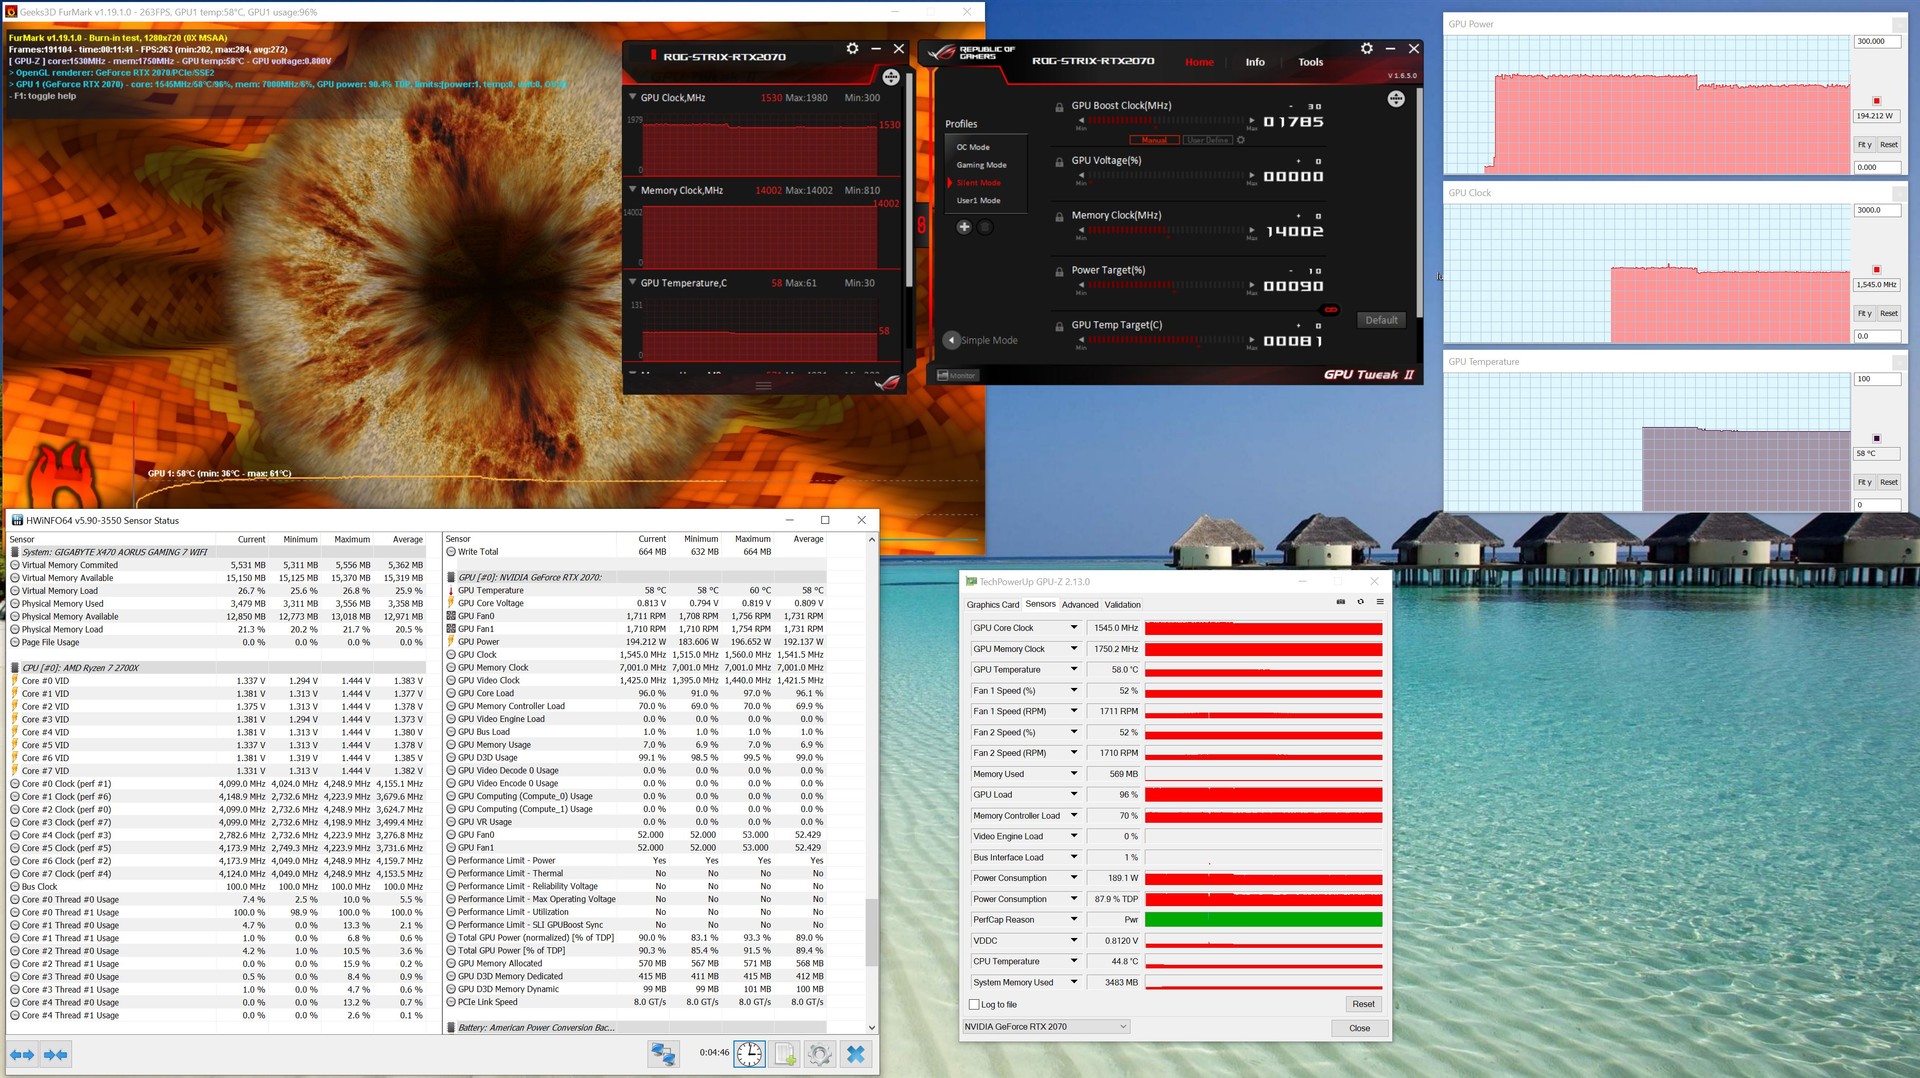
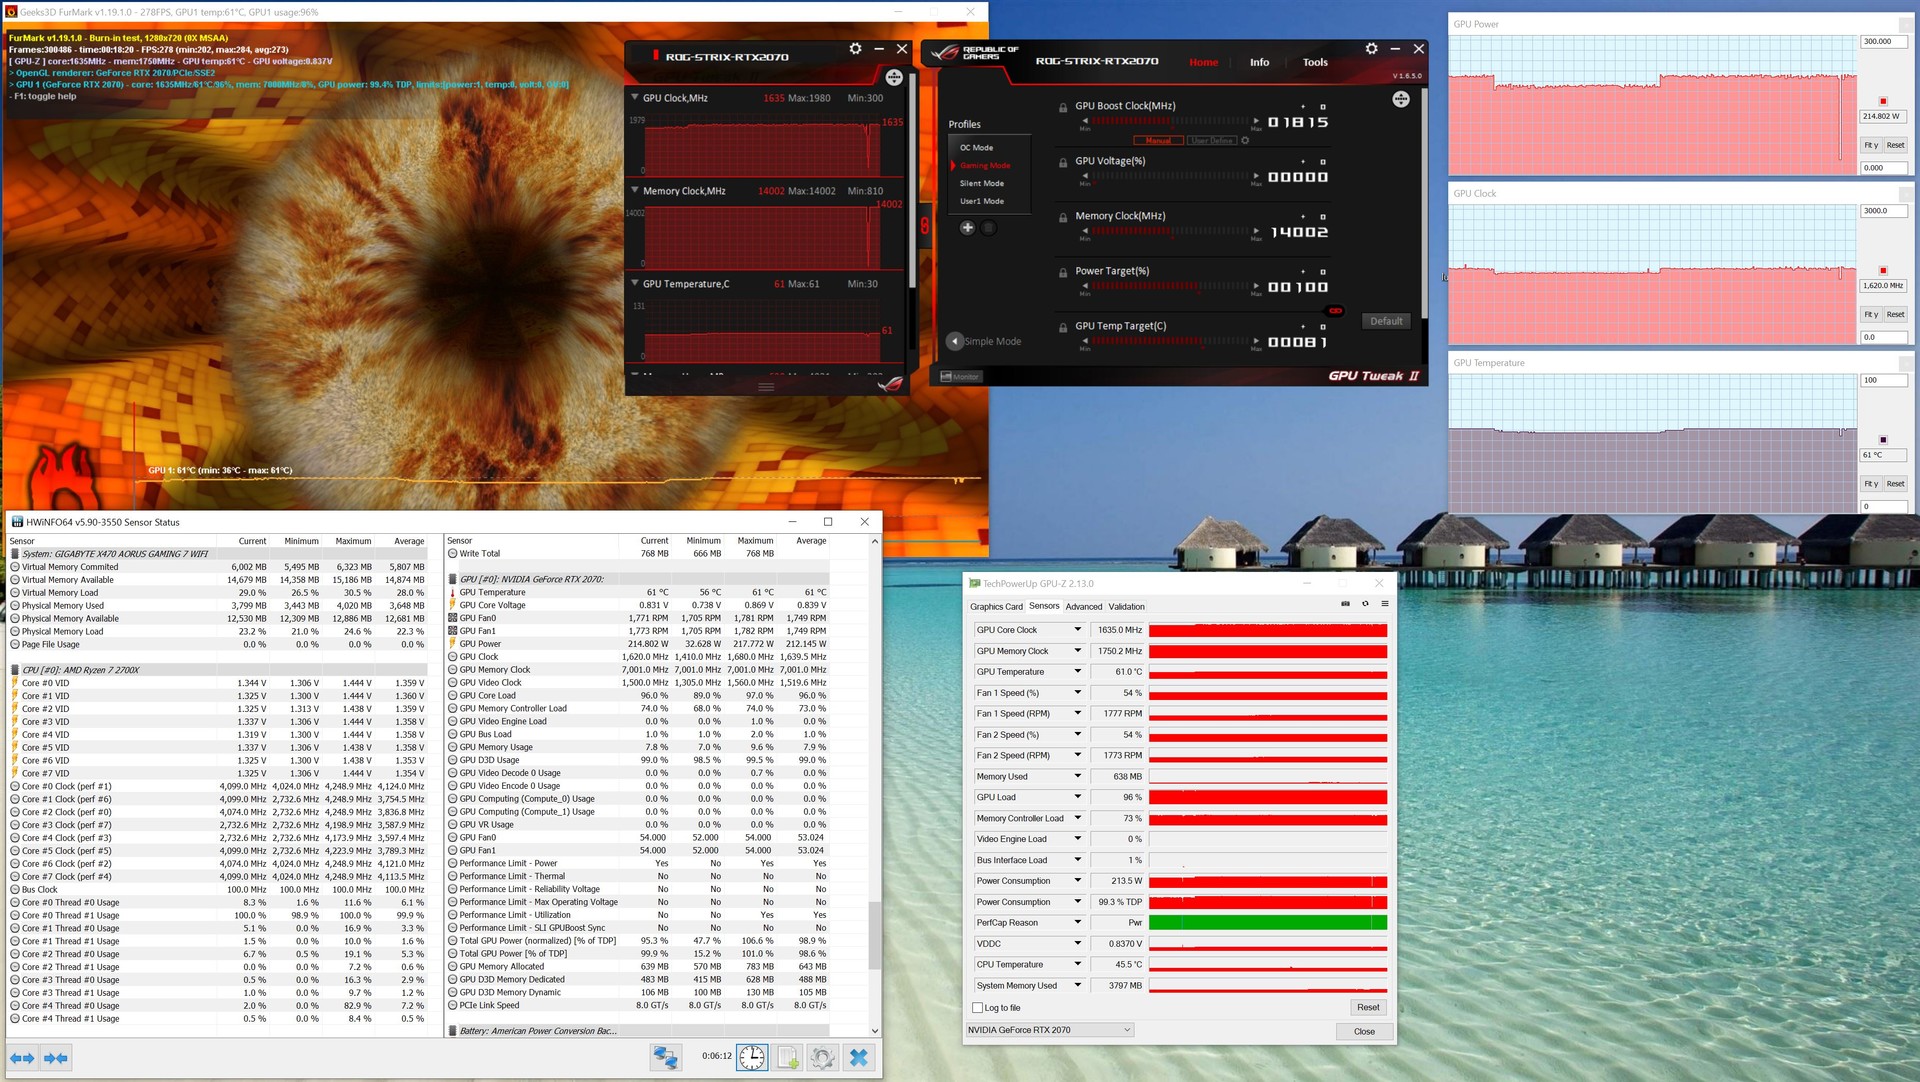
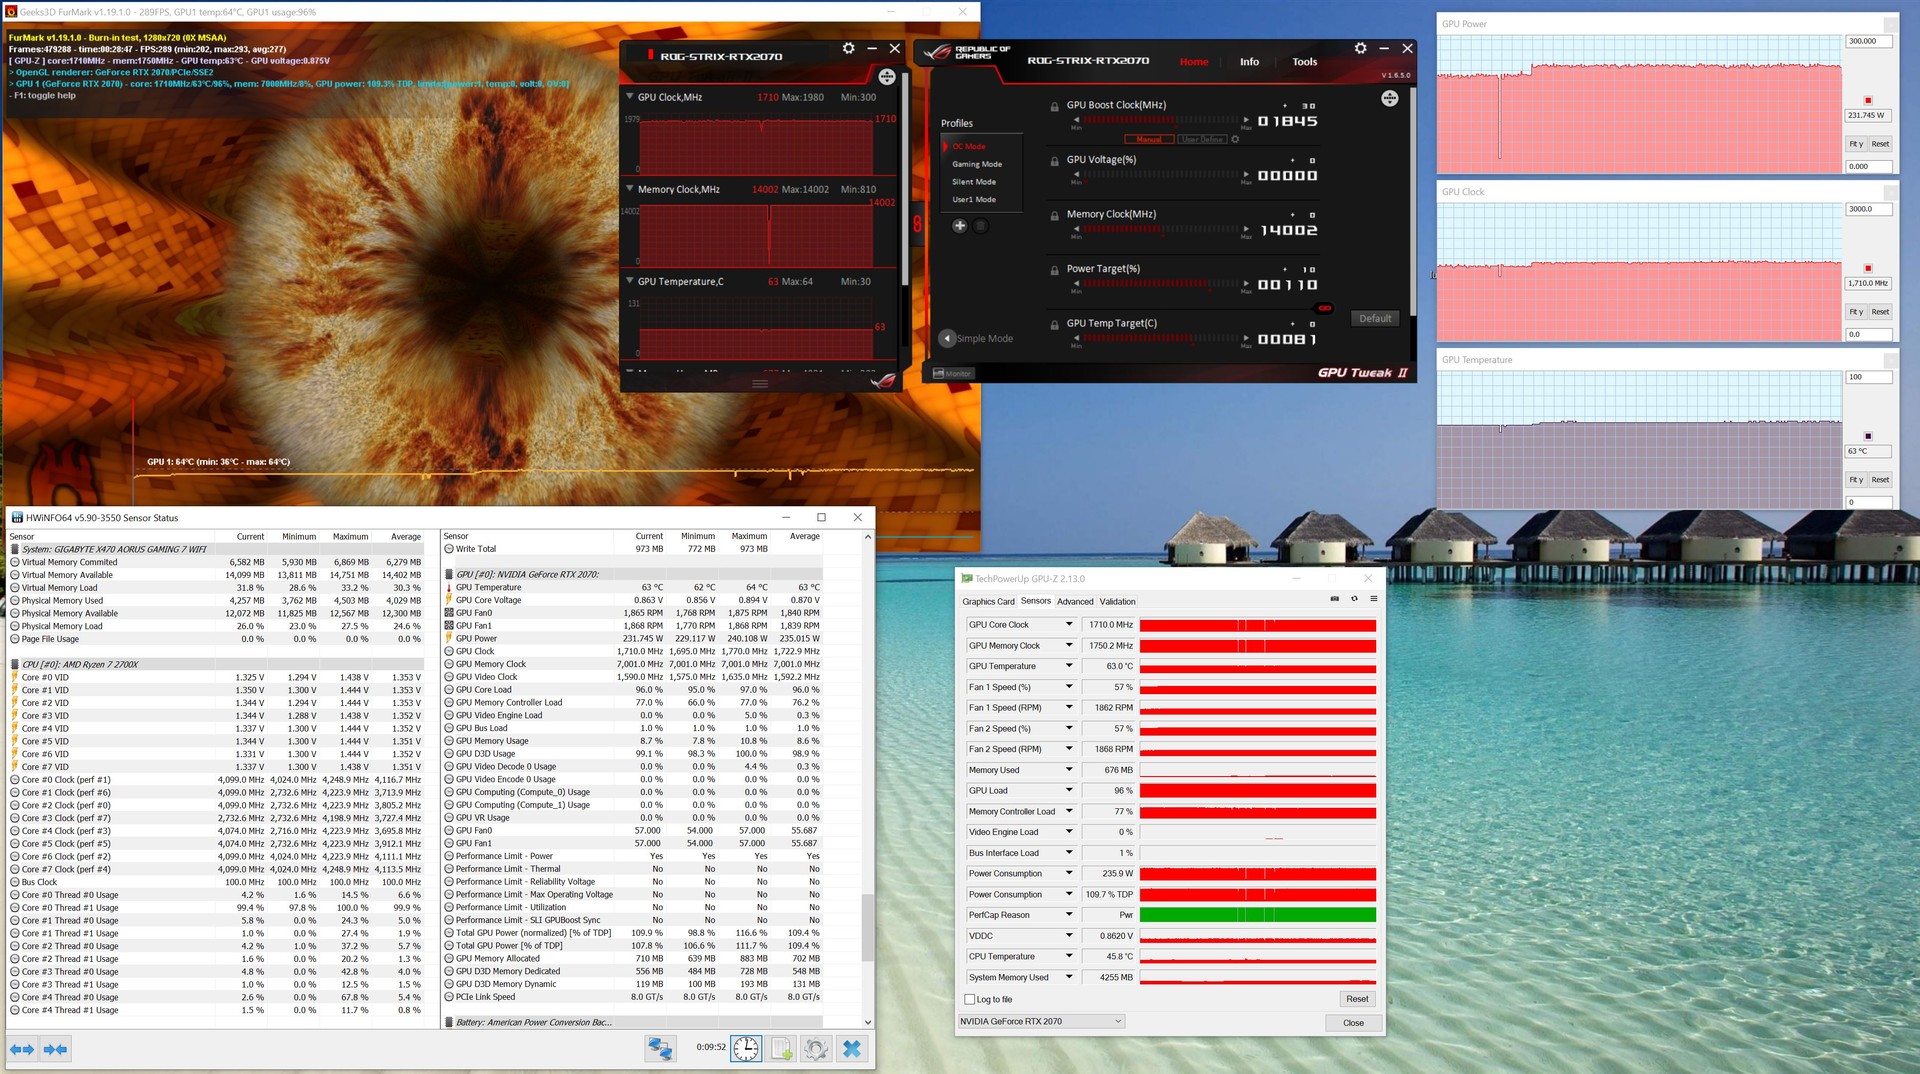
Asus has significantly increased its GPUs clock speeds compared to Nvidia’s Founders Edition. The ROG RTX Strix 2070 OC clocks up to 1,815 MHz when set to Gaming mode, which is 105 MHz higher than the Founder Edition’s boost clock speed. Asus’ GPU Tweak II software also allows the card to operate silently or in OC mode. The GPU increases by an additional 30 MHz in OC mode and drops by the same amount in Silent mode. The tweak also adjusts the power target to 90% for Silent mode and to 110% for OC mode. Asus has set the power target to 100% for the card’s Gaming mode, which is the mode in which we have conducted benchmarks.
The ROG Strix RTX 2070 OC also has a manual clock mode should you prefer fine control over clock speeds.
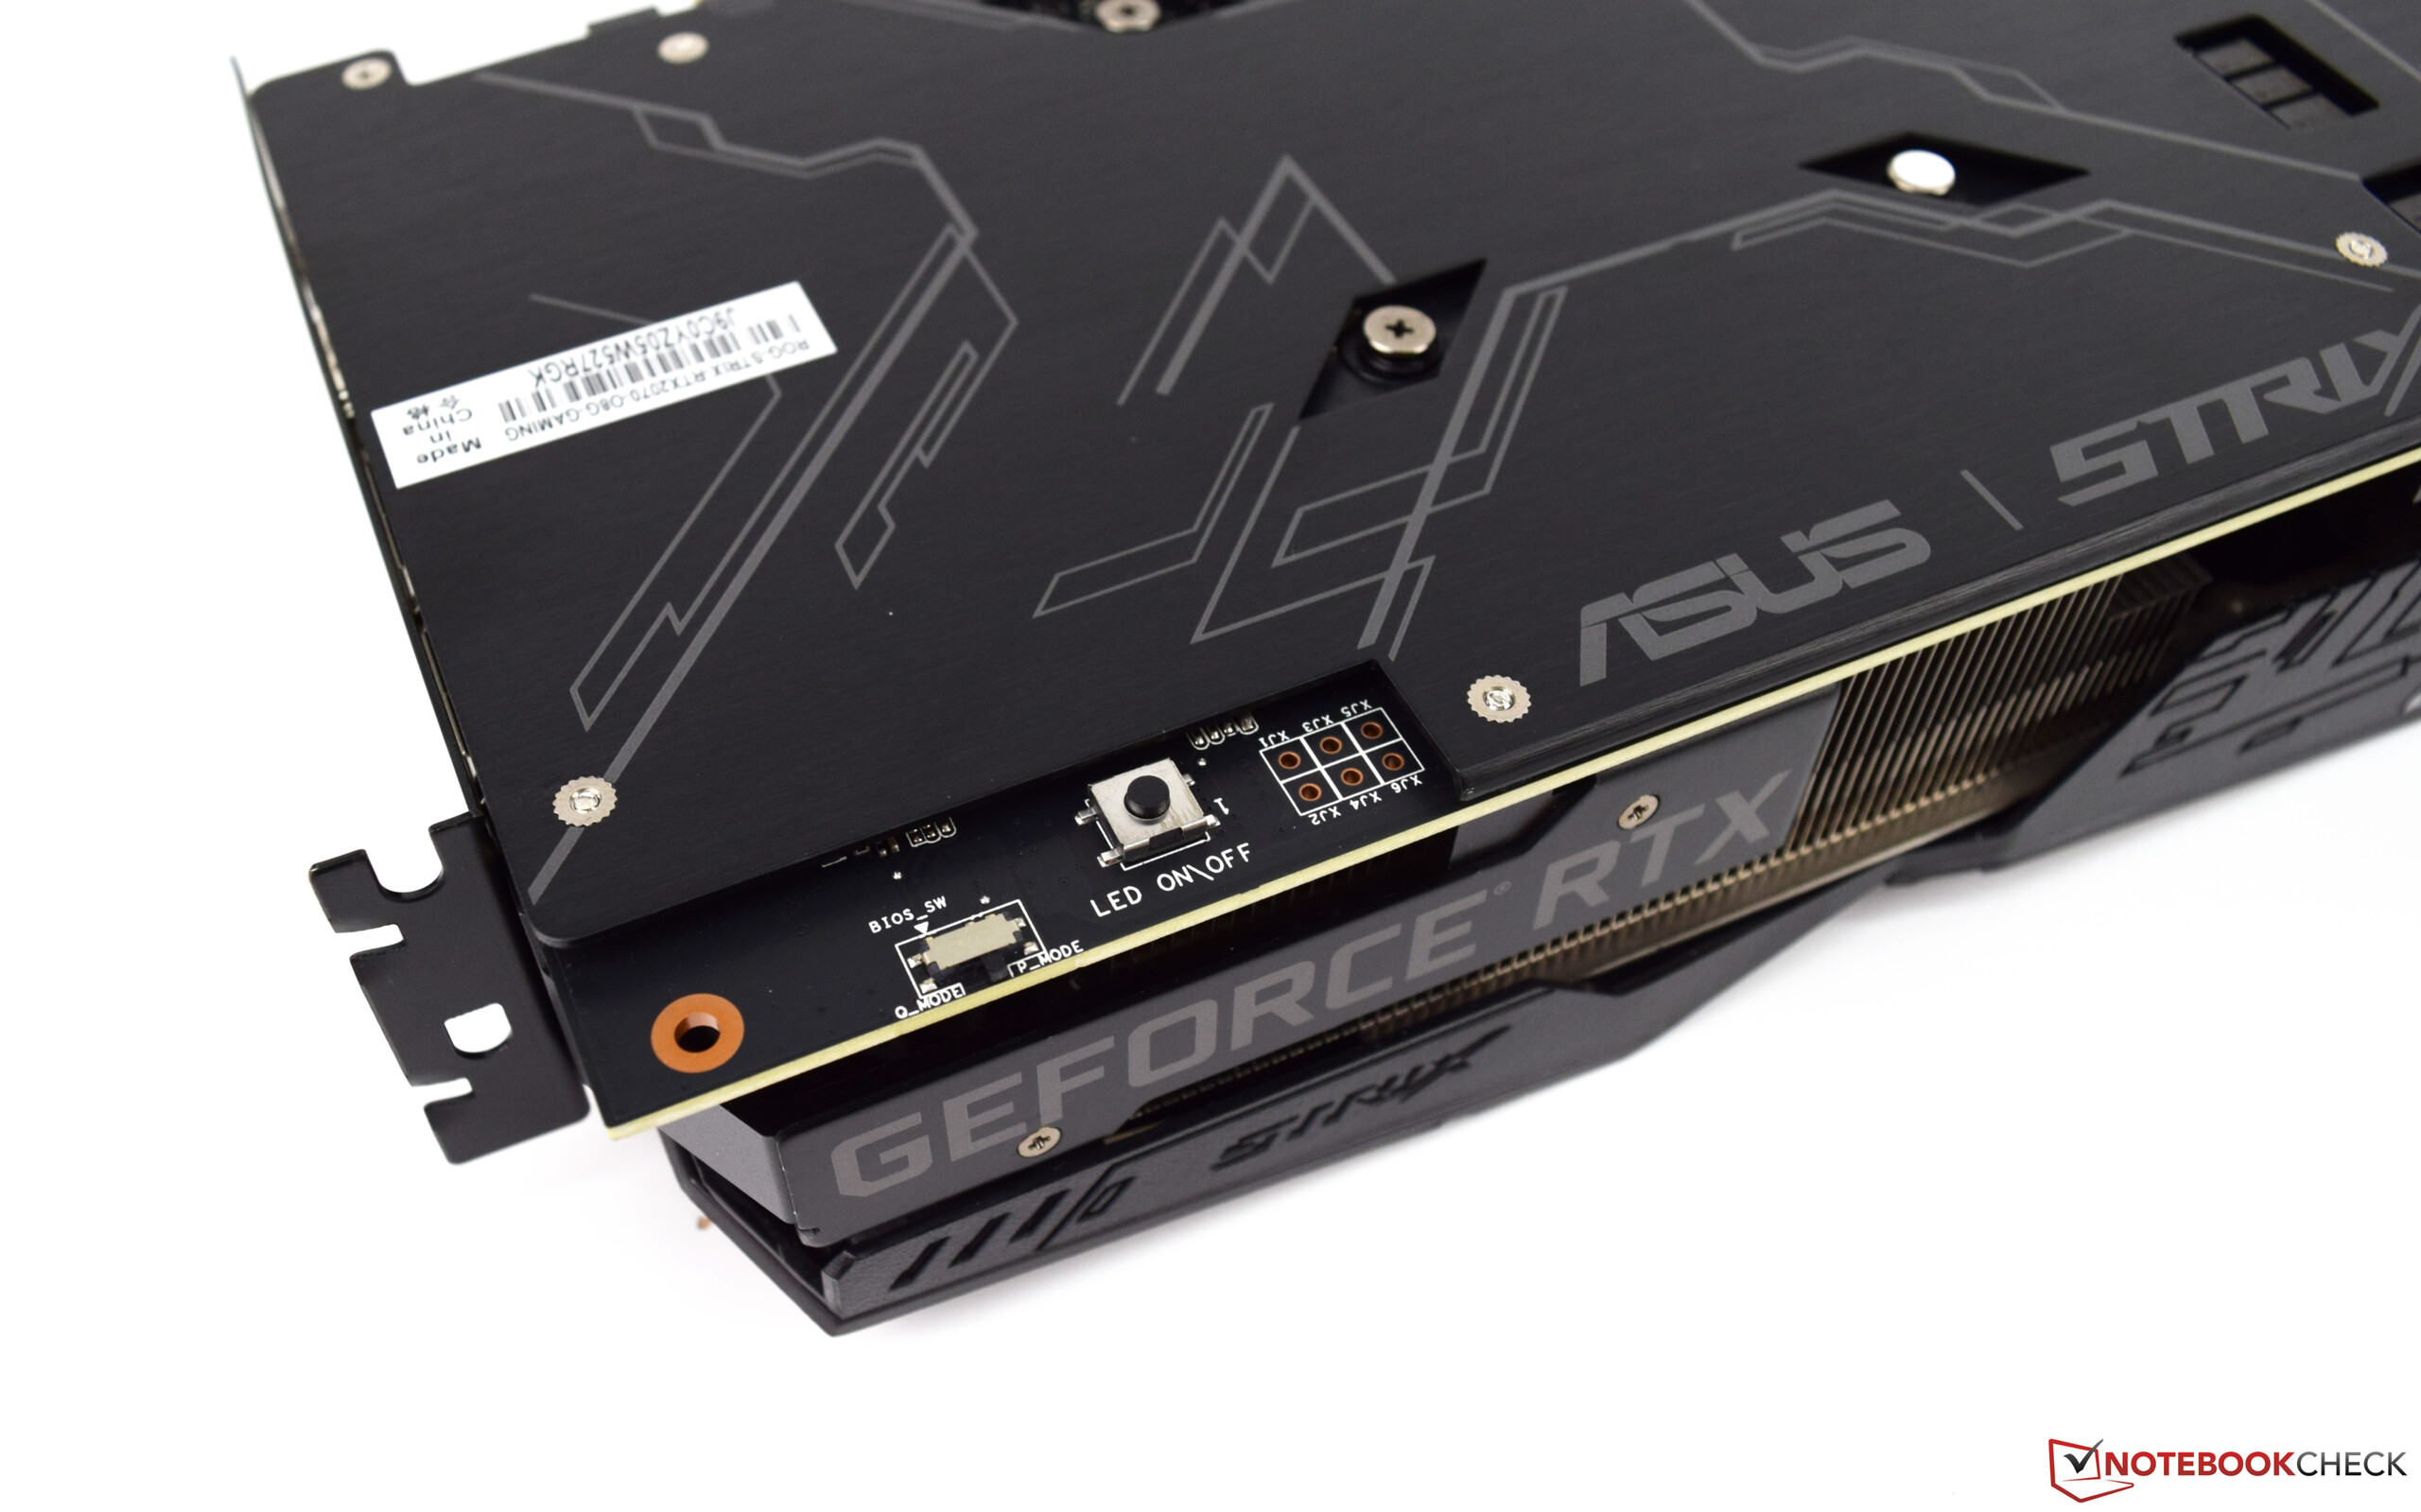
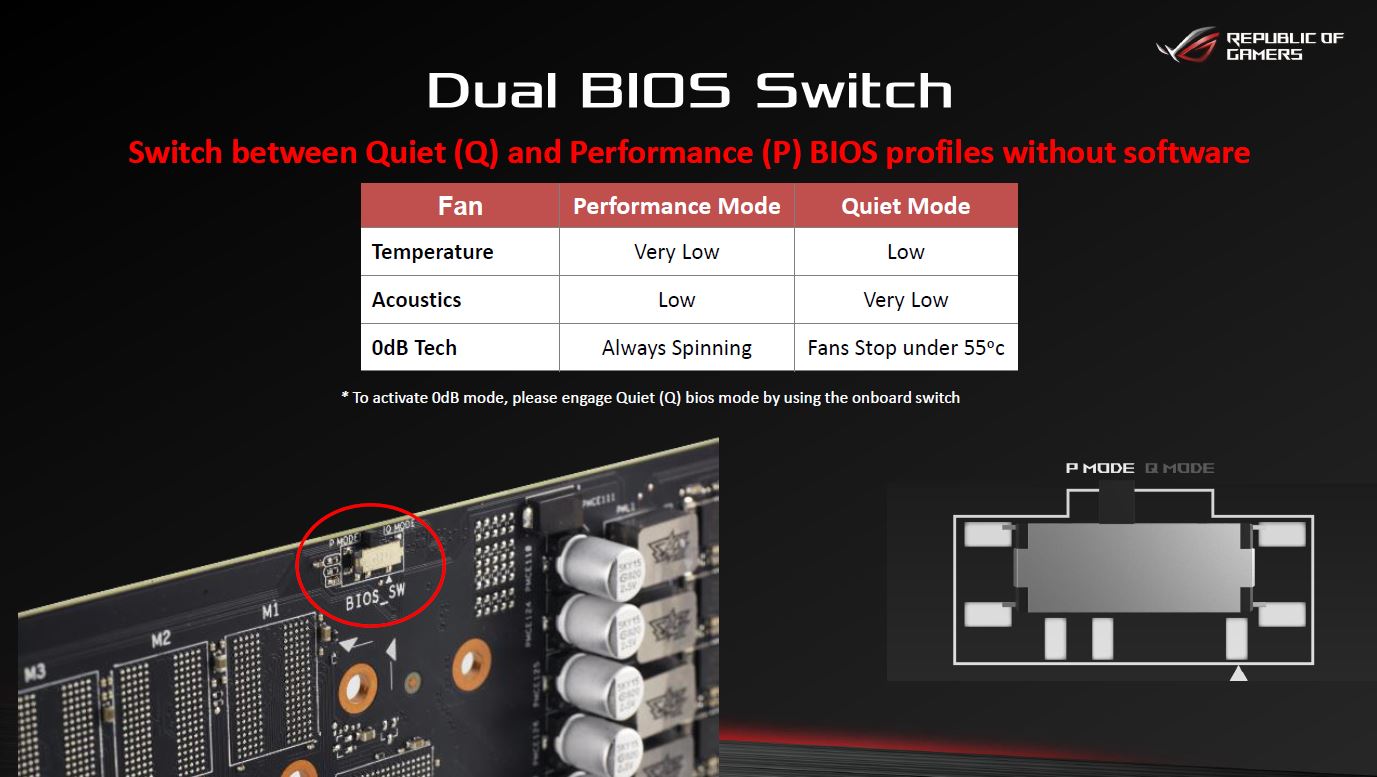
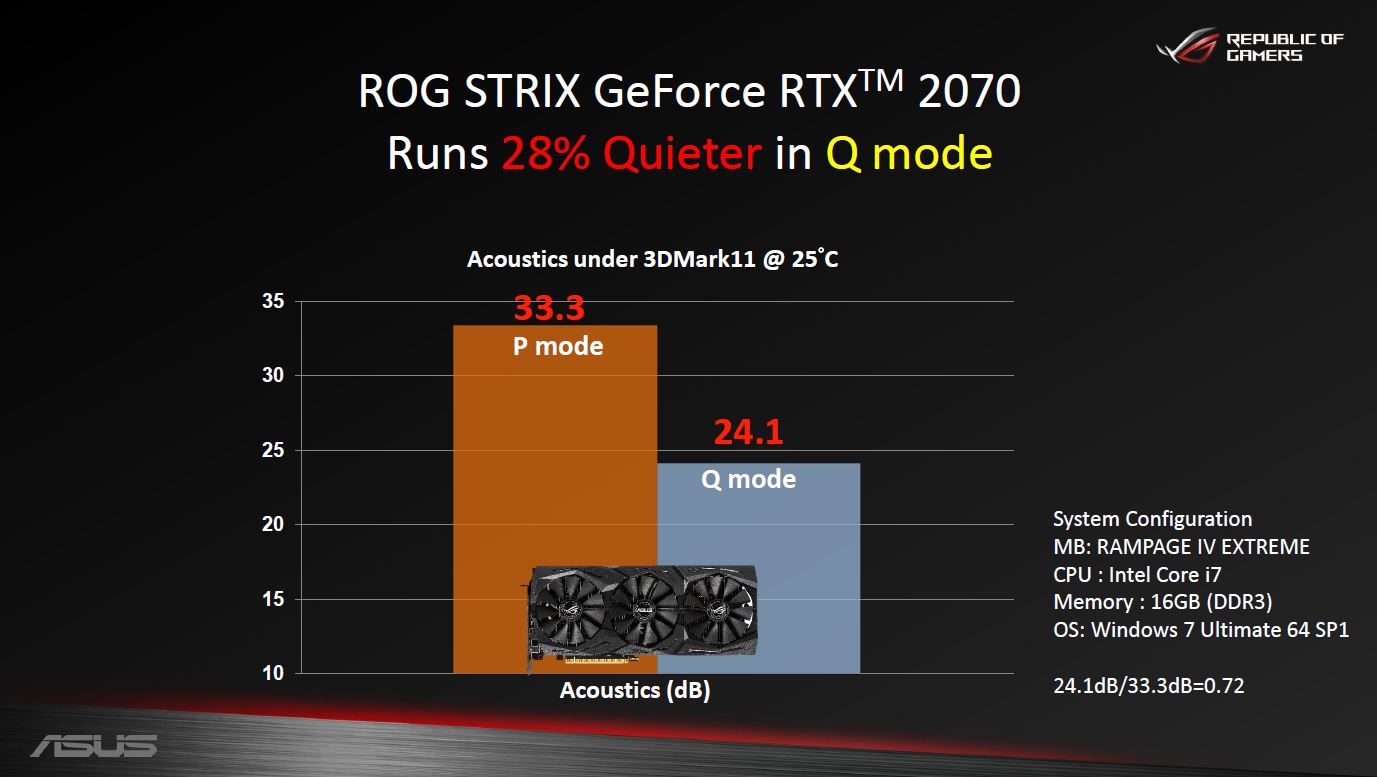
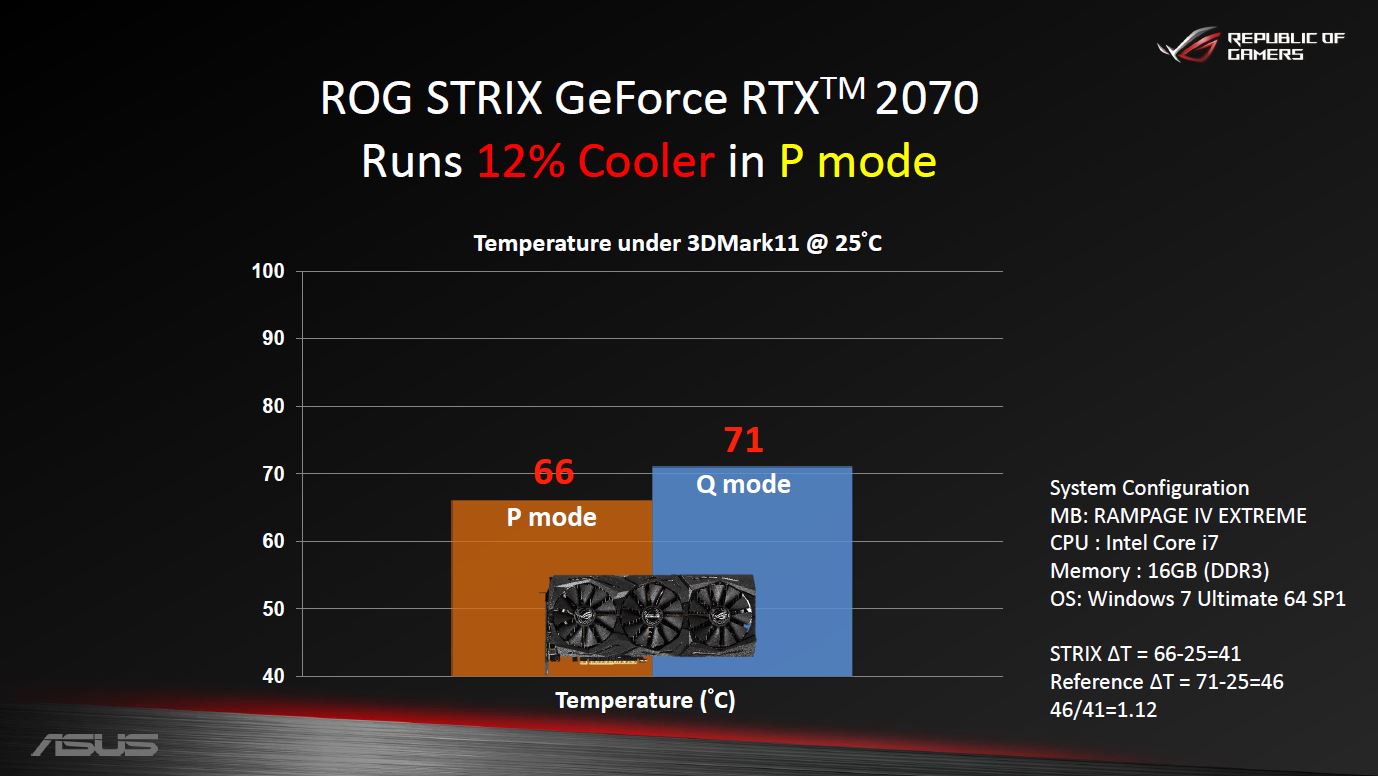
The graphics card also has a dual-BIOS named Performance Mode and Quiet Mode. We set our test GPU to the former for our benchmarks. Performance Mode sets the fans to always on, which increases fan noise but reduces temperatures when the card is idling. As its name suggests, the Quiet Mode turns the fans off for a quieter gaming experience. However, the fans start ramping up from 55 °C upwards.
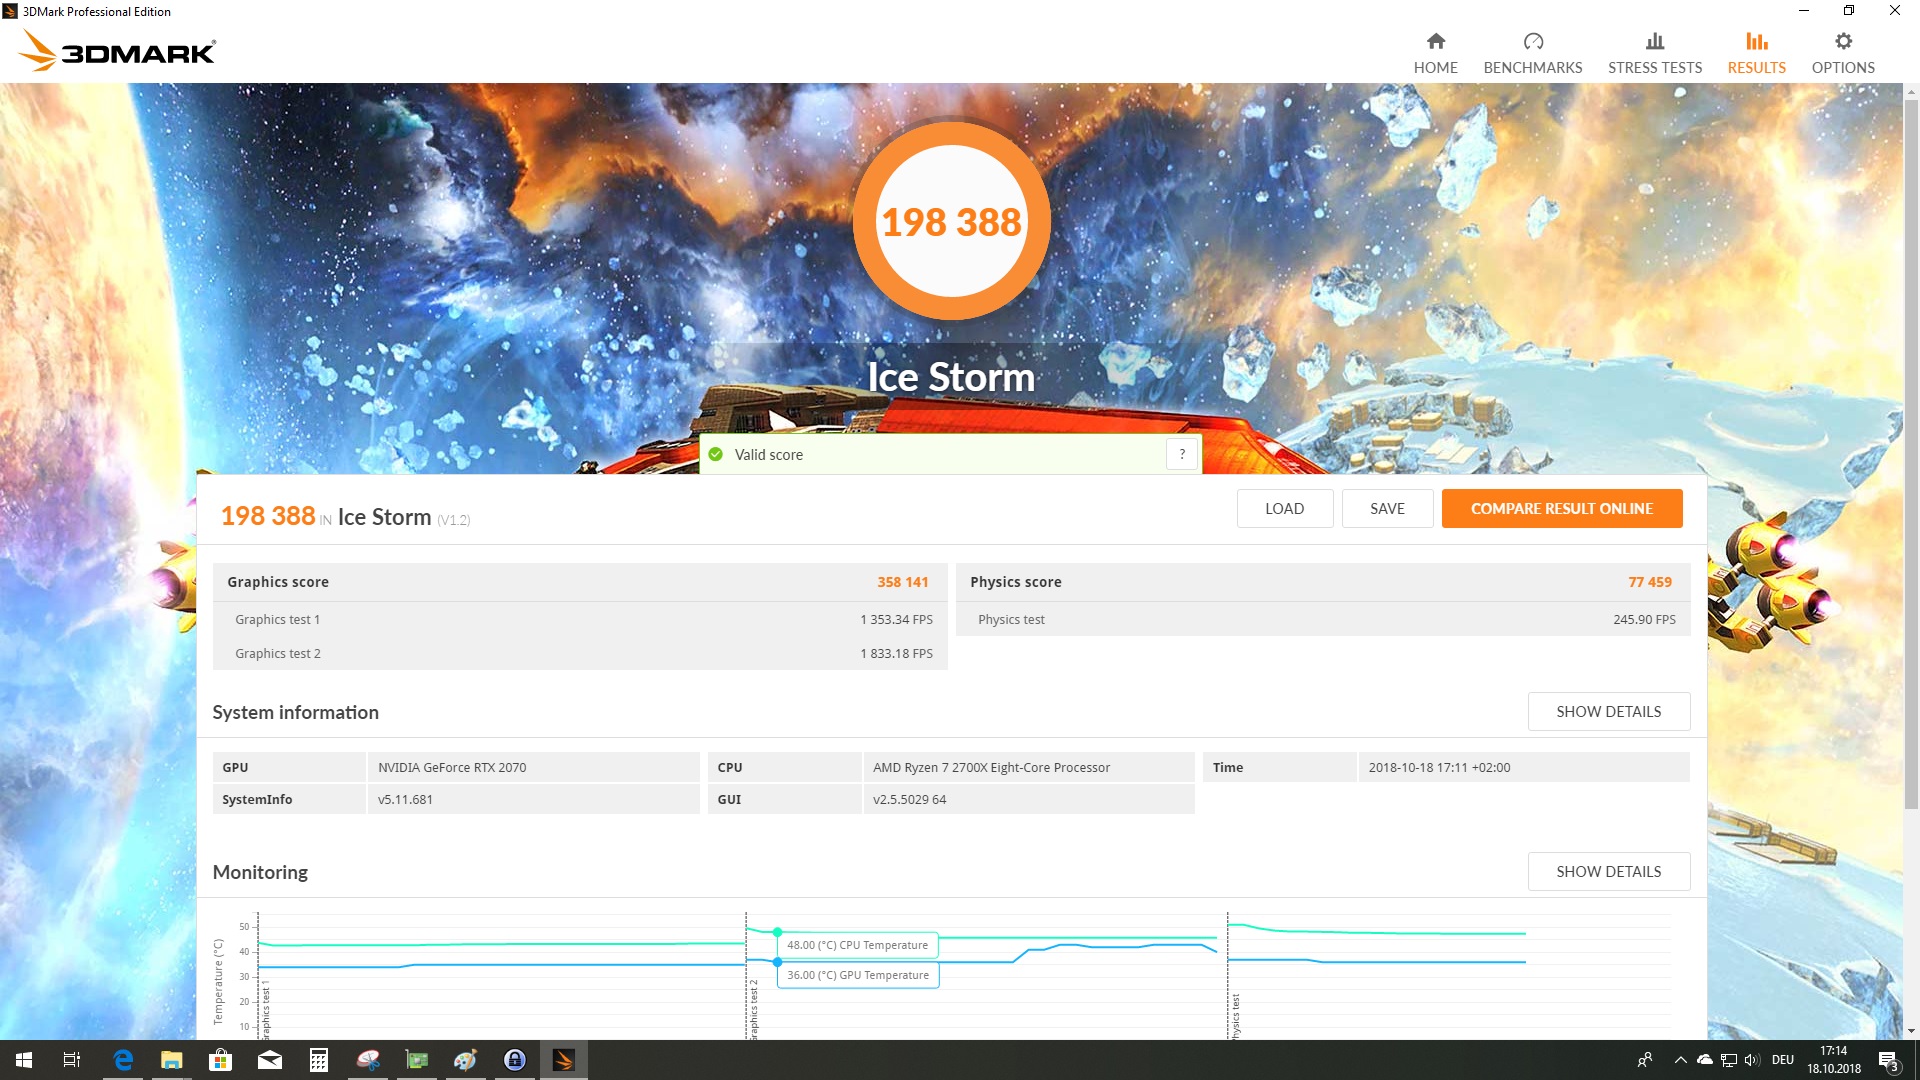
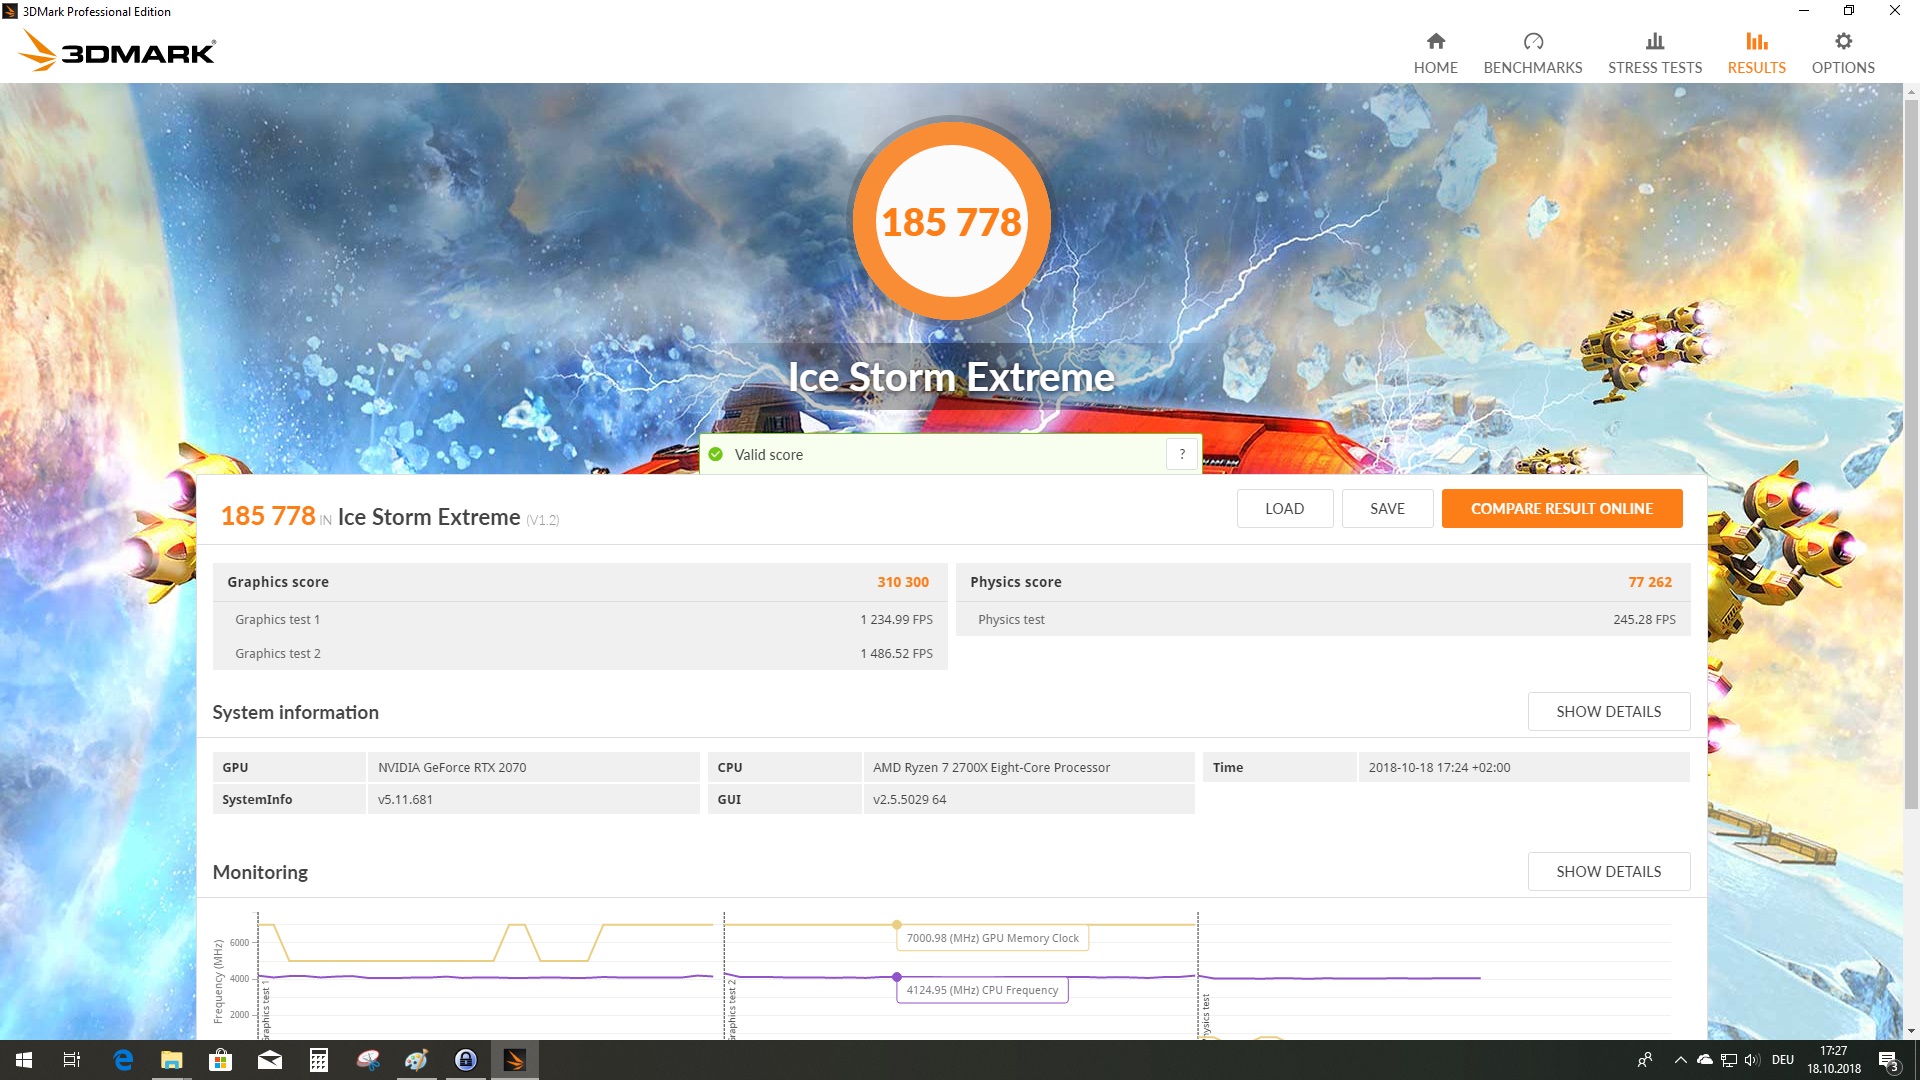
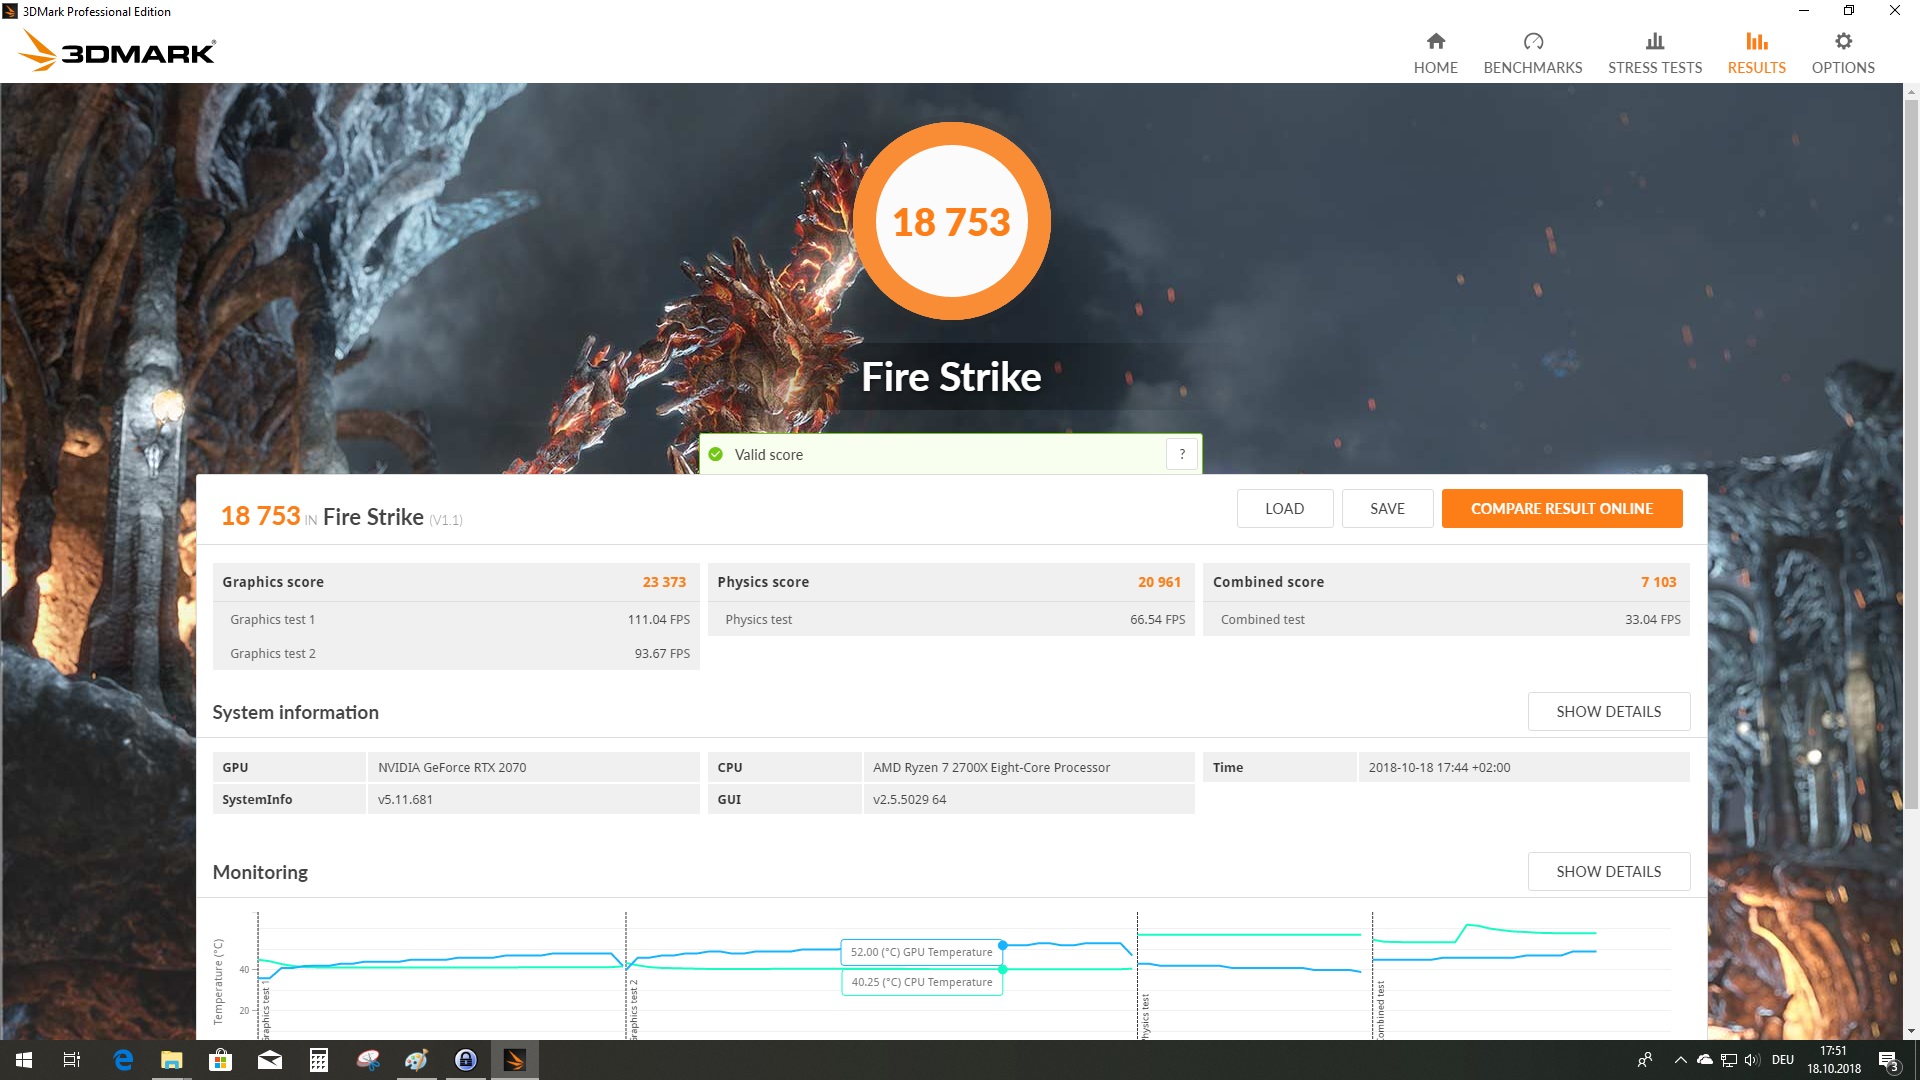
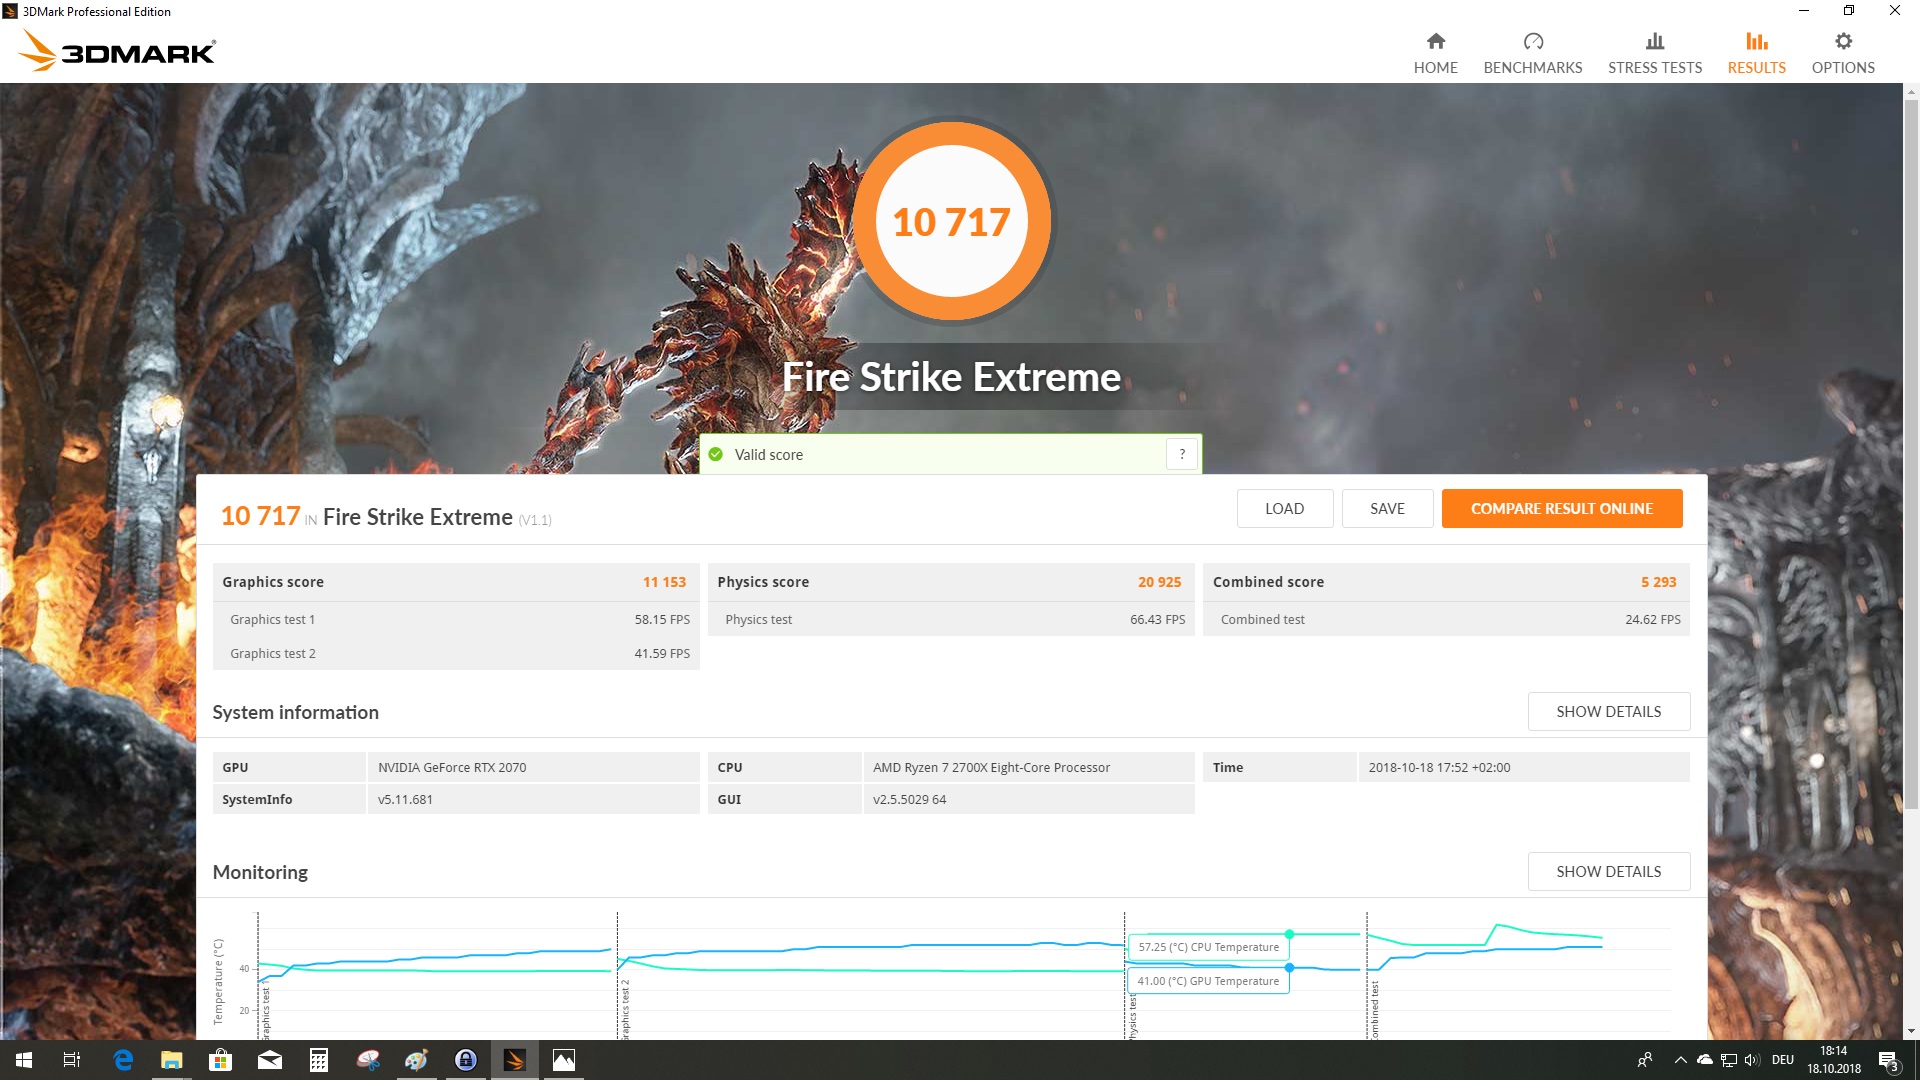
Synthetic Benchmarks
The ROG Strix RTX 2070 OC performs better than the GeForce GTX 1080 Founders Edition and scores around 40% in 3DMark Fire Strike benchmarks than its predecessor, the GeForce GTX 1070. By contrast, the GeForce GTX 1080 Ti is around 20% faster than our test sample. Moreover, the ROG Strix RTX 2070 OC is marginally faster than AMD’s Radeon RX Vega 64.


| 3DMark | |
| 1920x1080 Fire Strike Graphics | |
| Nvidia GeForce GTX 1080 Ti Founders Edition | |
| NVIDIA Titan X Pascal | |
| Asus ROG Strix RTX 2070 OC | |
| MSI Gaming X GeForce GTX 1080 Desktop PC | |
| AMD Radeon RX Vega 64 | |
| Nvidia GeForce GTX 1080 Founders Edition | |
| Nvidia GeForce GTX 1070 Founders Edition | |
| Asus ROG Strix RX 580 8 GB | |
| 1280x720 Cloud Gate Standard Graphics | |
| Asus ROG Strix RTX 2070 OC | |
| Nvidia GeForce GTX 1080 Founders Edition | |
| MSI Gaming X GeForce GTX 1080 Desktop PC | |
| AMD Radeon RX Vega 64 | |
| Nvidia GeForce GTX 1070 Founders Edition | |
| NVIDIA Titan X Pascal | |
| Asus ROG Strix RX 580 8 GB | |
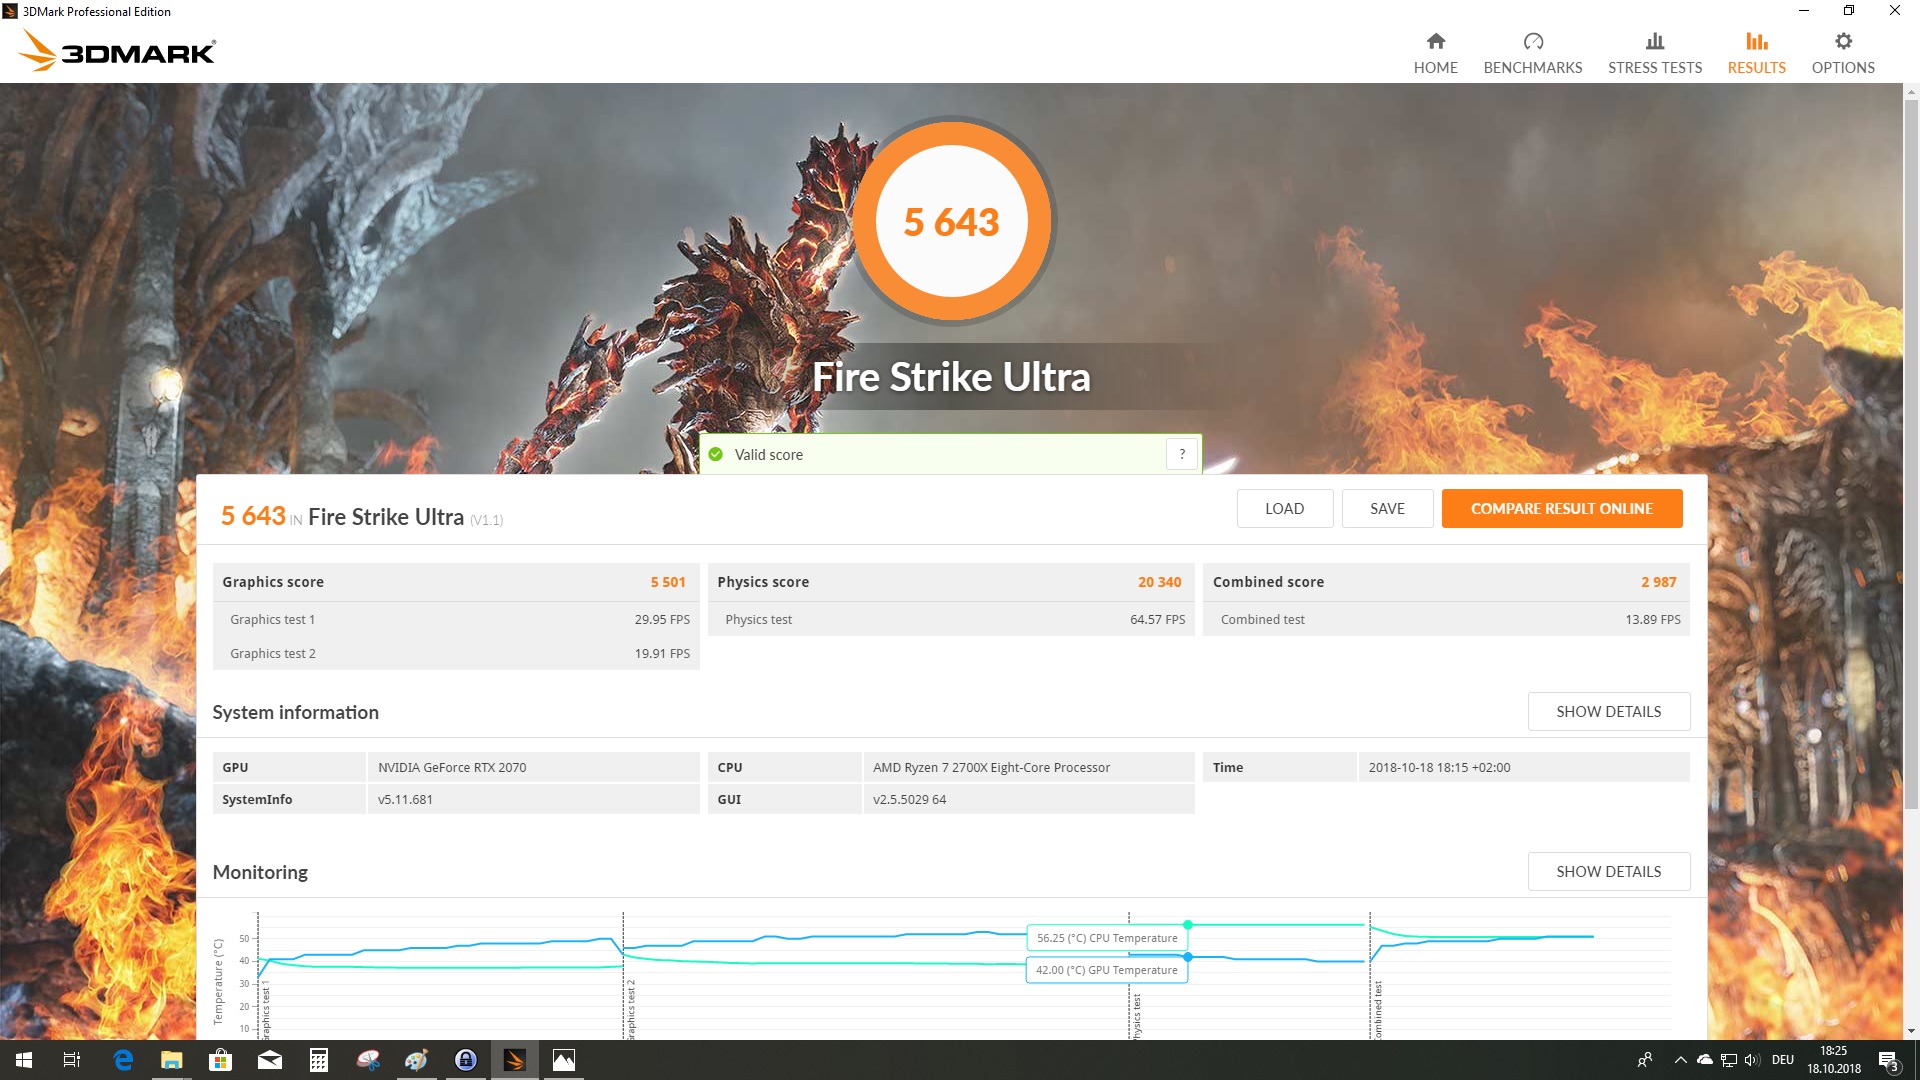
| 3840x2160 Fire Strike Ultra Graphics | |
| NVIDIA Titan X Pascal | |
| Nvidia GeForce GTX 1080 Ti Founders Edition | |
| Asus ROG Strix RTX 2070 OC | |
| AMD Radeon RX Vega 64 | |
| Nvidia GeForce GTX 1080 Founders Edition | |
| Nvidia GeForce GTX 1070 Founders Edition | |
| Asus ROG Strix RX 580 8 GB | |
| Unigine Valley 1.0 - 1920x1080 Extreme HD DirectX AA:x8 | |
| Nvidia GeForce GTX 1080 Ti Founders Edition | |
| Asus ROG Strix RTX 2070 OC | |
| MSI Gaming X GeForce GTX 1080 Desktop PC | |
| Nvidia GeForce GTX 1080 Founders Edition | |
| Nvidia GeForce GTX 1070 Founders Edition | |
| Asus ROG Strix RX 580 8 GB | |
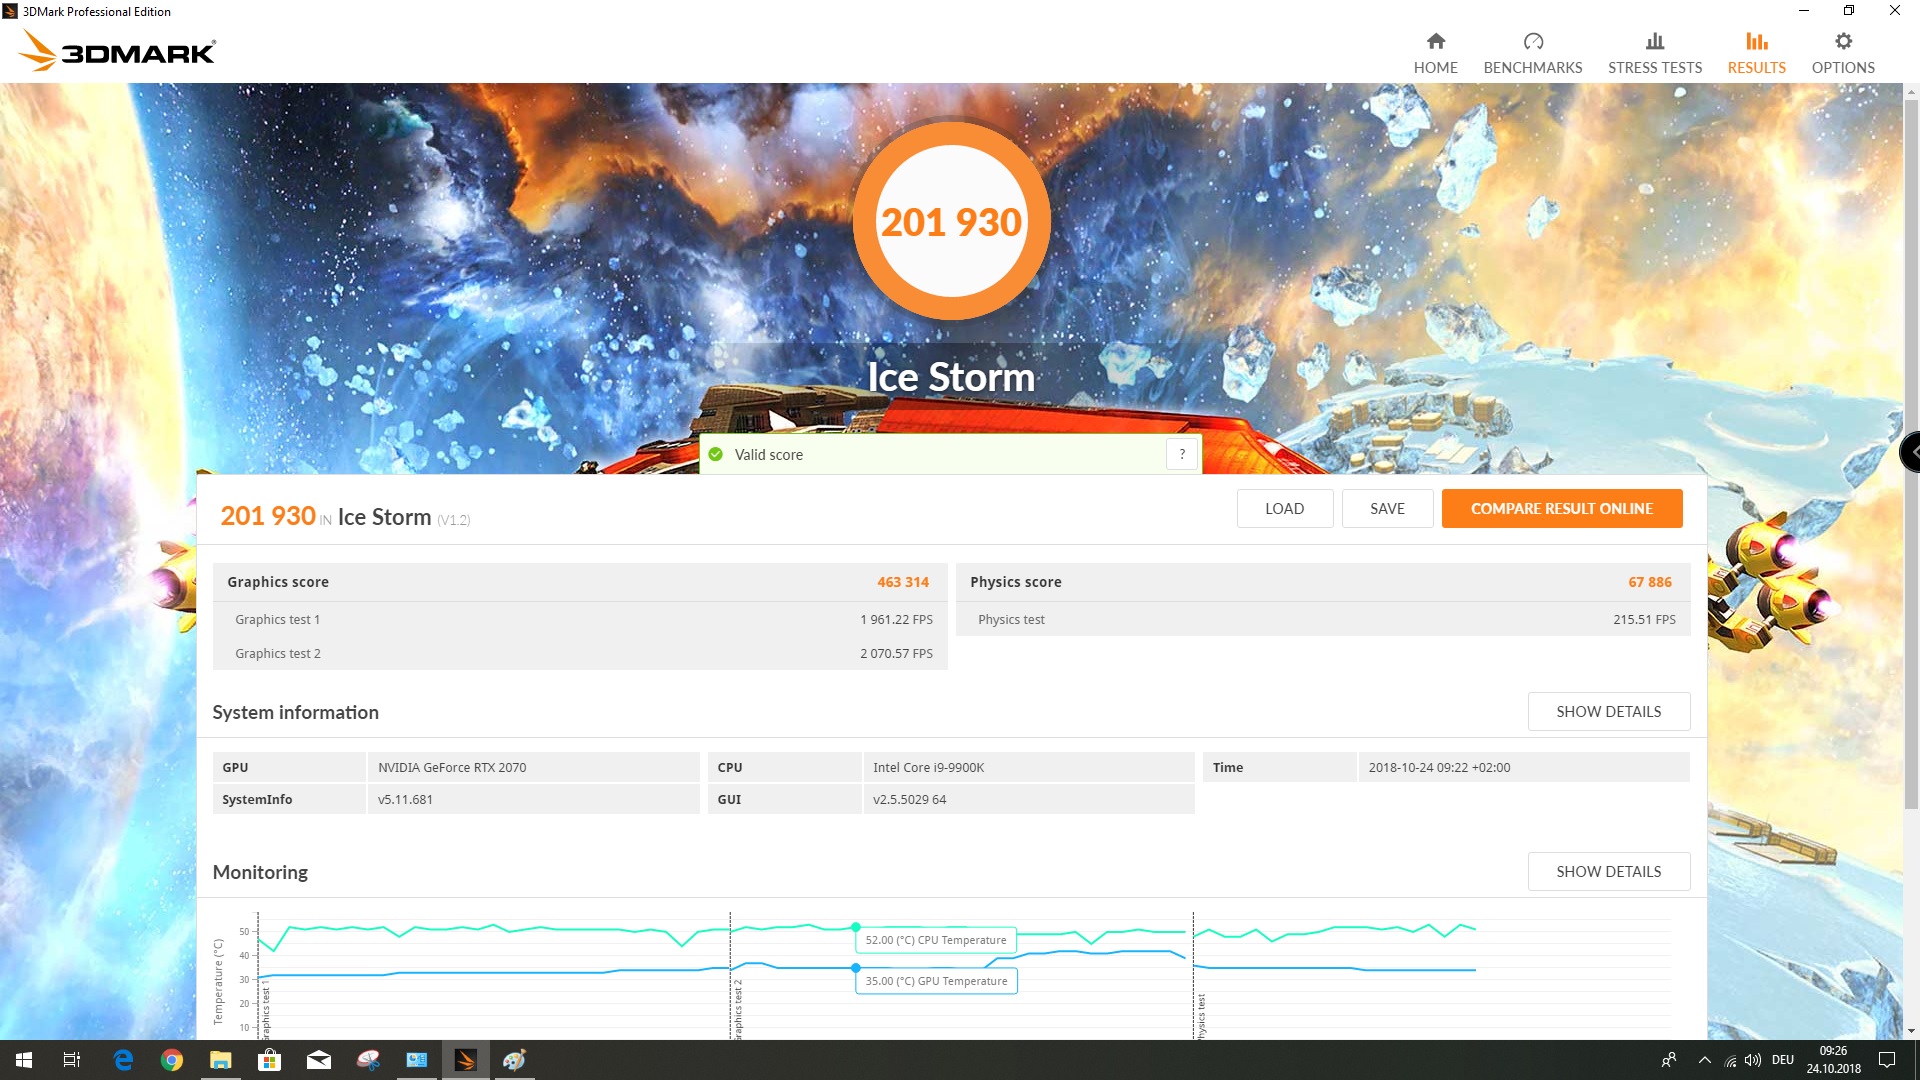
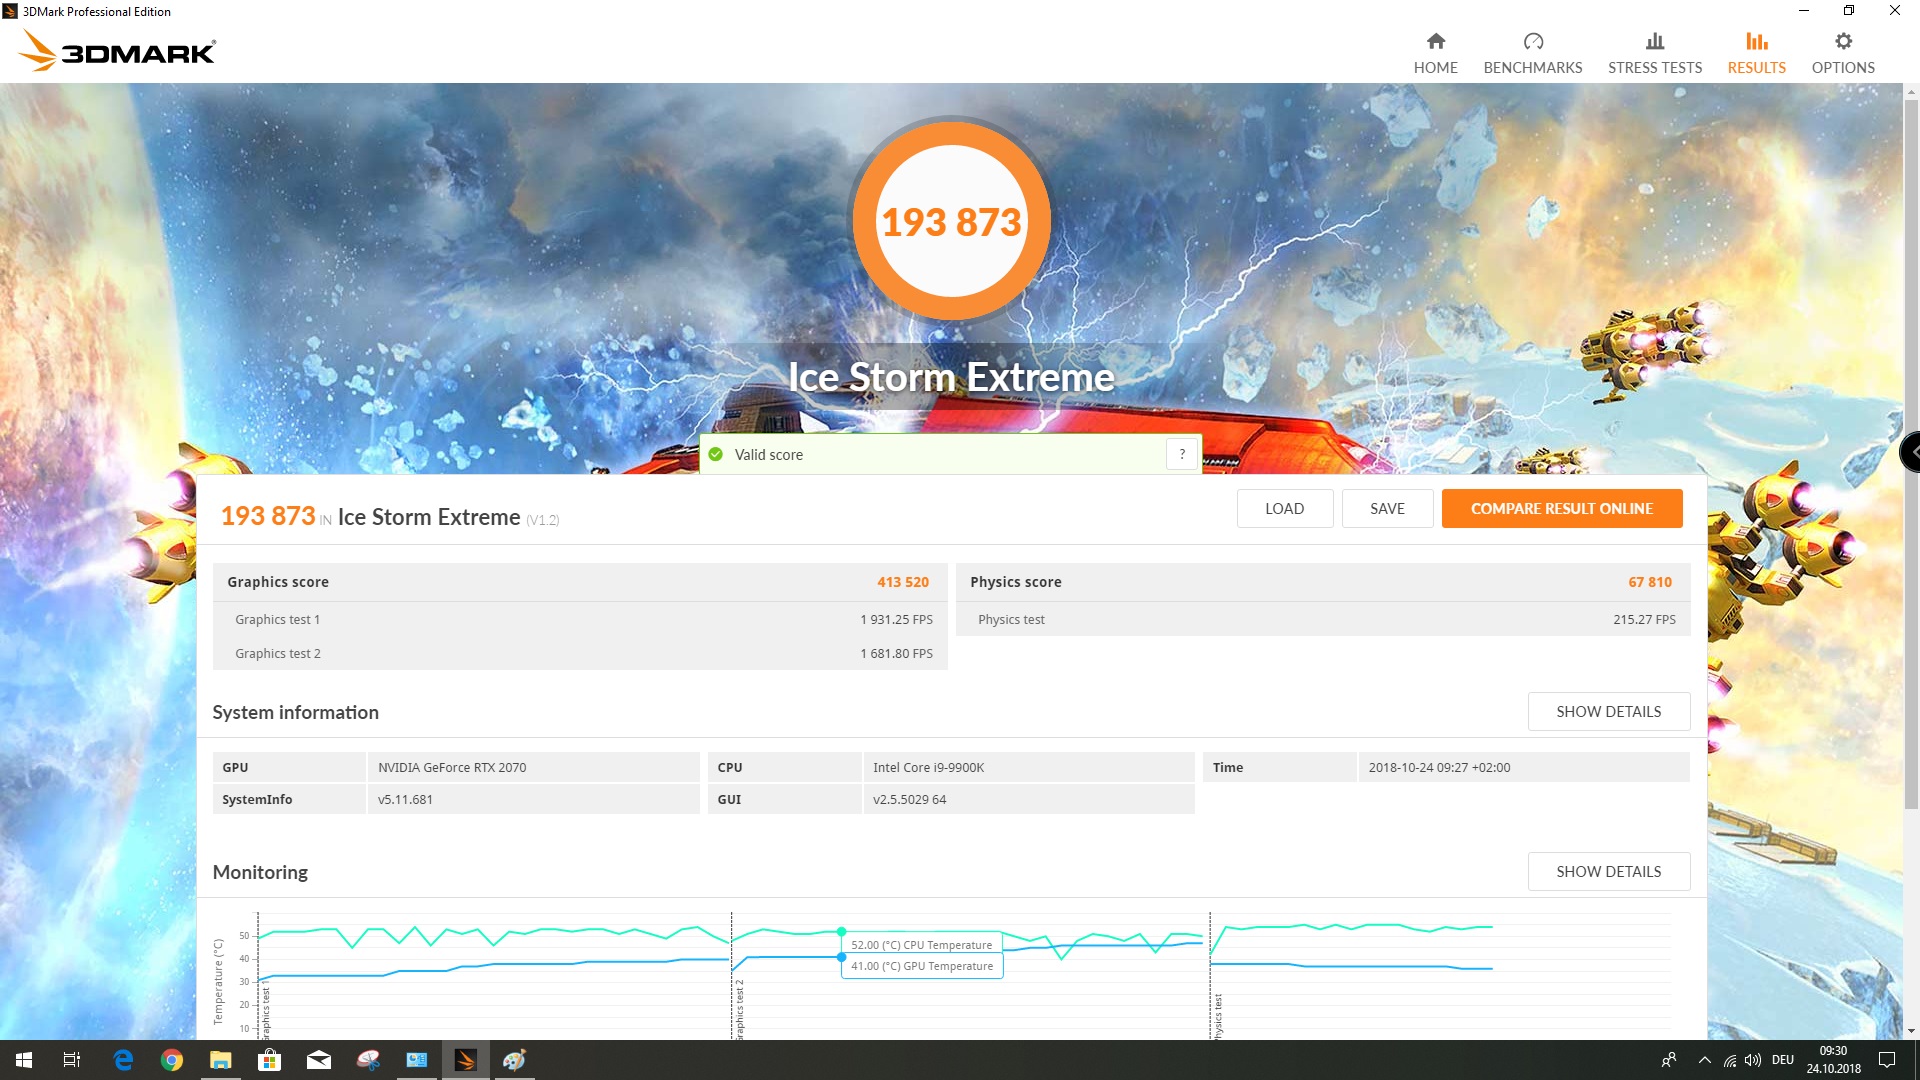
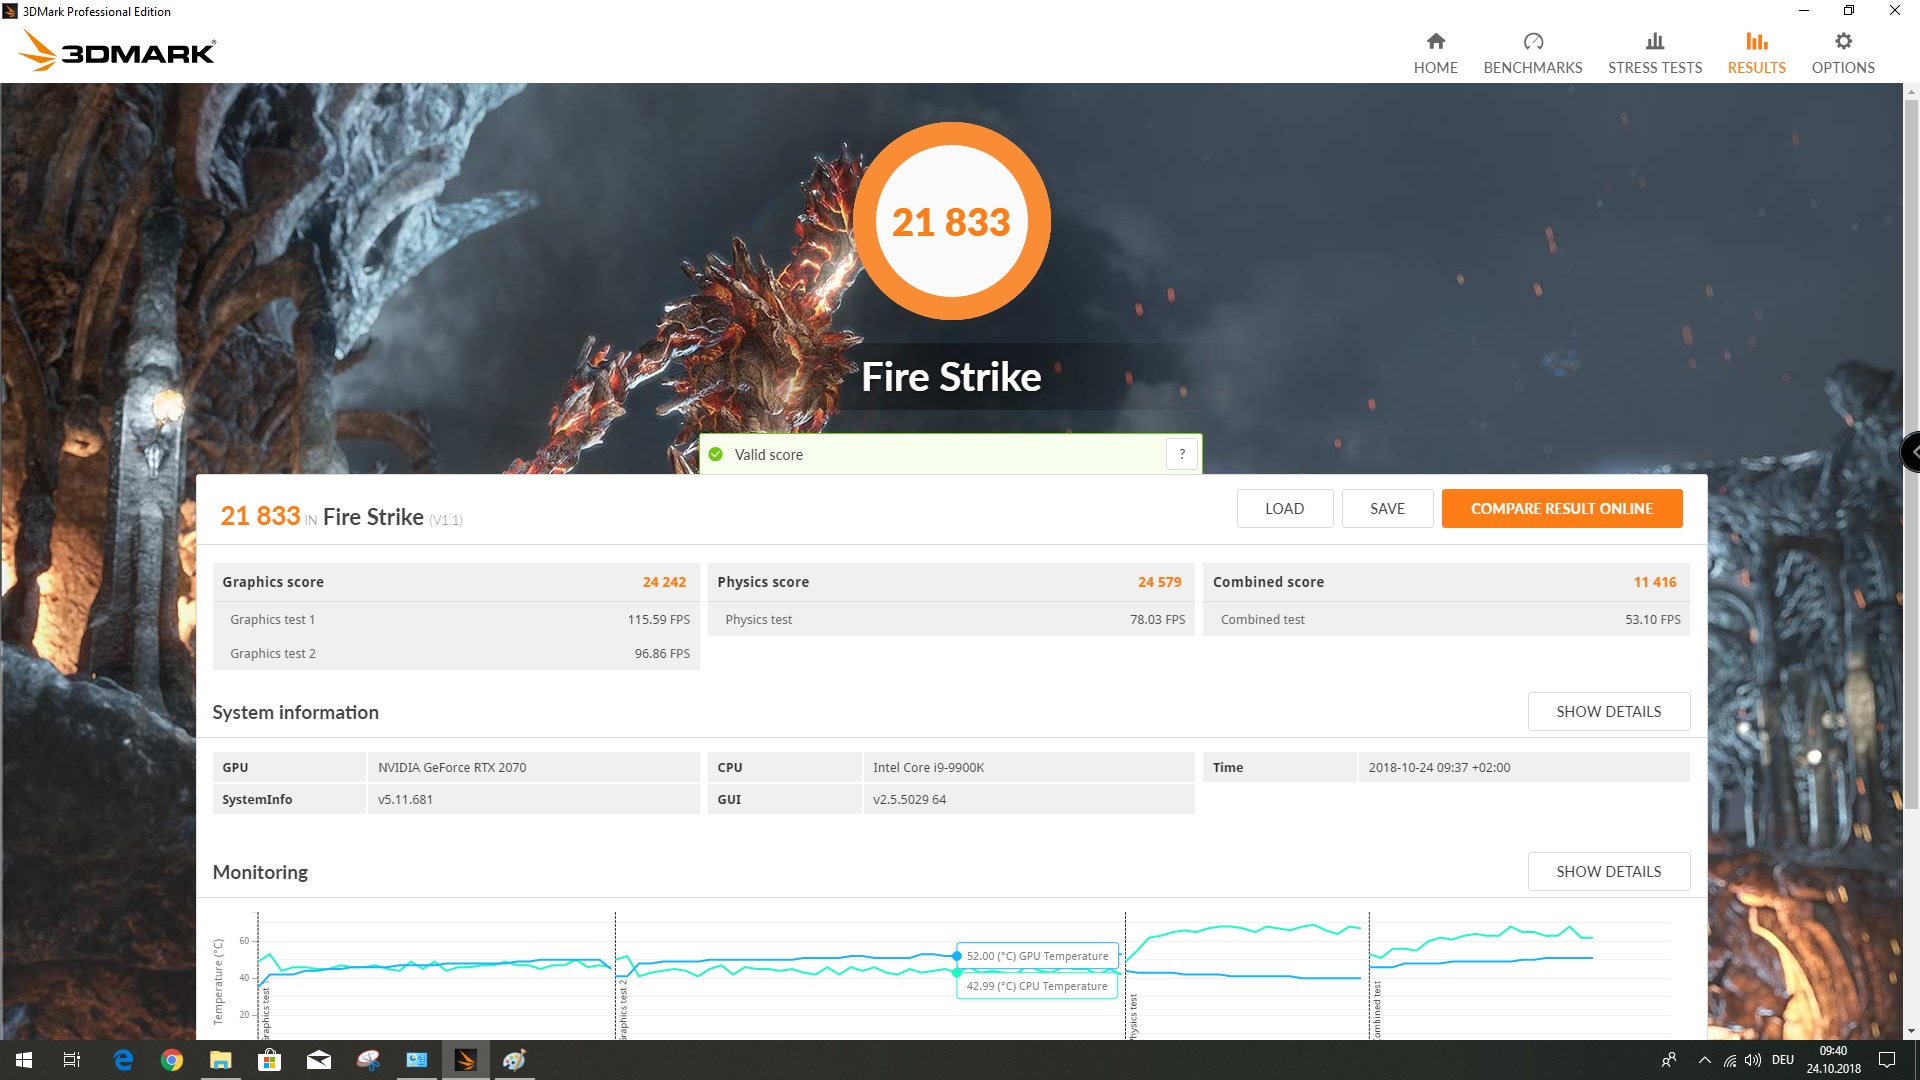
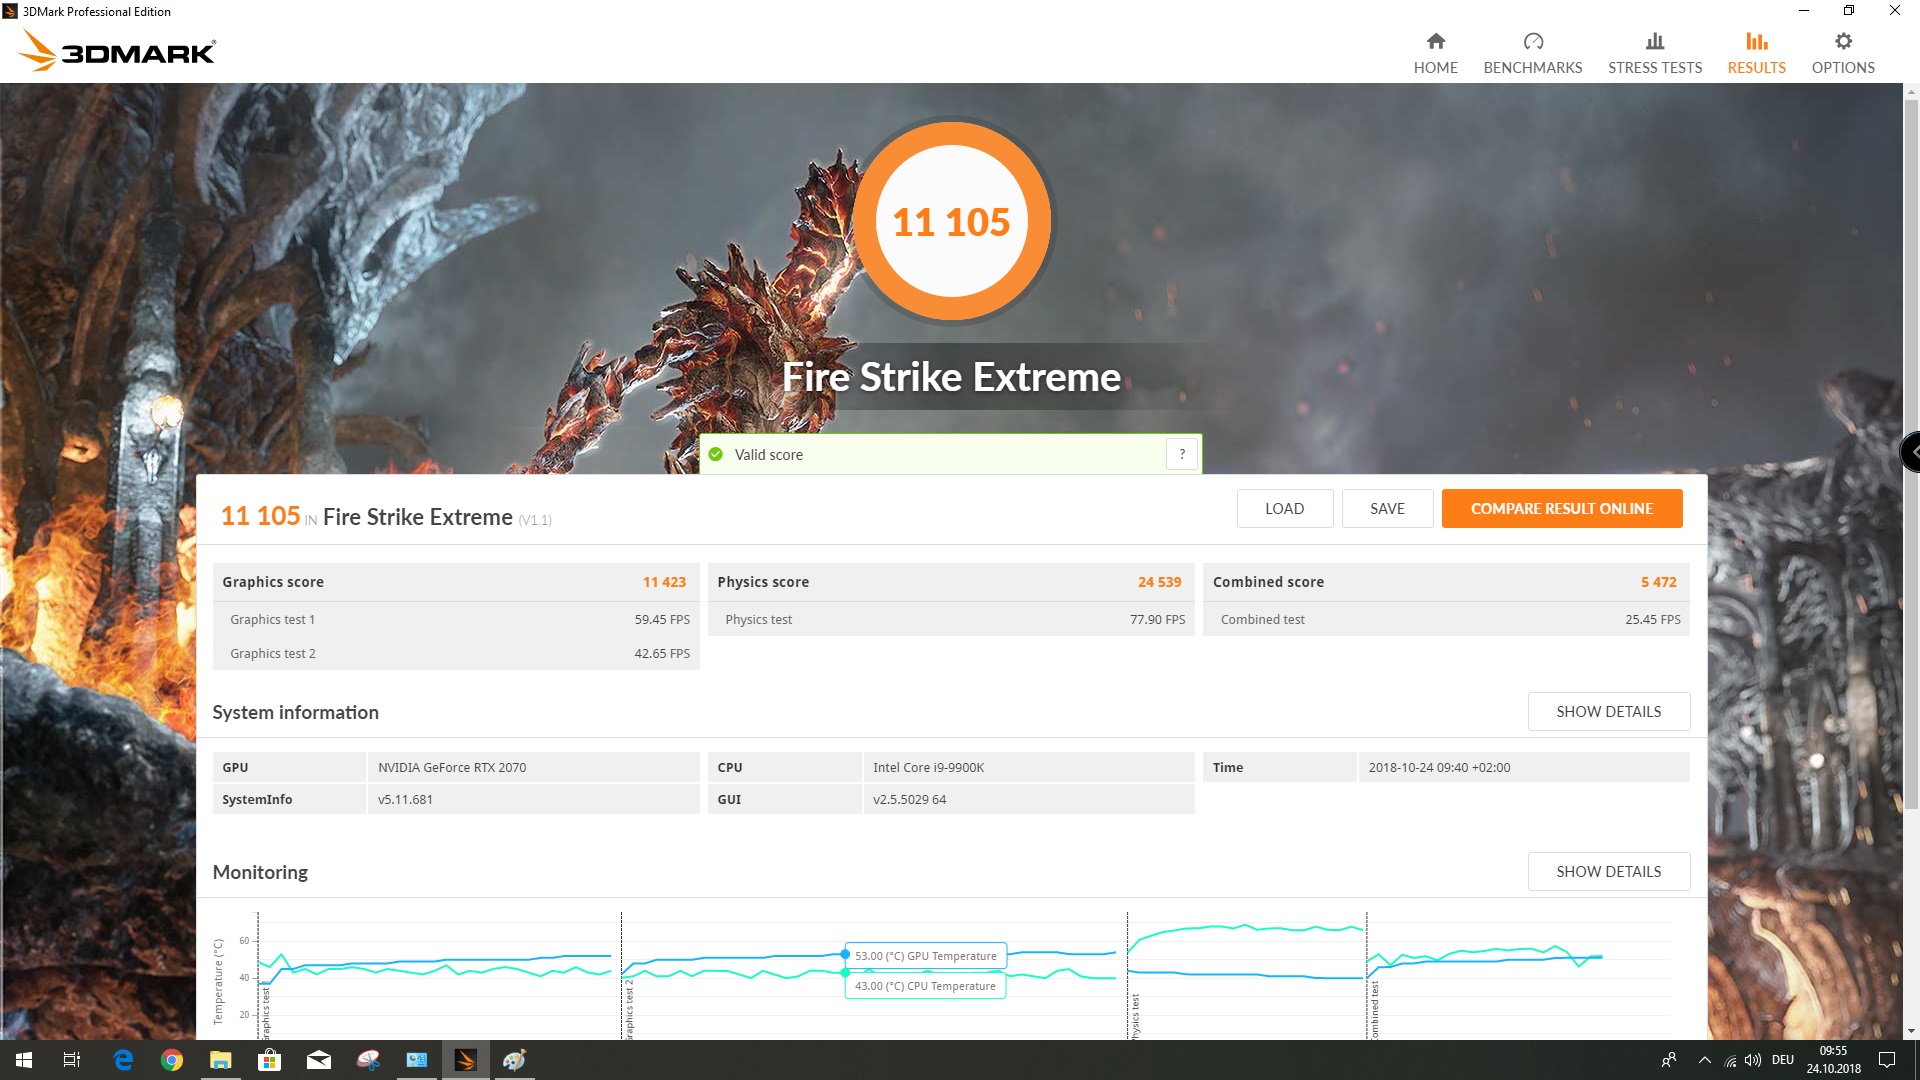
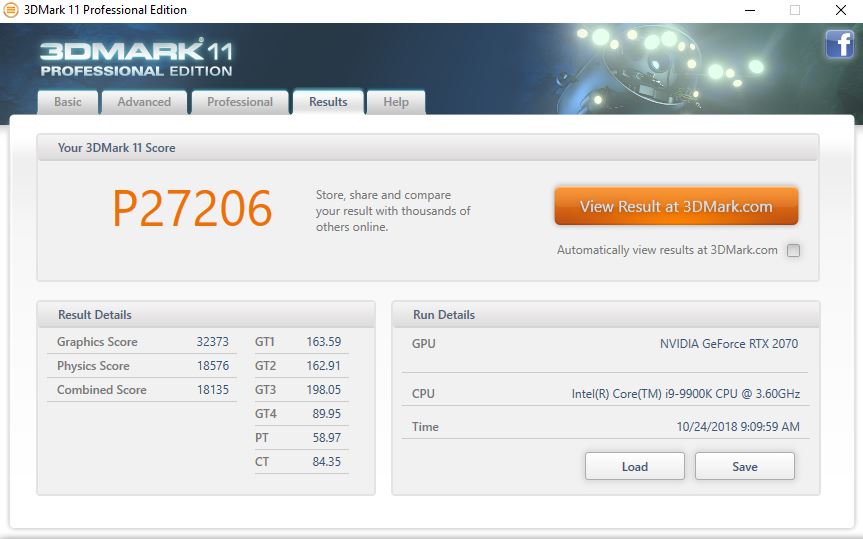
Synthetic Benchmarks with an Intel Core i9-9900K
We also had the opportunity at short notice during the review to test the ROG Strix RTX 2070 OC with an Intel Core i9-9900K processor. We decided to test our GPU with Intel’s new eight-core processor as it has more instructions per cycle (IPC) than comparable AMD APUs. However, our benchmarks demonstrate that the Core i9-9900K’s additional power only achieves a few percentage points more in benchmarks at high resolutions than the AMD Ryzen 7 2700X. Hence, Intel’s premium CPUs will not offer noticeably better gaming performance than their AMD counterparts despite the additional cost.


| 3DMark | |
| 1920x1080 Fire Strike Graphics | |
| Intel Core i9-9900K, Asus ROG Strix RTX 2070 OC | |
| Asus ROG Strix RTX 2070 OC | |
| 1280x720 Cloud Gate Standard Graphics | |
| Intel Core i9-9900K, Asus ROG Strix RTX 2070 OC | |
| Asus ROG Strix RTX 2070 OC | |
| 3840x2160 Fire Strike Ultra Graphics | |
| Intel Core i9-9900K, Asus ROG Strix RTX 2070 OC | |
| Asus ROG Strix RTX 2070 OC | |
| Fire Strike Extreme Graphics | |
| Intel Core i9-9900K, Asus ROG Strix RTX 2070 OC | |
| Asus ROG Strix RTX 2070 OC | |
| 3DMark 11 - 1280x720 Performance GPU | |
| Intel Core i9-9900K, Asus ROG Strix RTX 2070 OC | |
| Asus ROG Strix RTX 2070 OC | |
Game Benchmarks
While synthetic benchmarks like 3DMark are useful for comparing one card against another, gaming benchmarks are a closer indication of how well a GPU will perform for most users. In short, the ROG Strix RTX 2070 OC broadly outperforms the GeForce GTX 1080 and sits just behind the GeForce GTX 1080 Ti in our comparison table.
The ROG Strix RTX 2070 OC plays most games in 4K with ease, although frame rates do slip below 40 FPS in some games, particularly in Kingdom Come: Deliverance and Monster Hunter World. It is possible to improve frame rates in both games by adjusting some graphics settings though, which results in a more playable experience at 4K.
| Call of Duty Black Ops 4 - 1920x1080 Very High / On | |
| AMD Radeon RX Vega 64 | |
| NVIDIA Titan X Pascal | |
| Asus ROG Strix RTX 2070 OC | |
| NVIDIA GeForce GTX 1080 (Desktop) | |
| NVIDIA GeForce GTX 1070 (Desktop) | |
| NVIDIA GeForce GTX 1060 (Desktop) | |
| Assassin´s Creed Odyssey - 1920x1080 Ultra High Preset | |
| NVIDIA GeForce GTX 1080 (Desktop) | |
| NVIDIA Titan X Pascal | |
| Asus ROG Strix RTX 2070 OC | |
| NVIDIA GeForce GTX 1070 (Desktop) | |
| AMD Radeon RX Vega 64 | |
| NVIDIA GeForce GTX 1060 (Desktop) | |
| AMD Radeon RX 580 (Desktop) | |
| FIFA 19 - 1920x1080 Ultra Preset AA:4x MS | |
| NVIDIA GeForce GTX 1080 (Desktop) | |
| NVIDIA GeForce GTX 1070 (Desktop) | |
| AMD Radeon RX Vega 64 | |
| AMD Radeon RX 580 (Desktop) | |
| NVIDIA GeForce GTX 1060 (Desktop) | |
| NVIDIA Titan X Pascal | |
| Asus ROG Strix RTX 2070 OC | |
| Forza Horizon 4 - 1920x1080 Ultra Preset AA:2xMS | |
| AMD Radeon RX Vega 64 | |
| NVIDIA GeForce GTX 1080 (Desktop) | |
| NVIDIA Titan X Pascal | |
| Asus ROG Strix RTX 2070 OC | |
| NVIDIA GeForce GTX 1070 (Desktop) | |
| AMD Radeon RX 580 (Desktop) | |
| NVIDIA GeForce GTX 1060 (Desktop) | |
| F1 2018 - 1920x1080 Ultra High Preset AA:T AF:16x | |
| Asus ROG Strix RTX 2070 OC | |
| NVIDIA Titan X Pascal | |
| NVIDIA GeForce GTX 1080 (Desktop) | |
| NVIDIA GeForce GTX 1070 (Desktop) | |
| AMD Radeon RX Vega 64 | |
| AMD Radeon RX 580 (Desktop) | |
| NVIDIA GeForce GTX 1060 (Desktop) | |
| Monster Hunter World - 1920x1080 Highest Preset (Image Quality High) | |
| NVIDIA Titan X Pascal | |
| Asus ROG Strix RTX 2070 OC | |
| NVIDIA GeForce GTX 1080 (Desktop) | |
| AMD Radeon RX Vega 64 | |
| NVIDIA GeForce GTX 1070 (Desktop) | |
| AMD Radeon RX 580 (Desktop) | |
| NVIDIA GeForce GTX 1060 (Desktop) | |
| Far Cry 5 - 1920x1080 Ultra Preset AA:T | |
| NVIDIA GeForce GTX 1080 (Desktop) | |
| Asus ROG Strix RTX 2070 OC | |
| AMD Radeon RX Vega 64 | |
| NVIDIA GeForce GTX 1070 (Desktop) | |
| NVIDIA Titan X Pascal | |
| NVIDIA GeForce GTX 1060 (Desktop) | |
| AMD Radeon RX 580 (Desktop) | |
| The Crew 2 - 1920x1080 Ultra Preset | |
| NVIDIA GeForce GTX 1060 (Desktop) | |
| NVIDIA GeForce GTX 1070 (Desktop) | |
| NVIDIA GeForce GTX 1080 (Desktop) | |
| NVIDIA Titan X Pascal | |
| AMD Radeon RX 580 (Desktop) | |
| Asus ROG Strix RTX 2070 OC | |
| Assassin´s Creed Origins - 1920x1080 Ultra High Preset | |
| Asus ROG Strix RTX 2070 OC | |
| NVIDIA GeForce GTX 1080 Ti (Desktop) | |
| NVIDIA GeForce GTX 1080 (Desktop) | |
| NVIDIA GeForce GTX 1070 (Desktop) | |
| AMD Radeon RX Vega 64 | |
| NVIDIA GeForce GTX 1060 (Desktop) | |
| AMD Radeon RX 580 (Desktop) | |
| Kingdom Come: Deliverance - 1920x1080 Ultra High Preset | |
| Asus ROG Strix RTX 2070 OC | |
| NVIDIA GeForce GTX 1080 (Desktop) | |
| NVIDIA GeForce GTX 1080 Ti (Desktop) | |
| AMD Radeon RX Vega 64 | |
| NVIDIA GeForce GTX 1070 (Desktop) | |
| NVIDIA GeForce GTX 1060 (Desktop) | |
| AMD Radeon RX 580 (Desktop) | |
| Fortnite - 1920x1080 Epic Preset | |
| NVIDIA GeForce GTX 1080 Ti (Desktop) | |
| Asus ROG Strix RTX 2070 OC | |
| NVIDIA GeForce GTX 1080 (Desktop) | |
| NVIDIA GeForce GTX 1070 (Desktop) | |
| NVIDIA GeForce GTX 1060 (Desktop) | |
| AMD Radeon RX 580 (Desktop) | |
| Final Fantasy XV Benchmark - 1920x1080 High Quality | |
| NVIDIA GeForce GTX 1080 Ti (Desktop) | |
| Asus ROG Strix RTX 2070 OC | |
| NVIDIA GeForce GTX 1080 (Desktop) | |
| NVIDIA GeForce GTX 1070 (Desktop) | |
| AMD Radeon RX Vega 64 | |
| AMD Radeon RX Vega 64 | |
| NVIDIA GeForce GTX 1060 (Desktop) | |
| AMD Radeon RX 580 (Desktop) | |
| Destiny 2 - 1920x1080 Highest Preset AA:SM AF:16x | |
| NVIDIA GeForce GTX 1080 Ti (Desktop) | |
| Asus ROG Strix RTX 2070 OC | |
| NVIDIA GeForce GTX 1080 (Desktop) | |
| NVIDIA GeForce GTX 1070 (Desktop) | |
| NVIDIA GeForce GTX 1060 (Desktop) | |
| Far Cry Primal - 1920x1080 Ultra Preset AA:SM | |
| NVIDIA GeForce GTX 1080 Ti (Desktop) | |
| AMD Radeon RX Vega 64 | |
| Asus ROG Strix RTX 2070 OC | |
| NVIDIA GeForce GTX 1070 (Desktop) | |
| AMD Radeon RX 580 (Desktop) | |
| The Witcher 3 - 1920x1080 Ultra Graphics & Postprocessing (HBAO+) | |
| NVIDIA GeForce GTX 1080 Ti (Desktop) | |
| Asus ROG Strix RTX 2070 OC | |
| AMD Radeon RX Vega 64 | |
| NVIDIA GeForce GTX 1070 (Desktop) | |
| AMD Radeon RX 580 (Desktop) | |
| Watch Dogs 2 - 1920x1080 Ultra Preset | |
| NVIDIA GeForce GTX 1080 Ti (Desktop) | |
| Asus ROG Strix RTX 2070 OC | |
| AMD Radeon RX Vega 64 | |
| NVIDIA GeForce GTX 1060 (Desktop) | |
| AMD Radeon RX 580 (Desktop) | |
| Battlefield 1 - 1920x1080 Ultra Preset AA:T | |
| NVIDIA GeForce GTX 1080 Ti (Desktop) | |
| AMD Radeon RX Vega 64 | |
| Asus ROG Strix RTX 2070 OC | |
| NVIDIA GeForce GTX 1060 (Desktop) | |
| The Division - 1920x1080 Ultra Preset AF:16x | |
| NVIDIA GeForce GTX 1080 Ti (Desktop) | |
| Asus ROG Strix RTX 2070 OC | |
| AMD Radeon RX Vega 64 | |
| NVIDIA GeForce GTX 1070 (Desktop) | |
| AMD Radeon RX 580 (Desktop) | |
| For Honor - 1920x1080 Extreme Preset AA:T AF:16x | |
| NVIDIA GeForce GTX 1080 Ti (Desktop) | |
| Asus ROG Strix RTX 2070 OC | |
| NVIDIA GeForce GTX 1080 (Desktop) | |
| AMD Radeon RX Vega 64 | |
| NVIDIA GeForce GTX 1070 (Desktop) | |
| NVIDIA GeForce GTX 1070 (Desktop) | |
| AMD Radeon RX 580 (Desktop) | |
| NVIDIA GeForce GTX 1060 (Desktop) | |
| Ghost Recon Wildlands - 1920x1080 Ultra Preset AA:T AF:16x | |
| NVIDIA GeForce GTX 1080 Ti (Desktop) | |
| Asus ROG Strix RTX 2070 OC | |
| NVIDIA GeForce GTX 1080 (Desktop) | |
| NVIDIA GeForce GTX 1070 (Desktop) | |
| AMD Radeon RX Vega 64 | |
| NVIDIA GeForce GTX 1070 (Desktop) | |
| NVIDIA GeForce GTX 1060 (Desktop) | |
| AMD Radeon RX 580 (Desktop) | |
| Doom - 1920x1080 Ultra Preset AA:SM | |
| NVIDIA GeForce GTX 1080 Ti (Desktop) | |
| NVIDIA GeForce GTX 1080 Ti (Desktop) | |
| Asus ROG Strix RTX 2070 OC | |
| NVIDIA GeForce GTX 1070 (Desktop) | |
| GTA V - 1920x1080 Highest AA:4xMSAA + FX AF:16x | |
| Asus ROG Strix RTX 2070 OC | |
| NVIDIA GeForce GTX 1080 Ti (Desktop) | |
| NVIDIA GeForce GTX 1070 (Desktop) | |
| low | med. | high | ultra | 4K | |
|---|---|---|---|---|---|
| Battlefield 4 (2013) | 200 | 200 | 200 | 183 | 102 |
| GTA V (2015) | 172.2 | 169.1 | 146.1 | 110.5 | 111.9 |
| The Witcher 3 (2015) | 314.9 | 240 | 158.3 | 87 | 61.8 |
| Rainbow Six Siege (2015) | 320 | 278 | 247 | 238 | 121 |
| Rise of the Tomb Raider (2016) | 283.7 | 208.2 | 162.8 | 134 | 59.4 |
| Far Cry Primal (2016) | 127 | 113 | 103 | 95 | 59 |
| The Division (2016) | 284.8 | 237.4 | 140.7 | 112 | 58.3 |
| Doom (2016) | 168 | 161 | 151 | 150 | 93 |
| Overwatch (2016) | 300 | 300 | 217 | 206 | 128 |
| Deus Ex Mankind Divided (2016) | 153.8 | 143.4 | 116.8 | 69.5 | 45 |
| Battlefield 1 (2016) | 179.4 | 151.6 | 150 | 137.3 | 75.8 |
| Watch Dogs 2 (2016) | 140.7 | 133.3 | 107.5 | 78.3 | 47 |
| For Honor (2017) | 293.3 | 197.4 | 189.3 | 148.7 | 53.7 |
| Ghost Recon Wildlands (2017) | 147 | 119 | 112 | 65 | 46 |
| Rocket League (2017) | 248.5 | 249.2 | 240.6 | 128.5 | |
| Dirt 4 (2017) | 314.3 | 245.4 | 208.2 | 131.1 | 75.9 |
| Playerunknown's Battlegrounds (PUBG) (2017) | 178 | 192.6 | 201.6 | 141.8 | 50.1 |
| Destiny 2 (2017) | 167 | 165 | 167 | 157 | 60 |
| Assassin´s Creed Origins (2017) | 108 | 102 | 98 | 83 | 46 |
| Call of Duty WWII (2017) | 238 | 231 | 185 | 171 | 82 |
| Fortnite (2018) | 258.6 | 218.5 | 179.8 | 155.9 | 53.3 |
| Final Fantasy XV Benchmark (2018) | 160.1 | 117.3 | 85.7 | 38.3 | |
| Kingdom Come: Deliverance (2018) | 135.2 | 124.1 | 101.4 | 79.8 | 31 |
| Far Cry 5 (2018) | 126 | 113 | 111 | 105 | 49 |
| The Crew 2 (2018) | 60 | 60 | 60 | 60 | 56 |
| Monster Hunter World (2018) | 144.7 | 127.5 | 124.7 | 97.6 | 31.2 |
| F1 2018 (2018) | 237 | 200 | 161 | 121 | 62 |
| Shadow of the Tomb Raider (2018) | 142 | 114 | 110 | 101 | 38 |
| FIFA 19 (2018) | 242 | 238 | 224 | 219 | 203 |
| Forza Horizon 4 (2018) | 184 | 142 | 133 | 107 | 60 |
| Assassin´s Creed Odyssey (2018) | 112 | 100 | 86 | 61 | 36 |
| Call of Duty Black Ops 4 (2018) | 236 | 164 | 159 | 149 | 53 |
Computational Performance
We have also included a table below that compares the GeForce RTX 2070’s computational performance compared with those of other Nvidia GPUs. After all, GPUs are capable of more than just gaming, while some cards like the Quadro series are designed for professional use. Quadro GPUs are typically significantly more expensive than their GeForce counterparts too.
The RTX 2070 performs strongly in ComputeMark and LuxMark, with our test GPU even outscoring the Titan X in the latter OpenCL-based benchmark. The GeForce GTX 1080 Ti and Titan X perform better in ComputeMark though, with both GPUs outscoring the ROG Strix RTX 2070 OC by 16% across all tests. However, our test GPU scores 29% more than its predecessor and around 11% more than the GeForce GTX 1080.
| NVIDIA GeForce RTX 2070 (Desktop) AMD Ryzen 7 2700X | NVIDIA GeForce GTX 1060 (Desktop) Intel Core i7-6700K | NVIDIA GeForce GTX 1070 (Desktop) Intel Core i7-4790K | NVIDIA GeForce GTX 1080 (Desktop) Intel Core i7-4790K | NVIDIA GeForce GTX 1080 Ti (Desktop) Intel Core i7-4790K | NVIDIA Titan X Pascal Intel Xeon E5-2680 v4 | |
|---|---|---|---|---|---|---|
| LuxMark v2.0 64Bit | -56% | -29% | -33% | -9% | -8% | |
| Room GPUs-only (Samples/s) | 3333 | 1773 -47% | 2474 -26% | 2327 -30% | 3050 -8% | 2991 -10% |
| Sala GPUs-only (Samples/s) | 7293 | 2584 -65% | 5012 -31% | 4708 -35% | 6600 -10% | 6920 -5% |
| ComputeMark v2.1 | -50% | -29% | -11% | 16% | 16% | |
| 1024x600 Normal, QJuliaRayTrace (Points) | 6038 | 3322 -45% | 4761 -21% | 6191 3% | 7938 31% | 7847 30% |
| 1024x600 Normal, Mandel Scalar (Points) | 3662 | 2002 -45% | 2861 -22% | 3646 0% | 4949 35% | 5096 39% |
| 1024x600 Normal, Mandel Vector (Points) | 3316 | 1994 -40% | 2706 -18% | 3284 -1% | 4391 32% | 4284 29% |
| 1024x600 Normal, Fluid 2DTexArr (Points) | 2407 | 963 -60% | 1390 -42% | 1758 -27% | 2092 -13% | 2032 -16% |
| 1024x600 Normal, Fluid 3DTex (Points) | 2536 | 985 -61% | 1402 -45% | 1730 -32% | 2275 -10% | 2254 -11% |
| 1024x600 Normal, Score (Points) | 17690 | 9266 -48% | 13121 -26% | 16610 -6% | 21646 22% | 21512 22% |
| Total Average (Program / Settings) | -53% /
-51% | -29% /
-29% | -22% /
-16% | 4% /
10% | 4% /
10% |
Emissions

The ROG Strix RTX 2070 OC’s triple fan is audible when the card is idling with our test case open and the BIOS set to P-Mode. The fans operate at 800/900 RPM in this scenario, which corresponds to around 26% fan speed. The fans then ramp up to 54% whenever the system starts using the GPU, which we determined by starting a FurMark benchmark. Setting the card to OC mode also causes the fan speed to further increase to combat the heightened power target. Incidentally, the GPU rose from 61 °C to 63 °C when we set the card to Gaming mode.
Overall, the cooling system does a great job at cooling the GPU. The ROG Strix RTX 2070 OC never thermal throttled during testing regardless of how hard we pushed it.
The card consumes plenty of power though. We measured an average consumption of 212 W with the GPU set to Gaming mode, which is 27 W higher than what the Founders Edition card consumes. Setting our test GPU to OC mode further increases average power consumption to 240 W, while manually setting the power target to 125% causes average consumption to rise to 261 W, or 76 W higher than the Founders Edition.
We also measured our test system consuming 85 W at idle with our Metrahit Energy multimeter. Power consumption rises to a maximum of 354 W when running The Witcher 3 on the high preset at 1080p. Please note that this value does not include how much power the monitor consumes.


Overclocking
The ROG Strix RTX 2070 OC has hardly any extra headroom for overclocking, with Asus having already pushed its capabilities beyond what the ROG Strix RTX 2070 Advanced can achieve.
It is possible to manually set clock speeds higher than the OC Mode, but doing so does not improve performance. Our test device can stably handle a 1,950 MHz core clock and an 800 MHz VRAM clock speed boost having set the power and temperature targets both to their maximum. Our efforts had no effect though as the card achieved identical scores in synthetic benchmarks. Our tweaks increased power consumption to 270 W under load too, which is rather pointless when there is no tangible benefit to setting the card to OC Mode.
In short, we would not recommend overclocking the ROG Strix RTX 2070 OC. Asus has already achieved the best balance of performance to power consumption and manually overclocking it will only increase power consumption.
Verdict
The Asus ROG Strix RTX 2070 OC is one of the fastest RTX 2070 GPUs currently on the market, primarily because of its higher boost clock speed. Online retailers currently sell the card for around $629.99 (£660) with the Standard and Advanced versions currently selling for approximately $20 and $10 cheaper respectively. We would recommend choosing the OC version if price differences remain the same as it delivers consistently better performance for practically the same cost.
GPU prices remain inflated though and it is currently a market in which Nvidia struggles on price compared to AMD. The RTX 2070 is more efficient and has better performance than the Radeon RX Vega 64, but the latter is 150/200 Euros (~$170/$230) cheaper.
Currently no games take advantage of the real-time raytracing and DLSS that the RTX series offers. Time will tell what value these new technologies will add to games.
Asus aims its ROG Strix RTX 2070 OC primarily at people who predominantly want to game in WQHD or UHD at high graphics settings.
Overall, the RTX 2070’s performance is in between that of the GeForce GTX 1080 and the GTX 1080 Ti. We would also recommend pairing the ROG Strix RTX 2070 OC with other powerful hardware like in our test system. The AMD Ryzen 7 2700X is a solid processor which is great value for money. The Intel equivalent achieves slightly better performance thanks to its higher IPC, but at a considerable increase in cost. Unfortunately, we did not have time to run all our benchmarks with the Intel Core i9-9900K before publishing this review.
We would also like to thank Asus ROG Germany for providing us with a test device that we could review.
