Notebookcheck Logo

Nvidia GeForce GTX 1080 (Desktop) Review – Pascal has arrived

The GTX 1080 is a high-end graphics card which was announced in May 2016 and is based on the new Pascal architecture. We were able to review the Founders Edition from Nvidia and put it through our benchmarks.
gtx980 vs gtx1080

The GeForce GTX 1080 from Nvidia is the first consumer chip with the Pascal architecture and 16 nm FinFET. The new architecture promises significant efficiency improvements and some new features. We have a look at the latter in our article about the Pascal architecture here. This article focuses on the features and the performance of the desktop GeForce GTX 1080 based on the GP104, more precisely the Founders Edition from Nvidia. This version was designed and built by Nvidia and replaces the old "reference design". The Founders Edition, however, can be seen as a higher-quality version and is much more expensive at $699 (without taxes) compared to the less expensive 1080 cards, which will start at $599 (without taxes) according to Nvidia.

The Founders Edition uses high-quality materials, a vapor chamber cooling and a high-quality PCB. It is shipped with a single 8-pin power connector and offers 3x DisplayPort 1.4 ("ready"), one HDMI 2.0b and a dual-link DVI port. 8 GB GDDR5X video memory is also sufficient for today's standards.

Our test system for the following benchmarks is an Intel Core i7-4790K (not overclocked) on an Asus Z97-Deluxe motherboard, 16 GB DDR3-2133, Samsung SSD 840 Pro, OCZ Trion 100 and HGST 1 TB HDD.


The Nvidia GeForce GTX 1080 is a fast desktop graphics card based on the Pascal architecture. It was announced in May 2016 and offers all 2,560 shader of the used GP104 chip. Furthermore, the GPU is coupled with 8 GB GDDR5X graphics memory using a 256 Bit interface (10 GHz, 320 GB/s). The chip is manufactured at TSMC in 16nm (FinFET). The TDP is specified at 180 Watt and therefore slightly higher than the predecessor, the GTX 980 with 165 Watt.

GeForce GTX 1000 Series

GeForce GTX 1080 Ti compare 3584 @ 1.48 - 1.6 GHz352 Bit @ 11000 MHz
GeForce GTX 1080 SLI (Laptop) compare 5120 @ 1.56 - 1.73 GHz256 Bit @ 10000 MHz
GeForce GTX 1070 SLI (Desktop) compare 3840 @ 1.51 - 1.68 GHz256 Bit @ 8000 MHz
GeForce GTX 1070 SLI (Laptop) compare 4096 @ 1.44 - 1.65 GHz256 Bit @ 8000 MHz
GeForce GTX 1080 (Desktop) 2560 @ 1.61 - 1.73 GHz256 Bit @ 10000 MHz
GeForce GTX 1080 Mobile compare 2560 @ 1.57 - 1.73 GHz256 Bit @ 10000 MHz
GeForce GTX 1070 Ti (Desktop) compare 2432 @ 1.61 - 1.68 GHz256 Bit @ 8000 MHz
GeForce GTX 1070 (Desktop) compare 1920 @ 1.51 - 1.68 GHz256 Bit @ 8000 MHz
GeForce GTX 1080 Max-Q compare 2560 @ 1.1 - 1.28 GHz256 Bit @ 10000 MHz
GeForce GTX 1070 Mobile compare 2048 @ 1.44 - 1.65 GHz256 Bit @ 8000 MHz
GeForce GTX 1070 Max-Q compare 2048 @ 1.1 - 1.27 GHz256 Bit @ 8000 MHz
GeForce GTX 1060 (Desktop) compare 1280 @ 1.51 - 1.71 GHz192 Bit @ 8000 MHz
GeForce GTX 1060 Mobile compare 1280 @ 1.4 - 1.67 GHz192 Bit @ 8000 MHz
GeForce GTX 1060 Max-Q compare 1280 @ 1.06 - 1.34 GHz192 Bit @ 8000 MHz
GeForce GTX 1050 Ti Mobile compare 768 @ 1.49 - 1.62 GHz128 Bit @ 7000 MHz
GeForce GTX 1050 Ti (Desktop) compare 768 @ 1.29 - 1.39 GHz128 Bit @ 7008 MHz
GeForce GTX 1050 Ti Max-Q compare 768 @ 1.15 - 1.29 GHz128 Bit @ 7000 MHz
GeForce GTX 1050 (Desktop) compare 640 @ 1.35 - 1.46 GHz128 Bit @ 7008 MHz
GeForce GTX 1050 Mobile compare 640 @ 1.35 - 1.49 GHz128 Bit @ 7000 MHz
GeForce GTX 1050 Max-Q compare 640 @ 1 - 1.14 GHz128 Bit @ 7000 MHz
GeForce GT 1030 (Desktop) compare 384 @ 1.23 - 1.67 GHz64 Bit @ 6000 MHz
CodenamePascal GP104
ArchitecturePascal
Pipelines2560 - unified
Core Speed1607 - 1733 (Boost) MHz
Memory Speed10000 MHz
Memory Bus Width256 Bit
Memory TypeGDDR5X
Max. Amount of Memory8 GB
Shared Memoryno
APIDirectX 12_1, OpenGL 4.5
Power Consumption180 Watt
Transistor Count7.2 Billion
technology16 nm
FeaturesMulti-Projection, VR Ready, G-SYNC, Vulkan, Multi Monitor, 500-Watt system power recommended
Date of Announcement06.05.2016
v1.28
log 18. 16:13:43

#0 ran 1s before starting gpusingle class +0s ... 0s

#1 no ids found in url (should be separated by "_") +0s ... 0s

#2 not redirecting to Ajax server +0s ... 0s

#3 did not recreate cache, as it is less than 5 days old! Created at Tue, 18 Feb 2025 12:54:23 +0100 +0.001s ... 0.001s

#4 start showIntegratedCPUs +0.03s ... 0.031s

#5 return log +0.012s ... 0.043s

Synthetic Benchmarks

We primarily use the popular 3DMark series from Futuremark for the synthetic benchmarks. The new GTX 1080 is just behind two GTX 980 cards in an SLI configuration inside the MSI GT80S 6QF. SLI scales very well in the 2013 tests, but the SLI configuration is roughly on par with the GTX 1080 in the older 3DMark 11. However, the GTX 1080 can take the lead in Unigine Heaven 4.0. If you count all GPU benchmarks, the 980 SLI has an advantage of 6%.

A single GTX 980 is obviously clearly beaten by the Pascal-based GTX 1080; the Schenker XMG U716, for example, falls behind by around 40%. This difference is also maintained in Unigine Heaven. The Radeon R9 Fury (desktop) is a bit faster than the GTX 980 but is also clearly behind the new Pascal card (-33%).

3DMark 11 - 1280x720 Performance GPU
NVIDIA GeForce GTX 980 SLI (Laptop)
MSI GT80S 6QF, Intel Core i7-6820HK
30045 Points +2%
NVIDIA GeForce GTX 1080 (Desktop)
Nvidia GeForce GTX 1080 Founders Edition, Intel Core i7-4790K
29443 Points
NVIDIA GeForce GTX 980 Ti
Asus Strix GTX 980 Ti Desktop PC, Intel Core i7-4790K
23057 Points -22%
AMD Radeon R9 Fury
XFX Radeon R9 Fury Pro, Intel Core i7-4790K
17543 Points -40%
NVIDIA GeForce GTX 980 (Laptop)
SCHENKER XMG U716, Intel Core i7-6700
17050 Points -42%
NVIDIA GeForce GTX 980M
DogHouse Systems Mobius SS, Intel Core i7-6700K
12967 Points -56%
3DMark
1920x1080 Fire Strike Graphics
NVIDIA GeForce GTX 980 SLI (Laptop)
MSI GT80S 6QF, Intel Core i7-6820HK
23351 Points +15%
NVIDIA GeForce GTX 1080 (Desktop)
Nvidia GeForce GTX 1080 Founders Edition, Intel Core i7-4790K
20268 Points
NVIDIA GeForce GTX 980 Ti
Asus Strix GTX 980 Ti Desktop PC, Intel Core i7-4790K
16961 Points -16%
AMD Radeon R9 Fury
XFX Radeon R9 Fury Pro, Intel Core i7-4790K
14580 Points -28%
NVIDIA GeForce GTX 980 (Laptop)
SCHENKER XMG U716, Intel Core i7-6700
12691 Points -37%
NVIDIA GeForce GTX 980M
DogHouse Systems Mobius SS, Intel Core i7-6700K
9963 Points -51%
1280x720 Cloud Gate Standard Graphics
NVIDIA GeForce GTX 980 SLI (Laptop)
MSI GT80S 6QF, Intel Core i7-6820HK
147015 Points +14%
NVIDIA GeForce GTX 1080 (Desktop)
Nvidia GeForce GTX 1080 Founders Edition, Intel Core i7-4790K
129042 Points
NVIDIA GeForce GTX 980 Ti
Asus Strix GTX 980 Ti Desktop PC, Intel Core i7-4790K
98958 Points -23%
AMD Radeon R9 Fury
XFX Radeon R9 Fury Pro, Intel Core i7-4790K
80439 Points -38%
NVIDIA GeForce GTX 980 (Laptop)
SCHENKER XMG U716, Intel Core i7-6700
75213 Points -42%
NVIDIA GeForce GTX 980M
DogHouse Systems Mobius SS, Intel Core i7-6700K
62938 Points -51%
3840x2160 Fire Strike Ultra Graphics
NVIDIA GeForce GTX 980 SLI (Laptop)
MSI GT80S 6QF, Intel Core i7-6820HK
5358 Points +11%
NVIDIA GeForce GTX 1080 (Desktop)
Nvidia GeForce GTX 1080 Founders Edition, Intel Core i7-4790K
4841 Points
NVIDIA GeForce GTX 980 Ti
Asus Strix GTX 980 Ti Desktop PC, Intel Core i7-4790K
3918 Points -19%
AMD Radeon R9 Fury
XFX Radeon R9 Fury Pro, Intel Core i7-4790K
3552 Points -27%
NVIDIA GeForce GTX 980 (Laptop)
SCHENKER XMG U716, Intel Core i7-6700
2977 Points -39%
NVIDIA GeForce GTX 980M
DogHouse Systems Mobius SS, Intel Core i7-6700K
2297 Points -53%
Fire Strike Extreme Graphics
NVIDIA GeForce GTX 1080 (Desktop)
Nvidia GeForce GTX 1080 Founders Edition, Intel Core i7-4790K
9994 Points
NVIDIA GeForce GTX 980 Ti
Asus Strix GTX 980 Ti Desktop PC, Intel Core i7-4790K
7817 Points -22%
AMD Radeon R9 Fury
XFX Radeon R9 Fury Pro, Intel Core i7-4790K
6951 Points -30%
NVIDIA GeForce GTX 980M
DogHouse Systems Mobius SS, Intel Core i7-6700K
4673 Points -53%
Unigine Heaven 4.0 - Extreme Preset DX11
NVIDIA GeForce GTX 1080 (Desktop)
Nvidia GeForce GTX 1080 Founders Edition, Intel Core i7-4790K
137.7 fps
NVIDIA GeForce GTX 980 SLI (Laptop)
MSI GT80S 6QF, Intel Core i7-6820HK
129.5 fps -6%
NVIDIA GeForce GTX 980 Ti
Asus Strix GTX 980 Ti Desktop PC, Intel Core i7-4790K
110 fps -20%
NVIDIA GeForce GTX 980 (Laptop)
SCHENKER XMG U716, Intel Core i7-6700
78.1 fps -43%
AMD Radeon R9 Fury
XFX Radeon R9 Fury Pro, Intel Core i7-4790K
77.1 fps -44%

Gaming Benchmarks

GTX 1080 – particularly well-suited for VR
Well-suited for VR

Much more interesting is obviously the gaming performance in the 4K resolution with high details. The SLI scaling does not always work really well, so the GeForce GTX 980 SLI in the MSI GT80S 6QF falls behind the new GTX 1080 by 14% on average. A single GTX 980 is 41% slower; the R9 Fury performs a bit better with a deficit of 31%, but it cannot keep up with the GTX 1080, either. The mobile GeForce GTX 980M is clearly beaten and falls behind by 57%. All tested games were smoothly playable with these settings.

Need for Speed 2016 - 3840x2160 High / On AA:FX
NVIDIA GeForce GTX 1080 (Desktop)
Nvidia GeForce GTX 1080 Founders Edition, Intel Core i7-4790K
61 (47min - 75max) fps
NVIDIA GeForce GTX 980 Ti
Asus Strix GTX 980 Ti Desktop PC, Intel Core i7-4790K
48 (37min - 58max) fps -21%
AMD Radeon R9 Fury
XFX Radeon R9 Fury Pro, Intel Core i7-4790K
40.3 (34min - 48max) fps -34%
NVIDIA GeForce GTX 980
Desktop PC, Intel Core i7-6700K
34 (27min) fps -44%
NVIDIA GeForce GTX 980M
Schenker W504, Intel Core i7-4700MQ
26 (20min) fps -57%
Hitman 2016 - 3840x2160 High / On AA:FX AF:8x
NVIDIA GeForce GTX 1080 (Desktop)
Nvidia GeForce GTX 1080 Founders Edition, Intel Core i7-4790K
42 (34min - 53max) fps
AMD Radeon R9 Fury
XFX Radeon R9 Fury Pro, Intel Core i7-4790K
38.9 (26min - 46max) fps -7%
AMD Radeon R9 Fury
XFX Radeon R9 Fury Pro, Intel Core i7-4790K
37.7 (26min - 46max) fps -10%
NVIDIA GeForce GTX 980 Ti
Asus Strix GTX 980 Ti Desktop PC, Intel Core i7-4790K
32.6 (24min - 42max) fps -22%
NVIDIA GeForce GTX 980
Desktop PC, Intel Core i7-6700K
26.2 (19min) fps -38%
NVIDIA GeForce GTX 980M
Schenker W504, Intel Core i7-4700MQ
18.4 (15min) fps -56%
The Division - 3840x2160 High Preset AF:8x
NVIDIA GeForce GTX 1080 (Desktop)
Nvidia GeForce GTX 1080 Founders Edition, Intel Core i7-4790K
48.5 (19min - 65max) fps
NVIDIA GeForce GTX 980 Ti
Asus Strix GTX 980 Ti Desktop PC, Intel Core i7-4790K
39.8 (14min - 51max) fps -18%
AMD Radeon R9 Fury
XFX Radeon R9 Fury Pro, Intel Core i7-4790K
34.5 (19min - 51max) fps -29%
NVIDIA GeForce GTX 980
Desktop PC, Intel Core i7-6700K
27.7 (10min) fps -43%
Far Cry Primal - 3840x2160 High Preset AA:SM
NVIDIA GeForce GTX 1080 (Desktop)
Nvidia GeForce GTX 1080 Founders Edition, Intel Core i7-4790K
49 (46min - 53max) fps
NVIDIA GeForce GTX 980 Ti
Asus Strix GTX 980 Ti Desktop PC, Intel Core i7-4790K
40 (37min - 44max) fps -18%
AMD Radeon R9 Fury
XFX Radeon R9 Fury Pro, Intel Core i7-4790K
37 (33min - 42max) fps -24%
NVIDIA GeForce GTX 980
Desktop PC, Intel Core i7-6700K
29 (27min) fps -41%
NVIDIA GeForce GTX 980M
Schenker W504, Intel Core i7-4700MQ
20 (18min) fps -59%
XCOM 2 - 3840x2160 High Preset AA:FX AF:8x
NVIDIA GeForce GTX 1080 (Desktop)
Nvidia GeForce GTX 1080 Founders Edition, Intel Core i7-4790K
30.4 (27min - 34max) fps
NVIDIA GeForce GTX 980 Ti
Asus Strix GTX 980 Ti Desktop PC, Intel Core i7-4790K
25 (24min - 28max) fps -18%
AMD Radeon R9 Fury
XFX Radeon R9 Fury Pro, Intel Core i7-4790K
22 (19min - 24max) fps -28%
NVIDIA GeForce GTX 980
Desktop PC, Intel Core i7-6700K
18.7 (17min) fps -38%
Rise of the Tomb Raider - 3840x2160 High Preset AA:FX AF:4x
NVIDIA GeForce GTX 1080 (Desktop)
Nvidia GeForce GTX 1080 Founders Edition, Intel Core i7-4790K
50 fps
NVIDIA GeForce GTX 1080 (Desktop)
Nvidia GeForce GTX 1080 Founders Edition, Intel Core i7-4790K
47.8 (43min - 54max) fps -4%
NVIDIA GeForce GTX 980 Ti
Asus Strix GTX 980 Ti Desktop PC, Intel Core i7-4790K
40.6 (36min - 46max) fps -19%
AMD Radeon R9 Fury
XFX Radeon R9 Fury Pro, Intel Core i7-4790K
32.4 (29min - 37max) fps -35%
NVIDIA GeForce GTX 980
Desktop PC, Intel Core i7-6700K
27.9 (25min) fps -44%
NVIDIA GeForce GTX 980M
Schenker W504, Intel Core i7-4700MQ
20.8 (19min) fps -58%
Just Cause 3 - 3840x2160 High / On AA:FX AF:8x
NVIDIA GeForce GTX 1080 (Desktop)
Nvidia GeForce GTX 1080 Founders Edition, Intel Core i7-4790K
62 (56min - 67max) fps
NVIDIA GeForce GTX 980 Ti
Asus Strix GTX 980 Ti Desktop PC, Intel Core i7-4790K
48 (42min - 52max) fps -23%
NVIDIA GeForce GTX 980
Desktop PC, Intel Core i7-6700K
36.6 (33min) fps -41%
AMD Radeon R9 Fury
XFX Radeon R9 Fury Pro, Intel Core i7-4790K
36.3 (33min - 41max) fps -41%
NVIDIA GeForce GTX 980M
Schenker W504, Intel Core i7-4700MQ
23.6 (20min) fps -62%
Star Wars Battlefront - 3840x2160 High Preset AA:FX
NVIDIA GeForce GTX 1080 (Desktop)
Nvidia GeForce GTX 1080 Founders Edition, Intel Core i7-4790K
67 (58min - 79max) fps
NVIDIA GeForce GTX 980 SLI (Laptop)
MSI GT80S 6QF, Intel Core i7-6820HK
62.6 fps -7%
NVIDIA GeForce GTX 980 Ti
Asus Strix GTX 980 Ti Desktop PC, Intel Core i7-4790K
53 (46min - 64max) fps -21%
AMD Radeon R9 Fury
XFX Radeon R9 Fury Pro, Intel Core i7-4790K
50 (43min - 60max) fps -25%
NVIDIA GeForce GTX 980
Desktop PC, Intel Core i7-6700K
40.4 (35min) fps -40%
NVIDIA GeForce GTX 980M
Schenker W504, Intel Core i7-4700MQ
27.9 (23min) fps -58%
Assassin's Creed Syndicate - 3840x2160 High Preset AA:FX
NVIDIA GeForce GTX 1080 (Desktop)
Nvidia GeForce GTX 1080 Founders Edition, Intel Core i7-4790K
47.3 (44min - 51max) fps
NVIDIA GeForce GTX 980 SLI (Laptop)
MSI GT80S 6QF, Intel Core i7-6820HK
37.7 fps -20%
NVIDIA GeForce GTX 980 Ti
Asus Strix GTX 980 Ti Desktop PC, Intel Core i7-4790K
37.4 (35min - 41max) fps -21%
AMD Radeon R9 Fury
XFX Radeon R9 Fury Pro, Intel Core i7-4790K
31.5 (29min - 37max) fps -33%
NVIDIA GeForce GTX 980
Desktop PC, Intel Core i7-6700K
27.6 (26min) fps -42%
NVIDIA GeForce GTX 980M
Schenker W504, Intel Core i7-4700MQ
20.7 (18min) fps -56%
Fallout 4 - 3840x2160 High Preset AA:T AF:16x
NVIDIA GeForce GTX 980 SLI (Laptop)
MSI GT80S 6QF, Intel Core i7-6820HK
55.6 fps +3%
NVIDIA GeForce GTX 1080 (Desktop)
Nvidia GeForce GTX 1080 Founders Edition, Intel Core i7-4790K
54 (42min - 66max) fps
NVIDIA GeForce GTX 980 Ti
Asus Strix GTX 980 Ti Desktop PC, Intel Core i7-4790K
46 (37min - 56max) fps -15%
AMD Radeon R9 Fury
XFX Radeon R9 Fury Pro, Intel Core i7-4790K
38.7 (30min - 49max) fps -28%
NVIDIA GeForce GTX 980M
Schenker W504, Intel Core i7-4700MQ
24 (18min) fps -56%
Call of Duty: Black Ops 3 - 3840x2160 High / On AA:FX
NVIDIA GeForce GTX 980 SLI (Laptop)
MSI GT80S 6QF, Intel Core i7-6820HK
60.8 fps +5%
NVIDIA GeForce GTX 1080 (Desktop)
Nvidia GeForce GTX 1080 Founders Edition, Intel Core i7-4790K
58 (50min - 67max) fps
NVIDIA GeForce GTX 980 Ti
Asus Strix GTX 980 Ti Desktop PC, Intel Core i7-4790K
47.5 (41min - 55max) fps -18%
AMD Radeon R9 Fury
XFX Radeon R9 Fury Pro, Intel Core i7-4790K
36.4 (30min - 44max) fps -37%
NVIDIA GeForce GTX 980M
Schenker W504, Intel Core i7-4700MQ
24.8 (10min) fps -57%
Anno 2205 - 3840x2160 High Preset AA:4x
NVIDIA GeForce GTX 1080 (Desktop)
Nvidia GeForce GTX 1080 Founders Edition, Intel Core i7-4790K
67 (64min - 70max) fps
NVIDIA GeForce GTX 980 Ti
Asus Strix GTX 980 Ti Desktop PC, Intel Core i7-4790K
52.2 (49min - 55max) fps -22%
NVIDIA GeForce GTX 980 SLI (Laptop)
MSI GT80S 6QF, Intel Core i7-6820HK
35.4 fps -47%
AMD Radeon R9 Fury
XFX Radeon R9 Fury Pro, Intel Core i7-4790K
34.3 (32min - 36max) fps -49%
NVIDIA GeForce GTX 980M
Schenker W504, Intel Core i7-4700MQ
23.8 (20min) fps -64%
World of Warships - 3840 x 2160 Very High Preset AA:High FX AF:16x
NVIDIA GeForce GTX 1080 (Desktop)
Nvidia GeForce GTX 1080 Founders Edition, Intel Core i7-4790K
109 (81min - 150max) fps
NVIDIA GeForce GTX 980 Ti
Asus Strix GTX 980 Ti Desktop PC, Intel Core i7-4790K
87 (64min - 132max) fps -20%
AMD Radeon R9 Fury
XFX Radeon R9 Fury Pro, Intel Core i7-4790K
64 (50min - 82max) fps -41%
Dirt Rally - 3840x2160 High Preset
NVIDIA GeForce GTX 1080 (Desktop)
Nvidia GeForce GTX 1080 Founders Edition, Intel Core i7-4790K
126 (99min - 154max) fps
NVIDIA GeForce GTX 980 Ti
Asus Strix GTX 980 Ti Desktop PC, Intel Core i7-4790K
109 (88min - 139max) fps -13%
NVIDIA GeForce GTX 980 SLI (Laptop)
MSI GT80S 6QF, Intel Core i7-6820HK
85.6 fps -32%
AMD Radeon R9 Fury
XFX Radeon R9 Fury Pro, Intel Core i7-4790K
81 (53min - 104max) fps -36%
NVIDIA GeForce GTX 980M
Schenker W504, Intel Core i7-4700MQ
58.6 (45min) fps -53%
GTA V - 3840x2160 High/On (Advanced Graphics Off) AA:FX AF:8x
NVIDIA GeForce GTX 980 Ti
Asus Strix GTX 980 Ti Desktop PC, Intel Core i7-4790K
79 fps +11%
NVIDIA GeForce GTX 1080 (Desktop)
Nvidia GeForce GTX 1080 Founders Edition, Intel Core i7-4790K
71.2 (11.6min - 170max) fps
AMD Radeon R9 Fury
XFX Radeon R9 Fury Pro, Intel Core i7-4790K
46.6 fps -35%
NVIDIA GeForce GTX 980M
Schenker W504, Intel Core i7-4700MQ
41.4 (15min) fps -42%
Battlefield 4 - 3840x2160 High Preset
NVIDIA GeForce GTX 980 SLI (Laptop)
MSI GT80S 6QF, Intel Core i7-6820HK
91.6 fps +2%
NVIDIA GeForce GTX 1080 (Desktop)
Nvidia GeForce GTX 1080 Founders Edition, Intel Core i7-4790K
90 fps
NVIDIA GeForce GTX 980 Ti
Asus Strix GTX 980 Ti Desktop PC, Intel Core i7-4790K
70 (63min - 84max) fps -22%
AMD Radeon R9 Fury
XFX Radeon R9 Fury Pro, Intel Core i7-4790K
56 (49min - 65max) fps -38%
NVIDIA GeForce GTX 980M
Schenker W504, Intel Core i7-4700MQ
35.2 (30min) fps -61%

4K and Maximum Details?

After the promising benchmarks in 4K and high settings, there was the question of whether the GTX 1080, as the fastest single chip GPU, is powerful enough for modern titles at the highest settings, Anti-Aliasing and 3840x2160 pixels. This was the case for Need for Speed 2016 (46 fps), The Division (39 fps), Star Wars Battlefront (61 fps) and Battlefield 4 (58 fps). Only Anno 2205 (24 fps), Doom (ultra 51 fps, min 41) and Crysis 3 (31 fps) were close calls. This means the performance is still not sufficient enough to avoid stutters in very demanding scenes. Still, you can easily enjoy the 4K resolution with a slight reduction in respect of AA or details.

More gaming benchmarks and additional resolutions are listed at the end of this article where you can also find general information about the GPU.

Battlefield 4 in 4k and Ultra setting – 64 players Multiplayer – smooth gameplay
Star Wars Battlefront in 4k and Ultra setting – 64 players Multiplayer – smooth gameplay

Boost Clock and Load Performance

Thanks to GPU Boost 3.0, the graphics card can reach much higher clocks until it hits the internal temperature limit. The Founders Edition starts with a high clock of 1797 MHz and 142 fps in The Witcher 3 but drops to 1696 MHz (base clock 1607 MHz according to Nvidia) after 5 minutes. The GPU is steady at 82 °C and the frame rate dropped to 134 fps (-6%). The memory clock on the other hand was maintained at 5005 MHz (10,010 MHz effective). We also noticed a slight performance drop over time in Metro last Light. 141 fps (FHD Ultra) dropped to 138 fps in the third run (-4%), but it will finally level off at 139 fps (we tested 10 runs).

All in all, you have to expect a performance drop of up to 6% depending on the application.

DirectX 12

Praised as a new miracle weapon (by AMD in particular), we now finally have the first games with DirectX 12. However, we can see that the Nvidia driver was already extremely well-optimized and the use of DirectX 11 actually comes with small performance gains in many cases. Ashes of Singularity at "crazy" settings and 4K, for example, was a bit faster with DirectX 11 at 41.6 vs. 40.8 fps. We also measured a small performance advantage for DX 11 for Rise of the Tomb Raider. Hitman still produced graphics errors with the review driver 368.13 in DX12, so we waived a comparison (Nvidia says they are working on a fix until the launch). The theoretical potential of DirectX 12 is shown by the 3DMark 2013 Overhead Test. An 11x result speaks for itself.

Compute Performance

The 1080 cannot beat two GTX 980 cards in the LuxMark render test, because the scaling of the two GPUs just works too well in this case. The R9 Fury and a single GTX 980 on the other hand are clearly beaten. It seems the ComputeMark could not utilize both GTX 980 cards, so the 1080 manages an impressive advantage of 73 and 79%, respectively. The R9 Fury is also 25% slower but can take the lead in Fluid 3DTex.

LuxMark v2.0 64Bit
Room GPUs-only
NVIDIA GeForce GTX 980 SLI (Laptop)
MSI GT80S 6QF, Intel Core i7-6820HK
3660 Samples/s +57%
NVIDIA GeForce GTX 980 Ti
Asus Strix GTX 980 Ti Desktop PC, Intel Core i7-4790K
2490 Samples/s +7%
NVIDIA GeForce GTX 1080 (Desktop)
Nvidia GeForce GTX 1080 Founders Edition, Intel Core i7-4790K
2327 Samples/s
NVIDIA GeForce GTX 980 (Laptop)
Eurocom Sky DLX7, Intel Core i7-6700K
1938 Samples/s -17%
AMD Radeon R9 Fury
XFX Radeon R9 Fury Pro, Intel Core i7-4790K
1566 Samples/s -33%
NVIDIA GeForce GTX 980M
DogHouse Systems Mobius SS, Intel Core i7-6700K
1407 Samples/s -40%
Sala GPUs-only
NVIDIA GeForce GTX 980 SLI (Laptop)
MSI GT80S 6QF, Intel Core i7-6820HK
5814 Samples/s +23%
NVIDIA GeForce GTX 1080 (Desktop)
Nvidia GeForce GTX 1080 Founders Edition, Intel Core i7-4790K
4708 Samples/s
NVIDIA GeForce GTX 980 Ti
Asus Strix GTX 980 Ti Desktop PC, Intel Core i7-4790K
3919 Samples/s -17%
AMD Radeon R9 Fury
XFX Radeon R9 Fury Pro, Intel Core i7-4790K
3125 Samples/s -34%
NVIDIA GeForce GTX 980 (Laptop)
Eurocom Sky DLX7, Intel Core i7-6700K
3077 Samples/s -35%
NVIDIA GeForce GTX 980M
DogHouse Systems Mobius SS, Intel Core i7-6700K
2319 Samples/s -51%
ComputeMark v2.1
1024x600 Normal, QJuliaRayTrace
NVIDIA GeForce GTX 1080 (Desktop)
Nvidia GeForce GTX 1080 Founders Edition, Intel Core i7-4790K
6191 Points
NVIDIA GeForce GTX 980 Ti
Asus Strix GTX 980 Ti Desktop PC, Intel Core i7-4790K
4270 Points -31%
NVIDIA GeForce GTX 980 (Laptop)
Eurocom Sky DLX7, Intel Core i7-6700K
3229 Points -48%
NVIDIA GeForce GTX 980 SLI (Laptop)
MSI GT80S 6QF, Intel Core i7-6820HK
3091 Points -50%
AMD Radeon R9 Fury
XFX Radeon R9 Fury Pro, Intel Core i7-4790K
3082 Points -50%
NVIDIA GeForce GTX 980M
DogHouse Systems Mobius SS, Intel Core i7-6700K
2418 Points -61%
1024x600 Normal, Mandel Scalar
NVIDIA GeForce GTX 1080 (Desktop)
Nvidia GeForce GTX 1080 Founders Edition, Intel Core i7-4790K
3646 Points
AMD Radeon R9 Fury
XFX Radeon R9 Fury Pro, Intel Core i7-4790K
3233 Points -11%
NVIDIA GeForce GTX 980 Ti
Asus Strix GTX 980 Ti Desktop PC, Intel Core i7-4790K
2710 Points -26%
NVIDIA GeForce GTX 980 (Laptop)
Eurocom Sky DLX7, Intel Core i7-6700K
1960 Points -46%
NVIDIA GeForce GTX 980 SLI (Laptop)
MSI GT80S 6QF, Intel Core i7-6820HK
1854 Points -49%
NVIDIA GeForce GTX 980M
DogHouse Systems Mobius SS, Intel Core i7-6700K
1461 Points -60%
1024x600 Normal, Mandel Vector
NVIDIA GeForce GTX 1080 (Desktop)
Nvidia GeForce GTX 1080 Founders Edition, Intel Core i7-4790K
3284 Points
AMD Radeon R9 Fury
XFX Radeon R9 Fury Pro, Intel Core i7-4790K
2602 Points -21%
NVIDIA GeForce GTX 980 Ti
Asus Strix GTX 980 Ti Desktop PC, Intel Core i7-4790K
2479 Points -25%
NVIDIA GeForce GTX 980 (Laptop)
Eurocom Sky DLX7, Intel Core i7-6700K
1926 Points -41%
NVIDIA GeForce GTX 980 SLI (Laptop)
MSI GT80S 6QF, Intel Core i7-6820HK
1856 Points -43%
NVIDIA GeForce GTX 980M
DogHouse Systems Mobius SS, Intel Core i7-6700K
1564 Points -52%
1024x600 Normal, Fluid 2DTexArr
NVIDIA GeForce GTX 1080 (Desktop)
Nvidia GeForce GTX 1080 Founders Edition, Intel Core i7-4790K
1758 Points
NVIDIA GeForce GTX 980 Ti
Asus Strix GTX 980 Ti Desktop PC, Intel Core i7-4790K
1382 Points -21%
AMD Radeon R9 Fury
XFX Radeon R9 Fury Pro, Intel Core i7-4790K
1114 Points -37%
NVIDIA GeForce GTX 980 (Laptop)
Eurocom Sky DLX7, Intel Core i7-6700K
1031 Points -41%
NVIDIA GeForce GTX 980 SLI (Laptop)
MSI GT80S 6QF, Intel Core i7-6820HK
1020 Points -42%
NVIDIA GeForce GTX 980M
DogHouse Systems Mobius SS, Intel Core i7-6700K
760 Points -57%
1024x600 Normal, Fluid 3DTex
AMD Radeon R9 Fury
XFX Radeon R9 Fury Pro, Intel Core i7-4790K
1860 Points +8%
NVIDIA GeForce GTX 1080 (Desktop)
Nvidia GeForce GTX 1080 Founders Edition, Intel Core i7-4790K
1730 Points
NVIDIA GeForce GTX 980 Ti
Asus Strix GTX 980 Ti Desktop PC, Intel Core i7-4790K
1531 Points -12%
NVIDIA GeForce GTX 980 SLI (Laptop)
MSI GT80S 6QF, Intel Core i7-6820HK
1070 Points -38%
NVIDIA GeForce GTX 980 (Laptop)
Eurocom Sky DLX7, Intel Core i7-6700K
1059 Points -39%
NVIDIA GeForce GTX 980M
DogHouse Systems Mobius SS, Intel Core i7-6700K
783 Points -55%
1024x600 Normal, Score
NVIDIA GeForce GTX 1080 (Desktop)
Nvidia GeForce GTX 1080 Founders Edition, Intel Core i7-4790K
16610 Points
NVIDIA GeForce GTX 980 Ti
Asus Strix GTX 980 Ti Desktop PC, Intel Core i7-4790K
12373 Points -26%
AMD Radeon R9 Fury
XFX Radeon R9 Fury Pro, Intel Core i7-4790K
11890 Points -28%
NVIDIA GeForce GTX 980 (Laptop)
Eurocom Sky DLX7, Intel Core i7-6700K
9204 Points -45%
NVIDIA GeForce GTX 980 SLI (Laptop)
MSI GT80S 6QF, Intel Core i7-6820HK
8892 Points -46%
NVIDIA GeForce GTX 980M
DogHouse Systems Mobius SS, Intel Core i7-6700K
6986 Points -58%

Professional Applications

Using a consumer GPU for professional applications is tempting. The price differences to the Quadro cards are often very big, but the GeForce drivers are not certified and also pretty limited in some cases. Depending on the driver version (for notebooks in particular), the performance can fluctuate significantly. We took a "good" GTX 980 in the Schenker XMG U716 and a "bad" one in the GT72S as an example, because they differ a lot in Maya, for instance. Both cards offer a similar DirectX performance, but the different driver versions result in these big differences. By the way, the 980 SLI did not have an advantage over a single 980. The professional M5000M and even the M3000M are much faster is some tests like Siemens NX, despite the slower hardware. Still, the performance of the GTX 1080 with the driver version 368.13 was good in general.

NVIDIA GeForce GTX 1080 (Desktop)
Nvidia GeForce GTX 1080 Founders Edition, Intel Core i7-4790K
NVIDIA GeForce GTX 980 SLI (Laptop)
MSI GT80S 6QF, Intel Core i7-6820HK
NVIDIA GeForce GTX 980 (Laptop)
SCHENKER XMG U716, Intel Core i7-6700
NVIDIA GeForce GTX 980 (Laptop)
MSI GT72S 6QF, Intel Core i7-6820HK
NVIDIA Quadro M5000M
MSI WT72-6QM, Intel Xeon E3-1505M v5
NVIDIA Quadro M3000M
SCHENKER W706, Intel Core i7-6700
SPECviewperf 12
-37%
-35%
-43%
101%
37%
1900x1060 Solidworks (sw-03)
67.7
50.8
-25%
49.23
-27%
43.23
-36%
101
49%
92
36%
1900x1060 Siemens NX (snx-02)
8.67
6.05
-30%
6.11
-30%
5.69
-34%
86.9
902%
52
500%
1900x1060 Showcase (showcase-01)
112
61.2
-45%
59.3
-47%
52.1
-53%
44.14
-61%
37
-67%
1900x1060 Medical (medical-01)
45.6
30.18
-34%
30.94
-32%
29.57
-35%
31.35
-31%
22
-52%
1900x1060 Maya (maya-04)
163
88.9
-45%
107
-34%
75.2
-54%
69.6
-57%
61
-63%
1900x1060 Energy (energy-01)
10.4
6.8
-35%
7.17
-31%
5.61
-46%
6.86
-34%
4.8
-54%
1900x1060 Creo (creo-01)
60.9
35.42
-42%
34.82
-43%
32.6
-46%
81.3
33%
66
8%
1900x1060 Catia (catia-04)
86.3
52.2
-40%
53.6
-38%
49.52
-43%
94.4
9%
77
-11%

Video Decoder

DXVAChecker GTX 1080

The new video decoder was also convincing in our review. Both 2K H.264 as well as 4K H.264 playback was smooth at high frame rates and the CPU load was low (4K 100 Mbps 138 fps, 4% CPU). HEVC was no problem, either (1080p at 565 fps, 4% CPU and 4K 267 fps at 1% CPU).

Thanks to 12-bit HEVC decoding and new security features, the GTX 1080 is one of the first cards certified according to PlayReady 3.0 (SL3000) and can therefore be used for 4K streaming (e.g. Netflix) in Windows 10. More information about Pascal's video decoding and encoding is available in our in-depth analysis of Pascal.

Emissions of the Founders Edition

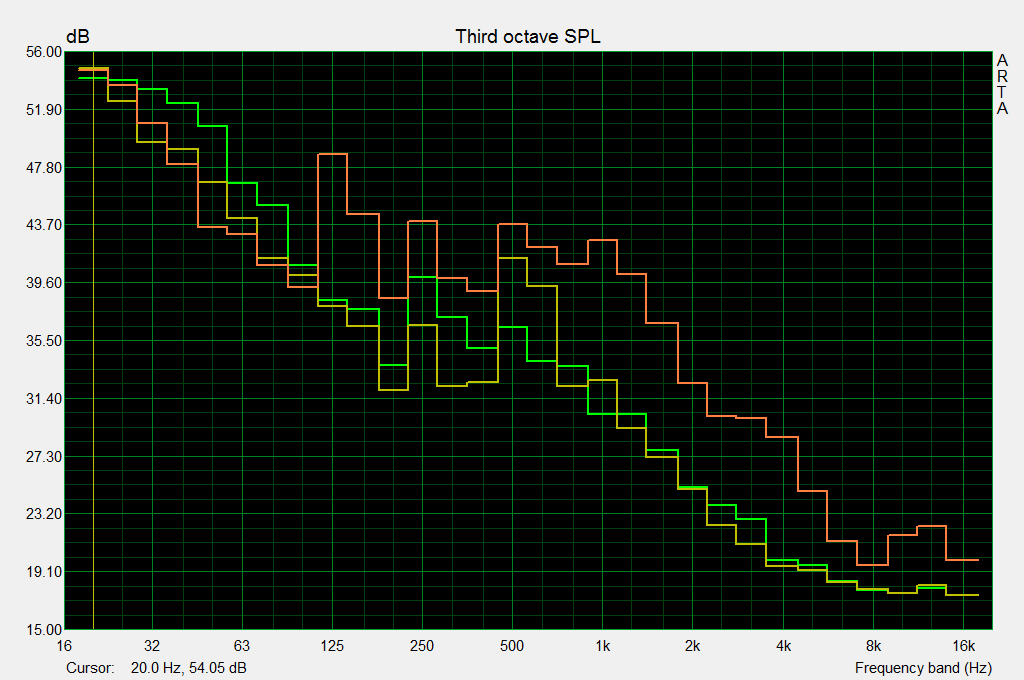
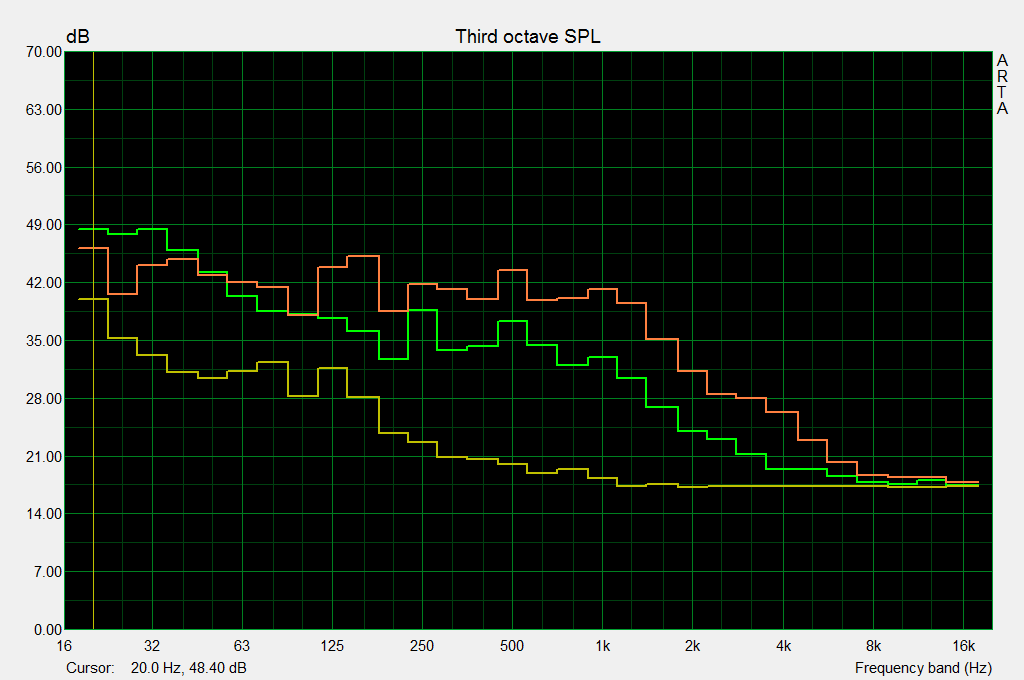
The Founders Edition of the Nvidia GeForce GTX 1080 is conveniently restrained in terms of emissions. We can hardly notice a difference to the (admittedly pretty loud) CPU cooler at a distance of 15 cm when the desktop is idling. We can measure about 41 dB (for PSU and CPU fan) with and without the GPU. The curve in the lower diagram even shows that the CPU fan is actually a bit louder in some cases with the activated integrated GPU. The system noise is increased up to 49.4 dB (2355 rpm) under load in FurMark and 48.5 dB (2200 rpm) in The Witcher 3 under sustained load. Still, the noise characteristics are convenient and never annoying.

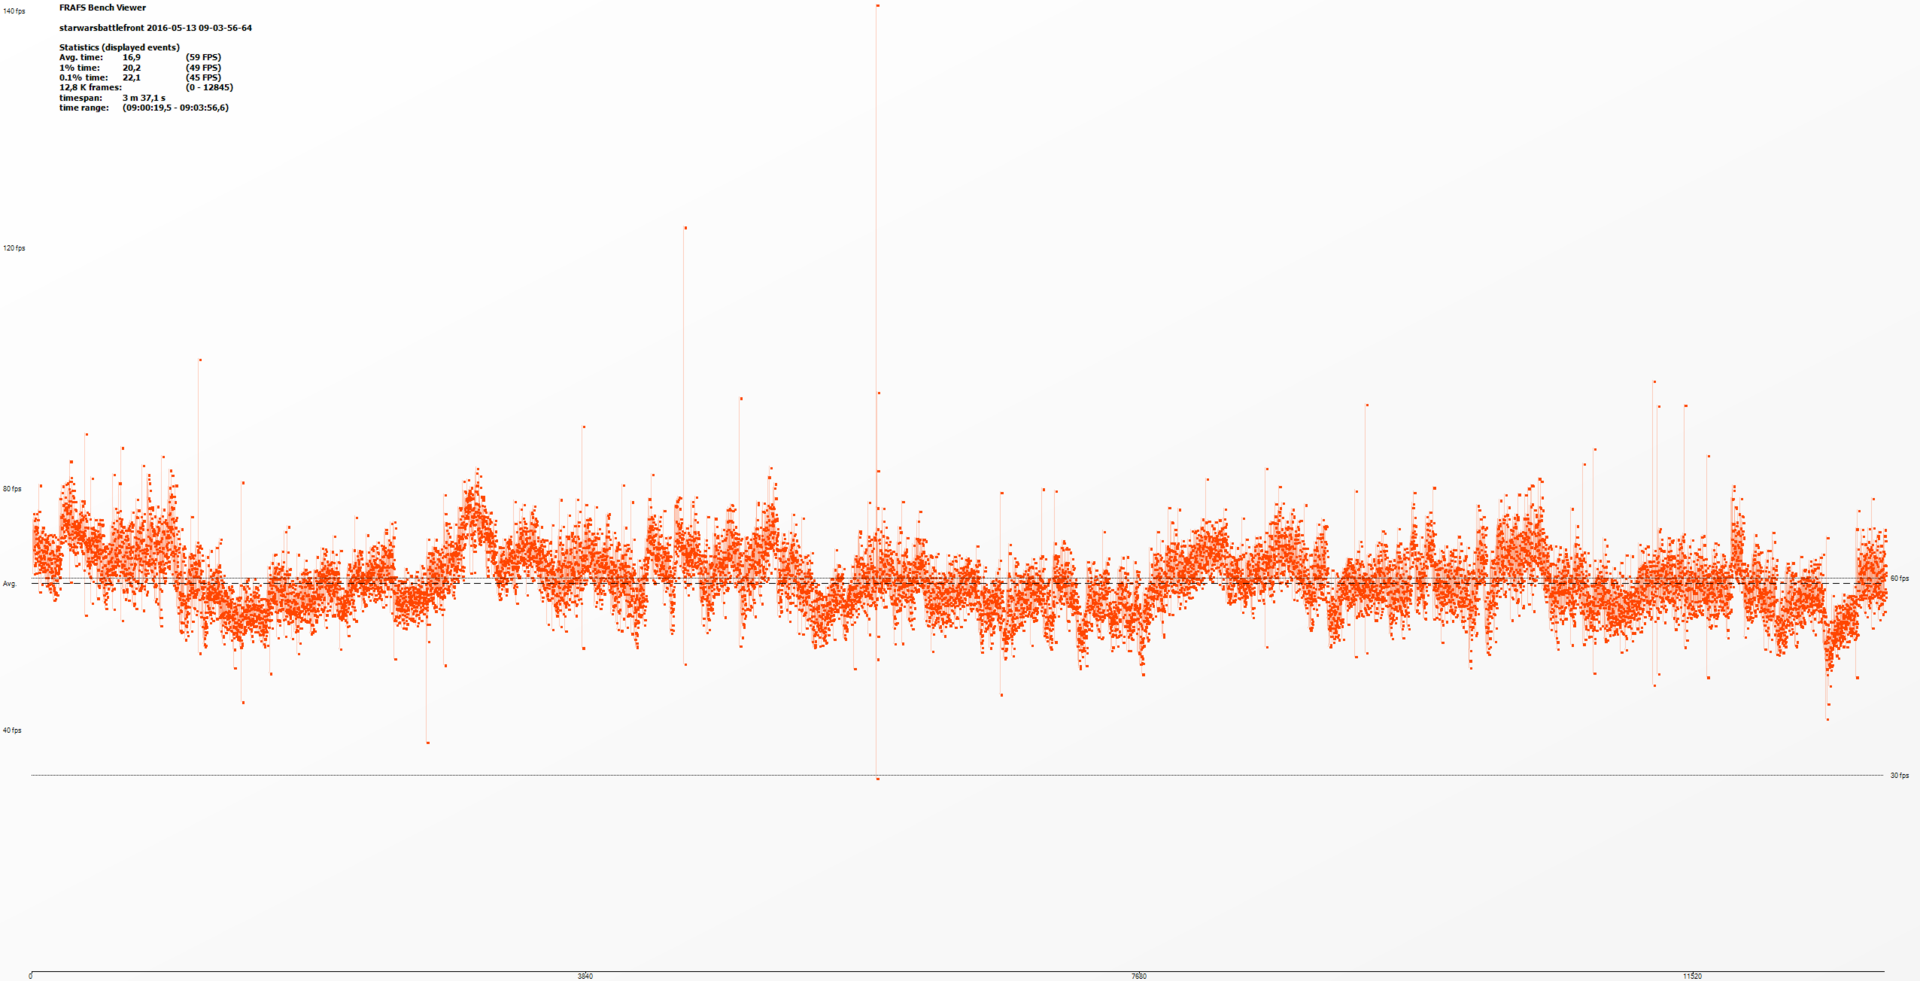
We did notice annoying coil whining at frame rates above 200 fps though. It gets really unpleasant above 400 fps, but this should not be an issue for most users.

Our test system consumes 66 Watts without dedicated graphics card on the Windows 10 desktop with one 4K monitor connected. This value is raised by 8 Watts to 74 Watts with the GTX 1080. HWiNFO sensors show 8.8 Watts for the GTX 1080, which supports our measurement. Using an XFX Radeon R9 Fury Pro we measure 85 Watt. The Asus Strix GTX 980Ti needs 1 Watt more with 86 Watts. As the typical 980 is about 3 to 8 Watts better than the AMD R9 Fury, the GTX 1080 should easily beat its predecessor in idle too.

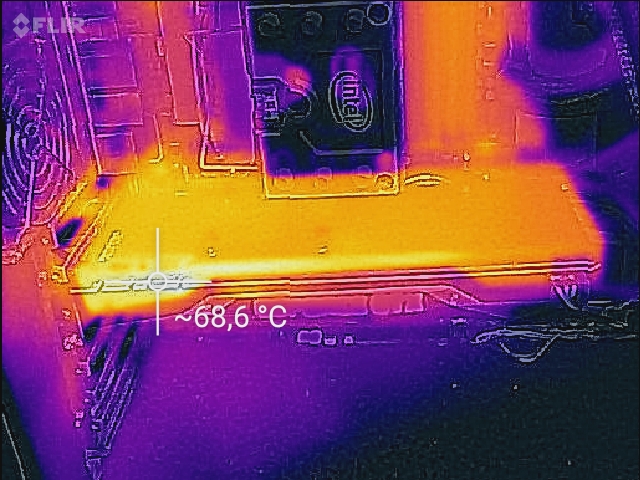
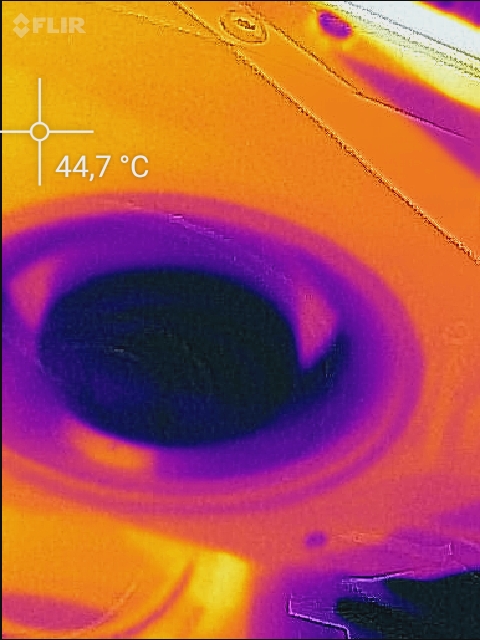
Using The Witcher 3, we can measure 322 Watts at the socket at first (248 Watts more than idle). HWiNFO shows 175 Watts for the GPU. The value levels off at 302 Watts after 5 minutes (HWiNFO shows 160 Watts for the GPU, 34 Watts for the CPU). The recommended 500-Watt PSU should therefore be sufficient. Using the R9 Fury, we get around 350 Watts (constant) in the same scene. The Asus Strix 980 Ti (overclocked by Asus) is using even more with about 397 Watt.

yellow: without GPU; green: 1080 idle; red 1080 during FurMark
Attention different scaling for comparison: yellow: ambient noise, PC off; green: idle; red: load
The graphics card gets very warm at up to 68 °C.
The situation is better around the cooler.

Verdict Nvidia GeForce GTX 1080 Founders Edition

Pascal in the GTX 1080 – a successful product

After numerous benchmarks and measurements, we can congratulate Nvidia for Pascal with a clear conscience. The graphics card has a similar power consumption, but there is a significant performance jump. Even two GTX 980s SLI can be slightly beaten on average in the gaming benchmarks. The desktop 980Ti and Titan X are also beaten. Gaming in 4K with the GTX 1080 is usually possible at high settings. A notebook version is probably just a matter of time, similar to the GTX 980.

The high-quality Founders Edition from Nvidia convinces with convenient noise levels and high-quality materials. Only the future will tell if it can compete with third-party models. The price will probably be average, but more expensive cards will certainly be shipped with higher clocks.

Benchmarks

Performance Rating - 3DMark 11 + Fire Strike + Time Spy
8 pt (24%)
3DMark - 3DMark Time Spy Score
min: 6423     avg: 6926     median: 6902 (18%)     max: 7922 Points
3DMark - 3DMark Time Spy Graphics
min: 6867     avg: 7227     median: 7185 (15%)     max: 7592 Points
3DMark - 3DMark Ice Storm Unlimited Graphics
min: 358774     avg: 417948     median: 421474 (43%)     max: 470072 Points
3DMark - 3DMark Cloud Gate Score
min: 27092     avg: 30829     median: 31475 (30%)     max: 35343 Points
3DMark - 3DMark Cloud Gate Graphics
min: 79091     avg: 115297     median: 119971 (30%)     max: 129042 Points
3DMark - 3DMark Fire Strike Standard Score
min: 13278     avg: 16733     median: 16623 (25%)     max: 20814 Points
3DMark - 3DMark Fire Strike Standard Graphics
min: 15834     avg: 20727     median: 21408.5 (20%)     max: 22887 Points
3DMark 11 - 3DM11 Performance Score
min: 15758     avg: 20943     median: 21289.5 (26%)     max: 26308 Points
3DMark 11 - 3DM11 Performance GPU
min: 19910     avg: 28484     median: 29263 (22%)     max: 32126 Points
3DMark Vantage
3DM Vant. Perf. total +
3DM Vant. Perf. GPU no PhysX +
3DMark 2001SE - 3DMark 2001 - Standard
94578 Points (98%)
3DMark 03 - 3DMark 03 - Standard
176008 Points (92%)
3DMark 06 3DMark 06 - Standard 1280x1024 +
Unigine Heaven 3.0 - Unigine Heaven 3.0 DX 11
269 fps (89%)
SPECviewperf 12
specvp12 sw-03 +
specvp12 snx-02 +
specvp12 showcase-01 +
specvp12 mediacal-01 +
specvp12 maya-04 +
specvp12 energy-01 +
specvp12 creo-01 +
specvp12 catia-04 +
Cinebench R10 Cinebench R10 Shading (32bit) +
Cinebench R11.5 Cinebench R11.5 OpenGL 64 Bit +
Cinebench R15
Cinebench R15 OpenGL 64 Bit +
Cinebench R15 OpenGL Ref. Match 64 Bit +
Power Consumption - Furmark Stress Test Power Consumption - external Monitor *
min: 229.7     avg: 280.4     median: 267.5 (37%)     max: 357 Watt
Power Consumption - The Witcher 3 Power Consumption - external Monitor *
min: 243.1     avg: 280.3     median: 273.5 (38%)     max: 331 Watt
Power Consumption - Power Efficiency - Witcher 3 ultra external Monitor
min: 0.2477     avg: 0.3     median: 0.3 (24%)     max: 0.3867 fps per Watt
Emissions Witcher 3 Fan Noise +
- Range of benchmark values for this graphics card
red legend - Average benchmark values for this graphics card
* Smaller numbers mean a higher performance

v1.28
log 18. 16:13:44

#0 ran 1s before starting gpusingle class +0s ... 0s

#1 no ids found in url (should be separated by "_") +0s ... 0s

#2 not redirecting to Ajax server +0s ... 0s

#3 did not recreate cache, as it is less than 5 days old! Created at Tue, 18 Feb 2025 12:54:23 +0100 +0.001s ... 0.001s

#4 getting avg benchmarks for device 7311 +0.02s ... 0.021s

#5 got single benchmarks 7311 +0.019s ... 0.04s

#6 got avg benchmarks for devices +0s ... 0.04s

#7 min, max, avg, median took s +0.889s ... 0.93s

#8 return log +0s ... 0.93s

Game Benchmarks

The following benchmarks stem from our benchmarks of review laptops. The performance depends on the used graphics memory, clock rate, processor, system settings, drivers, and operating systems. So the results don't have to be representative for all laptops with this GPU. For detailed information on the benchmark results, click on the fps number.

ultra 1920x1080
46.6  fps    + Compare
QHD 2560x1440
27.5  fps    + Compare
4K 3840x2160
11  fps    + Compare
» With all tested laptops playable in detail settings ultra.
Additional Benchmarks
Steam Deck 1280x800
126.9
Ultra Preset (FSR2 on) 1920x1080
58.9
ultra 1920x1080
55.8  fps    + Compare + 📈 Graph
QHD 2560x1440
37.1  fps    + Compare + 📈 Graph