Notebook reviews with NVIDIA GeForce GTX 965M graphics card
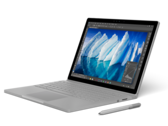
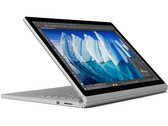
Surface Book with Performance Base Review – 1 TB SSD Update
Top model. We review the high-end SKU of Microsoft's luxury 2-in-1 with a fast 1 TB NVMe-SSD and 16 GB DDR4 of RAM. We check the differences to the entry-level version from 2017 that we have already reviewed.
Intel Core i7-6600U, NVIDIA GeForce GTX 965M, 13.5", 1.7 kgMicrosoft Surface Book with Performance Base (GTX 965M) Convertible Review
Pumped up. Is premium getting even better? Nvidia’s current Pascal GPU didn’t make it into the new Surface Book but Microsoft managed to fit a Maxwell chip under the hood that should offer plenty of performance. Or does it?
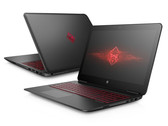
Intel Core i7-6600U, NVIDIA GeForce GTX 965M, 13.5", 1.7 kgHP Omen 15 (2016) Notebook Review
Remake. For the 2016 version of their Omen, HP does not stop at a simple hardware refresh, but also updates the notebook with a stylish new chassis. We take a closer look at the 15-inch version with GeForce GTX 965M. What follows are our impressions.
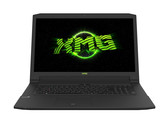
Intel Core i7-6700HQ, NVIDIA GeForce GTX 965M, 15.6", 2.2 kgSchenker XMG A726 (Clevo N170RF1-G) Notebook Review
Fine tuning. Schenker Technologies have added new gaming models to their Advanced series in May. Thanks to the many new features, the XMG A726 is notably more modern than its 17-inch XMG A716 and XMG A706 siblings. We checked the differences in detail. Is the extra cost worth it?
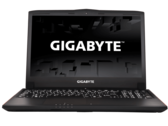
Intel Core i7-6700HQ, NVIDIA GeForce GTX 965M, 17.3", 3.1 kgGigabyte P55K v5 Notebook Review
GTX 965M gaming. Not content with a GTX 960M and is the GTX 970M a bit too much? Then the GTX 965M may be your best bet.
Intel Core i7-6700HQ, NVIDIA GeForce GTX 965M, 15.6", 2.6 kgSchenker XMG A516: Intel Core i7-6700HQ, 15.60", 2.5 kg
Review » Schenker XMG A516 (Clevo N150RF) Notebook Review
MIFcom EG7: Intel Core i7-6700HQ, 17.30", 3.1 kg
Review » MIFcom EG7 (Clevo N170RF) Notebook Review
MSI GE72 965M Ti: Intel Core i7-6700HQ, 17.30"
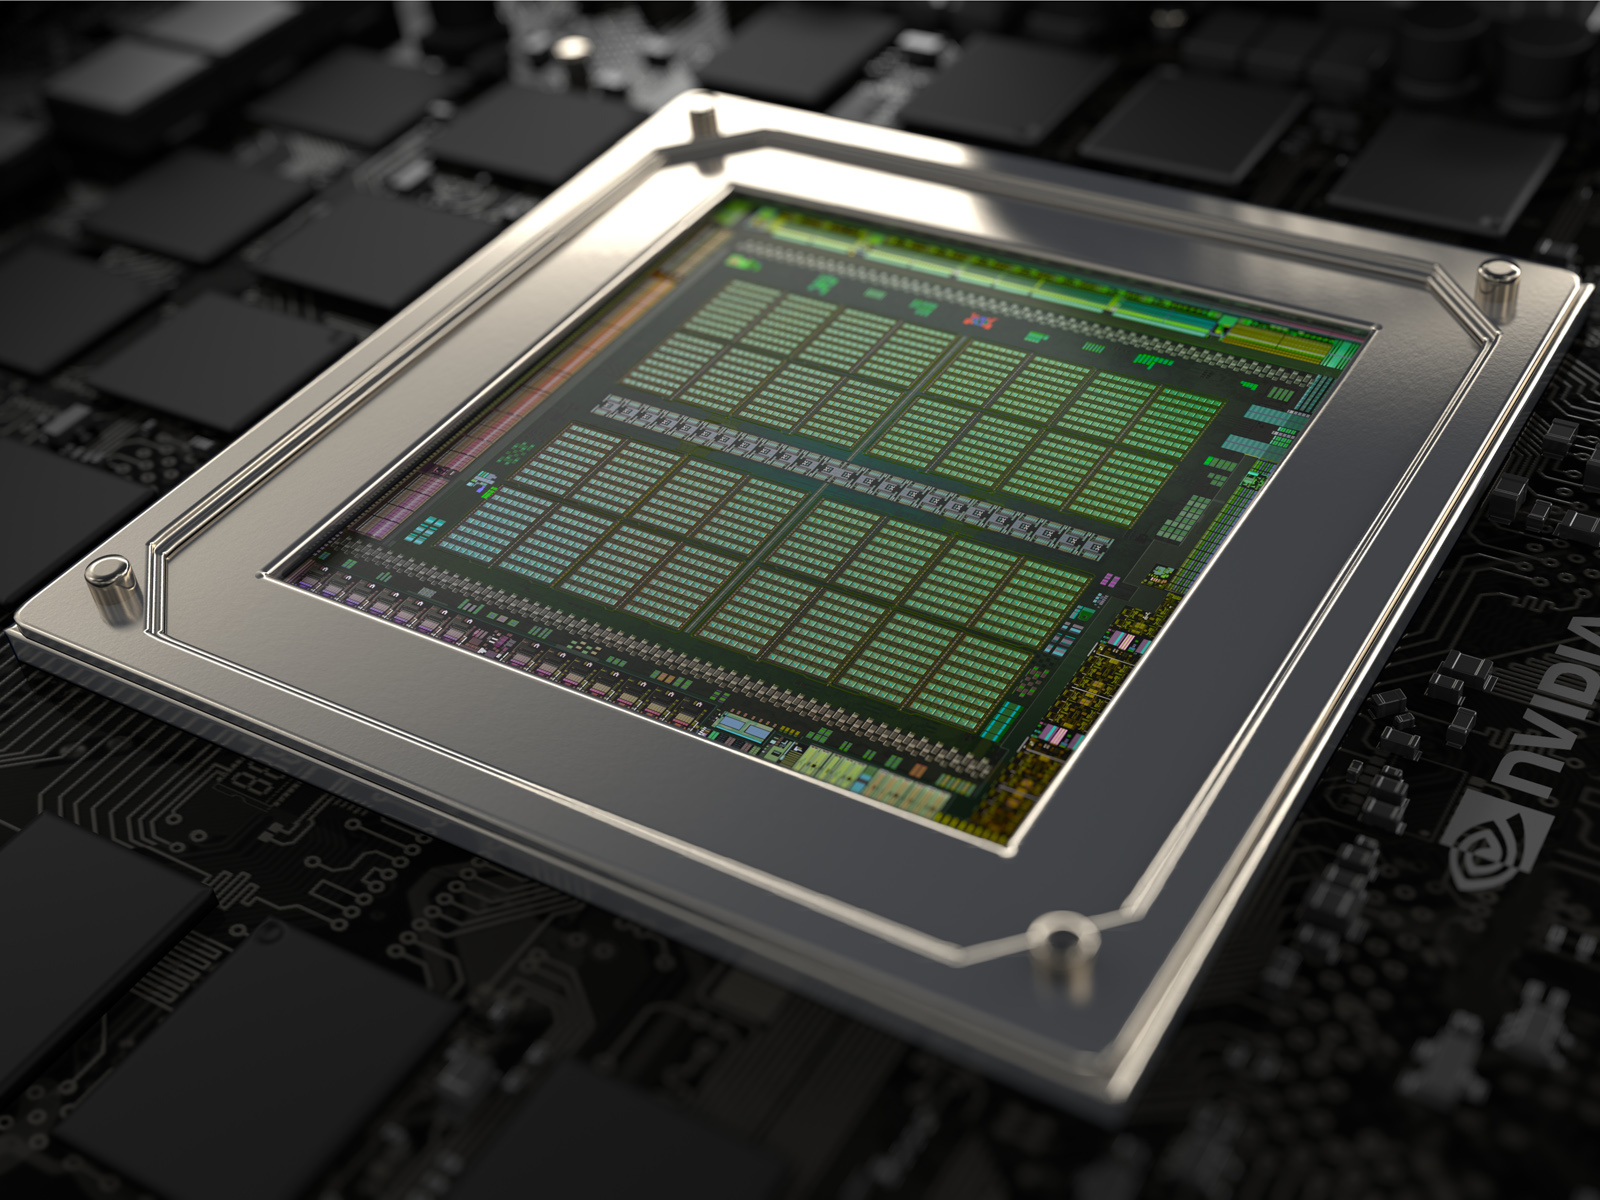
Review » Nvidia GeForce GTX 965M 2016 Refresh (N16E-GR) Review
Schenker XMG C405: Intel Core i7-4720HQ, 14.00", 1.8 kg
Review » Schenker XMG C405 Notebook Review
MSI GE62-2QEUi716H21BW: Intel Core i7-4720HQ, 15.60", 2.4 kg
Review » MSI GE62 Notebook Review
Schenker XMG P705: Intel Core i7-4720HQ, 17.30", 3.3 kg
Review » Schenker XMG P705 (Clevo P670SA) Notebook Review
Microsoft Surface Book with Performance Base: Intel Core i7-6600U, 13.50", 1.7 kg
External Review » Microsoft Surface Book with Performance Base
HP Omen 17-w005ur: Intel Core i7-6700HQ, 17.30", 2.8 kg
External Review » HP Omen 17-w005ur
HP Omen 17-w010nd: Intel Core i7-6700HQ, 17.30", 2.9 kg
External Review » HP Omen 17-w010nd
Microsoft Surface Book 2016, Core i7: Intel Core i7-6600U, 13.50", 1.7 kg
External Review » Microsoft Surface Book 2016, Core i7
HP Omen 17-w010ng: Intel Core i7-6700HQ, 17.30", 2.8 kg
External Review » HP Omen 17-w010ng
Gigabyte Aero 14-K-ES-CF1: Intel Core i7-6700HQ, 14.00", 1.9 kg
External Review » Gigabyte Aero 14-K-ES-CF1
HP Omen 15-ax025nd: Intel Core i7-6700HQ, 11.60", 2.2 kg
External Review » HP Omen 15-ax025nd
HP Omen 15-ax009no: Intel Core i7-6700HQ, 15.60", 2.1 kg
External Review » HP Omen 15-ax009no
HP Omen 15-ax011na: Intel Core i7-6700HQ, 15.60", 2.2 kg
External Review » HP Omen 15-ax011na
HP Omen 17-w009ng: Intel Core i7-6700HQ, 17.30", 2.8 kg
External Review » HP Omen 17-w009ng
Asus G752VL-GC085T: Intel Core i7-6700HQ, 17.30", 4.5 kg
External Review » Asus G752VL-GC085T
HP Omen 15-ax003ng: Intel Core i7-6700HQ, 15.60", 2.2 kg
External Review » HP Omen 15-ax003ng
HP OMEN 15-ax006ur: Intel Core i5-6300HQ, 15.60", 2.2 kg
External Review » HP OMEN 15-ax006ur
Alienware 13 OLED: Intel Core i7-6500U, 13.30", 2.1 kg
External Review » Alienware 13 OLED
HP Omen 15-ax002nc: Intel Core i7-6700HQ, 15.60", 2.3 kg
External Review » HP Omen 15-ax002nc
HP Omen 17-w012ng: Intel Core i7-6700HQ, 17.30", 2.8 kg
External Review » HP Omen 17-w012ng
HP Omen 15-ax008ng: Intel Core i7-6700HQ, 15.60", 2.2 kg
External Review » HP Omen 15-ax008ng
Sager NP7258: Intel Core i7-6700HQ, 15.60", 2.5 kg
External Review » Sager NP7258
Gigabyte P55K v4-W2: Intel Core i7-5700HQ, 15.60", 2.5 kg
External Review » Gigabyte P55K v4-W2
Alienware 15 R2: Intel Core i5-6300HQ, 15.60", 3.2 kg
External Review » Alienware 15 R2
Cyberpower Fangbook III HX6-200: Intel Core i7-5700HQ, 15.60", 2.4 kg
External Review » Cyberpower Fangbook III HX6-200
Alienware 15-4068: Intel Core i5-4210H, 15.60", 3.2 kg
External Review » Alienware 15-4068
Asus G751JL-T7028: Intel Core i7-4720HQ, 17.30", 4.3 kg
External Review » Asus G751JL-T7028
MSI GS60 2QD-470UK: Intel Core i7-4720HQ, 15.60", 2 kg
External Review » MSI GS60 2QD-470UK
MSI GE62-2QEWi78H11: Intel Core i7-4720HQ, 15.60", 2.4 kg
External Review » MSI GE62-2QEWi78H11
MSI GE72-2QEi716H21BW: Intel Core i7-4720HQ, 17.30", 2.7 kg
External Review » MSI GE72-2QEi716H21BW
Schenker XMG C405: Intel Core i7-4720HQ, 14.00", 1.8 kg
External Review » Schenker XMG C405
Origin PC EON17-X: unknown, 17.30", 3.9 kg
External Review » Origin PC EON17-X
Gigabyte P35K v3: Intel Core i7-4720HQ, 15.60", 2.3 kg
External Review » Gigabyte P35K v3
MSI GE62-2QEWi781: Intel Core i7-4720HQ, 15.60", 2.4 kg
External Review » MSI GE62-2QEWi781
Schenker XMG P705: Intel Core i7-4720HQ, 17.30", 3.3 kg
External Review » Schenker XMG P705