Notebook reviews with NVIDIA GeForce GTX 1050 Mobile graphics card
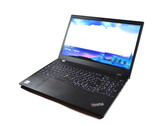
Lenovo ThinkPad T15p Gen 1 laptop review: Powerful but inefficient
The Lenovo ThinkPad T15p Gen 1 promises a more performant laptop package compared to the regular ThinkPad T15. It keeps this promise, but its performance has drawbacks. And so, in the end, we ask ourselves: For whom is the Lenovo ThinkPad T15p the right laptop?
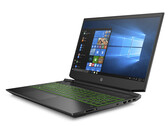
Intel Core i7-10750H, NVIDIA GeForce GTX 1050 Mobile, 15.6", 2.2 kgHP Pavilion Gaming 15 in Review: Cheap gaming laptop with good battery life
The Pavilion Gaming 15's combination of CPU and GPU is able to display all current PC games smoothly on the 15.6-inch screen. On top of that, it comes with an NVMe SSD, 8 GB of RAM (dual-channel mode) and very good battery life. However, the display is disappointing.
AMD Ryzen 5 3550H, NVIDIA GeForce GTX 1050 Mobile, 15.6", 2.3 kgMSI GF63 8RC (i5-8300H, GTX 1050) Laptop Review
The GF63 is nearly the same size and weight as the GS65 but for hundreds of dollars less. MSI has created an excellent budget gaming system that's also light enough for schoolwork and travel.
Intel Core i5-8300H, NVIDIA GeForce GTX 1050 Mobile, 15.6", 1.9 kgDell G3 15 3579 (i5-8300H, GTX 1050, FHD) Laptop Review
Value-oriented. The new Dell G series caters to gamers on tighter budgets who may find the Alienware series to be out of reach. While core performance remains intact, the cut corners for this inexpensive offering add up quickly.
Intel Core i5-8300H, NVIDIA GeForce GTX 1050 Mobile, 15.6", 2.5 kgDell G3 17 3779 (i5-8300H, GTX 1050, SSD, IPS) Laptop Review
The Dell G3 series offers affordable gaming laptops. We took a careful look at the most affordable Dell notebook with a Coffee Lake CPU and a mid-range GPU. You can find out in our review whether a purchase is worthwhile and if the 17-inch laptop offers any more advantages.
Intel Core i5-8300H, NVIDIA GeForce GTX 1050 Mobile, 17.3", 3 kgAsus VivoBook 15 X570UD: Intel Core i7-8550U, 15.60", 1.9 kg
Review » Asus VivoBook 15 K570UD (i7-8550U, GTX 1050) Laptop Review
Lenovo Yoga 730-15IKB: Intel Core i7-8550U, 15.60", 1.9 kg
Review » Lenovo Yoga 730-15IKB (i7-8550U, GTX 1050, SSD, 4K) Convertible Review
MSI GL63 8RC-069US: Intel Core i5-8300H, 15.60", 2.2 kg
Review » MSI GL63 8RC (i5-8300H, GTX 1050) Laptop Review
Dell XPS 15 2018 i5 FHD 97Wh: Intel Core i5-8300H, 15.60", 1.9 kg
Review » Dell XPS 15 2018 9570 (8300H, GTX 1050, 97Wh) Laptop Review
Asus FX504GD: Intel Core i5-8300H, 15.60", 2.3 kg
Review » Asus TUF FX504GD (Core i5-8300H, GTX 1050) Laptop Review
Acer Nitro 5 Spin NP515-51-86CX: Intel Core i7-8550U, 15.60", 2.2 kg
Review » Acer Nitro 5 Spin NP515 (i7-8550U, GTX 1050) Convertible Review
Asus ZenBook Flip 15 UX561UD: Intel Core i7-8550U, 15.60", 2.1 kg
Review » Asus ZenBook Flip 15 (i7-8550U, GTX 1050, 4K, SSD, HDD) Convertible Review
Asus VivoBook Pro 17 N705UD-EH76: Intel Core i7-8550U, 17.30", 2.3 kg
Review » Asus VivoBook Pro 17 N705UD (i7-8550U, GTX 1050) Laptop Review
Dell Inspiron 15 7000 7577: Intel Core i5-7300HQ, 15.60", 2.8 kg
Review » Dell Inspiron 15 7000 7577 (i5-7300HQ, GTX 1050, 1080p) Laptop Review
Acer Spin 5 SP515-51GN-80A3: Intel Core i7-8550U, 15.60", 2.3 kg
Review » Acer Spin 5 SP515-51GN (i7-8550U, GTX 1050, 8 GB) Convertible Review
Acer Aspire 7 A715-71G-53TU: Intel Core i5-7300HQ, 15.60", 2.4 kg
Review » Acer Aspire 7 A715 (7300HQ, GTX 1050) Laptop Review
Microsoft Surface Book 2: Intel Core i7-8650U, 13.50", 1.6 kg
Review » Microsoft Surface Book 2 (13.5", i7, GTX 1050) Convertible Review
Asus GL503VD-DB74: Intel Core i7-7700HQ, 15.60", 2.2 kg
Review » Asus ROG GL503VD-DB74 (7700HQ, GTX 1050) Laptop Review
Asus ROG Strix GL703VD-DB74: Intel Core i7-7700HQ, 17.30", 3 kg
Review » Asus ROG Strix GL703VD-DB74 (7700HQ, GTX 1050, FHD) Laptop Review
Asus VivoBook Pro 15 N580VD-DM028T: Intel Core i7-7700HQ, 15.60", 2 kg
Review » Asus VivoBook Pro 15 (i7-7700HQ, GTX 1050) Laptop Review
Zotac ZBOX Magnus EN51050: Intel Core i5-7500T, 1.7 kg
Review » Zotac ZBOX Magnus EN51050 Mini PC Review
Asus ZenBook Pro UX550VD: Intel Core i7-7700HQ, 15.60", 1.9 kg
Review » Asus ZenBook Pro UX550VD (i7, GTX 1050, Full HD) Laptop Review
Dell Inspiron 15 7000 7567 Gaming (Core i5-7300HQ, GTX 1050): Intel Core i5-7300HQ, 15.60", 2.8 kg
Review » Dell Inspiron 15 7000 7567 Gaming (i5-7300HQ, GTX 1050) Laptop Review
Gigabyte Sabre 15G: Intel Core i7-7700HQ, 15.60", 2.5 kg
Review » Gigabyte Sabre 15 (i7-7700HQ, GTX 1050) Laptop Review
HP Pavilion 15 Power 1GK62AV: Intel Core i7-7700HQ, 15.60", 2.4 kg
Review » HP Pavilion 15 Power (i7-7700HQ, GTX 1050) Laptop Review
MSI GL72 7RDX-602: Intel Core i7-7700HQ, 17.30", 3 kg
Review » MSI GL72 7RD-028 Laptop (Core i7, Full HD) Review
Lenovo Yoga 720-15IKB-80X7: Intel Core i7-7700HQ, 15.60", 2 kg
Review » Lenovo Yoga 720-15IKB (7700HQ, FHD, GTX 1050) Laptop Review
Acer Aspire VX15 VX5-591G-589S: Intel Core i5-7300HQ, 15.60", 2.5 kg
Review » Acer Aspire VX 15 VX5-591G (7300HQ, GTX 1050, Full HD) Laptop Review
Samsung Odyssey NP800G5M-X01US: Intel Core i7-7700HQ, 15.60", 2.5 kg
Review » Samsung Odyssey NP800G5M (7700HQ, FHD, GTX 1050) Laptop Review
Asus FX553VD-DM249T: Intel Core i7-7700HQ, 15.60", 2.4 kg
Review » Asus FX553VD (7700HQ, GTX 1050) Laptop Review
HP Pavilion 15t-bc200 X7P44AV: Intel Core i7-7700HQ, 15.60", 2.3 kg
Review » HP Pavilion 15t-bc200 X7P44AV (7700HQ, UHD, GTX 1050) Laptop Review
HP Pavilion 17t-ab200 UHD: Intel Core i7-7700HQ, 17.30", 3 kg
Review » HP Pavilion 17t (7700HQ, UHD, GTX 1050) Laptop Review
HP Pavilion 15t-X7P42AV: Intel Core i7-7700HQ, 15.60", 2.3 kg
Review » HP Pavilion 15t X7P44AV (7700HQ, FHD, GTX 1050) Laptop Review
Asus ROG Strix GL553VD-DS71: Intel Core i7-7700HQ, 15.60", 2.5 kg
Review » Asus ROG Strix GL553VD (7700HQ, FHD, GTX 1050) Laptop Review
Dell XPS 15 9560 (i7-7700HQ, UHD): Intel Core i7-7700HQ, 15.60", 2.1 kg
Review » Dell XPS 15 9560 (i7-7700HQ, UHD) Laptop Review
HP Pavilion 17t-ab200: Intel Core i7-7700HQ, 17.30", 3 kg
Review » HP Pavilion 17t-ab200 Notebook Review
Dell XPS 15 2017 9560 (7300HQ, Full-HD): Intel Core i5-7300HQ, 15.60", 2 kg
Review » Dell XPS 15 2017 9560 (7300HQ, Full-HD) Notebook Review
MSI GL62M 7RD-077: Intel Core i7-7700HQ, 15.60", 2.4 kg
Review » MSI GL62M 7RD-077 Notebook Review
Asus Strix GL753VD-GC045T: Intel Core i7-7700HQ, 17.30", 2.9 kg
Review » Asus ROG Strix GL753VD Notebook Review
Lenovo Ideapad L340 15IRH-81LK0150MH: Intel Core i5-9300HF, 15.60", 2.2 kg
External Review » Lenovo Ideapad L340 15IRH-81LK0150MH
HP Omen 15-ce000nd: Intel Core i5-7300HQ, 15.60", 2.6 kg
External Review » HP Omen 15-ce000nd
LG Ultra 15 15U70N: Intel Core i7-1065G7, 15.60", 1.9 kg
External Review » LG Ultra 15 15U70N
HP Pavilion Gaming 16-A0008NS: Intel Core i5-10300H, 16.10", 2.4 kg
External Review » HP Pavilion Gaming 16-A0008NS
HP Pavilion Gaming 16-A0023NS: Intel Core i5-10300H, 16.10", 2.4 kg
External Review » HP Pavilion Gaming 16-A0023NS
Asus D570DD-DM178: AMD Ryzen 7 3700U, 15.60", 2 kg
External Review » Asus D570DD-DM178
Lenovo ThinkPad T15p-20TN0005GE: Intel Core i7-10750H, 15.60", 2.1 kg
External Review » Lenovo ThinkPad T15p-20TN0005GE
HP Pavilion Gaming 15-ec1010ns: AMD Ryzen 5 4600H, 15.60", 2 kg
External Review » HP Pavilion Gaming 15-ec1010ns
HP Pavilion Gaming 16-a0005ns: Intel Core i5-10300H, 15.60", 2.4 kg
External Review » HP Pavilion Gaming 16-a0005ns
HP Pavilion Gaming 15-ec1008ns: AMD Ryzen 5 4600H, 15.60", 2 kg
External Review » HP Pavilion Gaming 15-ec1008ns
HP Pavilion Gaming 15-ec1001ns: AMD Ryzen 5 4600H, 15.60", 2 kg
External Review » HP Pavilion Gaming 15-ec1001ns
Asus TUF FX505GD-BQ137T: Intel Core i7-8750H, 15.60", 2.2 kg
External Review » Asus TUF FX505GD-BQ137T
Acer Aspire 7 A715-74G-71WS: Intel Core i7-9750H, 15.60", 2.4 kg
External Review » Acer Aspire 7 A715-74G-71WS
Acer Nitro 5 AN515-54-710E: Intel Core i7-9750H, 15.60", 2.5 kg
External Review » Acer Nitro 5 AN515-54-710E
HP Pavilion Gaming 15-ec0005ns: AMD Ryzen 5 3550H, 15.60", 2.3 kg
External Review » HP Pavilion Gaming 15-ec0005ns
HP Gaming Pavilion 15-dk0030ns: Intel Core i5-9300H, 15.60", 2.3 kg
External Review » HP Gaming Pavilion 15-dk0030ns
HP Pavilion Power 15-cb093nd: Intel Core i5-7300HQ, 15.60", 2.2 kg
External Review » HP Pavilion Power 15-cb093nd
HP Pavilion Gaming 15-ec0006ns: AMD Ryzen 5 3550H, 15.60", 2.3 kg
External Review » HP Pavilion Gaming 15-ec0006ns
Acer Aspire Nitro 5 AN515-54-52G3: Intel Core i5-9300H, 15.60", 2.5 kg
External Review » Acer Aspire Nitro 5 AN515-54-52G3
Asus M570DD-E4082T: AMD Ryzen 5 3500U, 15.60", 2 kg
External Review » Asus M570DD-E4082T
Lenovo Yoga 730-15IWL-81JS007VMH: Intel Core i7-8565U, 15.60", 1.9 kg
External Review » Lenovo Yoga 730-15IWL-81JS007VMH
HP Pavilion Gaming 15-dk0020ns: Intel Core i5-9300H, 15.60", 2.3 kg
External Review » HP Pavilion Gaming 15-dk0020ns
HP Pavilion Gaming 15-ec0009ns: AMD Ryzen 5 3550H, 15.60", 2 kg
External Review » HP Pavilion Gaming 15-ec0009ns
Asus VivoBook 15 K571GD-BQ215T: Intel Core i7-9750H, 15.60", 2.1 kg
External Review » Asus VivoBook 15 K571GD-BQ215T
Asus X571GD-BQ353: Intel Core i5-8300H, 15.60", 2 kg
External Review » Asus X571GD-BQ353
HP Pavilion 15-BC523NS: Intel Core i5-9300H, 15.60", 2.2 kg
External Review » HP Pavilion 15-BC523NS
Asus D570DD-E4028T: AMD Ryzen 5 3500U, 15.60", 2 kg
External Review » Asus D570DD-E4028T
HP Pavilion Gaming 15-CX0020NS: Intel Core i5-8300H, 15.60", 2.4 kg
External Review » HP Pavilion Gaming 15-CX0020NS
Lenovo Yoga 730-15IWL-81JS0009MX: Intel Core i5-8265U, 15.60", 1.9 kg
External Review » Lenovo Yoga 730-15IWL-81JS0009MX
HP Pavilion 15-BC519NS: Intel Core i5-9300H, 15.60", 2.1 kg
External Review » HP Pavilion 15-BC519NS
Lenovo Ideapad 330-15ICH-81FK00EHSP: Intel Core i7-8750H, 15.60", 2.2 kg
External Review » Lenovo Ideapad 330-15ICH-81FK00EHSP
Asus TUF FX505DD-BQ067: AMD Ryzen 7 3750H, 15.60", 2.2 kg
External Review » Asus TUF FX505DD-BQ067
Asus ZenBook 15 UX533FD-A8107T: Intel Core i7-8565U, 15.60", 1.7 kg
External Review » Asus ZenBook 15 UX533FD-A8107T
Asus F571GD-BQ409: Intel Core i5-8300H, 15.60", 1.8 kg
External Review » Asus F571GD-BQ409
HP Omen 15-DC0014NS: Intel Core i7-8750H, 15.60", 2.4 kg
External Review » HP Omen 15-DC0014NS
HP Pavilion 15-BC500NS: Intel Core i5-9300H, 15.60", 2.2 kg
External Review » HP Pavilion 15-BC500NS
HP Pavilion Gaming 15-cx0001ns: Intel Core i5-8300H, 15.60", 2.2 kg
External Review » HP Pavilion Gaming 15-cx0001ns
Asus Vivobook R560UD-EJ387: Intel Core i5-8250U, 15.60", 2 kg
External Review » Asus Vivobook R560UD-EJ387
HP Pavilion 15-BC416NS: Intel Core i5-8300H, 15.60", 2.2 kg
External Review » HP Pavilion 15-BC416NS
Acer Nitro 5 AN515-52-51P6: Intel Core i5-8300H, 15.60", 2.7 kg
External Review » Acer Nitro 5 AN515-52-51P6
Asus TUF FX504GD-EN1354: Intel Core i7-8750H, 15.60", 2.3 kg
External Review » Asus TUF FX504GD-EN1354
Dell Inspiron 15 7591, i7-9750H: Intel Core i7-9750H, 15.60", 1.9 kg
External Review » Dell Inspiron 15 7591, i7-9750H
Asus TUF FX504GD-EN421: Intel Core i7-8750H, 15.60", 2.3 kg
External Review » Asus TUF FX504GD-EN421
HP Pavilion Gaming 15-cx0004ns : Intel Core i7-8750H, 15.60", 2.2 kg
External Review » HP Pavilion Gaming 15-cx0004ns
Asus TUF FX505GD-BQ142: Intel Core i7-8750H, 15.60", 2.2 kg
External Review » Asus TUF FX505GD-BQ142
Acer Aspire 7 A715-72G-51XK: Intel Core i5-8300H, 15.60", 2.4 kg
External Review » Acer Aspire 7 A715-72G-51XK
Lenovo Ideapad L340-17IRH-81LL004SGE: Intel Core i5-9300H, 17.30", 2.8 kg
External Review » Lenovo Ideapad L340-17IRH-81LL004SGE
Lenovo Ideapad L340-15IRH-81LK00CKGE: Intel Core i5-9300H, 15.60", 2.2 kg
External Review » Lenovo Ideapad L340-15IRH-81LK00CKGE
Dell Inspiron 15 7591, i5-9300H: Intel Core i5-9300H, 15.60", 1.9 kg
External Review » Dell Inspiron 15 7591, i5-9300H
MSI GF63 9RC: Intel Core i5-9300H, 15.60", 1.9 kg
External Review » MSI GF63 9RC
Asus TUF FX504GD-EN561: Intel Core i7-8750H, 15.60", 2.3 kg
External Review » Asus TUF FX504GD-EN561
Asus TUF FX504GD-DM194: Intel Core i5-8300H, 15.60", 2.3 kg
External Review » Asus TUF FX504GD-DM194
HP Pavilion Gaming 15-ec0010nr: AMD Ryzen 5 3550H, 15.60", 2.3 kg
External Review » HP Pavilion Gaming 15-ec0010nr
Asus TUF FX505GD-BQ326T: Intel Core i7-8750H, 15.60", 2.2 kg
External Review » Asus TUF FX505GD-BQ326T
Asus ZenBook Pro 14 UX480FD-BE010T: Intel Core i7-8565U, 14.00", 1.6 kg
External Review » Asus ZenBook Pro 14 UX480FD-BE010T
Lenovo Legion Y530-81FV00QARU: Intel Core i7-8750H, 15.60", 2.3 kg
External Review » Lenovo Legion Y530-81FV00QARU
Acer Nitro 5 AN515-52-569N: Intel Core i5-8300H, 15.60", 2.7 kg
External Review » Acer Nitro 5 AN515-52-569N
HP Gaming Pavilion 15-cx0140tx: Intel Core i5-8300H, 15.60", 2.2 kg
External Review » HP Gaming Pavilion 15-cx0140tx
BTO Notebooks X-Book 14CL77: Intel Core i7-7700HQ, 14.00", 2 kg
External Review » BTO Notebooks X-Book 14CL77
Acer Spin 5 SP515-51GN-80A3: Intel Core i7-8550U, 15.60", 2.3 kg
External Review » Acer Spin 5 SP515-51GN-80A3
Asus TUF FX705GD-EW086: Intel Core i7-8750H, 17.30", 2.7 kg
External Review » Asus TUF FX705GD-EW086
MSI GF63 8RC-069ES: Intel Core i7-8750H, 15.60", 1.9 kg
External Review » MSI GF63 8RC-069ES
Lenovo IdeaPad 330-15ICH 81FK003XM: Intel Core i5-8300H, 15.60", 2.2 kg
External Review » Lenovo IdeaPad 330-15ICH 81FK003XM
HP OMEN 15-dc0004ns: Intel Core i5-8300H, 15.60", 2.4 kg
External Review » HP OMEN 15-dc0004ns
Lenovo Ideapad 330-15ICH-81FK00EJSP: Intel Core i7-8750H, 15.60", 2.2 kg
External Review » Lenovo Ideapad 330-15ICH-81FK00EJSP
Dell XPS 15 9560-3PHNV: Intel Core i7-7700HQ, 15.60", 1.9 kg
External Review » Dell XPS 15 9560-3PHNV
Asus TUF FX504GD-DM883: Intel Core i7-8750H, 15.60", 2.3 kg
External Review » Asus TUF FX504GD-DM883
MSI PS42 8RC-029ES: Intel Core i7-8550U, 14.00", 1.2 kg
External Review » MSI PS42 8RC-029ES
HP Pavilion 17-ab402ng: Intel Core i7-8750H, 17.30", 3.1 kg
External Review » HP Pavilion 17-ab402ng
MSI PS63 Modern 8RC-013ES: Intel Core i7-8565U, 15.60", 1.6 kg
External Review » MSI PS63 Modern 8RC-013ES
Lenovo Ideapad 330-17ICH-81FL008VGE: Intel Core i7-8750H, 17.30", 2.8 kg
External Review » Lenovo Ideapad 330-17ICH-81FL008VGE
Lenovo Ideapad 330-15ICH-81FK00EGSP: Intel Core i5-8300H, 15.60", 2.2 kg
External Review » Lenovo Ideapad 330-15ICH-81FK00EGSP
Lenovo IdeaPad 330-15ICH-81FK003YMH: Intel Core i5-8300H, 15.60", 2.2 kg
External Review » Lenovo IdeaPad 330-15ICH-81FK003YMH
Asus Vivobook R560UD-EJ362: Intel Core i5-8250U, 15.60", 2 kg
External Review » Asus Vivobook R560UD-EJ362
Asus Vivobook R570ZD-DM266: AMD Ryzen 5 2500U, 15.60", 1.9 kg
External Review » Asus Vivobook R570ZD-DM266
MSI GL63 8RC-679XES: Intel Core i7-8750H, 15.60", 2.2 kg
External Review » MSI GL63 8RC-679XES
Asus TUF FX505GD-BQ137: Intel Core i7-8750H, 15.60", 2.3 kg
External Review » Asus TUF FX505GD-BQ137
Medion Erazer P6605-MD61232: Intel Core i7-8750H, 15.60", 2.7 kg
External Review » Medion Erazer P6605-MD61232
Lenovo Yoga 730-15IKBR-81CU003WSP: Intel Core i7-8550U, 15.60", 1.9 kg
External Review » Lenovo Yoga 730-15IKBR-81CU003WSP
MSI GL63 8RC-644XES: Intel Core i7-8750H, 15.60", 2.2 kg
External Review » MSI GL63 8RC-644XES
MSI PS42 8RC-001ES: Intel Core i7-8550U, 14.00", 1.2 kg
External Review » MSI PS42 8RC-001ES
Asus Zenbook UX533FD-A9035T: Intel Core i5-8265U, 15.60", 1.6 kg
External Review » Asus Zenbook UX533FD-A9035T
Asus TUF FX504GD-DM030T : Intel Core i7-8750H, 15.60", 2.3 kg
External Review » Asus TUF FX504GD-DM030T
Asus ZenBook Pro 15 UX550GD-BN026T: Intel Core i7-8750H, 15.60", 1.9 kg
External Review » Asus ZenBook Pro 15 UX550GD-BN026T
Lenovo Ideapad 330-15ICH-81FK006YSP: Intel Core i7-8750H, 15.60", 2.2 kg
External Review » Lenovo Ideapad 330-15ICH-81FK006YSP
HP Pavilion 15-bc404ns: Intel Core i7-8550U, 15.60", 2.2 kg
External Review » HP Pavilion 15-bc404ns
Acer Aspire 7 A717-72G-534E: Intel Core i5-8300H, 17.30", 2.9 kg
External Review » Acer Aspire 7 A717-72G-534E
Asus TUF FX705GD-EW081T: Intel Core i5-8300H, 17.30", 2.6 kg
External Review » Asus TUF FX705GD-EW081T
Lenovo Ideapad 330-15ICH-81FK00A1SP: Intel Core i5-8300H, 15.60", 2.2 kg
External Review » Lenovo Ideapad 330-15ICH-81FK00A1SP
Lenovo Legion Y530-15ICH-81FV00E2SP: Intel Core i7-8750H, 15.60", 2.3 kg
External Review » Lenovo Legion Y530-15ICH-81FV00E2SP
Lenovo Ideapad 330-15ICH-81FK00ADGE: Intel Core i7-8750H, 15.60", 2.2 kg
External Review » Lenovo Ideapad 330-15ICH-81FK00ADGE
HP Pavilion 15-cx0013ns: Intel Core i5-8300H, 15.60", 2.3 kg
External Review » HP Pavilion 15-cx0013ns
Lenovo Ideapad 330-15ICH-81FK0071SP: Intel Core i5-8300H, 15.60", 2.2 kg
External Review » Lenovo Ideapad 330-15ICH-81FK0071SP
Asus TUF FX504GD-DM521T: Intel Core i5-8300H, 15.60", 2.3 kg
External Review » Asus TUF FX504GD-DM521T
Dell XPS 15 9570 CNX97001: Intel Core i5-8300H, 15.60", 2 kg
External Review » Dell XPS 15 9570 CNX97001
HP Pavilion 15-cs1001ns: Intel Core i7-8565U, 15.60", 1.9 kg
External Review » HP Pavilion 15-cs1001ns
Asus TUF FX505GD-BQ111: Intel Core i5-8300H, 15.60", 2.2 kg
External Review » Asus TUF FX505GD-BQ111
Lenovo Legion Y530-81FV00G0IX: Intel Core i5-8300H, 15.60", 2.3 kg
External Review » Lenovo Legion Y530-81FV00G0IX
HP Pavilion 15-cs1000ns: Intel Core i5-8265U, 15.60", 1.9 kg
External Review » HP Pavilion 15-cs1000ns
Dell G3 15 3579-CN35711: Intel Core i5-8300H, 15.60", 2.5 kg
External Review » Dell G3 15 3579-CN35711
MSI GF63 8RC-457XES: Intel Core i7-8750H, 15.60", 1.9 kg
External Review » MSI GF63 8RC-457XES
Lenovo Ideapad Y520-15IKBN-80WK0161SP: Intel Core i5-7300HQ, 15.60", 2.5 kg
External Review » Lenovo Ideapad Y520-15IKBN-80WK0161SP
HP OMEN 15-ce016ns: Intel Core i7-7700HQ, 15.60", 2.6 kg
External Review » HP OMEN 15-ce016ns
Asus FX504GD-DM473: Intel Core i7-8750H, 15.60", 2.3 kg
External Review » Asus FX504GD-DM473
Lenovo Ideapad 330-15ICH-81FK0072SP: Intel Core i7-8750H, 15.60", 2.2 kg
External Review » Lenovo Ideapad 330-15ICH-81FK0072SP
MSI GF63 8RC-230CH: Intel Core i7-8750H, 15.60", 1.9 kg
External Review » MSI GF63 8RC-230CH
Dell XPS 15 9575-Y4H2V: Intel Core i7-8750H, 15.60", 2 kg
External Review » Dell XPS 15 9575-Y4H2V
Asus GL753VD-GC184T: Intel Core i7-7700HQ, 17.30", 2.8 kg
External Review » Asus GL753VD-GC184T
Asus ZenBook Pro 15 UX550GD-BN015T: Intel Core i7-8750H, 15.60", 1.9 kg
External Review » Asus ZenBook Pro 15 UX550GD-BN015T
Medion Erazer P6605-MD61174: Intel Core i5-8300H, 15.60", 2.7 kg
External Review » Medion Erazer P6605-MD61174
Lenovo Legion Y530-15ICH-81FV00GEMH: Intel Core i5-8300H, 15.60", 2.3 kg
External Review » Lenovo Legion Y530-15ICH-81FV00GEMH
HP Omen 17-an100nw: Intel Core i5-8300H, 17.30", 3.8 kg
External Review » HP Omen 17-an100nw
Acer Nitro 5 AN515-52-5336: Intel Core i5-8300H, 15.60", 2.7 kg
External Review » Acer Nitro 5 AN515-52-5336
HP Omen 15-ax201ns: Intel Core i7-7700HQ, 15.60", 2.2 kg
External Review » HP OMEN 15-ax201ns
Lenovo Yoga 730-15IKB-81CU003EMH: Intel Core i7-8550U, 15.60", 1.9 kg
External Review » Lenovo Yoga 730-15IKB-81CU003EMH
Lenovo Legion Y530-81FV008VFR: Intel Core i5-8300H, 15.60", 2.3 kg
External Review » Lenovo Legion Y530-81FV008VFR
Lenovo Legion Y530-15ICH-81FV00G6GE: Intel Core i5-8300H, 15.60", 2.3 kg
External Review » Lenovo Legion Y530-15ICH-81FV00G6GE
Lenovo Legion Y530-81FV0018CK: Intel Core i5-8300H, 15.60", 2.3 kg
External Review » Lenovo Legion Y530-81FV0018CK
MSI GL63 8RC-255CZ: Intel Core i5-8300H, 15.60", 2.2 kg
External Review » MSI GL63 8RC-255CZ
Lenovo Ideapad 330-15ICH-81FK006WSP: Intel Core i5-8300H, 15.60", 2.2 kg
External Review » Lenovo Ideapad 330-15ICH-81FK006WSP
MSI GV62 8RC-012XES: Intel Core i7-8750H, 15.60", 2.2 kg
External Review » MSI GV62 8RC-012XES
Lenovo IdeaPad 330-17ICH-81FL000CGE: Intel Core i5-8300H, 17.30", 2.8 kg
External Review » Lenovo IdeaPad 330-17ICH-81FL000CGE
Medion Erazer P6689-MD61021: Intel Core i7-8550U, 15.60", 2.3 kg
External Review » Medion Erazer P6689-MD61021
HP Pavilion 15-BC400NS: Intel Core i5-8250U, 15.60", 2.2 kg
External Review » HP Pavilion 15-BC400NS
Acer Nitro 5 Spin NP515-51-86CX: Intel Core i7-8550U, 15.60", 2.2 kg
External Review » Acer Nitro 5 Spin NP515-51-86CX
Asus VivoBook Pro 17 N705UD-EH76: Intel Core i7-8550U, 17.30", 2.3 kg
External Review » Asus VivoBook Pro 17 N705UD-EH76
Asus Vivobook Pro N580GD-E4189T: Intel Core i7-8750H, 15.60", 2 kg
External Review » Asus Vivobook Pro N580GD-E4189T
Asus Vivobook R570ZD-DM107: Intel Core i7-8750H, 15.60", 2 kg
External Review » Asus Vivobook R570ZD-DM107
Lenovo Legion Y530-15ICH-81FV0013US: Intel Core i5-8300H, 15.60", 2.3 kg
External Review » Lenovo Legion Y530-15ICH-81FV0013US
HP EliteBook 1050 G1-4QY21EA: Intel Core i7-8750H, 15.60", 2.1 kg
External Review » HP EliteBook 1050 G1-4QY21EA
Asus ZenBook Pro 15 UX550GD: Intel Core i7-8750H, 15.60", 1.9 kg
External Review » Asus ZenBook Pro 15 UX550GD
Asus K560UD-BQ183T: Intel Core i5-8250U, 15.60", 2 kg
External Review » Asus K560UD-BQ183T
Asus VivoBook 15 X570ZD: AMD Ryzen 5 2500U, 15.60", 2 kg
External Review » Asus X570ZD
Asus F560UD: Intel Core i5-8250U, 15.60", 2 kg
External Review » Asus F560UD
Lenovo Yoga 730-15IKB-81CU0043GE: Intel Core i5-8250U, 15.60", 1.9 kg
External Review » Lenovo Yoga 730-15IKB-81CU0043GE
Asus TUF FX504GD-EN579T: Intel Core i7-8750H, 15.60", 2.3 kg
External Review » Asus TUF FX504GD-EN579T
Lenovo Legion Y530-15ICH-81FV00GFMH: Intel Core i7-8750H, 15.60", 2.3 kg
External Review » Lenovo Legion Y530-15ICH-81FV00GFMH
Asus ZenBook Pro 14 UX480FD-BE027T: Intel Core i7-8565U, 14.10", 1.6 kg
External Review » Asus ZenBook Pro 14 UX480FD-BE027T
Asus VivoBook 15 X570UD: Intel Core i7-8550U, 15.60", 1.9 kg
External Review » Asus VivoBook 15 X570UD
HP Omen 15-dc0002ns: Intel Core i5-8300H, 15.60", 2.4 kg
External Review » HP Omen 15-dc0002ns
MSI GL72M 7RDX-1006XES: Intel Core i7-7700HQ, 17.30", 2.7 kg
External Review » MSI GL72M 7RDX-1006XES
Dell G3 17 3779: Intel Core i5-8300H, 17.30", 3 kg
External Review » Dell G3 17 3779
Acer Aspire 7 A715-72G-75AN: Intel Core i7-8750H, 15.60", 2.4 kg
External Review » Acer Aspire 7 A715-72G-75AN
Acer Aspire Nitro 5 AN515-52-51T2: Intel Core i5-8300H, 15.60", 2.7 kg
External Review » Acer Aspire Nitro 5 AN515-52-51T2
Asus Zenbook Pro 15 UX580GD-E2006T: Intel Core i7-8750H, 15.60", 1.9 kg
External Review » Asus Zenbook Pro 15 UX580GD-E2006T
Acer Aspire 7 A715-72G-57R2: Intel Core i5-8300H, 15.60", 2.4 kg
External Review » Acer Aspire 7 A715-72G-57R2
MSI GL63 8RC-069US: Intel Core i5-8300H, 15.60", 2.2 kg
External Review » MSI GL63 8RC-069US
HP Pavilion 15-bc451ns: Intel Core i7-8750H, 15.60", 2.2 kg
External Review » HP Pavilion 15-bc451ns
HP Pavilion 15-bc450ns: Intel Core i5-8300H, 15.60", 2.2 kg
External Review » HP Pavilion 15-bc450ns
Acer Aspire Nitro 5 AN515-52-76N6: Intel Core i7-8750H, 15.60", 2.7 kg
External Review » Acer Aspire Nitro 5 AN515-52-76N6
Acer Aspire 7 A717-72G-7600: Intel Core i7-8750H, 17.30", 3 kg
External Review » Acer Aspire 7 A717-72G-7600
Lenovo Ideapad Y520-15IKBN-80WK016RSP: Intel Core i7-7700HQ, 15.60", 2.5 kg
External Review » Lenovo Ideapad Y520-15IKBN-80WK016RSP
Lenovo Ideapad Y520-15IKBN-80WK016ESP: Intel Core i5-7300HQ, 15.60", 2.5 kg
External Review » Lenovo Ideapad Y520-15IKBN-80WK016ESP
HP Pavilion 15-cx001nl: Intel Core i7-8750H, 15.60", 2.6 kg
External Review » HP Pavilion 15-cx001nl
MSI Leopard GP72M 7RDX-1493ES: Intel Core i7-7700HQ, 17.30", 2.7 kg
External Review » MSI Leopard GP72M 7RDX-1493ES
Acer Aspire VX5-591G-73J6: Intel Core i7-7700HQ, 15.60", 2.5 kg
External Review » Acer Aspire VX5-591G-73J6
Asus ZenBook Flip 15 UX561UD-E2029T: Intel Core i7-8550U, 15.60", 2.1 kg
External Review » Asus ZenBook Flip 15 UX561UD-E2029T
Asus FX504GD: Intel Core i5-8300H, 15.60", 2.3 kg
External Review » Asus FX504GD
HP EliteBook 1050 G1-4NC55UT: Intel Core i7-8750H, 15.60", 2.1 kg
External Review » HP EliteBook 1050 G1-4NC55UT
Asus TUF FX504GD-ES51: Intel Core i5-8300H, 15.60", 2.3 kg
External Review » Asus TUF FX504GD-ES51
Acer Nitro 5 AN515-53-52FA: Intel Core i5-8300H, 15.60", 2.3 kg
External Review » Acer Nitro 5 AN515-53-52FA
Acer Aspire 7 A715-72G-517N: Intel Core i5-8300H, 15.60", 2.4 kg
External Review » Acer Aspire 7 A715-72G-517N
Acer Aspire Nitro 5 AN515-52-58R5: Intel Core i5-8300H, 15.60", 2.3 kg
External Review » Acer Aspire Nitro 5 AN515-52-58R5
HP Omen 15-dc0005NS: Intel Core i7-8750H, 15.60", 2.4 kg
External Review » HP Omen 15-DC0005NS
Lenovo Yoga 720-15IKB-80X7006VSP: Intel Core i7-7700HQ, 15.60", 2 kg
External Review » Lenovo Yoga 720-15IKB-80X7006VSP
HP Pavilion 15-cx0002NS: Intel Core i5-8300H, 15.60", 2.2 kg
External Review » HP Pavilion 15-CX0002NS
MSI GV62M 7RD-1686NL: Intel Core i5-7300HQ, 15.60", 2.2 kg
External Review » MSI GV62M 7RD-1686NL
Acer Aspire 7 A717-71G-73EB: Intel Core i7-7700HQ, 17.30", 2.9 kg
External Review » Acer Aspire 7 A717-71G-73EB
Dell G3 15 3579: Intel Core i5-8300H, 15.60", 2.5 kg
External Review » Dell G3 15 3579
Acer Aspire 7 A715-71G-53TU: Intel Core i5-7300HQ, 15.60", 2.4 kg
External Review » Acer Aspire 7 A715-71G-53TU
Asus TUF FX504GD-E4075: Intel Core i7-8750H, 15.60", 2.3 kg
External Review » Asus TUF FX504GD-E4075
Lenovo Yoga 730-15IKB: Intel Core i7-8550U, 15.60", 1.9 kg
External Review » Lenovo Yoga 730-15IKB
Lenovo IdeaPad Y520-15IKB-80WK00YYSP: Intel Core i7-7700HQ, 15.60", 2.5 kg
External Review » Lenovo IdeaPad Y520-15IKB-80WK00YYSP
HP Pavilion 15-bc401ns: Intel Core i5-8250U, 15.60", 2.2 kg
External Review » HP Pavilion 15-bc401ns
HP Pavilion Power 15-cb005ns : Intel Core i7-7700HQ, 15.60", 2.2 kg
External Review » HP Pavilion Power 15-cb005ns
HP Omen 17-an026ns: Intel Core i7-7700HQ, 17.30", 3.8 kg
External Review » HP Omen 17-an026ns
Medion Erazer P6689-MD61020: Intel Core i5-8250U, 15.60", 2.3 kg
External Review » Medion Erazer P6689-MD61020
Acer Aspire Nitro 5 AN515-51-56UX: Intel Core i5-7300HQ, 15.60", 2.7 kg
External Review » Acer Aspire Nitro 5 AN515-51-56UX
Dell XPS 15 2018 i5 FHD 97Wh: Intel Core i5-8300H, 15.60", 1.9 kg
External Review » Dell XPS 15 2018 i5 FHD 97Wh
MSI PE62 7RD-1814XES: Intel Core i7-7700HQ, 15.60", 2.2 kg
External Review » MSI PE62 7RD-1814XES
HP Pavilion Power 15-cb015ns: Intel Core i5-7300HQ, 15.60", 2.2 kg
External Review » HP Pavilion Power 15-cb015ns
MSI GL63 8RC-015XES: Intel Core i7-8750H, 15.60", 2.2 kg
External Review » MSI GL63 8RC-015XES
MSI GP62M Leopard 7RDX-1809ES: Intel Core i7-7700HQ, 15.60", 2.2 kg
External Review » MSI GP62M Leopard 7RDX-1809ES
Asus ZenBook Flip UX561UD-BO033T: Intel Core i7-8550U, 15.60", 2.1 kg
External Review » Asus ZenBook Flip UX561UD-BO033T
Acer Nitro 5 AN515-51-57RG: Intel Core i5-7300HQ, 15.60", 2.7 kg
External Review » Acer Nitro 5 AN515-51-57RG
HP Pavilion Power 15-cb001nd: Intel Core i5-7300HQ, 15.60", 2.2 kg
External Review » HP Pavilion Power 15-cb001nd
Acer Aspire 7 A717-72G-71PM: Intel Core i7-8750H, 17.30", 3 kg
External Review » Acer Aspire 7 A717-72G-71PM
MSI GF63 8RC: Intel Core i5-8300H, 15.60", 1.9 kg
External Review » MSI GF63 8RC
Medion Erazer P7651: Intel Core i5-8250U, 17.30", 2.7 kg
External Review » Medion Erazer P7651
Acer Aspire VX5-591G-70AD: Intel Core i7-7700HQ, 15.60", 2.5 kg
External Review » Acer Aspire VX5-591G-70AD
Asus FX753VD-GC384T: Intel Core i5-7300HQ, 17.30", 2.8 kg
External Review » Asus FX753VD-GC384T
Asus ZenBook Flip 15 UX561UD: Intel Core i7-8550U, 15.60", 2.1 kg
External Review » Asus ZenBook Flip 15 UX561UD
Acer Nitro 5 Spin NP515-51-53DZ: Intel Core i5-8250U, 15.60", 2.2 kg
External Review » Acer Nitro 5 Spin NP515-51-53DZ
Dell XPS 15 9560-F5WWG: Intel Core i7-7700HQ, 15.60", 1.9 kg
External Review » Dell XPS 15 9560-F5WWG
Asus FX503VD-E4082T: Intel Core i7-7700HQ, 15.60", 2.6 kg
External Review » Asus FX503VD-E4082T
Asus FX570UD: Intel Core i7-8550U, 15.60", 2 kg
External Review » Asus FX570UD
Asus GL503VD-FY005: Intel Core i5-7300HQ, 15.60", 2.5 kg
External Review » Asus GL503VD-FY005
Asus FX570: Intel Core i7-8550U, 15.60", 1.9 kg
External Review » Asus FX570
Lenovo Yoga 730-15: Intel Core i7-8550U, 15.60", 1.9 kg
External Review » Lenovo Yoga 730-15
Asus FX503VD-E4035T: Intel Core i7-7700HQ, 15.60", 2.2 kg
External Review » Asus FX503VD-E4035T
Asus VivoBook Pro 17 N705UD-GC106T: Intel Core i7-8550U, 17.30", 2.4 kg
External Review » Asus VivoBook Pro 17 N705UD-GC106T
Acer Nitro 5 AN515-51-75FR: Intel Core i7-7700HQ, 15.60", 2.7 kg
External Review » Acer Nitro 5 AN515-51-75FR
MSI GL62M 7RD-223CN: Intel Core i7-7700HQ, 15.60", 2.3 kg
External Review » MSI GL62M 7RD-223CN
Asus GL753VD-GC011: Intel Core i7-7700HQ, 17.30", 3 kg
External Review » Asus GL753VD-GC011
MSI GS63 7RD-076NL: Intel Core i7-7700HQ, 15.60", 1.8 kg
External Review » MSI GS63 7RD-076NL
Asus GL703VD-WB71: Intel Core i7-7700HQ, 17.30", 3 kg
External Review » Asus GL703VD-WB71
Acer Aspire 7 A717-71G-549R: Intel Core i5-7300HQ, 17.30", 2.9 kg
External Review » Acer Aspire 7 A717-71G-549R
Acer Nitro 5 A515-51-51A1: Intel Core i5-7300HQ, 15.60", 2.7 kg
External Review » Acer Nitro 5 A515-51-51A1
MSI GL62M 7RDX-2203XES: Intel Core i5-7300HQ, 15.60", 2.2 kg
External Review » MSI GL62M 7RDX-2203XES
MSI GL62M 7REX-2202XES: Intel Core i5-7300HQ, 15.60", 2.2 kg
External Review » MSI GL62M 7REX-2202XES
Lenovo Yoga 720-15IKB-80X70047CK: Intel Core i5-7300HQ, 15.60", 2 kg
External Review » Lenovo Yoga 720-15IKB-80X70047CK
Acer Nitro 5 Spin NP515-51-81PH: Intel Core i7-8550U, 15.60", 2.2 kg
External Review » Acer Nitro 5 Spin NP515-51-81PH
MSI GL62M 7RD-609XTR: Intel Core i5-7300HQ, 15.60", 2.2 kg
External Review » MSI GL62M 7RD-609XTR
HP Omen 15-ce003nl: Intel Core i7-7700HQ, 15.60", 2.6 kg
External Review » HP Omen 15-ce003nl
MSI PE72 7RD-1040XES: Intel Core i7-7700HQ, 17.30", 2.7 kg
External Review » MSI PE72 7RD-1040XES
MSI GV62 7RD-1811ES: Intel Core i7-7700HQ, 15.60", 2.2 kg
External Review » MSI GV62 7RD-1811ES
HP Pavilion Power 15-cb012ns: Intel Core i7-7700HQ, 15.60", 2.2 kg
External Review » HP Pavilion Power 15-cb012ns
MSI GS63VR 7RD-092NL: Intel Core i7-7700HQ, 15.60", 1.8 kg
External Review » MSI GS63VR 7RD-092NL
Asus GL553VD-DM067T: Intel Core i7-7700HQ, 15.60", 2.5 kg
External Review » Asus GL553VD-DM067T
Lenovo Ideapad Y520-15IKBN-80WK00GXSP: Intel Core i7-7700HQ, 15.60", 2.5 kg
External Review » Lenovo Ideapad Y520-15IKBN-80WK00GXSP
Medion Erazer P6689-MD60911: Intel Core i7-8550U, 15.60", 2.4 kg
External Review » Medion Erazer P6689-MD60911
HP Omen 15-ce085tx: Intel Core i7-7700HQ, 15.60", 2.6 kg
External Review » HP Omen 15-ce085tx
Asus VivoBook Pro 15 N580VD-DM028T: Intel Core i7-7700HQ, 15.60", 2 kg
External Review » Asus VivoBook Pro 15 N580VD-DM028T
Asus GL503VD Hero Edition: Intel Core i7-7700HQ, 15.60", 2.3 kg
External Review » Asus GL503VD Hero Edition
Asus ZX53VD7700-158BSHQ2X11: Intel Core i7-7700HQ, 15.60", 2.5 kg
External Review » Asus ZX53VD7700-158BSHQ2X11
HP Pavilion Power 15t-1GK62AV: Intel Core i5-7300HQ, 15.60", 2.2 kg
External Review » HP Pavilion Power 15t-1GK62AV
Asus Strix GL503VD-FY126T: Intel Core i7-7700HQ, 15.60", 2.5 kg
External Review » Asus Strix GL503VD-FY126T
Asus FX503VD-EH73: Intel Core i7-7700HQ, 15.60", 2.2 kg
External Review » Asus FX503VD-EH73
Asus GL553VD-DM078T: Intel Core i7-7700HQ, 15.60", 2.5 kg
External Review » Asus GL553VD-DM078T
Asus Strix GL753VD-GC387T: Intel Core i7-7700HQ, 17.30", 2.8 kg
External Review » Asus Strix GL753VD-GC387T
Acer Aspire 7 A715-71G-79BN: Intel Core i7-7700HQ, 15.60", 2.4 kg
External Review » Acer Aspire 7 A715-71G-79BN
Asus GL503VD-DB74: Intel Core i7-7700HQ, 15.60", 2.2 kg
External Review » Asus GL503VD-DB74
Asus ZenBook Pro UX550VD-BN205T: Intel Core i5-7300HQ, 15.60", 1.8 kg
External Review » Asus ZenBook Pro UX550VD-BN205T
Acer Aspire Spin 5 SP515-51GN-82SS: Intel Core i7-8550U, 15.60", 2.3 kg
External Review » Acer Aspire Spin 5 SP515-51GN-82SS
HP Pavilion Power 15-cb012na: Intel Core i7-7700HQ, 15.60", 2.4 kg
External Review » HP Pavilion Power 15-cb012na
Lenovo IdeaPad Y520-15IKBN-80WK00YXSP: Intel Core i5-7300HQ, 15.60", 2.5 kg
External Review » Lenovo IdeaPad Y520-15IKBN-80WK00YXSP
Medion Erazer P6681: Intel Core i5-7200U, 15.60", 2.3 kg
External Review » Medion Erazer P6681
Asus ZenBook Pro UX550VD-BN032T: Intel Core i7-7700HQ, 15.60", 1.8 kg
External Review » Asus ZenBook Pro UX550VD-BN032T
Lenovo Yoga 720-15IKB-80X7001WUS: Intel Core i7-7700HQ, 15.60", 2 kg
External Review » Lenovo Yoga 720-15IKB-80X7001WUS
Lenovo Ideapad Y520-15IKBN-80WK00WNSP: Intel Core i7-7700HQ, 15.60", 2.5 kg
External Review » Lenovo Ideapad Y520-15IKBN-80WK00WNSP
Asus Vivobook Pro N580VD-DM471T: Intel Core i7-7700HQ, 15.60", 2 kg
External Review » Asus Vivobook Pro N580VD-DM471T
Asus Strix GL503VD-DB71: Intel Core i7-7700HQ, 15.60", 2.2 kg
External Review » Asus Strix GL503VD-DB71
Asus VivoBook Pro 15 N580VD-DB74T: Intel Core i7-7700HQ, 15.60", 2 kg
External Review » Asus VivoBook Pro 15 N580VD-DB74T
HP Pavilion Power 15-cb052tx: Intel Core i7-7700HQ, 15.60", 2.2 kg
External Review » HP Pavilion Power 15-cb052tx
HP OMEN 15-ce026ns: Intel Core i5-7300HQ, 15.60", 2.6 kg
External Review » HP OMEN 15-ce026ns
HP OMEN 15-ce015ns: Intel Core i7-7700HQ, 15.60", 2.6 kg
External Review » HP OMEN 15-ce015ns
MSI GP62M 7RDX-1263NL: Intel Core i7-7700HQ, 15.60", 2.2 kg
External Review » MSI GP62M 7RDX-1263NL
Lenovo Legion Y520-15IKBN-80WK00V9SP: Intel Core i5-7300HQ, 15.60", 2.4 kg
External Review » Lenovo Legion Y520-15IKBN-80WK00V9SP
Microsoft Surface Book 2: Intel Core i7-8650U, 13.50", 1.6 kg
External Review » Microsoft Surface Book 2
HP Pavilion Power 15-CB018UR: Intel Core i7-7700HQ, 15.60", 2.2 kg
External Review » HP Pavilion Power 15-CB018UR
HP Pavilion Power 15-cb000ns: Intel Core i5-7300HQ, 15.60", 2.2 kg
External Review » HP Pavilion Power 15-cb000ns
Medion Akoya P6689: Intel Core i5-8250U, 15.60", 2.2 kg
External Review » Medion Akoya P6689
HP Pavilion Power 15-cb091nd: Intel Core i7-7700HQ, 15.60", 2.2 kg
External Review » HP Pavilion Power 15-cb091nd
Asus Strix GL703VD-GC029T: Intel Core i7-7700HQ, 17.30", 2.9 kg
External Review » Asus Strix GL703VD-GC029T
MSI PE72 7RD-842XRU: Intel Core i5-7300HQ, 17.30", 2.7 kg
External Review » MSI PE72 7RD-842XRU
Acer Aspire VX5-591G-54FT: Intel Core i5-7300HQ, 15.60", 2.5 kg
External Review » Acer Aspire VX5-591G-54FT
Acer Aspire 7 A715-71G-76Z5: Intel Core i7-7700HQ, 15.60", 2.4 kg
External Review » Acer Aspire 7 A715-71G-76Z5
Acer Aspire 7 A715-71G-56BD: Intel Core i5-7300HQ, 15.60", 2.4 kg
External Review » Acer Aspire 7 A715-71G-56BD
HP Pavilion Power 15-cb012no: Intel Core i7-7700HQ, 15.60", 2.2 kg
External Review » HP Pavilion Power 15-cb012no
HP Omen 15-ce008nw: Intel Core i5-7300HQ, 15.60", 2.6 kg
External Review » HP Omen 15-ce008nw
HP Pavilion Power 15-cb036ns: Intel Core i7-7700HQ, 15.60", 2.2 kg
External Review » HP Pavilion Power 15-cb036ns
HP OMEN 15-ce019ns: Intel Core i5-7300HQ, 15.60", 2.6 kg
External Review » HP OMEN 15-ce019ns
HP OMEN 15-ce020ns: Intel Core i7-7700HQ, 15.60", 2.6 kg
External Review » HP OMEN 15-ce020ns
HP OMEN 15-ce012ns: Intel Core i5-7300HQ, 15.60", 2.6 kg
External Review » HP OMEN 15-ce012ns
Acer Aspire VX5-591G-587: Intel Core i5-7300HQ, 15.60", 2.5 kg
External Review » Acer Aspire VX5-591G-587
Acer Aspire VX5-591G-50E: Intel Core i5-7300HQ, 15.60", 2.5 kg
External Review » Acer Aspire VX5-591G-50E
MSI PL60 7RD-022GB: Intel Core i7-7500U, 15.60", 2.2 kg
External Review » MSI PL60 7RD-022GB
Dell XPS 15 9560-8951: Intel Core i5-7300HQ, 15.60", 1.8 kg
External Review » Dell XPS 15 9560-8951
Asus Zenbook Pro UX550VD-BN073T: Intel Core i7-7700HQ, 15.60", 1.8 kg
External Review » Asus Zenbook Pro UX550VD-BN073T
MSI GL62M 7RDX-1655XES: Intel Core i7-7700HQ, 15.60", 2.2 kg
External Review » MSI GL62M 7RDX-1655XES
Dell XPS 15 9560-15187550: Intel Core i7-7700HQ, 15.60", 2 kg
External Review » Dell XPS 15 9560-15187550
Acer Aspire 7 A715-71G-52XK: Intel Core i5-7300HQ, 15.60", 2.4 kg
External Review » Acer Aspire 7 A715-71G-52XK
Asus ZenBook Pro UX550VD-BN0: Intel Core i7-7700HQ, 15.60", 1.8 kg
External Review » Asus ZenBook Pro UX550VD-BN0
Asus ZenBook Pro UX550VD-BN005T: Intel Core i7-7700HQ, 15.60", 1.8 kg
External Review » Asus ZenBook Pro UX550VD-BN005T
Asus Strix GL553VD-DM535T: Intel Core i7-7700HQ, 15.60", 2.5 kg
External Review » Asus Strix GL553VD-DM535T
Asus R510VX-DM533T: Intel Core i7-7700HQ, 15.60", 2.5 kg
External Review » Asus R510VX-DM533T
Asus GL553VD-FY073T: Intel Core i5-7300HQ, 15.60", 2.5 kg
External Review » Asus GL553VD-FY073T
Acer Aspire Nitro 5 AN515-51-50WJ: Intel Core i5-7300HQ, 15.60", 2.7 kg
External Review » Acer Aspire Nitro 5 AN515-51-50WJ
Asus ZenBook Pro UX550VD-BN020T: Intel Core i7-7700HQ, 15.60", 1.9 kg
External Review » Asus ZenBook Pro UX550VD-BN020T
Acer Aspire Nitro 5 AN515-51-54YF: Intel Core i5-7300HQ, 15.60", 2.7 kg
External Review » Acer Aspire Nitro 5 AN515-51-54YF
Asus Zenbook Pro UX550VD-90NB0ET1-M01310: Intel Core i5-7300HQ, 15.60", 1.8 kg
External Review » Asus Zenbook Pro UX550VD-90NB0ET1-M01310
Acer Nitro 5 Spin: Intel Core i7-8550U, 15.60", 2.2 kg
External Review » Acer Nitro 5 Spin
MSI GS73 7RE-017XES: Intel Core i7-7700HQ, 17.30", 2.4 kg
External Review » MSI GS73 7RE-017XES
HP Pavilion Power 15-cb009ns: Intel Core i7-7700HQ, 15.60", 2.2 kg
External Review » HP Pavilion Power 15-cb009ns
MSI GE62 7RE-213ES: Intel Core i7-7700HQ, 15.60", 2.4 kg
External Review » MSI GE62 7RE-213ES
Asus VivoBook Pro 15 N580VD-E4380R: Intel Core i5-7300HQ, 15.60", 2.3 kg
External Review » Asus VivoBook Pro 15 N580VD-E4380R
Asus FX553VD-90NB0DW4-M05730: Intel Core i7-7700HQ, 15.60", 2.5 kg
External Review » Asus FX553VD-90NB0DW4-M05730
Asus GL553VD-DM468T: Intel Core i7-7700HQ, 15.60", 2.5 kg
External Review » Asus GL553VD-DM468T
Asus Strix GL753VD-GC041T: Intel Core i7-7700HQ, 17.30", 2.8 kg
External Review » Asus Strix GL753VD-GC041T
HP Omen 15-ce008ns : Intel Core i7-7700HQ, 15.60", 2.6 kg
External Review » HP Omen 15-ce008ns
HP Omen 15-ce004ns: Intel Core i5-7300HQ, 15.60", 2.6 kg
External Review » HP Omen 15-ce004ns
HP Pavilion 17-ab203ur: Intel Core i7-7700HQ, 17.30", 2.9 kg
External Review » HP Pavilion 17-ab203ur
HP Pavilion Power 15-cb061nd: Intel Core i7-7700HQ, 15.60", 2.2 kg
External Review » HP Pavilion Power 15-cb061nd
Asus VivoBook Pro 15 N580VD-DM194T: Intel Core i5-7300HQ, 15.60", 2 kg
External Review » Asus VivoBook Pro 15 N580VD-DM194T
Asus GL553VD-DM666T: Intel Core i7-7700HQ, 15.60", 2.5 kg
External Review » Asus GL553VD-DM666T
Asus NX580VD: Intel Core i7-7700HQ, 15.60", 2.2 kg
External Review » Asus NX580VD
MSI GL72M 7RDX-680XES: Intel Core i7-7700HQ, 17.30", 2.7 kg
External Review » MSI GL72M 7RDX-680XES
Gigabyte Sabre 15G: Intel Core i7-7700HQ, 15.60", 2.5 kg
External Review » Gigabyte Sabre 15G
Acer Aspire VX5-591G-78F: Intel Core i7-7700HQ, 15.60", 2.5 kg
External Review » Acer Aspire VX5-591G-78F
HP Pavilion Power 15-cb033ns: Intel Core i7-7700HQ, 15.60", 2.2 kg
External Review » HP Pavilion Power 15-cb033ns
HP Pavilion Power 15-cb032ns: Intel Core i7-7700HQ, 15.60", 2.2 kg
External Review » HP Pavilion Power 15-cb032ns
MSI GL62M 7RD-204NL: Intel Core i7-7700HQ, 15.60", 2.2 kg
External Review » MSI GL62M 7RD-204NL
Dell XPS 15 9560-NGG9X: Intel Core i7-7700HQ, 15.60", 1.8 kg
External Review » Dell XPS 15 9560-NGG9X
Lenovo Legion Y520-15-80WK005QMH: Intel Core i7-7700HQ, 15.60", 2.4 kg
External Review » Lenovo Legion Y520-15-80WK005QMH
Acer Aspire VX5-591G-7502: Intel Core i7-7700HQ, 15.60", 2.5 kg
External Review » Acer Aspire VX5-591G-7502
Dell Inspiron 15 7567-4414: Intel Core i5-7300HQ, 15.60", 2.8 kg
External Review » Dell Inspiron 15-7567-4414
MSI GP62 7RDX Leopard: Intel Core i7-7700HQ, 15.60", 2.4 kg
External Review » MSI GP62 7RDX Leopard
HP Pavilion Power 15-cb040nd: Intel Core i7-7700HQ, 15.60", 2.2 kg
External Review » HP Pavilion Power 15-cb040nd
MSI GP62M 7RD-014NL: Intel Core i7-7700HQ, 15.60", 2.2 kg
External Review » MSI GP62M 7RD-014NL
Lenovo Ideapad Y520-15IKBN-80WK00FXSP: Intel Core i7-7700HQ, 15.60", 2.5 kg
External Review » Lenovo Ideapad Y520-15IKBN-80WK00FXSP
Asus GL553VD-DM470: Intel Core i5-7300HQ, 15.60", 2.5 kg
External Review » Asus GL553VD-DM470
Acer Aspire VX5-591G-57XN: Intel Core i5-7300HQ, 15.60", 2.5 kg
External Review » Acer Aspire VX5-591G-57XN
MSI GP62M 7RDX (WOT Edition) -1276GB: Intel Core i7-7700HQ, 15.60", 2.2 kg
External Review » MSI GP62M 7RDX (WOT Edition) -1276GB
Acer Aspire 7 A715-71G-74QK: Intel Core i7-7700HQ, 15.60", 2.4 kg
External Review » Acer Aspire 7 A715-71G-74QK
Lenovo Yoga 720-15IKB-80X70043GE: Intel Core i7-7700HQ, 15.60", 2 kg
External Review » Lenovo Yoga 720-15IKB-80X70043GE
Gigabyte P34G v7: Intel Core i7-7700HQ, 14.00", 1.7 kg
External Review » Gigabyte P34G v7
HP Pavilion Power 15-cb075tx: Intel Core i7-7700HQ, 15.60", 2.2 kg
External Review » HP Pavilion Power 15-cb075tx
MSI PE70 7RD-644XES: Intel Core i7-7700HQ, 17.30", 2.7 kg
External Review » MSI PE70 7RD-644XES
MSI GP72 7RDX-488XRU Leopard: Intel Core i7-7700HQ, 17.30", 2.7 kg
External Review » MSI GP72 7RDX-488XRU Leopard
MSI GP62M 7RD Leopard - 7RD-076DE: Intel Core i7-7700HQ, 15.60", 2.2 kg
External Review » MSI GP62M 7RD Leopard - 7RD-076DE
HP Omen 15-ce000ng: Intel Core i5-7300HQ, 15.60", 2.6 kg
External Review » HP Omen 15-ce000ng
HP Pavilion 17-ab201na: Intel Core i5-7300HQ, 17.30", 2.9 kg
External Review » HP Pavilion 17-ab201na
Dell Inspiron 15-5577: Intel Core i5-7300HQ, 15.60", 2.5 kg
External Review » Dell Inspiron 15-5577
Asus VivoBook Pro 15 N580VD: Intel Core i7-7700HQ, 15.60", 2 kg
External Review » Asus VivoBook Pro 15 N580VD
Asus Strix ZX753VD-GC266T: Intel Core i7-7700HQ, 17.30", 3 kg
External Review » Asus Strix ZX753VD-GC266T
Acer Aspire VX5-591G-74CU: Intel Core i7-7700HQ, 15.60", 2.6 kg
External Review » Acer Aspire VX5-591G-74CU
MSI GL62M 7RD-1031XES: Intel Core i5-7300HQ, 15.60", 2.2 kg
External Review » MSI GL62M 7RD-1031XES
MSI GL62M 7RDX-1096: Intel Core i7-7700HQ, 15.60", 2.4 kg
External Review » MSI GL62M 7RDX-1096
MSI PE70 7RD-086ES: Intel Core i7-7700HQ, 17.30", 2.7 kg
External Review » MSI PE70 7RD-086ES
Lenovo Legion Y520-15-80WK004TMH: Intel Core i7-7700HQ, 15.60", 2.4 kg
External Review » Lenovo Legion Y520-15-80WK004TMH
Lenovo Yoga 720-15IKB: Intel Core i7-7700HQ, 15.60", 2 kg
External Review » Lenovo Yoga 720-15IKB
Acer Aspire VX5-591G-73FR: Intel Core i7-7700HQ, 15.60", 2.5 kg
External Review » Acer Aspire VX5-591G-73FR
HP Omen 17-w203ns: Intel Core i7-7700HQ, 17.30", 3.4 kg
External Review » HP Omen 17-w203ns
HP Pavilion 15-bc210nd: Intel Core i5-7300HQ, 15.60", 2.1 kg
External Review » HP Pavilion 15-bc210nd
Lenovo Legion Y520-80WK0005MX: Intel Core i5-7300HQ, 15.60", 2.4 kg
External Review » Lenovo Legion Y520-80WK0005MX
Acer Aspire VX5-591G-5497: Intel Core i5-7300HQ, 15.60", 2.5 kg
External Review » Acer Aspire VX5-591G-5497
Asus Strix GL753VD-GC042T: Intel Core i7-7700HQ, 17.30", 3 kg
External Review » Asus Strix GL753VD-GC042T
HP Omen 15-ax208ns : Intel Core i7-7700HQ, 15.60", 2.2 kg
External Review » HP Omen 15-ax208ns
Asus Strix GL753VD-GC043T: Intel Core i5-7300HQ, 17.30", 2.9 kg
External Review » Asus Strix GL753VD-GC043T
Samsung Odyssey NP800G5M-X01US: Intel Core i7-7700HQ, 15.60", 2.5 kg
External Review » Samsung Odyssey NP800G5M-X01US
Lenovo Legion Y520-15IKBN-80WK004VGE: Intel Core i5-7300HQ, 15.60", 2.4 kg
External Review » Lenovo Legion Y520-15IKBN-80WK004VGE
Asus GL553VD-FY025T: Intel Core i7-7700HQ, 15.60", 2.5 kg
External Review » Asus GL553VD-FY025T
Acer Aspire VX5-591G-5652: Intel Core i5-7300HQ, 15.60", 2.6 kg
External Review » Acer Aspire VX5-591G-5652
MSI GL62M 7RD-077: Intel Core i7-7700HQ, 15.60", 2.4 kg
External Review » MSI GL62M 7RD-077
Acer Aspire VX5-591G-58TC: Intel Core i5-7300HQ, 15.60", 2.5 kg
External Review » Acer Aspire VX5-591G-58TC
Clevo N850: Intel Core i7-7700HQ, 15.60", 2.5 kg
External Review » Clevo N850
Dell XPS 15 9560-1C32-33Y: Intel Core i7-7700HQ, 15.60", 2.1 kg
External Review » Dell XPS 15 9560-1C32-33Y
HP Pavilion 15-bc201ng: Intel Core i5-7300HQ, 15.60", 2.3 kg
External Review » HP Pavilion 15-bc201ng
MSI GS73VR 7RF-212NE: Intel Core i7-7700HQ, 17.30", 2.4 kg
External Review » MSI GS73VR 7RF-212NE
Asus Strix GL753VD-GC009: Intel Core i7-7700HQ, 17.30", 3 kg
External Review » Asus Strix GL753VD-GC009
MSI PE60 7RD-282ES: Intel Core i7-7700HQ, 15.60", 2.2 kg
External Review » MSI PE60 7RD-282ES
MSI GL62M 7RD-835XES: Intel Core i7-7700HQ, 15.60", 2.2 kg
External Review » MSI GL62M 7RD-835XES
HP Omen 15-ax209ns: Intel Core i7-7700HQ, 15.60", 2.2 kg
External Review » HP Omen 15-ax209ns
HP Omen 17-w209ns: Intel Core i7-7700HQ, 17.30", 2.8 kg
External Review » HP Omen 17-w209ns
MSI GP62M 7RD Leopard-660RU: Intel Core i7-7700HQ, 15.60", 2.2 kg
External Review » MSI GP62M 7RD Leopard-660RU
Asus FX553VD-DM249T: Intel Core i7-7700HQ, 15.60", 2.4 kg
External Review » Asus FX553VD-DM249T
HP Omen 15-ax210ns: Intel Core i5-7300HQ, 15.60", 2.2 kg
External Review » HP Omen 15-ax210ns
HP Pavilion 17-ab200ns: Intel Core i7-7700HQ, 17.30", 2.9 kg
External Review » HP Pavilion 17-ab200ns
Asus GL553VD-FY026T: Intel Core i7-7700HQ, 15.60", 2.5 kg
External Review » Asus GL553VD-FY026T
HP Omen 15-ax210nd: Intel Core i5-7300HQ, 15.60", 2.2 kg
External Review » HP Omen 15-ax210nd
MSI GE62 7RD-219XES: Intel Core i7-7700HQ, 15.60", 2.4 kg
External Review » MSI GE62 7RD-219XES
MSI GE72 7RD-085XES: Intel Core i7-7700HQ, 17.30", 2.9 kg
External Review » MSI GE72 7RD-085XES
Asus GL553VD-FY040T: Intel Core i7-7700HQ, 15.60", 2.5 kg
External Review » Asus GL553VD-FY040T
HP Omen 15-ax200ns: Intel Core i7-7700HQ, 15.60", 2.2 kg
External Review » HP Omen 15-ax200ns
HP Pavilion 15-bc202nc: Intel Core i7-7700HQ, 15.60", 2.2 kg
External Review » HP Pavilion 15-bc202nc
Asus ROG Strix GL553VD-DS71: Intel Core i7-7700HQ, 15.60", 2.5 kg
External Review » Asus ROG Strix GL553VD-DS71
Acer Aspire VX5-591G-78J8: Intel Core i7-7700HQ, 15.60", 2.5 kg
External Review » Acer Aspire VX5-591G-78J8
Asus GL553VD-FY072T: Intel Core i7-7700HQ, 15.60", 2.5 kg
External Review » Asus GL553VD-FY072T
MSI PE60 7RD-059 Prestige: Intel Core i7-7700HQ, 15.60", 2.4 kg
External Review » MSI PE60 7RD-059 Prestige
Dell XPS 15 9560 (i7-7700HQ, FHD): Intel Core i7-7700HQ, 15.60", 2.1 kg
External Review » Dell XPS 15 9560 (i7-7700HQ, FHD)
MSI GP62 7RD-090DE Leopard: Intel Core i7-7700HQ, 15.60", 2.4 kg
External Review » MSI GP62 7RD-090DE Leopard
Lenovo Legion Y520-80WK004XGE: Intel Core i7-7700HQ, 15.60", 2.4 kg
External Review » Lenovo Legion Y520-80WK004XGE
Dell XPS 15 9560 (i7-7700HQ, UHD): Intel Core i7-7700HQ, 15.60", 2.1 kg
External Review » Dell XPS 15 9560 (i7-7700HQ, UHD)
MSI GL62M 7RD-429XES: Intel Core i7-7700HQ, 15.60", 2.2 kg
External Review » MSI GL62M 7RD-429XES
HP Omen 15-ax204ns: Intel Core i7-7700HQ, 15.60", 2.2 kg
External Review » HP OMEN 15-ax204ns
HP Pavilion 15-bc235nd: Intel Core i7-7700HQ, 15.60", 2.2 kg
External Review » HP Pavilion 15-bc235nd
Acer Aspire VX5-591G-54PD: Intel Core i5-7300HQ, 15.60", 2.5 kg
External Review » Acer Aspire VX5-591G-54PD
Acer Aspire VX5-591G-711J: Intel Core i7-7700HQ, 15.60", 2.5 kg
External Review » Acer Aspire VX5-591G-711J
Asus Strix GL753VD-GC044T: Intel Core i7-7700HQ, 17.30", 2.9 kg
External Review » Asus Strix GL753VD-GC044T
MSI GL62 7RD-083: Intel Core i7-7700HQ, 15.60", 2.4 kg
External Review » MSI GL62 7RD-083
Lenovo Legion Y520-15IKB-80WK004RGE: Intel Core i7-7700HQ, 15.60", 2.5 kg
External Review » Lenovo Legion Y520-15IKB-80WK004RGE
Asus Strix GL553VD-FY075T: Intel Core i7-7700HQ, 15.60", 2.5 kg
External Review » Asus Strix GL553VD-FY075T
Asus Strix GL753VD-GC045T: Intel Core i7-7700HQ, 17.30", 2.9 kg
External Review » Asus Strix GL753VD-GC045T
Lenovo ThinkPad T15p-20TN0006GE: Intel Core i7-10750H, 15.60", 2.2 kg
» The Lenovo ThinkPad T15p surprises us with a plastic case
HP Pavilion Gaming 15-ec0002ng: AMD Ryzen 5 3550H, 15.60", 2.3 kg
» Disappointing display - The HP Pavilion Gaming 15 in Review
Dell XPS 15 2018 i5 FHD 97Wh: Intel Core i5-8300H, 15.60", 1.9 kg
» The XPS 15 9570 with i7-8750H CPU is almost twice as fast as its predecessor
Dell XPS 15 9560 (i7-7700HQ, UHD): Intel Core i7-7700HQ, 15.60", 2.1 kg
» The XPS 15 9570 with i7-8750H CPU is almost twice as fast as its predecessor