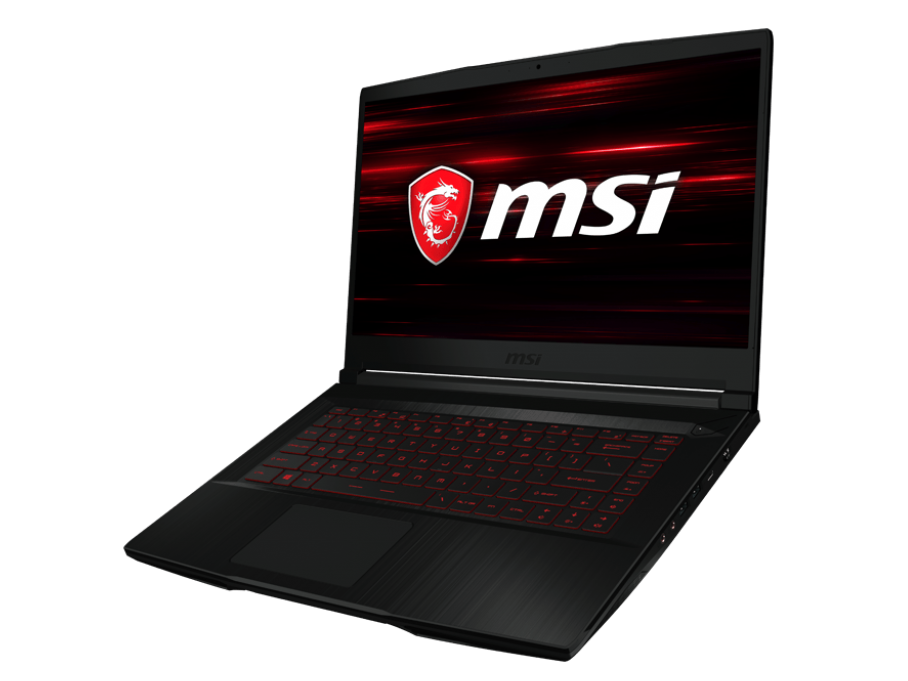
MSI GF63 8RC (i5-8300H, GTX 1050) Laptop Review

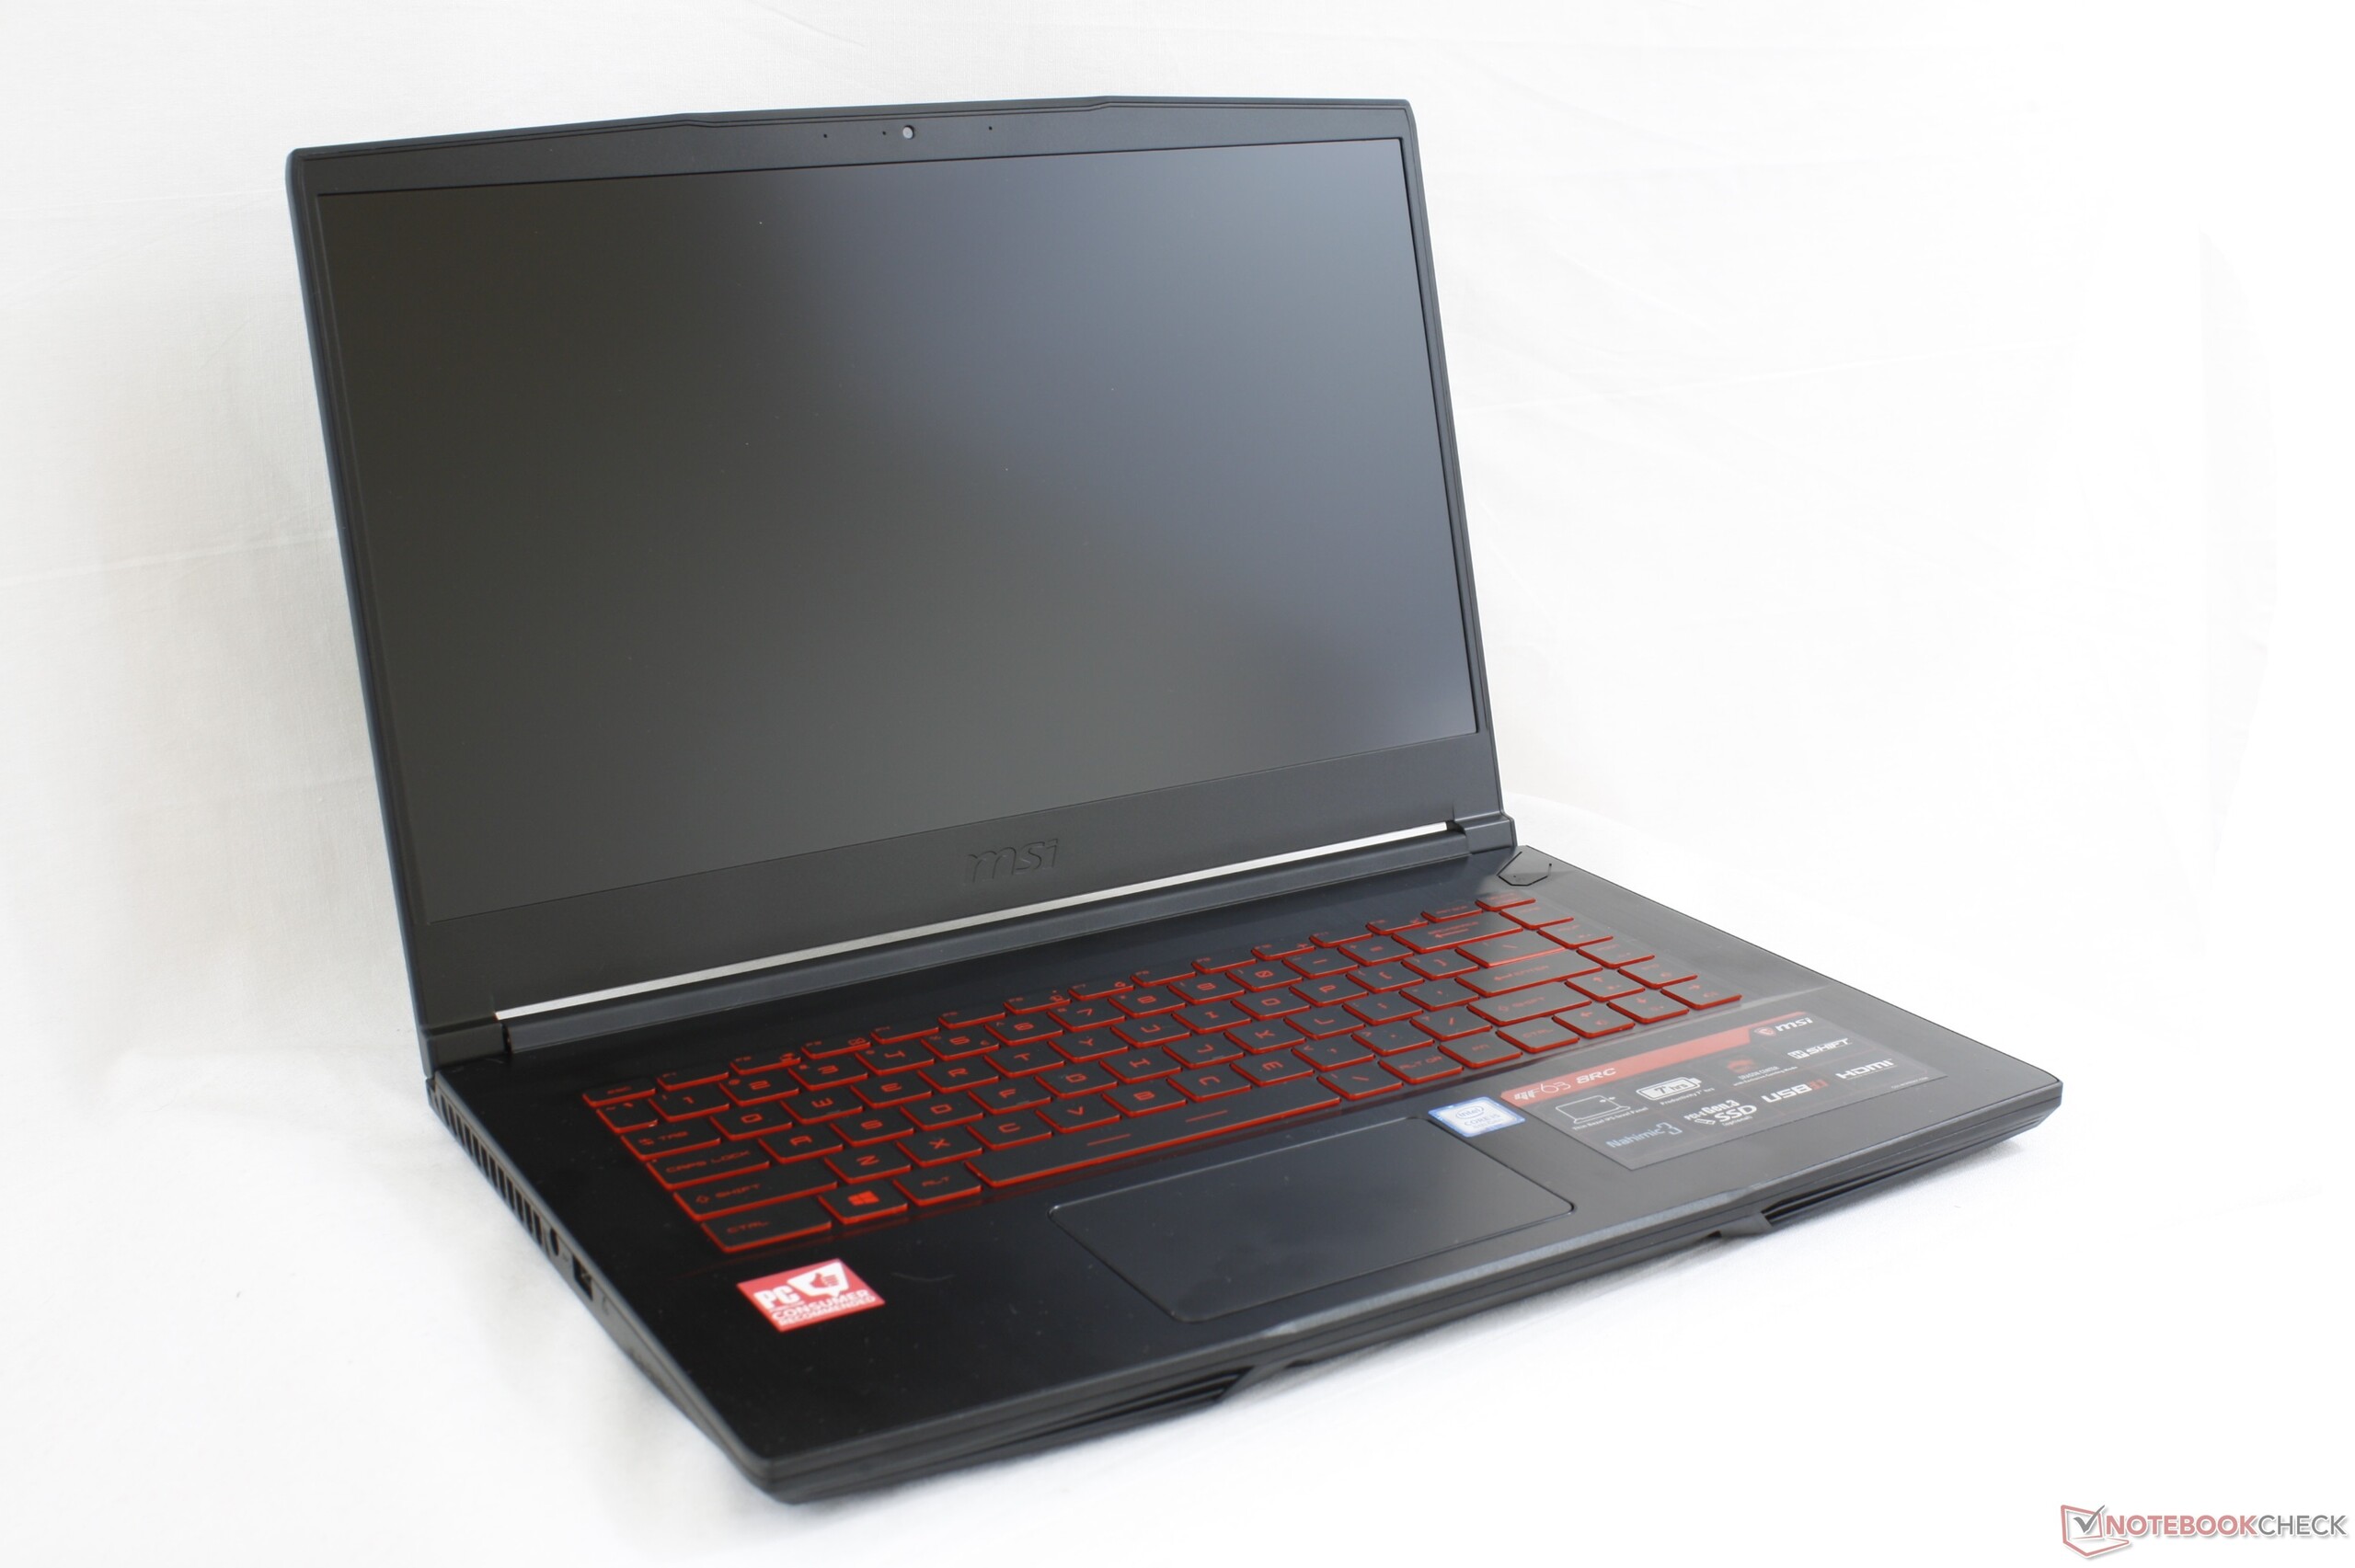
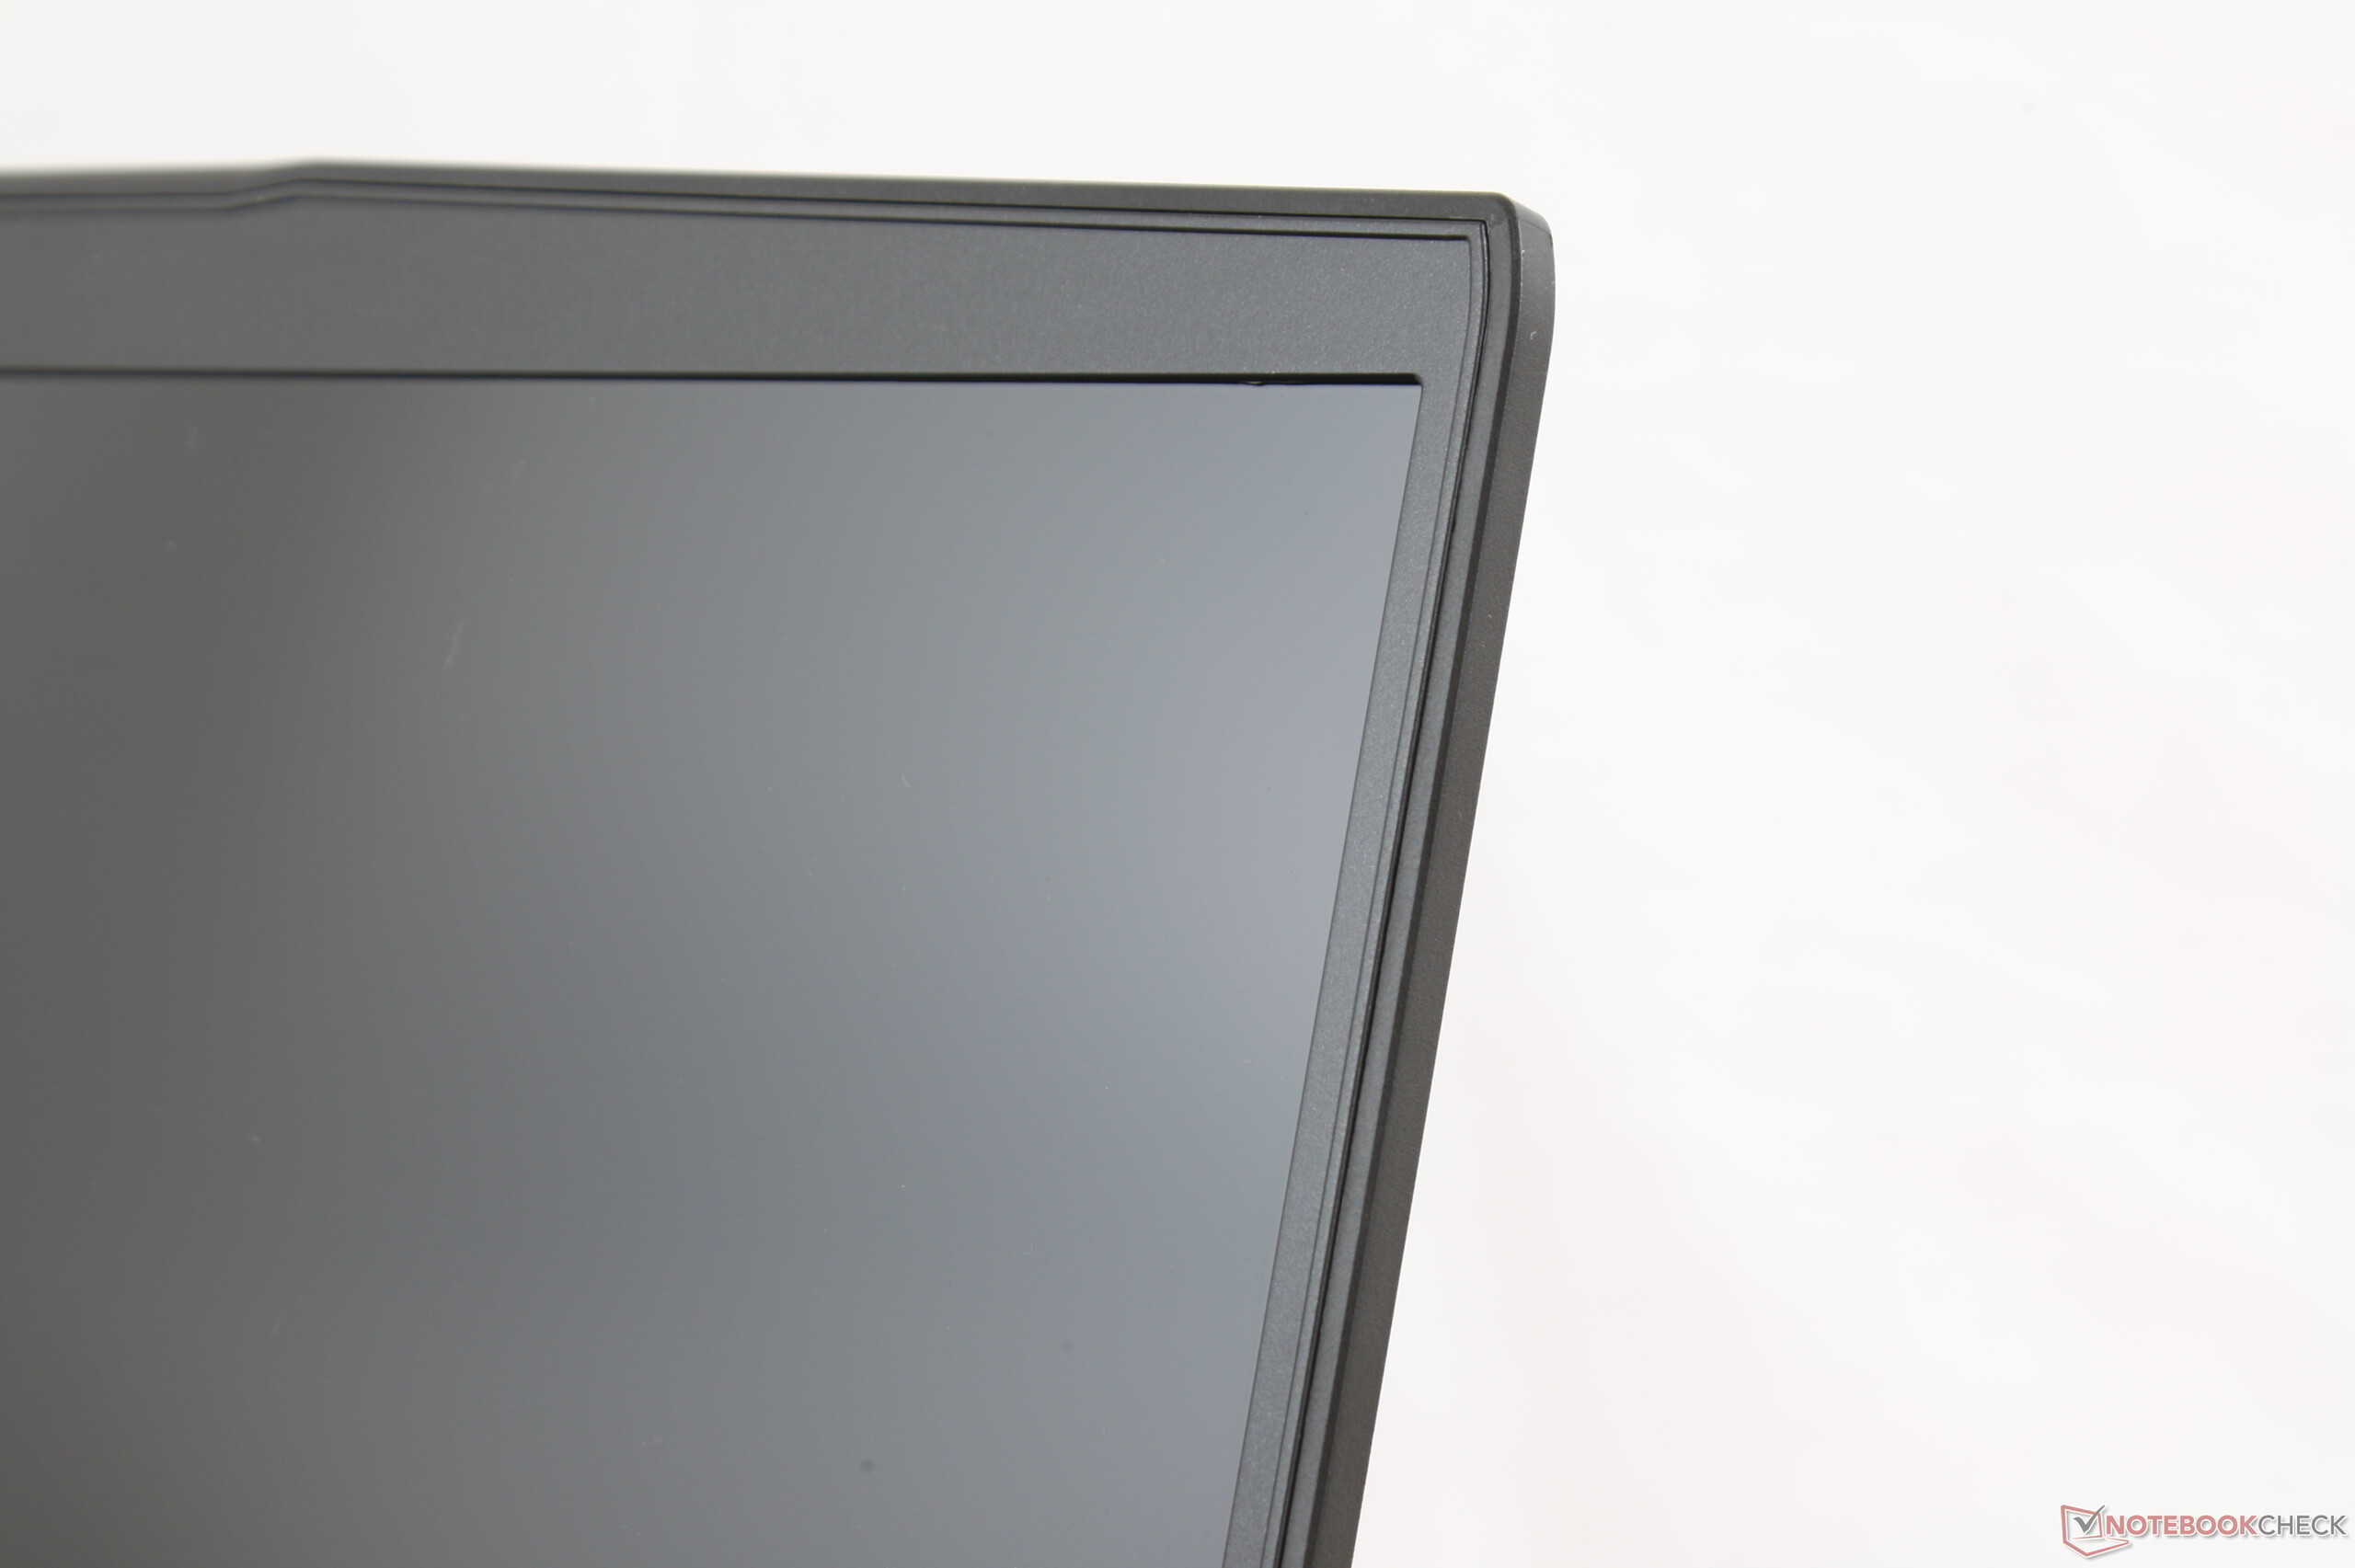
First showcased at Computex 2018, the 15.6-inch MSI GF63 represents the company's first narrow-bezel laptop for entry-level gamers. It can be considered as an affordable version of the sleeker GS65 that debuted earlier this year alongside the mobile Intel Coffee Lake-H series. The system is a direct successor to the GF62VR and it is a complete design overhaul from top to bottom as our review below will detail.
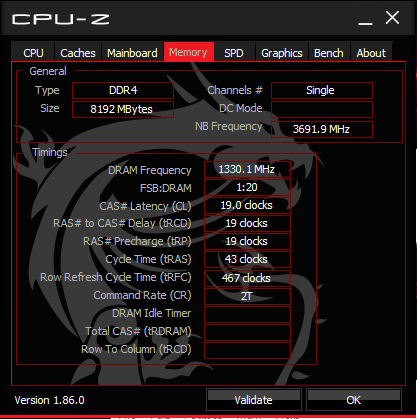
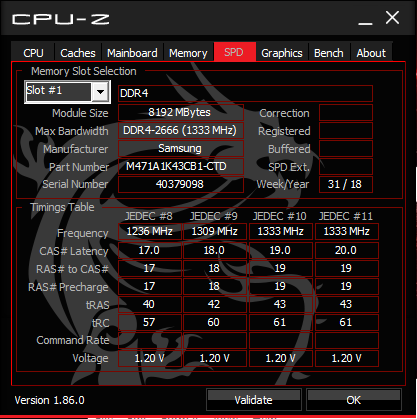
Only two SKUs of the GF63 are available at the time of writing. The GF63 8RC and GF63 8RD come with GTX 1050 and GTX 1050 Ti Max-Q graphics, respectively, with Core i5-8300H and i7-8750H CPU options. Both configurations are otherwise equipped with the same features and 1080p IPS panel. Note that the GTX 1060 and 1080p TN options from the GF62VR series have been dropped alongside a number of other changes. Our test unit today is the entry-level SKU with the i5-8300H CPU, GTX 1050 GPU, 1 TB HDD, and 8 GB of DDR4 RAM for about $750 USD.
Direct competitors in the entry-level gaming space are numerous. Any 15.6-inch gaming system with GTX 1050 graphics can be considered an alternative including the HP Pavilion Gaming 15, Lenovo Legion Y530, Asus TUF FX504, Acer Nitro 5, Dell G5/G7, and the Gigabyte Sabre 15.
More MSI reviews:
Case
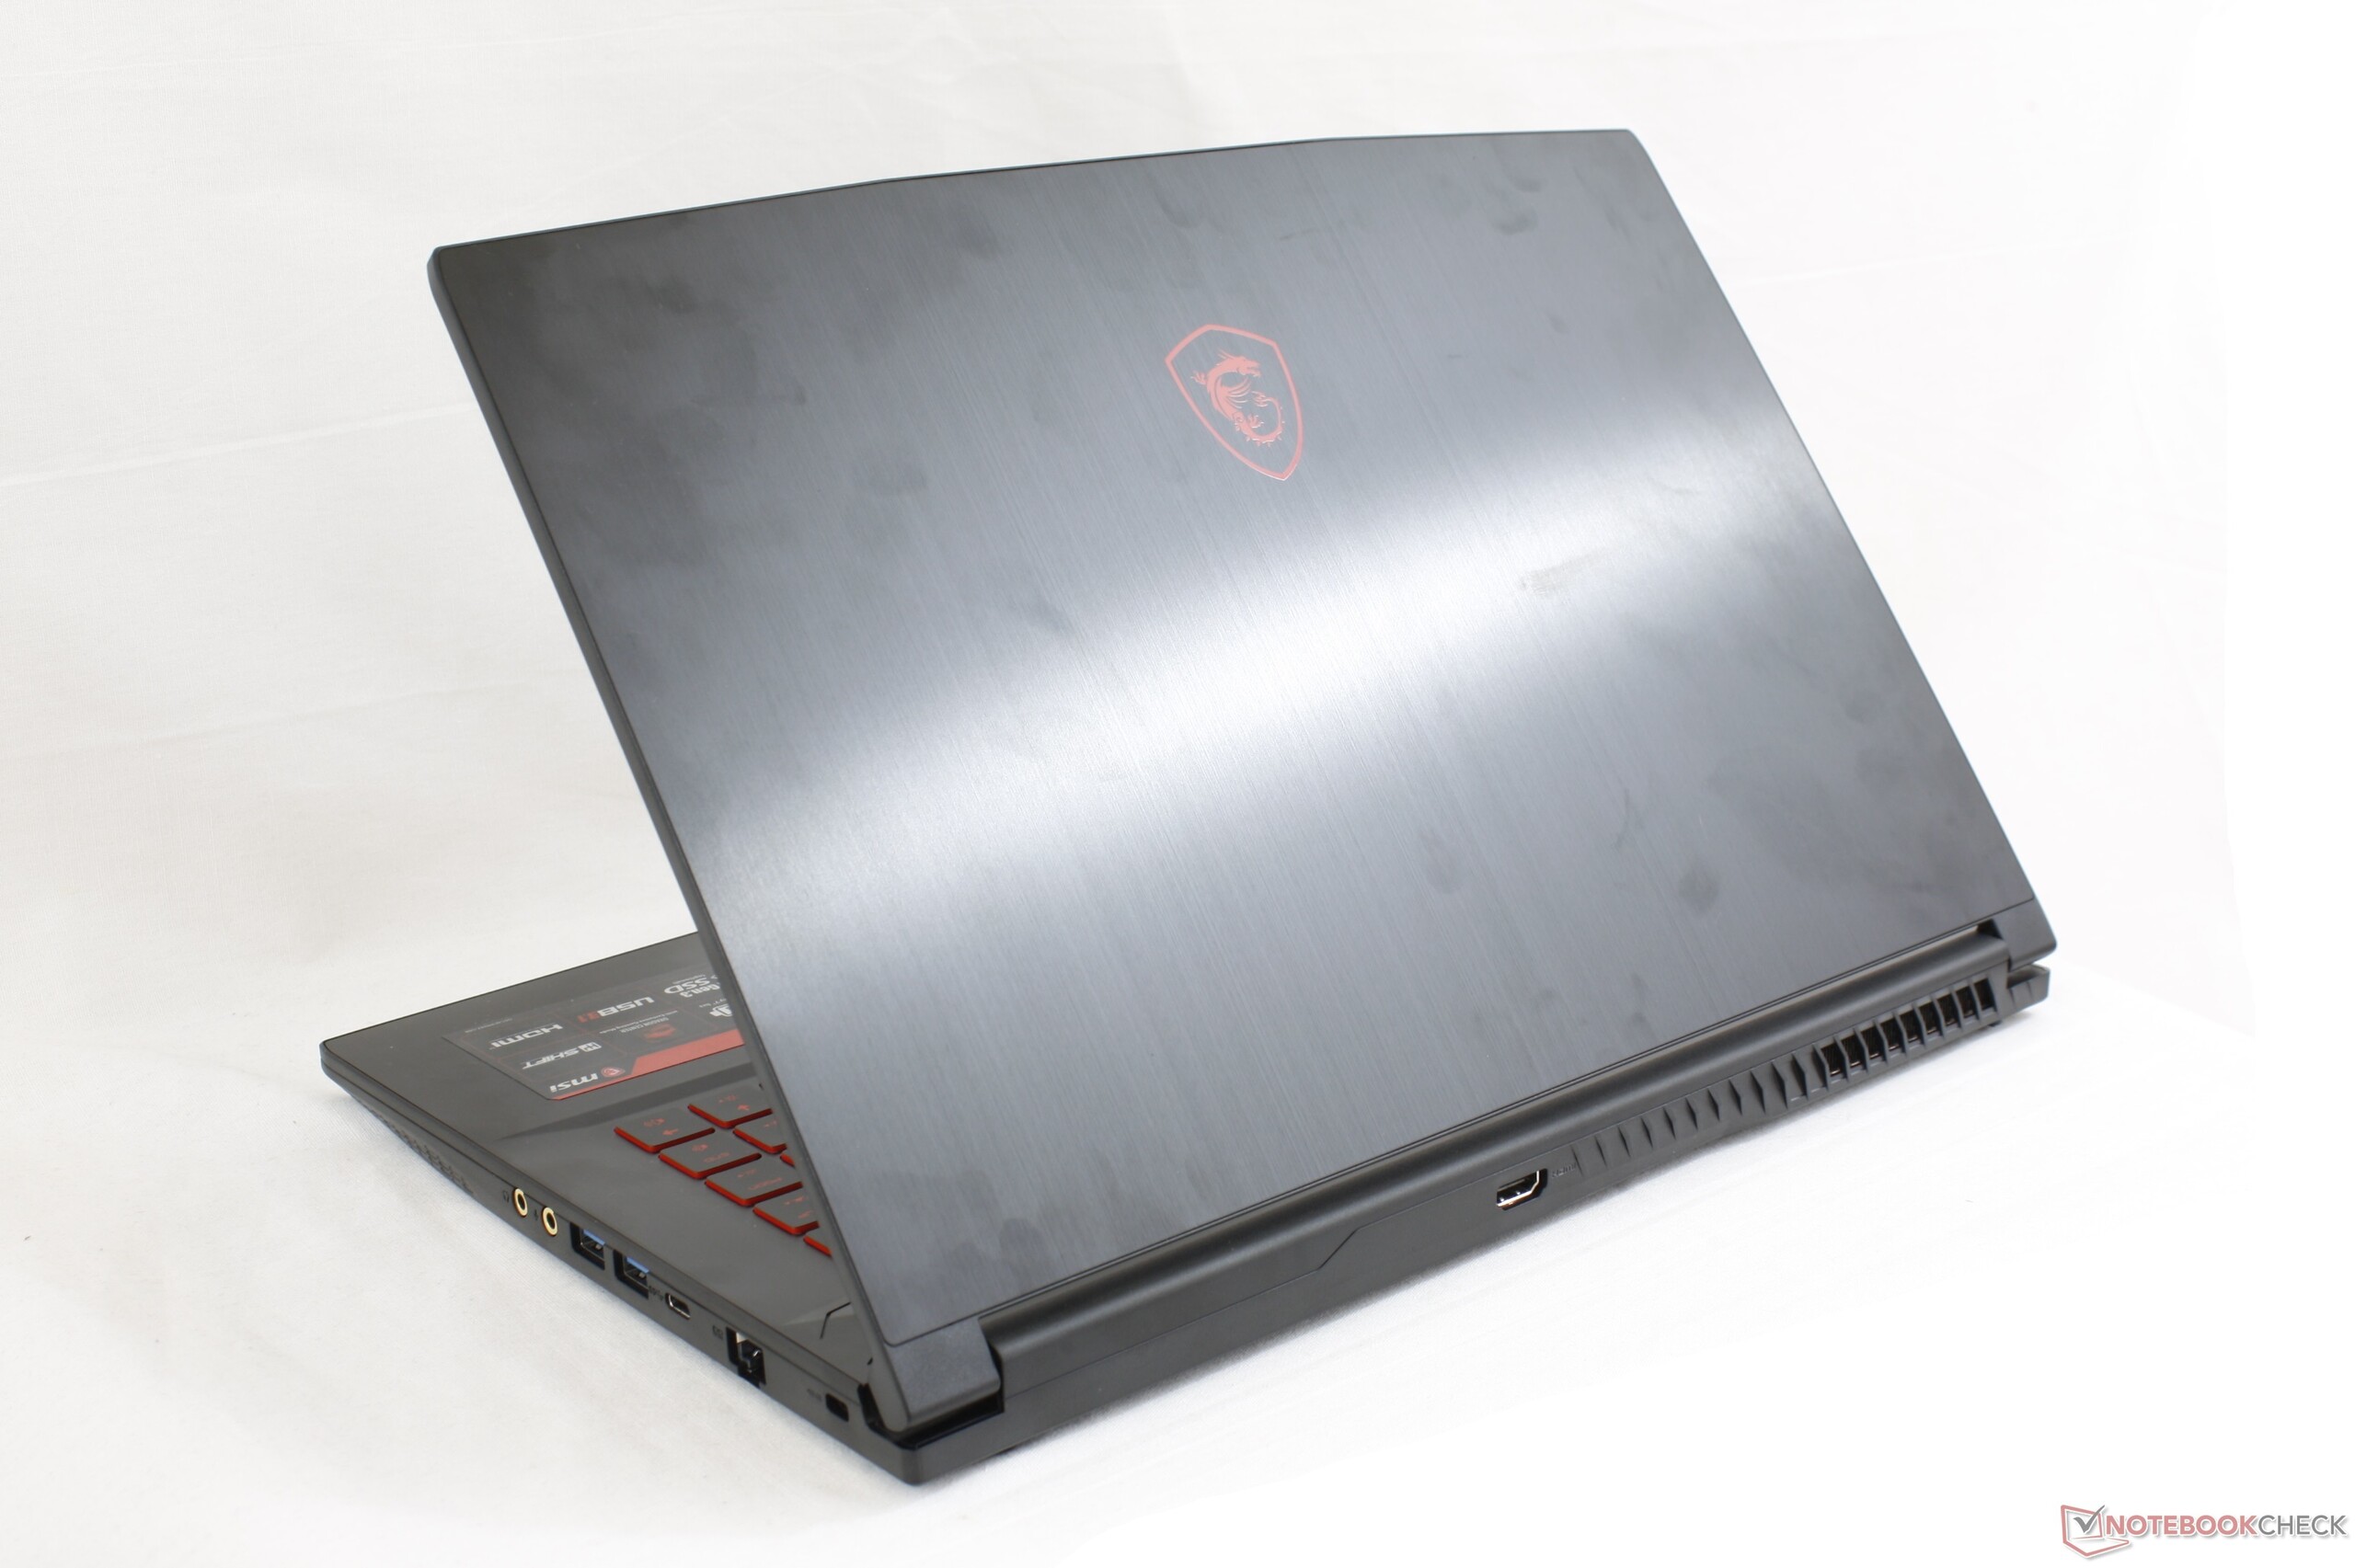
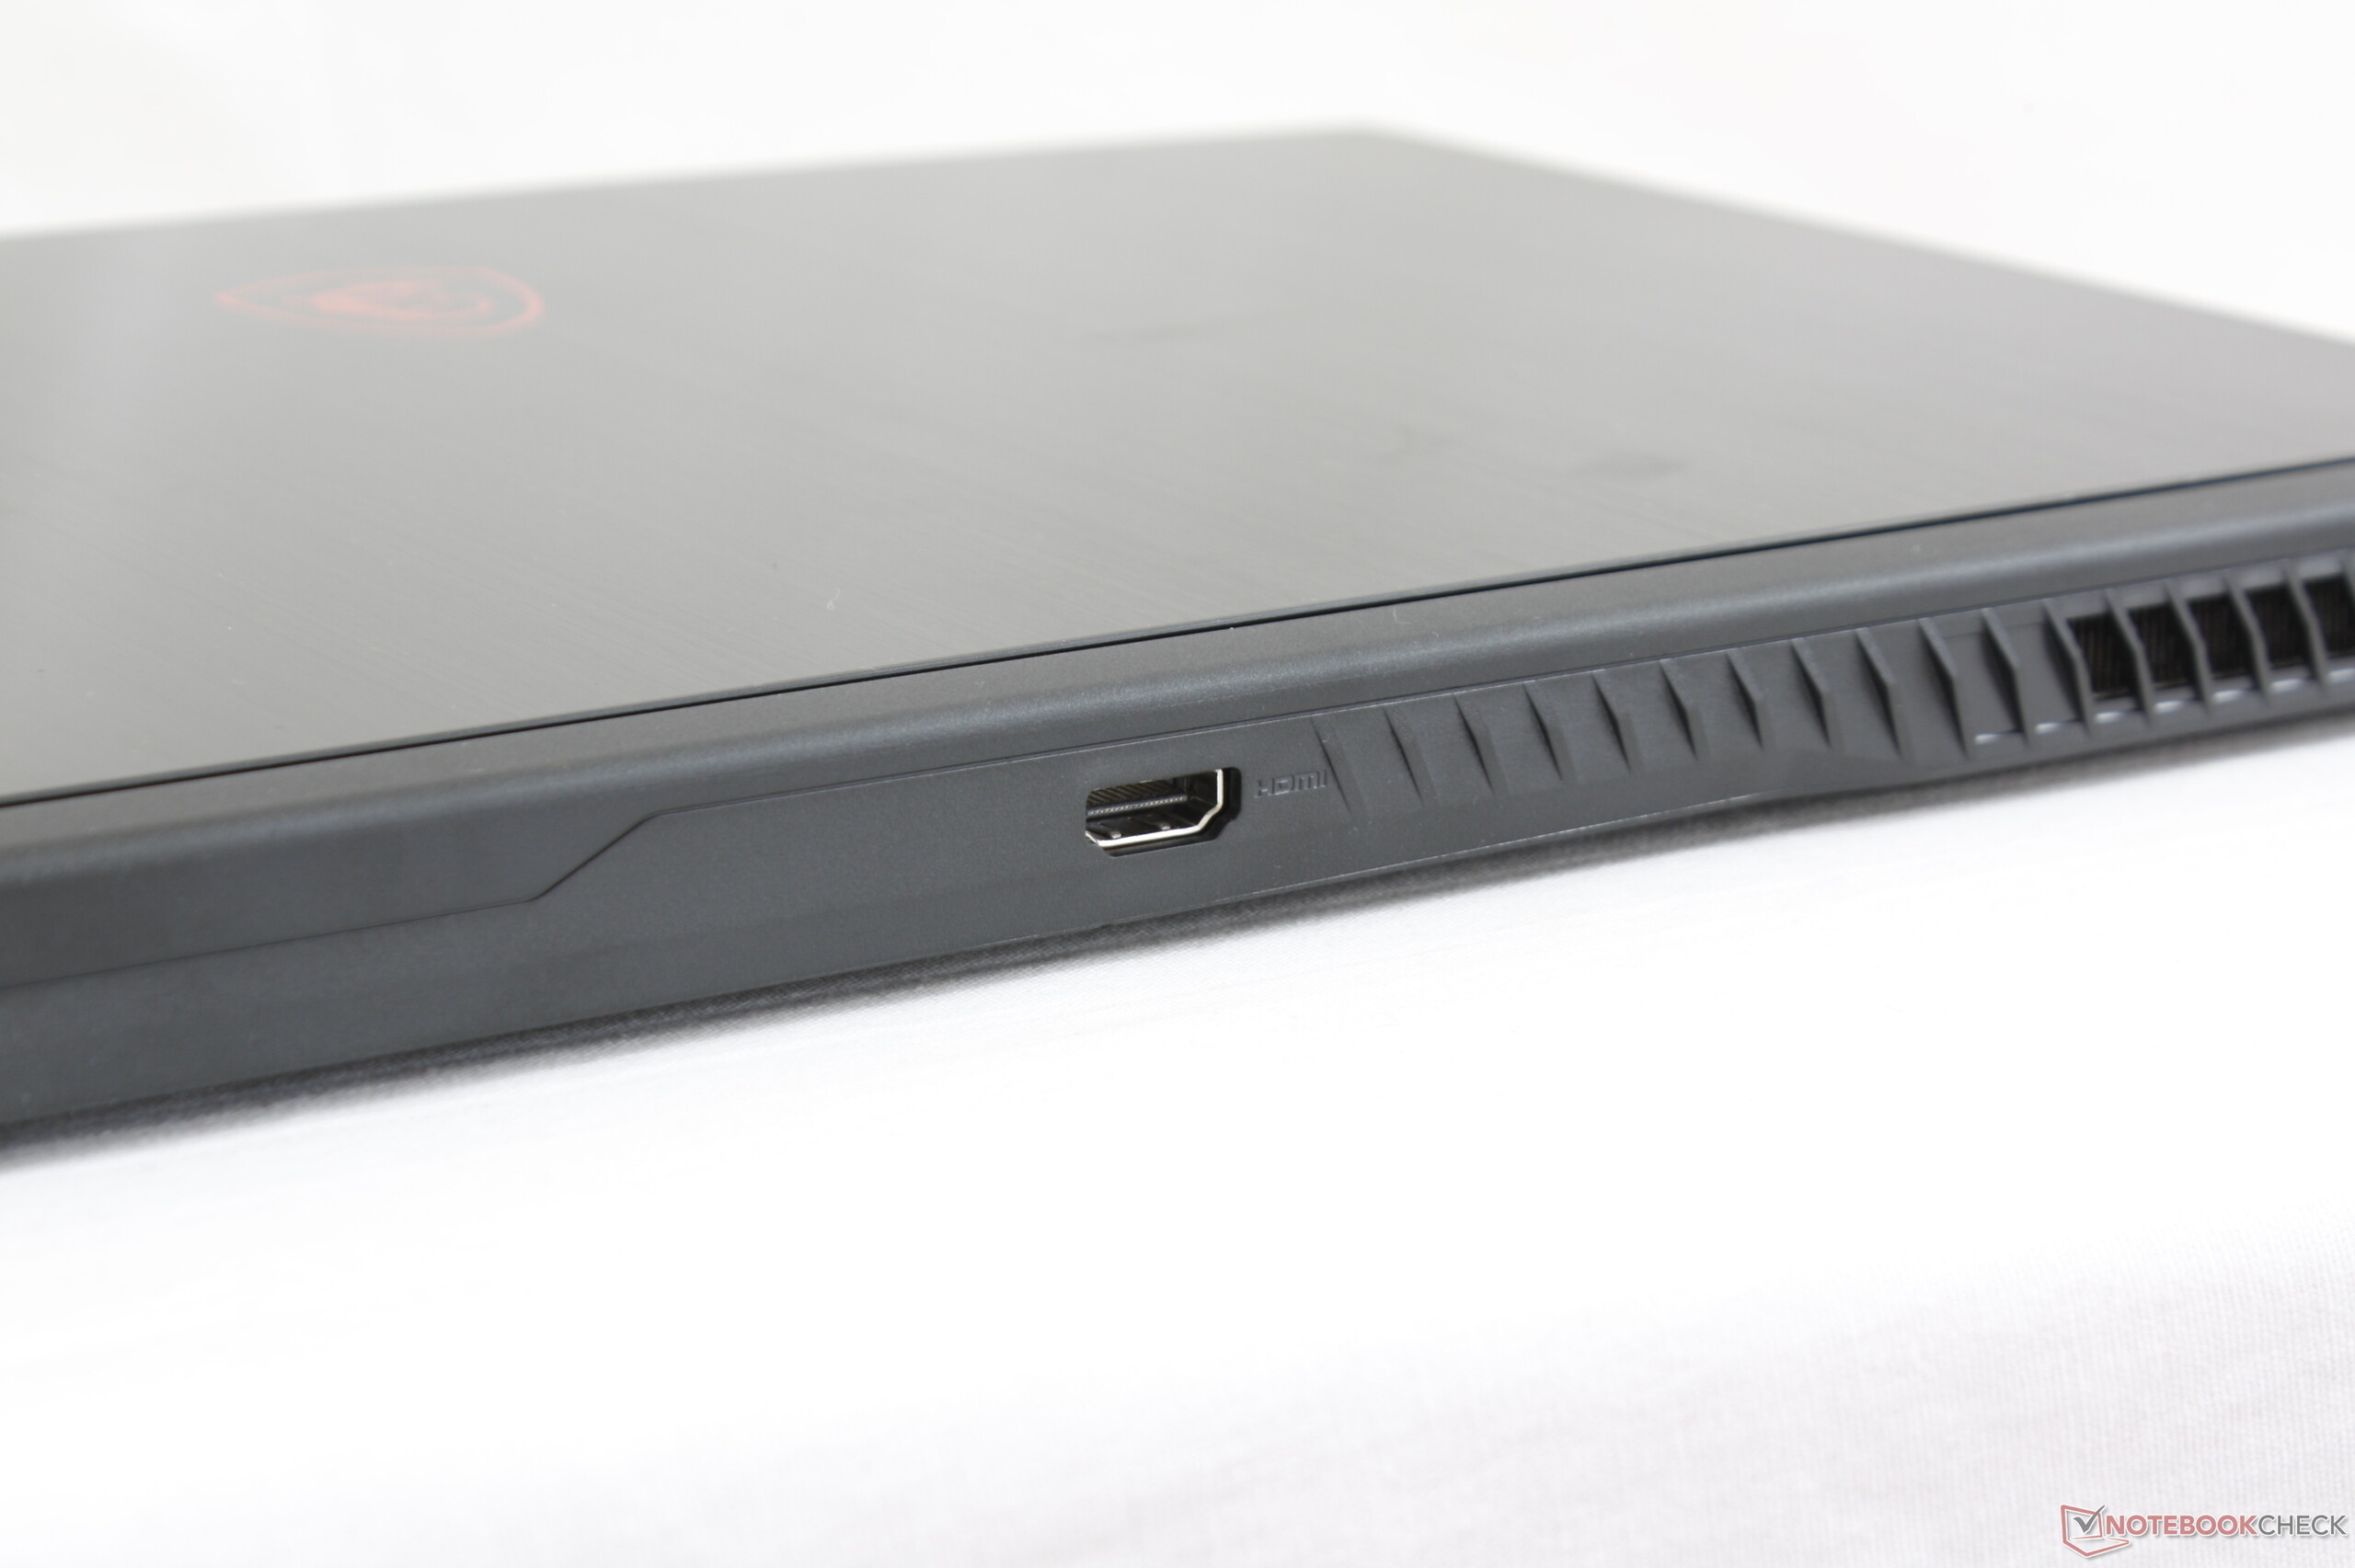
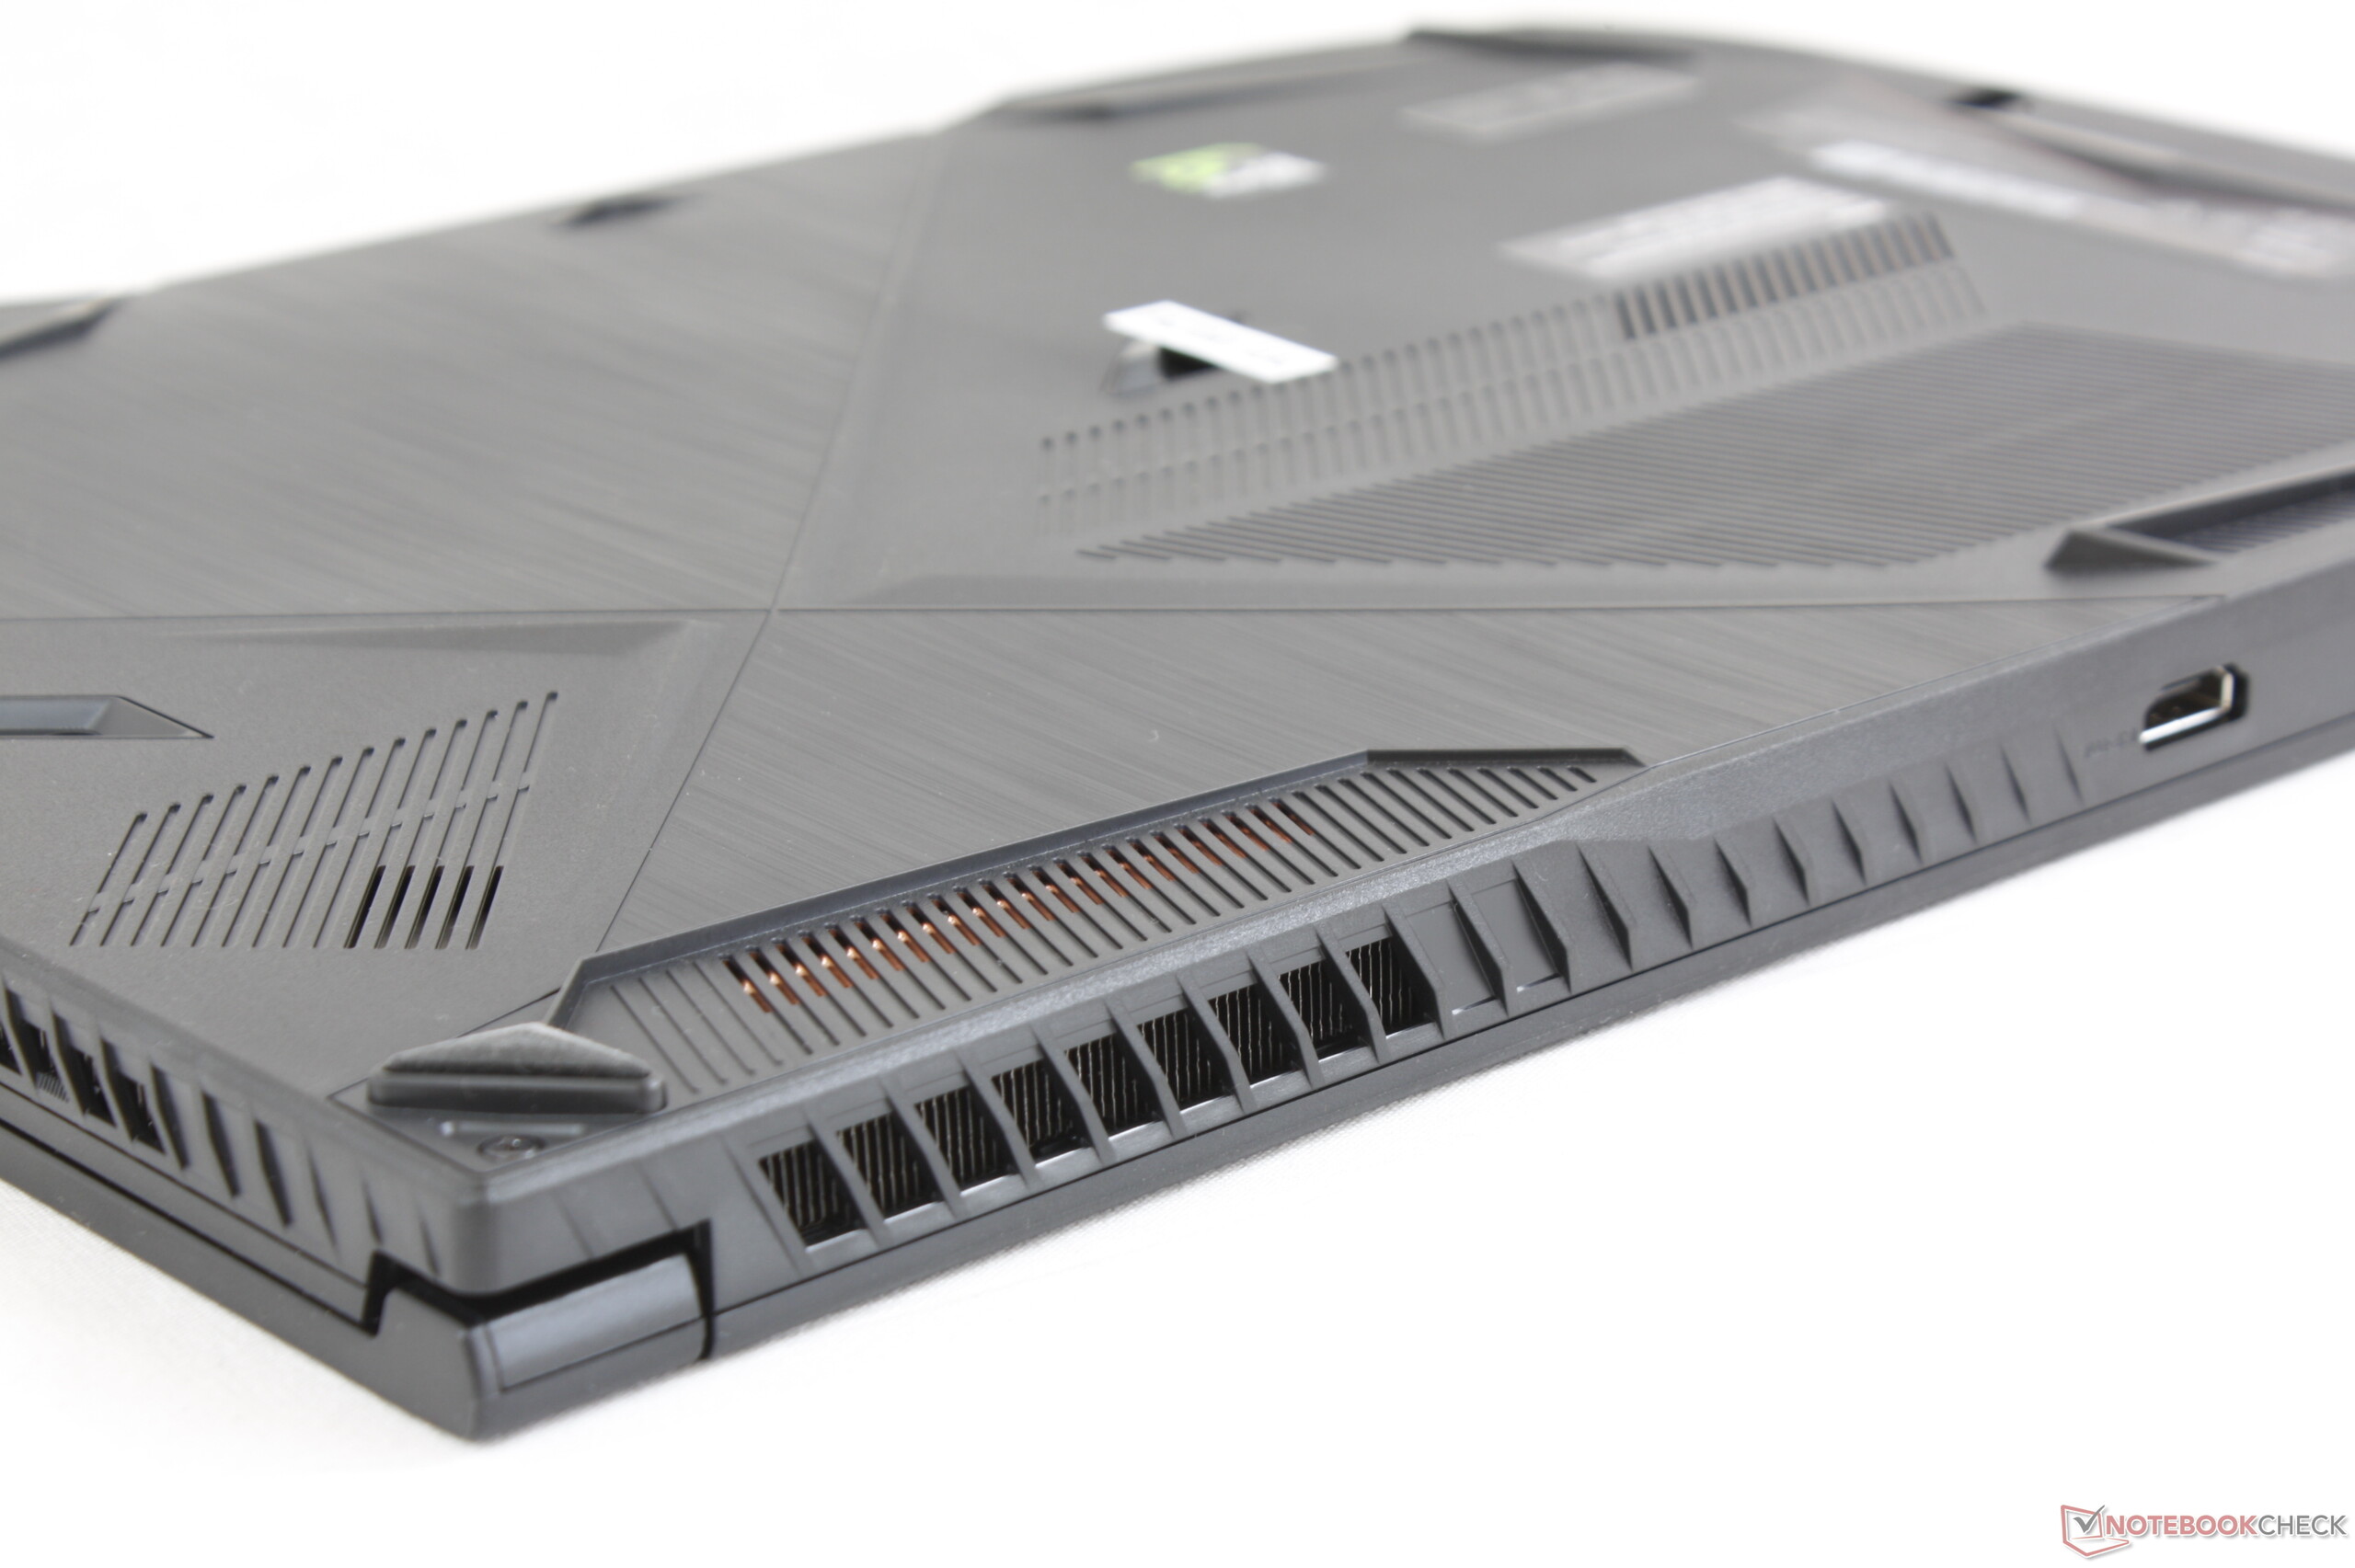
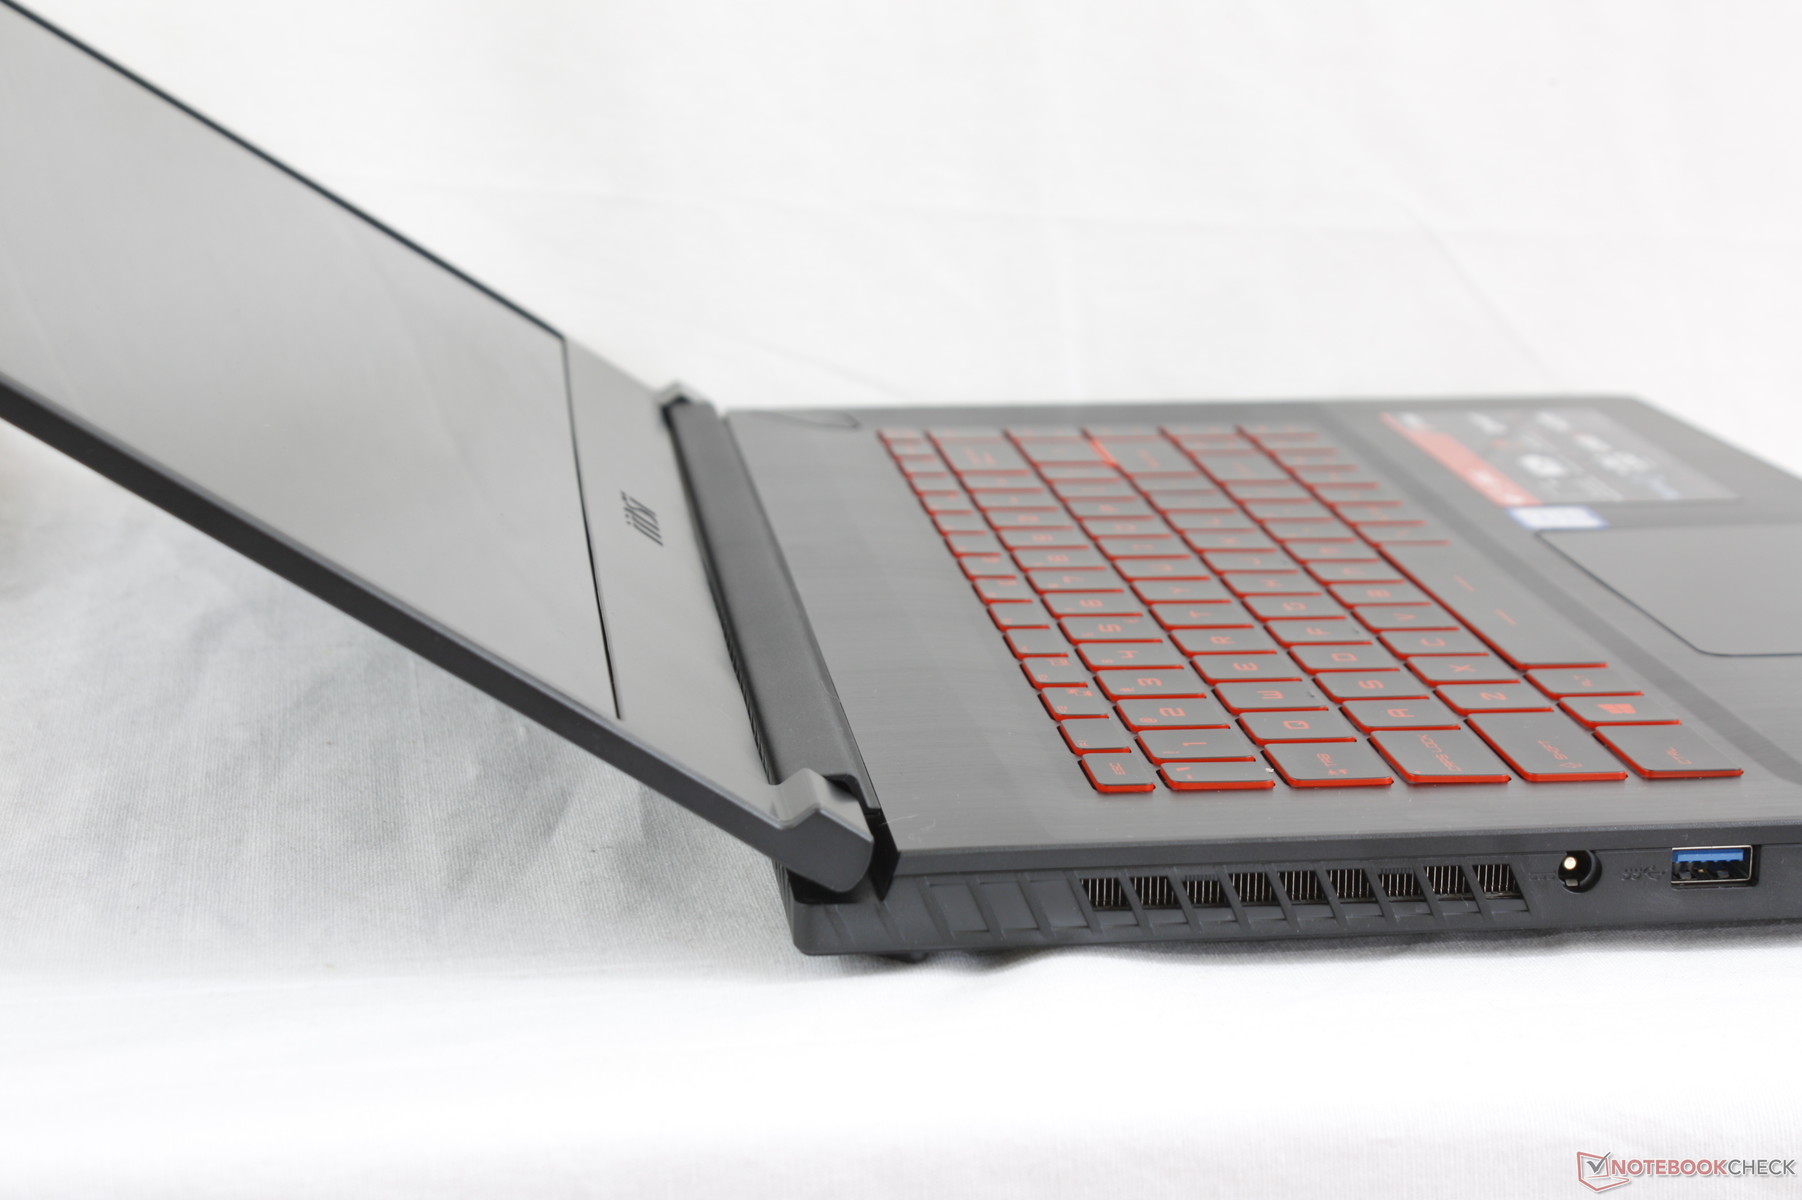
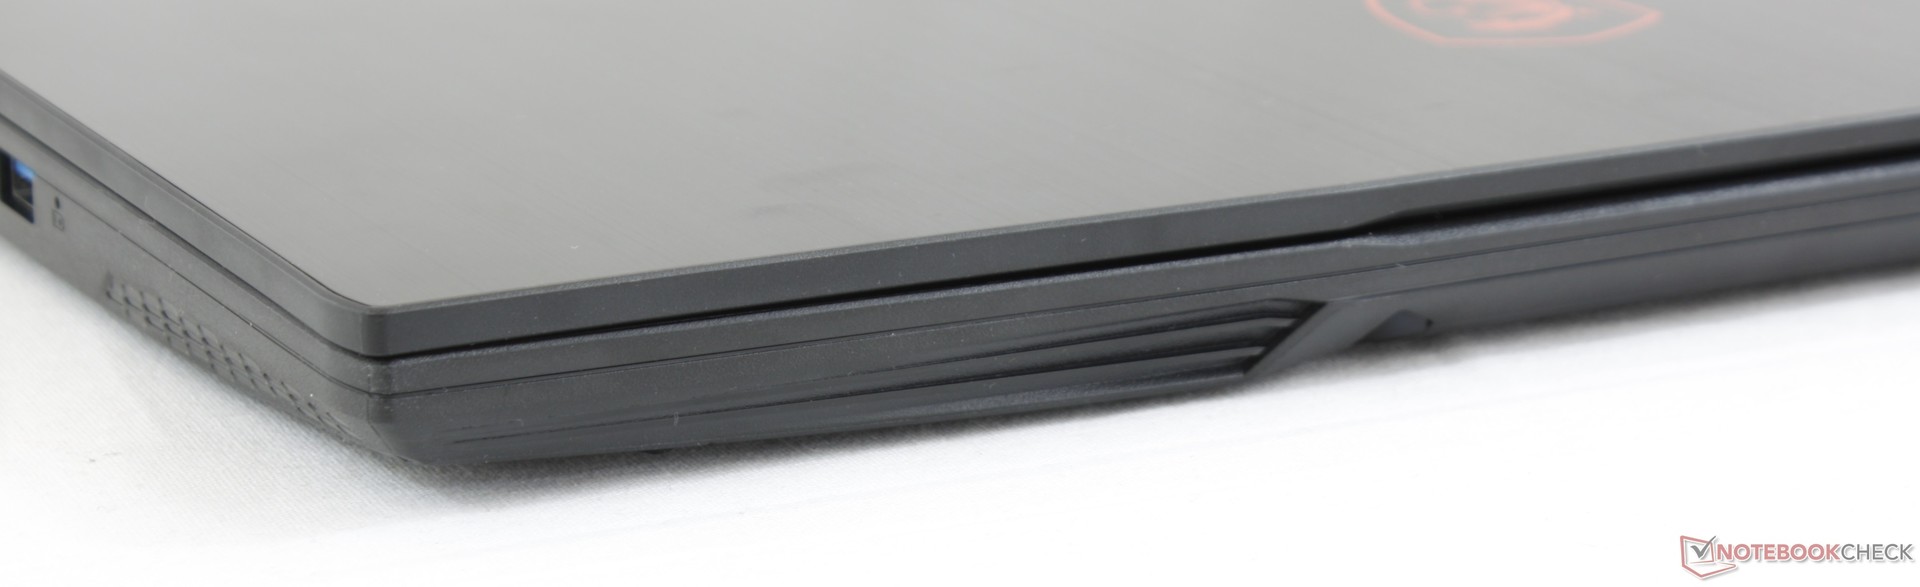
Visually, the GF63 has more in common with the GS65 than the GF62VR that it replaces. Whereas the GF62VR had plenty of angles, slants, and accents, the GF63 is more minimalist with smoother and flatter surfaces. The outer lid is now a flat piece of brushed aluminum for a sleeker look overall. This "flat top" approach is common on thin gaming laptops like the Asus Zephyrus, Lenovo Legion Y530, or the Razer Blade and it's great to see MSI bring the concept to a more affordable model.
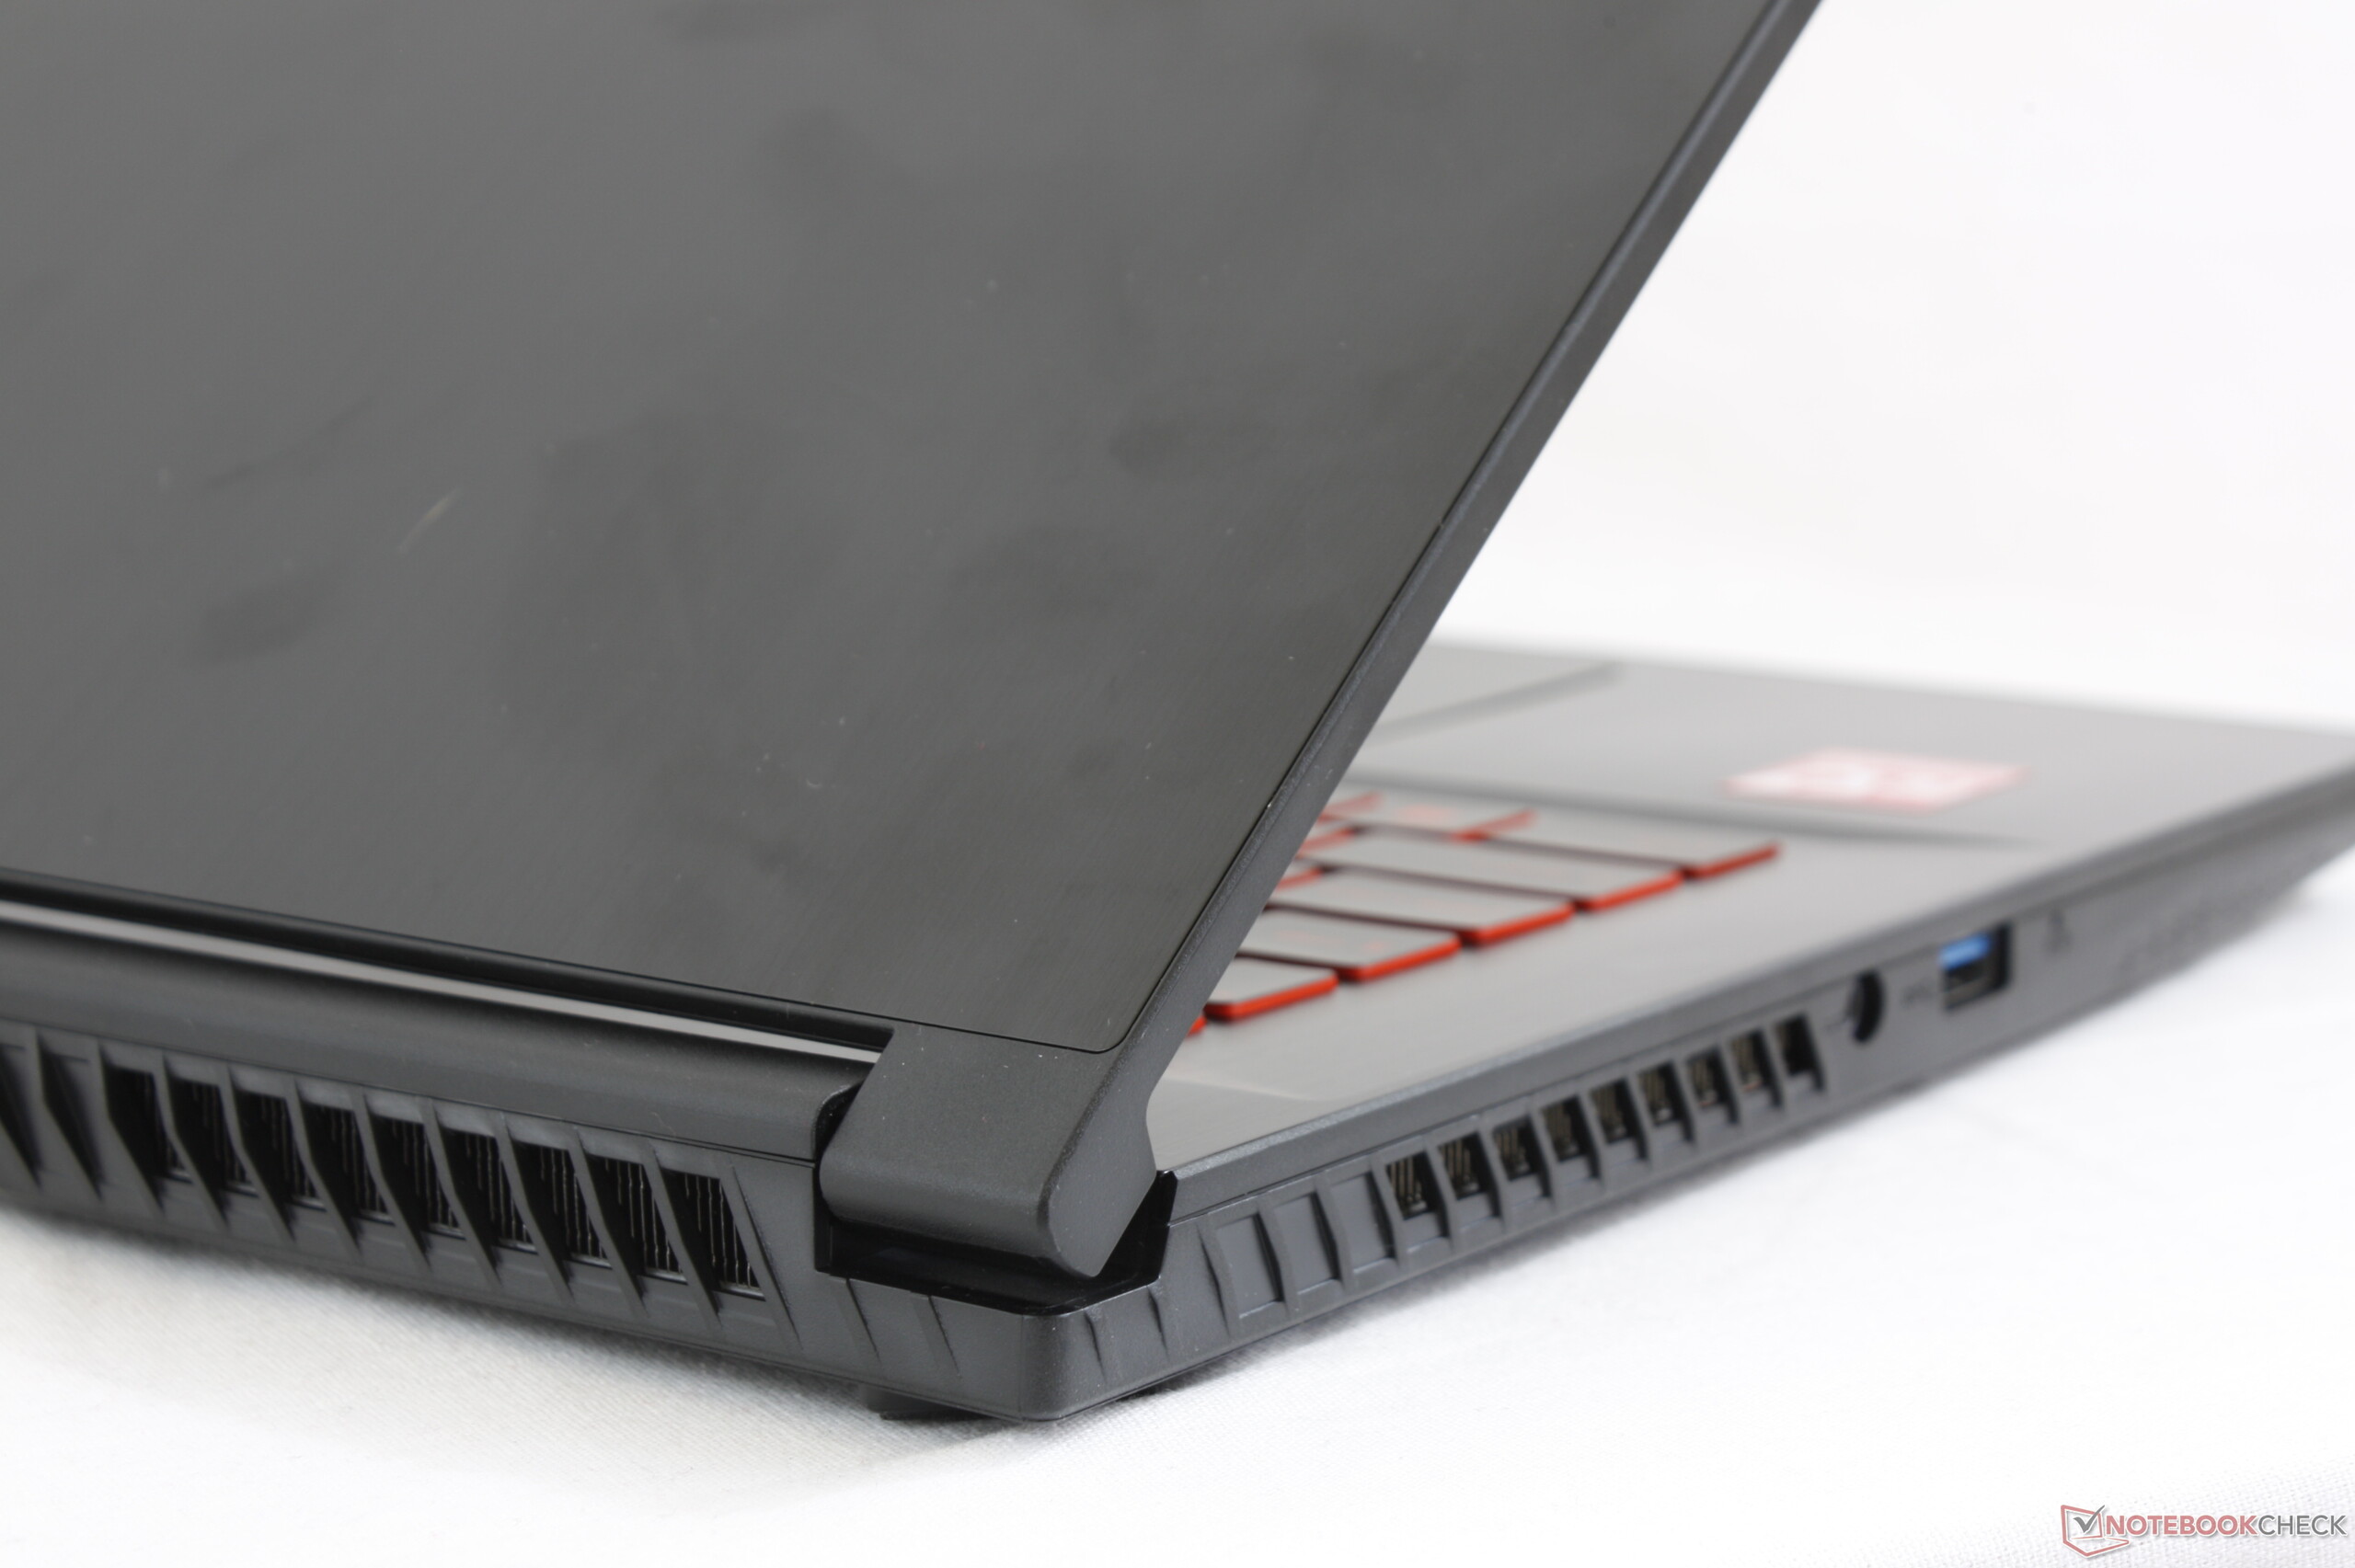
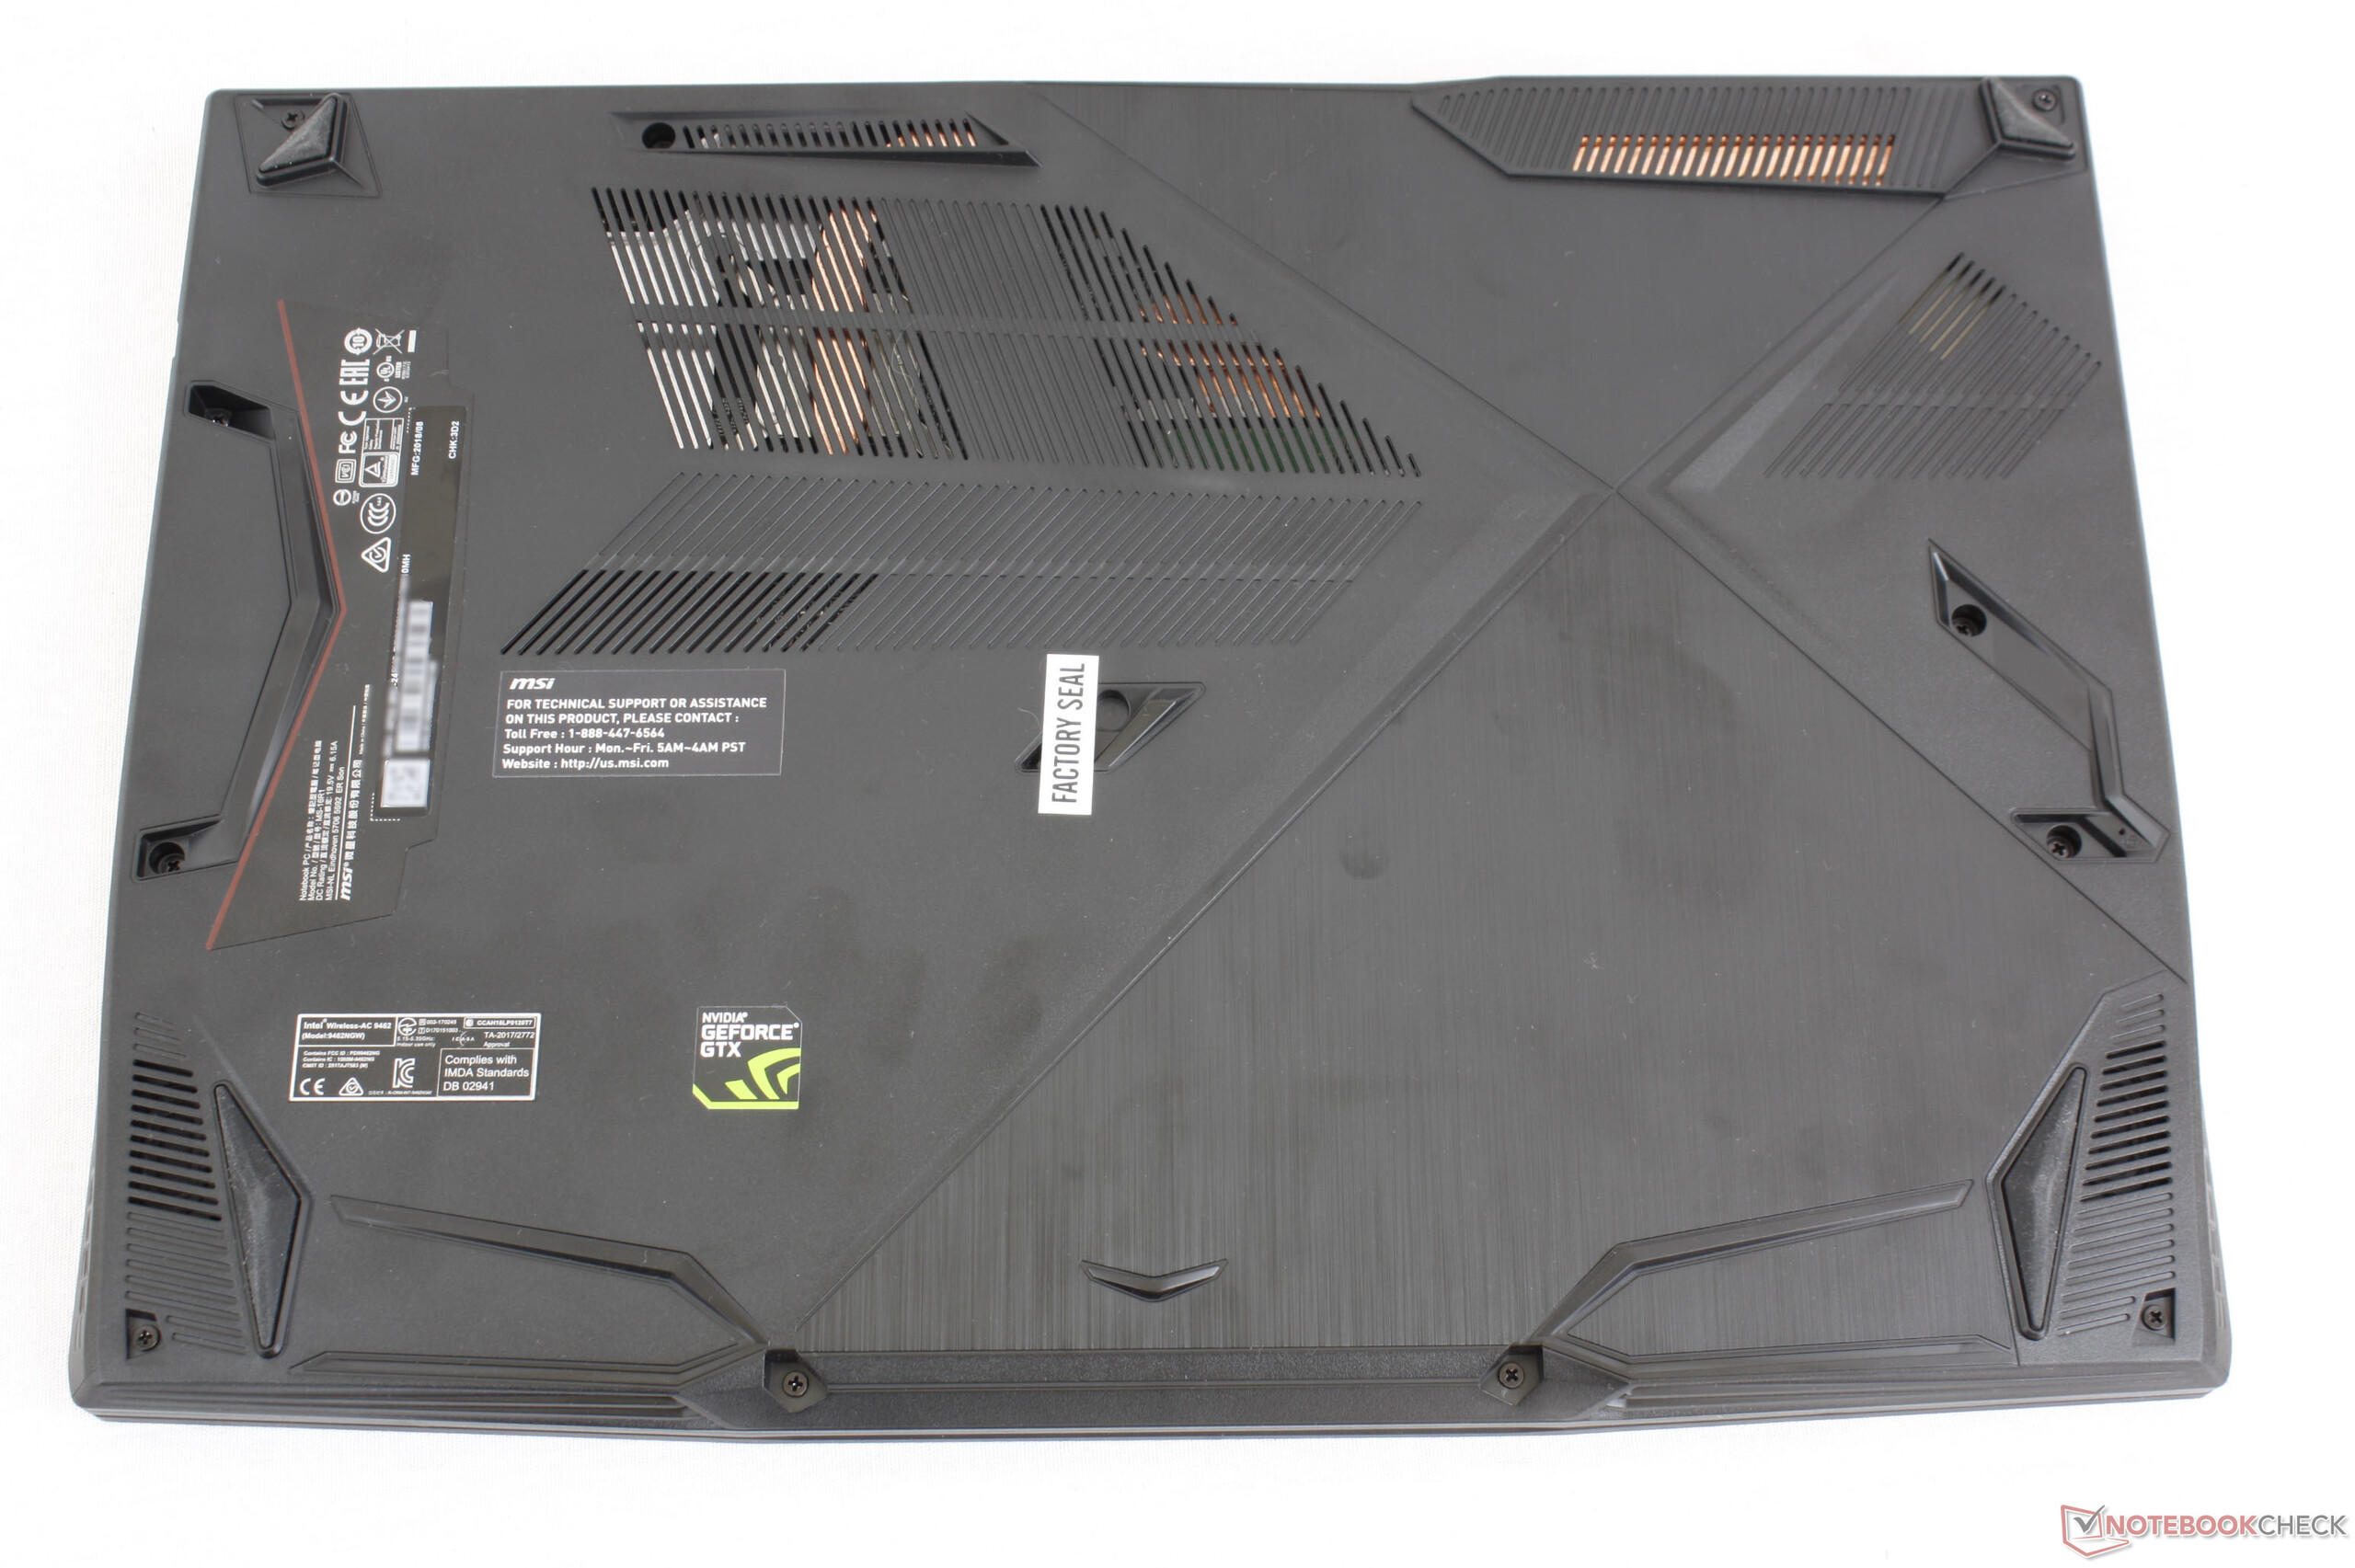
Interestingly, the plastic bottom plate is intricately designed with angles, bumps, and slants in contrast to the rest of the notebook. Aside from aesthetic reasons, the uneven bottom doubles as feet and raises the system slightly for improved airflow.
While we love the new design, there is still room for improvement in terms of rigidity. Light creaking and flexing will occur when attempting to twist the base. The brushed aluminum keyboard deck flexes slightly when applying pressure with a finger and the thin lid is even more susceptible to warping and side-to-side twisting.
As for the hinges, they are satisfactory with minimal teetering when adjusting or transporting. Still, we would have preferred a tighter grip as we're a bit concerned about the longevity of the small hinges. Overall chassis rigidity feels slightly better than the GS65 since the GF63 is thicker, but it is still a few steps below the competing narrow-bezel Asus GL504GM. MSI still needs a bit more time to perfect a sturdier narrow bezel design.
Construction is otherwise excellent on our test unit with no unintended gaps or crevices between materials. The inner bezel could be flatter against the edge of the bottom of the screen, but this is a minor observation.
The GF63 is roughly 31 percent smaller in volume and 14 percent lighter than the last generation GF62VR with dimensions close to that of the GS65. Thus, its portable size is easily the highlight of the system when compared to the competition. The next closest 15-inch narrow bezel gaming laptop is the Lenovo Legion Y530, but it is both heavier and pricier. The new Dell G series laptops are massive and overweight when compared to what MSI has to offer for budget-conscious gamers.
Connectivity
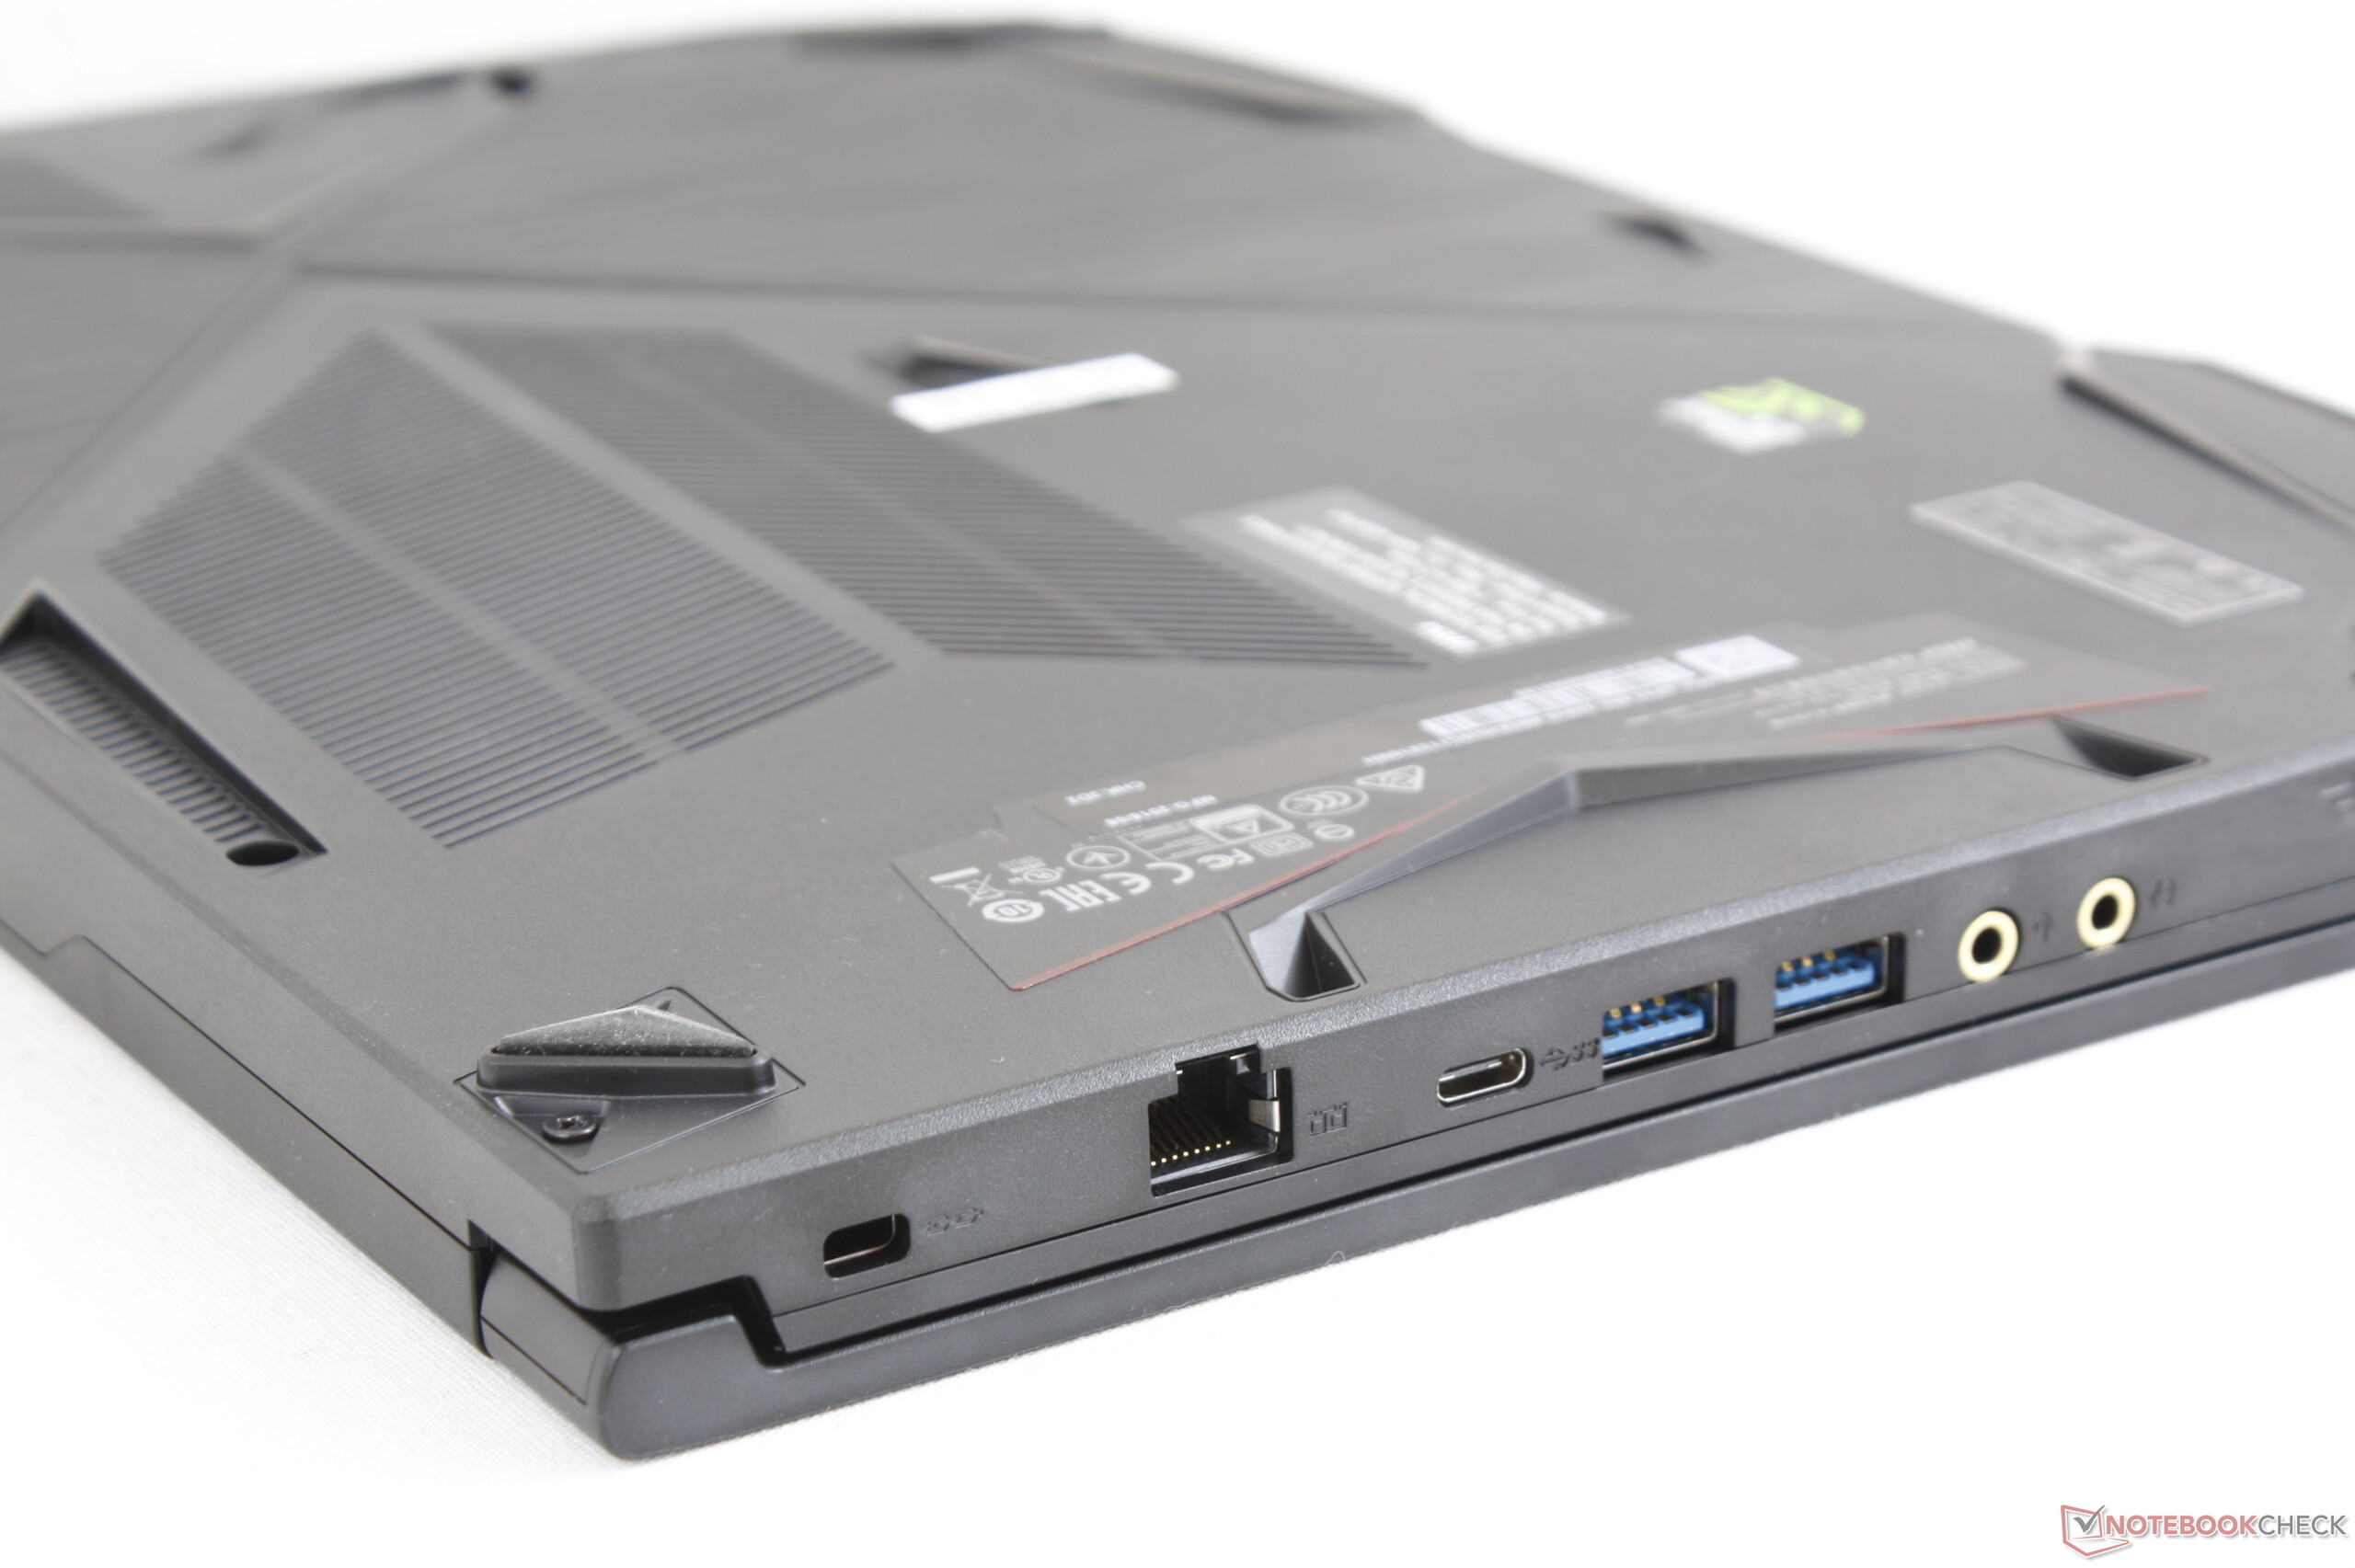
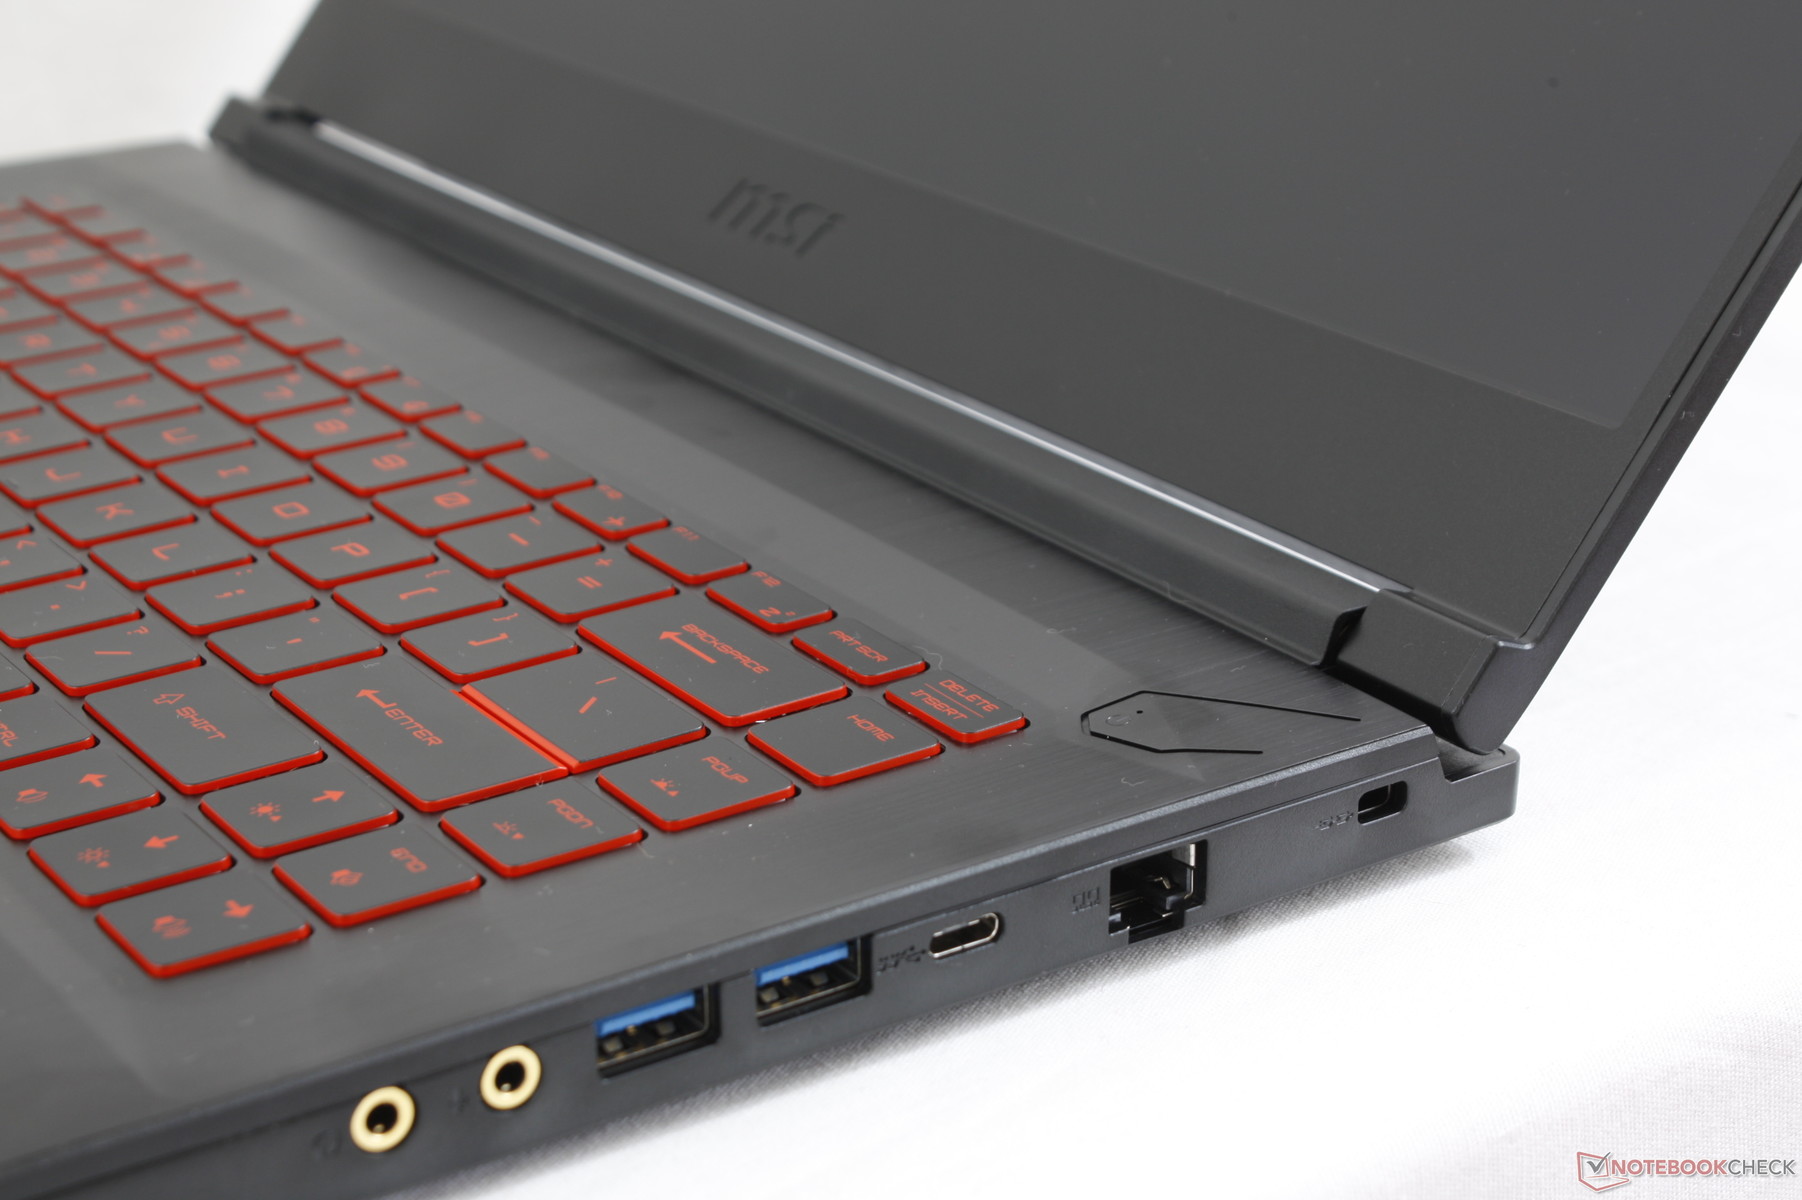
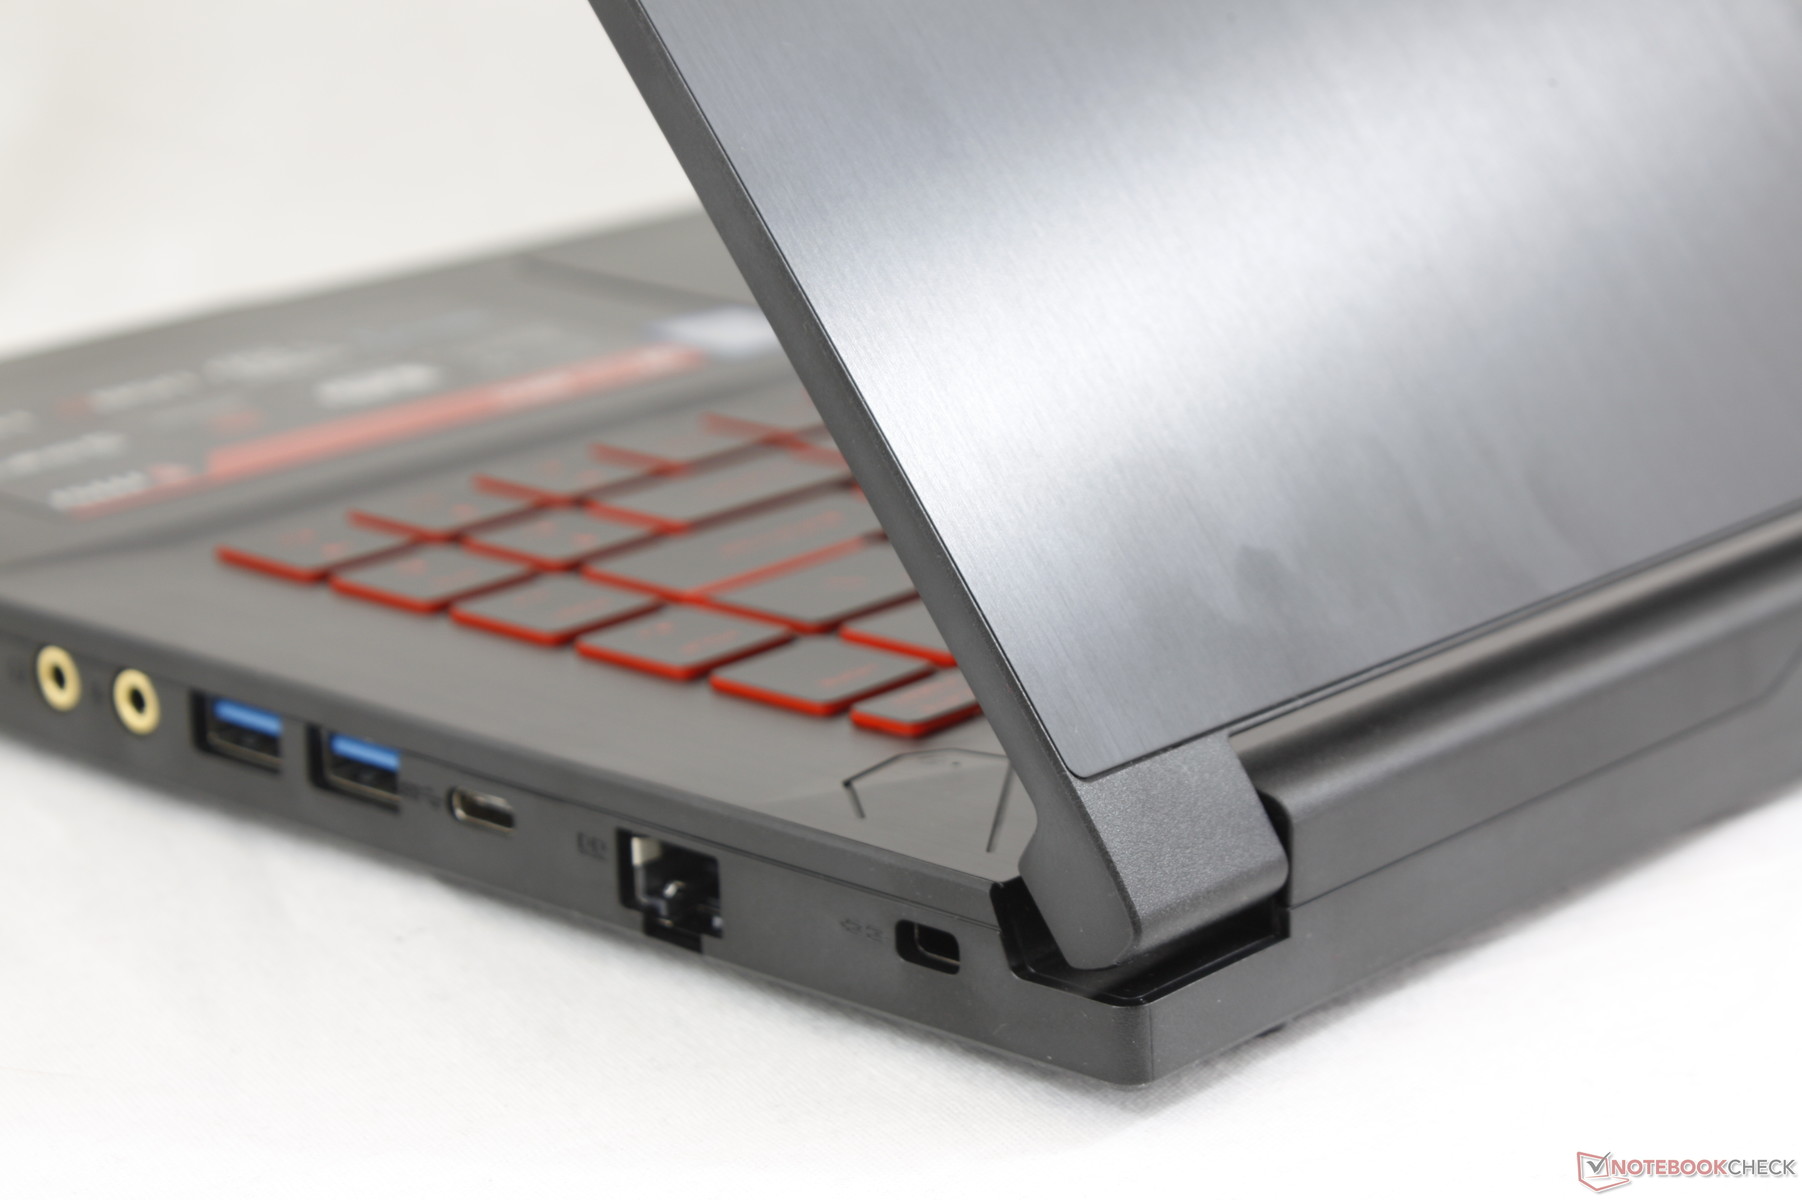
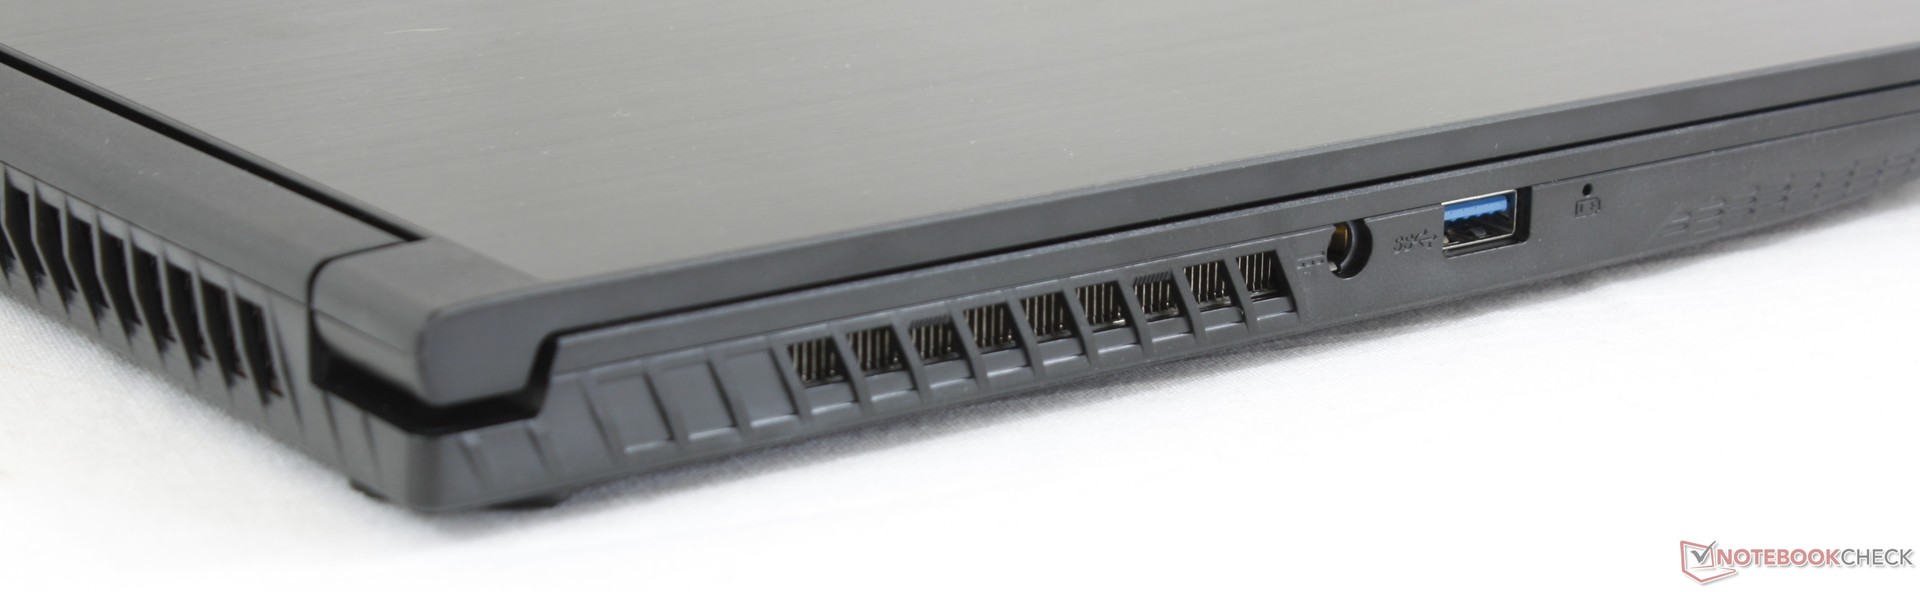
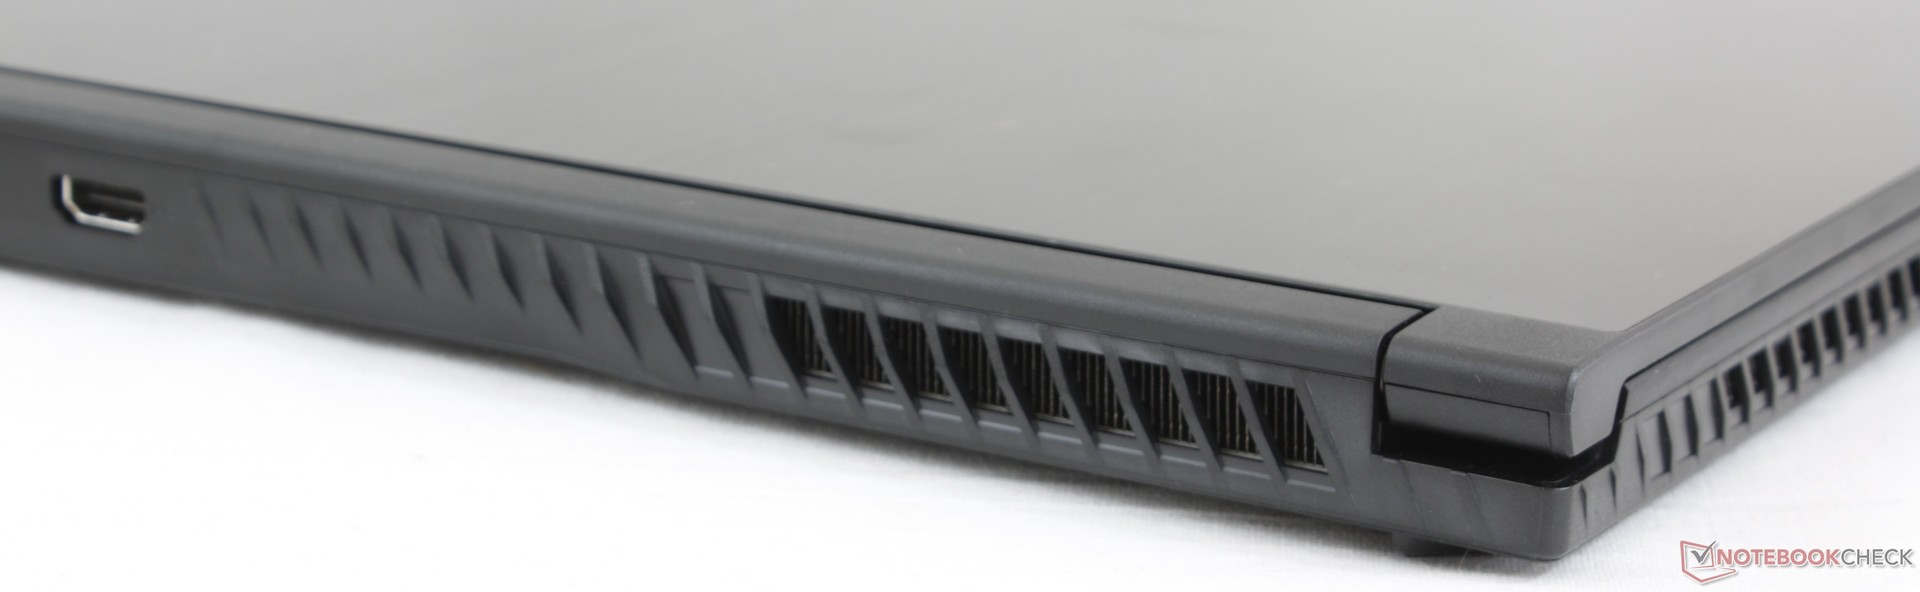
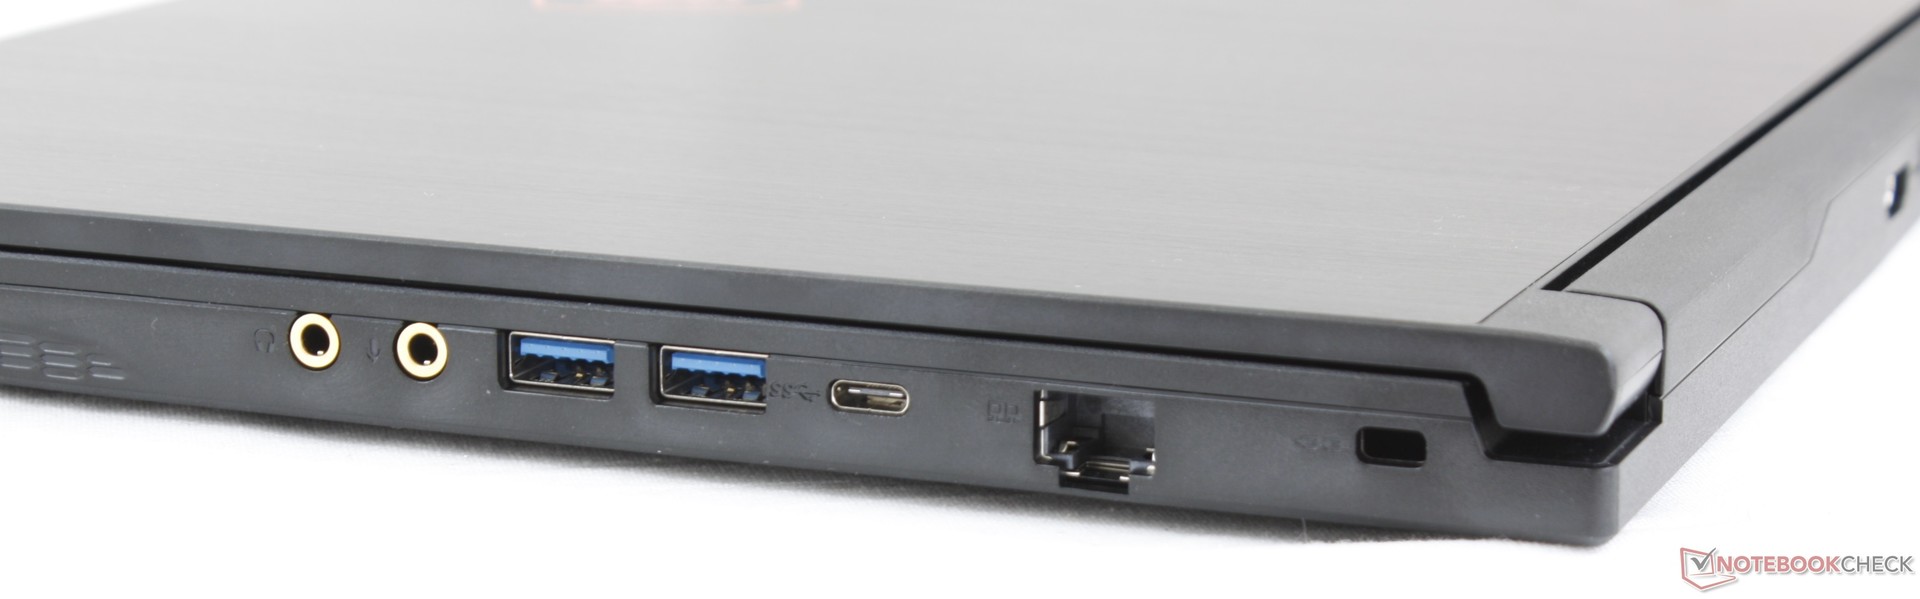
MSI has made a bunch of changes to ports and port placement from the GF62VR. The GF63 includes all ports from the GF62VR save for the SD card reader and mini DisplayPort and all existing ports have been rearranged to reduce desk clutter. There is no Thunderbolt 3 support, but that is to be expected for its price category.
Communication
The Intel 9462 is a 1x1 WLAN card capable of transfer rates of up to 433 Mbps. In comparison, higher-end gaming laptops like the Asus GL504GM are shipping with 2x2 Intel 9560 WLAN cards that can run up to 1.73 Gbps. It's clearly a cut corner, but casual or mainstream gamers will likely not notice in practice. Both 802.11ac and Bluetooth 5 are thankfully still supported and we didn't experience any connectivity issues during testing.
| Networking | |
| iperf3 transmit AX12 | |
| Asus Strix GL504GM | |
| MSI GS65 Stealth Thin 8RE-051US | |
| Dell G5 15 5587 | |
| MSI GF62VR 7RF-877 | |
| MSI GF63 8RC | |
| iperf3 receive AX12 | |
| MSI GS65 Stealth Thin 8RE-051US | |
| MSI GF62VR 7RF-877 | |
| Asus Strix GL504GM | |
| Dell G5 15 5587 | |
| MSI GF63 8RC | |
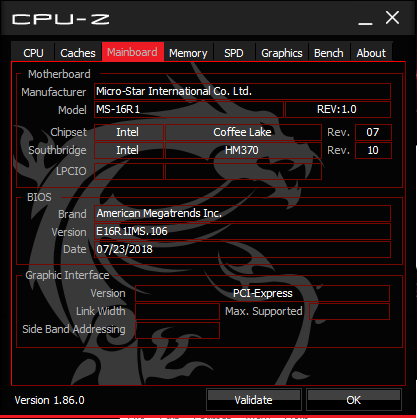
Maintenance
The bottom panel is secured by 12 Philips screws and removing the panel requires breaking a factory sticker. MSI has informed us that it will accept returns with broken seals so long as the end-user was only upgrading the storage or RAM. If trying to return the system to a reseller or store, however, all bets are off as a broken factory seal is usually an automatic red flag. We're hopeful that MSI will remove the seal from its lineup one day as most other gaming laptops have none for the bottom panel.
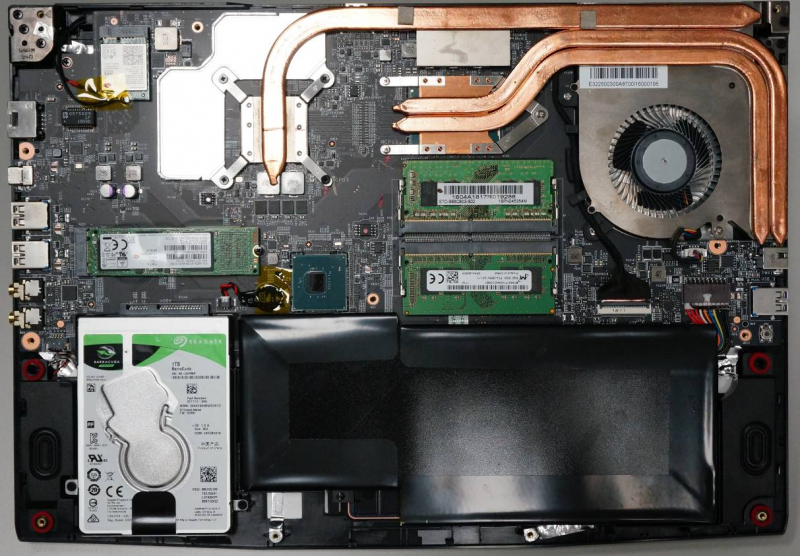
Once inside, users have easy access to the both storage bays, both DDR4 SODIMM slots, and the removable WLAN module.
Accessories and Warranty
There are no extras in the box save for a velvet cleaning cloth.
The limited one-year limited manufacturer warranty applies. MSI requires owners to register the purchased product online before submitting any questions. Please see our Guarantees, Return policies and Warranties FAQ for country-specific information.
Input Devices
Keyboard
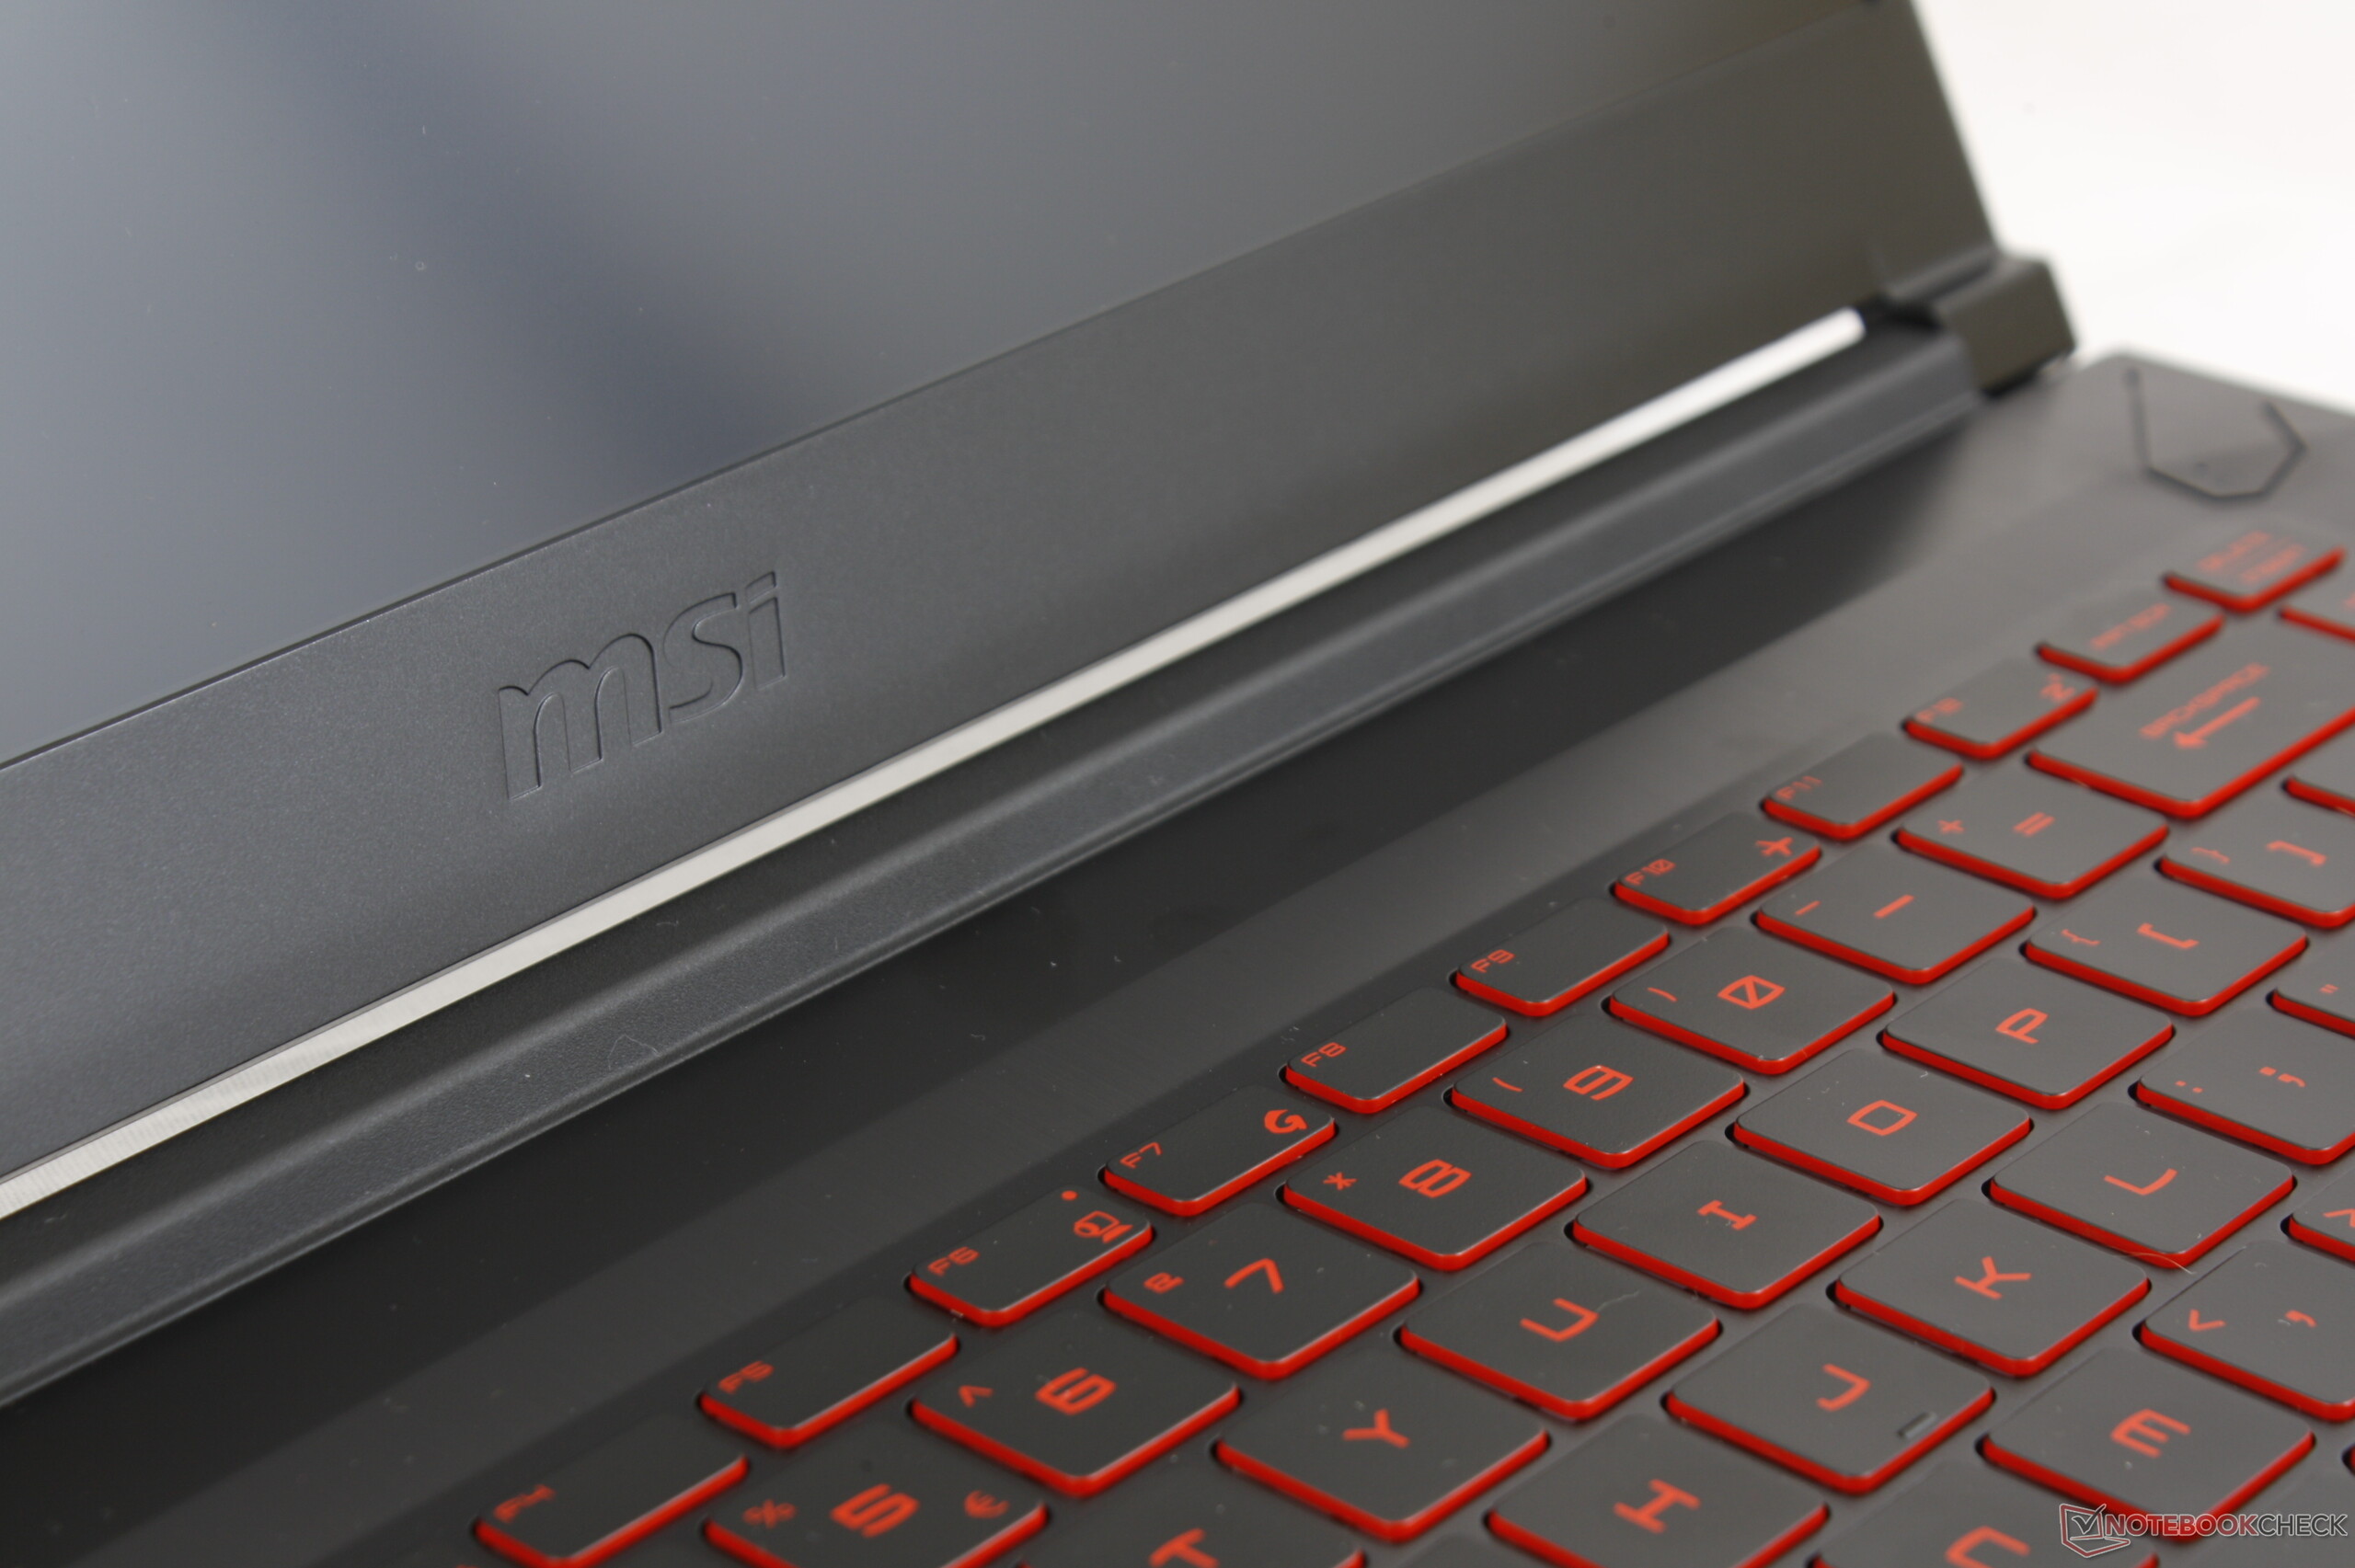
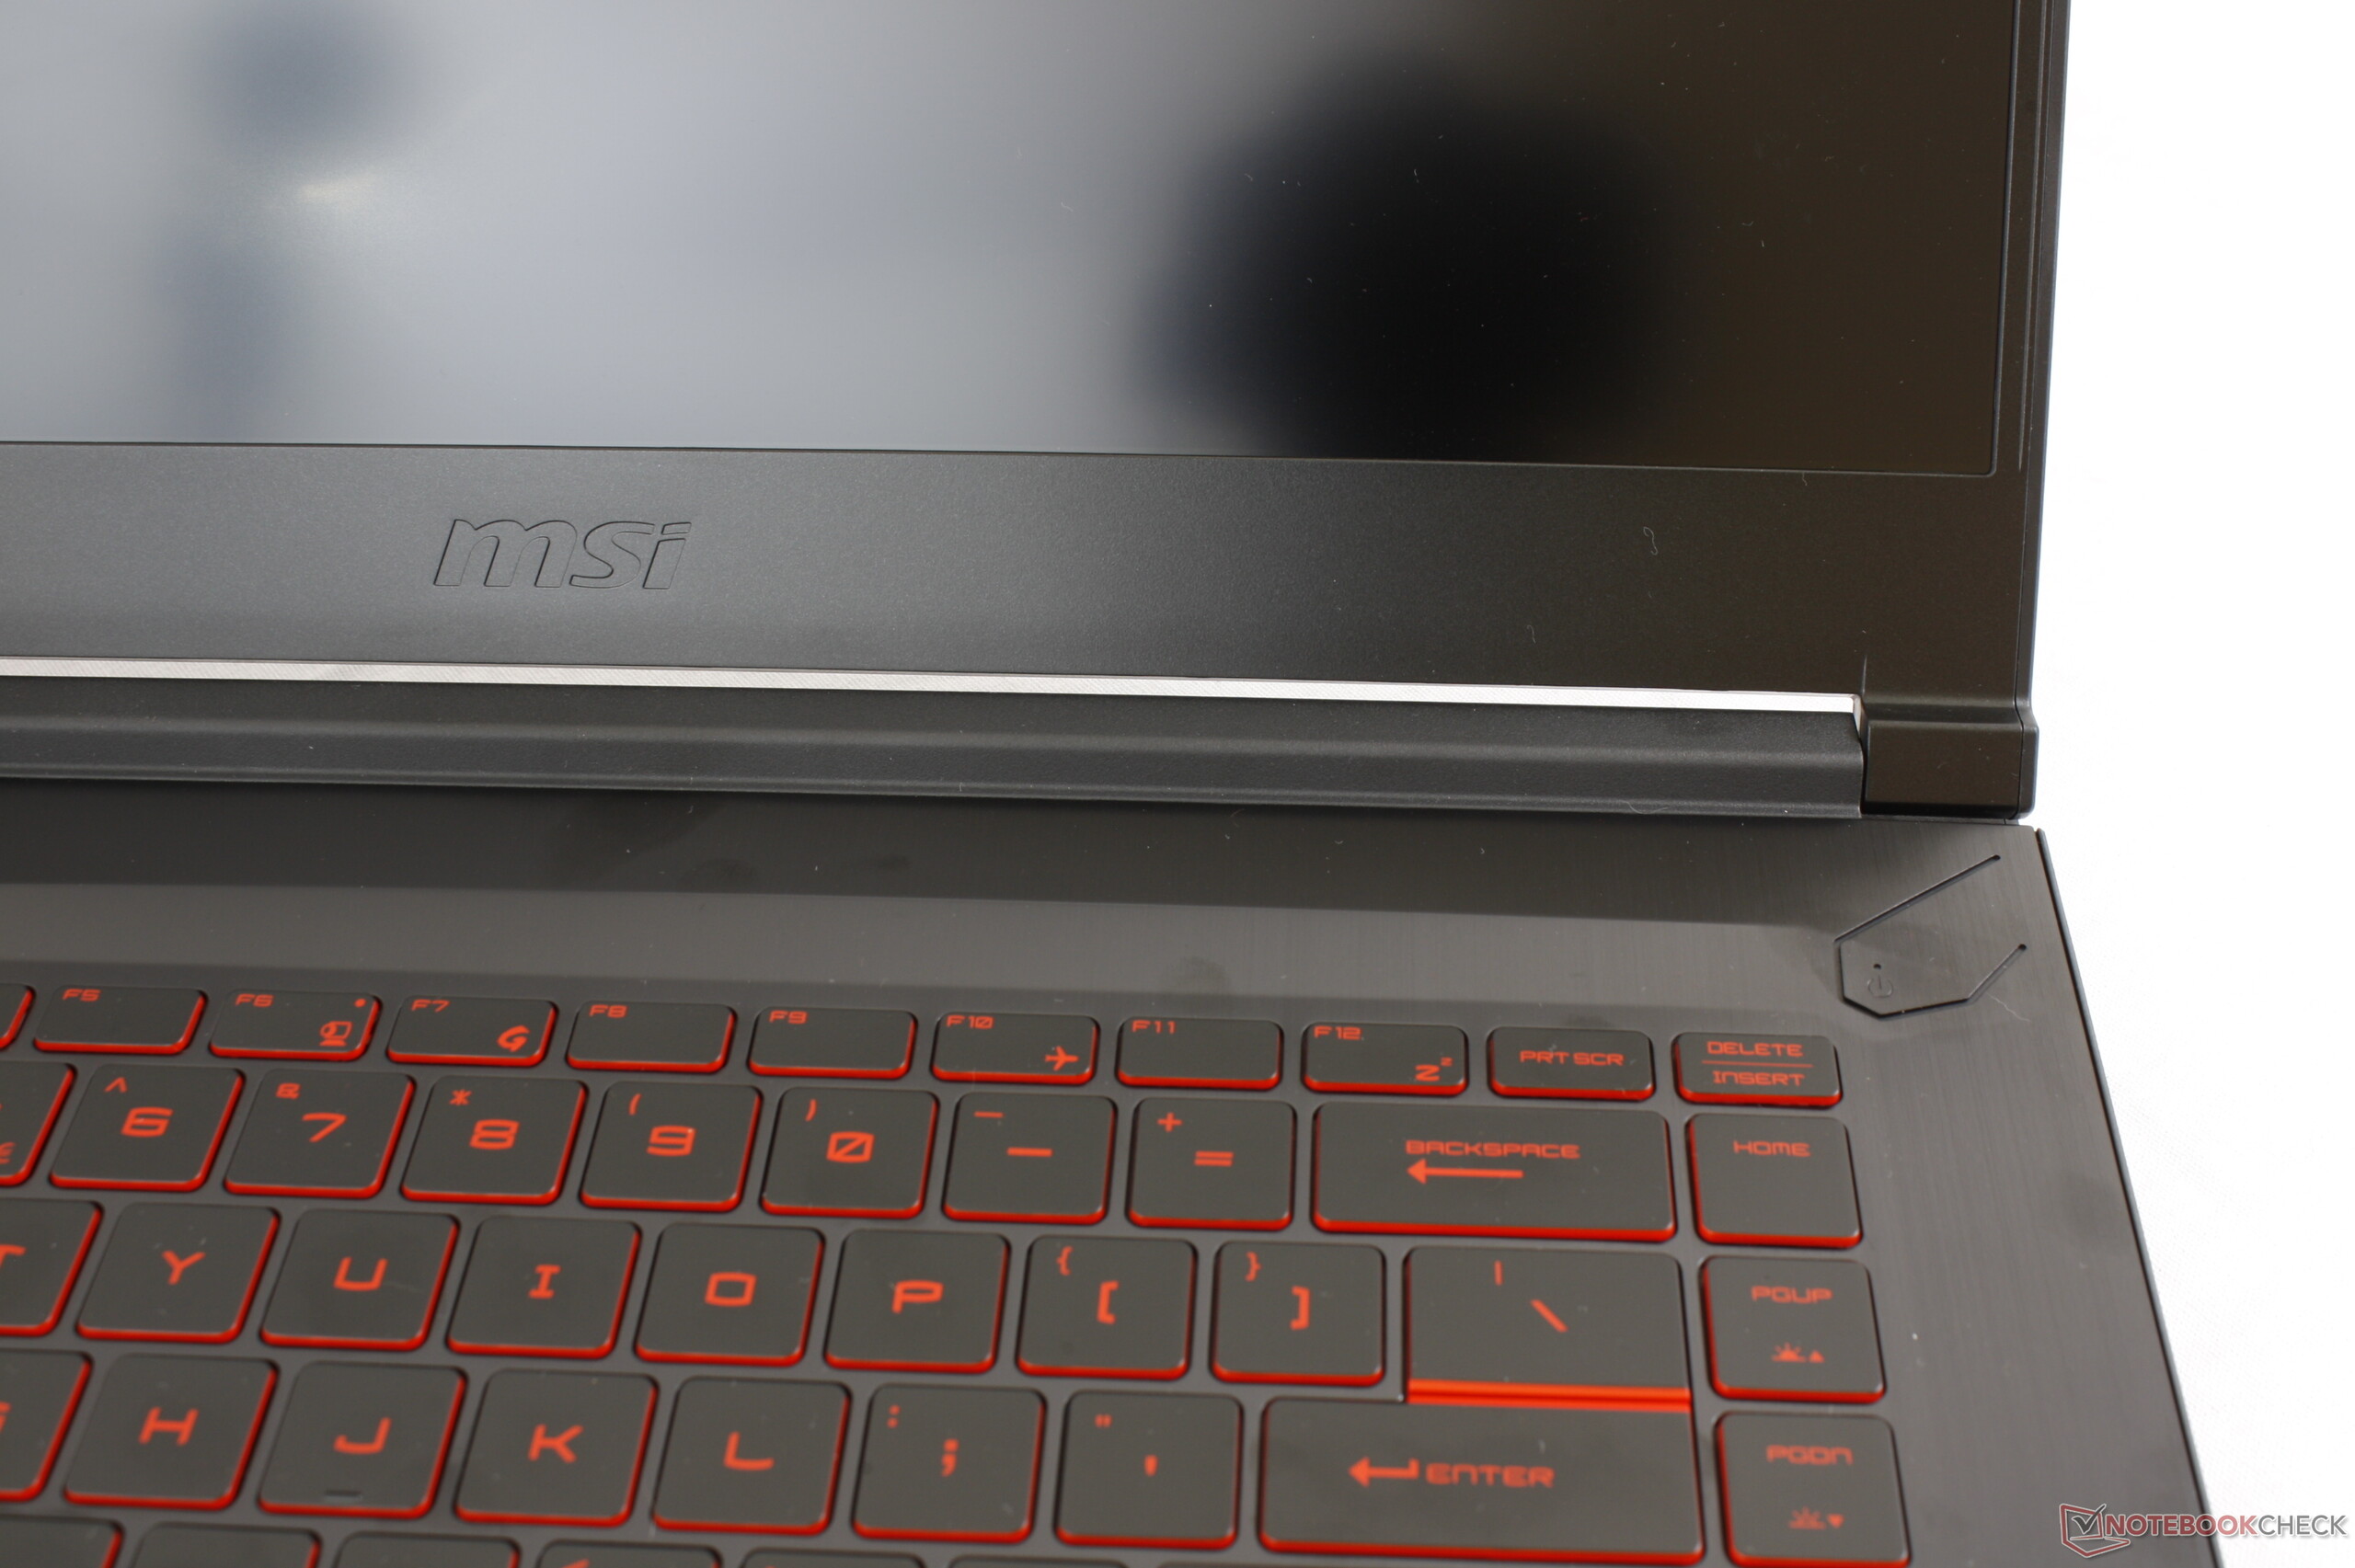
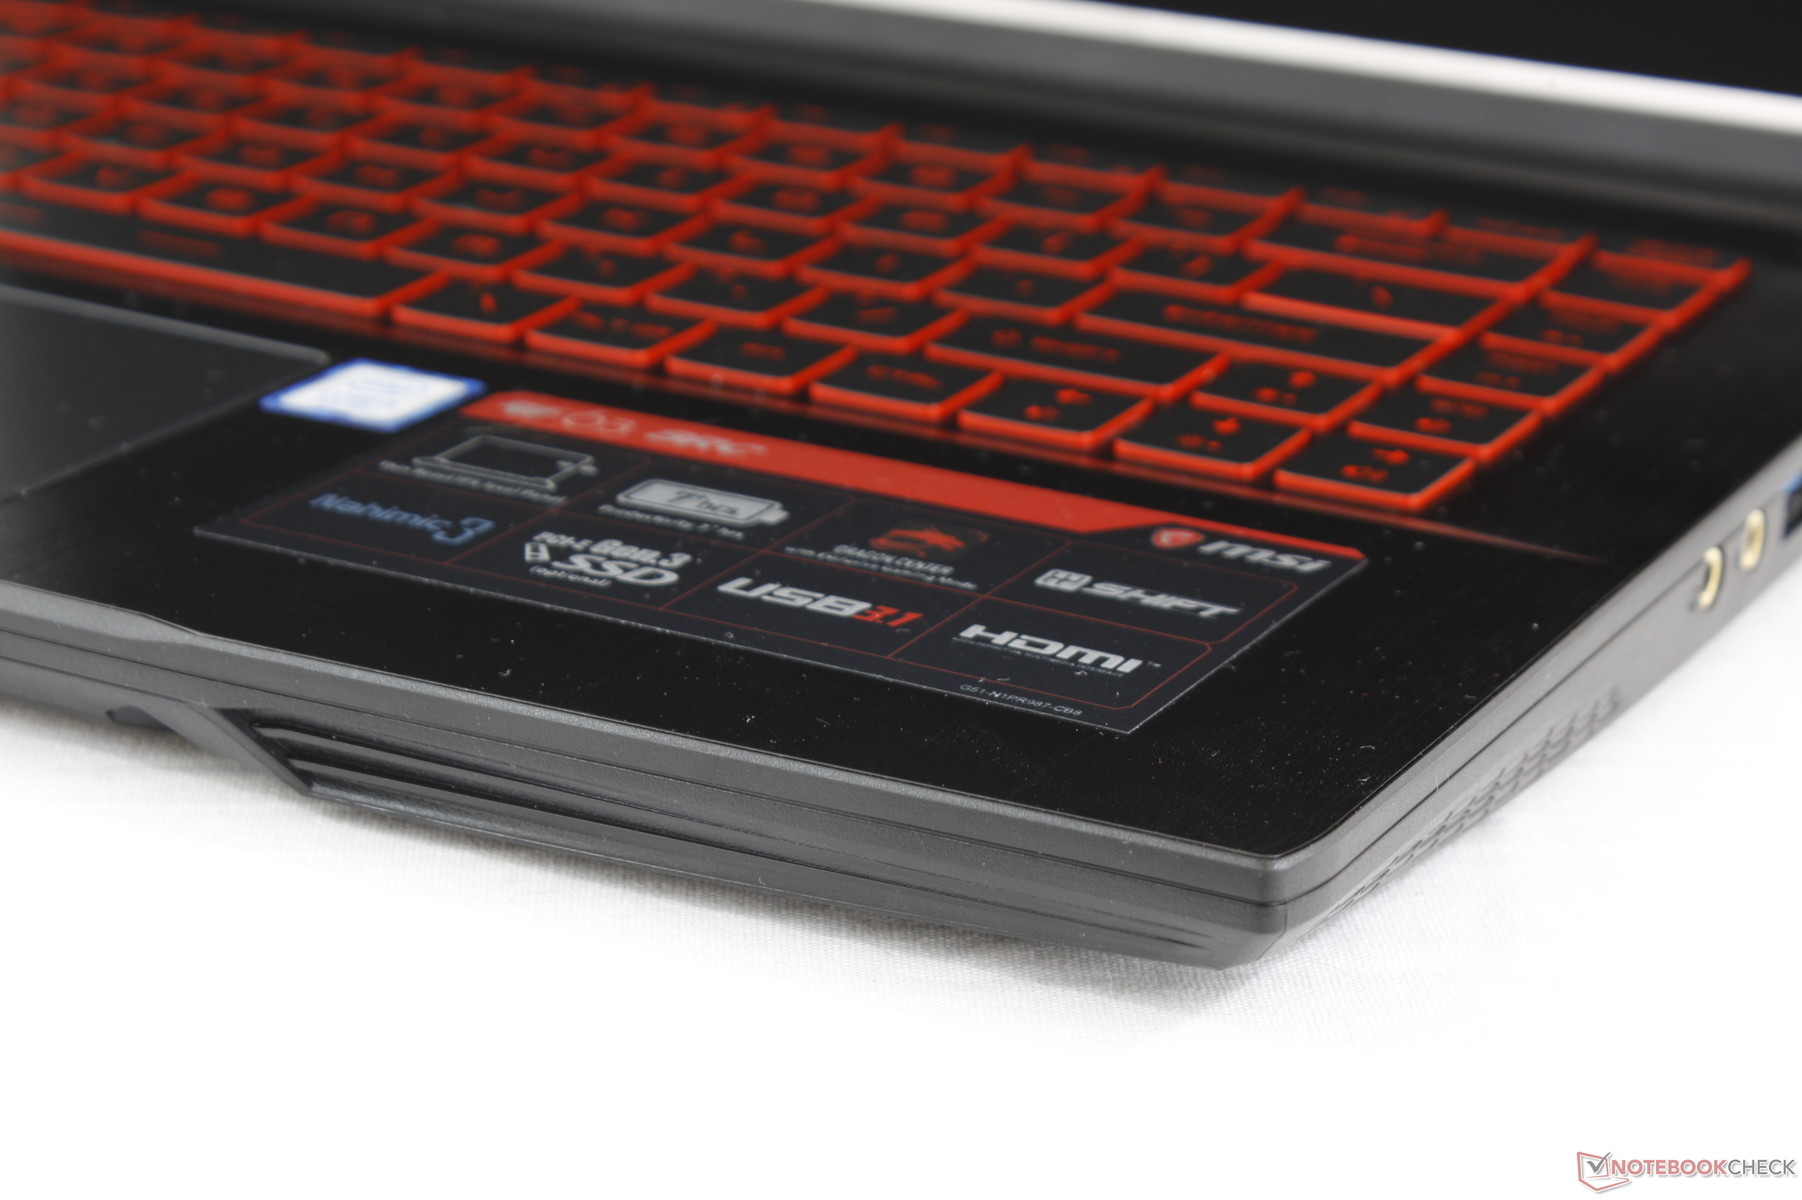
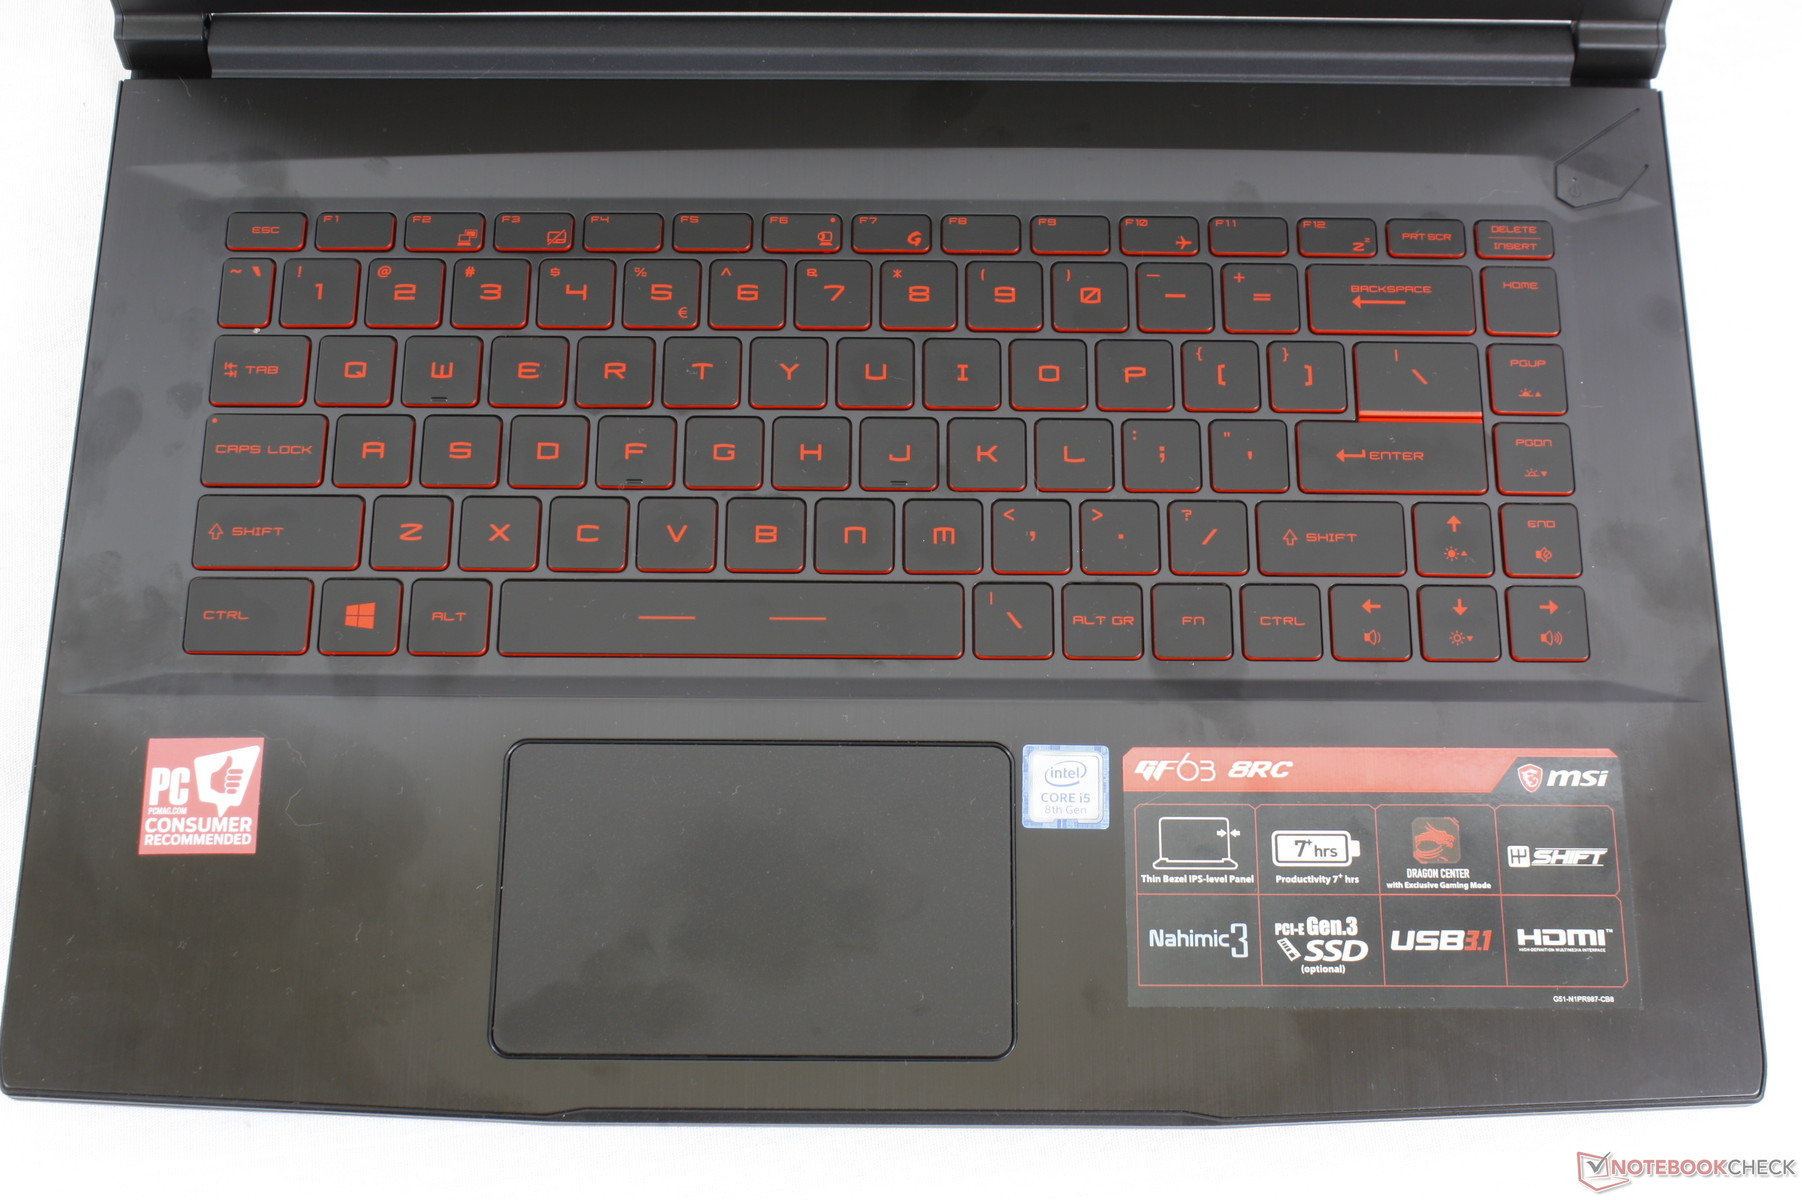
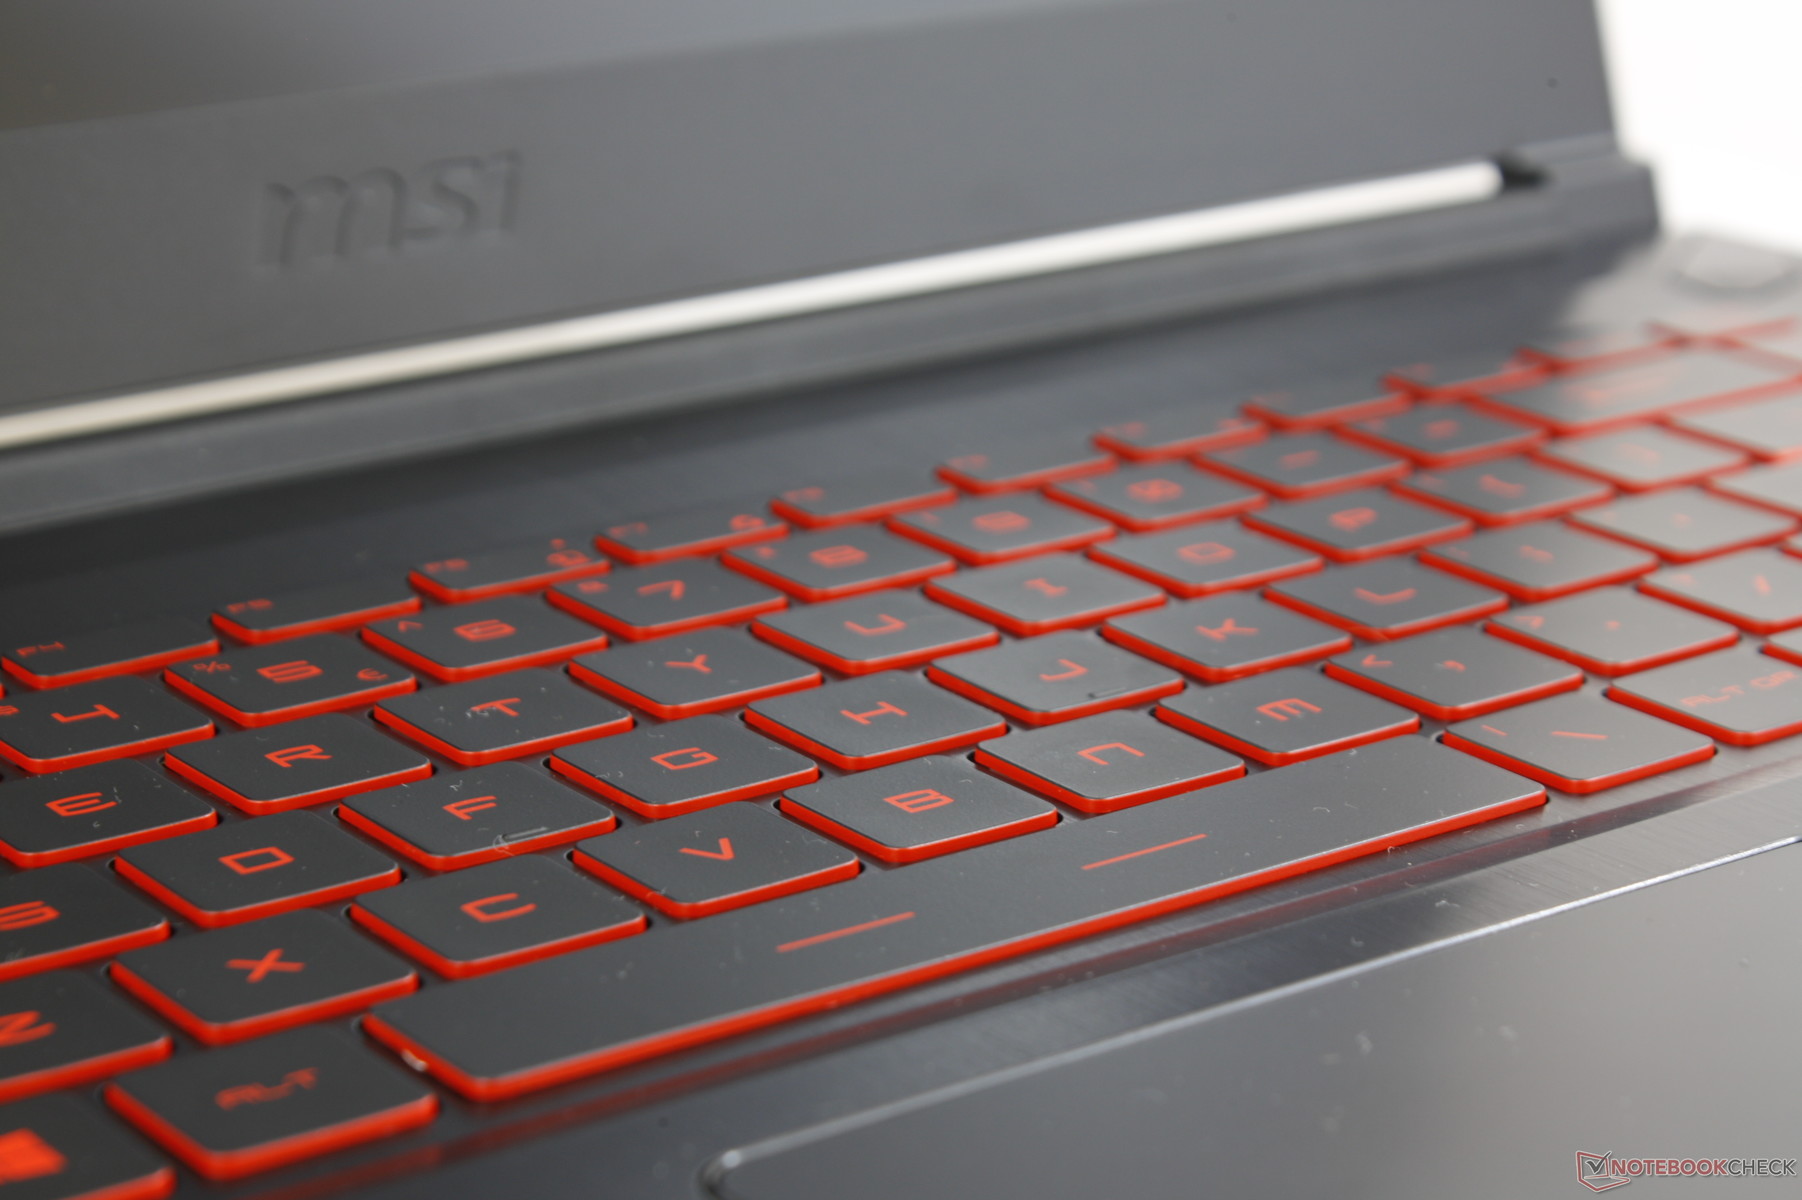
MSI has completely revamped both the keyboard and touchpad from last year's model. The NumPad and tri-zone RGB lighting on the GF62VR keyboard are now gone likely to save on cost and weight. Fortunately, the Arrow keys are still full-size which is an uncommon find on many laptops and feedback feels uniform across all main keys including the Backspace, Delete, and Space keys. Travel, however, remains similar to the GF62VR if not shallower for an overall light typing experience. Firmer feedback would have been appreciated to be closer to the GE series or a desktop keyboard.
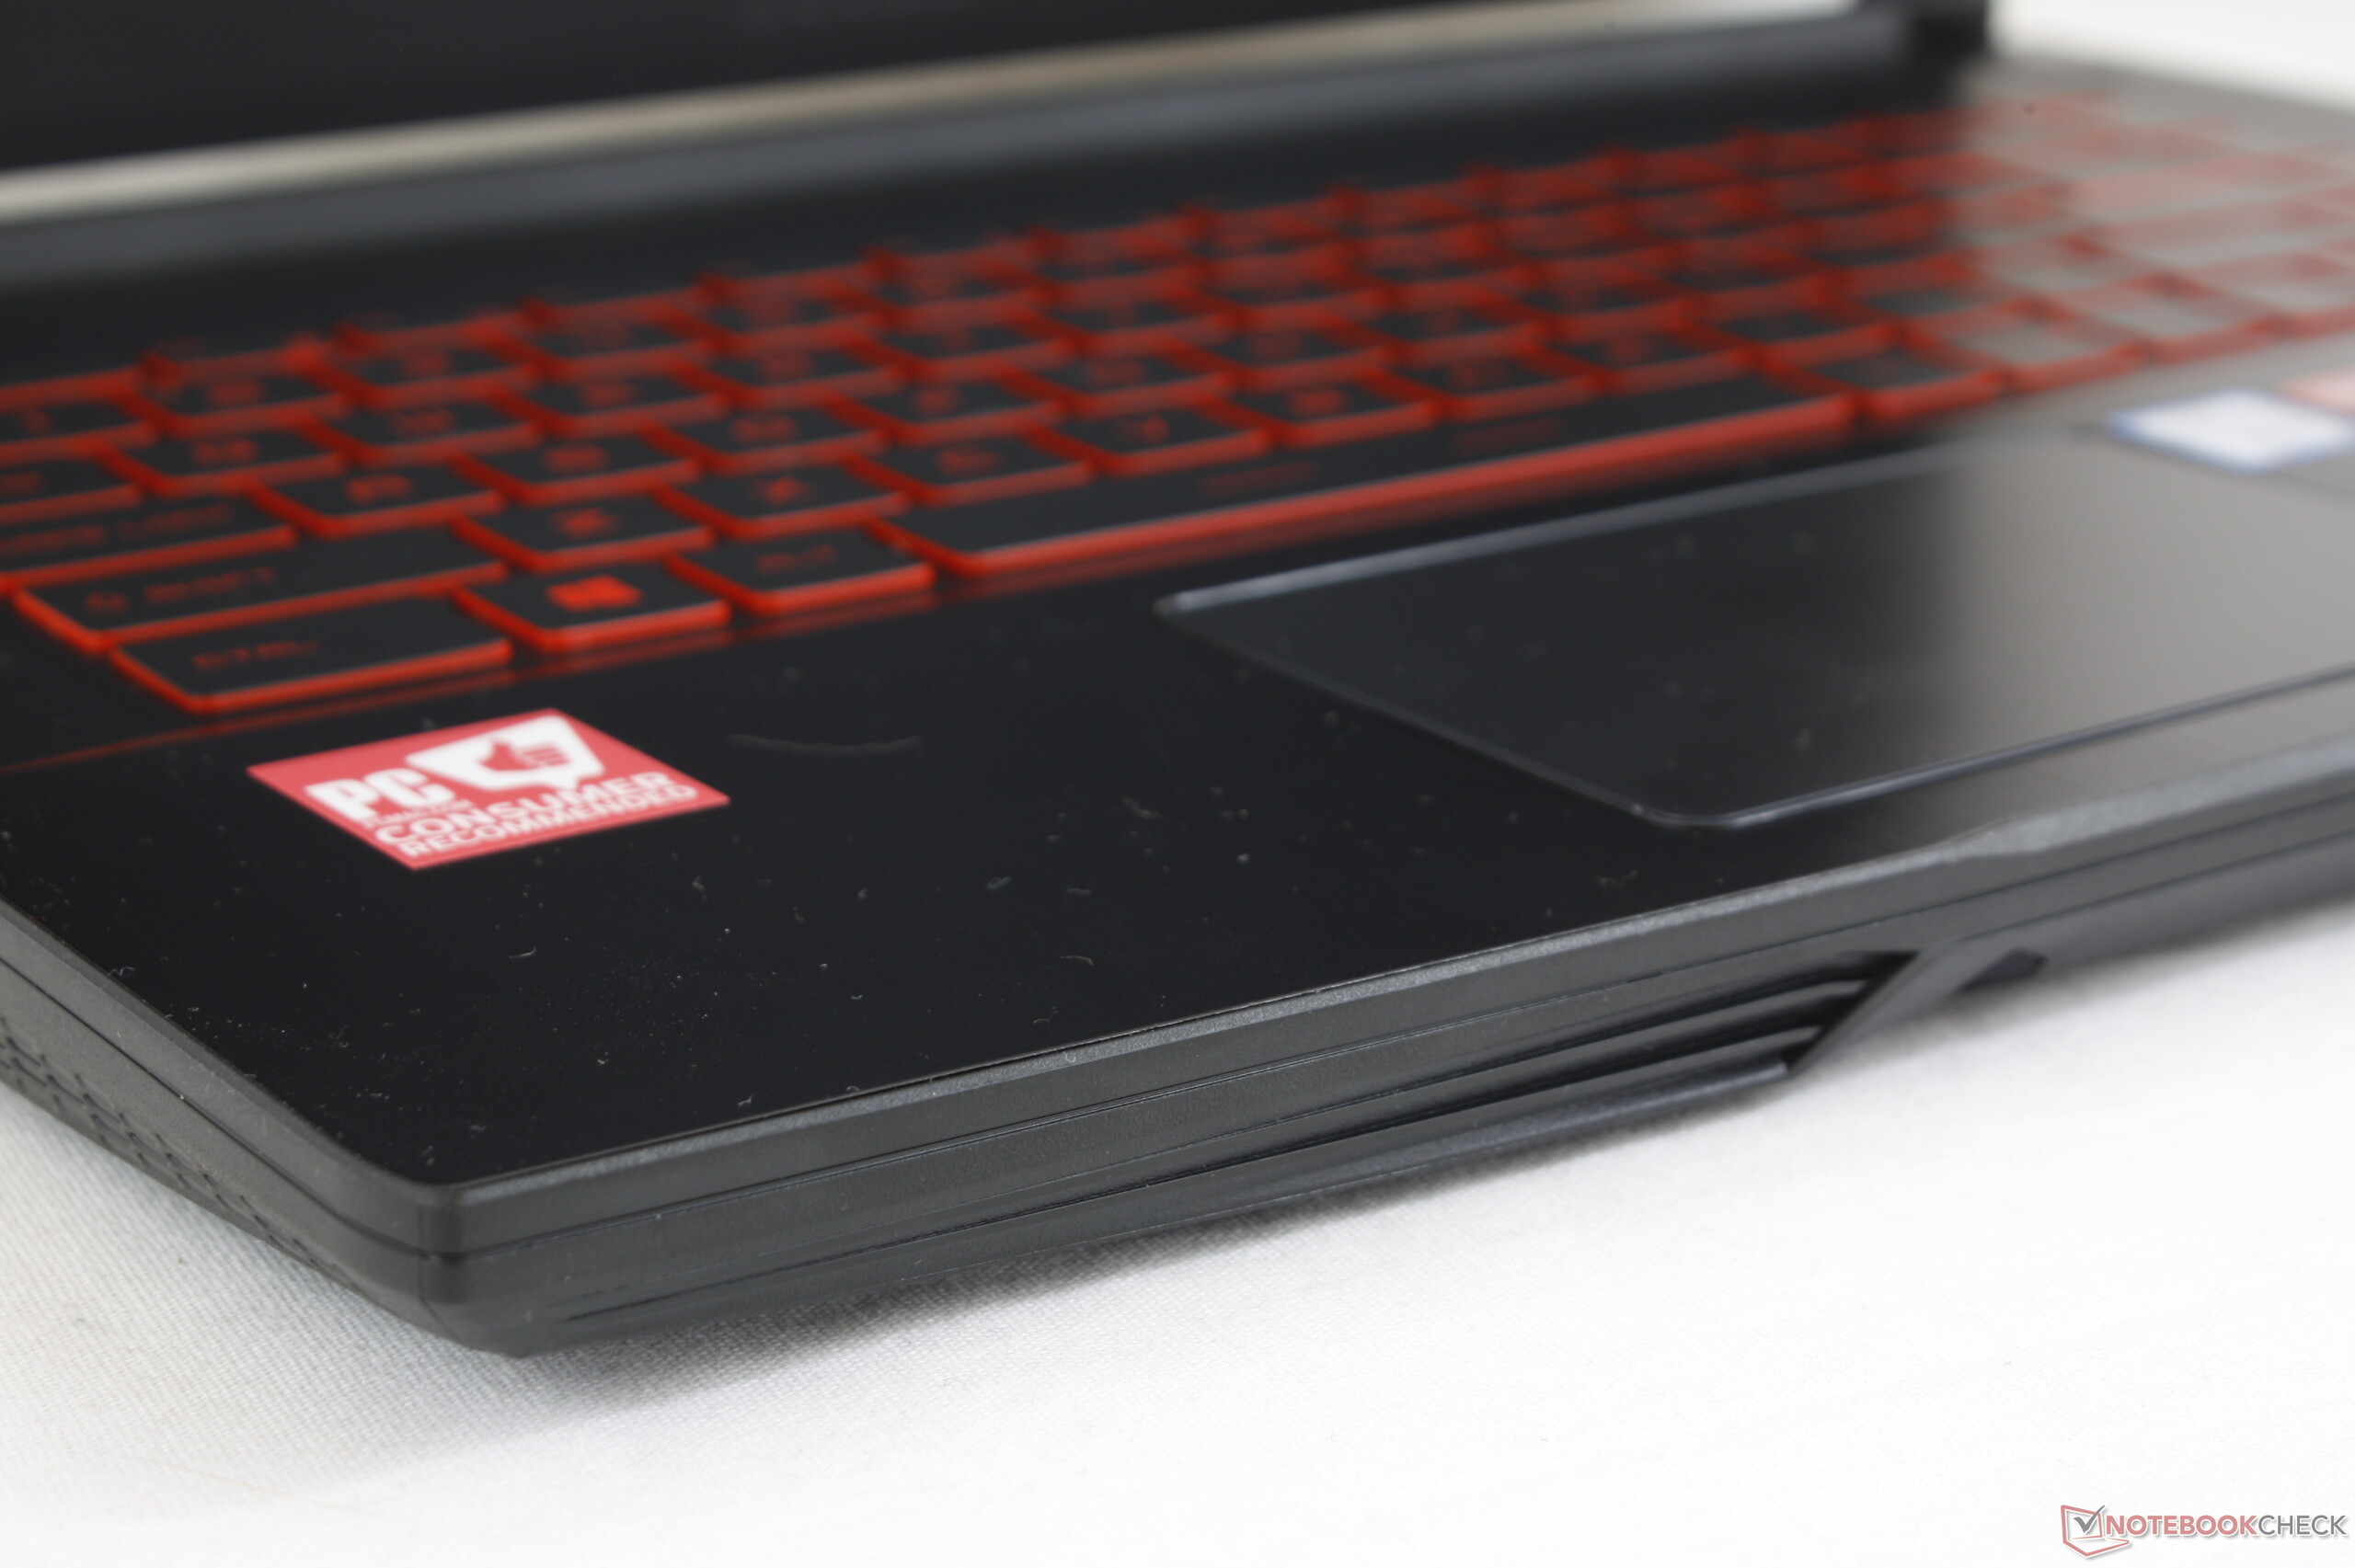
Touchpad
The touchpad is disappointingly poorer than the touchpad of the GF62VR. Not only is its surface area slightly smaller (10.6 x 6.5 cm vs. 10.8 cm x 6.0 cm), but it omits the dedicated mouse keys on the last generation model. Thus, simple actions like dragging and dropping are more difficult on the GF63 than on the GF62VR. Additionally, clicking on the touchpad produces a spongy and unsatisfying click with short-medium travel. Cursor control is otherwise smooth with only a small amount of sticking when gliding across the plastic surface. Be prepared for unsightly fingerprint buildup over time.
Display
All launch SKUs of the GF63 come equipped with 60 Hz 1080p IPS panels as standard with no other options. Brightness and contrast are improved over the TN panel of the GF62VR at the cost of slightly slower black-white and gray-gray response times. Overall characteristics are actually very similar to the LG panel on the competing Dell G5 5587. Users who want even faster response times and refresh rates for less ghosting should consider the GS65.
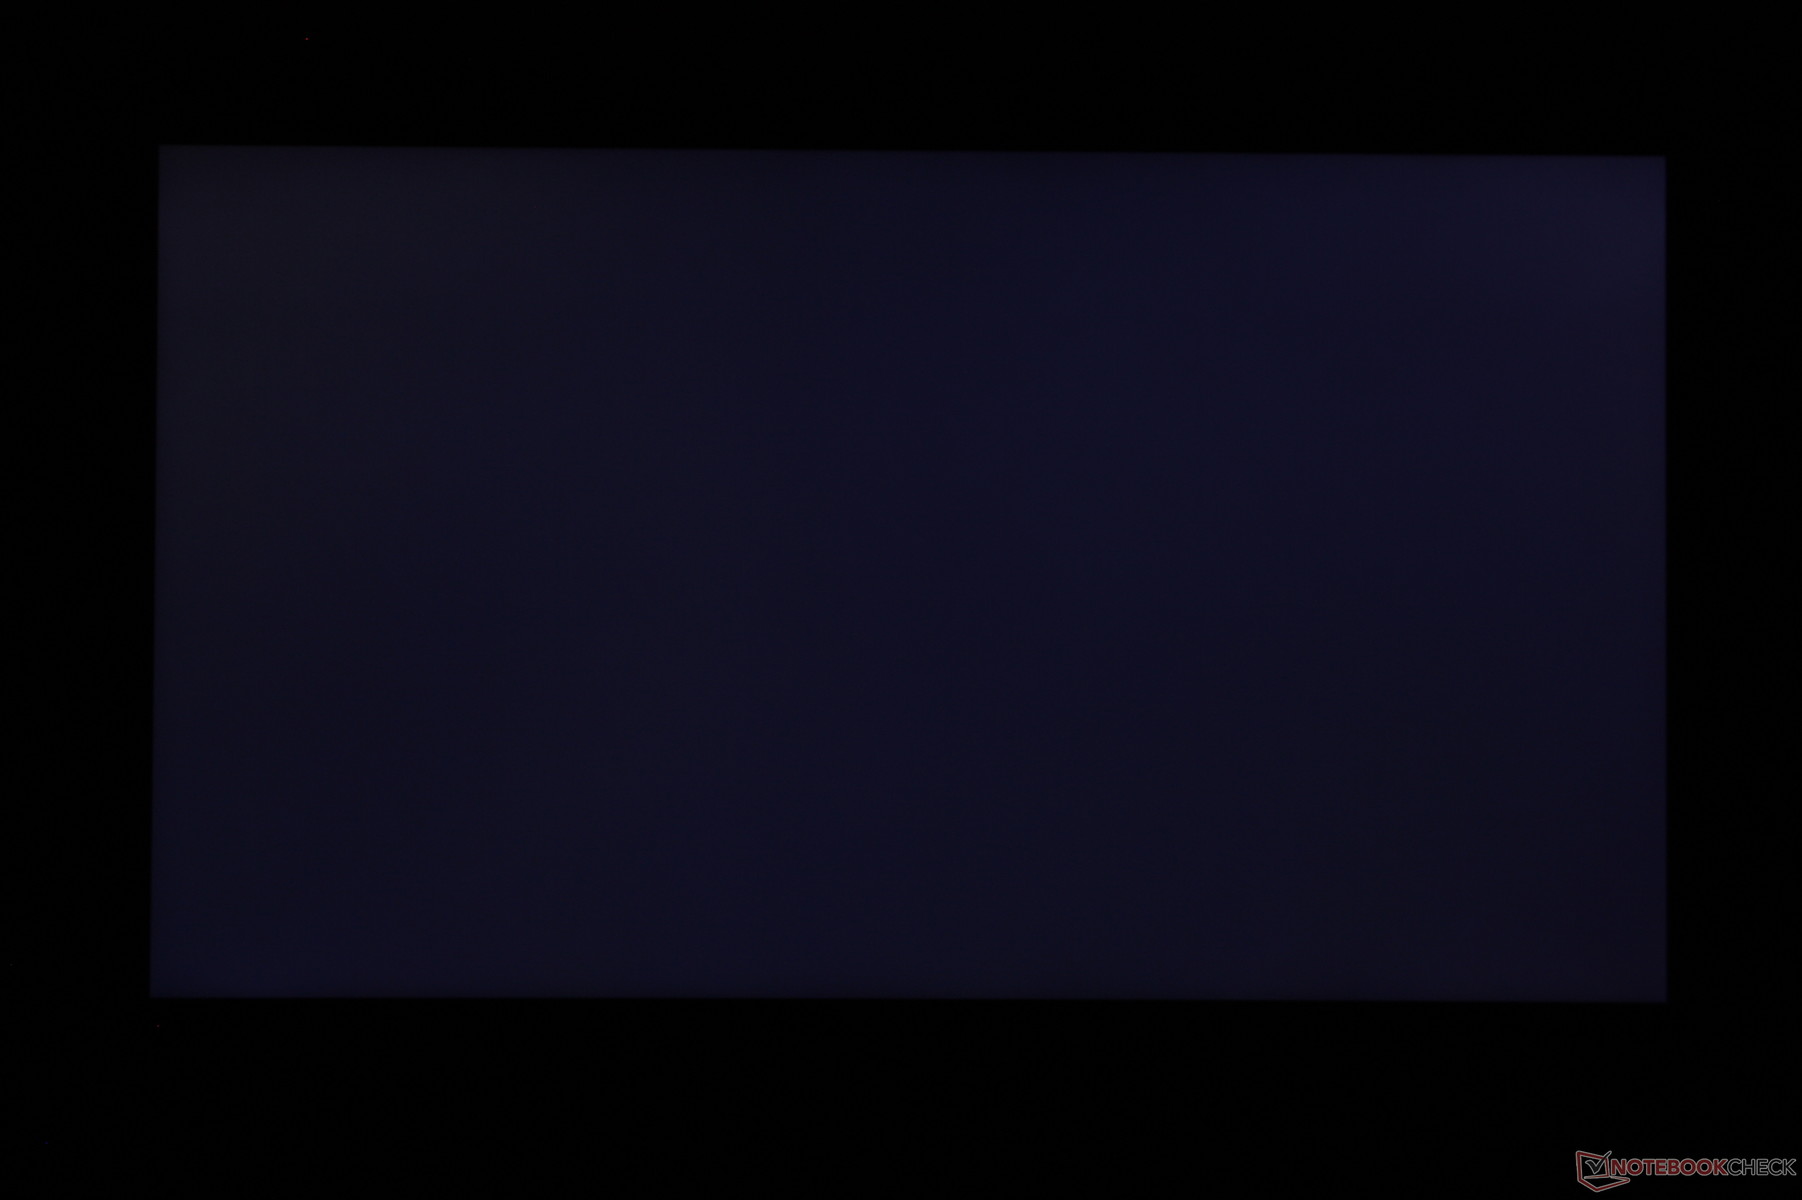
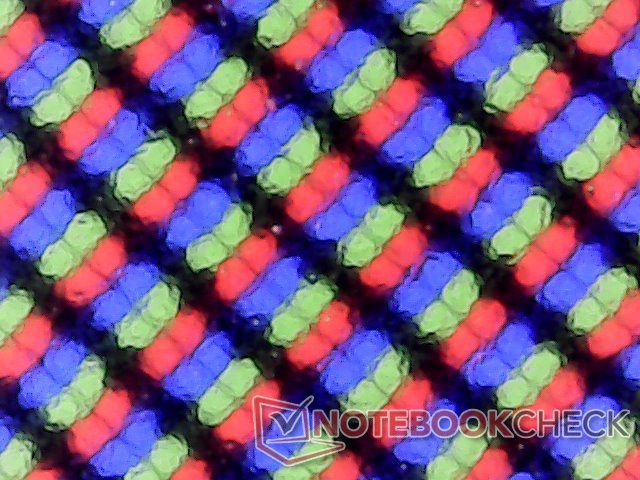
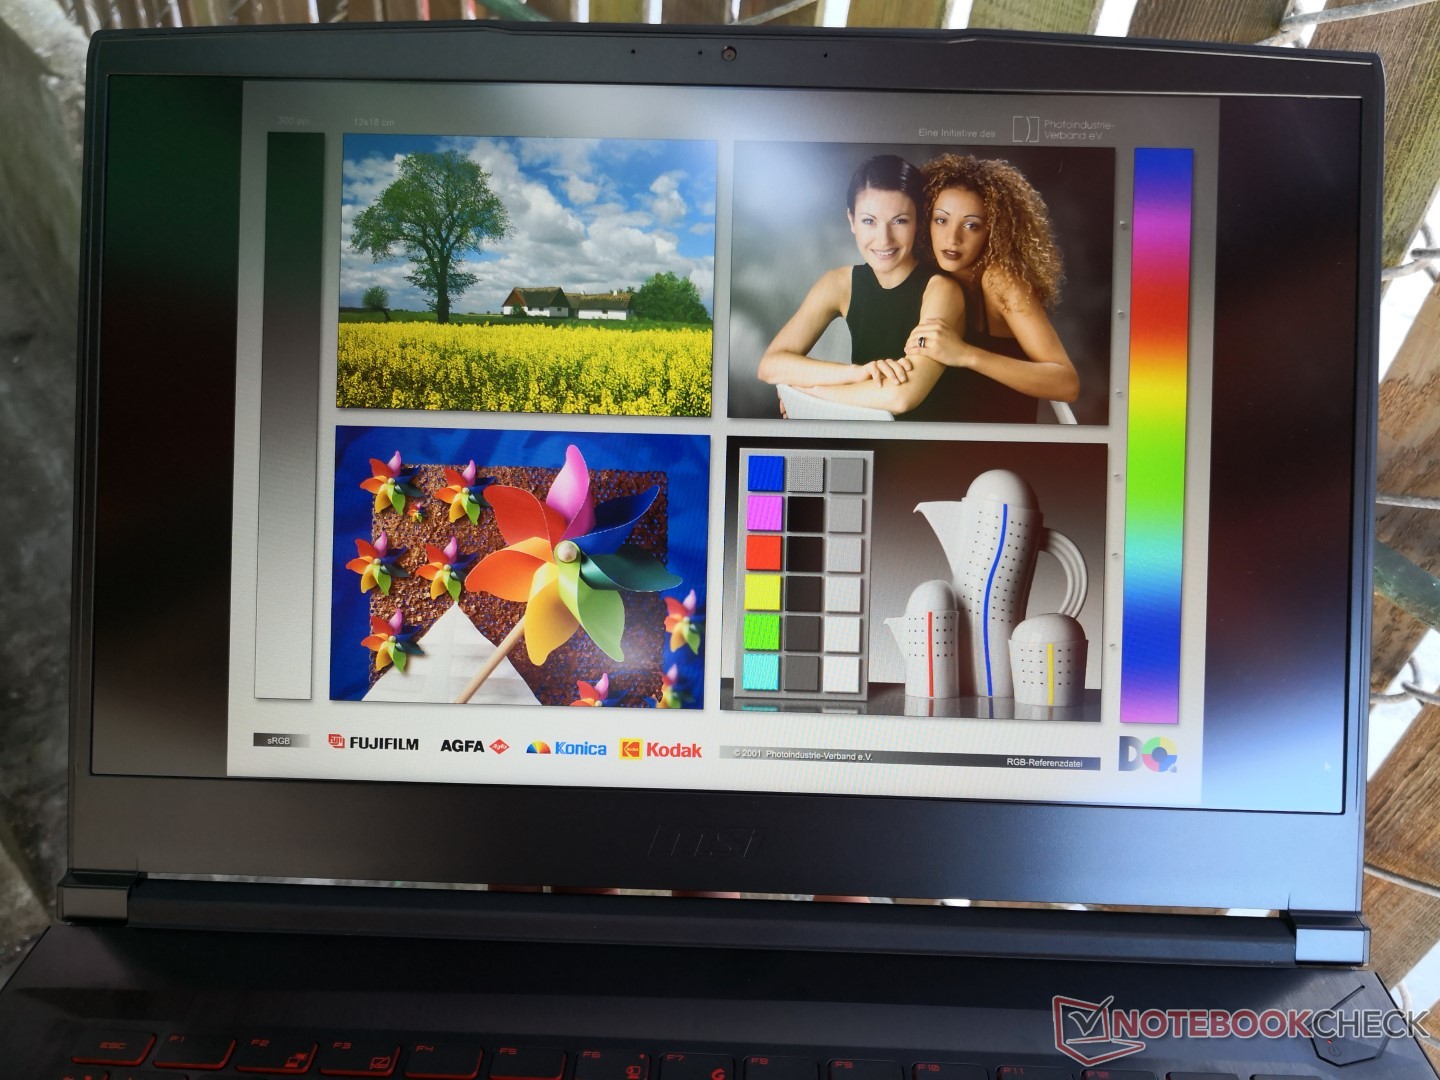
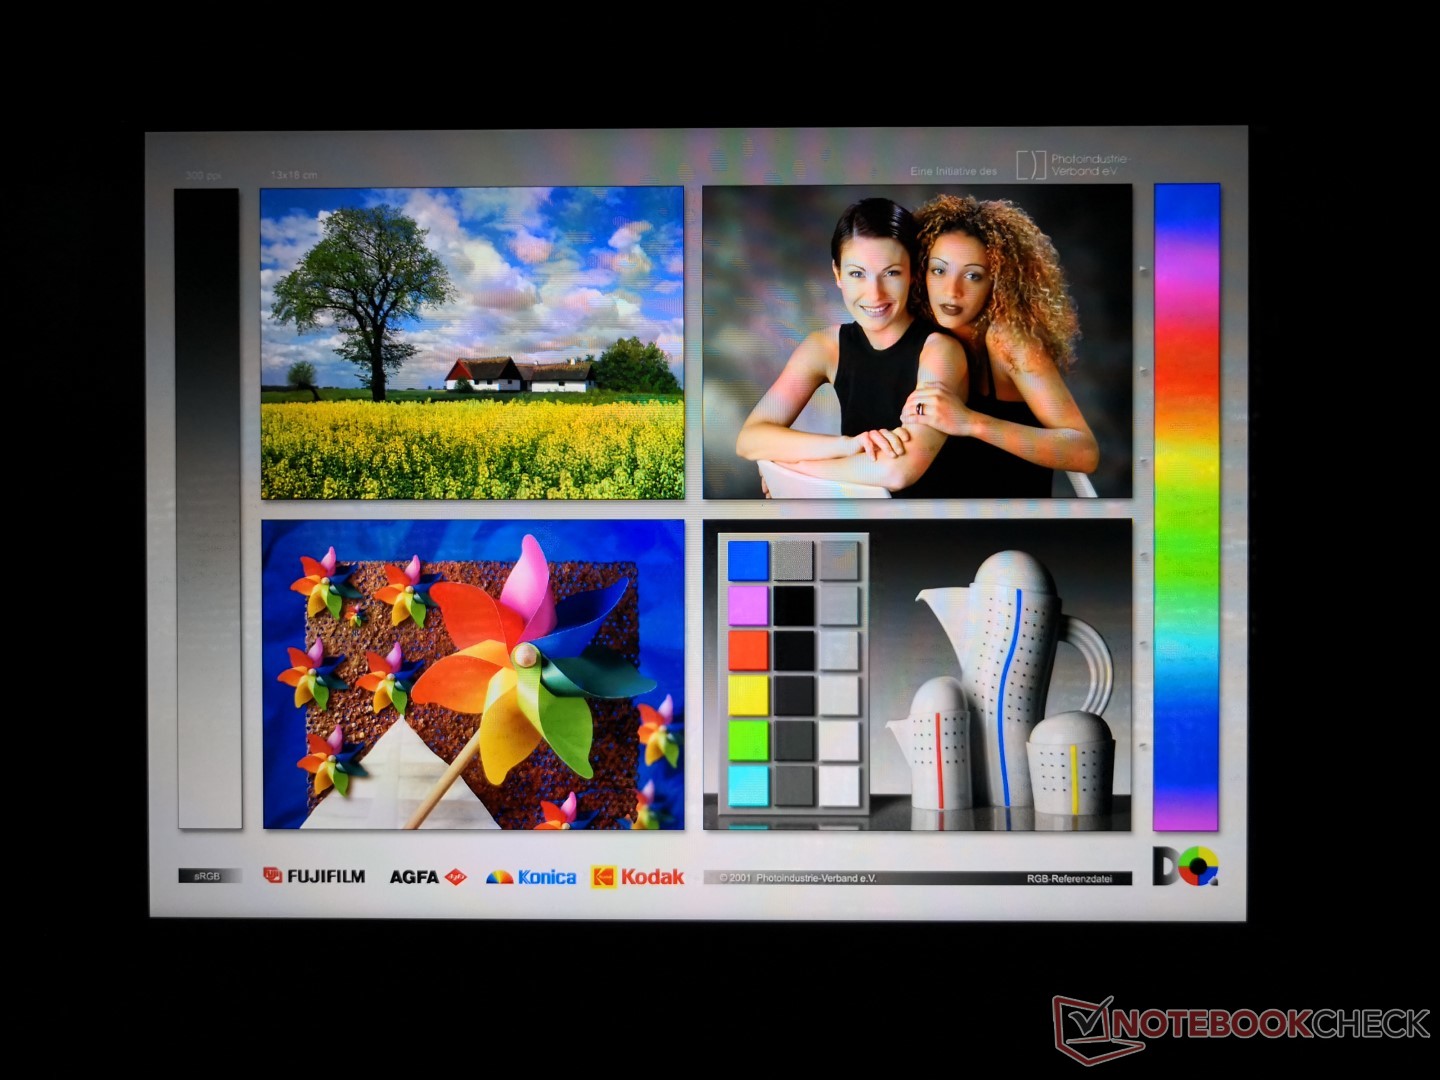
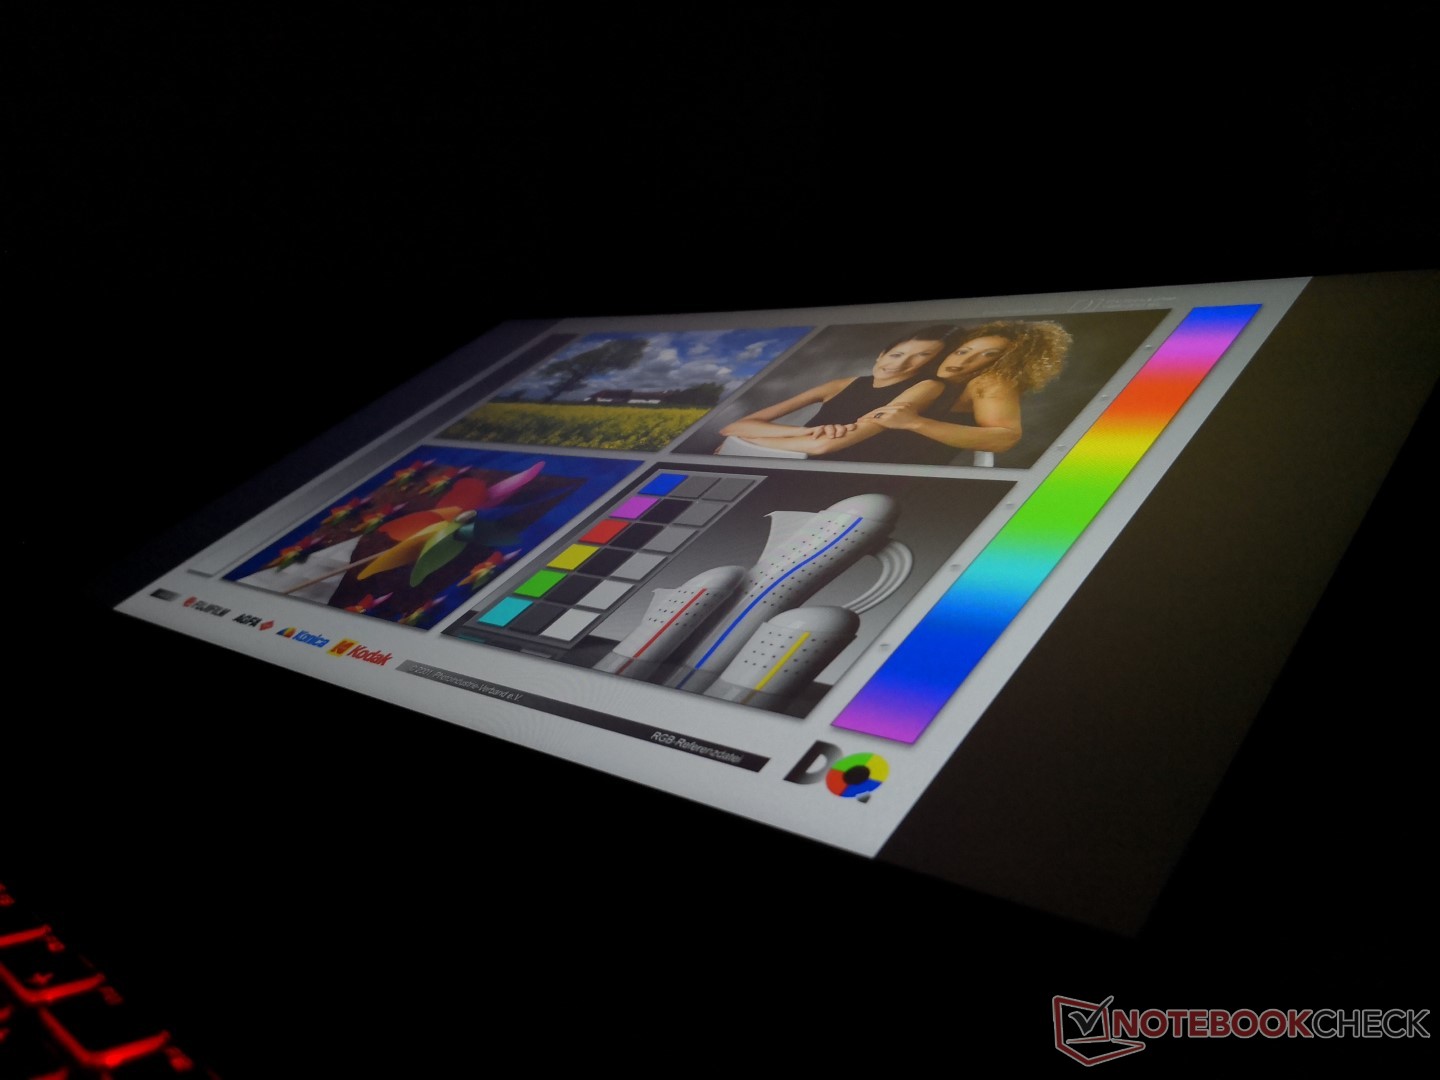
Subjectively, display quality is excellent and better for gaming purposes than the TN panel on the GF62VR. It's not perfect, however, as we can notice a slightly grainy overlay that prevents onscreen content from appearing as crisp as a glossy alternative. Backlight bleeding is surprisingly minimal and uniform across all four edges and corners of the screen. We were expecting at least one or two notable bleeding spots, but there are none to be found on our unit.
The AU Optronics B156HAN02.1 panel on our GF63 is also used on the 15.6-inch Asus VivoBook S15 S510 and Lenovo Legion Y530 narrow bezel laptops. Consequently, all three laptops share similar display properties such as response times and color spaces.
| |||||||||||||||||||||||||
Brightness Distribution: 89 %
Center on Battery: 266.6 cd/m²
Contrast: 919:1 (Black: 0.29 cd/m²)
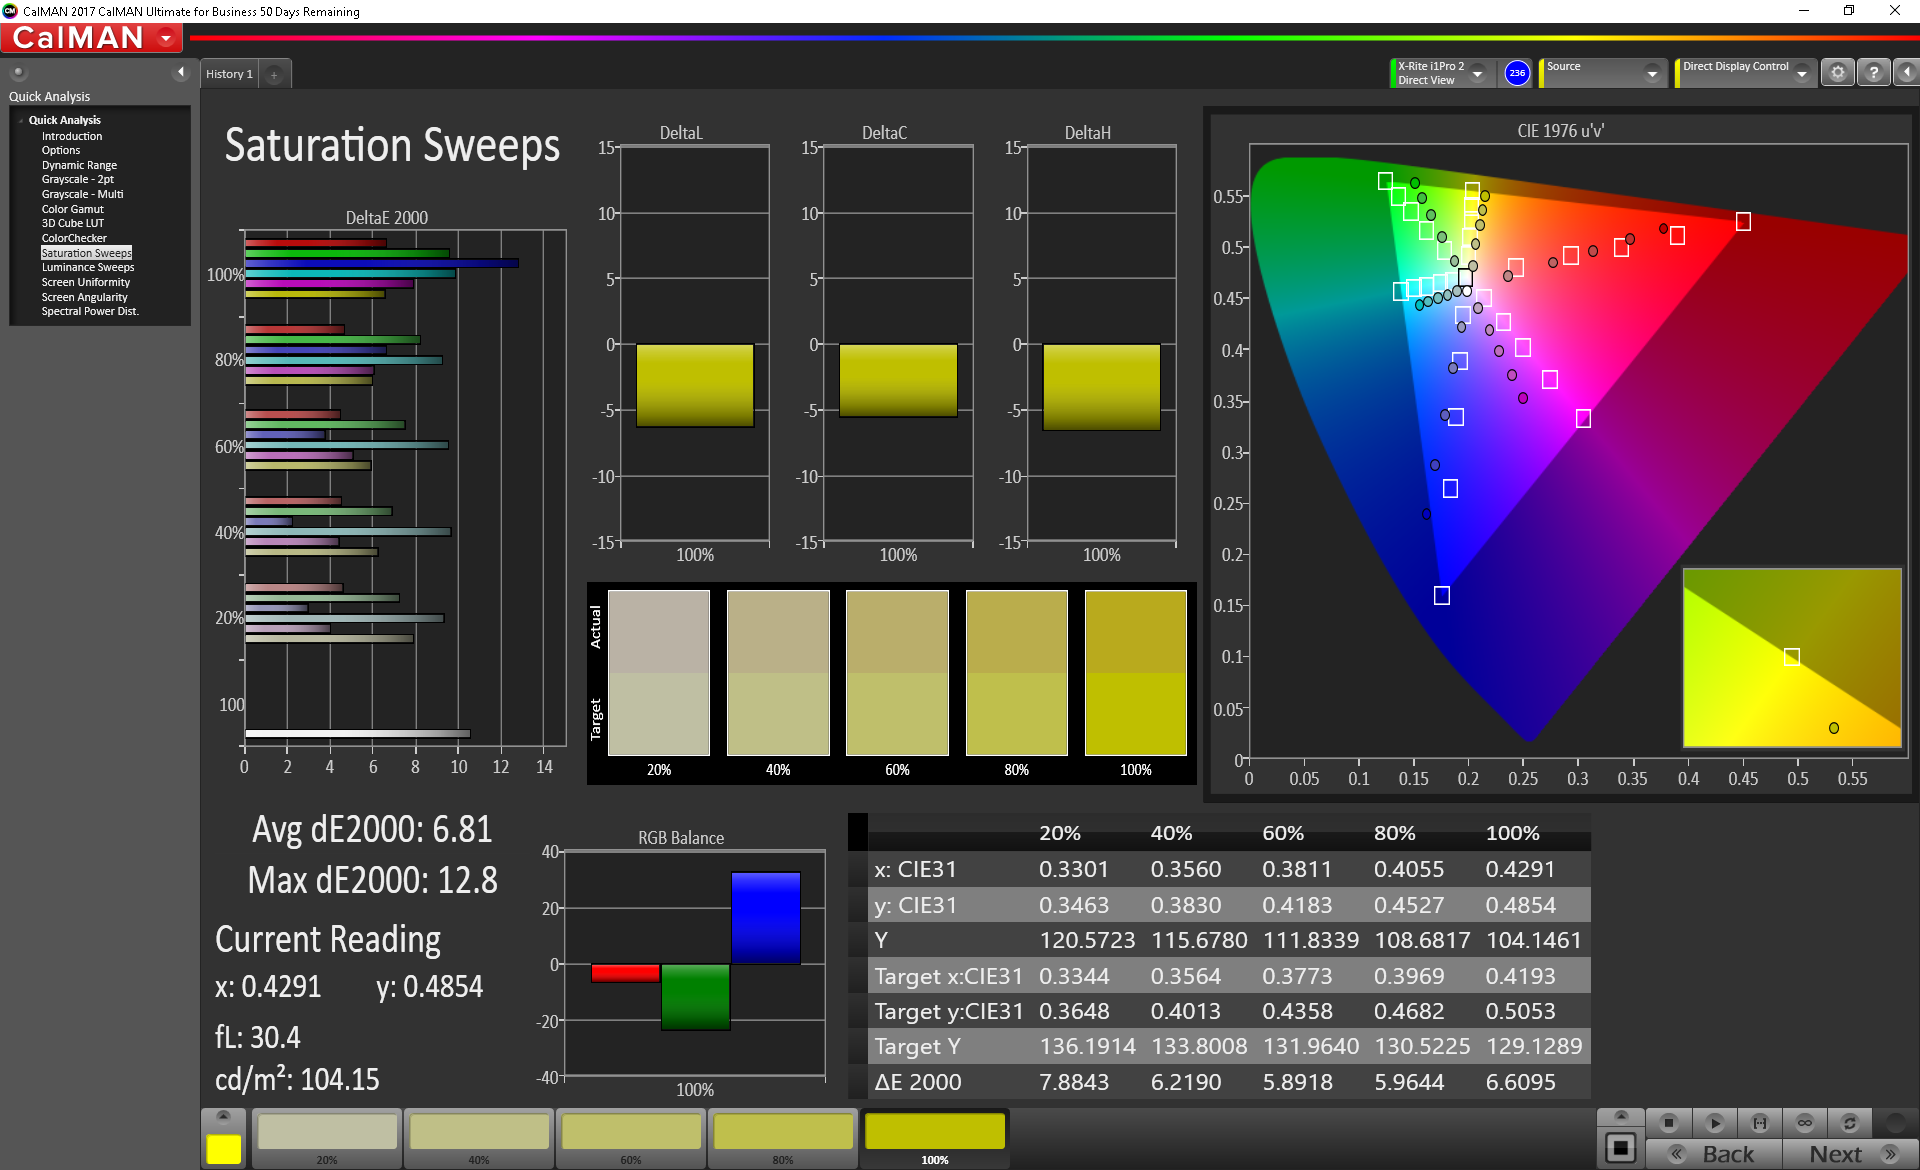
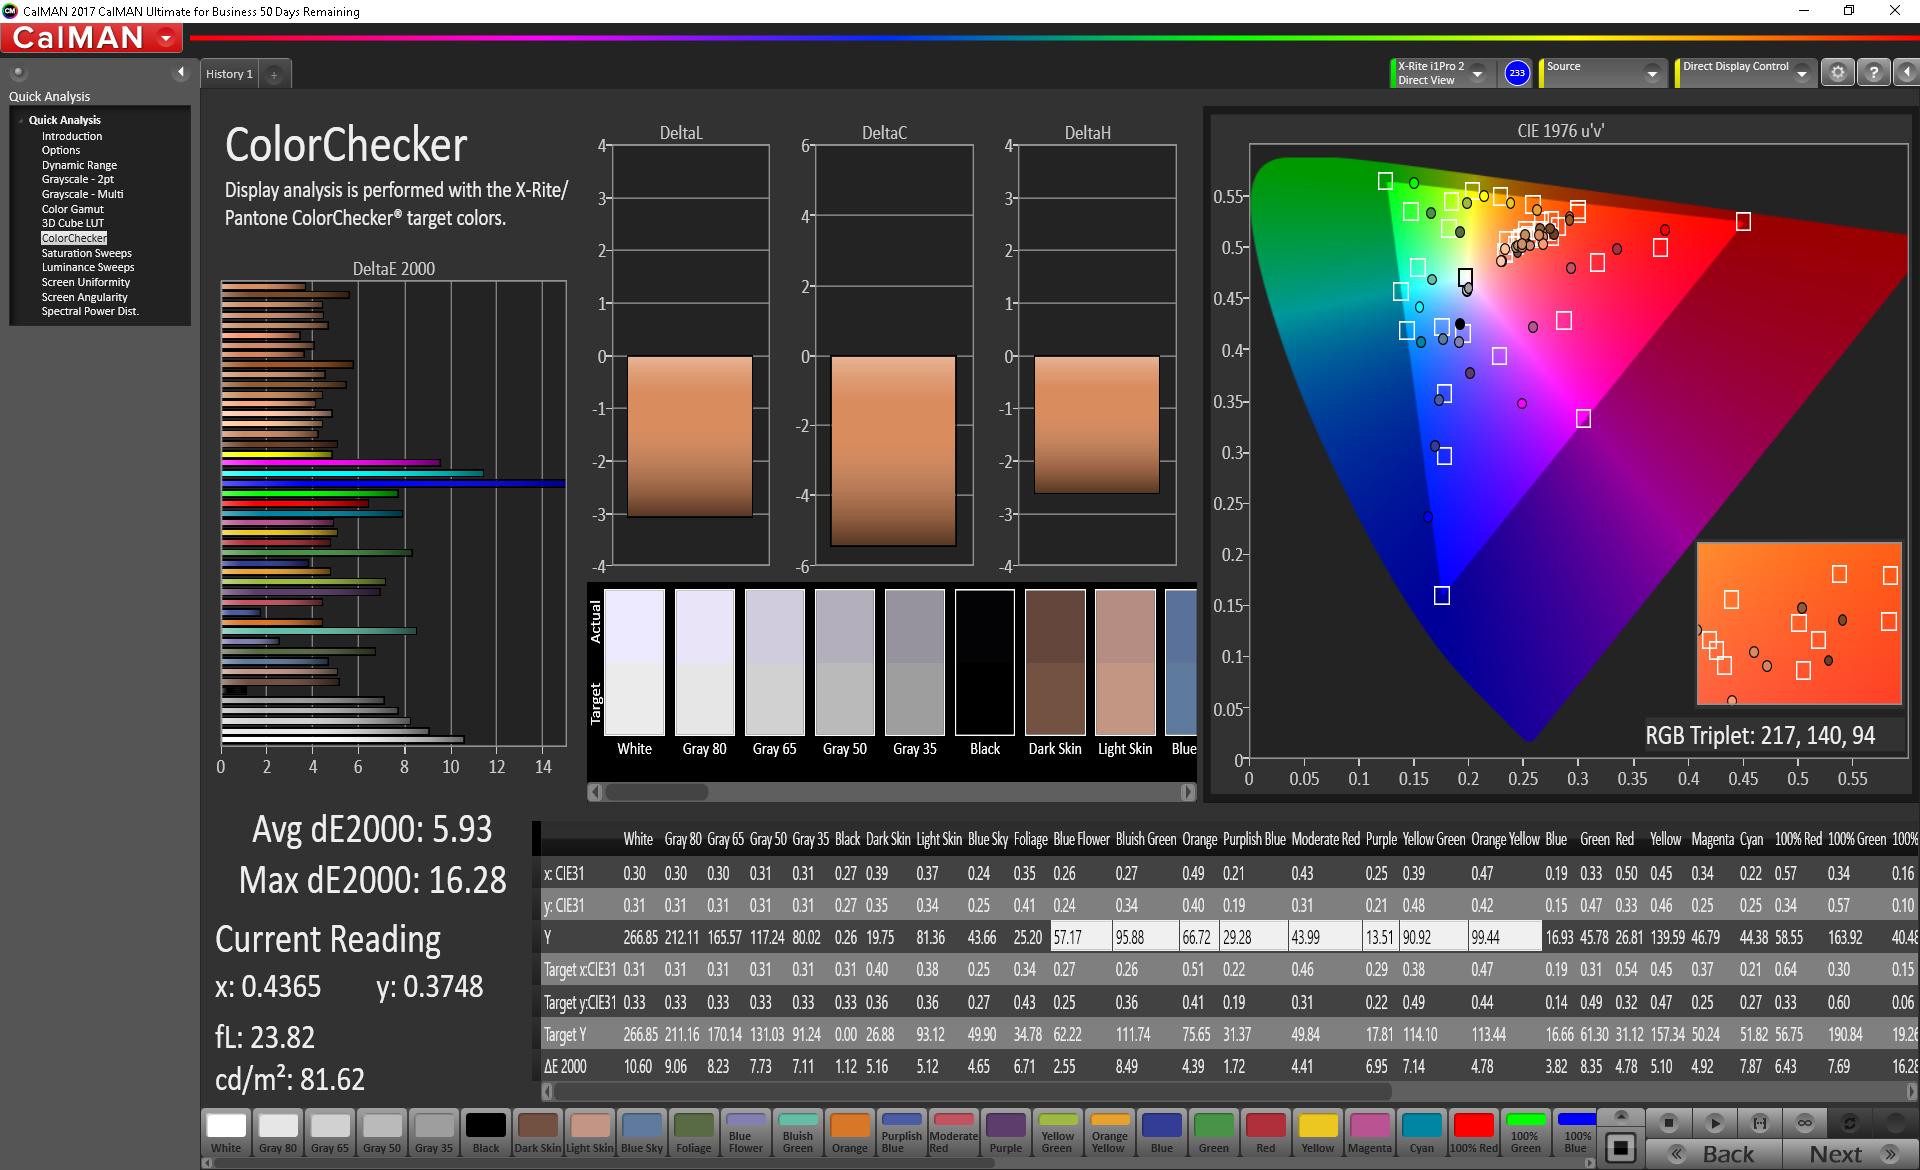
ΔE ColorChecker Calman: 5.93 | ∀{0.5-29.43 Ø4.71}
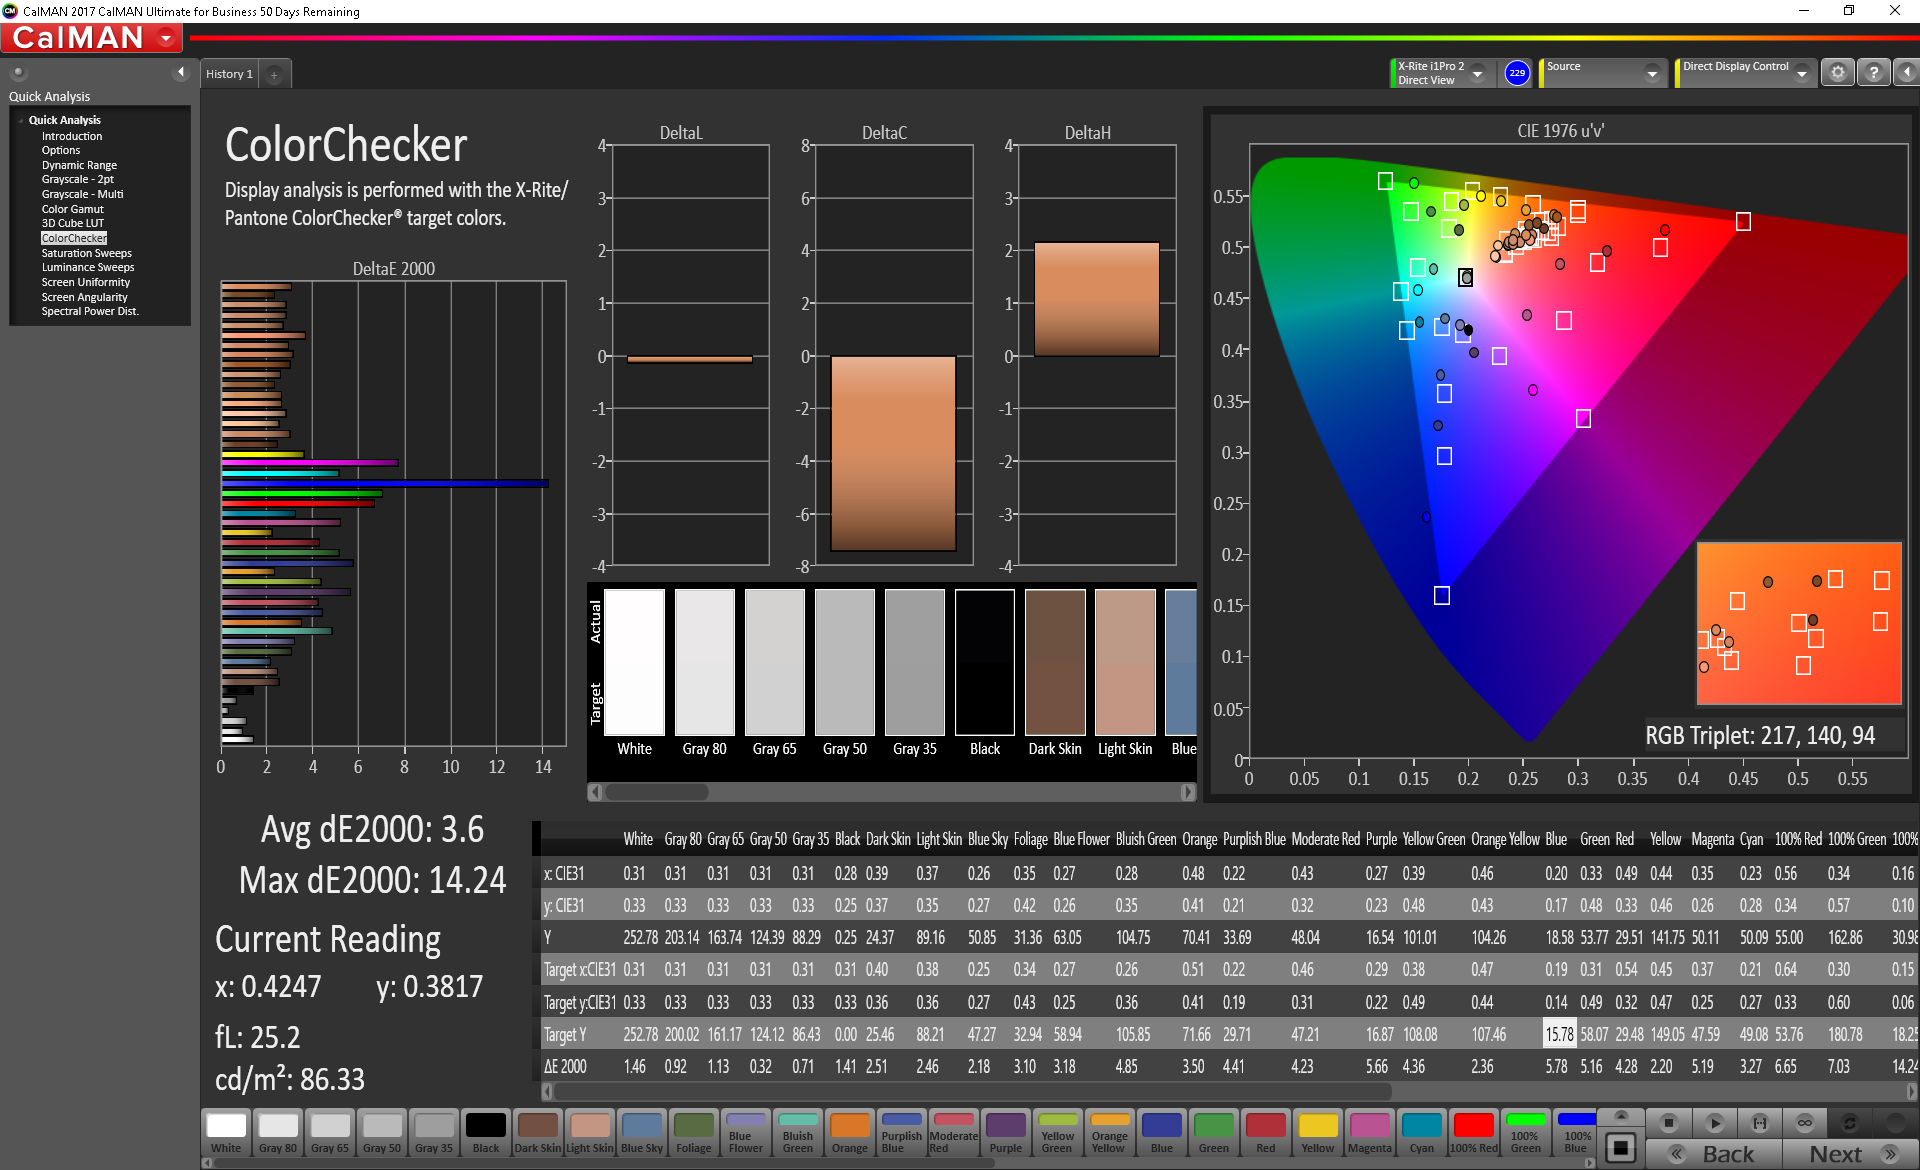
calibrated: 3.6
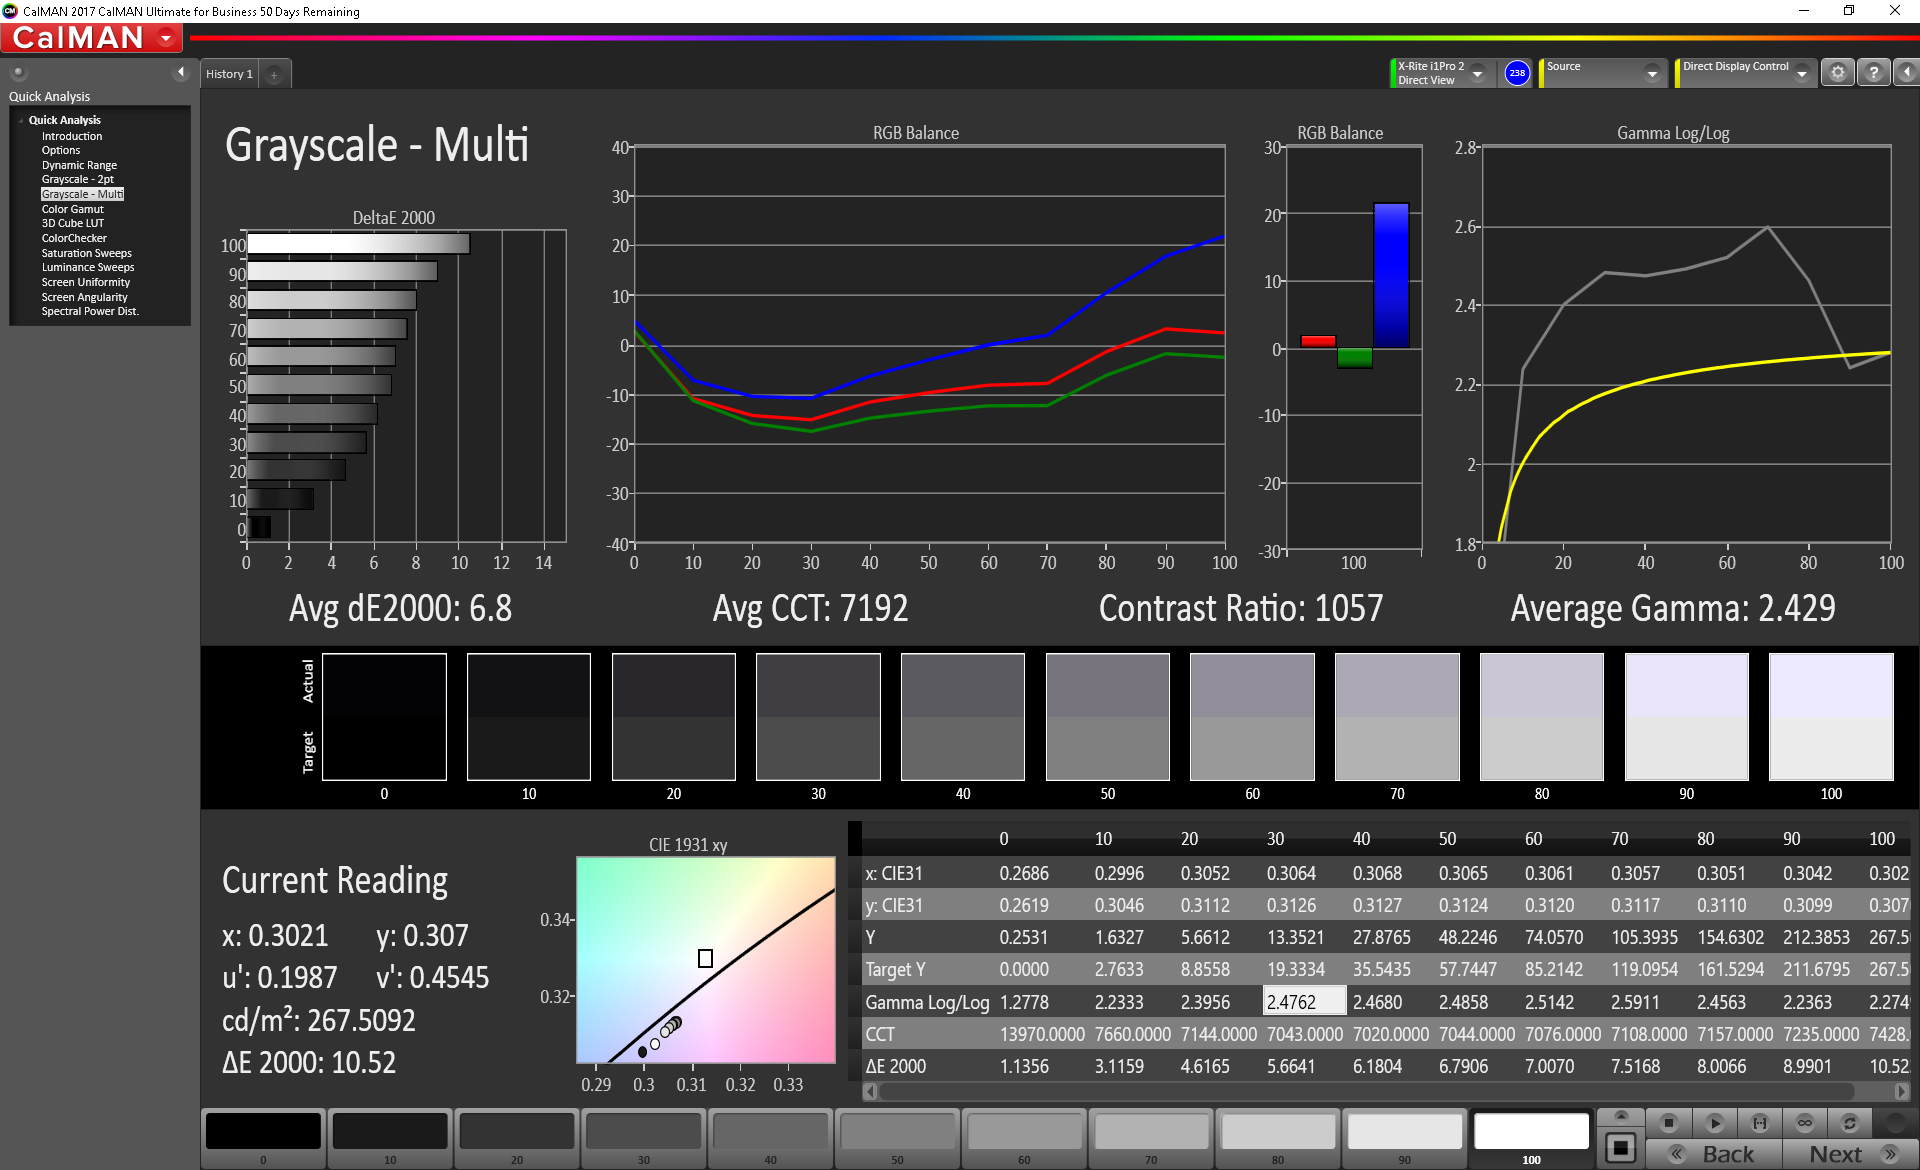
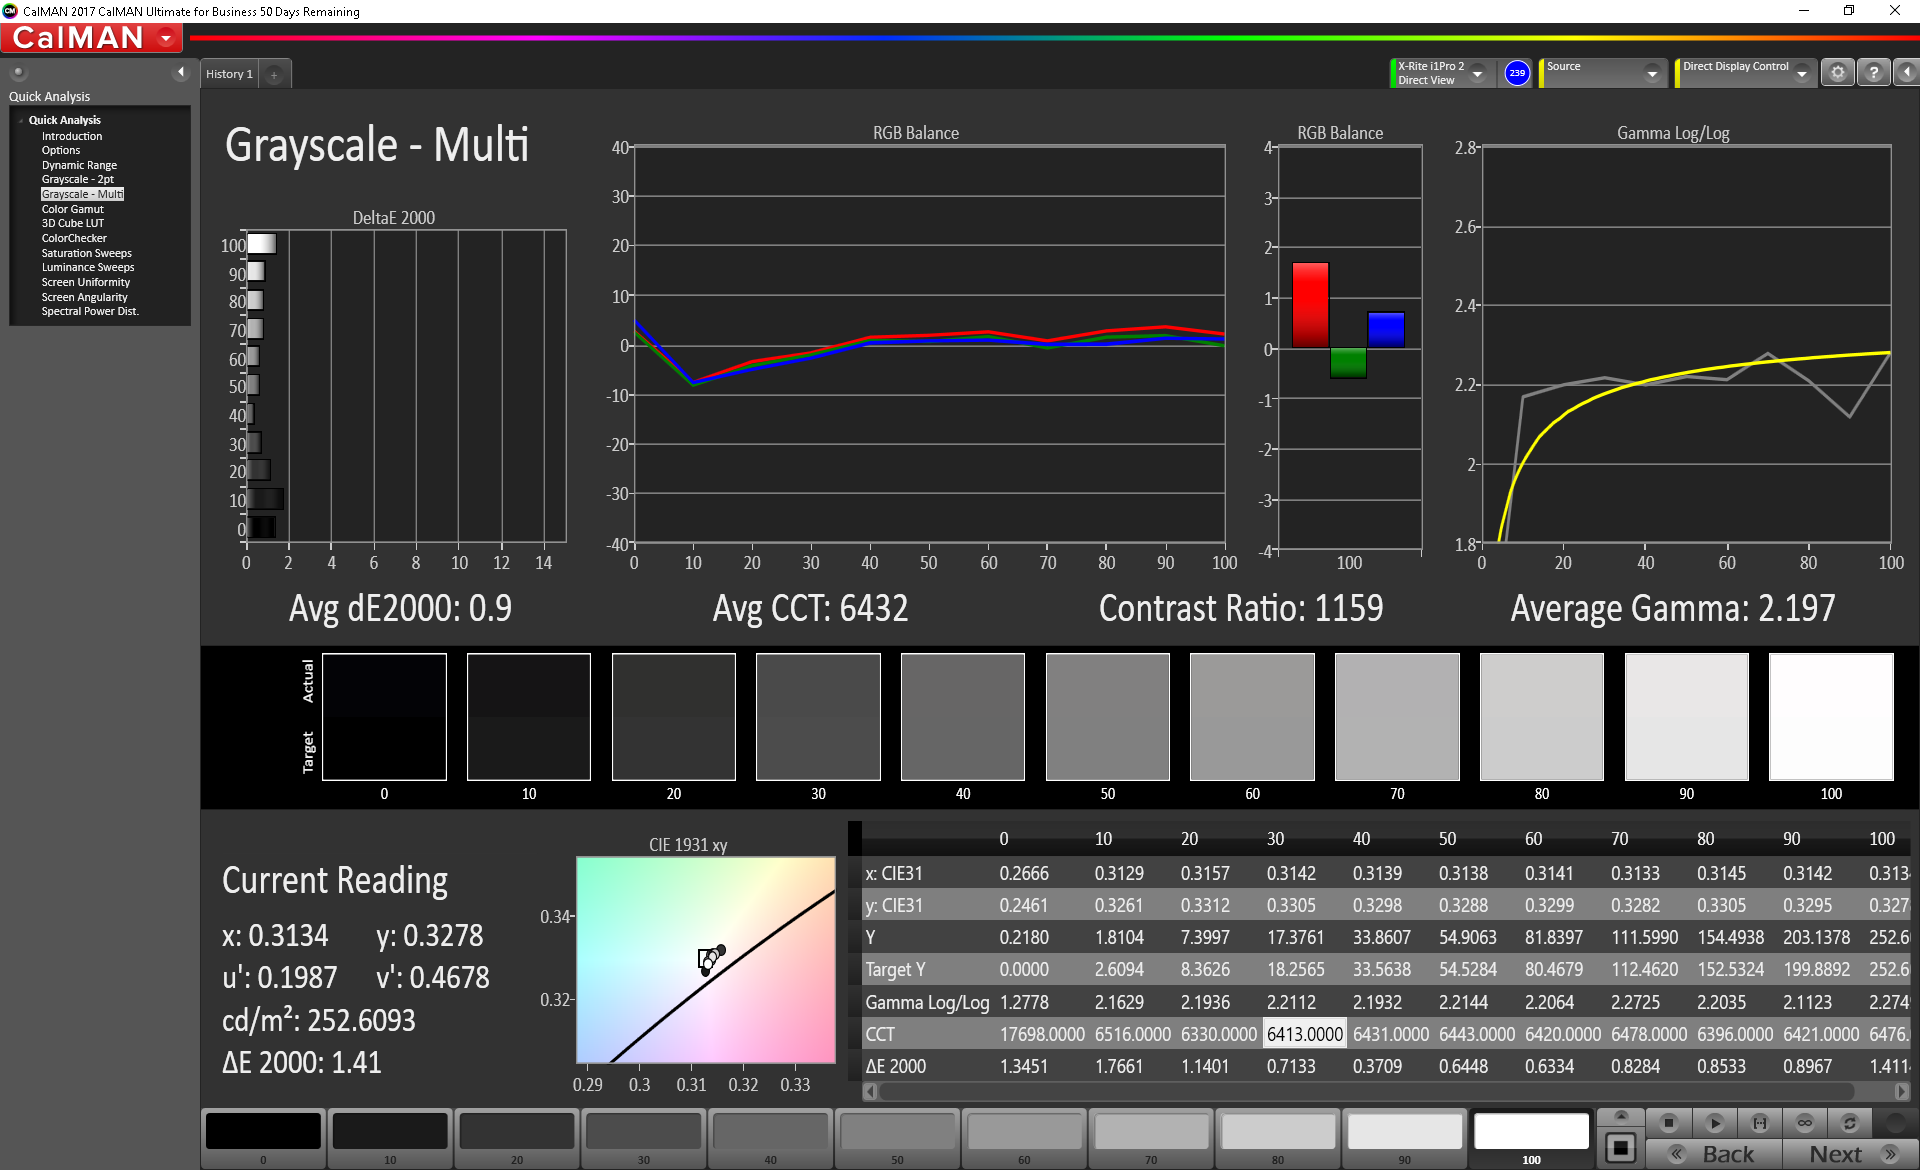
ΔE Greyscale Calman: 6.8 | ∀{0.09-98 Ø4.96}
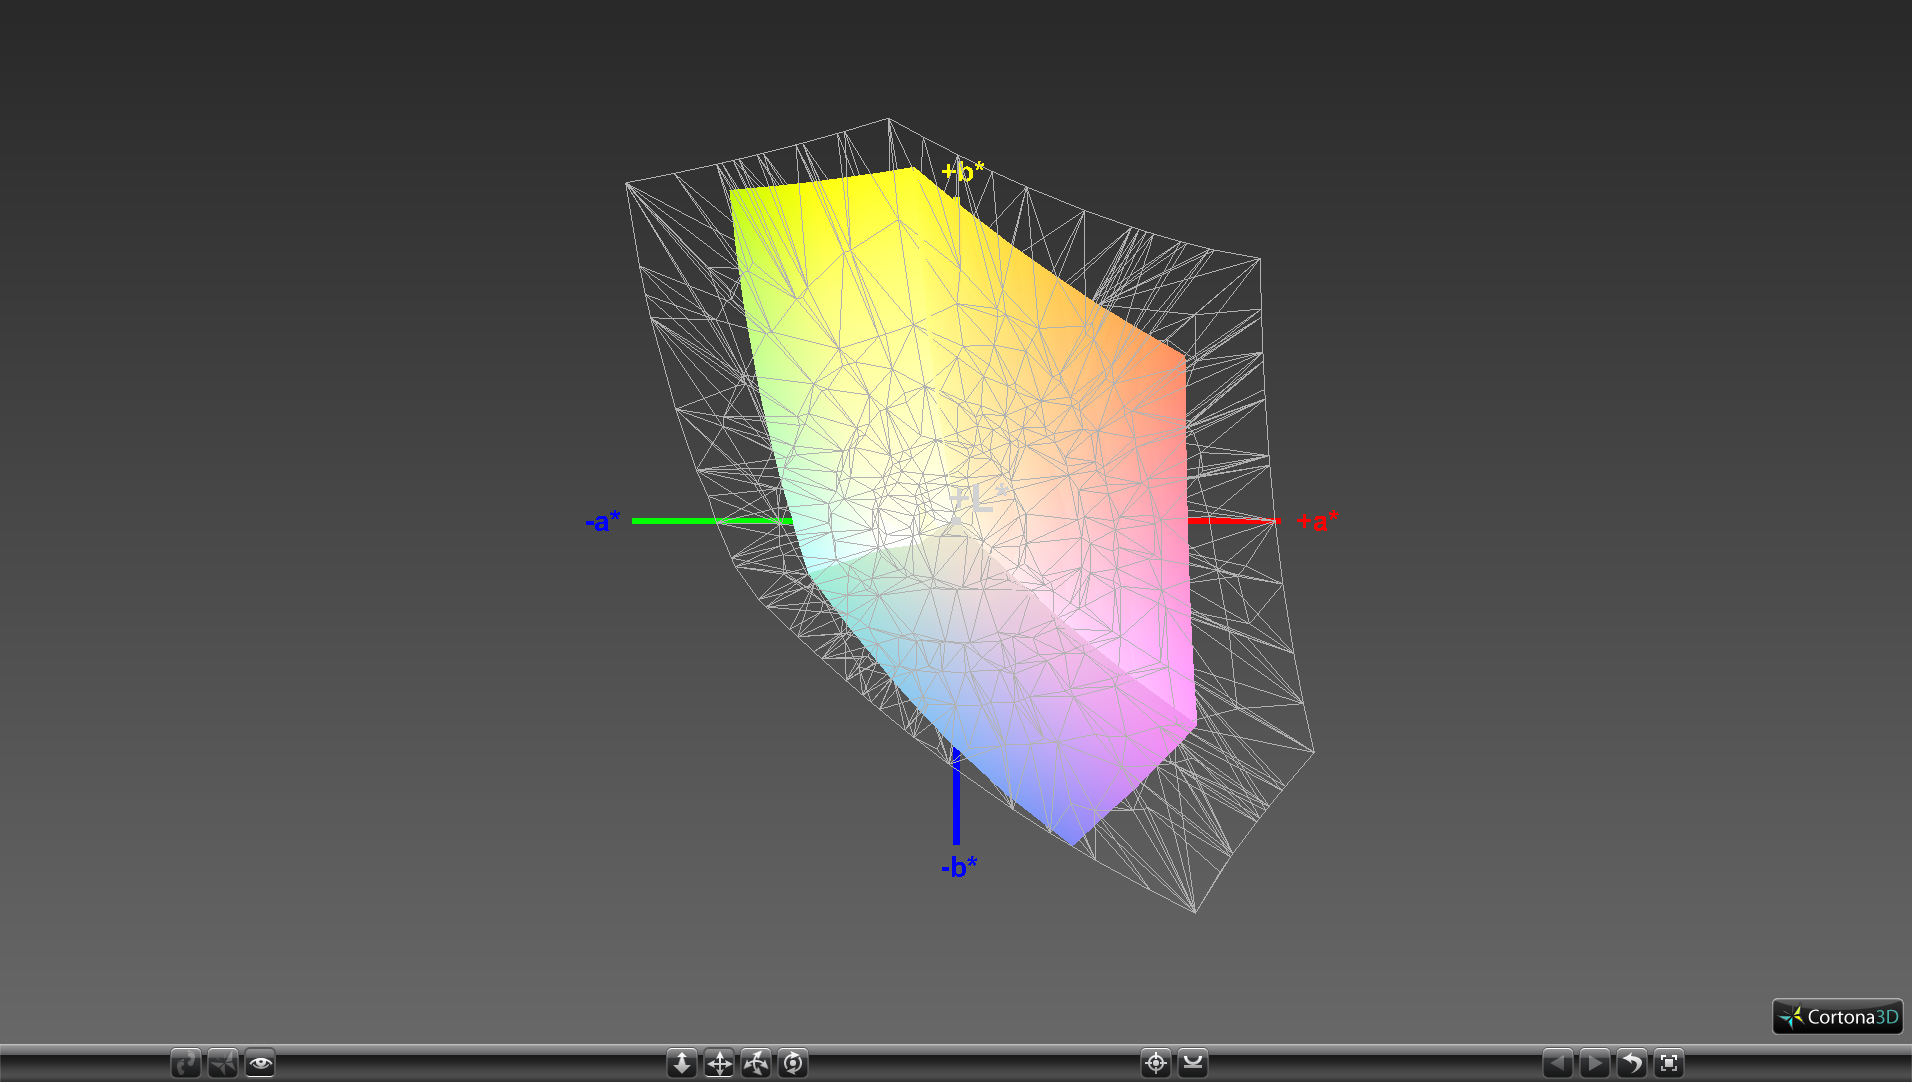
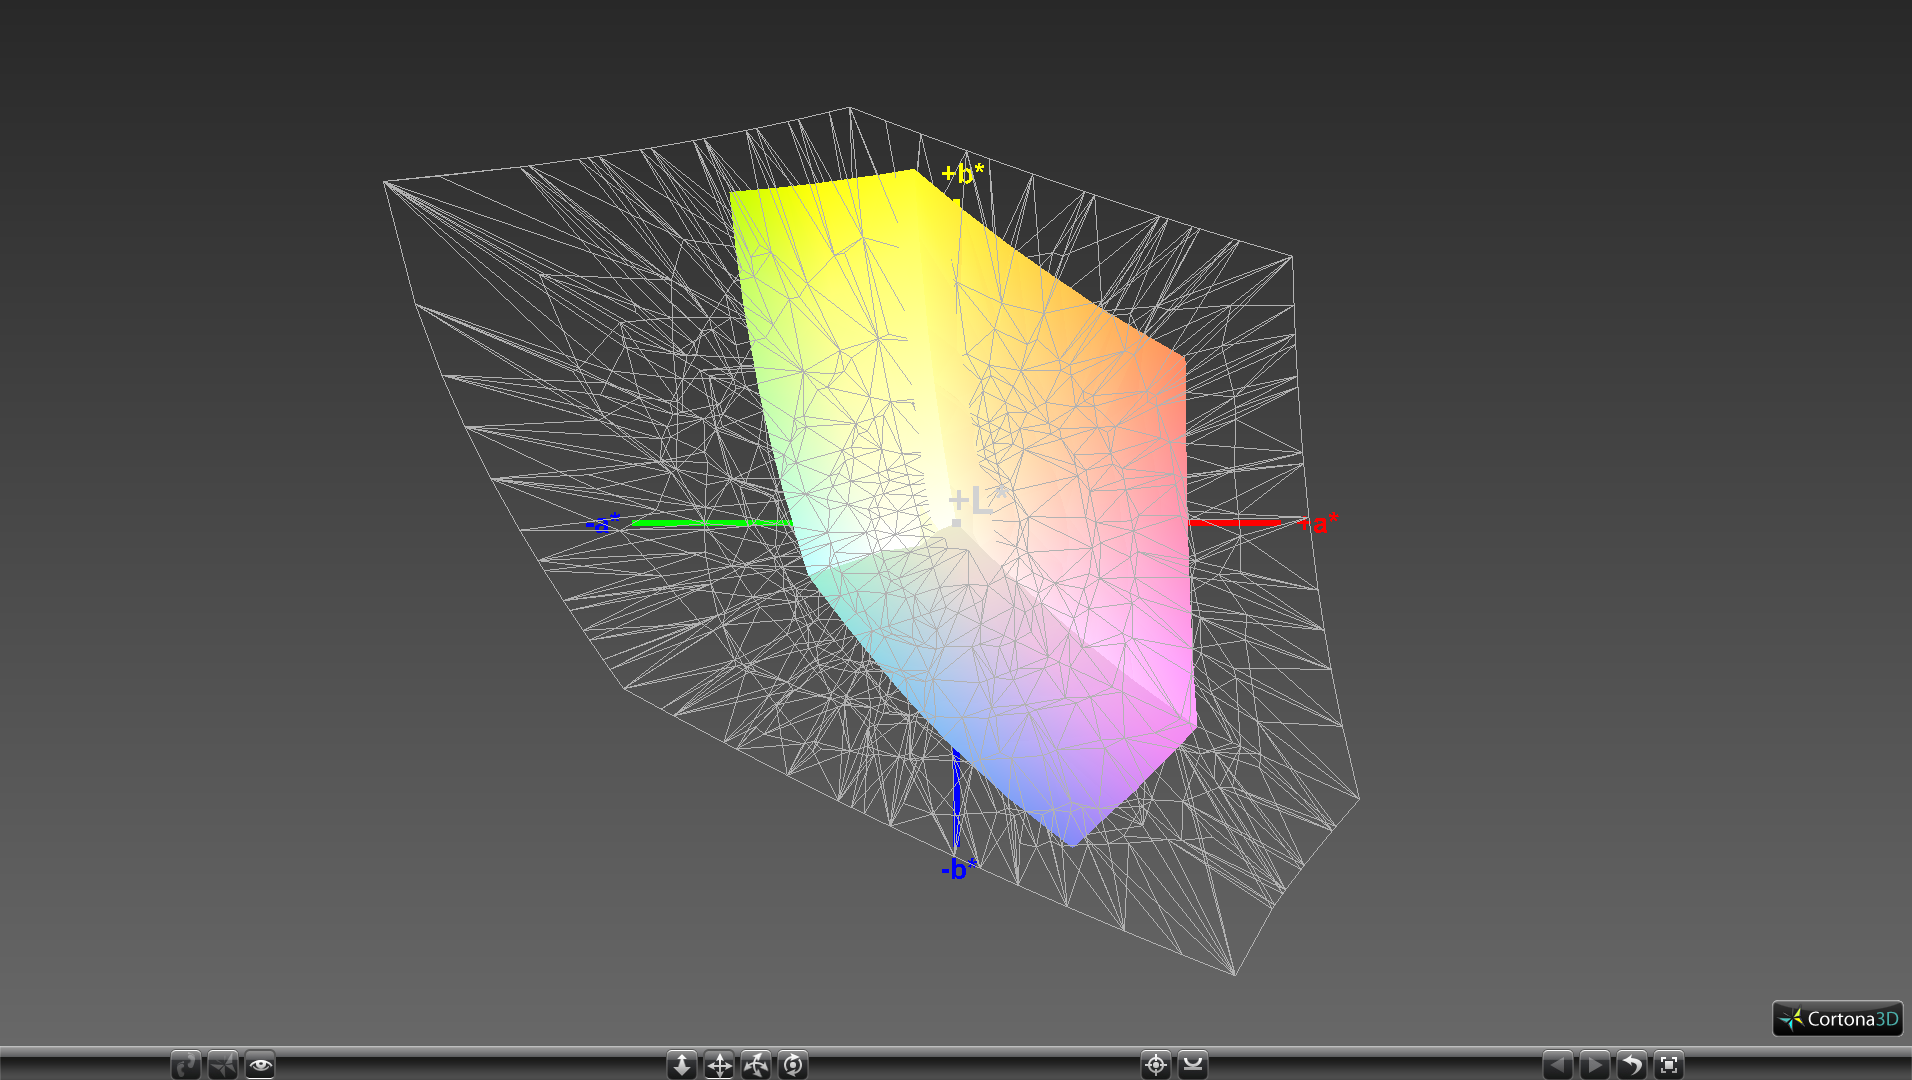
59.3% sRGB (Argyll 1.6.3 3D)
37.6% AdobeRGB 1998 (Argyll 1.6.3 3D)
40.73% AdobeRGB 1998 (Argyll 3D)
59.3% sRGB (Argyll 3D)
39.43% Display P3 (Argyll 3D)
Gamma: 2.43
CCT: 7192 K
| MSI GF63 8RC AU Optronics B156HAN02.1, IPS, 15.6", 1920x1080 | MSI GS65 Stealth Thin 8RE-051US AUO80ED, IPS, 15.6", 1920x1080 | Asus Strix GL504GM AU Optronics B156HAN08.2 (AUO82ED), IPS, 15.6", 1920x1080 | Acer Aspire 7 A715-71G-53TU BOE NV156FHM-N42 , a-Si TFT-LCD, IPS, 15.6", 1920x1080 | MSI GF62VR 7RF-877 Chi Mei N156HGA-EAL, TN LED, 15.6", 1920x1080 | Dell G5 15 5587 LGD053F, 156WF6, IPS, 15.6", 1920x1080 | |
|---|---|---|---|---|---|---|
| Display | 62% | 62% | 2% | 97% | -3% | |
| Display P3 Coverage (%) | 39.43 | 65.8 67% | 65.3 66% | 40.53 3% | 85.6 117% | 38.13 -3% |
| sRGB Coverage (%) | 59.3 | 92.1 55% | 92.8 56% | 59.9 1% | 99.9 68% | 56.8 -4% |
| AdobeRGB 1998 Coverage (%) | 40.73 | 67 64% | 66.7 64% | 41.87 3% | 83.9 106% | 39.47 -3% |
| Response Times | 48% | 70% | -40% | -20% | 7% | |
| Response Time Grey 50% / Grey 80% * (ms) | 33.2 ? | 20 ? 40% | 7.8 ? 77% | 49 ? -48% | 49.6 ? -49% | 33 ? 1% |
| Response Time Black / White * (ms) | 27.2 ? | 12 ? 56% | 10.4 ? 62% | 36 ? -32% | 24.4 ? 10% | 24 ? 12% |
| PWM Frequency (Hz) | 20000 ? | 25510 ? | ||||
| Screen | 24% | 29% | 11% | -19% | -7% | |
| Brightness middle (cd/m²) | 266.6 | 250.9 -6% | 350 31% | 267 0% | 223.9 -16% | 229 -14% |
| Brightness (cd/m²) | 257 | 257 0% | 338 32% | 250 -3% | 208 -19% | 224 -13% |
| Brightness Distribution (%) | 89 | 83 -7% | 90 1% | 82 -8% | 88 -1% | 87 -2% |
| Black Level * (cd/m²) | 0.29 | 0.32 -10% | 0.33 -14% | 0.31 -7% | 0.56 -93% | 0.28 3% |
| Contrast (:1) | 919 | 784 -15% | 1061 15% | 861 -6% | 400 -56% | 818 -11% |
| Colorchecker dE 2000 * | 5.93 | 2.77 53% | 4.3 27% | 4.65 22% | 9.7 -64% | 6.1 -3% |
| Colorchecker dE 2000 max. * | 16.28 | 5.89 64% | 7.78 52% | 8.2 50% | 19.7 -21% | 12.2 25% |
| Colorchecker dE 2000 calibrated * | 3.6 | 2.5 31% | 2.83 21% | 6.12 -70% | ||
| Greyscale dE 2000 * | 6.8 | 4 41% | 4.4 35% | 2.65 61% | 12.9 -90% | 5.68 16% |
| Gamma | 2.43 91% | 2.27 97% | 2.26 97% | 2.44 90% | 2.18 101% | 2.4 92% |
| CCT | 7192 90% | 6901 94% | 7517 86% | 6820 95% | 15225 43% | 6989 93% |
| Color Space (Percent of AdobeRGB 1998) (%) | 37.6 | 60 60% | 60 60% | 38 1% | 75 99% | 36 -4% |
| Color Space (Percent of sRGB) (%) | 59.3 | 92 55% | 92.5 56% | 59 -1% | 100 69% | 57 -4% |
| Total Average (Program / Settings) | 45% /
34% | 54% /
40% | -9% /
2% | 19% /
4% | -1% /
-5% |
* ... smaller is better
Color space covers just 49 percent and 38 percent of the sRGB and AdobeRGB standards, respectively, to indicate a budget IPS panel. In comparison, the TN panel on last year's GF62VR covers all of sRGB for richer and more accurate colors. It's unlikely that MSI will carry over the TN option from the GF62VR because the GF63 was designed specifically for narrow bezel panels. Graphics artists may want to consider the pricier MSI GS65 instead which uses a more accurate IPS panel than on the GF63.
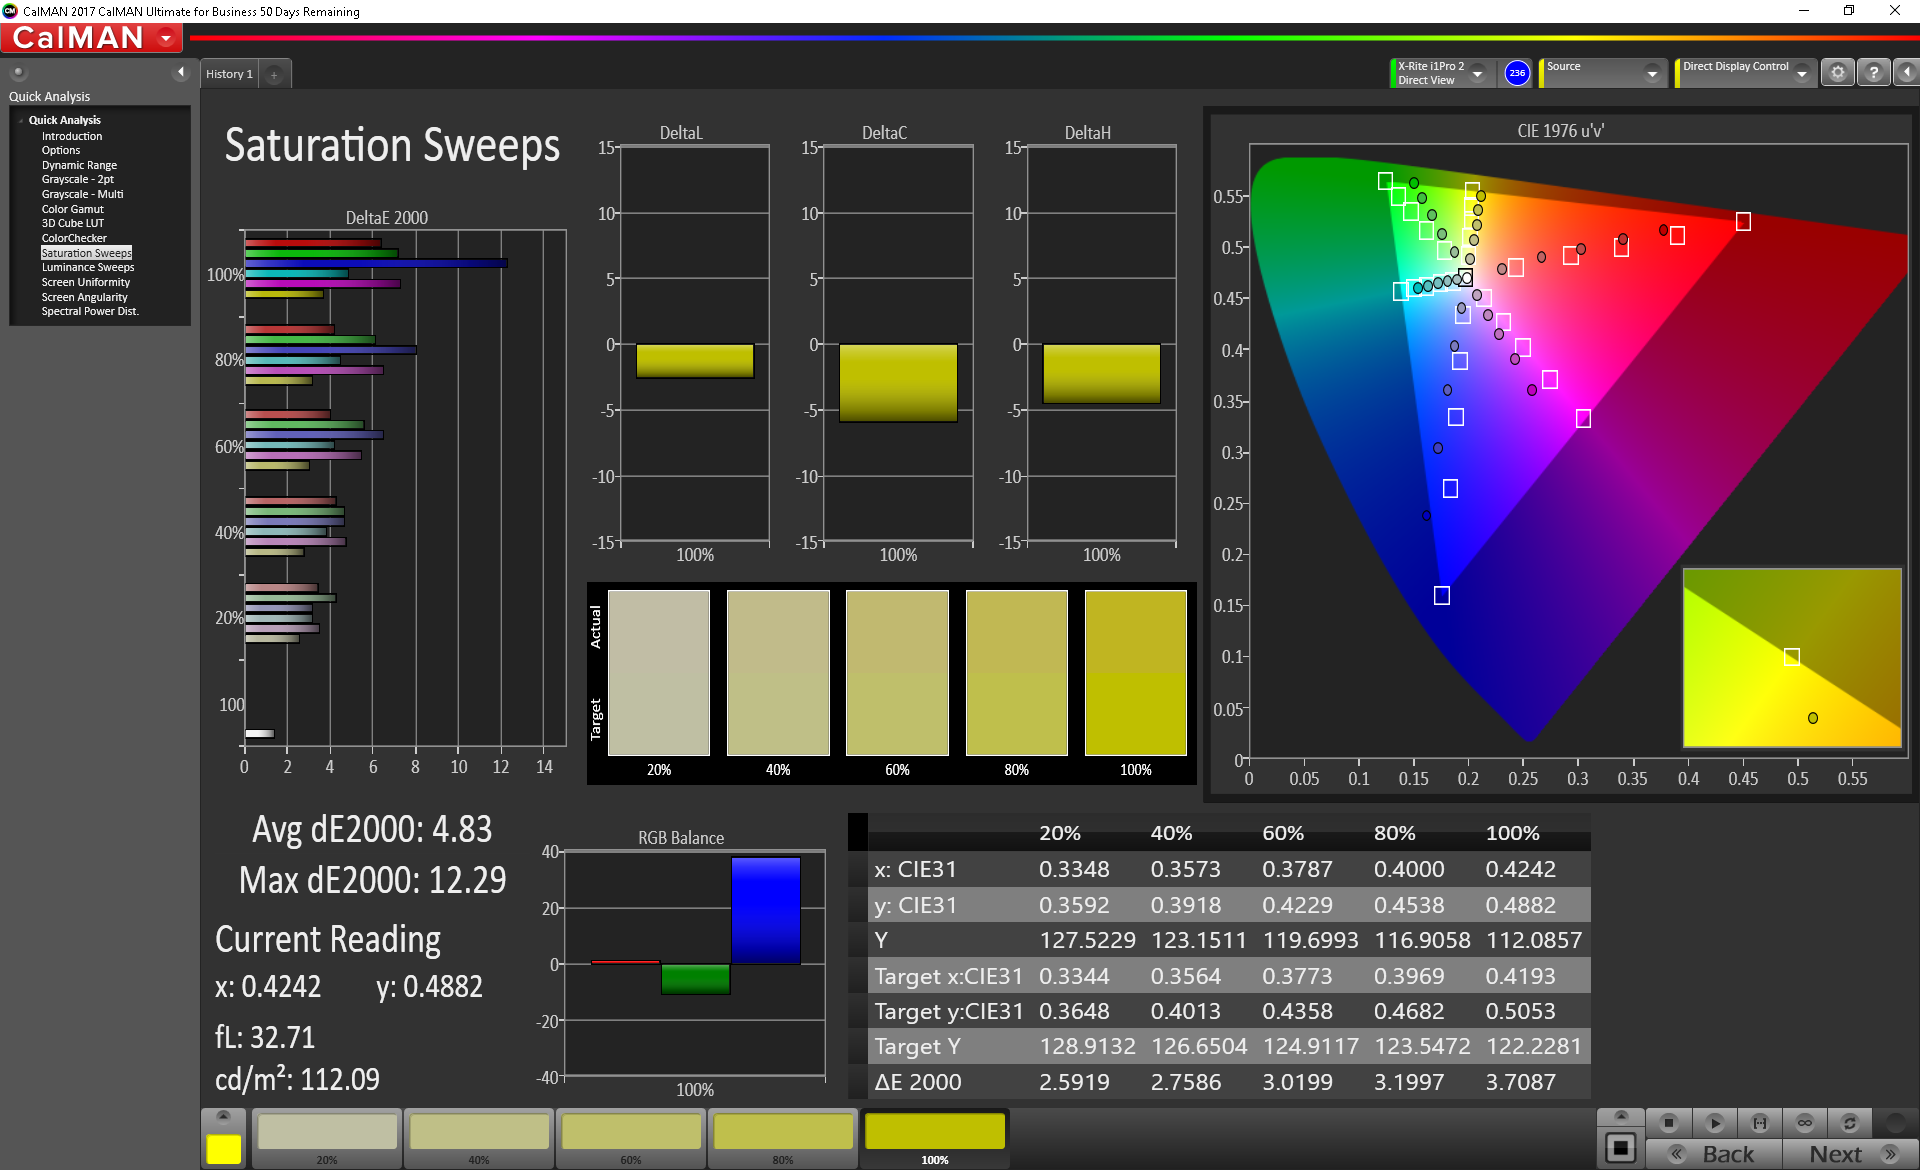
Further measurements with a X-Rite spectrophotometer reveal inaccurate grayscale and colors out of the box with an overly cool color temperature. Our calibration addresses many of these issues especially in regards to grayscale and colors at lower saturation levels. Because of the narrow gamut, however, colors still become increasingly inaccurate at higher saturation levels. We recommend applying our calibrated ICC profile above to get the most out of the display.
Display Response Times
| ↔ Response Time Black to White | ||
|---|---|---|
| 27.2 ms ... rise ↗ and fall ↘ combined | ↗ 15.6 ms rise | 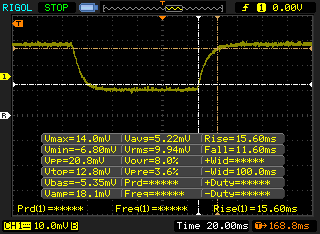 |
| ↘ 11.6 ms fall | ||
| The screen shows relatively slow response rates in our tests and may be too slow for gamers. In comparison, all tested devices range from 0.1 (minimum) to 240 (maximum) ms. » 69 % of all devices are better. This means that the measured response time is worse than the average of all tested devices (19.8 ms). | ||
| ↔ Response Time 50% Grey to 80% Grey | ||
| 33.2 ms ... rise ↗ and fall ↘ combined | ↗ 15.2 ms rise | 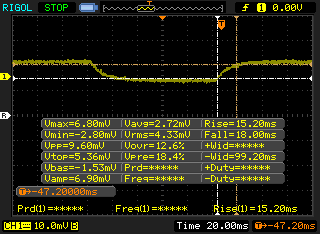 |
| ↘ 18 ms fall | ||
| The screen shows slow response rates in our tests and will be unsatisfactory for gamers. In comparison, all tested devices range from 0.165 (minimum) to 636 (maximum) ms. » 46 % of all devices are better. This means that the measured response time is similar to the average of all tested devices (31 ms). | ||
Screen Flickering / PWM (Pulse-Width Modulation)
| Screen flickering / PWM not detected | 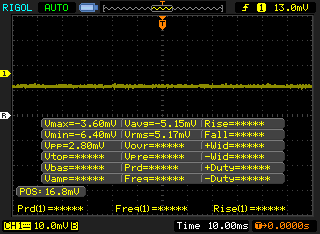 | ||
In comparison: 52 % of all tested devices do not use PWM to dim the display. If PWM was detected, an average of 7757 (minimum: 5 - maximum: 343500) Hz was measured. | |||
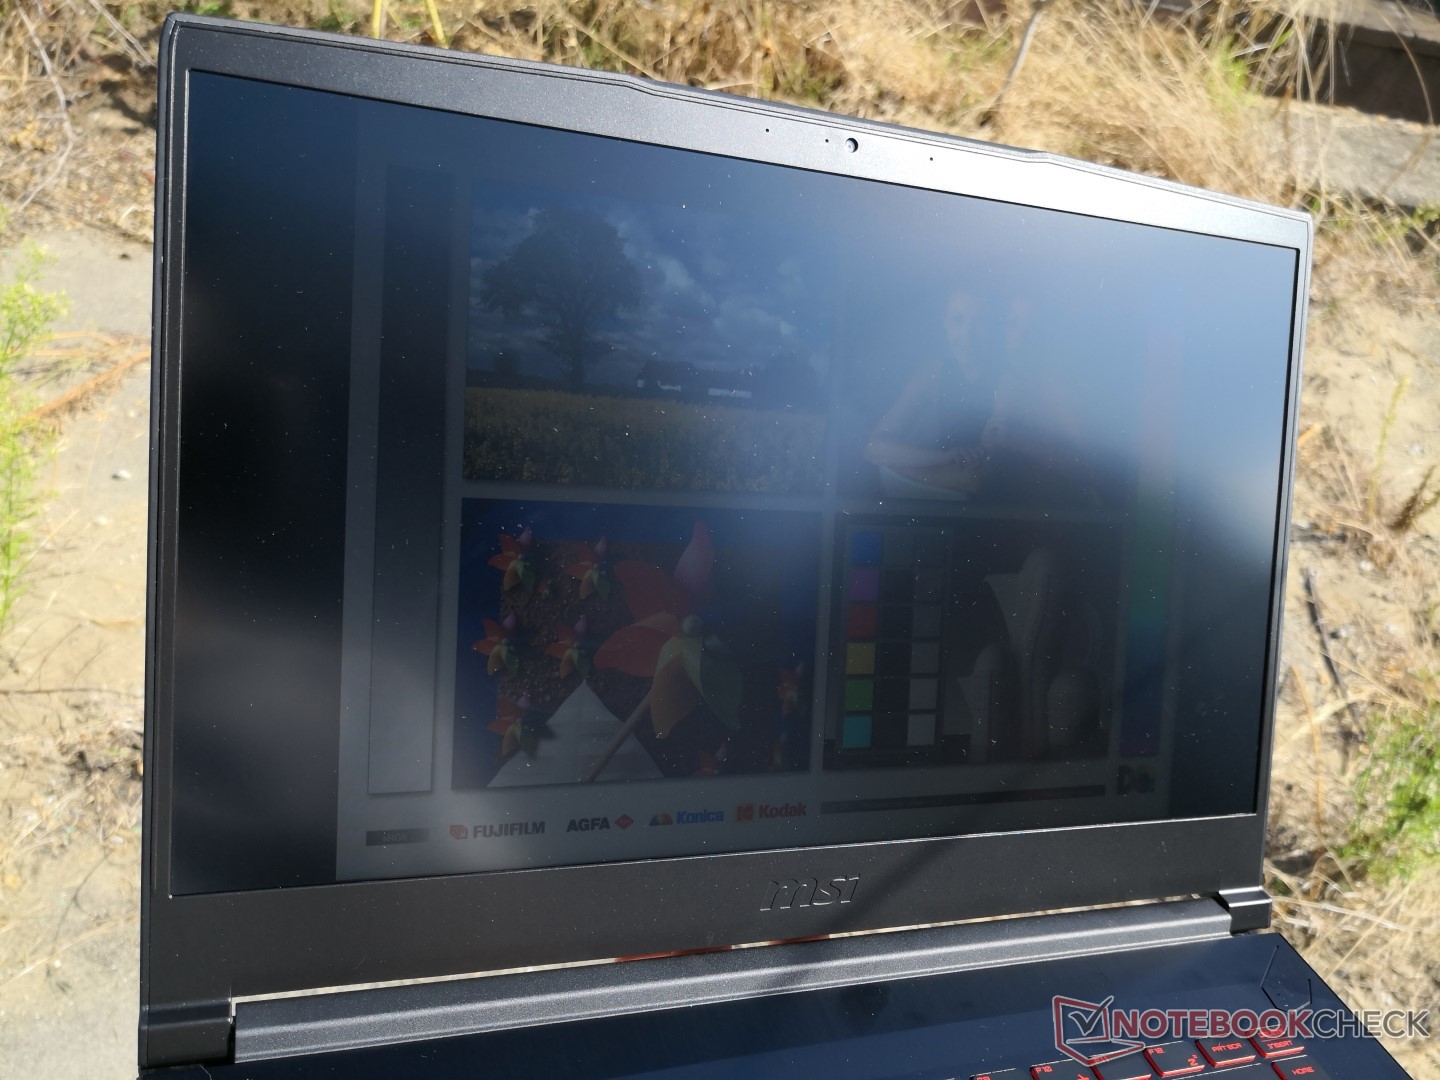
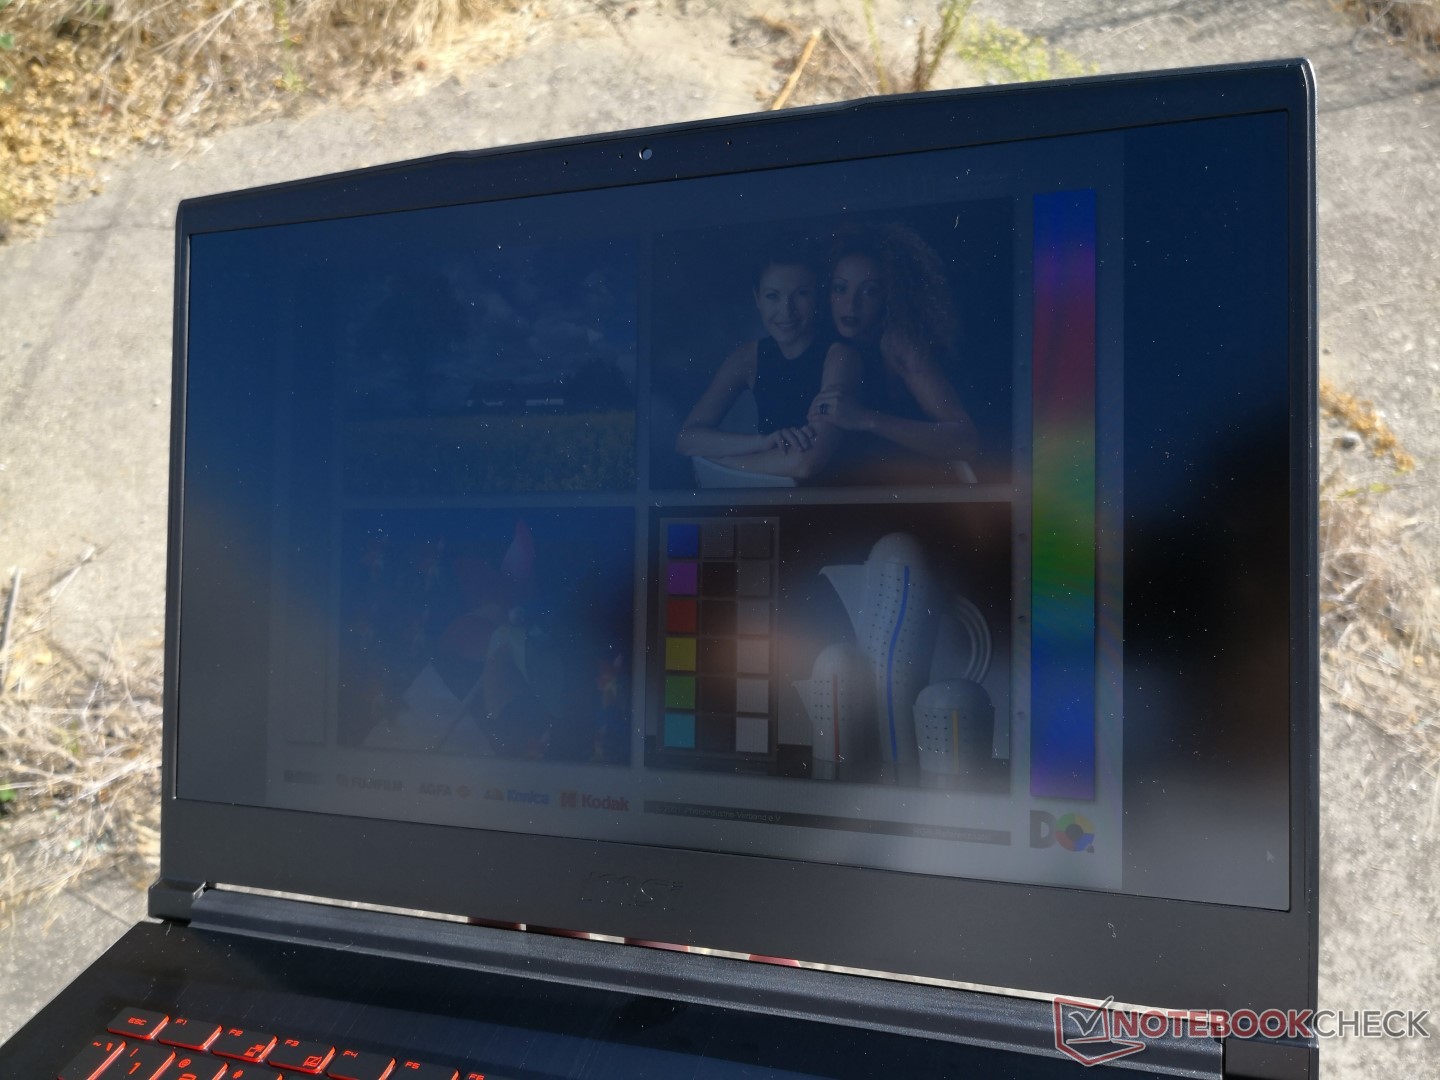
Outdoor visibility is better than on the GF62VR due to the wider IPS viewing angles and slightly brighter backlight. Nonetheless, the display is just not bright enough to make a significant difference and onscreen content will still be washed out when under sunlight. As portable as the system may be, the GF63 is at its best when used indoors or under shade.
Performance
As mentioned in the intro, current SKUs are limited to the Core i5-8300H or i7-8750H CPU with GTX 1050 or GTX 1050 Ti Max-Q graphics. Such a combination puts the GF63 squarely for mainstream gamers on tight budgets. Users who want more powerful options should consider the MSI GE, GS, or GT series where GTX 1060 graphics or higher are common.
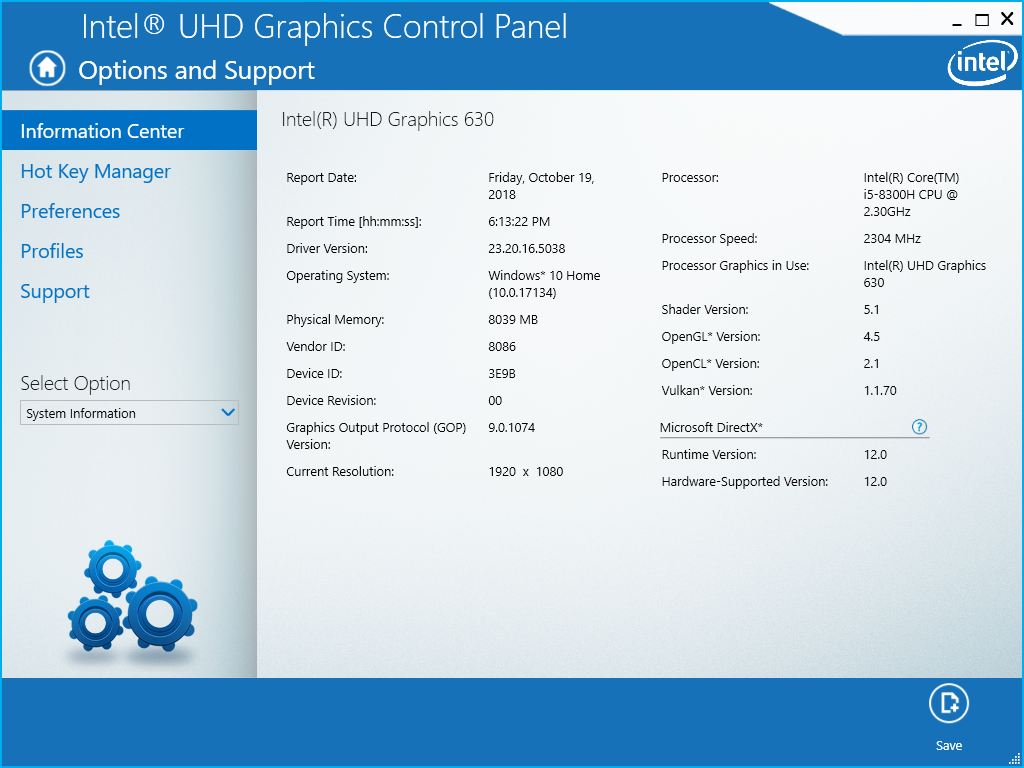
Nvidia Optimus is included by default for graphics switching to the integrated UHD Graphics 630.
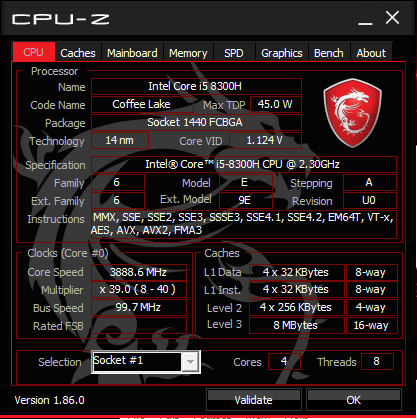
Processor
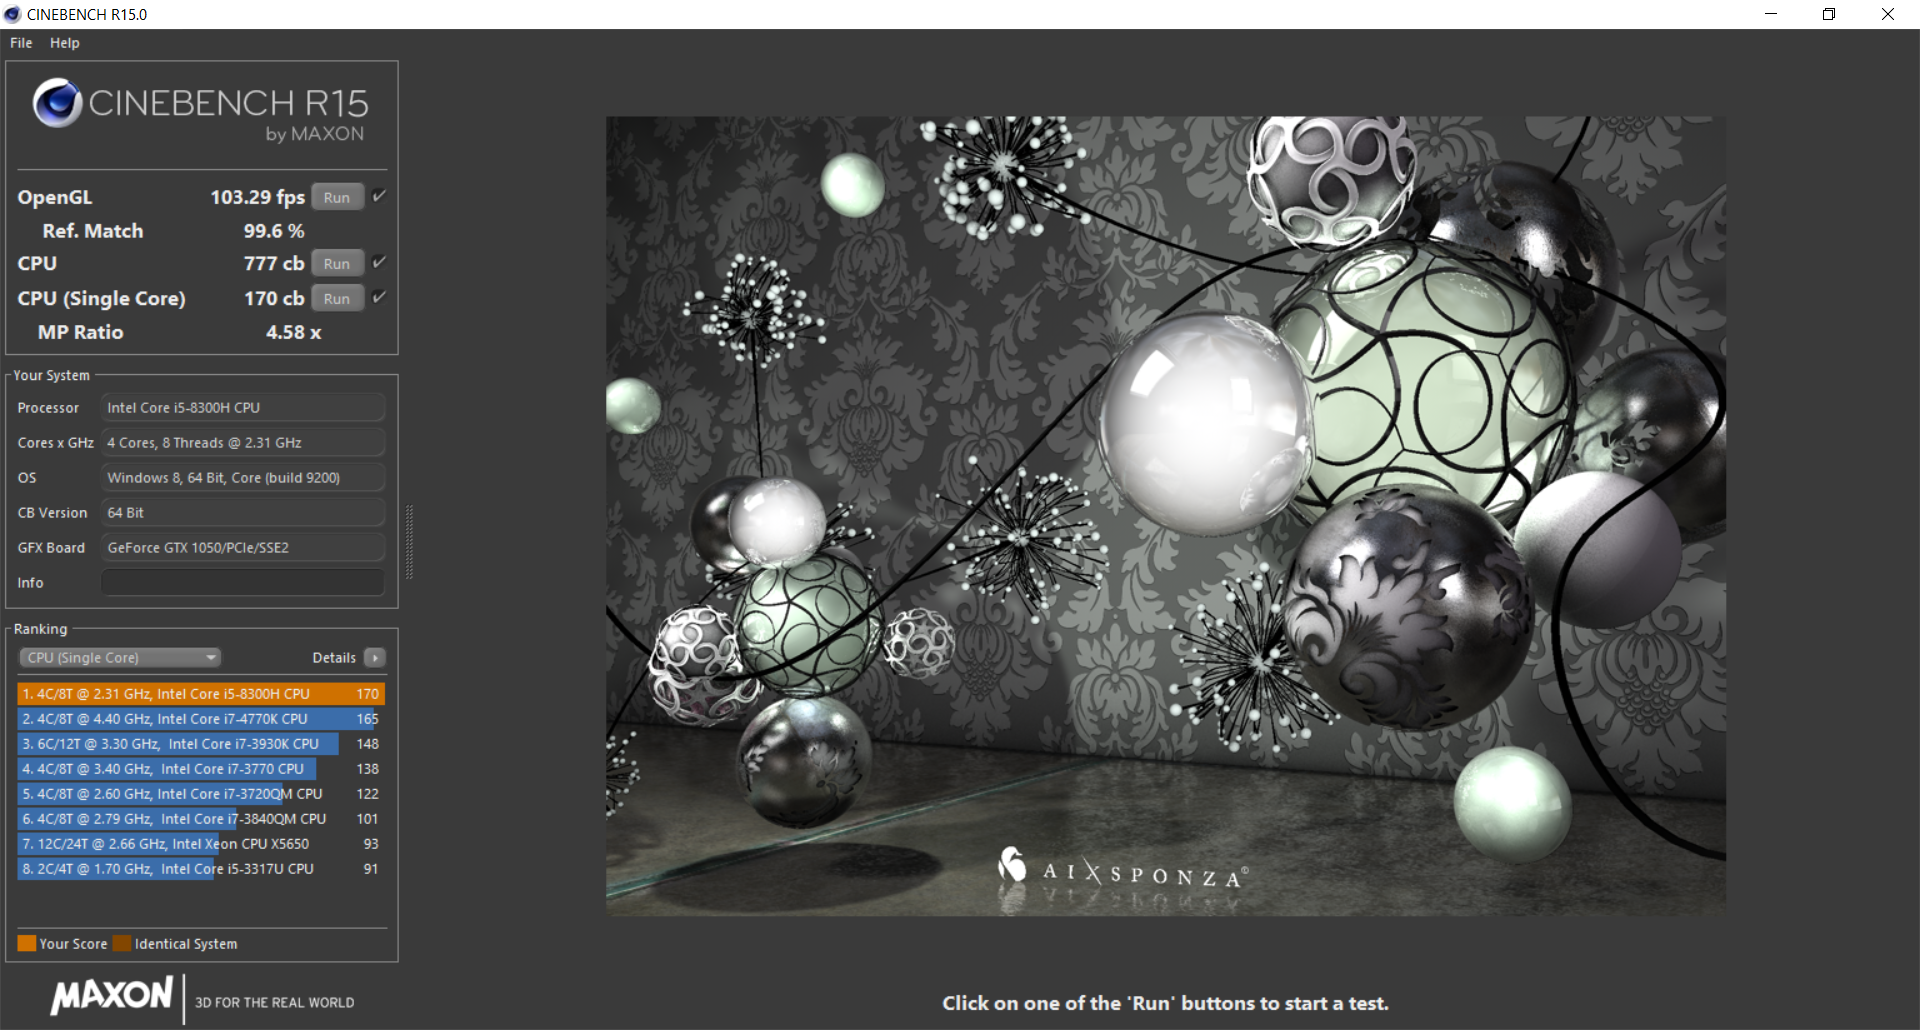
The Core i5-8300H directly replaces the i5-7300HQ and it provides a significant performance boost as well due to its implementation of Hyper Threading. CineBench R15 Multi-Thread reveals it to be about 51 percent faster than the i5-7300HQ in the MSI GV72 while barely edging out the i7-7700HQ in the last generation GF62VR. Users who want to upgrade to the i7-8750H SKU will get another 30 percent boost in CPU power when compared to the i5-8300H.
Running CineBench R15 Multi-Thread in a loop is a good way of testing CPU performance sustainability. The initial high score of 811 points for the first loop eventually drops to 749 points by the third loop to represent a dip of about 7.5 percent. The performance deficit is minor and of no concern when gaming.
See our dedicated page on the Core i5-8300H for more technical information and benchmark comparisons.
System Performance
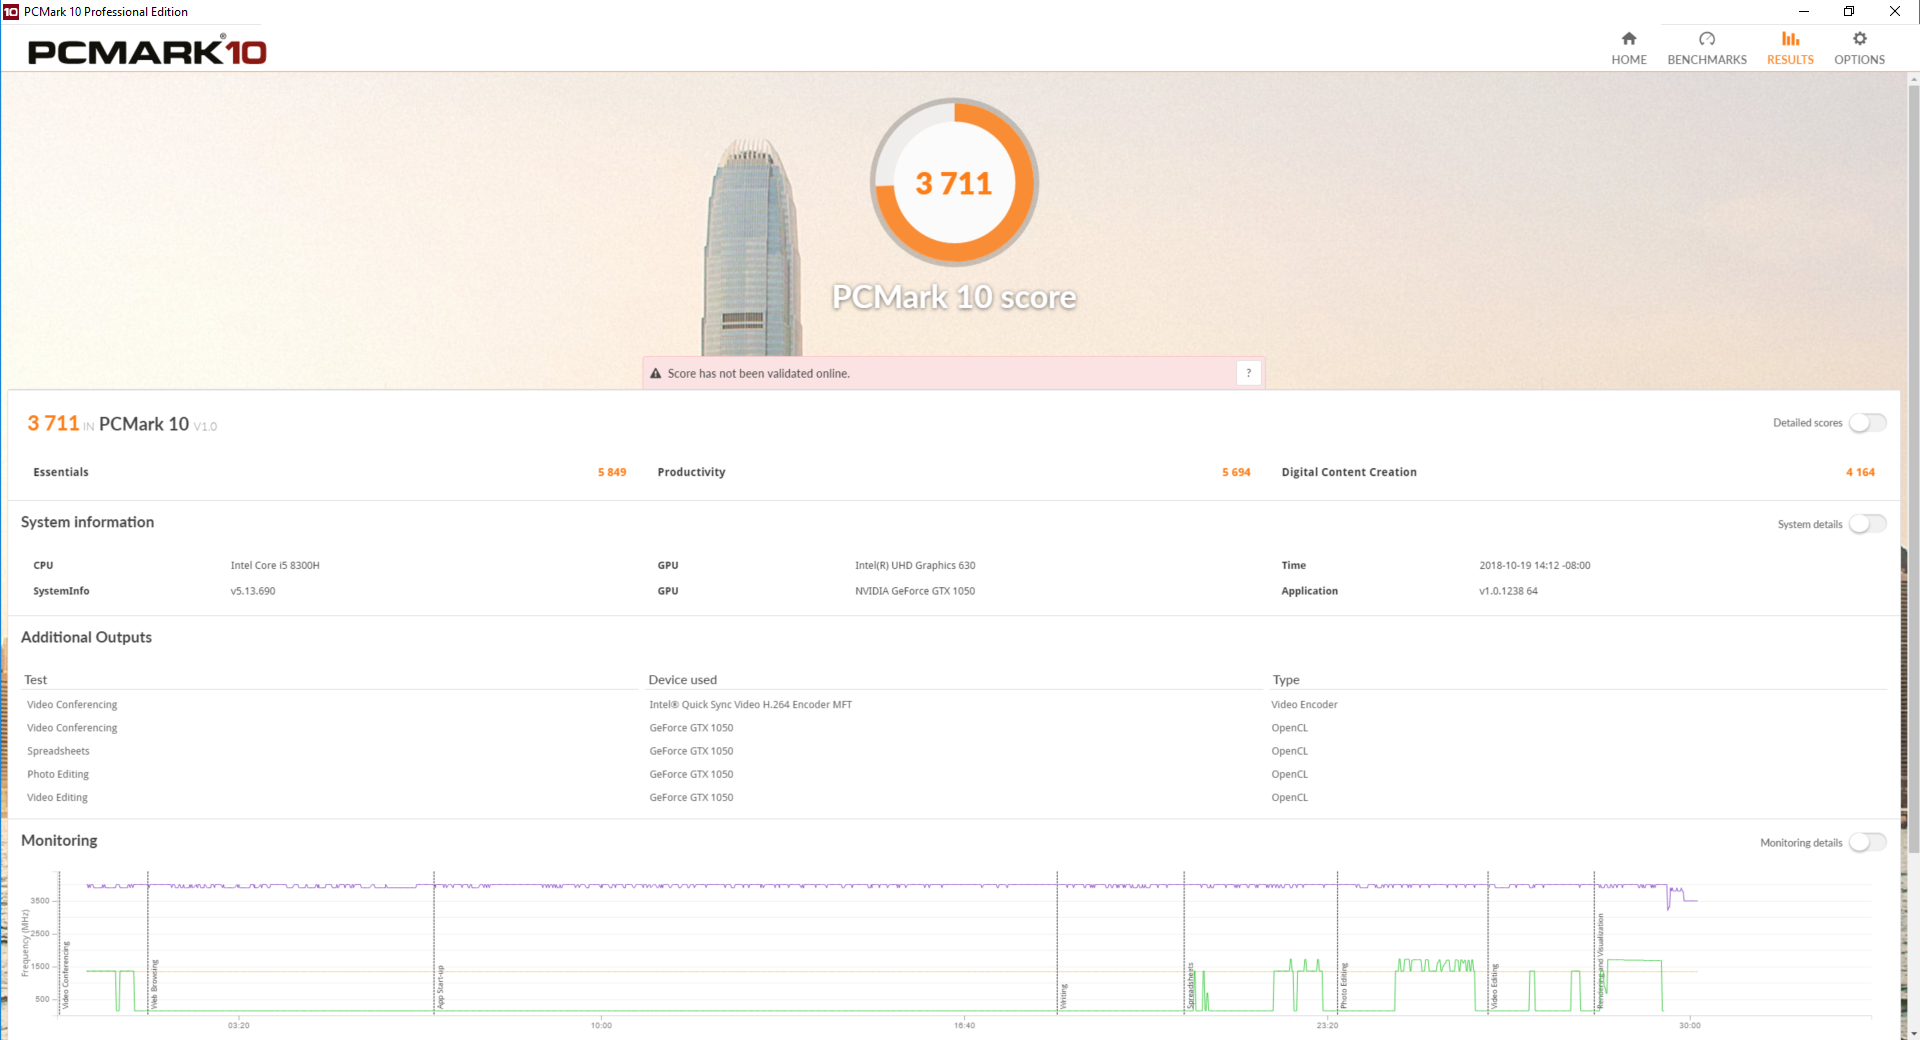
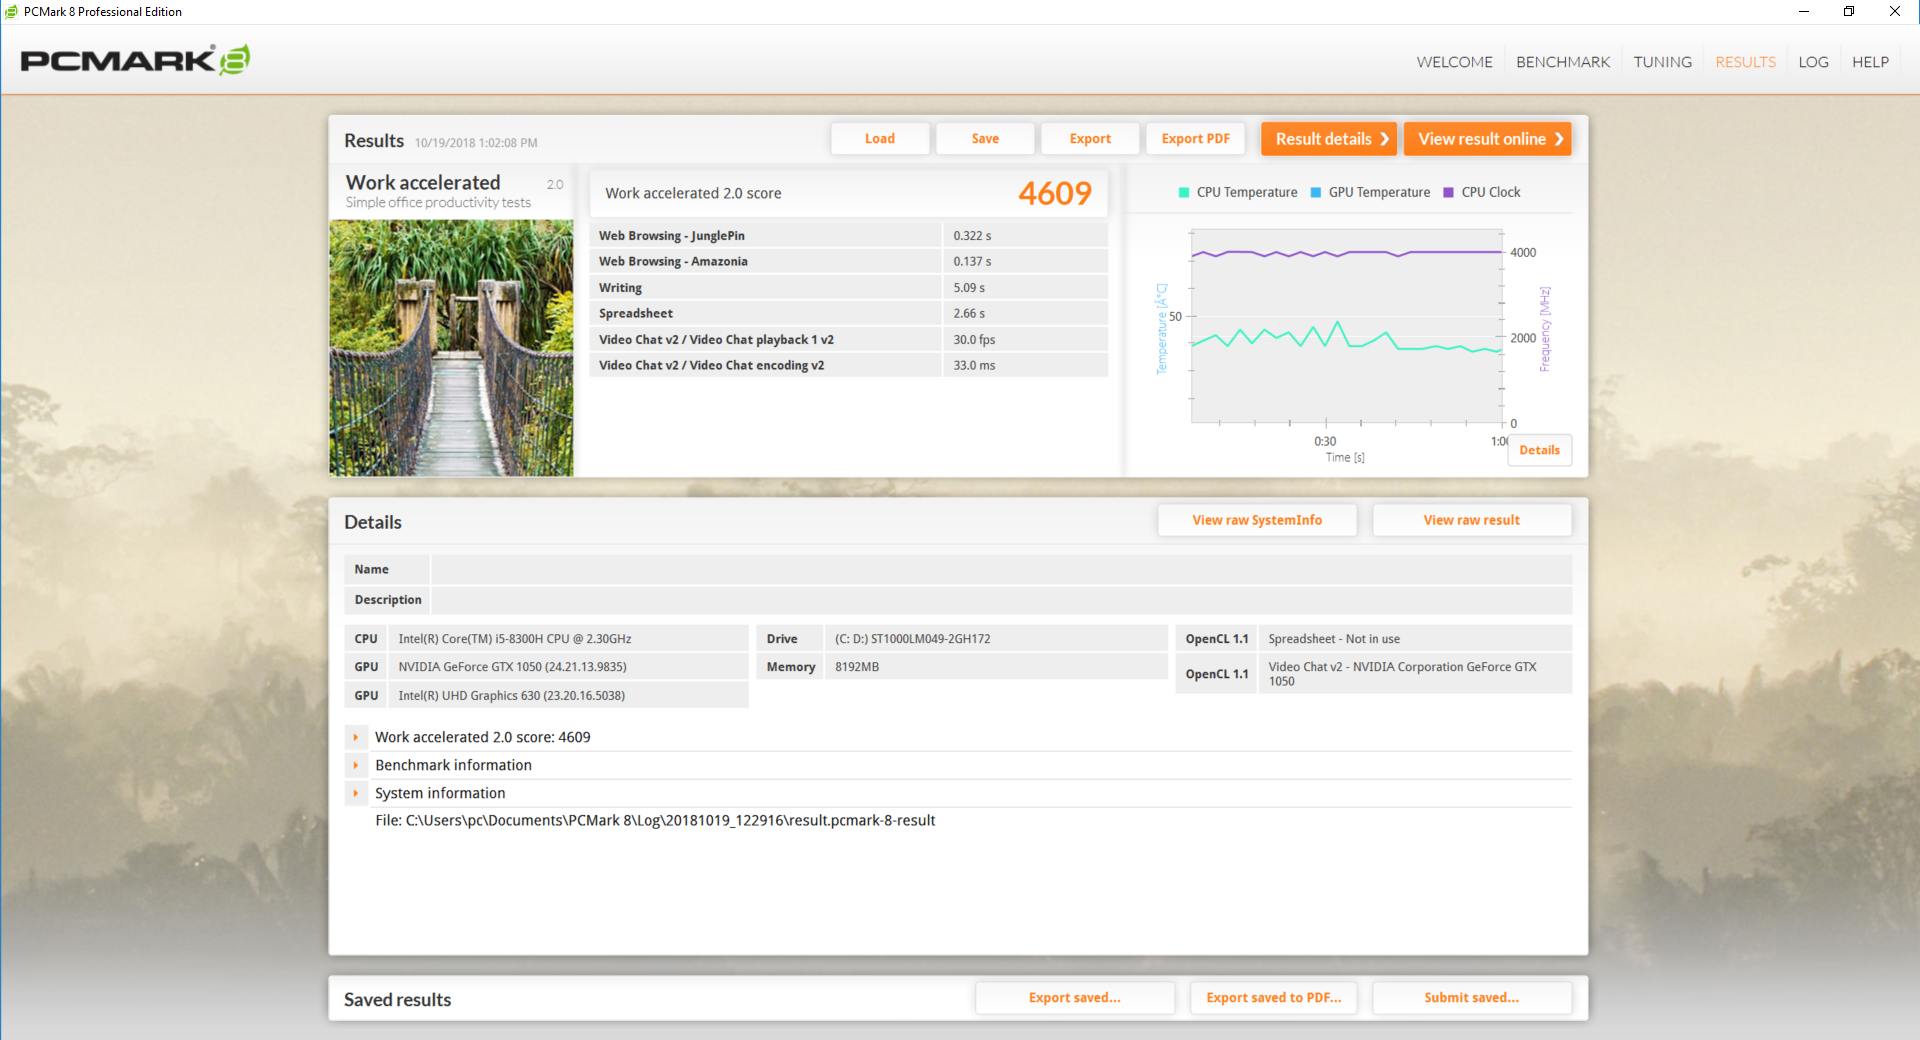
PCMark benchmarks rank our GF63 24 percent slower than the average gaming laptop in our database since this is an entry-level laptop for gamers. System performance is rather slow when navigating through the OS or launching applications and we highly recommend configuring with a primary SSD to avoid the disadvantages of a mechanical drive.
We experienced no software or hardware glitches during our time with the unit.
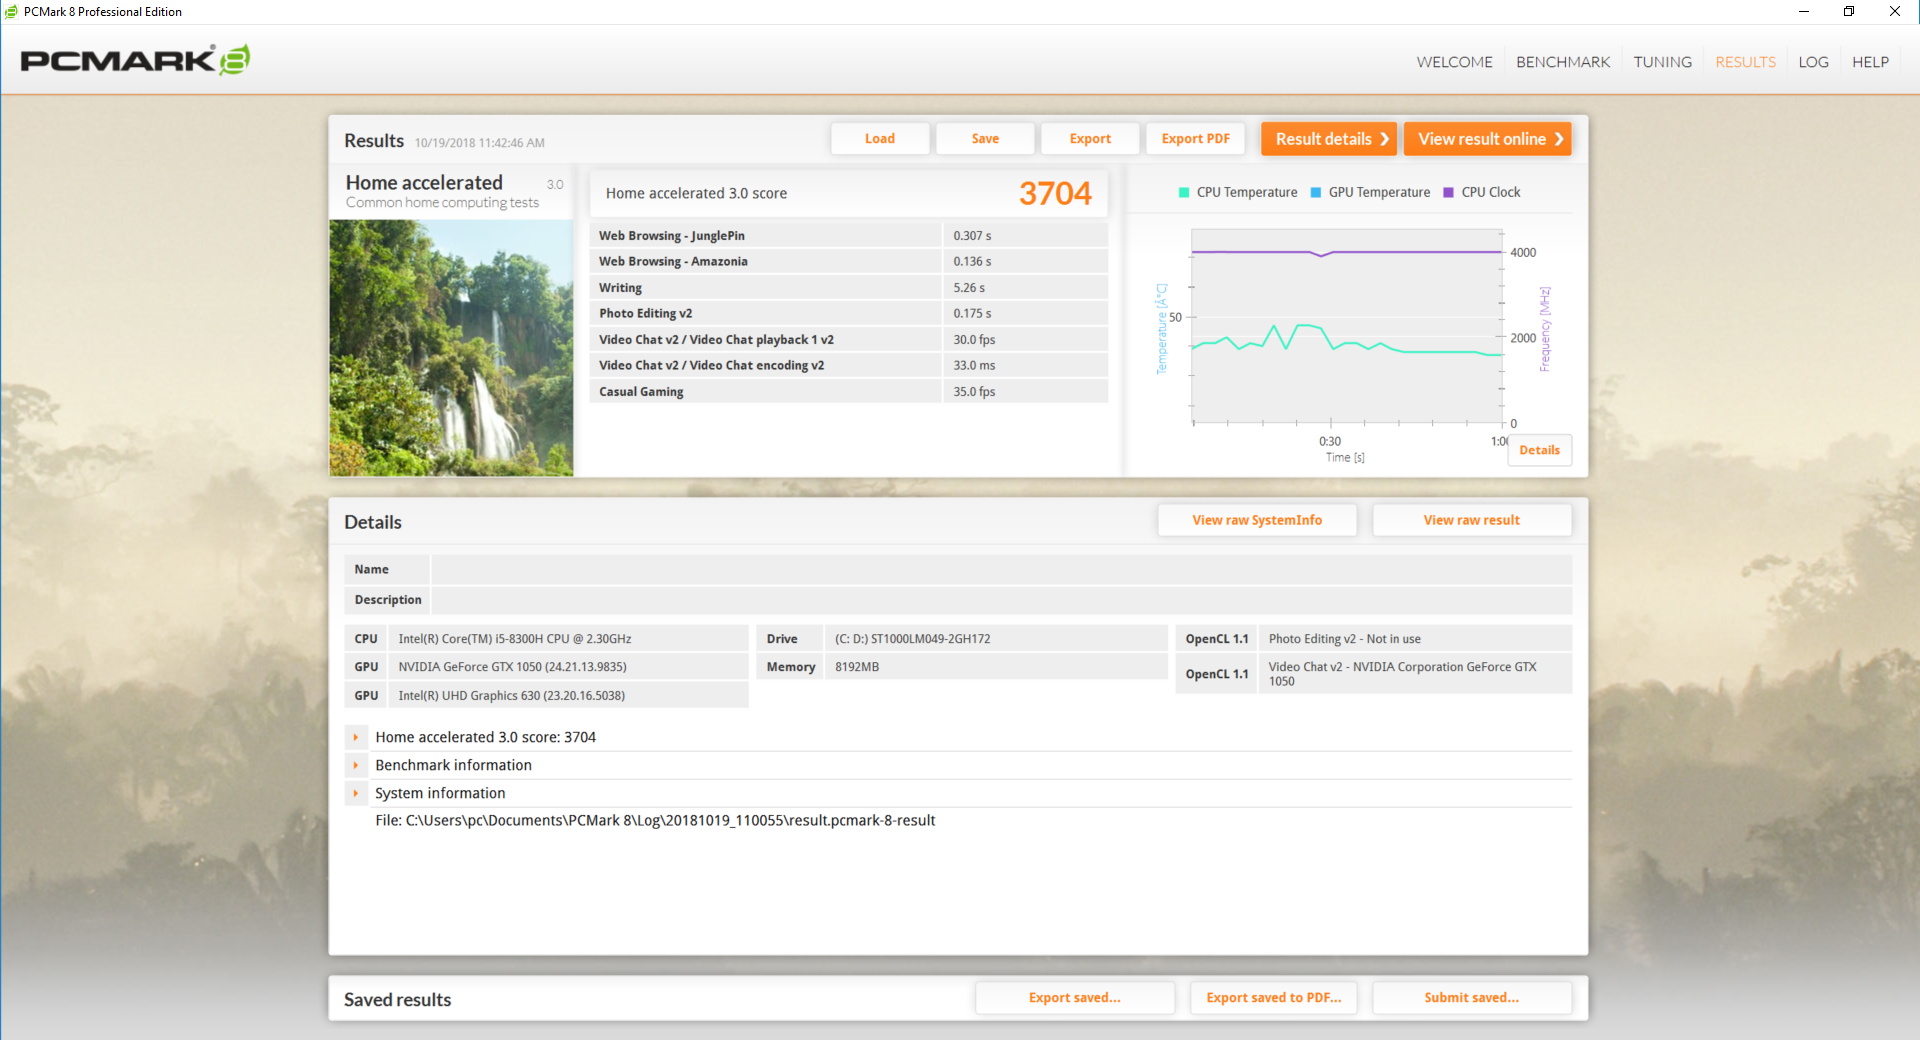
| PCMark 8 Home Score Accelerated v2 | 3704 points | |
| PCMark 8 Work Score Accelerated v2 | 4609 points | |
| PCMark 10 Score | 3711 points | |
Help | ||
Storage Devices
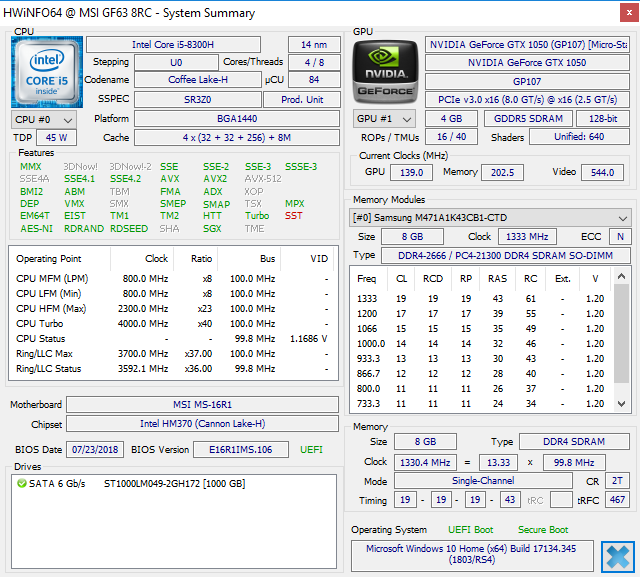
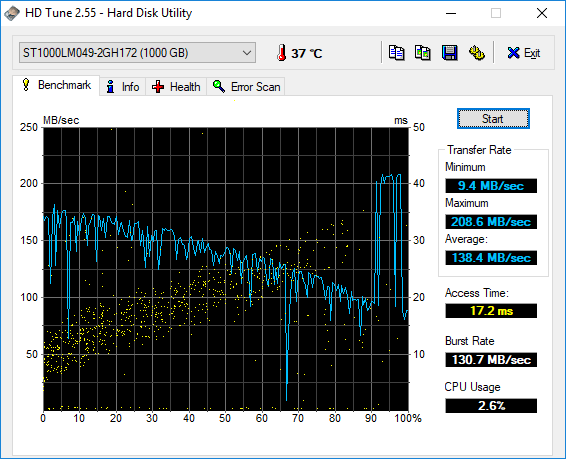
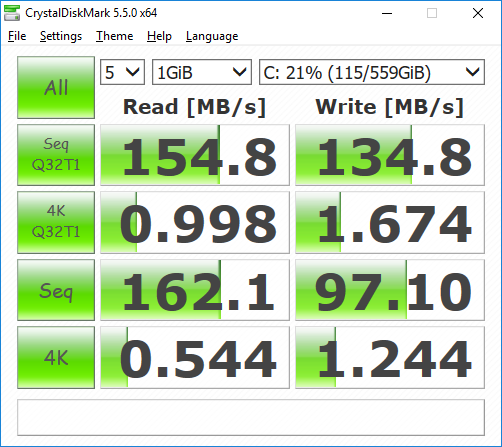
Two internal storage bays are available (M.2 2280 + 2.5-inch SATA III) with support for NVMe PCIe SSDs. Our test unit has a single 7200 RPM Seagate BarraCuda ST1000LM049 1 TB HDD with a very fast average transfer rate of 140 MB/s according to HD Tune. However, these results are probably skewed because of the integrated 128 MB cache as nearly every other 7200 RPM HDD in our database returns an average transfer rate much closer to 100 MB/s. Subjectively, there are still notable delays when launching applications as one would expect from a HDD-based PC.
See our table of HDDs and SSDs for more benchmark comparisons.
| MSI GF63 8RC Seagate BarraCuda Pro Compute 1TB ST1000LM049 | Panasonic Toughbook CF-54G2999VM Seagate BarraCuda Compute 1TB ST1000LM048 | Lenovo IdeaPad 330-15ARR-81D2005JGE Seagate Mobile HDD 1TB ST1000LM035 | Dell G3 15 3579 Seagate Mobile HDD 1TB ST1000LX015-1U7172 | Dell Latitude 15 3590-K8JP Toshiba MQ01ACF050 | |
|---|---|---|---|---|---|
| CrystalDiskMark 5.2 / 6 | -14% | -39% | -40% | -13% | |
| Write 4K (MB/s) | 1.244 | 1.145 -8% | 0.217 -83% | 0.202 -84% | 1.216 -2% |
| Read 4K (MB/s) | 0.544 | 0.453 -17% | 0.367 -33% | 0.461 -15% | 0.451 -17% |
| Write Seq (MB/s) | 97.1 | 52.2 -46% | 98.8 2% | 53.5 -45% | 117.6 21% |
| Read Seq (MB/s) | 162.1 | 122.7 -24% | 131.1 -19% | 107.2 -34% | 120 -26% |
| Write 4K Q32T1 (MB/s) | 1.674 | 2.428 45% | 0.222 -87% | 0.882 -47% | 1.212 -28% |
| Read 4K Q32T1 (MB/s) | 0.998 | 1.063 7% | 0.781 -22% | 1.057 6% | 0.844 -15% |
| Write Seq Q32T1 (MB/s) | 134.8 | 73.7 -45% | 97 -28% | 63.7 -53% | 115.1 -15% |
| Read Seq Q32T1 (MB/s) | 154.8 | 120.4 -22% | 93.3 -40% | 77.1 -50% | 121.6 -21% |

GPU Performance
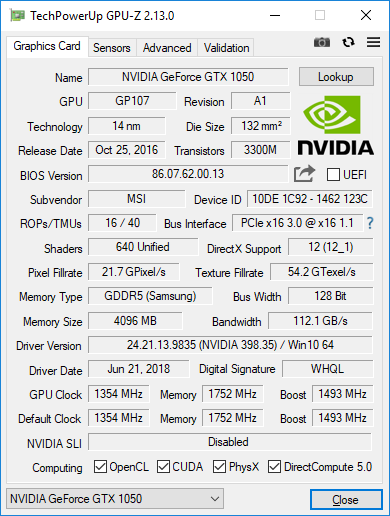
The Pascal GeForce GTX 1050 sits comfortably between the Maxwell GTX 960M and GTX 970M in terms of raw performance. Users who want the faster GF63 8RD SKU with GTX 1050 Ti Max-Q graphics will see a performance boost of about 22 percent to be near identical to the GTX 970M. Jumping to a different laptop with GTX 1060 brings an enormous graphics advantage of almost 100 percent over the GTX 1050.
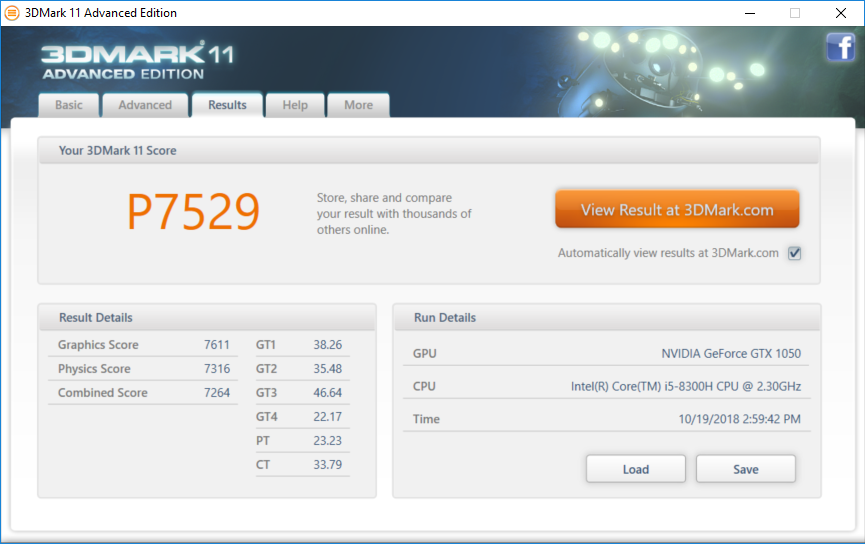
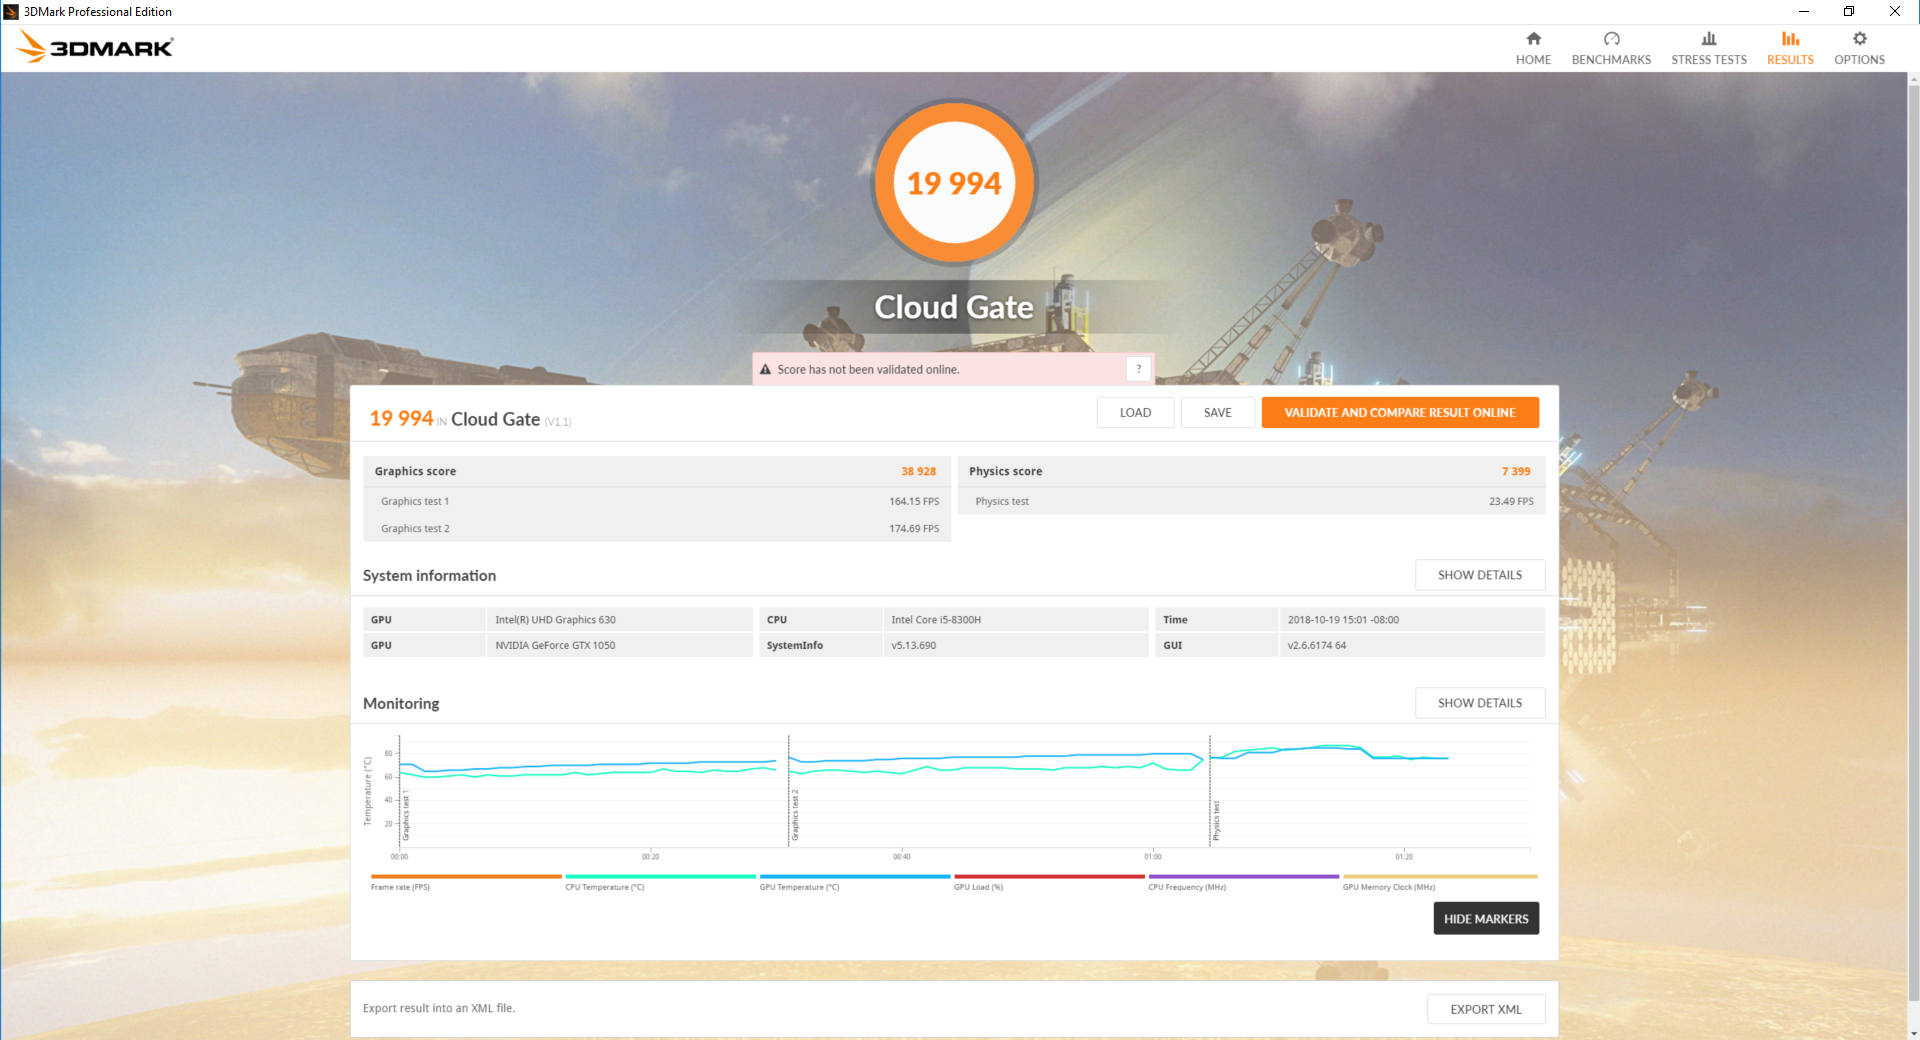
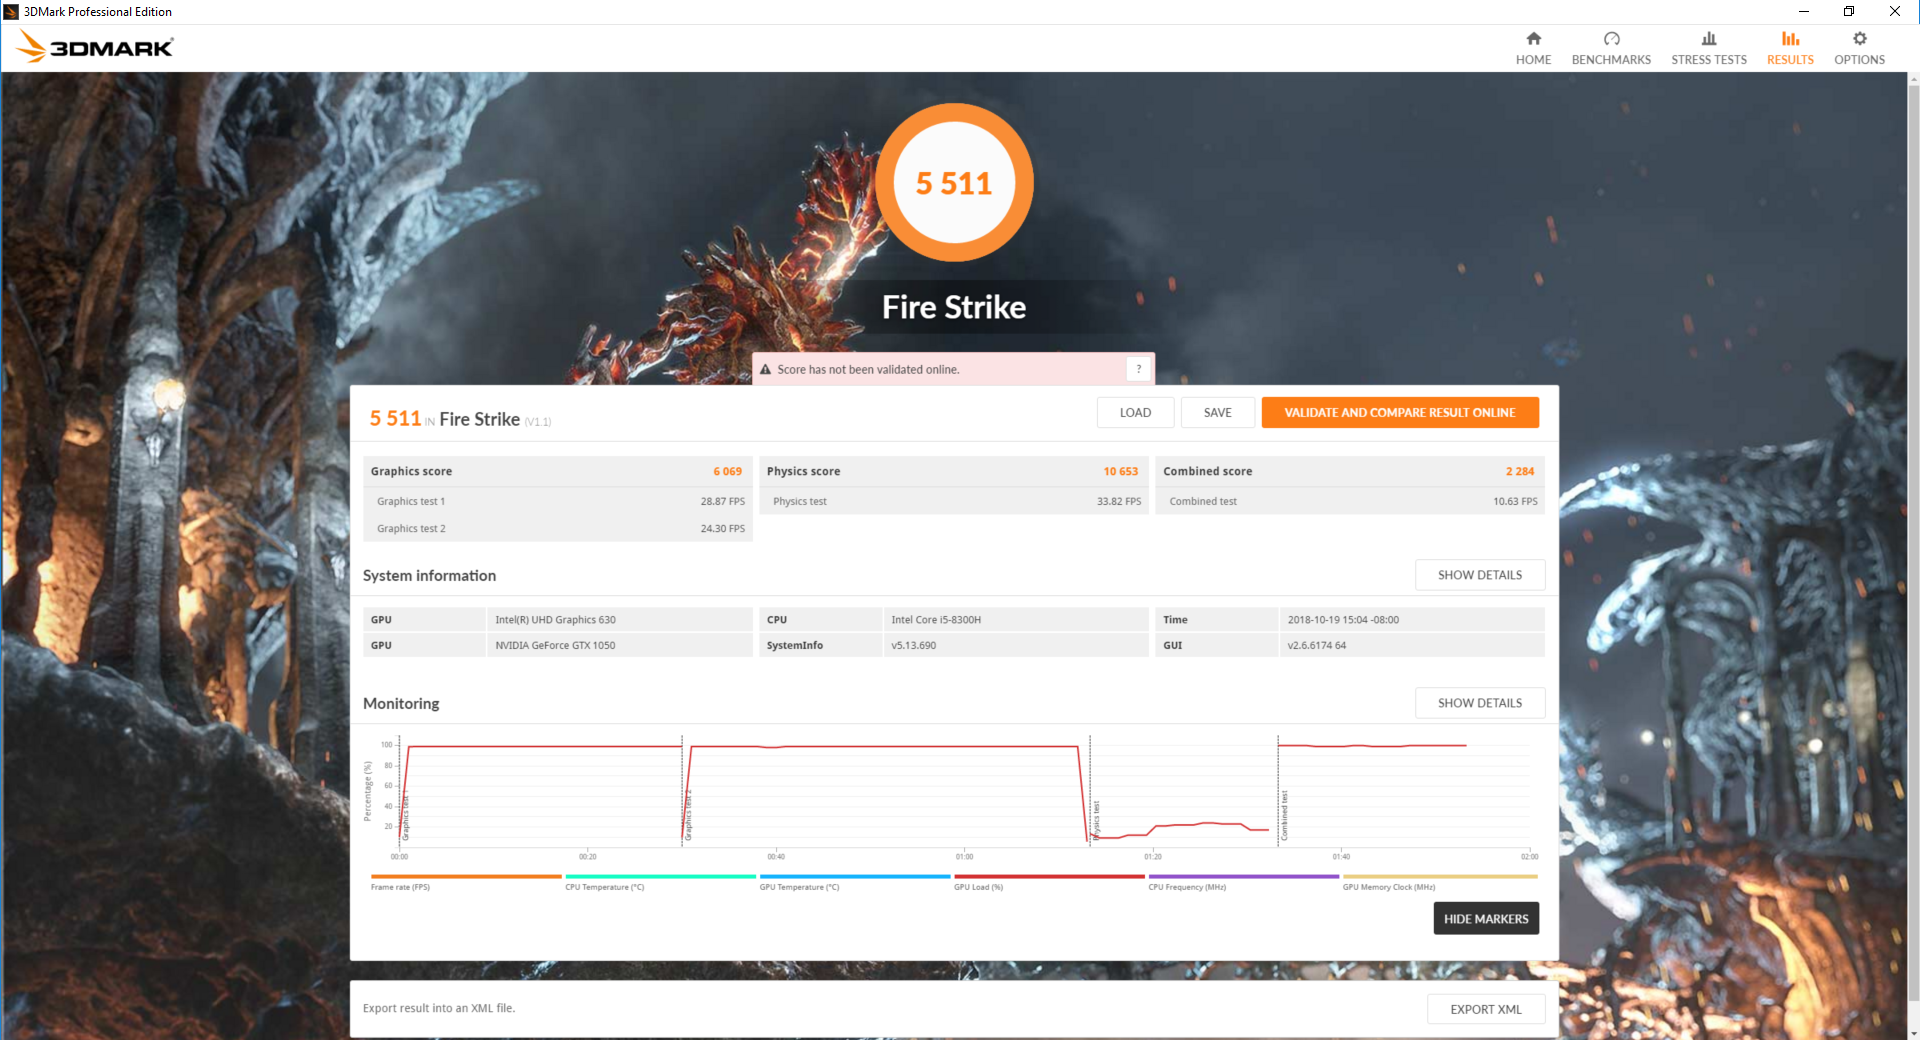
| 3DMark 11 Performance | 7529 points | |
| 3DMark Cloud Gate Standard Score | 19994 points | |
| 3DMark Fire Strike Score | 5511 points | |
Help | ||
Gaming Performance
Modern titles are playable at native 1080p with most effects turned down. Gamers who want to hit 60 FPS more easily should consider the GTX 1060 instead. Otherwise, expect 30 FPS when playing the latest games even if equipped with the GTX 1050 Ti Max-Q.
See our dedicated page on the GeForce GTX 1050 for more technical information and benchmark comparisons.
| low | med. | high | ultra | |
|---|---|---|---|---|
| BioShock Infinite (2013) | 234.1 | 180.8 | 159.8 | 64.5 |
| The Witcher 3 (2015) | 123.5 | 72.5 | 40.1 | 20.6 |
| Rise of the Tomb Raider (2016) | 124.7 | 72.8 | 38.6 | 33.7 |
Stress Test
We stress the system with synthetic loads to identify for any potential throttling or stability issues. When subjected to Prime95, the CPU can be observed running at up to 3.5 GHz for the first few seconds before dropping to a steady 2.1 GHz and a core temperature of only 57 C. Note that the base clock rate of the i5-8300H is higher at 2.3 GHz and so the GF63 is throttling just slightly to maintain the cool core temperature. This behavior is very odd because a wide temperature overhead is available for even faster clock rates, but the CPU refuses to stabilize at anything higher than 2.1 GHz despite running on the High Performance profile. It's not until we initiated Prime95+FurMark that the CPU would then decide to stabilize at a faster 2.8 GHz clock rate and at a higher core temperature of 81 C. We suspect it could be a bug in the automatic throttling settings of the CPU as this behavior is not normal on most other laptops.
When running Witcher 3 or higher loads, the GPU can reach temperatures greater than 83 C. In comparison, the GTX 1060 in the last generation GF62VR stabilizes at just 72 C in the same benchmark test despite being the more demanding GPU. The higher core temperatures of the newer GF63 can be explained by its gutted cooling system as our next section below will detail. Thankfully, the higher temperatures and aforementioned odd CPU behavior do not impact gaming performance as shown by our steady frame rate counter while running Witcher 3.
Running on battery power will limit both CPU and GPU performance despite setting the system to High Performance and the GPU to 'Prefer maximum performance'. A Fire Strike run on batteries returns Physics and Graphics scores of 9573 and 4734 points, respectively, compared to 10653 and 6069 points when on mains.
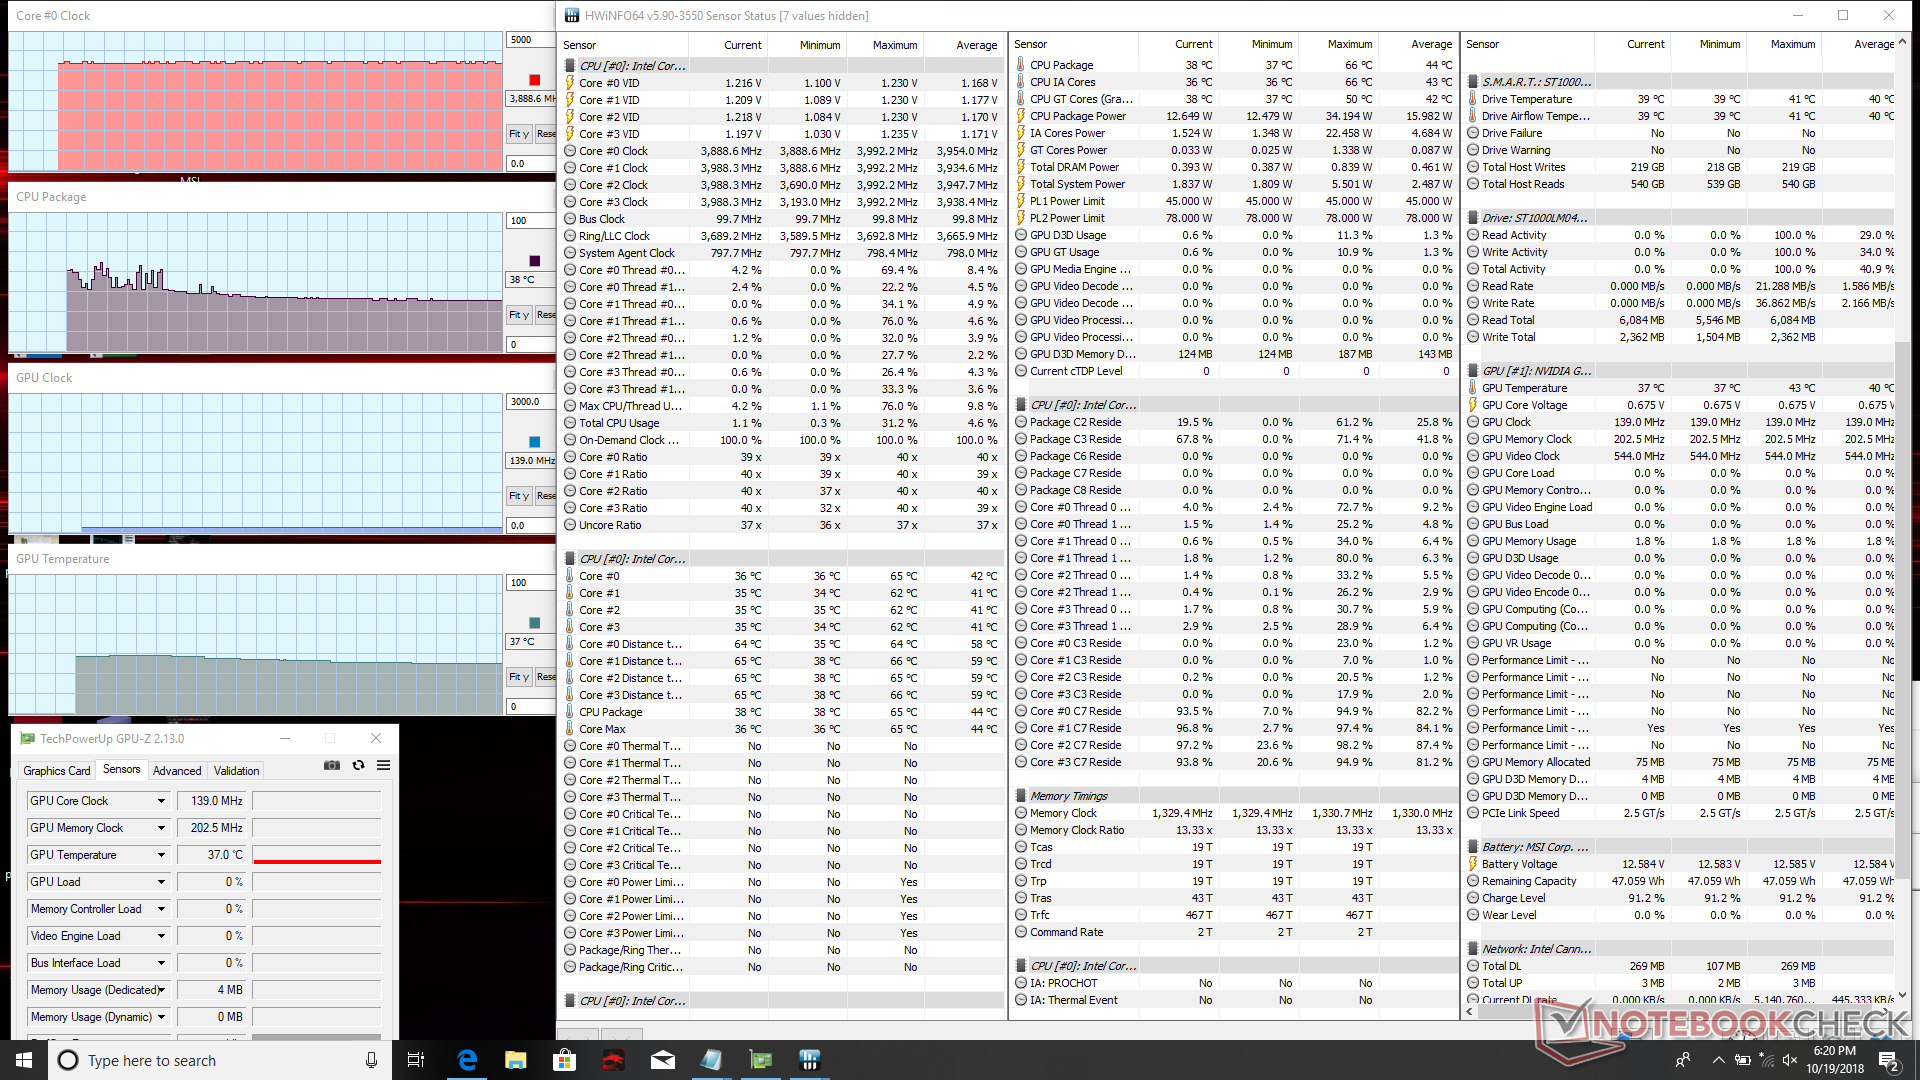
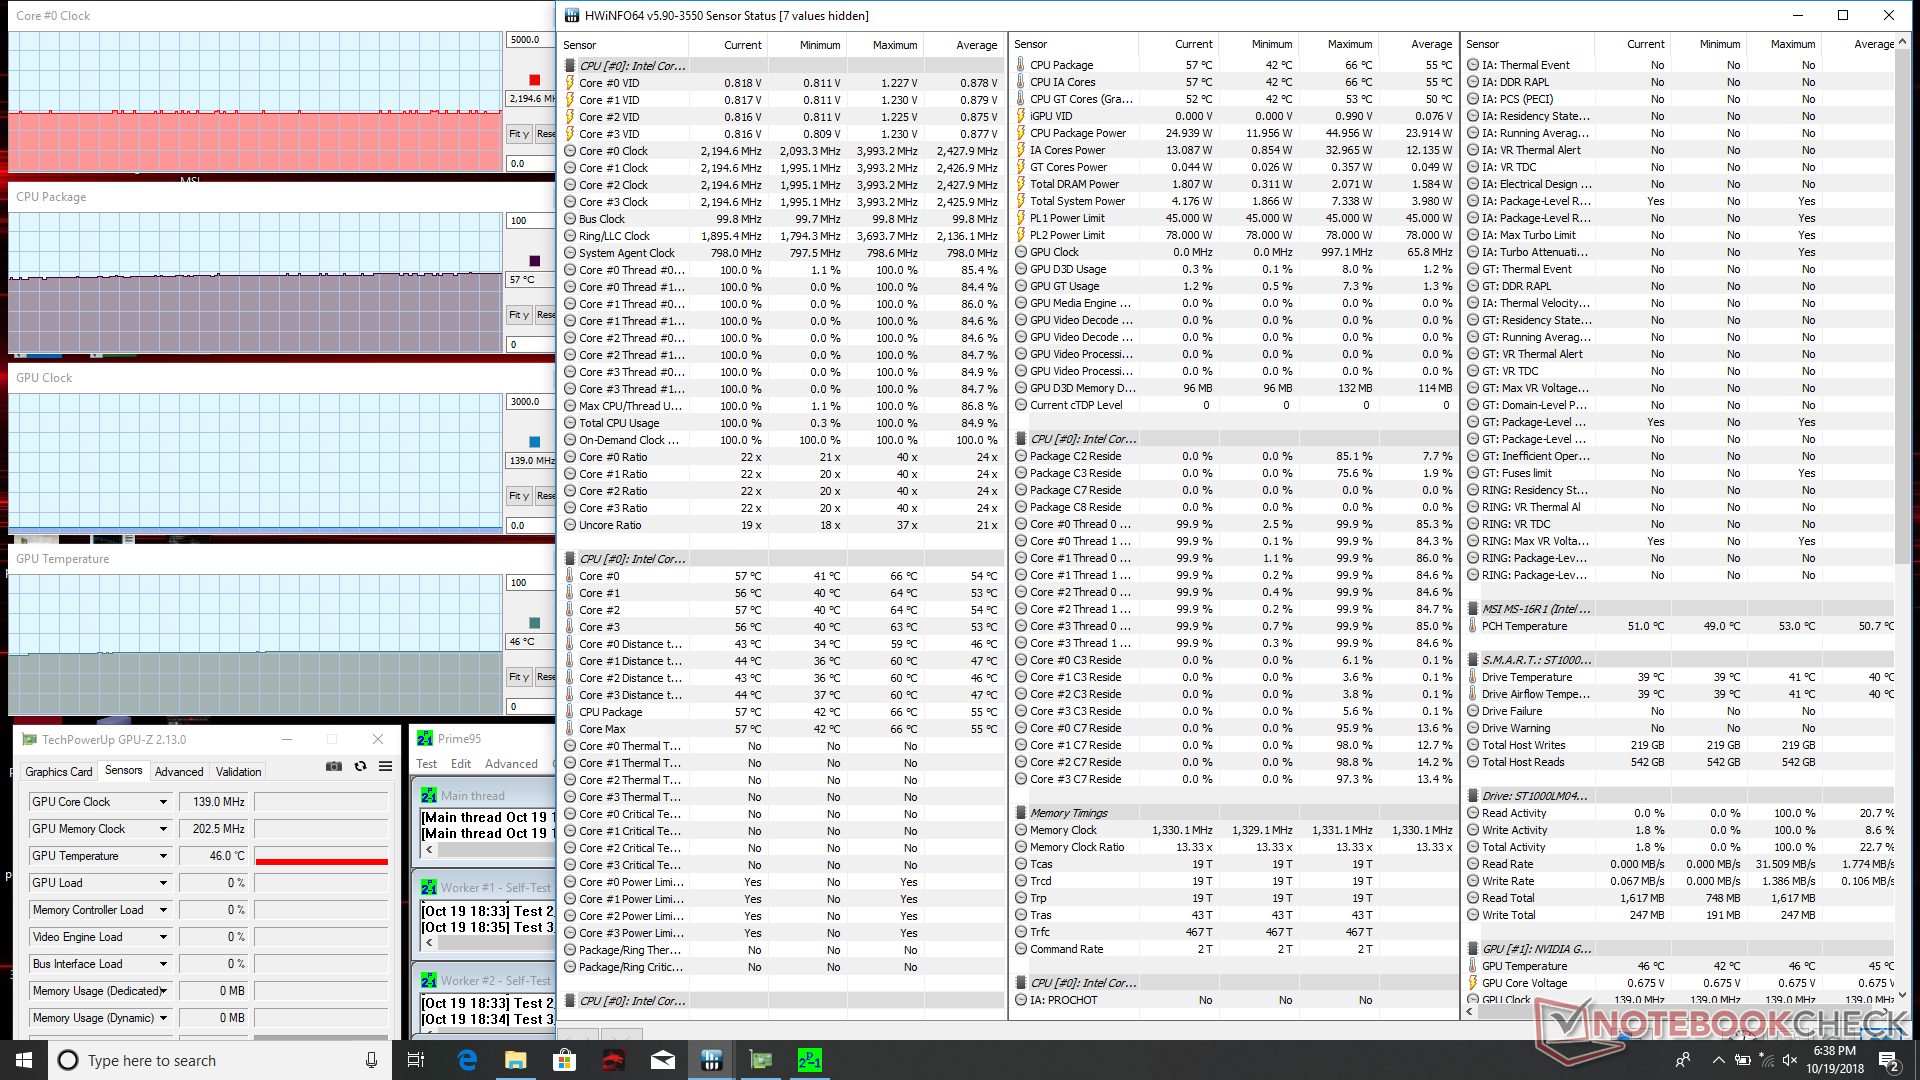
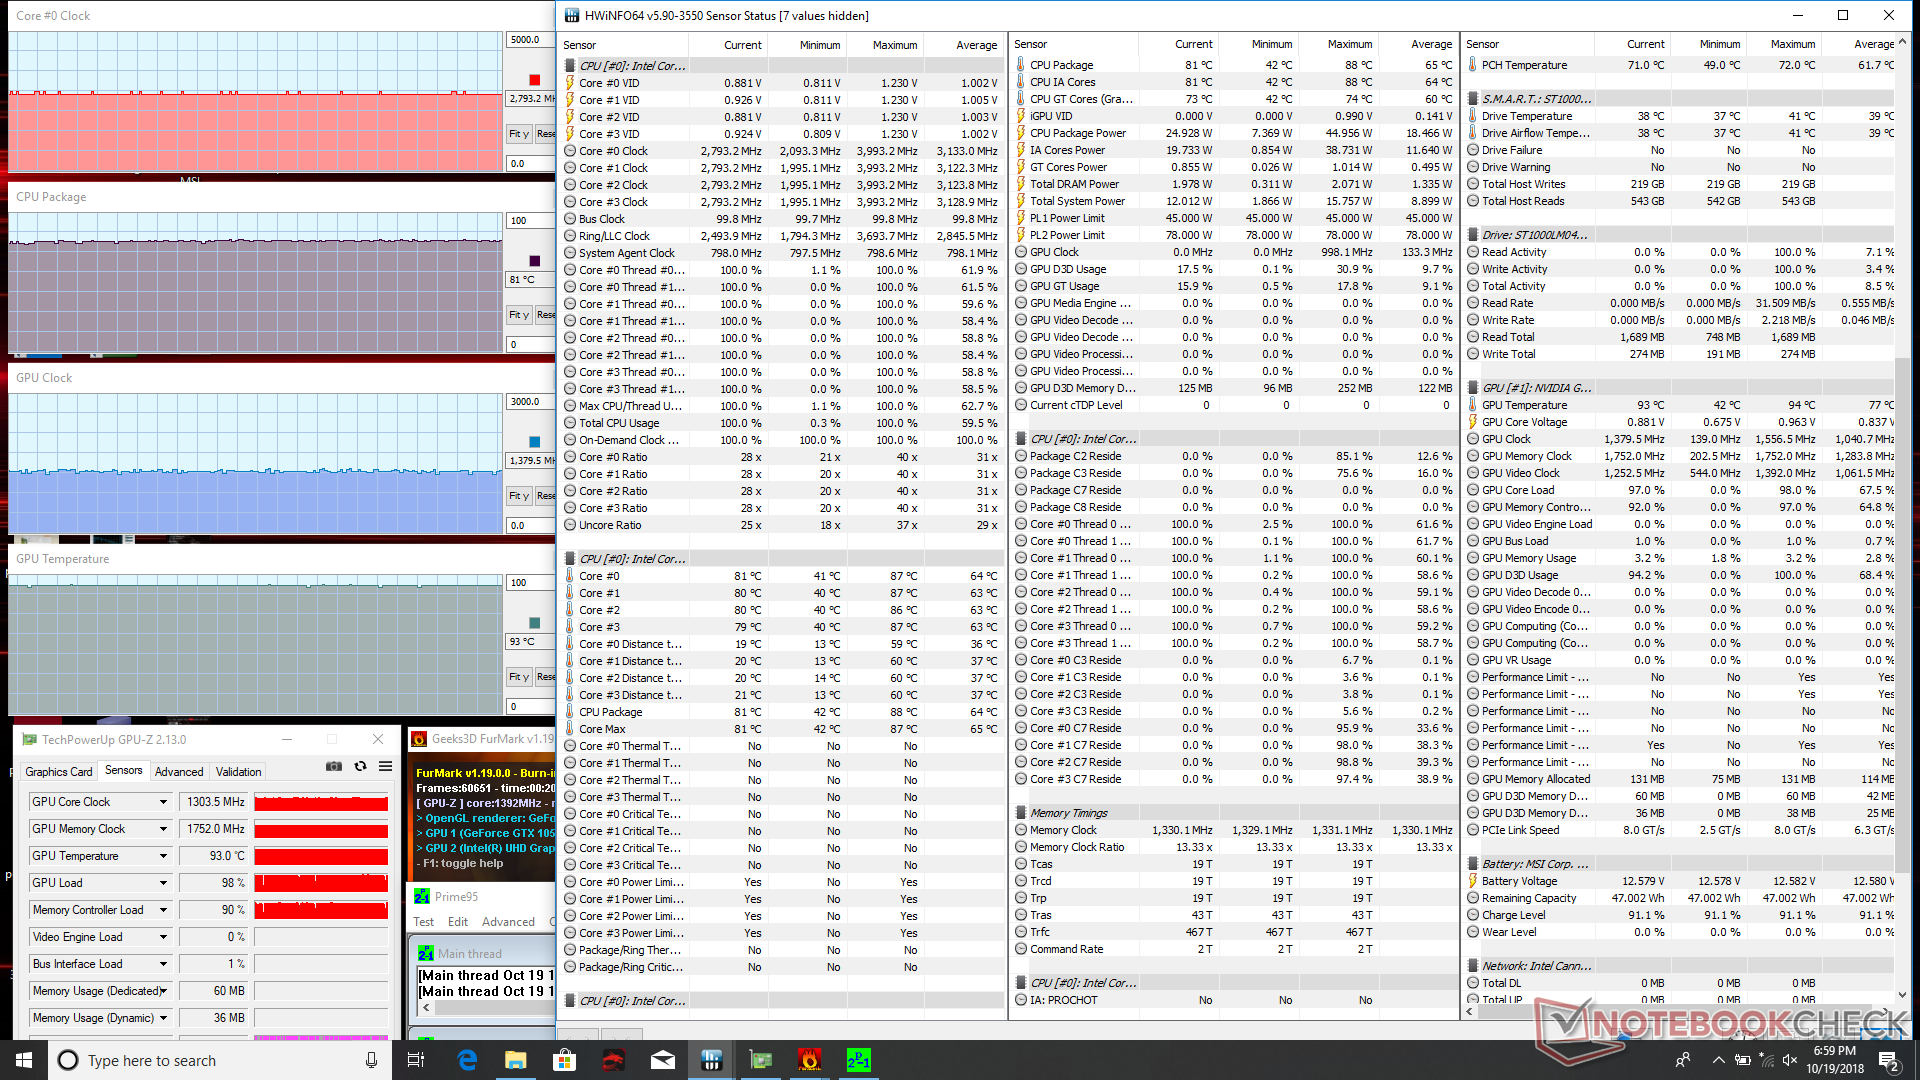
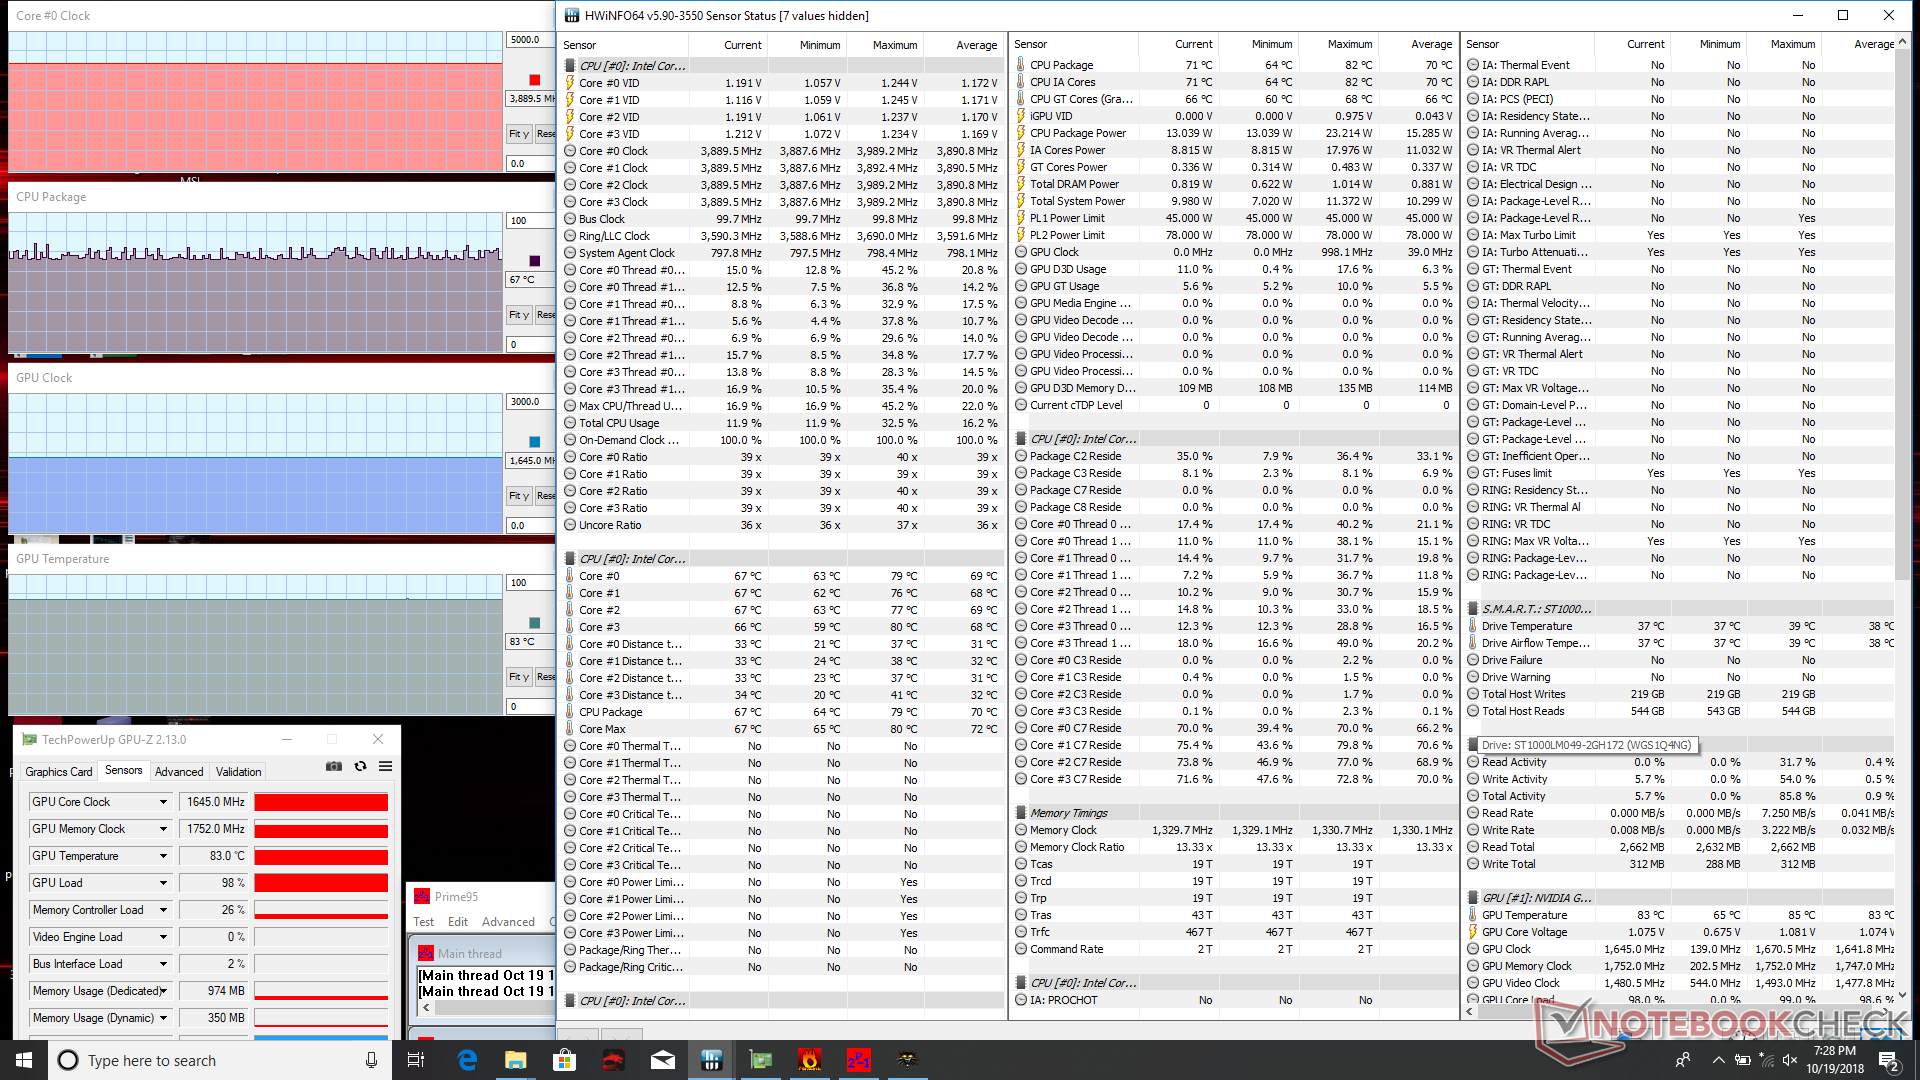
| CPU Clock (GHz) | GPU Clock (MHz) | Average CPU Temperature (°C) | Average GPU Temperature (°C) | |
| Prime95 Stress | 2.2 | -- | 57 | -- |
| FurMark Stress | -- | 1468 | -- | 93 |
| Prime95 + FurMark Stress | 2.8 | 1380 | 81 | 93 |
| Witcher 3 Stress | 3.9 | 1645 | ~67 | 83 |
Emissions
System Noise
MSI has halved the size of the cooling solution. When compared to the six heat pipes and two fans of the GF62VR, the GF63 utilizes just three heat pipes and a single fan. The move makes sense because the GF63 lacks a GTX 1060 option, but it also implies that MSI will unlikely introduce GPU options more demanding than the GTX 1050 series in the near future since the cooling system here may not be up to the task.
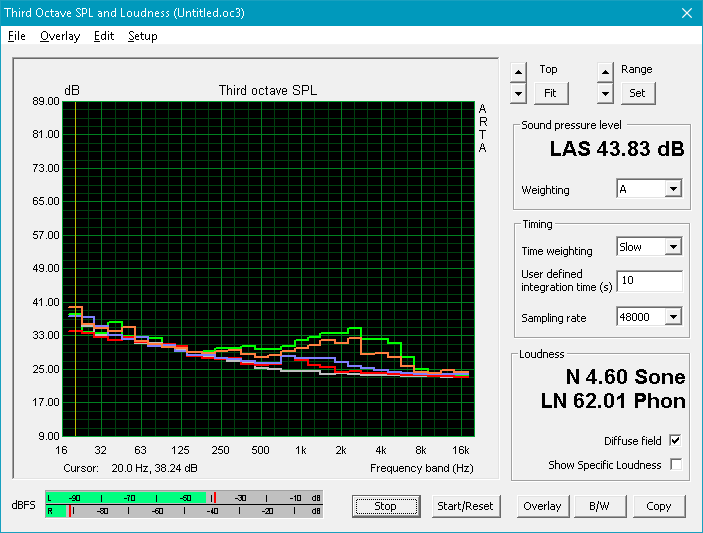
Fan noise is always present on the GF63 because the fan never idles. Simply sitting on desktop produces a fan noise of about 34 dB(A) by default not unlike on the GF62VR. Fan control options are available in the MSI Dragon control center software, but we are unable to get a completely silent streaming or emailing experience no matter the setting even after accounting for the HDD noise.
Fortunately, the GF63 is noticeably quieter than the GF62VR when gaming. Running Witcher 3 produces a fan noise of 43 dB(A) compared to 48 dB(A) on the last generation model at the cost of higher GPU temperatures as shown in our Stress Test section above. The low-to-mid 40 dB(A) range is commonplace for gaming laptops.
Our unit suffers from no audible electronic noise.
Noise level
| Idle |
| 33.8 / 34 / 34.2 dB(A) |
| Load |
| 37.3 / 46 dB(A) |
 | ||
30 dB silent 40 dB(A) audible 50 dB(A) loud |
||
min: | ||
| MSI GF63 8RC GeForce GTX 1050 Mobile, i5-8300H, Seagate BarraCuda Pro Compute 1TB ST1000LM049 | MSI GS65 Stealth Thin 8RE-051US GeForce GTX 1060 Mobile, i7-8750H, Samsung SSD PM981 MZVLB256HAHQ | Asus Strix GL504GM GeForce GTX 1060 Mobile, i7-8750H, Toshiba NVMe THNSN5256GPU7 | Acer Aspire 7 A715-71G-53TU GeForce GTX 1050 Mobile, i5-7300HQ, Kingston RBUSNS8180DS3128GH | MSI GF62VR 7RF-877 GeForce GTX 1060 Mobile, i7-7700HQ, Intel SSD 600p SSDPEKKW256G7 | Dell G5 15 5587 GeForce GTX 1060 Max-Q, i5-8300H, SK hynix SC311 M.2 | |
|---|---|---|---|---|---|---|
| Noise | 3% | 0% | 6% | -5% | 3% | |
| off / environment * (dB) | 28 | 28.4 -1% | 28.5 -2% | 30.4 -9% | 28.1 -0% | 30.3 -8% |
| Idle Minimum * (dB) | 33.8 | 28.4 16% | 30 11% | 30.4 10% | 33.5 1% | 31.1 8% |
| Idle Average * (dB) | 34 | 28.4 16% | 30 12% | 30.8 9% | 33.5 1% | 31.1 9% |
| Idle Maximum * (dB) | 34.2 | 29.6 13% | 30 12% | 30.8 10% | 33.5 2% | 34.2 -0% |
| Load Average * (dB) | 37.3 | 43.5 -17% | 41.8 -12% | 33.6 10% | 41.3 -11% | 34.9 6% |
| Witcher 3 ultra * (dB) | 43.4 | 45.7 -5% | 47.6 -10% | 48.5 -12% | 42.7 2% | |
| Load Maximum * (dB) | 46 | 45.7 1% | 50 -9% | 43.4 6% | 53.5 -16% | 44 4% |
* ... smaller is better
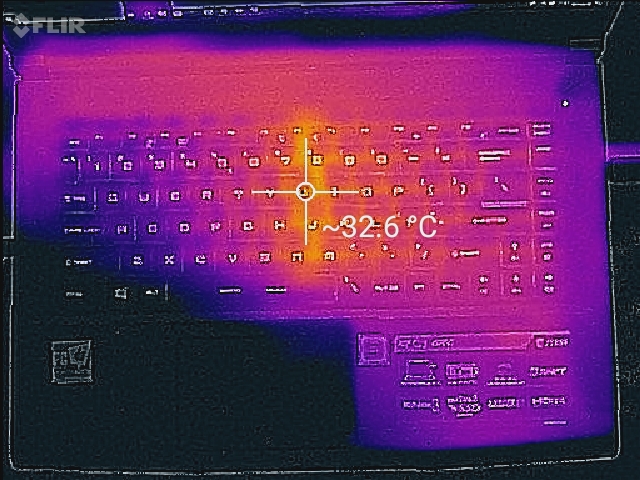
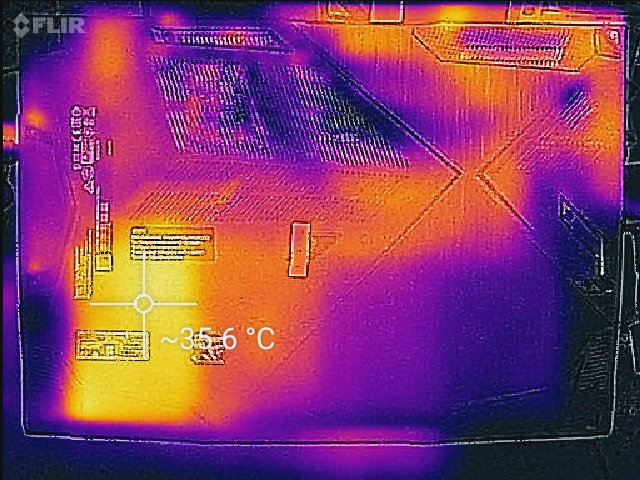
Temperature
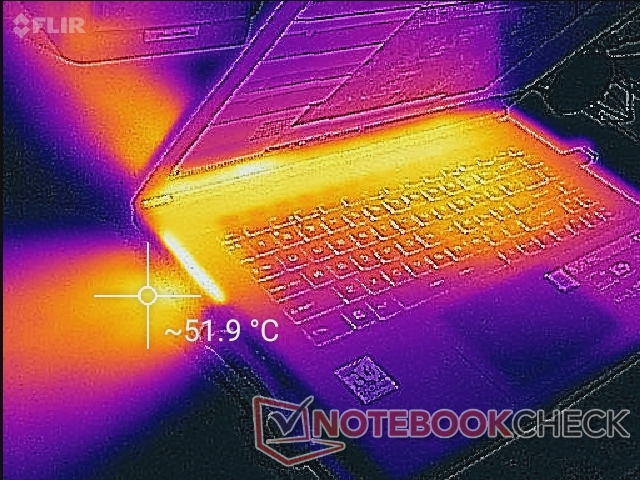
Surface temperatures are flat on both sides of the system when idling save for the spot directly underneath the 2.5-inch SATA bay. Users who decide to replace the 2.5-inch drive with a M.2 SSD will be moving this hot spot towards the M.2 slot instead.
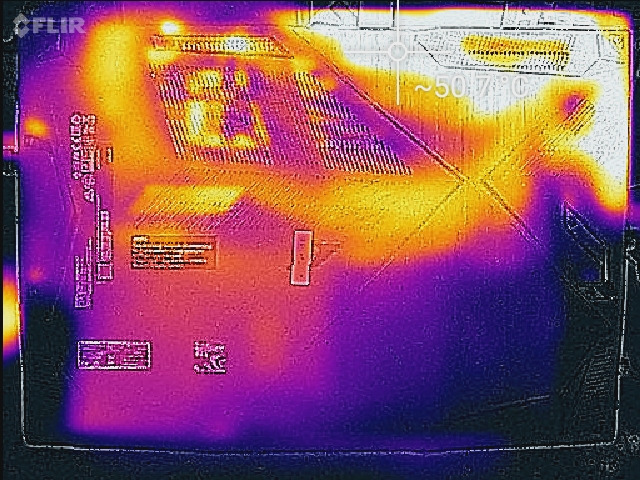
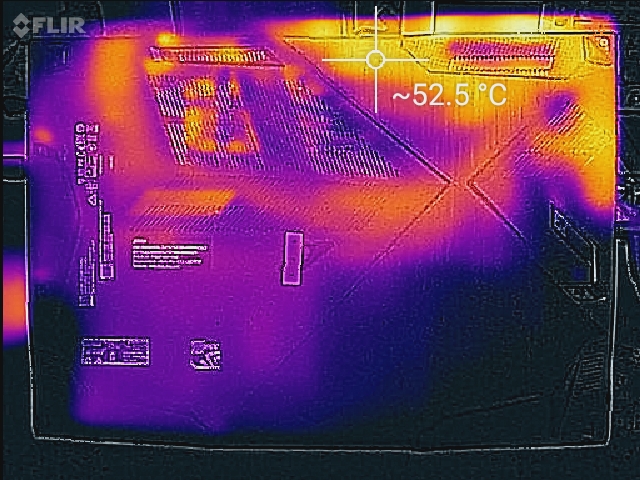
When under very high loads, the right side of the keyboard can become as warm as 50 C since the GPU is located directly underneath this region. Interestingly, results are similar to the GF62VR where we were also able to record a surface temperature of 50 C on this exact same spot on the keyboard. Because of the asymmetric cooling solution of the GF63, however, temperatures on the bottom of the notebook are warmest towards the back right corner where the two ventilation grilles are located. Be sure to allow for adequate airflow surrounding this corner of the notebook.
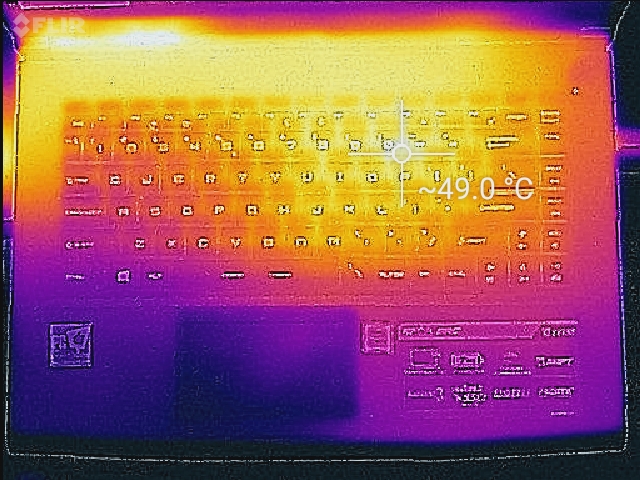
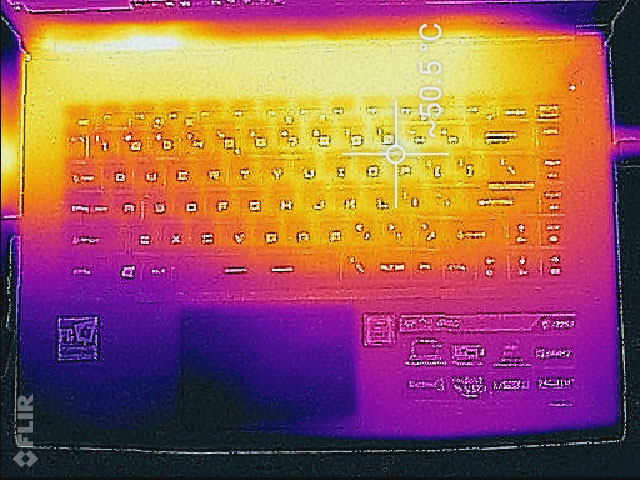
(-) The maximum temperature on the upper side is 50.8 °C / 123 F, compared to the average of 40.4 °C / 105 F, ranging from 21.2 to 68.8 °C for the class Gaming.
(-) The bottom heats up to a maximum of 52 °C / 126 F, compared to the average of 43.2 °C / 110 F
(+) In idle usage, the average temperature for the upper side is 29.3 °C / 85 F, compared to the device average of 33.9 °C / 93 F.
(-) Playing The Witcher 3, the average temperature for the upper side is 39.9 °C / 104 F, compared to the device average of 33.9 °C / 93 F.
(+) The palmrests and touchpad are reaching skin temperature as a maximum (33.6 °C / 92.5 F) and are therefore not hot.
(-) The average temperature of the palmrest area of similar devices was 28.8 °C / 83.8 F (-4.8 °C / -8.7 F).
Speakers
The stereo 2 x 2 W speakers have good sound quality with balanced mid and high tones. Bass is average at best since the system lacks a dedicated subwoofer unlike on the larger Lenovo Legion Y730 17 or MSI GT75 series. Higher volume settings are loud enough to fill a small conference room and will vibrate the chassis only minimally. Gamers will appreciate the separate 3.5 mm jacks for earphones and microphone.
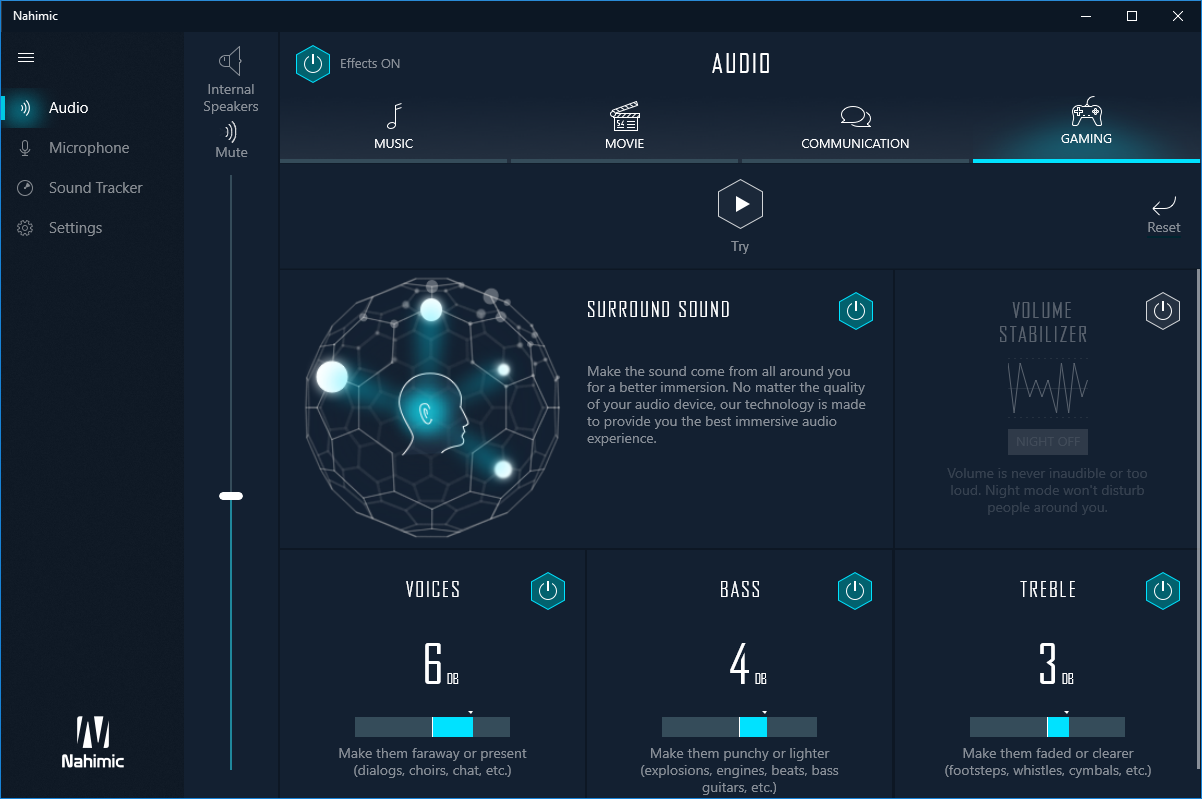
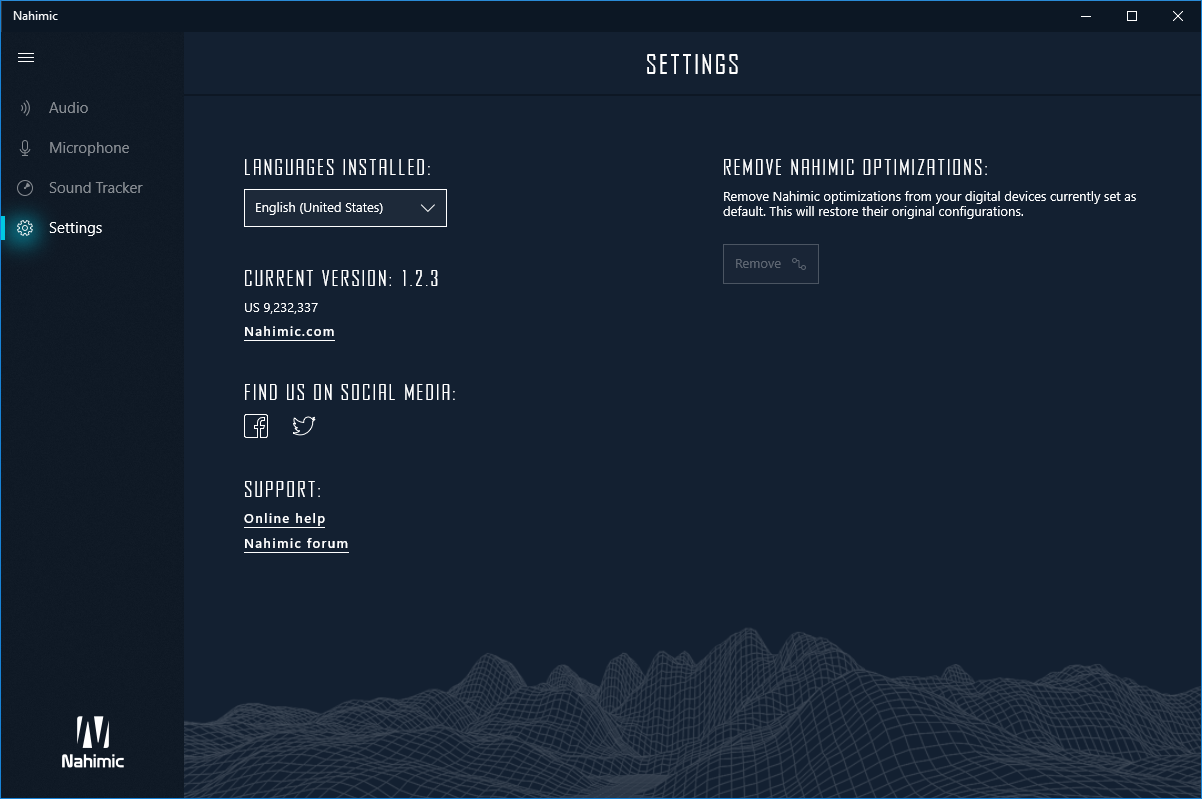
As with all other MSI gaming laptops, the Nahimic software is once again included for audio control.


MSI GF63 8RC audio analysis
(-) | not very loud speakers (70.2 dB)
Bass 100 - 315 Hz
(-) | nearly no bass - on average 18.9% lower than median
(±) | linearity of bass is average (13.8% delta to prev. frequency)
Mids 400 - 2000 Hz
(+) | balanced mids - only 1.6% away from median
(+) | mids are linear (6.7% delta to prev. frequency)
Highs 2 - 16 kHz
(+) | balanced highs - only 1.2% away from median
(+) | highs are linear (4.6% delta to prev. frequency)
Overall 100 - 16.000 Hz
(±) | linearity of overall sound is average (18.5% difference to median)
Compared to same class
» 60% of all tested devices in this class were better, 8% similar, 32% worse
» The best had a delta of 6%, average was 18%, worst was 132%
Compared to all devices tested
» 42% of all tested devices were better, 8% similar, 51% worse
» The best had a delta of 4%, average was 23%, worst was 134%
Apple MacBook 12 (Early 2016) 1.1 GHz audio analysis
(+) | speakers can play relatively loud (83.6 dB)
Bass 100 - 315 Hz
(±) | reduced bass - on average 11.3% lower than median
(±) | linearity of bass is average (14.2% delta to prev. frequency)
Mids 400 - 2000 Hz
(+) | balanced mids - only 2.4% away from median
(+) | mids are linear (5.5% delta to prev. frequency)
Highs 2 - 16 kHz
(+) | balanced highs - only 2% away from median
(+) | highs are linear (4.5% delta to prev. frequency)
Overall 100 - 16.000 Hz
(+) | overall sound is linear (10.2% difference to median)
Compared to same class
» 7% of all tested devices in this class were better, 2% similar, 90% worse
» The best had a delta of 5%, average was 18%, worst was 53%
Compared to all devices tested
» 5% of all tested devices were better, 1% similar, 94% worse
» The best had a delta of 4%, average was 23%, worst was 134%
Energy Management
Power Consumption
Overall consumption is very similar to the the 15.6-inch MSI GL63 because both systems share the same CPU and GPU. Note that the last generation GF62VR is more demanding than the GF63 by as much as 36 percent when gaming due largely to its more powerful GTX 1060 GPU.
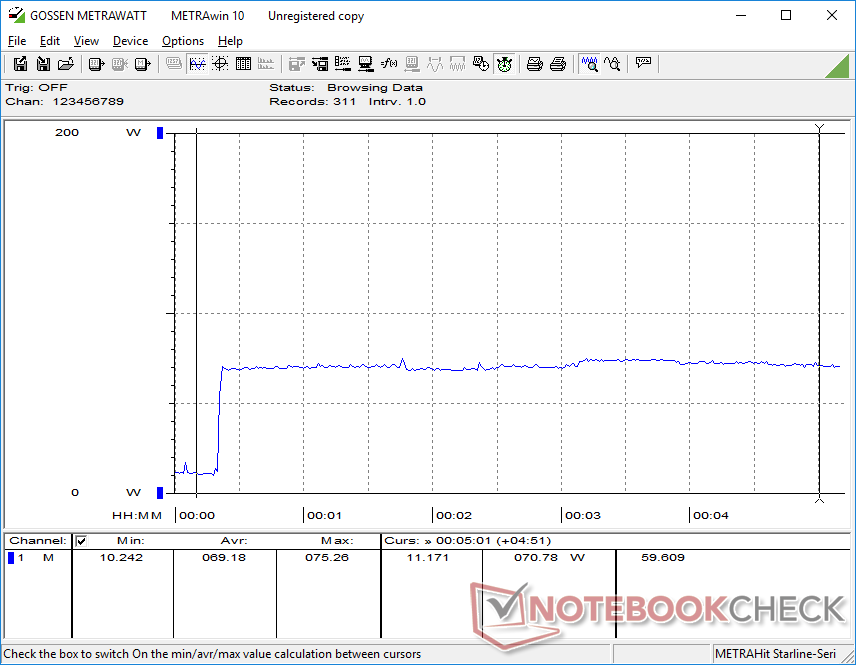
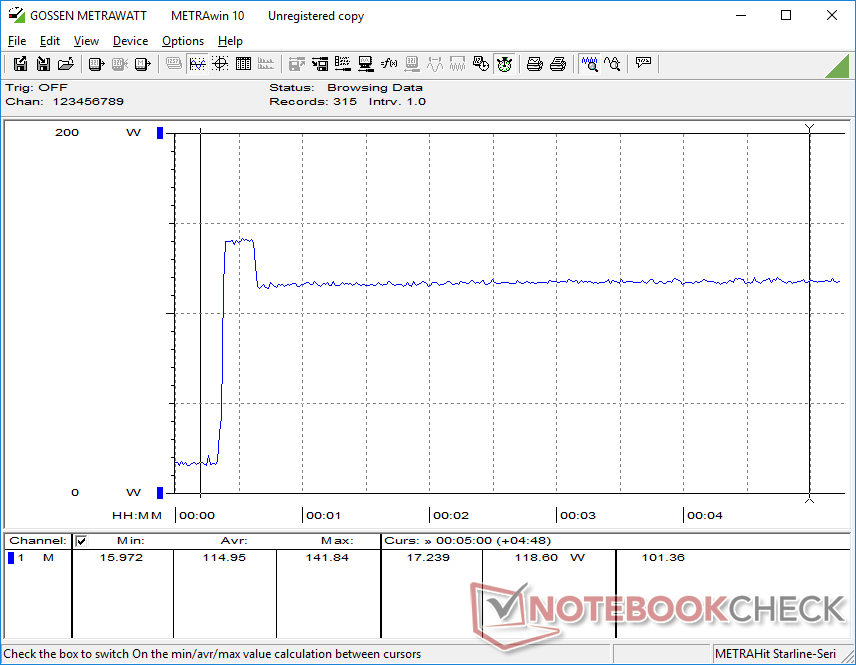
We are able to record a consumption of 142 W from the medium-sized (~14.8 x 7.4 x 2.6 cm) 120 W AC adapter. Consumption eventually settles at 119 W when subjected to extreme loads as shown by our graph below. A more capable 150 W or 180 W AC adapter would have been better for the system.
| Off / Standby | |
| Idle | |
| Load |
|
Key:
min: | |
| MSI GF63 8RC i5-8300H, GeForce GTX 1050 Mobile, Seagate BarraCuda Pro Compute 1TB ST1000LM049, IPS, 1920x1080, 15.6" | MSI GF62VR 7RF-877 i7-7700HQ, GeForce GTX 1060 Mobile, Intel SSD 600p SSDPEKKW256G7, TN LED, 1920x1080, 15.6" | MSI GL63 8RC-069US i5-8300H, GeForce GTX 1050 Mobile, Toshiba HG6 THNSNJ256G8NY, IPS, 1920x1080, 15.6" | Asus Strix GL504GM i7-8750H, GeForce GTX 1060 Mobile, Toshiba NVMe THNSN5256GPU7, IPS, 1920x1080, 15.6" | Dell G5 15 5587 i5-8300H, GeForce GTX 1060 Max-Q, SK hynix SC311 M.2, IPS, 1920x1080, 15.6" | |
|---|---|---|---|---|---|
| Power Consumption | -71% | -7% | -60% | -1% | |
| Idle Minimum * (Watt) | 5.4 | 16.2 -200% | 7.1 -31% | 10 -85% | 4.9 9% |
| Idle Average * (Watt) | 10.4 | 18.2 -75% | 9.8 6% | 16.9 -62% | 8.5 18% |
| Idle Maximum * (Watt) | 10.5 | 18.9 -80% | 10.4 1% | 21.1 -101% | 9.1 13% |
| Load Average * (Watt) | 84.7 | 82.7 2% | 88.8 -5% | 112.4 -33% | 90.7 -7% |
| Witcher 3 ultra * (Watt) | 92.7 | 125.7 -36% | 93.3 -1% | 135.5 -46% | 110 -19% |
| Load Maximum * (Watt) | 119.9 | 162.3 -35% | 132.5 -11% | 157.3 -31% | 144 -20% |
* ... smaller is better
Battery Life
Despite being much smaller than the GF62VR, MSI has managed to up the battery capacity of the GF63 from 41 Wh to 51 Wh. Users can expect a real-world WLAN runtime of 5.5 hours compared to less than 2 hours on our last GF62VR test unit. Results are about half an hour to an hour shorter than the Dell G5 15 or GS65 but still above average for a gaming laptop.
Charging from near empty to full capacity is slow at a little over two hours compared to 1.5 hours on most Ultrabooks.
| MSI GF63 8RC i5-8300H, GeForce GTX 1050 Mobile, 51 Wh | MSI GS65 Stealth Thin 8RE-051US i7-8750H, GeForce GTX 1060 Mobile, 82 Wh | Asus Strix GL504GM i7-8750H, GeForce GTX 1060 Mobile, 66 Wh | Acer Aspire 7 A715-71G-53TU i5-7300HQ, GeForce GTX 1050 Mobile, 48 Wh | MSI GF62VR 7RF-877 i7-7700HQ, GeForce GTX 1060 Mobile, 41 Wh | Dell G5 15 5587 i5-8300H, GeForce GTX 1060 Max-Q, 56 Wh | |
|---|---|---|---|---|---|---|
| Battery runtime | 23% | 7% | 28% | -53% | 62% | |
| Reader / Idle (h) | 9.5 | 9.9 4% | 2.8 -71% | 11.8 24% | ||
| WiFi v1.3 (h) | 5.5 | 6.2 13% | 5.9 7% | 5.6 2% | 1.9 -65% | 6.5 18% |
| Load (h) | 0.9 | 1.2 33% | 1.6 78% | 0.7 -22% | 2.2 144% |
Pros
Cons
Verdict
The MSI GF63 lowers the price of entry for narrow-bezel gaming laptops to just $750 USD and it is significantly lighter and smaller than competitors in its price range. If you want a laptop for mainstream gaming that is also portable enough for schoolwork for less than a grand, then the GF63 is an excellent option. Its combination of gaming performance, affordability, and mobility was unheard of just a year ago when narrow bezels were limited to pricey flagship models like the XPS 15 9560 or Gigabyte Aero 15X.
In order to offer such a light 15.6-inch gaming laptop for a low price, MSI had to drop several features from the GF62VR. Potential buyers should be aware that the GF63 is more streamlined with no NumPad, tri-zone RGB lighting, or SD reader. Users who wish for GTX 1060 graphics will also be out of luck here as the highest GPU option is the GTX 1050 Ti Max-Q. Fortunately, core gaming performance is reliable when plugged in with decent battery life for less demanding tasks.
Perhaps our biggest gripes with the system are its spongy clickpad and average chassis rigidity when compared to other narrow-bezel 15.6-inch laptops like the Asus GL504, HP Spectre x360 15, Razer Blade 15, or the aforementioned Dell and Gigabyte. When compared to alternatives more in its price range like the Gigabyte Sabre 15, Dell G7, or Acer Nitro 5, however, the GF63 is the lighter and more versatile option overall.
The MSI GF63 strikes a better balance between affordability, portability, and gaming performance than many of its competitors because of its new narrow bezel design. If you're a gamer on a tight budget and want something more powerful than a traditional Ultrabook but without the added weight, then the GF62 is a solid option.
MSI GF63 8RC
- 10/23/2018 v6 (old)
Allen Ngo
Price comparison
