MSI PS42 8RB Prestige (i7-8550U, GeForce MX150) Laptop Review
MSI has a very strong foothold in the gaming laptop world and now it wants an even bigger piece of the pie by expanding into more ultrathin business laptops. The PS42 Prestige represents MSI's first foray into a market dominated by systems like the Dell XPS 13, Asus ZenBook 3, HP Spectre 13, Huawei Matebook X Pro, Lenovo Ideapad 720S, Acer Swift 7, Microsoft Surface Laptop, and countless other sub 14-inch offerings. With such a crowded selection to choose from, MSI will have to hit it out of the park if it wishes to make a dent in the market.
The PS42 carries a few unique features not found on most other Ultrabooks. Namely, its full-fledged GeForce MX150 GPU and 14-inch screen size are rarities in a space where 13-inch systems with integrated graphics are common. These features give the PS42 an edge in graphics performance for users who need more power than what integrated Intel UHD or Iris graphics can provide. MSI's last 14-inch notebook was the GS43 Shadow released years ago, but the PS42 looks to be an entirely different approach altogether.
Current configurations range from $900 USD for the i5-8250U CPU with integrated UHD graphics up to $1300 USD for the i7-8550U with the aforementioned discrete GeForce MX150. An easy-to-read comparison list between the SKUs can be found on the official product page for the PS42.
Case
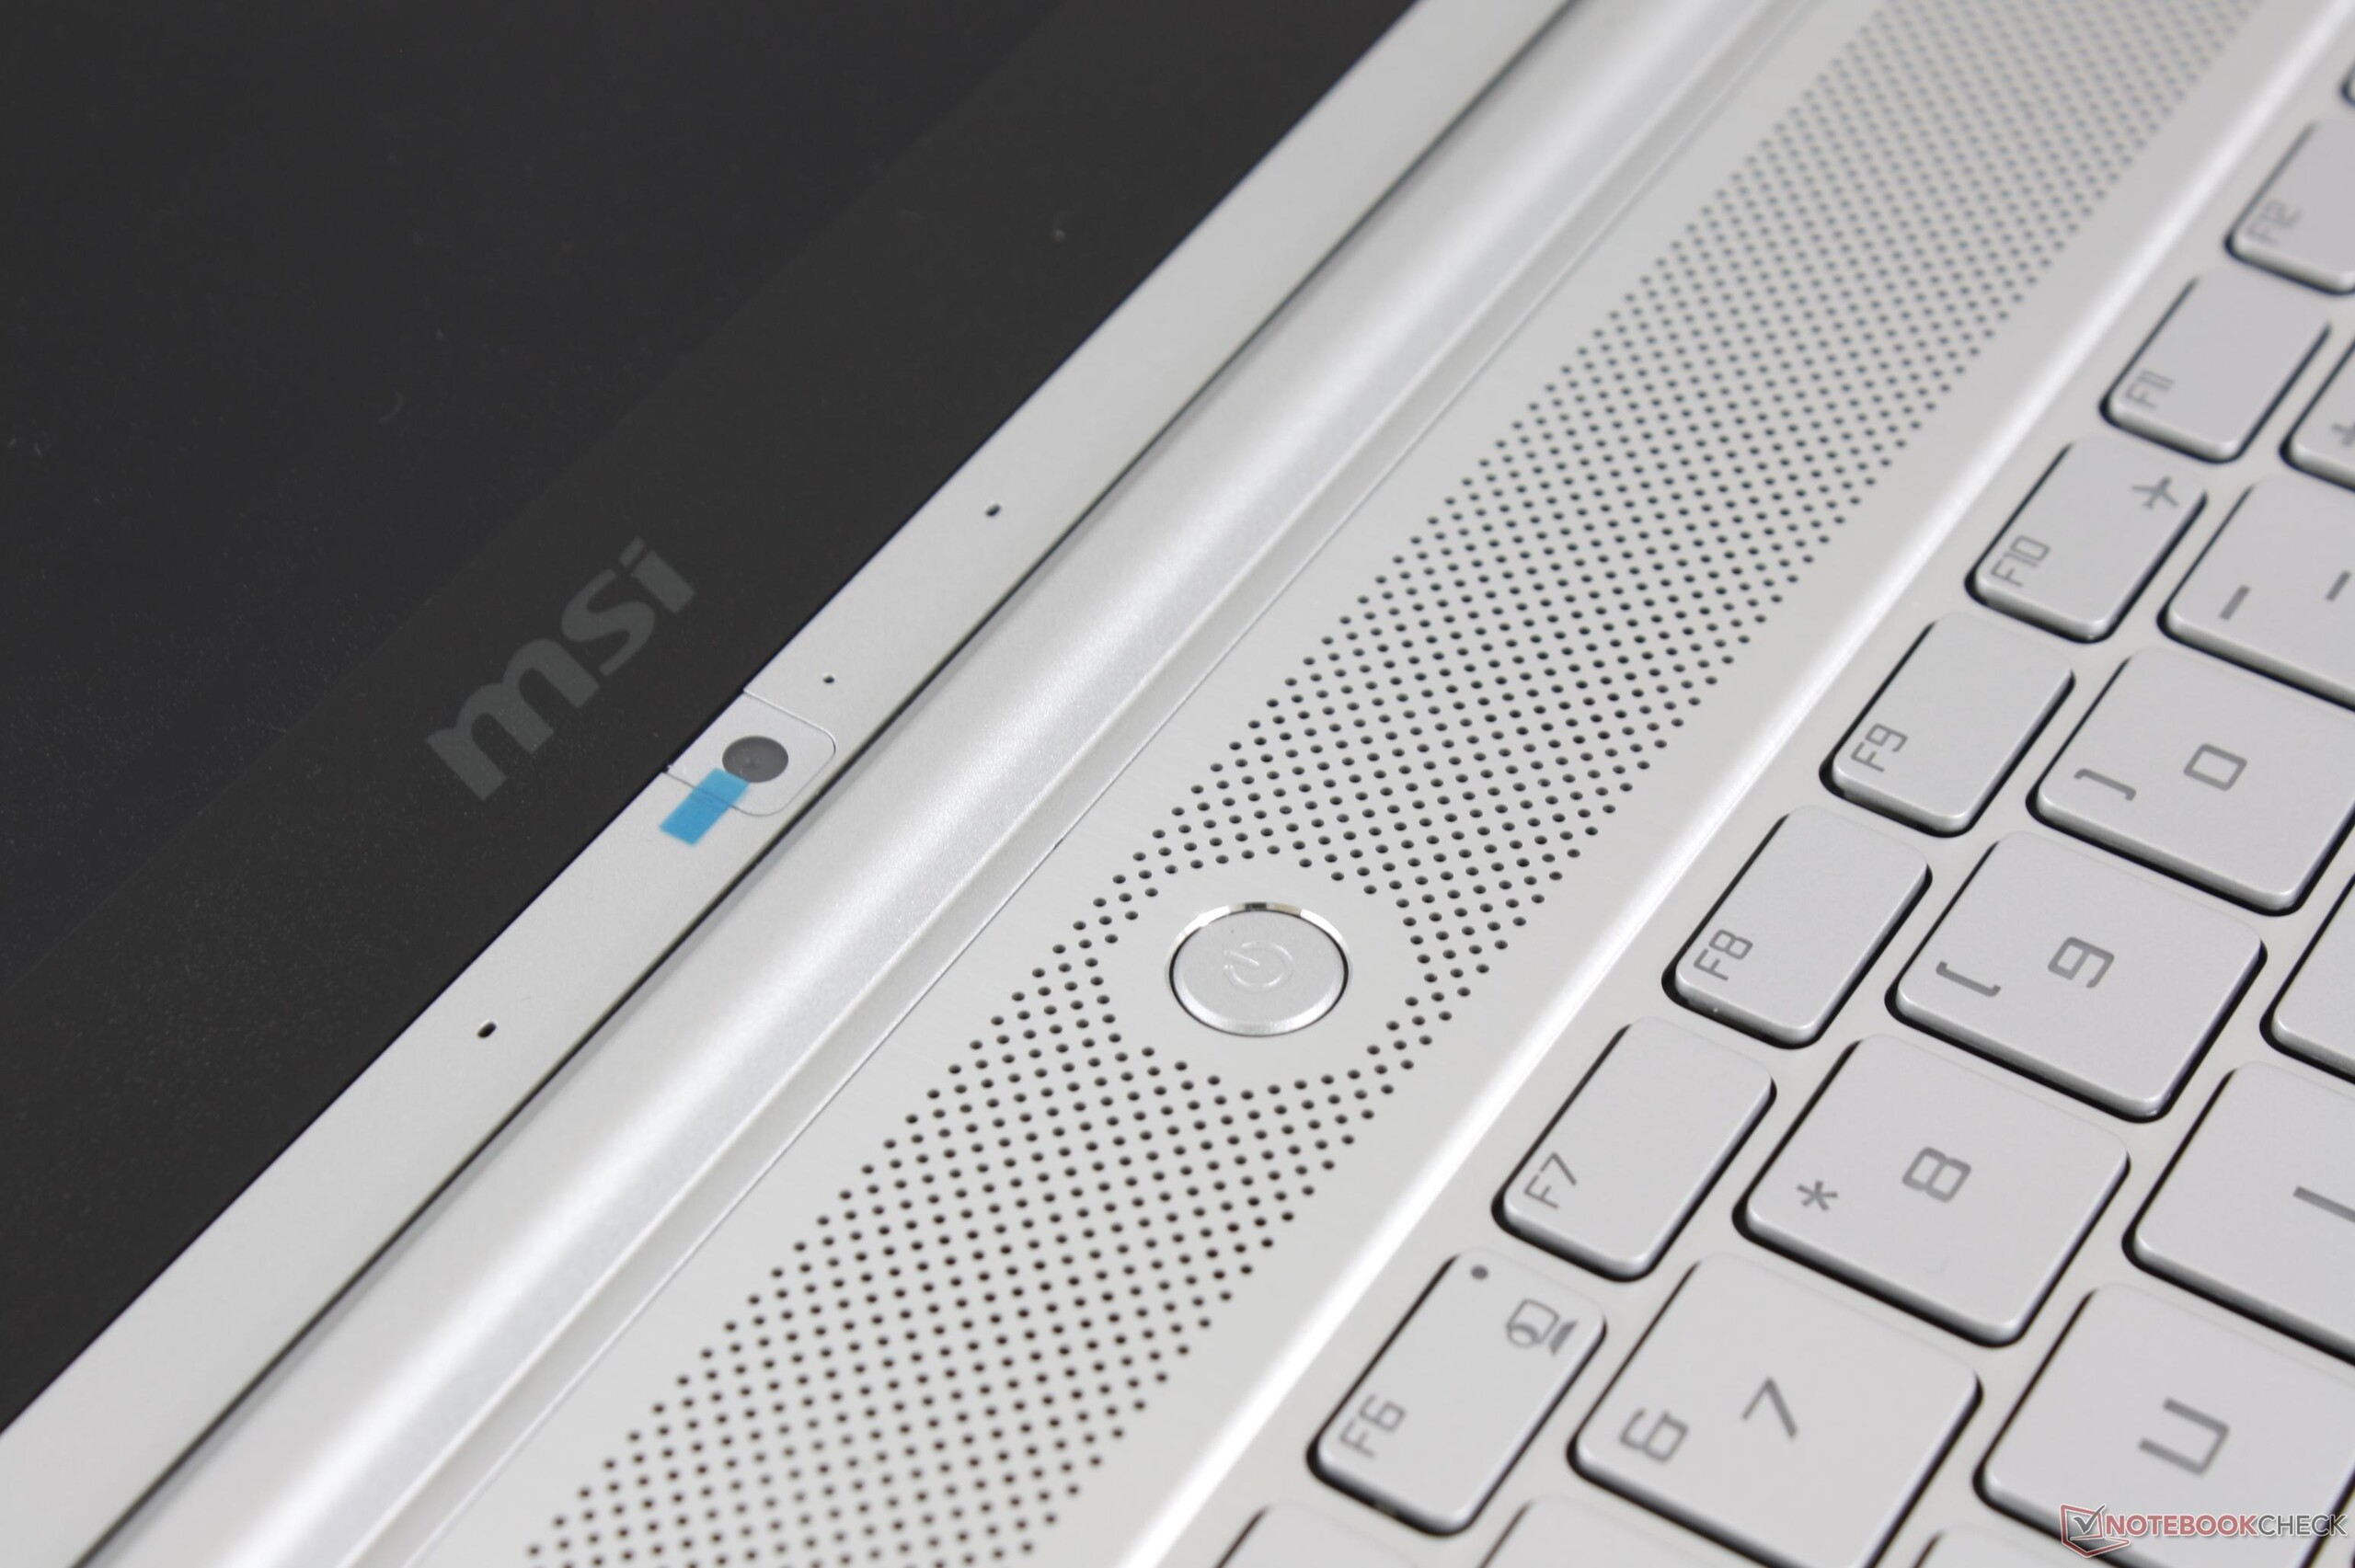
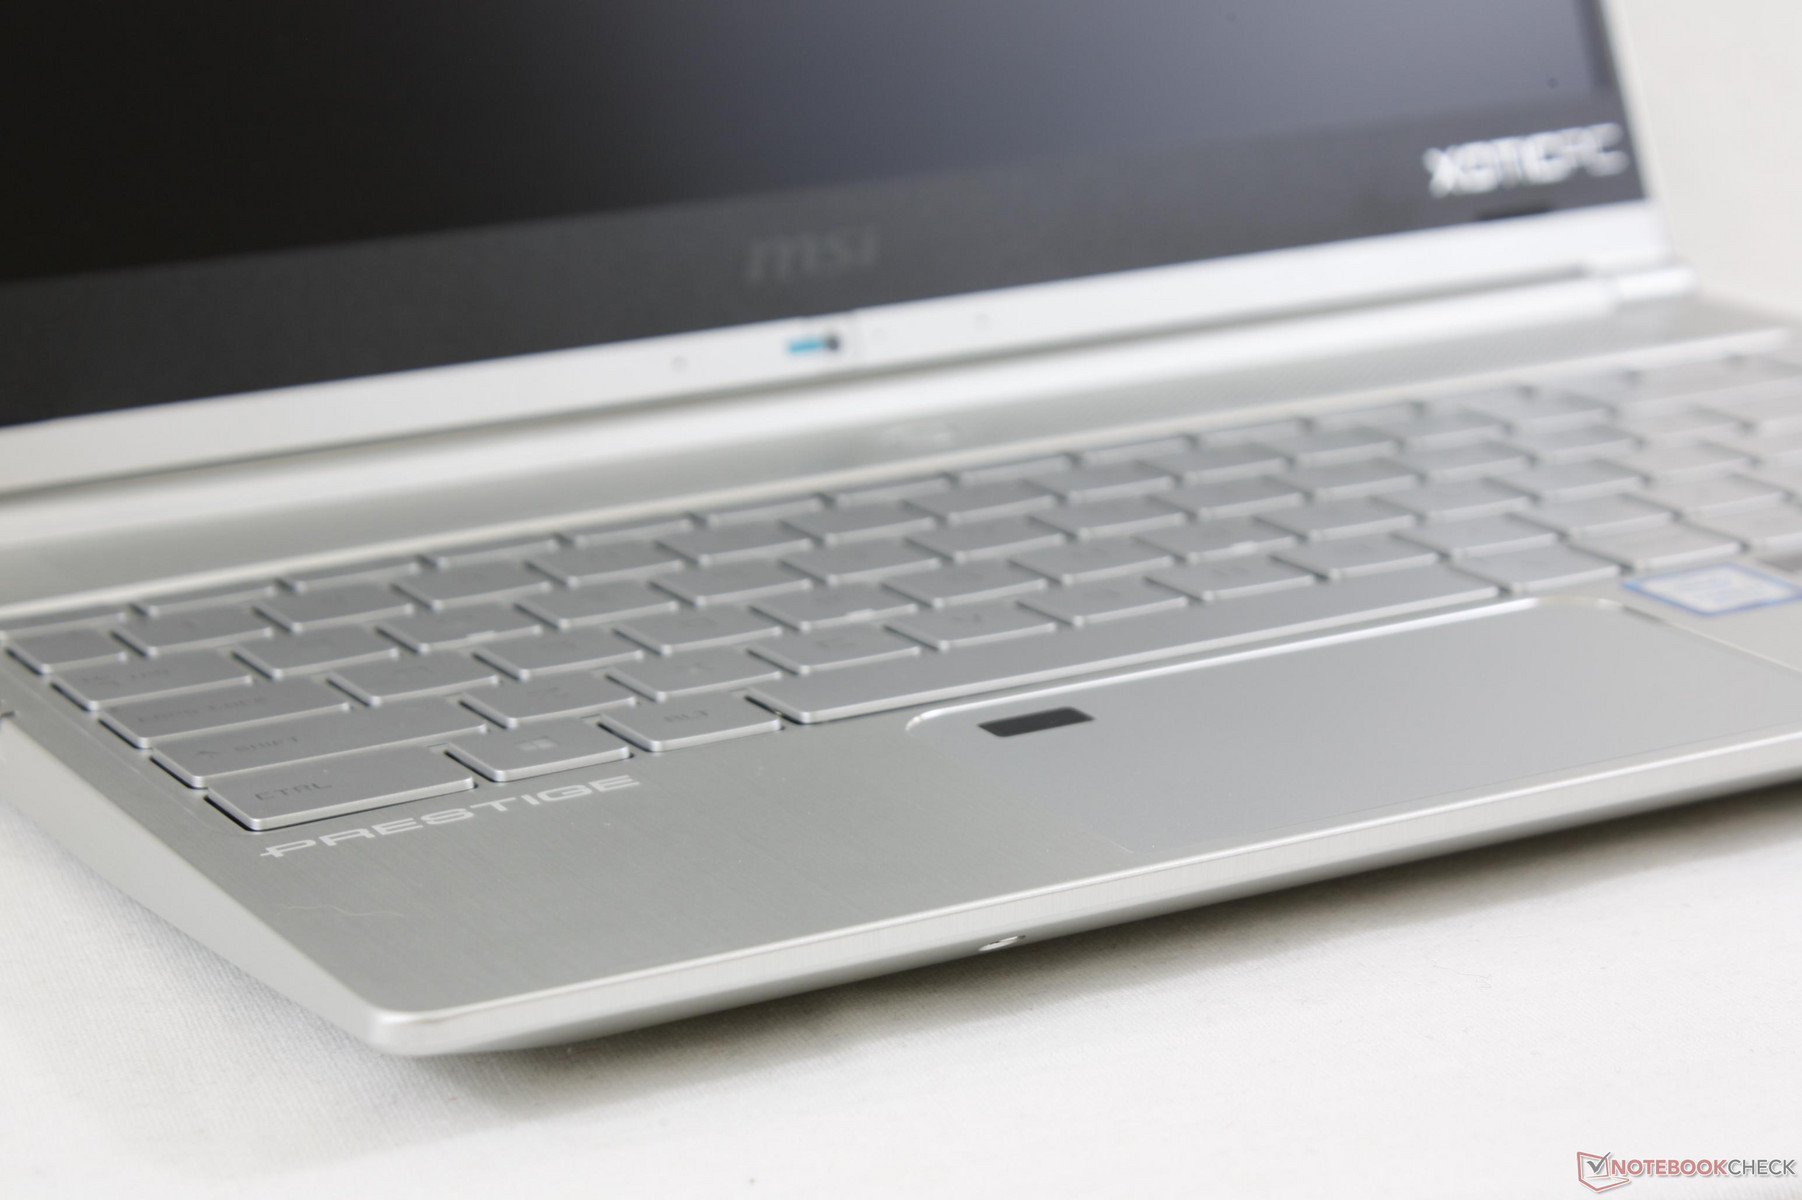
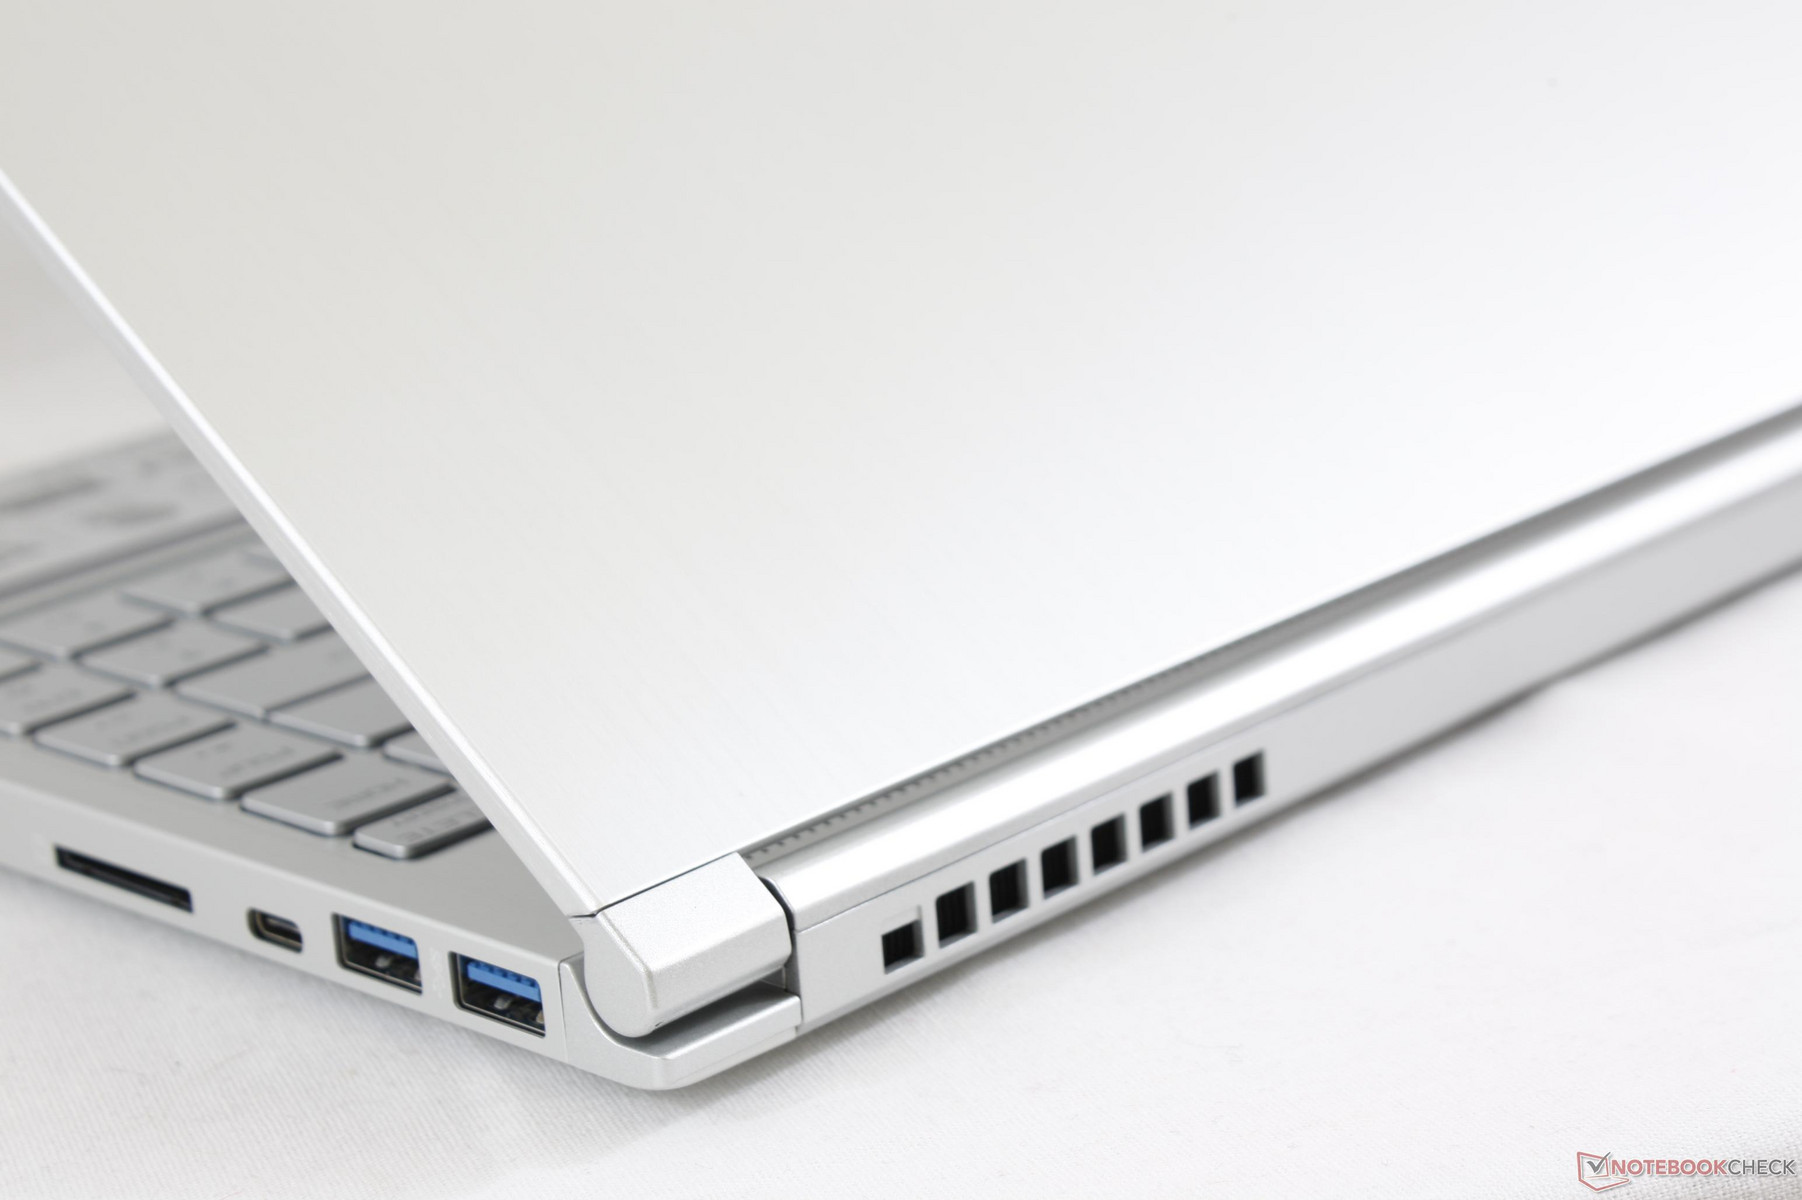
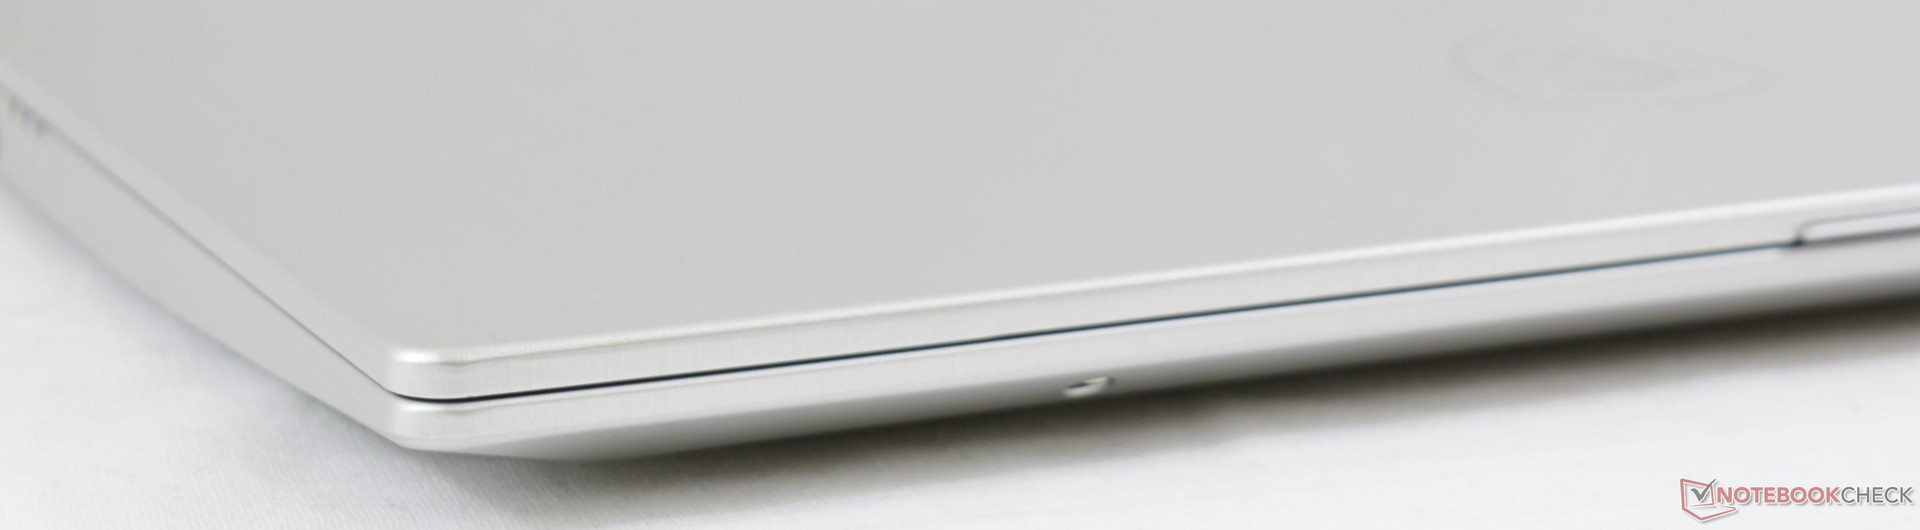
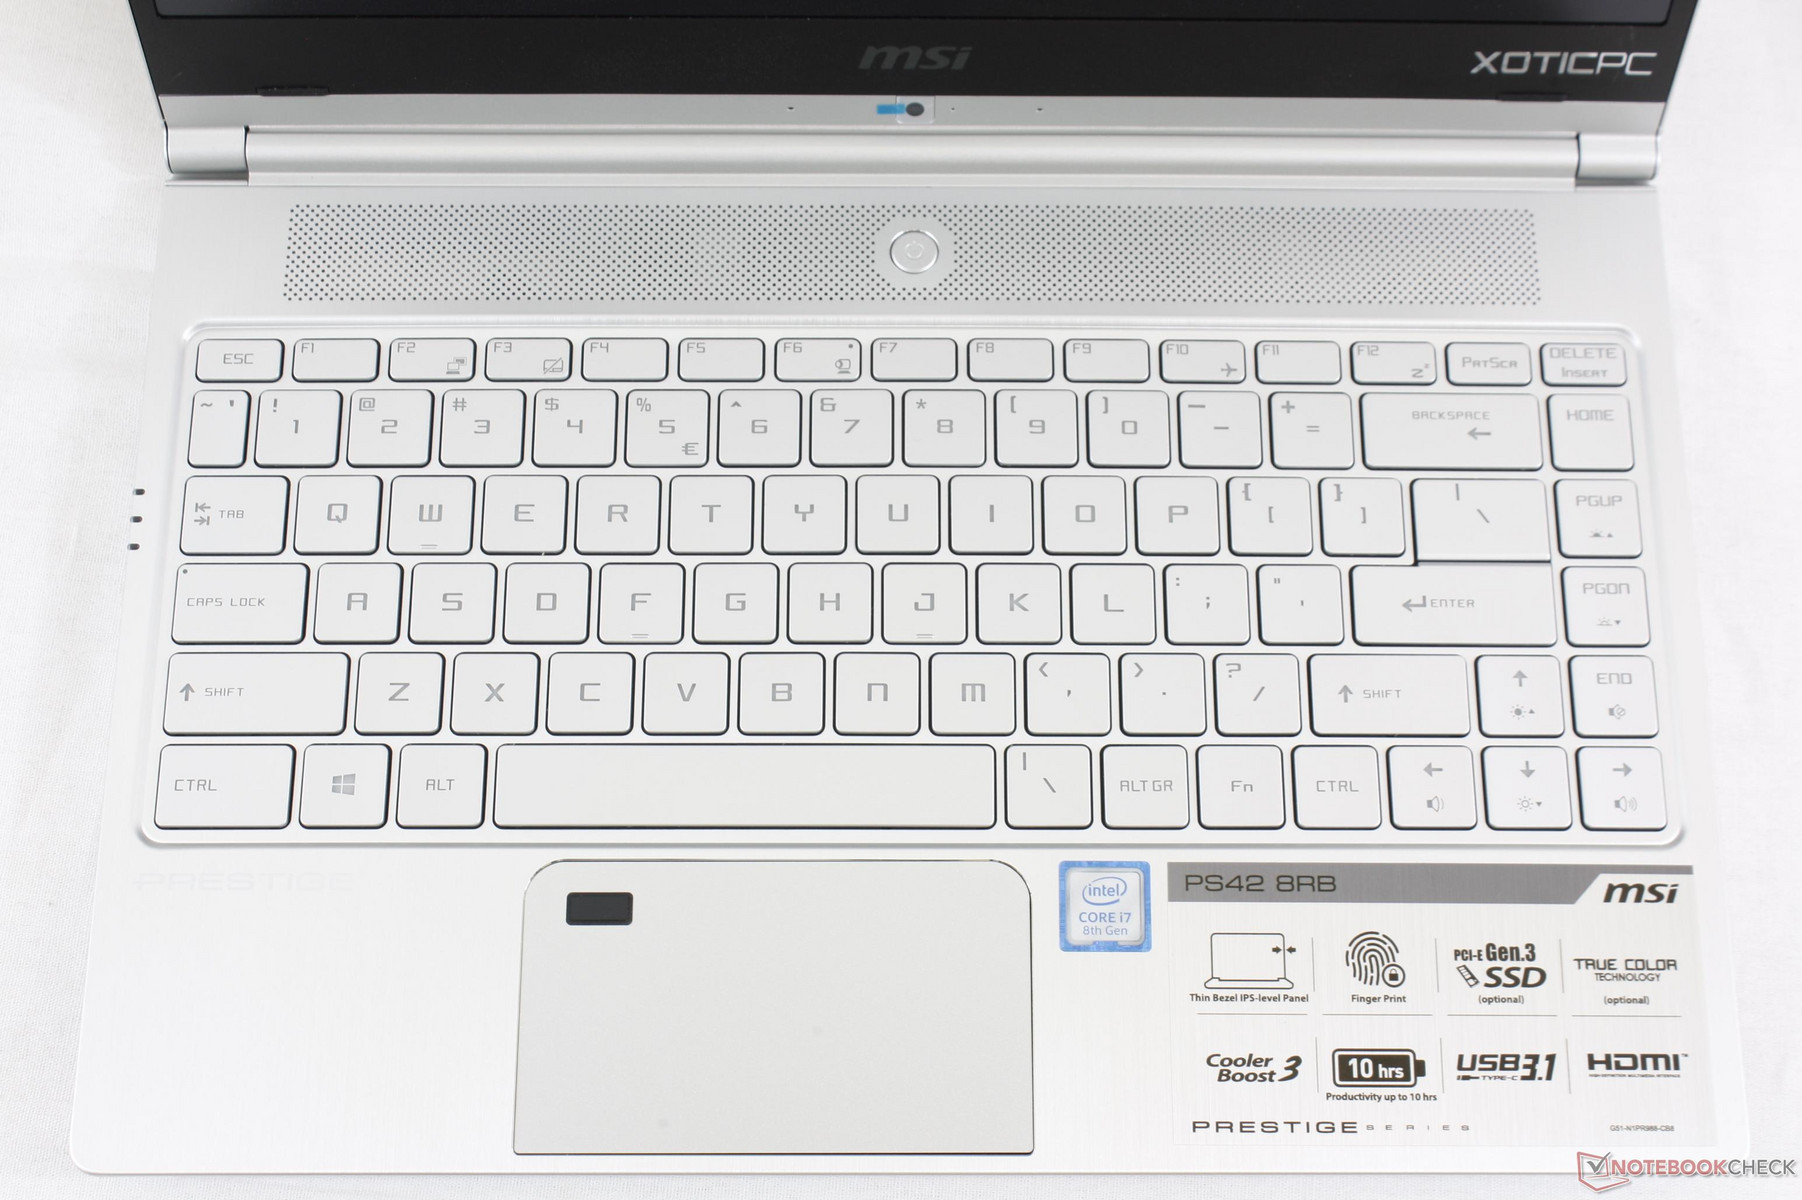
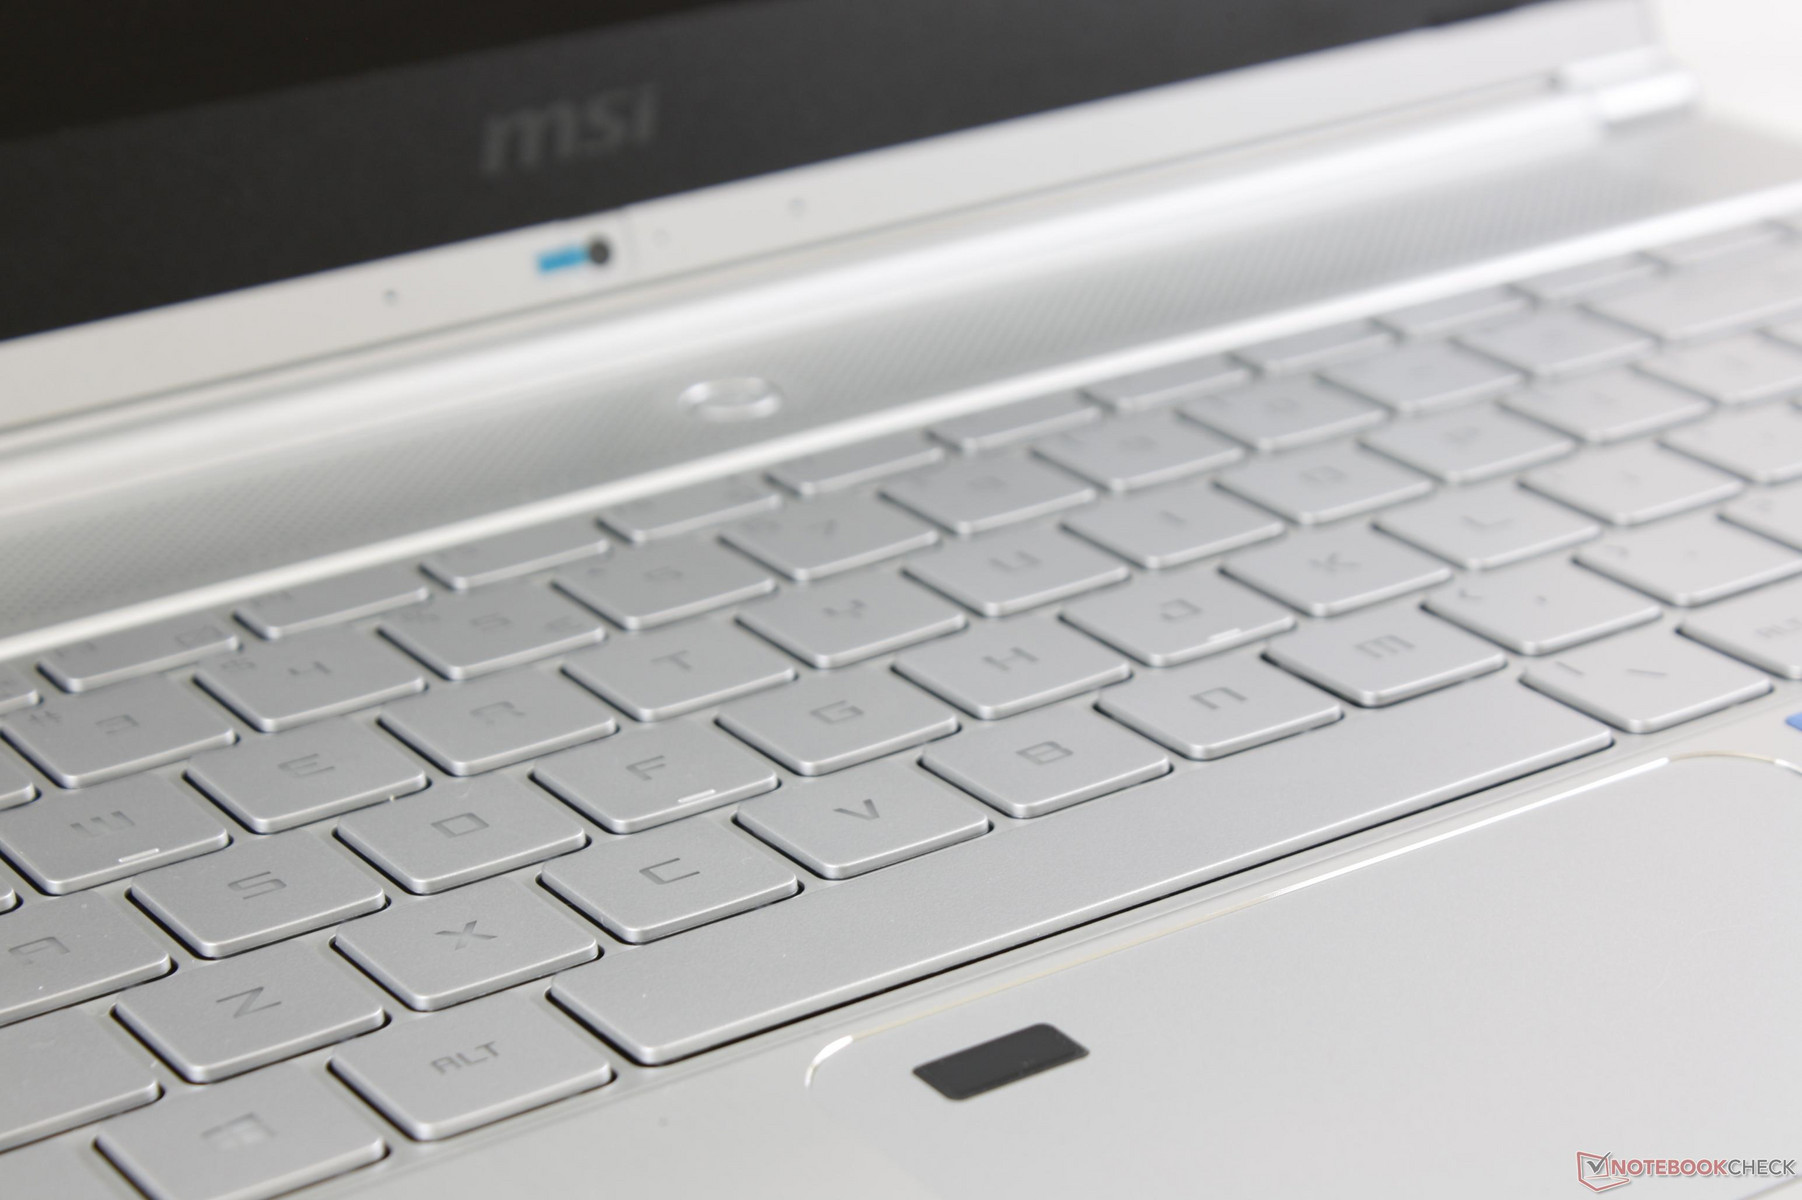
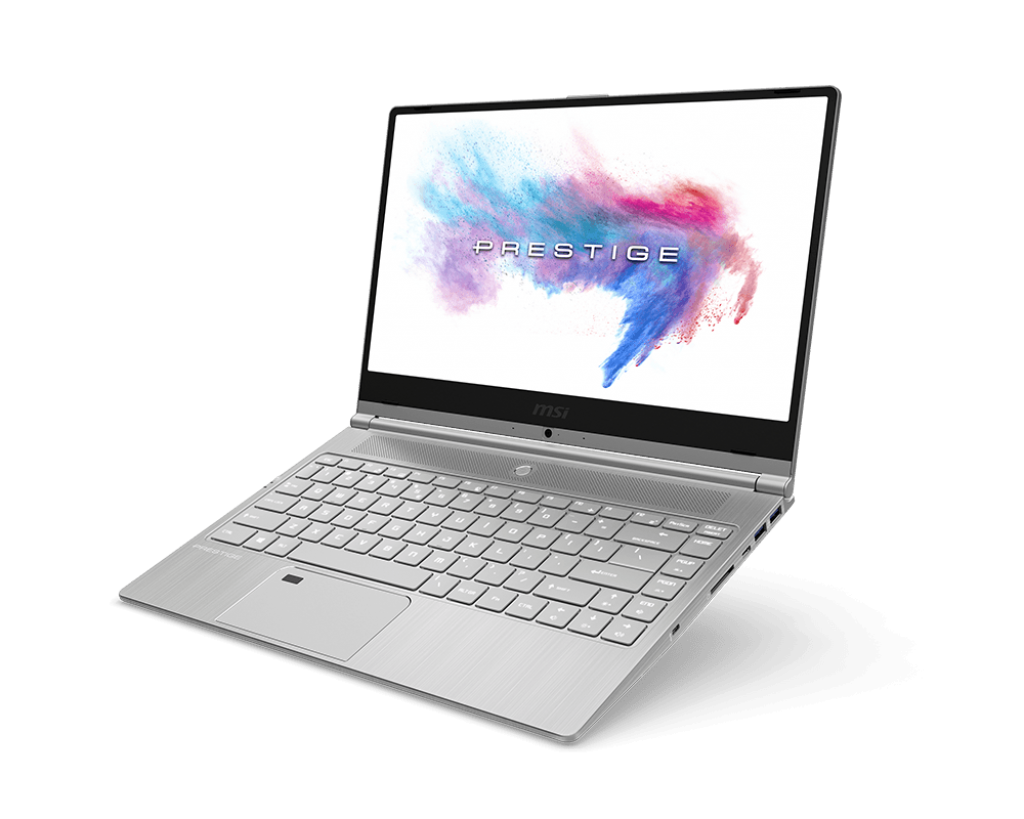
MSI has essentially taken what it's learned from the gaming GS series to create the PS42 Prestige. The inspirations are very clear as the system looks almost exactly like the GS63 or GS73 from certain angles especially in regard to the dual hinges and smooth, brushed aluminum outer lid and palm rests. In contrast to the black G series laptops, however, the silver finish of the PS42 is able to hide grease and fingerprints much more easily. Its clean and classy design makes it a better fit for business or office environments where MSI is hoping to make a bigger splash.
What ought to be improved on future iterations is chassis rigidity. The PS42 is at least a few steps behind the sturdier XPS 13, Matebook X Pro, and Spectre 13 because of its more flexible surfaces. Both the base and especially the lid are comparatively easier to warp when twisting from the edges or applying pressure down the center. Surfaces do not feel as thick or firm as they do on the aforementioned alternatives and the overall impression is much weaker as a result.
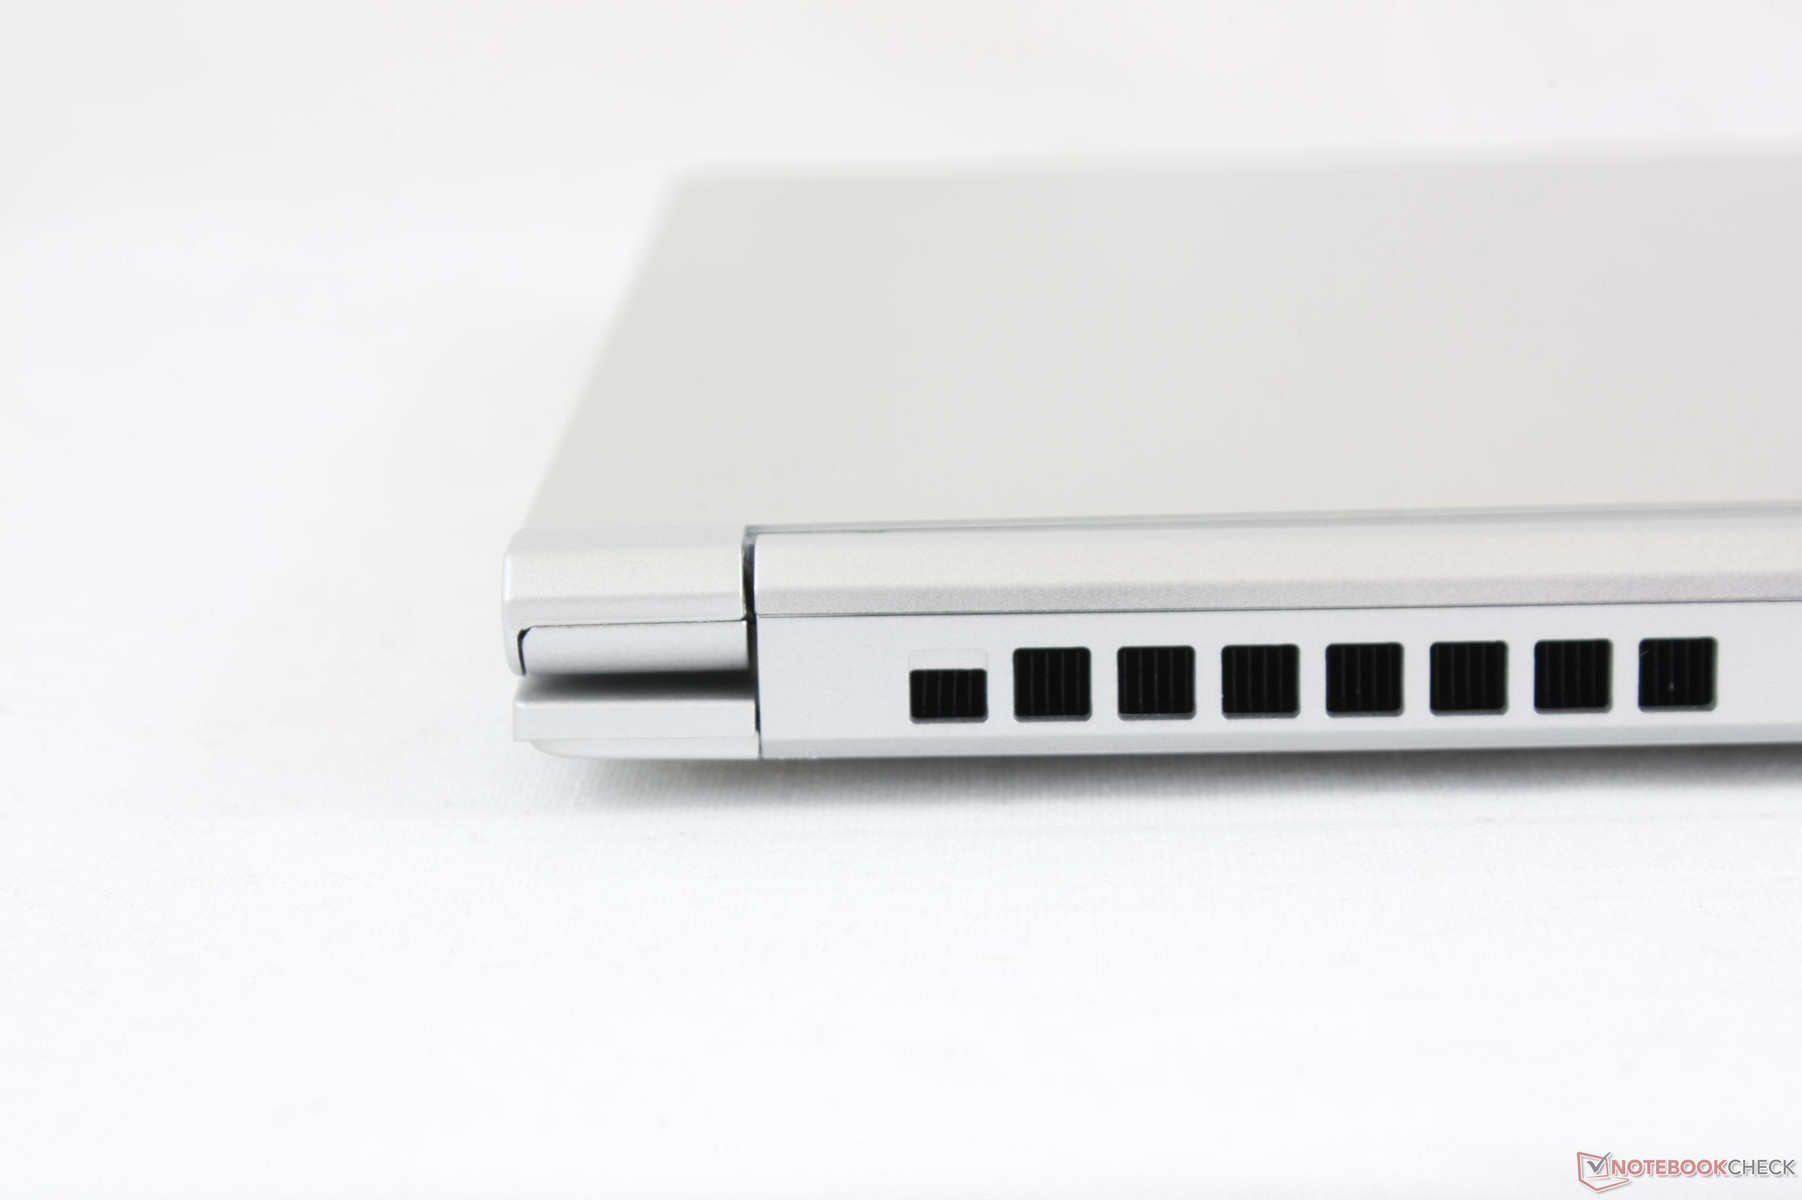
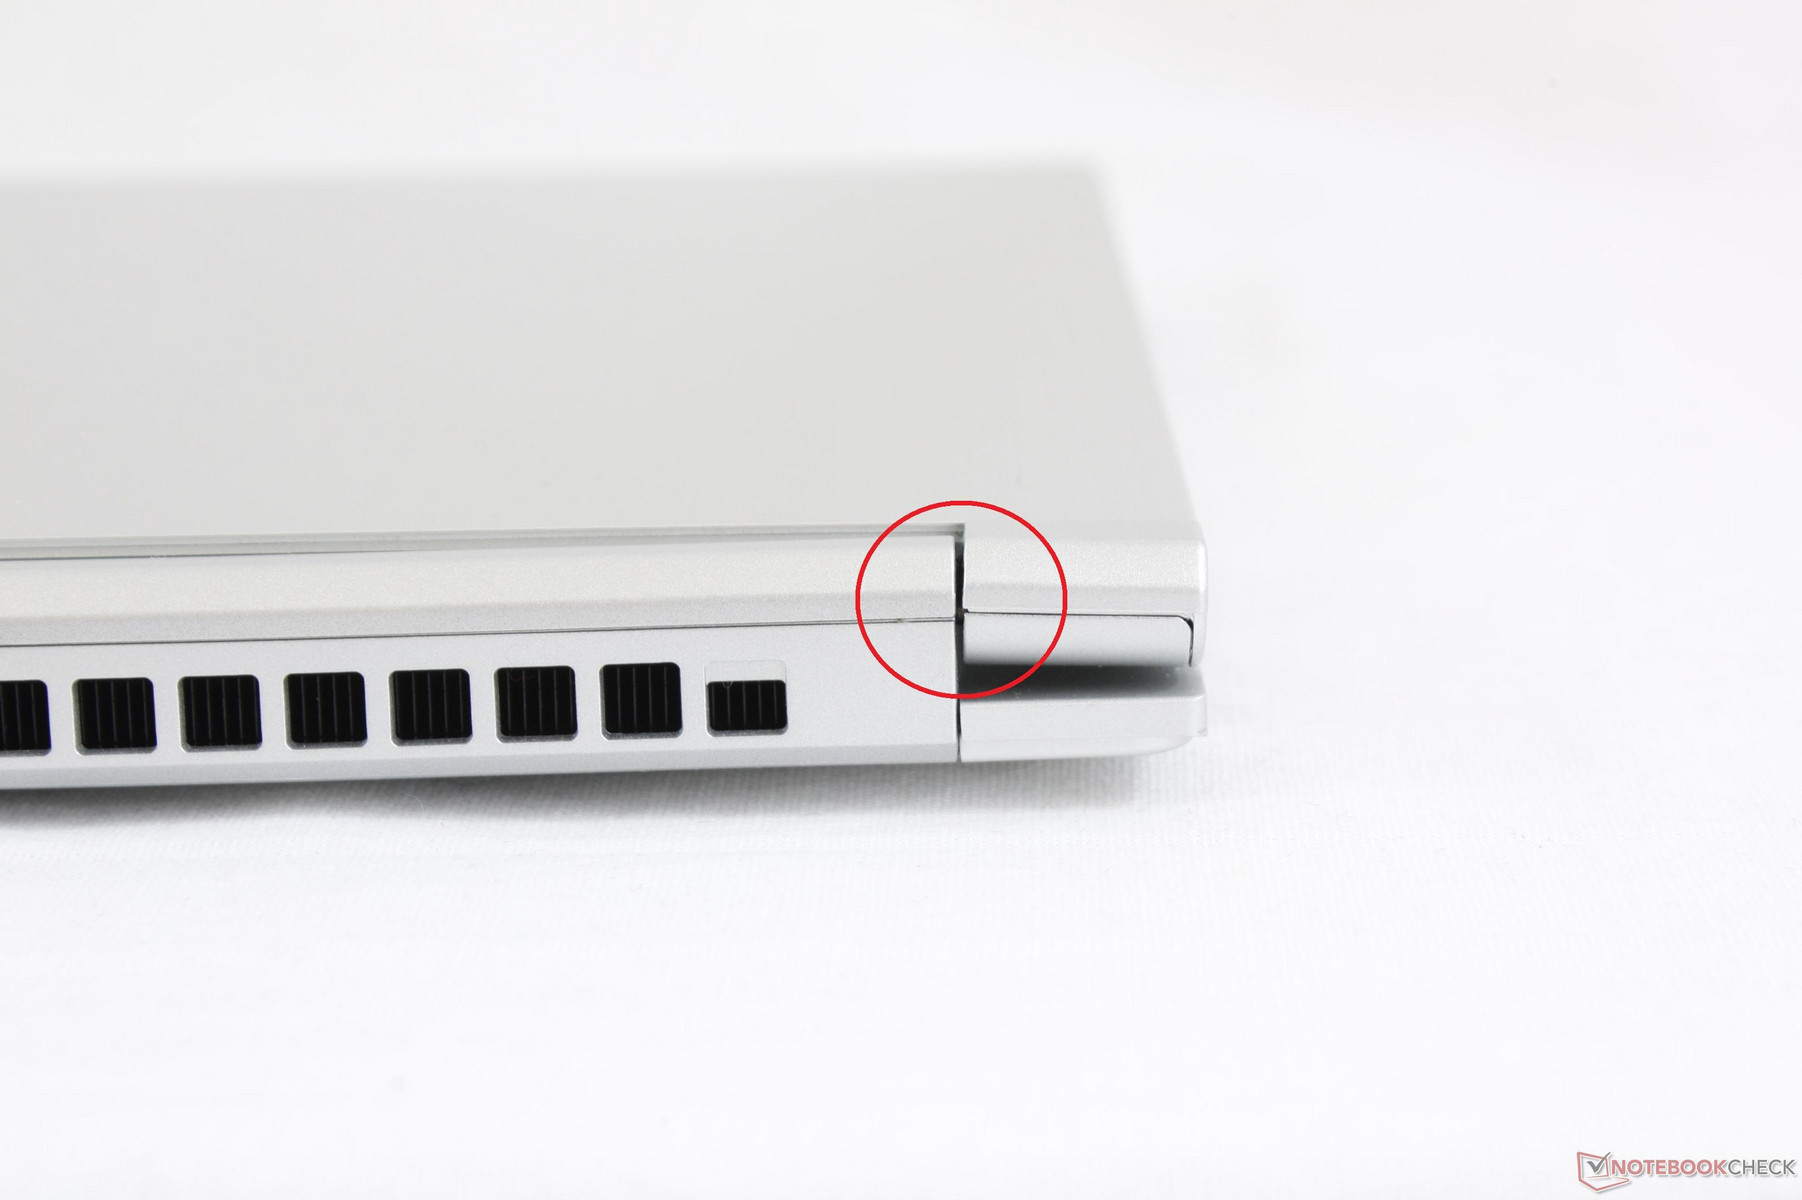
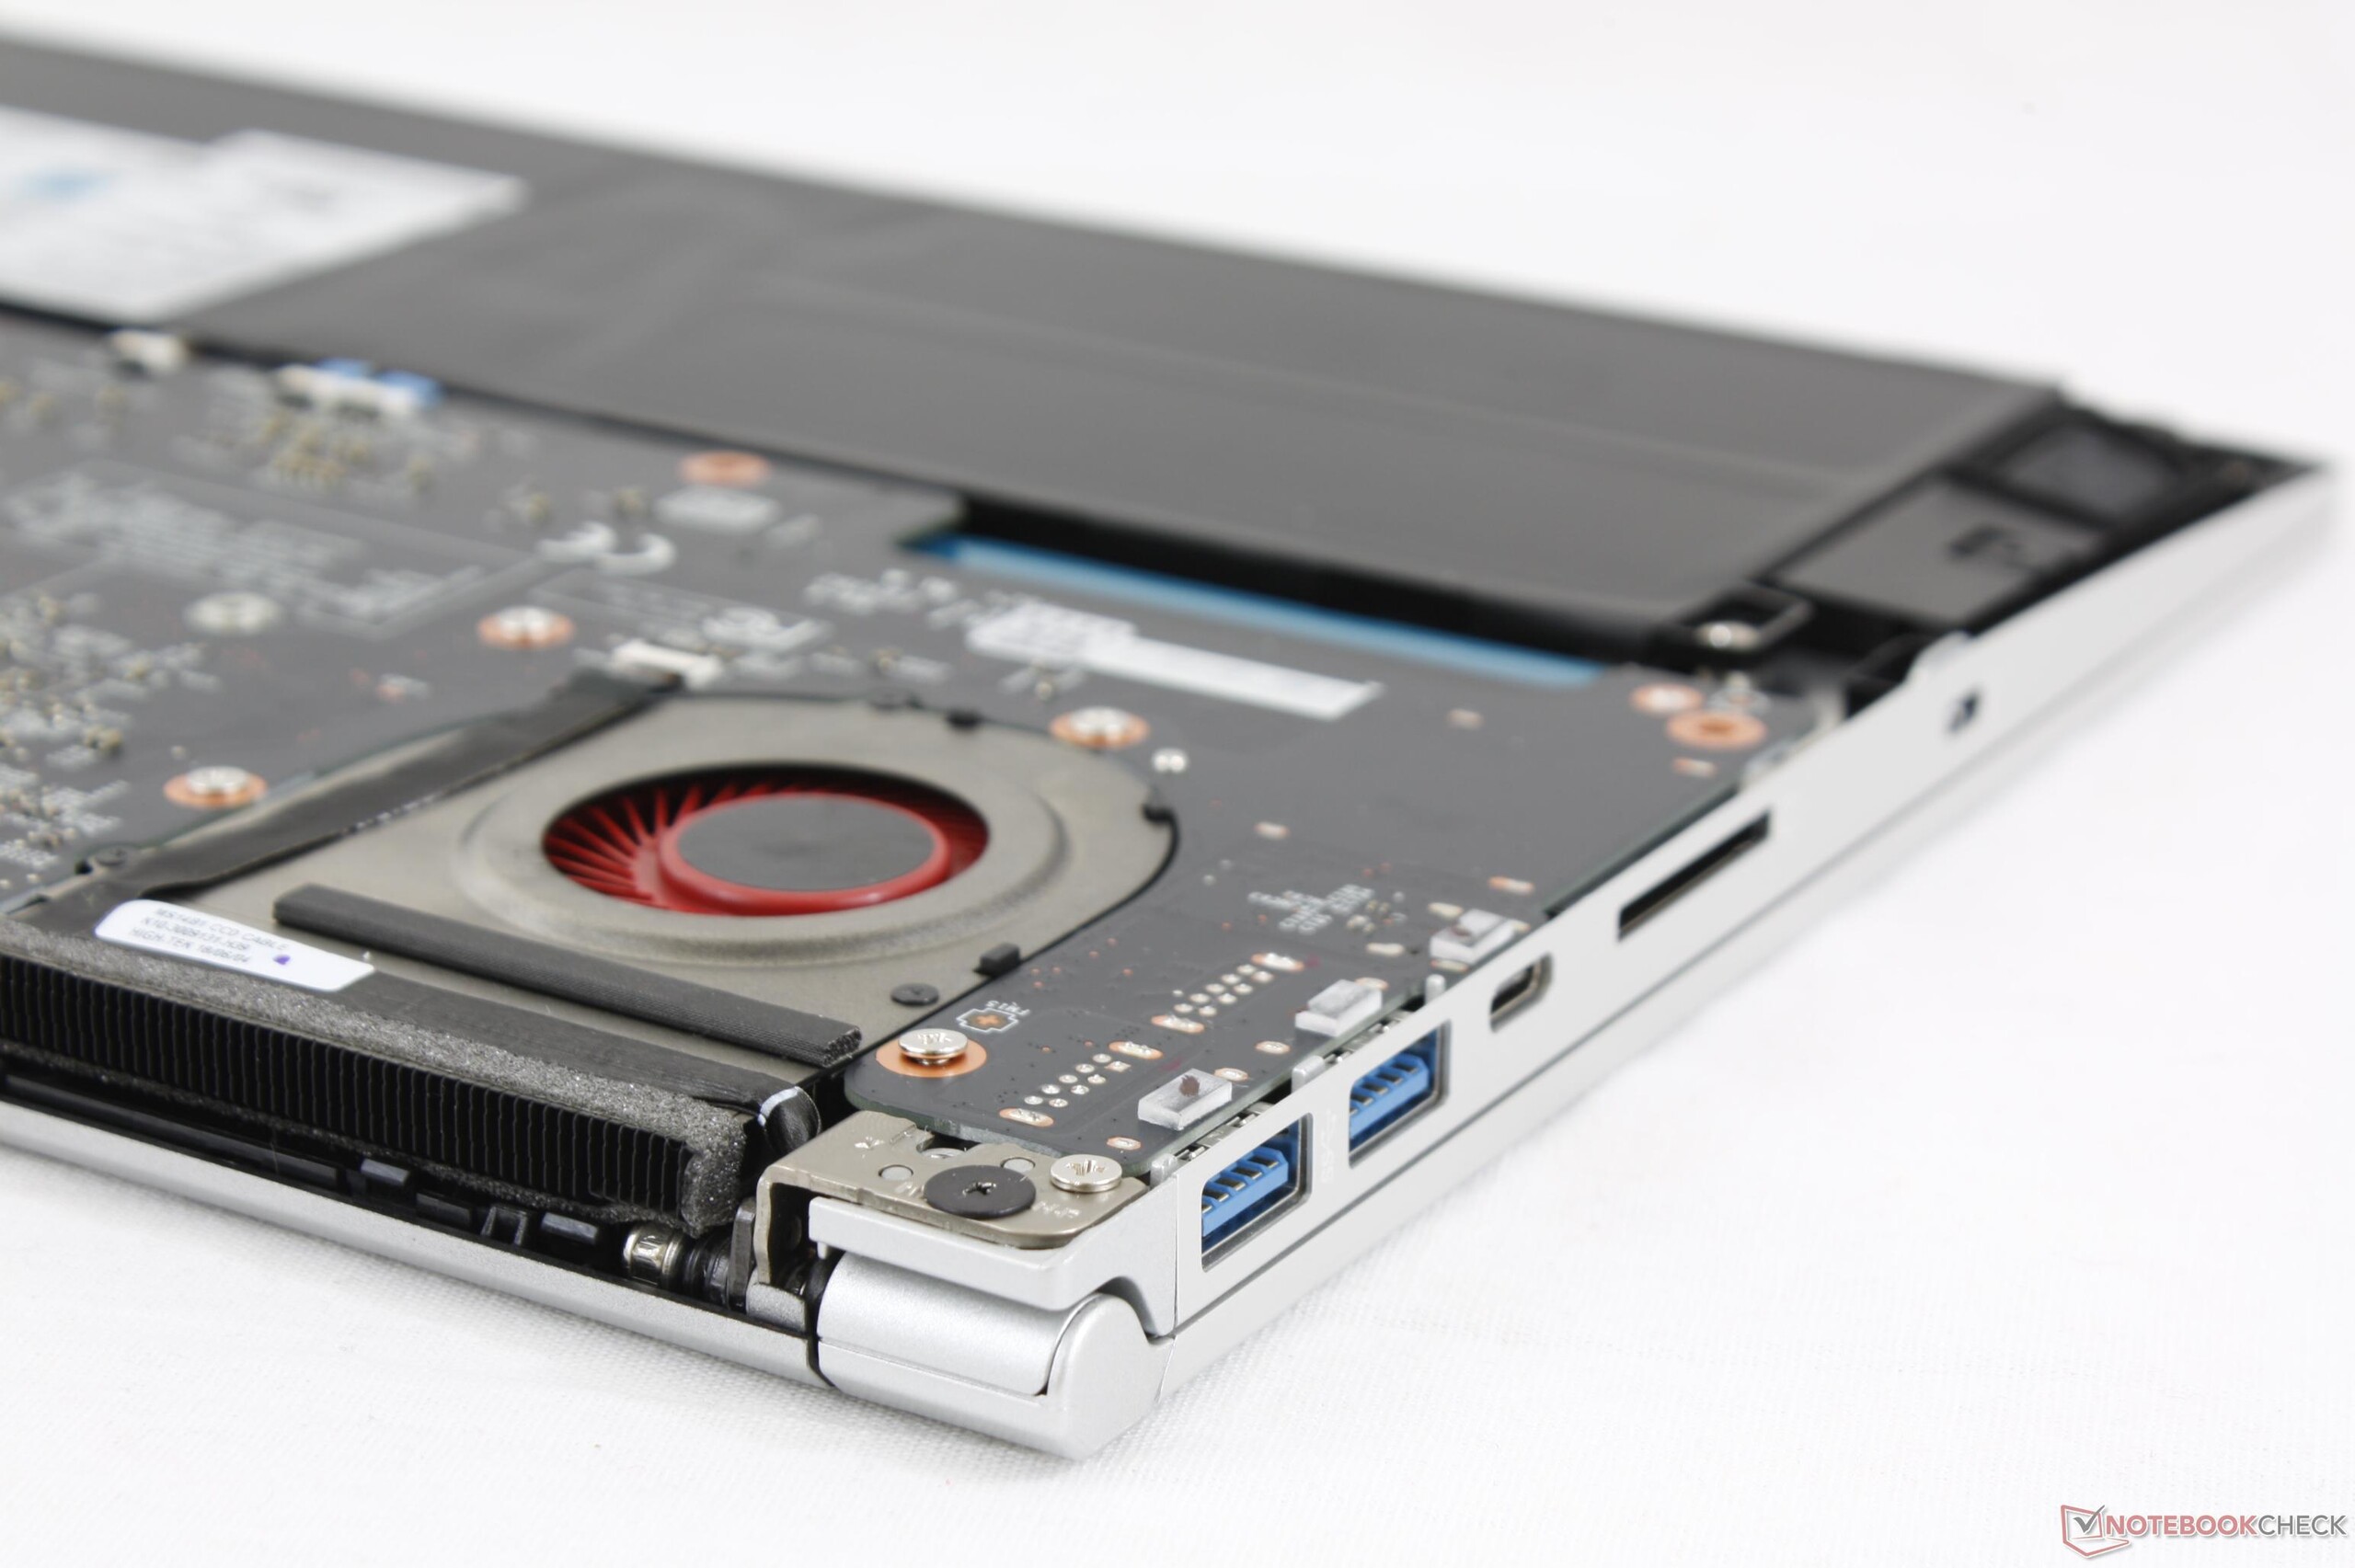
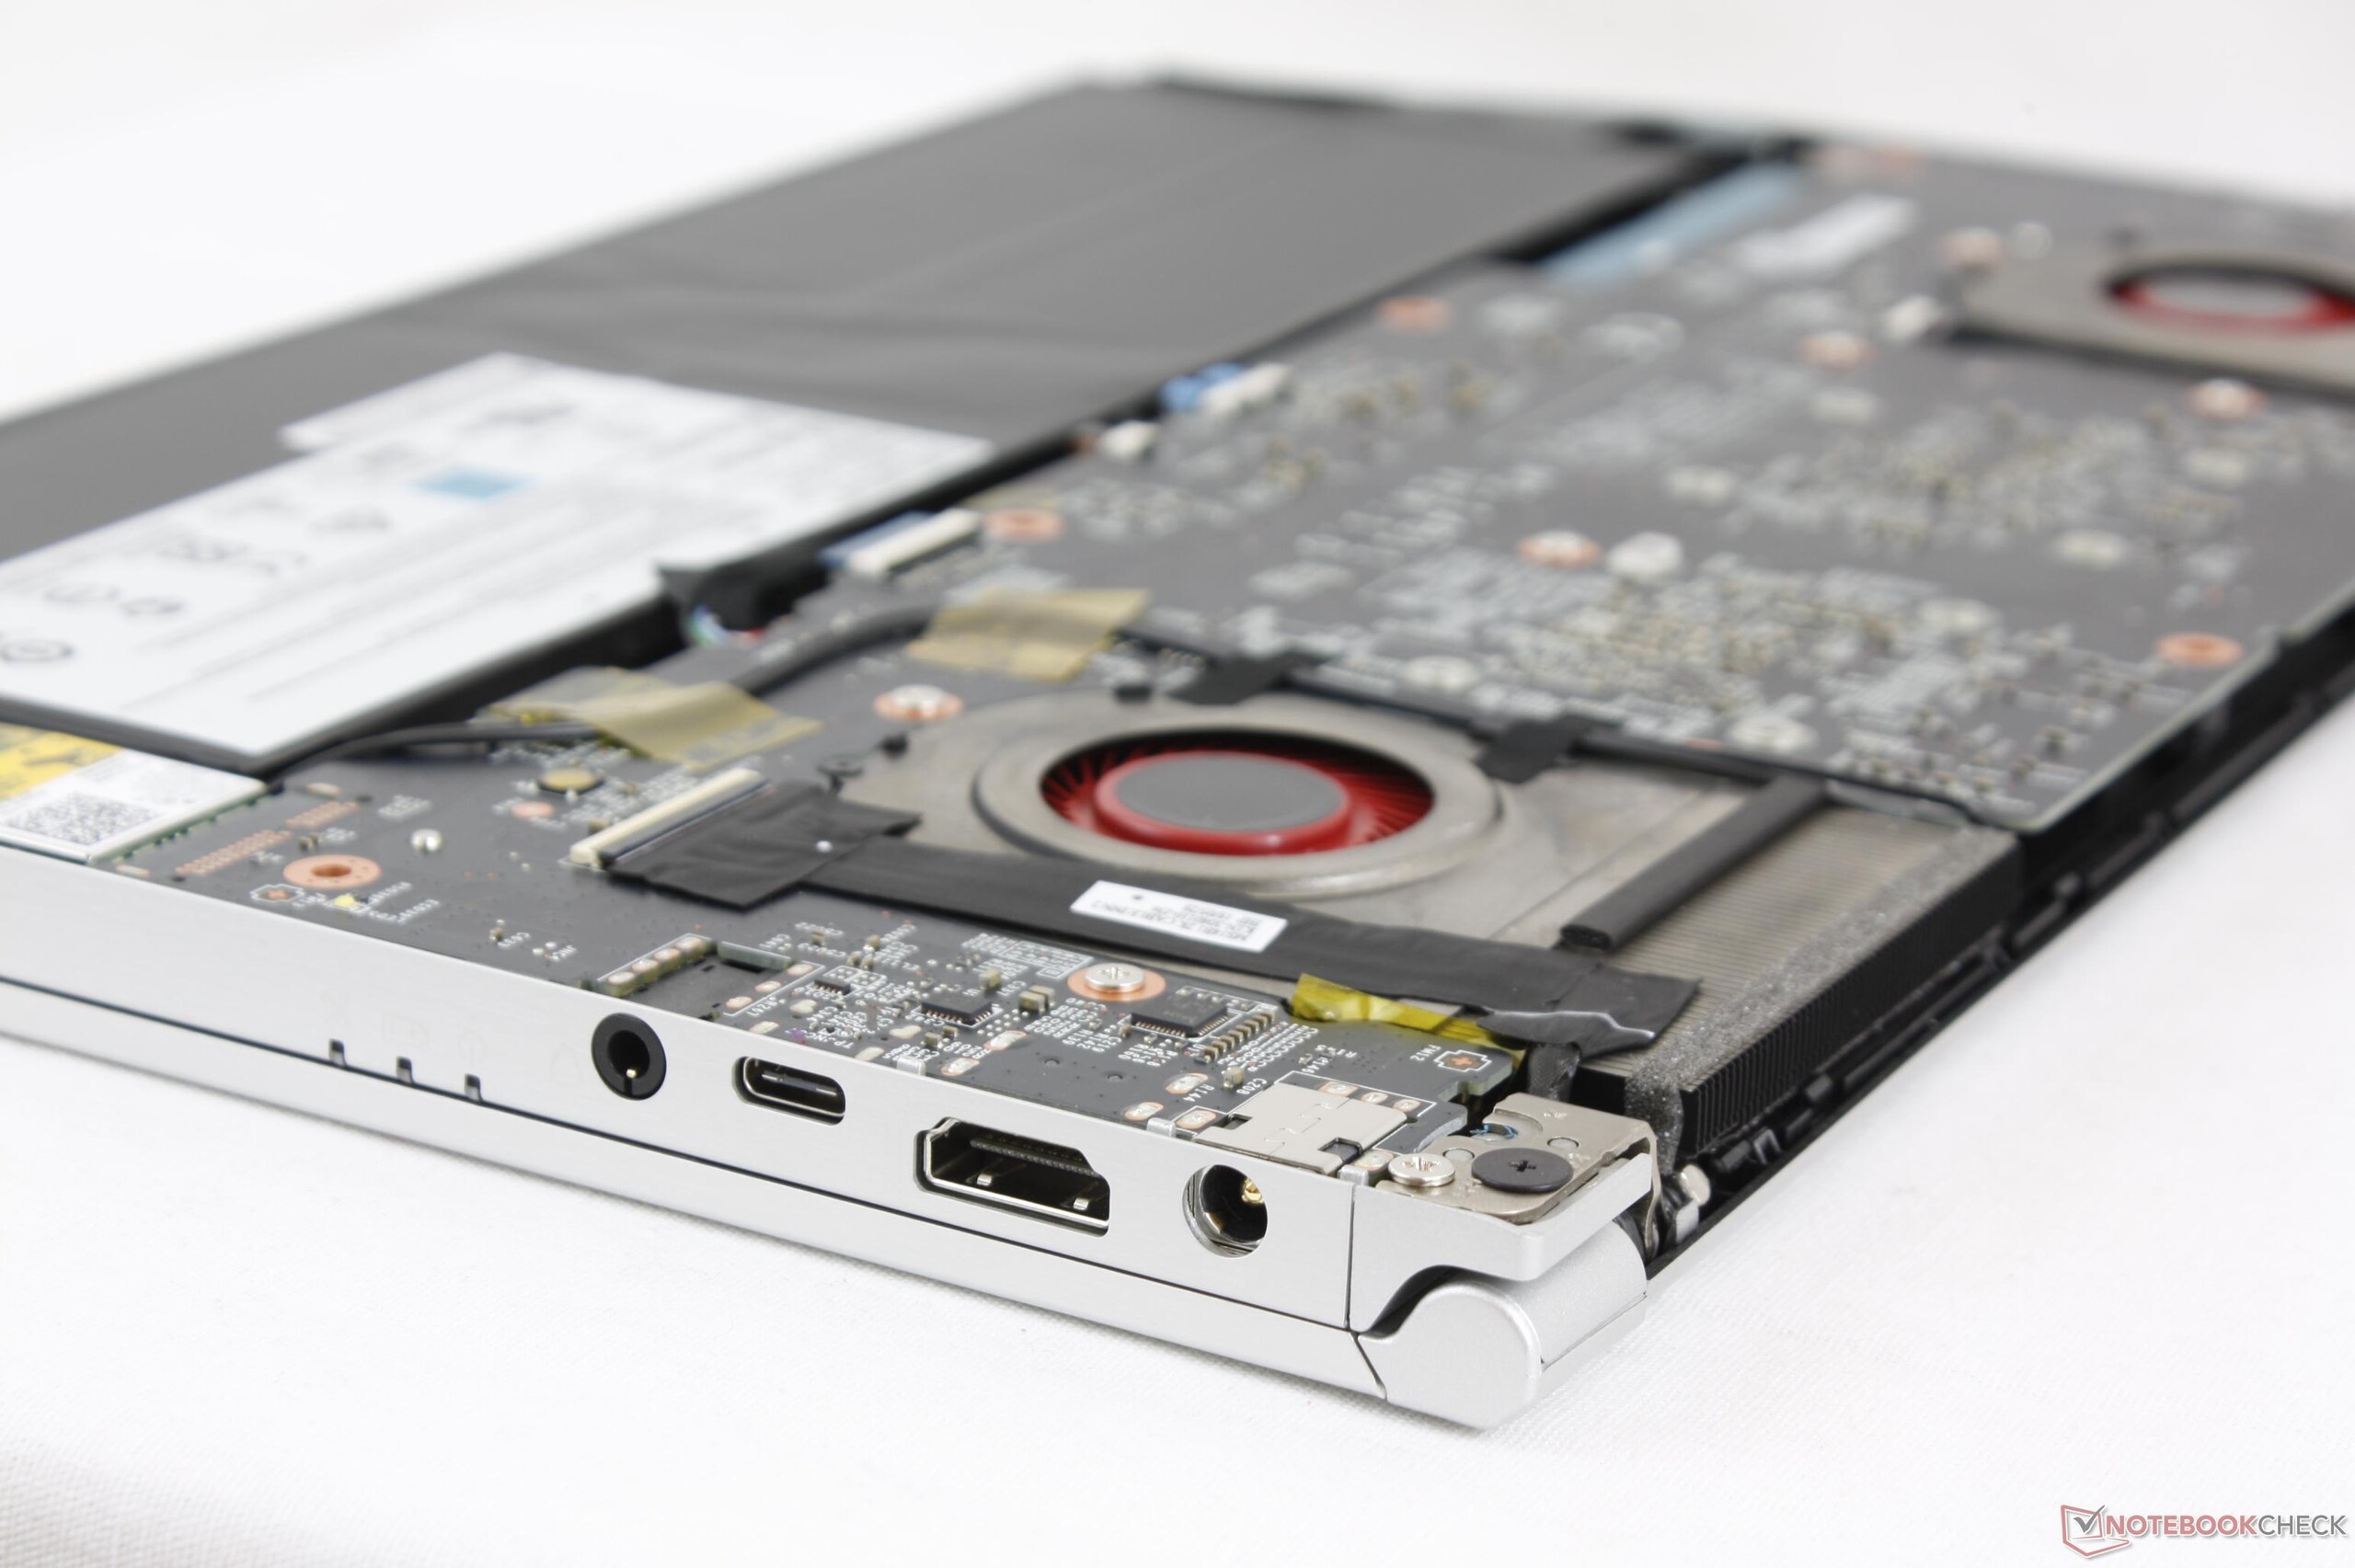
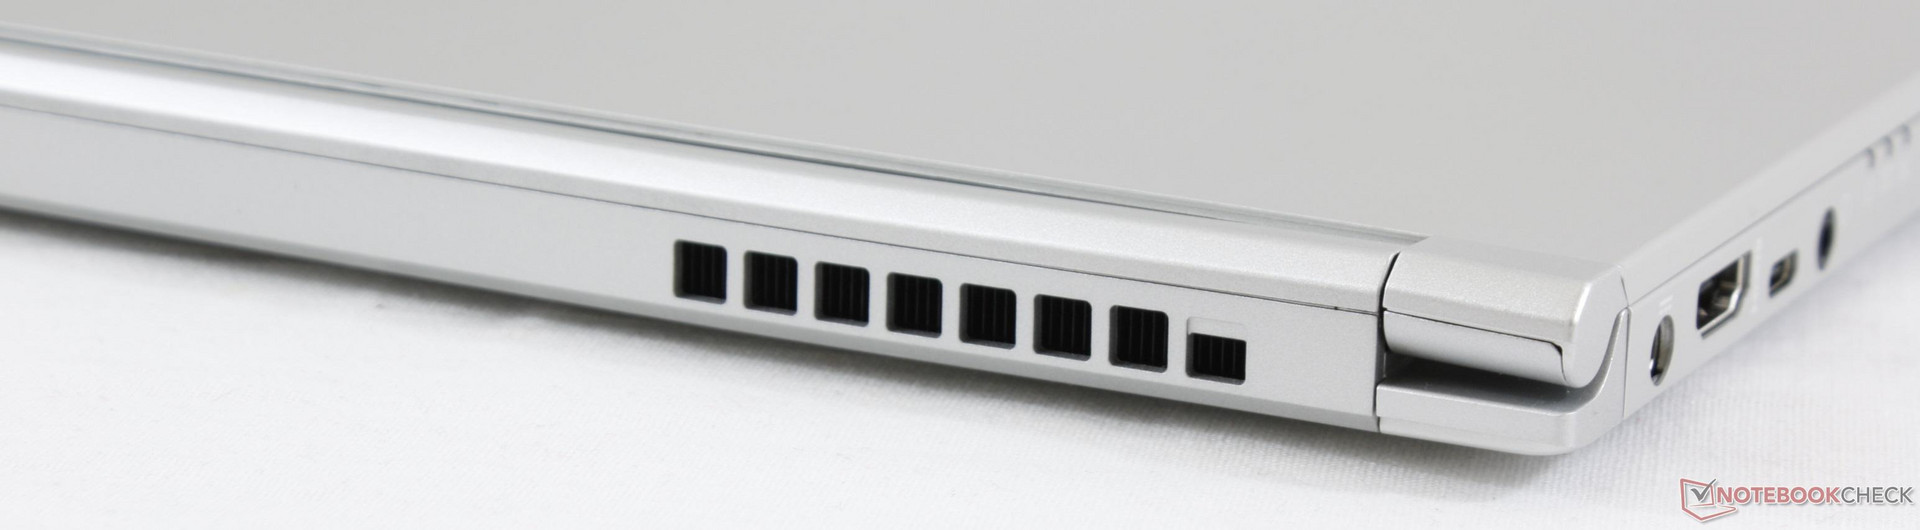
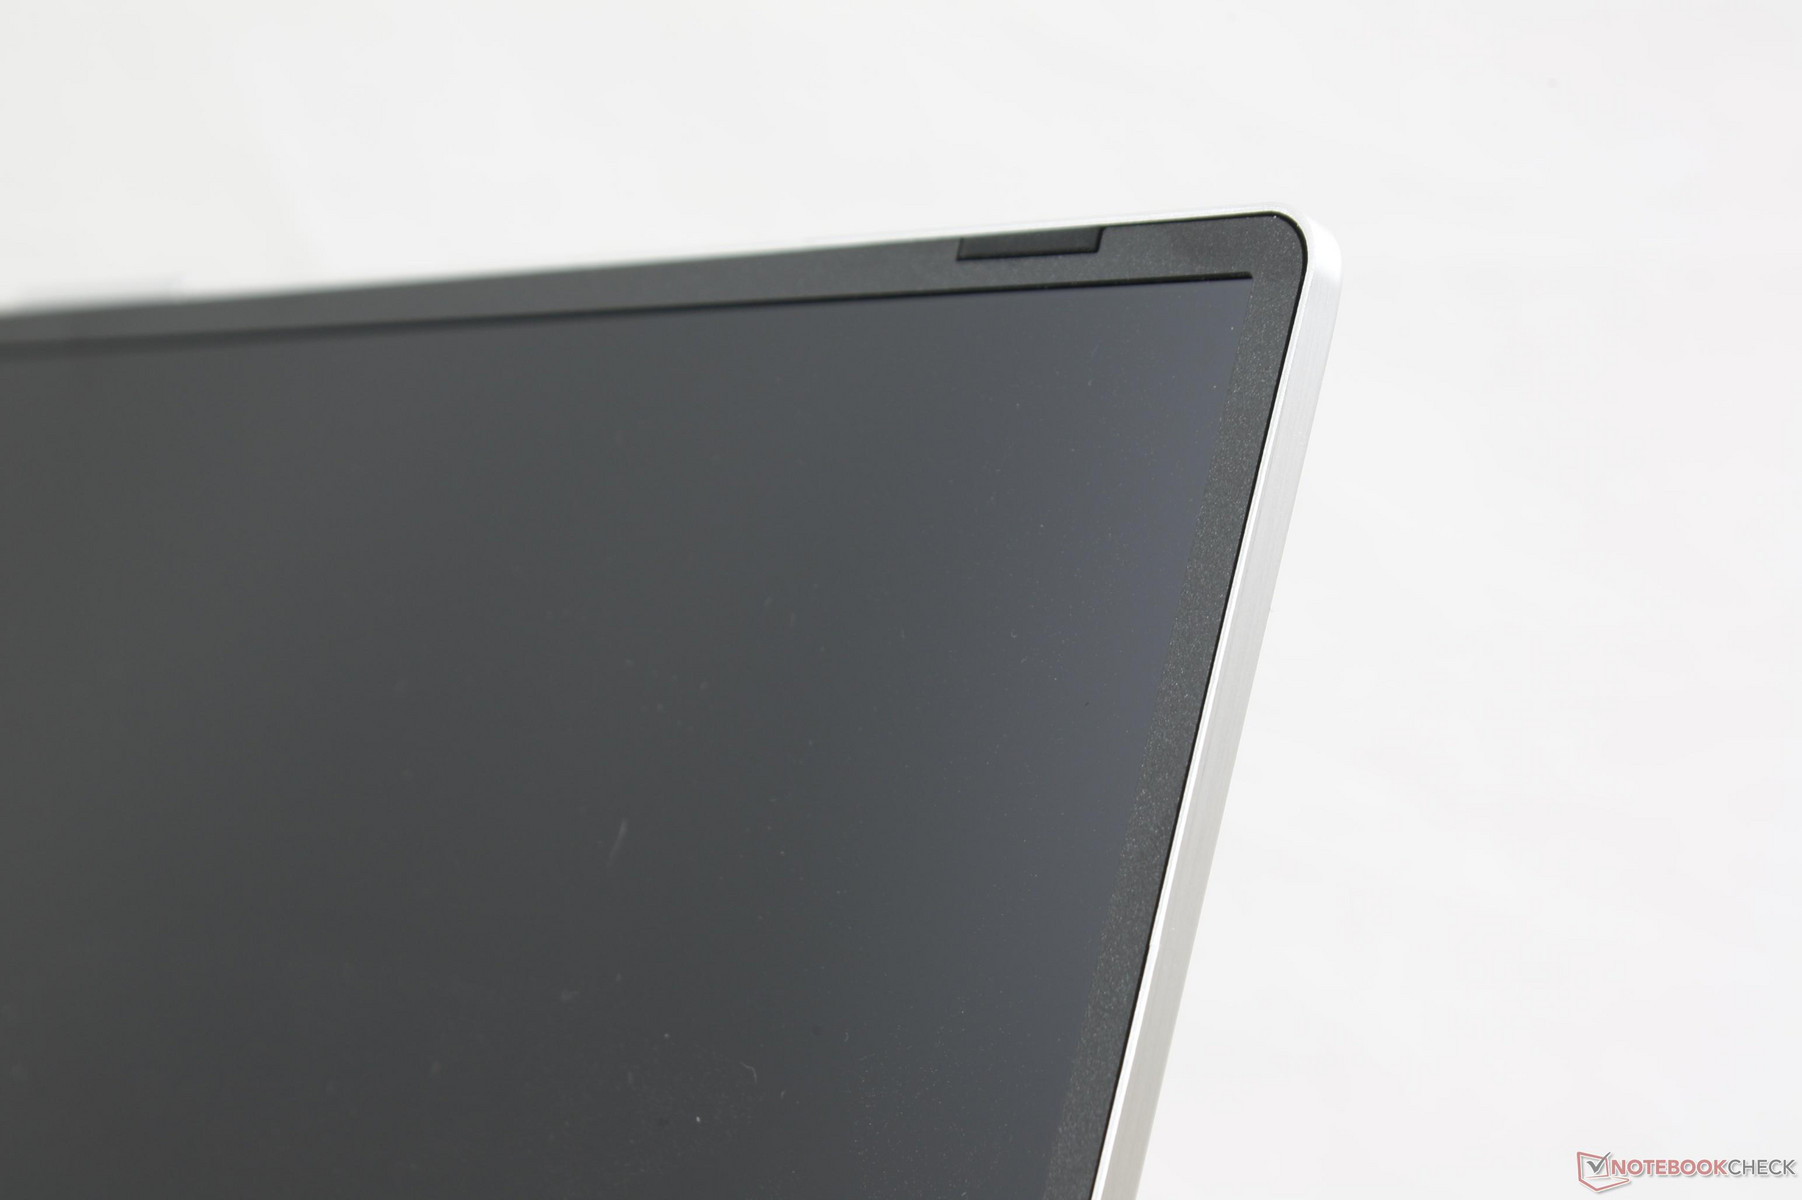
The dual hinges are otherwise satisfactory with no teetering up to the maximum of 180 degrees. Build quality on our sample unit is imperfect around the rear corners as shown by our sample images below.
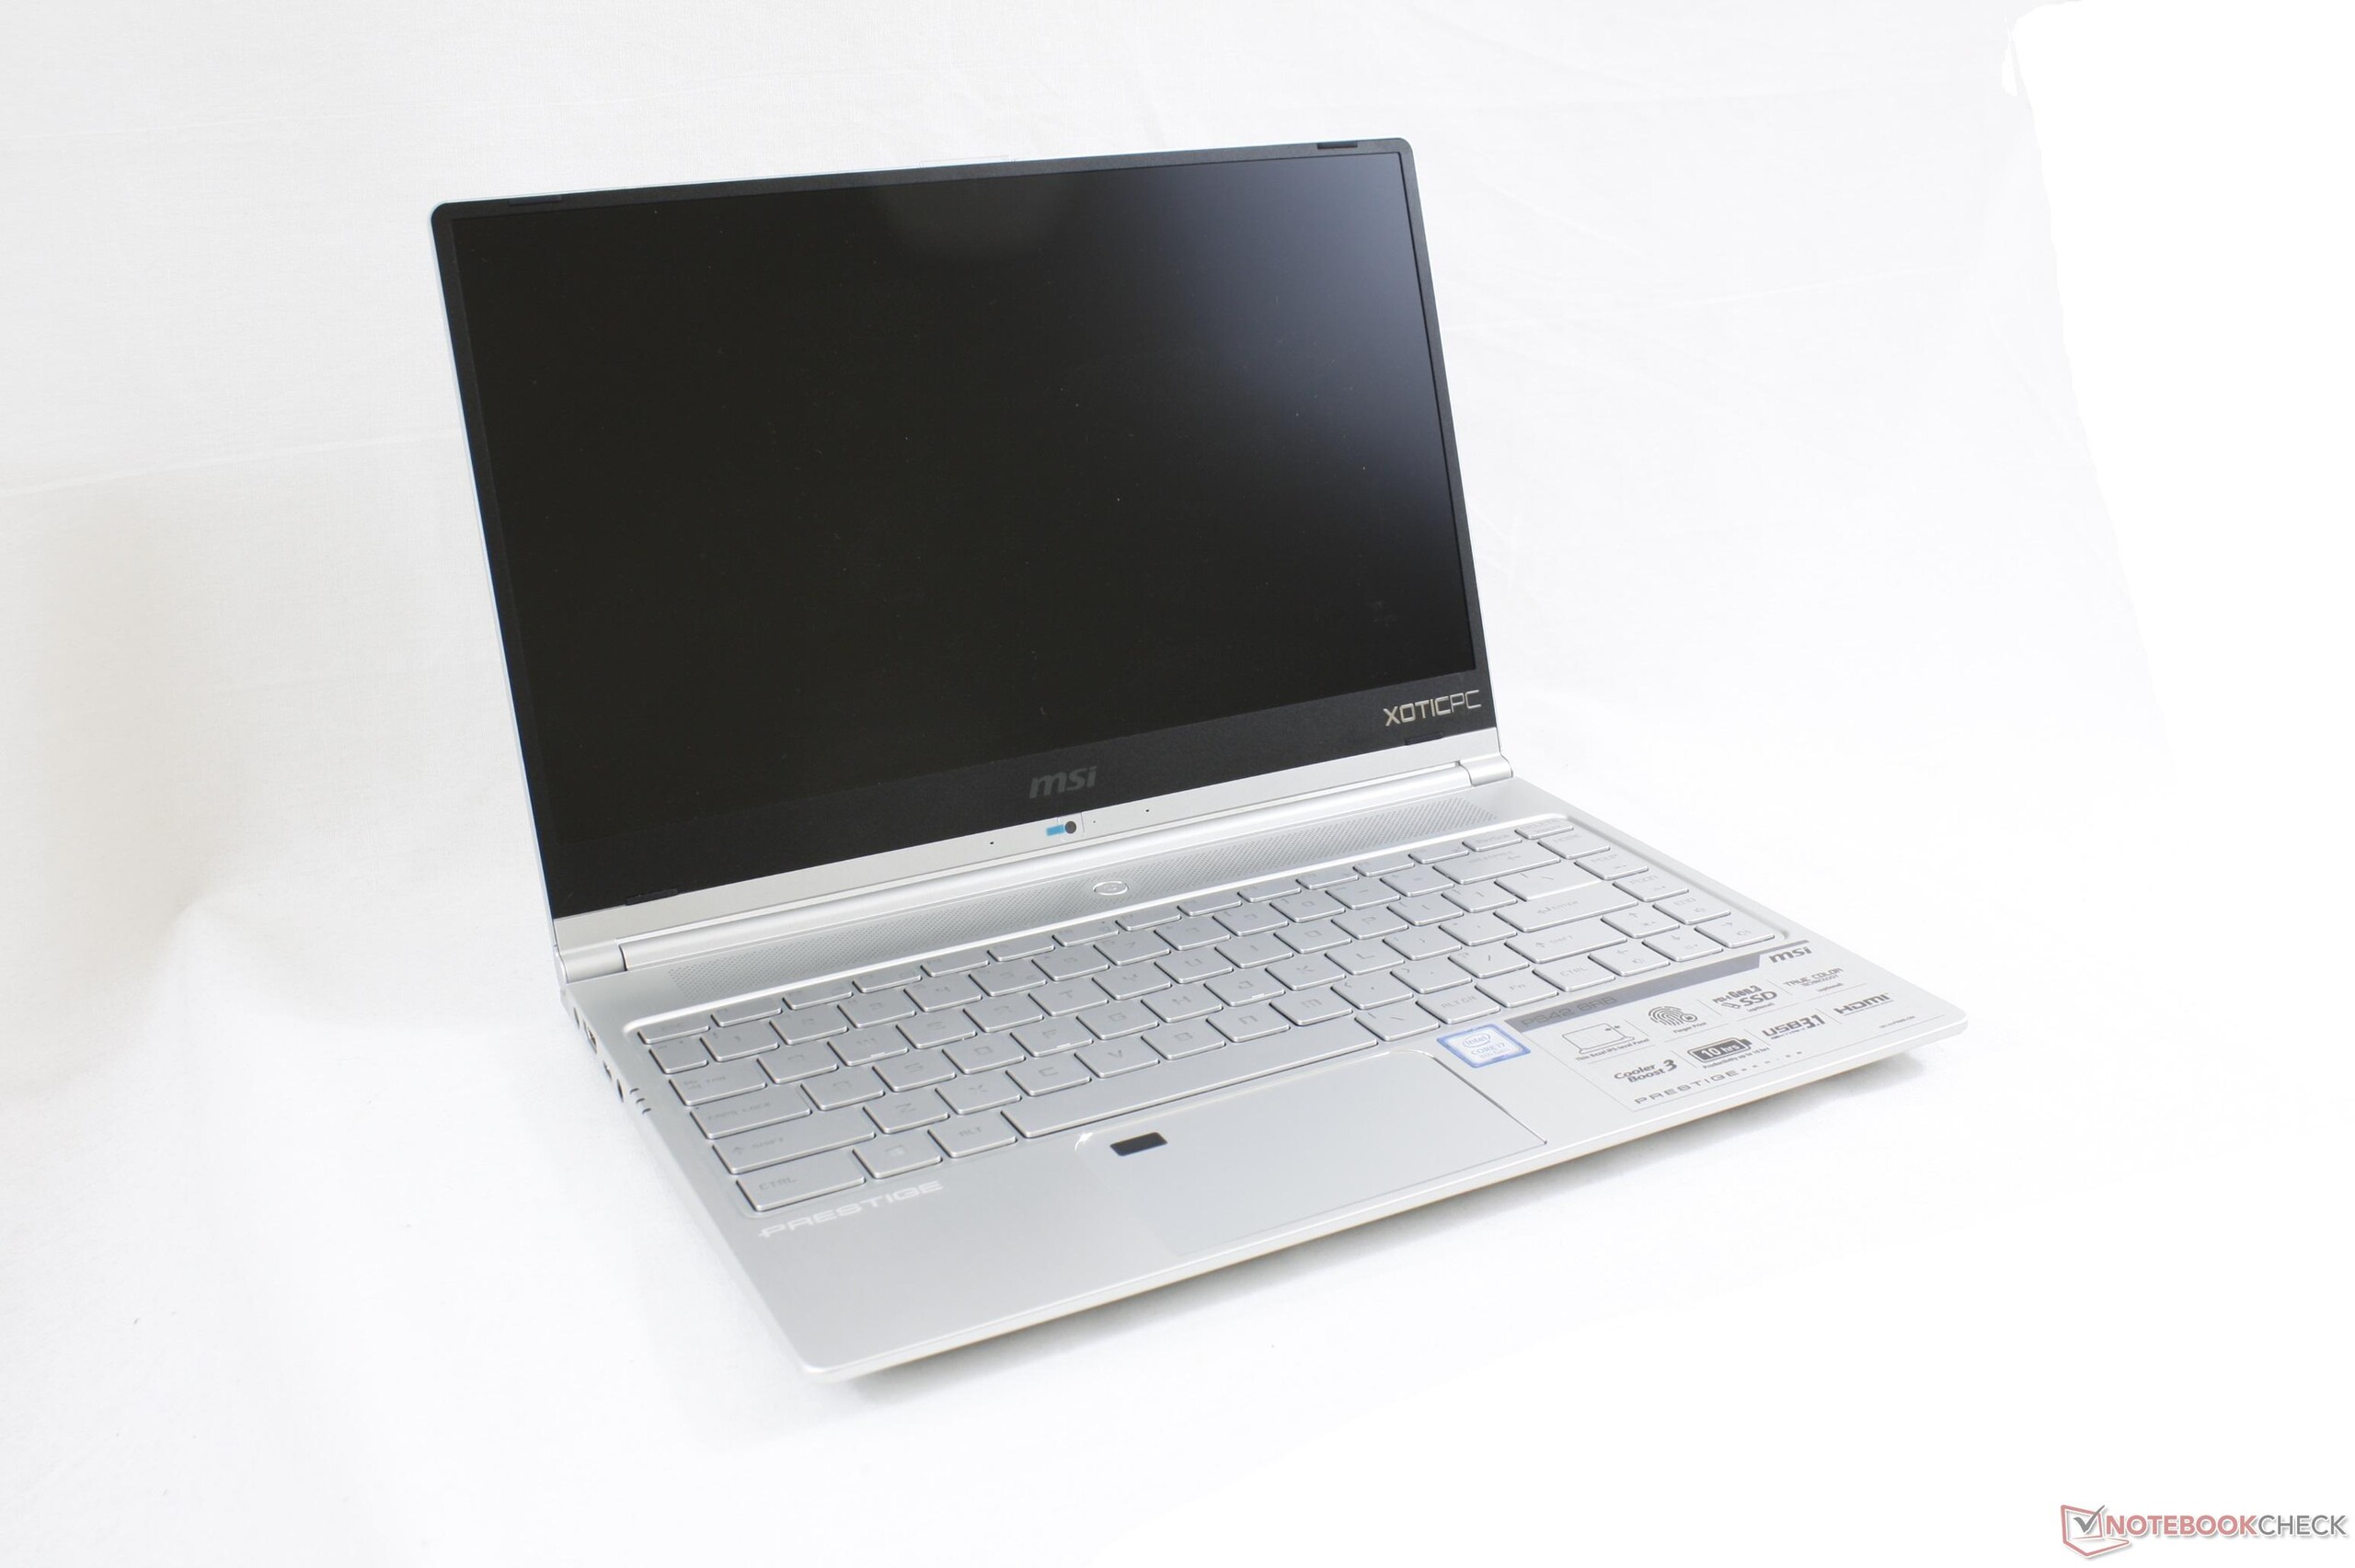
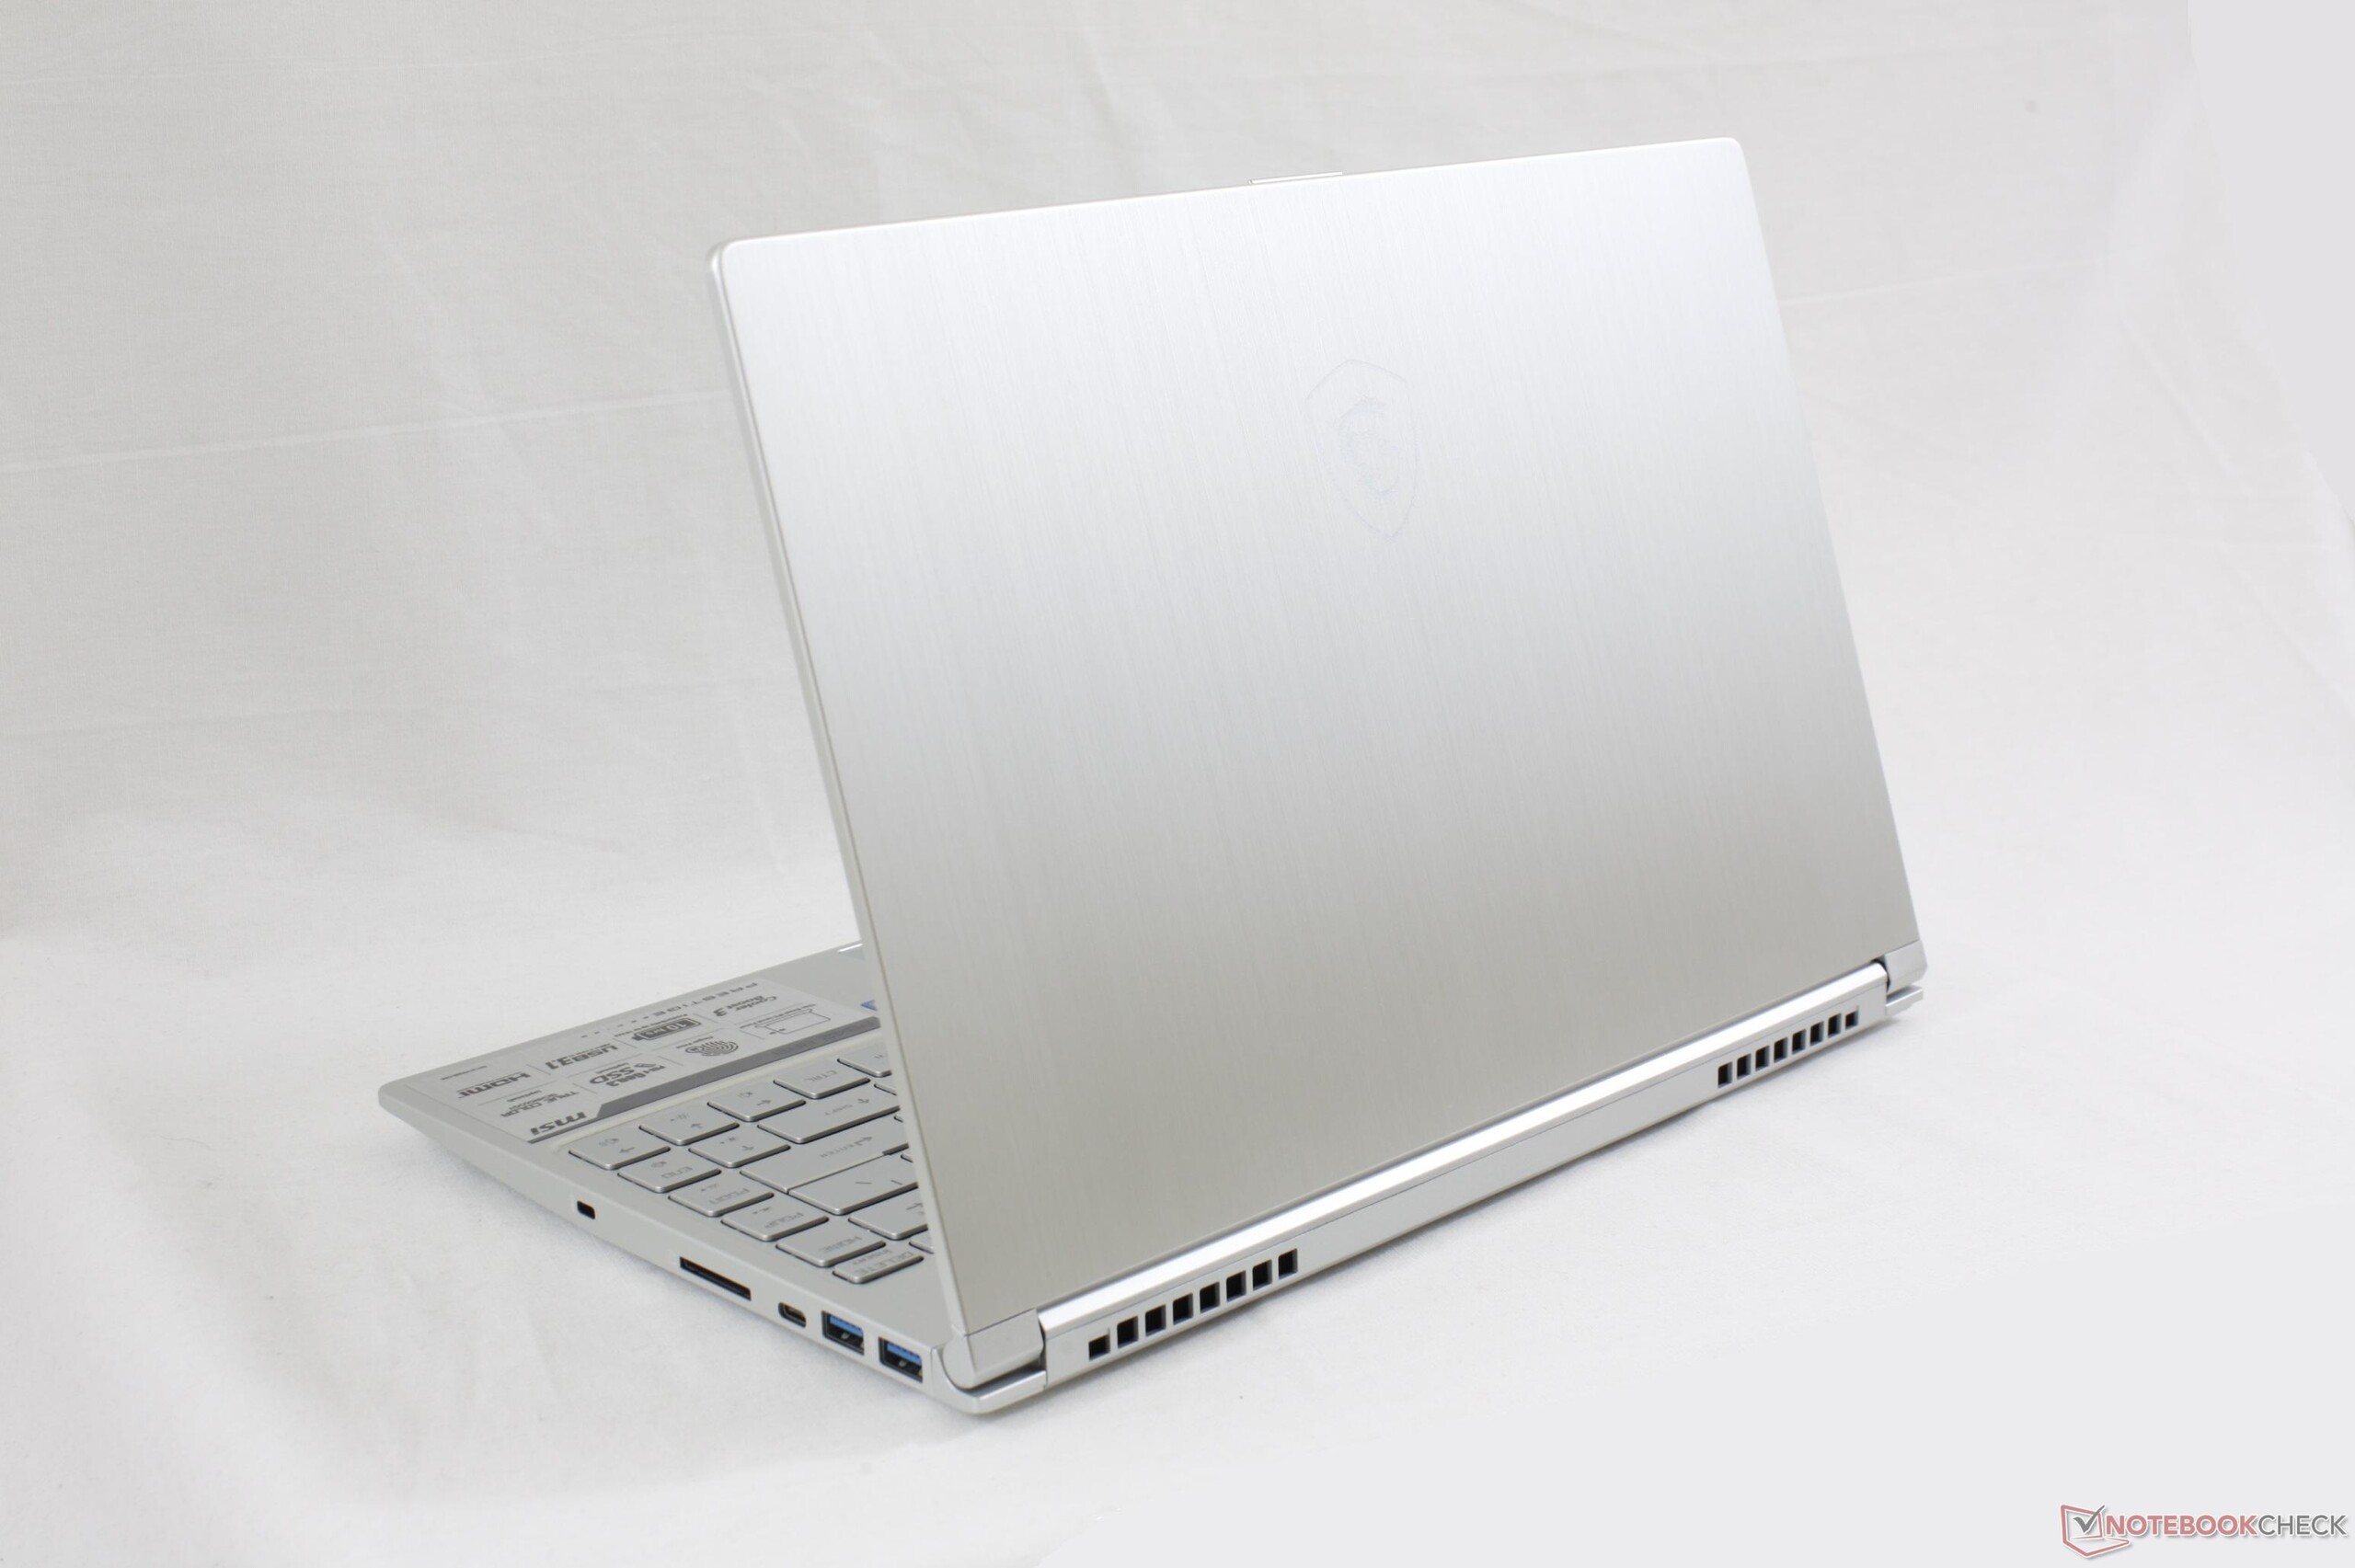
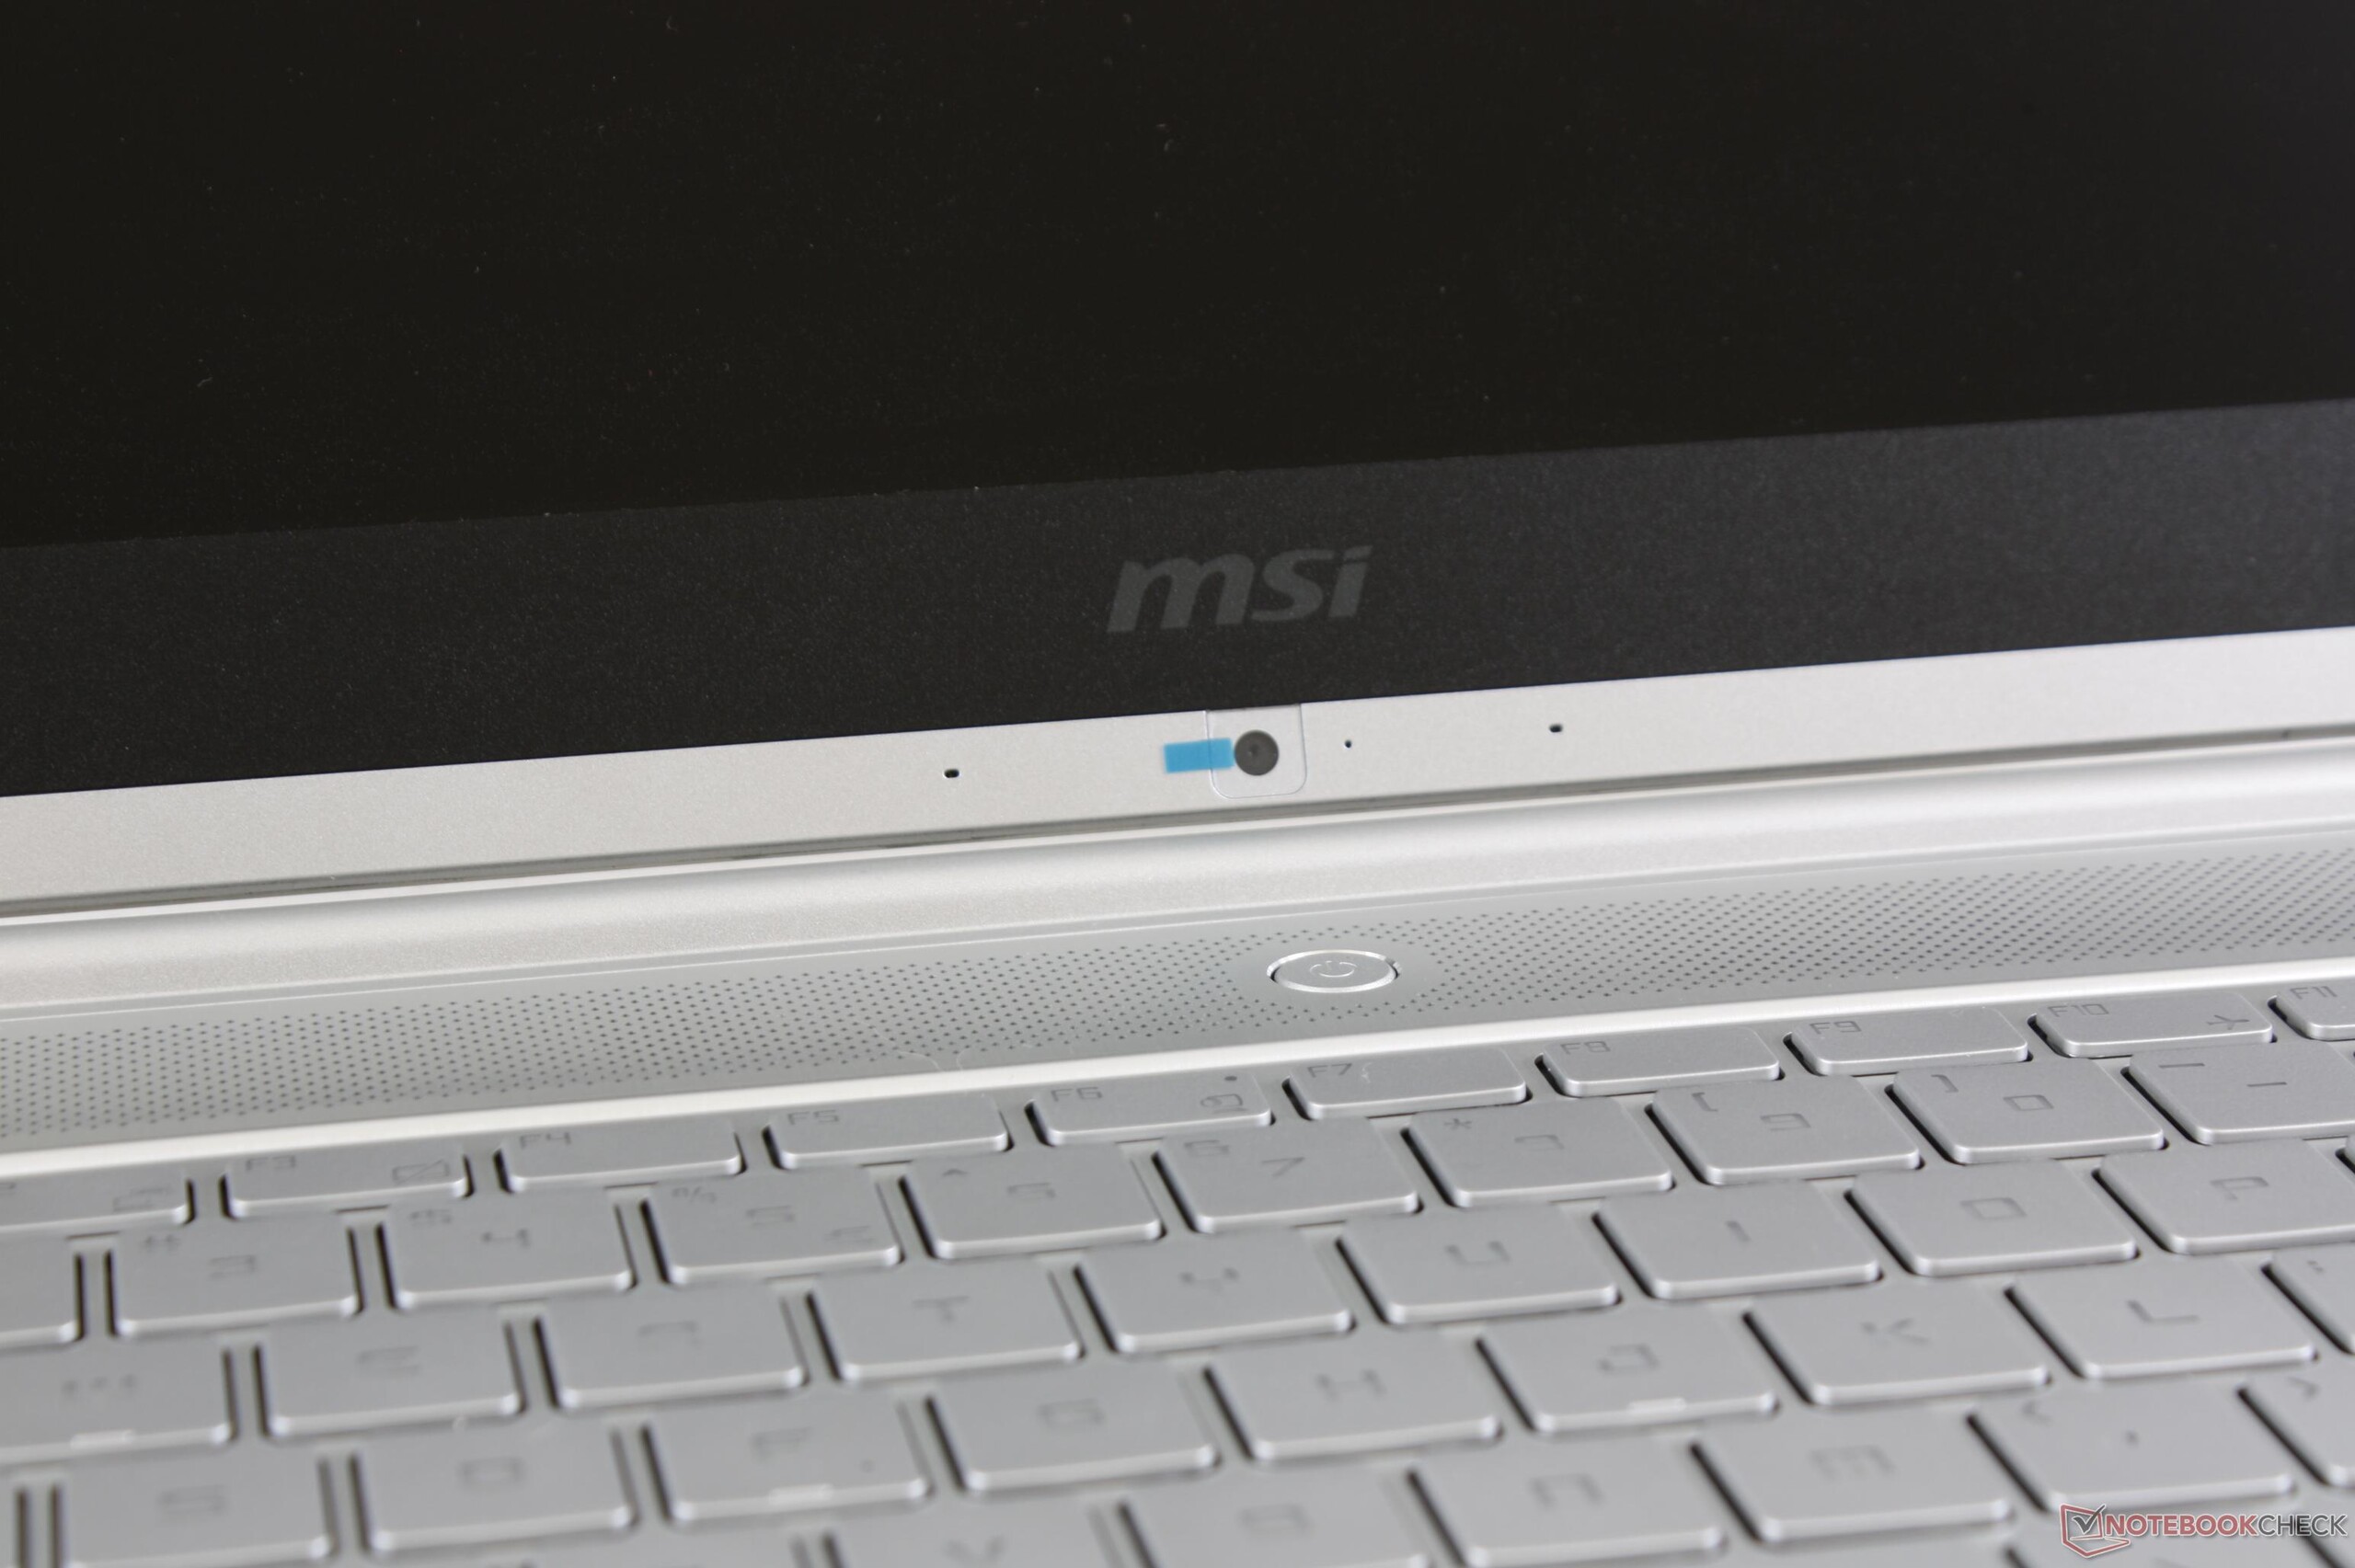

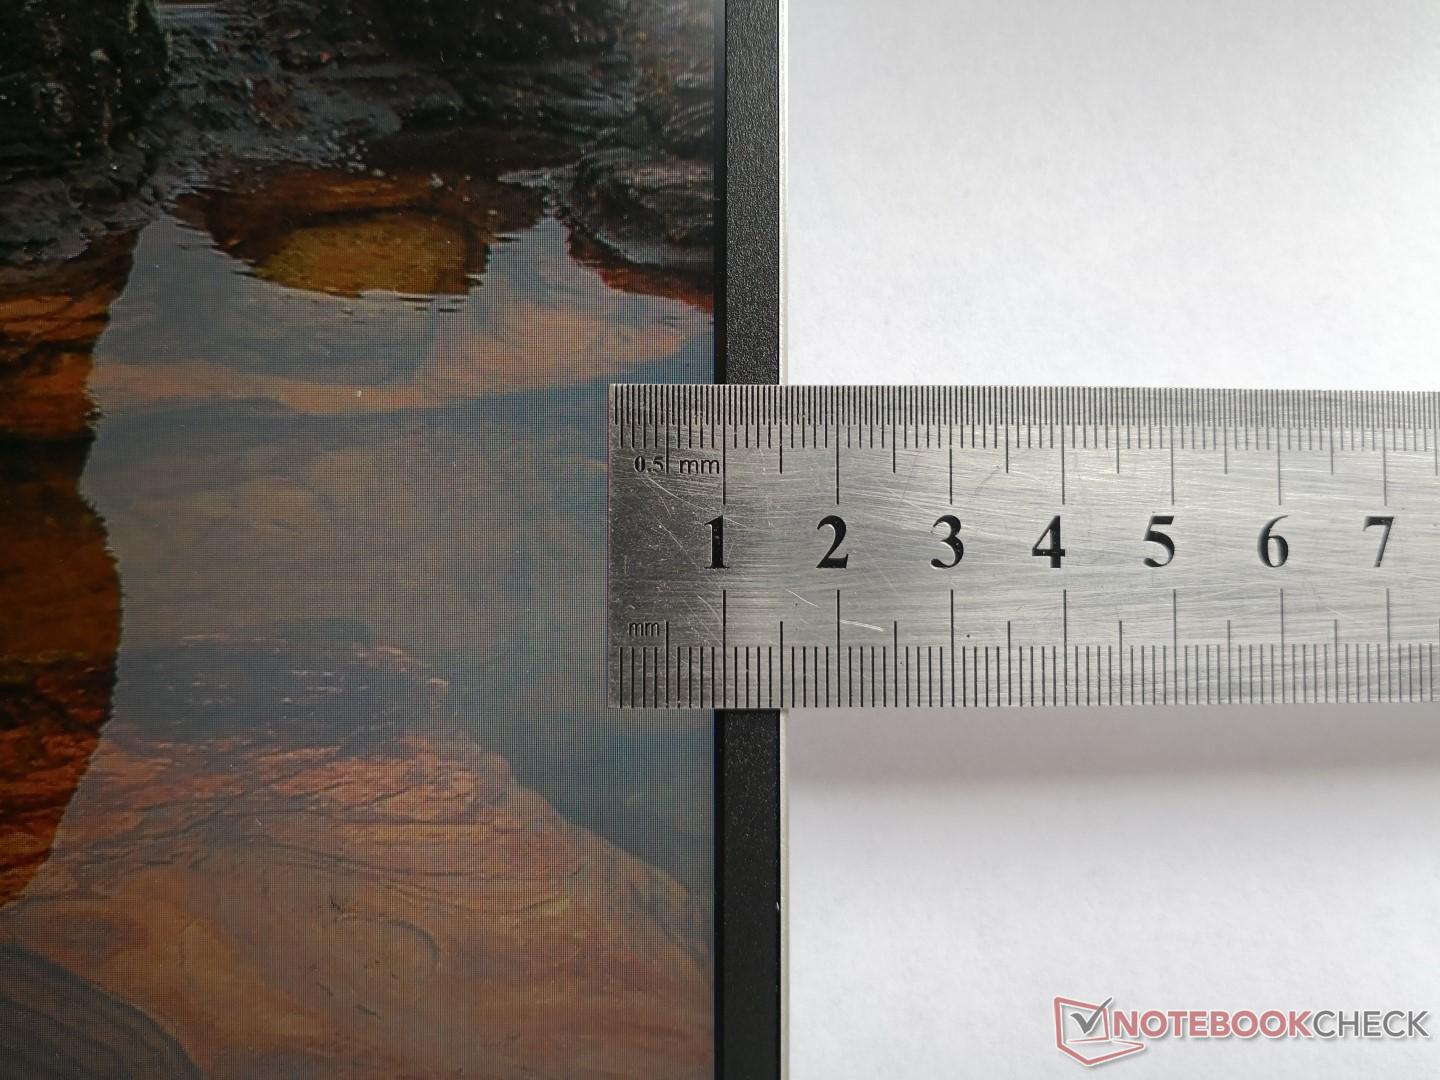
At just 1.2 kg, the PS42 is one of the lightest 14-inch notebooks we've seen. The XPS 13 is smaller in all three dimensions without any discrete GPU options and it amazingly still weighs about the same as our MSI. This fact alone is responsible for why the PS42 gives a "hollow" first impression since many smaller Ultrabooks don't have significant weight differences. On the bright side, the light weight and very narrow 5.7 mm bezels make the MSI easy to carry around for travel. Some competing models can be thinner like the Microsoft Surface Laptop or the MateBook X Pro, but these "cheat" by having smaller 13.5-inch and 13.9-inch screen sizes.
Connectivity
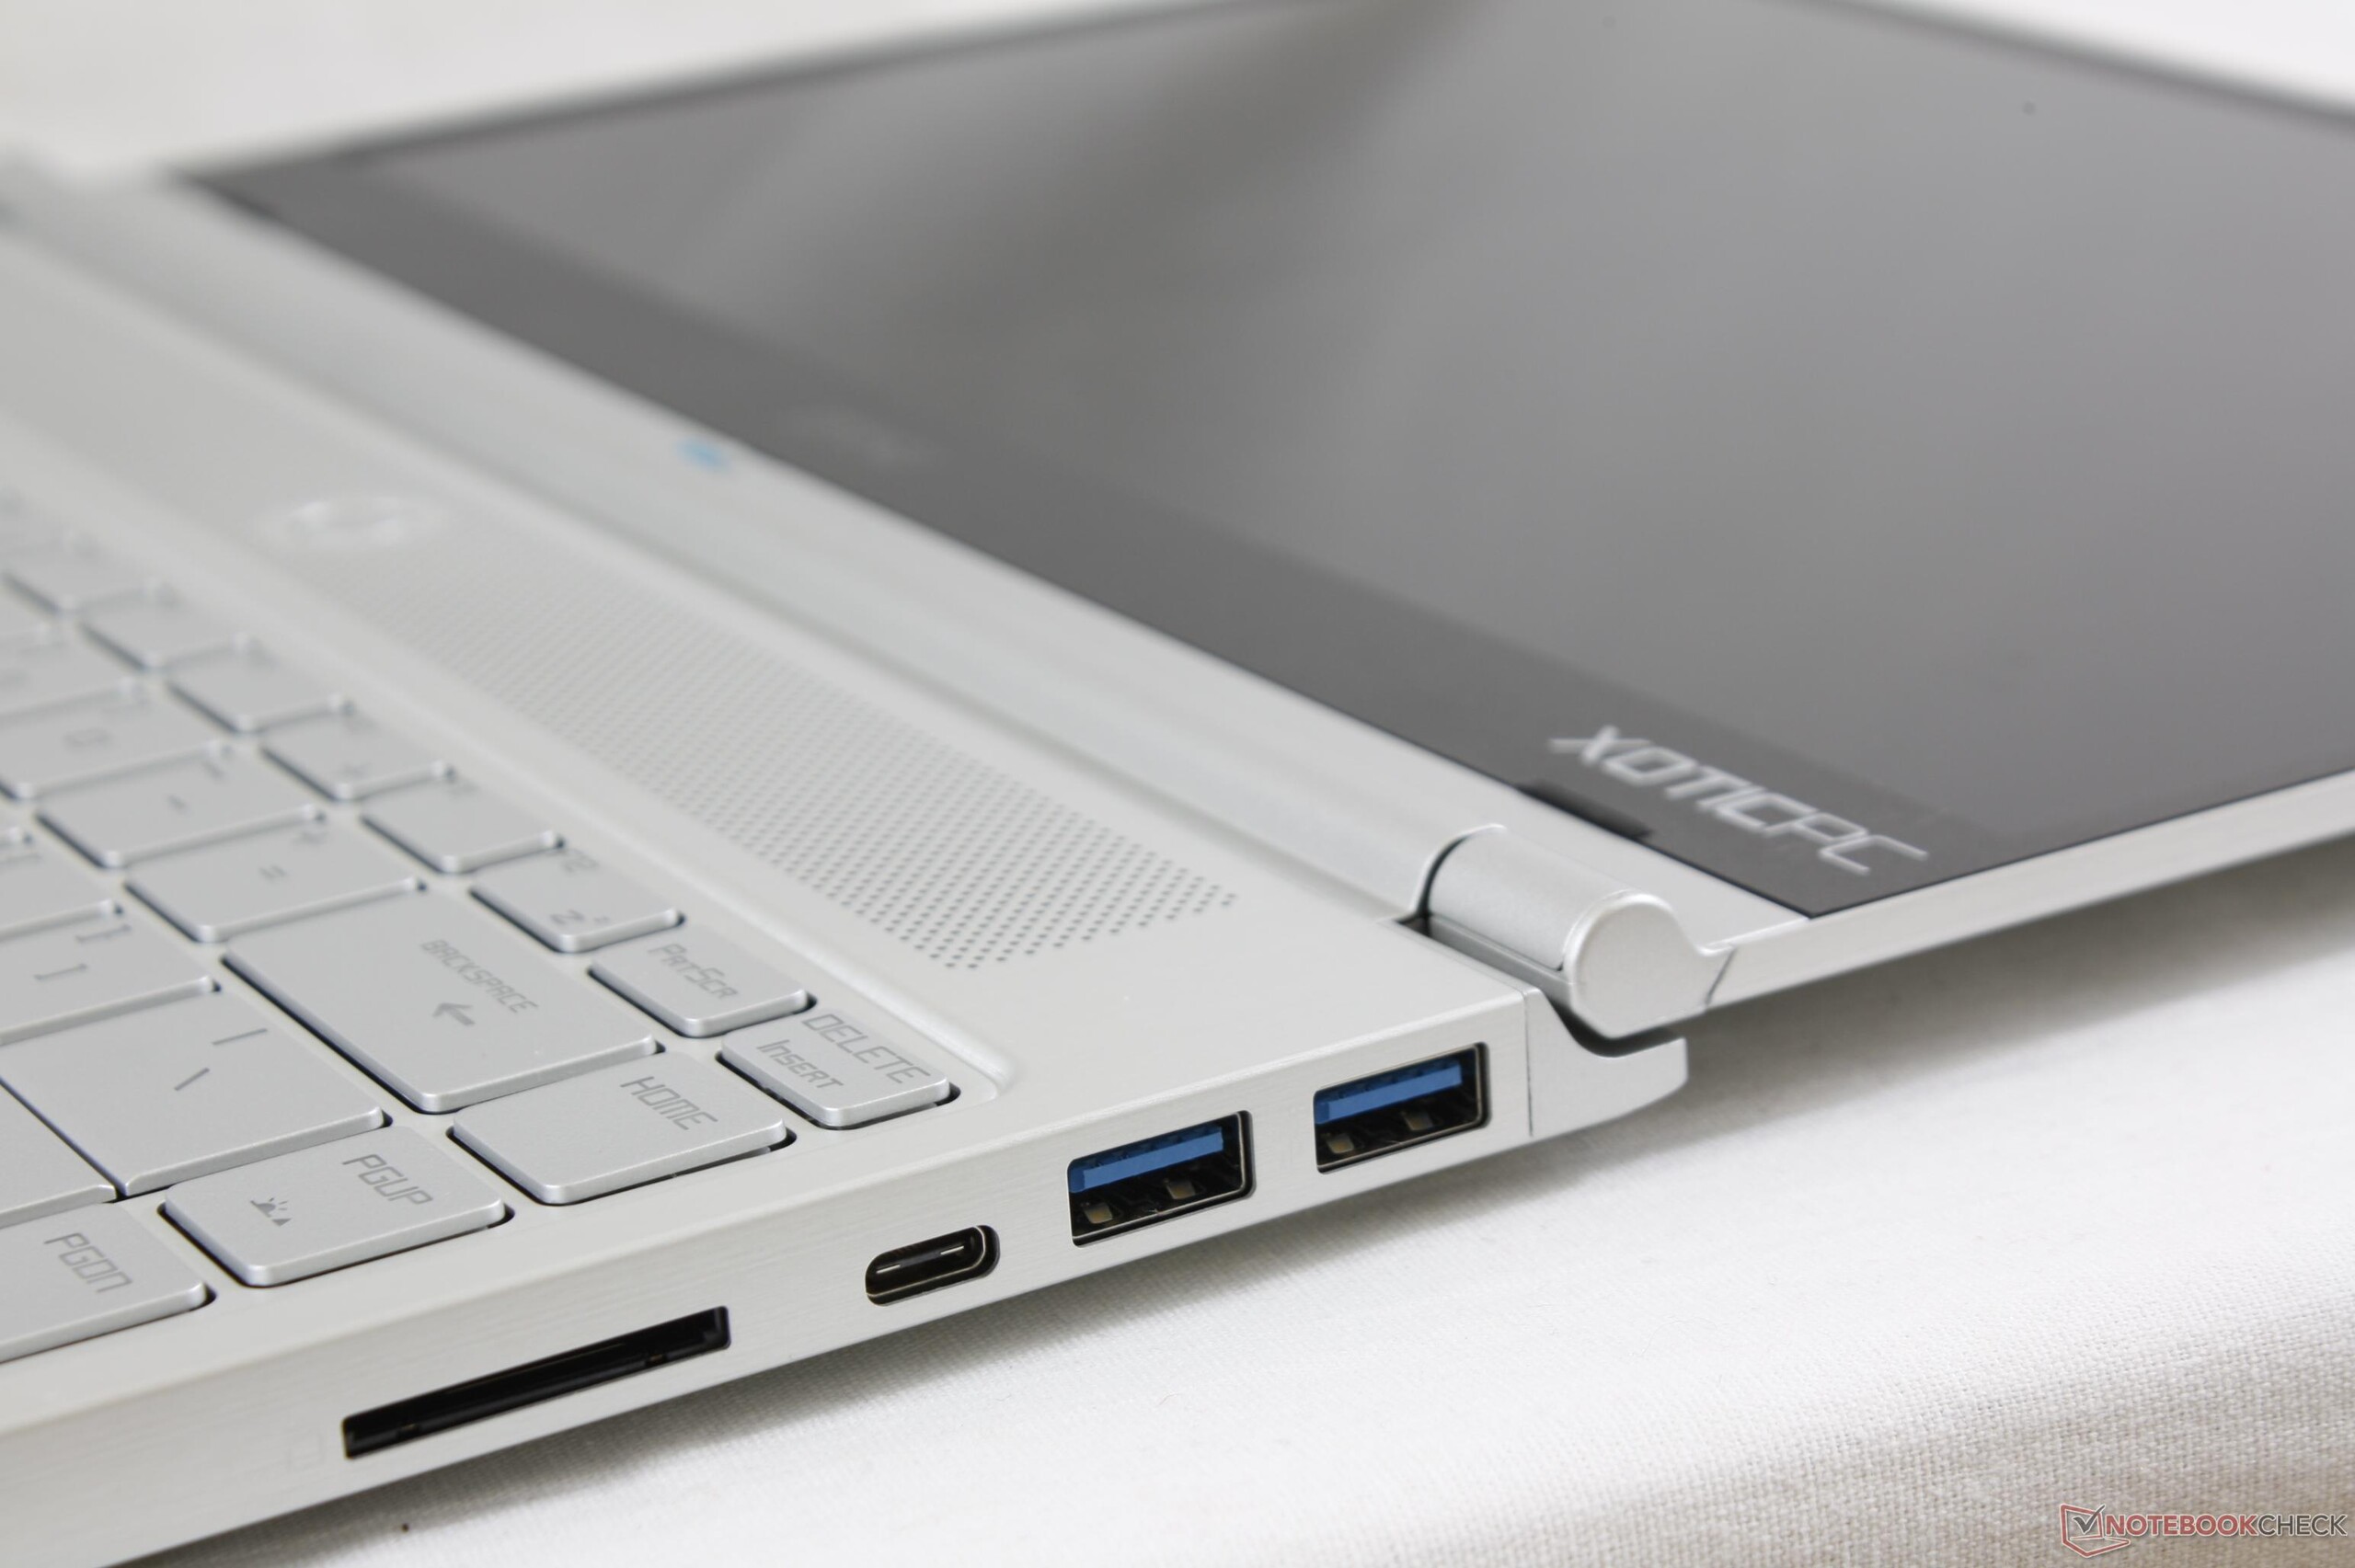
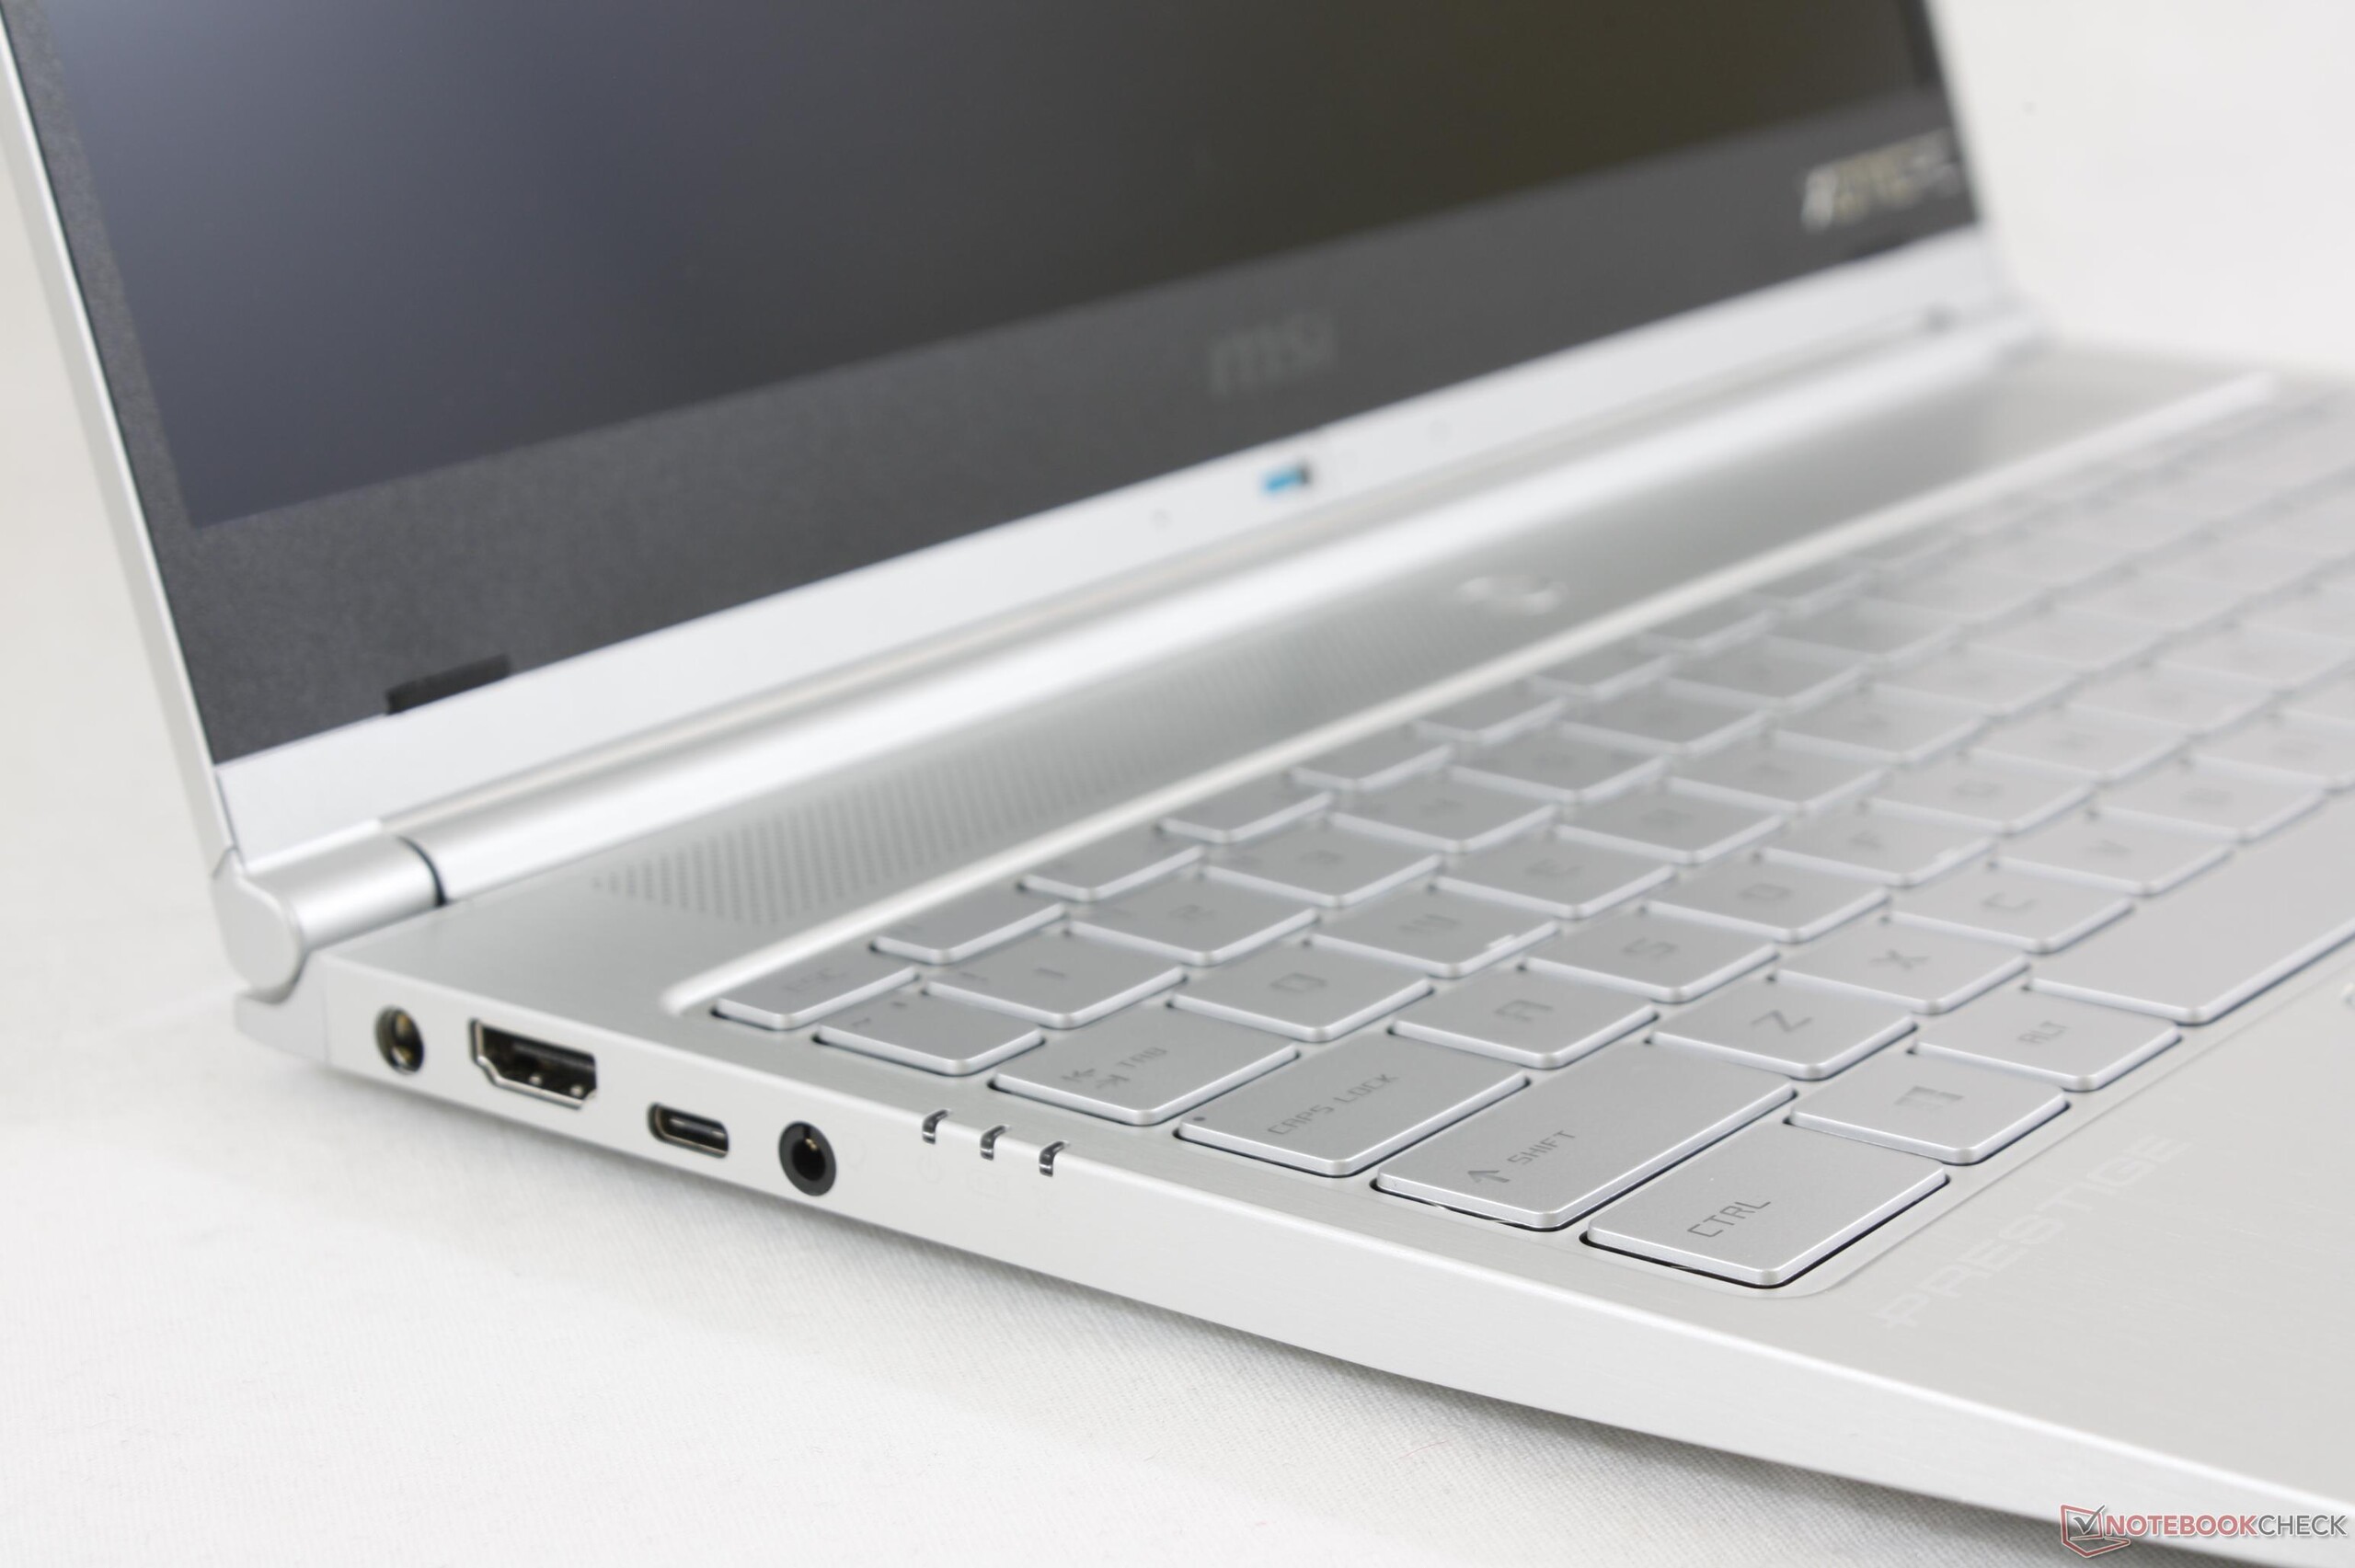
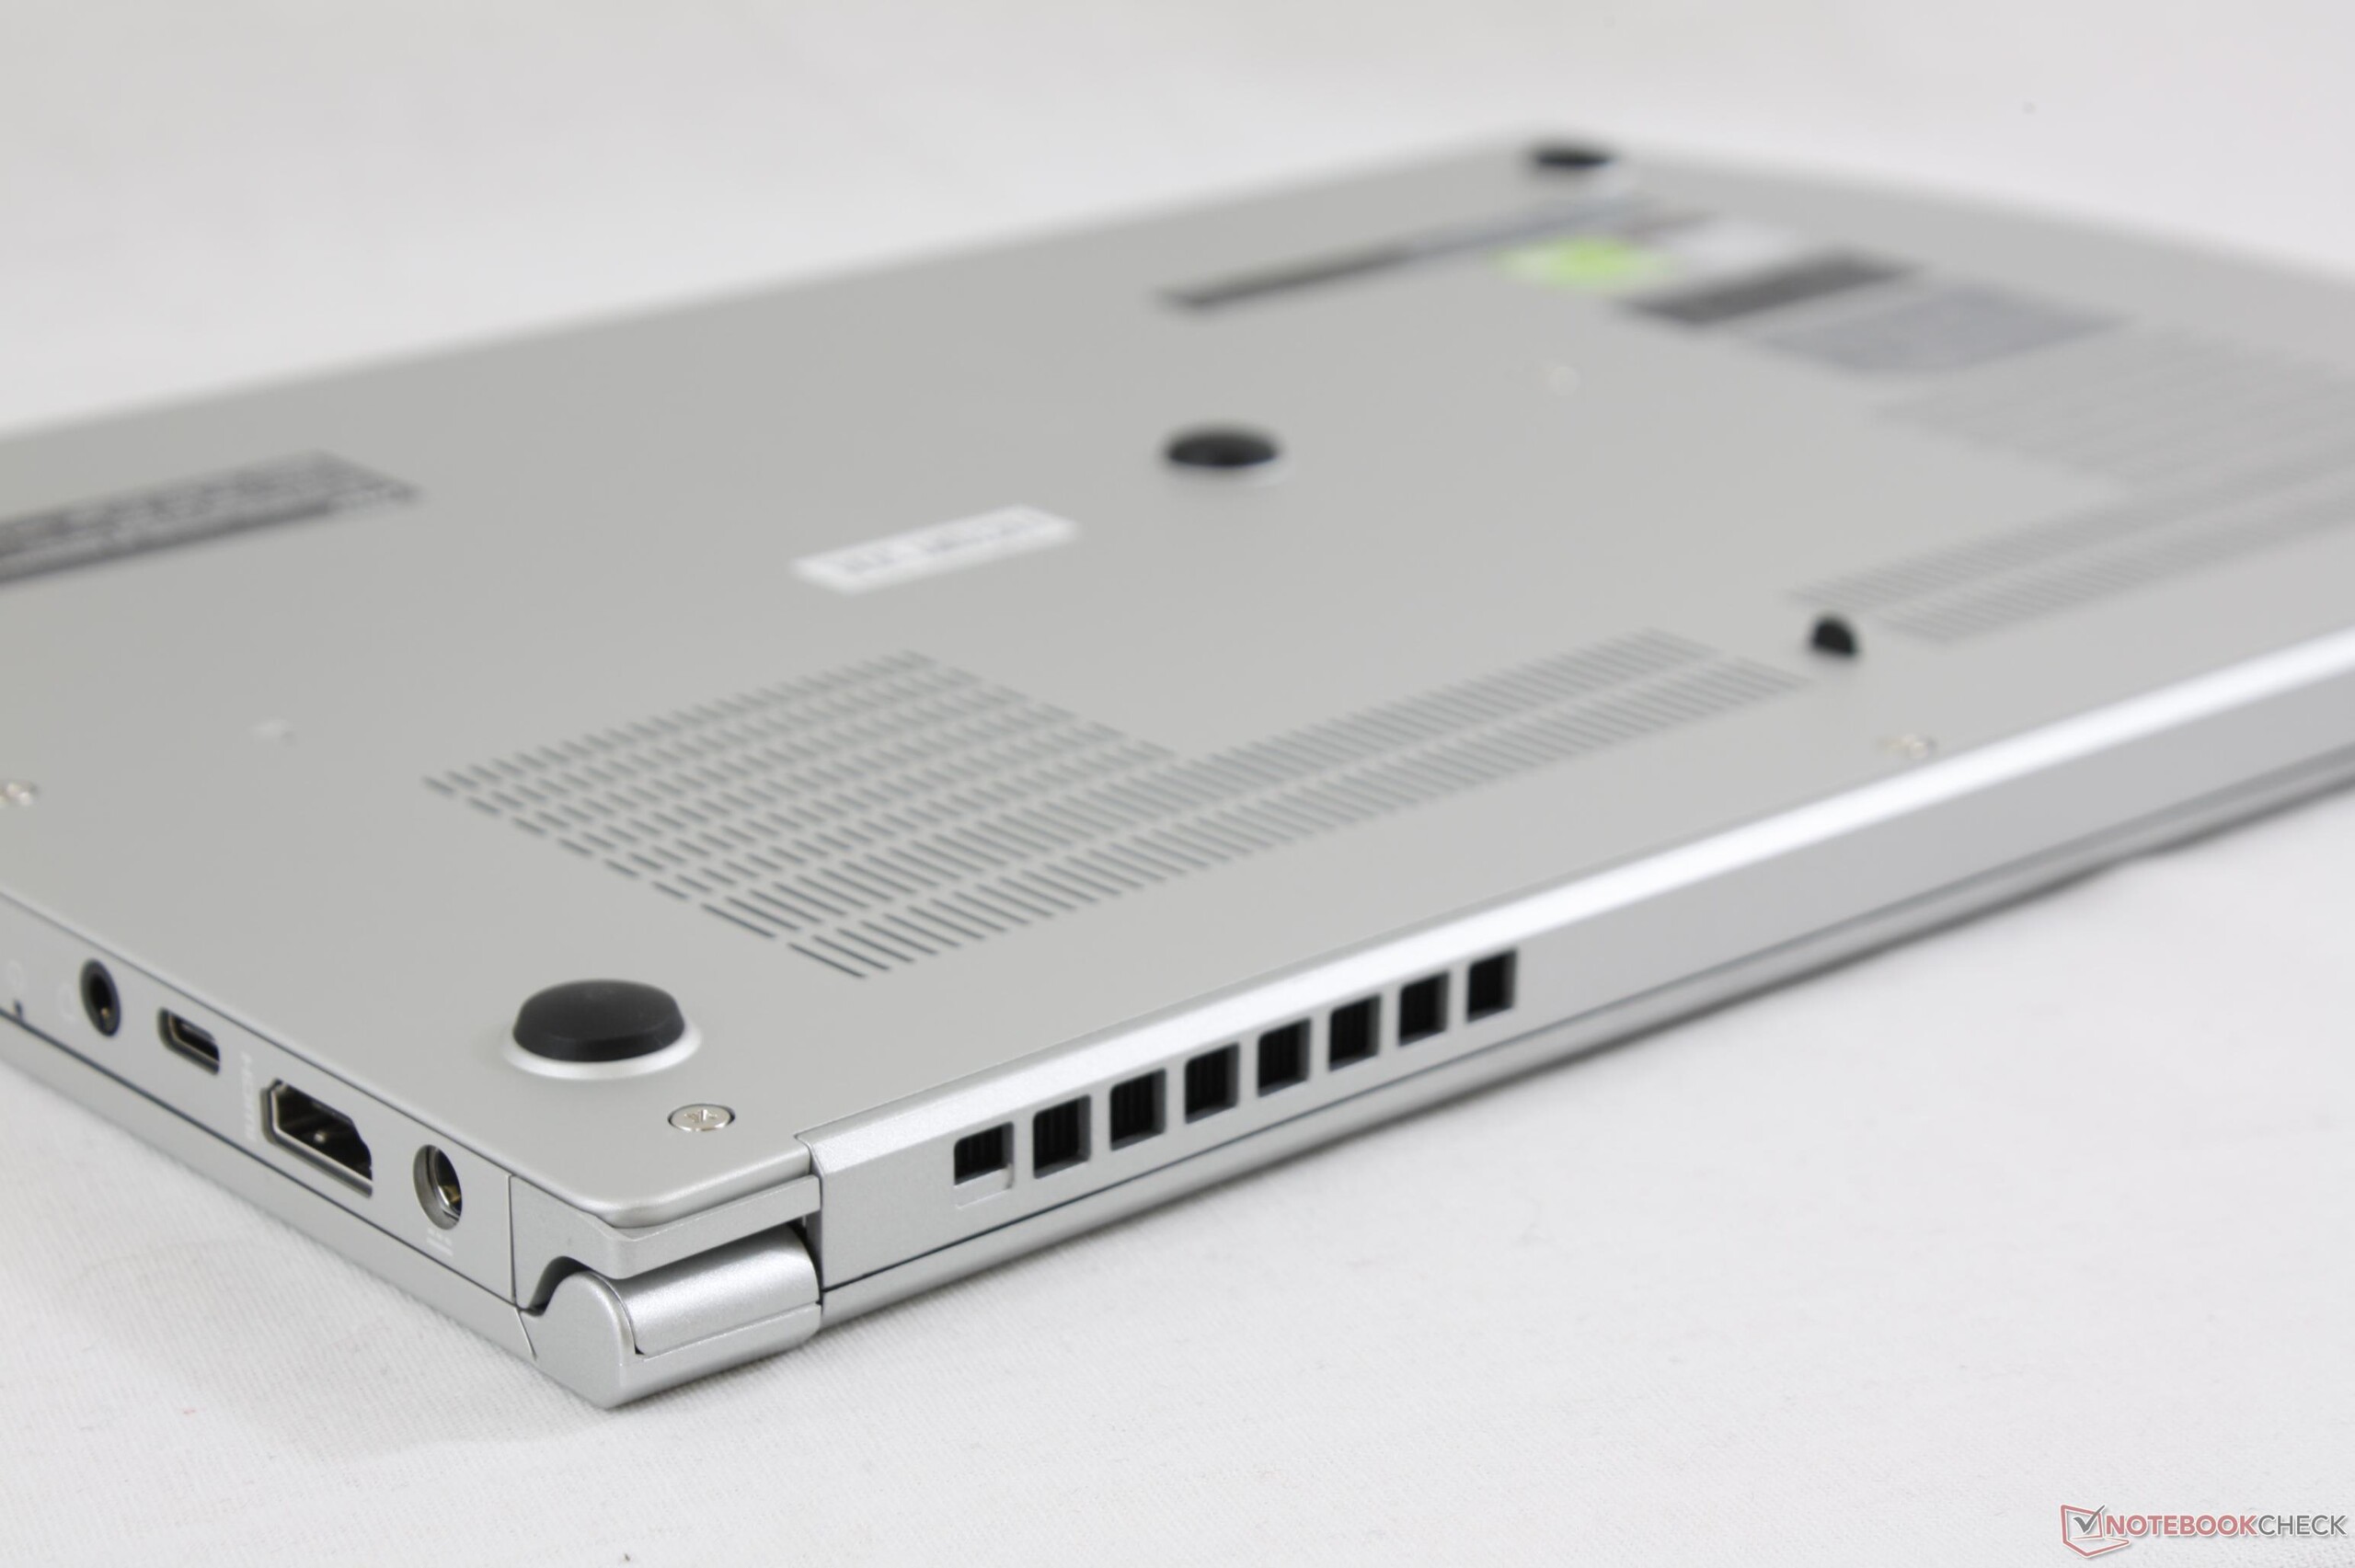
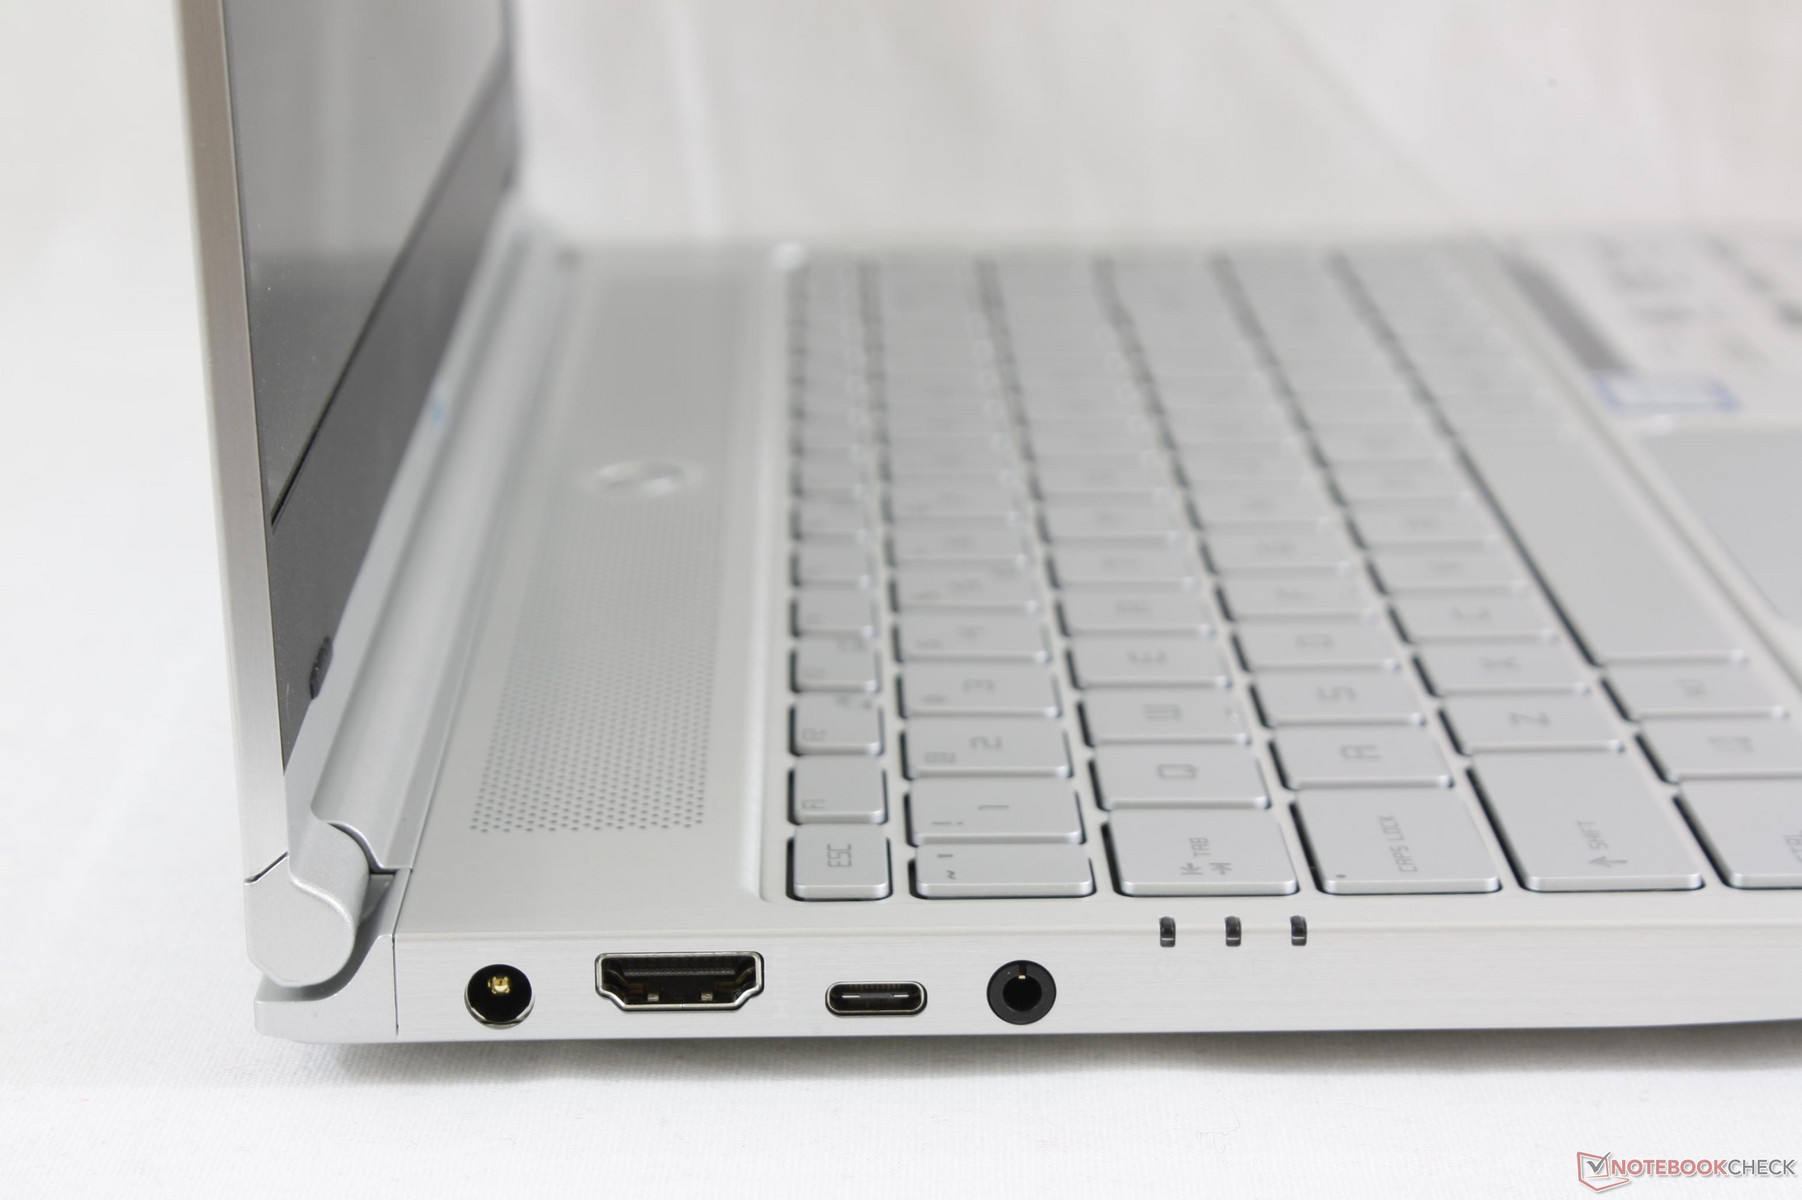
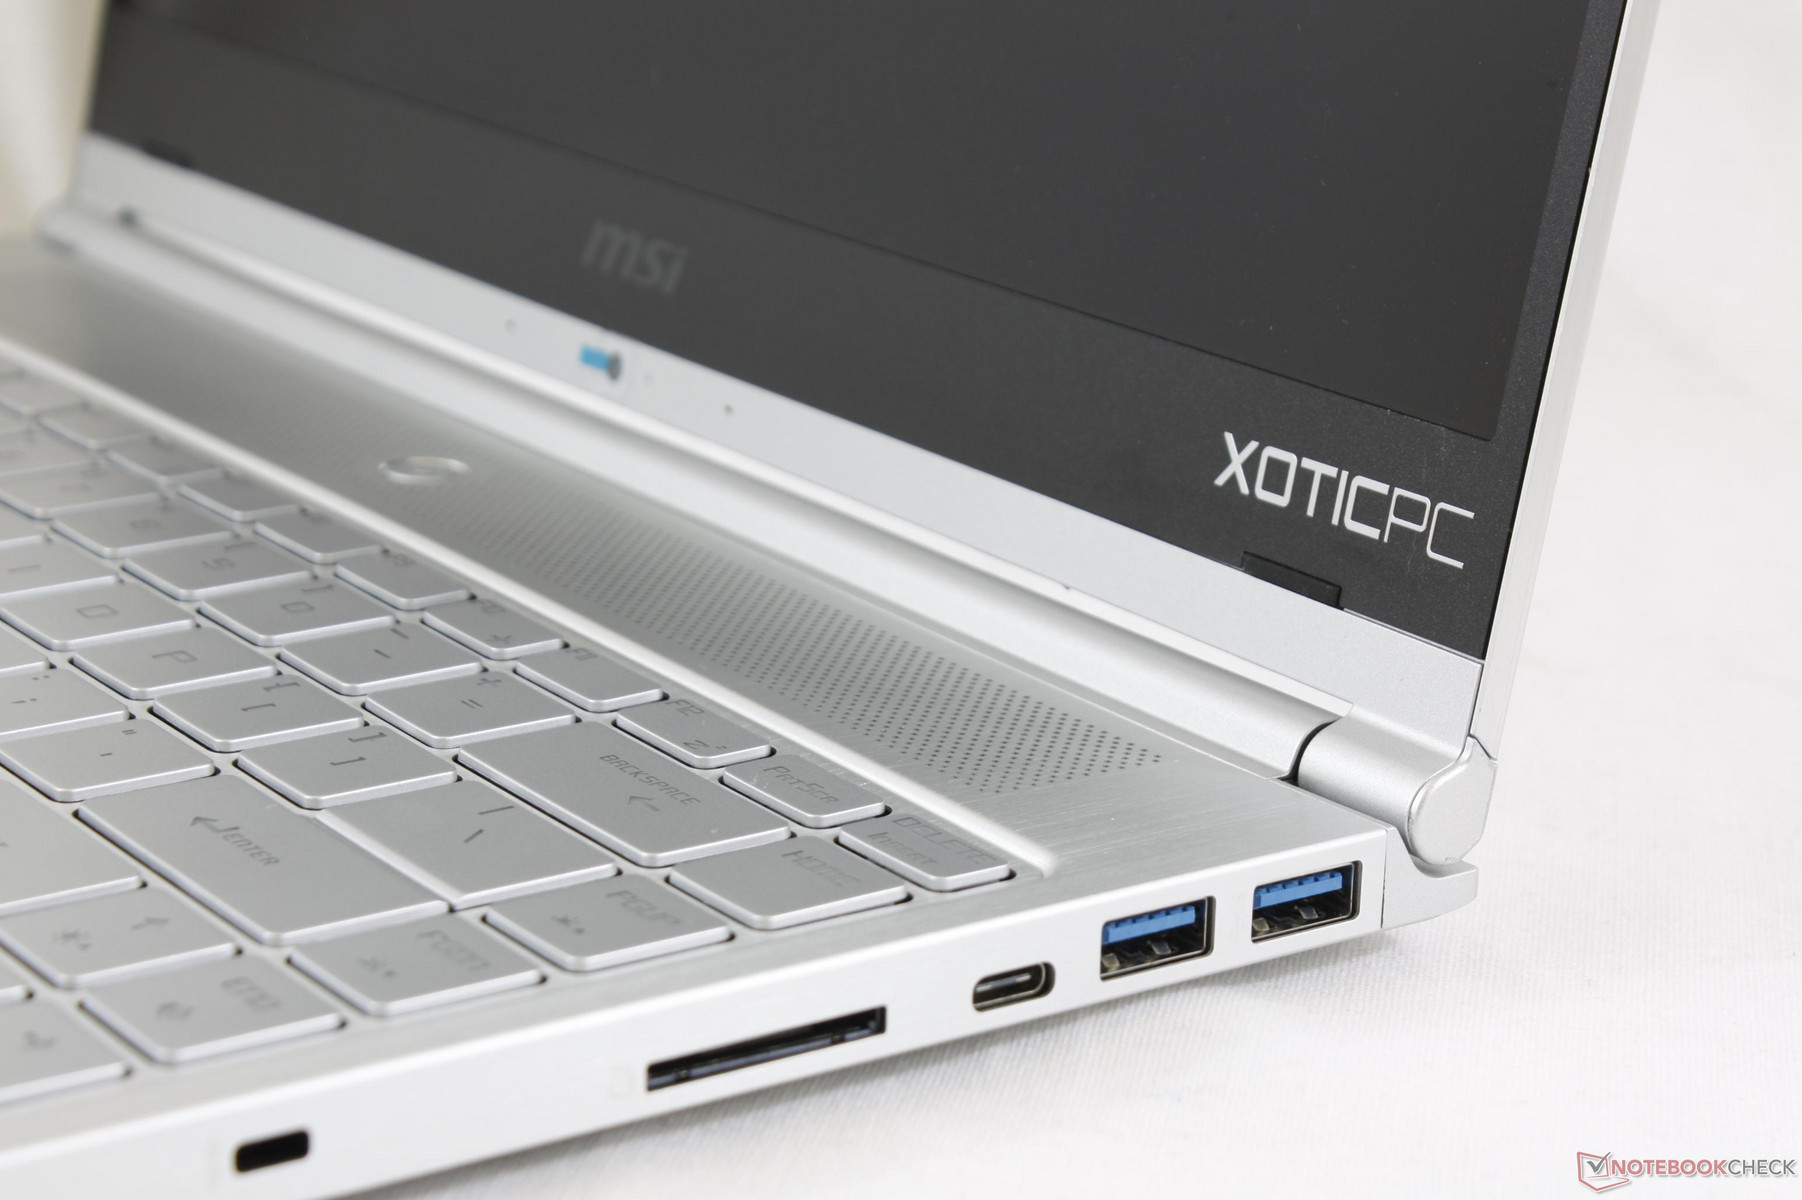
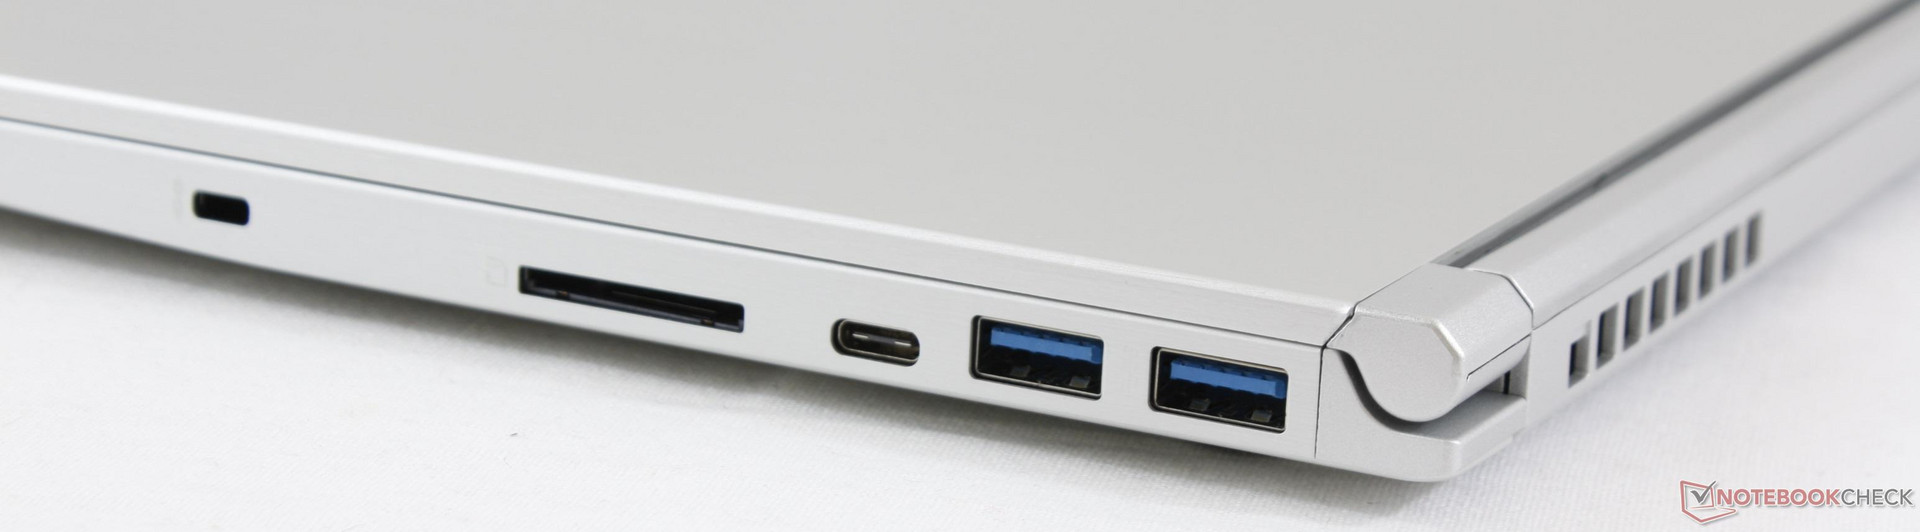
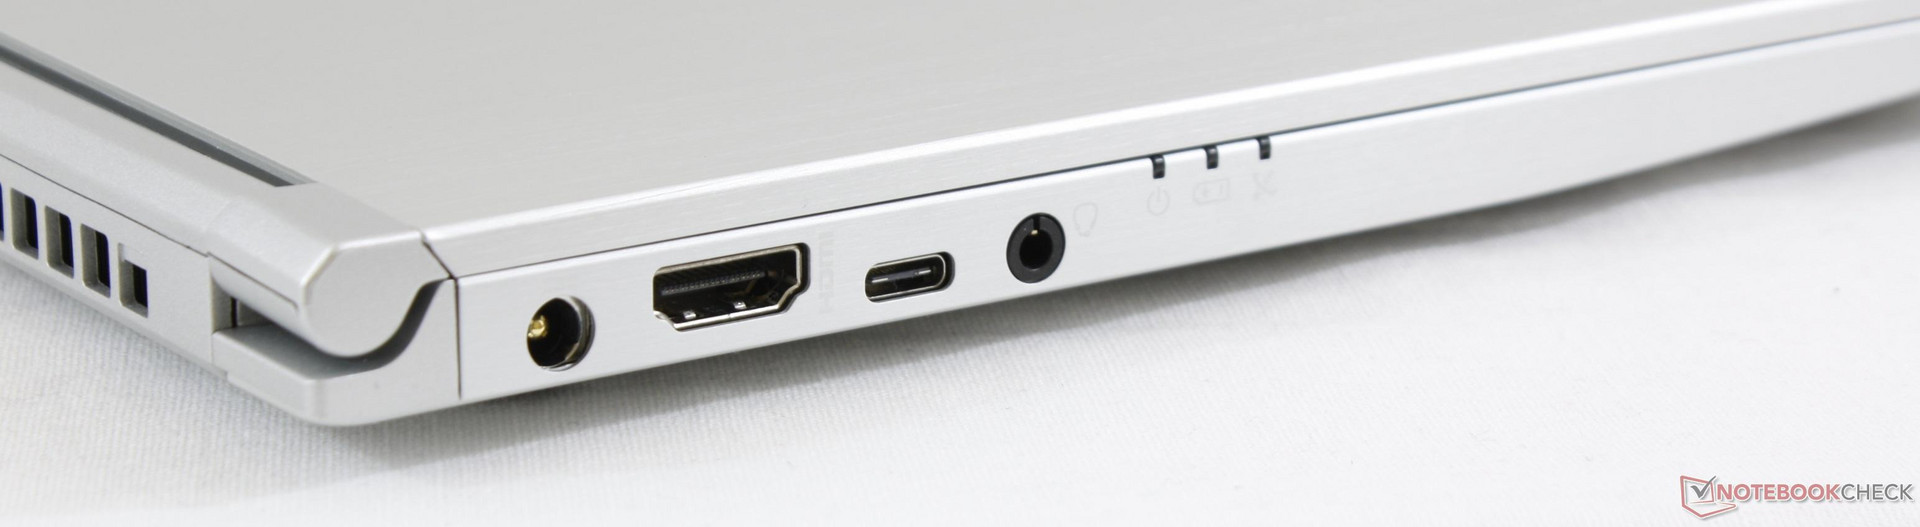
Port selection is wide with a few glaring omissions. Most notably, the system lacks Thunderbolt 3 and even USB Type-C Gen. 2 for more limited connectivity options. Output to 4K60 is not possible either as there is no HDMI 2.0 port. We were expecting a bit more for a notebook worth over $1000 USD.
Port positioning is imperfect. While all ports are easy to reach, the Kensington Lock is oddly located very close upfront along the right edge. A connected lock will occupy valuable desk space away from an external mouse and this can become a nuisance since it is so close to the front of the notebook. It's unfortunate that MSI couldn't move the lock further towards the rear or switch positions with one of the USB ports.
Another disappointment is the use of a proprietary AC adapter port instead of the more versatile USB Type-C charging. We're hoping that future revisions will drop the AC adapter port entirely much like on the XPS 13 or Spectre 13.
SD Card Reader
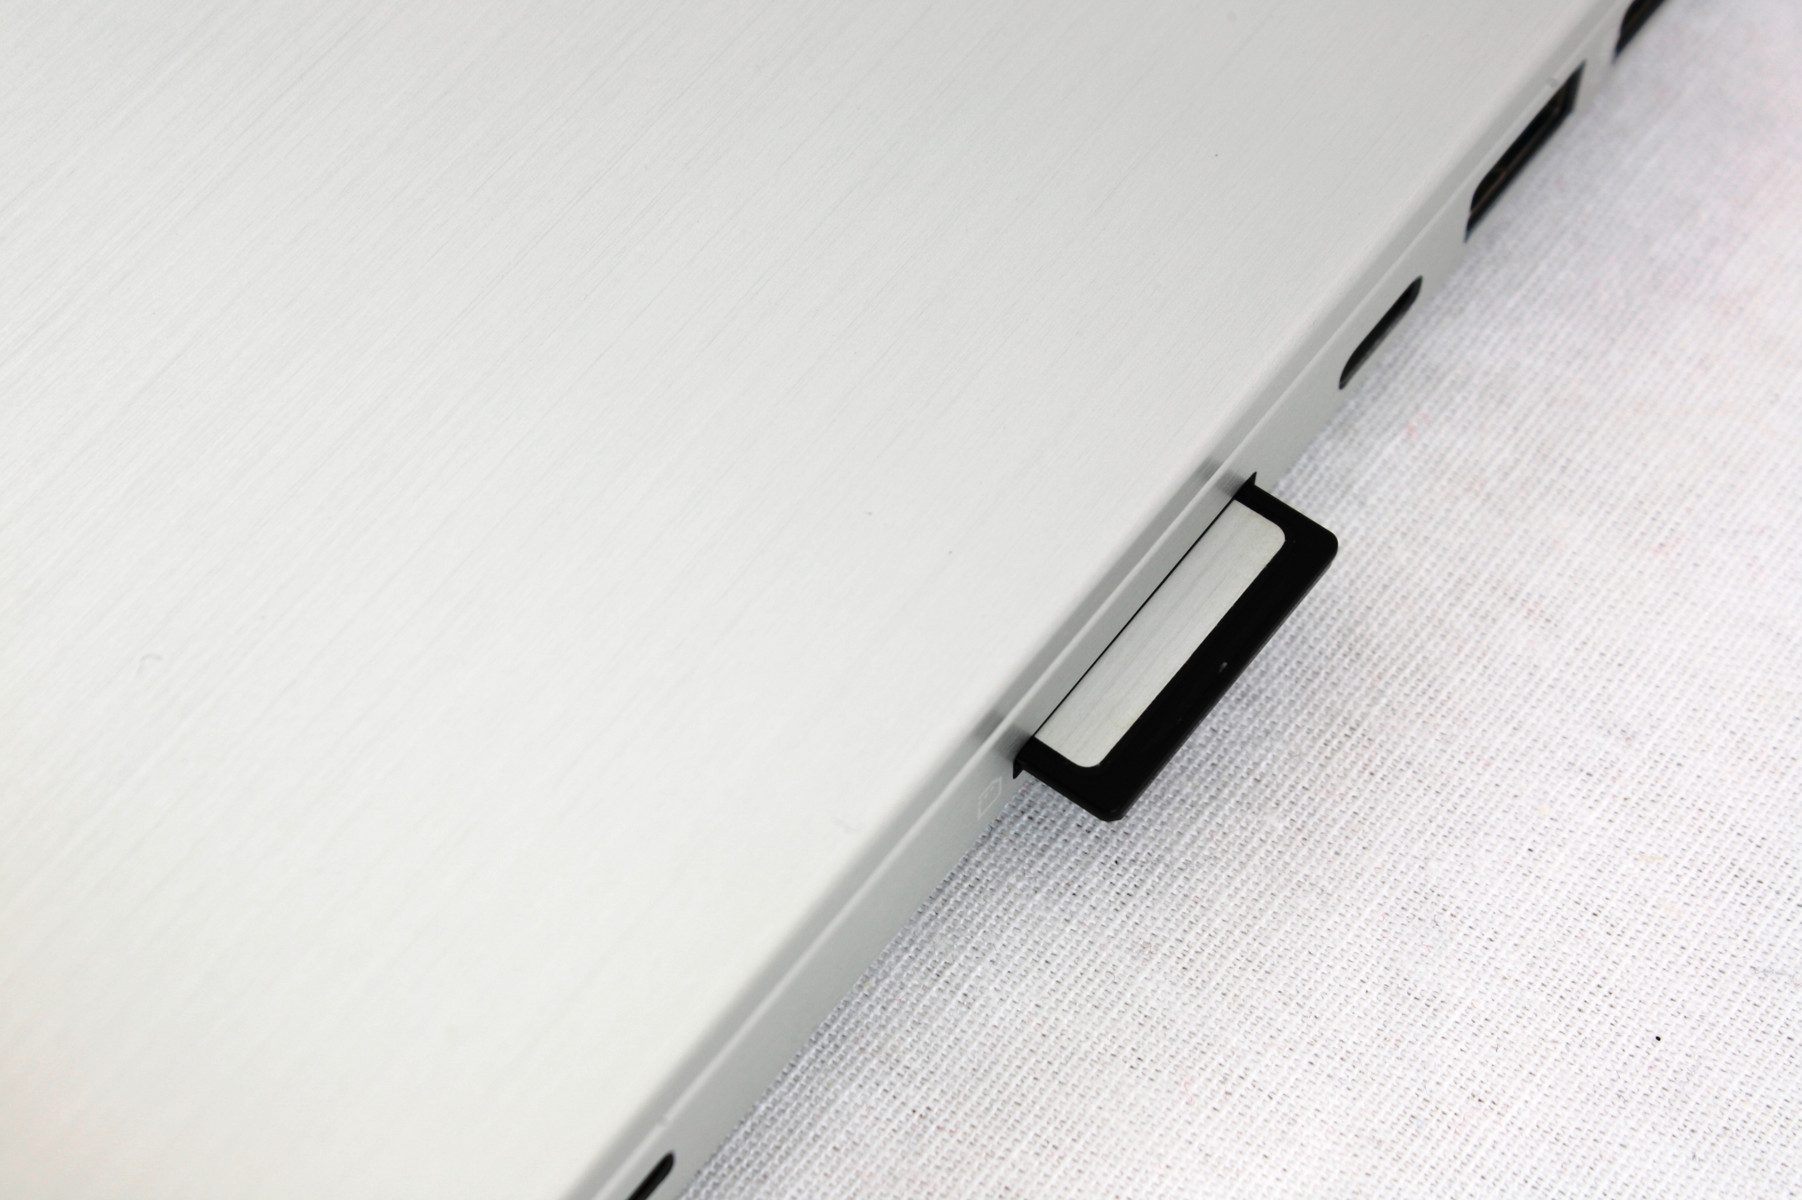
Transfer rates from the integrated spring-loaded card reader are very slow at around 25 MB/s only. Moving 1 GB worth of files from our UHS-II test card takes almost 50 seconds compared to just 6 seconds on the XPS 13 9370. It's disappointing to see MSI cut such a deep corner in this regard. Older MSI GS models like the GS63 were also equipped with super-slow card readers.
A fully inserted SD card still protrudes by about one-quarter of its total length.
| SD Card Reader | |
| average JPG Copy Test (av. of 3 runs) | |
| Dell XPS 13 9370 i7 UHD (Toshiba Exceria Pro UHS-II) | |
| Lenovo ThinkPad T480s-20L7002AUS (Toshiba Exceria Pro SDXC 64 GB UHS-II) | |
| MSI Prestige PS42 8RB-059 (Toshiba Exceria Pro SDXC 64 GB UHS-II) | |
| maximum AS SSD Seq Read Test (1GB) | |
| Dell XPS 13 9370 i7 UHD (Toshiba Exceria Pro UHS-II) | |
| Lenovo ThinkPad T480s-20L7002AUS (Toshiba Exceria Pro SDXC 64 GB UHS-II) | |
| MSI Prestige PS42 8RB-059 (Toshiba Exceria Pro SDXC 64 GB UHS-II) | |
Communication
The Intel 3168 module is capable of transfer rates of up to 433 Mbps or half of what the more popular Intel 8260 can do since it only carries a 1x1 antennae. While sufficient for home or office use, it's still a bummer that there are no proper 2x2 module options. Flagship Ultrabooks in the same price range typically carry faster WLAN modules as standard.
| Networking | |
| iperf3 transmit AX12 | |
| Huawei Matebook X Pro i5 | |
| Dell XPS 13 9370 i7 UHD | |
| MSI Prestige PS42 8RB-059 | |
| iperf3 receive AX12 | |
| Dell XPS 13 9370 i7 UHD | |
| Huawei Matebook X Pro i5 | |
| MSI Prestige PS42 8RB-059 | |
Accessories
Included extras are a Quick Start guide and a USB Type-A to RJ-45 adapter. Additional support for docking stations is limited since the system has no USB Type-C Gen. 2 or Thunderbolt ports.
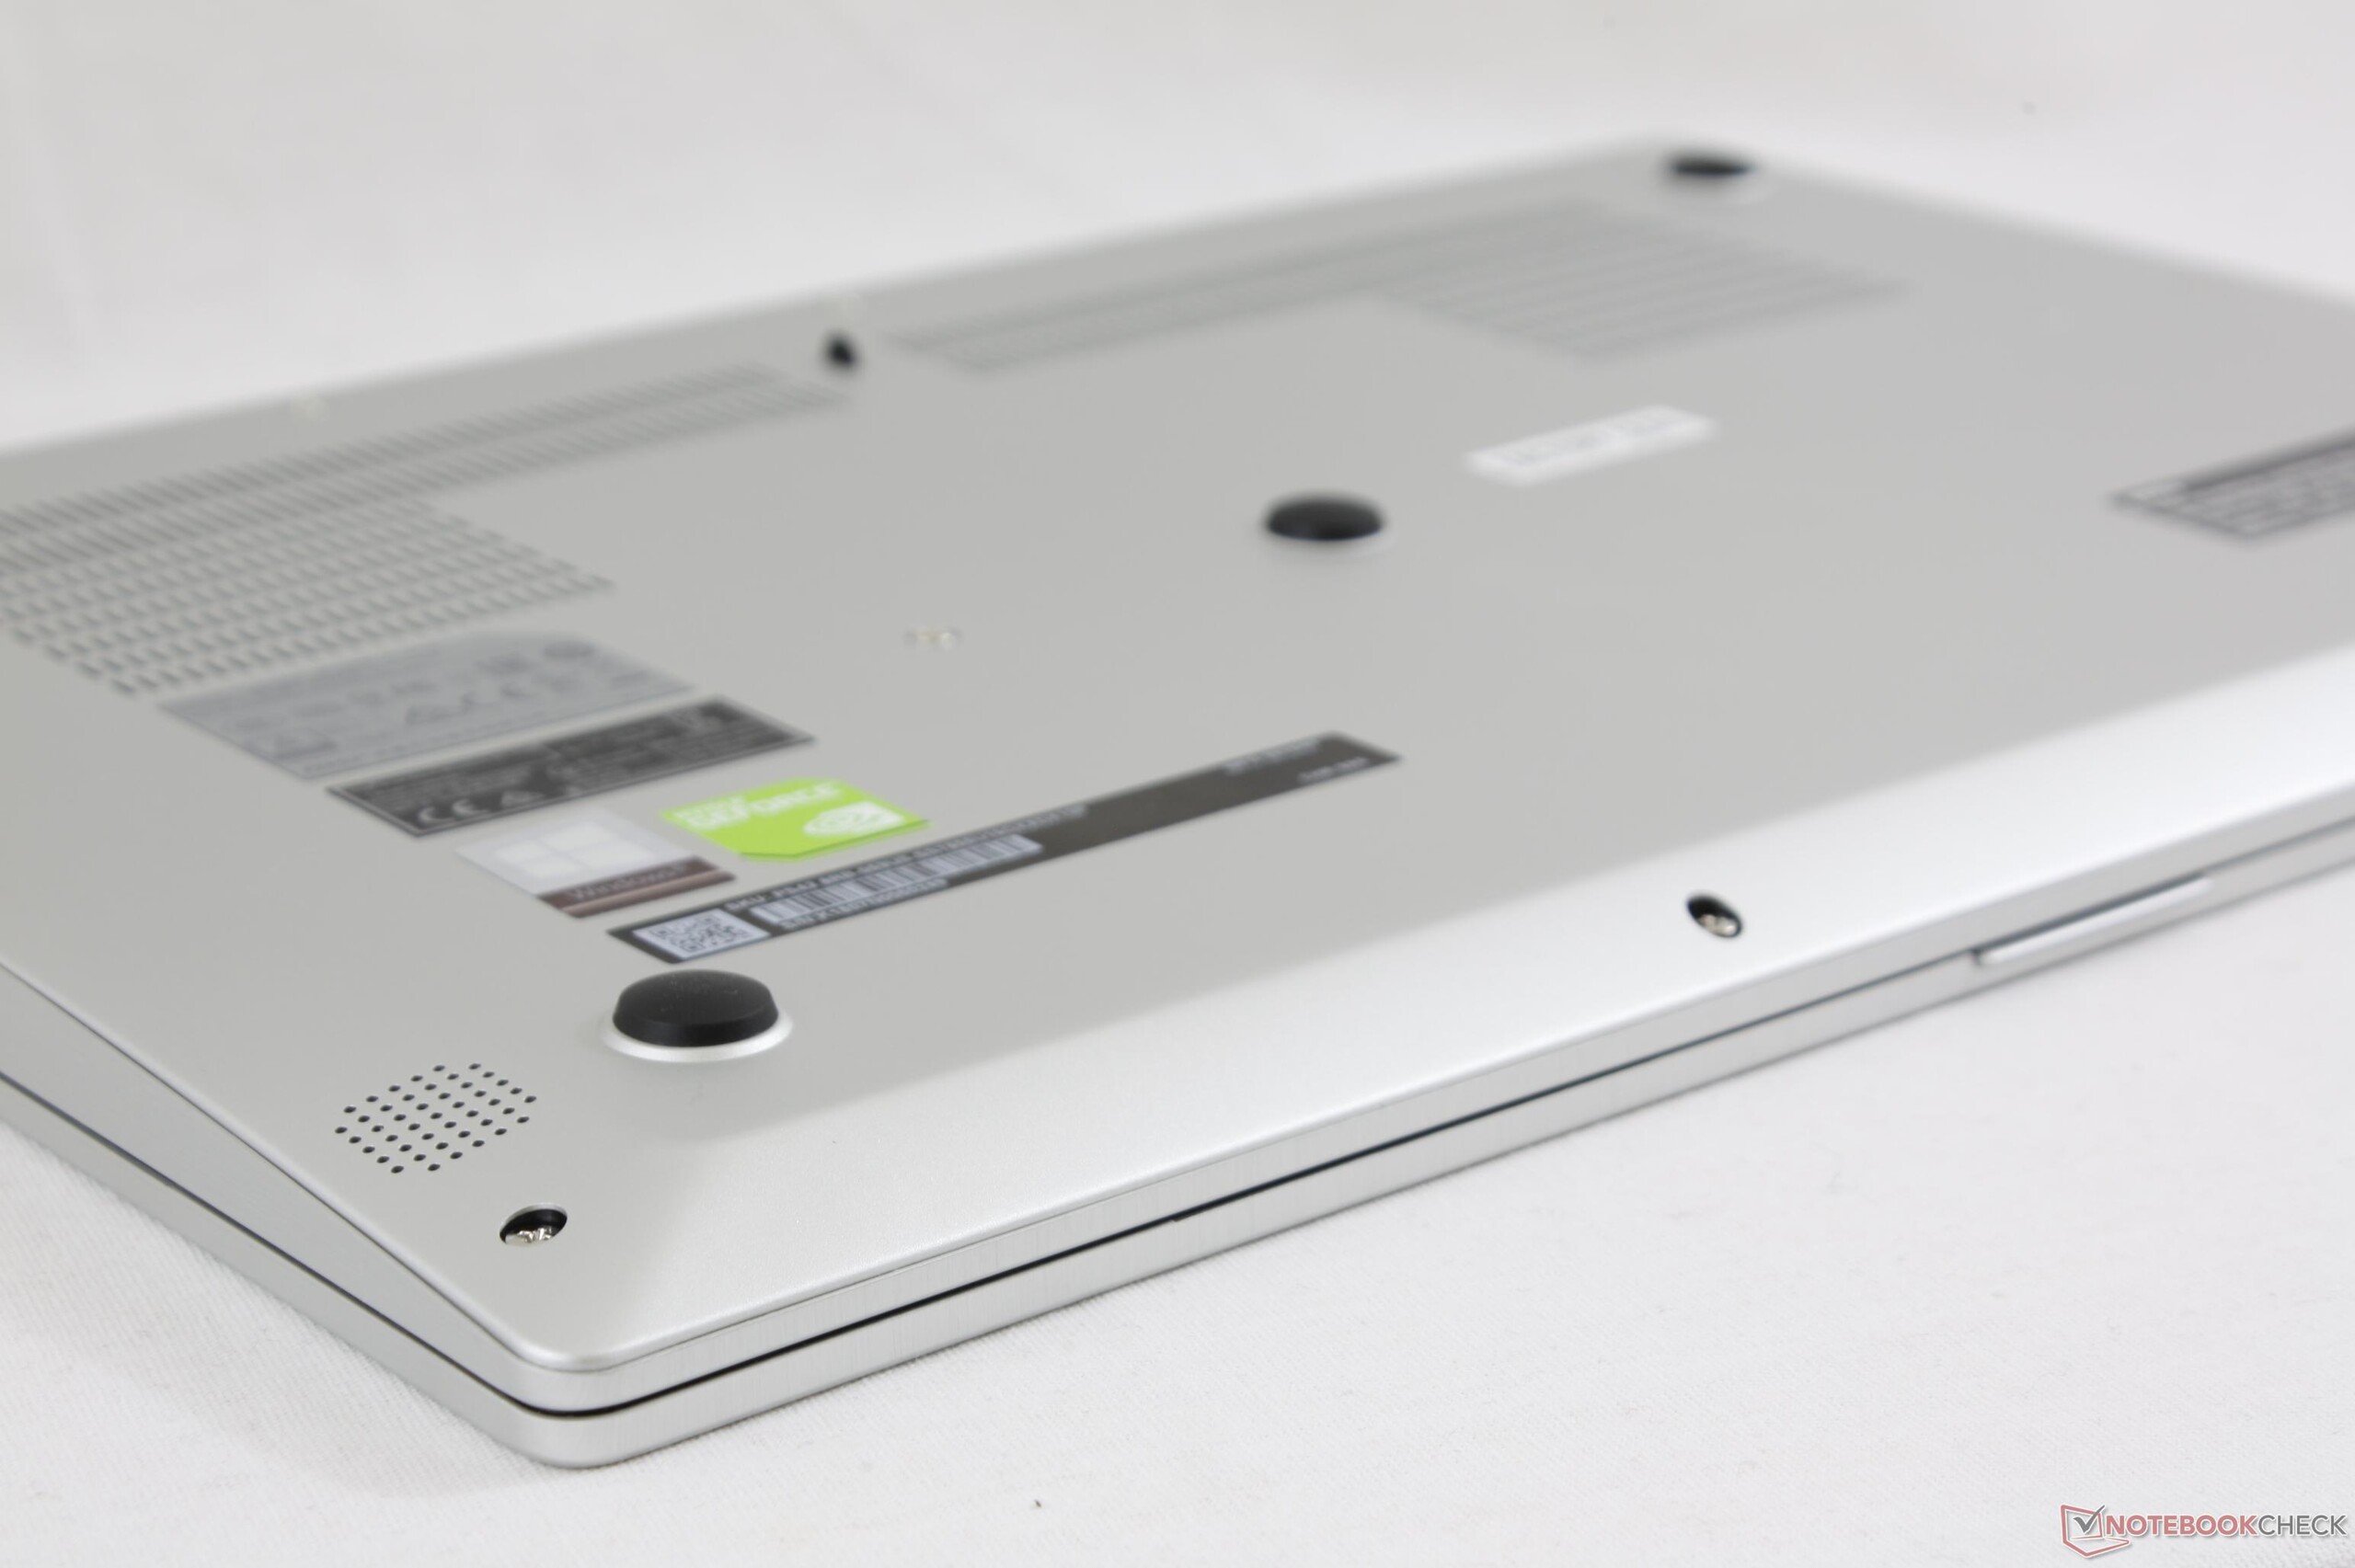
Maintenance
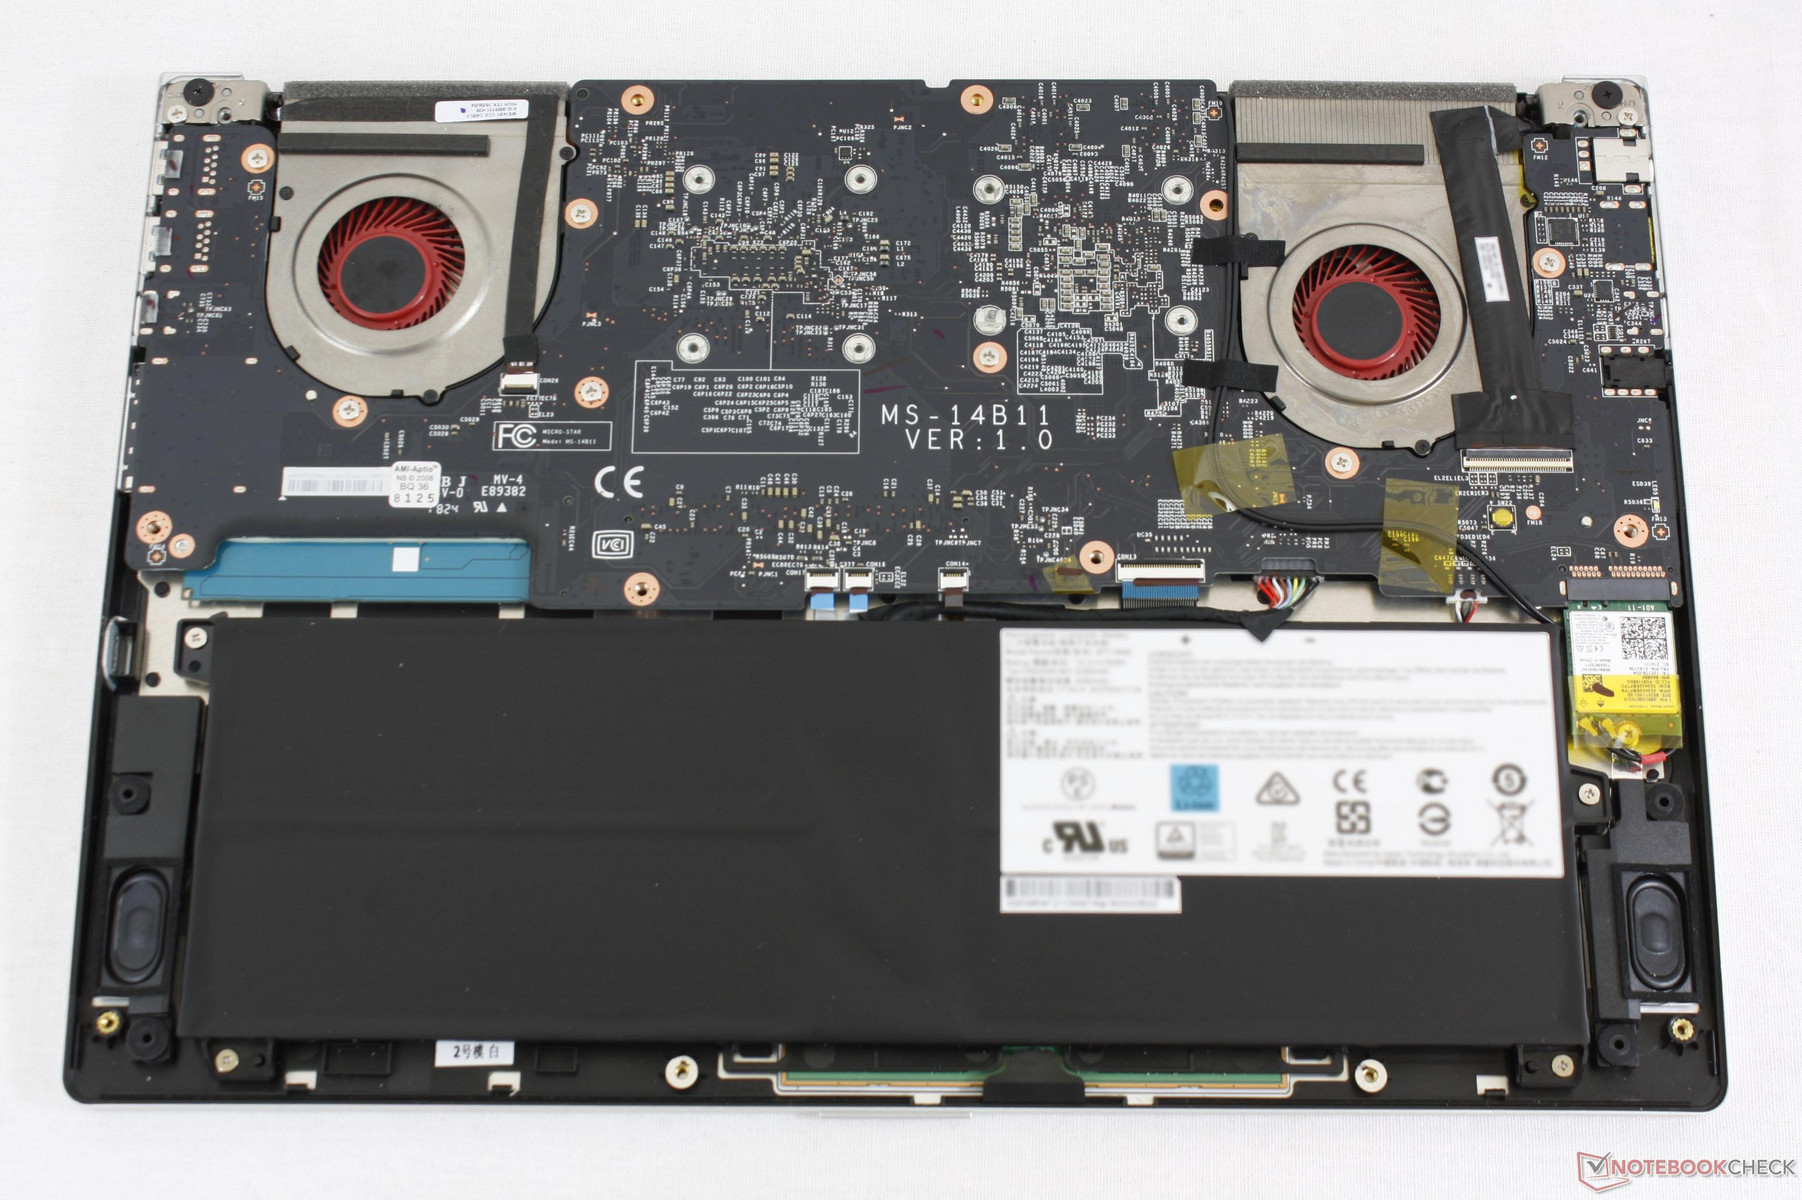
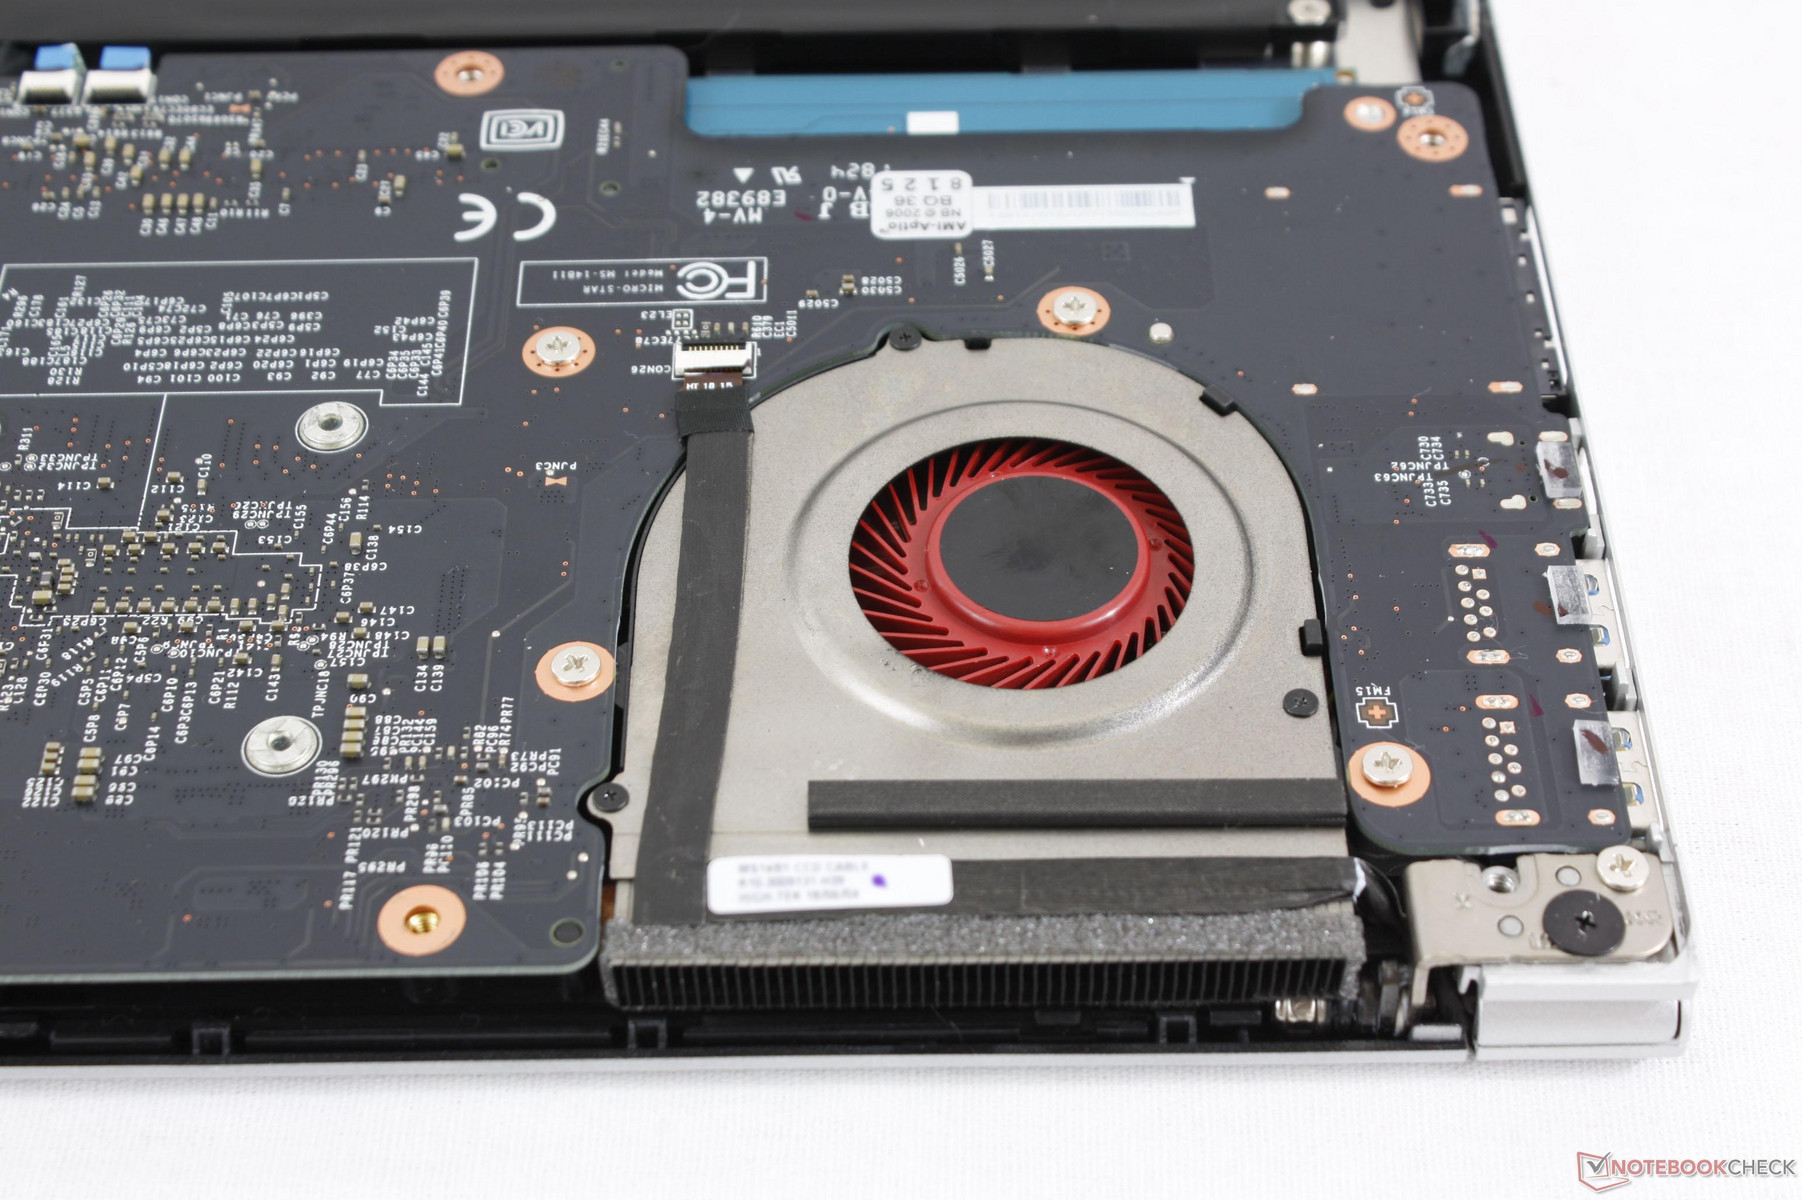
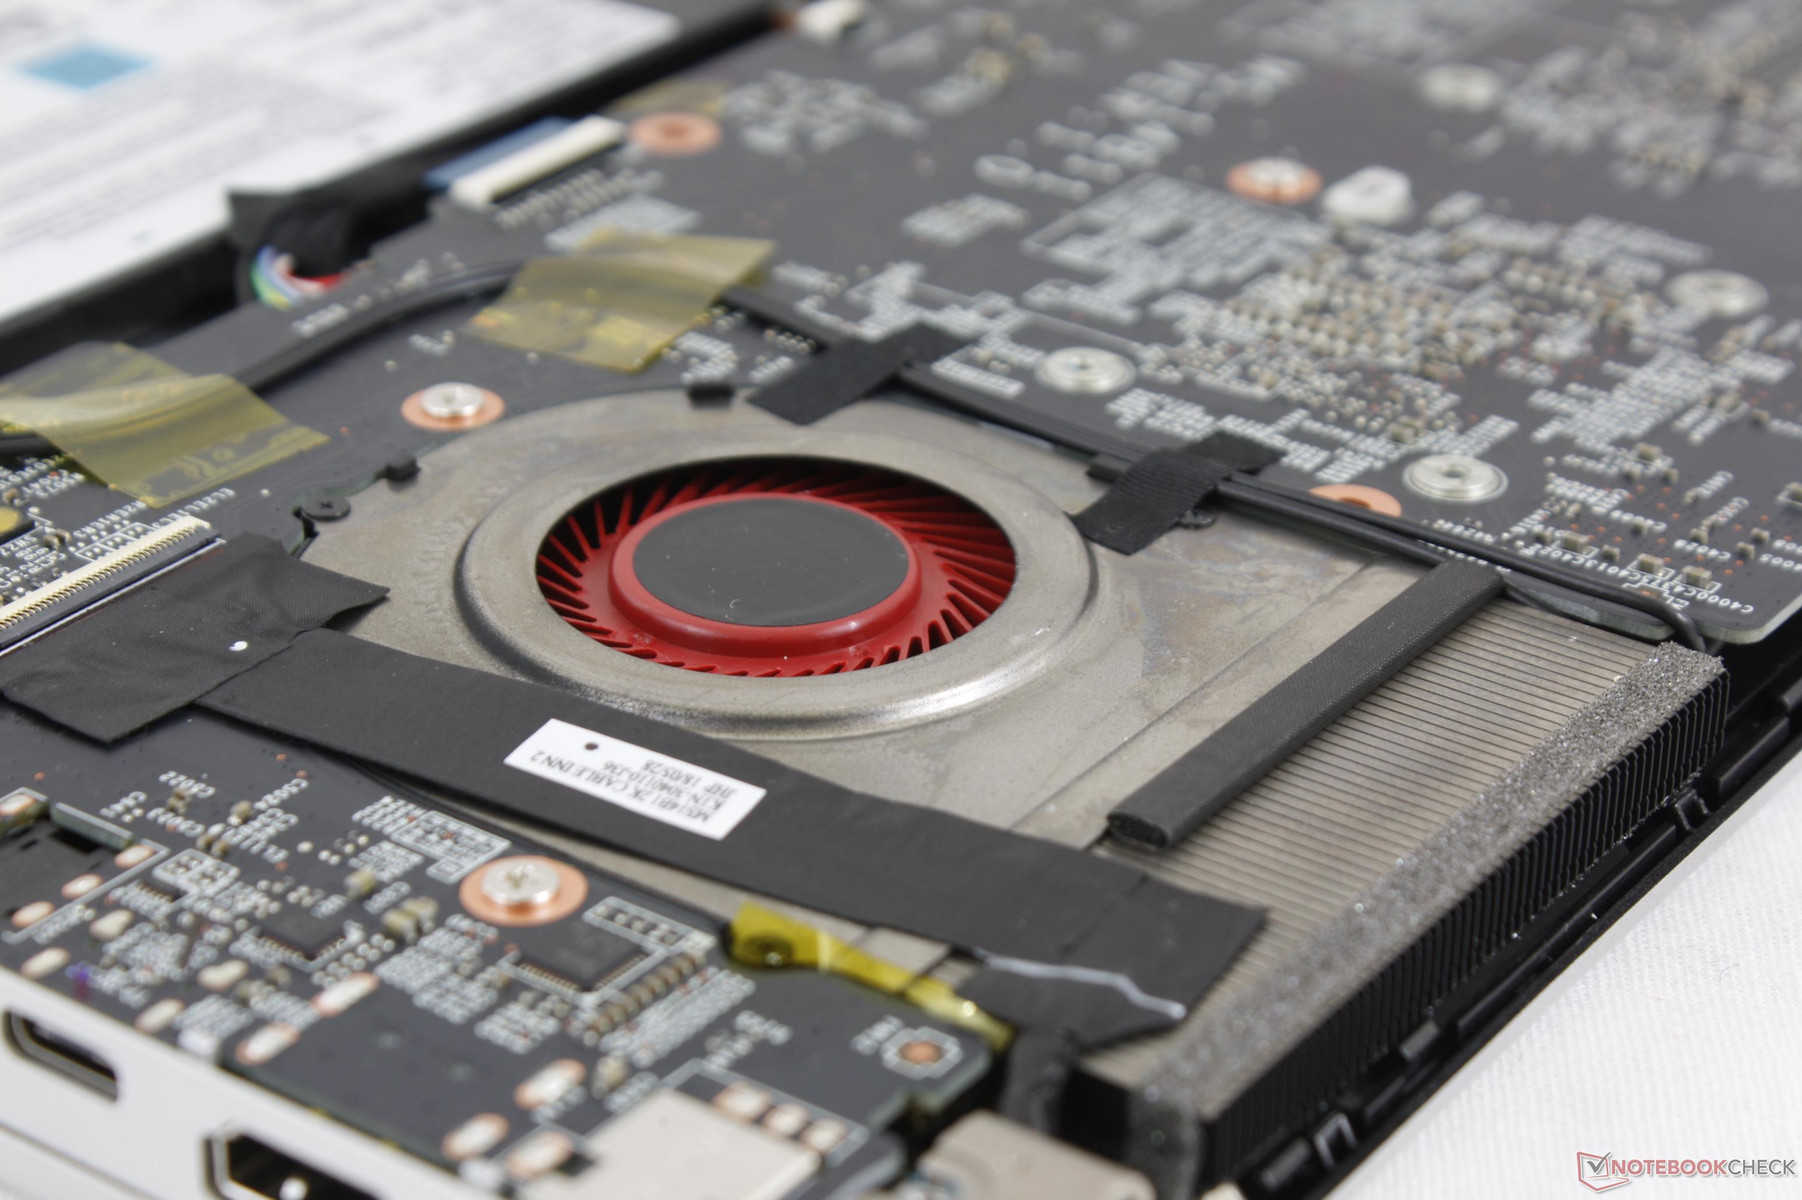
Serviceability is not as easy as we would like and users already familiar with the MSI GS73 or GS63 will notice a very familiar design when opening up the system. Though the bottom panel can be easily removed with just a Philips screwdriver, the motherboard is upside-down and so key components require additional disassembly. Things like RAM, storage, BIOS battery, and cooling are thus not easily accessible. The only easily serviceable components are the M.2 2232 WLAN module and internal battery.
Warranty
The standard one-year limited manufacturer warranty applies with extensions of up to another year. It's certainly not as comprehensive as what traditional OEMs like Dell, Lenovo, or HP have to offer. Please see our Guarantees, Return policies and Warranties FAQ for country-specific information.
Input Devices
Keyboard
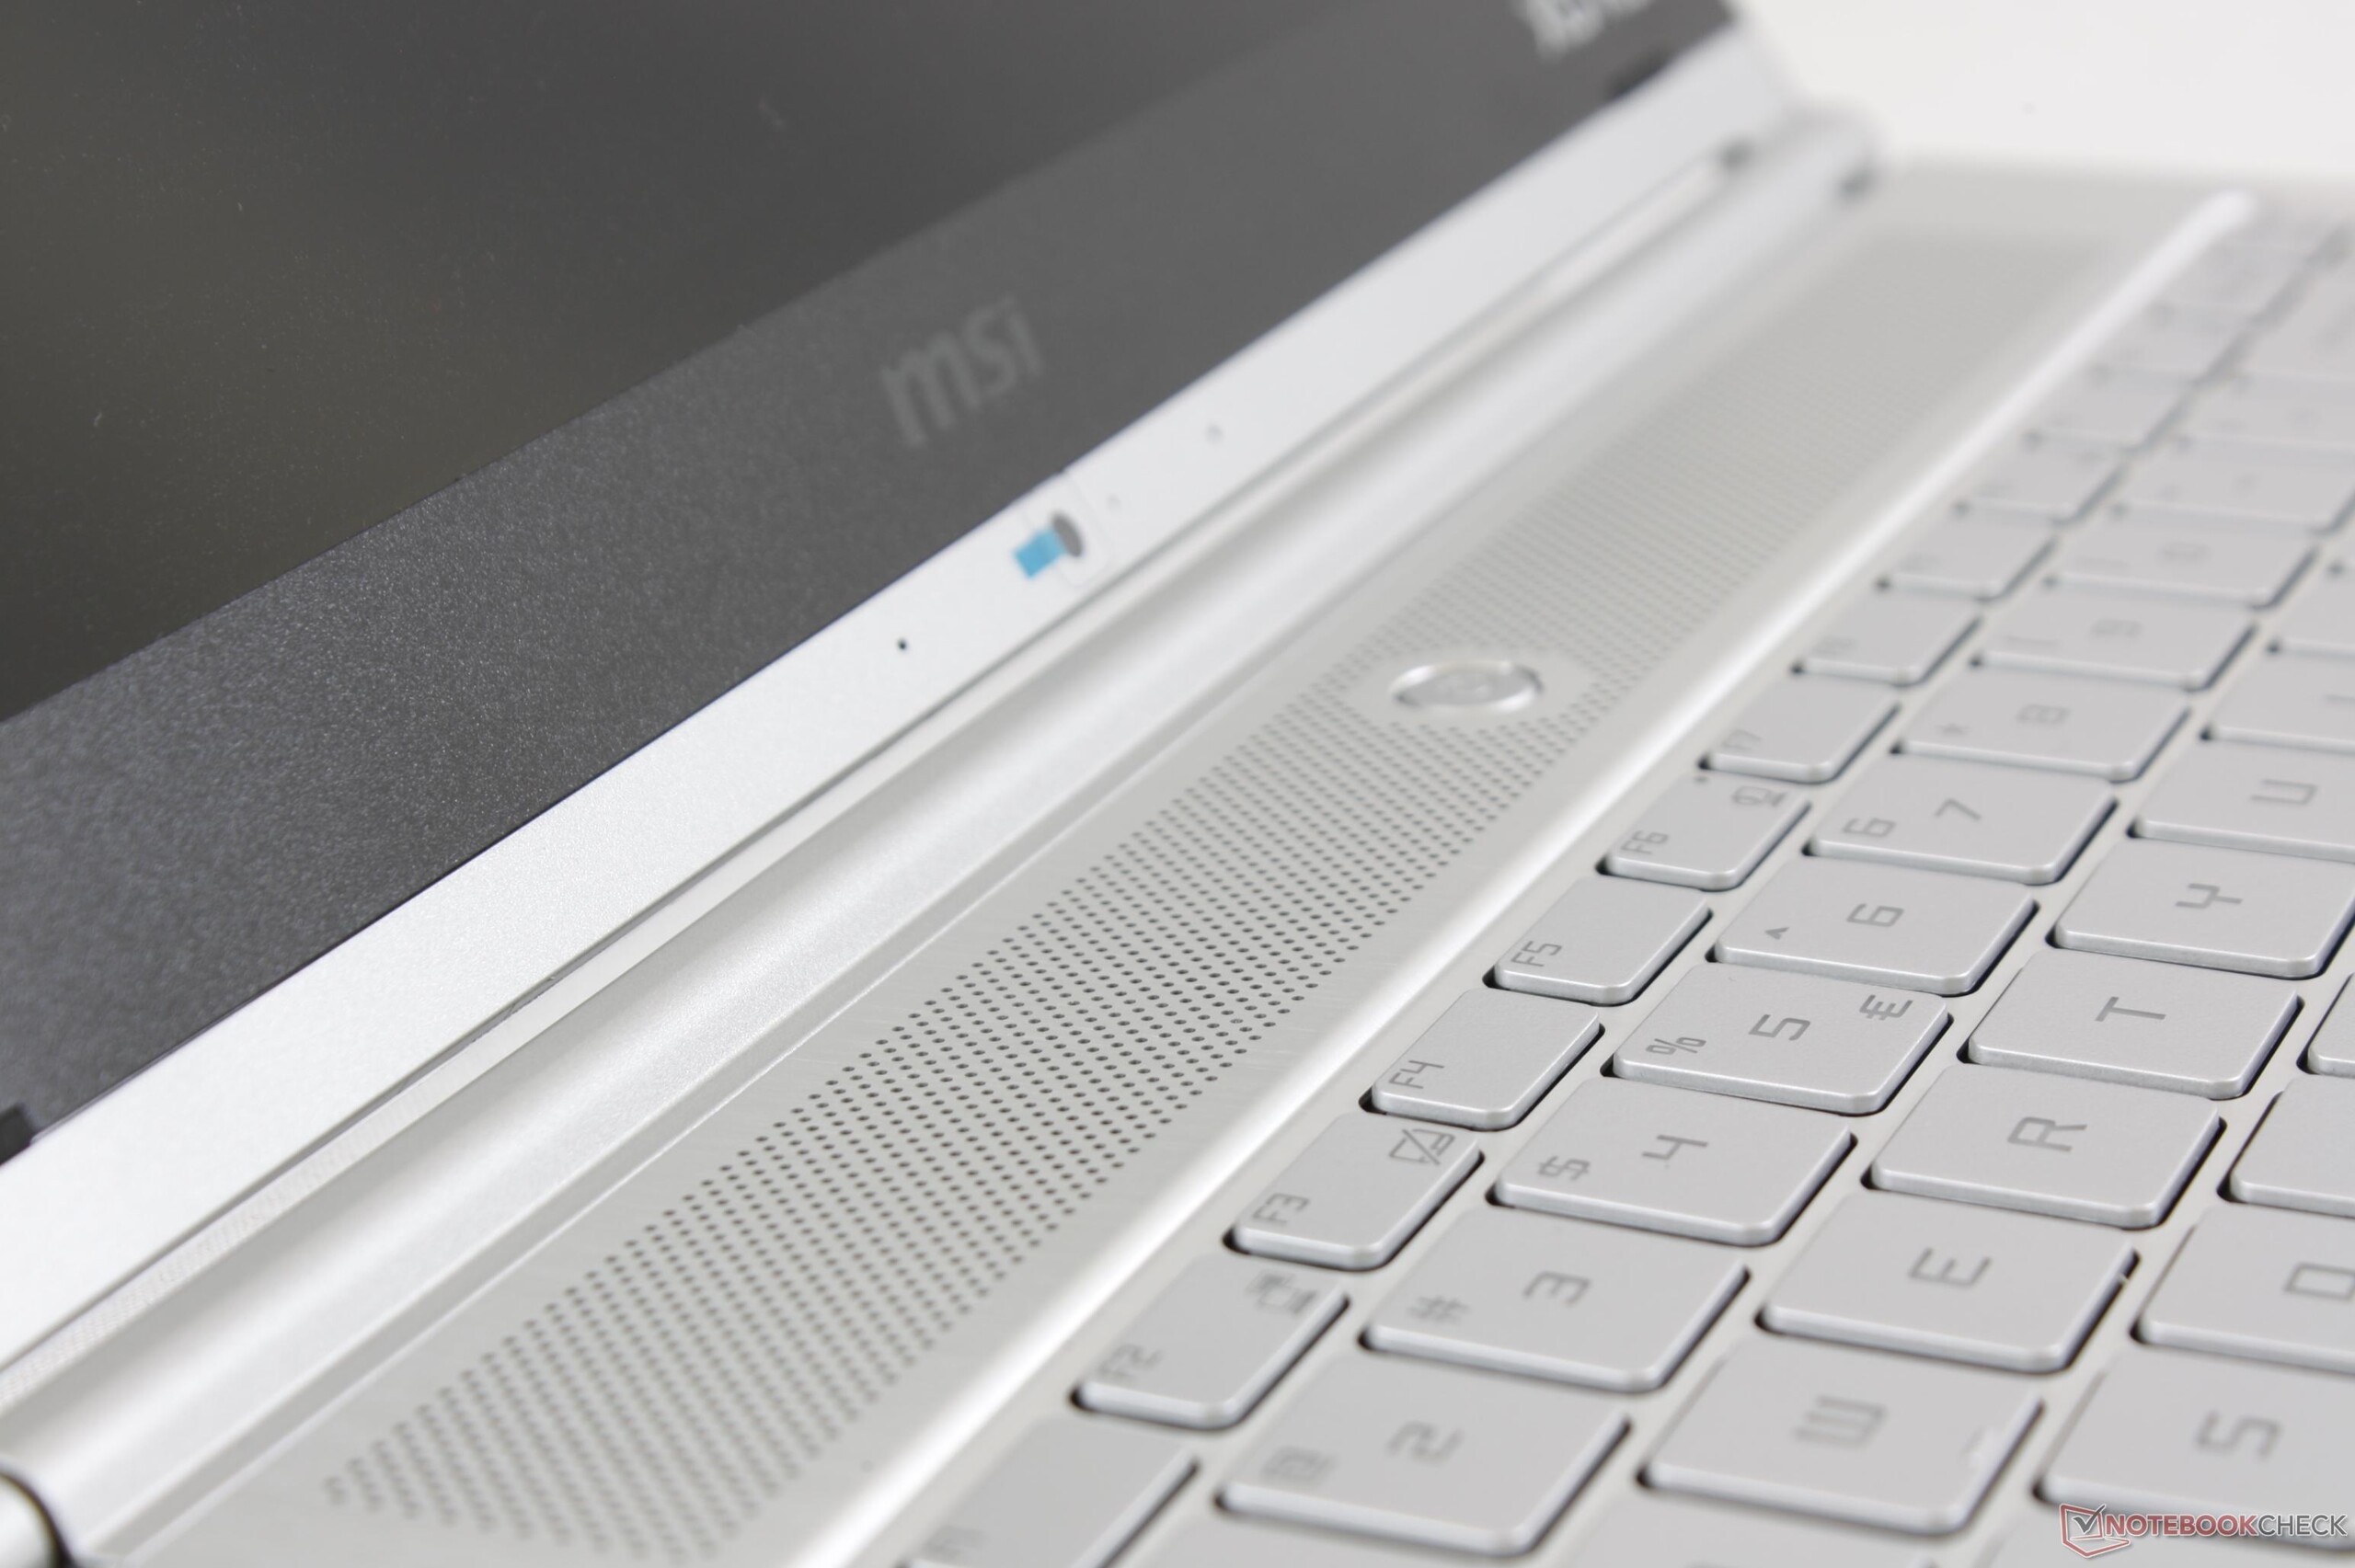
The chiclet keyboard is roomy (~30.0 x 10.5 cm) with large individual keys including the full-size Arrow keys. Unlike the MSI gaming G series, however, the PS42 does not use a SteelSeries keyboard. Its keys have noticeably shorter travel and a lighter tactile feel than the keyboards of the GS65 or GS73 as a result. The Space and Enter keys in particular feel very light and could have benefited from deeper travel or firmer feedback for a business laptop. Clatter is otherwise relatively quiet.
The white backlight has four levels of illumination. Depending on the ambient lighting, the letter printing on the keys can be difficult to see because they do not contrast well with the white-silver color scheme. Pushing down on the center of the keyboard will warp it slightly to suggest that key feedback could have been firmer if the chassis was more rigid.
Touchpad
The Precision trackpad (~10.0 x 5.8 cm) integrates a fingerprint reader on the corner whereas the latest Ultrabooks are integrating the fingerprint reader directly onto the Power button itself for convenience. Glide is smooth and cursor control is reliable without any issues. Surface area is smaller than on the XPS 13 (10.5 x 6.0 cm) and MateBook X Pro (12.0 x 7.8 cm) and so multi-touch gestures can feel cramped.
The integrated mouse keys along the bottom edge have shallow and spongy travel and a high-pitched audible click when fully pressed. It takes quite a bit of force to input a click and so rapid clicks can be difficult. It's a mediocre implementation at best.
Display
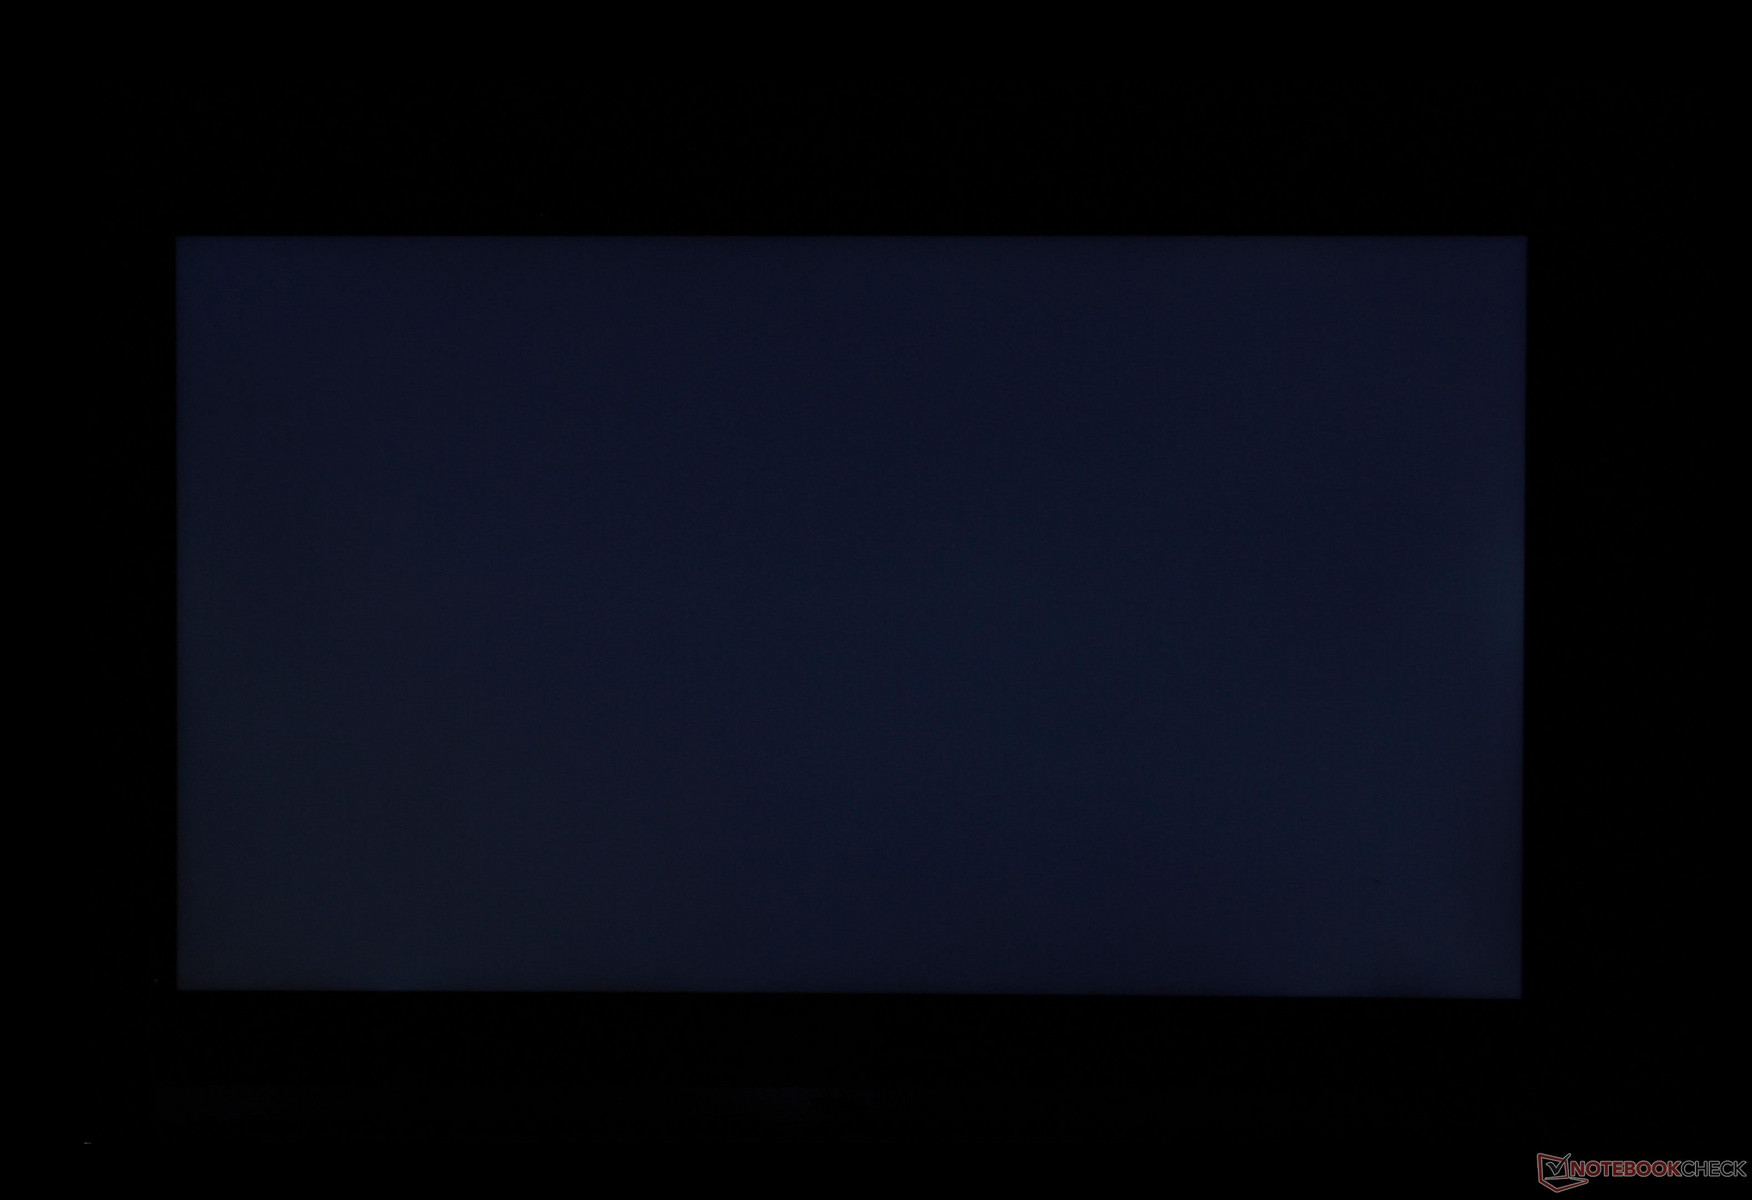
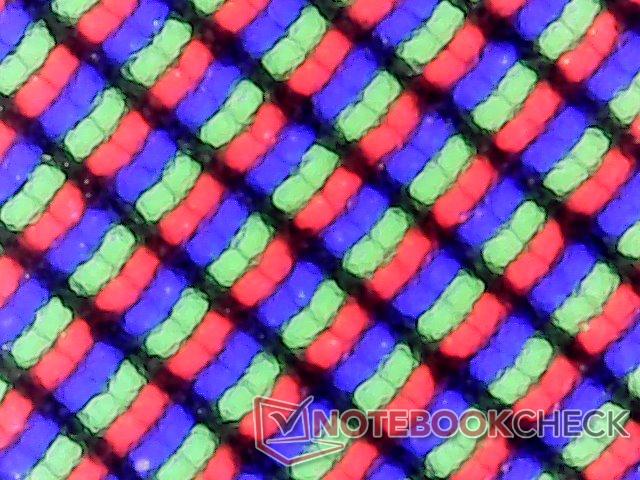
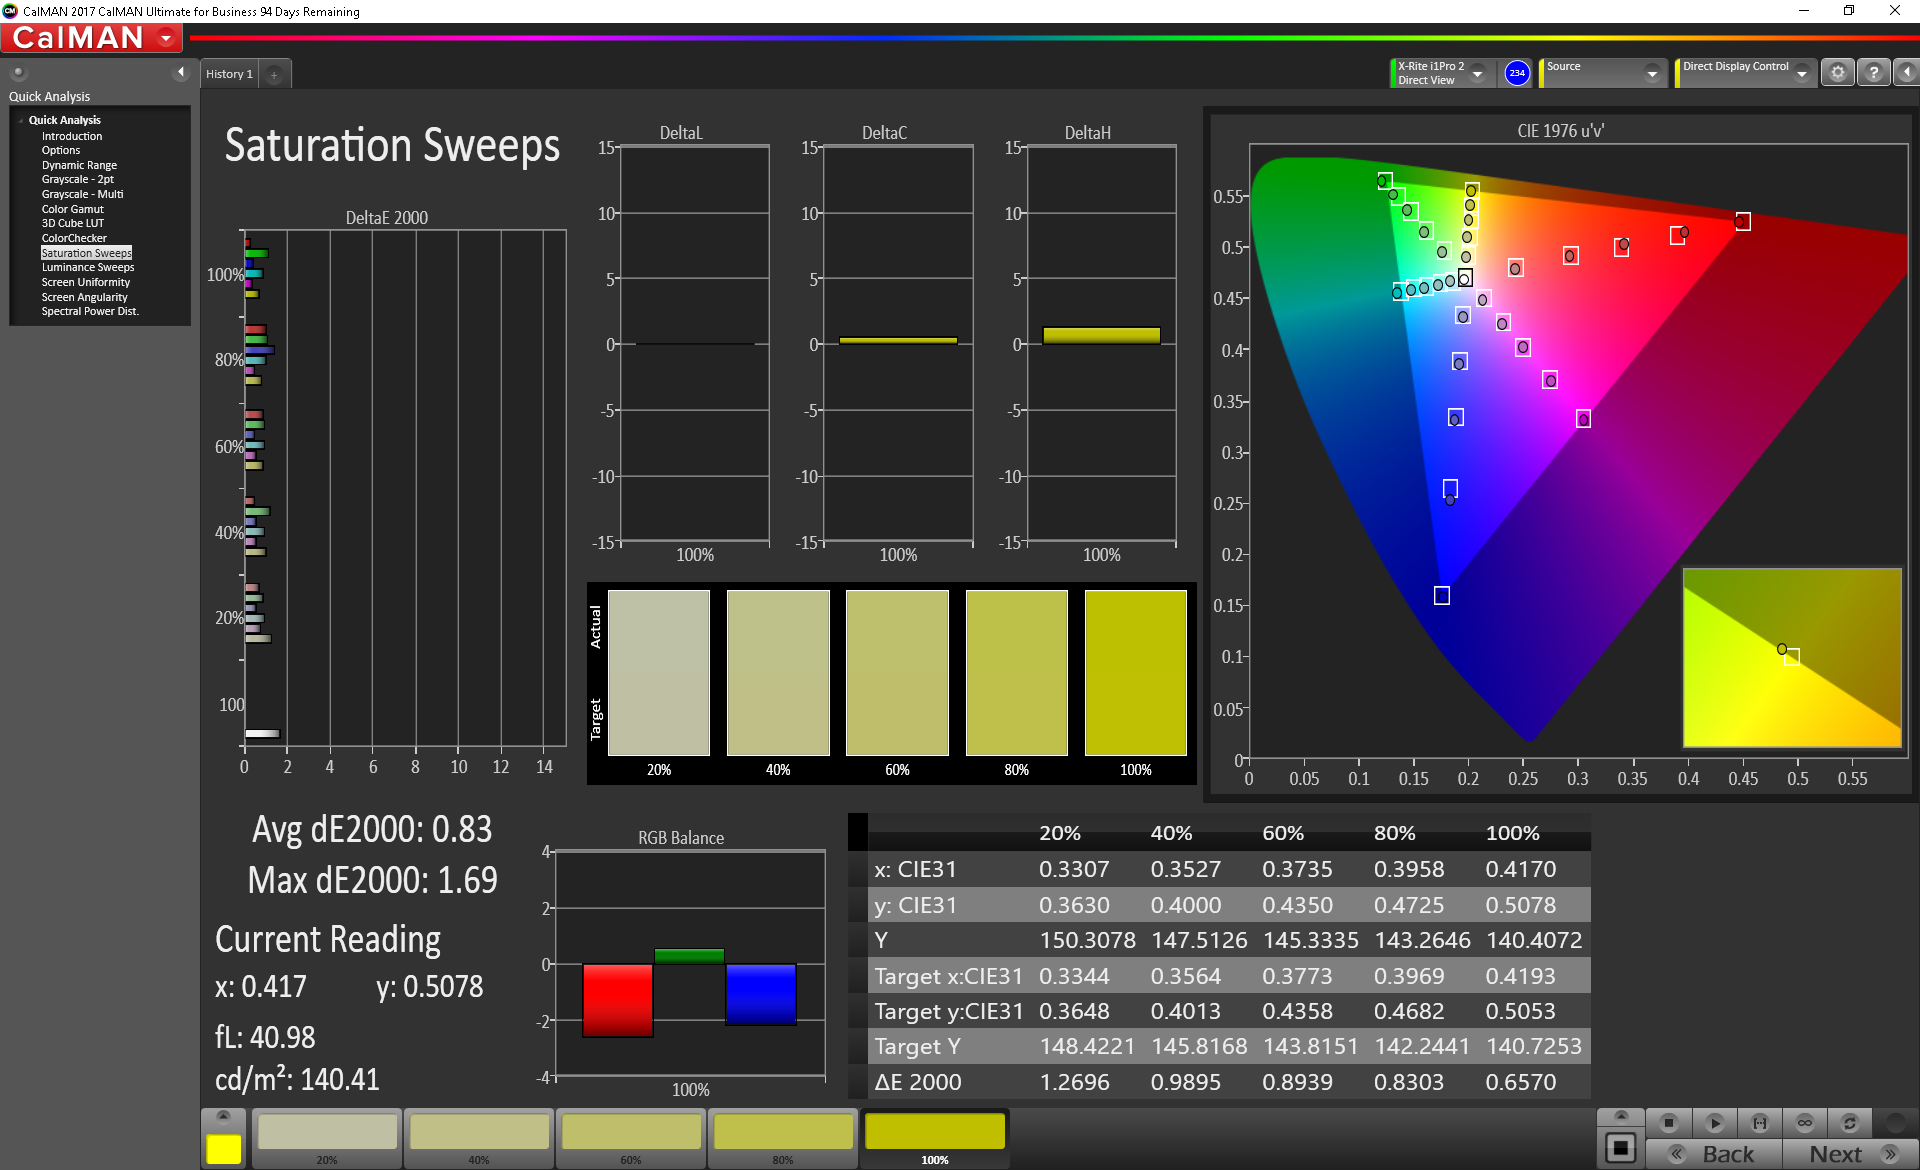
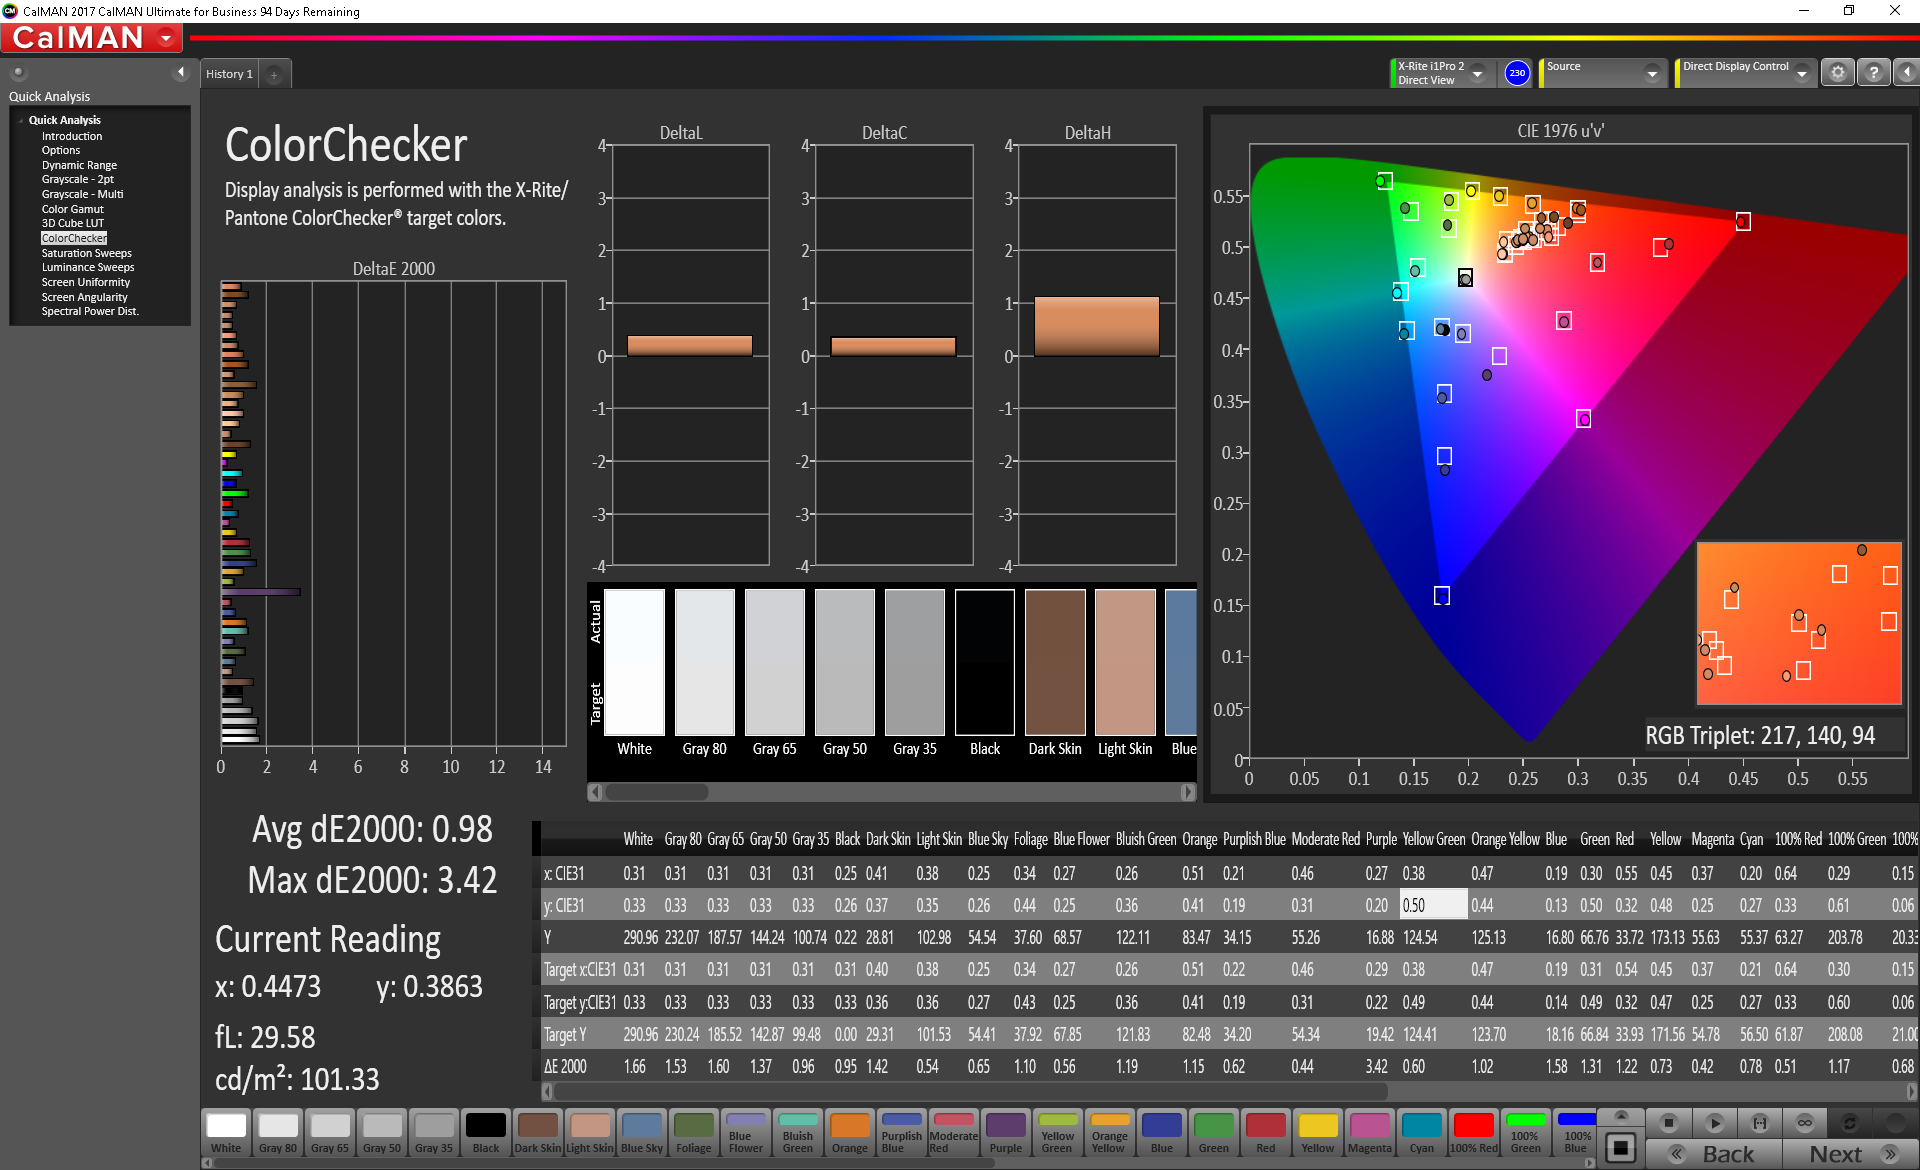
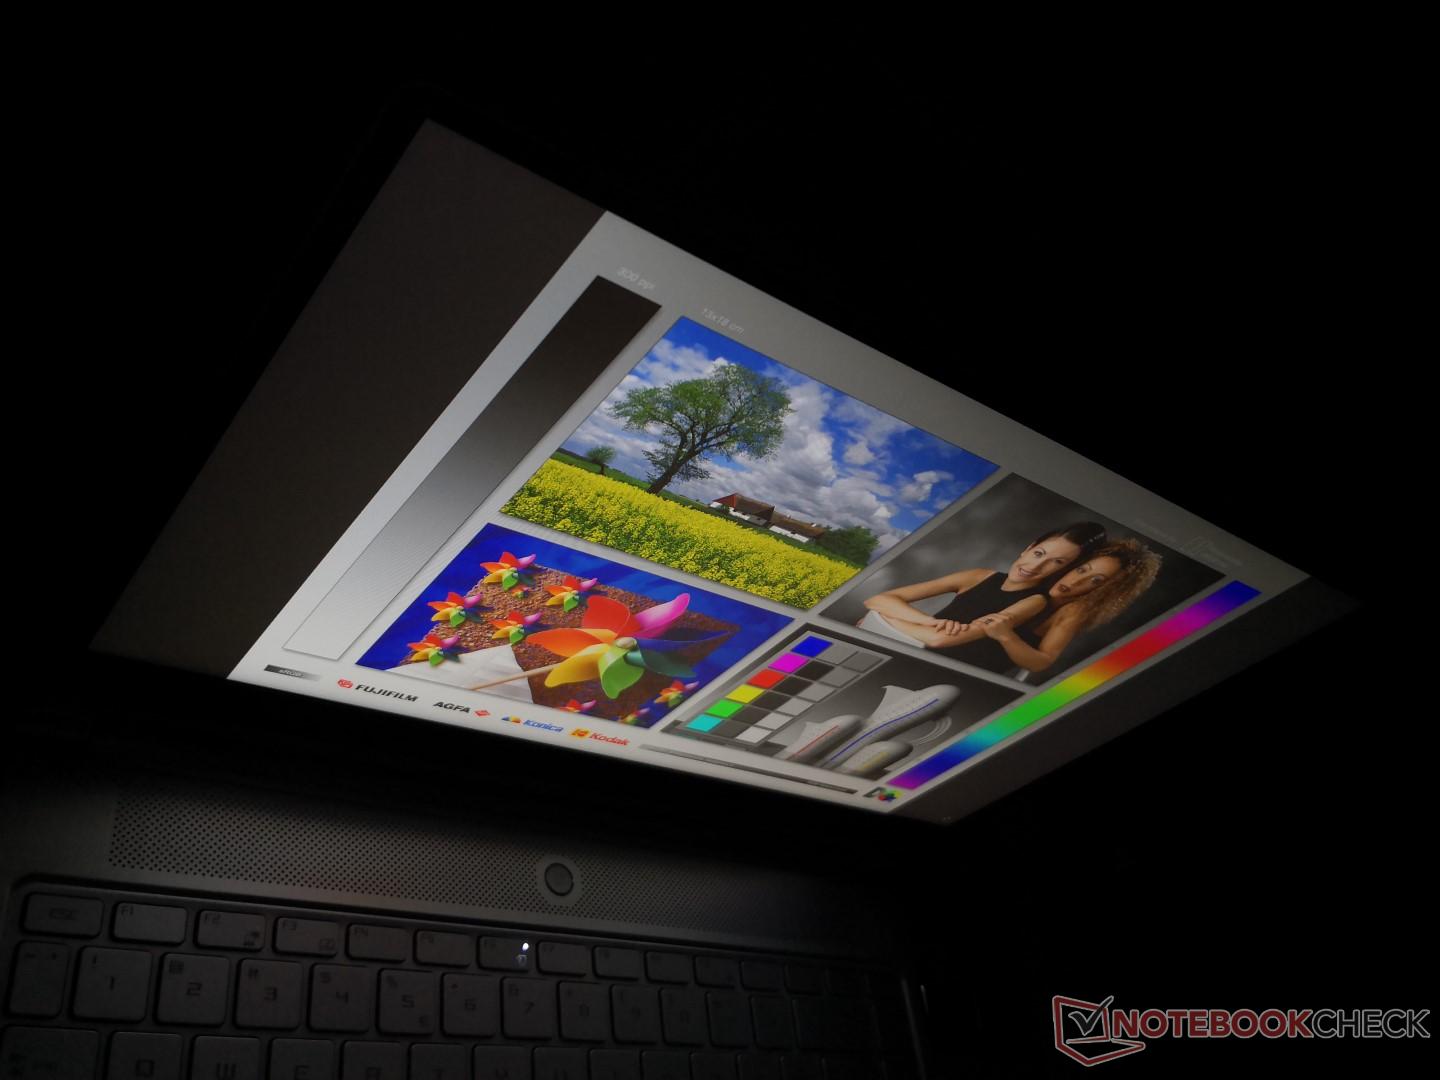
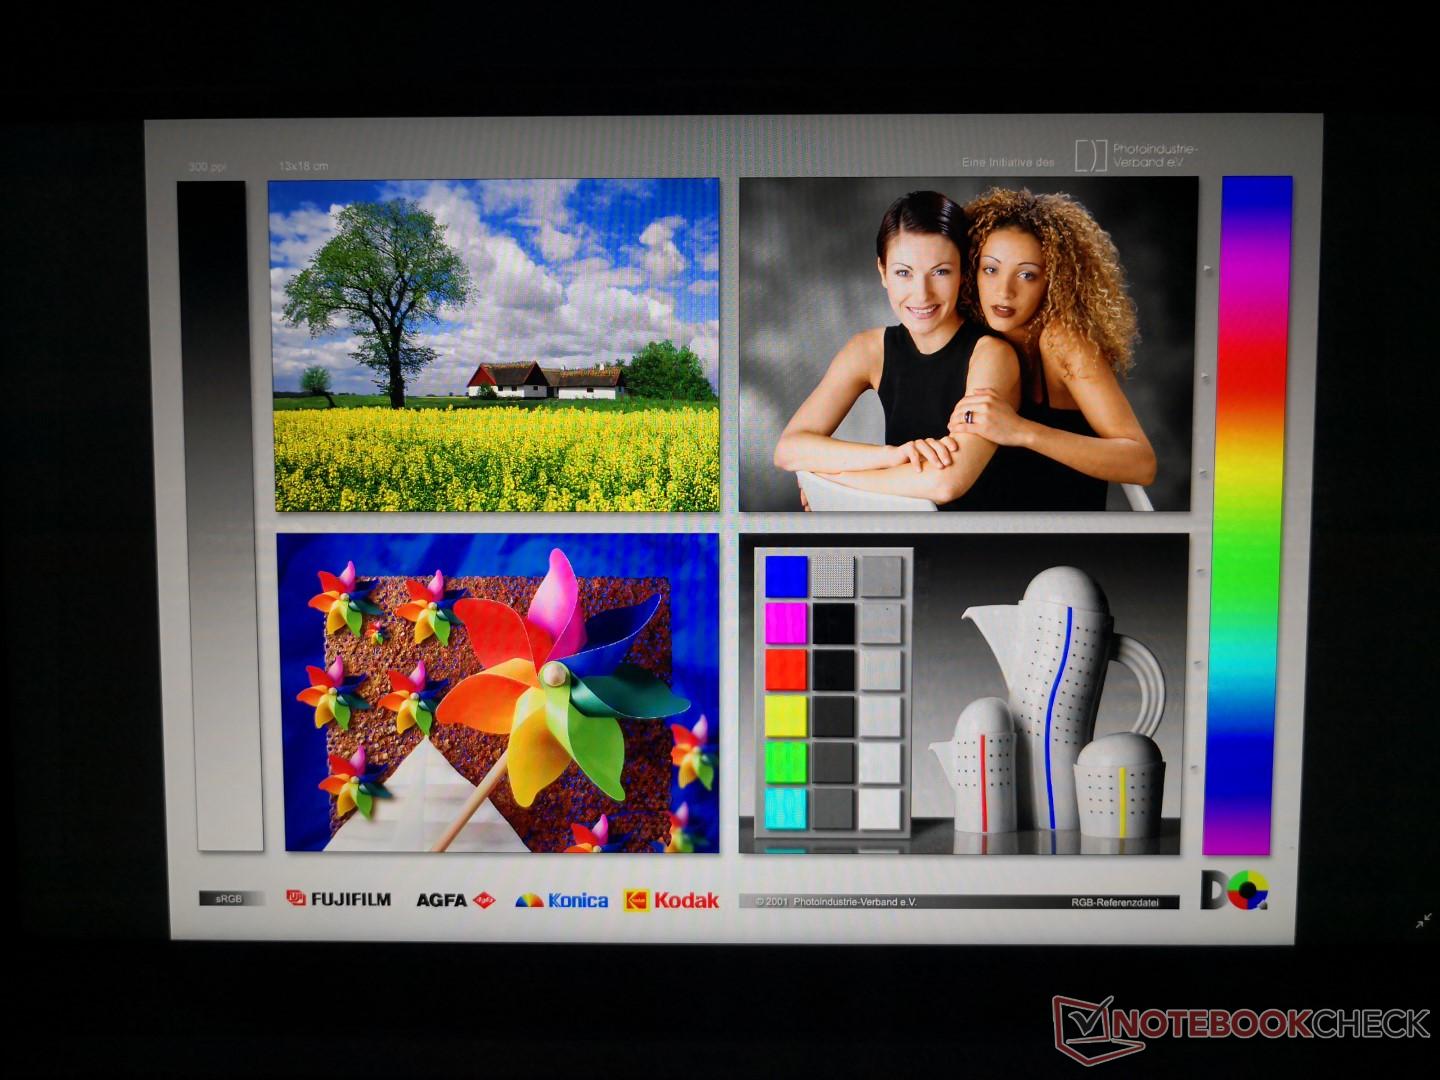
The narrow-bezel matte 1080p display is one of the best aspects about the PS42. Content appears crisp like a glossy screen without most of the color grains that often plague matte panels. Contrast is respectable at almost 1000:1 and colors are both deep and extraordinarily accurate. Our impressions are similar to those for the Zenbook UX3410UA since both systems utilize Chi Mei N140HCE IPS panels.
A couple of features prevent the PS42 from having the "perfect" display. First, the backlight is noticeably dimmer than many of its closest competitors including the Matebook X Pro, HP Spectre x360 13, and the aforementioned Zenbook UX3410UA. Secondly, pulse-width modulation is present on very low brightness levels that can affect users sensitive to onscreen flickering.
| |||||||||||||||||||||||||
Brightness Distribution: 86 %
Center on Battery: 285.4 cd/m²
Contrast: 921:1 (Black: 0.31 cd/m²)
ΔE ColorChecker Calman: 1 | ∀{0.5-29.43 Ø4.73}
calibrated: 0.98
ΔE Greyscale Calman: 1.4 | ∀{0.09-98 Ø4.97}
98.91% sRGB (Argyll 1.6.3 3D)
63.82% AdobeRGB 1998 (Argyll 1.6.3 3D)
69.6% AdobeRGB 1998 (Argyll 3D)
98.6% sRGB (Argyll 3D)
67.5% Display P3 (Argyll 3D)
Gamma: 2.25
CCT: 6699 K
| MSI Prestige PS42 8RB-059 CMN N140HCE-EN2, IPS, 14", 1920x1080 | Dell XPS 13 9370 i7 UHD ID: Sharp SHP148B, Name: LQ133D1, Dell P/N: 8XDHY, IPS, 13.3", 3840x2160 | Huawei Matebook X Pro i5 Tianma XM, IPS, 13.9", 3000x2000 | Lenovo ThinkPad T480s-20L7002AUS NV140FHM-N46, TFT-LCD, 14", 1920x1080 | Asus Zenbook UX3430UN-GV174T Chi Mei CMN14D2 / N140HCE-EN1, IPS, 14", 1920x1080 | HP Spectre x360 13t-ae000 LGD0588, IPS, 13.3", 3840x2160 | |
|---|---|---|---|---|---|---|
| Display | 1% | -3% | -41% | -2% | 4% | |
| Display P3 Coverage (%) | 67.5 | 68.9 2% | 65.9 -2% | 39.69 -41% | 65.6 -3% | 71.9 7% |
| sRGB Coverage (%) | 98.6 | 98.4 0% | 95.2 -3% | 59.2 -40% | 97.4 -1% | 98.1 -1% |
| AdobeRGB 1998 Coverage (%) | 69.6 | 69.5 0% | 67.6 -3% | 41 -41% | 67.8 -3% | 73.1 5% |
| Response Times | -90% | -10% | -33% | 6% | -41% | |
| Response Time Grey 50% / Grey 80% * (ms) | 34.4 ? | 69.6 ? -102% | 40.4 ? -17% | 44 ? -28% | 30 ? 13% | 51.6 ? -50% |
| Response Time Black / White * (ms) | 24.8 ? | 44 ? -77% | 25.6 ? -3% | 34 ? -37% | 25 ? -1% | 32.4 ? -31% |
| PWM Frequency (Hz) | 25000 ? | 3759 ? | 990 | |||
| Screen | -29% | -61% | -149% | -77% | -16% | |
| Brightness middle (cd/m²) | 285.4 | 478.5 68% | 442.7 55% | 288.3 1% | 377 32% | 329.8 16% |
| Brightness (cd/m²) | 269 | 466 73% | 428 59% | 281 4% | 339 26% | 318 18% |
| Brightness Distribution (%) | 86 | 86 0% | 84 -2% | 86 0% | 76 -12% | 74 -14% |
| Black Level * (cd/m²) | 0.31 | 0.43 -39% | 0.31 -0% | 0.21 32% | 0.4 -29% | 0.25 19% |
| Contrast (:1) | 921 | 1113 21% | 1428 55% | 1373 49% | 943 2% | 1319 43% |
| Colorchecker dE 2000 * | 1 | 3.09 -209% | 2.24 -124% | 6.16 -516% | 3.33 -233% | 2.37 -137% |
| Colorchecker dE 2000 max. * | 3.65 | 5.94 -63% | 7.19 -97% | 18.99 -420% | 8.02 -120% | 4.08 -12% |
| Colorchecker dE 2000 calibrated * | 0.98 | 2.06 -110% | 1.11 -13% | 4.51 -360% | 3.5 -257% | |
| Greyscale dE 2000 * | 1.4 | 2.4 -71% | 9.7 -593% | 6.3 -350% | 4.89 -249% | 2.8 -100% |
| Gamma | 2.25 98% | 2.063 107% | 1.42 155% | 2.517 87% | 2.37 93% | 2.145 103% |
| CCT | 6699 97% | 6883 94% | 6227 104% | 6886 94% | 7620 85% | 6441 101% |
| Color Space (Percent of AdobeRGB 1998) (%) | 63.82 | 69.47 9% | 61.6 -3% | 37.67 -41% | 62 -3% | 67 5% |
| Color Space (Percent of sRGB) (%) | 98.91 | 98.36 -1% | 95 -4% | 58.9 -40% | 98 -1% | 98 -1% |
| Total Average (Program / Settings) | -39% /
-31% | -25% /
-43% | -74% /
-114% | -24% /
-52% | -18% /
-16% |
* ... smaller is better
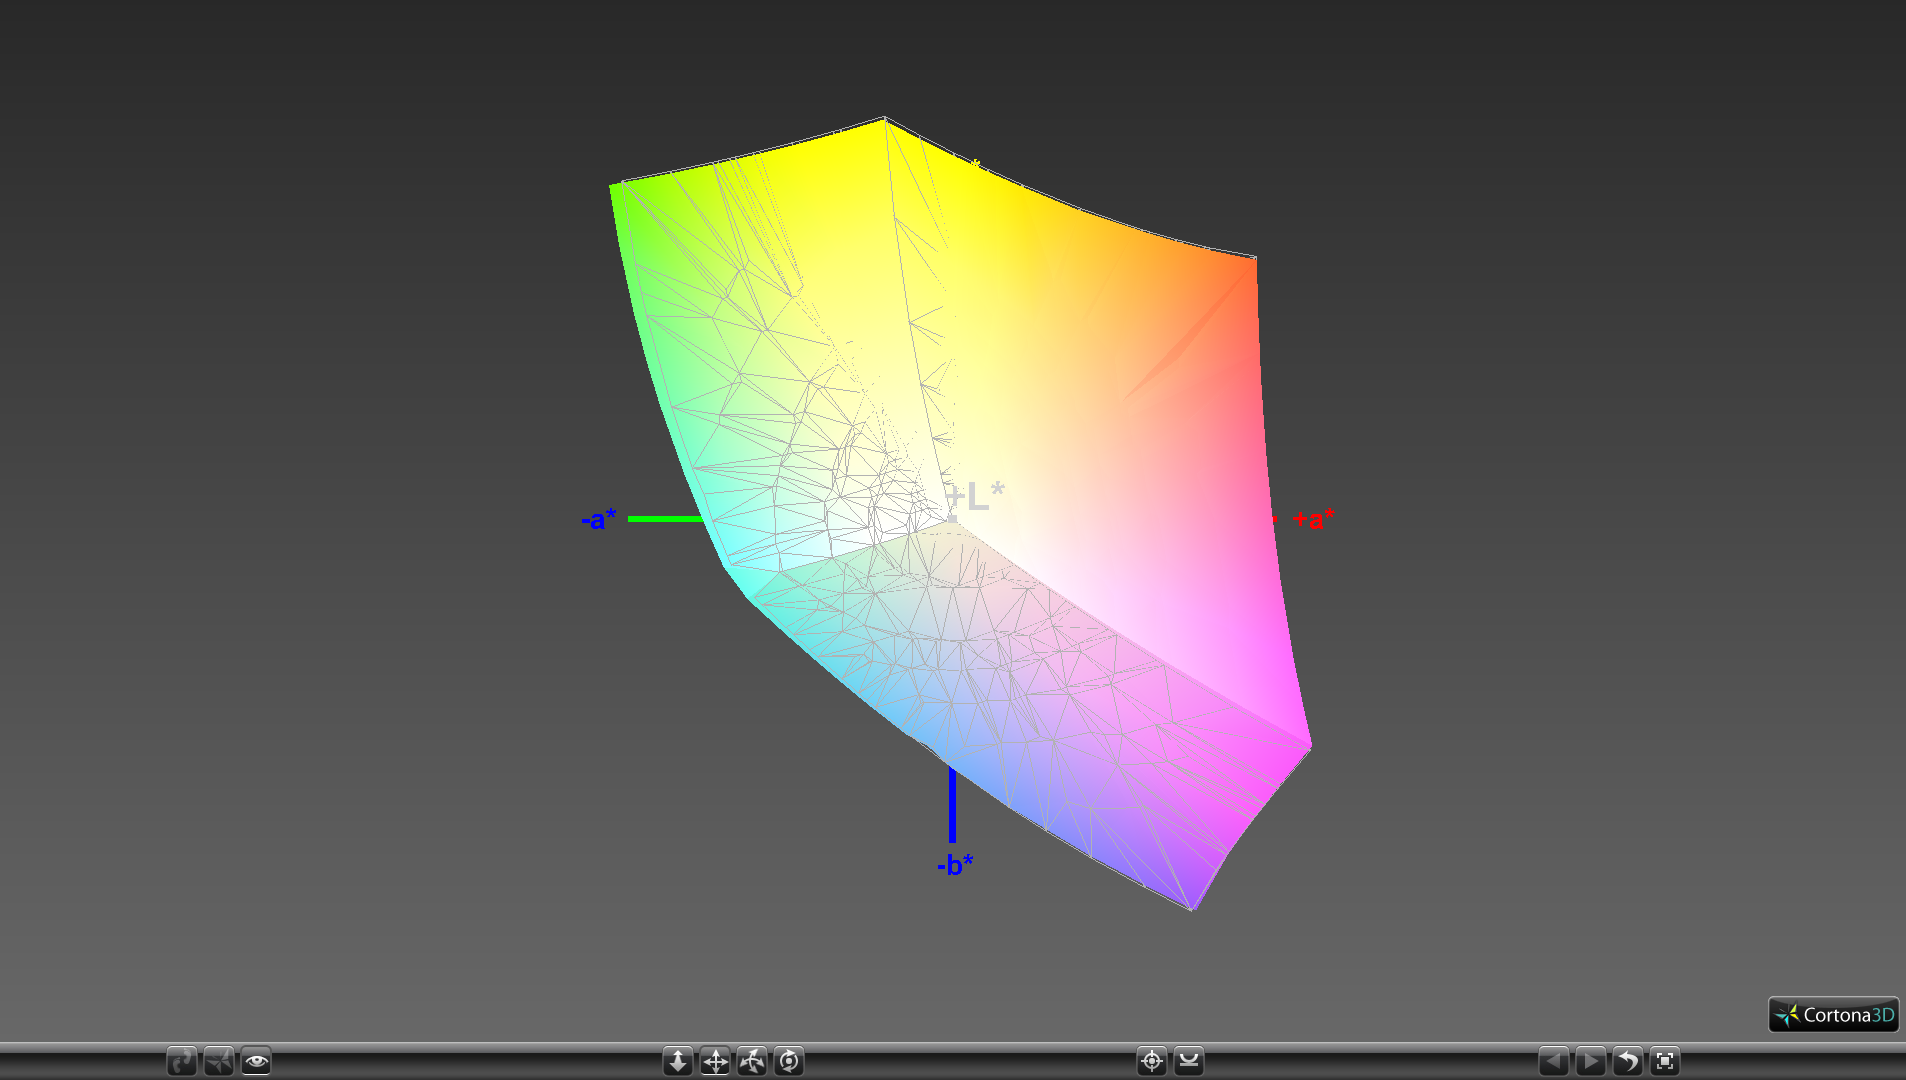
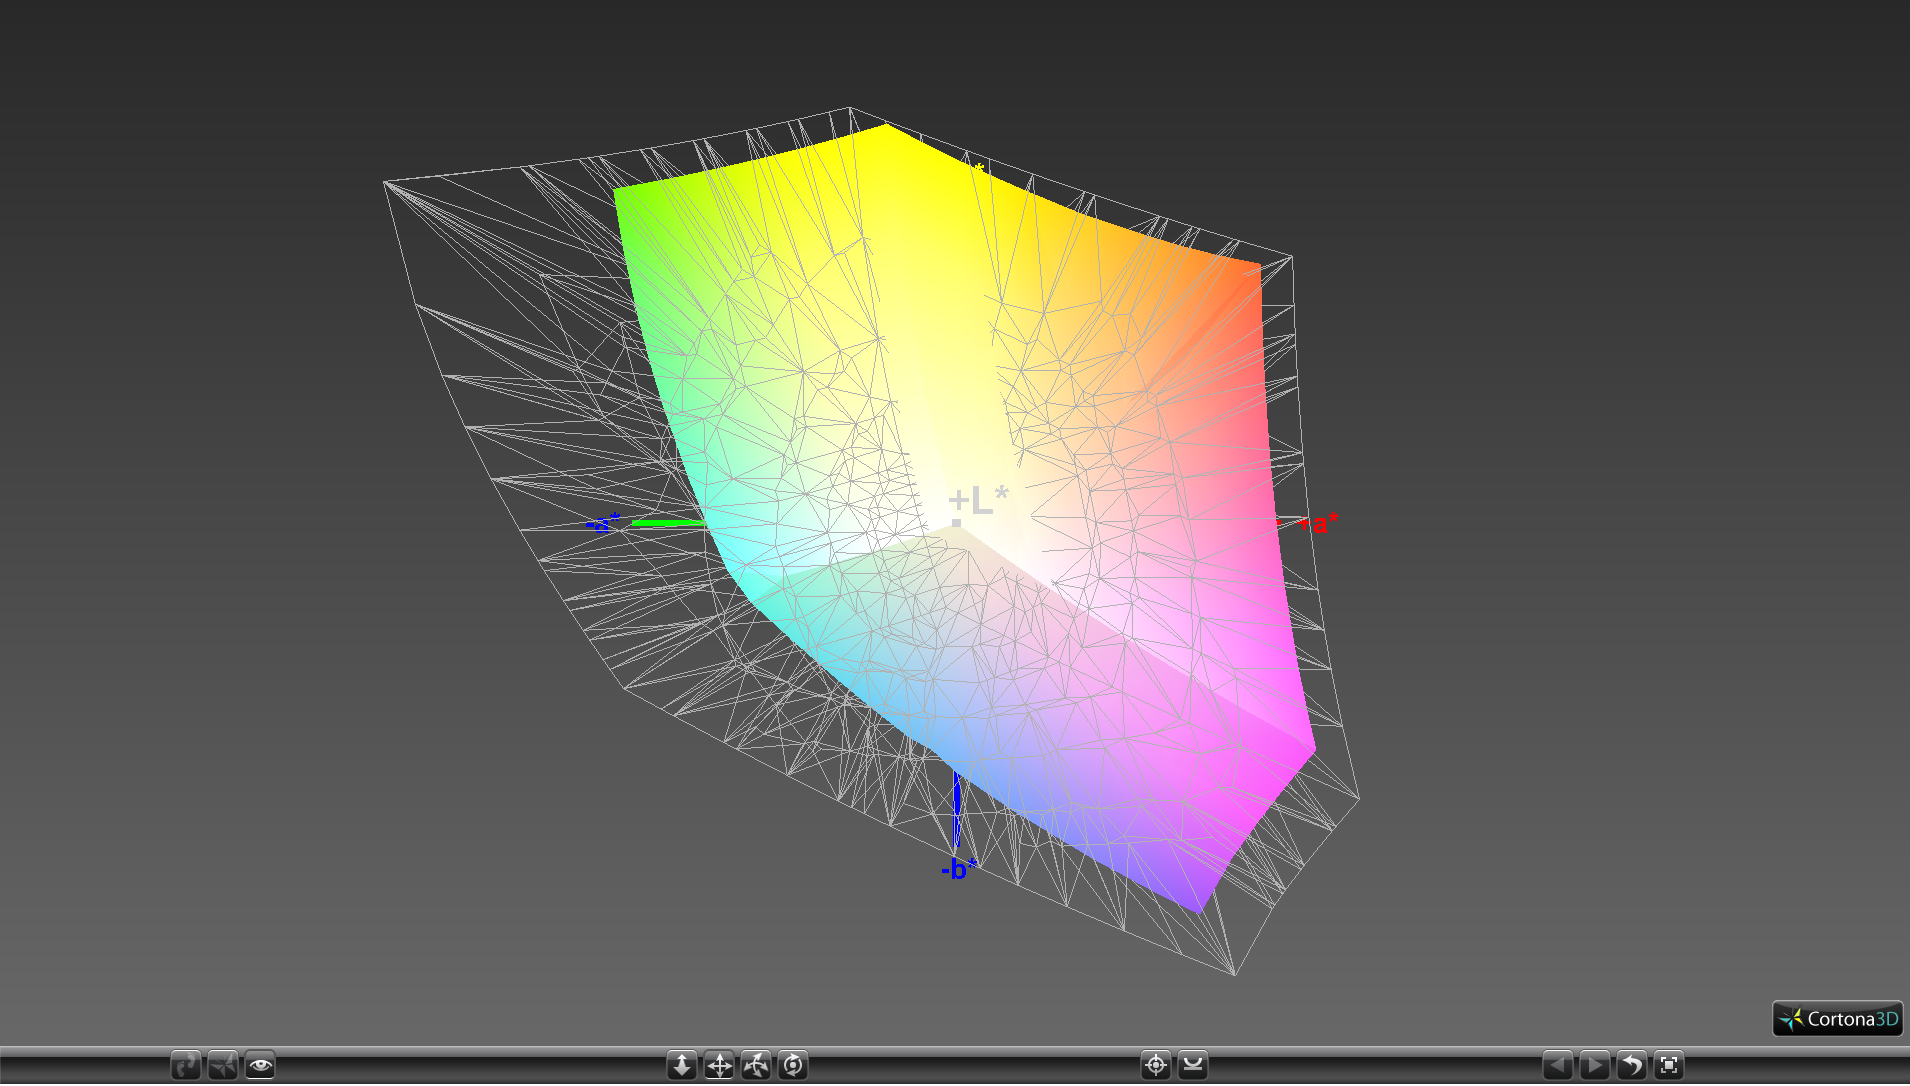
Color coverage is wide at essentially the entire sRGB spectrum and approximately 64 percent of the AdobeRGB standard. Results are comparable to the panels of other flagship Ultrabooks like the XPS 13, Matebook X Pro, and Spectre x360 13. Digital artists who need complete sRGB coverage should find the PS42 sufficient.
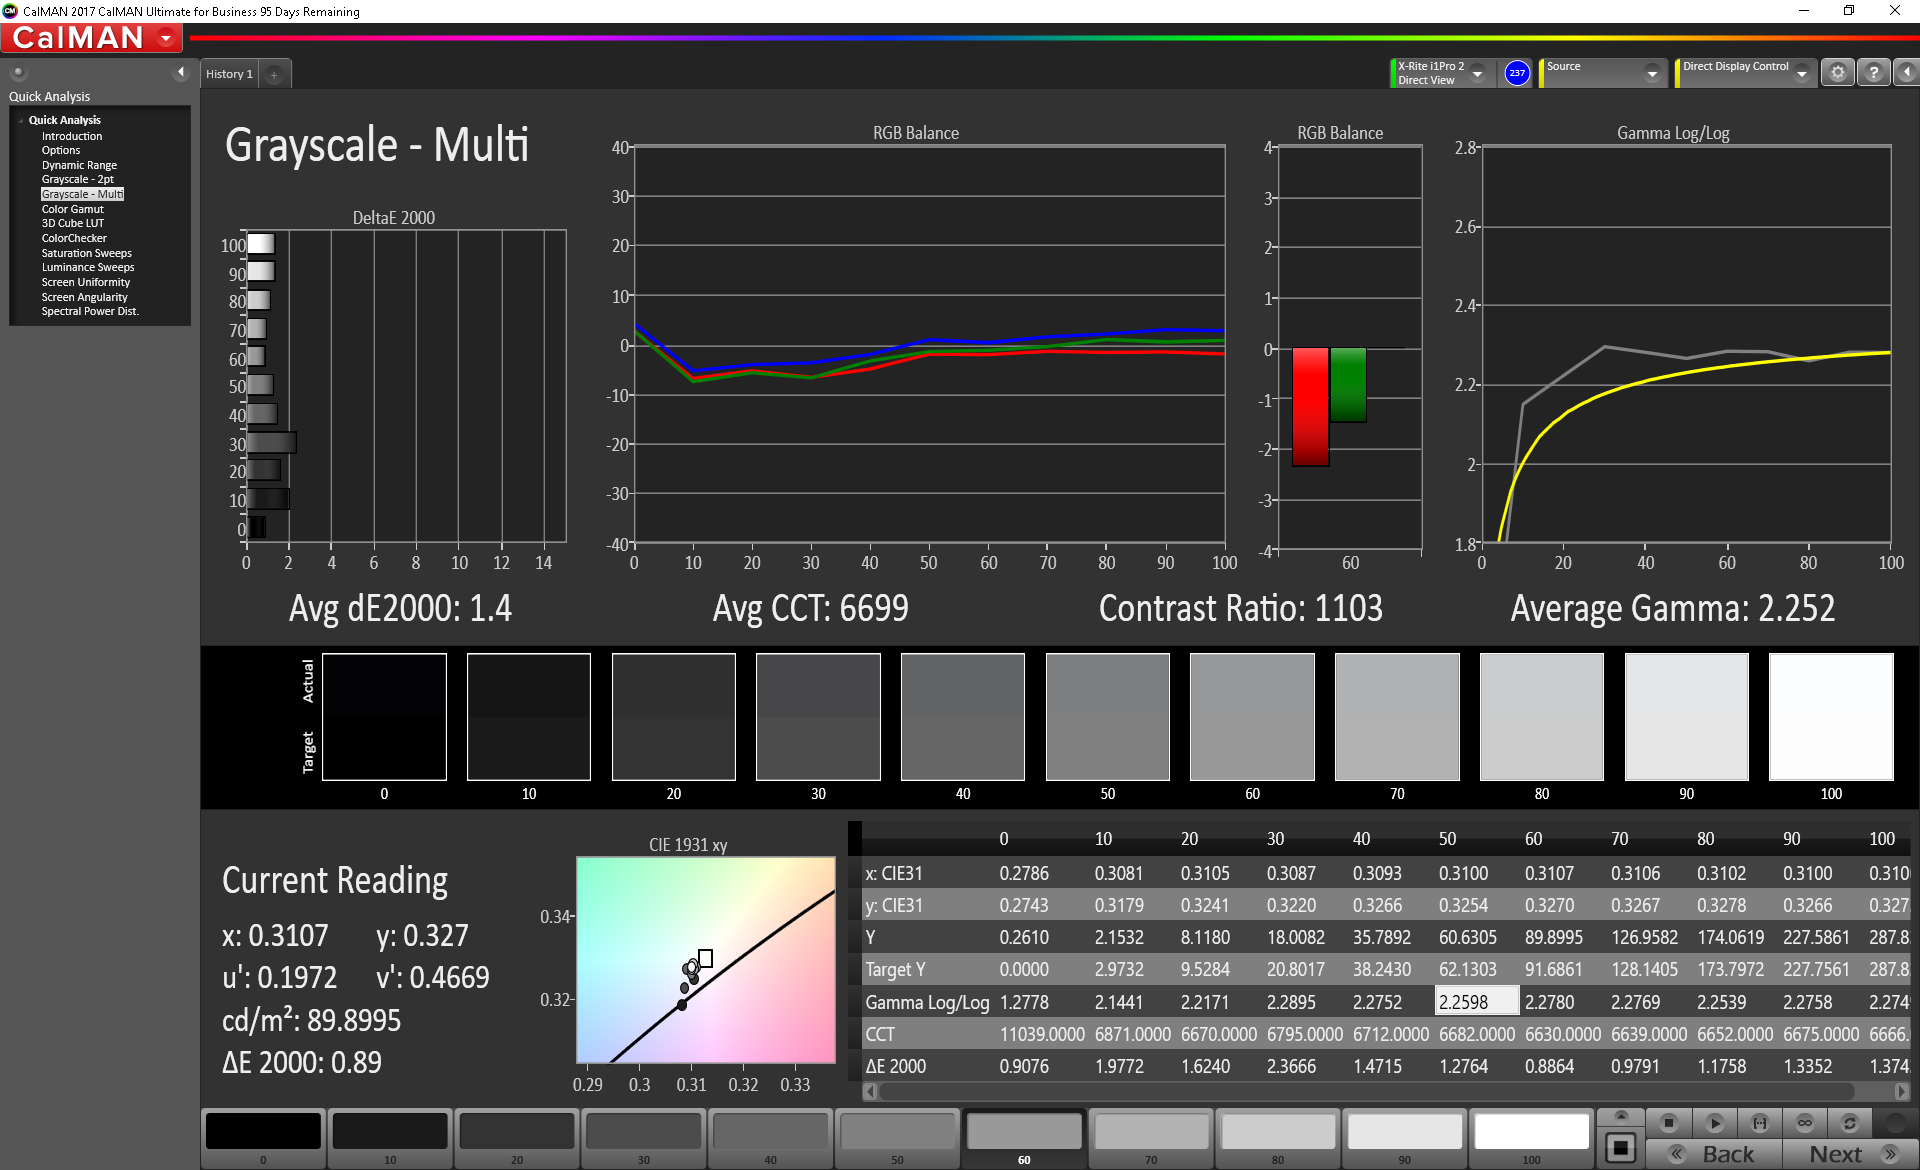
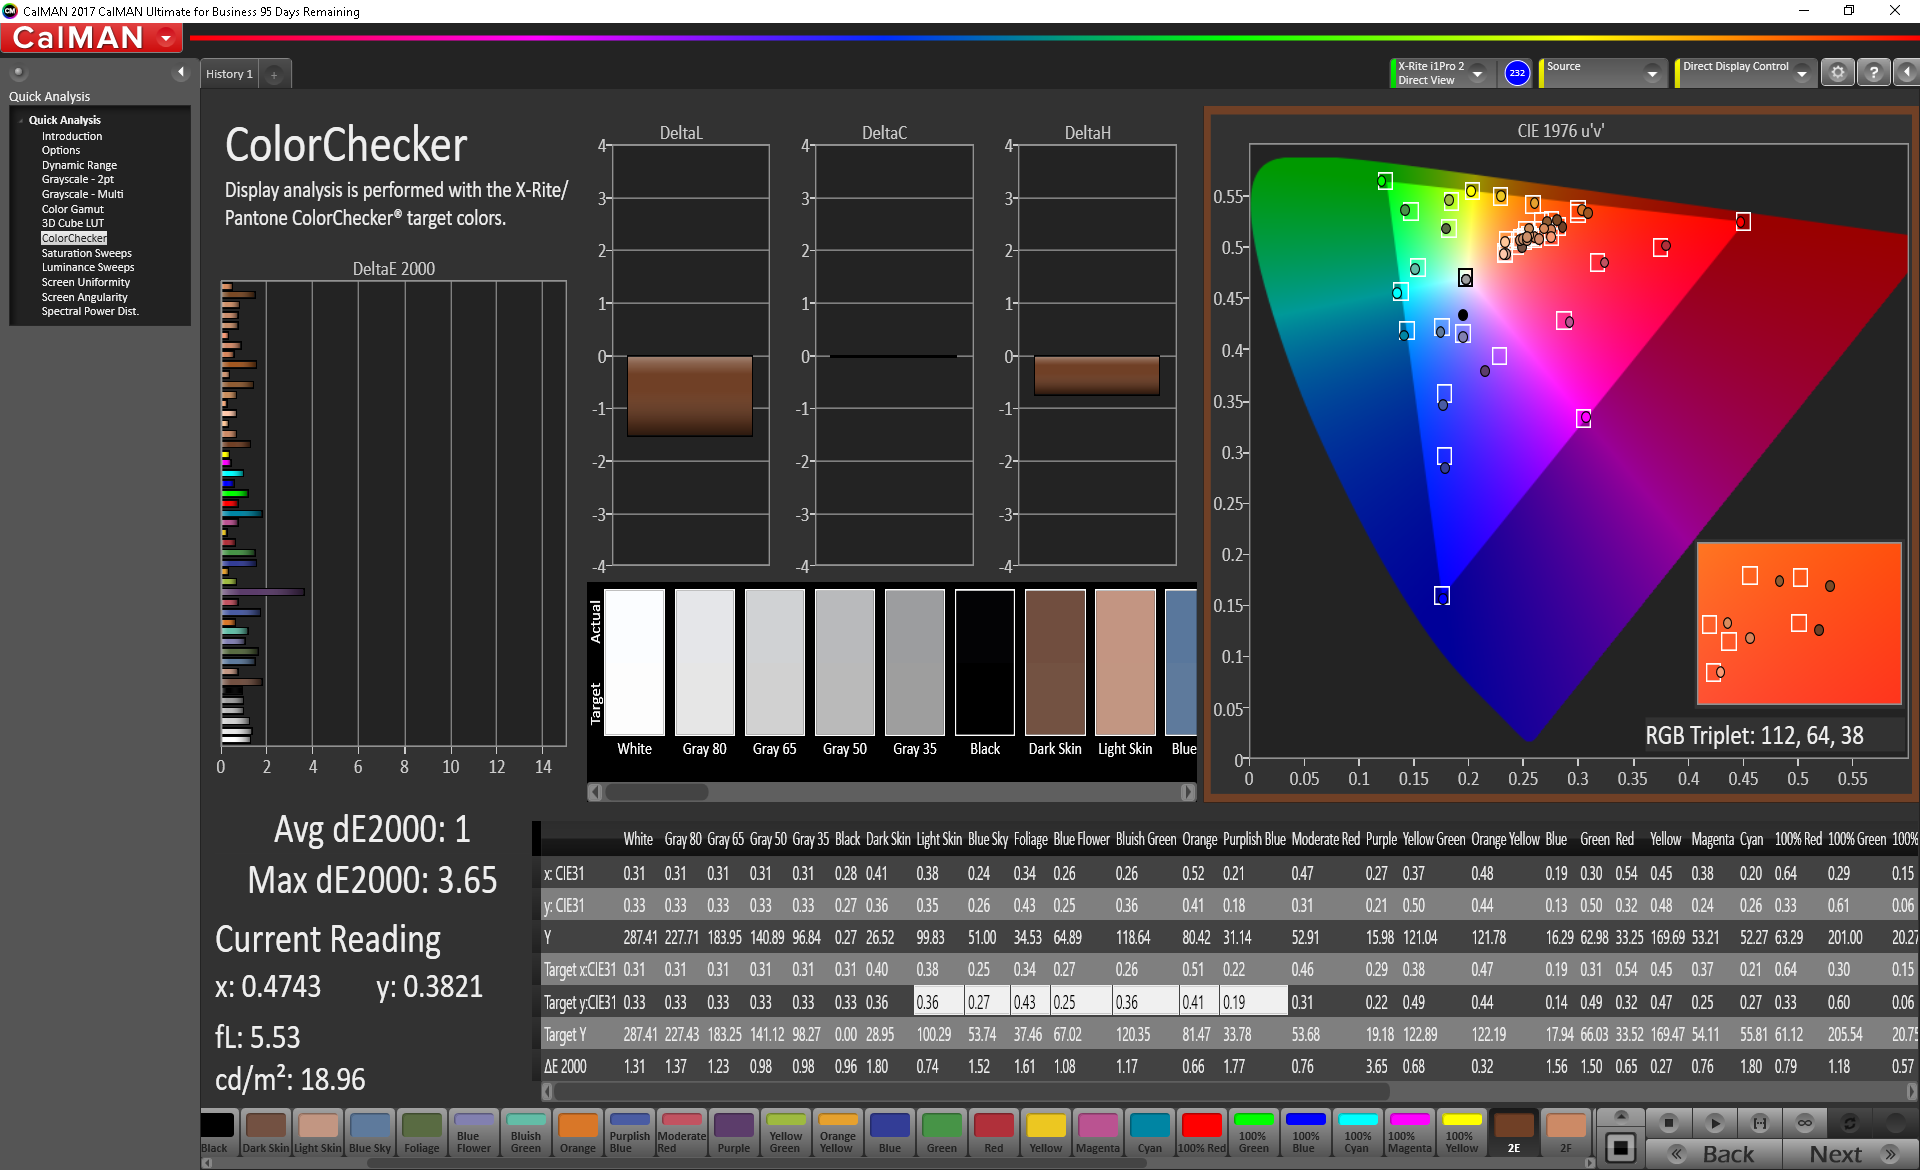
Further display measurements reveal very accurate colors and grayscale out of the box with some of the lowest DeltaE values we've seen on a laptop. Our attempts to calibrate the display change almost nothing and so an end-user calibration is not necessary to get the most accurate colors.
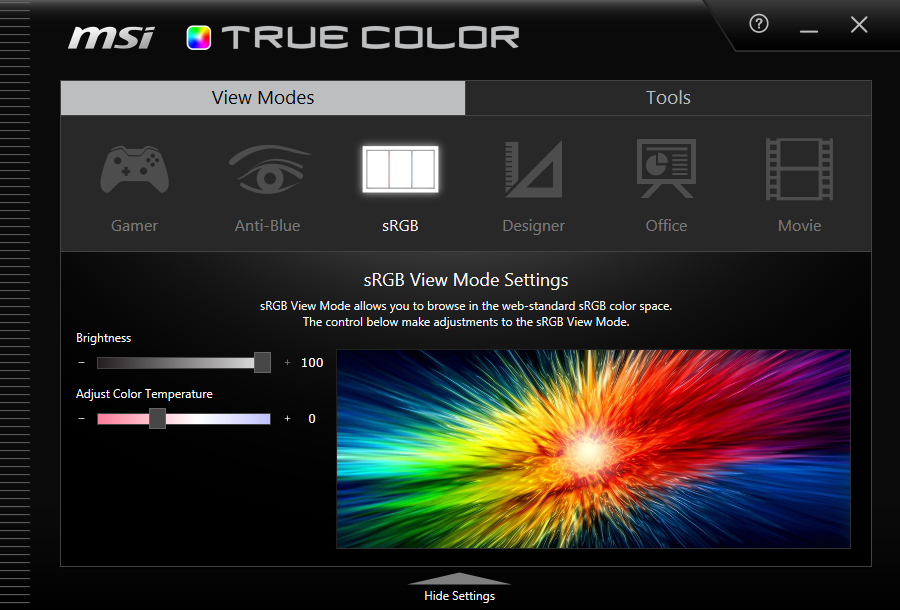
The pre-installed MSI True Color application was set to sRGB prior to taking our measurements.

Display Response Times
| ↔ Response Time Black to White | ||
|---|---|---|
| 24.8 ms ... rise ↗ and fall ↘ combined | ↗ 14.8 ms rise | 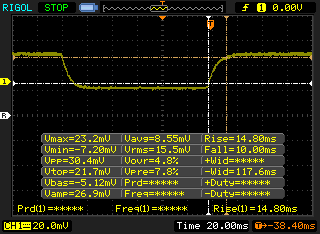 |
| ↘ 10 ms fall | ||
| The screen shows good response rates in our tests, but may be too slow for competitive gamers. In comparison, all tested devices range from 0.1 (minimum) to 240 (maximum) ms. » 58 % of all devices are better. This means that the measured response time is worse than the average of all tested devices (19.9 ms). | ||
| ↔ Response Time 50% Grey to 80% Grey | ||
| 34.4 ms ... rise ↗ and fall ↘ combined | ↗ 18 ms rise | 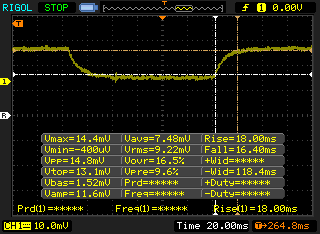 |
| ↘ 16.4 ms fall | ||
| The screen shows slow response rates in our tests and will be unsatisfactory for gamers. In comparison, all tested devices range from 0.165 (minimum) to 636 (maximum) ms. » 48 % of all devices are better. This means that the measured response time is worse than the average of all tested devices (31.1 ms). | ||
Screen Flickering / PWM (Pulse-Width Modulation)
| Screen flickering / PWM detected | 25000 Hz | ≤ 22 % brightness setting | 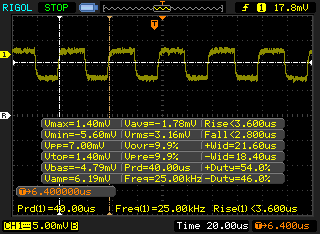 |
The display backlight flickers at 25000 Hz (worst case, e.g., utilizing PWM) Flickering detected at a brightness setting of 22 % and below. There should be no flickering or PWM above this brightness setting. The frequency of 25000 Hz is quite high, so most users sensitive to PWM should not notice any flickering. In comparison: 52 % of all tested devices do not use PWM to dim the display. If PWM was detected, an average of 7794 (minimum: 5 - maximum: 343500) Hz was measured. | |||
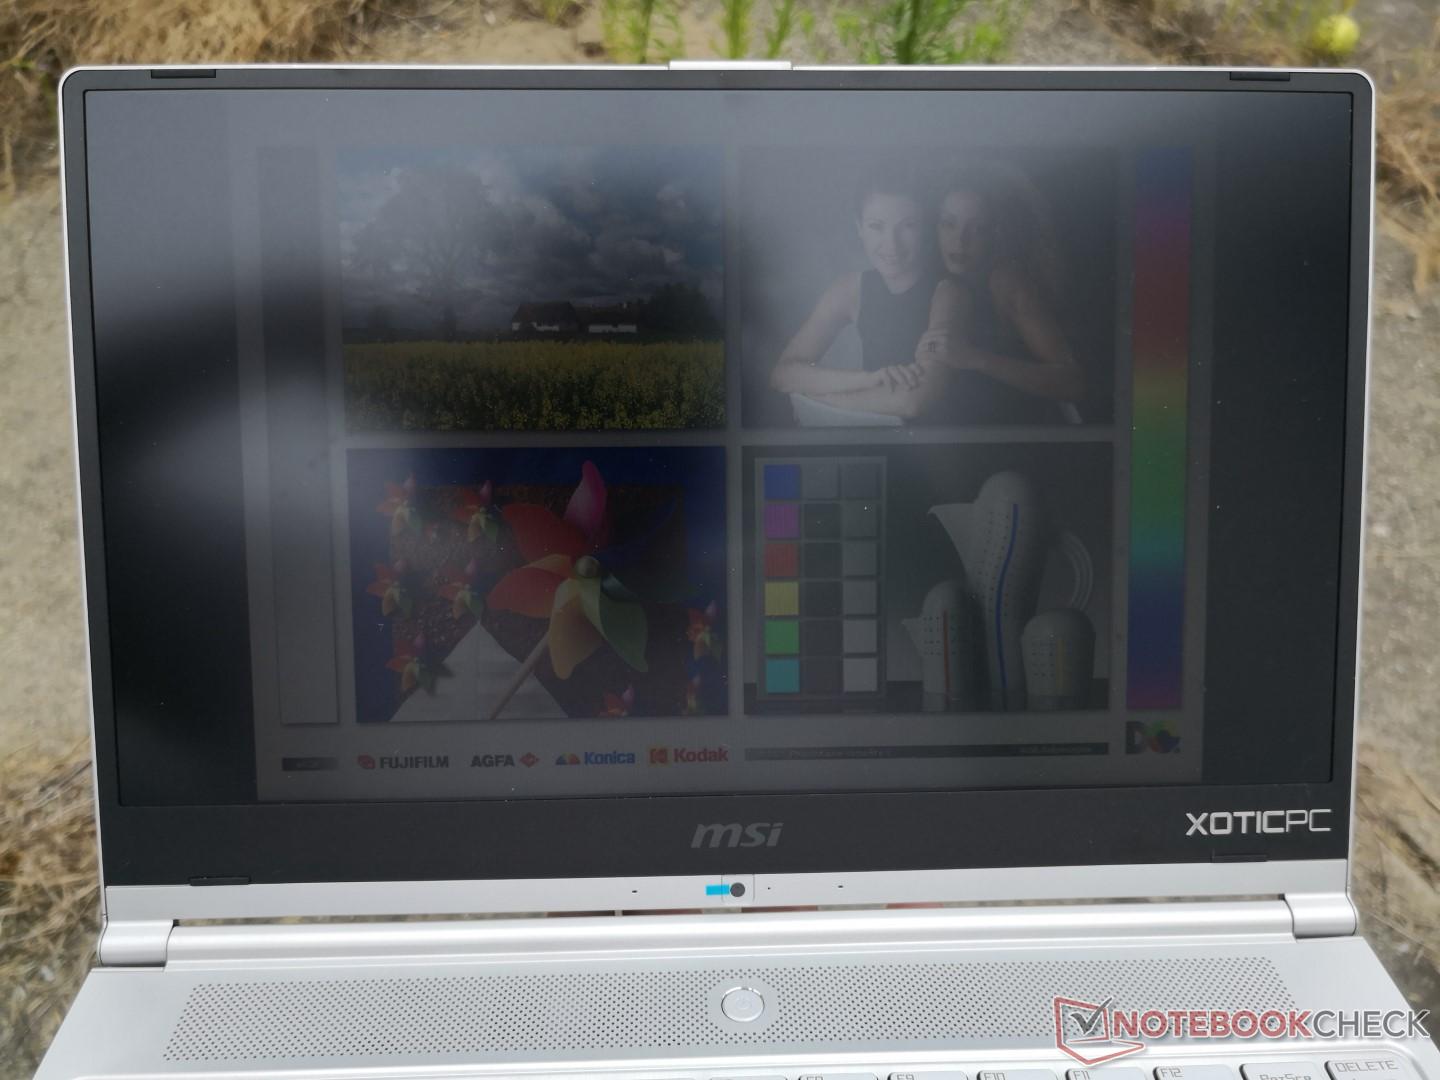
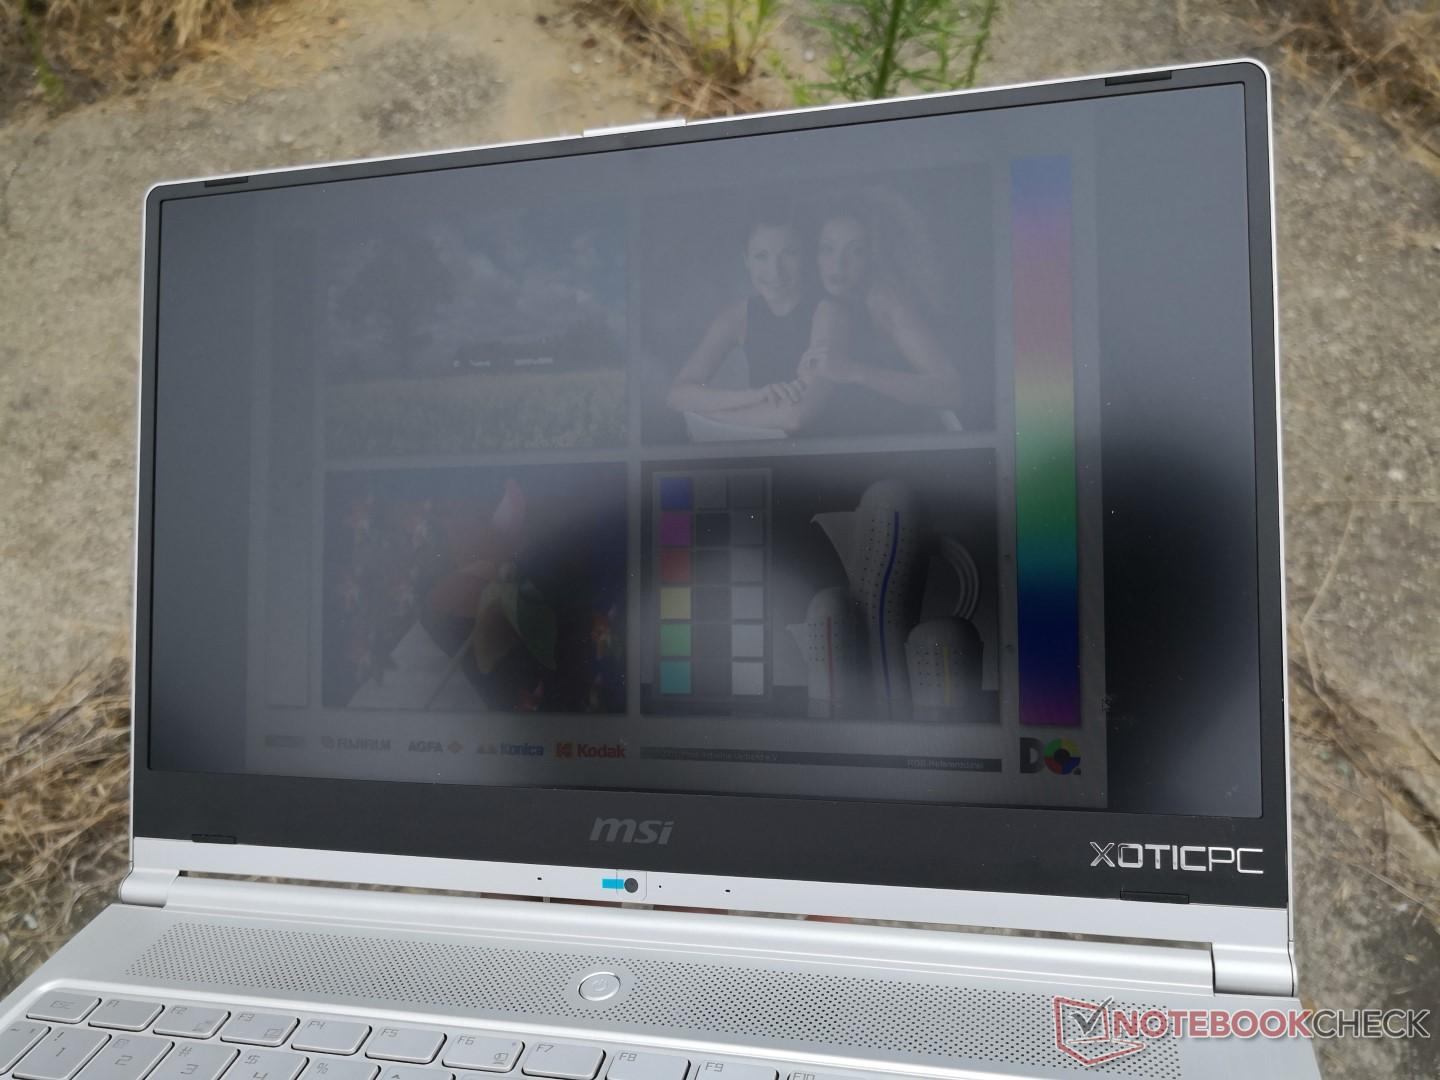
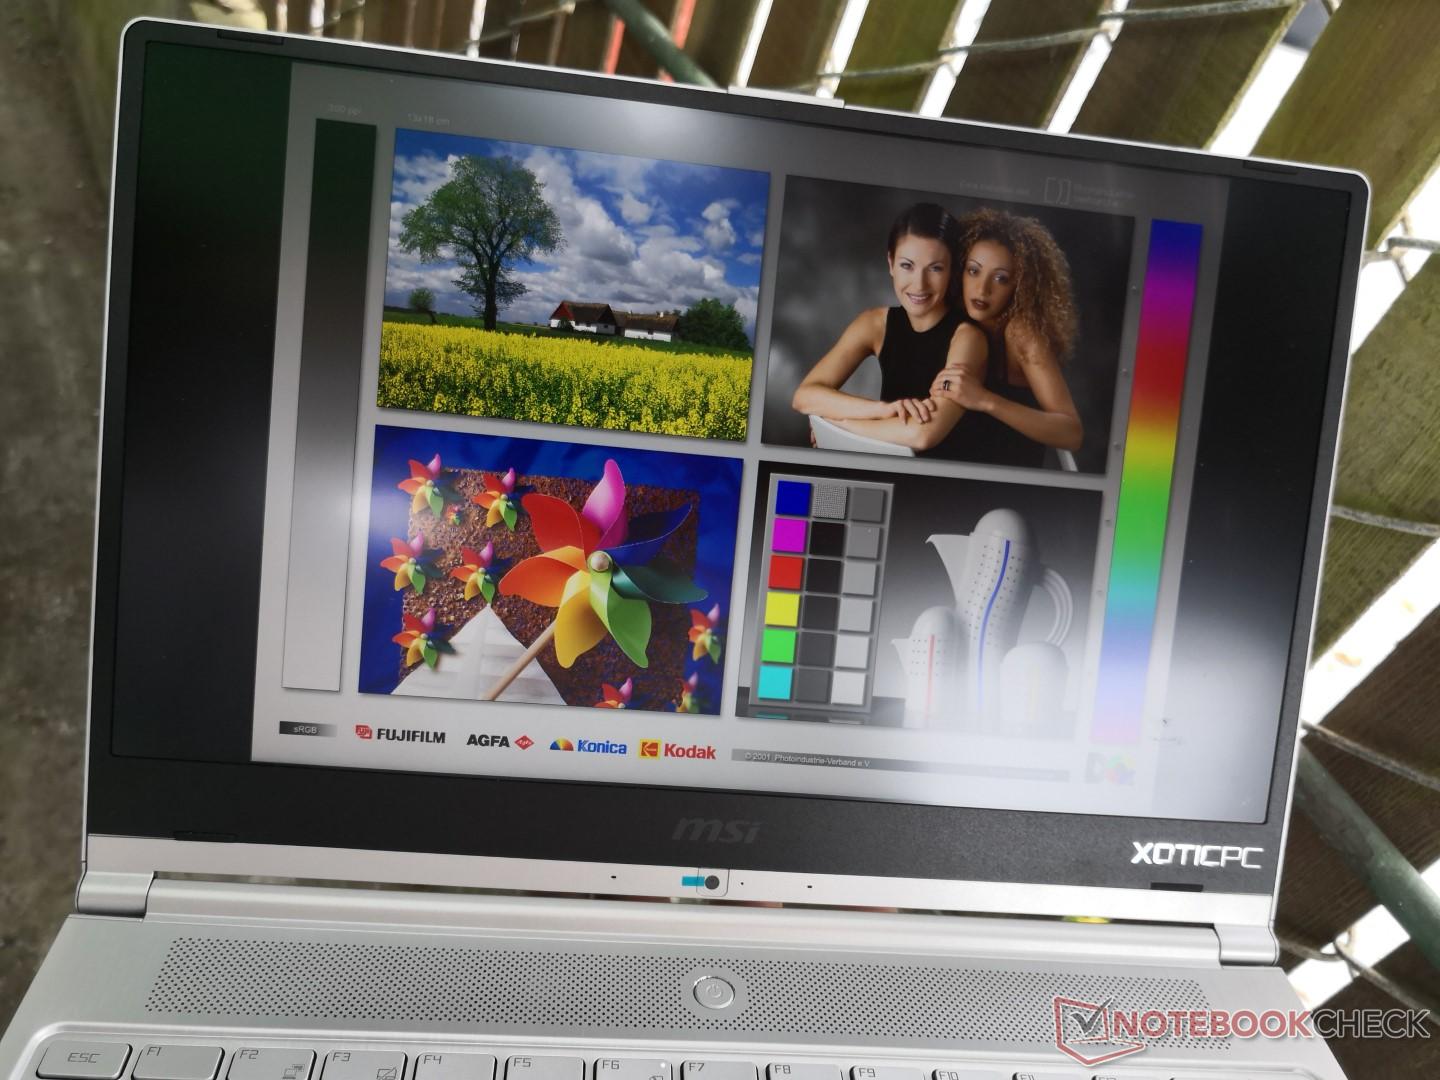
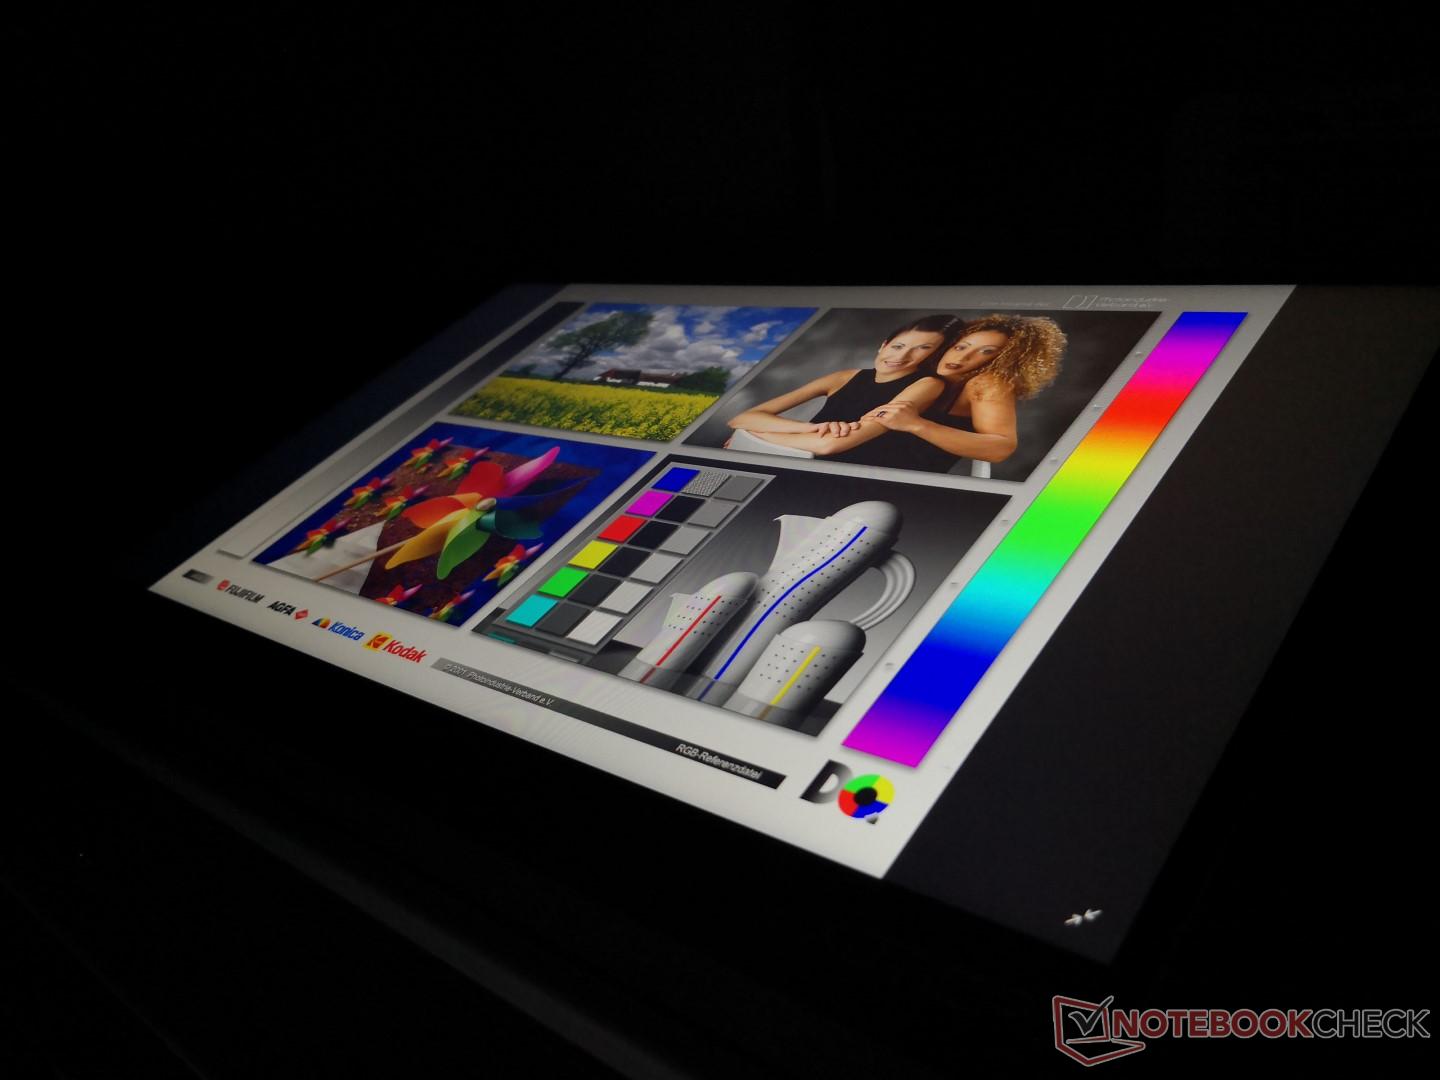
Outdoor visibility is just average under shade. The backlight is too dim for comfortable use in brighter environments despite the matte panel. Viewing angles are otherwise excellent with no major brightness or color shifting.
Performance
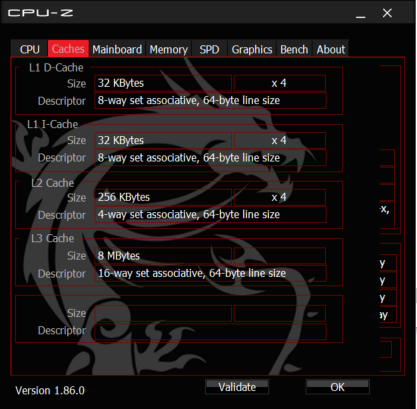
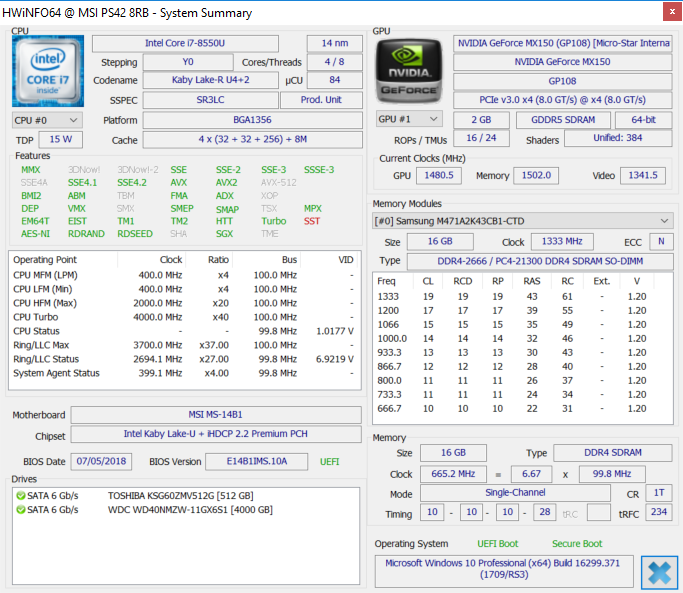
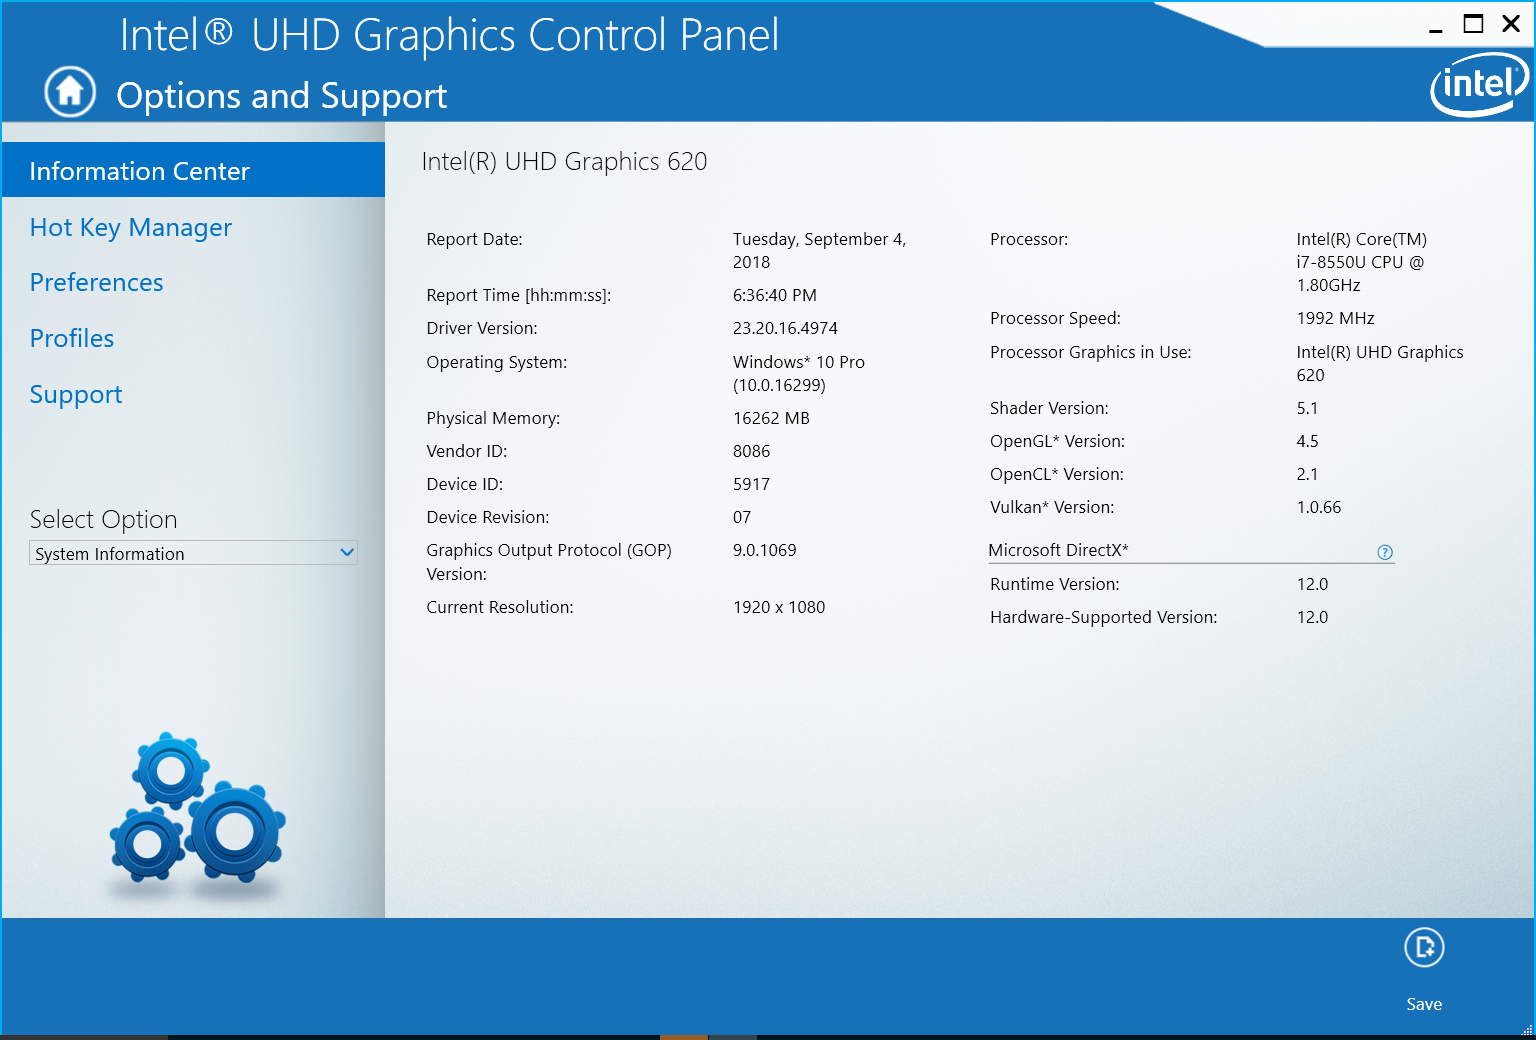
Current SKUs include the Core i5-8250U or Core i7-8550U CPU with either UHD Graphics 620 and GeForce MX150 graphics. All SKUs with the i5-8250U, however, ship with just 8 GB of RAM whereas the i7-8550U SKUs have 16 GB. The same 1080p IPS display is used across the entire lineup.
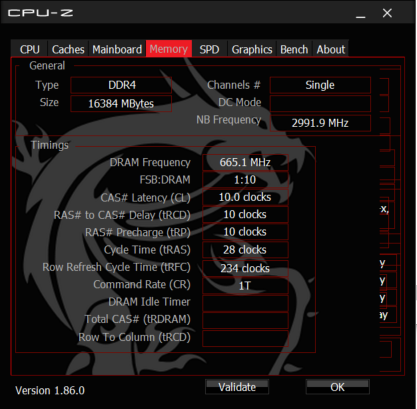
It's important to note that the PS42 is limited to single-channel memory that can potentially reduce performance depending on the application. Optimus is included in the GeForce MX150 SKUs to lengthen battery life.
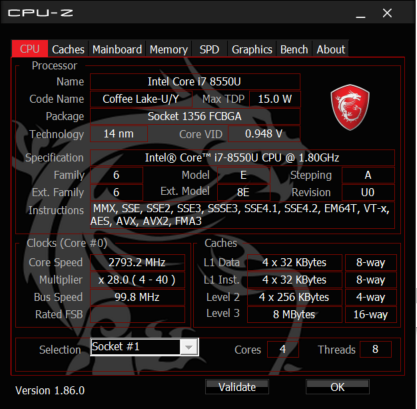
Processor
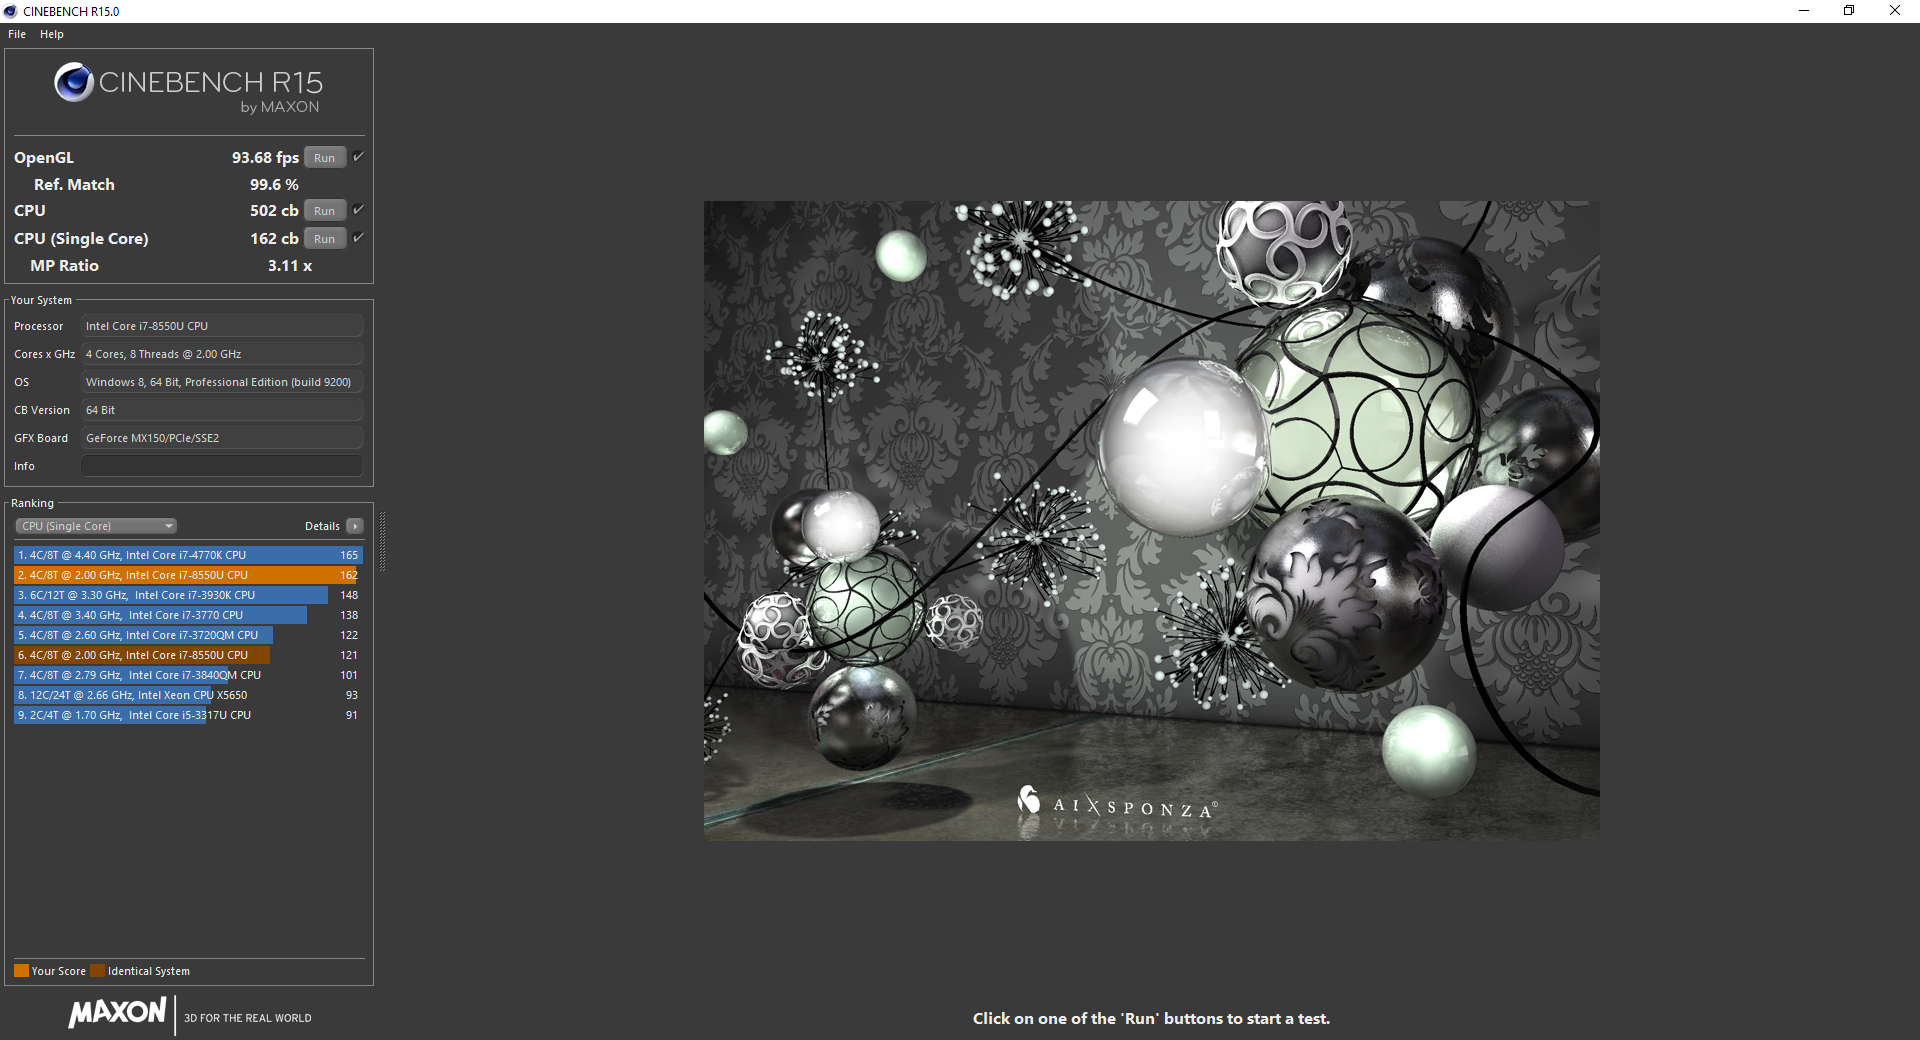
CPU performance is a mixed bag. On the bright side, performance is consistent as shown by our CineBench R15 Multi-Thread loop test below with very even scores from start to finish. In comparison, the same CPU in the MateBook X Pro can fall by as much as 12 percent when subjected to the same CineBench loop test.
On the flip side, maximum Turbo Boost potential is limited. The average Core i7-8550U CineBench R15 Multi-Thread score in our database is 14 percent higher than the same CPU in our PS42. The XPS 13 9370, for example, is able to score 27 percent higher than our MSI. Our Stress Test section below reveals that the CPU never runs any faster than 2.6 GHz or 2.7 GHz for more than a few seconds to explain the below average CineBench scores. Thus, while CPU performance is consistent, Turbo Boost potential is somewhat disappointing.
See our dedicated page on the Core i7-8550U for more technical information and benchmarks.
System Performance
PCMark benchmarks rank our system similarly to other notebooks equipped with the same CPU and GPU. Indeed, PCMark 8 Home and PCMark 10 results are within single-digit percentages from competing ultraportables like the ThinkPad T480s, Matebook X Pro, and XPS 13 9370. Its PCMark 8 Work results, however, are noticeably higher due to the faster dedicated GeForce graphics. The system feels buttery smooth as one would expect from a SSD-based laptop with no crashes or bugs during our time with the unit.
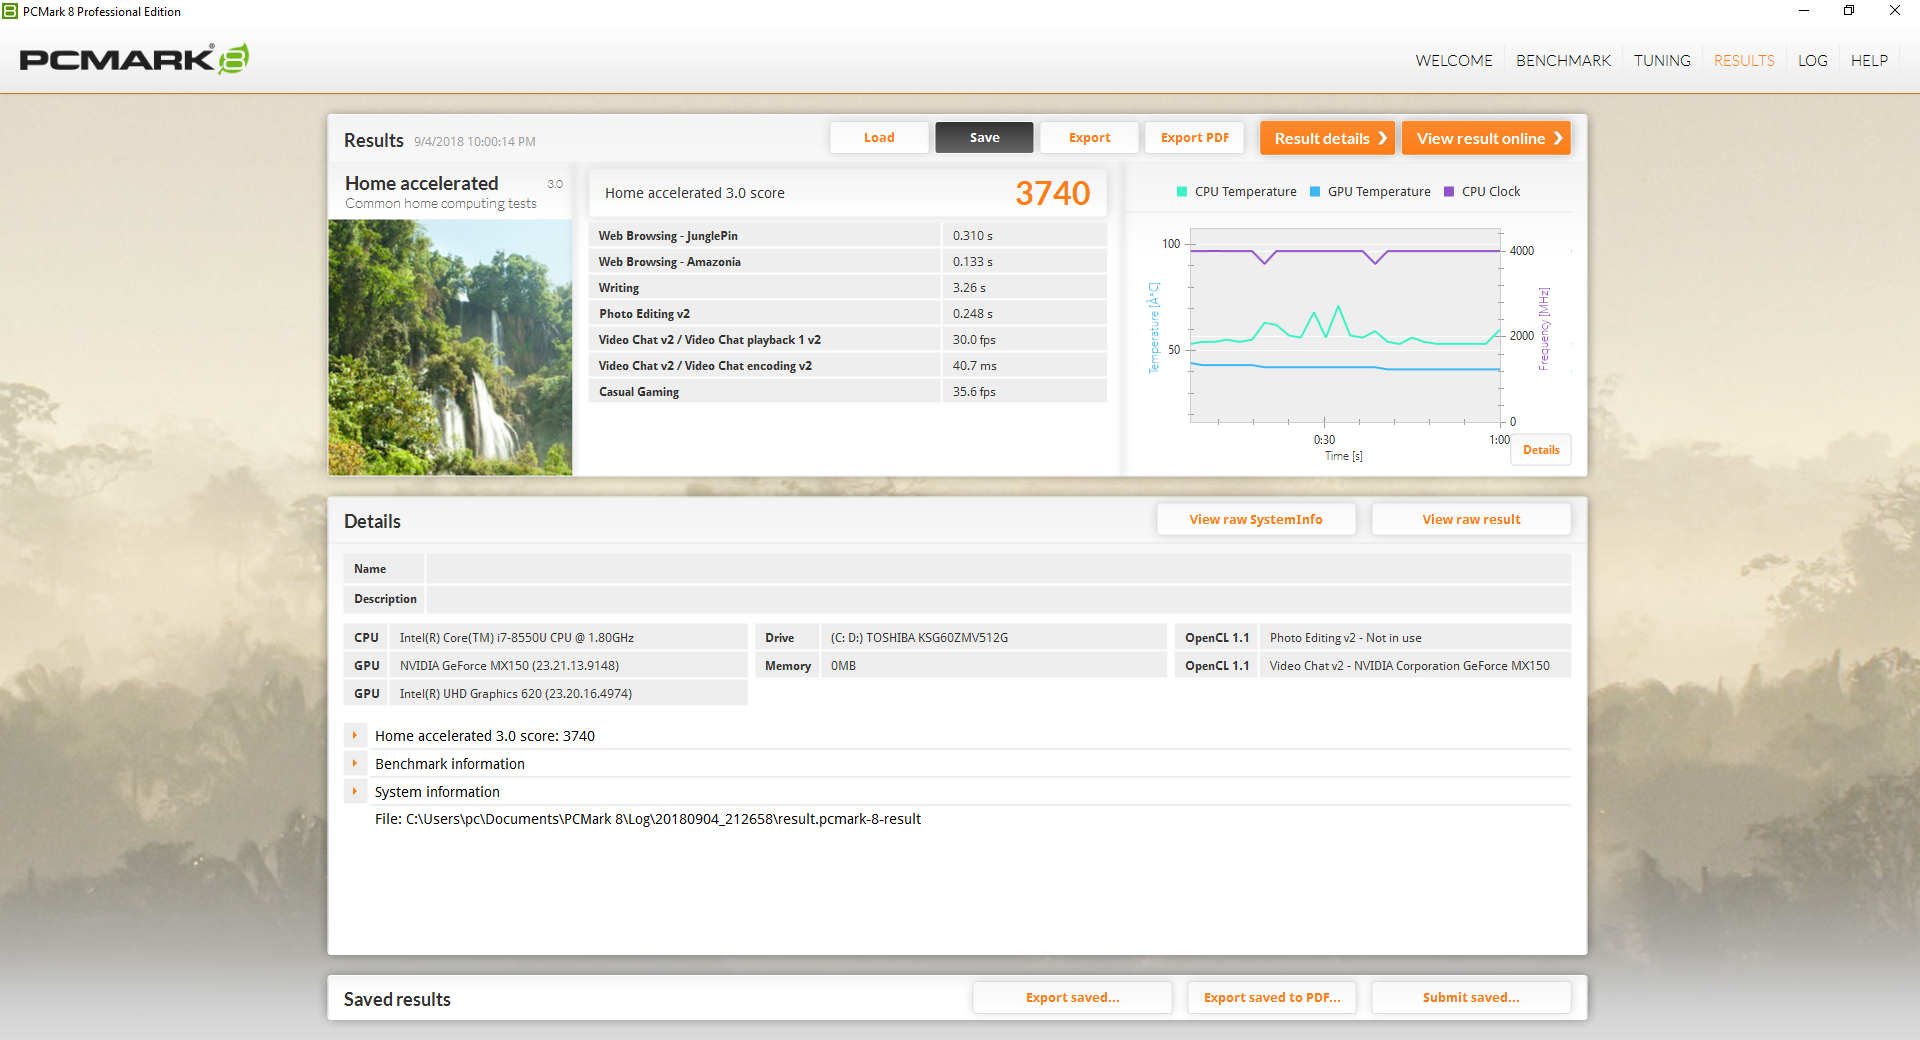
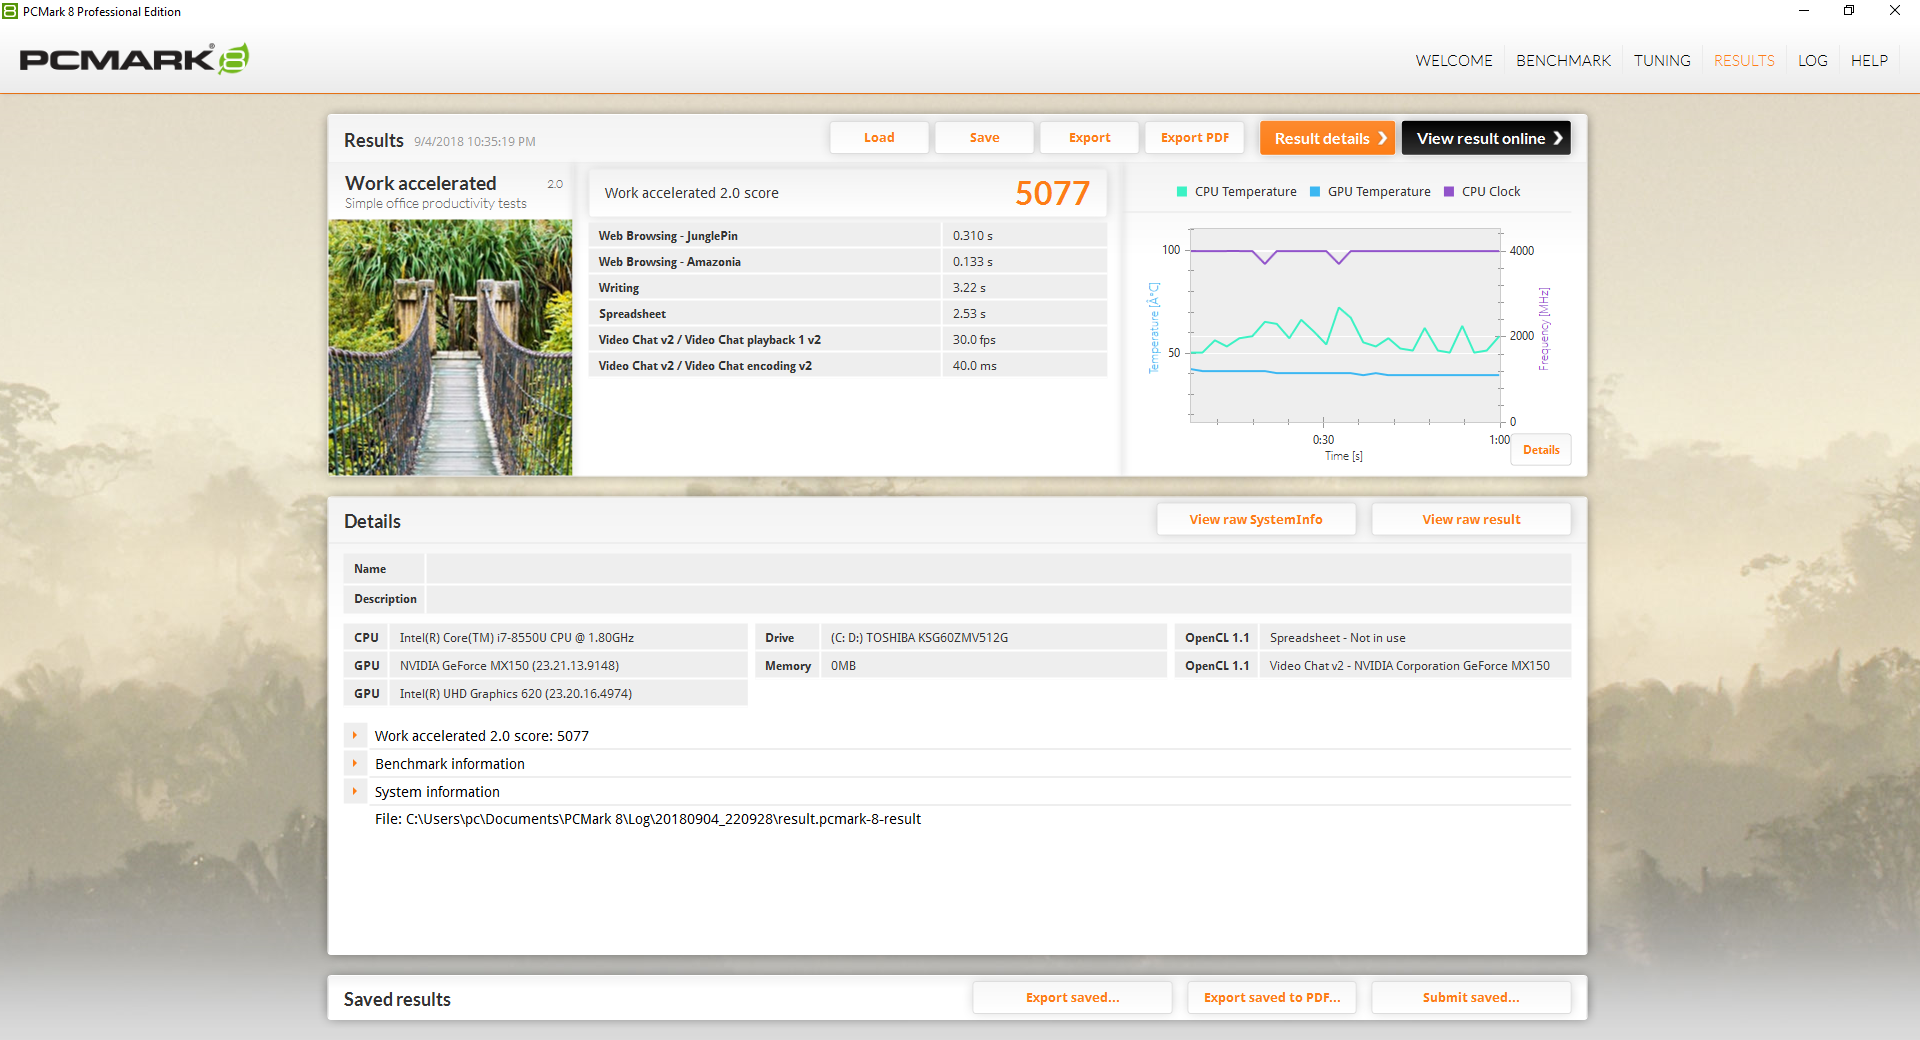
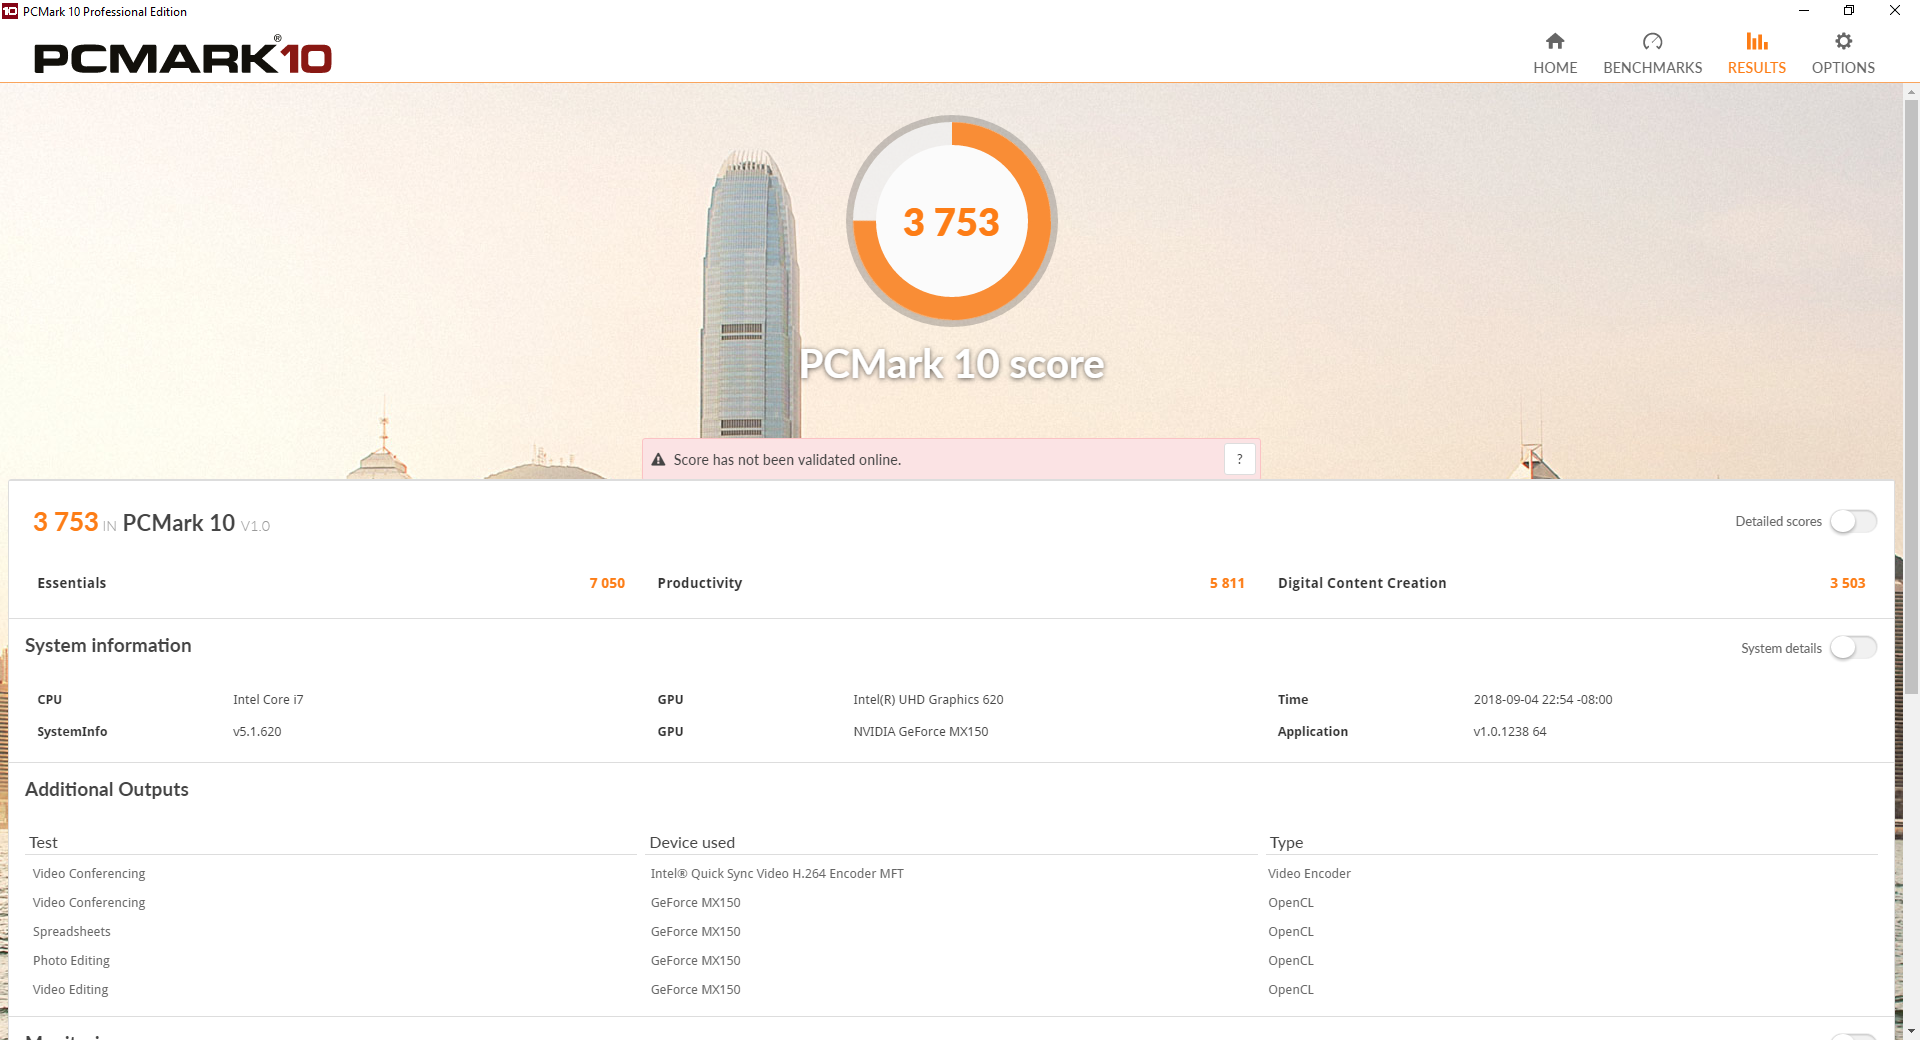
| PCMark 8 Home Score Accelerated v2 | 3740 points | |
| PCMark 8 Work Score Accelerated v2 | 5077 points | |
| PCMark 10 Score | 3753 points | |
Help | ||
Storage Devices
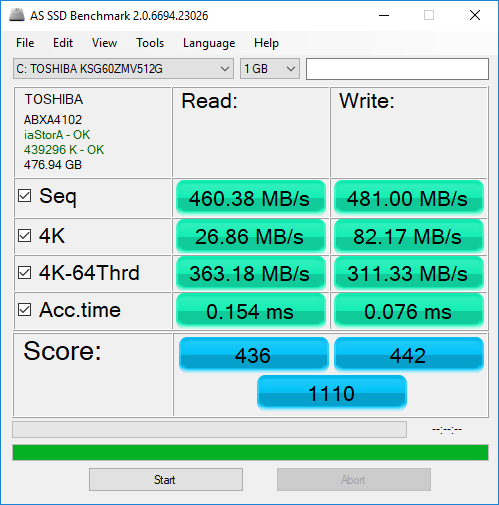
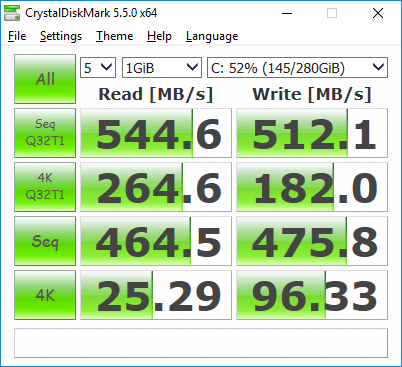
A single M.2 2280 slot is available with SSD options up to 512 GB. Our particular test unit is equipped with a 512 GB SATA III Toshiba KSG60ZMV512G SSD.
Transfer rates from out Toshiba SSD are typical of a SATA III SSD with sequential read and write rates hovering just below 500 MB/s. While more than sufficient for browsing and streaming, video editors and performance users will find the drive to be slower than the NVMe SSDs found on most competing Ultrabooks. The faster Toshiba KXG50ZNV512G NVMe SSD in the XPS 13, for example, is capable of four times the sequential read rates of our MSI.
See our table of SSDs and HDDs for more benchmark comparisons.
(September 11, 2018 correction: SKUs in the United States are not available with NVMe options, but the systems are otherwise compatible with NVMe SSDs. SKUs overseas, such as in Germany, have NVMe SSDs by default.)
| MSI Prestige PS42 8RB-059 Toshiba KSG60ZMV512G | Dell XPS 13 9370 i7 UHD Toshiba XG5 KXG50ZNV512G | Huawei Matebook X Pro i5 Samsung PM961 MZVLW256HEHP | Lenovo ThinkPad T480s-20L7002AUS Samsung PM961 MZVLW256HEHP | Lenovo ThinkPad 13 20J1005TPB Intel SSD 600p SSDPEKKW256G7 | Average Toshiba KSG60ZMV512G | |
|---|---|---|---|---|---|---|
| AS SSD | 61% | 96% | 141% | 44% | -3% | |
| Copy Game MB/s (MB/s) | 587 | 503 -14% | 486.3 -17% | 546 ? -7% | ||
| Copy Program MB/s (MB/s) | 439.5 | 570 30% | 312.3 -29% | 326 ? -26% | ||
| Copy ISO MB/s (MB/s) | 700 | 585 -16% | 739 6% | 563 ? -20% | ||
| Score Total (Points) | 1110 | 1911 72% | 2575 132% | 3048 175% | 1305 18% | 1089 ? -2% |
| Score Write (Points) | 442 | 596 35% | 620 40% | 921 108% | 655 48% | 412 ? -7% |
| Score Read (Points) | 436 | 926 112% | 1329 205% | 1435 229% | 449 3% | 446 ? 2% |
| Access Time Write * (ms) | 0.076 | 0.055 28% | 0.036 53% | 0.038 50% | 0.033 57% | 0.064 ? 16% |
| Access Time Read * (ms) | 0.154 | 0.059 62% | 0.058 62% | 0.055 64% | 0.081 47% | 0.112 ? 27% |
| 4K-64 Write (MB/s) | 311.3 | 444.8 43% | 399.6 28% | 706 127% | 481.7 55% | 285 ? -8% |
| 4K-64 Read (MB/s) | 363.2 | 678 87% | 1039 186% | 1183 226% | 278.2 -23% | 373 ? 3% |
| 4K Write (MB/s) | 82.2 | 107.4 31% | 103.1 25% | 97.8 19% | 113.9 39% | 87 ? 6% |
| 4K Read (MB/s) | 26.86 | 29.36 9% | 48.33 80% | 42.09 57% | 33.1 23% | 25.3 ? -6% |
| Seq Write (MB/s) | 481 | 435.8 -9% | 1170 143% | 1172 144% | 590 23% | 391 ? -19% |
| Seq Read (MB/s) | 460.4 | 2205 379% | 2416 425% | 2094 355% | 1375 199% | 467 ? 1% |
* ... smaller is better

GPU Performance
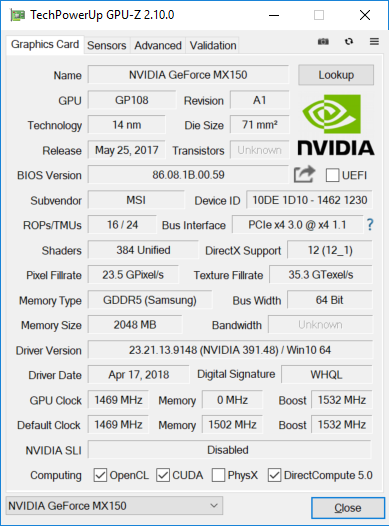
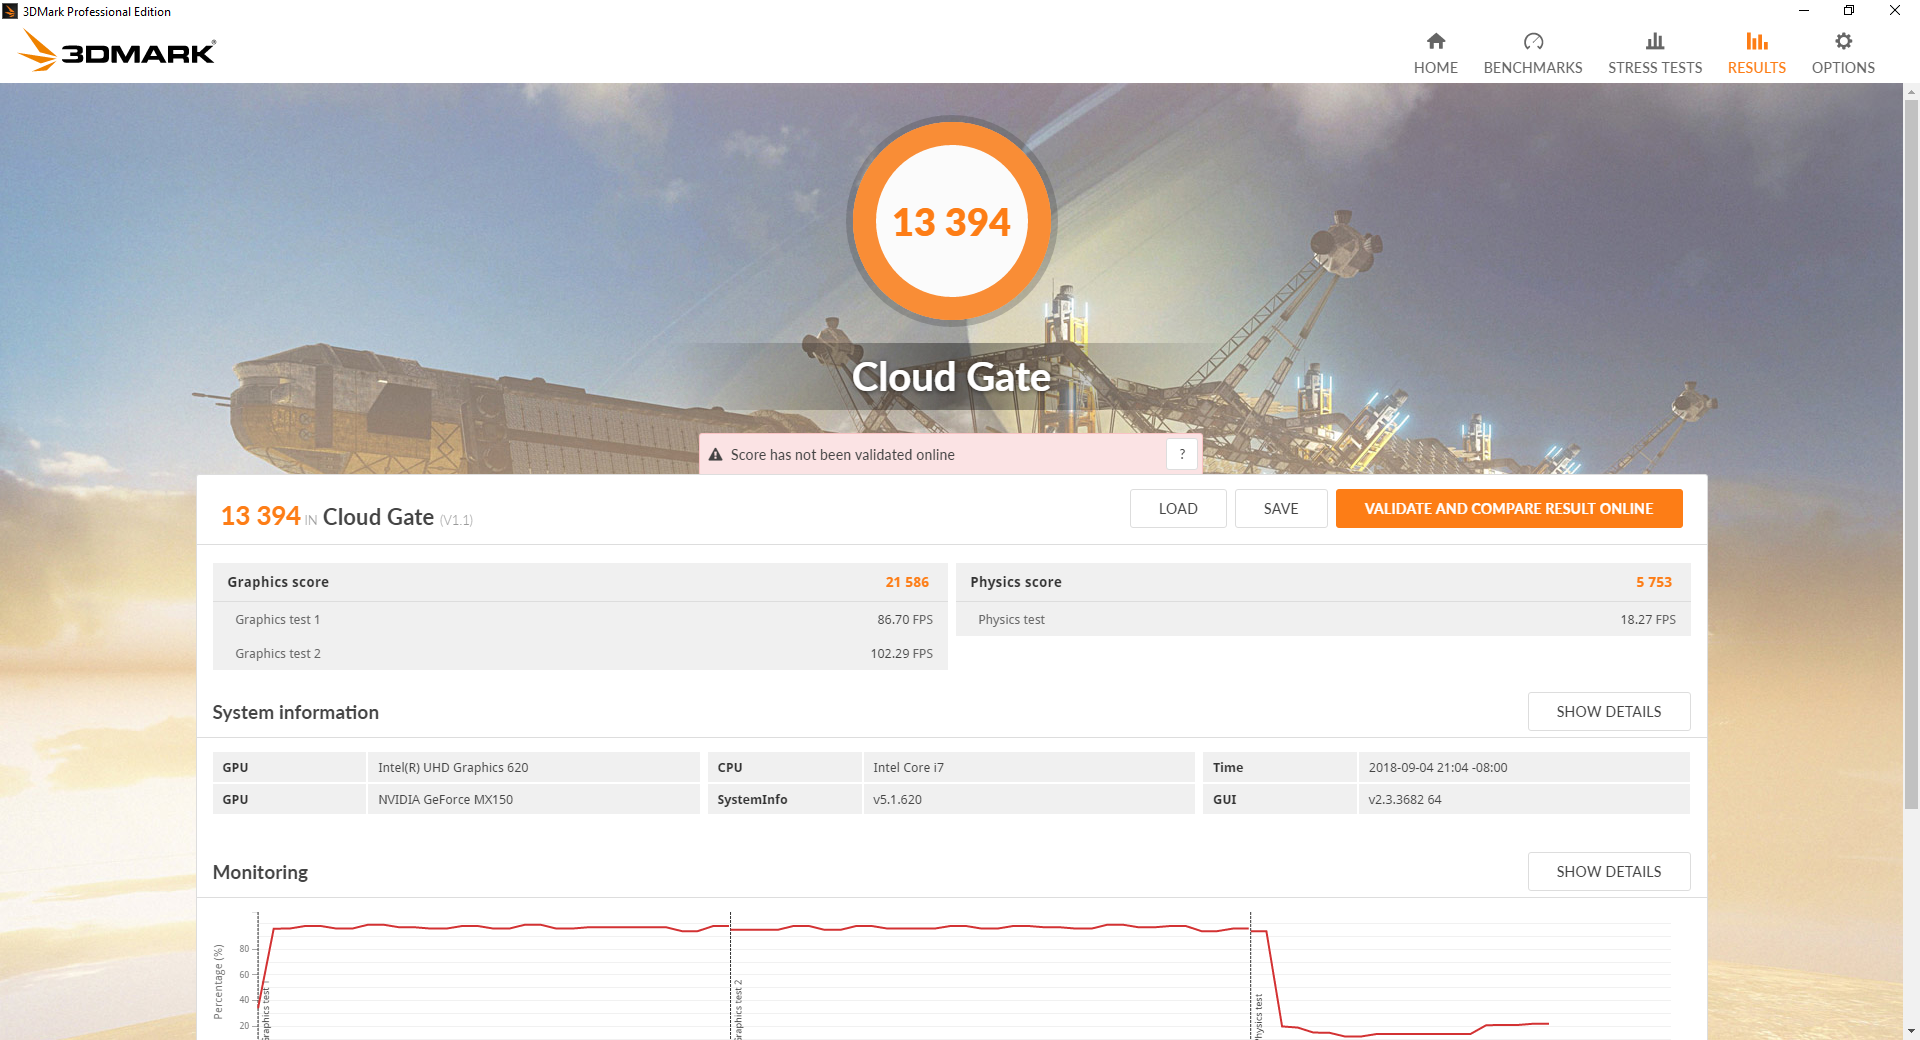
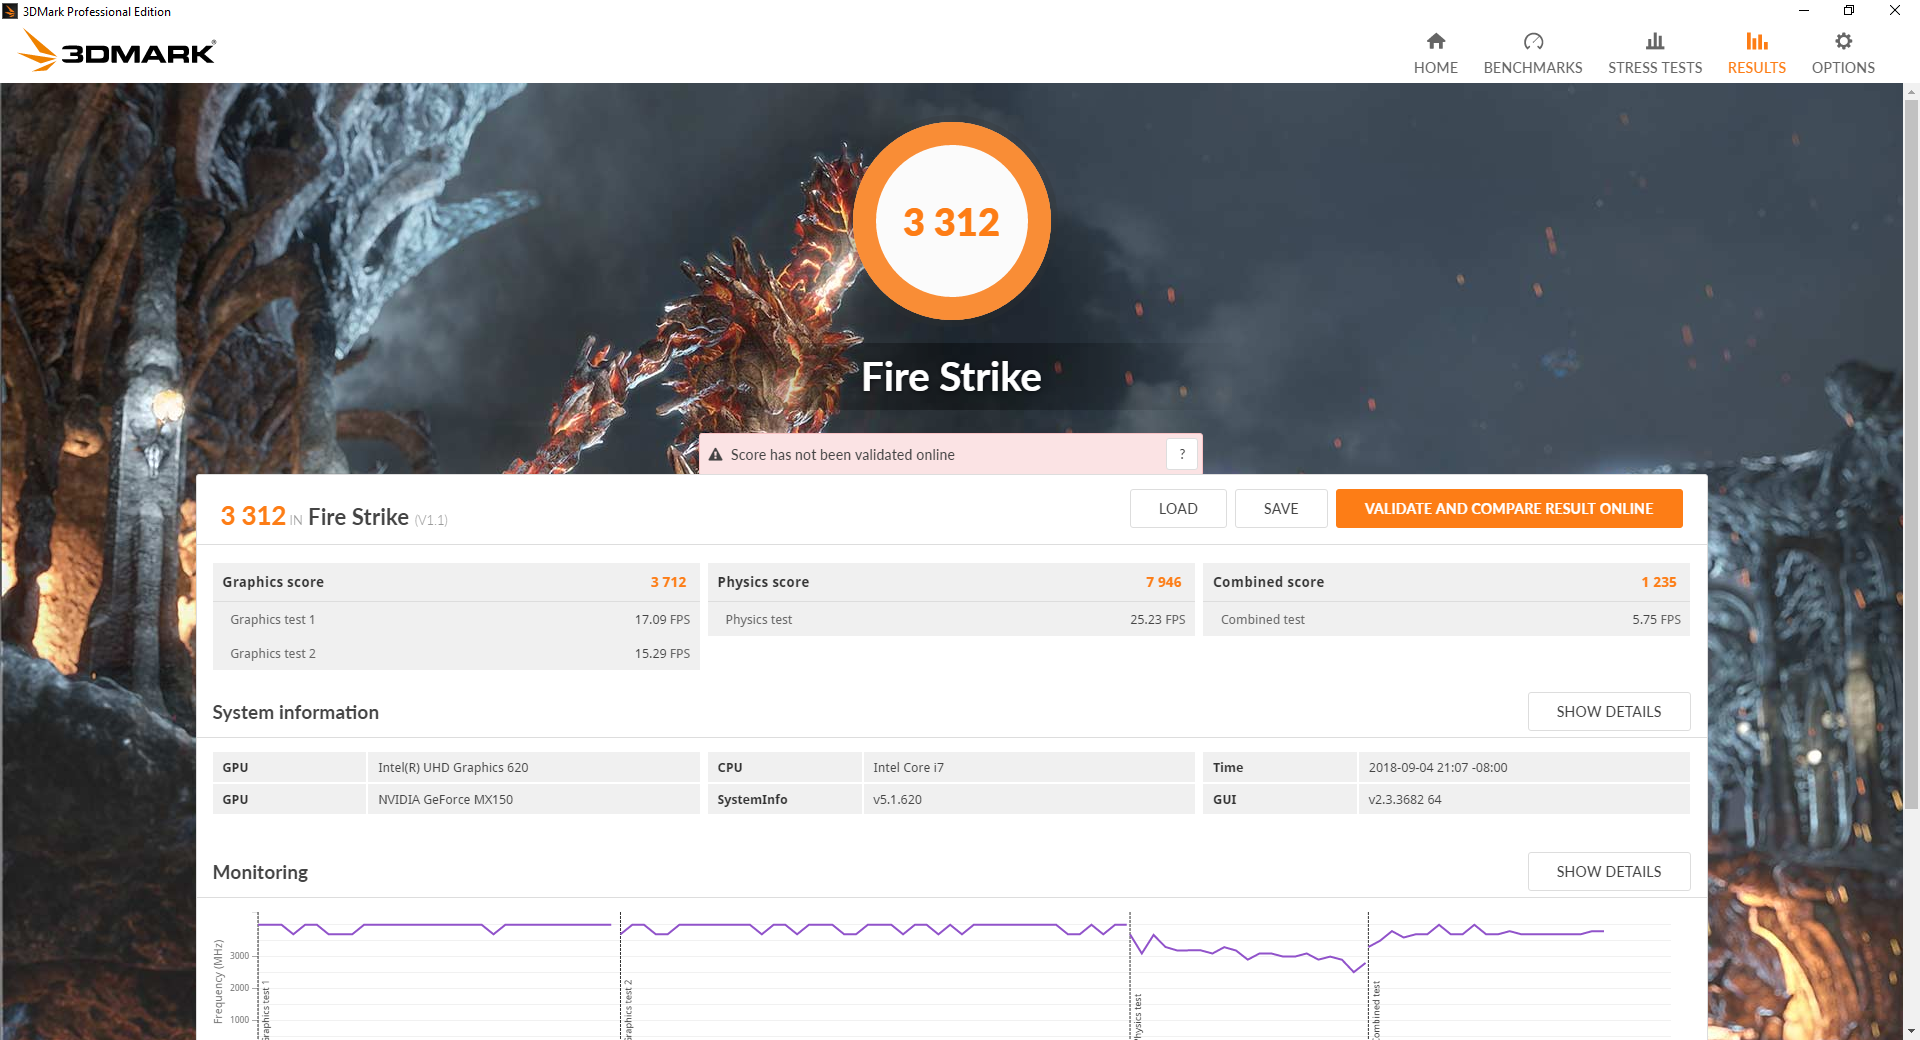
The MX150 in the MSI is about 10 to 15 percent faster than the average MX150 in our database to show that MSI didn't have to employ any performance tweaks to the GPU. The same GPU in other Ultrabooks, such as the Asus UX3430, is often underclocked in order to fit inside thin form factors. Users upgrading from the UHD Graphics 620, AMD RX Vega 10, or older GeForce 940MX will see a raw graphics boost of roughly 170 percent, 140 percent, and 80 percent, respectively. The Razer Blade 14 is an alternative option for even faster graphics performance albeit at twice the price of the PS42.
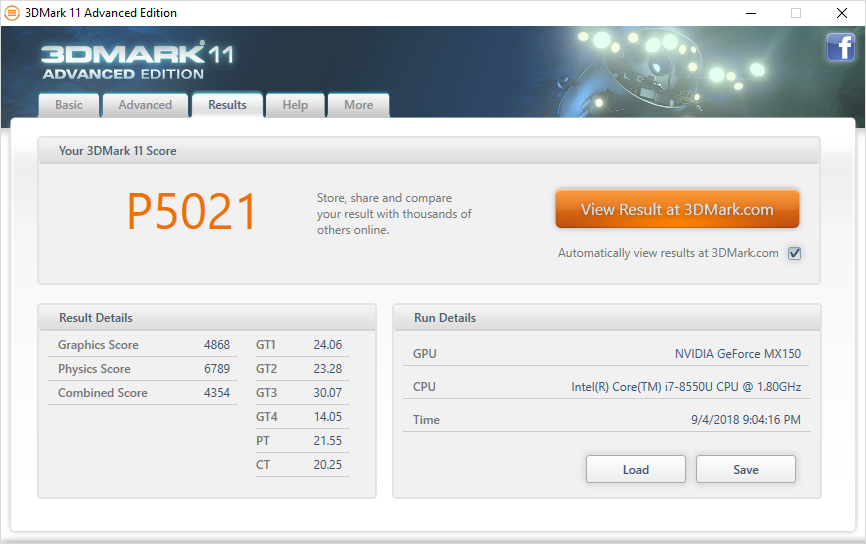
| 3DMark 11 Performance | 5021 points | |
| 3DMark Cloud Gate Standard Score | 13394 points | |
| 3DMark Fire Strike Score | 3312 points | |
Help | ||
Gaming Performance
The low-power GeForce MX150 is probably the best budget gaming GPU Nvidia has made for ultrathin laptops. Graphical settings on more demanding titles like Witcher 3 would have to be tuned down, but popular multiplayer titles like LoL, DOTA 2, or Overwatch will all run surprisingly well at 1080p given the small form factor.
See our dedicated page on the GeForce MX150 for more technical information and benchmark comparisons. It's important to remember that the PS42 is one of the few sub 15-inch notebooks with the faster '1D10' variant of the MX150 GPU and not the slower '1D12' variant. Notebooks with the '1D12' MX150 GPU, like the Matebook X Pro, can perform 20 percent slower in games.
| BioShock Infinite - 1920x1080 Ultra Preset, DX11 (DDOF) | |
| Dell G3 15 3579 | |
| Dell XPS 15 9575 i5-8305G | |
| MSI Prestige PS42 8RB-059 | |
| Average NVIDIA GeForce MX150 (27.8 - 35.2, n=33) | |
| Huawei Matebook X Pro i5 | |
| Asus VivoBook S410UQ-NH74 | |
| HP EliteBook 755 G5 3UN79EA | |
| HP EliteBook x360 1030 G3 | |
| Rise of the Tomb Raider - 1920x1080 Very High Preset AA:FX AF:16x | |
| Dell G3 15 3579 | |
| Dell XPS 15 9575 i5-8305G | |
| MSI Prestige PS42 8RB-059 | |
| Average NVIDIA GeForce MX150 (14.8 - 26, n=23) | |
| Asus VivoBook S410UQ-NH74 | |
| The Witcher 3 - 1920x1080 Ultra Graphics & Postprocessing (HBAO+) | |
| Dell XPS 15 9575 i5-8305G | |
| Dell G3 15 3579 | |
| MSI Prestige PS42 8RB-059 | |
| Average NVIDIA GeForce MX150 (6.5 - 17, n=25) | |
| Apple MacBook Pro 13 2018 Touchbar i5 | |
| low | med. | high | ultra | |
|---|---|---|---|---|
| BioShock Infinite (2013) | 187.2 | 113.1 | 95.6 | 34.8 |
| The Witcher 3 (2015) | 66.8 | 39.6 | 22.1 | 11.8 |
| Rise of the Tomb Raider (2016) | 77.1 | 42.5 | 22.1 | 18.8 |
Stress Test
We stress the PS42 with synthetic loads to identify for any potential throttling or stability issues. When subjected to Prime95 stress, the CPU can be observed operating at 2.5 GHz for the first few seconds before falling and stabilizing at 2.2 GHz and at a core temperature of 79 C. Since the base clock rate of the i7-8550U is 1.8 GHz, this means that the MSI is able to maintain a steady Turbo Boost of +400 MHz. If running both Prime95 and FurMark simultaneously, the CPU and GPU hold steady at 74 C and 78 C, respectively. The CPU impressively never falls below 2.2 GHz even when under such extreme loads.
Running Witcher 3 is more representative of real-world gaming load. The GPU can be observed operating at a steady 1734 MHz and at a core temperature of 76 C. In comparison, the slower '1D12' MX150 GPU in the Matebook X Pro will run at a significantly reduced clock rate of just 1038 MHz when under the same load conditions.
Running on batteries reduces both CPU and GPU power. A 3DMark 11 run on batteries returns Physics and Graphics scores of 6180 and 4281 points, respectively, compared to 6789 and 4868 points when on mains.
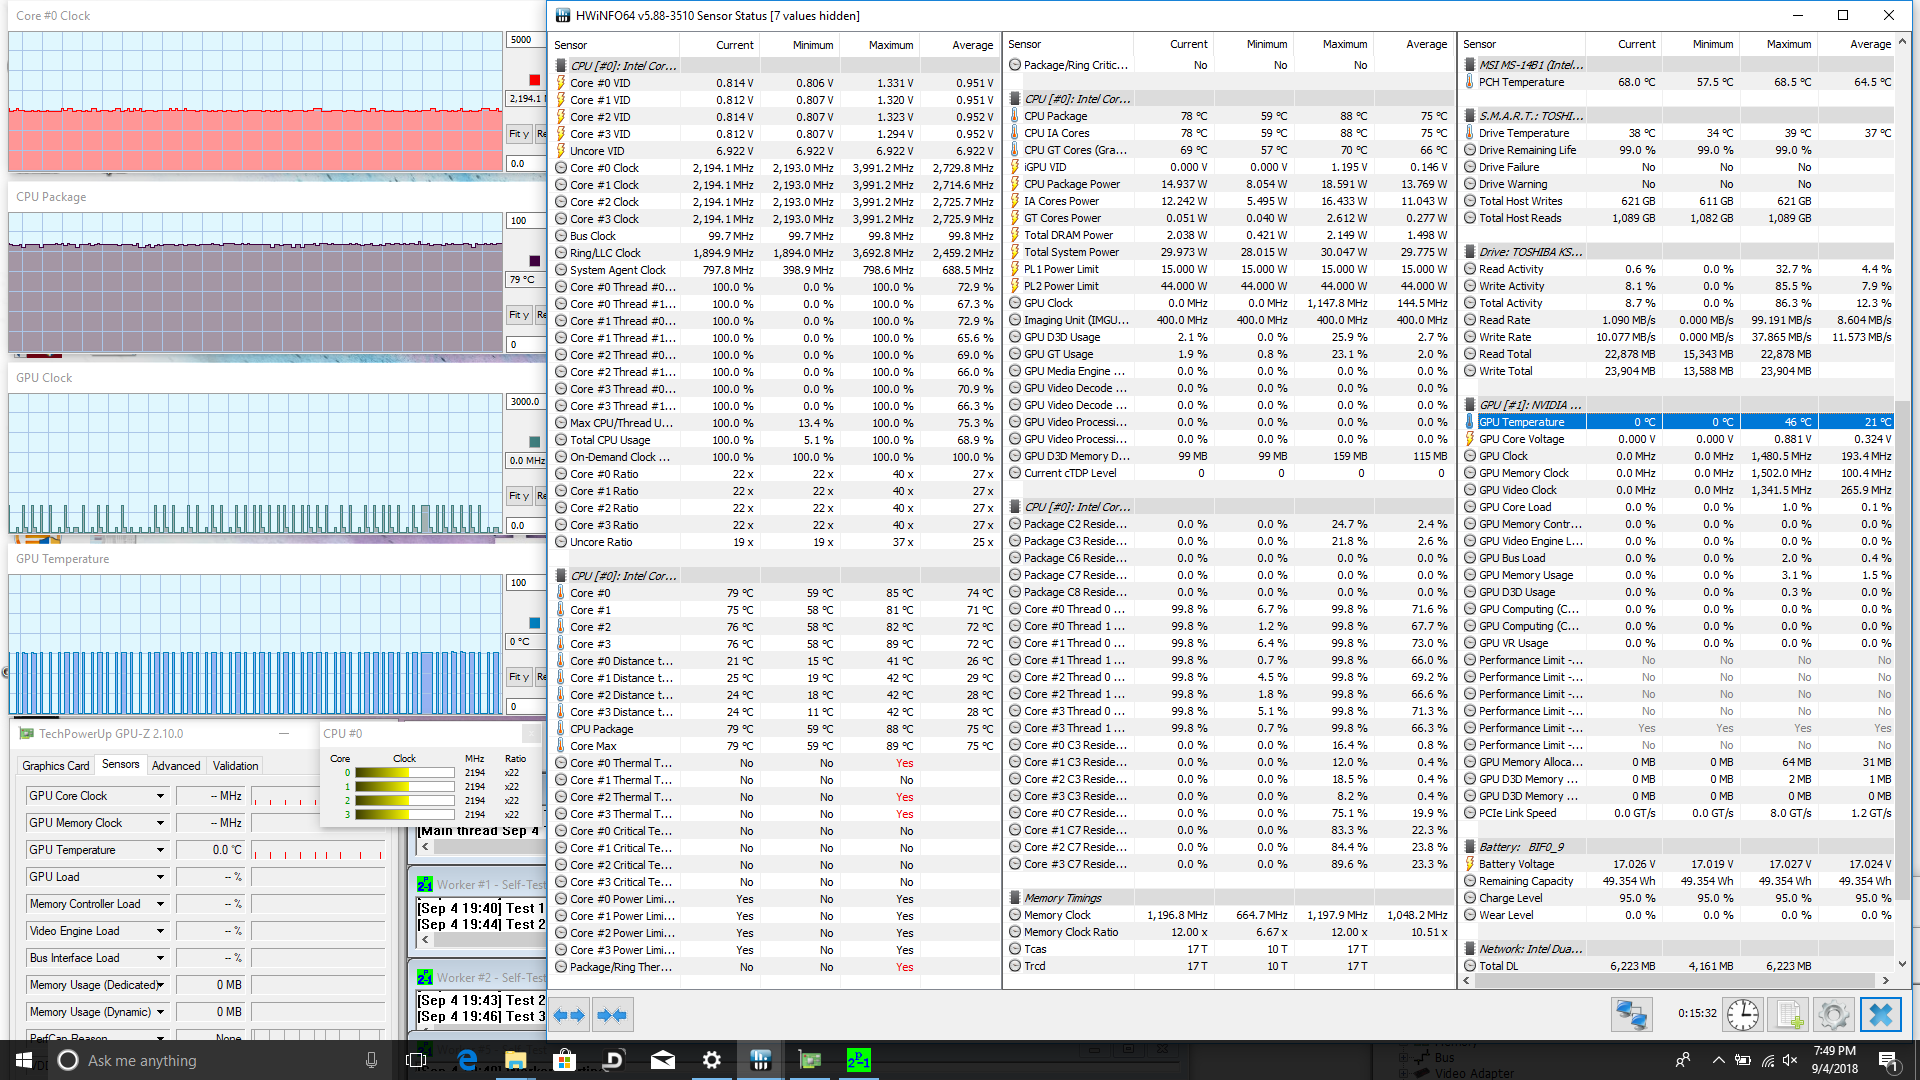
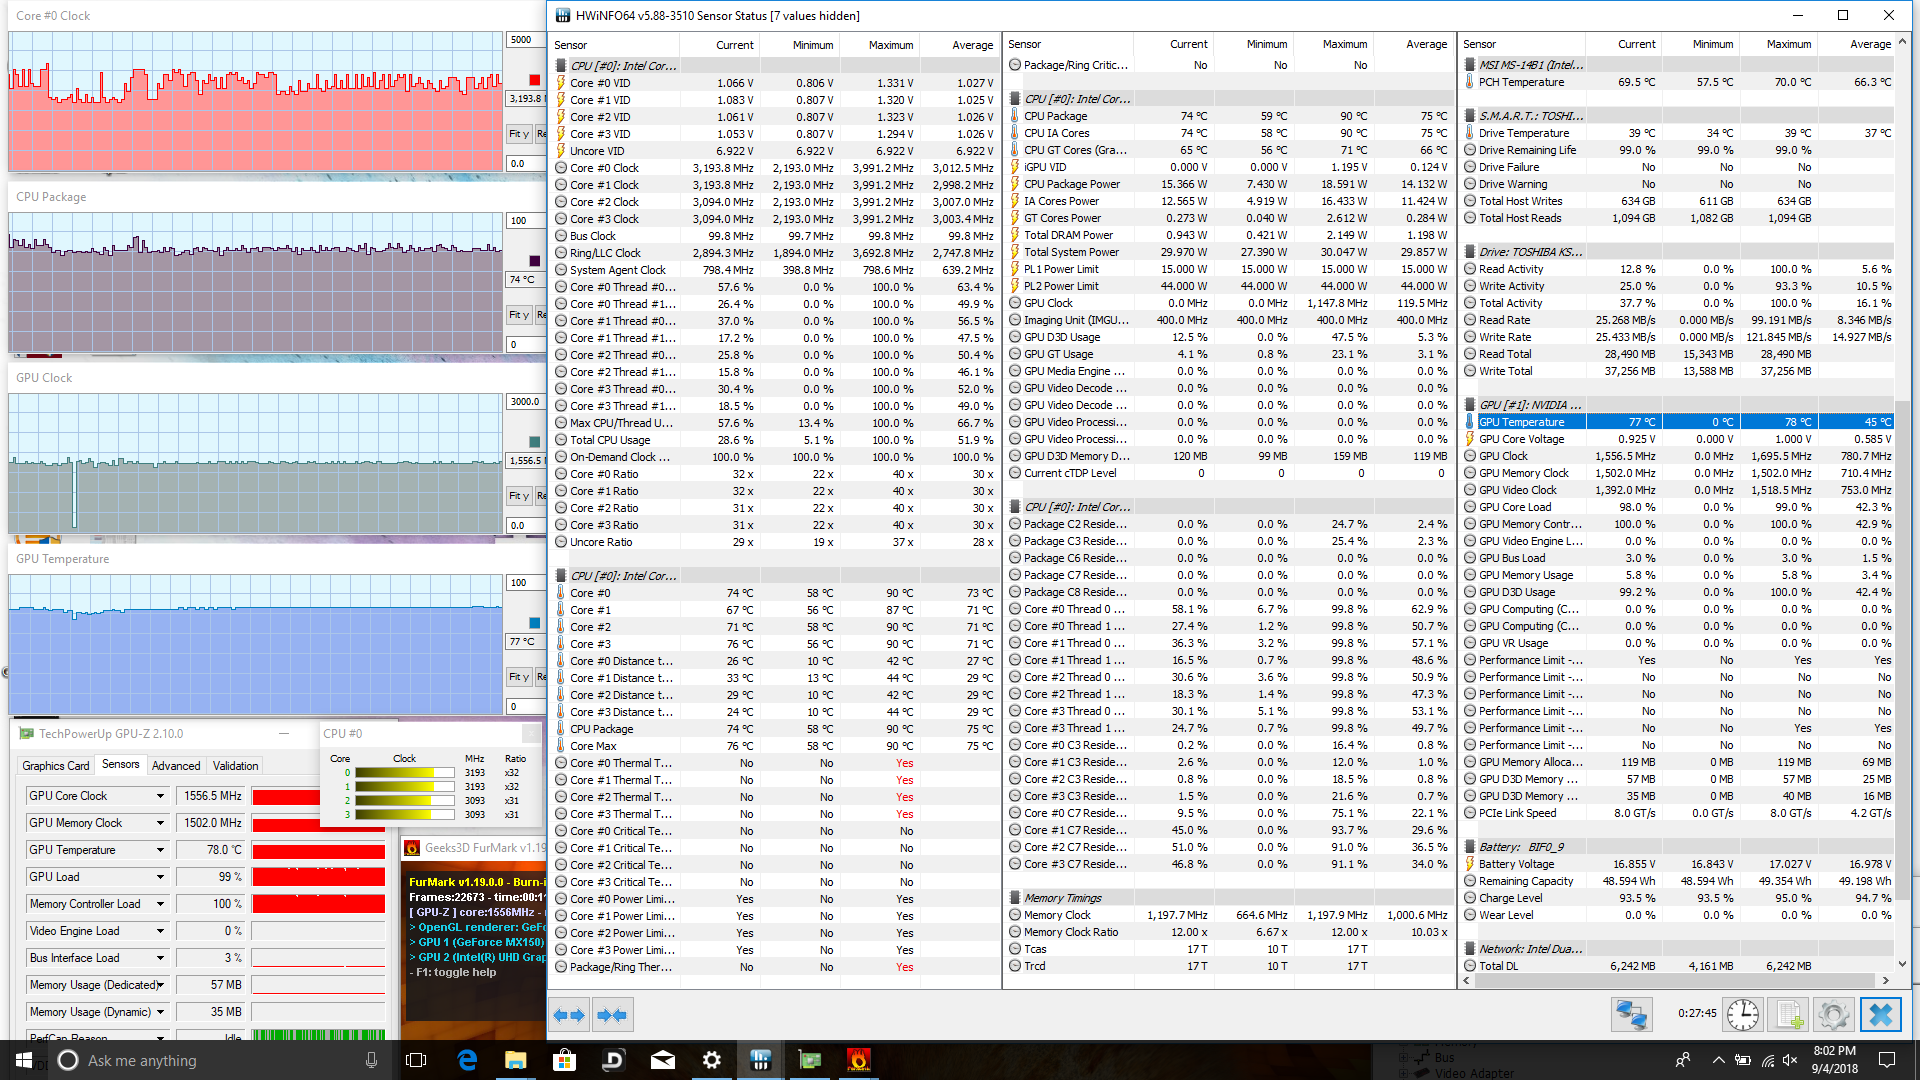
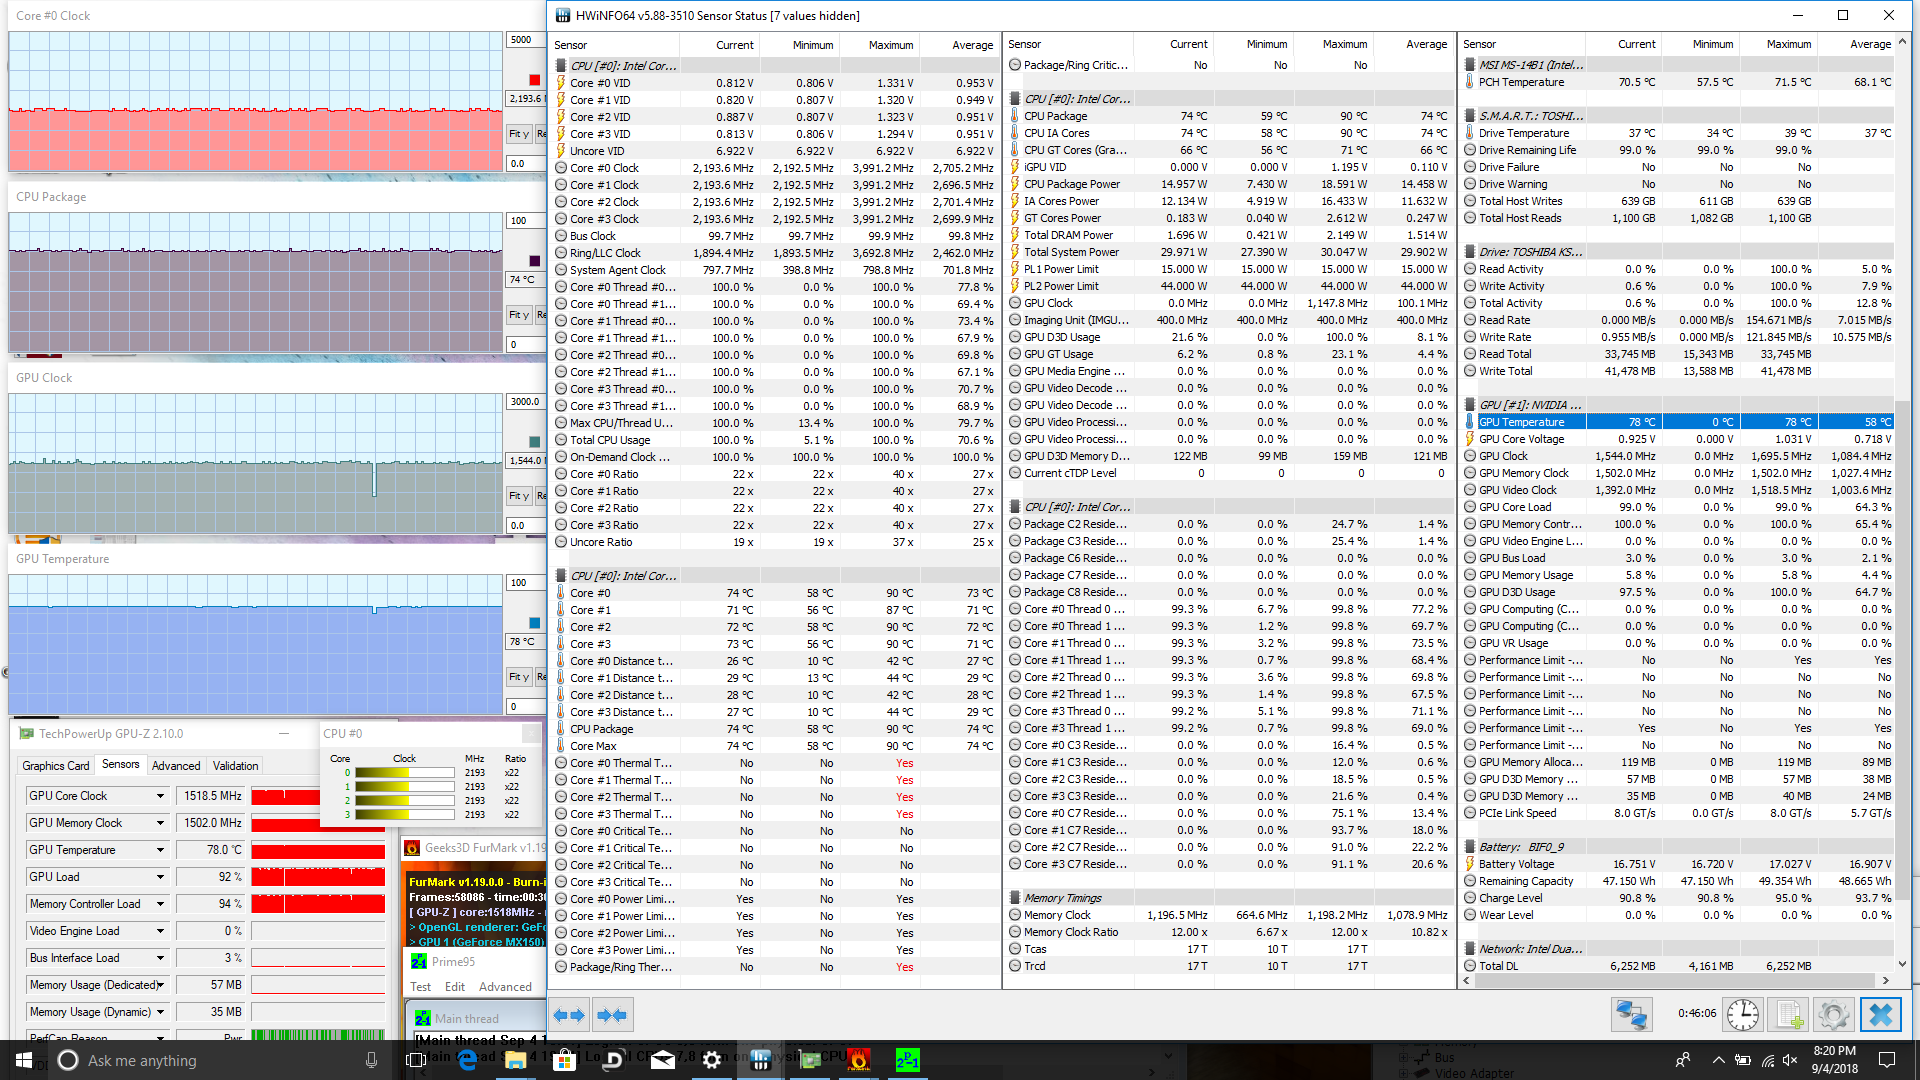
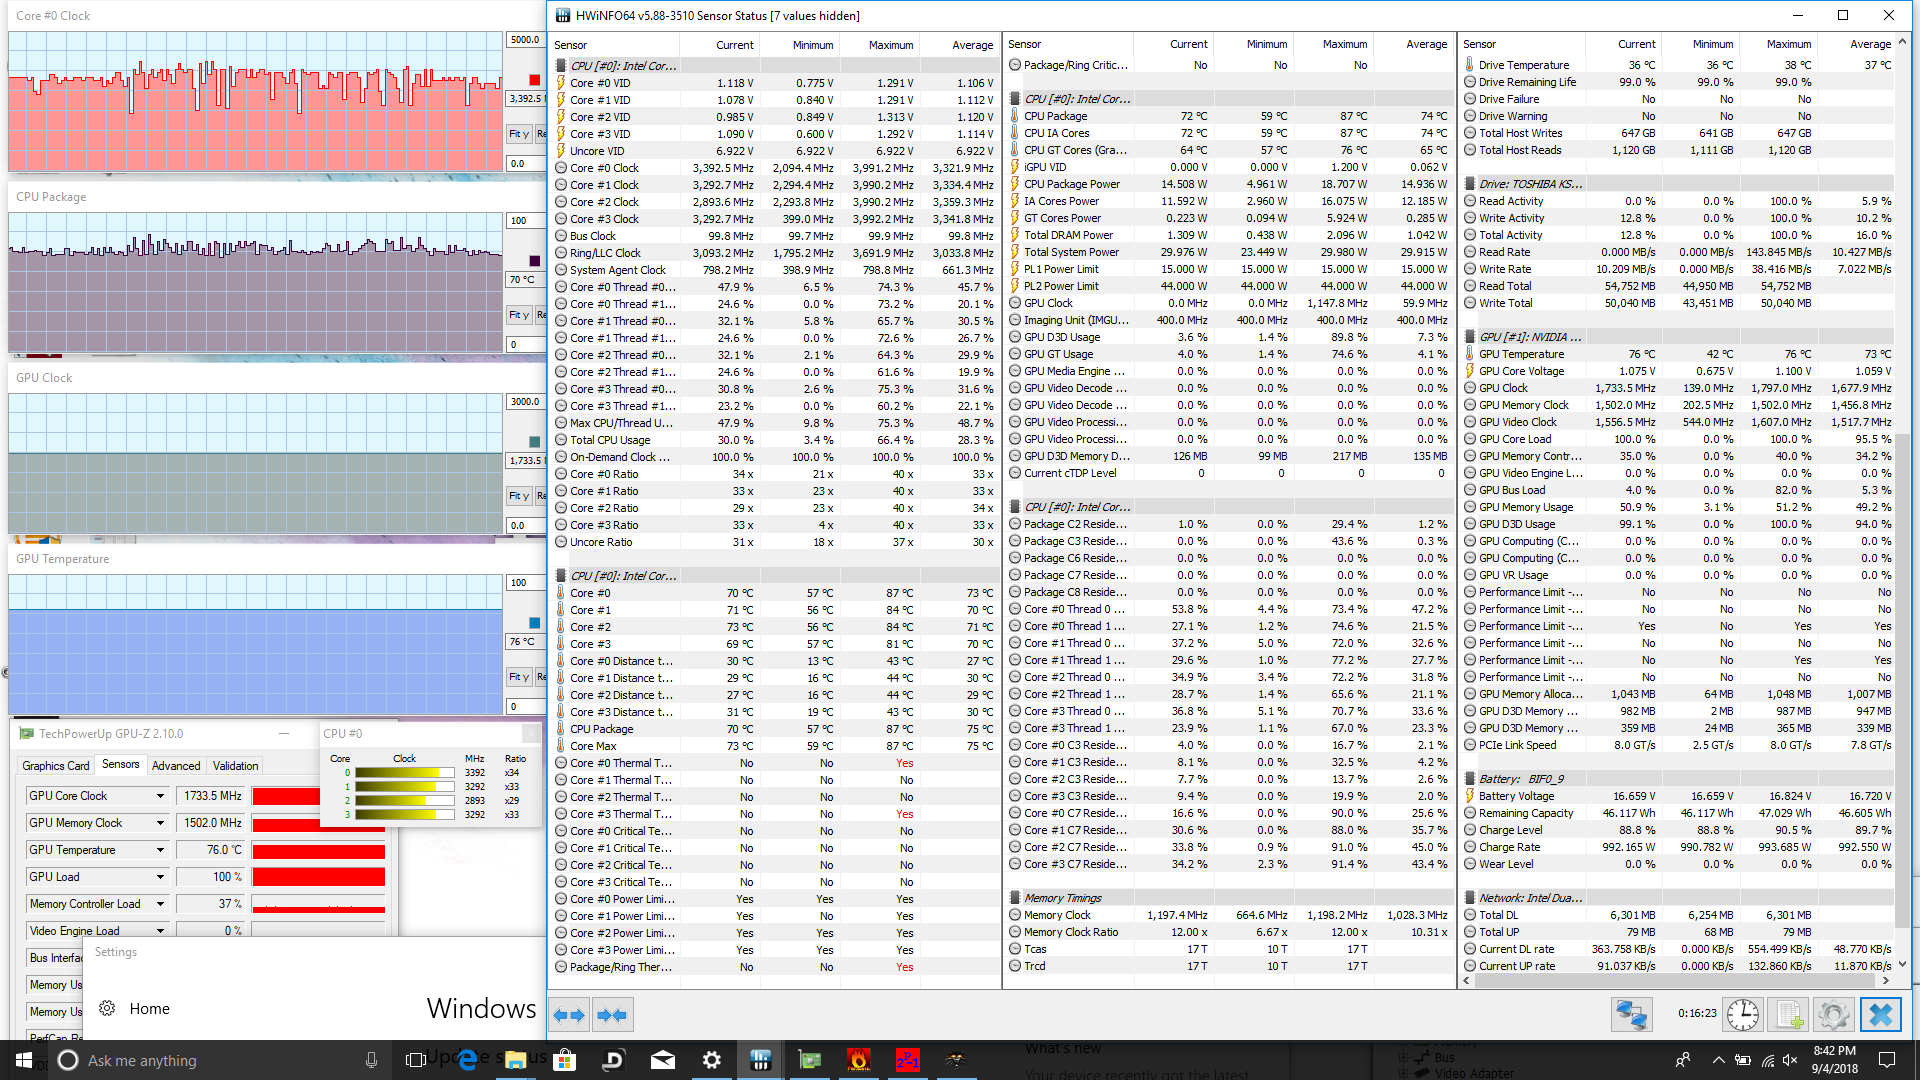
| CPU Clock (GHz) | GPU Clock (MHz) | Average CPU Temperature (°C) | Average GPU Temperature (°C) | |
| Prime95 Stress | 2.2 | -- | 79 | -- |
| FurMark Stress | -- | 1557 | -- | 77 |
| Prime95 + FurMark Stress | 2.2 | 1544 | 74 | 78 |
| Witcher 3 Stress | ~3.1 | 1734 | 71 | 76 |
Emissions
System Noise
The cooling solution consists of twin fans and three heat pipes with two of those heat pipes dedicated to the GPU. Most importantly, the size of the cooling solution is larger than on most other laptops equipped with the same GeForce MX150 GPU. The Acer Aspire 5 A517, for example, uses the exact same CPU and GPU as our MSI unit but with just a single fan and heat pipe shared between both processors. As a result, the dual fans in the PS42 can afford to be slower and more lethargic for a quieter experience.
Both fans remain inactive during low loads like browsing, streaming, or word processing for silent operation. Gaming will induce a fan noise of 38 dB(A) or higher not unlike a standard gaming laptop.
Our particular test unit suffers from minor coil whine or electronic noise that can only be heard when placing an ear near the keyboard keys. It's fortunately inaudible when in a typical office environment, but it's present nonetheless.
Noise level
| Idle |
| 28.7 / 28.7 / 28.7 dB(A) |
| Load |
| 33.4 / 45 dB(A) |
 | ||
30 dB silent 40 dB(A) audible 50 dB(A) loud |
||
min: | ||
| MSI Prestige PS42 8RB-059 GeForce MX150, i5-8550U, Toshiba KSG60ZMV512G | Dell XPS 13 9370 i7 UHD UHD Graphics 620, i5-8550U, Toshiba XG5 KXG50ZNV512G | Huawei Matebook X Pro i5 GeForce MX150, i5-8250U, Samsung PM961 MZVLW256HEHP | Lenovo ThinkPad T480s-20L7002AUS UHD Graphics 620, i5-8250U, Samsung PM961 MZVLW256HEHP | HP EliteBook x360 1030 G3 UHD Graphics 620, i5-8250U, Samsung PM871b MZNLN128HAHQ | Asus Zenbook UX3430UN-GV174T GeForce MX150, i5-8250U, SK Hynix HFS256G39TND-N210A | |
|---|---|---|---|---|---|---|
| Noise | 3% | -2% | 2% | 6% | -5% | |
| off / environment * (dB) | 28.3 | 28 1% | 27.9 1% | 28.1 1% | 28.5 -1% | 30 -6% |
| Idle Minimum * (dB) | 28.7 | 28 2% | 27.9 3% | 28.1 2% | 28.5 1% | 30 -5% |
| Idle Average * (dB) | 28.7 | 28 2% | 27.9 3% | 28.1 2% | 28.5 1% | 30 -5% |
| Idle Maximum * (dB) | 28.7 | 28 2% | 27.9 3% | 28.1 2% | 28.5 1% | 33.1 -15% |
| Load Average * (dB) | 33.4 | 32.5 3% | 36.2 -8% | 35.5 -6% | 31.3 6% | 37.6 -13% |
| Witcher 3 ultra * (dB) | 38.2 | 45 -18% | ||||
| Load Maximum * (dB) | 45 | 42.2 6% | 45.2 -0% | 41.5 8% | 33.5 26% | 37.6 16% |
* ... smaller is better
Temperature
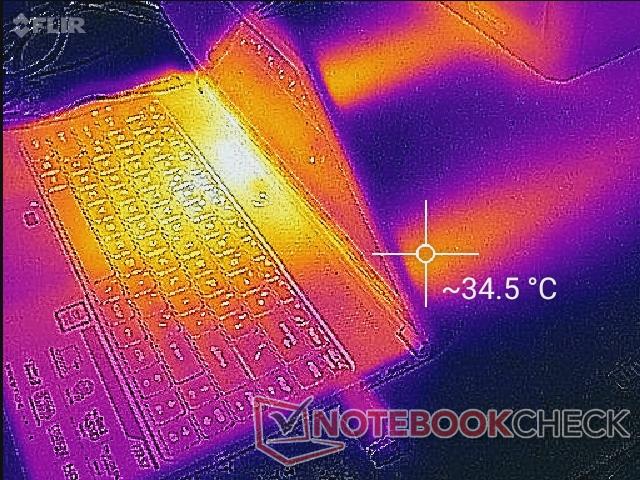
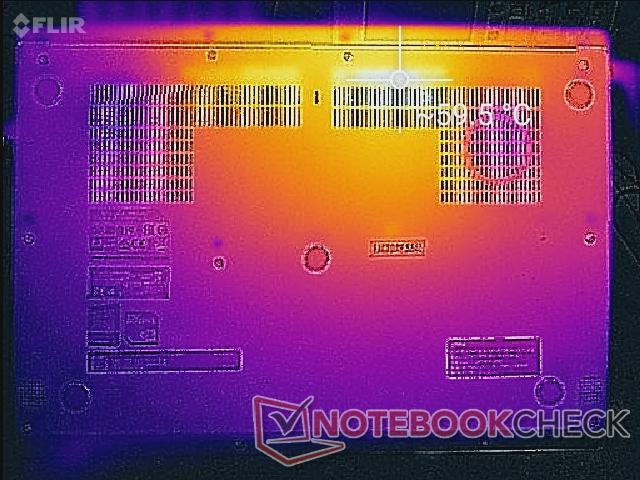
Perhaps unsurprisingly, surface temperatures are similar to the GS63 or GS73 in terms of gradient when the PS42 is under stress. The center of the notebook will always be warmest due to the roughly symmetrical positioning of the heat pipes and processors within. Hot spots can reach up to 46 C and 60 C when gaming as shown by our temperature maps below, but these areas are fortunately towards the rear of the system where users are less likely to touch. In comparison, the 14-inch Zenbook UX3430UN with the same MX150 GPU can have surfaces as warm as 55 C when subjected to similar loads. We recommend using a flat desk if gaming to avoid covering the very warm ventilation grilles underneath.
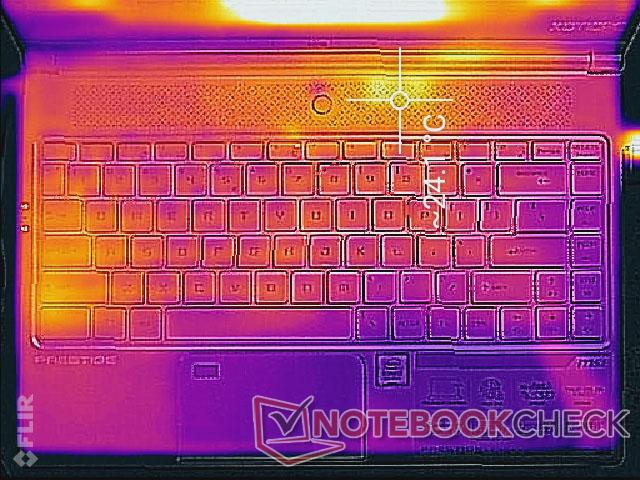
Surface temperatures when idling are flat on both sides of the laptop save for the small areas nearest the GPU where it can be as warm as 29 C. It's important to not cover the grilles above the keyboard since these allow for airflow.
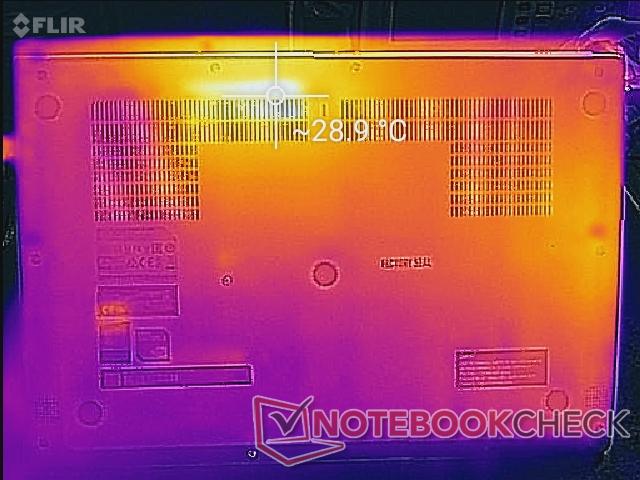
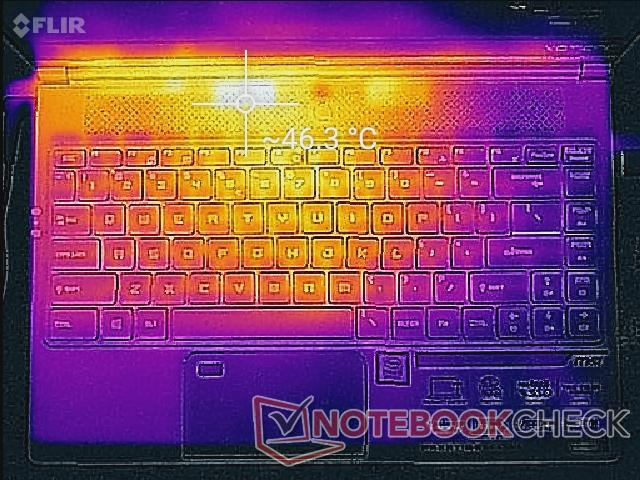
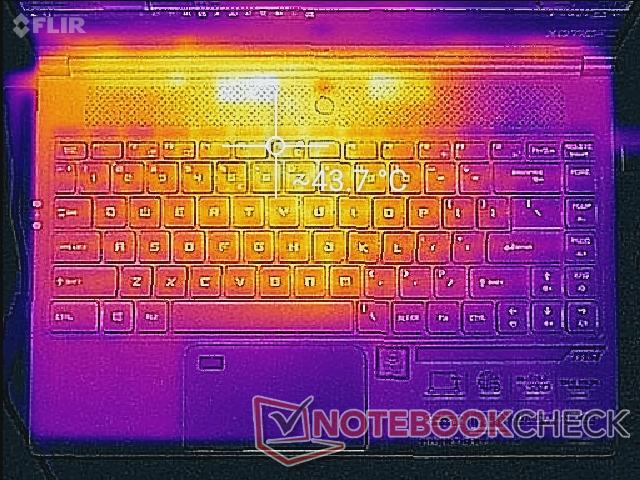
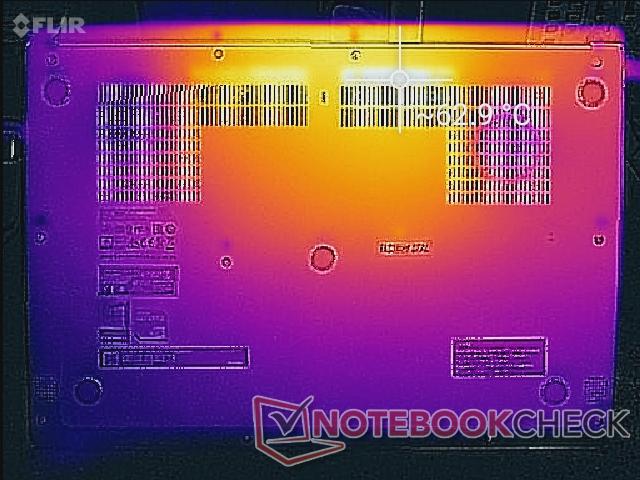
(-) The maximum temperature on the upper side is 47 °C / 117 F, compared to the average of 34.3 °C / 94 F, ranging from 21.2 to 62.5 °C for the class Office.
(-) The bottom heats up to a maximum of 63.4 °C / 146 F, compared to the average of 36.8 °C / 98 F
(+) In idle usage, the average temperature for the upper side is 22.5 °C / 73 F, compared to the device average of 29.5 °C / 85 F.
(±) Playing The Witcher 3, the average temperature for the upper side is 33.5 °C / 92 F, compared to the device average of 29.5 °C / 85 F.
(+) The palmrests and touchpad are cooler than skin temperature with a maximum of 29 °C / 84.2 F and are therefore cool to the touch.
(±) The average temperature of the palmrest area of similar devices was 27.5 °C / 81.5 F (-1.5 °C / -2.7 F).
Speakers
The stereo speakers are disappointingly soft in volume and should have been louder for use in conference rooms and presentations. Bass is lacking as shown by our pink noise measurements and sound quality is therefore average at best. The B&O speakers of the Spectre 13 manage to to be louder and stronger in a smaller form factor than the MSI. Fortunately, high volume settings do not introduce static or major reverberations.


MSI Prestige PS42 8RB-059 audio analysis
(-) | not very loud speakers (68.2 dB)
Bass 100 - 315 Hz
(-) | nearly no bass - on average 23.5% lower than median
(±) | linearity of bass is average (13.1% delta to prev. frequency)
Mids 400 - 2000 Hz
(+) | balanced mids - only 3.9% away from median
(±) | linearity of mids is average (8.1% delta to prev. frequency)
Highs 2 - 16 kHz
(+) | balanced highs - only 4.9% away from median
(±) | linearity of highs is average (7.1% delta to prev. frequency)
Overall 100 - 16.000 Hz
(±) | linearity of overall sound is average (27.4% difference to median)
Compared to same class
» 85% of all tested devices in this class were better, 5% similar, 10% worse
» The best had a delta of 7%, average was 21%, worst was 53%
Compared to all devices tested
» 83% of all tested devices were better, 4% similar, 13% worse
» The best had a delta of 4%, average was 24%, worst was 134%
Apple MacBook 12 (Early 2016) 1.1 GHz audio analysis
(+) | speakers can play relatively loud (83.6 dB)
Bass 100 - 315 Hz
(±) | reduced bass - on average 11.3% lower than median
(±) | linearity of bass is average (14.2% delta to prev. frequency)
Mids 400 - 2000 Hz
(+) | balanced mids - only 2.4% away from median
(+) | mids are linear (5.5% delta to prev. frequency)
Highs 2 - 16 kHz
(+) | balanced highs - only 2% away from median
(+) | highs are linear (4.5% delta to prev. frequency)
Overall 100 - 16.000 Hz
(+) | overall sound is linear (10.2% difference to median)
Compared to same class
» 7% of all tested devices in this class were better, 2% similar, 91% worse
» The best had a delta of 5%, average was 18%, worst was 53%
Compared to all devices tested
» 5% of all tested devices were better, 1% similar, 94% worse
» The best had a delta of 4%, average was 24%, worst was 134%
Energy Management
Power Consumption
When under high loads, the PS42 will draw anywhere from 55 W to 63 W or noticeably more than many other Ultrabooks including the Matebook X Pro and Zenbook UX3430UN. The full-power GeForce MX150 in the MSI is likely responsible for the higher power consumption as the slower and less demanding '1D12' MX150 variant is more common in competing Ultrabooks. Competitors with integrated Intel UHD Graphics only, such as the XPS 13 or Spectre 13, can be twice as power efficient as the MSI when under high loads.
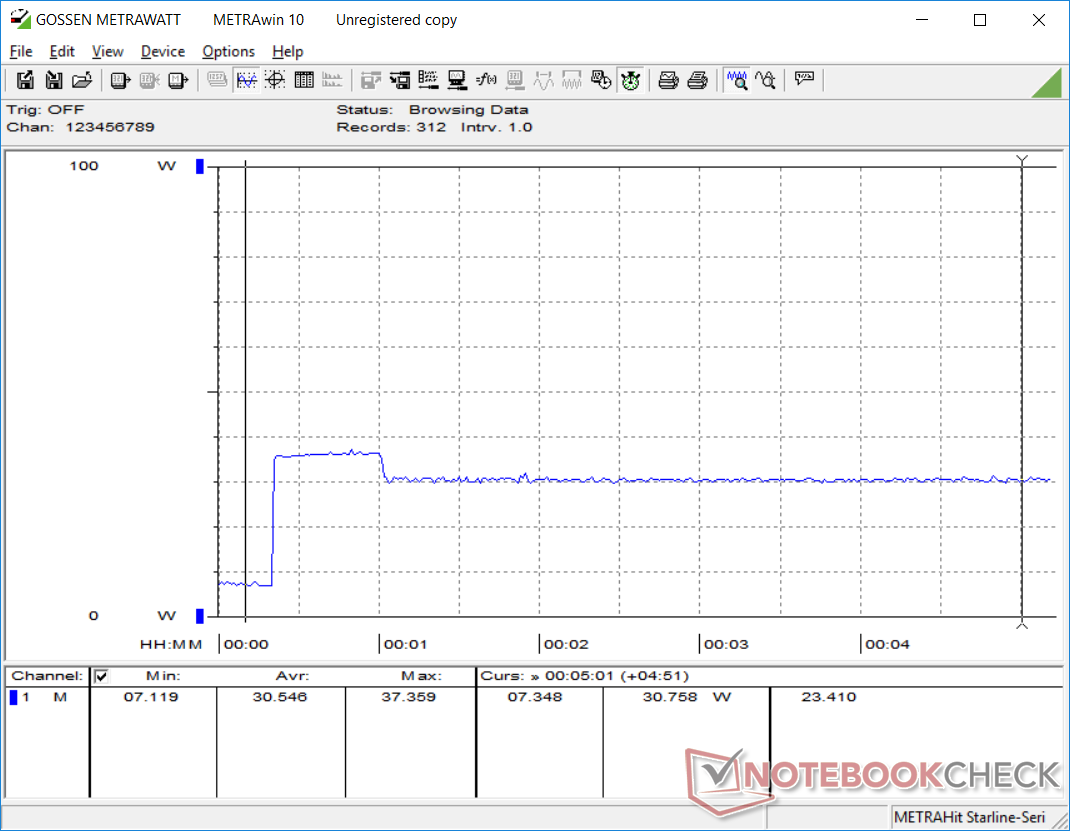
When running Prime95, power consumption jumps to about 37 W for the first few seconds before falling to a steady 30.8 W as shown by the graph to the right. The data correlates with our Prime95 stress test above where clock rates are fastest for the first few seconds only.
Our PS42 test unit ships with a small (~10.5 x 4.5 x 3.0 cm) 65 W AC adapter while the configurations with no MX150 graphics ship with a 40 W AC adapter.
| Off / Standby | |
| Idle | |
| Load |
|
Key:
min: | |
| MSI Prestige PS42 8RB-059 i5-8550U, GeForce MX150, Toshiba KSG60ZMV512G, IPS, 1920x1080, 14" | Dell XPS 13 9370 i7 UHD i5-8550U, UHD Graphics 620, Toshiba XG5 KXG50ZNV512G, IPS, 3840x2160, 13.3" | Huawei Matebook X Pro i5 i5-8250U, GeForce MX150, Samsung PM961 MZVLW256HEHP, IPS, 3000x2000, 13.9" | Asus Zenbook UX3430UN-GV174T i5-8250U, GeForce MX150, SK Hynix HFS256G39TND-N210A, IPS, 1920x1080, 14" | HP EliteBook x360 1030 G3 i5-8250U, UHD Graphics 620, Samsung PM871b MZNLN128HAHQ, IPS, 1920x1080, 13.3" | Lenovo ThinkPad T480s-20L7002AUS i5-8250U, UHD Graphics 620, Samsung PM961 MZVLW256HEHP, TFT-LCD, 1920x1080, 14" | |
|---|---|---|---|---|---|---|
| Power Consumption | 5% | 1% | 5% | 22% | 27% | |
| Idle Minimum * (Watt) | 5.6 | 5 11% | 3.5 37% | 4.5 20% | 3.8 32% | 3.1 45% |
| Idle Average * (Watt) | 6.5 | 8.3 -28% | 8.9 -37% | 7.8 -20% | 7.5 -15% | 6.4 2% |
| Idle Maximum * (Watt) | 7.9 | 8.8 -11% | 12.3 -56% | 8.1 -3% | 8.6 -9% | 9.4 -19% |
| Load Average * (Watt) | 62.3 | 46.4 26% | 54.2 13% | 52 17% | 33.1 47% | 29.8 52% |
| Witcher 3 ultra * (Watt) | 55.7 | 42.4 24% | ||||
| Load Maximum * (Watt) | 67 | 48.6 27% | 52.1 22% | 59 12% | 31.8 53% | 31.2 53% |
* ... smaller is better
Battery Life
MSI advertises a 10-hour battery life from its integrated 50 Wh battery. Our own real-world WLAN test shows a battery life of about 8.5 hours which we consider to be quite close to the manufacturer claim. Results are comparable to other Ultrabooks like the Zenbook UX3430 and MateBook X Pro. Simply idling on desktop at the lowest brightness setting can last for an impressive 17 hours.
Charging from near empty to full capacity takes a little over 2 hours.
| MSI Prestige PS42 8RB-059 i5-8550U, GeForce MX150, 50 Wh | Apple MacBook Pro 15 2018 (2.6 GHz, 560X) i7-8850H, Radeon Pro 560X, 83 Wh | Dell XPS 13 9370 i7 UHD i5-8550U, UHD Graphics 620, 52 Wh | Huawei Matebook X Pro i5 i5-8250U, GeForce MX150, 57.4 Wh | Lenovo ThinkPad T480s-20L7002AUS i5-8250U, UHD Graphics 620, 57 Wh | Asus Zenbook UX3430UN-GV174T i5-8250U, GeForce MX150, 48 Wh | HP EliteBook x360 1030 G3 i5-8250U, UHD Graphics 620, 56.2 Wh | |
|---|---|---|---|---|---|---|---|
| Battery runtime | -32% | -25% | -2% | -40% | -7% | 21% | |
| Reader / Idle (h) | 16.8 | 13.7 -18% | 20.7 23% | 22.8 36% | 23 37% | ||
| WiFi v1.3 (h) | 14.9 | 10.2 -32% | 7.8 -48% | 9.3 -38% | 9 -40% | 8.1 -46% | 10 -33% |
| Load (h) | 2 | 1.8 -10% | 2.2 10% | 1.8 -10% | 3.2 60% | ||
| Witcher 3 ultra (h) | 1.5 |
Pros
Cons
Verdict

The MSI PS42 has a lot going for it, but the handful of cut corners are hard to ignore. For one, the lack of Thunderbolt 3 limits connectivity and versatility. This wouldn't have been an issue if the PS42 was cheaper, but it retails for about the same price as the XPS 13, HP Spectre 13, or MateBook X Pro which all have Thunderbolt 3 as standard. The dimmer display, slower 1x1 WiFi, single-channel RAM, slightly under-performing CPU, and less rigid chassis are all disappointing to see when most competitors offer better options.
The redeeming qualities of the PS42 are its light weight, very accurate 1080p matte display, and full-power GeForce MX150 GPU. This is probably the only 14-inch laptop using a 25 W '1D10' MX150 GPU instead of the slower 10 W variant. Users can game or perform graphics-intensive tasks without fear of GPU throttling.
If GPU performance and portability are of utmost performance, then the PS42 can be a good option. Otherwise, invest $200 to $300 more in the 13.9-inch MateBook X Pro as it is the stronger laptop for word processing and day-to-day usage.
The PS42 is a respectable first attempt at a narrow-bezel business laptop from MSI with its strong graphics performance, light weight, and accurate colors. Nonetheless, its handful of cut corners means MSI has a long way to go before it can stand toe-to-toe with veteran Ultrabook makers.
MSI Prestige PS42 8RB-059
- 10/26/2019 v7 (old)
Allen Ngo
Price comparison
