Lenovo ThinkPad T580 (i7-8650U, FHD) Laptop Review
While smaller notebooks are all the rage these days, some business users still demand a larger display and accompanying numeric keypad. Machines incorporating these venerable features may be thinning further with each new hardware generation, but Lenovo still provides a mainstream, top-end ThinkPad for the task: the 15.6-inch T580. A few months back, we evaluated a high-end T580 configuration featuring a Core i7, GeForce MX150 graphics, and a UHD display. This particular setup retails for close to $2,400 as of this writing—and while we were convinced overall by the quality of our test unit, we specifically regretted the heavy power consumption (and associated high heat and weak battery runtimes) as well as a lackluster overall performance from the UHD display.
But what if a dedicated GPU and an ultra-high-resolution display aren’t critical requirements? Perhaps a system with everything but those items (and correspondingly a smaller external battery) makes more sense for the average business user. That’s precisely what we’ll be exploring with today’s configuration, which swaps the dedicated GPU for vanilla integrated Intel UHD Graphics and the display for an FHD embedded touch panel. Elsewhere, the CPU has actually been bumped up to a Core i7-8650U and the RAM has doubled to 16 GB. The price with these options currently comes in at $1,887; is this the 15-inch business notebook to own?
Preliminary Notes
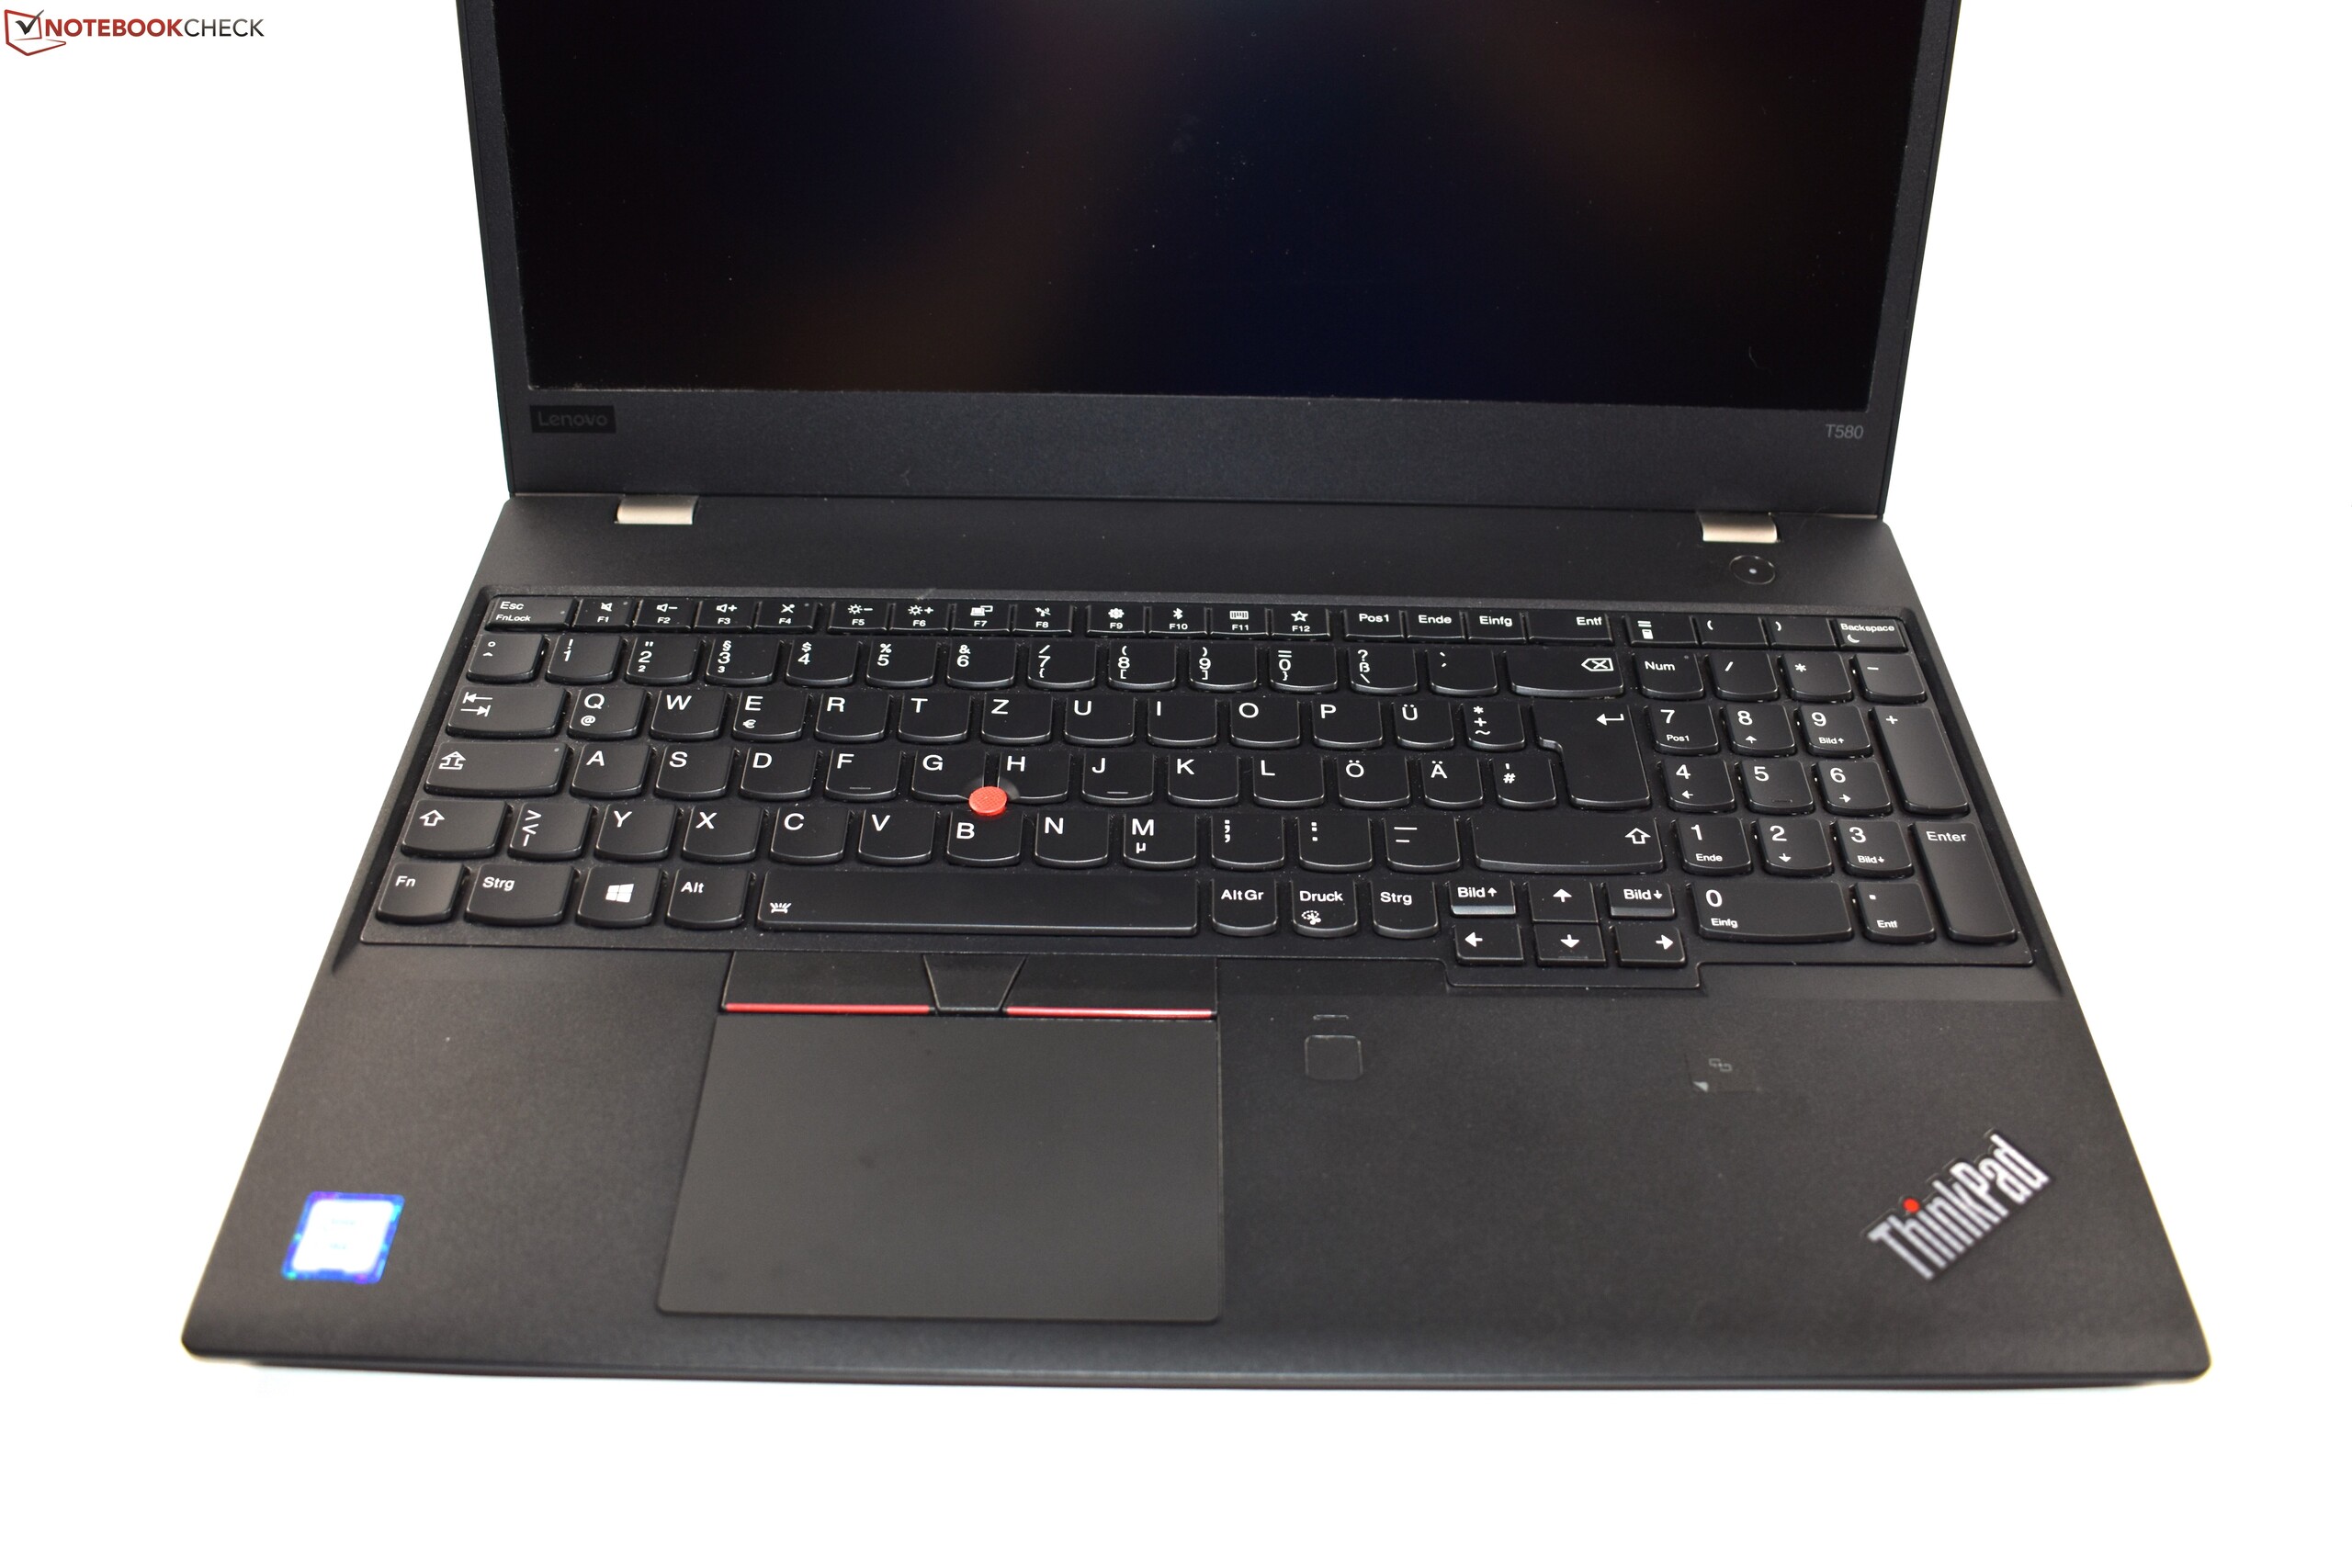
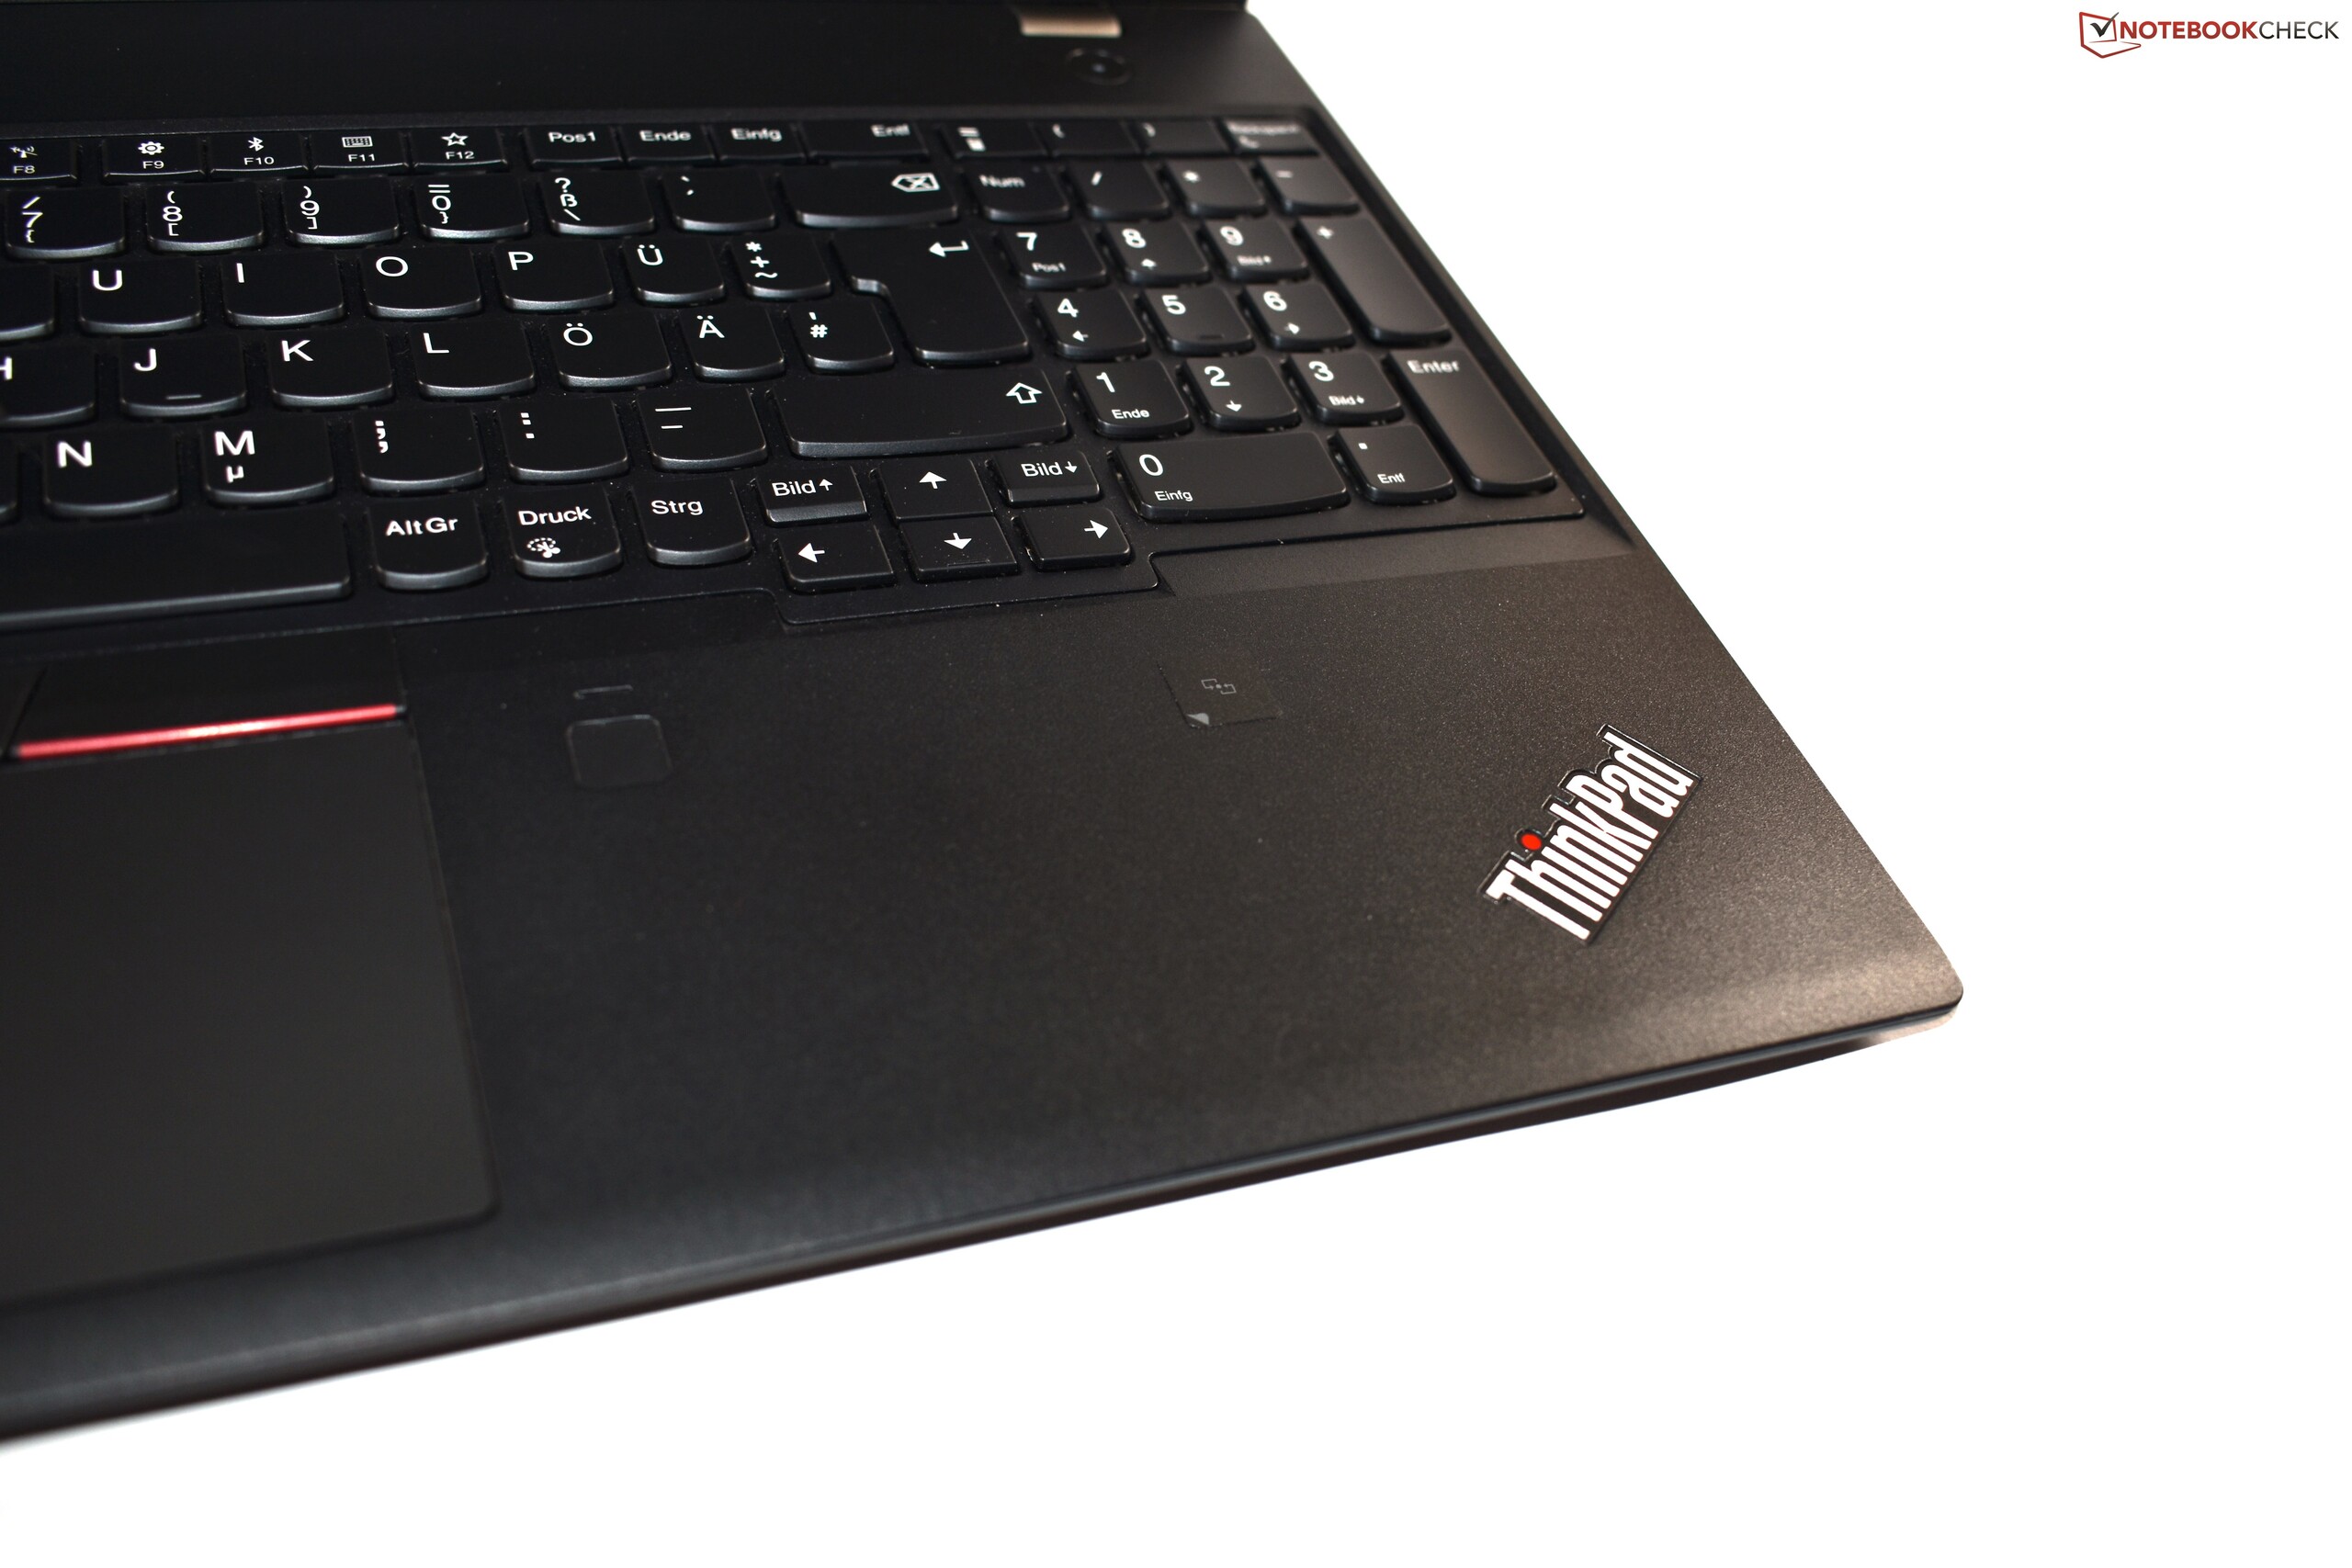
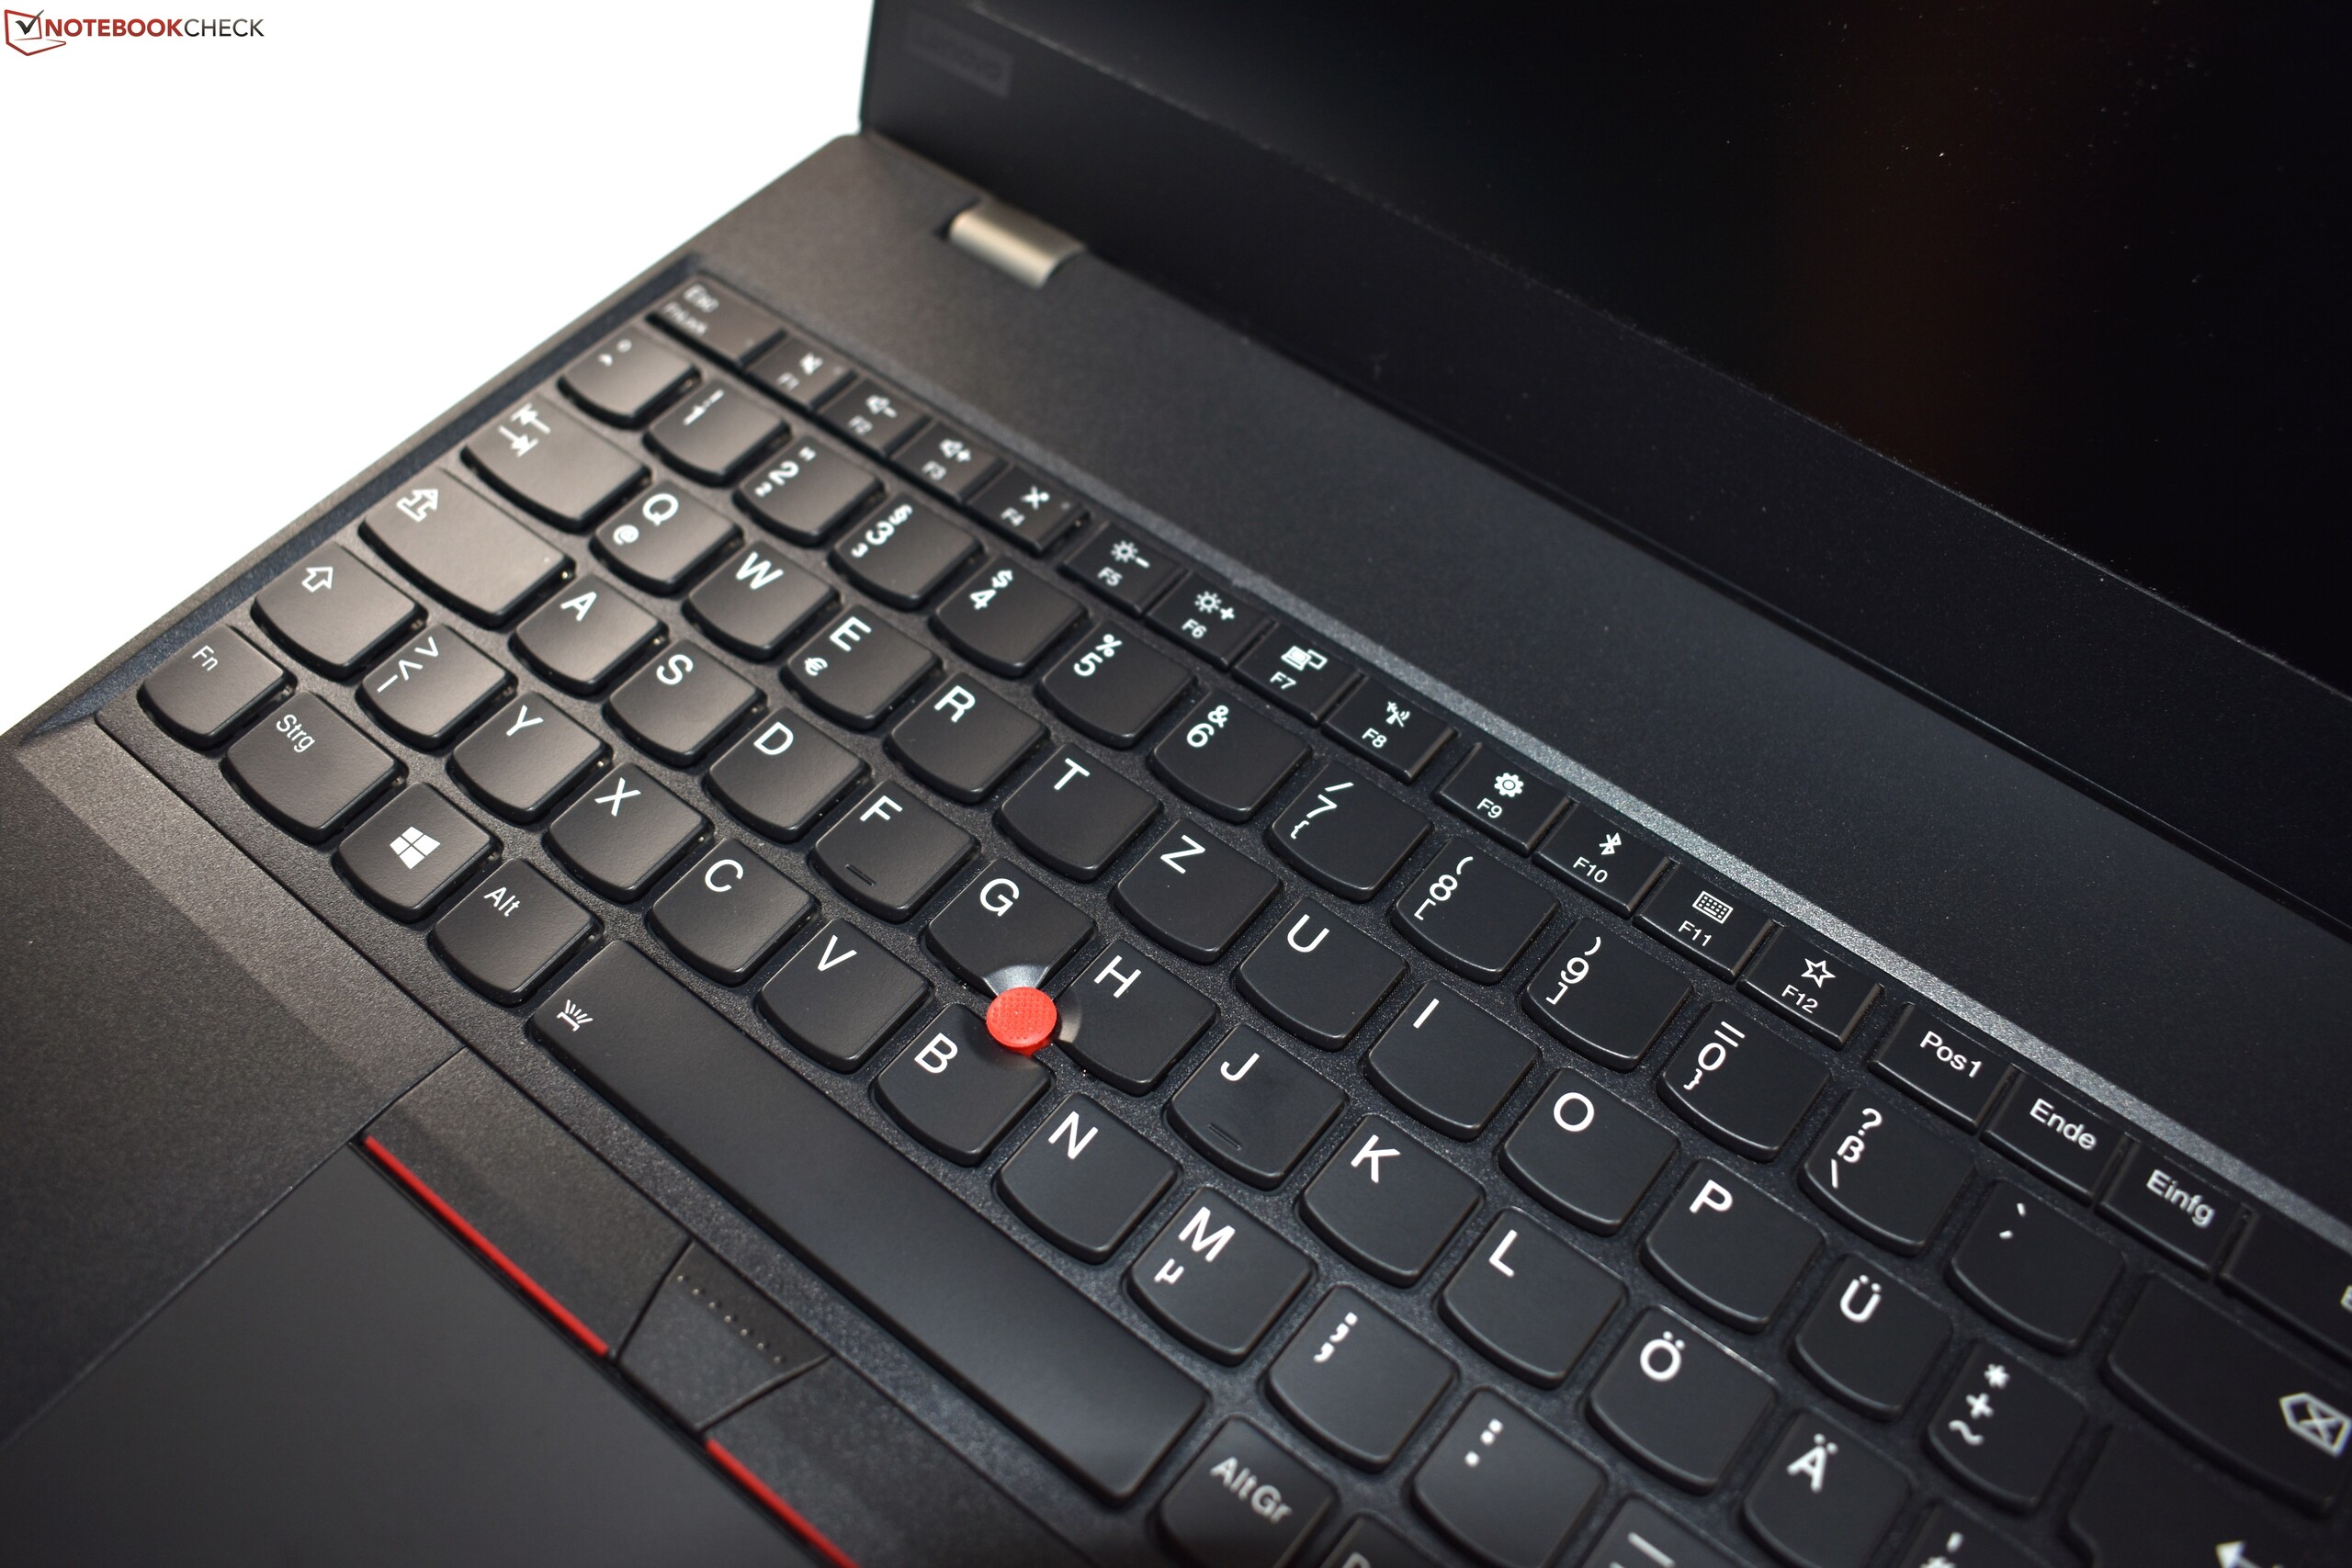
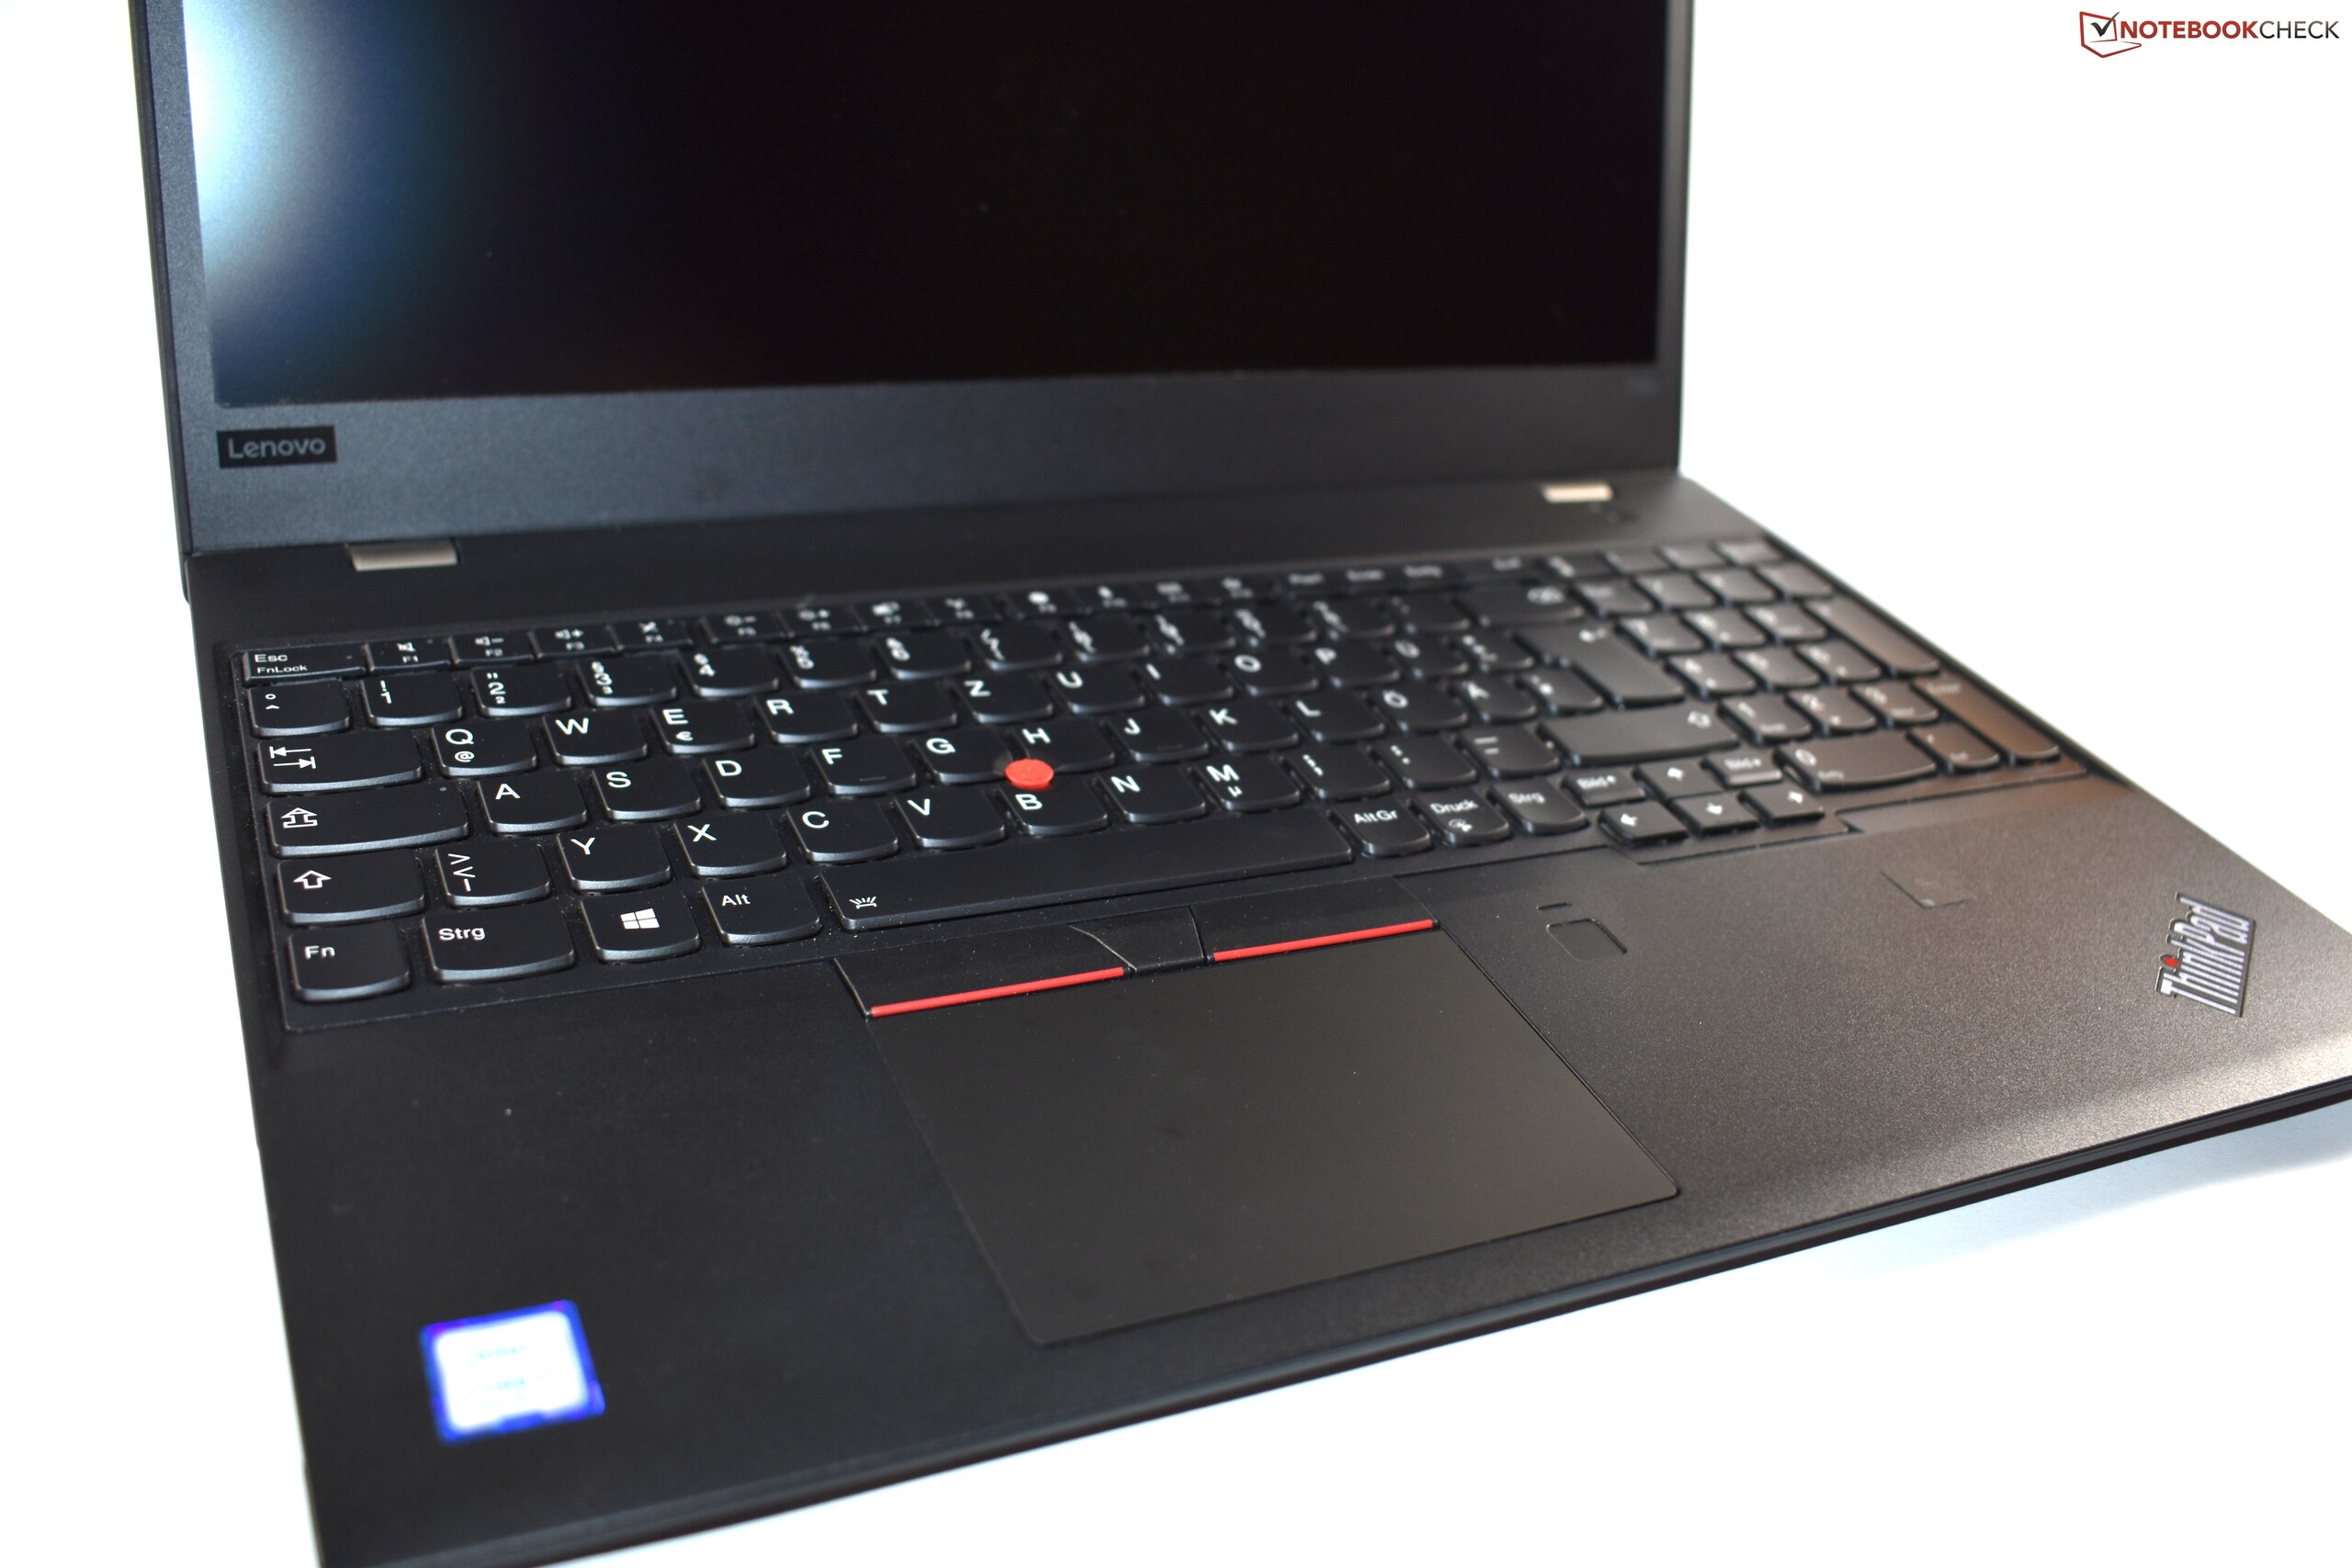
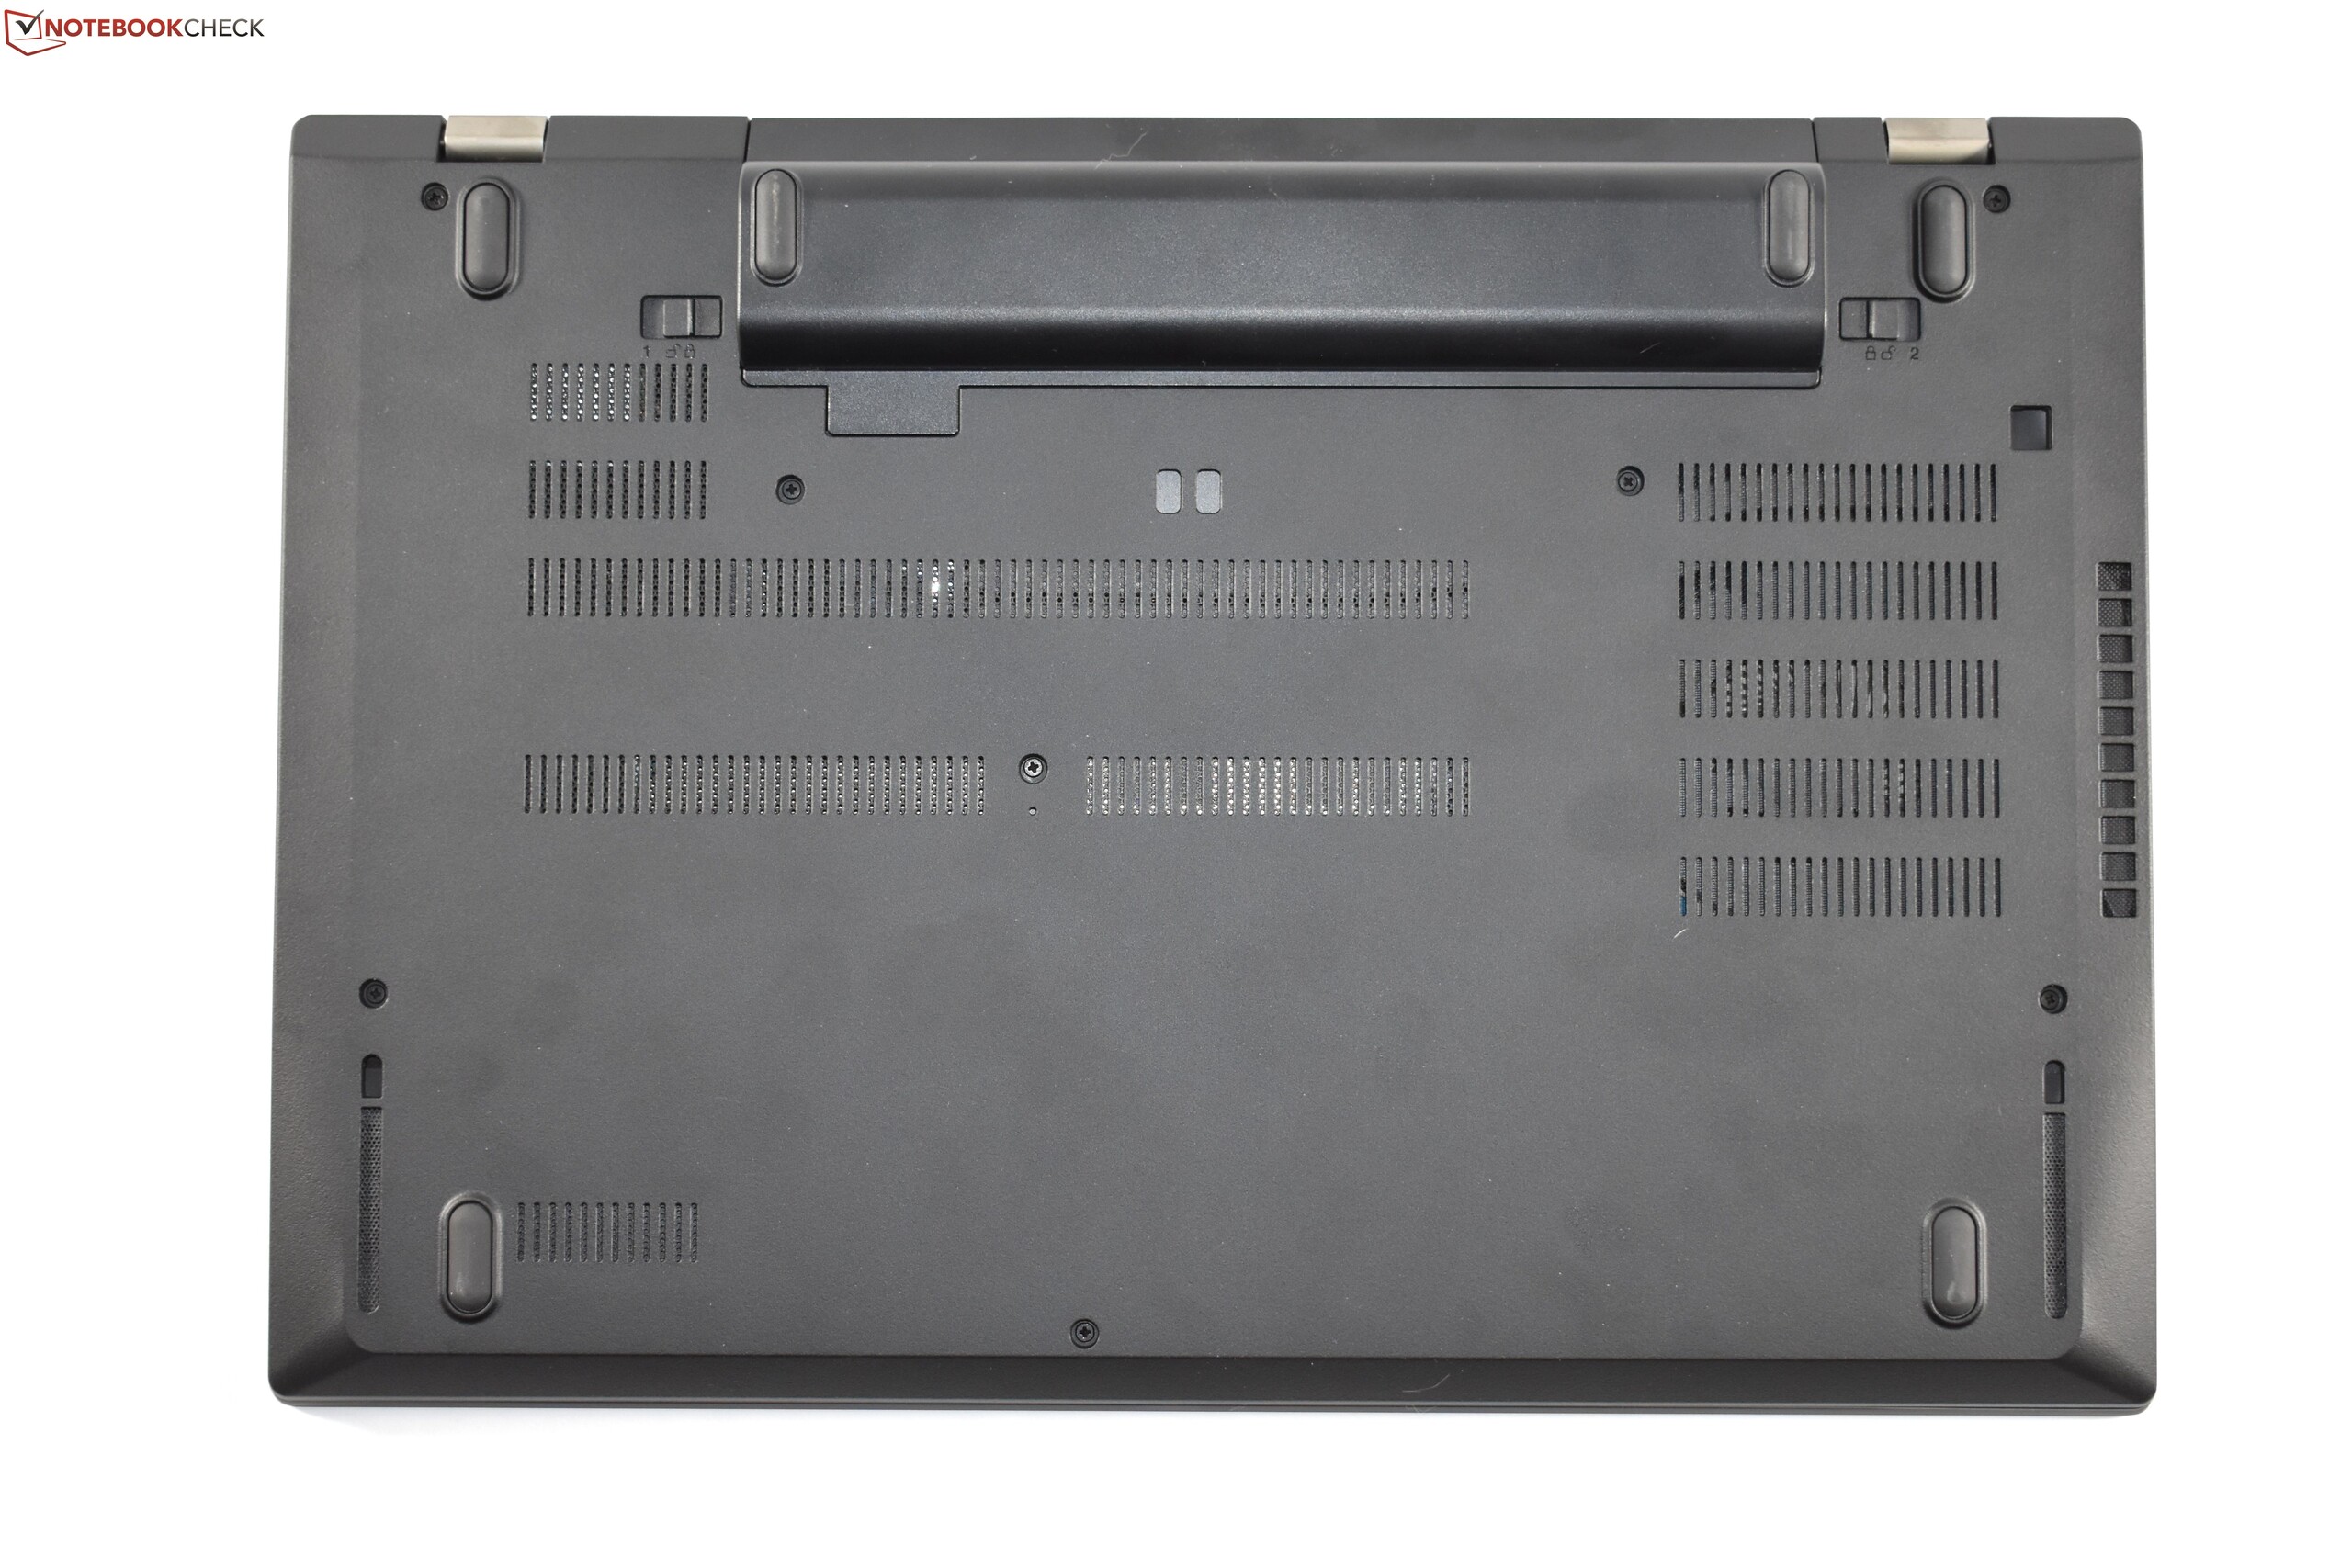
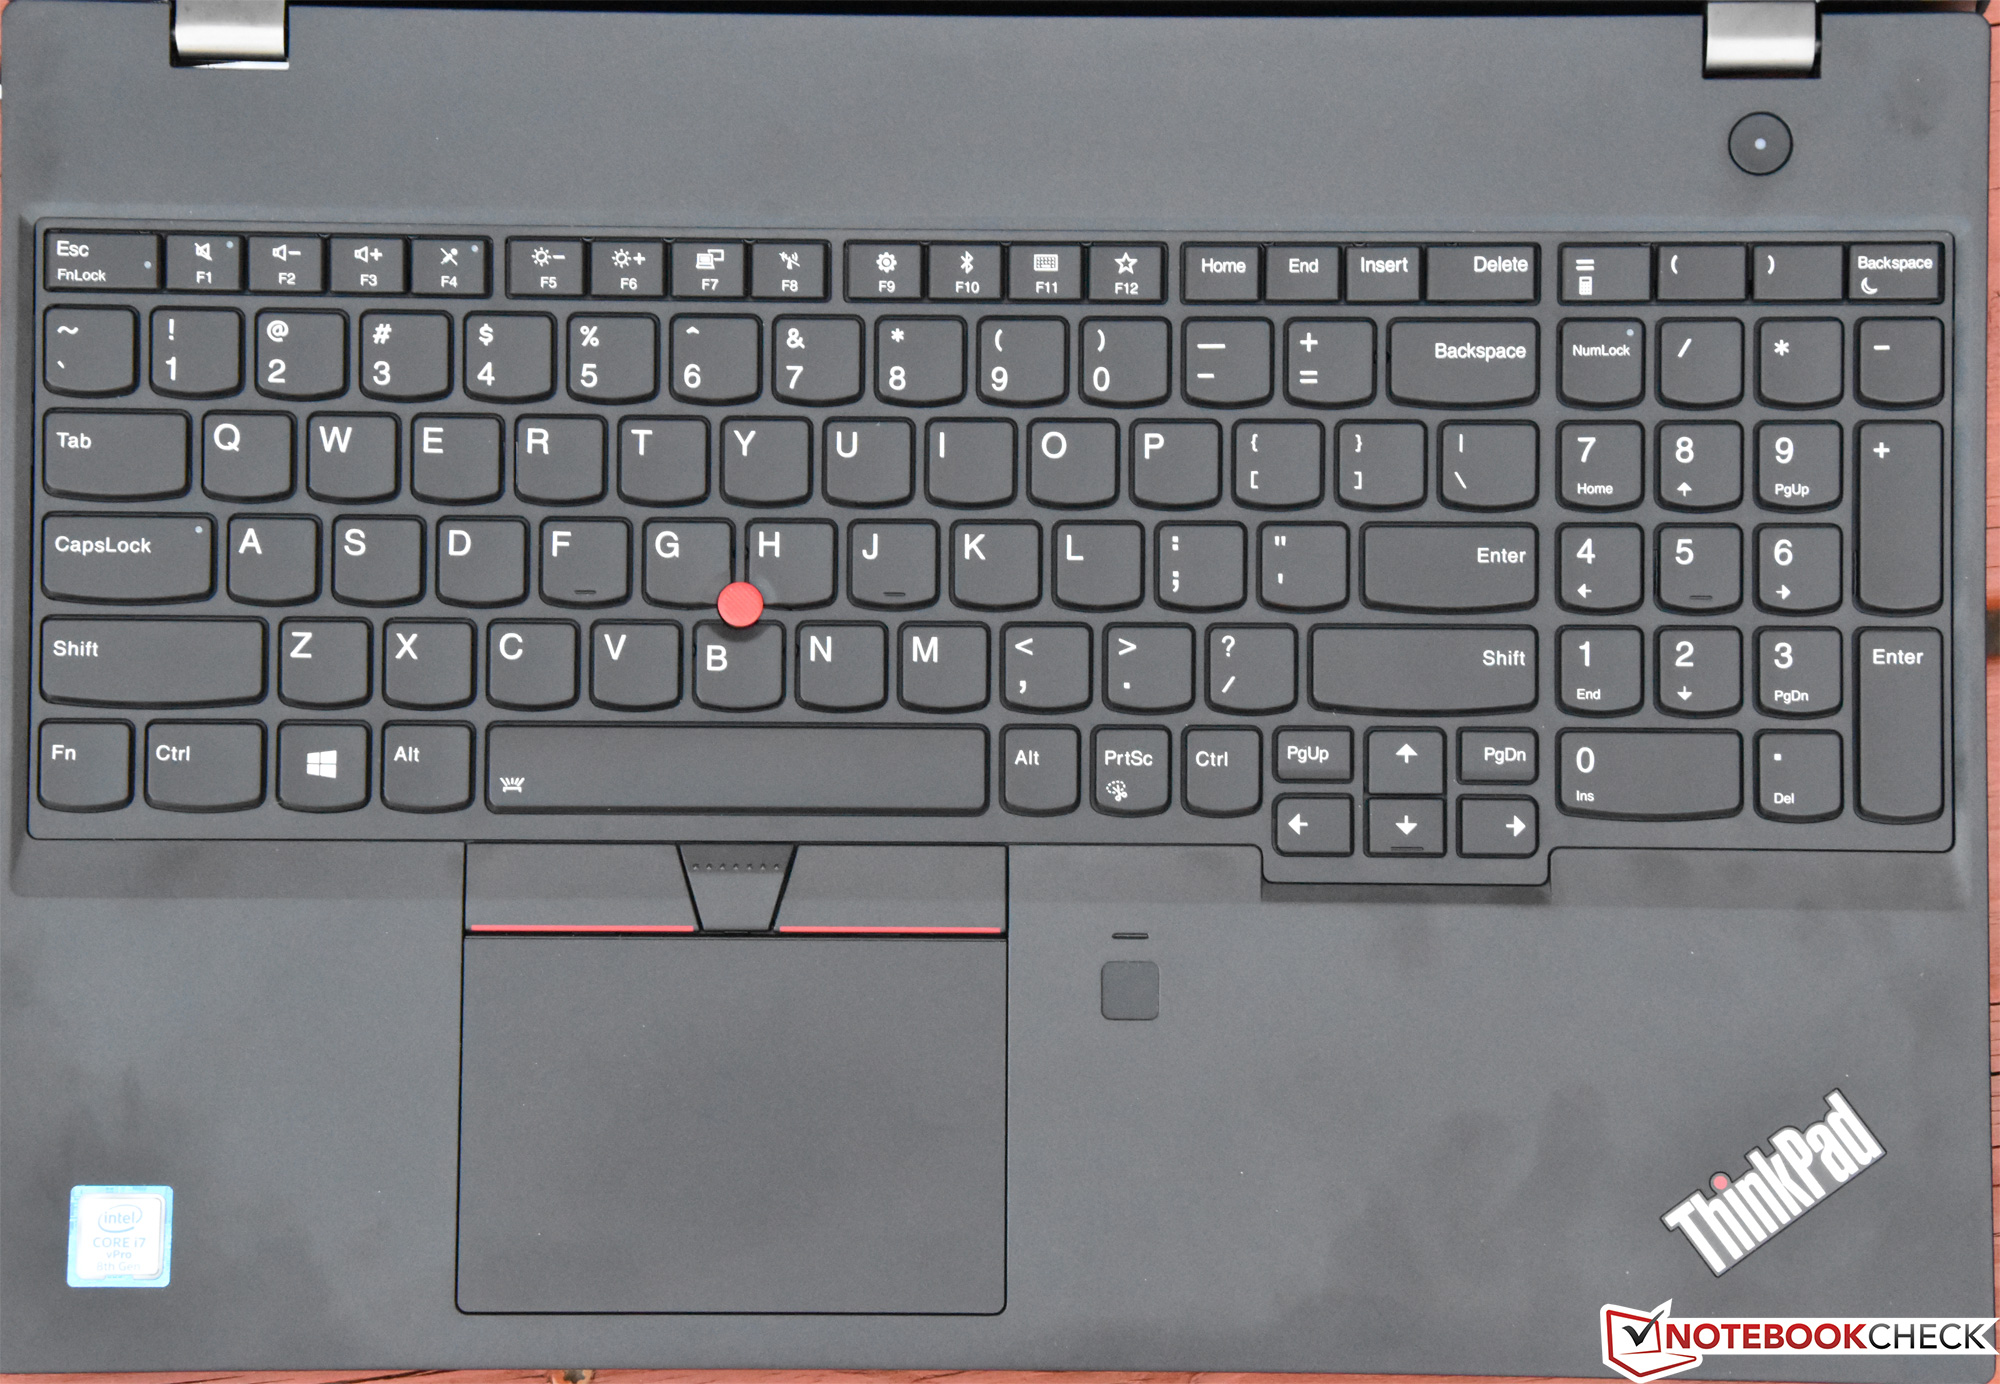
Since the overall design, connectivity, and input devices haven’t changed since the last review, we’ll be skipping directly to what’s new in this article. To quickly summarize our thoughts on these matters from previous reviews, however, we found that the build quality of the device—bolstered by the glass-fiber reinforced plastic—was very good overall, albeit a notch below the smaller Tx80 series machines (a trend we’ve found often holds true across most other business notebooks as well). The keyboard and touchpad are great (as expected), and plenty of connectivity options exist via the conveniently-organized side-mounted ports and standardized USB-C charging interface. Finally, as always, we appreciated the dual-battery “ThinkPad Power Bridge” design, which was convenient for quick hot swaps of the external battery in a pinch without having to power down or plug in.
One other note specific to today’s review unit: as you’ll see below, we recorded uncharacteristically low wireless transmit speeds, far below those of the previous test unit. This is very likely a bad antenna, however, as it clearly is a peculiarity of today’s machine.
For much more information on any of the preliminary items, don’t miss our previous review of the T580 from April or our T570 review.


| SD Card Reader | |
| average JPG Copy Test (av. of 3 runs) | |
| Dell Latitude 5590 (Toshiba Exceria Pro SDXC 64 GB UHS-II) | |
| Dell XPS 15 9570 i7 UHD (Toshiba Exceria Pro SDXC 64 GB UHS-II) | |
| Lenovo ThinkPad T580-20LAS01H00 (Toshiba Exceria Pro SDXC 64 GB UHS-II) | |
| Lenovo ThinkPad T580-20L9001AUS (Toshiba Exceria Pro SDXC 64 GB UHS-II) | |
| Average of class Office (19.8 - 198.5, n=22, last 2 years) | |
| maximum AS SSD Seq Read Test (1GB) | |
| Dell Latitude 5590 (Toshiba Exceria Pro SDXC 64 GB UHS-II) | |
| Dell XPS 15 9570 i7 UHD (Toshiba Exceria Pro SDXC 64 GB UHS-II) | |
| Lenovo ThinkPad T580-20LAS01H00 (Toshiba Exceria Pro SDXC 64 GB UHS-II) | |
| Lenovo ThinkPad T580-20L9001AUS (Toshiba Exceria Pro SDXC 64 GB UHS-II) | |
| Average of class Office (27.4 - 249, n=21, last 2 years) | |
Display
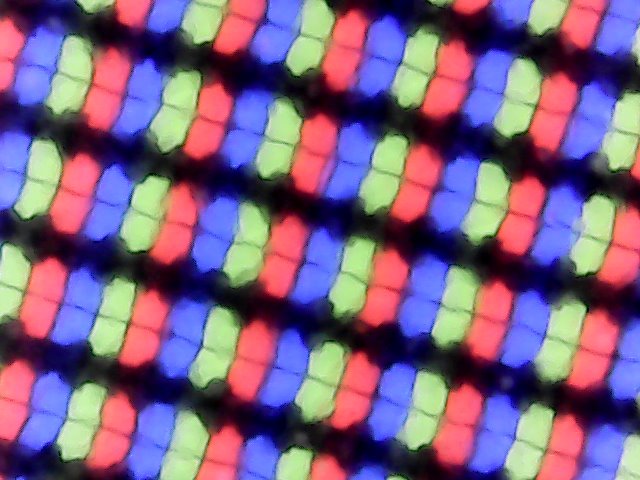
While our previous review unit packed a UHD display, today’s machine trades it for an FHD (1920x1080) embedded touch panel. As with other embedded (also called “on-cell”) touch displays, today’s panel remains legitimately anti-glare, which is a huge boon for business users who can’t afford to wrestle with disruptive reflections while on the move. Unfortunately, apart from that notable positive, most everything else about the display fails to impress: colors subjectively appear washed-out, brightness is middling at best, and contrast seems rather weak.
The bottom of the display on our review unit exhibited fairly minor backlight bleed noticeable only on dark screens (see our photo below).

| |||||||||||||||||||||||||
Brightness Distribution: 87 %
Center on Battery: 254.5 cd/m²
Contrast: 943:1 (Black: 0.27 cd/m²)
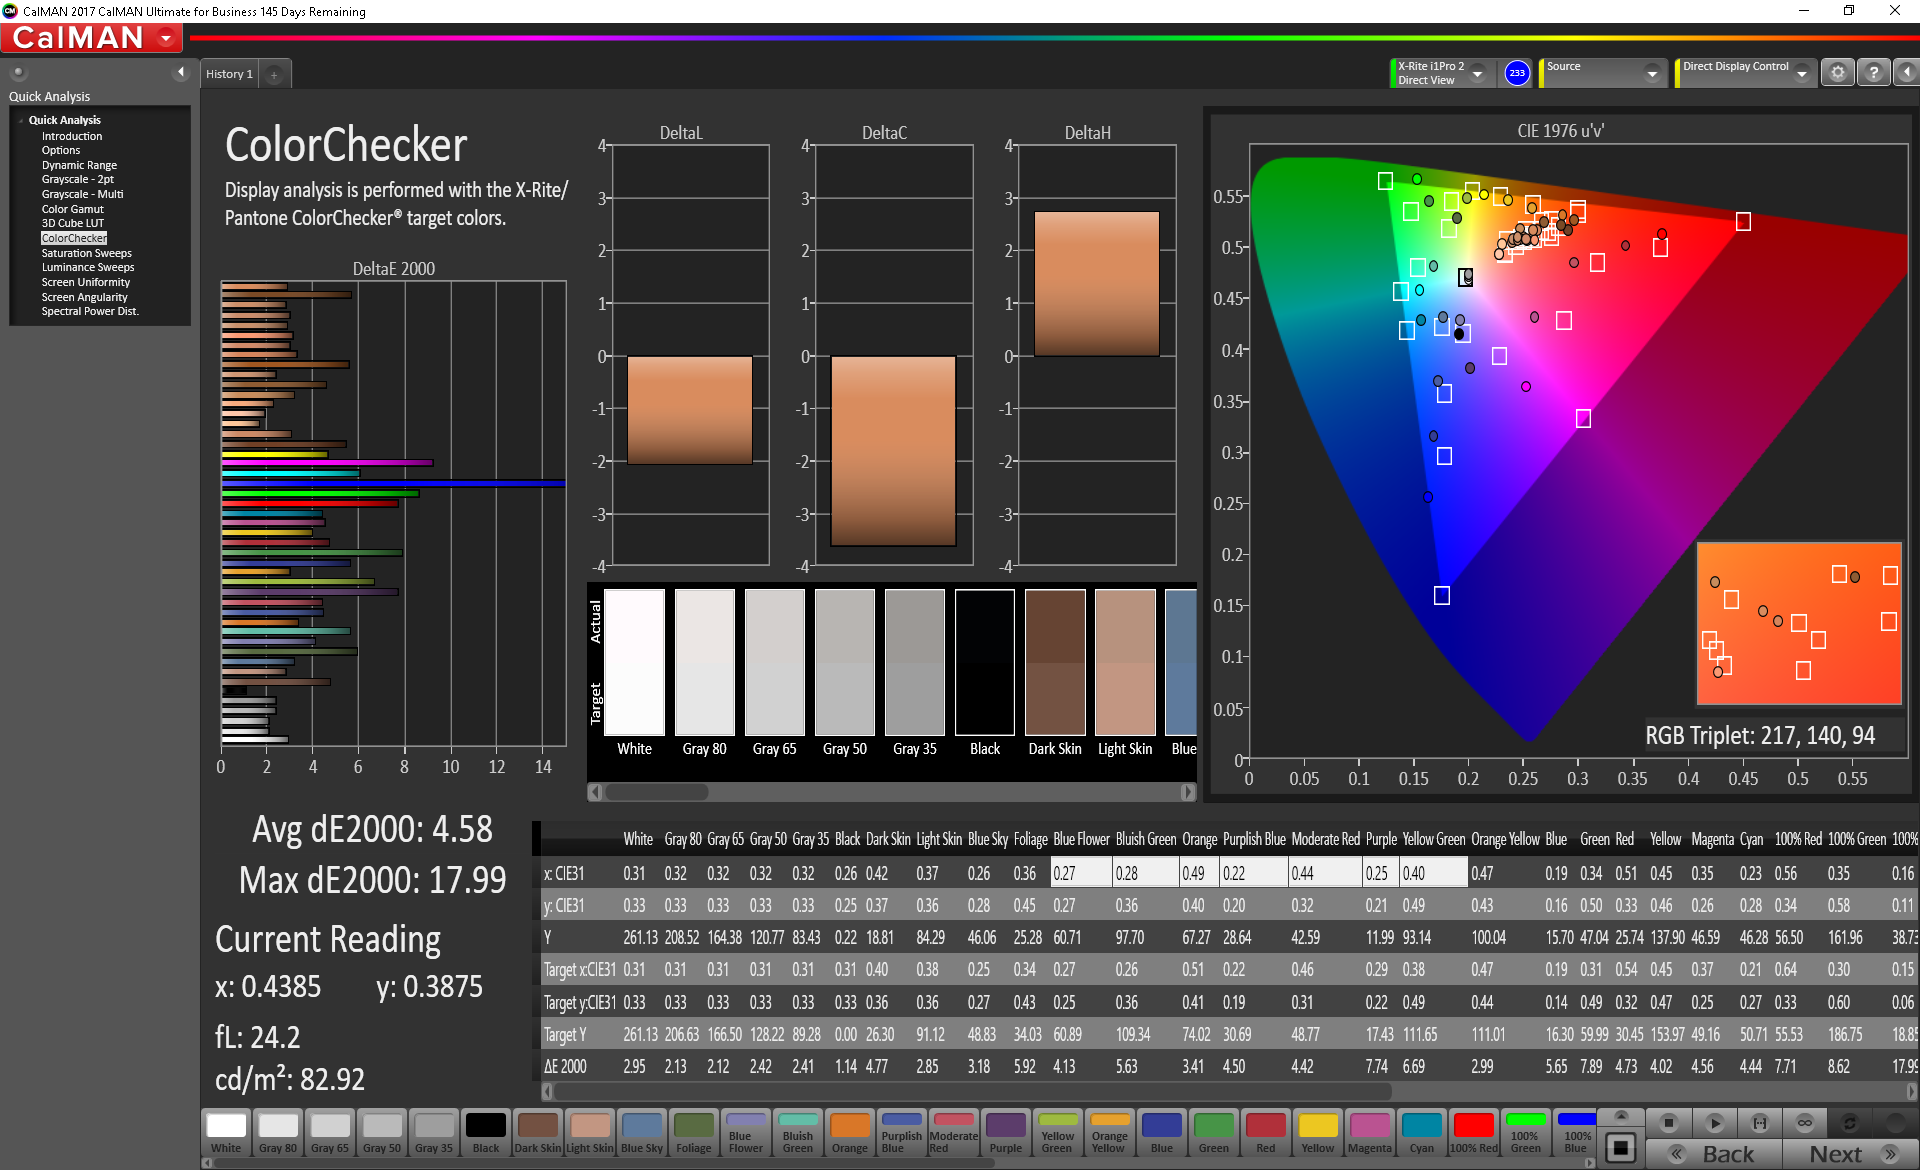
ΔE ColorChecker Calman: 4.58 | ∀{0.5-29.43 Ø4.73}
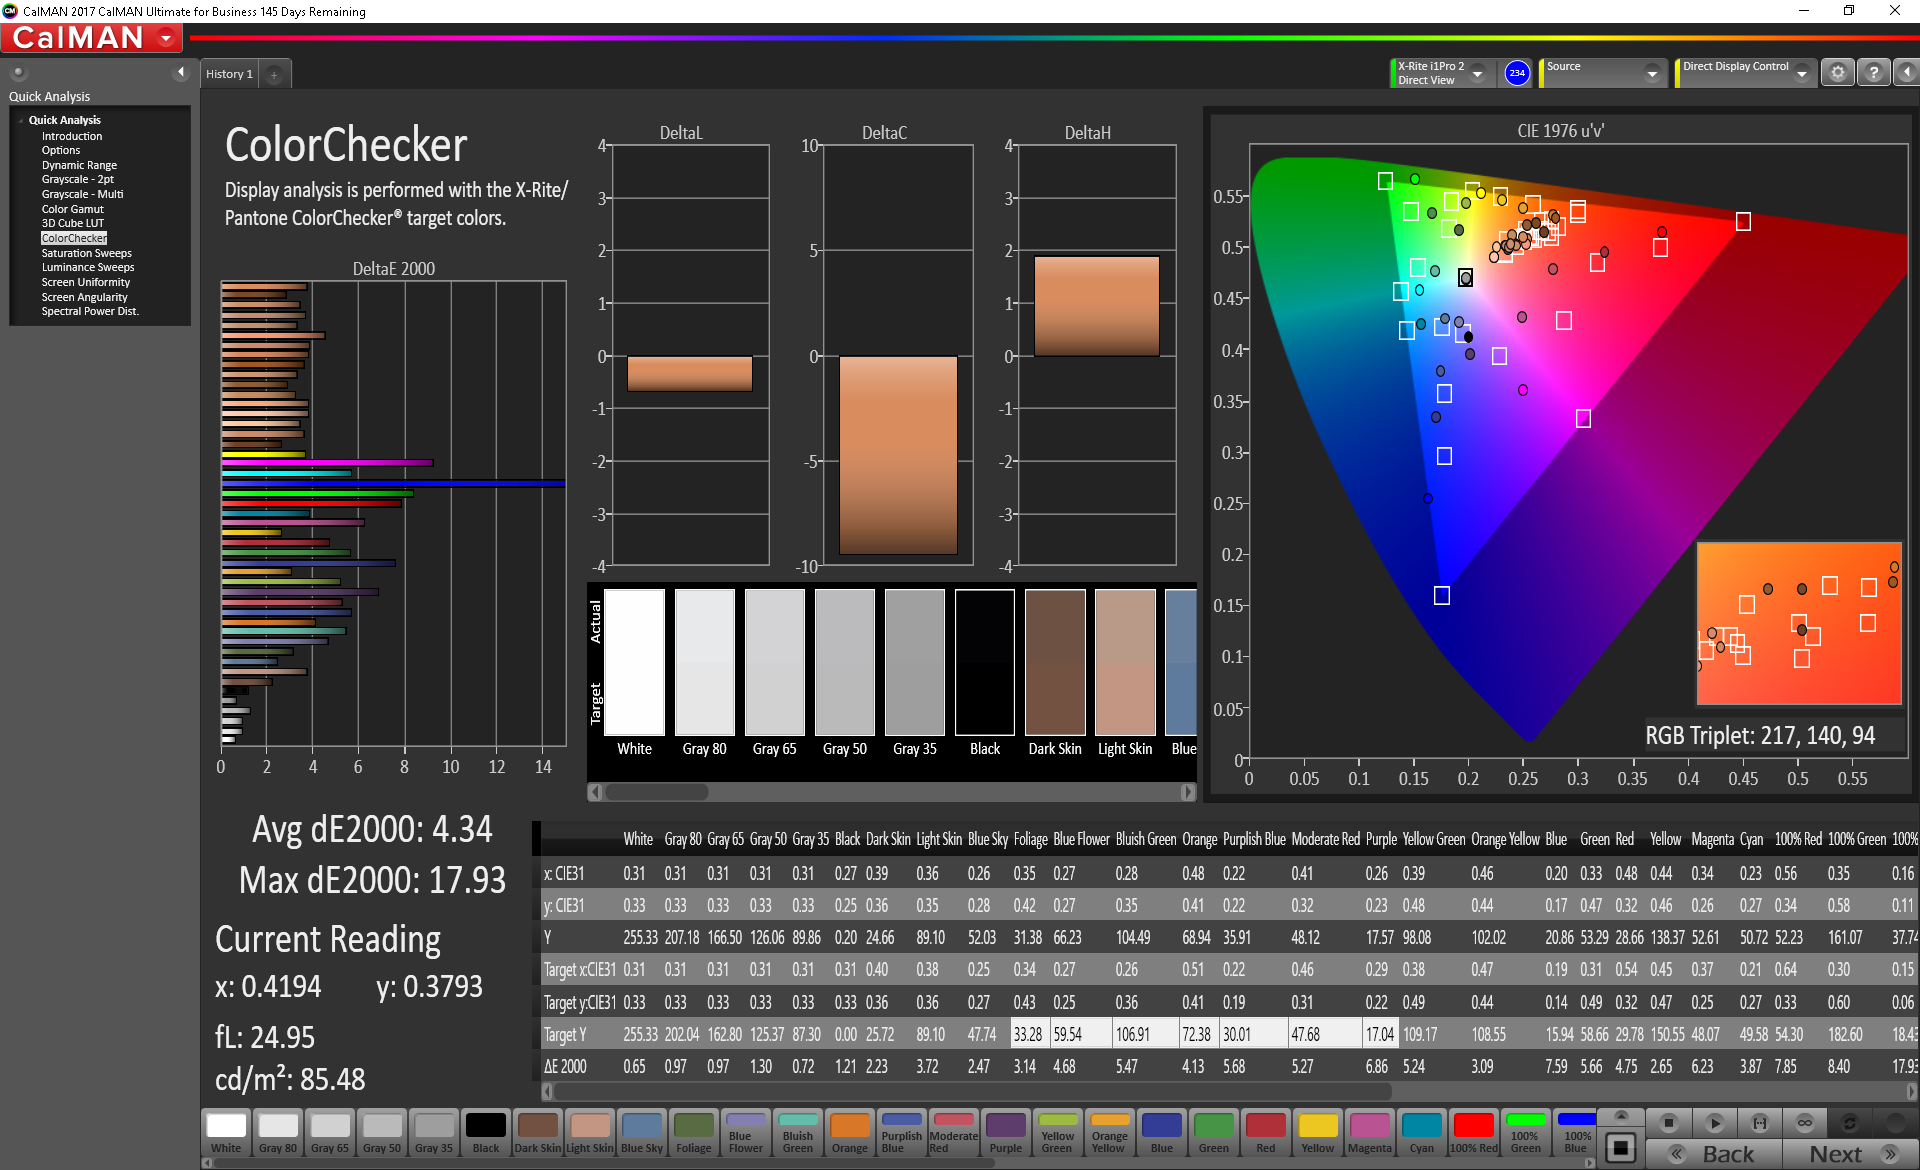
calibrated: 4.34
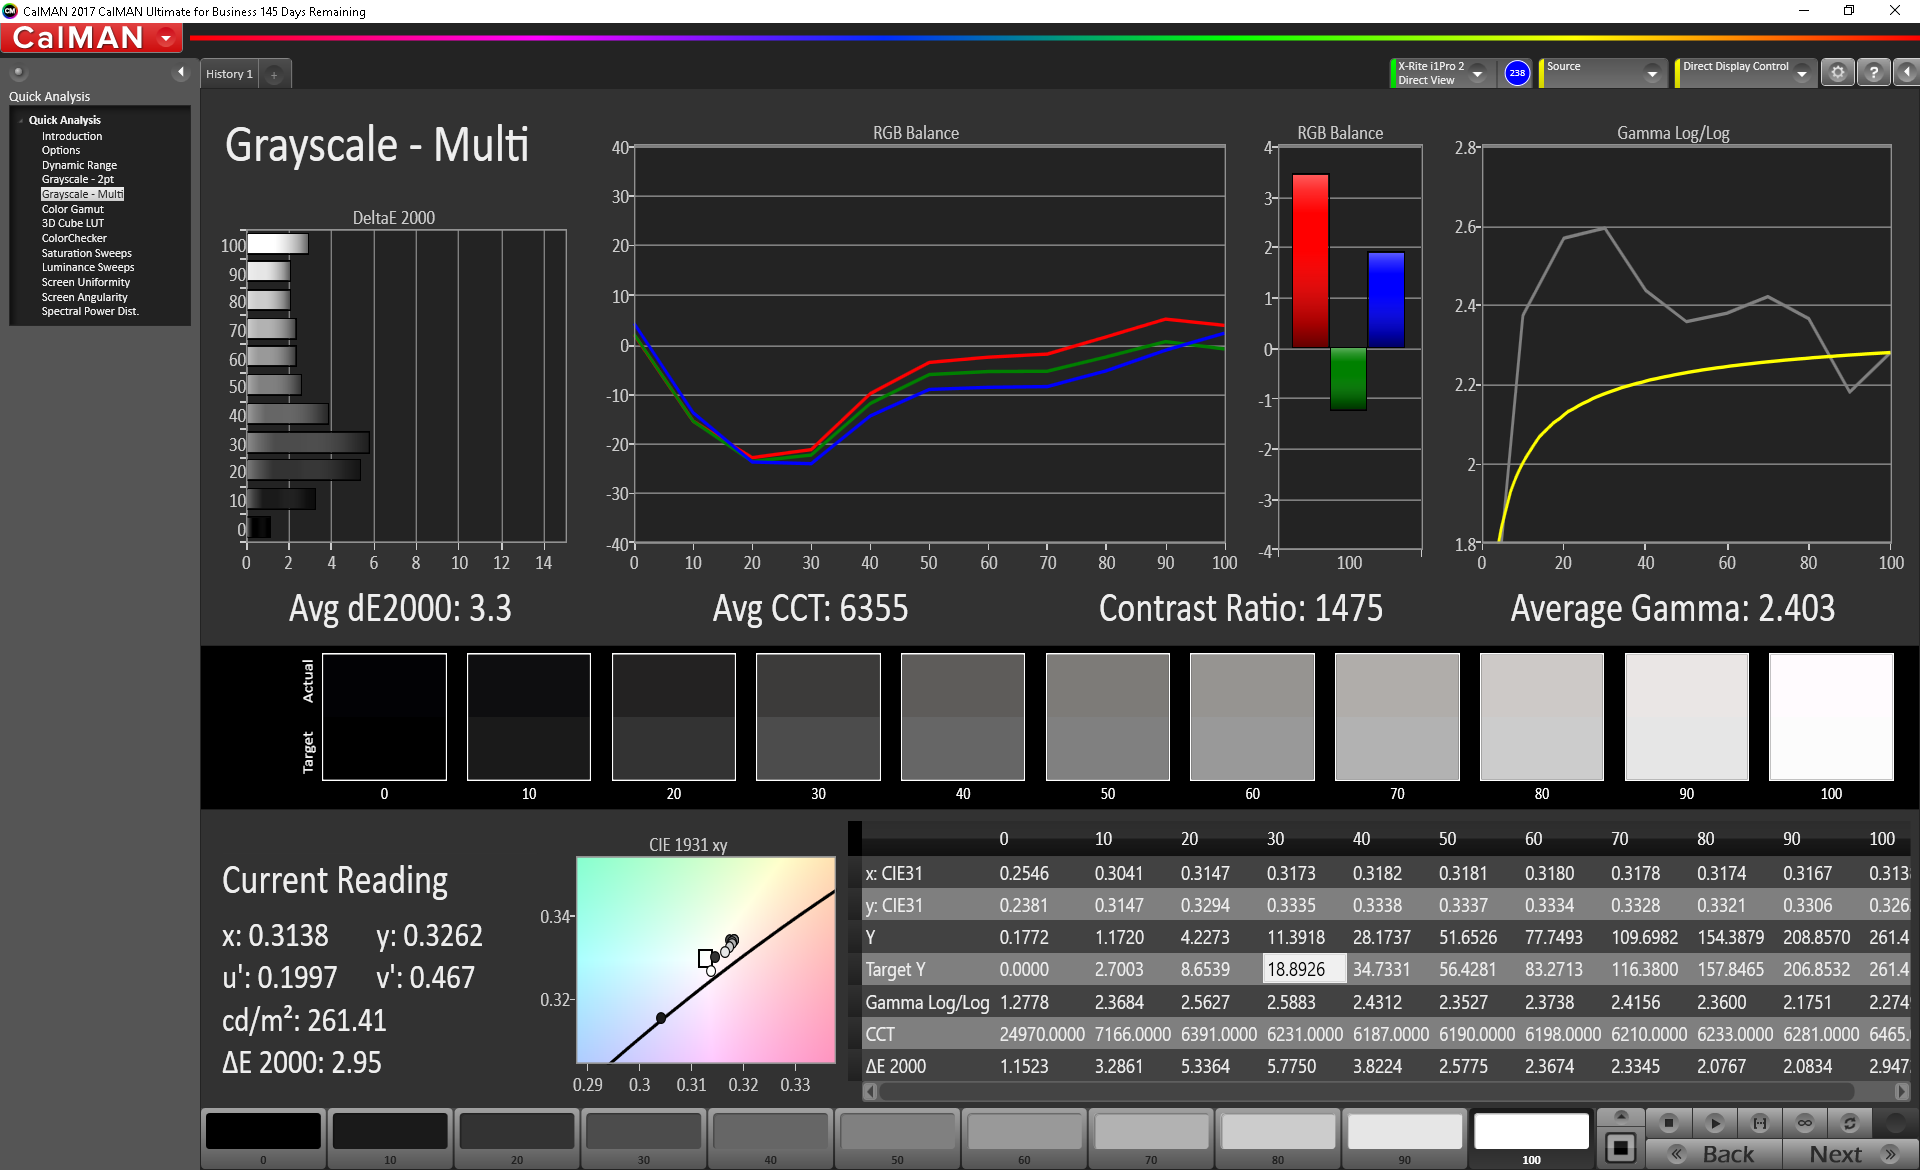
ΔE Greyscale Calman: 3.3 | ∀{0.09-98 Ø4.97}
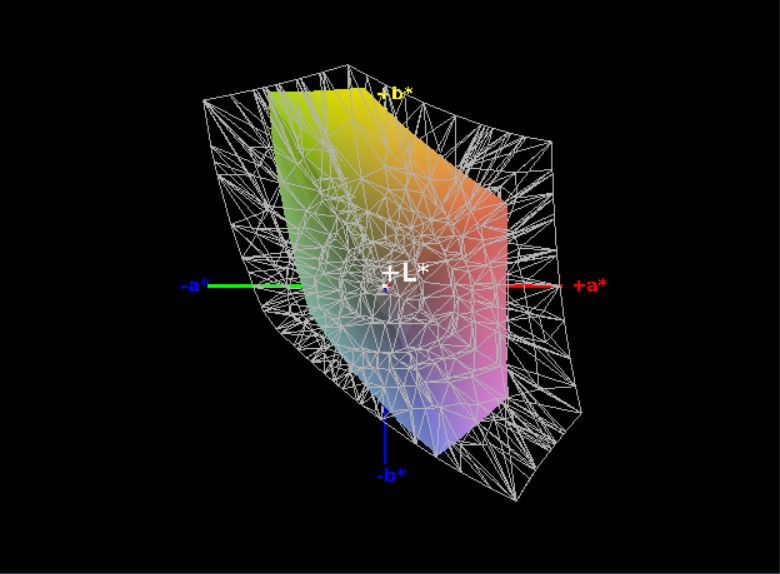
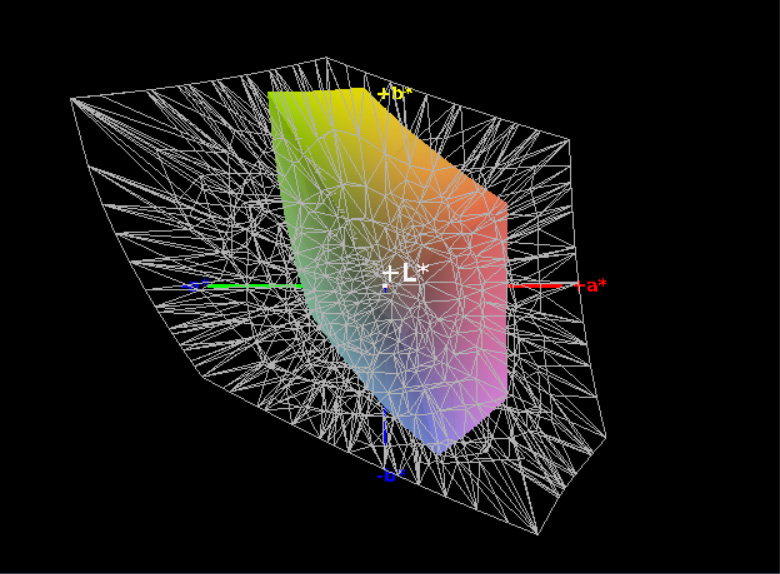
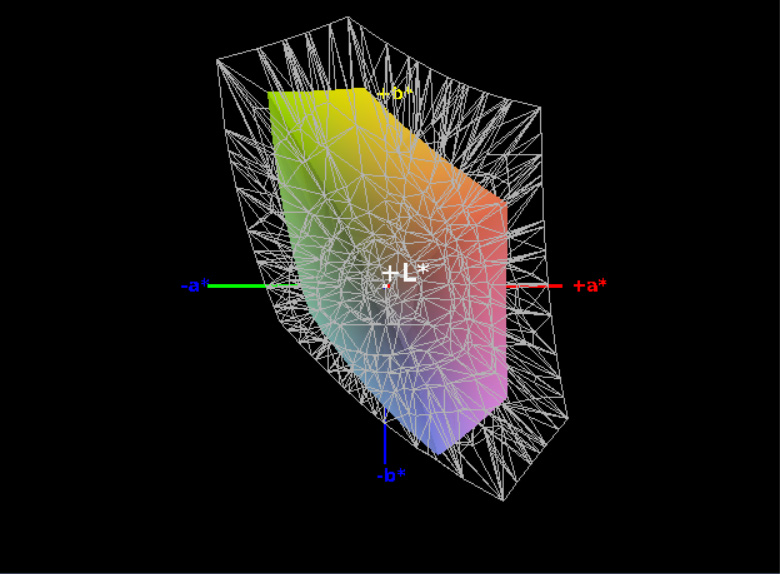
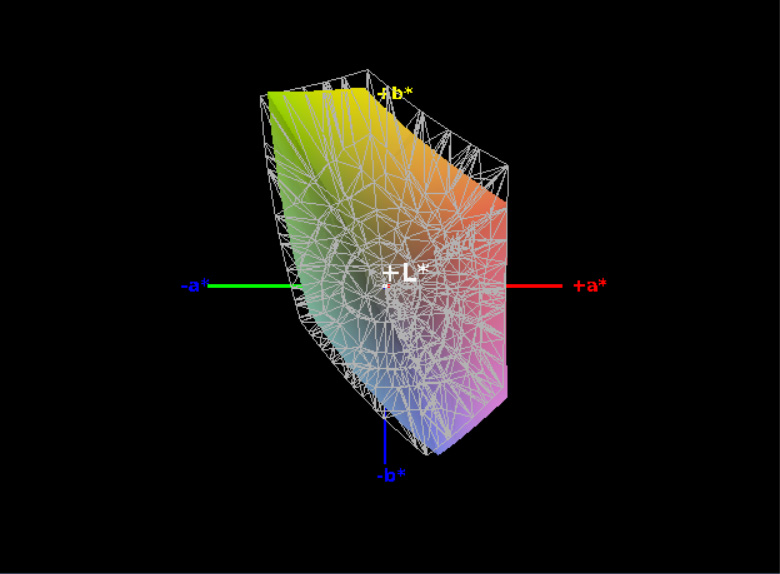
55% sRGB (Argyll 1.6.3 3D)
35% AdobeRGB 1998 (Argyll 1.6.3 3D)
38.16% AdobeRGB 1998 (Argyll 3D)
55.3% sRGB (Argyll 3D)
36.94% Display P3 (Argyll 3D)
Gamma: 2.403
CCT: 6355 K
| Lenovo ThinkPad T580-20L9001AUS B156HAK02.0, IPS, 15.6", 1920x1080 | Lenovo ThinkPad T580-20LAS01H00 NV156QUM-N44, IPS LED, 15.6", 3840x2160 | Dell Latitude 5590 NV15N42, IPS, 15.6", 1920x1080 | HP EliteBook 850 G4-Z2W86ET AUO35ED, TN LED, 15.6", 1920x1080 | Dell XPS 15 9570 i7 UHD LQ156D1, IPS, 15.6", 3840x2160 | |
|---|---|---|---|---|---|
| Display | 75% | 12% | 53% | 100% | |
| Display P3 Coverage (%) | 36.94 | 69.2 87% | 41.56 13% | 56.8 54% | 79.1 114% |
| sRGB Coverage (%) | 55.3 | 90.7 64% | 61.3 11% | 83.7 51% | 98.8 79% |
| AdobeRGB 1998 Coverage (%) | 38.16 | 66.3 74% | 42.93 13% | 58.7 54% | 79.2 108% |
| Response Times | -31% | -52% | 2% | -28% | |
| Response Time Grey 50% / Grey 80% * (ms) | 33.2 ? | 51.2 ? -54% | 53.2 ? -60% | 47.2 ? -42% | 46.4 ? -40% |
| Response Time Black / White * (ms) | 27.6 ? | 29.6 ? -7% | 39.6 ? -43% | 15.2 ? 45% | 32 ? -16% |
| PWM Frequency (Hz) | 952 ? | 1000 ? | 199.2 ? | 980 ? | |
| Screen | 36% | -6% | -52% | 41% | |
| Brightness middle (cd/m²) | 254.5 | 310 22% | 243 -5% | 338 33% | 494 94% |
| Brightness (cd/m²) | 238 | 283 19% | 234 -2% | 341 43% | 457 92% |
| Brightness Distribution (%) | 87 | 87 0% | 83 -5% | 90 3% | 88 1% |
| Black Level * (cd/m²) | 0.27 | 0.24 11% | 0.19 30% | 0.81 -200% | 0.34 -26% |
| Contrast (:1) | 943 | 1292 37% | 1279 36% | 417 -56% | 1453 54% |
| Colorchecker dE 2000 * | 4.58 | 3.1 32% | 6.6 -44% | 10.9 -138% | 5.2 -14% |
| Colorchecker dE 2000 max. * | 17.99 | 7.6 58% | 22.3 -24% | 18.7 -4% | 17.5 3% |
| Colorchecker dE 2000 calibrated * | 4.34 | 2.2 49% | 5 -15% | ||
| Greyscale dE 2000 * | 3.3 | 2.3 30% | 5.2 -58% | 13.3 -303% | 2.7 18% |
| Gamma | 2.403 92% | 2.21 100% | 2.24 98% | 2.11 104% | 2.1 105% |
| CCT | 6355 102% | 6876 95% | 6990 93% | 16030 41% | 7038 92% |
| Color Space (Percent of AdobeRGB 1998) (%) | 35 | 59.1 69% | 39.2 12% | 53.8 54% | 71.2 103% |
| Color Space (Percent of sRGB) (%) | 55 | 90.1 64% | 60.8 11% | 83.4 52% | 98.8 80% |
| Total Average (Program / Settings) | 27% /
35% | -15% /
-8% | 1% /
-24% | 38% /
43% |
* ... smaller is better
Our measurements corroborate our initial thoughts. With an average brightness of just 238.2 cd/m² across the panel (over 40 cd/m² below the UHD panel’s 282.9 cd/m²) and a merely decent contrast ratio of 943:1 (versus 1292:1 on the last review unit), there isn’t much to get excited about here. For basic office use, these values are fine, but in brighter lighting the inadequacies quickly prove evident.
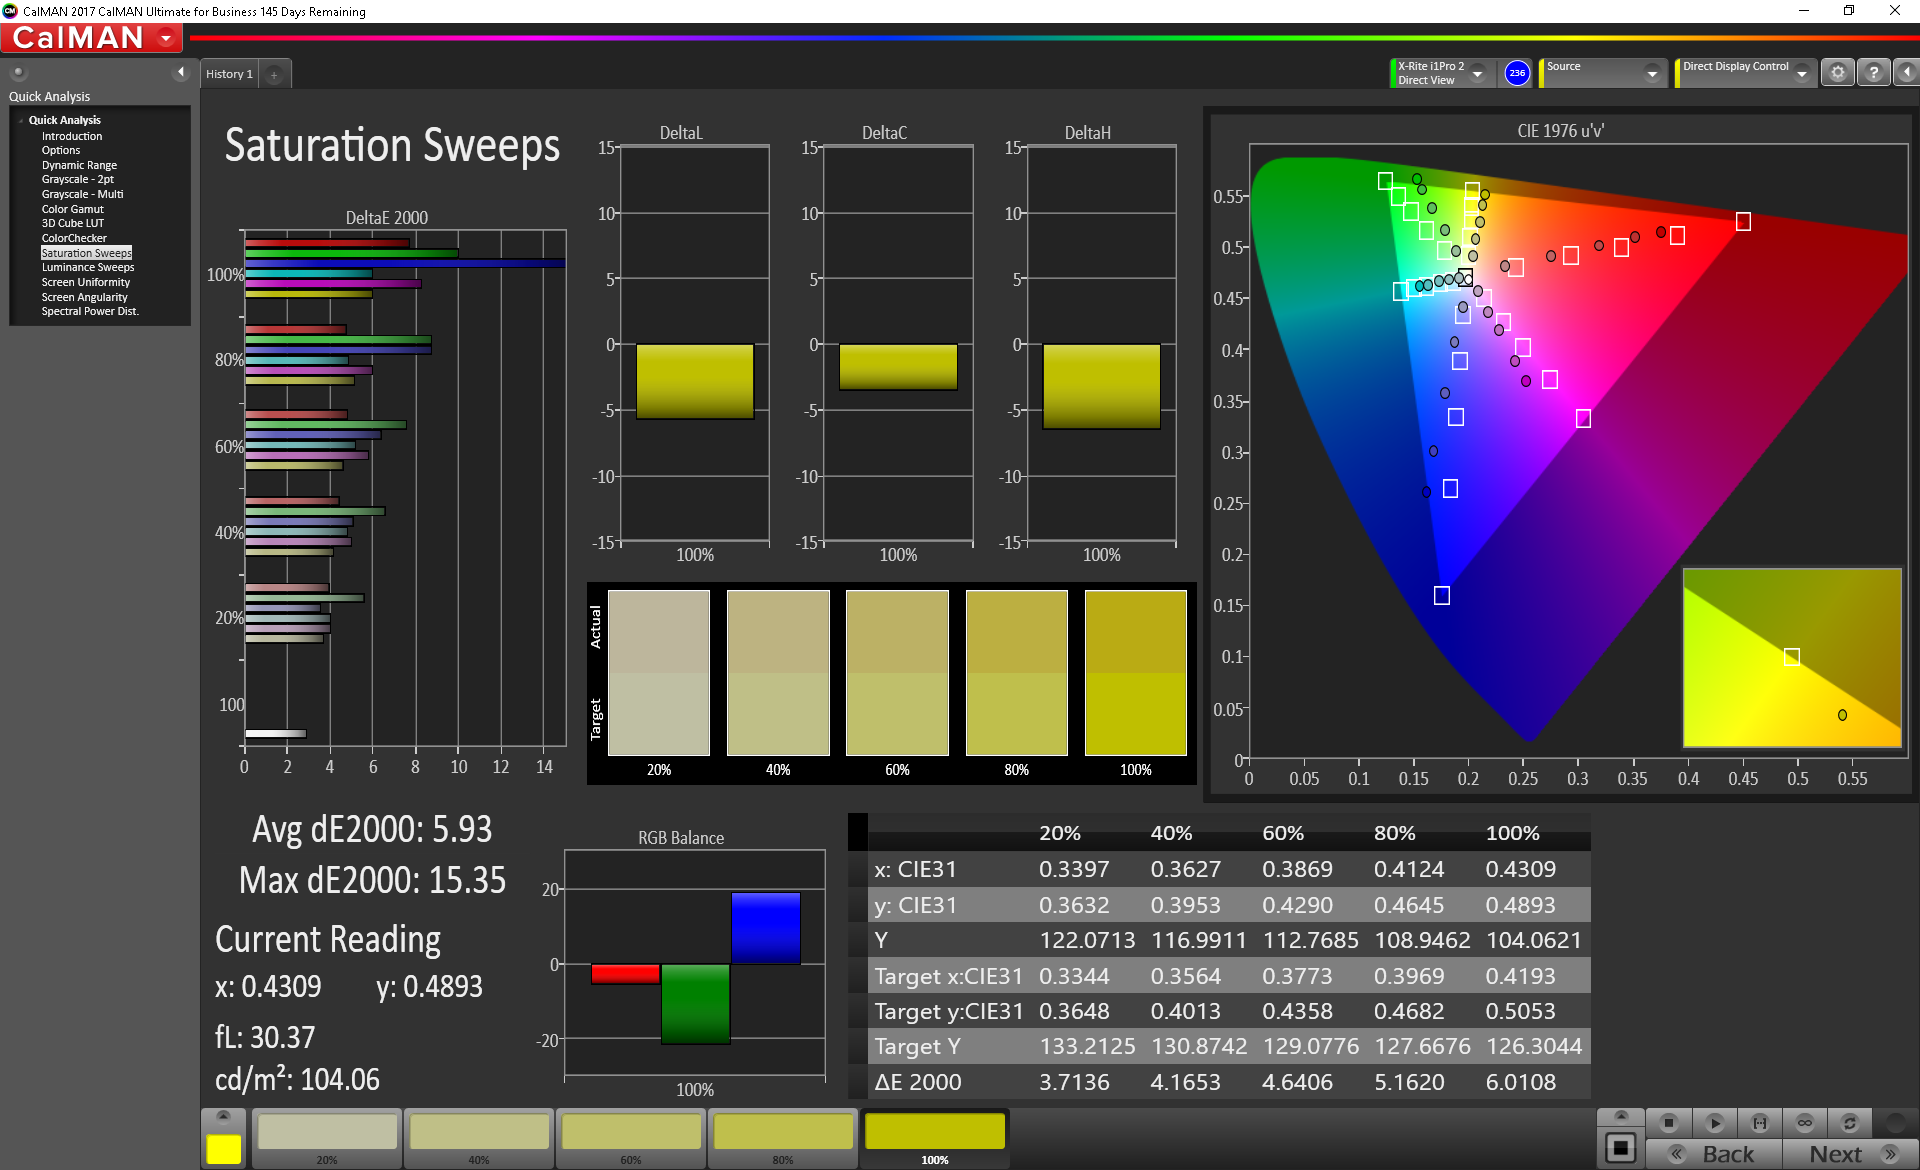
Color coverage is, in turn, even worse than previously. While the UHD panel turned in a disappointing (but still acceptable) 90.1% of sRGB, today’s panel can hardly muster 55%. Correspondingly, only 35% of the AdobeRGB spectrum is covered, which is vastly inferior to the HP Elitebook 850 G4 and Dell XPS 15 displays (53.8% and 71.2% of AdobeRGB respectively). It’s too bad that a better FHD panel doesn’t exist for those uninterested in splurging for 4K resolution but hoping for adequate brightness and color reproduction nonetheless, but unfortunately, this appears to be a trend across nearly all ThinkPad T-series machines.
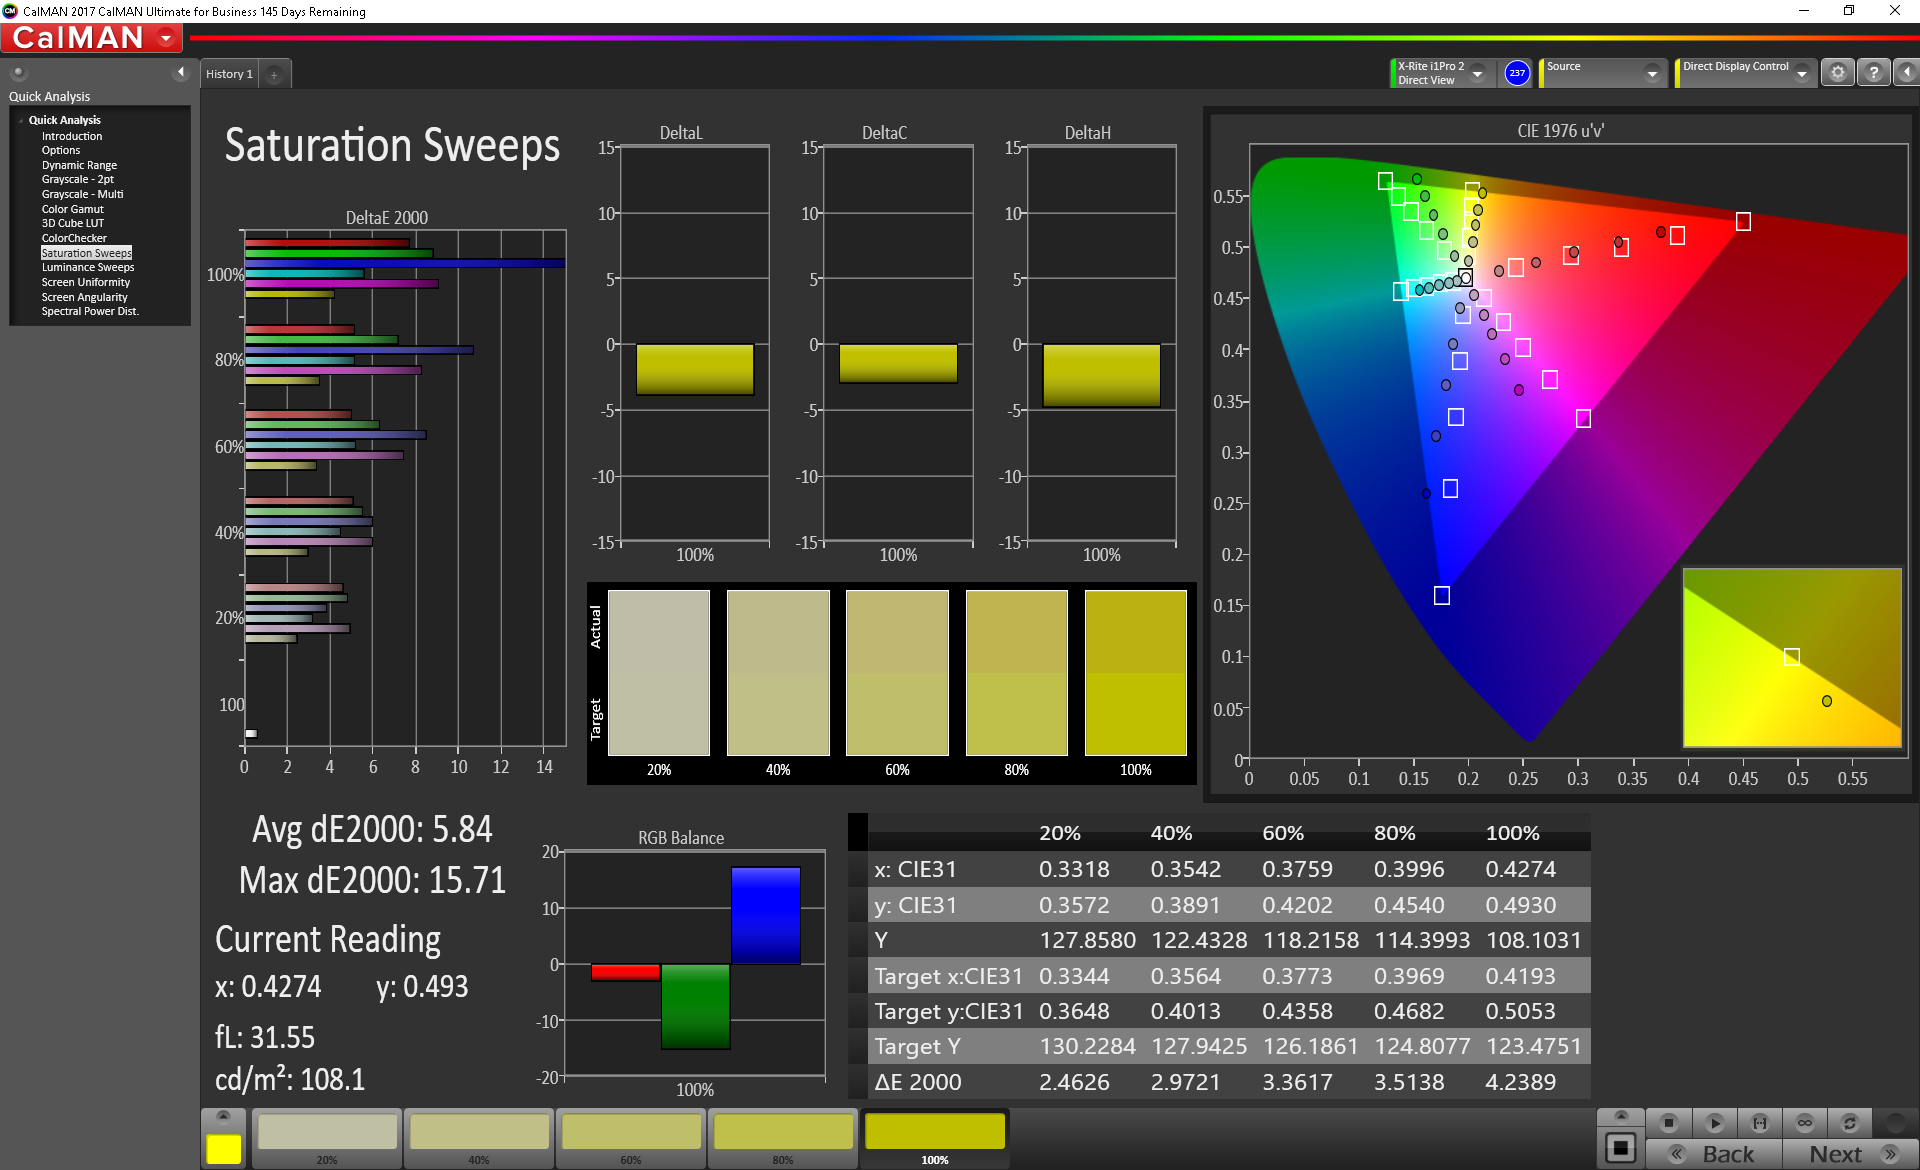
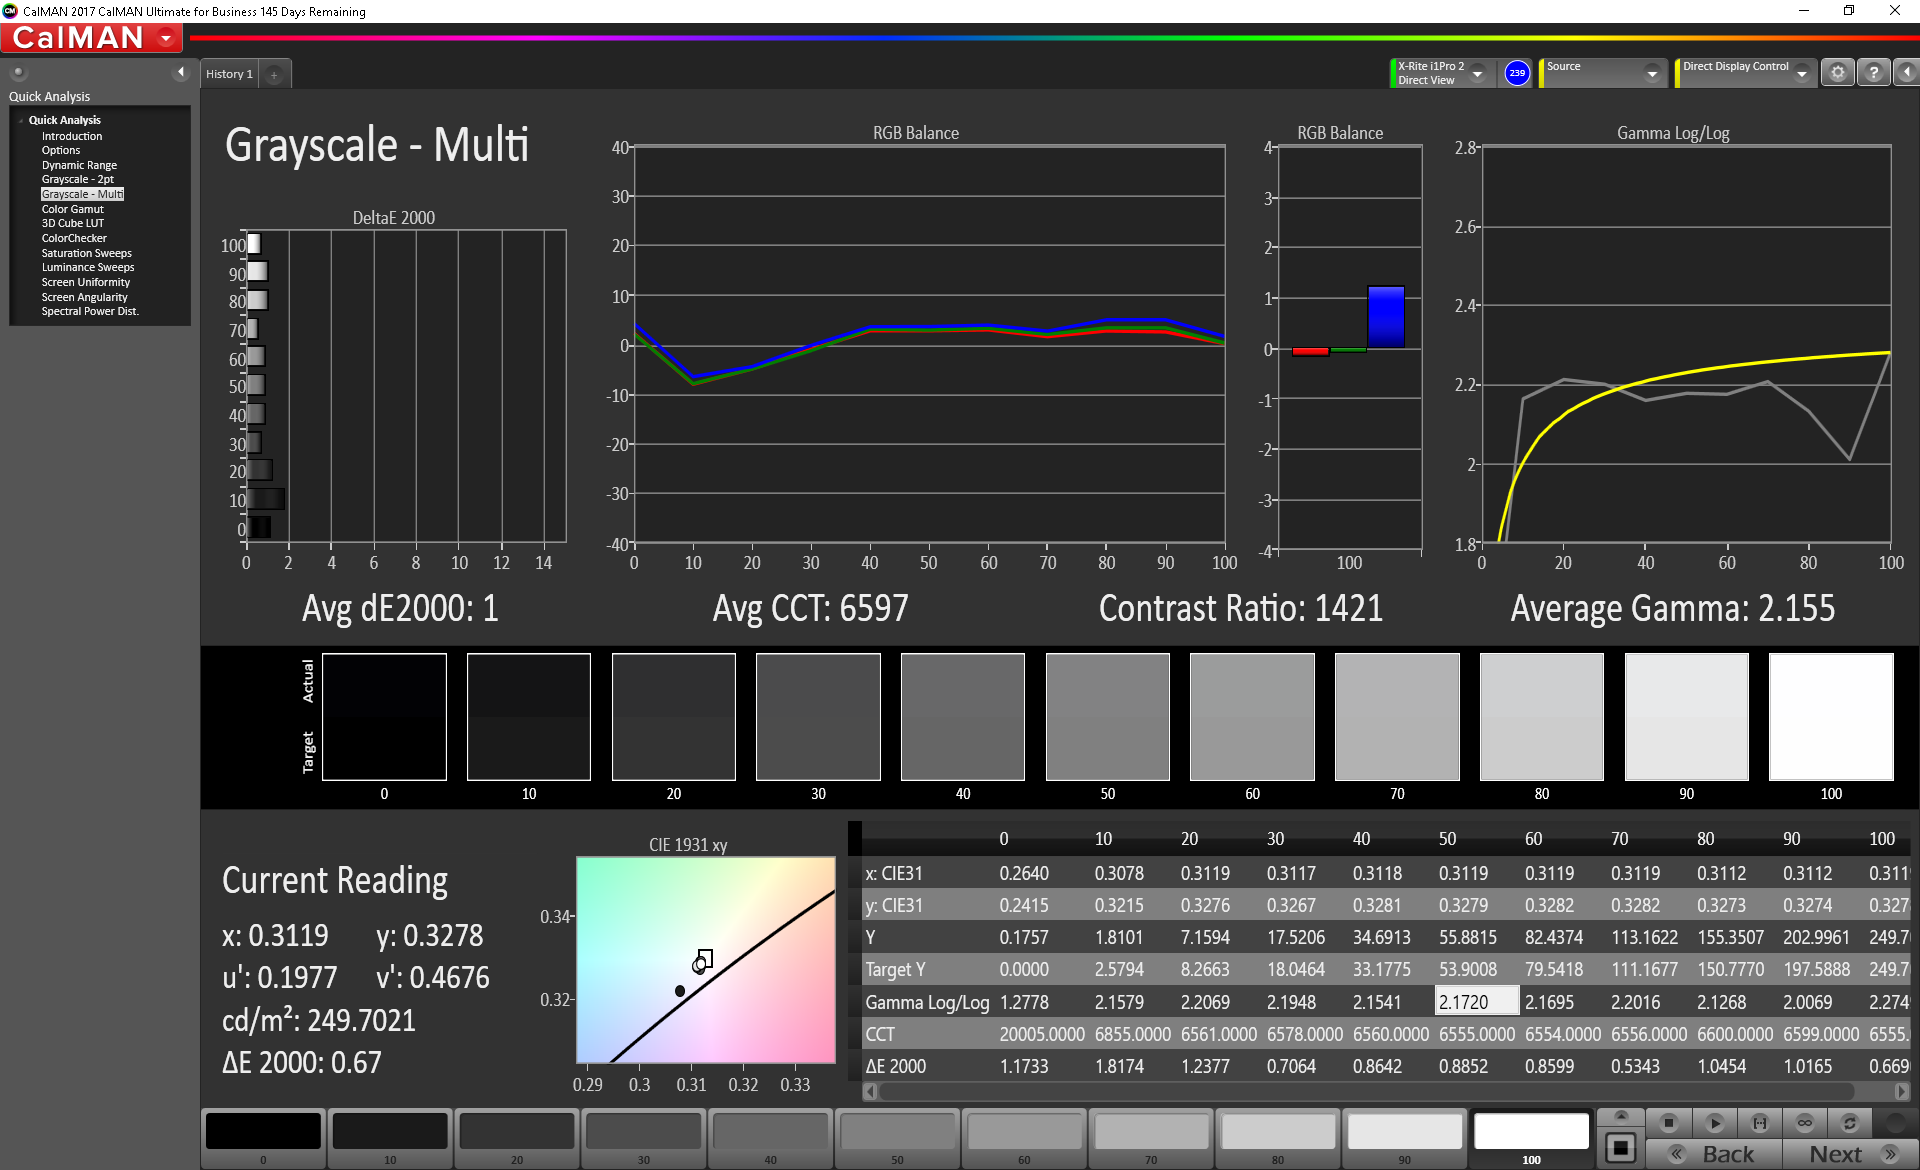
Color accuracy is better, with DeltaE values of just 4.58 and 3.3 for ColorChecker and Greyscale respectively, pre-calibration. The CCT Average of 6355 and total gamma measurement of 2.403 are also very good values.
Display Response Times
| ↔ Response Time Black to White | ||
|---|---|---|
| 27.6 ms ... rise ↗ and fall ↘ combined | ↗ 14.8 ms rise | 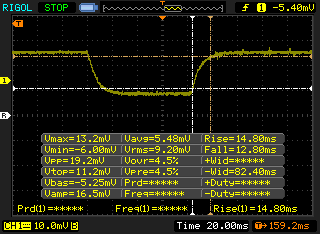 |
| ↘ 12.8 ms fall | ||
| The screen shows relatively slow response rates in our tests and may be too slow for gamers. In comparison, all tested devices range from 0.1 (minimum) to 240 (maximum) ms. » 70 % of all devices are better. This means that the measured response time is worse than the average of all tested devices (19.9 ms). | ||
| ↔ Response Time 50% Grey to 80% Grey | ||
| 33.2 ms ... rise ↗ and fall ↘ combined | ↗ 15.6 ms rise | 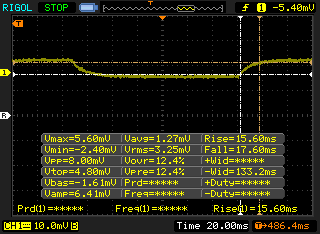 |
| ↘ 17.6 ms fall | ||
| The screen shows slow response rates in our tests and will be unsatisfactory for gamers. In comparison, all tested devices range from 0.165 (minimum) to 636 (maximum) ms. » 46 % of all devices are better. This means that the measured response time is similar to the average of all tested devices (31.1 ms). | ||
Screen Flickering / PWM (Pulse-Width Modulation)
| Screen flickering / PWM not detected |  | ||
In comparison: 52 % of all tested devices do not use PWM to dim the display. If PWM was detected, an average of 7794 (minimum: 5 - maximum: 343500) Hz was measured. | |||
One lone positive over the UHD panel is that today’s FHD display exhibited no PWM at any brightness level.
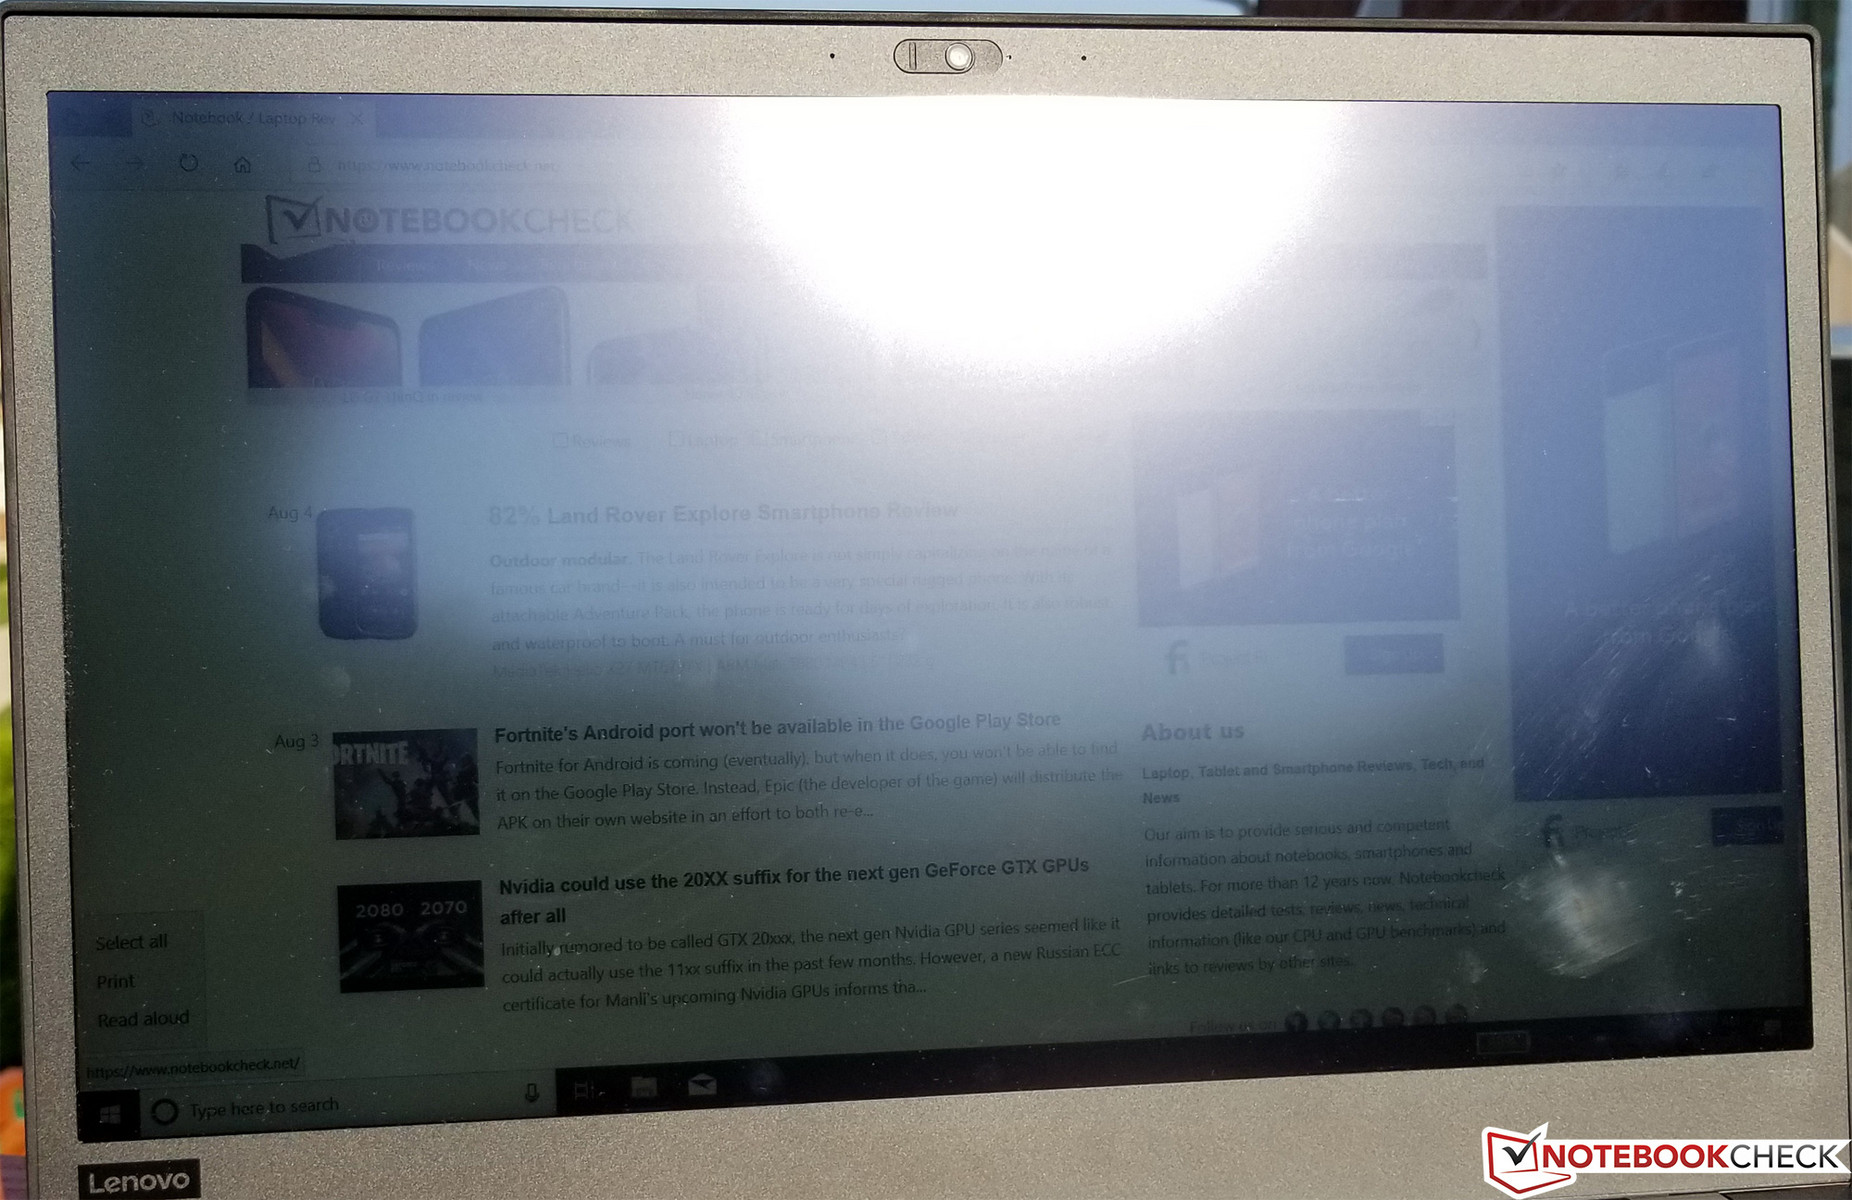
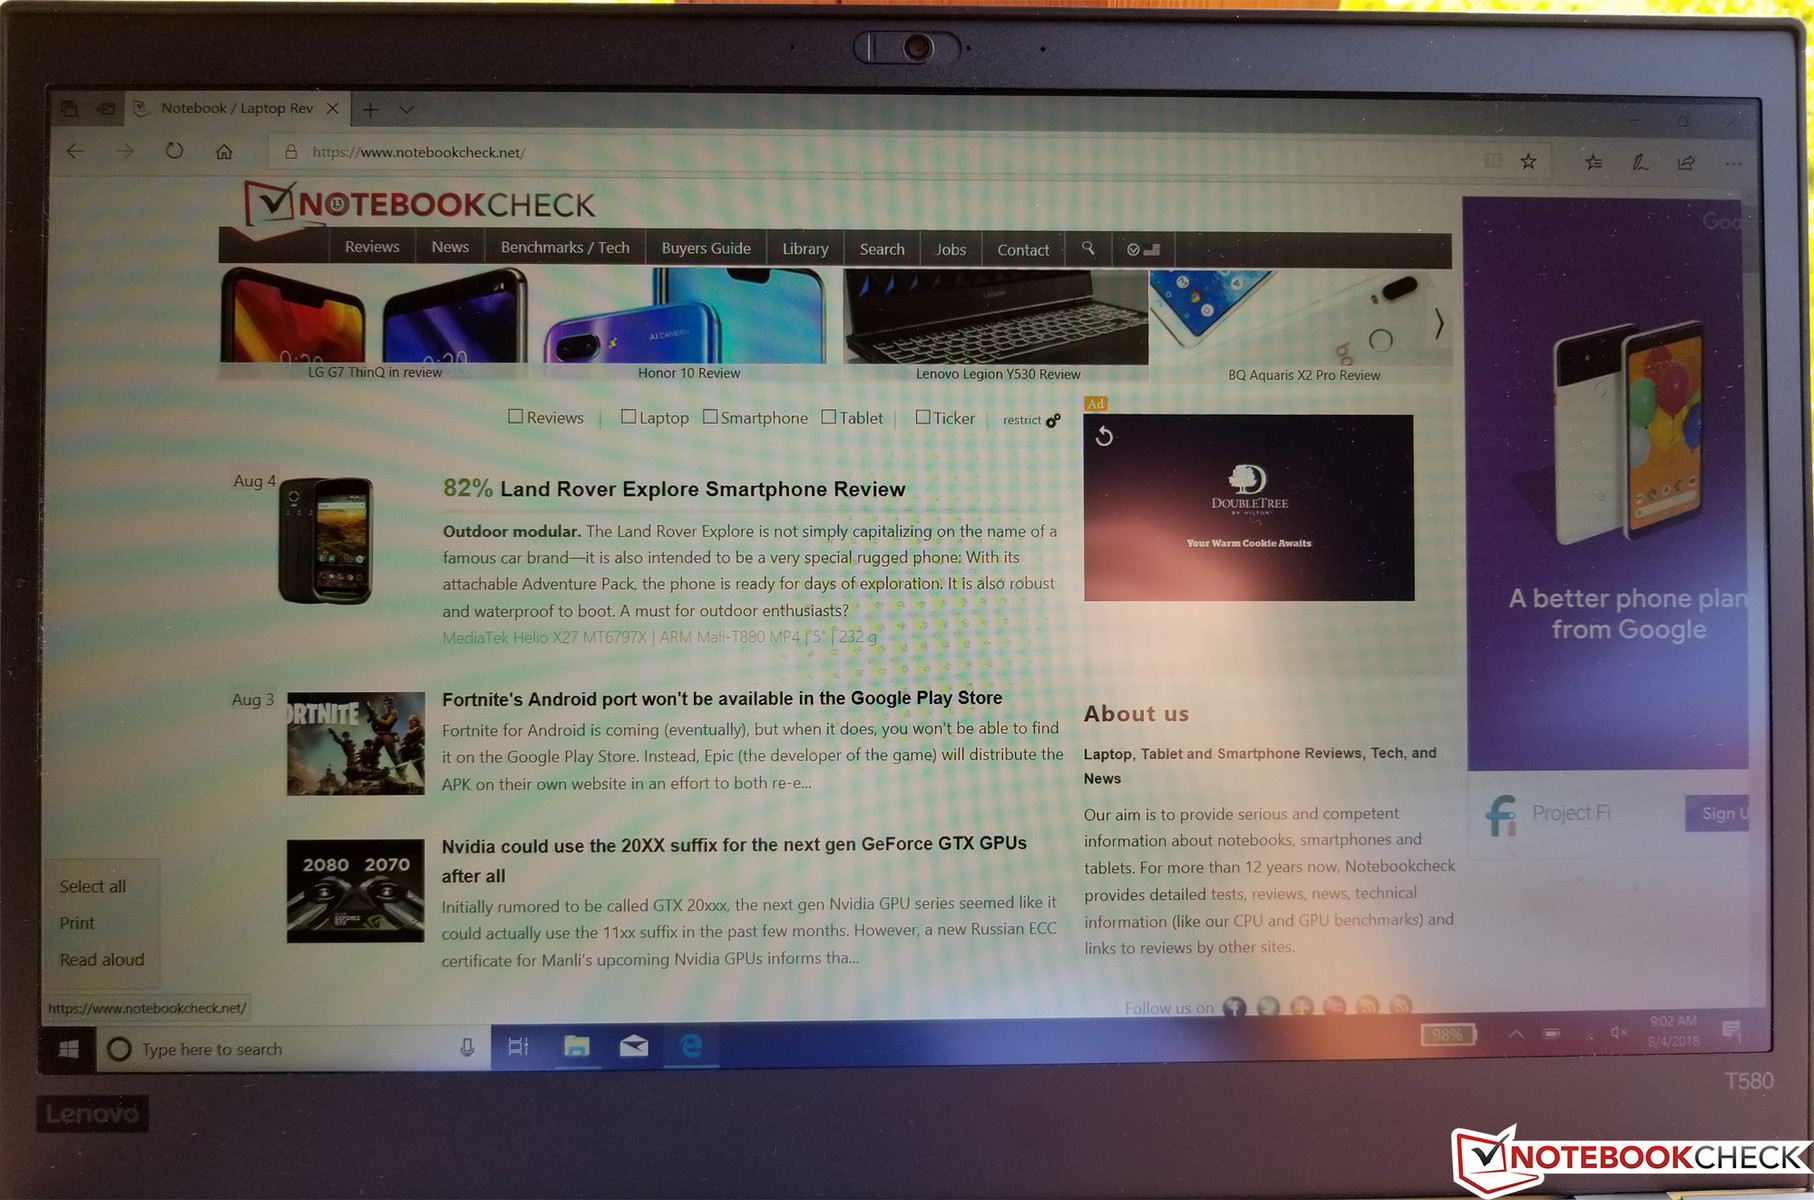
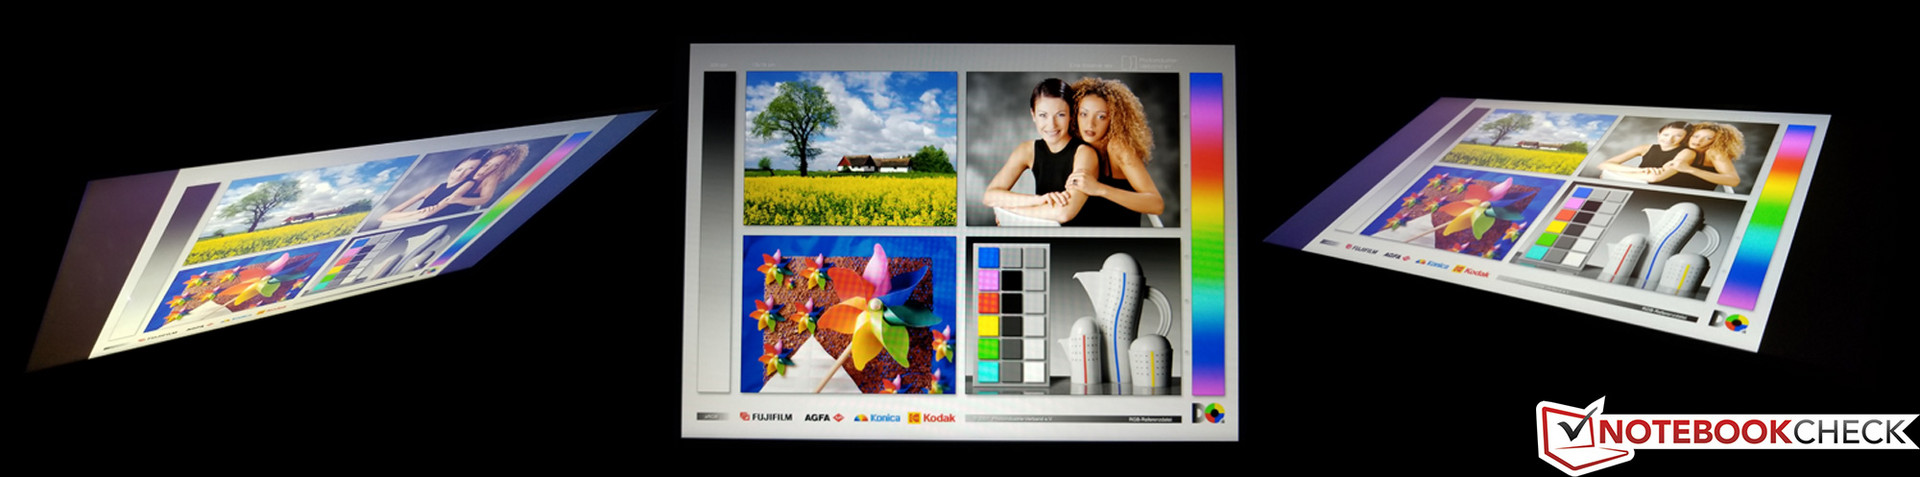
Outdoors, the display predictably struggles even in spite of its matte finish: brightness is simply overpowered by any degree of sunlight. Viewing angles at least are not a problem in the slightest.
Performance
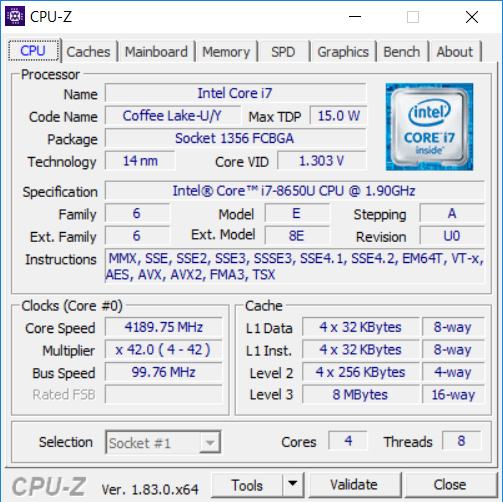
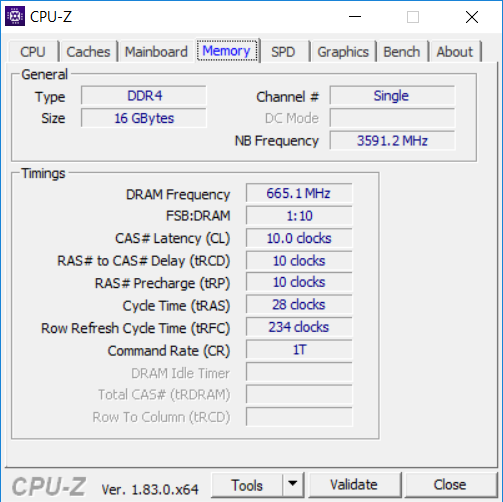
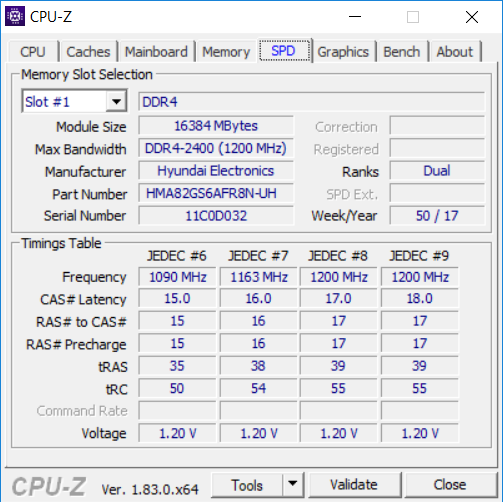
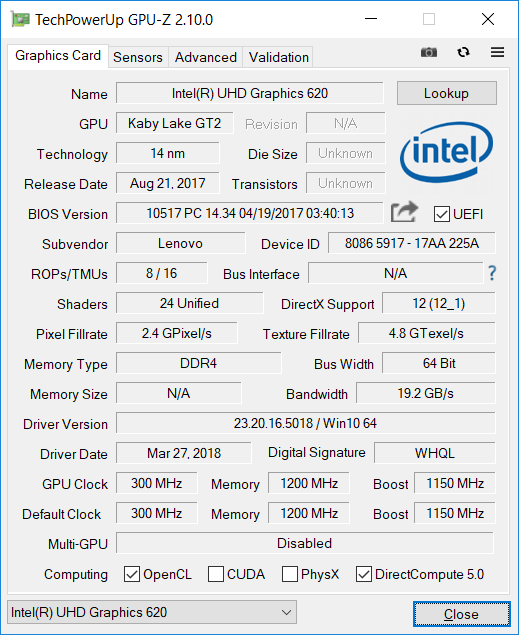
The ThinkPad T580 is configurable with CPUs ranging from the dual-core Core i5-7200U up to the quad-core Core i7-8650U alongside dual-channel RAM configurations up to 32 GB in total capacity. GPU options include either the conventional Intel UHD Graphics 620 or dedicated NVIDIA GeForce MX150 (with 2 GB GDDR5 VRAM). Whereas our review unit a few months ago included a Core i7-8550U with 8 GB RAM, today’s candidate bumps it up to a Core i7-8650U and doubles the RAM to 16 GB. However, today’s machine trades the dedicated MX150 GPU for on-chip Intel UHD Graphics 620.
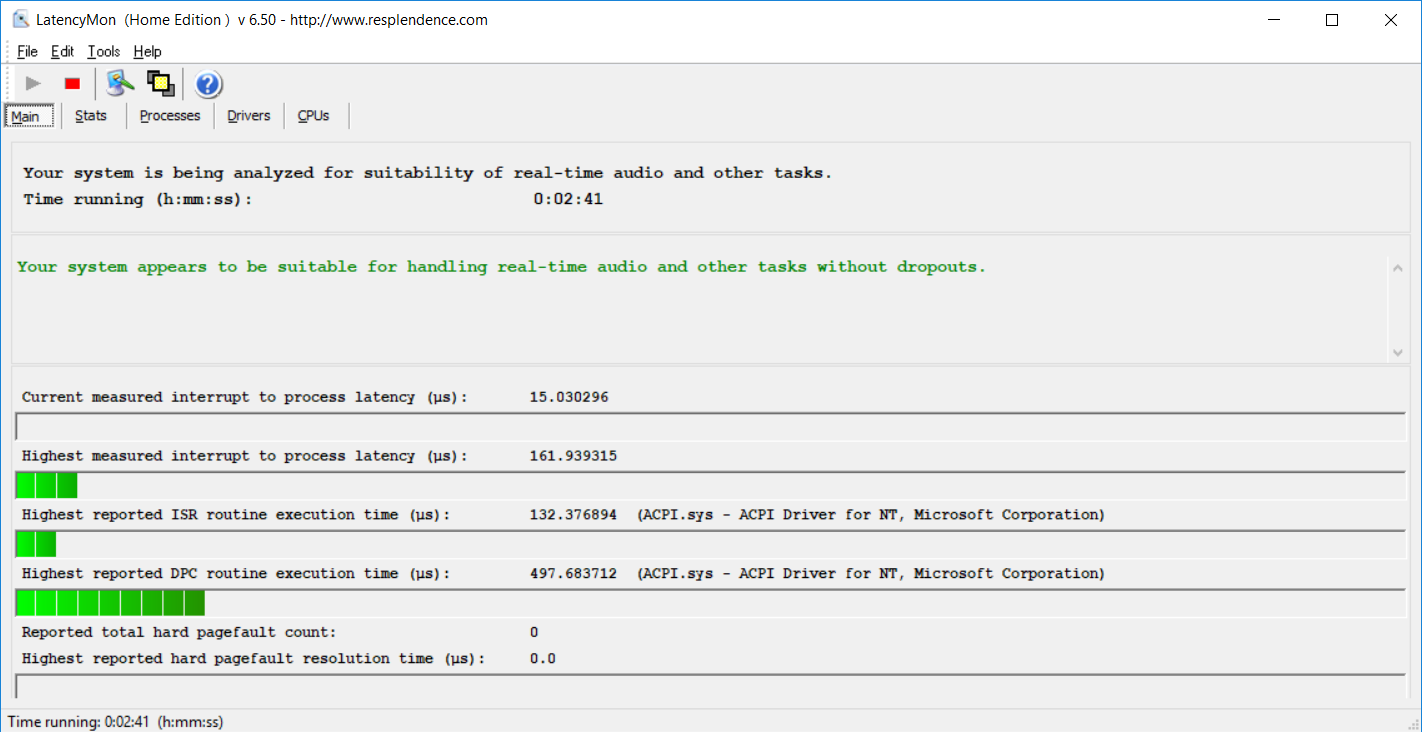
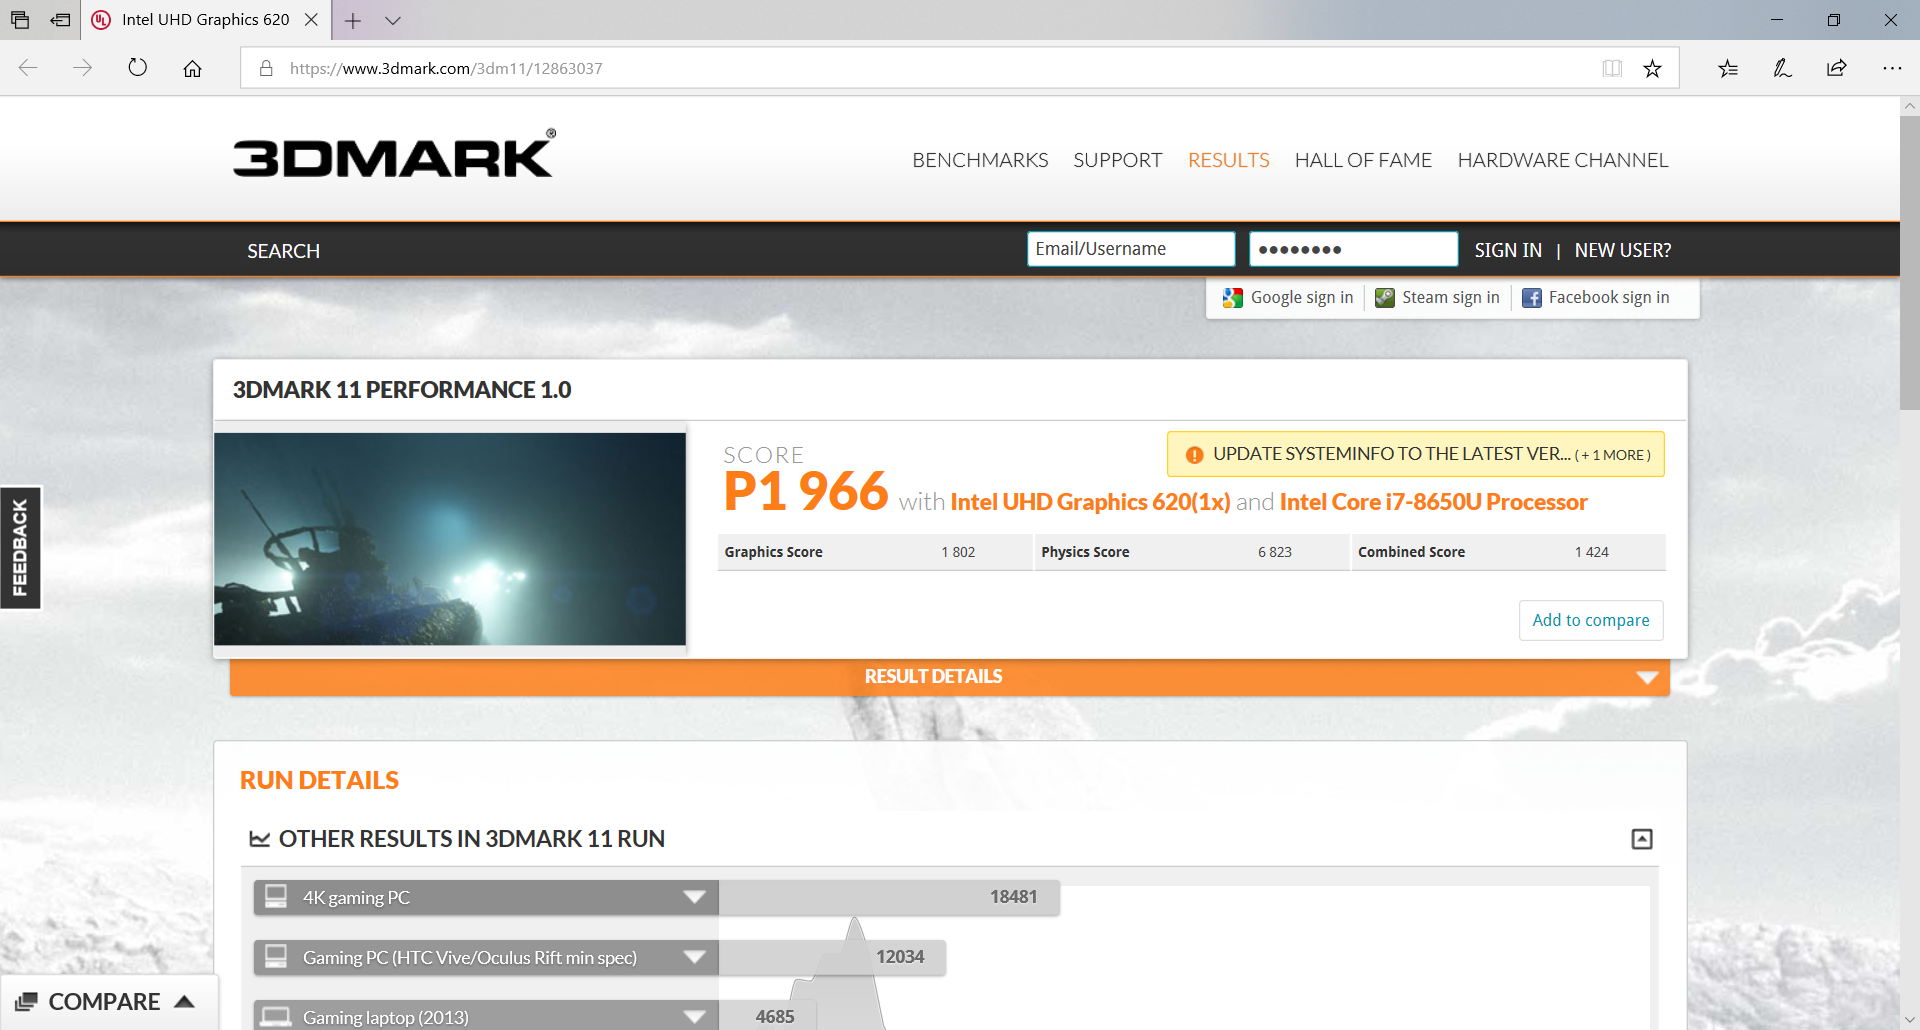
Before we get to our performance benchmark results, we should mention that we experienced only a slight reduction in processing speeds while operating unplugged (a drop to 1807 in 3DMark 11 versus 1966 while on AC power), as well as no issues with DPC Latencies even with all wireless radios active.
Processor
The Intel Core i7-8650U in today’s review unit is a quad-core SoC with a clock rate ranging between 1.9 GHz and 4.2 GHz. As with all of the other CPU options (both 7th and 8th-generation Intel Core i5/i7), it carries a TDP of 15 W, but as we’ve seen in the past, with regard to the Kaby Lake Refresh CPUs, more expensive is not necessarily better (depending on the implementation, power provisions, thermal headroom, and particular firmware of the device).
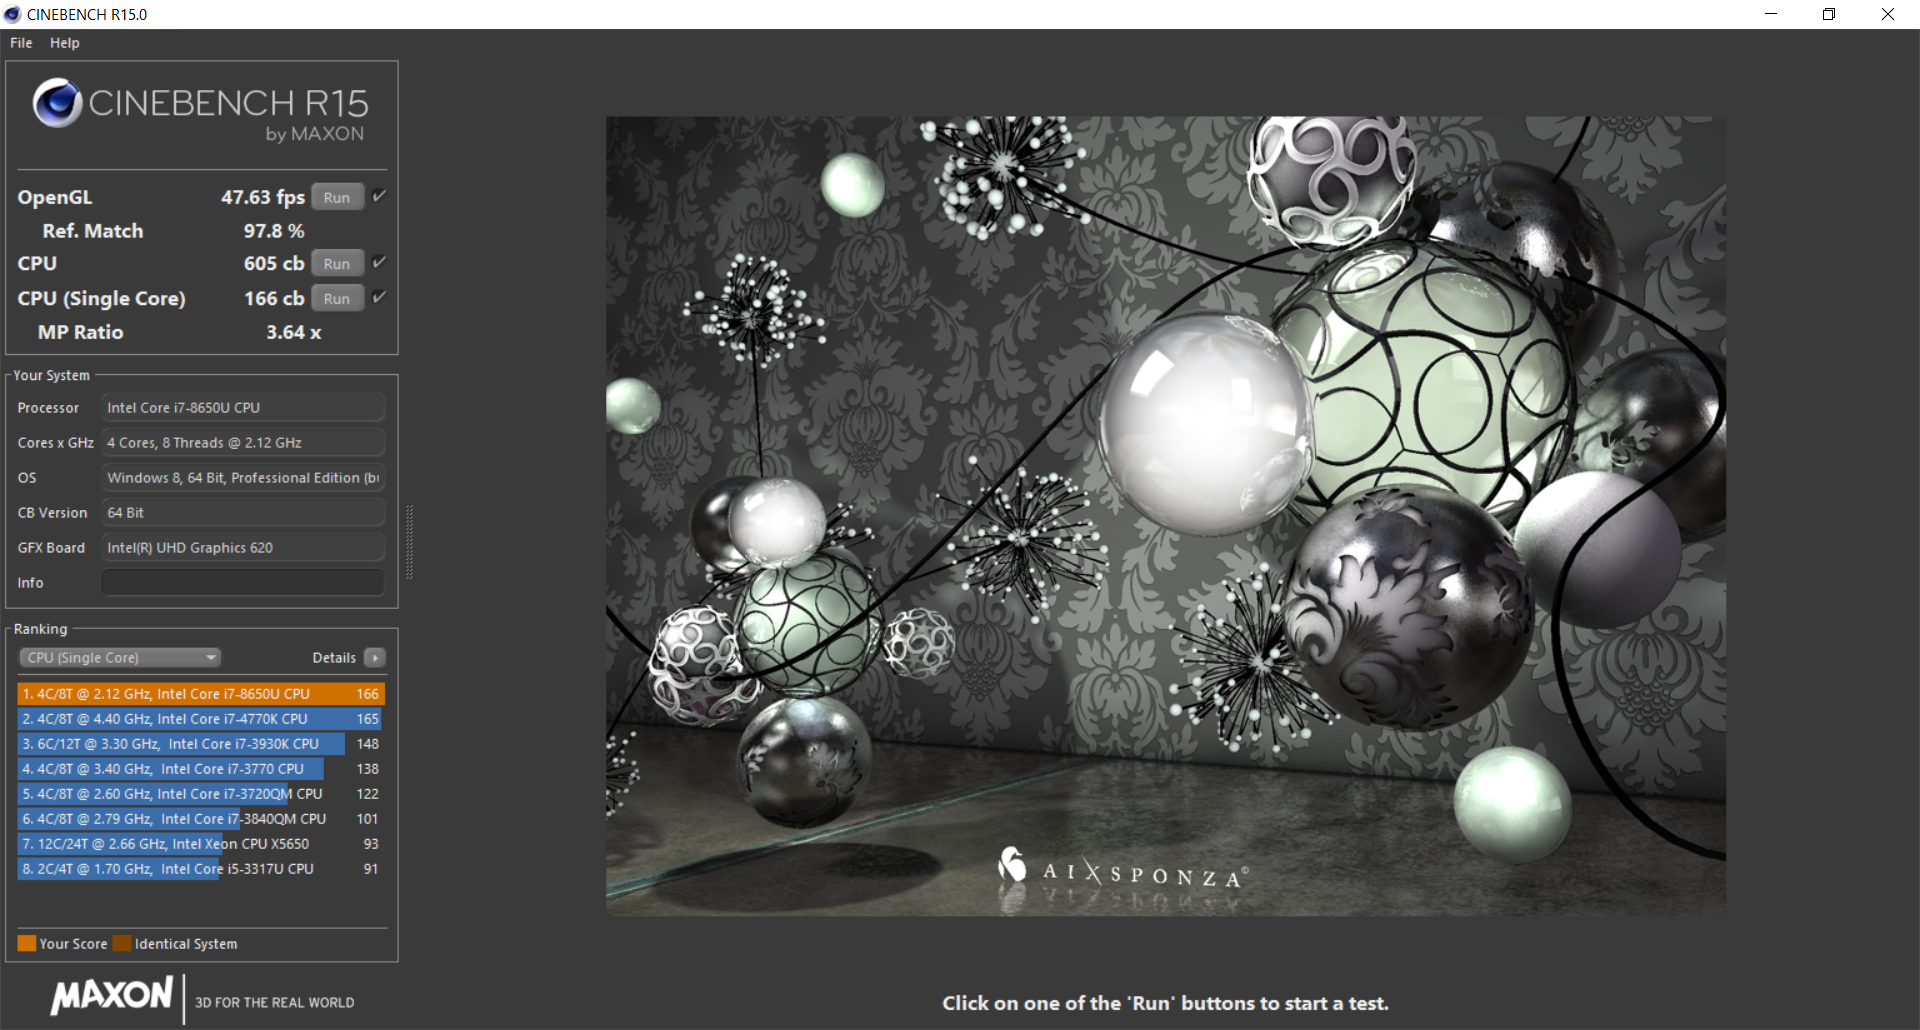
That’s unfortunately precisely what we discovered with today’s review unit, where the Core i7-8650U actually performed below that of the previous T580 (equipped with the Core i7-8550U), even with the latest BIOS installed. While single-core operation is essentially neck-and-neck (and on par with the average of recorded scores in our database for all Core i7-8650U-equipped devices), Cinebench R15 multi-core scored today’s unit just 605 points, which is 9% below the 660 points of the previous unit and also slightly (1%) below the current average for that CPU.
To be fair, the Core i7-8550U T580 could only have been described as an overachiever, as it outstripped its corresponding CPU average by a whopping 14% in the multi-core test. But contributing further to this slight disappointment is the fact that—as before—we once again witnessed what appeared to be an 80 °C long-term temperature limit (after the initial 95 °C sprint is finished), but unlike last time, the machine fails to recover to normal performance once performance drops in today’s review unit. As our graph below illustrates, the tenth run of Cinebench R15 multi-CPU in our sustained performance test sees a considerable drop to the 448 – 478 range of scores, nearly 20% below the initial highest score of 590. All subsequent runs remain in this range.
Thus, unless other variables are in play, it seems that the i7-8650U-equipped T580 we’re reviewing today possesses no true CPU performance advantages over the previous configuration. In light of that, we’d recommend saving your money and springing for the i7-8550U instead.
| Cinebench R15 | |
| CPU Single 64Bit | |
| Average of class Office (99.5 - 312, n=74, last 2 years) | |
| Dell XPS 15 9570 i7 UHD | |
| Lenovo ThinkPad T580-20L9001AUS | |
| Average Intel Core i7-8650U (128 - 178, n=17) | |
| Lenovo ThinkPad T580-20LAS01H00 | |
| Dell Latitude 5590 | |
| HP EliteBook 850 G4 Z8W50EA | |
| CPU Multi 64Bit | |
| Average of class Office (250 - 3380, n=74, last 2 years) | |
| Dell XPS 15 9570 i7 UHD | |
| Dell XPS 15 9570 i7 UHD | |
| Dell Latitude 5590 | |
| Lenovo ThinkPad T580-20LAS01H00 | |
| Lenovo ThinkPad T580-20L9001AUS | |
| Average Intel Core i7-8650U (451 - 675, n=19) | |
| HP EliteBook 850 G4 Z8W50EA | |
System Performance
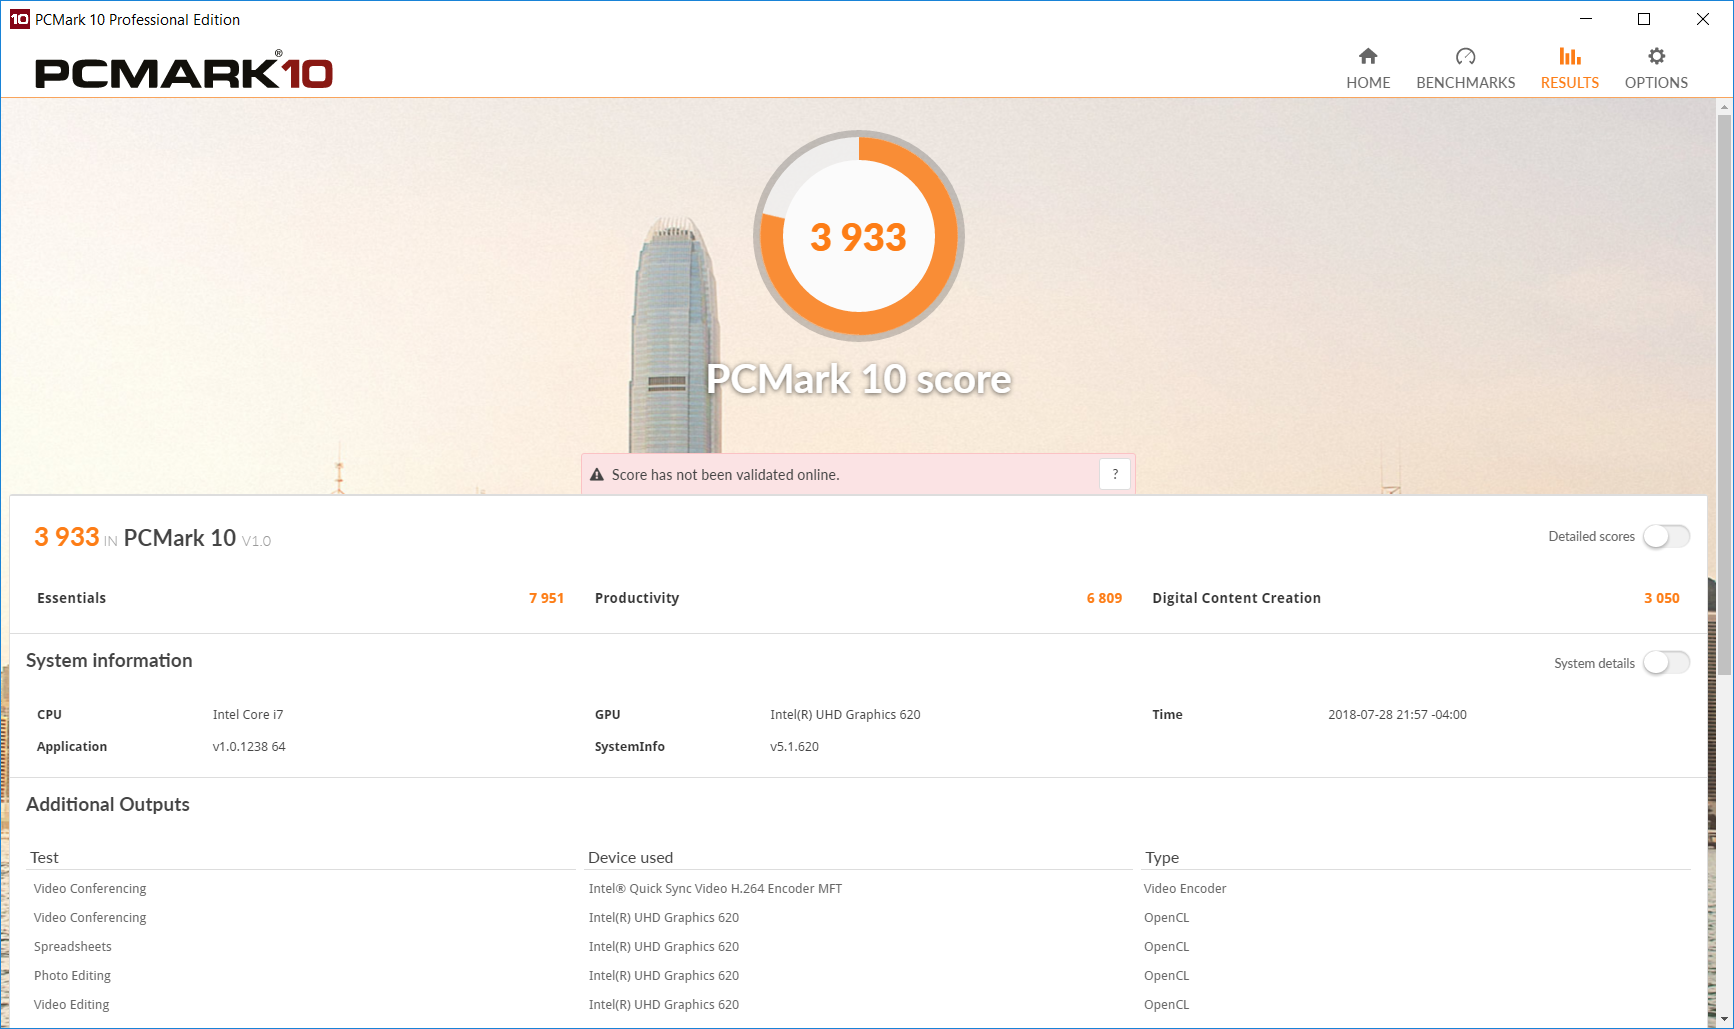
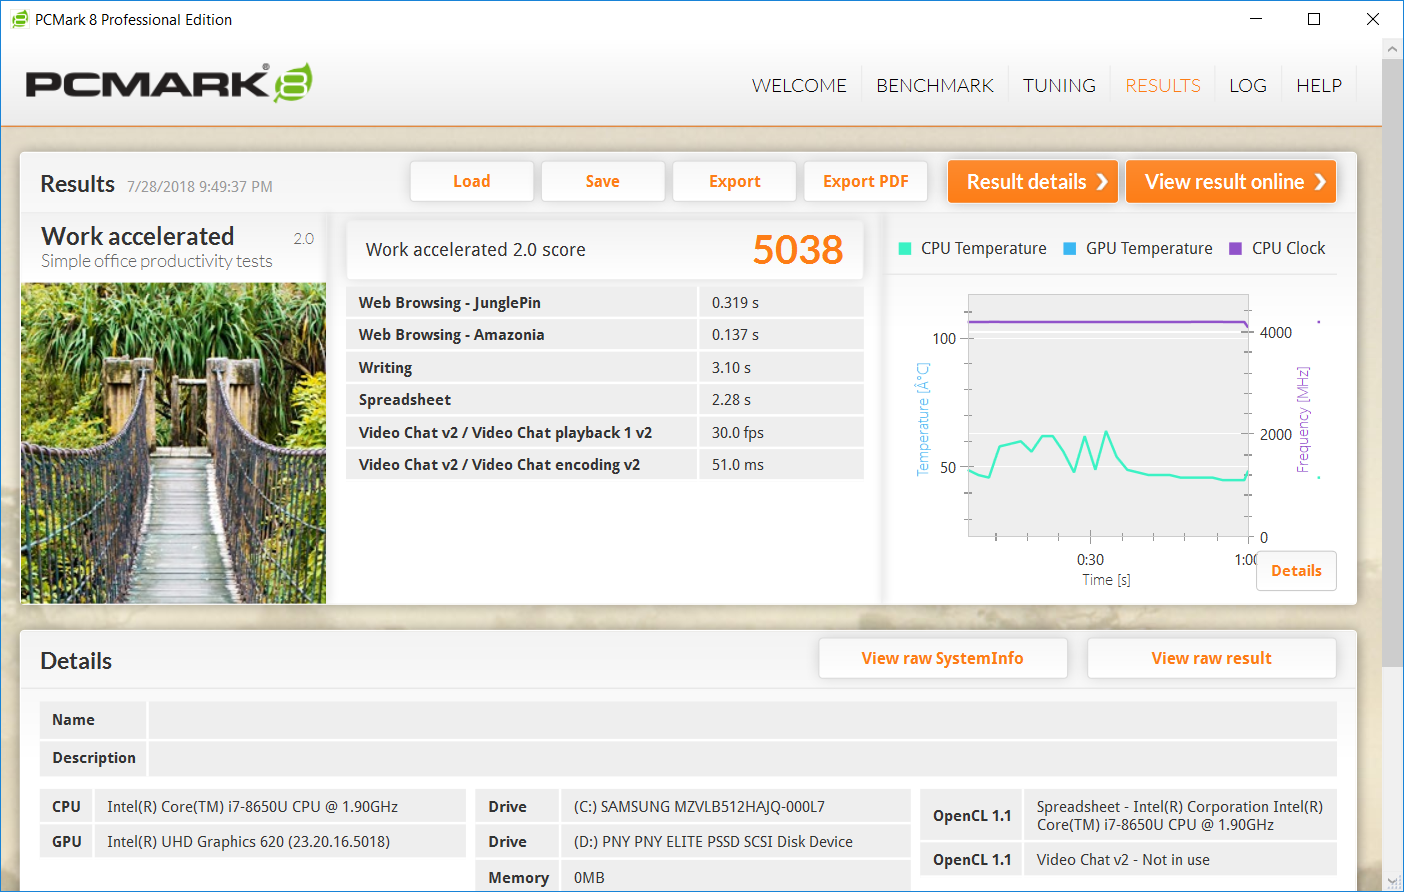
Fortunately, a strong CPU result isn’t the sole constituent of a fast machine, and our PCMark synthetic performance results are evidence of that—where today’s T580 (helped along by its lower-resolution display, in fairness) bests the previous configuration and tops most of the performance charts across both PCMark 8 and 10. Subjectively, we never encountered any notable performance stutters or hangs, either.
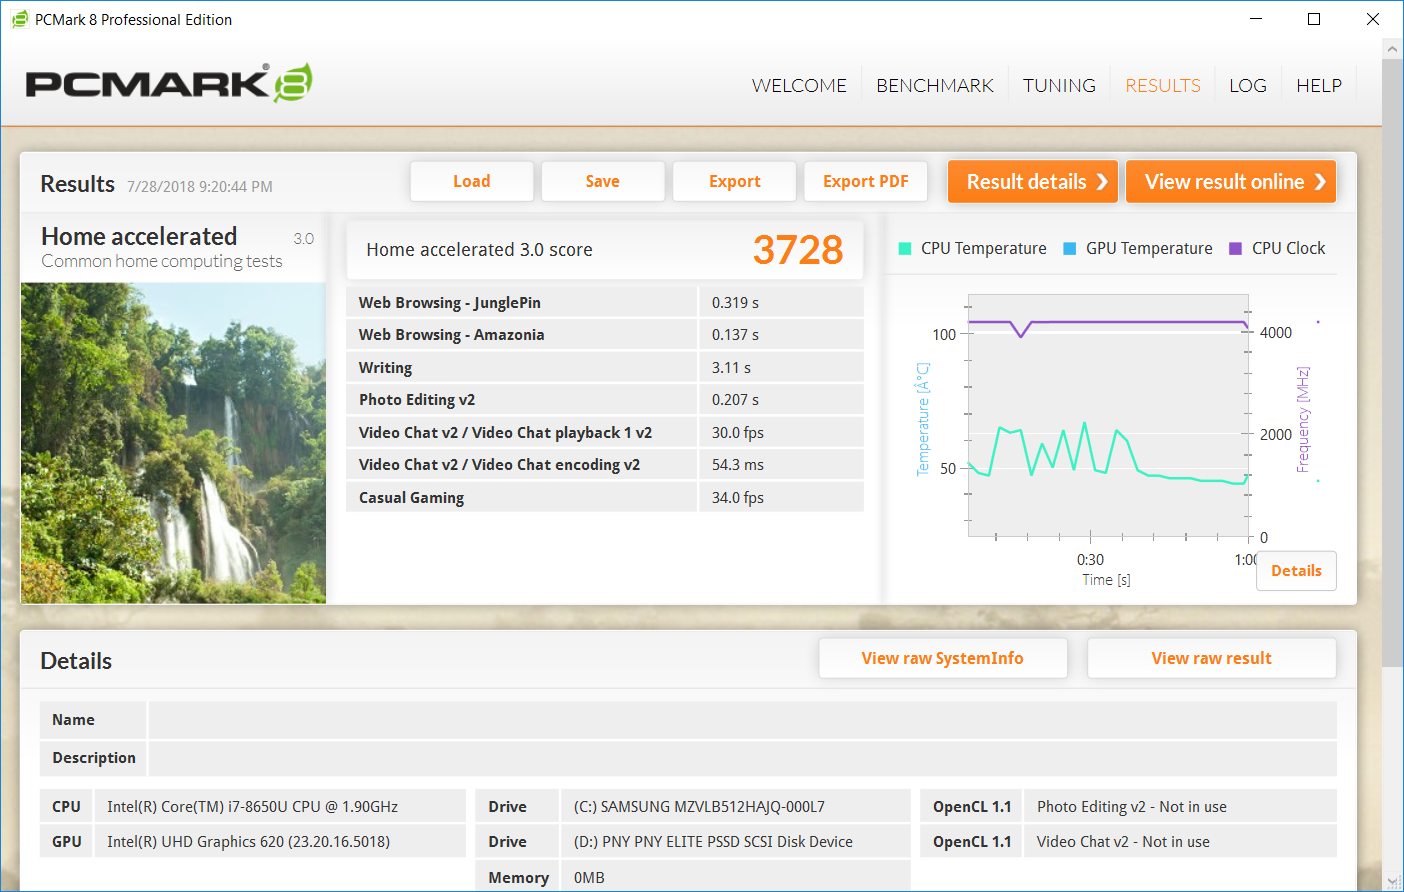
| PCMark 8 Home Score Accelerated v2 | 3728 points | |
| PCMark 8 Work Score Accelerated v2 | 5038 points | |
| PCMark 10 Score | 3933 points | |
Help | ||
Storage Devices
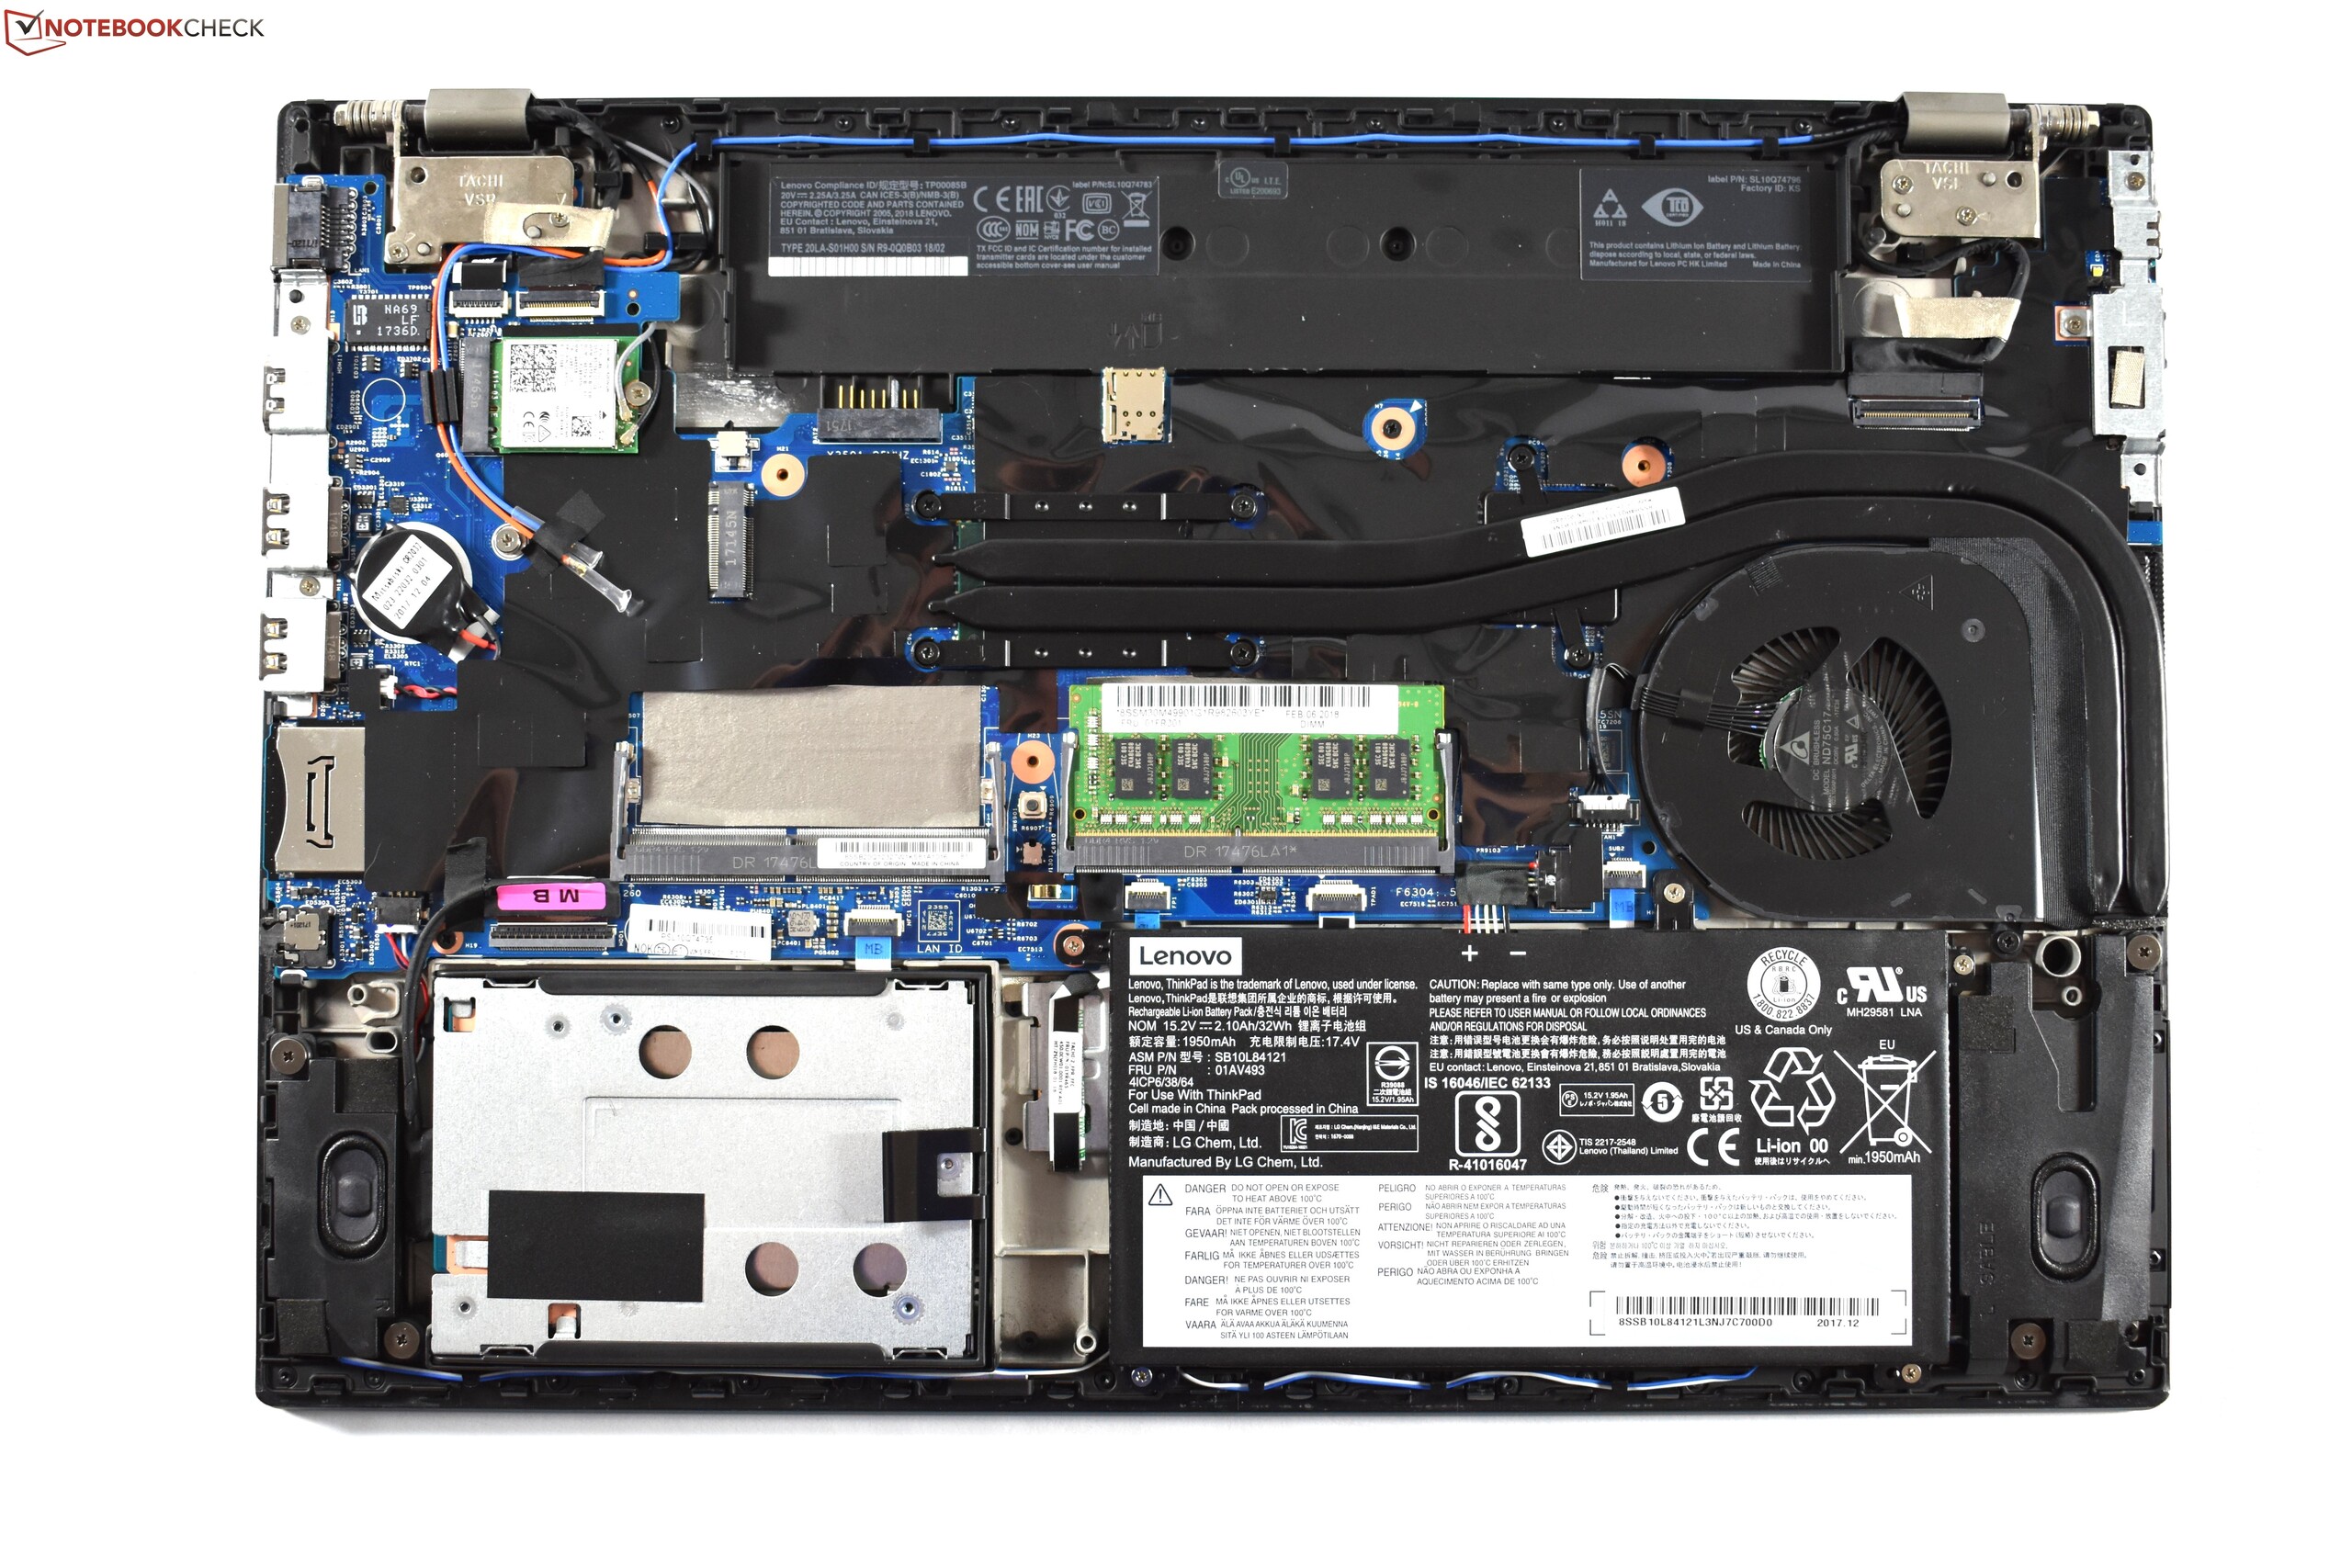
Much of our subjective experience noted in the previous section is thanks to the very fast internal Samsung PM981 NVMe SSD included in our review unit, which is in fact the same drive that was found in last April’s test unit. And just like last time, the drive is installed via a bay adapter in the 2.5-inch SATA drive bay, which effectively limits its speeds to those of PCIe x2. While it’s not ideal, in spite of this, overall performance is nonetheless sufficiently fast that it should never prove noticeable as a bottleneck to the user during typical use.
Dual storage is indeed possible if a second M.2-2242 SSD is installed in the WWAN slot, which also in fact doubles as a PCIe 3.0 x4 slot. We didn’t test this configuration, but it’s specified in Lenovo’s technical documentation.
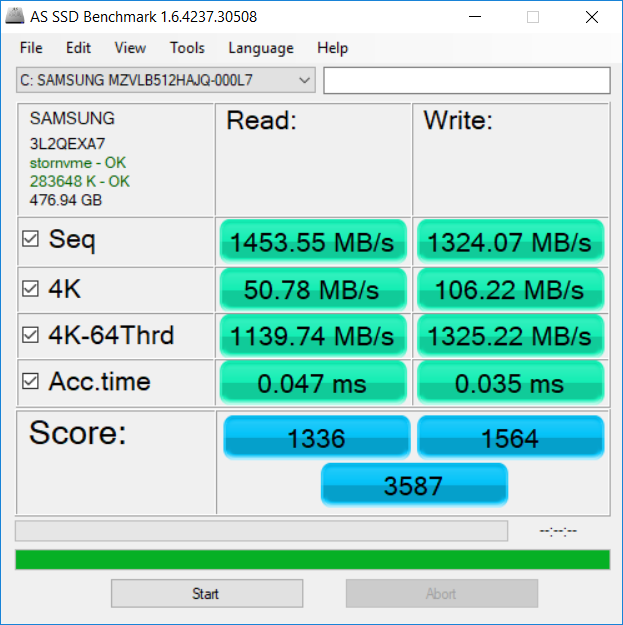
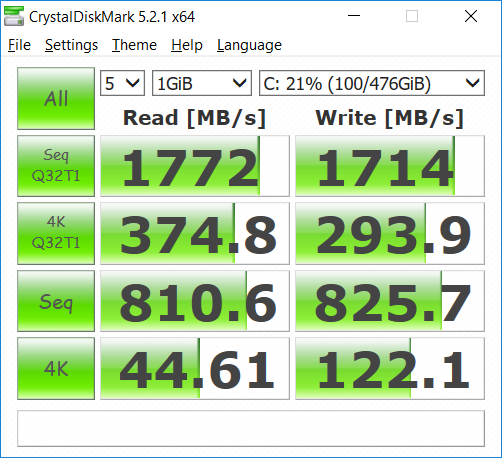
| Lenovo ThinkPad T580-20L9001AUS Samsung SSD PM981 MZVLB512HAJQ | Lenovo ThinkPad T580-20LAS01H00 Samsung SSD PM981 MZVLB512HAJQ | Dell Latitude 5590 SK hynix SC311 M.2 | HP EliteBook 850 G4 Z8W50EA Samsung PM961 NVMe MZVLW512HMJP | Average Samsung SSD PM981 MZVLB512HAJQ | |
|---|---|---|---|---|---|
| AS SSD | -3% | -69% | 13% | -3% | |
| Score Total (Points) | 3587 | 3548 -1% | 912 -75% | 3789 6% | 3966 ? 11% |
| Score Write (Points) | 1564 | 1515 -3% | 326 -79% | 1291 -17% | 1780 ? 14% |
| Score Read (Points) | 1336 | 1342 0% | 385 -71% | 1681 26% | 1451 ? 9% |
| Access Time Write * (ms) | 0.035 | 0.033 6% | 0.047 -34% | 0.031 11% | 0.08337 ? -138% |
| Access Time Read * (ms) | 0.047 | 0.059 -26% | 0.111 -136% | 0.037 21% | 0.05092 ? -8% |
| 4K-64 Write (MB/s) | 1325 | 1278 -4% | 212.7 -84% | 1017 -23% | 1504 ? 14% |
| 4K-64 Read (MB/s) | 1140 | 1153 1% | 306 -73% | 1382 21% | 1203 ? 6% |
| 4K Write (MB/s) | 106.2 | 110.9 4% | 73.5 -31% | 120.6 14% | 112 ? 5% |
| 4K Read (MB/s) | 50.8 | 51.5 1% | 29.03 -43% | 49.34 -3% | 50.5 ? -1% |
| Seq Write (MB/s) | 1324 | 1262 -5% | 393 -70% | 1538 16% | 1637 ? 24% |
| Seq Read (MB/s) | 1454 | 1373 -6% | 503 -65% | 2497 72% | 1976 ? 36% |
* ... smaller is better

GPU Performance
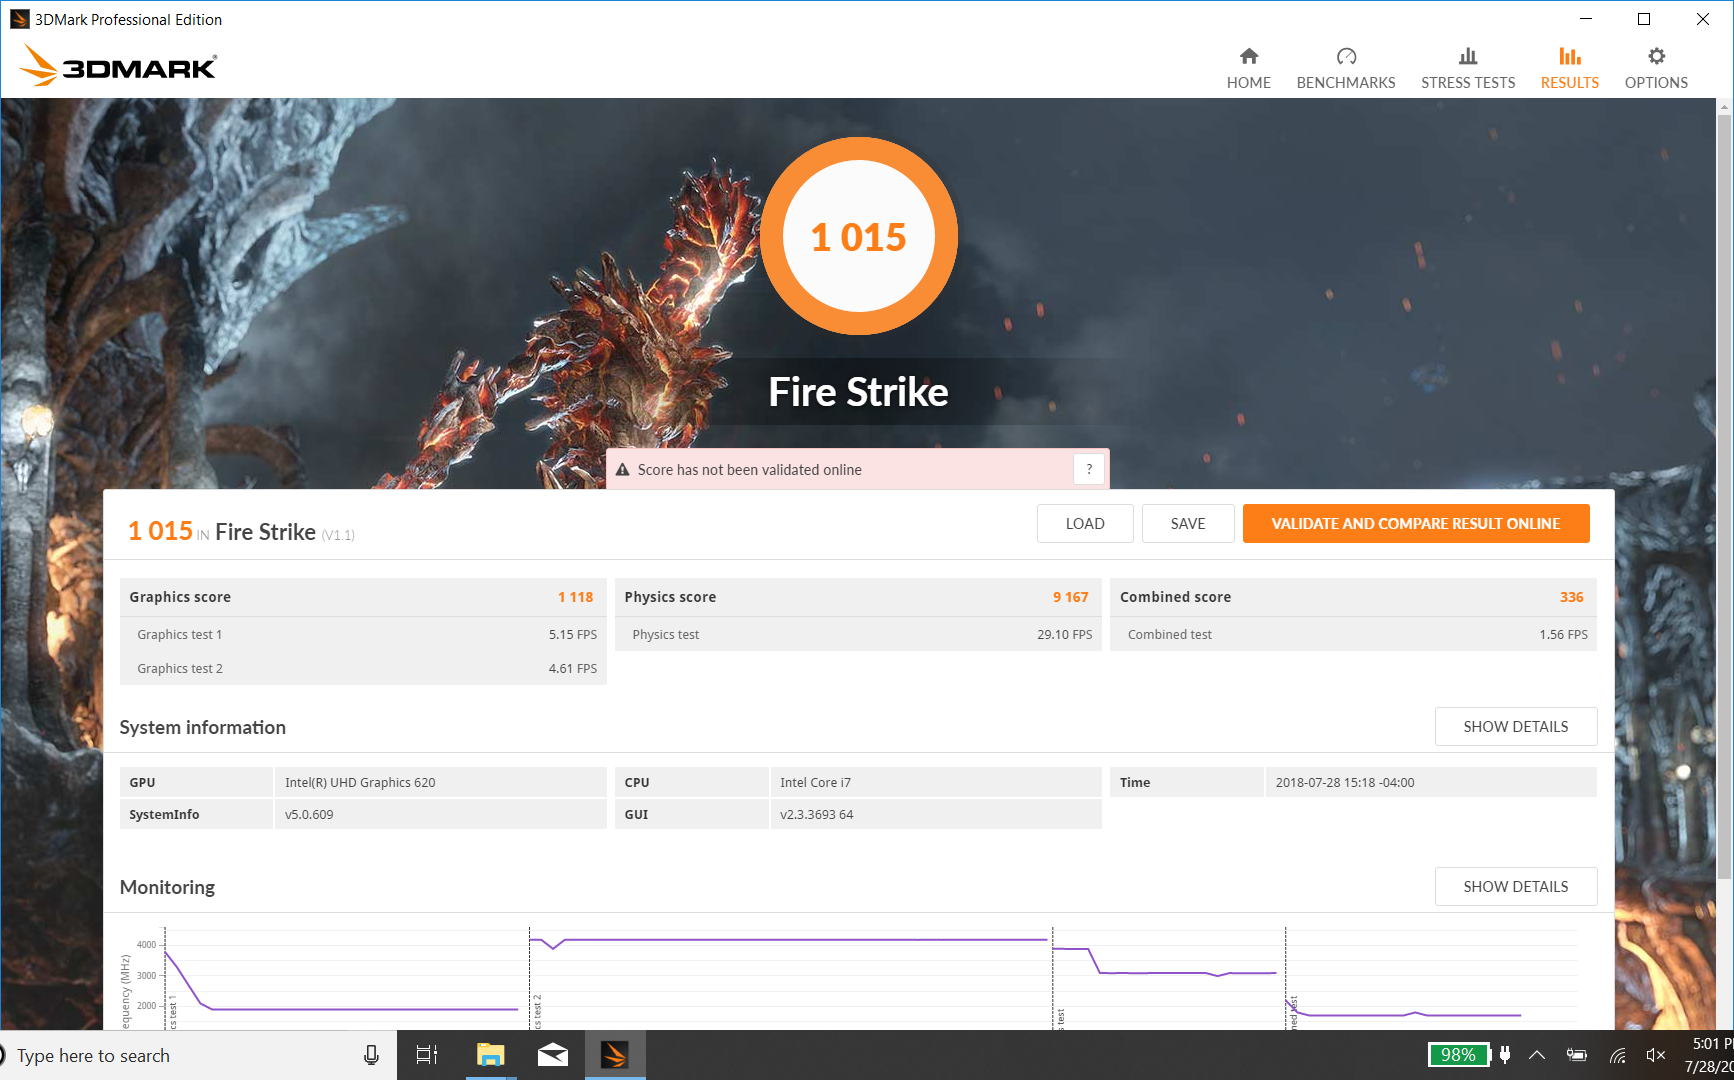
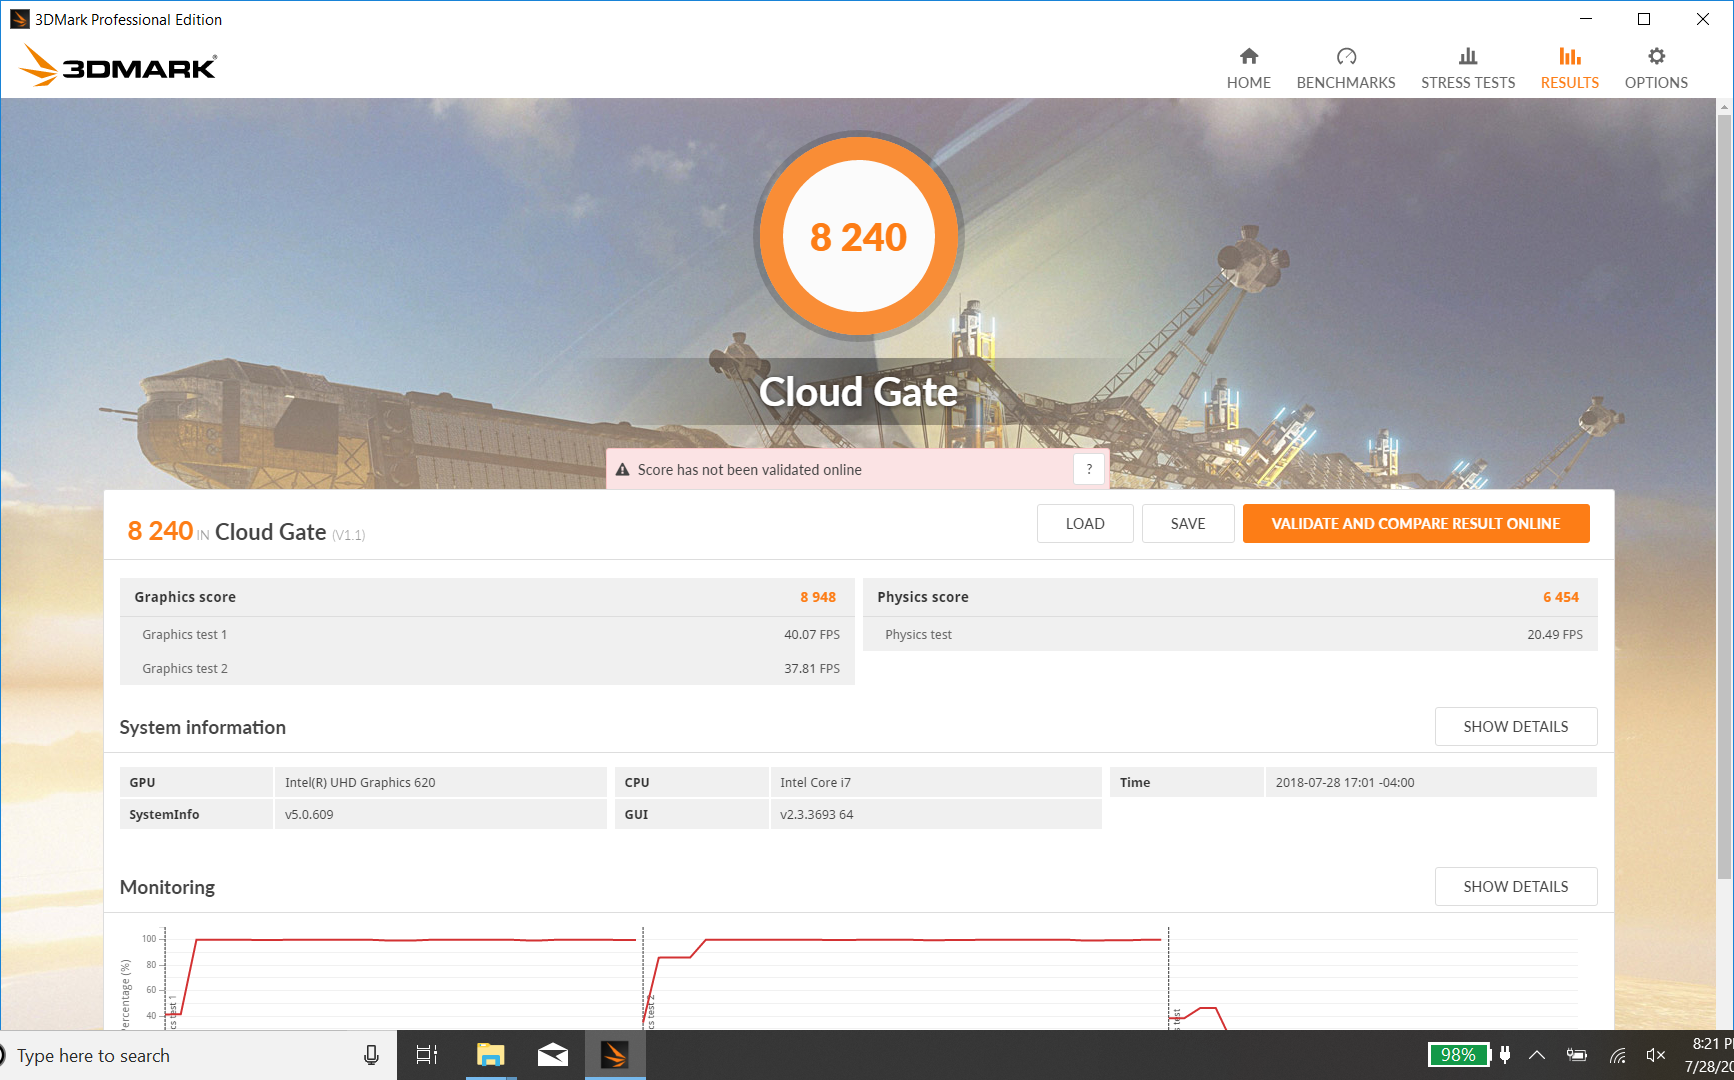
Of course, the retreat from the NVIDIA GeForce MX150 in the previous model back to integrated Intel UHD Graphics 620 in today’s unit means vastly weaker graphical performance. The MX150-equipped configuration manages scores up to five times higher (depending on the benchmark)—so if GPU performance is important, consider that option instead. For everyone else, the Intel UHD Graphics option will save you some money and reduce power consumption and heat (and therefore improve battery life). And at least in context with other similarly-equipped machines, the T580 fares well.
| 3DMark 11 | |
| 1280x720 Performance GPU | |
| Dell XPS 15 9570 i7 UHD | |
| Average of class Office (2551 - 18313, n=68, last 2 years) | |
| Lenovo ThinkPad T580-20LAS01H00 | |
| Lenovo ThinkPad T580-20L9001AUS | |
| Average Intel UHD Graphics 620 (1144 - 3432, n=244) | |
| Dell Latitude 5590 | |
| HP EliteBook 850 G4 Z8W50EA | |
| 1280x720 Performance Combined | |
| Dell XPS 15 9570 i7 UHD | |
| Average of class Office (2054 - 16787, n=68, last 2 years) | |
| Lenovo ThinkPad T580-20LAS01H00 | |
| Average Intel UHD Graphics 620 (927 - 2505, n=244) | |
| Lenovo ThinkPad T580-20L9001AUS | |
| Dell Latitude 5590 | |
| HP EliteBook 850 G4 Z8W50EA | |
| 3DMark | |
| 1280x720 Cloud Gate Standard Graphics | |
| Average of class Office (11640 - 118515, n=37, last 2 years) | |
| Lenovo ThinkPad T580-20LAS01H00 | |
| Average Intel UHD Graphics 620 (6205 - 16400, n=225) | |
| Lenovo ThinkPad T580-20L9001AUS | |
| Dell Latitude 5590 | |
| HP EliteBook 850 G4 Z8W50EA | |
| 1920x1080 Fire Strike Graphics | |
| Dell XPS 15 9570 i7 UHD | |
| Average of class Office (736 - 21871, n=72, last 2 years) | |
| Lenovo ThinkPad T580-20LAS01H00 | |
| Average Intel UHD Graphics 620 (557 - 2608, n=213) | |
| Lenovo ThinkPad T580-20L9001AUS | |
| Dell Latitude 5590 | |
| HP EliteBook 850 G4 Z8W50EA | |
| 1920x1080 Ice Storm Extreme Graphics | |
| Average of class Office (80312 - 156297, n=5, last 2 years) | |
| Dell Latitude 5590 | |
| Average Intel UHD Graphics 620 (26409 - 59483, n=71) | |
| HP EliteBook 850 G4 Z8W50EA | |
| 3DMark 11 Performance | 1966 points | |
| 3DMark Cloud Gate Standard Score | 8240 points | |
| 3DMark Fire Strike Score | 1015 points | |
Help | ||
| BioShock Infinite | |
| 1280x720 Very Low Preset (sort by value) | |
| Lenovo ThinkPad T580-20L9001AUS | |
| Lenovo ThinkPad T580-20LAS01H00 | |
| Dell Latitude 5590 | |
| HP EliteBook 850 G4 Z8W50EA | |
| Dell XPS 15 9570 i7 UHD | |
| Average Intel UHD Graphics 620 (18.3 - 90.2, n=187) | |
| 1366x768 Medium Preset (sort by value) | |
| Lenovo ThinkPad T580-20L9001AUS | |
| Lenovo ThinkPad T580-20LAS01H00 | |
| Dell Latitude 5590 | |
| HP EliteBook 850 G4 Z8W50EA | |
| Dell XPS 15 9570 i7 UHD | |
| Average Intel UHD Graphics 620 (11.5 - 45.5, n=187) | |
| 1366x768 High Preset (sort by value) | |
| Lenovo ThinkPad T580-20L9001AUS | |
| Lenovo ThinkPad T580-20LAS01H00 | |
| Dell Latitude 5590 | |
| HP EliteBook 850 G4 Z8W50EA | |
| Dell XPS 15 9570 i7 UHD | |
| Average Intel UHD Graphics 620 (8.1 - 35.9, n=187) | |
| 1920x1080 Ultra Preset, DX11 (DDOF) (sort by value) | |
| Lenovo ThinkPad T580-20L9001AUS | |
| Lenovo ThinkPad T580-20LAS01H00 | |
| Dell Latitude 5590 | |
| HP EliteBook 850 G4 Z8W50EA | |
| Dell XPS 15 9570 i7 UHD | |
| Average Intel UHD Graphics 620 (4.5 - 17, n=176) | |
| low | med. | high | ultra | |
|---|---|---|---|---|
| BioShock Infinite (2013) | 60 | 27 | 22 | 8 |
Stress Test
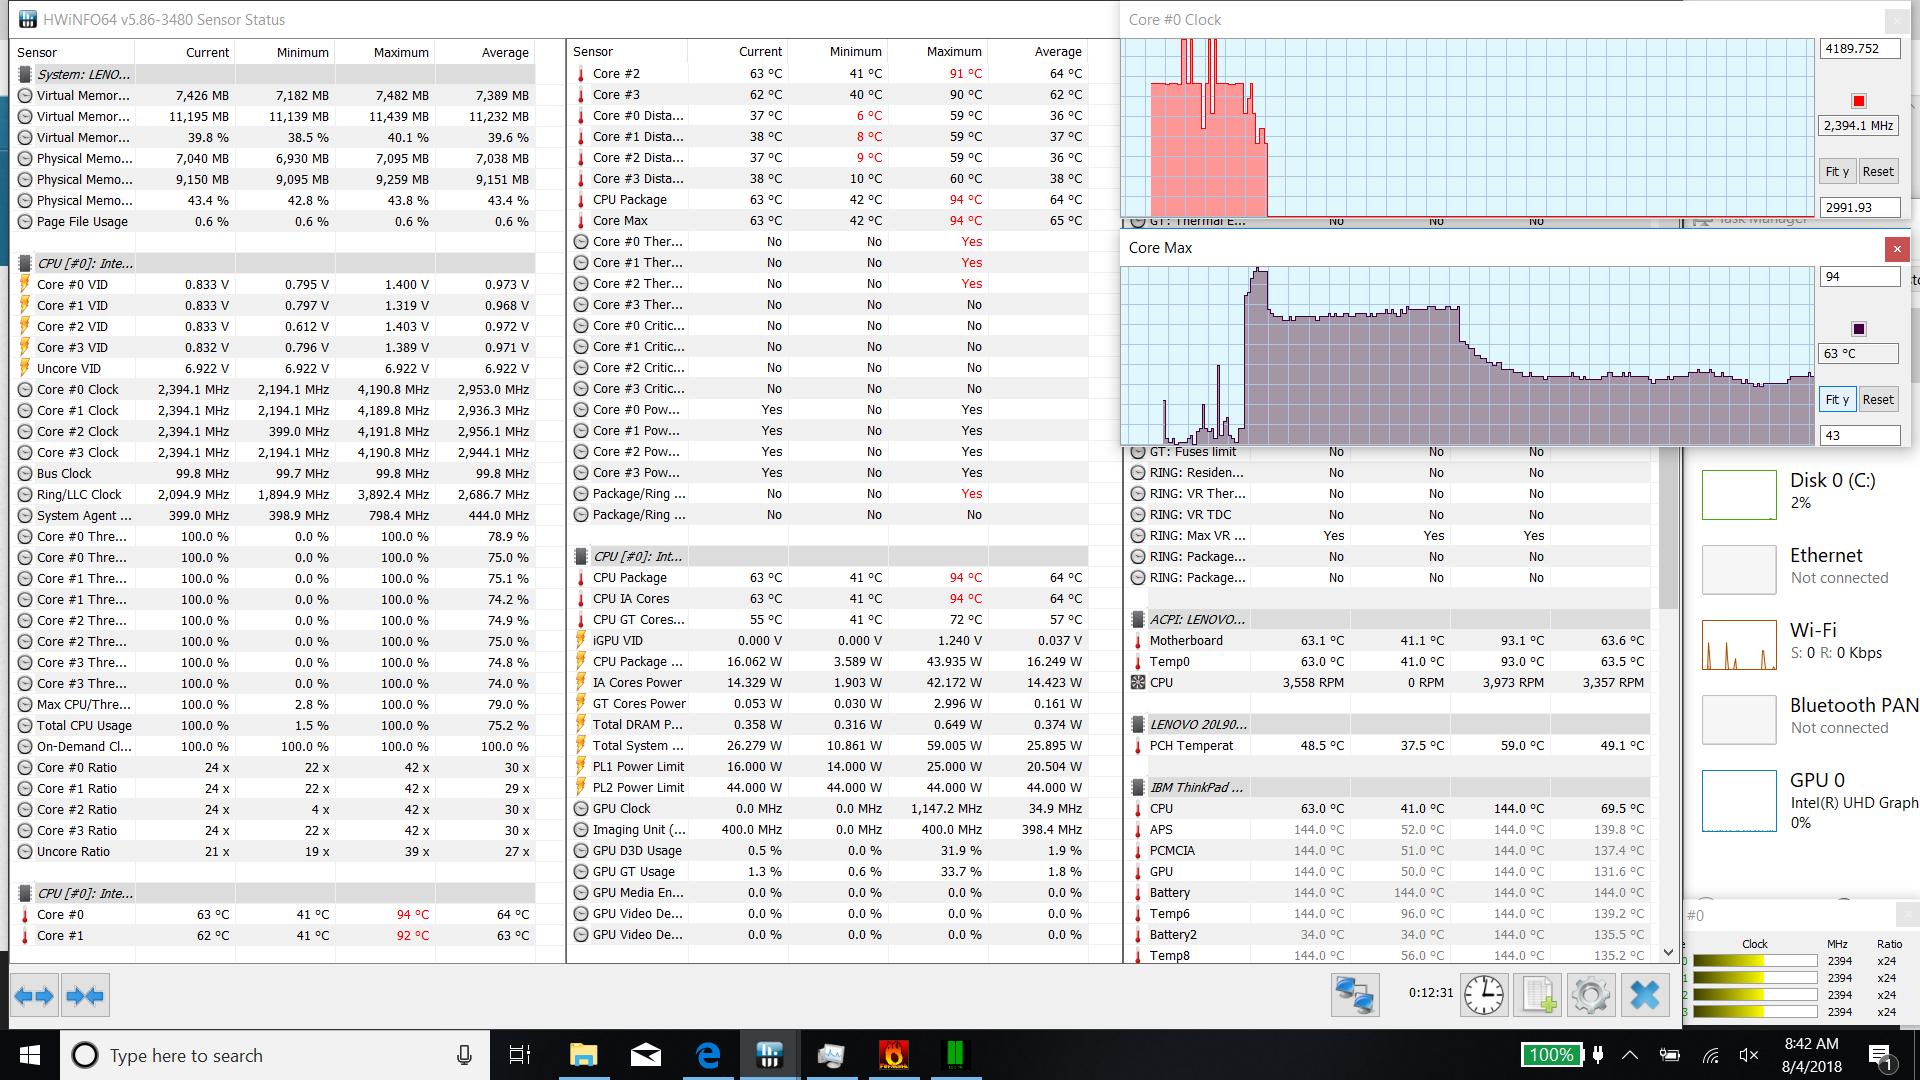
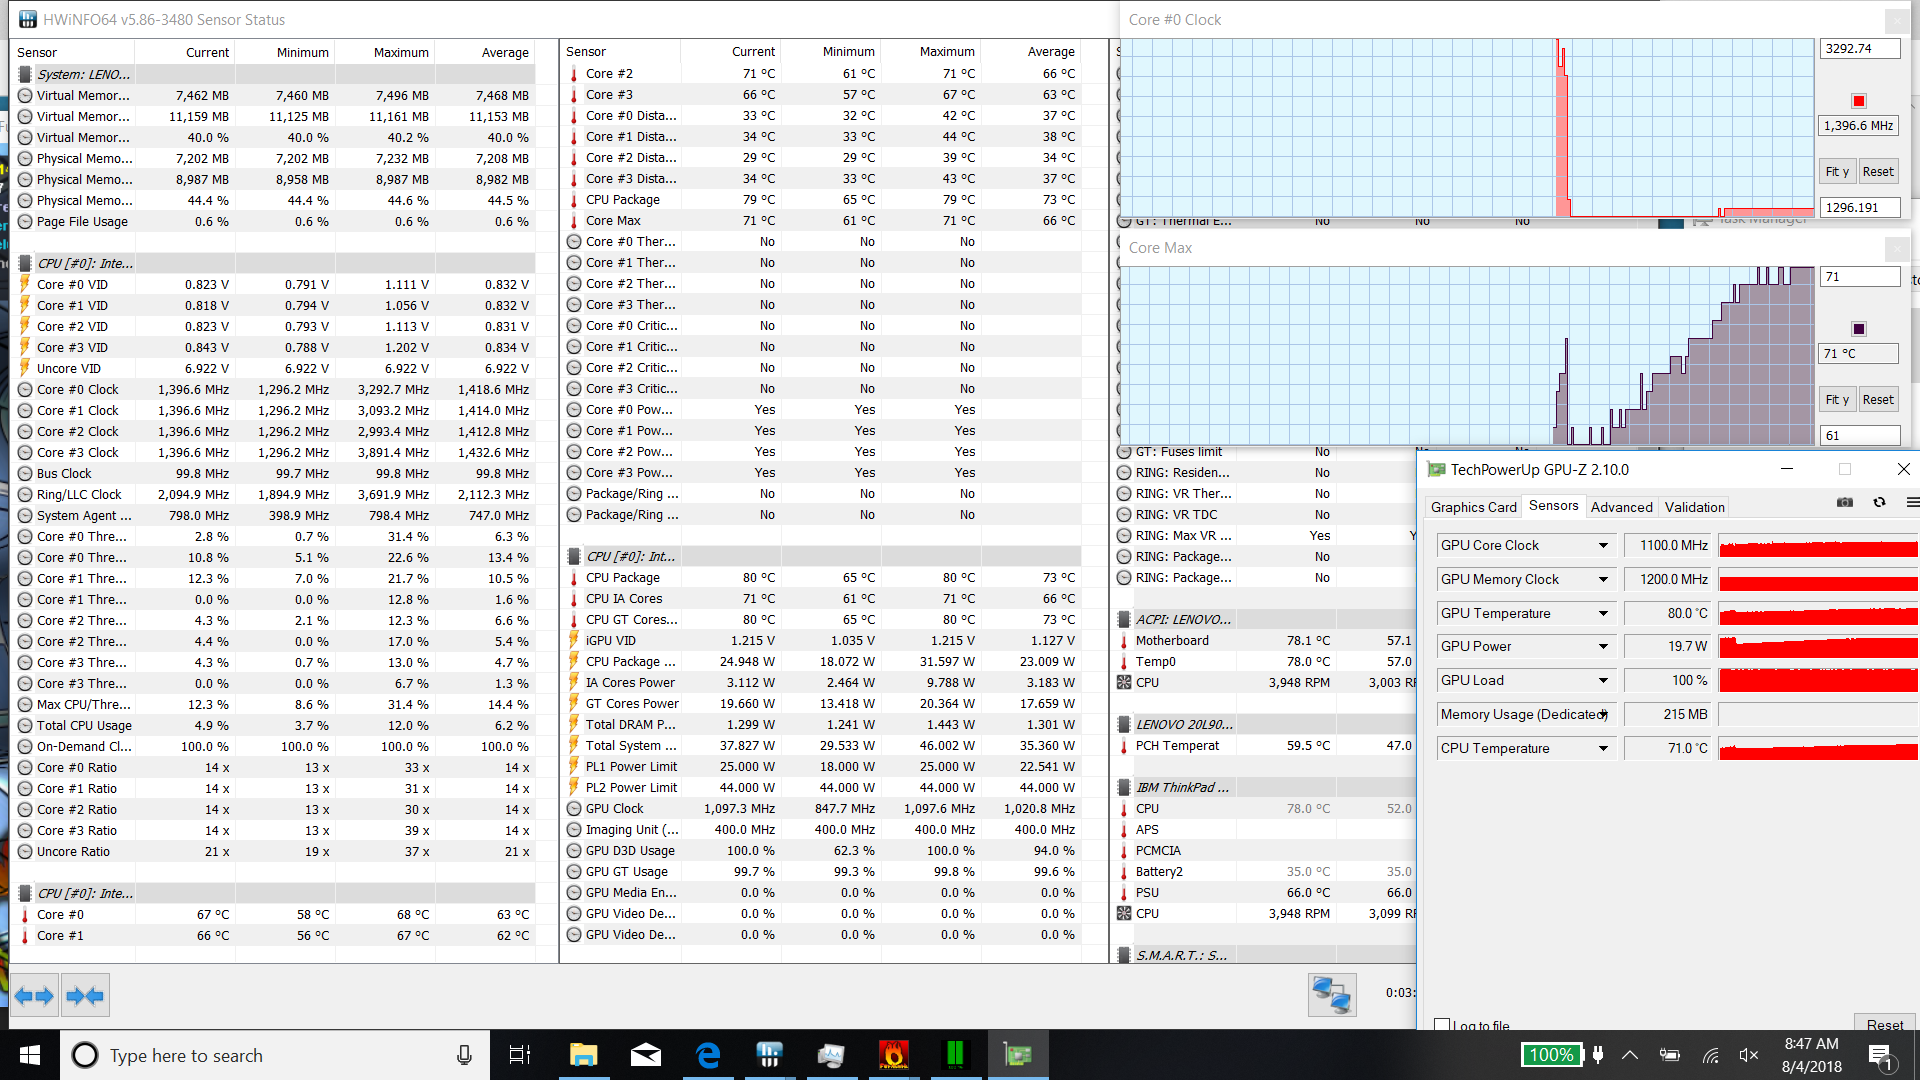
In typical Kaby Lake Refresh fashion, during full CPU synthetic stress, the CPU initially rockets upward toward max turbo speeds—though in this case it only ever reaches around 3.8 GHz under load—before soon subsiding to 2.7 GHz and later 2.4 GHz after temperatures climb back above 80 °C. GPU stress, on the other hand, easily provokes near-max turbo clock rates of 1100 MHz under stable temperatures of 80 °C.
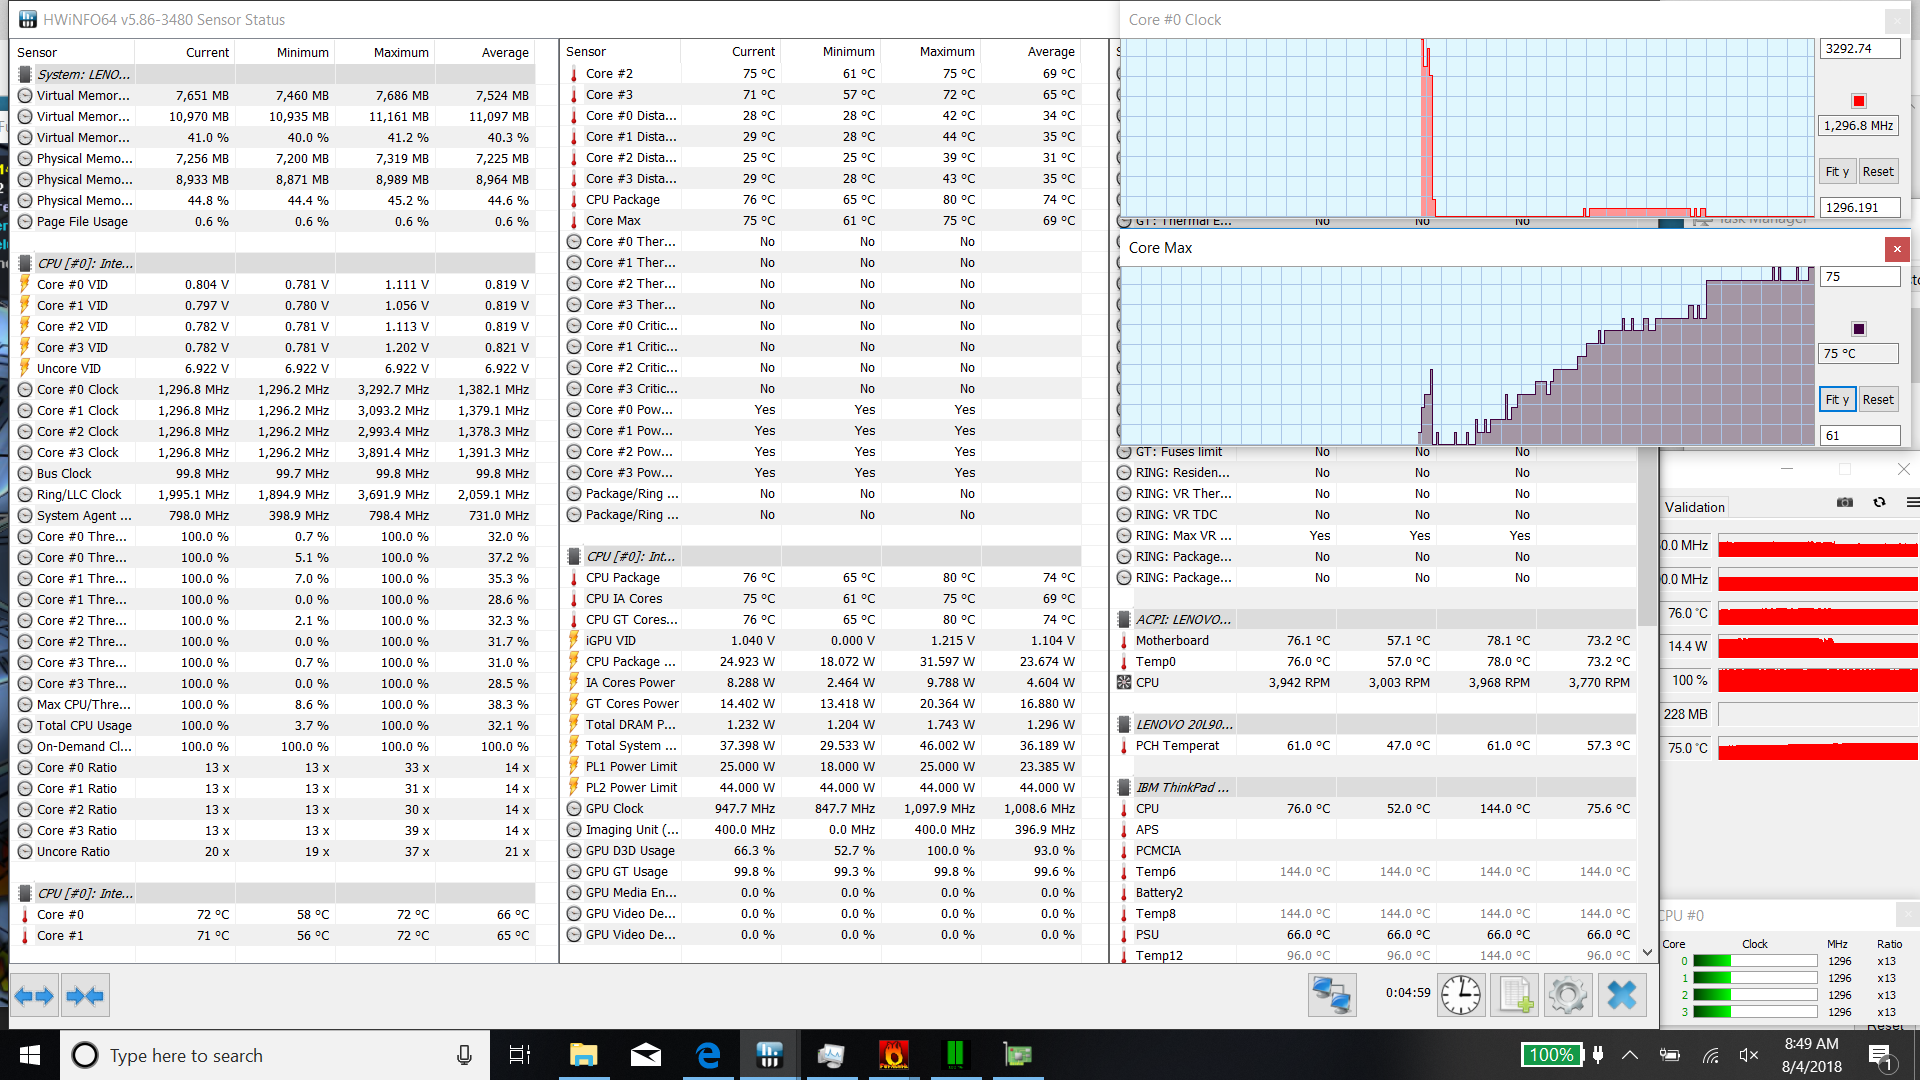
Combined stress results in immediately throttled CPU clock rates of just 1.3 GHz and accompanying (prioritized) GPU frequencies of around 950 MHz on average. Temperatures remain stable at 75 °C.
| CPU Clock (GHz) | GPU Clock (MHz) | Average CPU Temperature (°C) | Average GPU Temperature (°C) | |
| Prime95 Stress | 2.4 | - | 80 | - |
| FurMark Stress | - | 1100 | - | 80 |
| Prime95 + FurMark Stress | 1.3 | 950 | 75 | 75 |
Emissions
System Noise
While idling, the T580 is completely silent—a fairly typical trait in business notebooks. Introduce some stress, however, and it soon becomes noticeable; we measured 37.4 dB(A) of noise (against 28.6 dB(A) ambient levels) on average under load, up to a maximum of 40 dB(A). These values are right in line with the Dell Latitude 5590 and well below the XPS 15, but they’re far above the HP EliteBook 850 G4, which hardly makes its presence known even under the most severe stress.
We noticed a very slight electrical hiss emanating from today’s review unit, but it’s hard to hear in all but the most silent of conditions, so we would only consider this a minor problem.
Noise level
| Idle |
| 28.6 / 28.6 / 28.6 dB(A) |
| Load |
| 37.4 / 40 dB(A) |
 | ||
30 dB silent 40 dB(A) audible 50 dB(A) loud |
||
min: | ||
| Lenovo ThinkPad T580-20L9001AUS UHD Graphics 620, i7-8650U, Samsung SSD PM981 MZVLB512HAJQ | Lenovo ThinkPad T580-20LAS01H00 GeForce MX150, i5-8550U, Samsung SSD PM981 MZVLB512HAJQ | Dell Latitude 5590 UHD Graphics 620, i5-8250U, SK hynix SC311 M.2 | HP EliteBook 850 G4 Z8W50EA HD Graphics 620, i5-7200U, Samsung PM961 NVMe MZVLW512HMJP | Dell XPS 15 2018 i5 FHD 97Wh GeForce GTX 1050 Mobile, i5-8300H, Lite-On CA3-8D256-Q11 | |
|---|---|---|---|---|---|
| Noise | -1% | -2% | 2% | -5% | |
| off / environment * (dB) | 28.6 | 29.3 -2% | 29 -1% | 30.3 -6% | |
| Idle Minimum * (dB) | 28.6 | 29.3 -2% | 29 -1% | 30 -5% | 30.3 -6% |
| Idle Average * (dB) | 28.6 | 29.3 -2% | 29 -1% | 30 -5% | 30.3 -6% |
| Idle Maximum * (dB) | 28.6 | 31.8 -11% | 31.3 -9% | 30 -5% | 30.3 -6% |
| Load Average * (dB) | 37.4 | 35.8 4% | 36.6 2% | 33.2 11% | 37.1 1% |
| Load Maximum * (dB) | 40 | 38 5% | 40.9 -2% | 34.2 14% | 43 -8% |
| Witcher 3 ultra * (dB) | 35.8 | 43.3 |
* ... smaller is better
Temperature
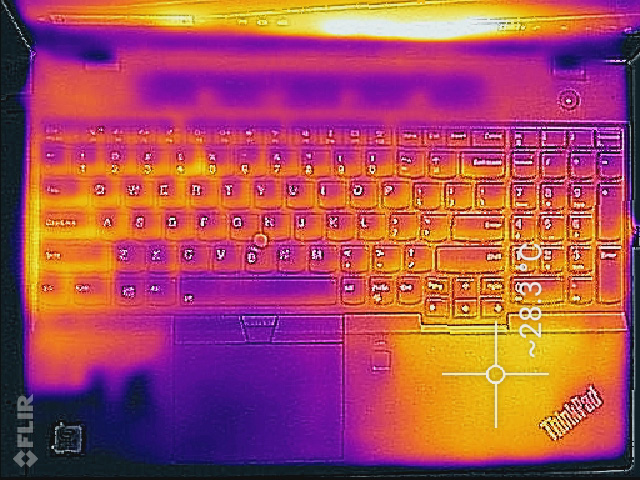
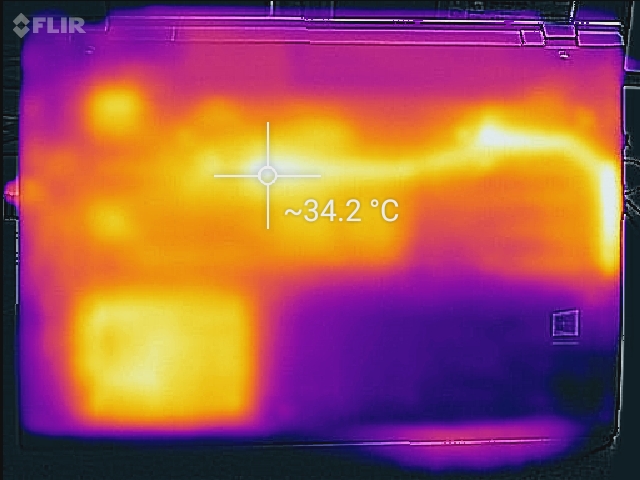
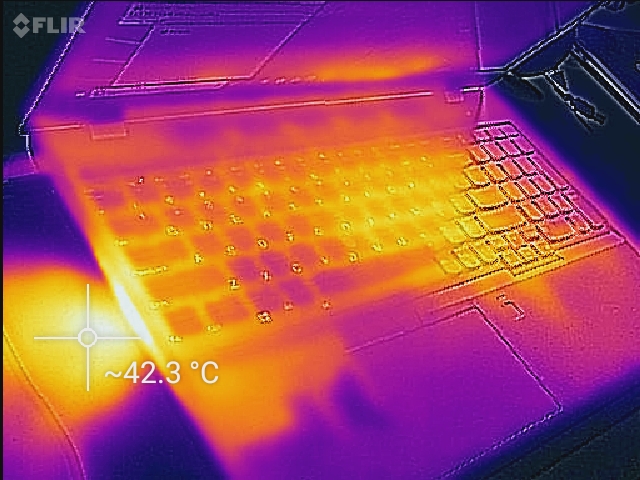
As we’d expect, since the cooling fan doesn’t engage while idling, temperatures under these circumstances are noticeably above ambient levels. With a room temperature of 20 °C, we measured idle averages of 26.4 °C / 31.1 °C on top/bottom respectively. That’s enough to become bothersome to even the most tolerant of users, with hot spots of 28.2 °C on the top and 34.2 °C on the bottom (8.2 °C / 14.2 °C above ambient levels, respectively). Fortunately, the Lenovo Vantage software can be used to customize cooling behavior by either enabling Intelligent Cooling (which dynamically adjusts cooling performance to keep the device cooler while being held versus resting on a stable surface) or explicitly toggling the Cool & quiet power profile therein, which reduces CPU performance to help lower surface temperatures and negate the need for fan operation.
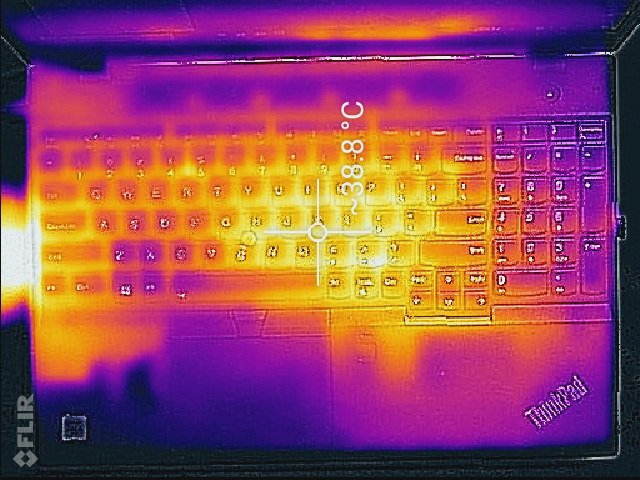
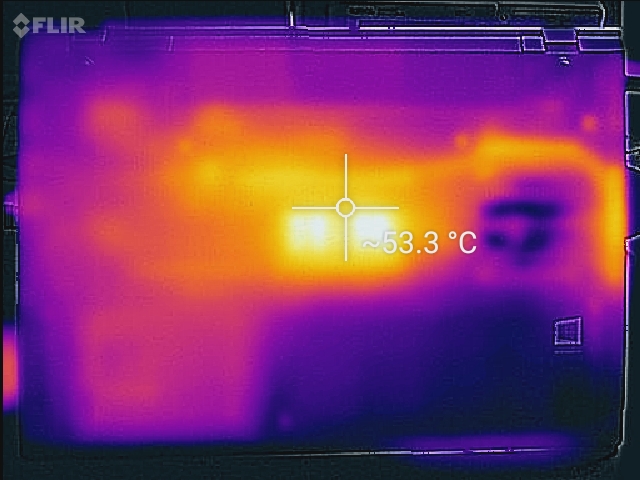
Load values aren’t much of a problem with averages of 32.7 °C / 39.4 °C on top/bottom, but two particular hot spots on the bottom—56 °C in the center and 46.4 °C in the upper-right—suggest that more could have been done to balance out temperatures.
(+) The maximum temperature on the upper side is 39 °C / 102 F, compared to the average of 34.3 °C / 94 F, ranging from 21.2 to 62.5 °C for the class Office.
(-) The bottom heats up to a maximum of 56 °C / 133 F, compared to the average of 36.8 °C / 98 F
(+) In idle usage, the average temperature for the upper side is 26.4 °C / 80 F, compared to the device average of 29.5 °C / 85 F.
(+) The palmrests and touchpad are cooler than skin temperature with a maximum of 31.8 °C / 89.2 F and are therefore cool to the touch.
(-) The average temperature of the palmrest area of similar devices was 27.5 °C / 81.5 F (-4.3 °C / -7.7 F).
Speakers
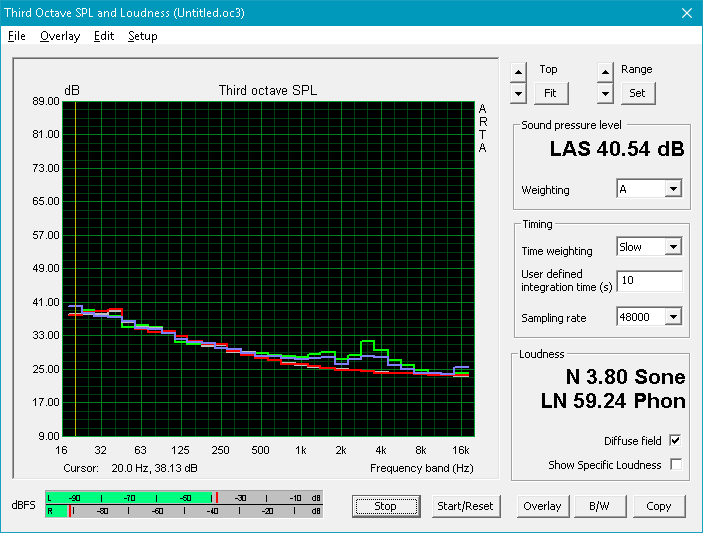
The T580 surprises with reasonably good audio, surpassing most other competitors in its class. Volume levels are decent, linearity across the spectrum is good, and only bass is somewhat lacking relative to other frequencies (hardly surprising given the absence of a subwoofer). As compared to the Latitude 5590, the sound is notably more linear and quite a bit more low frequency response is detectable. Subjectively, the sound seems just a bit flat out of the box, but post-processing is available via the Dolby app to further enhance the shape of the audio to meet particular tasks.

Lenovo ThinkPad T580-20L9001AUS audio analysis
(±) | speaker loudness is average but good (80.4 dB)
Bass 100 - 315 Hz
(±) | reduced bass - on average 7.5% lower than median
(±) | linearity of bass is average (7.8% delta to prev. frequency)
Mids 400 - 2000 Hz
(+) | balanced mids - only 3.6% away from median
(±) | linearity of mids is average (7% delta to prev. frequency)
Highs 2 - 16 kHz
(+) | balanced highs - only 2.3% away from median
(±) | linearity of highs is average (8.3% delta to prev. frequency)
Overall 100 - 16.000 Hz
(+) | overall sound is linear (12.7% difference to median)
Compared to same class
» 5% of all tested devices in this class were better, 2% similar, 93% worse
» The best had a delta of 7%, average was 21%, worst was 53%
Compared to all devices tested
» 12% of all tested devices were better, 3% similar, 86% worse
» The best had a delta of 4%, average was 24%, worst was 134%
Dell Latitude 5590 audio analysis
(+) | speakers can play relatively loud (84.7 dB)
Bass 100 - 315 Hz
(-) | nearly no bass - on average 17.3% lower than median
(±) | linearity of bass is average (9.3% delta to prev. frequency)
Mids 400 - 2000 Hz
(±) | higher mids - on average 5.4% higher than median
(+) | mids are linear (4.6% delta to prev. frequency)
Highs 2 - 16 kHz
(+) | balanced highs - only 3.4% away from median
(+) | highs are linear (4.5% delta to prev. frequency)
Overall 100 - 16.000 Hz
(±) | linearity of overall sound is average (16.3% difference to median)
Compared to same class
» 19% of all tested devices in this class were better, 7% similar, 74% worse
» The best had a delta of 7%, average was 21%, worst was 53%
Compared to all devices tested
» 27% of all tested devices were better, 6% similar, 68% worse
» The best had a delta of 4%, average was 24%, worst was 134%
Energy Management
Power Consumption
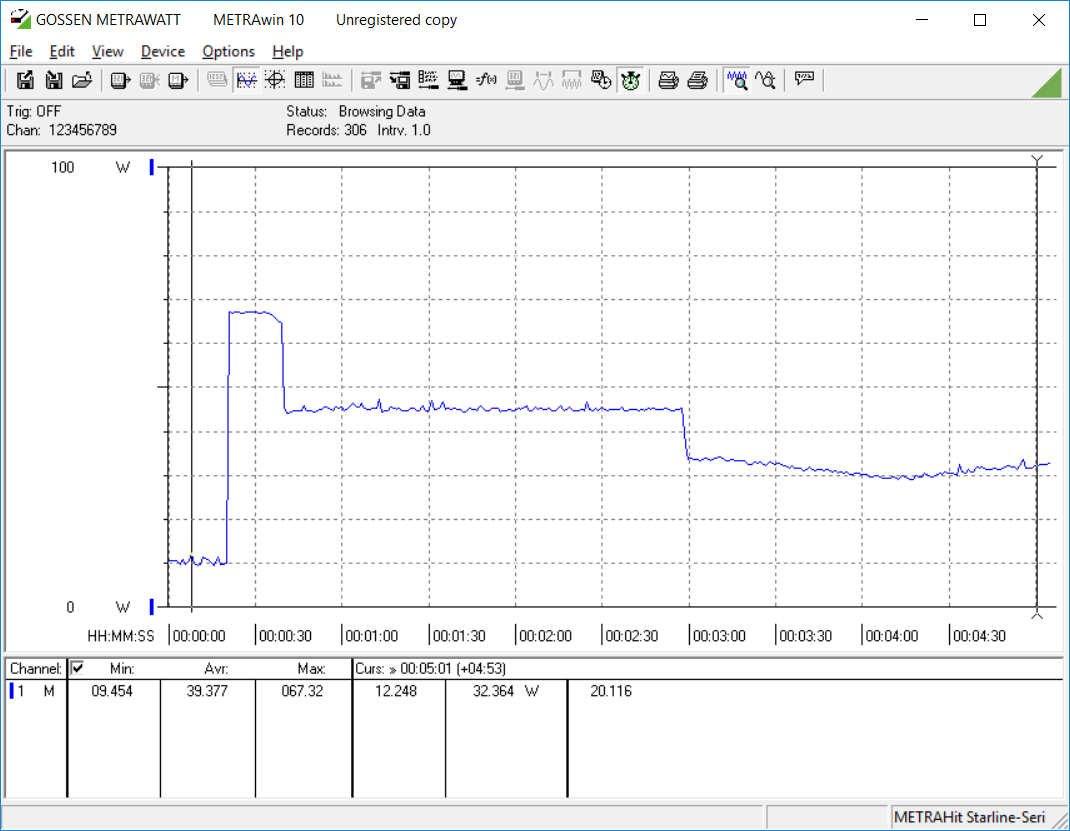
Our power consumption measurements from the T580 depict it as somewhat hungrier than the Latitude 5590 and EliteBook while idling (anywhere between 18% and 23% on average). Load averages are more in line with the 5590 (apart from a much lower maximum reading), but still far in excess of what we recorded from the EliteBook 850 G4, which only required 27.2 W under load on average (versus 47.2 W from the T580 we’re evaluating today). Perhaps the bigger story here though is the reduction in consumption relative to the MX150/UHD-equipped T580 configuration, which demanded an average of 24% to 29% more power under both load and idle conditions, respectively. This isn’t all that surprising, of course, given the higher-powered parts in the preceding configuration, but it ought to justify the use of a much smaller (and lighter) dual-battery configuration such as the one we’re using in today’s setup.
| Off / Standby | |
| Idle | |
| Load |
|
Key:
min: | |
| Lenovo ThinkPad T580-20L9001AUS i7-8650U, UHD Graphics 620, Samsung SSD PM981 MZVLB512HAJQ, IPS, 1920x1080, 15.6" | Lenovo ThinkPad T580-20LAS01H00 i5-8550U, GeForce MX150, Samsung SSD PM981 MZVLB512HAJQ, IPS LED, 3840x2160, 15.6" | Dell Latitude 5590 i5-8250U, UHD Graphics 620, SK hynix SC311 M.2, IPS, 1920x1080, 15.6" | HP EliteBook 850 G4 Z8W50EA i5-7200U, HD Graphics 620, Samsung PM961 NVMe MZVLW512HMJP, , 1920x1080, 15.6" | Dell XPS 15 2018 i5 FHD 97Wh i5-8300H, GeForce GTX 1050 Mobile, Lite-On CA3-8D256-Q11, LED IGZO IPS InfinityEdge, 1920x1080, 15.6" | |
|---|---|---|---|---|---|
| Power Consumption | -24% | 7% | 32% | -17% | |
| Idle Minimum * (Watt) | 4.7 | 5.3 -13% | 3.6 23% | 2.4 49% | 2.9 38% |
| Idle Average * (Watt) | 7.9 | 10.2 -29% | 6.5 18% | 6.1 23% | 5.8 27% |
| Idle Maximum * (Watt) | 11.4 | 13.6 -19% | 7.2 37% | 10 12% | 7.5 34% |
| Load Average * (Watt) | 47.2 | 58.3 -24% | 46.2 2% | 27.2 42% | 77.5 -64% |
| Load Maximum * (Watt) | 48.1 | 65.3 -36% | 68.8 -43% | 32 33% | 107 -122% |
| Witcher 3 ultra * (Watt) | 47.8 | 84 |
* ... smaller is better
Battery Life
Speaking of which, the 32 Wh (internal) + 24 Wh (external) ThinkPad Power Bridge battery configuration of our T580 test unit is barely half of what we got with the MX150 configuration—which also, in turn, was 167 grams heavier than our current machine. Unfortunately, all these weight savings still translate to an abbreviated 4 hours and 12 minutes of total runtime in our standardized wi-fi web surfing battery test, which is hardly enough to get by for most business professionals. By comparison, our previous review unit, with 105 Wh of total battery capacity (internal + external), lasted over twice as long at 8:42 in that same test. Other competitors, such as Dell’s Latitude 5590, still manage nearly twice the runtime with less battery capacity.
Of note: we actually performed this battery runtime test twice to ensure that nothing had gone awry the first time—and received nearly the same results. The bottom line is that we’d probably recommend a slightly larger battery for anyone planning on taking the T580 with them for any reasonable period of time. Fortunately, they’re easy to swap thanks to the dual-battery configuration.
| Lenovo ThinkPad T580-20L9001AUS i7-8650U, UHD Graphics 620, 56 Wh | Lenovo ThinkPad T580-20LAS01H00 i5-8550U, GeForce MX150, 105 Wh | Dell Latitude 5590 i5-8250U, UHD Graphics 620, 51 Wh | HP EliteBook 850 G4 Z8W50EA i5-7200U, HD Graphics 620, 51.3 Wh | Dell XPS 15 9570 i7 UHD i7-8750H, GeForce GTX 1050 Ti Max-Q, 97 Wh | |
|---|---|---|---|---|---|
| Battery runtime | 107% | 76% | 129% | ||
| WiFi v1.3 (h) | 4.2 | 8.7 107% | 7.4 76% | 9.6 129% | |
| WiFi (h) | 8.4 | ||||
| Witcher 3 ultra (h) | 1 |
Pros
Cons
Verdict
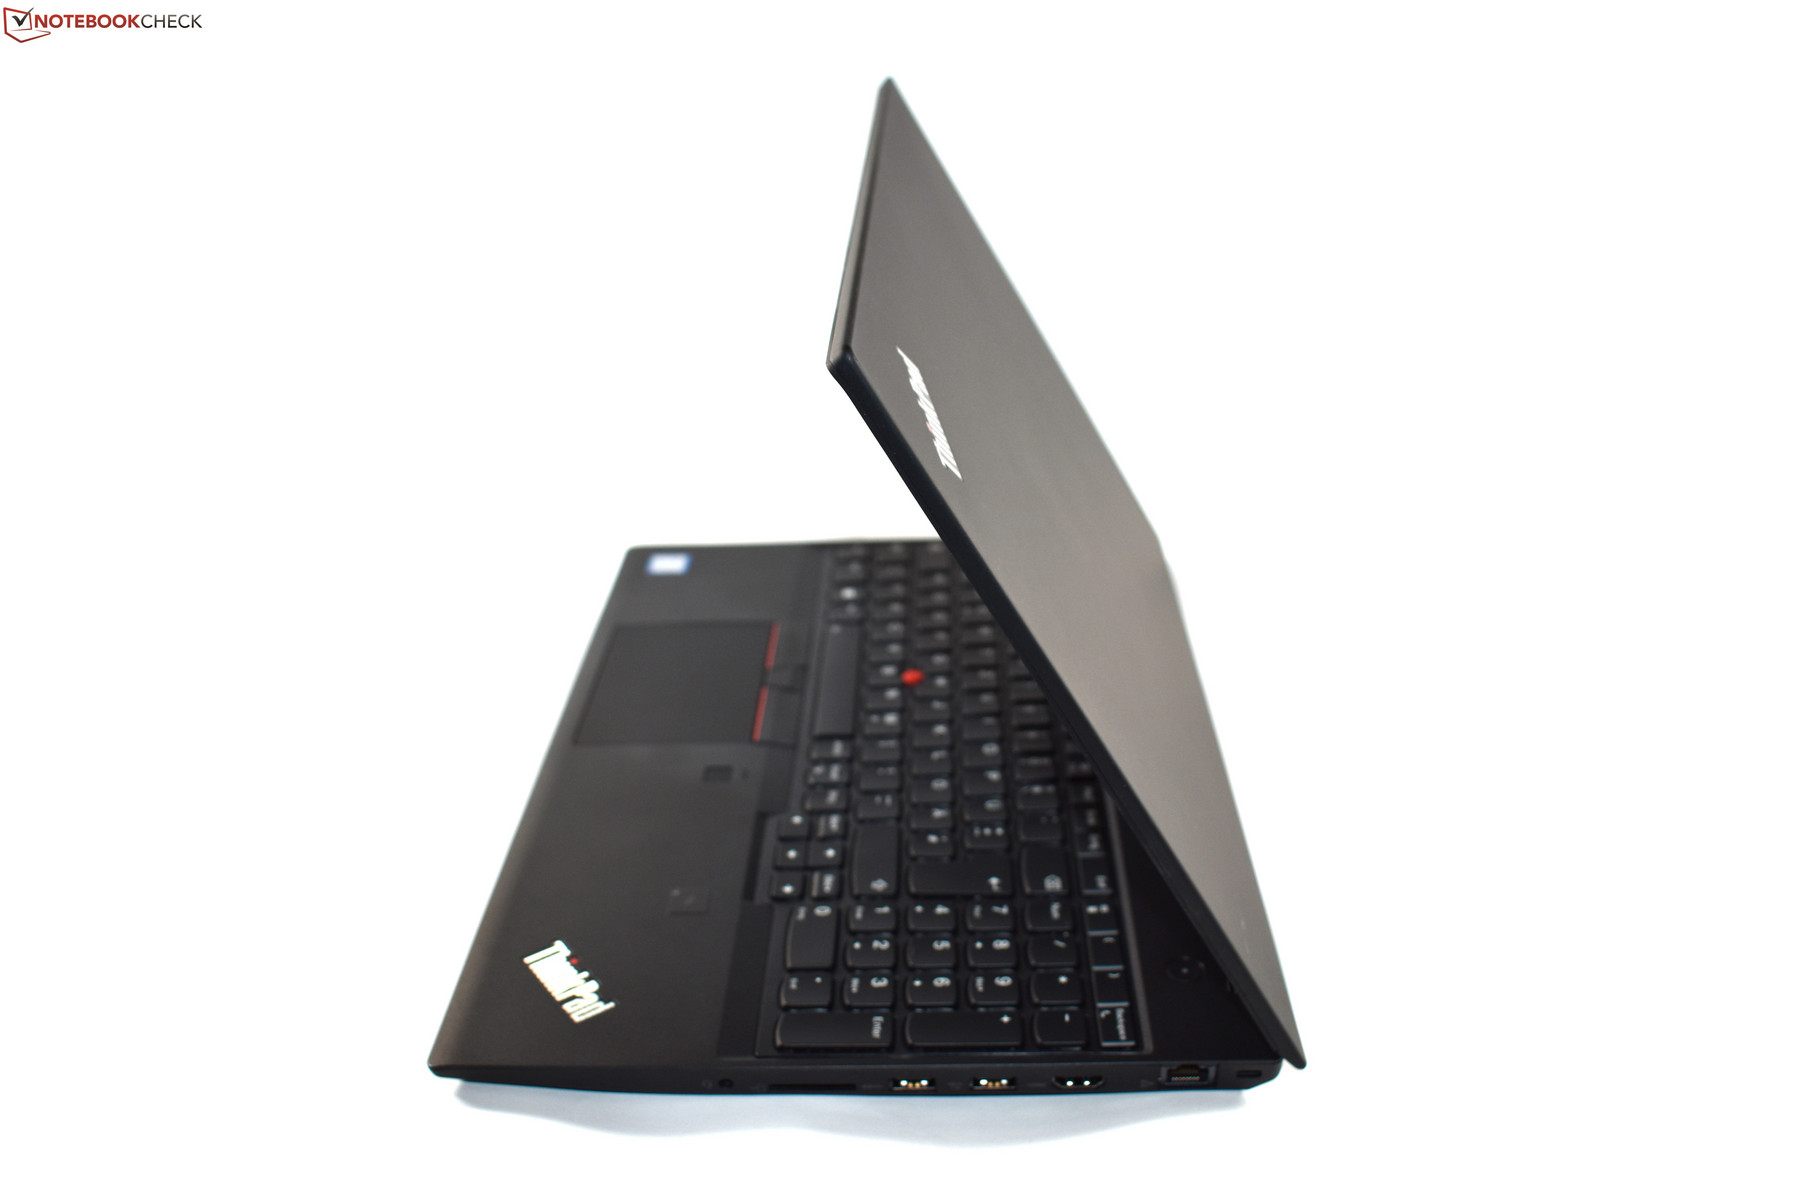
For business notebook traditionalists fixated on the presence of a 15.6-inch display and numeric keypad, the ThinkPad T580 represents one of the few good options still available. It’s true that the smaller machines (14 inch and below) have assumed the ultra-premium roles, with stronger cases/stability and slicker appearances—but the T580 offers most of the same benefits in a slightly larger form factor with the ever-important numeric keypad off to the right. As always, the input devices are first-rate, build quality is very good, maintenance is relatively straightforward, and the 3-year on-site warranty is inherently reassuring. It’s also a very quiet machine that posts strong general system performance results and CPU test scores which are sufficient for the average user (even if they can’t maintain their strength over the longer term). Finally, we do really enjoy the on-cell embedded touch screen technology that we’re beginning to see included in so many business models across the spectrum; our current review unit features such a panel, and it is truly anti-glare in spite of its touch capabilities.
Choose your specs wisely, but apart from the disappointing display and weak battery life, most everything else about the ThinkPad T580 will feel right at home for business machine traditionalists.
There are some definite drawbacks to the T580, however. For starters, as we alluded to above, the CPU performance scores plummet after several minutes of activity (a drop of close to 20%) and never recover subsequently until the machine is given a rest. Performance results from the Core i7-8650U are actually below those of our previous review unit (which included a Core i7-8550U), bringing into question the value of the upgrade. Elsewhere, while today’s unit is substantially cheaper than the previous review machine, the FHD display is dreary and dim in comparison to even the lackluster UHD panel in April’s unit. There are a couple of troublesome hot spots on the bottom of the machine under load, and wireless performance was oddly hamstrung by what seems likely to be an antenna issue (though this is certainly specific to our review unit and not indicative of problems with the model as a whole). And finally, perhaps most perplexingly, battery runtimes are far below what we’d hope to see out of even a 56 Wh-equipped machine, somehow nearly half of what we recorded from our Dell Latitude 5590 review unit (whose battery is actually smaller). Fortunately, batteries are easy to swap on this model thanks to the dual-battery ThinkPad Power Bridge design, so users can pack an extra external battery to help quell any concerns while on the go.
But apart from the EliteBook 840 G5 and Latitude 5590, the $1,887 ThinkPad T580 is one of the only remaining choices for a 15-inch notebook with a numeric keypad that still qualifies as a high-end (but general use) business machine. Without stepping up into workstation territory, only consumer-grade offshoot models (such as the XPS 15) exist elsewhere, and the XPS lacks the keypad. Choose your specs wisely, but apart from the disappointing display and weak battery life, most everything else about the T580 will feel right at home for business machine traditionalists.
Lenovo ThinkPad T580-20L9001AUS
- 08/10/2018 v6 (old)
Steve Schardein
Price comparison
