Dell XPS 15 9570 (i7, UHD, GTX 1050 Ti Max-Q) Laptop Review
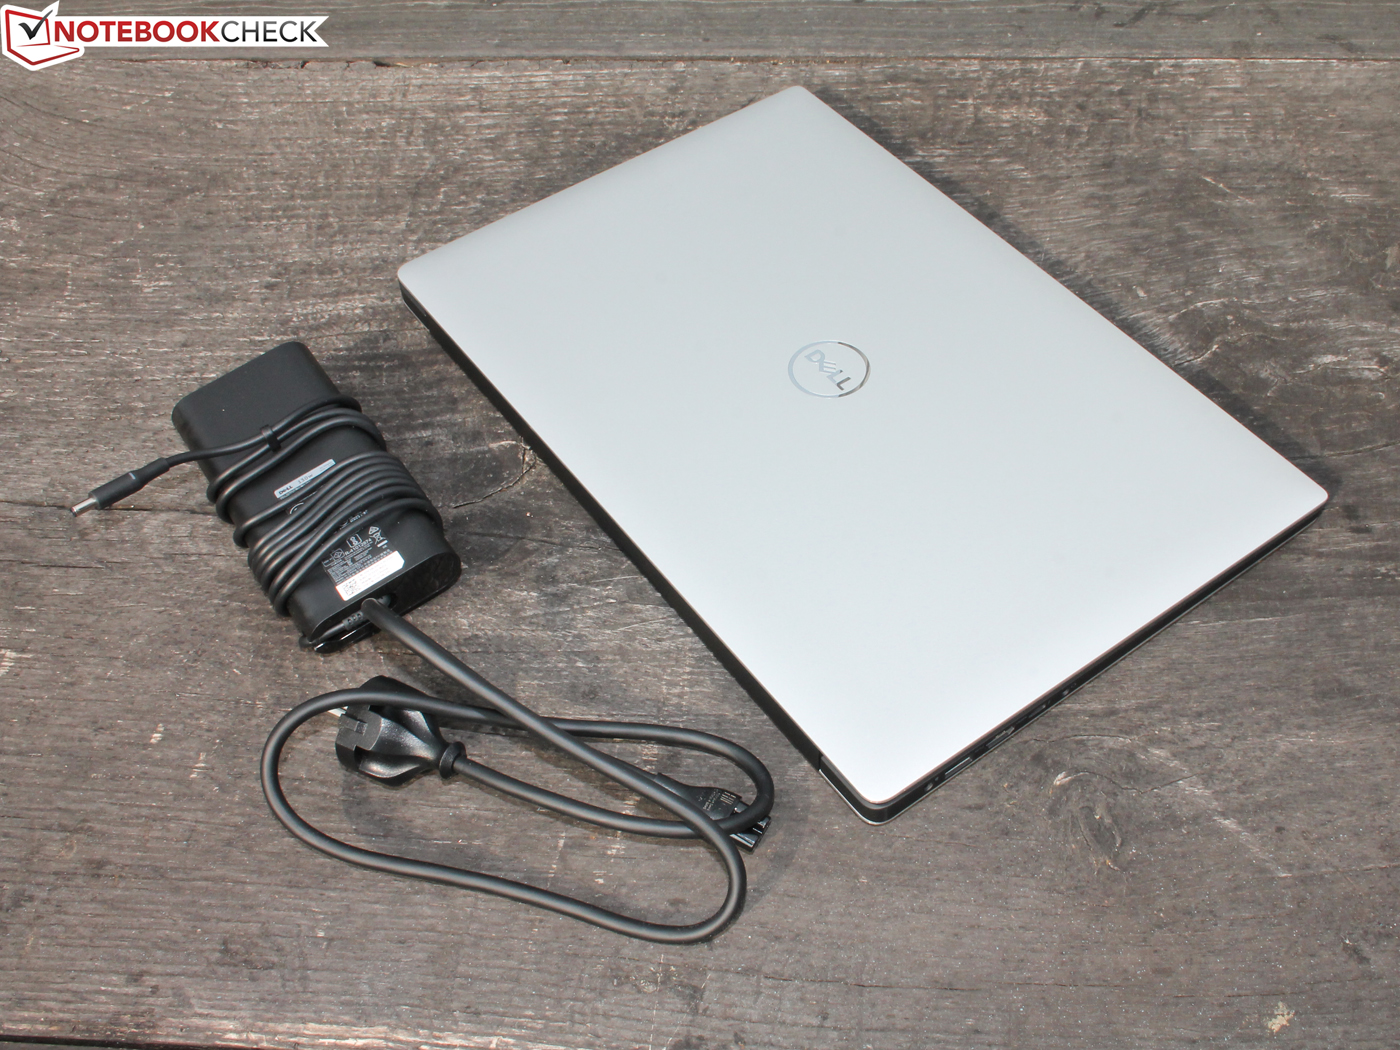
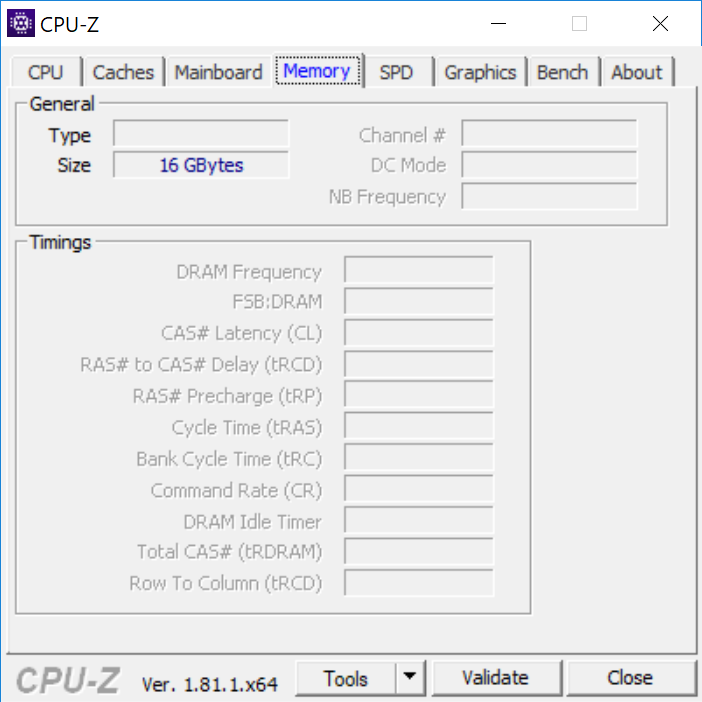
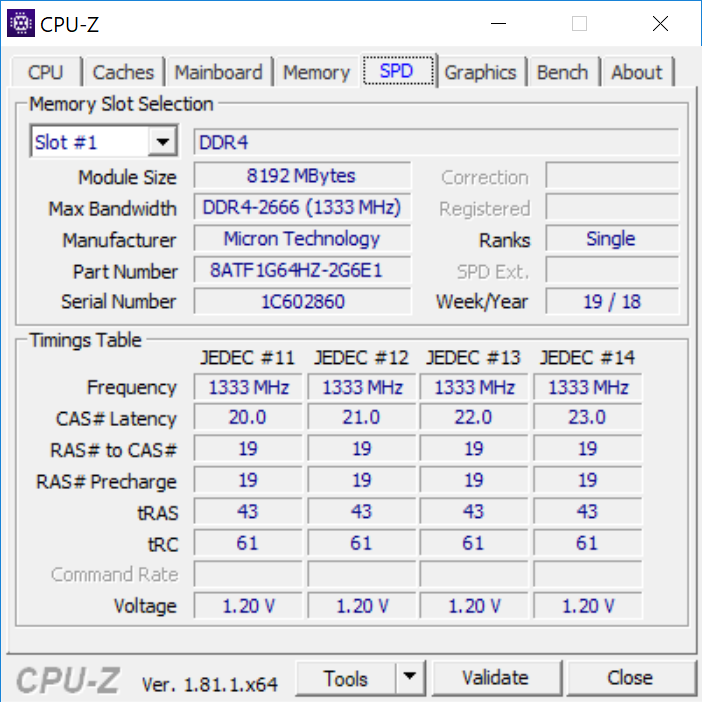
We already reviewed the entry-level model of the Dell XPS 15 9570. Equipped with a Core i5 processor, Nvidia GeForce GTX 1050 graphics, and a matte 1080p screen, it is an excellent multimedia laptop for a comparatively low price of 1,400 Euros (~$1635). We obviously want to know how the more expensive SKU performs, which retails for about 2,100 Euros (~$2453) (currently 1,900 Euros (~$2220) thanks to a special offer). This XPS 15 comes with a Core i7 processor with two additional CPU cores, the slightly faster Nvidia GeForce GTX 1050 Ti Max-Q as well as a high-resolution 4K UHD touchscreen. The amount of memory was also doubled and you now get 16 GB RAM and 512 GB SSD storage, respectively.
The following article will focus on the additional performance, how the slim chassis handles the additional heat, and how the 4K screen affects the power consumption as well as the battery runtime. We will obviously compare it with the entry-level SKU of the XPS 15 9570, but also other high-end laptops currently on the market. We selected the following comparison devices: Apple MacBook Pro 15 2018, Asus ZenBook Pro UX580GE, and the HP EliteBook 1050 G1. The upcoming Lenovo ThinkPad X1 Extreme has the same target user group, but we could not test it yet. Razer's Blade 15 might also be an interesting alternative, especially if you need more GPU performance.
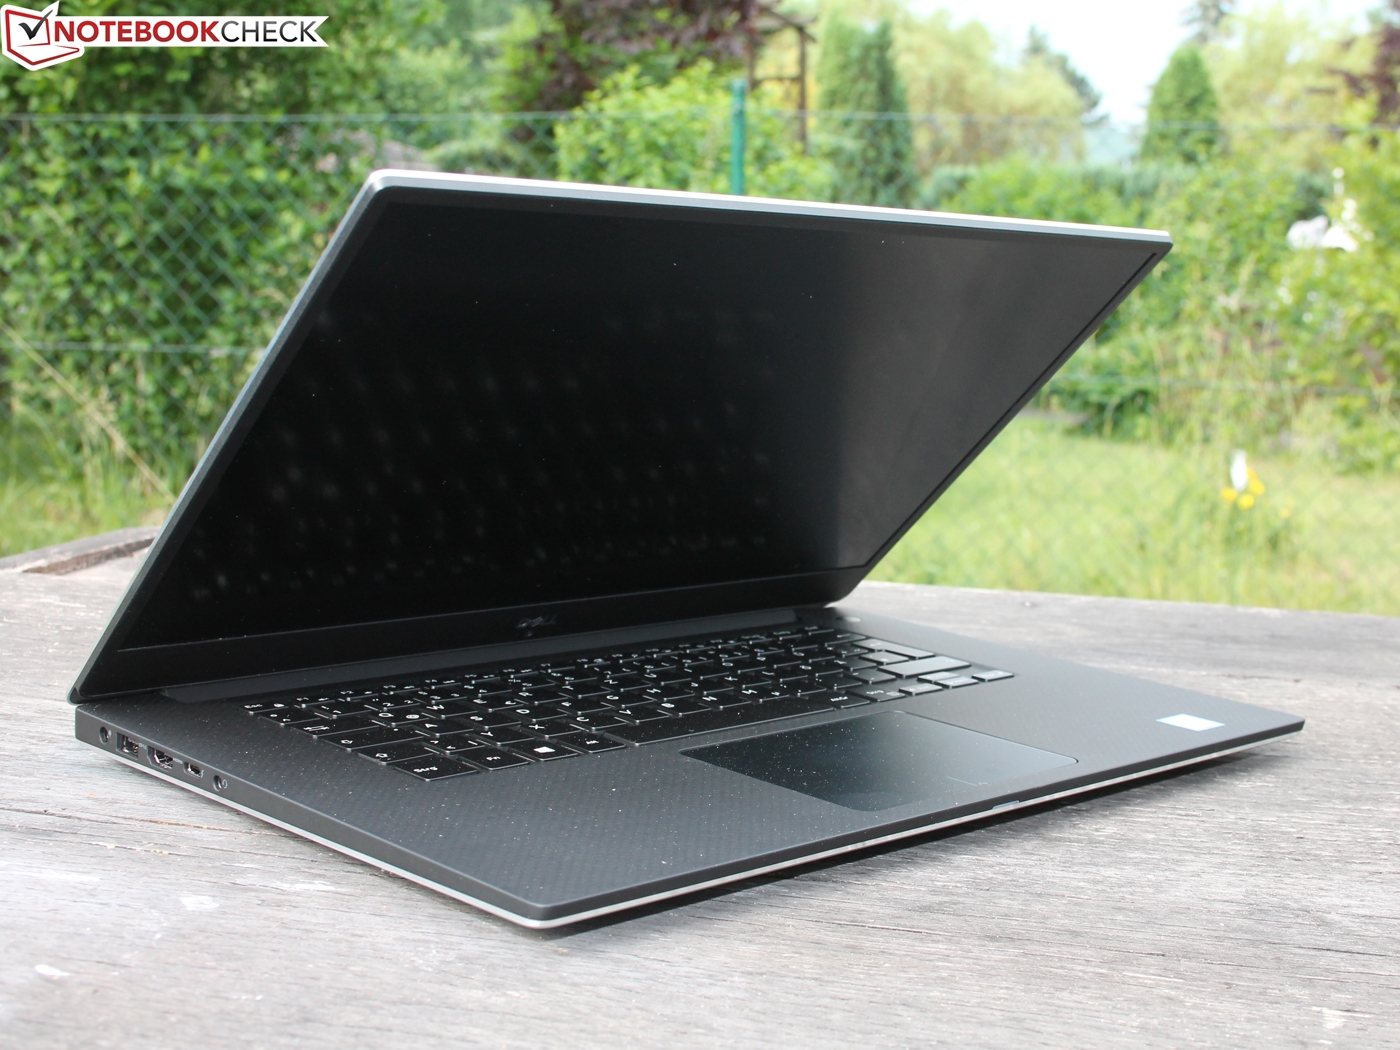
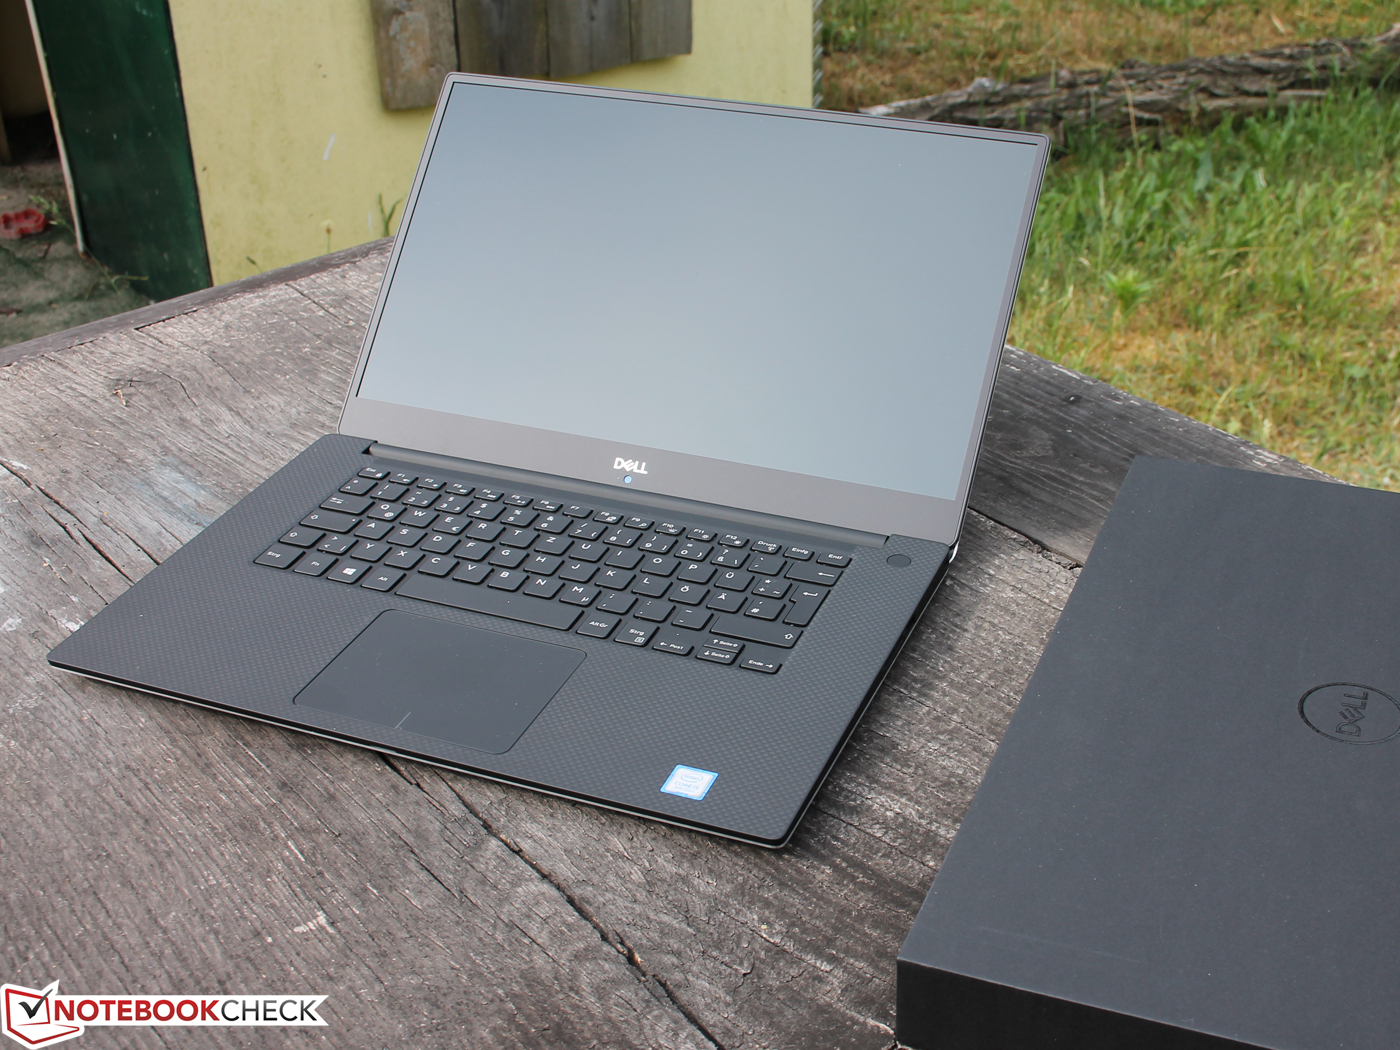
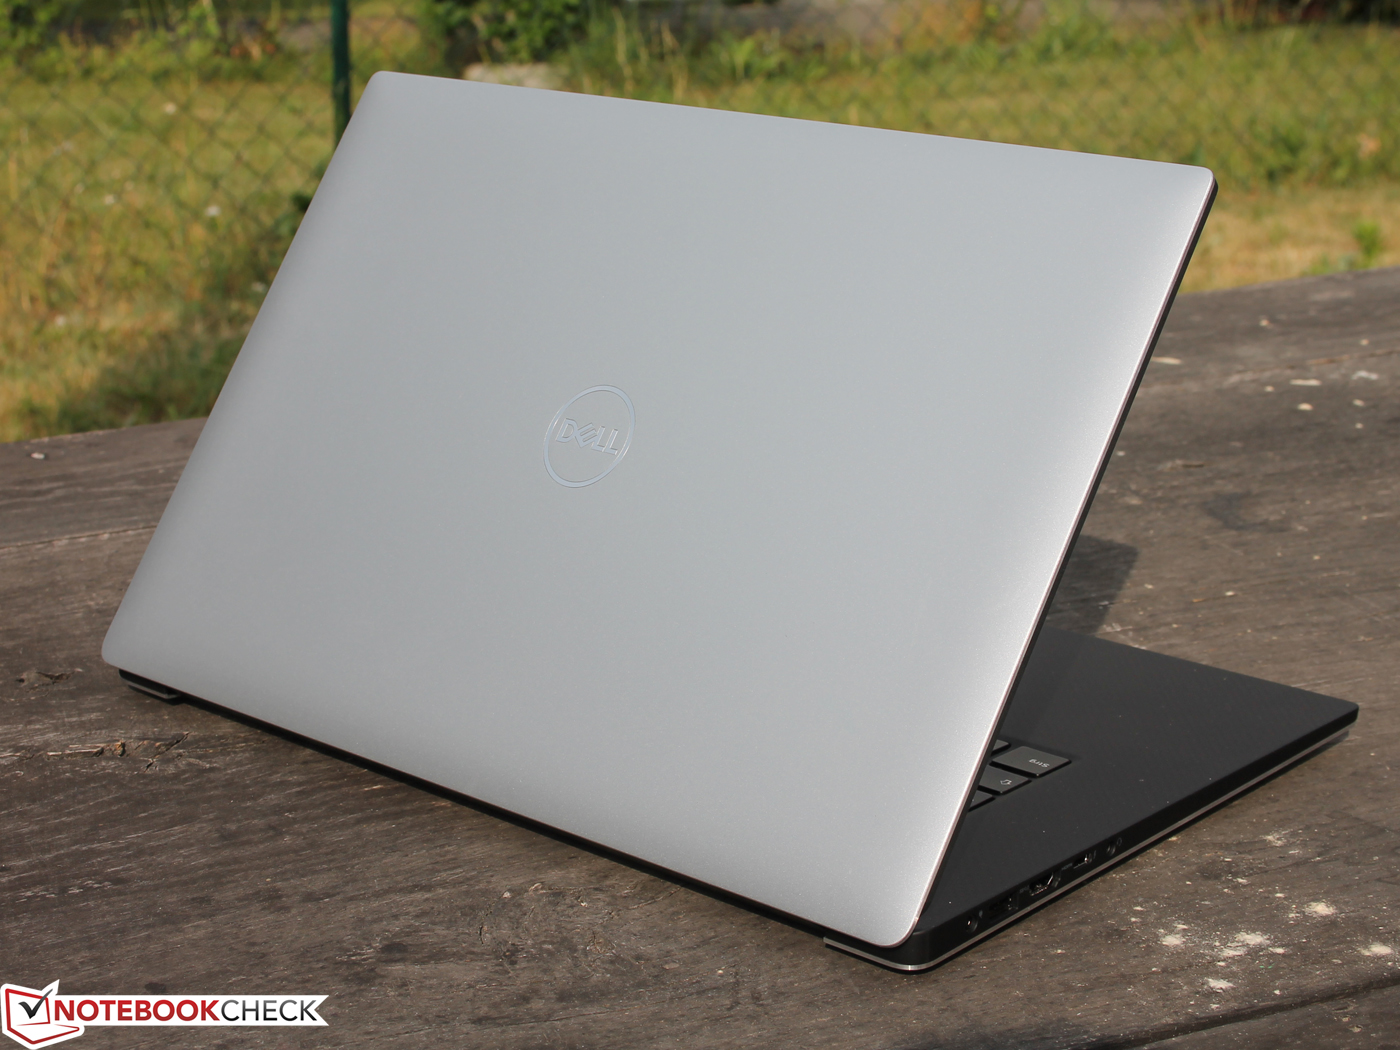
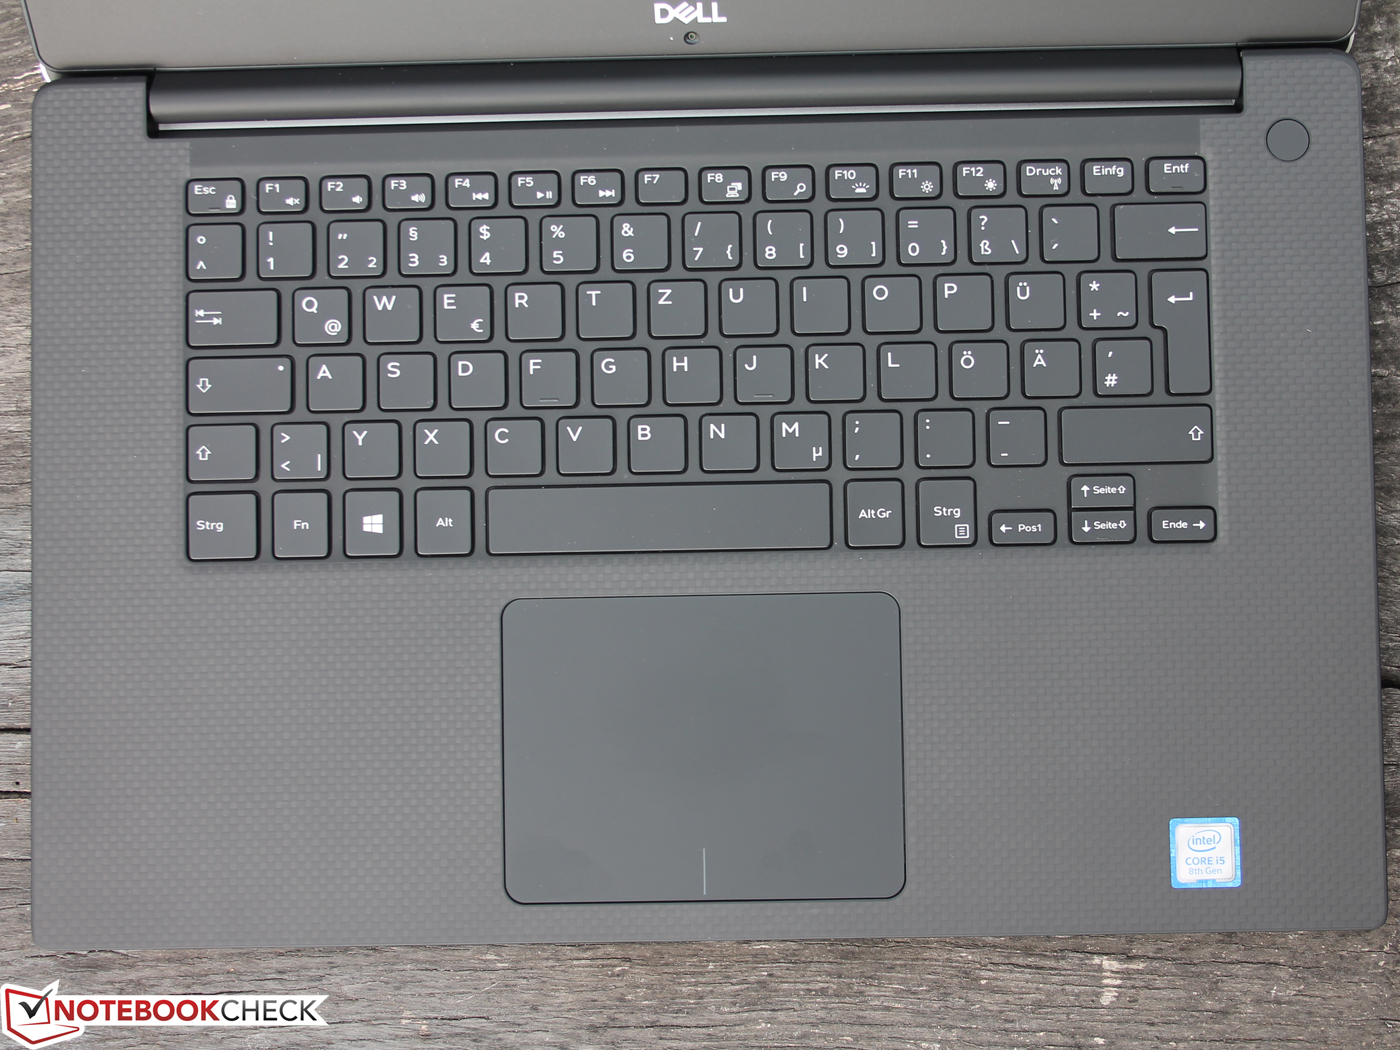
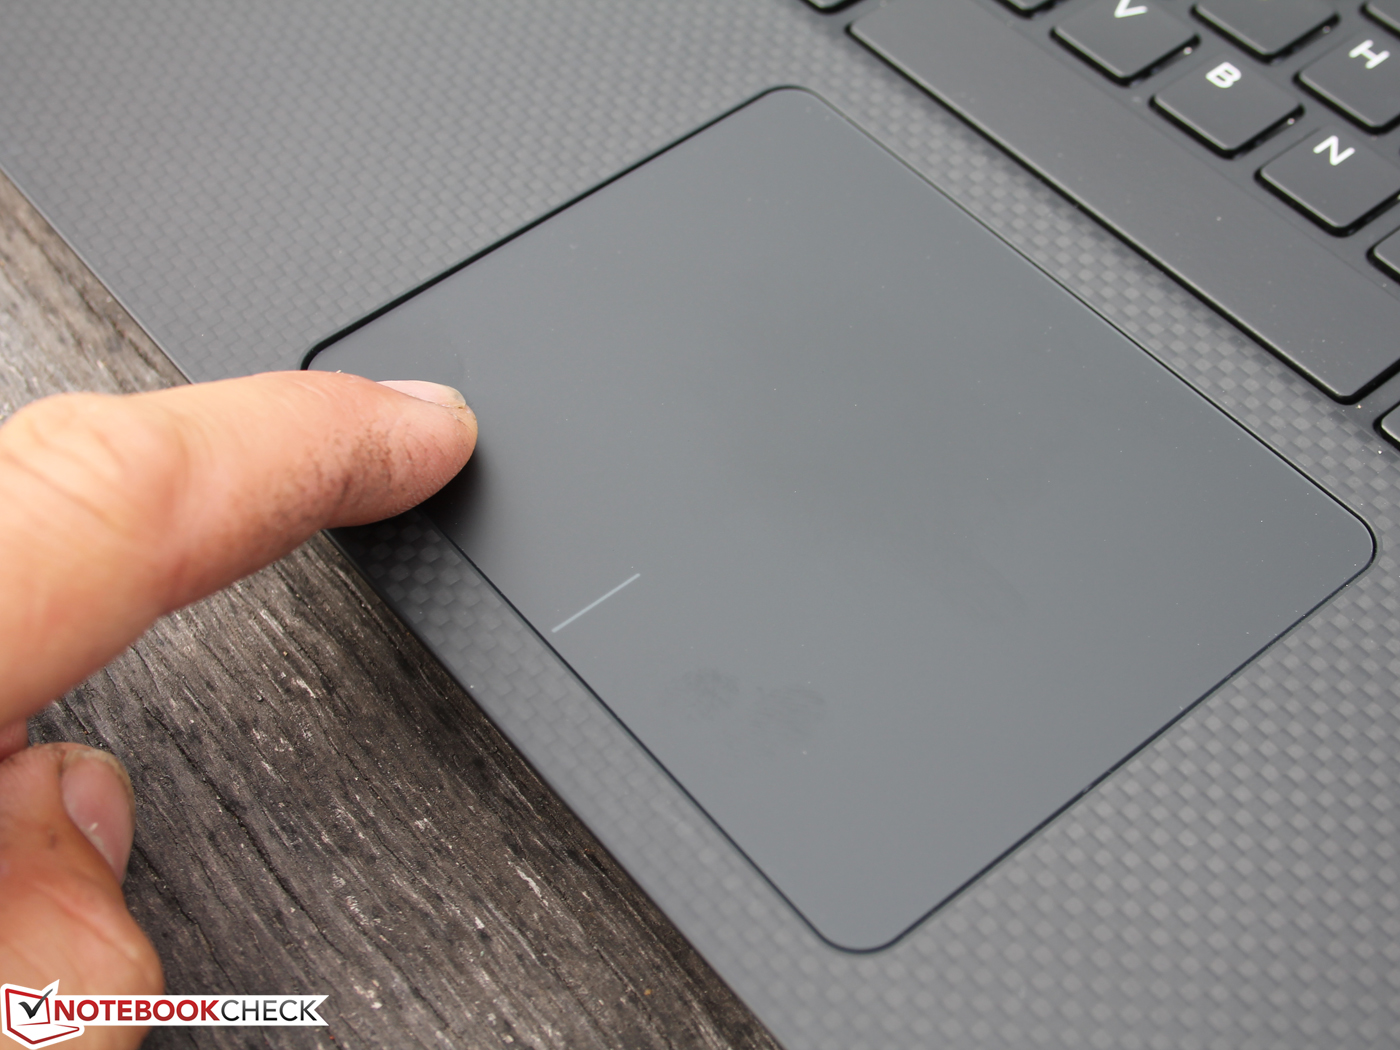
The chassis including the ports and the input devices is identical to the previously reviewed base model, so we recommend checking out this review for more information on these sections. We will focus on the new hardware as well as the effect on the emissions in the article below. The following pictures were also taken from our previous review.
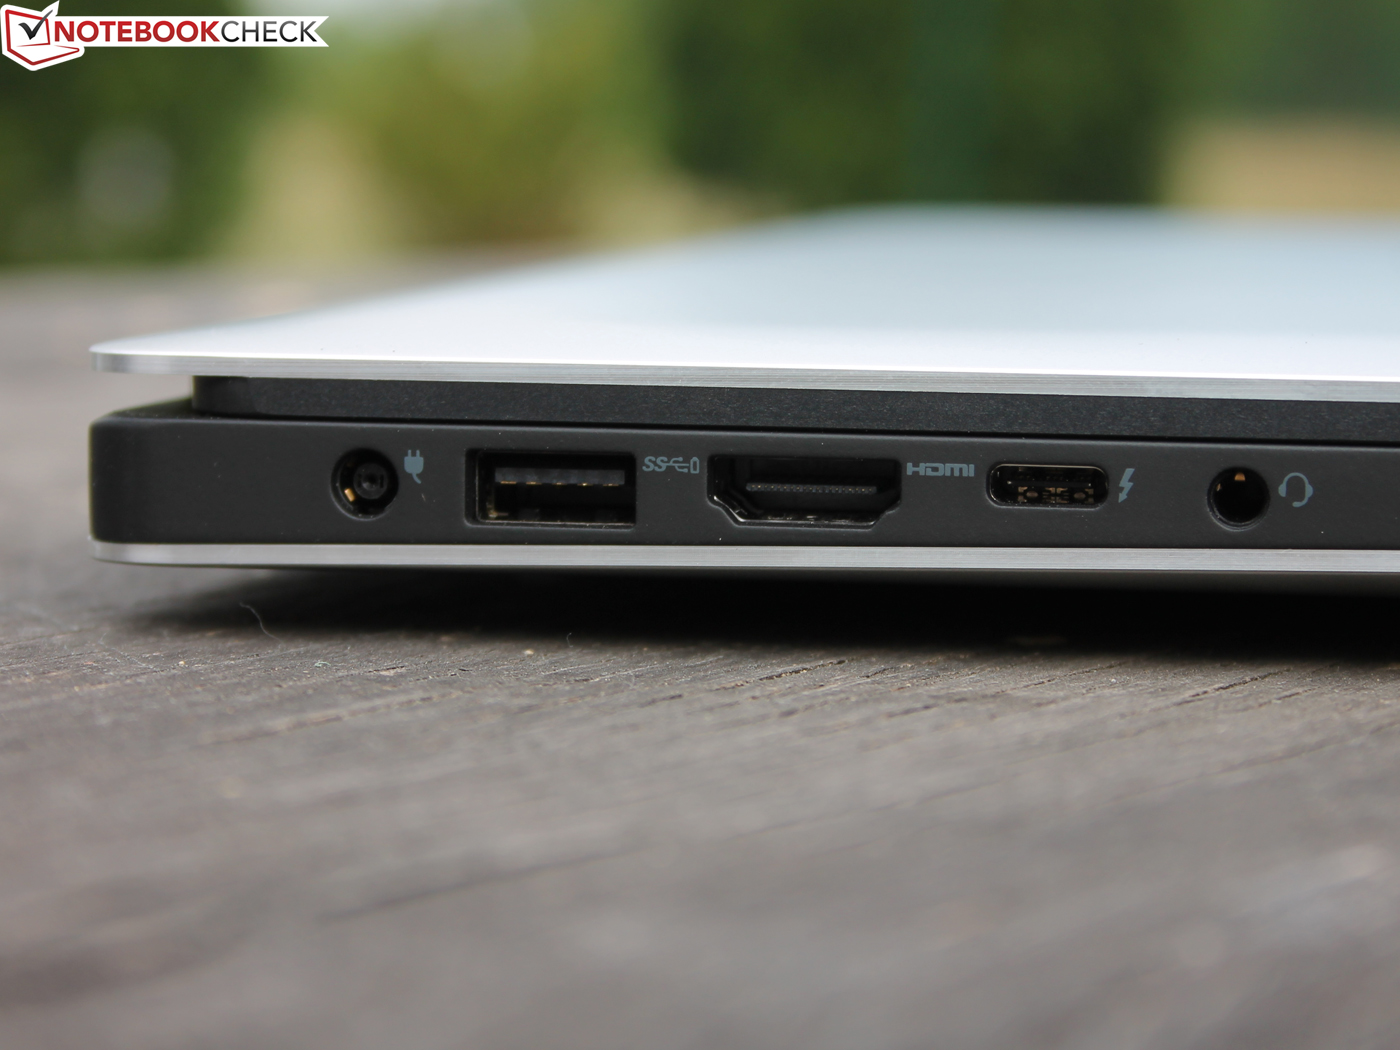
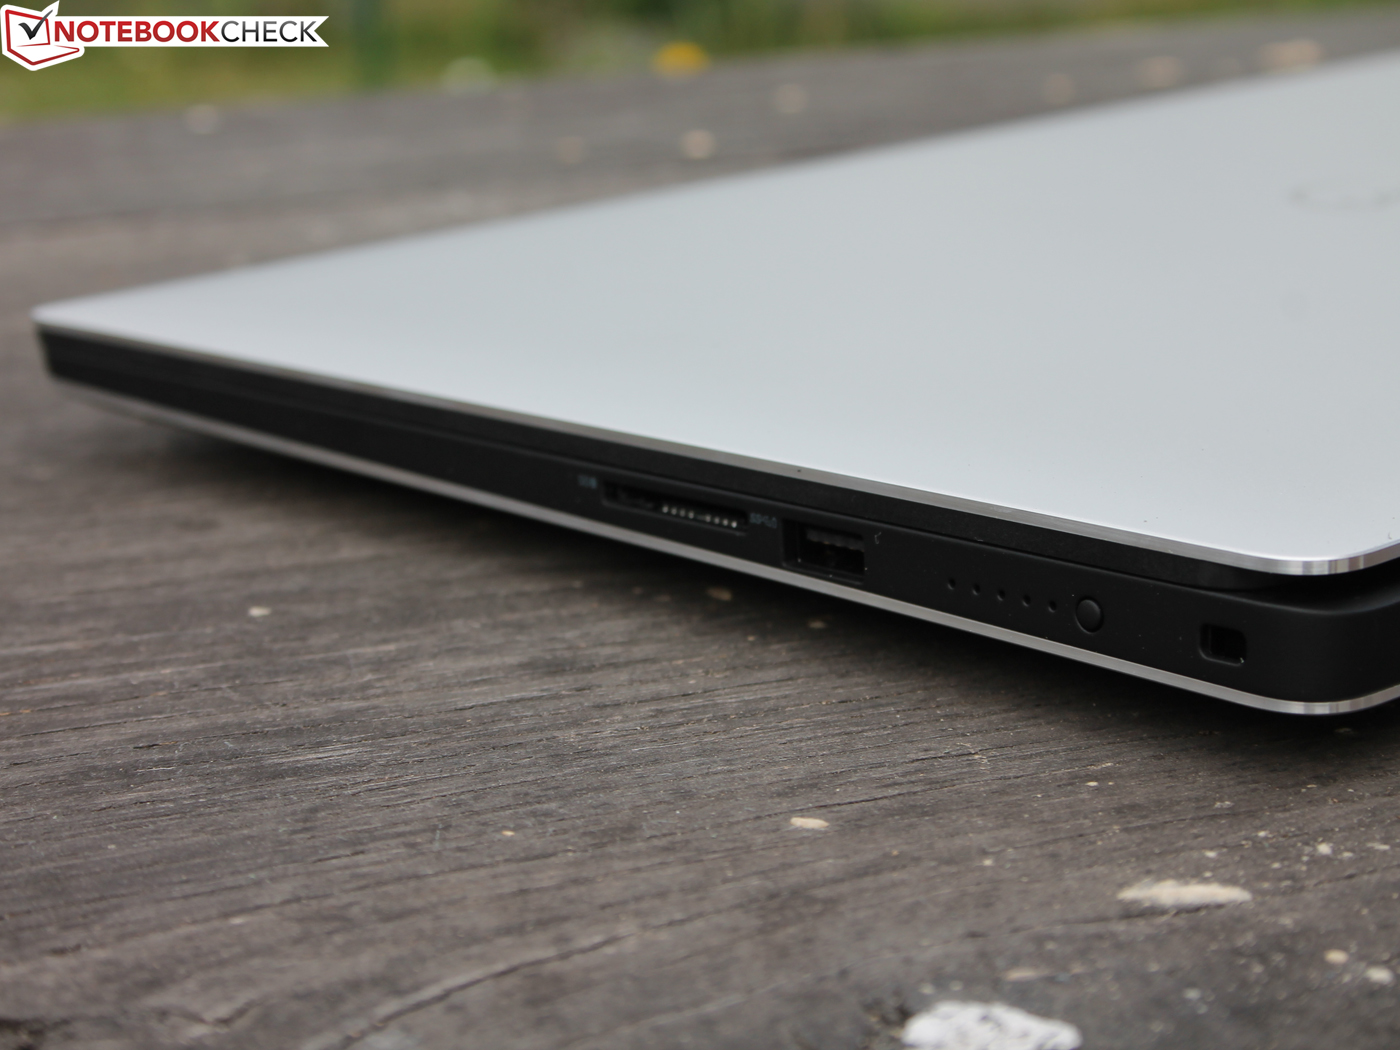

Connectivity - XPS 15 with fast card reader
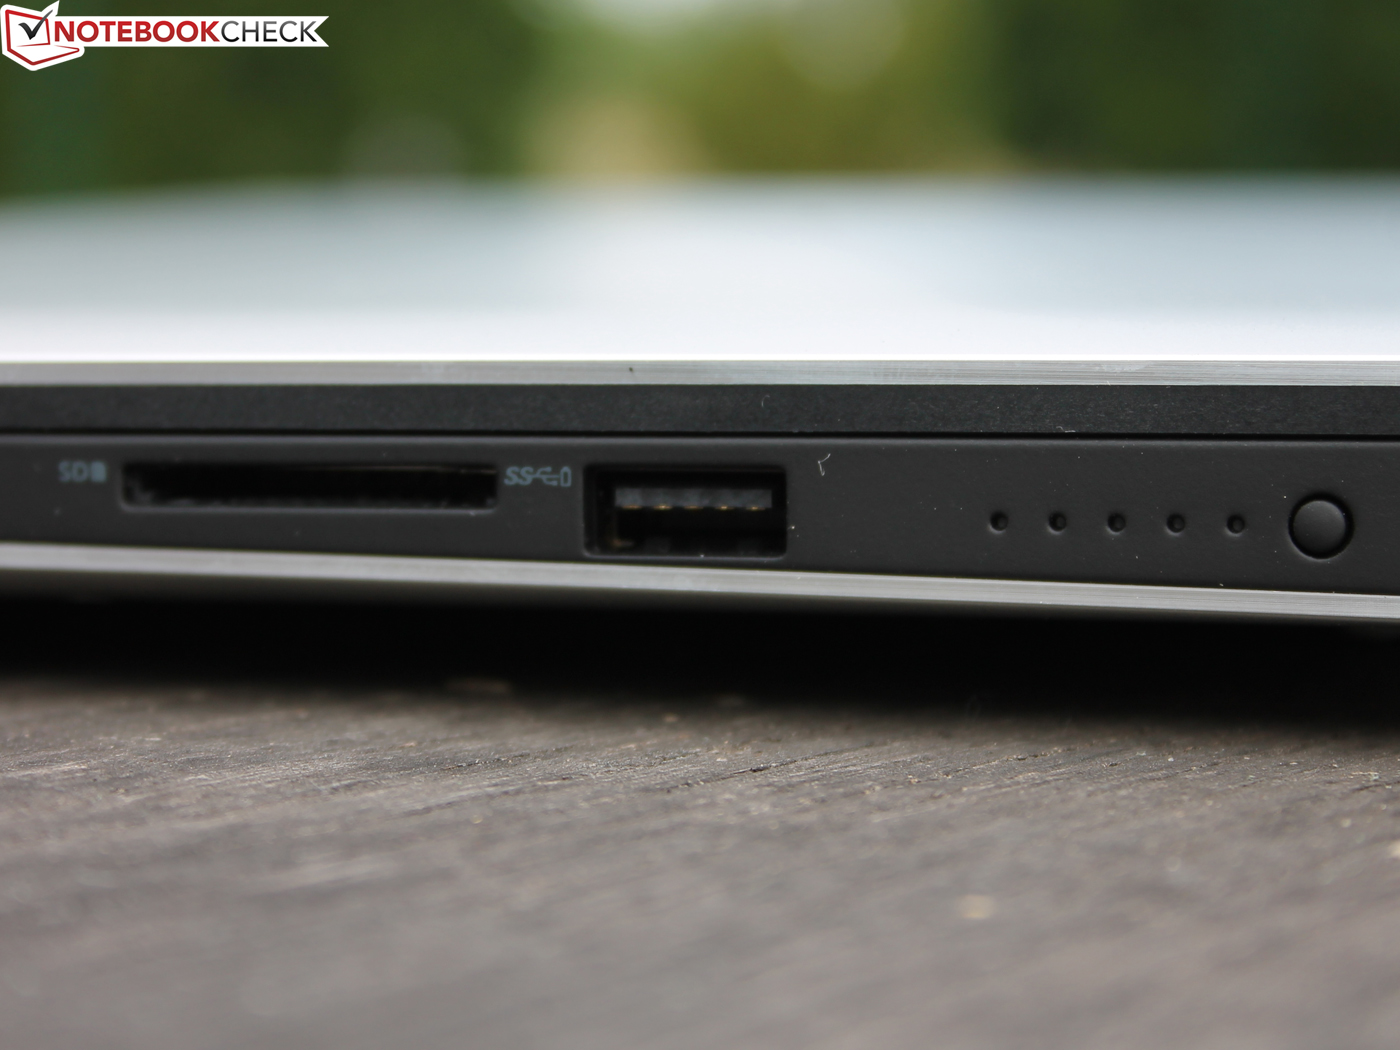
SD Card Reader
Dell is still one of the few manufactures to include fast card readers for standard-sized SD cards. We determined transfer rates close to 200 MB/s with our reference card from Toshiba (Exceria Pro UHS-II), so the XPS 15 is on par with the HP EliteBook 1050 G1. The Asus ZenBook Pro UX580GE on the other hand falls behind at just 65 MB/s.
| SD Card Reader | |
| average JPG Copy Test (av. of 3 runs) | |
| Dell XPS 15 9570 i7 UHD (Toshiba Exceria Pro SDXC 64 GB UHS-II) | |
| HP EliteBook 1050 G1-4QY20EA (Toshiba Exceria Pro SDXC 64 GB UHS-II) | |
| Average of class Multimedia (23 - 531, n=36, last 2 years) | |
| Asus ZenBook Pro 15 UX580GE (Toshiba Exceria Pro M501 UHS-II) | |
| maximum AS SSD Seq Read Test (1GB) | |
| HP EliteBook 1050 G1-4QY20EA (Toshiba Exceria Pro SDXC 64 GB UHS-II) | |
| Average of class Multimedia (37.3 - 1455, n=35, last 2 years) | |
| Dell XPS 15 9570 i7 UHD (Toshiba Exceria Pro SDXC 64 GB UHS-II) | |
Communication
Our current review unit is once again equipped with the Killer Wireless-AC 1535 Wi-Fi module, which did not manage very good numbers in our first review. The transfer rates should be north of 600 Mbps for this model, but our current XPS 15 does not perform better. This means the XPS 15 is just average within the comparison group, but we did not notice any issues with the wireless connection during our review period.
Display - 4K UHD Touchscreen
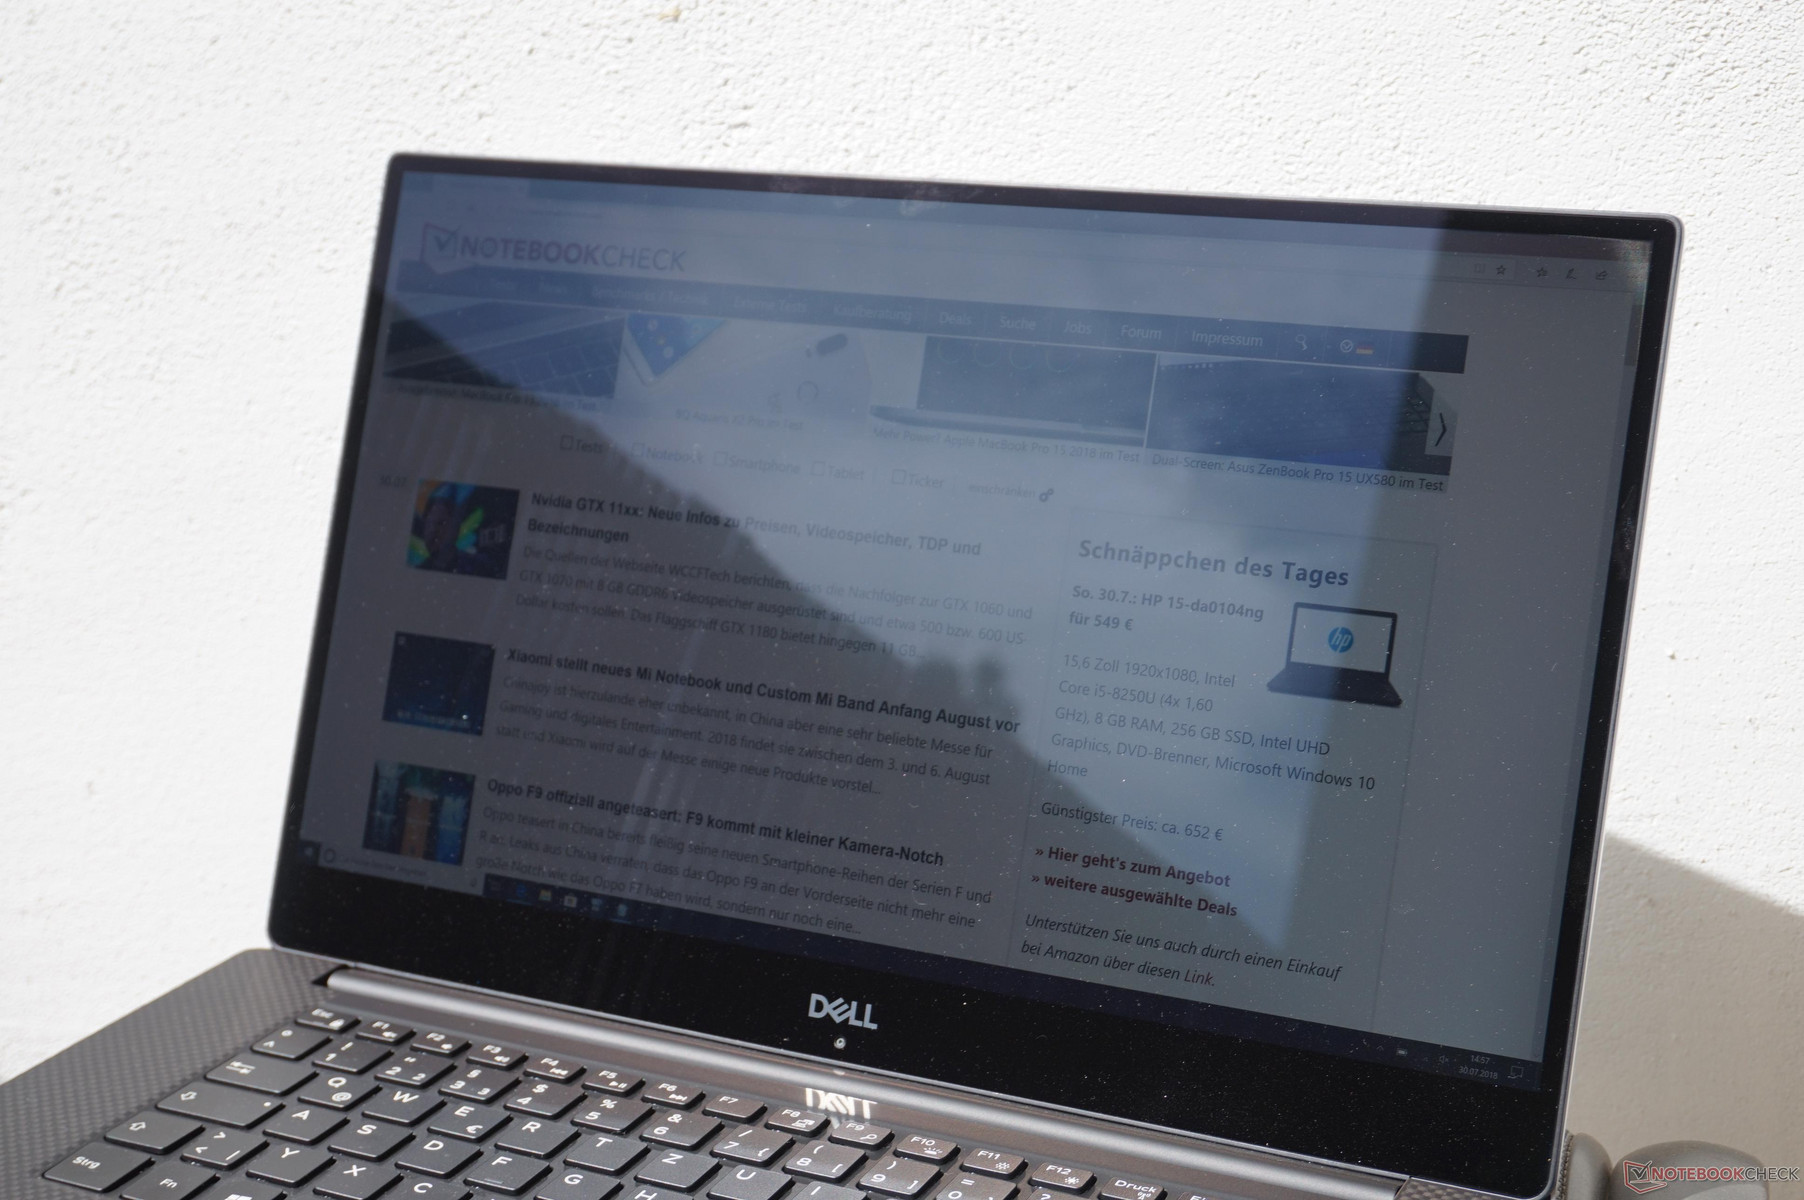
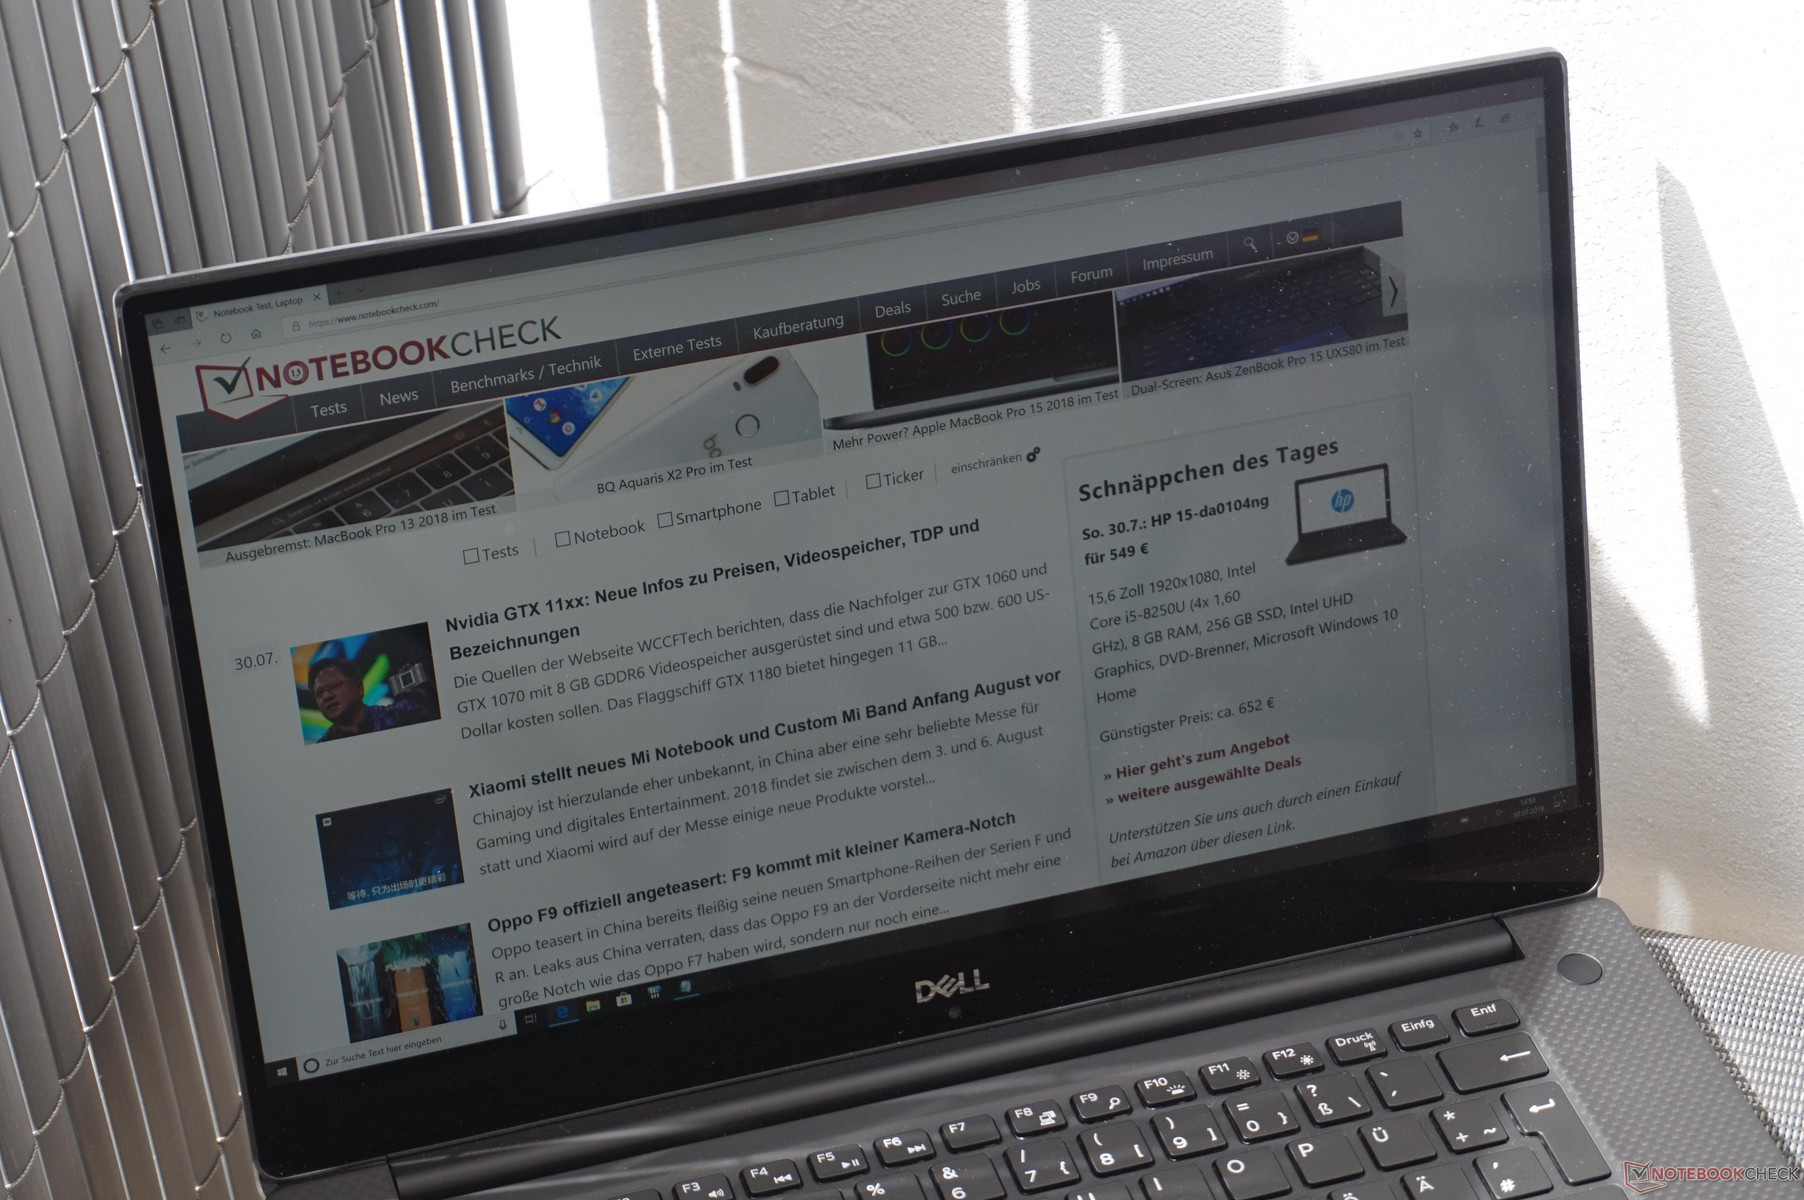
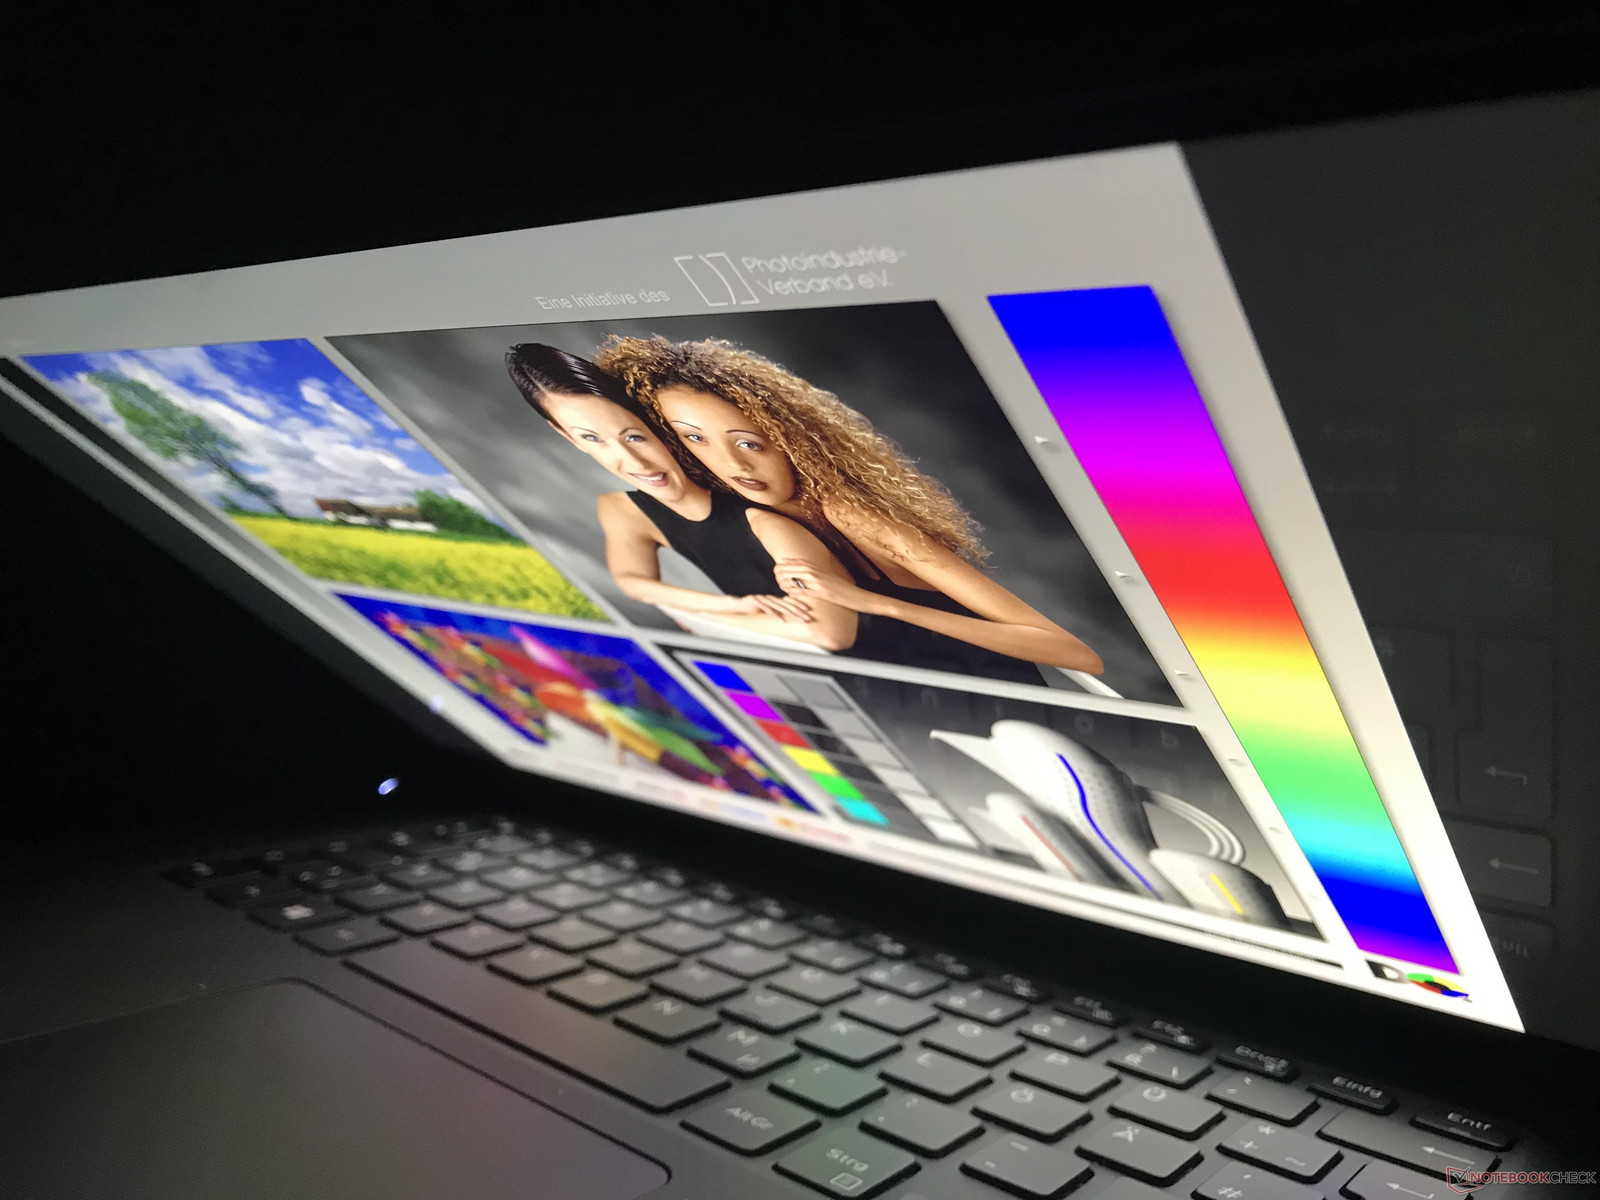
The display is obviously one of the big changes compared to the base model. Instead of the matte 1080p display, you now get a high-resolution 4K touchscreen with a glossy surface. The panel of our review unit is provided by LG Philips and features a resolution of 3840 x 2160 pixels, which ensures very vivid and sharp images. The additional layer of glass helps as well, even though it can cause reflections. However, these reflections were not a big issue during the review. We will have a closer look at the outdoor capabilities further below.
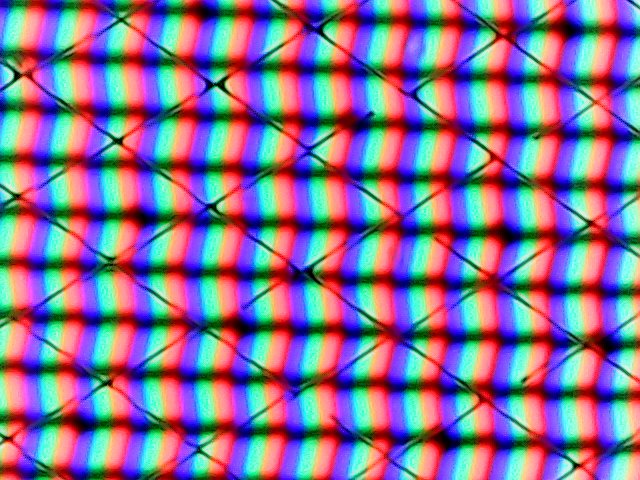
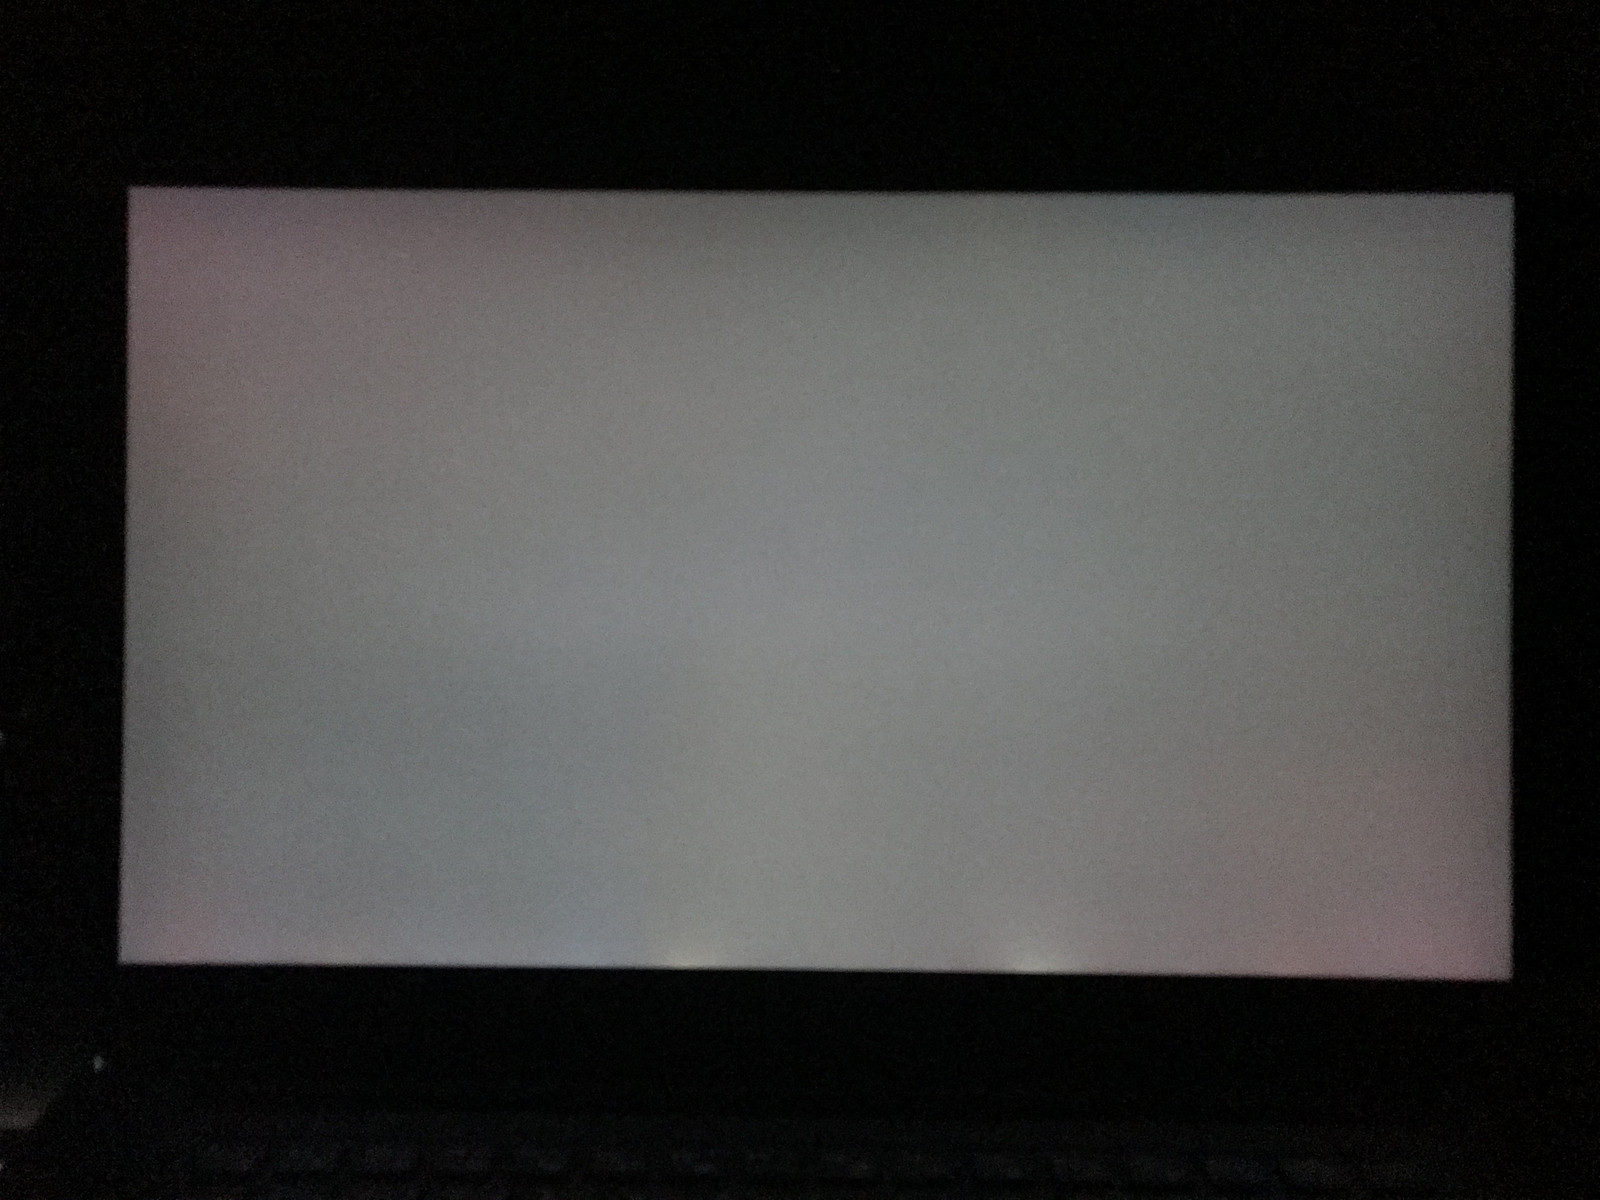
We determine a maximum panel luminance close to 500 nits and - not uncommon for very bright screens - a slightly uneven brightness distribution of 88%. The small deviations are not really noticeable in practice, though. The optional 4K screen is a bit brighter than the default 1080p model, but the latter manages a better black value, so the two are pretty much identical when we look at the contrast ratio (>1400:1). Dell once again uses PWM to regulate the background illumination, this time at a frequency of 980 Hz at 25% luminance or lower. Backlight bleeding is not a major issue, and we can only spot some brighter areas at the lower edge. We did not determine CABC on mains or battery power.
| |||||||||||||||||||||||||
Brightness Distribution: 88 %
Center on Battery: 489 cd/m²
Contrast: 1453:1 (Black: 0.34 cd/m²)
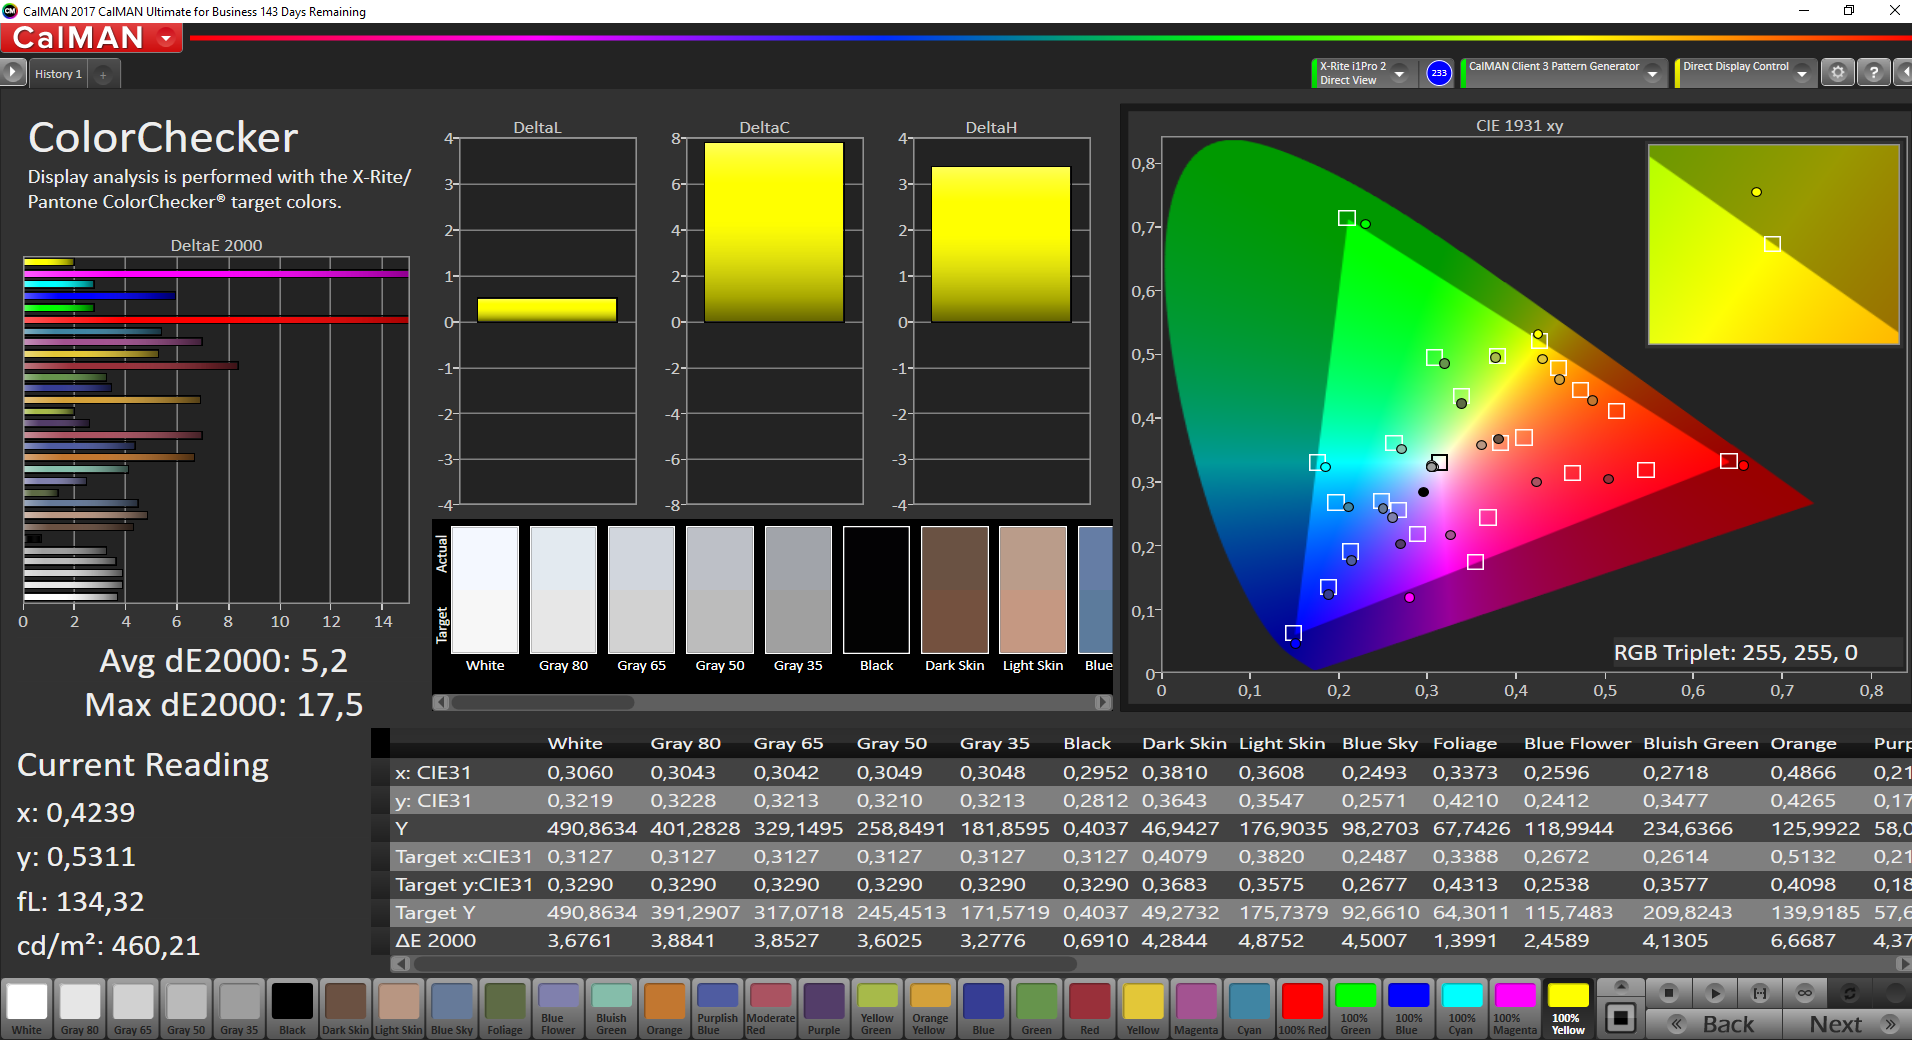
ΔE ColorChecker Calman: 5.2 | ∀{0.5-29.43 Ø4.71}
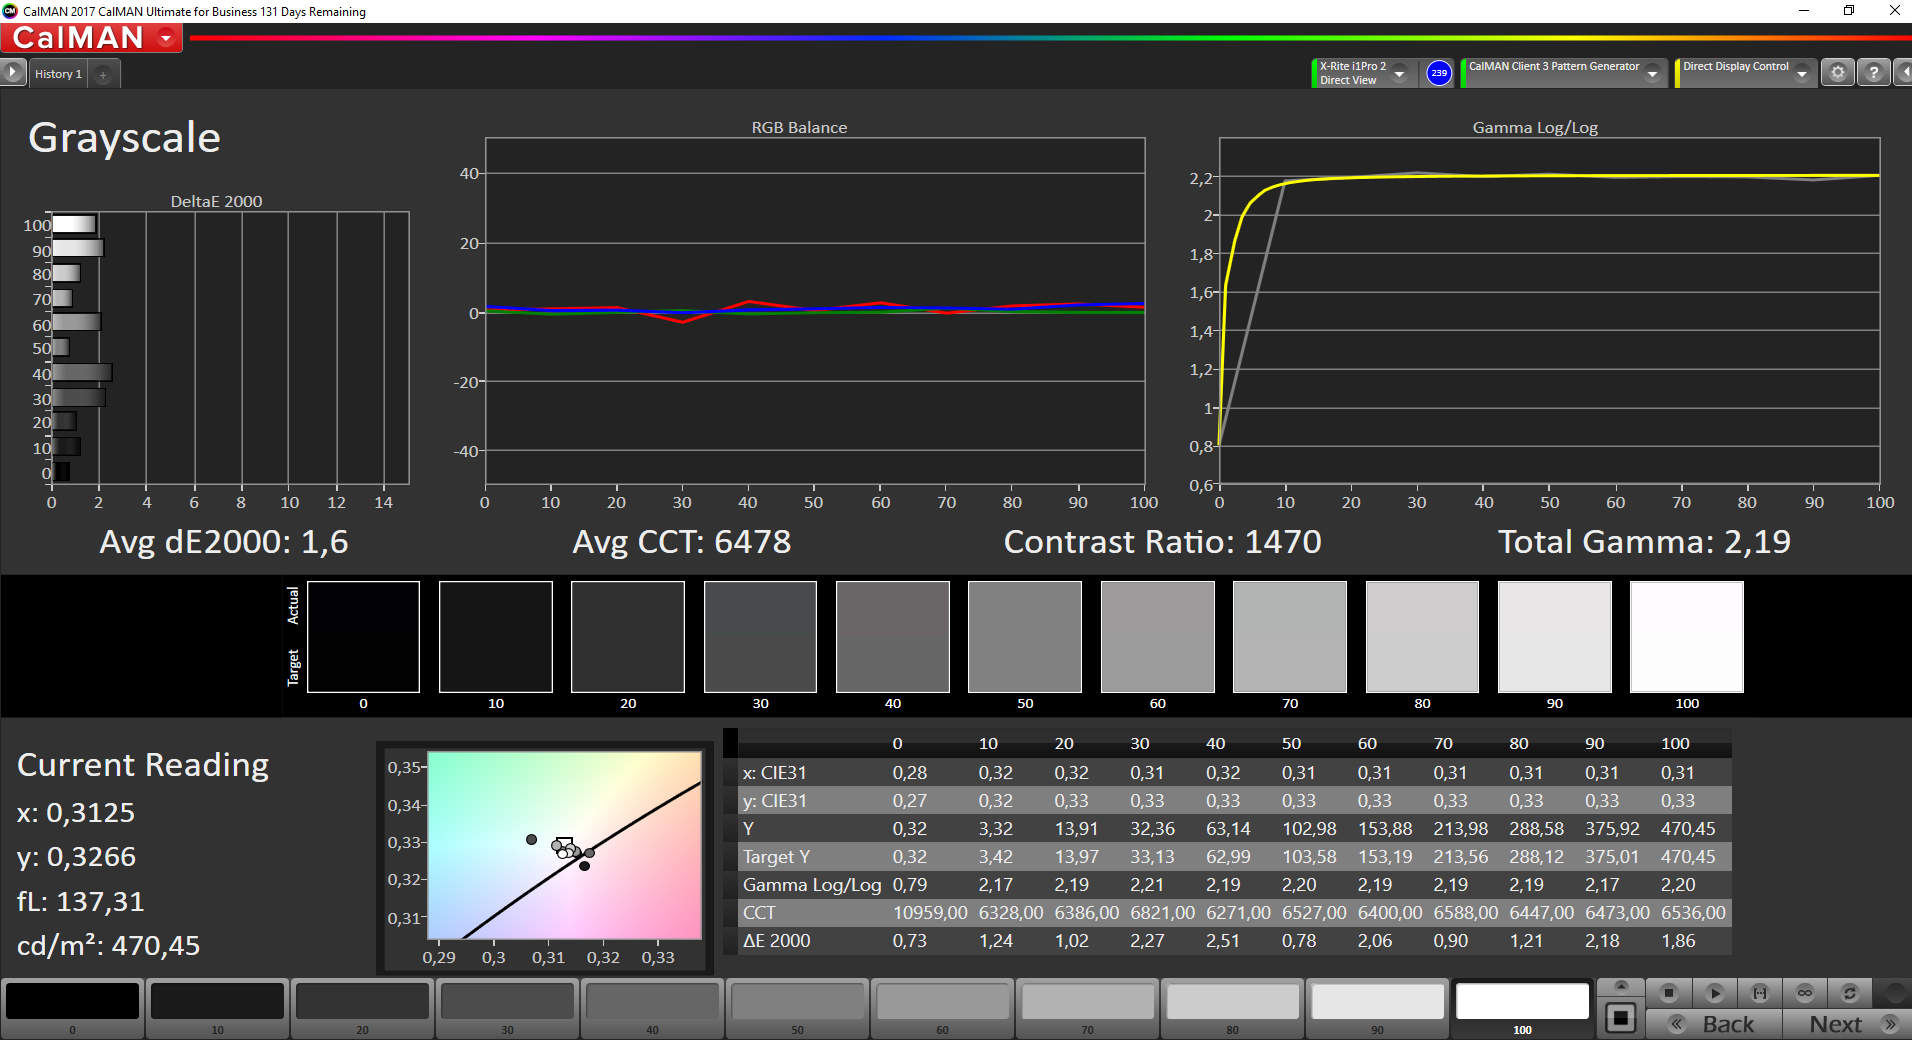
ΔE Greyscale Calman: 2.7 | ∀{0.09-98 Ø4.96}
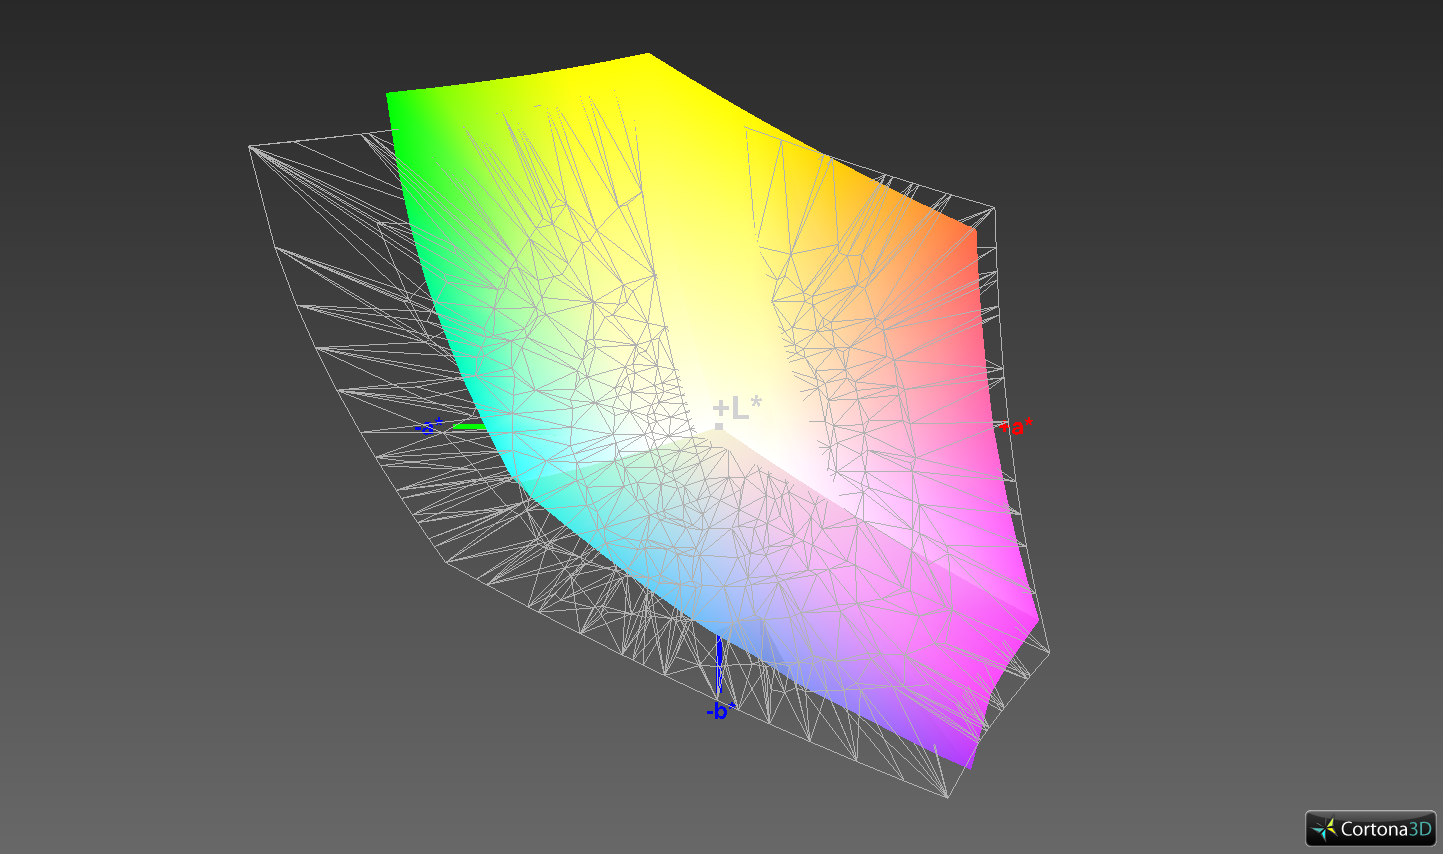
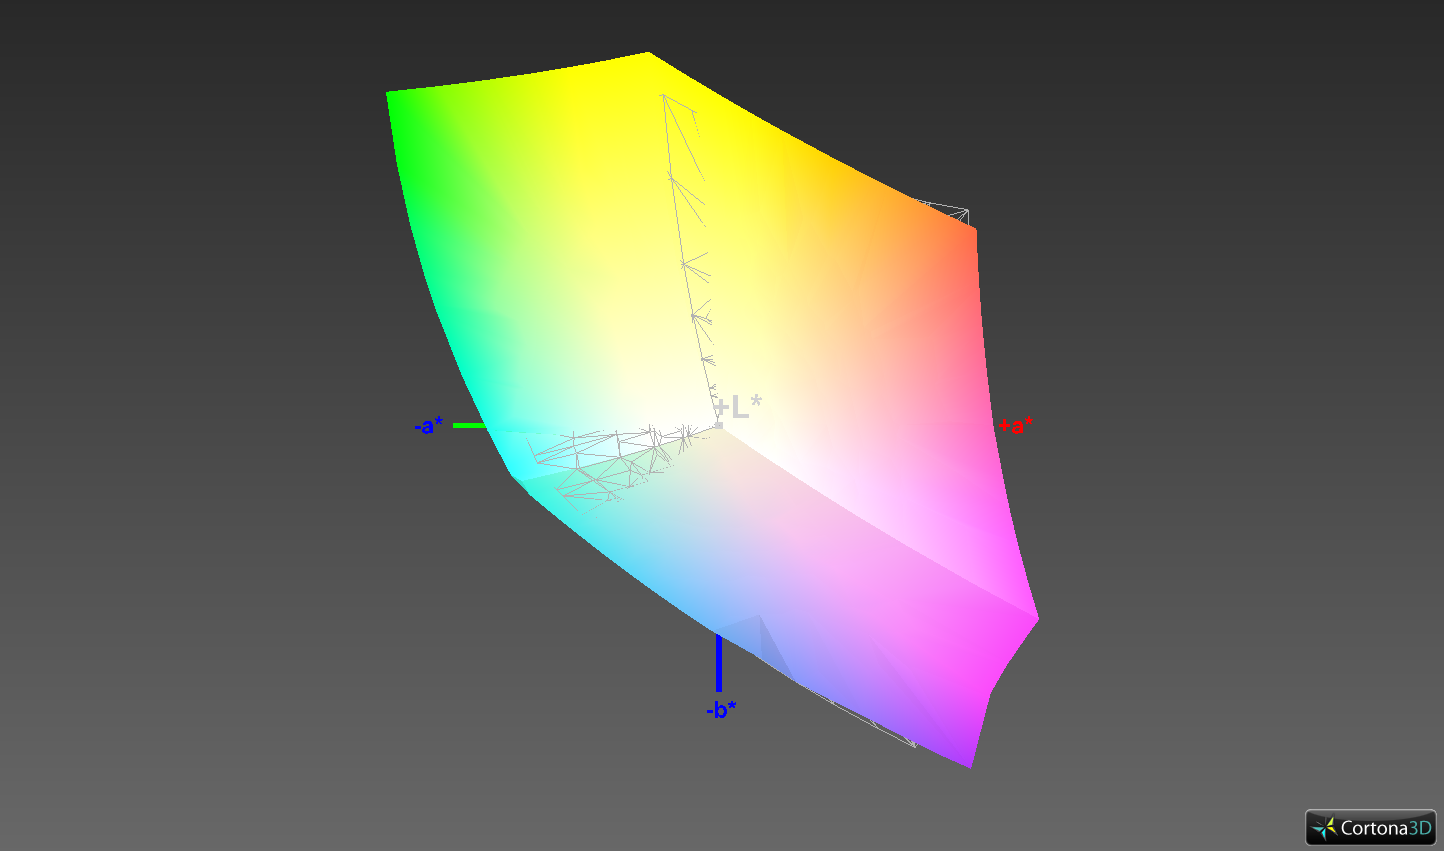
98.8% sRGB (Argyll 1.6.3 3D)
71.2% AdobeRGB 1998 (Argyll 1.6.3 3D)
79.2% AdobeRGB 1998 (Argyll 3D)
98.8% sRGB (Argyll 3D)
79.1% Display P3 (Argyll 3D)
Gamma: 2.1
CCT: 7038 K
| Dell XPS 15 9570 i7 UHD LQ156D1, , 3840x2160, 15.6" | Dell XPS 15 2018 i5 FHD 97Wh Sharp SHP149A LQ156M1, , 1920x1080, 15.6" | Apple MacBook Pro 15 2018 (2.6 GHz, 560X) APPA040, , 2880x1800, 15.4" | HP EliteBook 1050 G1-4QY20EA AUO30EB, , 3840x2160, 15.6" | Asus ZenBook Pro 15 UX580GE AU Optronics B156ZAN03.1, , 3840x2160, 15.6" | Razer Blade 15 GTX 1060 LGD05C0, , 1920x1080, 15.6" | |
|---|---|---|---|---|---|---|
| Display | -12% | 12% | -11% | 12% | -14% | |
| Display P3 Coverage (%) | 79.1 | 66 -17% | 98.7 25% | 67.8 -14% | 85.9 9% | 64.4 -19% |
| sRGB Coverage (%) | 98.8 | 96.5 -2% | 99.9 1% | 94.1 -5% | 100 1% | 93.4 -5% |
| AdobeRGB 1998 Coverage (%) | 79.2 | 66.7 -16% | 86.6 9% | 67.9 -14% | 99.1 25% | 65.5 -17% |
| Response Times | 0% | 5% | -6% | 17% | 67% | |
| Response Time Grey 50% / Grey 80% * (ms) | 46.4 ? | 49 ? -6% | 43.2 ? 7% | 56 ? -21% | 44 ? 5% | 13.6 ? 71% |
| Response Time Black / White * (ms) | 32 ? | 30 ? 6% | 31.2 ? 2% | 29 ? 9% | 22.8 ? 29% | 12 ? 62% |
| PWM Frequency (Hz) | 980 ? | 961 ? | 117000 ? | |||
| Screen | 10% | 26% | -8% | 3% | 4% | |
| Brightness middle (cd/m²) | 494 | 413 -16% | 520 5% | 440 -11% | 357.6 -28% | 304.3 -38% |
| Brightness (cd/m²) | 457 | 378 -17% | 492 8% | 389 -15% | 350 -23% | 293 -36% |
| Brightness Distribution (%) | 88 | 86 -2% | 88 0% | 83 -6% | 85 -3% | 80 -9% |
| Black Level * (cd/m²) | 0.34 | 0.29 15% | 0.39 -15% | 0.34 -0% | 0.35 -3% | 0.38 -12% |
| Contrast (:1) | 1453 | 1424 -2% | 1333 -8% | 1294 -11% | 1022 -30% | 801 -45% |
| Colorchecker dE 2000 * | 5.2 | 2.44 53% | 1.2 77% | 5.04 3% | 4.12 21% | 1.79 66% |
| Colorchecker dE 2000 max. * | 17.5 | 4.46 75% | 2.3 87% | 6.99 60% | 9.91 43% | 3.69 79% |
| Greyscale dE 2000 * | 2.7 | 2.48 8% | 1.3 52% | 4.98 -84% | 1.8 33% | 1.1 59% |
| Gamma | 2.1 105% | 2.43 91% | 2.18 101% | 2.48 89% | 2.17 101% | 2.27 97% |
| CCT | 7038 92% | 7006 93% | 6738 96% | 7777 84% | 6613 98% | 6665 98% |
| Color Space (Percent of AdobeRGB 1998) (%) | 71.2 | 62 -13% | 61 -14% | 87.5 23% | 59.8 -16% | |
| Color Space (Percent of sRGB) (%) | 98.8 | 96 -3% | 94 -5% | 100 1% | 92.8 -6% | |
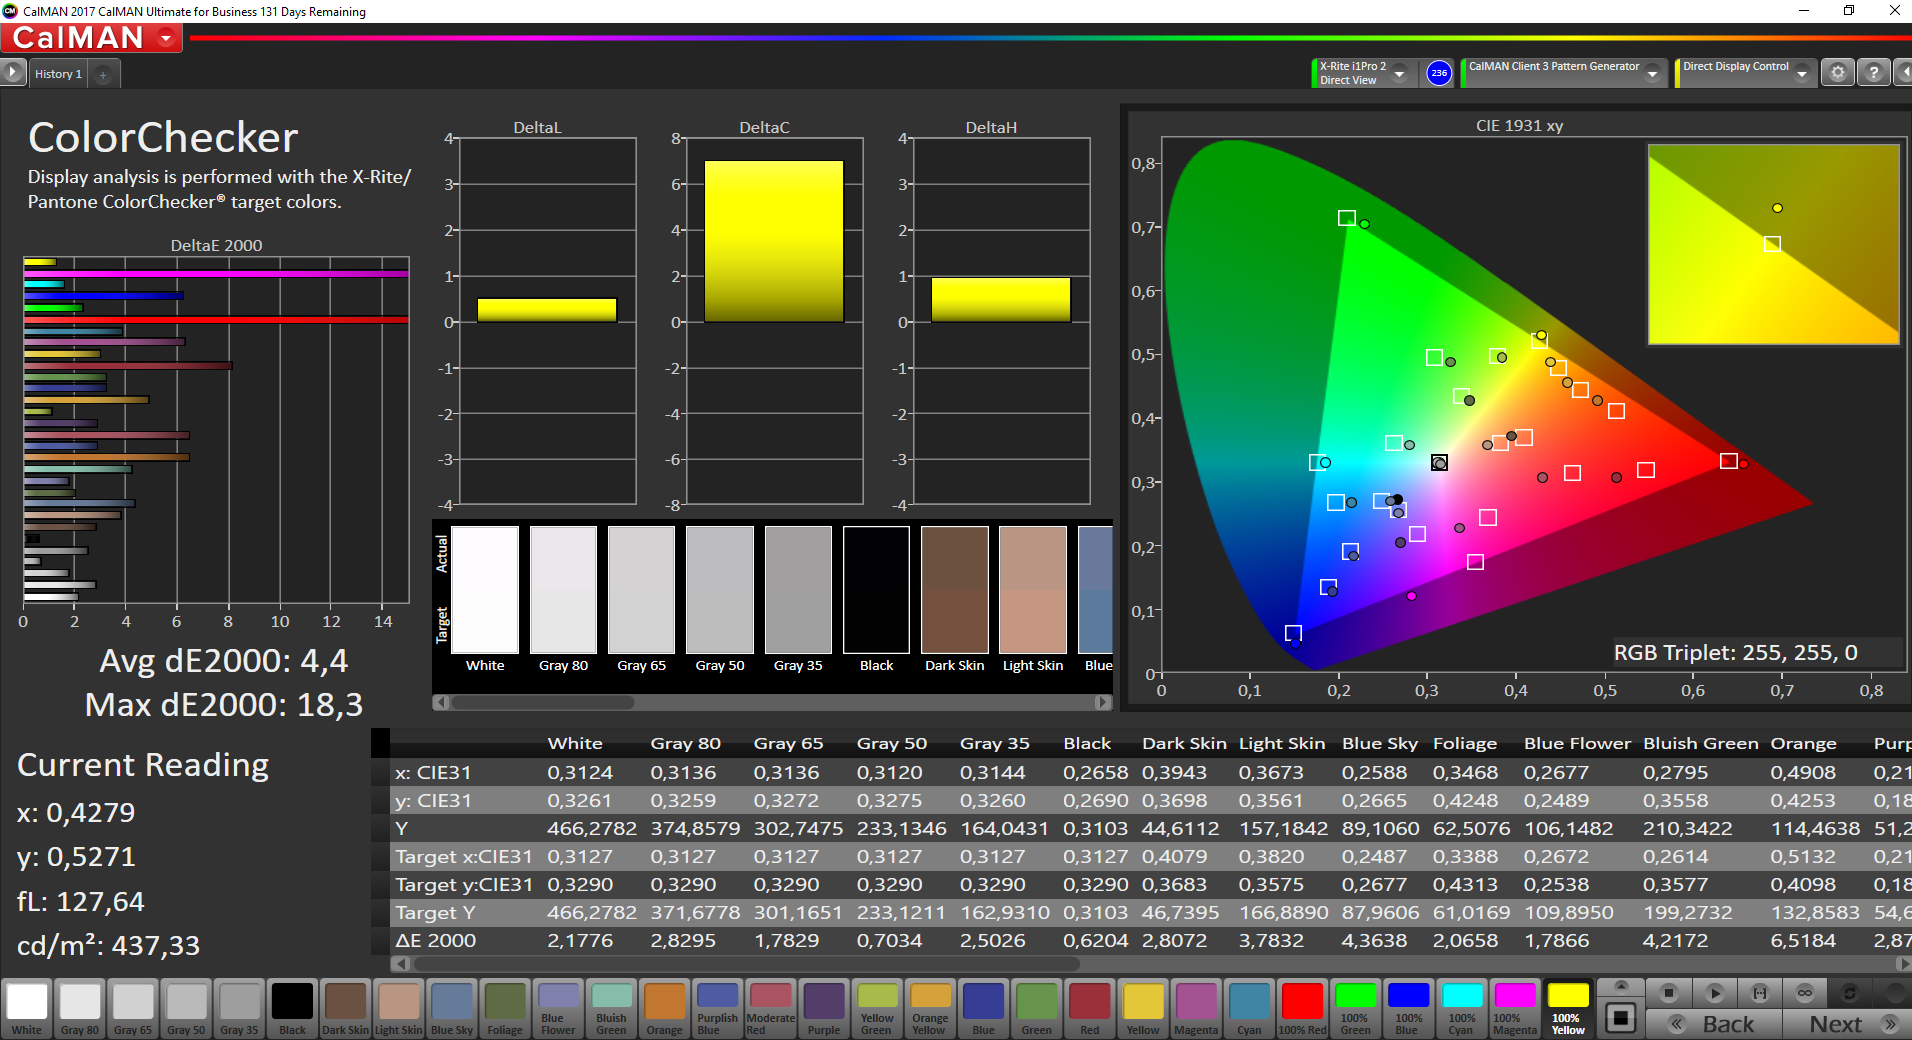
| Colorchecker dE 2000 calibrated * | 2.48 | 2.04 | 4.23 | |||
| Total Average (Program / Settings) | -1% /
4% | 14% /
19% | -8% /
-9% | 11% /
7% | 19% /
9% |
* ... smaller is better
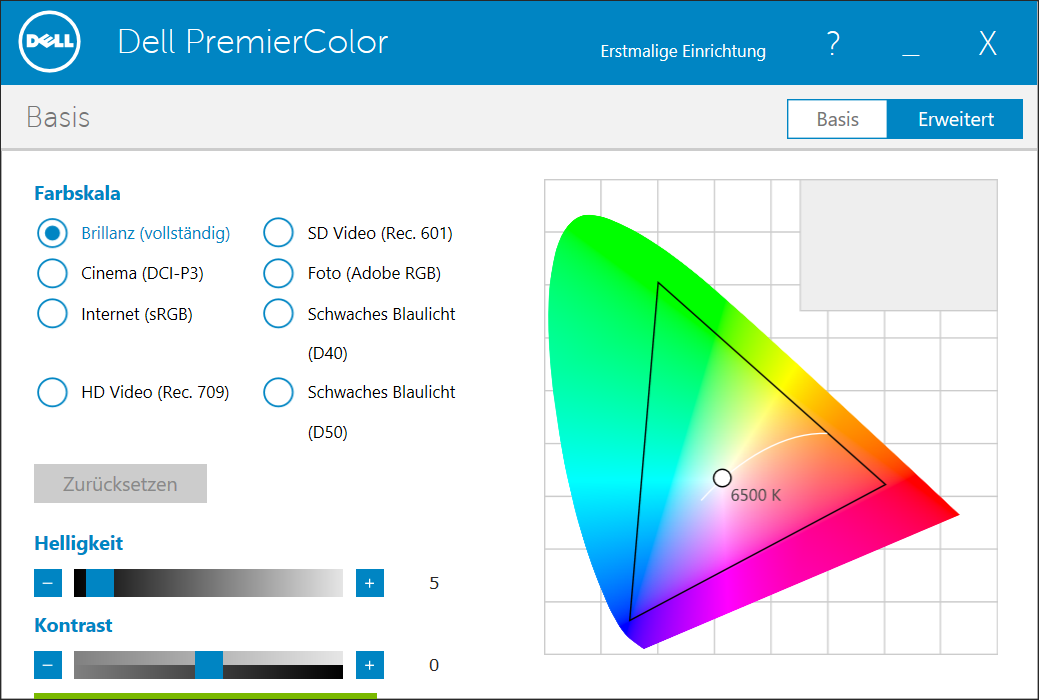
The XPS 15 comes preloaded with the Dell PremierColor tool, which is familiar from Dell's mobile workstations. It can be used to select the color space you want to work in, for example. The default setting is Brilliant, and we used it for our measurements.
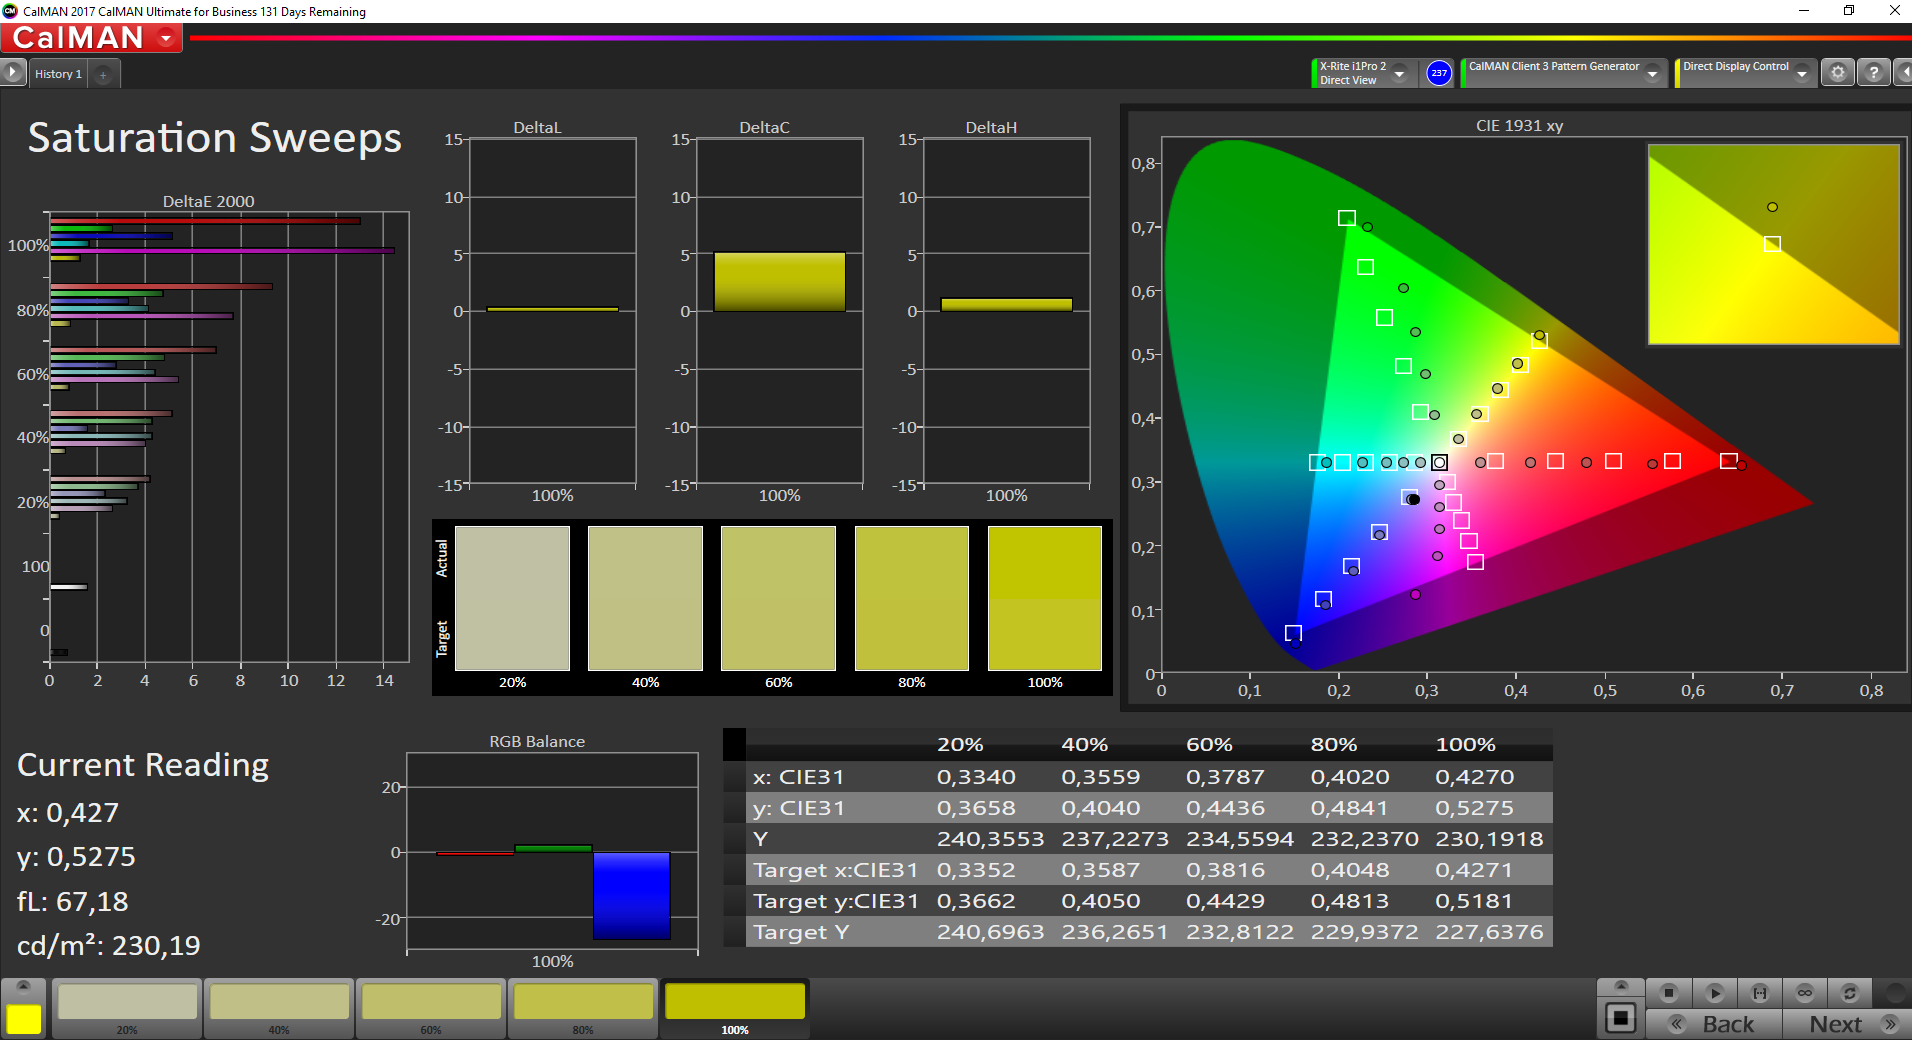
The grayscale performance is already very good ex-works with DeltaE-2000 deviations below the important mark of 3. The color temperature is a bit too cool and there is a slight blue cast though, but it is not noticeably in practice. We were much more surprised by the high color deviations, especially fully saturated colors show massive deviations. We also tested the other profiles, but the results did not change.

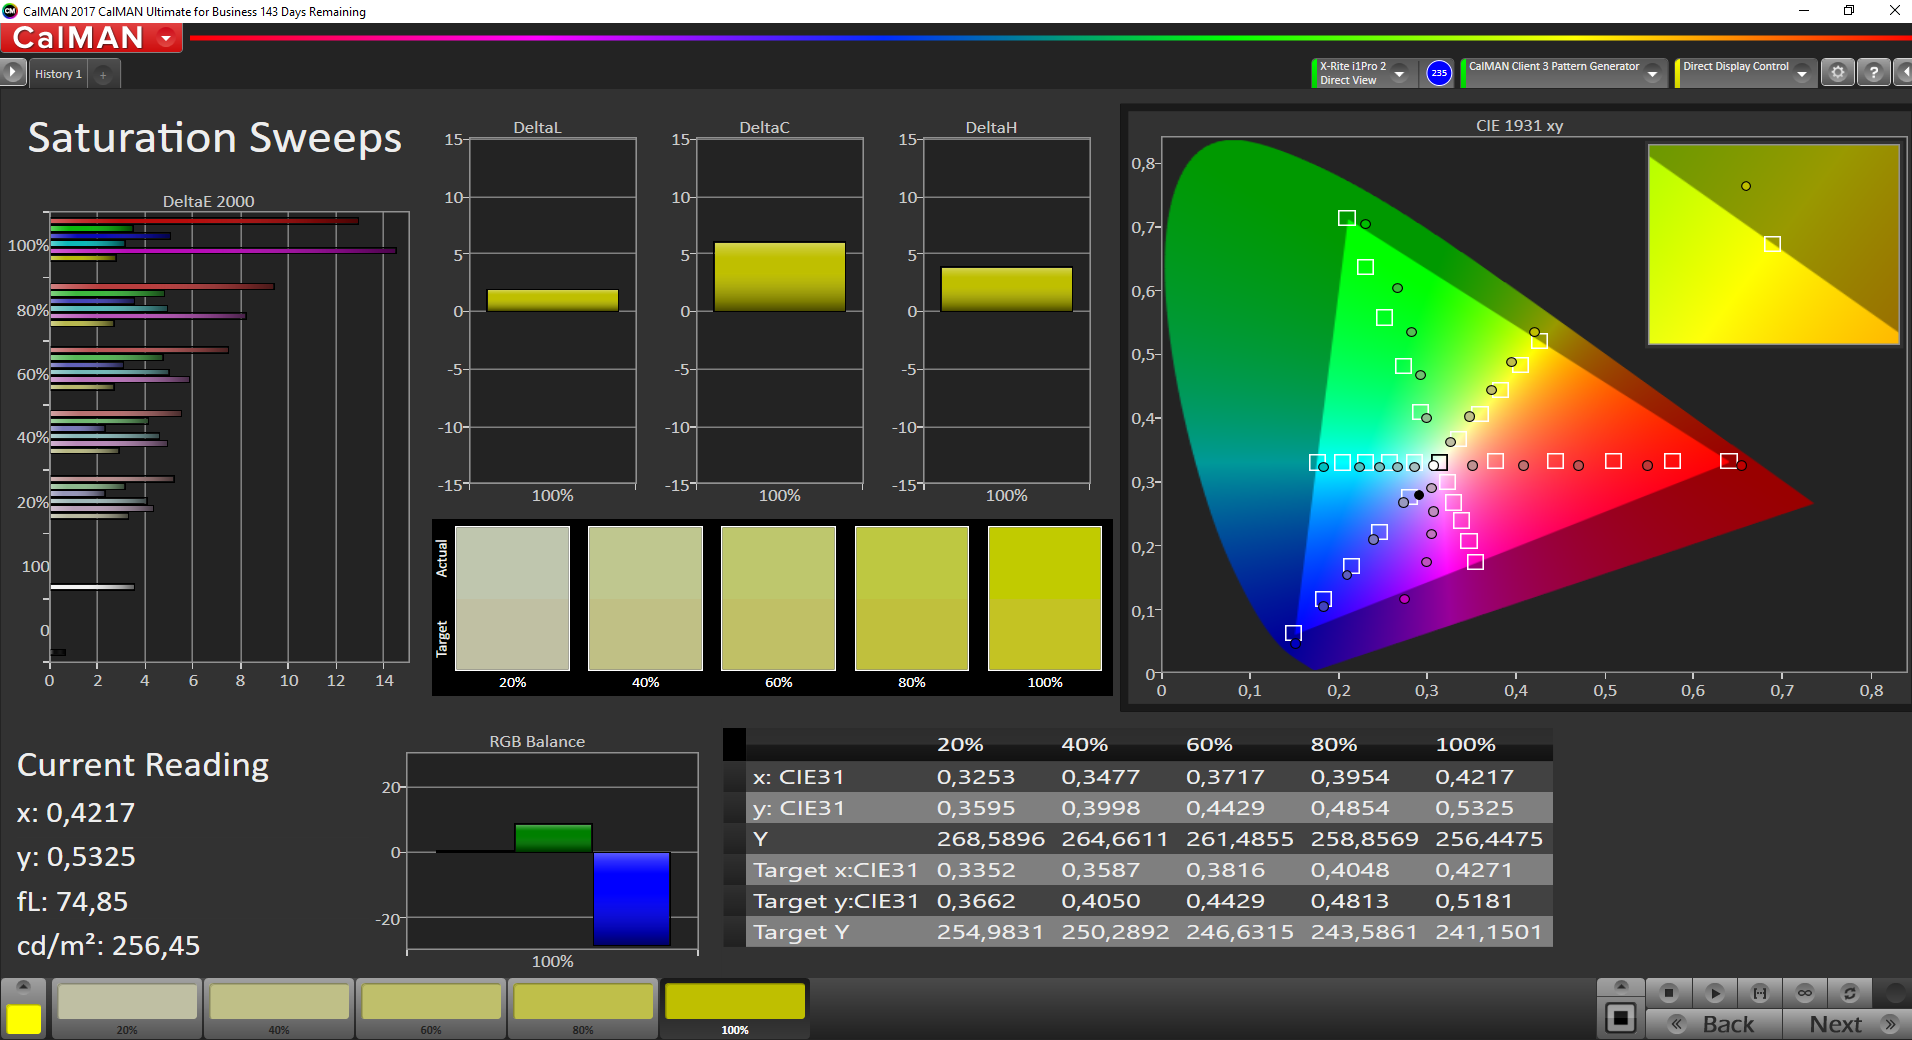
Our calibration removes the slight color cast and the average grayscale deviation is reduced, but the massive color deviations are just slightly improved. This is a negative surprise for such a screen. The smaller sRGB gamut is covered completely, but AdobeRGB only by ~71%. This means the XPS 15 with the UHD screen is not the best option for picture/video editing.
Display Response Times
| ↔ Response Time Black to White | ||
|---|---|---|
| 32 ms ... rise ↗ and fall ↘ combined | ↗ 18 ms rise | 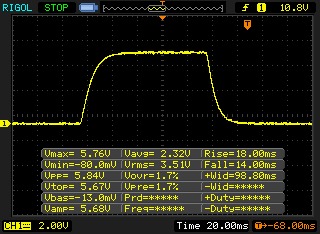 |
| ↘ 14 ms fall | ||
| The screen shows slow response rates in our tests and will be unsatisfactory for gamers. In comparison, all tested devices range from 0.1 (minimum) to 240 (maximum) ms. » 86 % of all devices are better. This means that the measured response time is worse than the average of all tested devices (19.8 ms). | ||
| ↔ Response Time 50% Grey to 80% Grey | ||
| 46.4 ms ... rise ↗ and fall ↘ combined | ↗ 22.8 ms rise | 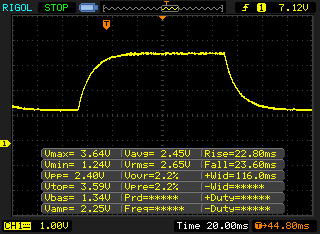 |
| ↘ 23.6 ms fall | ||
| The screen shows slow response rates in our tests and will be unsatisfactory for gamers. In comparison, all tested devices range from 0.165 (minimum) to 636 (maximum) ms. » 80 % of all devices are better. This means that the measured response time is worse than the average of all tested devices (30.9 ms). | ||
Screen Flickering / PWM (Pulse-Width Modulation)
| Screen flickering / PWM detected | 980 Hz | ≤ 25 % brightness setting | 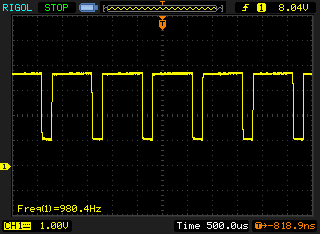 |
The display backlight flickers at 980 Hz (worst case, e.g., utilizing PWM) Flickering detected at a brightness setting of 25 % and below. There should be no flickering or PWM above this brightness setting. The frequency of 980 Hz is quite high, so most users sensitive to PWM should not notice any flickering. In comparison: 52 % of all tested devices do not use PWM to dim the display. If PWM was detected, an average of 7741 (minimum: 5 - maximum: 343500) Hz was measured. | |||
We already mentioned the glossy surface of the Dell XPS 15 with the 4K screen. This obviously makes it harder to use outdoors compared to a matte panel, but the high luminance certainly helps. If you can avoid direct reflections on the screen, there should not be any issues with the visibility even in bright environments. The viewing angle stability is excellent thanks to the IPS panel.
Performance

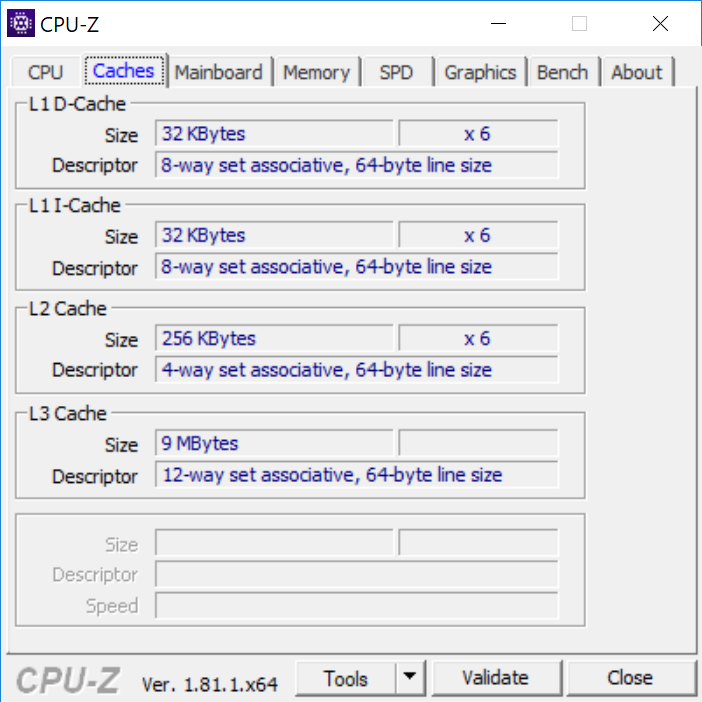
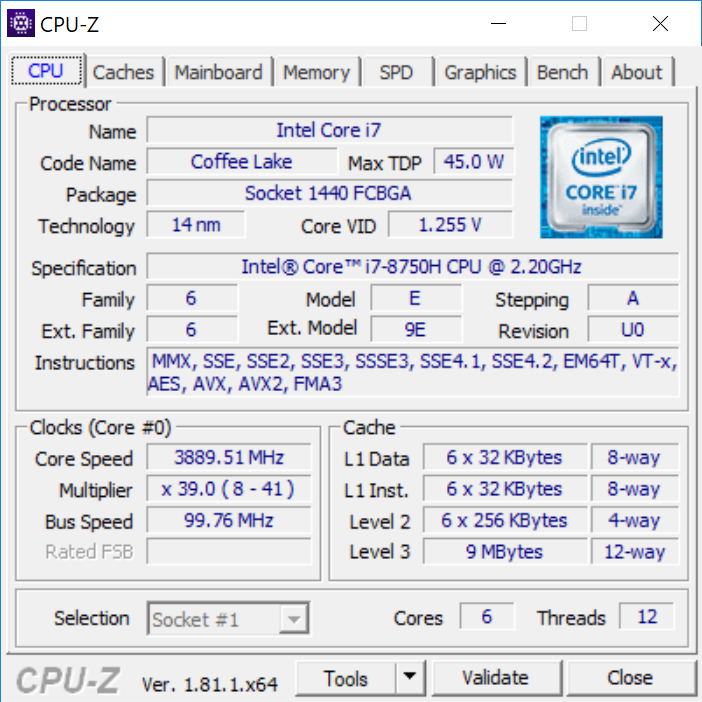

Processor - Coffee Lake Core i7
Dell offers the XPS 15 with quad-core (i5) as well as hexa-core CPUs (i7 & i9) from Intel's 8th generation Coffee Lake lineup. Except for the two additional processor cores, however, the chips only differ slightly in terms of frequency and different cache sizes. The entry-level model's cooling did not have any issues with the Core i5-8300H and the performance utilization was good. So how about the Core i7-8750H and its six cores? We recently saw many laptops where the high Turbo frequencies only lasted a few seconds, before they leveled off at a certain level.
Dell sets the TDP limits for the processor to 78 watts for the first 30 seconds and then 56 watts, which is noticeably above the nominal TDP classification of 45 watts for this processor. We see a fluctuation between 3.3-3.9 GHz on all six cores at first during the Cinebench Multi test, which corresponds with a consumption of 71 watts. The frequency then levels off at 6x 3.3-3.4 GHz. Thanks to the high initial clocks, the i7 XPS 15 manages a very good Cinebench Multi score of more than 1200 points, so the XPS 15 secures the top spot in our comparison group. We will have a closer look at the sustained performance (about 1000 points) in the next section. The Core i7 is therefore about 25% faster than the i5 model under sustained workloads.
CPU Tuning - 15% more performance
The initial result is good, but the XPS 15 has to reduce its performance under sustained workloads. The previously mentioned 56-watt limitation cannot be maintained all the time during our Cinebench loop (50 runs of the Multi test), and the average clock is ~3.2 GHz. The score of about 1000 points is on par with the rivals.
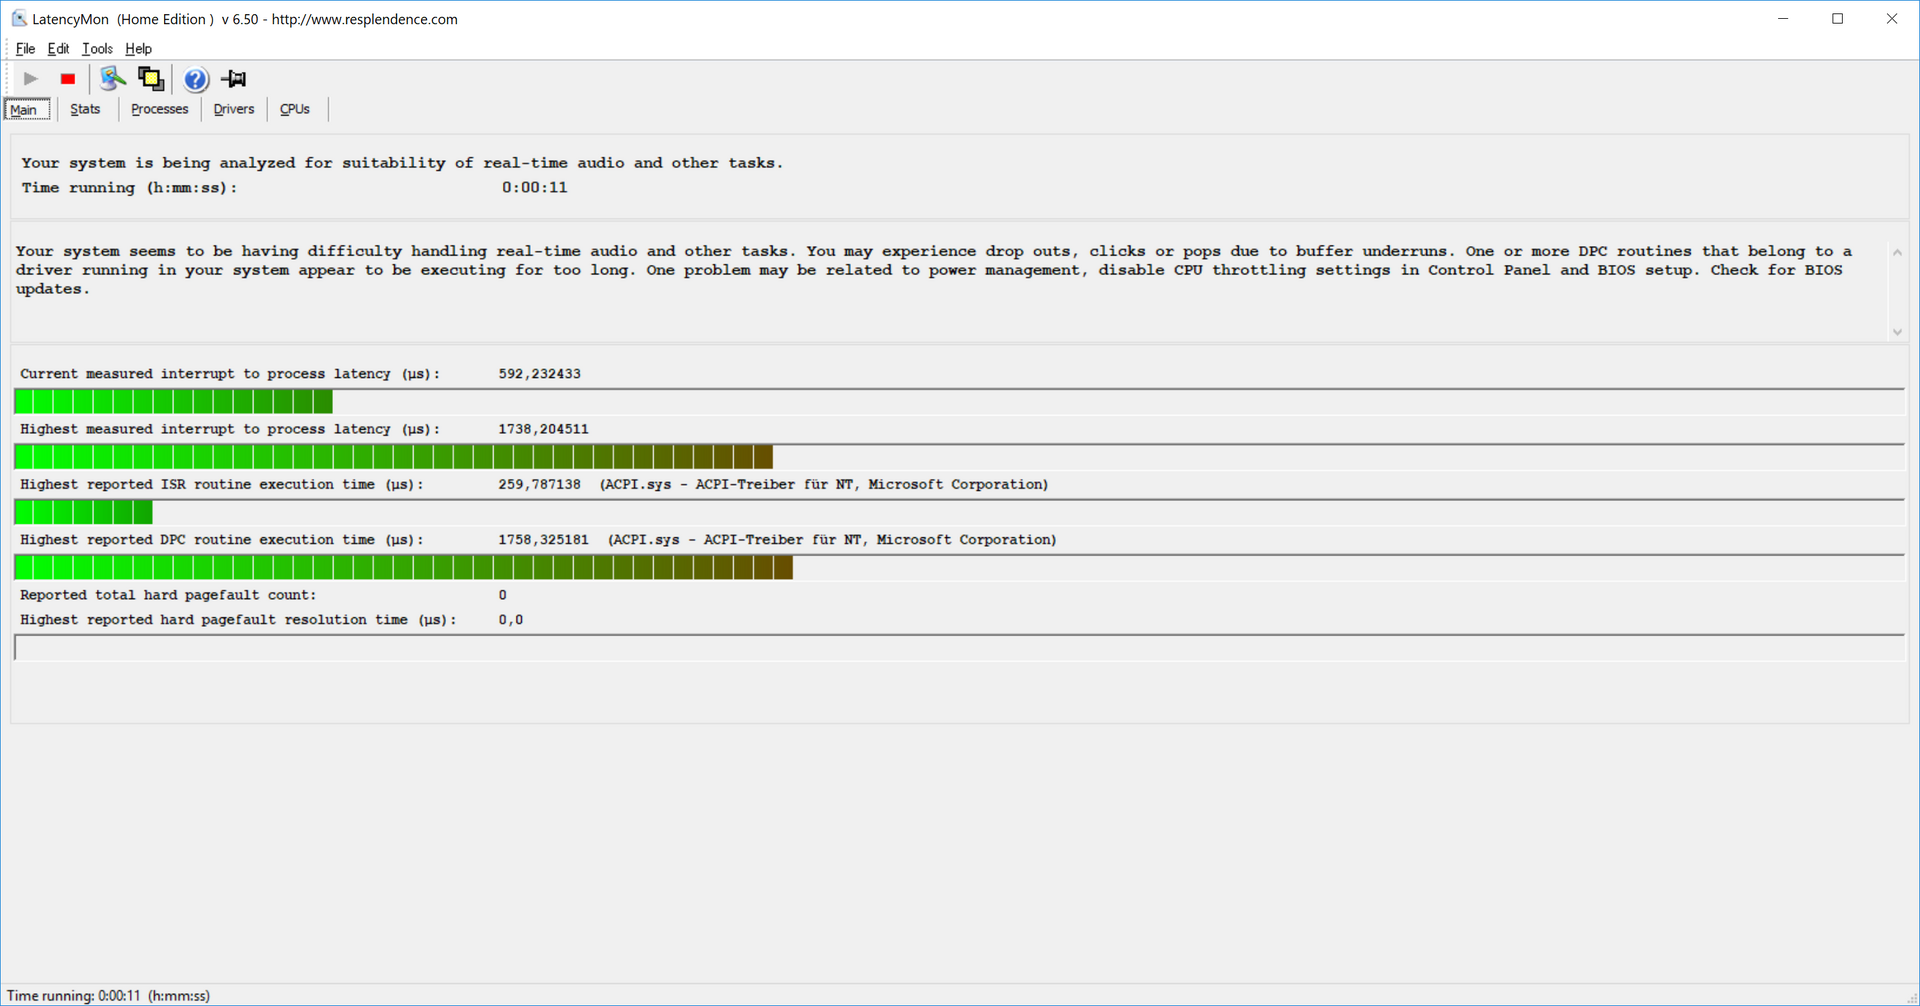
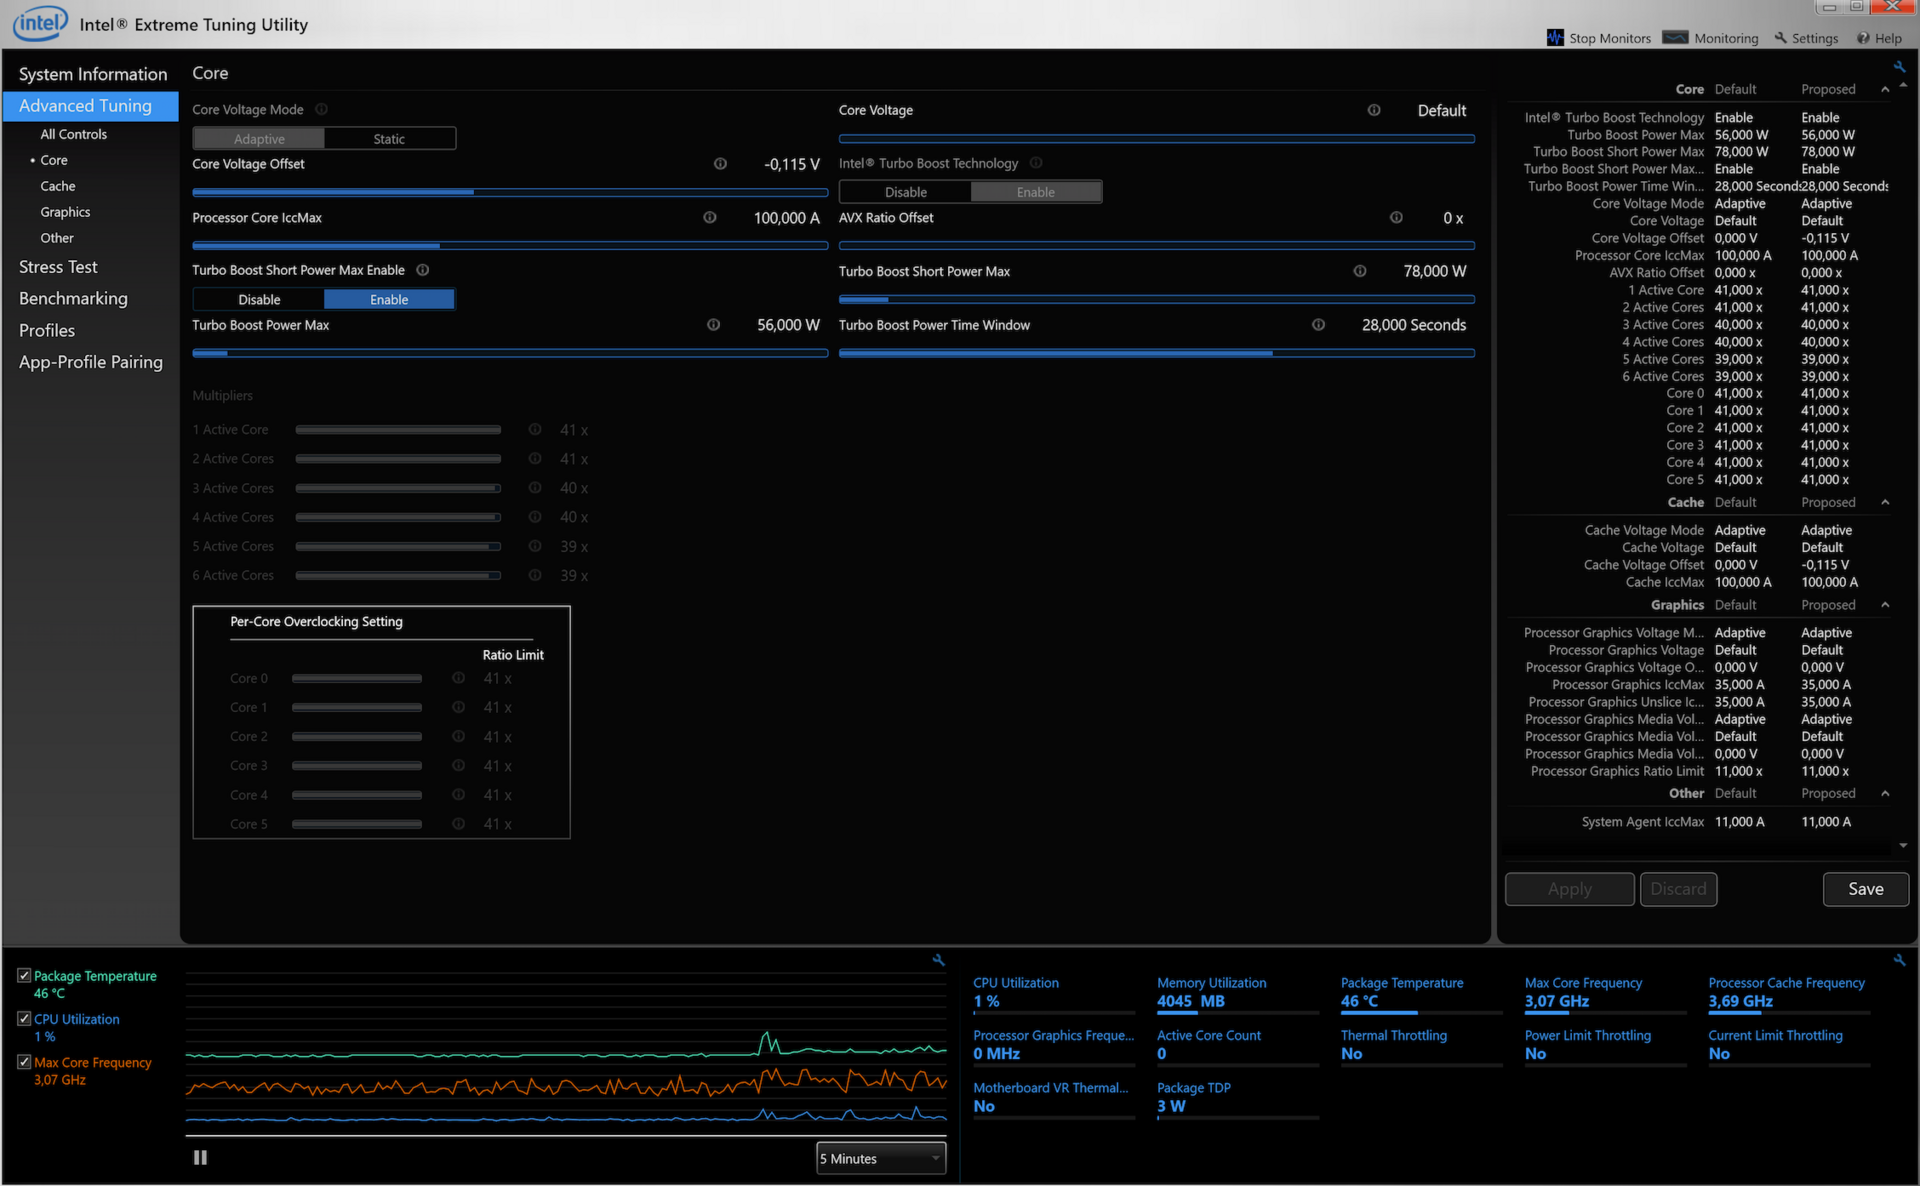
We reduced the core voltage of the CPU with the tool Intel XTU and refer to our dedicated article for detailed instructions. Attention: You can affect the system stability if you are not careful. Every processor is slightly different, so you cannot just use our value. Notebookcheck does not assume any liabilities for potential damages.
We were able to run the Core i7-8750H at -0.115 V, which means the processor temperature is not as high at high clocks and this improves the performance. The first Cinebench results is just slightly faster, but the score levels off at more than 1150 points over the course of the Cinebench loop, so you get more than 15% more performance under sustained workloads.
| Default | -0.115 V | |
|---|---|---|
| Clock | ~3.2 GHz | ~3.6 GHz |
| Temperature | ~82.5 °C | ~83 °C |
| Power consumption | ~45 Watts | ~50 Watts |
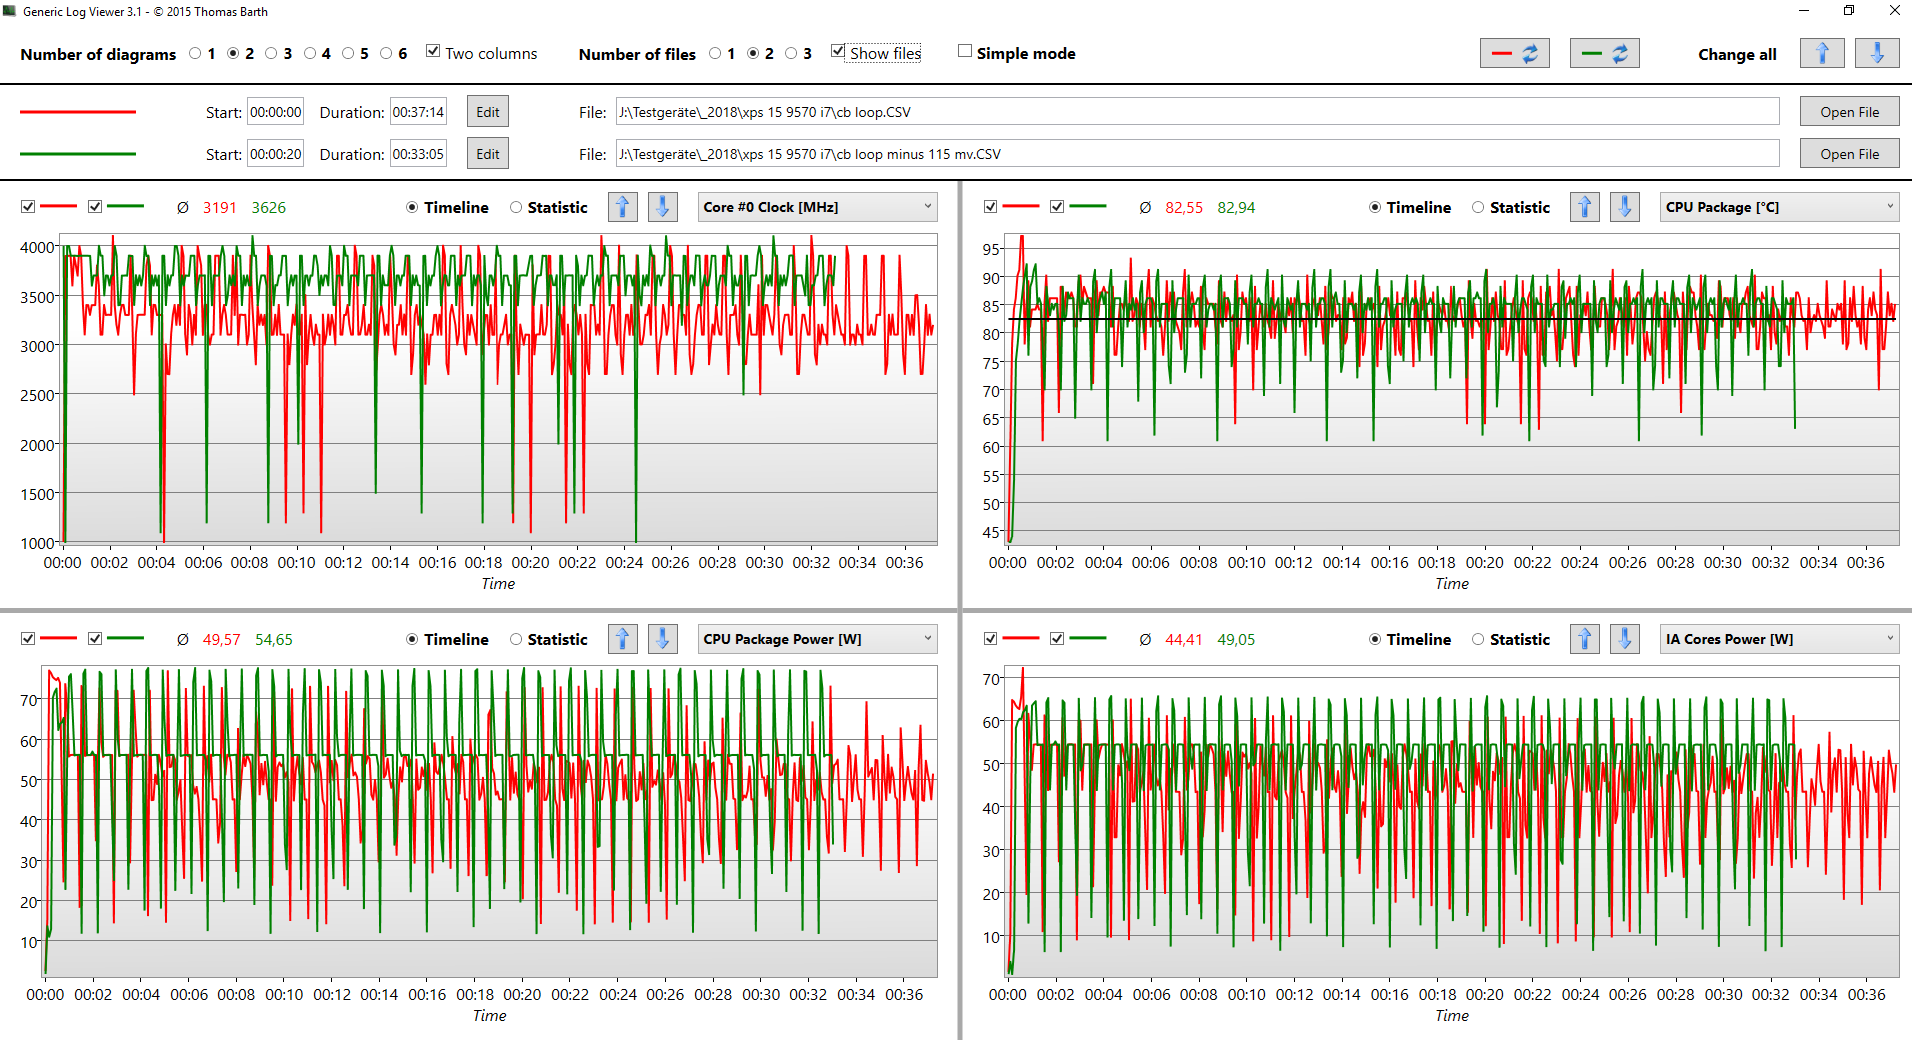
The diagram shows the CPU can maintain 56W after a spike, which is not always the case with the default settings. The average core clock is 400 MHz higher at the same time, which requires a bit more power, but the core temperature is basically identical.
The CPU now consumes up to 76W for the full 6x 3.9 GHz, and 56W for a steady 6x 3.7 GHz. This shows how inefficient the current CPU generation is at these clocks, because 6x 200 MHz more require 20 watts more. The advantages of the voltage reduction are not just limited to sustained workloads. Short peak load is more common in practice, and the temperature will stay lower so the cooling unit does not spin up as quickly or can stay turned off, respectively.
System Performance
The XPS 15 is a very fast and responsive system, but this can be expected considering the specs. However, the test model suffers a bit from its higher resolution in the older PCMark 8 tests, where it is beaten by the entry-level SKU. The newer PCMark 10 gives us a clearer picture and the XPS 15 9570 i7 is only beaten by the rivals from Asus and Razer, which is most likely connected to their faster Samsung SSDs. Still, the deficit is small and almost 5000 points is a very good result. We did not notice any software hiccups or issues during our review period, either.
| PCMark 8 Home Score Accelerated v2 | 3631 points | |
| PCMark 8 Creative Score Accelerated v2 | 5284 points | |
| PCMark 8 Work Score Accelerated v2 | 4418 points | |
| PCMark 10 Score | 4966 points | |
Help | ||
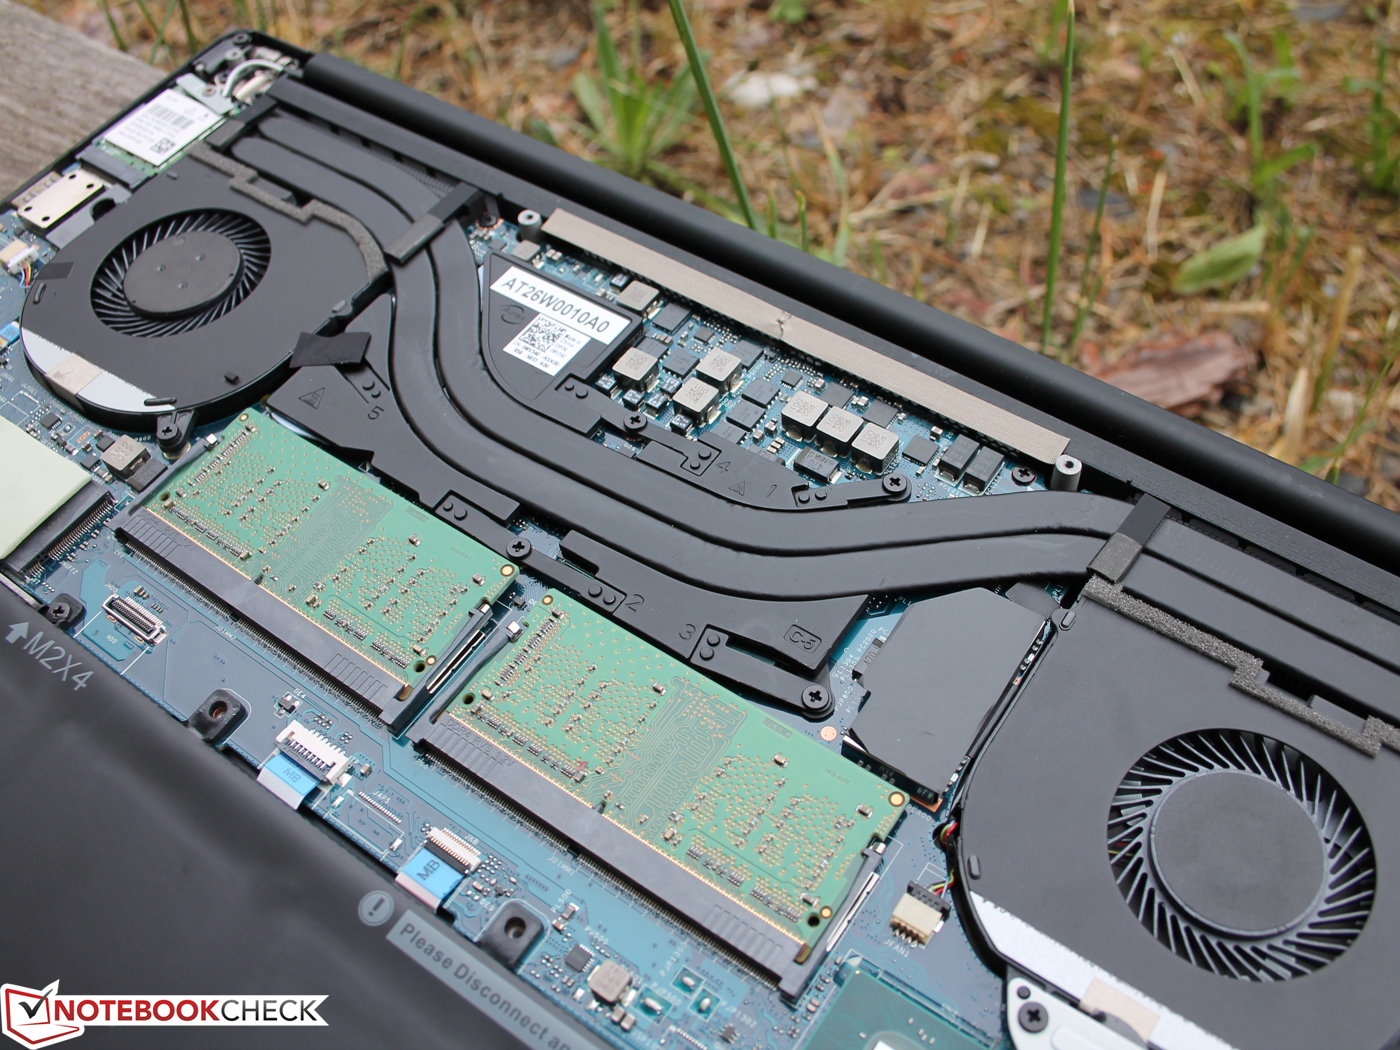
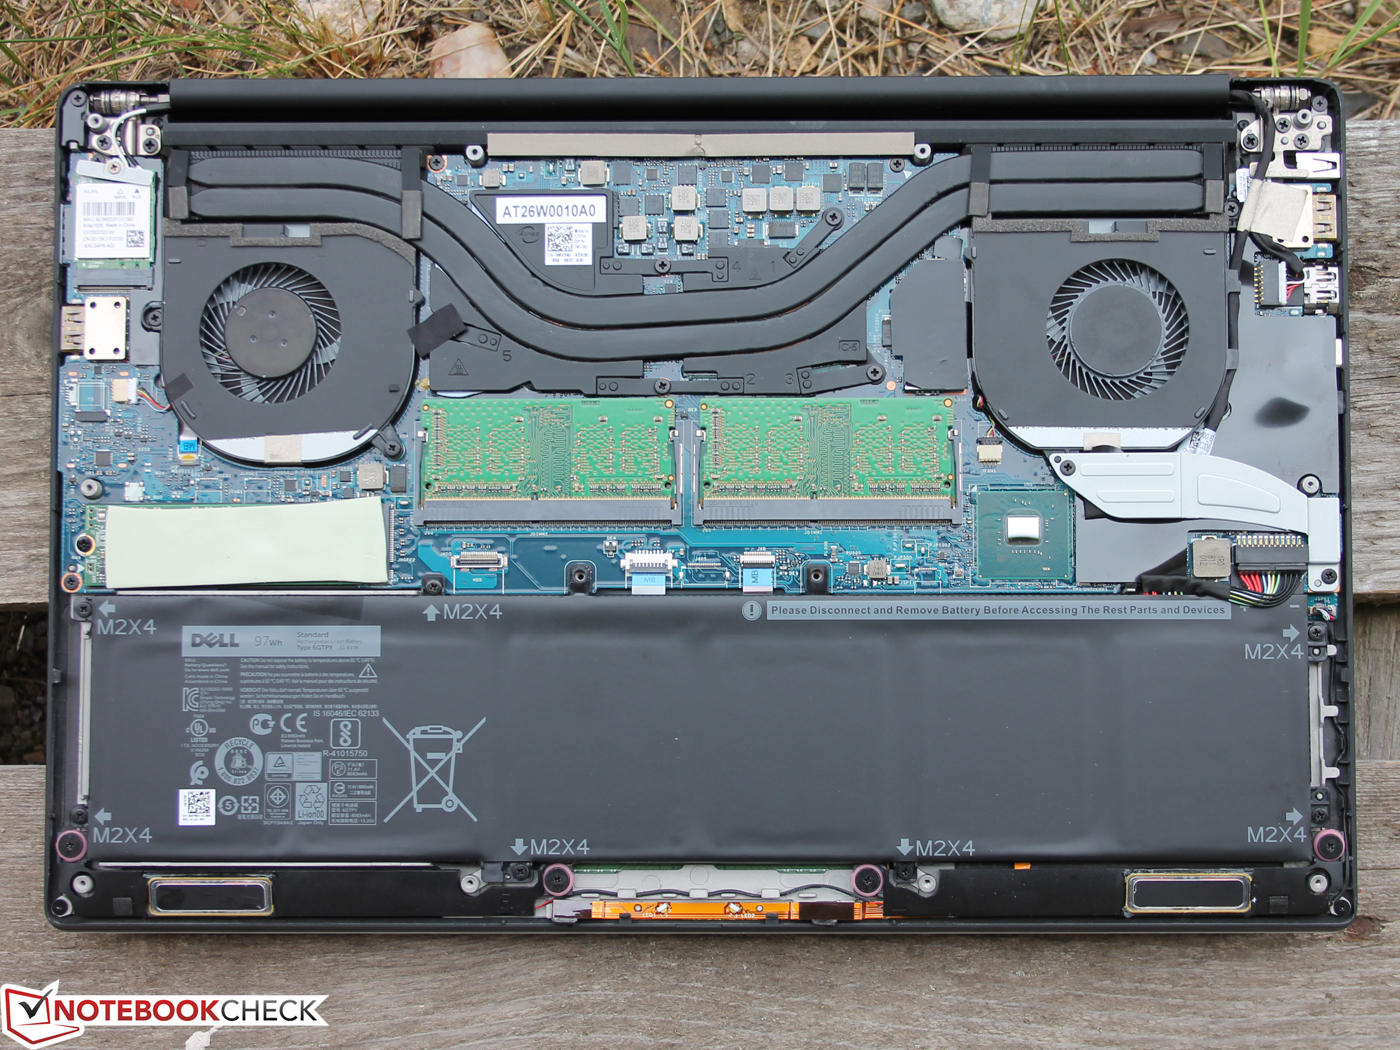
Storage Devices
Contrary to our first test model (256 GB), the 512 GB NVMe-SSD is provided by Toshiba (XG5). The Toshiba drive performs slightly better in the benchmarks and there are no major issues here. Dell uses multiple vendors, so you never know what drive you get when you order the XPS.
Our test unit is equipped with the 97 Wh battery, so the M.2-SSD is the only storage drive. SKUs with the 56 Wh battery also support an additional 2.5-inch drive. More benchmarks and comparisons are available in our comprehensive HDD/SSD list.
| Dell XPS 15 9570 i7 UHD Toshiba XG5 KXG50ZNV512G | Dell XPS 15 2018 i5 FHD 97Wh Lite-On CA3-8D256-Q11 | HP EliteBook 1050 G1-4QY20EA Toshiba XG5-P KXG50PNV2T04 | Asus ZenBook Pro 15 UX580GE Samsung SSD PM961 1TB M.2 PCIe 3.0 x4 NVMe (MZVLW1T0) | Razer Blade 15 GTX 1060 Samsung SSD PM981 MZVLB512HAJQ | Average Toshiba XG5 KXG50ZNV512G | |
|---|---|---|---|---|---|---|
| CrystalDiskMark 5.2 / 6 | -5% | -6% | 27% | 17% | 4% | |
| Write 4K (MB/s) | 79.1 | 89.4 13% | 94.8 20% | 125 58% | 97.9 24% | 114 ? 44% |
| Read 4K (MB/s) | 37.89 | 44.64 18% | 26.45 -30% | 44.68 18% | 41.32 9% | 35.6 ? -6% |
| Write Seq (MB/s) | 1119 | 830 -26% | 1037 -7% | 1059 -5% | 1594 42% | 684 ? -39% |
| Read Seq (MB/s) | 1852 | 1774 -4% | 1280 -31% | 772 -58% | 1353 -27% | 1612 ? -13% |
| Write 4K Q32T1 (MB/s) | 361.1 | 310.6 -14% | 277.6 -23% | 507 40% | 305.6 -15% | 401 ? 11% |
| Read 4K Q32T1 (MB/s) | 257.9 | 266.4 3% | 333.9 29% | 614 138% | 354.1 37% | 427 ? 66% |
| Write Seq Q32T1 (MB/s) | 1131 | 831 -27% | 1037 -8% | 1763 56% | 2033 80% | 830 ? -27% |
| Read Seq Q32T1 (MB/s) | 3096 | 2962 -4% | 3135 1% | 2171 -30% | 2543 -18% | 2950 ? -5% |

GPU Performance - GTX 1050 Ti Max-Q
Besides the integrated Intel UHD Graphics 630, which takes care of the graphics output in everyday situations, Dell also equips the XPS 15 9570 with a dedicated Nvidia GeForce GTX 1050 Ti with 4 GB GDDR5-VRAM. It is the Max-Q version, which is supposed to be more efficient. This is achieved thanks to lower clocks, which are about 200 MHz lower compared to the regular GPU version. At least in theory, because we saw a maximum core clock of 1683 MHz (Witcher 3), so the performance is basically on par with the regular GTX 1050 Ti.
This is also supported by the synthetic benchmarks, because the GTX 1050 Ti Max-Q is constantly ahead of the regular GTX 1050 Ti inside the ZenBook Pro 15. The XPS 15 with the standard GTX 1050 is between 10-20% slower depending on the test, while the GTX 1060 Max-Q of the Razer Blade is at least 50% faster.
More technical information and benchmarks for the GeForce GTX 1050 Ti Max-Q are available in our tech section.
| 3DMark 06 1024x768 Score | 34786 points | |
| 3DMark Vantage P Result | 34180 points | |
| 3DMark 11 Performance | 9414 points | |
| 3DMark Ice Storm Standard Score | 41456 points | |
| 3DMark Fire Strike Score | 6753 points | |
| 3DMark Fire Strike Extreme Score | 3431 points | |
| 3DMark Time Spy Score | 2513 points | |
Help | ||
Gaming Performance - too slow for 4K
The good performance impression continues during our gaming benchmarks, because the XPS 15 is once again ahead of the ZenBook Pro as well as the less expensive XPS 15 with the GeForce GTX 1050. The XPS 15 is a multimedia laptop and capable for occasional gaming sessions, but you cannot use the highest details in modern games. The resolution is usually also limited to 1080p, because the performance is just not sufficient for the native 4K resolution.
| low | med. | high | ultra | 4K | |
|---|---|---|---|---|---|
| BioShock Infinite (2013) | 297 | 214 | 187.8 | 74.6 | |
| The Witcher 3 (2015) | 130.9 | 87.2 | 48.2 | 26 | 17.1 |
| Rainbow Six Siege (2015) | 263.6 | 162.2 | 92.7 | 62.5 | 29.3 |
| Rise of the Tomb Raider (2016) | 99.9 | 73.6 | 47.3 | 39.9 | 16.8 |
| The Division (2016) | 114.2 | 83.4 | 42.5 | 34.8 | 15.7 |
| Battlefield 1 (2016) | 89.5 | 85.2 | 51.7 | 49.8 | 21.1 |
| For Honor (2017) | 113.6 | 63.8 | 65.5 | 49.5 | 19.2 |
| Ghost Recon Wildlands (2017) | 68.6 | 42.7 | 40 | 23.4 | 14.5 |
| Assassin´s Creed Origins (2017) | 58 | 41 | 33 | 27 | 13 |
| Star Wars Battlefront 2 (2017) | 92.3 | 42 | 34.3 | 30.4 | |
| Far Cry 5 (2018) | 91 | 48 | 44 | 38 | 13 |
| The Crew 2 (2018) | 60 | 49.1 | 45.3 | 42 | 14 |
Emissions
System Noise - Coil whine
We start with the bad news: Our test unit produces occasional coil whine at 30.7 dB(A), which is quite annoying. The fans are otherwise not particularly obtrusive. Our measurements for the two XPS 15 models are almost identical for idling and medium workloads, but the maximum noise under load (both stress test and Witcher 3) is a bit lower at 40.4 dB(A). The faster XPS 15 is therefore a bit quieter than the base model and Dell stays within the specification for Max-Q GPUs (40 dB(A)) during gaming. The pulsating fan under medium workloads is a bit annoying as well.
Noise level
| Idle |
| 29.9 / 29.9 / 30.3 dB(A) |
| Load |
| 36.5 / 40.4 dB(A) |
 | ||
30 dB silent 40 dB(A) audible 50 dB(A) loud |
||
min: | ||
| Dell XPS 15 9570 i7 UHD GeForce GTX 1050 Ti Max-Q, i7-8750H, Toshiba XG5 KXG50ZNV512G | Dell XPS 15 2018 i5 FHD 97Wh GeForce GTX 1050 Mobile, i5-8300H, Lite-On CA3-8D256-Q11 | Apple MacBook Pro 15 2018 (2.6 GHz, 560X) Radeon Pro 560X, i7-8850H, Apple SSD AP0512 | HP EliteBook 1050 G1-4QY20EA GeForce GTX 1050 Max-Q, i7-8750H, Toshiba XG5-P KXG50PNV2T04 | Asus ZenBook Pro 15 UX580GE GeForce GTX 1050 Ti Mobile, i9-8950HK, Samsung SSD PM961 1TB M.2 PCIe 3.0 x4 NVMe (MZVLW1T0) | Razer Blade 15 GTX 1060 GeForce GTX 1060 Max-Q, i7-8750H, Samsung SSD PM981 MZVLB512HAJQ | Dell XPS 15 9560 (i7-7700HQ, UHD) GeForce GTX 1050 Mobile, i7-7700HQ, Lite-On CX2-8B512-Q11 | |
|---|---|---|---|---|---|---|---|
| Noise | -3% | -5% | -6% | -4% | -7% | -10% | |
| off / environment * (dB) | 29.9 | 30.3 -1% | 29.6 1% | 30.25 -1% | 28 6% | 28.1 6% | 28.4 5% |
| Idle Minimum * (dB) | 29.9 | 30.3 -1% | 30.1 -1% | 30.25 -1% | 28.6 4% | 28.1 6% | 29 3% |
| Idle Average * (dB) | 29.9 | 30.3 -1% | 30.1 -1% | 30.25 -1% | 29.9 -0% | 33 -10% | 29 3% |
| Idle Maximum * (dB) | 30.3 | 30.3 -0% | 30.1 1% | 31.8 -5% | 30.5 -1% | 33.5 -11% | 32.2 -6% |
| Load Average * (dB) | 36.5 | 37.1 -2% | 46.8 -28% | 44.7 -22% | 42.5 -16% | 42.2 -16% | 47.1 -29% |
| Witcher 3 ultra * (dB) | 40.4 | 43.3 -7% | 36 11% | 44.8 -11% | 45.3 -12% | 52 -29% | |
| Load Maximum * (dB) | 40.4 | 43 -6% | 46.8 -16% | 42 -4% | 44.8 -11% | 45.7 -13% | 47.1 -17% |
* ... smaller is better
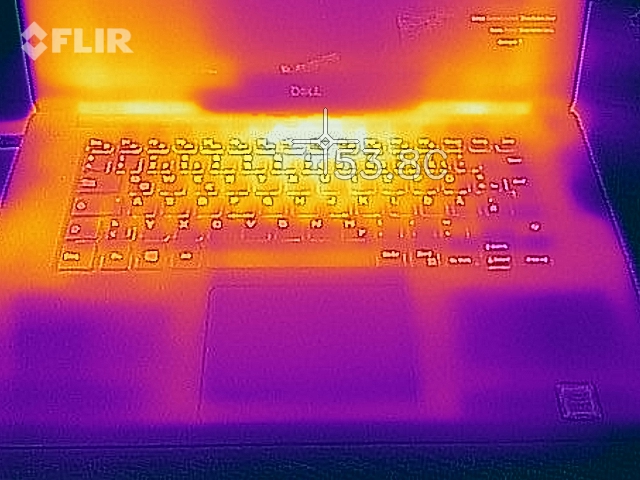
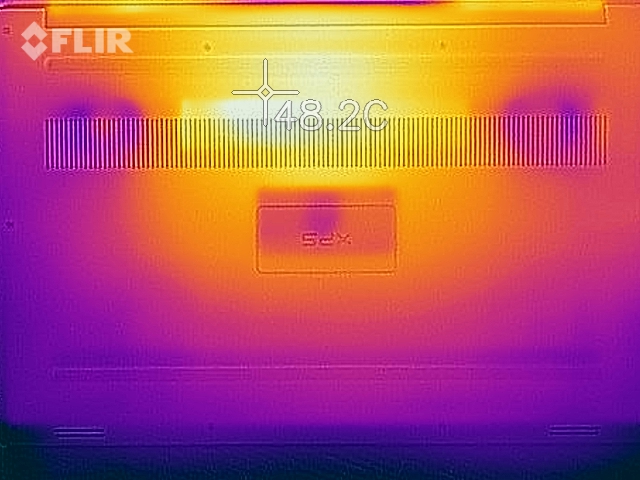
Temperature
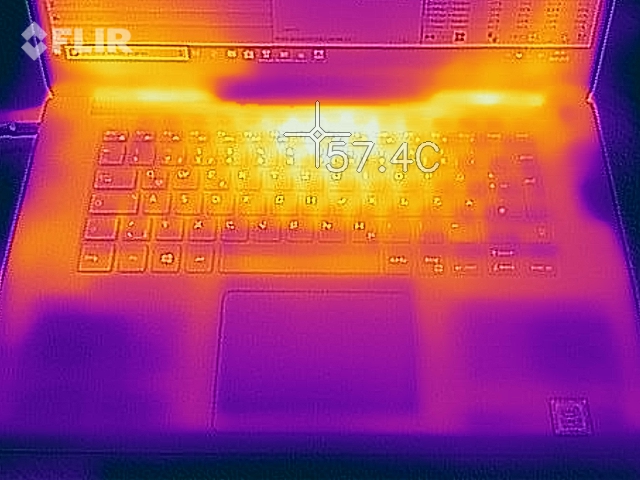
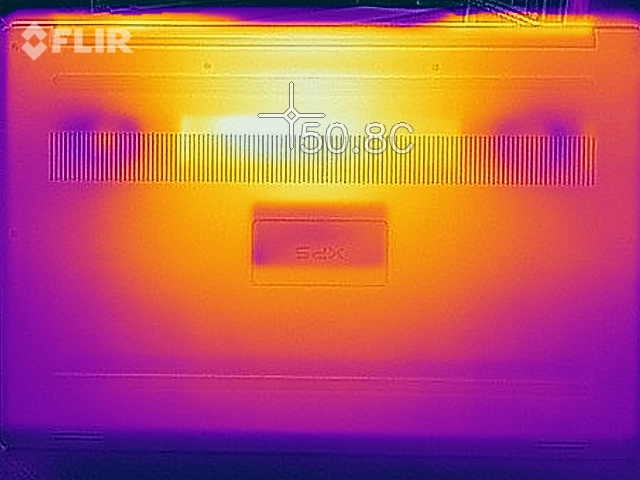
The fans are spinning a bit slower compared to the base model, so the XPS 15 with the i7 and the GTX 1050 Ti Max-Q gets a bit warmer. The surface temperatures of the two XPS 15 models are very similar, but the ambient temperature was higher during our first review. Especially the rear center area of the base unit warms up, which is also perceptible. The bottom side stays a few degrees cooler, but you should not use it on your lap in this case.
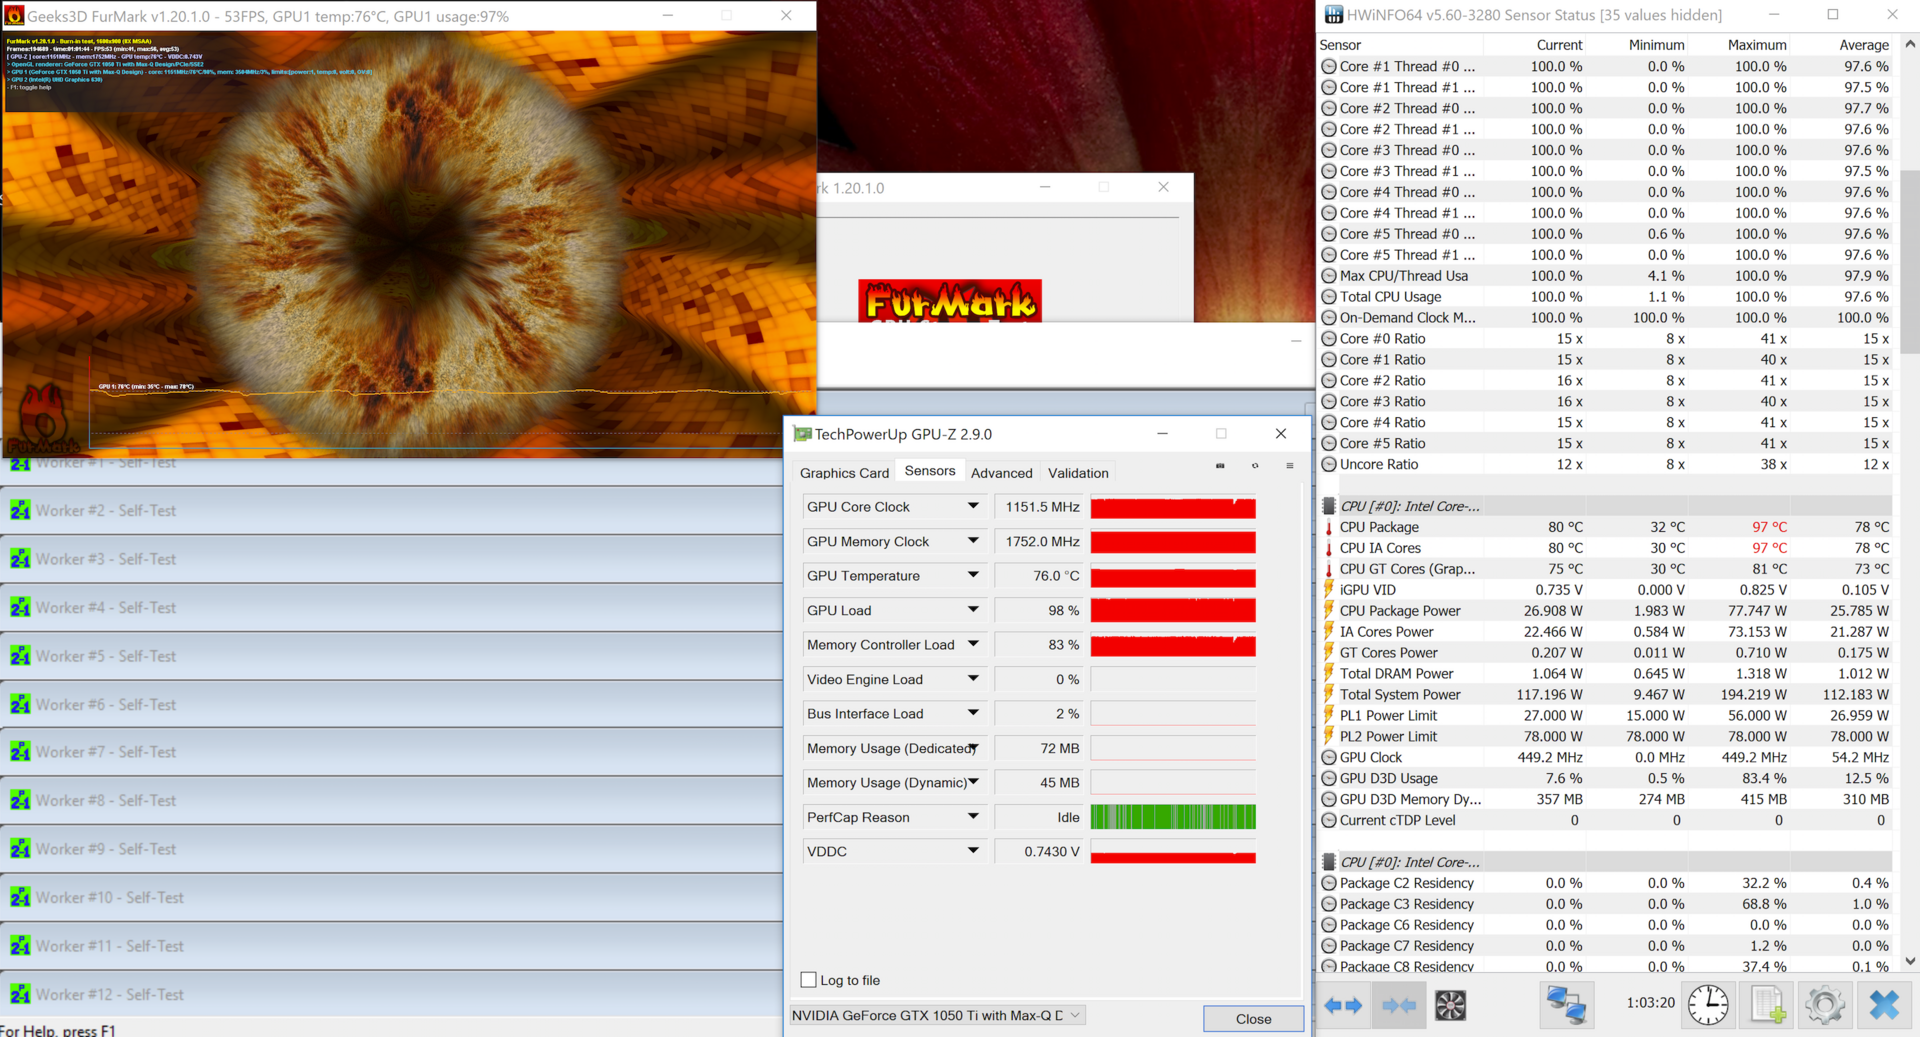
A look at the processor and the graphics card shows that the cooling solution cannot maintain maximum clocks for both components. The processor only runs at 1.5-1.6 GHz and the graphics card at around 1150 MHz during the stress test. However, especially the CPU load is lower when you play games and we could not detect performance drops in this scenario. A 3DMark 11 run immediately after the stress test did not result in a lower result, either.
(-) The maximum temperature on the upper side is 55.7 °C / 132 F, compared to the average of 36.8 °C / 98 F, ranging from 21 to 71 °C for the class Multimedia.
(-) The bottom heats up to a maximum of 48.5 °C / 119 F, compared to the average of 39.1 °C / 102 F
(+) In idle usage, the average temperature for the upper side is 24.1 °C / 75 F, compared to the device average of 31.3 °C / 88 F.
(±) Playing The Witcher 3, the average temperature for the upper side is 38 °C / 100 F, compared to the device average of 31.3 °C / 88 F.
(+) The palmrests and touchpad are reaching skin temperature as a maximum (34.6 °C / 94.3 F) and are therefore not hot.
(-) The average temperature of the palmrest area of similar devices was 28.7 °C / 83.7 F (-5.9 °C / -10.6 F).
Energy Management - 4K consumes a lot of power
Power Consumption
The high-resolution display increases the power consumption significantly, because the idle consumption at the highest luminance is more than doubled compared to the 1080p unit. You will also notice the more powerful components when you start to stress the system. We measure about 90 watts in the first scene of 3DMark 06 and up to 134.4 watts at the beginning of the stress test, but this value drops over the course of the test and eventually levels off at about 110 watts. The 130W PSU is therefore still sufficient.
| Off / Standby | |
| Idle | |
| Load |
|
Key:
min: | |
| Dell XPS 15 9570 i7 UHD i7-8750H, GeForce GTX 1050 Ti Max-Q, Toshiba XG5 KXG50ZNV512G, IPS, 3840x2160, 15.6" | Dell XPS 15 2018 i5 FHD 97Wh i5-8300H, GeForce GTX 1050 Mobile, Lite-On CA3-8D256-Q11, LED IGZO IPS InfinityEdge, 1920x1080, 15.6" | Apple MacBook Pro 15 2018 (2.6 GHz, 560X) i7-8850H, Radeon Pro 560X, Apple SSD AP0512, IPS, 2880x1800, 15.4" | HP EliteBook 1050 G1-4QY20EA i7-8750H, GeForce GTX 1050 Max-Q, Toshiba XG5-P KXG50PNV2T04, IPS LED, 3840x2160, 15.6" | Asus ZenBook Pro 15 UX580GE i9-8950HK, GeForce GTX 1050 Ti Mobile, Samsung SSD PM961 1TB M.2 PCIe 3.0 x4 NVMe (MZVLW1T0), IPS, 3840x2160, 15.6" | Razer Blade 15 GTX 1060 i7-8750H, GeForce GTX 1060 Max-Q, Samsung SSD PM981 MZVLB512HAJQ, IPS, 1920x1080, 15.6" | Average NVIDIA GeForce GTX 1050 Ti Max-Q | Average of class Multimedia | |
|---|---|---|---|---|---|---|---|---|
| Power Consumption | 45% | 31% | 23% | -13% | -19% | 20% | 30% | |
| Idle Minimum * (Watt) | 9.48 | 2.9 69% | 3.4 64% | 6.1 36% | 11.7 -23% | 14.9 -57% | 5.8 ? 39% | 5.62 ? 41% |
| Idle Average * (Watt) | 16.1 | 5.8 64% | 11 32% | 10.2 37% | 18.5 -15% | 17.5 -9% | 11.2 ? 30% | 10.2 ? 37% |
| Idle Maximum * (Watt) | 16.9 | 7.5 56% | 14.9 12% | 13.4 21% | 22.8 -35% | 19.2 -14% | 13.5 ? 20% | 12.5 ? 26% |
| Load Average * (Watt) | 90.8 | 77.5 15% | 78.9 13% | 82 10% | 97.5 -7% | 103.2 -14% | 86.9 ? 4% | 65 ? 28% |
| Load Maximum * (Watt) | 134.4 | 107 20% | 91.2 32% | 122 9% | 111.1 17% | 132.7 1% | 122.4 ? 9% | 111.9 ? 17% |
| Witcher 3 ultra * (Watt) | 84 | 102.9 | 123.1 |
* ... smaller is better
Battery Runtime
We are not surprised that the battery runtimes are worse compared to the entry-level SKU with the 1080p screen. Our WLAN test at an adjusted luminance of 150 nits runs for ~9.5 hours, which is not a bad result for a 15-inch laptop with a 4K screen. However, the 1080p XPS 15 manages 6 hours more. The video runtime (also tested at 150 nits) is more than 12 hours. You can expect around one hour when you really stress the system.
The XPS 15 does not support a special quick-charge feature. It takes about 2.5 hours before the 97 Wh battery is fully charged again.
| Dell XPS 15 9570 i7 UHD i7-8750H, GeForce GTX 1050 Ti Max-Q, 97 Wh | Dell XPS 15 2018 i5 FHD 97Wh i5-8300H, GeForce GTX 1050 Mobile, 97 Wh | Apple MacBook Pro 15 2018 (2.6 GHz, 560X) i7-8850H, Radeon Pro 560X, 83 Wh | HP EliteBook 1050 G1-4QY20EA i7-8750H, GeForce GTX 1050 Max-Q, 96 Wh | Asus ZenBook Pro 15 UX580GE i9-8950HK, GeForce GTX 1050 Ti Mobile, 71 Wh | Razer Blade 15 GTX 1060 i7-8750H, GeForce GTX 1060 Max-Q, 80 Wh | Average of class Multimedia | |
|---|---|---|---|---|---|---|---|
| Battery runtime | 37% | 17% | 11% | -17% | -30% | 31% | |
| H.264 (h) | 12.3 | 11.7 -5% | 9.7 -21% | 16.8 ? 37% | |||
| WiFi v1.3 (h) | 9.6 | 15.7 64% | 10.2 6% | 8.7 -9% | 6.3 -34% | 6.7 -30% | 12.3 ? 28% |
| Witcher 3 ultra (h) | 1 | 1 0% | 1.5 50% | ||||
| Load (h) | 1.3 | 1.9 46% | 2.1 62% | 1.3 0% | 1.645 ? 27% |
Verdict - More performance, but less stamina
Pros
Cons
More CPU cores, faster graphics, and more pixels – is the more expensive spec of the XPS 15 9570 the better choice? No, at least not for every user. The good performance utilization of the CPU and GPU is definitely a positive aspect, which is not always the case with slim devices. You can also optimize the CPU performance even further, so the Core i7 option is a no-brainer if you need a lot of CPU power. The choice of the GPU is not that hard, either, because the GeForce GTX 1050 Ti Max-Q is a bit faster and provides more headroom for the future.
The display choice is a bigger problem. The optional 4K UHD touchscreen is a bit brighter and supports touch inputs (whether this is an advantage comes down to your personal preference), but it is glossy and we are surprised about the high color deviations, which are only slightly improved by a calibration. The 4K screen is therefore not the best choice for picture/video editing. It also increases the weight a bit and consumes much more power, so the battery runtime is much shorter. About 9.5 hours is not bad for a 15-inch system, but the XPS 15 with the matte 1080p screen lasts much longer. The other measurements of the 1080p screen (brightness, contrast, etc.) are also good, so the less expensive version is probably the better choice for many users.
The additional performance of the processor and the graphics card is definitely an advantage, but the optional 4K touchscreen leaves mixed impressions. It consumes a lot of power and massive color deviations prevent a better score.
Our test model also suffered from coil whine and the fans tend to pulsate during medium workloads. Overall, this XPS 15 SKU is still a very good multimedia laptop, but the base model was a more balanced package and got a higher overall score as a result. The best configuration is probably the FHD screen in combination with the Core i7 and the GTX 1050 Ti. We will have a separate review of the Core i9 model and check whether it is worth the additional price.
Dell XPS 15 9570 i7 UHD
- 09/17/2018 v6 (old)
Andreas Osthoff
Price comparison
