Dell XPS 15 9570 (i9-8950HK, 4K UHD, GTX 1050 Ti Max-Q) Laptop Review
The XPS 15 is Dell's premier consumer laptop and it carries premier hardware to back it all up. While 15-inch laptops aren't uncommon, the XPS 15 is special for being so thin and compact while offering Core i9, discrete Nvidia graphics, and 4K touchscreen options all in one.
Our test unit today represents the highest-end configuration that the XPS 15 9570 has to offer and we're especially excited to see how it performs when compared to the lower-end Core i5 and i7 SKUs. We recommend checking out our existing reviews on the XPS 15 for more information on the chassis, display, and its features since the visual design of the XPS 15 9570 has remained essentially unchanged since the XPS 15 9550 days. Our review here will instead focus on the CPU and its supposed advantages over the Core i7 alternative.
More Dell XPS 15 reviews:
Case
| SD Card Reader | |
| average JPG Copy Test (av. of 3 runs) | |
| Lenovo ThinkPad X1 Extreme-20MF000XGE (Toshiba Exceria Pro SDXC 64 GB UHS-II) | |
| Dell XPS 15 9570 Core i9 UHD (Toshiba Exceria Pro SDXC 64 GB UHS-II) | |
| HP Spectre x360 15-ch011nr (Toshiba Exceria Pro SDXC 64 GB UHS-II) | |
| Dell XPS 15 9575 i7-8705G (Toshiba Exceria Pro M501 UHS-II) | |
| Asus ZenBook Pro 15 UX580GE (Toshiba Exceria Pro M501 UHS-II) | |
| maximum AS SSD Seq Read Test (1GB) | |
| Lenovo ThinkPad X1 Extreme-20MF000XGE (Toshiba Exceria Pro SDXC 64 GB UHS-II) | |
| HP Spectre x360 15-ch011nr (Toshiba Exceria Pro SDXC 64 GB UHS-II) | |
| Dell XPS 15 9570 Core i9 UHD (Toshiba Exceria Pro SDXC 64 GB UHS-II) | |
| Dell XPS 15 9575 i7-8705G (Toshiba Exceria Pro M501 UHS-II) | |
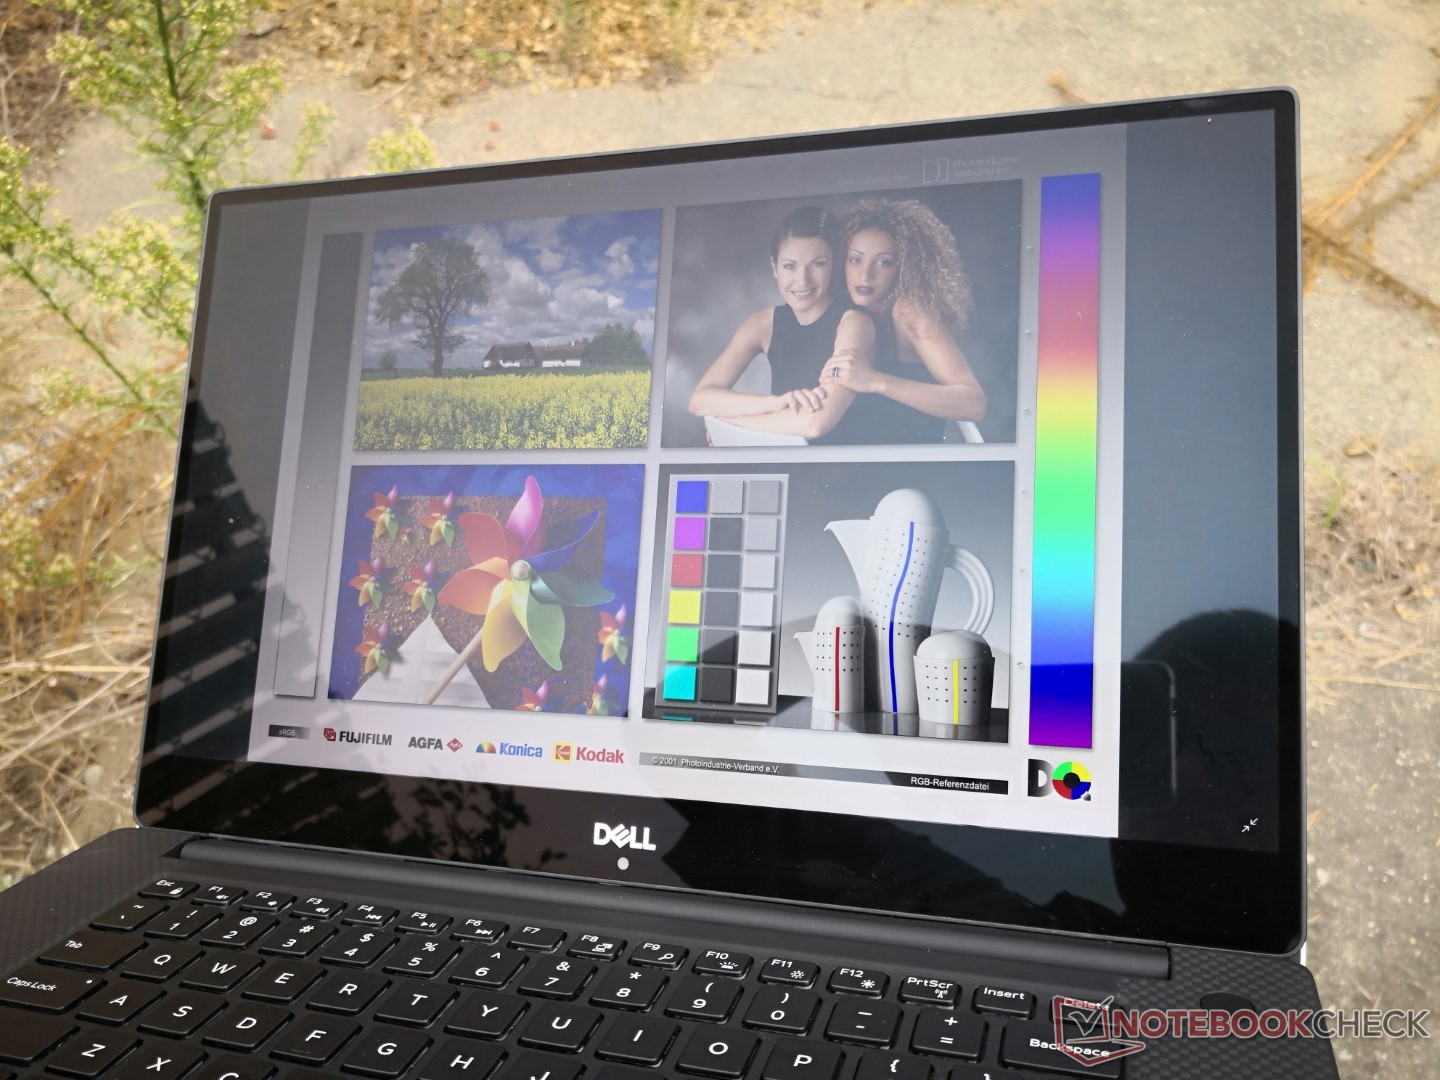
Display
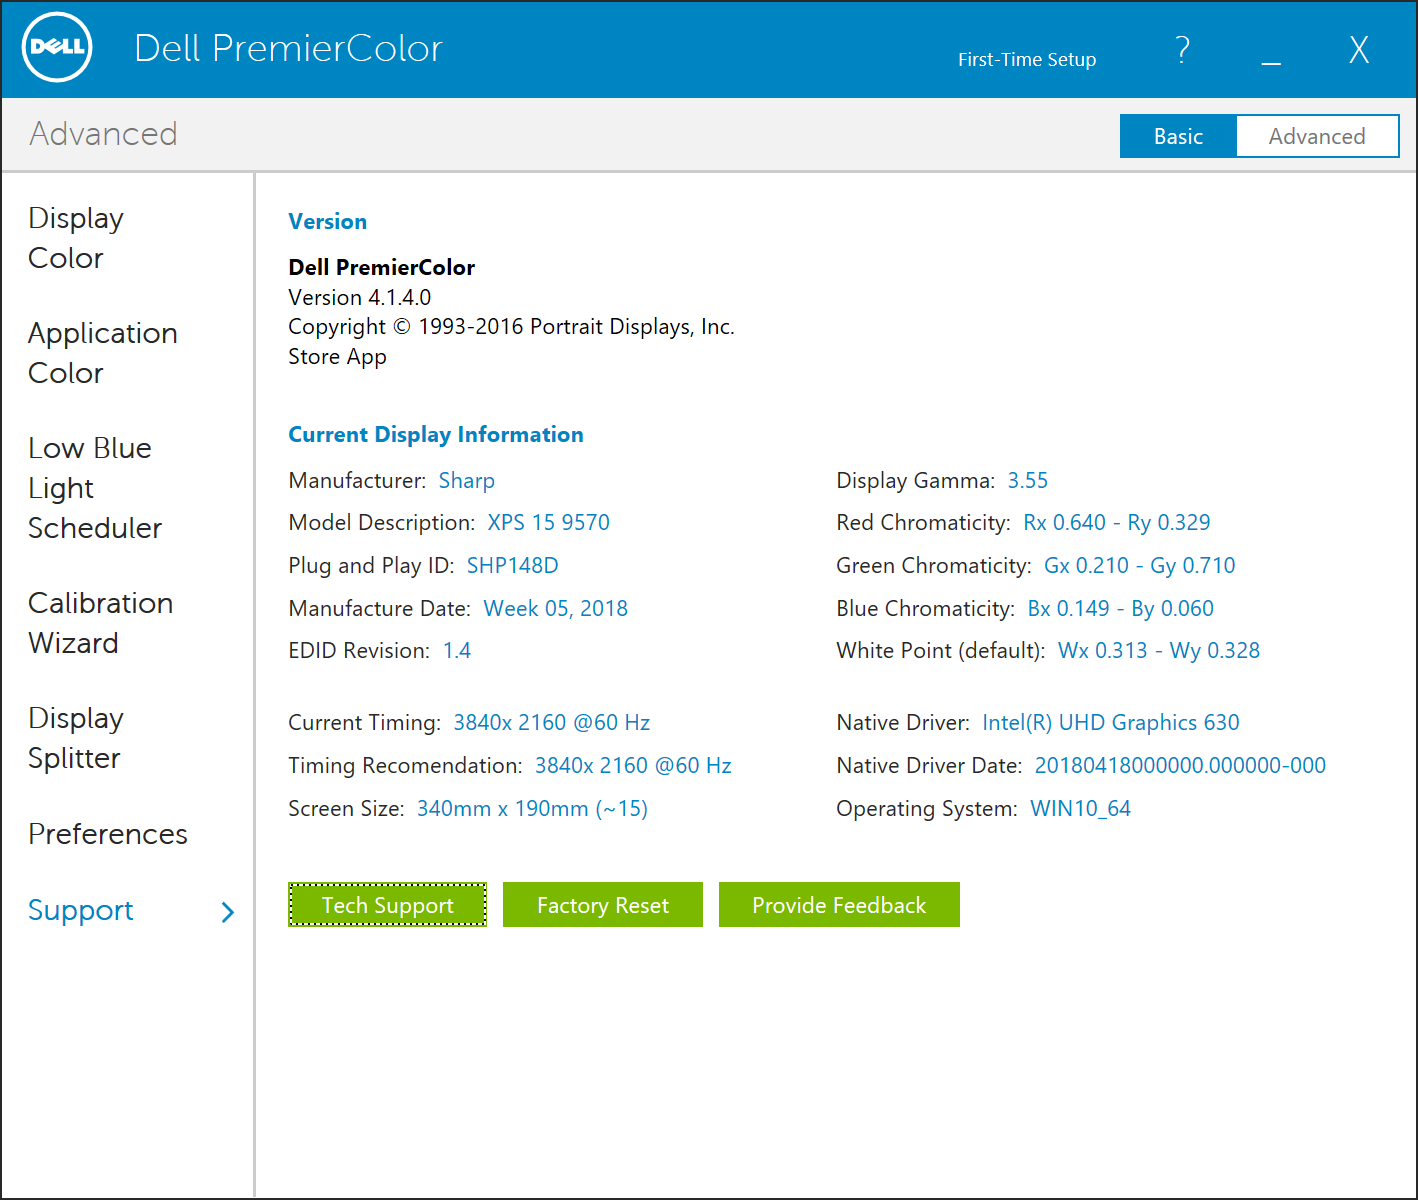
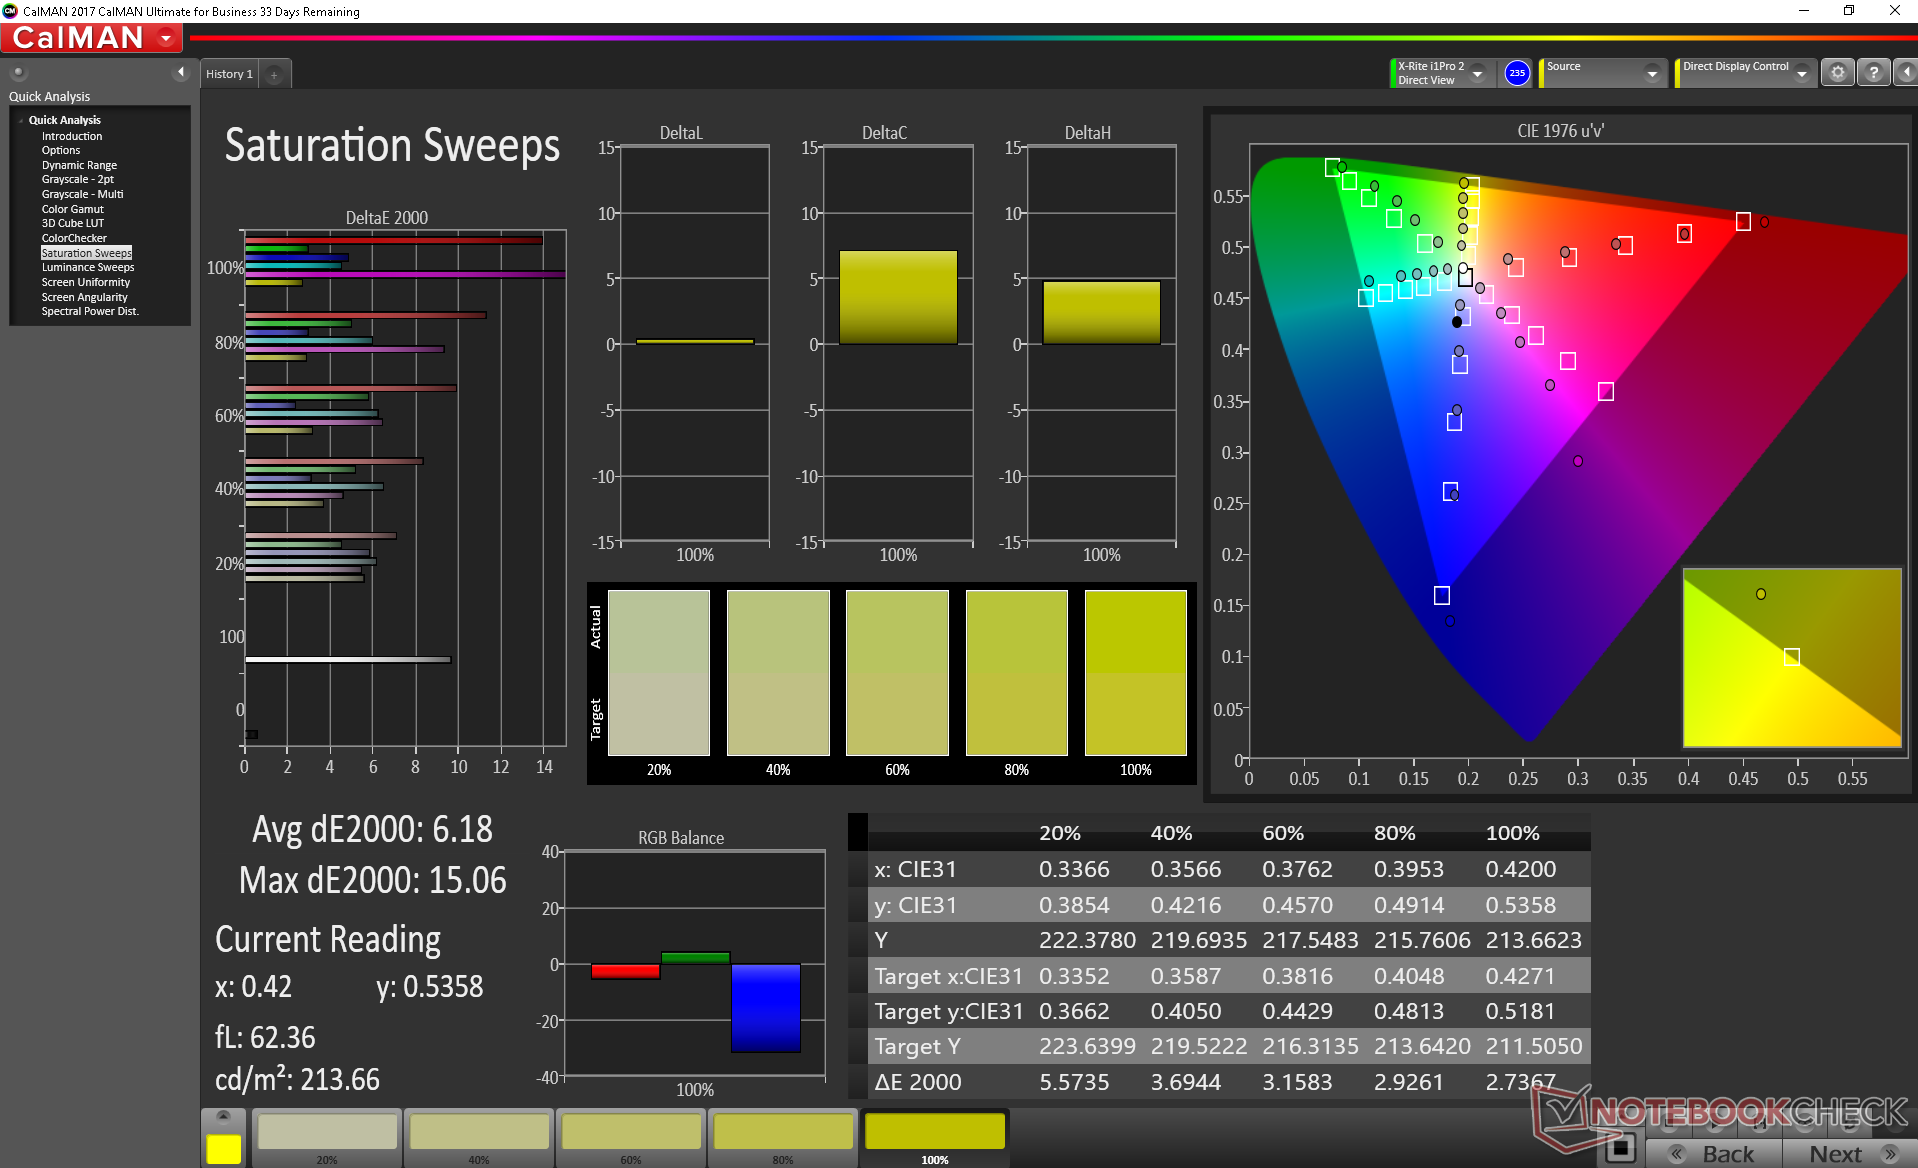
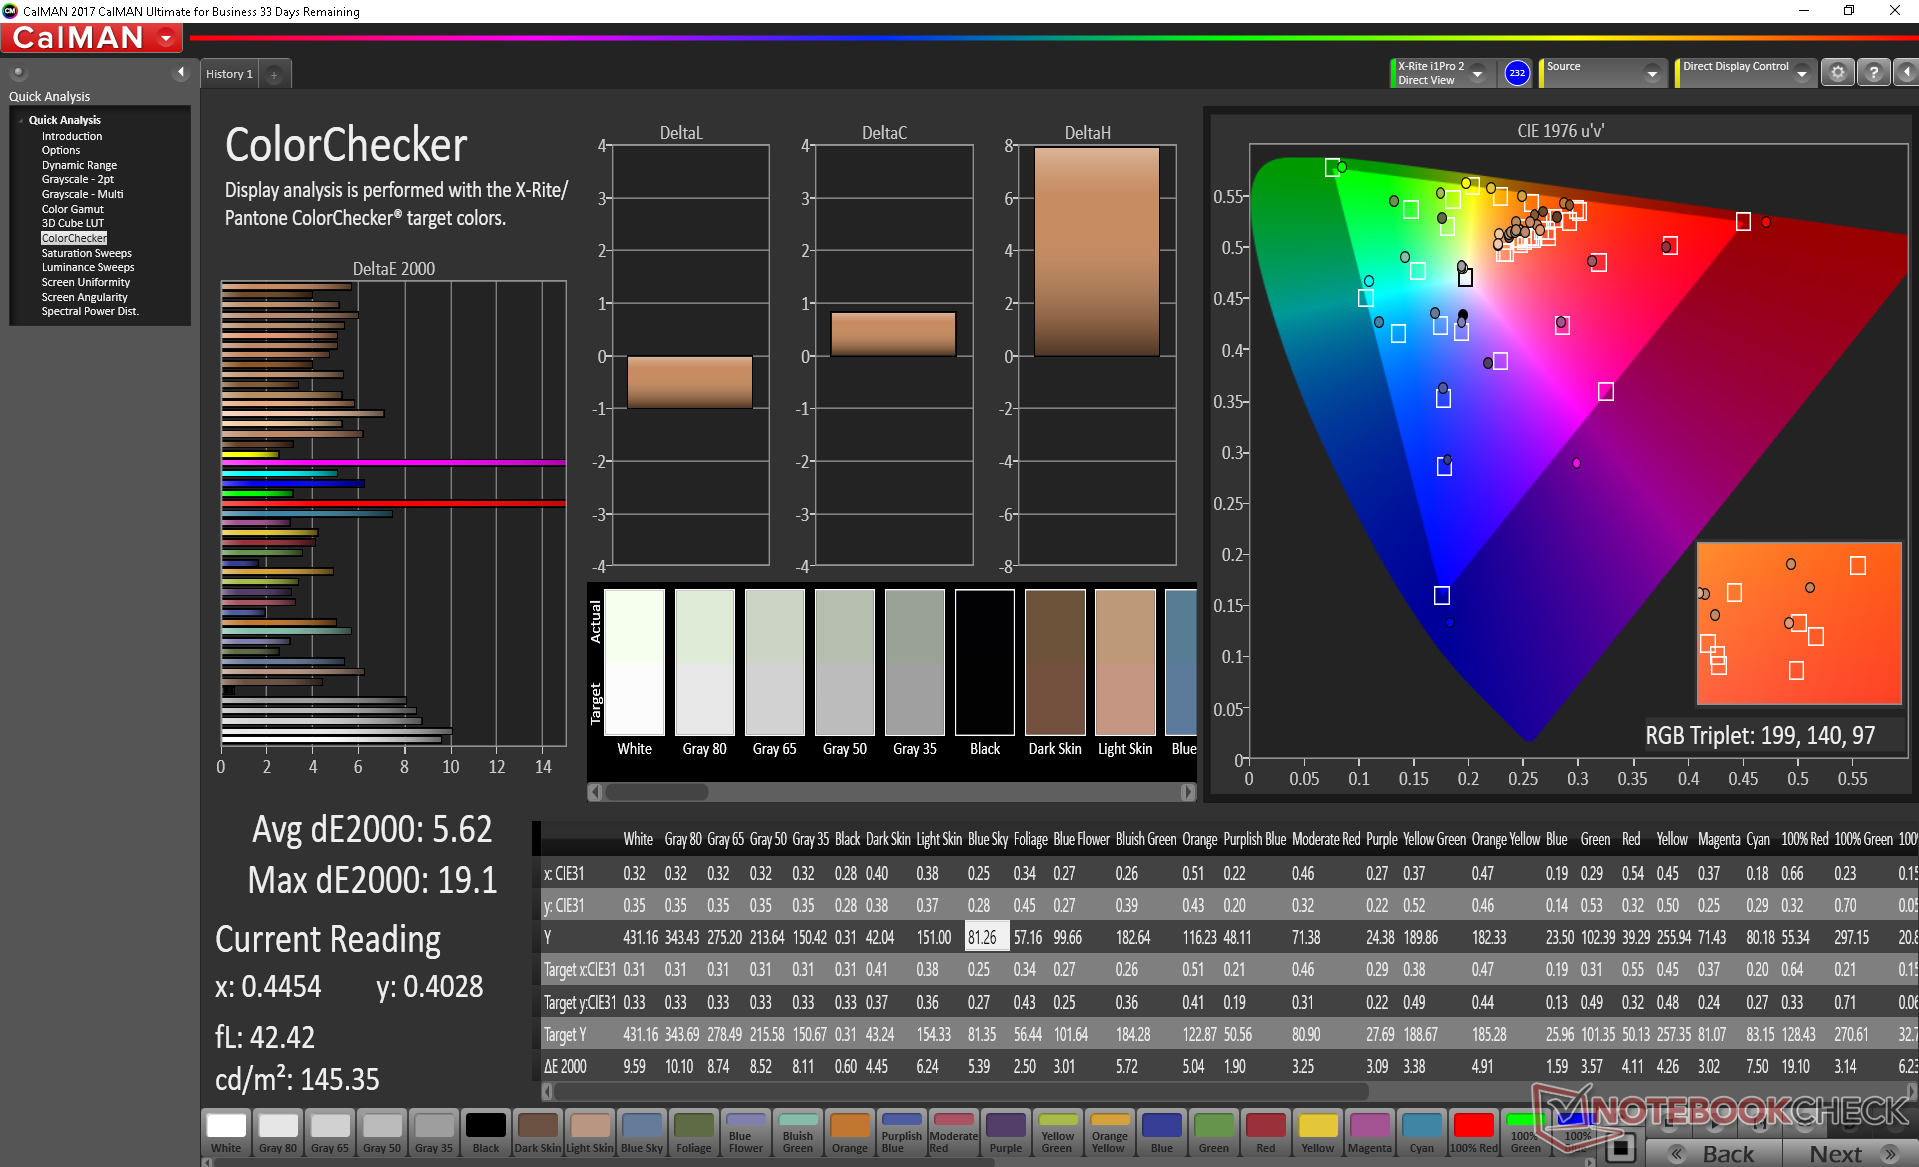
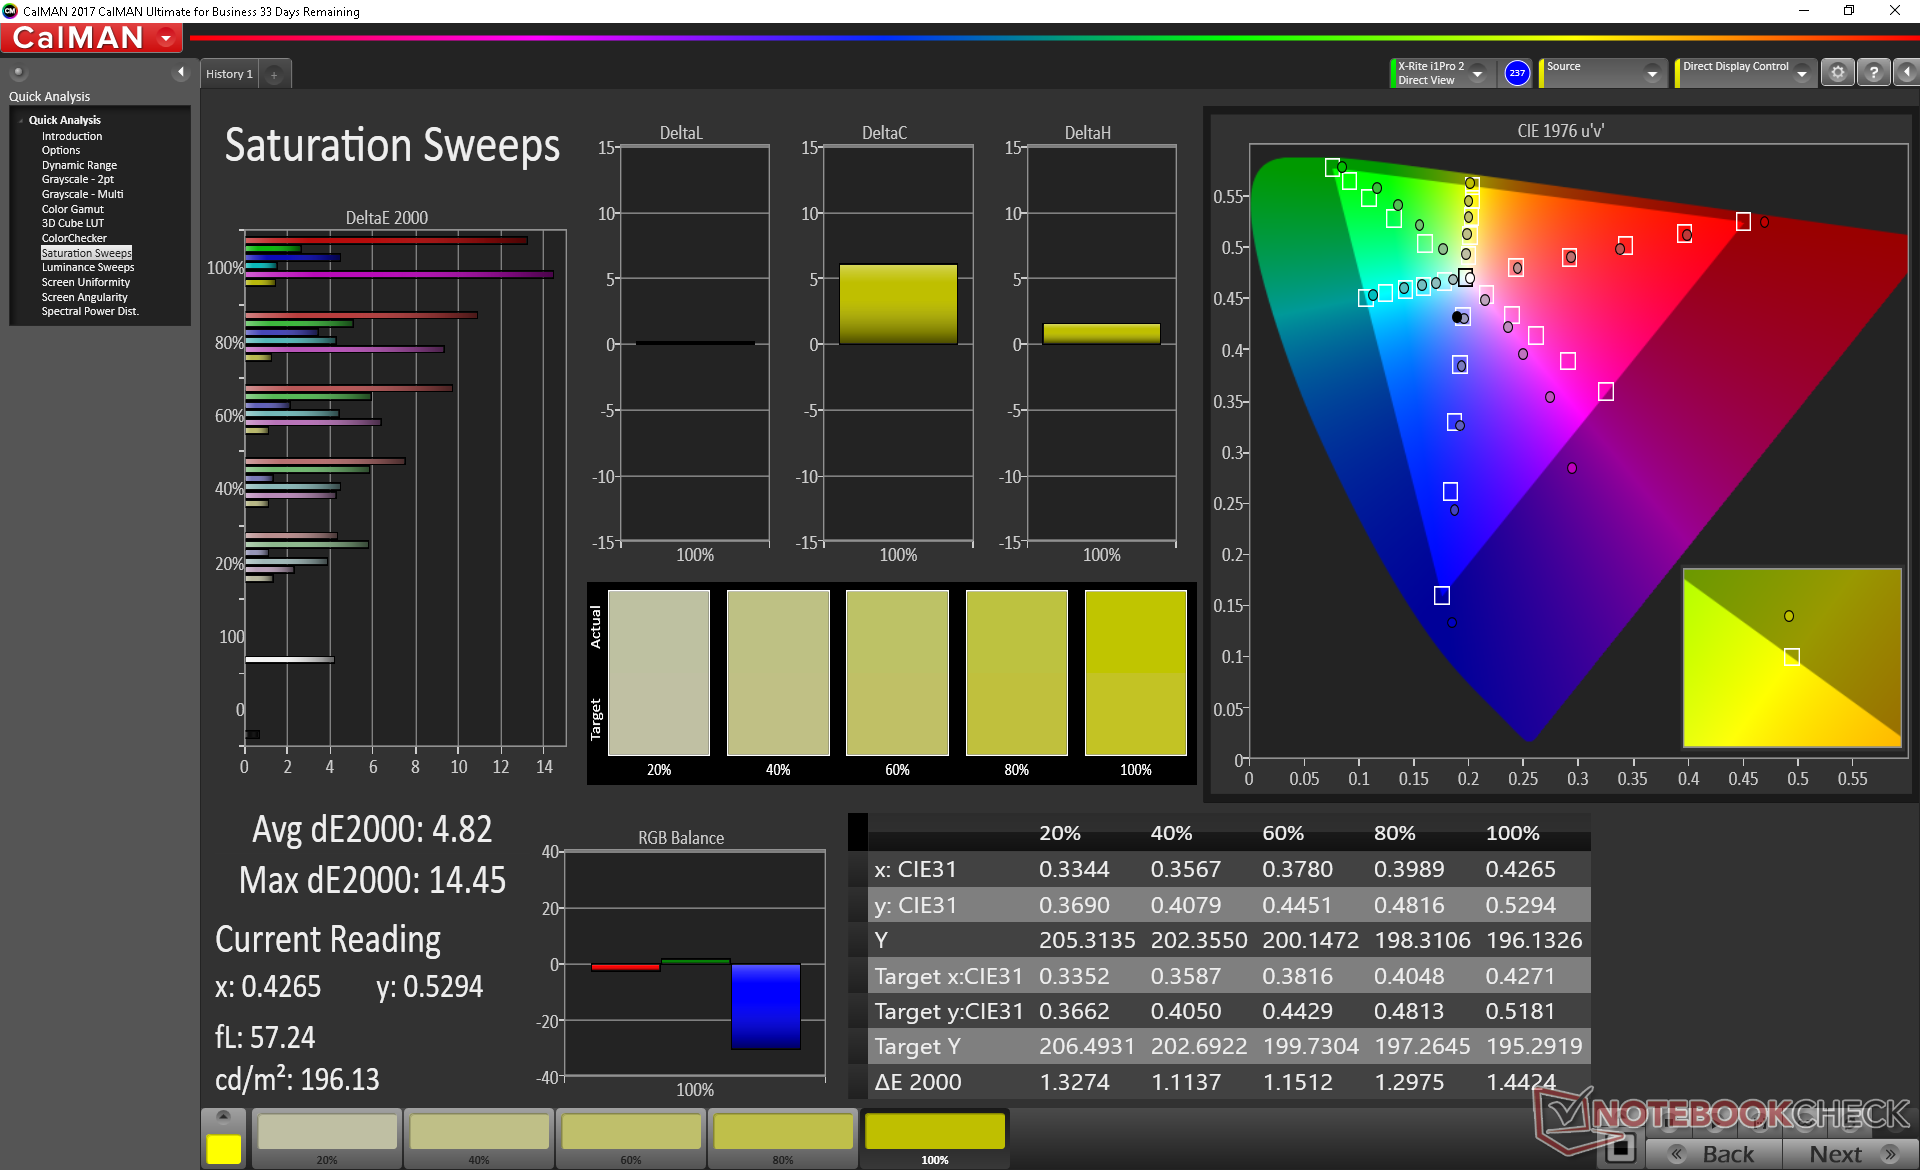
Dell utilizes the same 4K UHD LQ156D1 panel from Sharp across its XPS 15 9570 SKUs. Consequently, characteristics like response times, contrast, pulse-width modulation, and color coverage between our 4K i7 SKU and 4K i9 SKU are very similar between them. This unfortunately includes the inaccurate representation of Red and Violet colors yet again despite the otherwise deep colors and crisp text. Maximum brightness continues to be brighter than most other competing 15-inch laptops save for the notable exception of the MacBook Pro 15.
Slight backlight bleeding is present along the bottom edge of the screen on our unit. It's largely unnoticeable even during movie playback.

| |||||||||||||||||||||||||
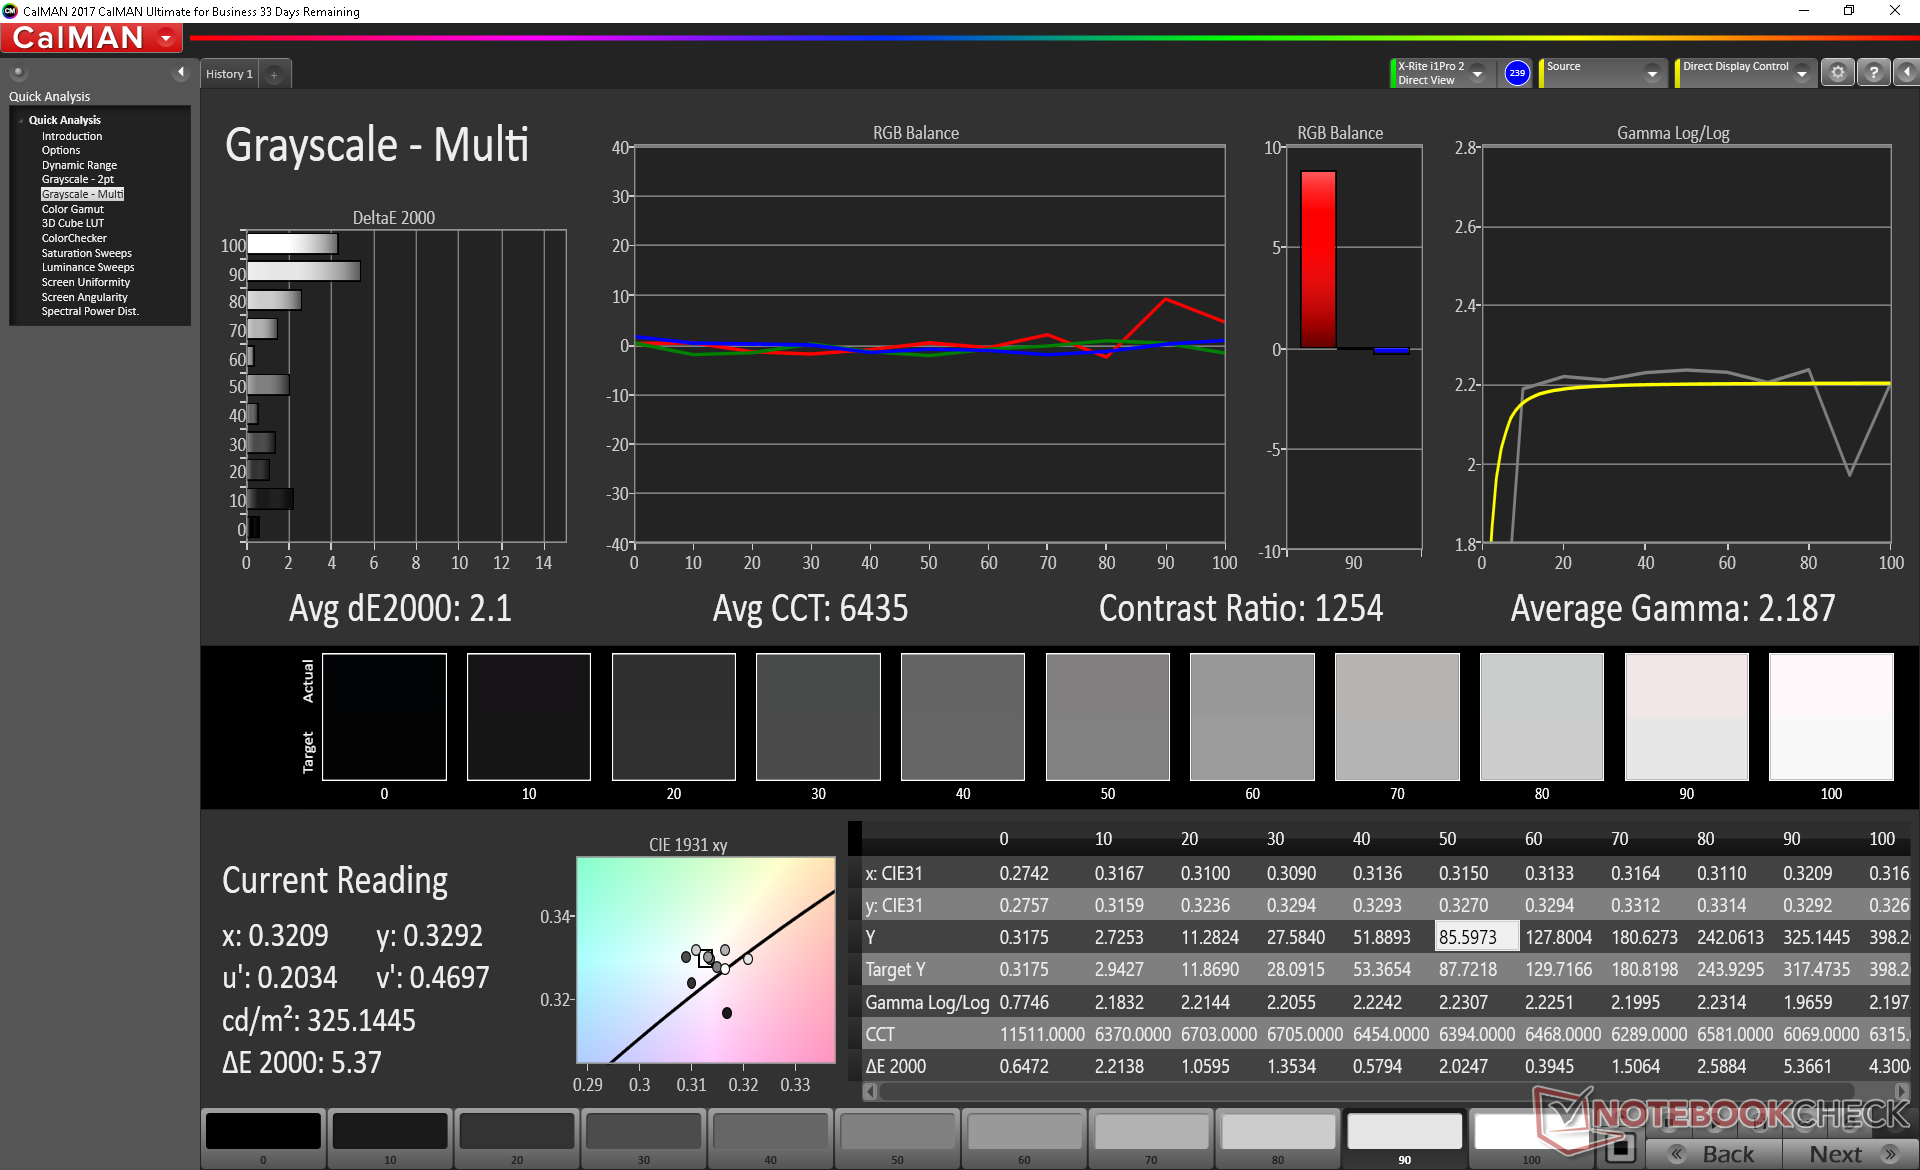
Brightness Distribution: 81 %
Center on Battery: 430.4 cd/m²
Contrast: 1255:1 (Black: 0.36 cd/m²)
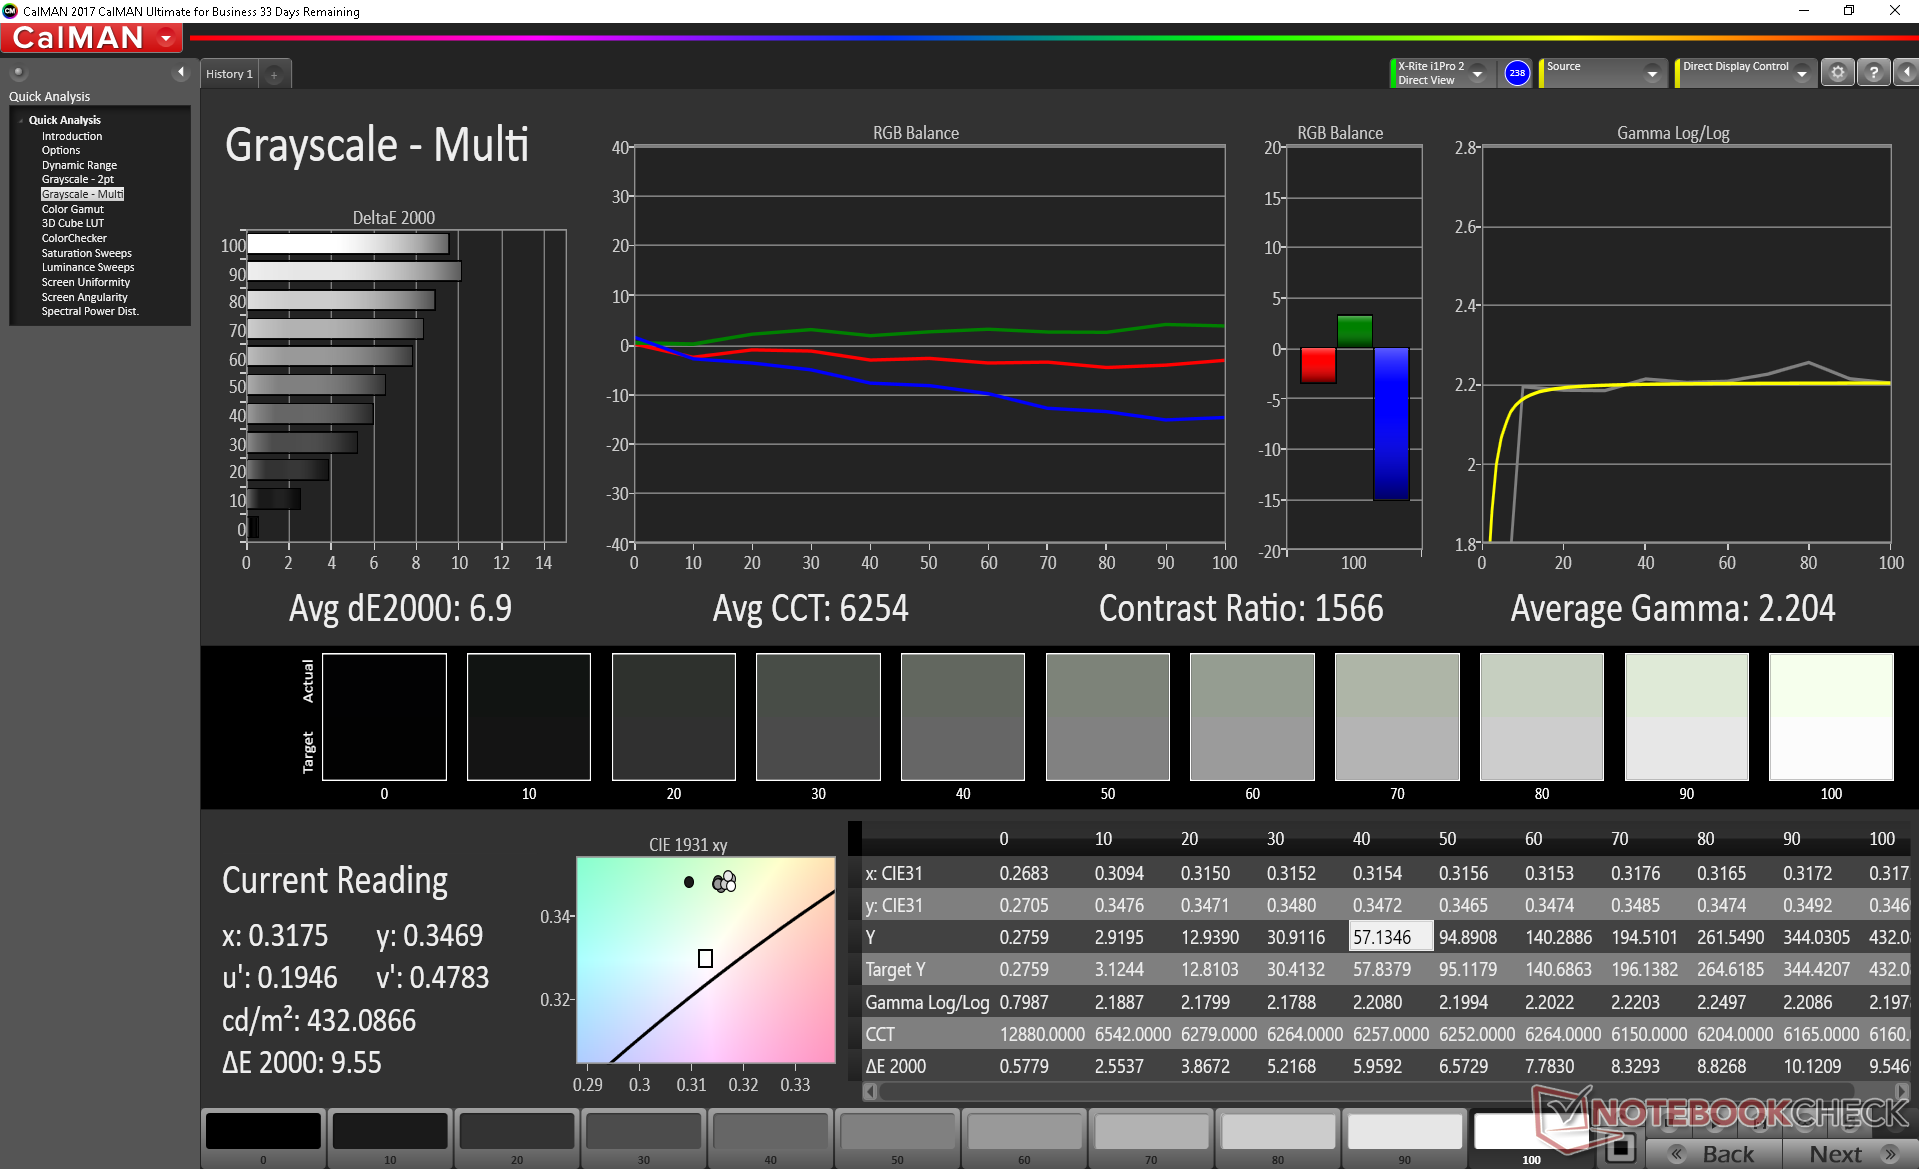
ΔE ColorChecker Calman: 5.62 | ∀{0.5-29.43 Ø4.71}
calibrated: 2.69
ΔE Greyscale Calman: 6.9 | ∀{0.09-98 Ø4.96}
98.5% sRGB (Argyll 1.6.3 3D)
71.8% AdobeRGB 1998 (Argyll 1.6.3 3D)
79.7% AdobeRGB 1998 (Argyll 3D)
98.4% sRGB (Argyll 3D)
79.6% Display P3 (Argyll 3D)
Gamma: 2.2
CCT: 6254 K
| Dell XPS 15 9570 Core i9 UHD LQ156D1, IPS, 15.6", 3840x2160 | Asus ZenBook Pro 15 UX580GE AU Optronics B156ZAN03.1, IPS, 15.6", 3840x2160 | Lenovo ThinkPad X1 Extreme-20MF000XGE B156ZAN03.2, IPS, 15.6", 3840x2160 | Dell XPS 15 9575 i7-8705G Sharp SHP148D, IPS, 15.6", 3840x2160 | HP Spectre x360 15-ch011nr BOE0730, IPS, 15.6", 3840x2160 | Razer Blade 15 Base Model BOE NV156FHM-N61, IPS, 15.6", 1920x1080 | |
|---|---|---|---|---|---|---|
| Display | 11% | 12% | -1% | -13% | -17% | |
| Display P3 Coverage (%) | 79.6 | 85.9 8% | 86.3 8% | 78.7 -1% | 68.5 -14% | 66.3 -17% |
| sRGB Coverage (%) | 98.4 | 100 2% | 100 2% | 97.9 -1% | 90.7 -8% | 86.6 -12% |
| AdobeRGB 1998 Coverage (%) | 79.7 | 99.1 24% | 99.4 25% | 79.2 -1% | 66.3 -17% | 63.3 -21% |
| Response Times | 22% | -10% | -1% | 20% | 7% | |
| Response Time Grey 50% / Grey 80% * (ms) | 52.4 ? | 44 ? 16% | 61.6 ? -18% | 48.4 ? 8% | 38 ? 27% | 39.2 ? 25% |
| Response Time Black / White * (ms) | 31.6 ? | 22.8 ? 28% | 32 ? -1% | 34.8 ? -10% | 27.6 ? 13% | 35.2 ? -11% |
| PWM Frequency (Hz) | 1000 ? | 1000 ? | 943 ? | 21190 ? | ||
| Screen | 6% | 20% | 21% | -6% | 2% | |
| Brightness middle (cd/m²) | 451.9 | 357.6 -21% | 396 -12% | 488 8% | 329.3 -27% | 273.6 -39% |
| Brightness (cd/m²) | 414 | 350 -15% | 380 -8% | 440 6% | 316 -24% | 262 -37% |
| Brightness Distribution (%) | 81 | 85 5% | 90 11% | 81 0% | 84 4% | 86 6% |
| Black Level * (cd/m²) | 0.36 | 0.35 3% | 0.28 22% | 0.3 17% | 0.31 14% | 0.3 17% |
| Contrast (:1) | 1255 | 1022 -19% | 1414 13% | 1627 30% | 1062 -15% | 912 -27% |
| Colorchecker dE 2000 * | 5.62 | 4.12 27% | 4 29% | 3.16 44% | 4.78 15% | 3.22 43% |
| Colorchecker dE 2000 max. * | 19.1 | 9.91 48% | 7.6 60% | 8.8 54% | 11.75 38% | 7.61 60% |
| Colorchecker dE 2000 calibrated * | 2.69 | 4.23 -57% | 0.9 67% | 3.51 -30% | 4.1 -52% | |
| Greyscale dE 2000 * | 6.9 | 1.8 74% | 6.1 12% | 3.3 52% | 7.9 -14% | 1.4 80% |
| Gamma | 2.2 100% | 2.17 101% | 2.25 98% | 2.178 101% | 2.24 98% | 2.24 98% |
| CCT | 6254 104% | 6613 98% | 7786 83% | 6811 95% | 8323 78% | 6636 98% |
| Color Space (Percent of AdobeRGB 1998) (%) | 71.8 | 87.5 22% | 88.5 23% | 71.7 0% | 58.8 -18% | 56.4 -21% |
| Color Space (Percent of sRGB) (%) | 98.5 | 100 2% | 100 2% | 97.9 -1% | 90.4 -8% | 86.2 -12% |
| Total Average (Program / Settings) | 13% /
9% | 7% /
15% | 6% /
14% | 0% /
-4% | -3% /
-1% |
* ... smaller is better


Display Response Times
| ↔ Response Time Black to White | ||
|---|---|---|
| 31.6 ms ... rise ↗ and fall ↘ combined | ↗ 18 ms rise | 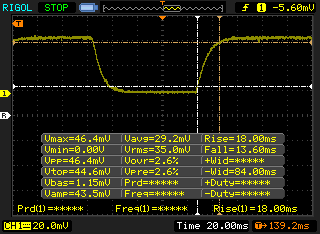 |
| ↘ 13.6 ms fall | ||
| The screen shows slow response rates in our tests and will be unsatisfactory for gamers. In comparison, all tested devices range from 0.1 (minimum) to 240 (maximum) ms. » 85 % of all devices are better. This means that the measured response time is worse than the average of all tested devices (19.8 ms). | ||
| ↔ Response Time 50% Grey to 80% Grey | ||
| 52.4 ms ... rise ↗ and fall ↘ combined | ↗ 27.6 ms rise | 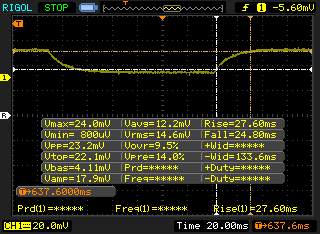 |
| ↘ 24.8 ms fall | ||
| The screen shows slow response rates in our tests and will be unsatisfactory for gamers. In comparison, all tested devices range from 0.165 (minimum) to 636 (maximum) ms. » 89 % of all devices are better. This means that the measured response time is worse than the average of all tested devices (31 ms). | ||
Screen Flickering / PWM (Pulse-Width Modulation)
| Screen flickering / PWM detected | 1000 Hz | ≤ 25 % brightness setting | 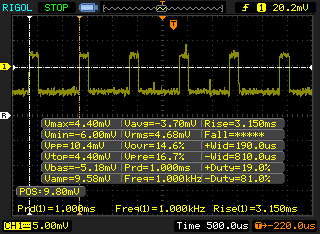 |
The display backlight flickers at 1000 Hz (worst case, e.g., utilizing PWM) Flickering detected at a brightness setting of 25 % and below. There should be no flickering or PWM above this brightness setting. The frequency of 1000 Hz is quite high, so most users sensitive to PWM should not notice any flickering. In comparison: 52 % of all tested devices do not use PWM to dim the display. If PWM was detected, an average of 7757 (minimum: 5 - maximum: 343500) Hz was measured. | |||


Performance
Unless otherwise stated, all benchmarks below were performed with the unit set to High Performance mode on both Windows and the Dell Power Manager software. Our goal is to see how powerful the i9 XPS 15 can be when at its best stock settings.
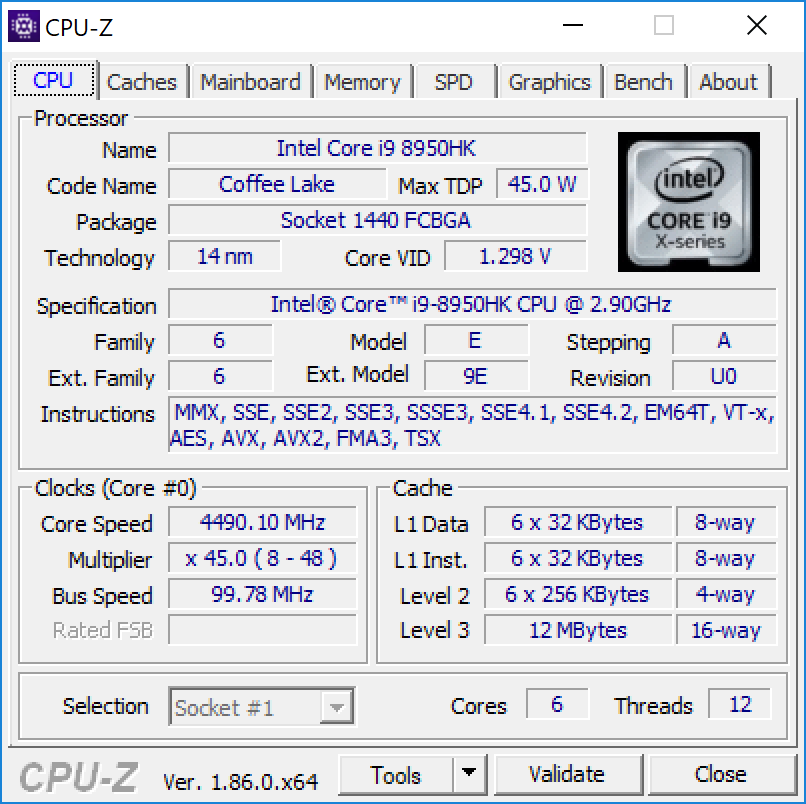
Processor
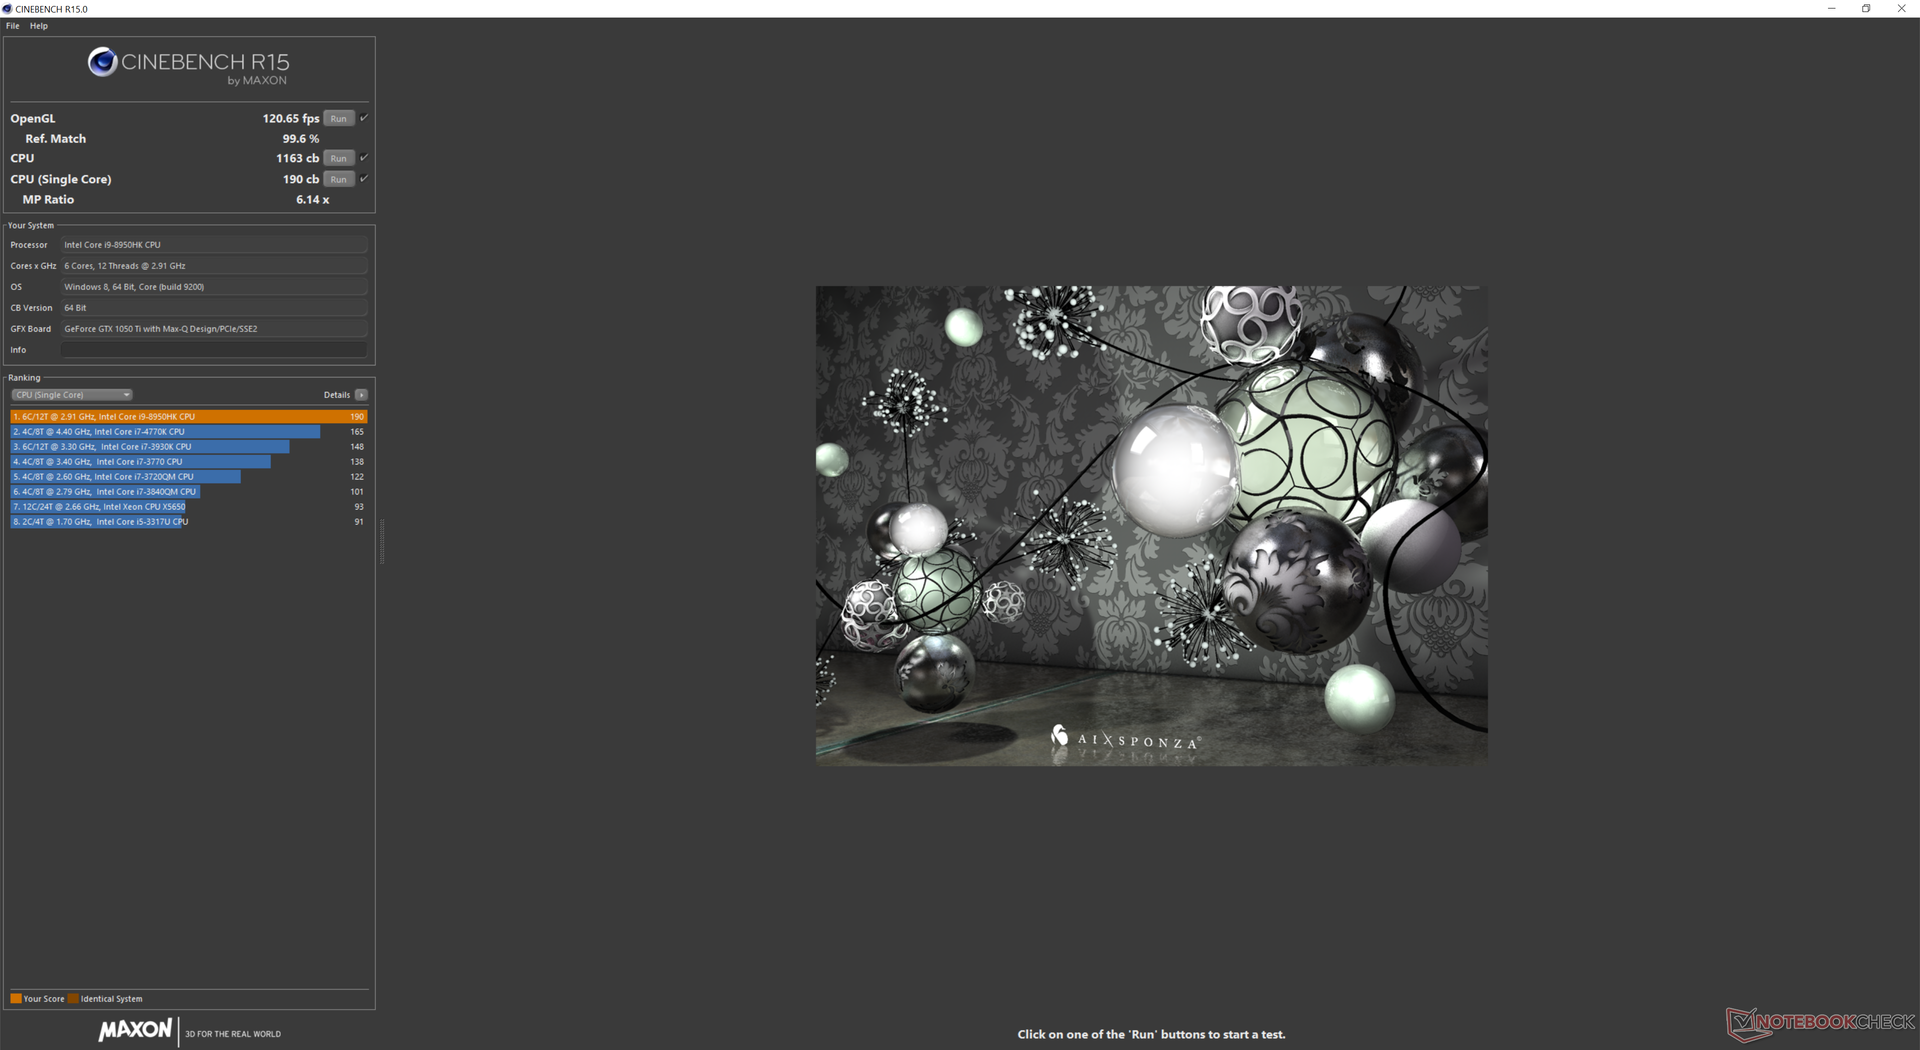
Current SKUs of the XPS 15 9570 include the Core i5-8300H, Core i7-8750H, or Core i9-8950HK. There's no question that the jump in performance from the quad-core i5 to the hexa-core i7 is quite significant at almost 50 percent in multi-threaded workloads. The performance delta between the i5 and i9, however, is a gray area. In this case, the i9 XPS 15 is not all that much faster than a stock i7 XPS 15. We are able to record a performance boost of only about 10 percent at most when both configurations are subjected to non-stop processing stress to imply that the Core i9 SKU is just slightly better at maintaining faster Turbo Boost clock rates. Otherwise, the gain is so marginal that even most performance users will not notice.
The competing Asus ZenBook UX580 carries the same Core i9 CPU as our Dell, but it performs slightly slower to be even closer to a baseline i7-8750H. Users who actually want the full performance of a Core i9-8950HK should consider the thicker MSI GT75 where performance can be almost 25 percent faster than the same CPU in the i9 XPS 15.
Intel XTU can be used to tweak the CPU for potentially faster performance. Unfortunately, our test unit inevitably crashes after a couple of minutes each time the program is launched.
See our dedicated page on the Core i9-8950HK for more technical details and benchmark comparisons.
| wPrime 2.10 - 1024m | |
| Dell XPS 13 9370 i7 UHD | |
| Average Intel Core i9-8950HK (n=1) | |
| Dell XPS 15 9560 (i7-7700HQ, UHD) | |
| Dell XPS 15 9575 i7-8705G | |
| Eurocom Sky X4C | |
| AMD Radeon RX Vega 64 | |
* ... smaller is better
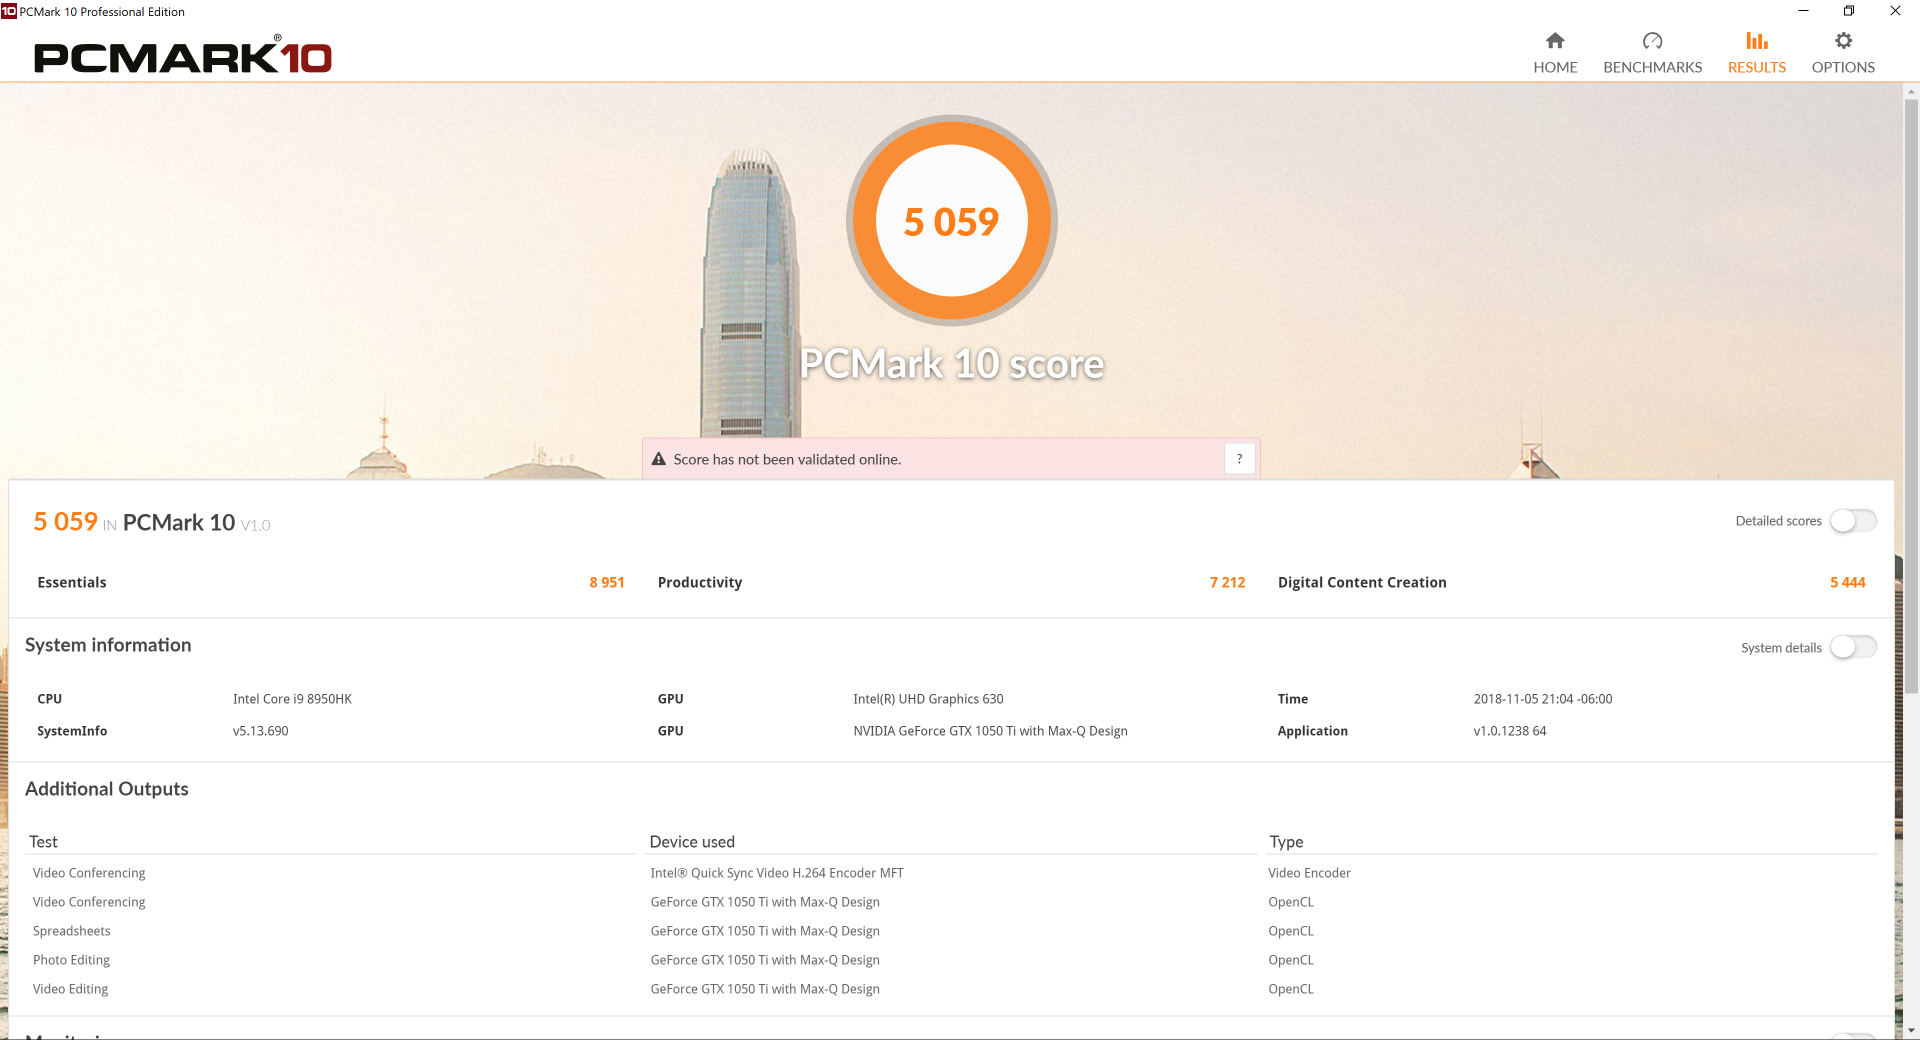
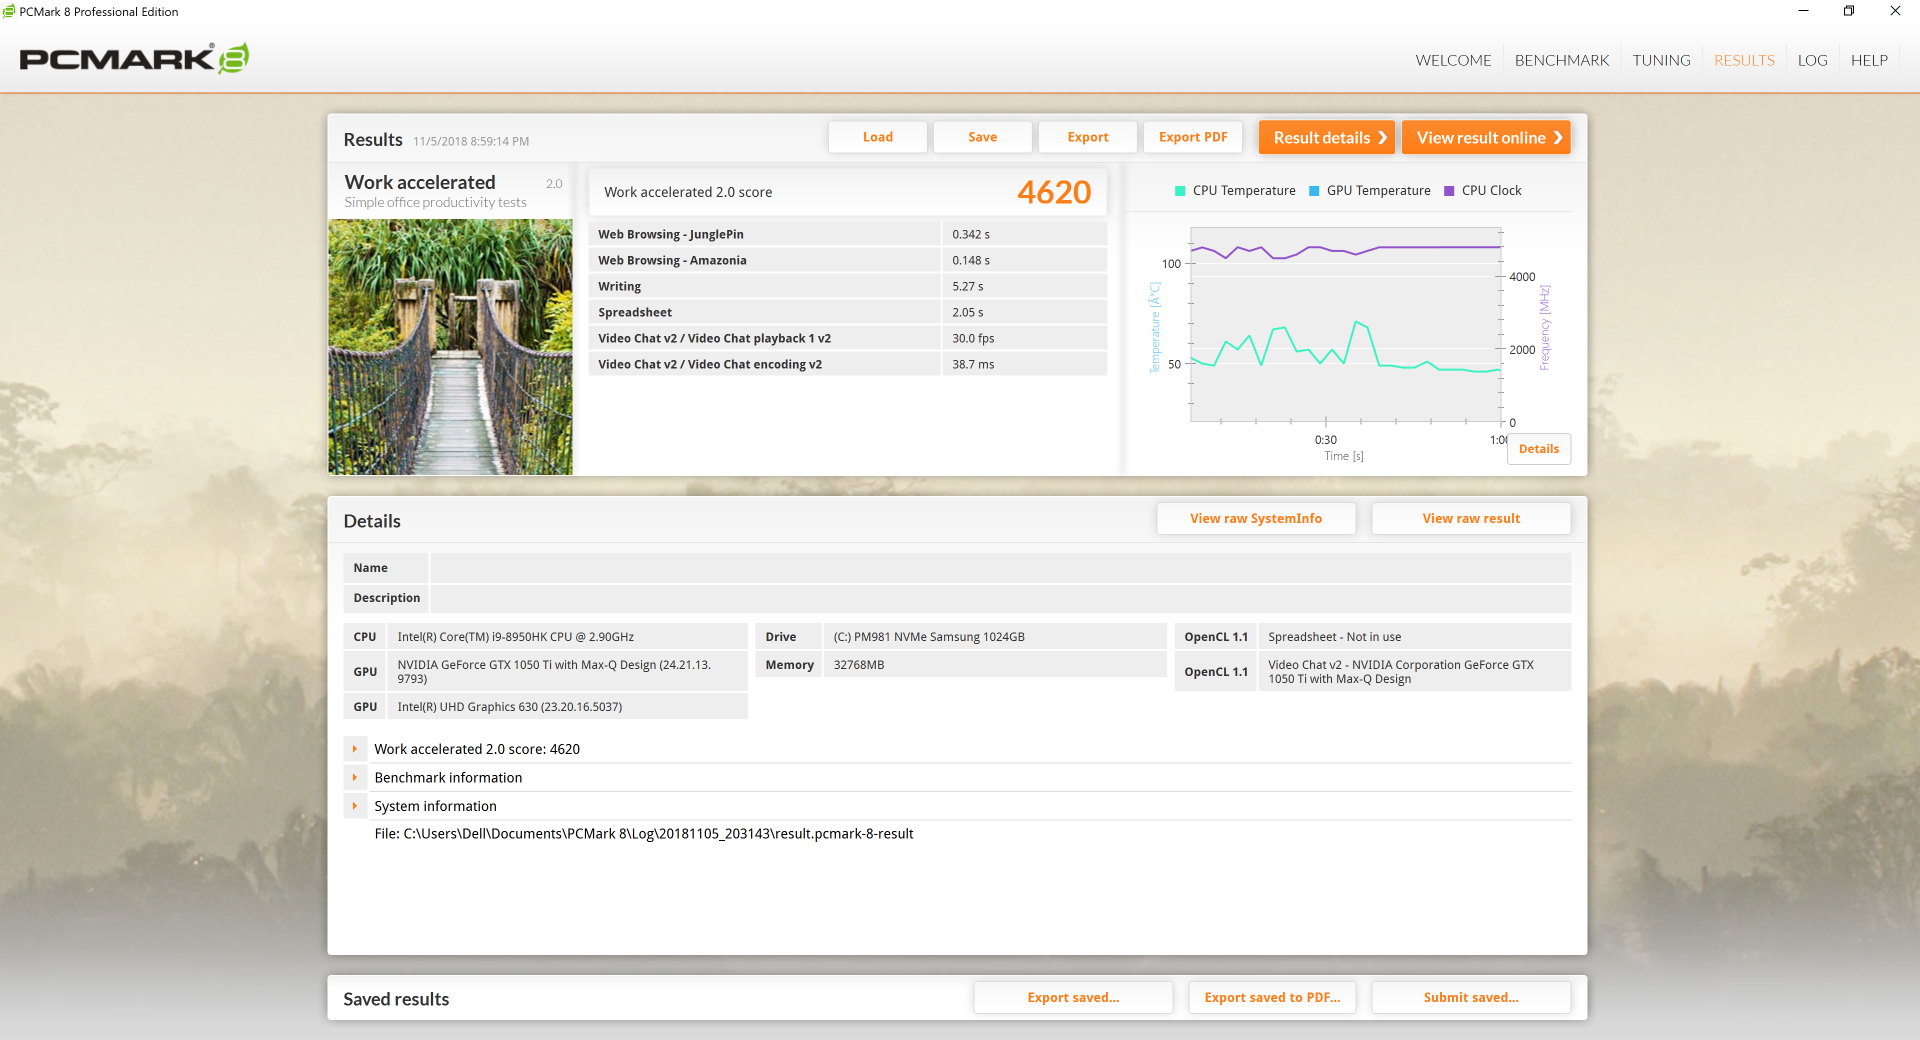
System Performance
PCMark benchmarks rank our i9 SKU within single-digit percentages of the i7 SKU to show that the Core i9 has very little impact on system performance during day-to-day office loads. We experienced several BSOD crashes during our time with the unit and they all involved either GPU-Z, HWiNFO, Intel XTU, or the i1Profiler display software in some way. The stop codes 'VIDEO_DXGKRNL_FATAL_ERROR' or 'DRIVER_POWER_STATE_FAILURE' would occur each time.
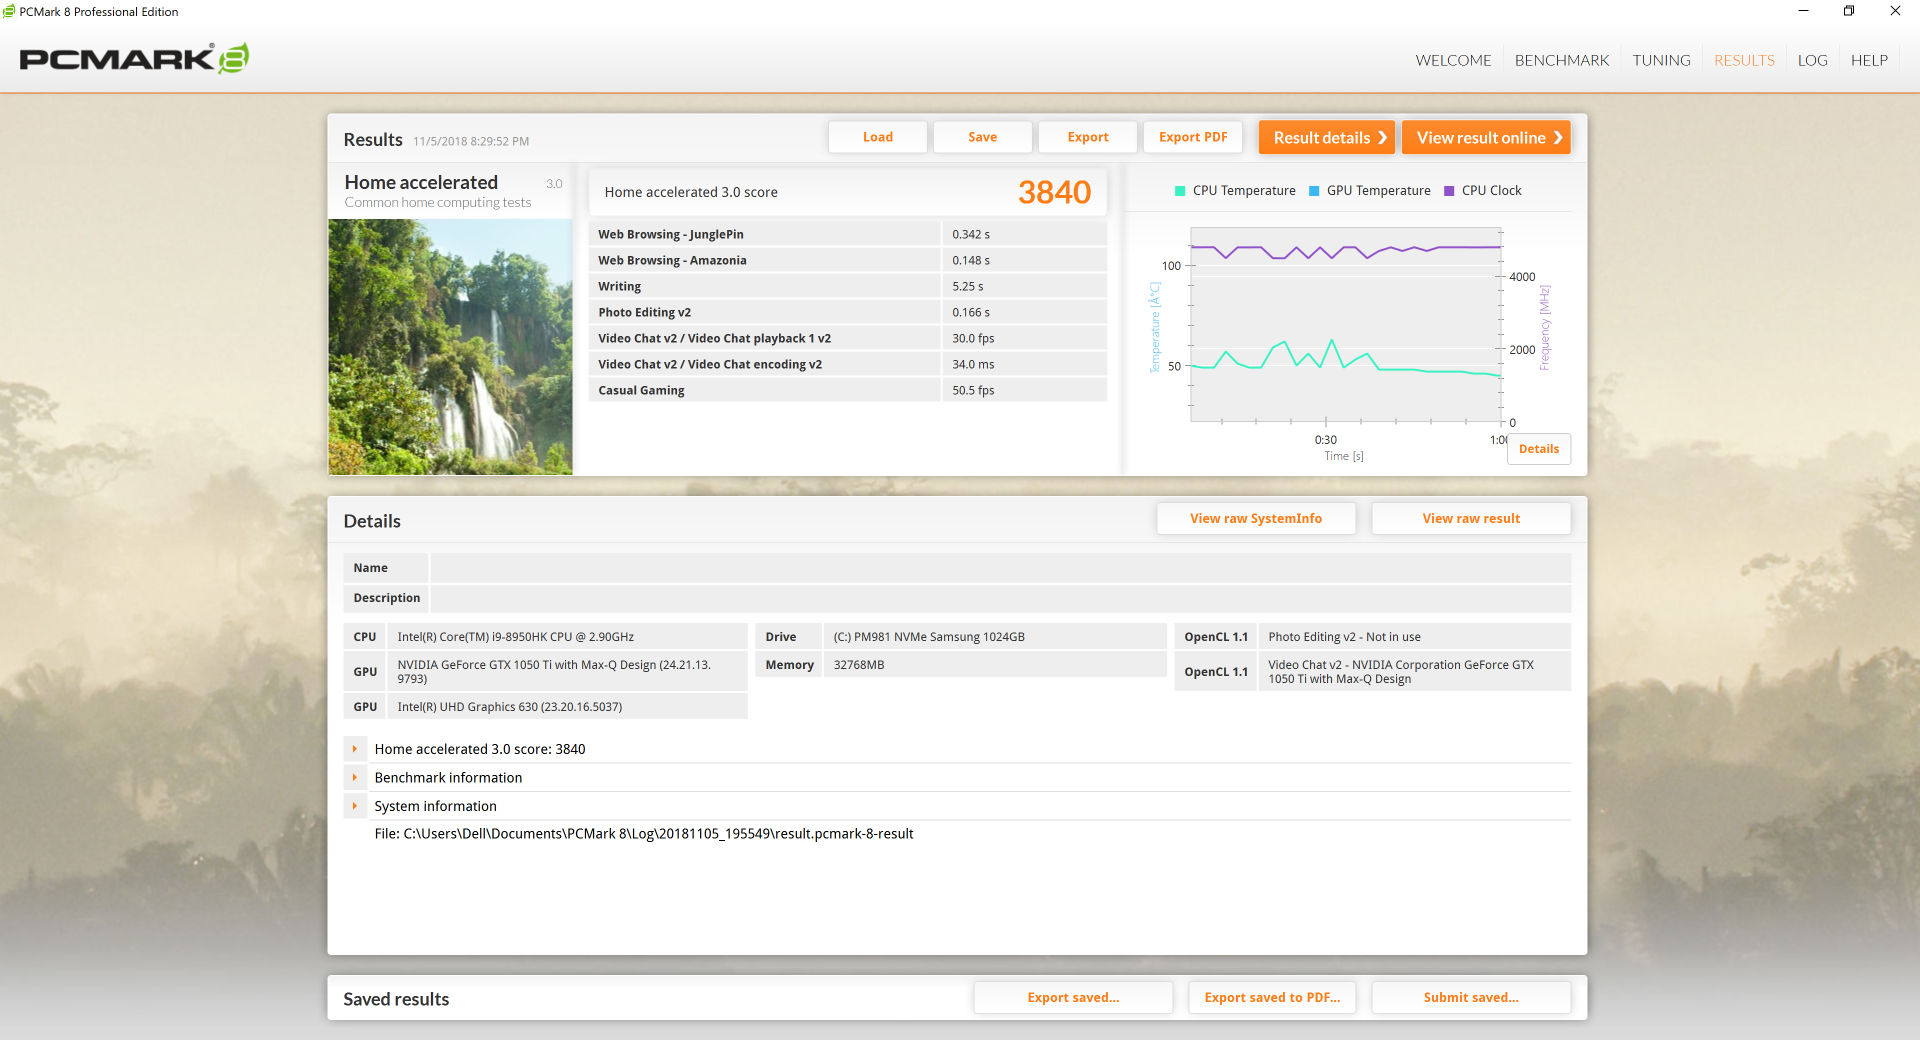
| PCMark 8 Home Score Accelerated v2 | 3840 points | |
| PCMark 8 Work Score Accelerated v2 | 4620 points | |
| PCMark 10 Score | 5059 points | |
Help | ||
Storage Devices
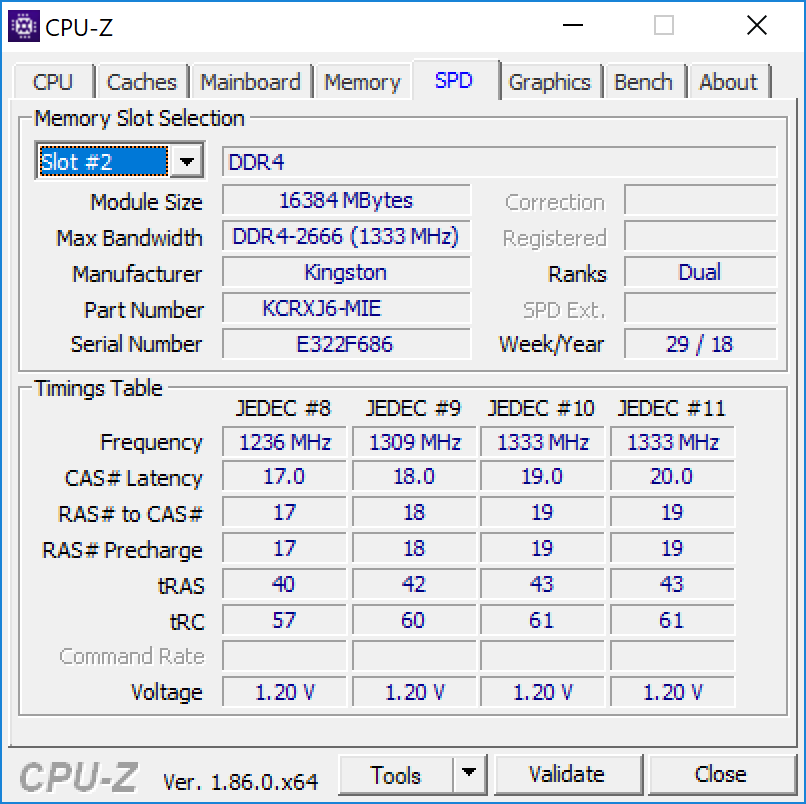
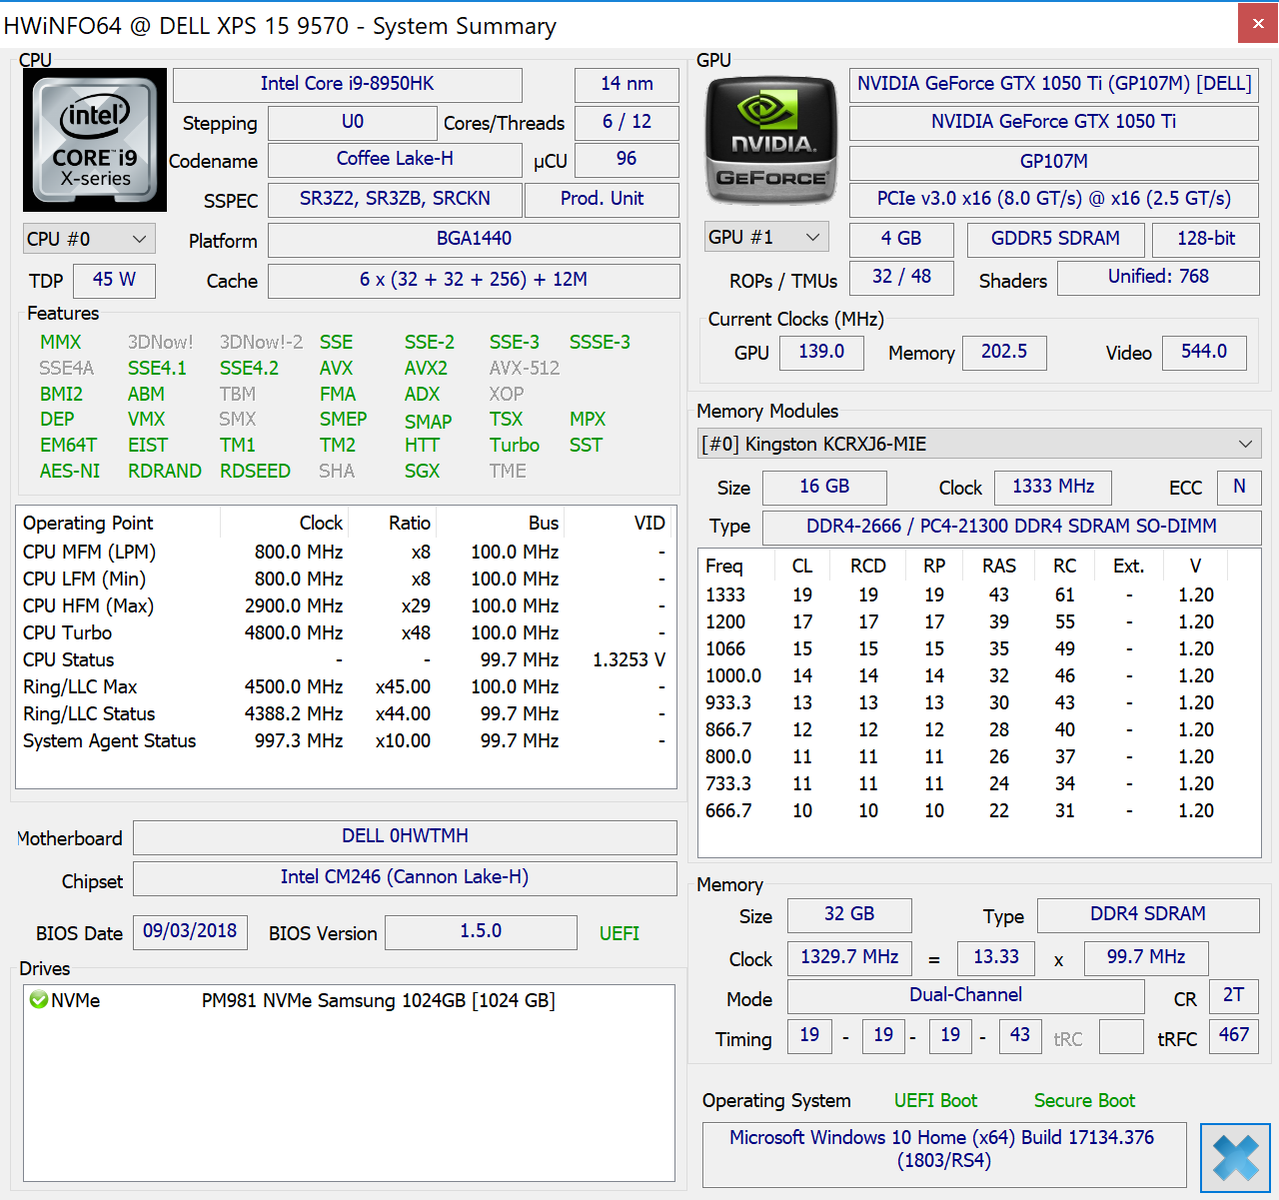
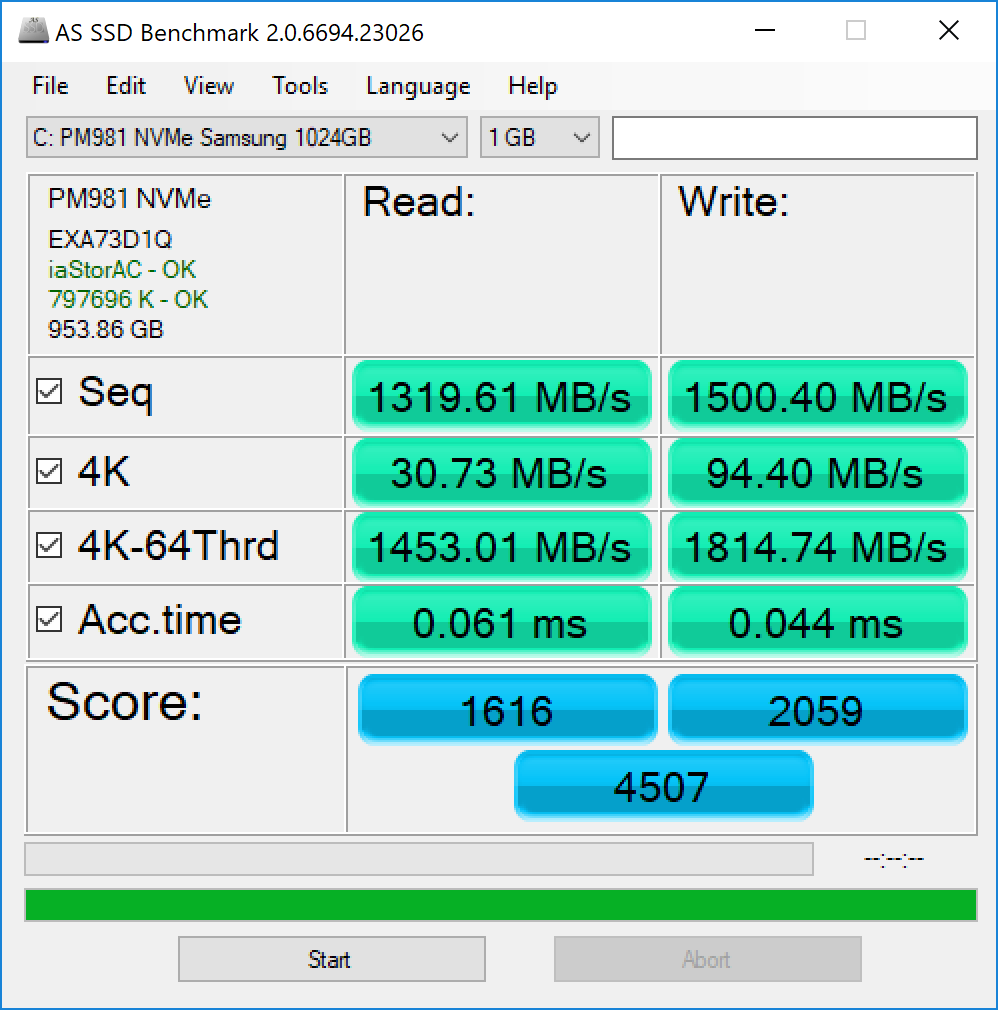
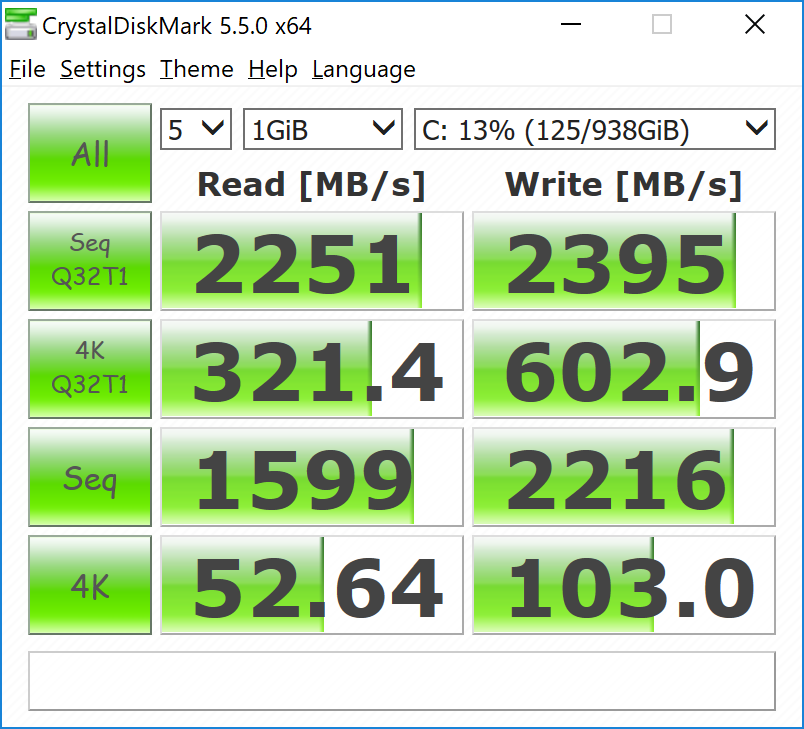
Unlike our i7 XPS 15 and its 512 GB Toshiba SSD, our i9 XPS 15 carries a 1 TB Samsung PM981 SSD with faster sequential read and write rates of 1599 MB/s and 2216 MB/s, respectively. Note that the secondary 2.5-inch SATA III bay option is not available on Core i9 SKUs.
See our table of HDDs and SSDs for more benchmark comparisons.
| Dell XPS 15 9570 Core i9 UHD Samsung SSD PM981 MZVLB1T0HALR | Asus ZenBook Pro 15 UX580GE Samsung SSD PM961 1TB M.2 PCIe 3.0 x4 NVMe (MZVLW1T0) | Lenovo ThinkPad X1 Extreme-20MF000XGE Samsung SSD PM981 MZVLB1T0HALR | Dell XPS 15 9575 i7-8705G SK hynix PC401 NVMe 500 GB | HP Spectre x360 15-ch011nr SK hynix PC401 NVMe 500 GB | Razer Blade 15 Base Model Samsung SSD PM981 MZVLB256HAHQ | |
|---|---|---|---|---|---|---|
| AS SSD | -1% | 40% | -19% | -22% | -17% | |
| Seq Read (MB/s) | 1320 | 2099 59% | 2703 105% | 2302 74% | 1739 32% | 1803 37% |
| Seq Write (MB/s) | 1500 | 1729 15% | 2336 56% | 752 -50% | 1189 -21% | 1367 -9% |
| 4K Read (MB/s) | 30.73 | 37.78 23% | 56.8 85% | 41.38 35% | 38.76 26% | 40.75 33% |
| 4K Write (MB/s) | 94.4 | 100.9 7% | 130.9 39% | 94.3 0% | 93.2 -1% | 93 -1% |
| 4K-64 Read (MB/s) | 1453 | 1431 -2% | 1805 24% | 649 -55% | 646 -56% | 749 -48% |
| 4K-64 Write (MB/s) | 1815 | 1273 -30% | 1782 -2% | 637 -65% | 545 -70% | 1270 -30% |
| Access Time Read * (ms) | 0.061 | 0.04 34% | 0.034 44% | 0.044 28% | 0.054 11% | 0.113 -85% |
| Access Time Write * (ms) | 0.044 | 0.036 18% | 0.028 36% | 0.051 -16% | 0.051 -16% | 0.04 9% |
| Score Read (Points) | 1616 | 1679 4% | 2132 32% | 921 -43% | 859 -47% | 970 -40% |
| Score Write (Points) | 2059 | 1547 -25% | 2147 4% | 807 -61% | 757 -63% | 1499 -27% |
| Score Total (Points) | 4507 | 4065 -10% | 5355 19% | 2132 -53% | 2037 -55% | 2952 -35% |
| Copy ISO MB/s (MB/s) | 2577 | 1045 -59% | 1523 -41% | 1668 -35% | 1892 -27% | |
| Copy Program MB/s (MB/s) | 515 | 430.9 -16% | 487.9 -5% | 486.8 -5% | 495.5 -4% | |
| Copy Game MB/s (MB/s) | 1120 | 728 -35% | 944 -16% | 1042 -7% | 1070 -4% |
* ... smaller is better

GPU Performance
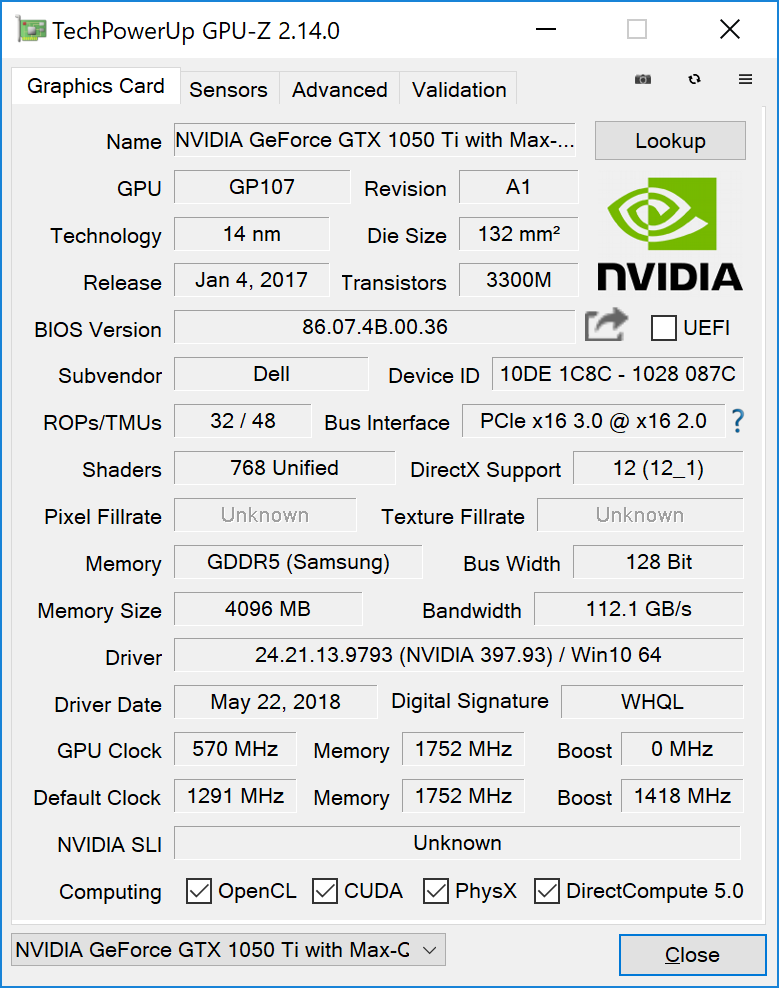
The GeForce GTX 1050 Ti Max-Q is an uncommon find since most OEMs tend to make the jump to a standard GTX 1050 Ti instead. We suspect that Dell went with the less demanding Max-Q variant due to thermal limitations of the chassis. After all, last year's XPS 15 9560 was limited up to the GTX 1050 and the XPS 15 9570 chassis still utilizes the same cooling solution. Performance is neck-to-neck with the Radeon RX Vega M GL as found on the XPS 15 9575.
3DMark benchmarks show the GTX 1050 Ti Max-Q to be about 10 to 20 percent faster than the GTX 1050 and 5 to 10 percent slower than a "proper" mobile GTX 1050 Ti.
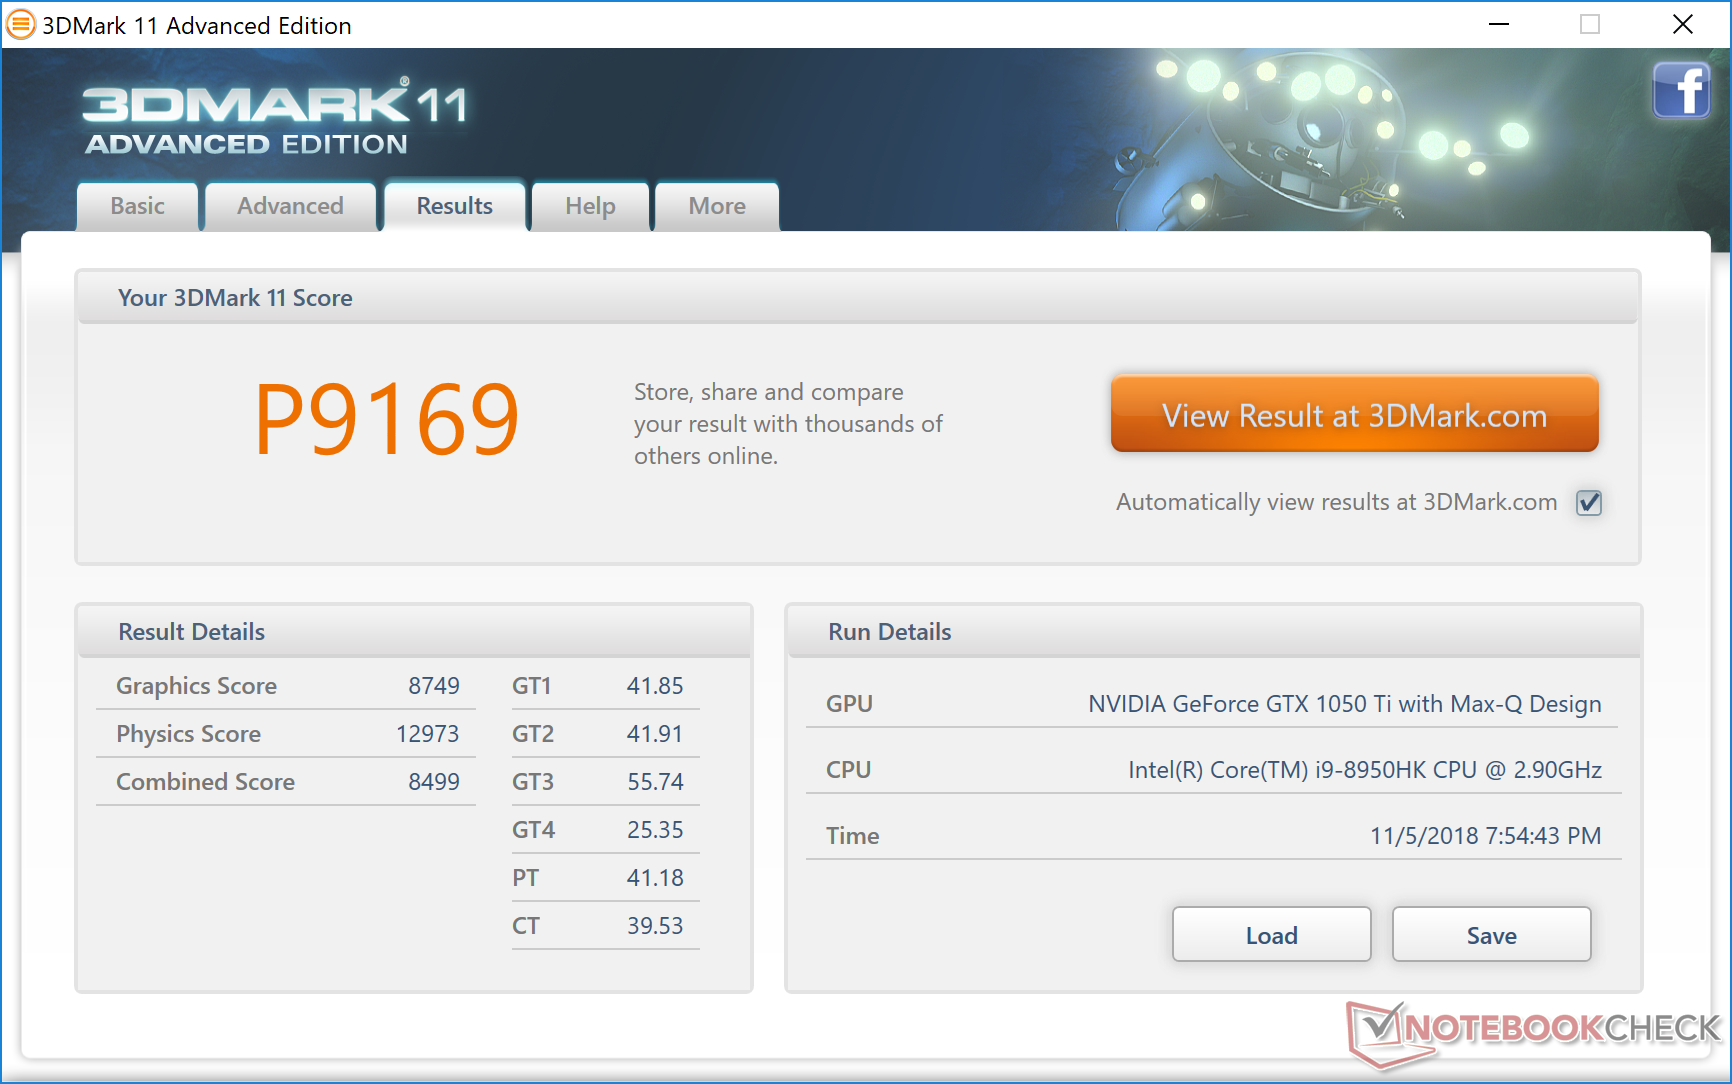
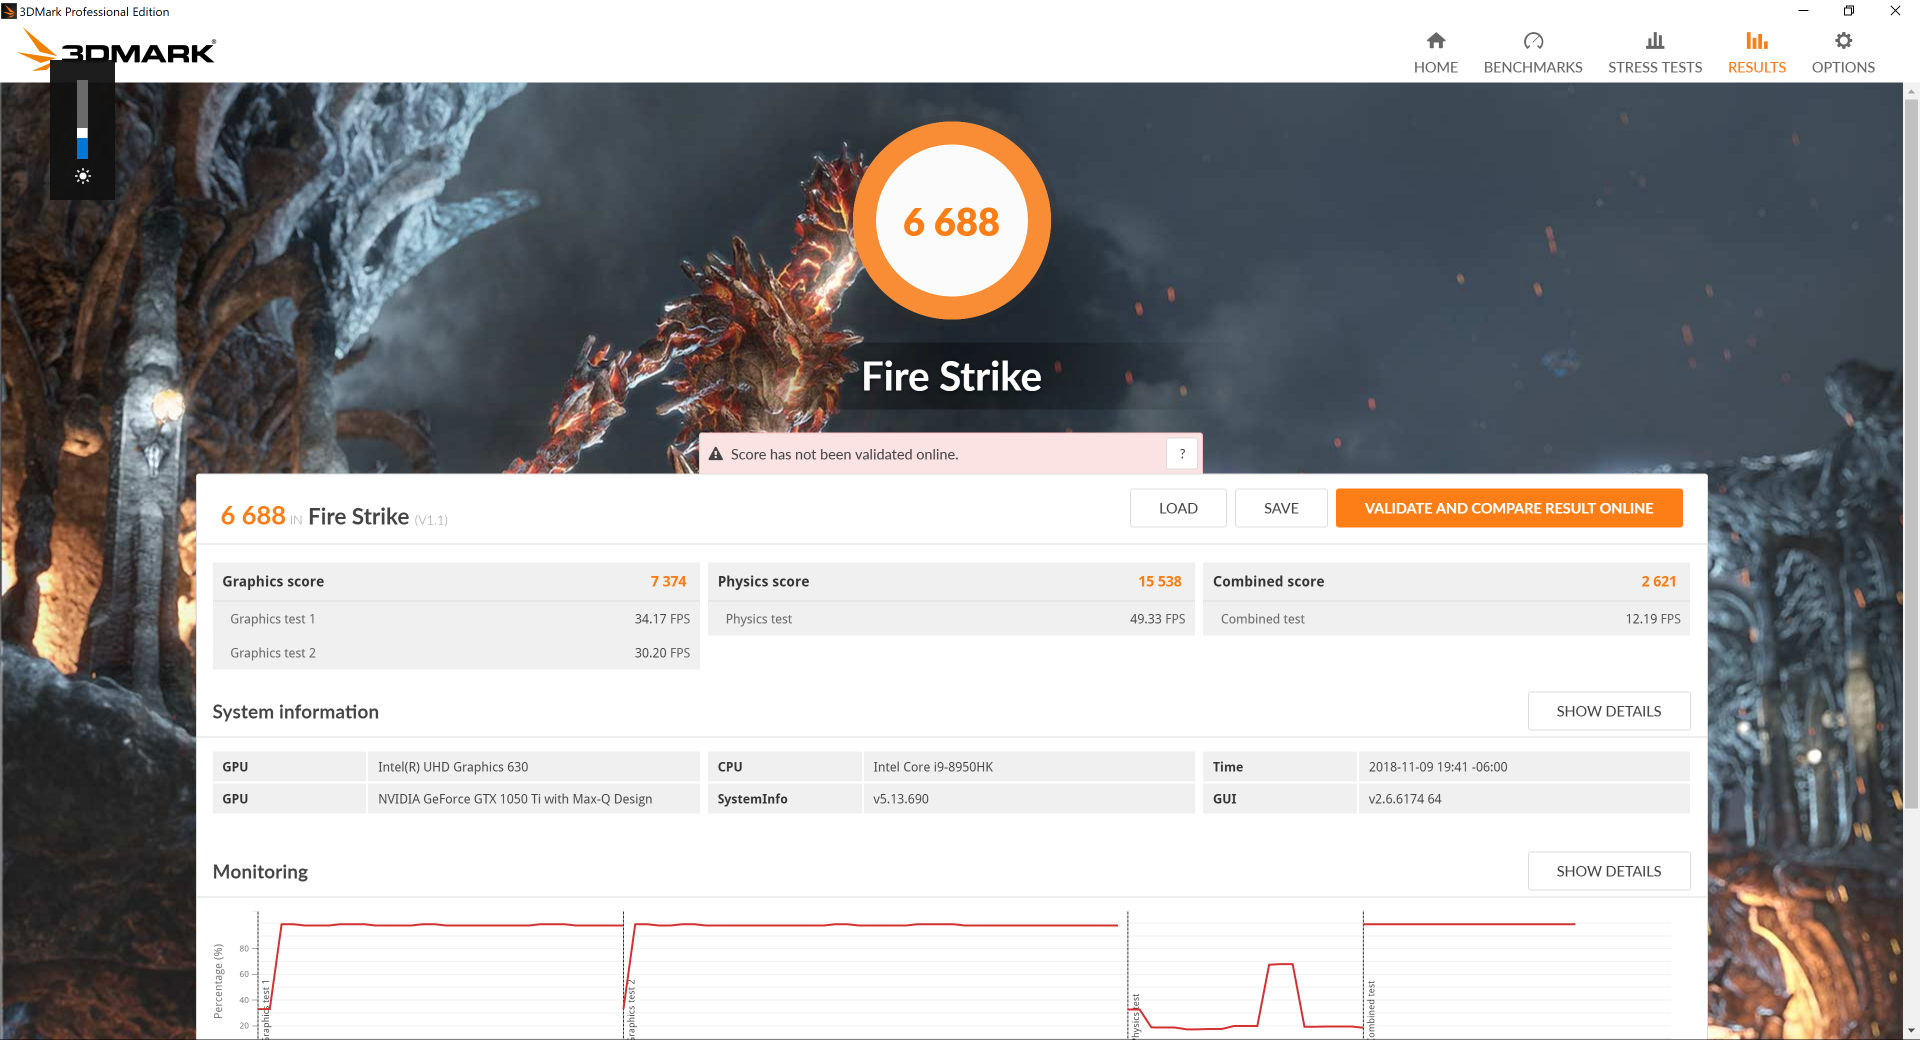
| 3DMark 11 Performance | 9373 points | |
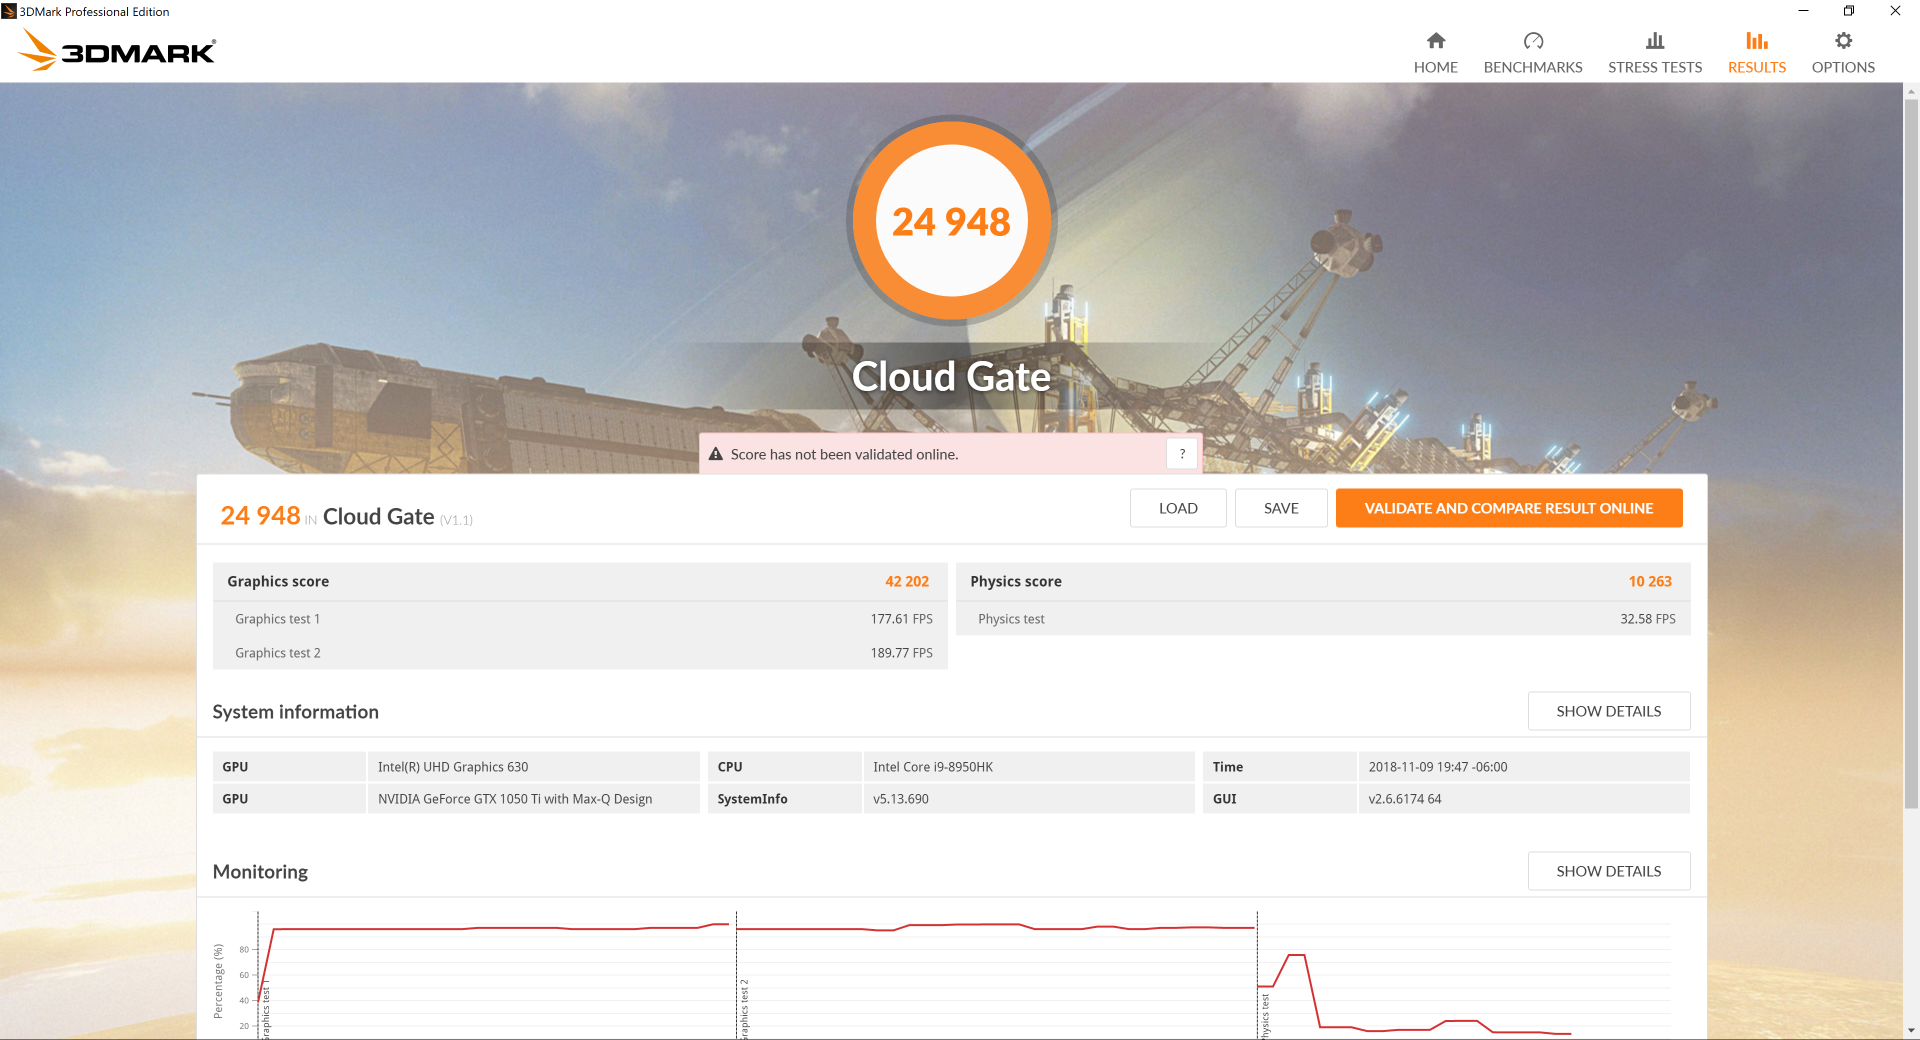
| 3DMark Cloud Gate Standard Score | 24948 points | |
| 3DMark Fire Strike Score | 6688 points | |
Help | ||
Gaming Performance
Unsurprisingly, gaming performance is between that of the GTX 1050 and GTX 1050 Ti. Modern titles are still playable at 1080p with most settings tuned down. See our dedicated page on the GTX 1050 Ti Max-Q for more technical information and benchmark comparisons.
Note that the system should be set to Ultra Performance through the Dell Power Manager menu when gaming. If not, performance may throttle as exemplified by our Witcher 3 graph below. Frame rates are constant at about 23 FPS when on Ultra Performance (red), but they will otherwise drop to 15 FPS when set to Quiet or Cool mode (orange).
| low | med. | high | ultra | |
|---|---|---|---|---|
| BioShock Infinite (2013) | 298.2 | 208.7 | 181.3 | 71.8 |
| The Witcher 3 (2015) | 122 | 73.2 | 42.6 | 23.5 |
| Rise of the Tomb Raider (2016) | 141.1 | 82.9 | 47.7 | 39.5 |
Emissions
System Noise
The twin fans remain quiet during low loads even though the processors underneath are very powerful. Even more impressively, we can notice no constant pulsing when on the High performance profile and so changes in fan noise tend to be moderate and less intrusive.
When gaming, fan noise jumps to a constant 47 dB(A) to be louder than what we recorded on the i7 XPS 15 SKU. If attempting to game on Cool or Quiet mode, fan noise tops out between 37 and 40 dB(A) at the cost of some performance throttling as mentioned in our Gaming Performance section above. Fan noise is most similar to the XPS 15 9575 when subjected to very high processing loads.
Our test unit suffers from slight electronic noise towards the right half of the unit to suggest that it could be from the SSD. Thankfully, the sound is inaudible when sitting and working from a normal distance.
Noise level
| Idle |
| 28.5 / 28.6 / 28.8 dB(A) |
| Load |
| 36.2 / 47.6 dB(A) |
 | ||
30 dB silent 40 dB(A) audible 50 dB(A) loud |
||
min: | ||
| Dell XPS 15 9570 Core i9 UHD GeForce GTX 1050 Ti Max-Q, i9-8950HK, Samsung SSD PM981 MZVLB1T0HALR | Dell XPS 15 9570 i7 UHD GeForce GTX 1050 Ti Max-Q, i7-8750H, Toshiba XG5 KXG50ZNV512G | Razer Blade 15 Base Model GeForce GTX 1060 Max-Q, i7-8750H, Samsung SSD PM981 MZVLB256HAHQ | Dell XPS 15 9575 i7-8705G Vega M GL / 870, i7-8705G, SK hynix PC401 NVMe 500 GB | Asus ZenBook Pro 15 UX580GE GeForce GTX 1050 Ti Mobile, i9-8950HK, Samsung SSD PM961 1TB M.2 PCIe 3.0 x4 NVMe (MZVLW1T0) | |
|---|---|---|---|---|---|
| Noise | 1% | -8% | 4% | -2% | |
| off / environment * (dB) | 28.2 | 29.9 -6% | 27.8 1% | 28.2 -0% | 28 1% |
| Idle Minimum * (dB) | 28.5 | 29.9 -5% | 31 -9% | 28.2 1% | 28.6 -0% |
| Idle Average * (dB) | 28.6 | 29.9 -5% | 31.2 -9% | 28.2 1% | 29.9 -5% |
| Idle Maximum * (dB) | 28.8 | 30.3 -5% | 31.3 -9% | 28.2 2% | 30.5 -6% |
| Load Average * (dB) | 36.2 | 36.5 -1% | 47.2 -30% | 29 20% | 42.5 -17% |
| Witcher 3 ultra * (dB) | 47.6 | 40.4 15% | 51.3 -8% | 44.7 6% | 44.8 6% |
| Load Maximum * (dB) | 47.6 | 40.4 15% | 44.3 7% | 47.4 -0% | 44.8 6% |
* ... smaller is better
Temperature

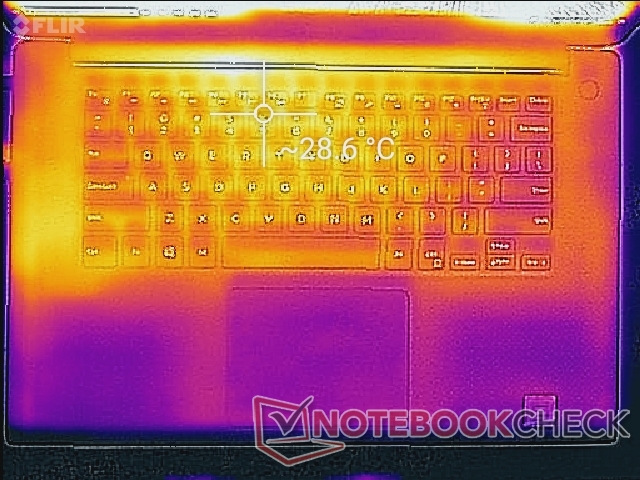
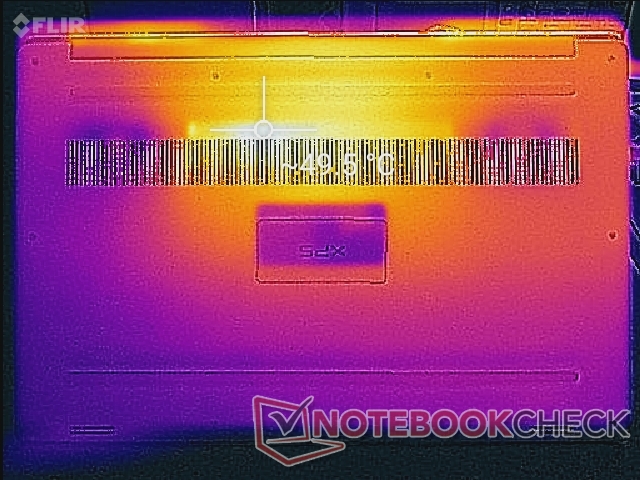
Surface temperature and hot spots are essentially identical to both the i5 XPS 15 and i7 XPS 15 despite the processor swap. Users can expect hot spots as warm as 50 C or 55 C towards the center rear of the system after a long session or gaming or high processing load. The palm rests remain relatively cool no matter the load for comfortable use.


We stress the notebook with synthetic loads to identify for any potential throttling or stability issues. When subjected to Prime95, the CPU can be observed running as fast as 4.3 GHz for the first few seconds with core temperature jumping from an idle of 42 C to 97 C in almost an instant. Clock rates subsequently drop and fluctuate between 3.0 GHz and 3.4 GHz in order to maintain a cooler temperature in the 80 C range. When considering that the base clock rate of the i9-8950HK is 2.9 GHz, we can surmise that the XPS 15 can maintain a Turbo Boost in the +100 to +500 MHz range.
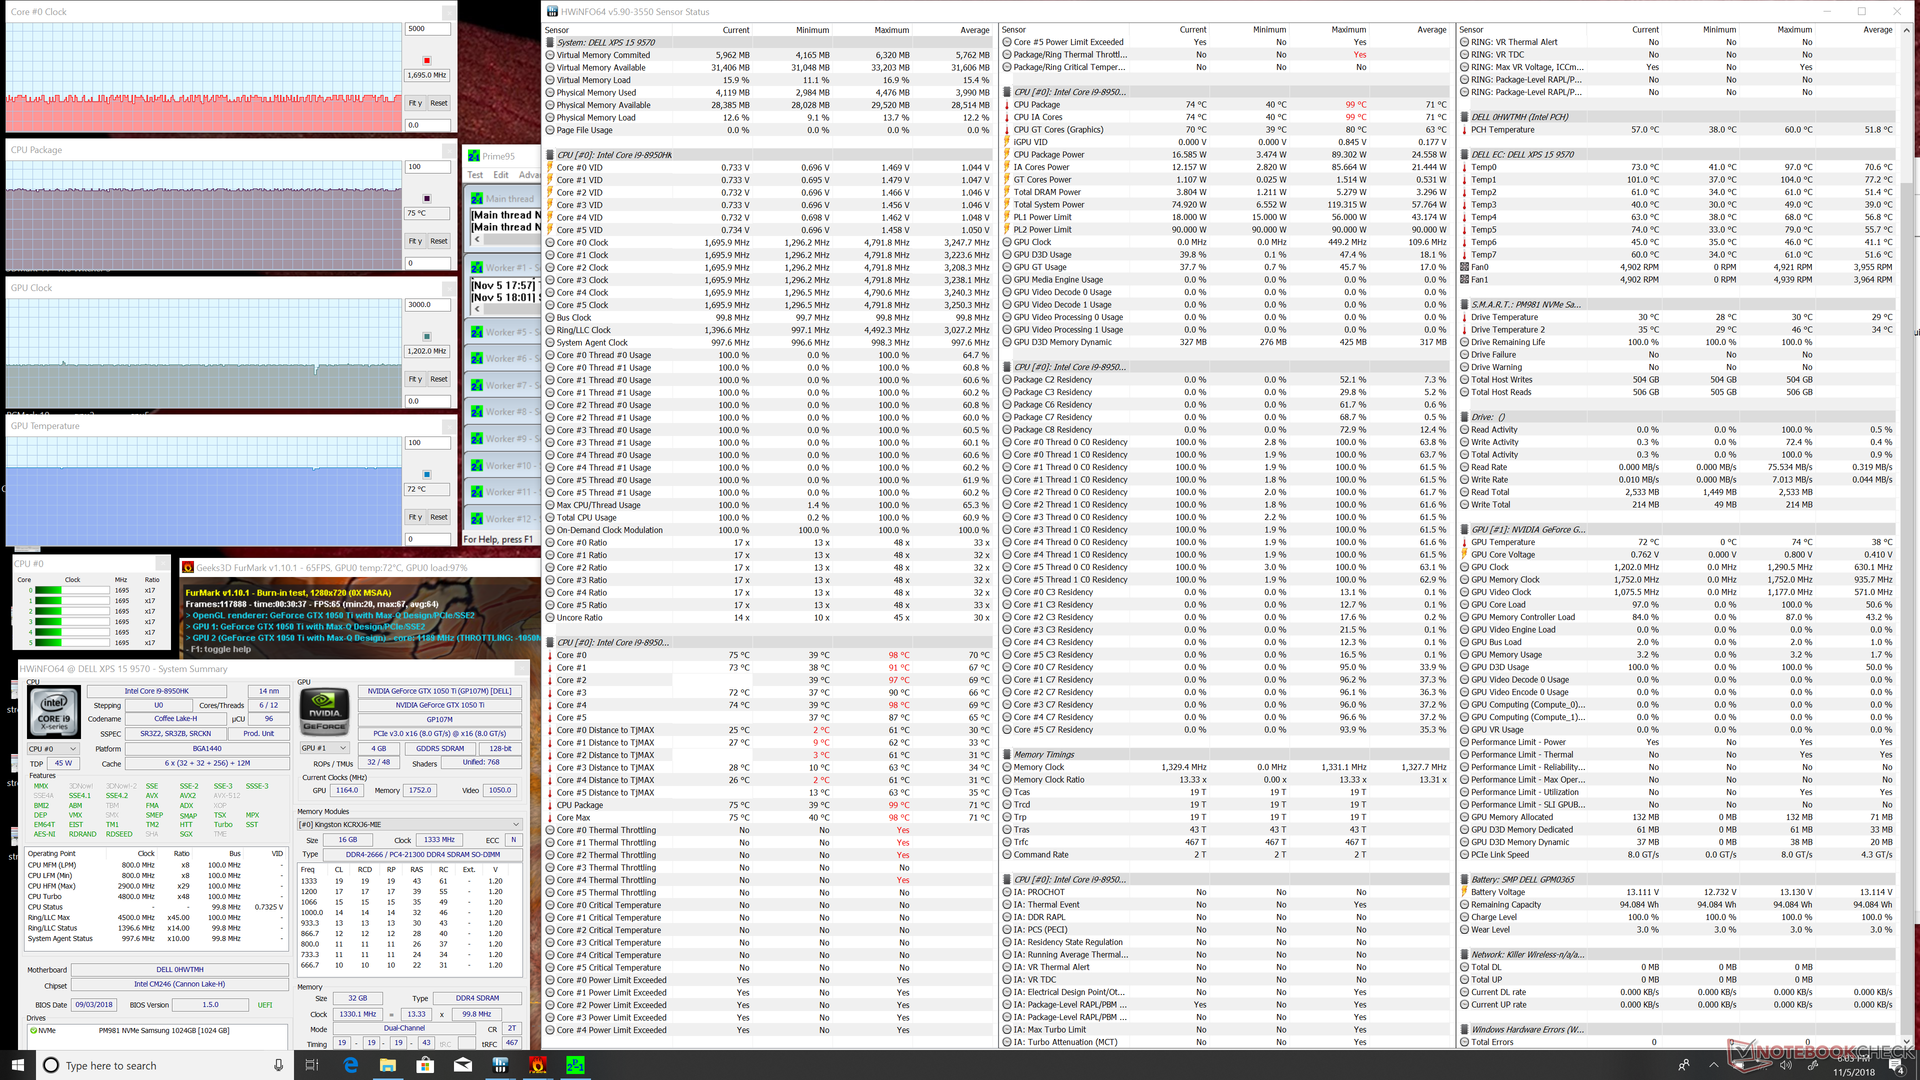
Running on Ultra Performance mode does not appear to increase performance over the standard Optimized mode when under such high stress levels. If running both Prime95 and FurMark simultaneously, the CPU will throttle below 2.0 GHz in order to maintain a cooler core temperature in the 70 C range.
Running Witcher 3 is more representative of real-world stress. The CPU and GPU will each stabilize at around 75 C with no performance dips over time.
Attempting to run 3DMark on battery power to test performance on batteries would crash the system each and every time.

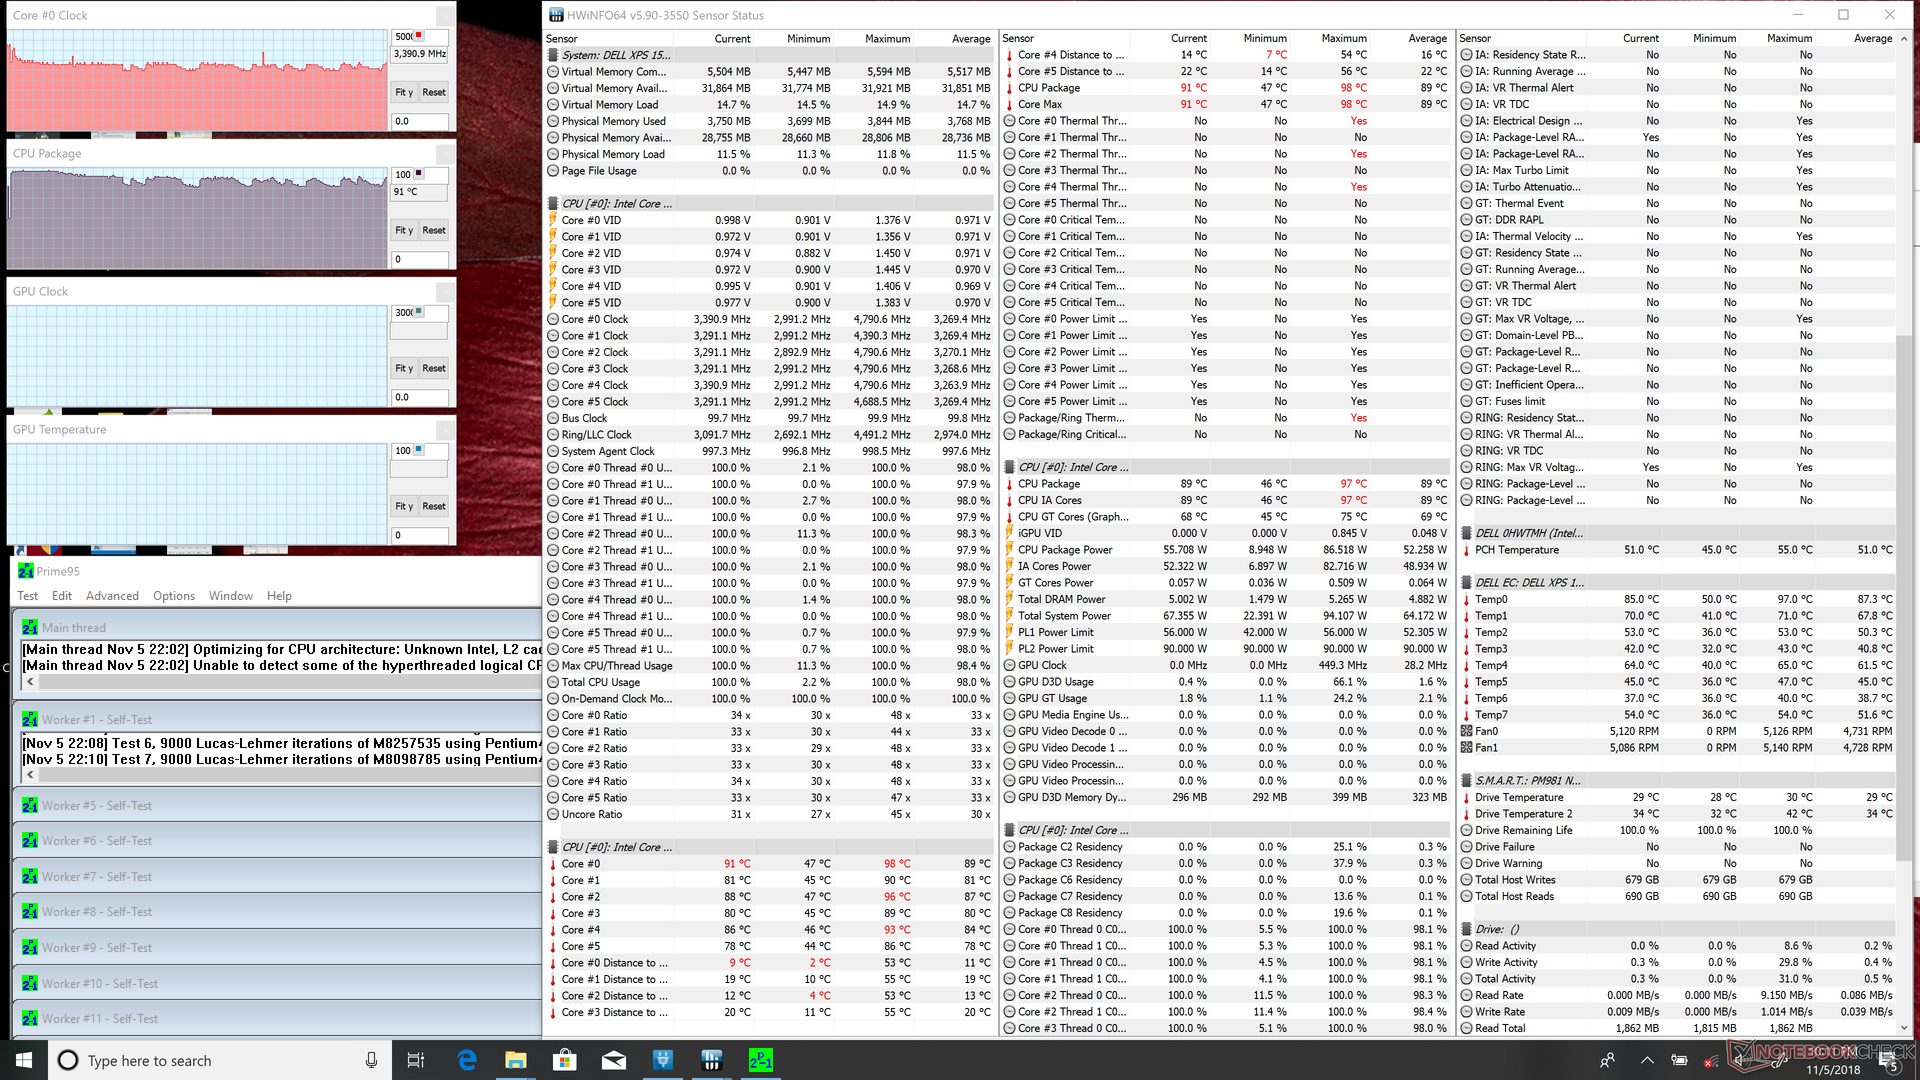

| CPU Clock (GHz) | GPU Clock (MHz) | Average CPU Temperature (°C) | Average GPU Temperature (°C) | |
| System Idle | -- | -- | 42 | 42 |
| Prime95 Stress | 3.0 - 3.4 | -- | 81 - 87 | -- |
| Prime95 + FurMark Stress | 1.5 - 1.7 | 1202 | 75 | 72 |
| Witcher 3 Stress | 3.3+ | 1595 | ~75 | 74 |
(-) The maximum temperature on the upper side is 53.6 °C / 128 F, compared to the average of 36.8 °C / 98 F, ranging from 21 to 71 °C for the class Multimedia.
(-) The bottom heats up to a maximum of 49 °C / 120 F, compared to the average of 39.1 °C / 102 F
(+) In idle usage, the average temperature for the upper side is 27.1 °C / 81 F, compared to the device average of 31.3 °C / 88 F.
(±) Playing The Witcher 3, the average temperature for the upper side is 35.4 °C / 96 F, compared to the device average of 31.3 °C / 88 F.
(+) The palmrests and touchpad are cooler than skin temperature with a maximum of 28.2 °C / 82.8 F and are therefore cool to the touch.
(±) The average temperature of the palmrest area of similar devices was 28.7 °C / 83.7 F (+0.5 °C / 0.9 F).
Speakers

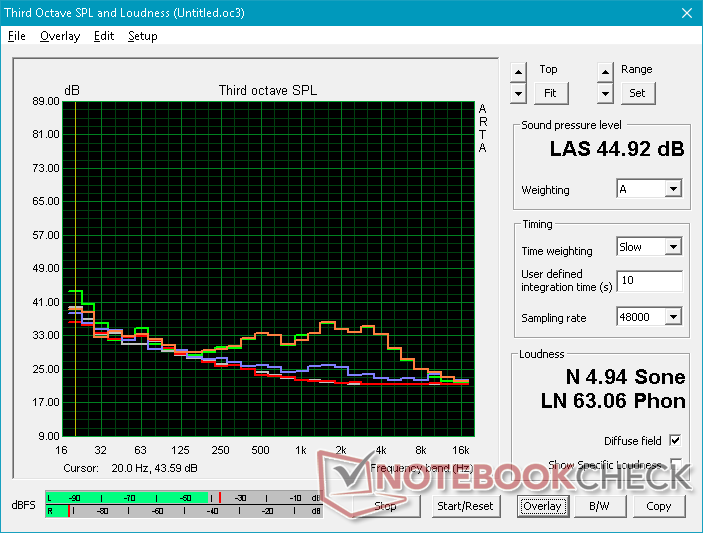
Dell XPS 15 9570 Core i9 UHD audio analysis
(±) | speaker loudness is average but good (77.9 dB)
Bass 100 - 315 Hz
(-) | nearly no bass - on average 17.9% lower than median
(±) | linearity of bass is average (8.4% delta to prev. frequency)
Mids 400 - 2000 Hz
(±) | higher mids - on average 7.2% higher than median
(±) | linearity of mids is average (12.1% delta to prev. frequency)
Highs 2 - 16 kHz
(+) | balanced highs - only 4.6% away from median
(±) | linearity of highs is average (9.8% delta to prev. frequency)
Overall 100 - 16.000 Hz
(±) | linearity of overall sound is average (20.9% difference to median)
Compared to same class
» 71% of all tested devices in this class were better, 8% similar, 21% worse
» The best had a delta of 5%, average was 17%, worst was 45%
Compared to all devices tested
» 57% of all tested devices were better, 8% similar, 35% worse
» The best had a delta of 4%, average was 23%, worst was 134%
Apple MacBook 12 (Early 2016) 1.1 GHz audio analysis
(+) | speakers can play relatively loud (83.6 dB)
Bass 100 - 315 Hz
(±) | reduced bass - on average 11.3% lower than median
(±) | linearity of bass is average (14.2% delta to prev. frequency)
Mids 400 - 2000 Hz
(+) | balanced mids - only 2.4% away from median
(+) | mids are linear (5.5% delta to prev. frequency)
Highs 2 - 16 kHz
(+) | balanced highs - only 2% away from median
(+) | highs are linear (4.5% delta to prev. frequency)
Overall 100 - 16.000 Hz
(+) | overall sound is linear (10.2% difference to median)
Compared to same class
» 7% of all tested devices in this class were better, 2% similar, 90% worse
» The best had a delta of 5%, average was 18%, worst was 53%
Compared to all devices tested
» 5% of all tested devices were better, 1% similar, 94% worse
» The best had a delta of 4%, average was 23%, worst was 134%
Energy Management
Power Consumption
Users can expect consumption to be anywhere from 7 W to 14 W when idling on desktop depending on the power profile and brightness setting. When gaming, consumption jumps to about 103 W not unlike on the Zenbook UX580 with the same GPU but still more than the ThinkPad X1 Extreme.
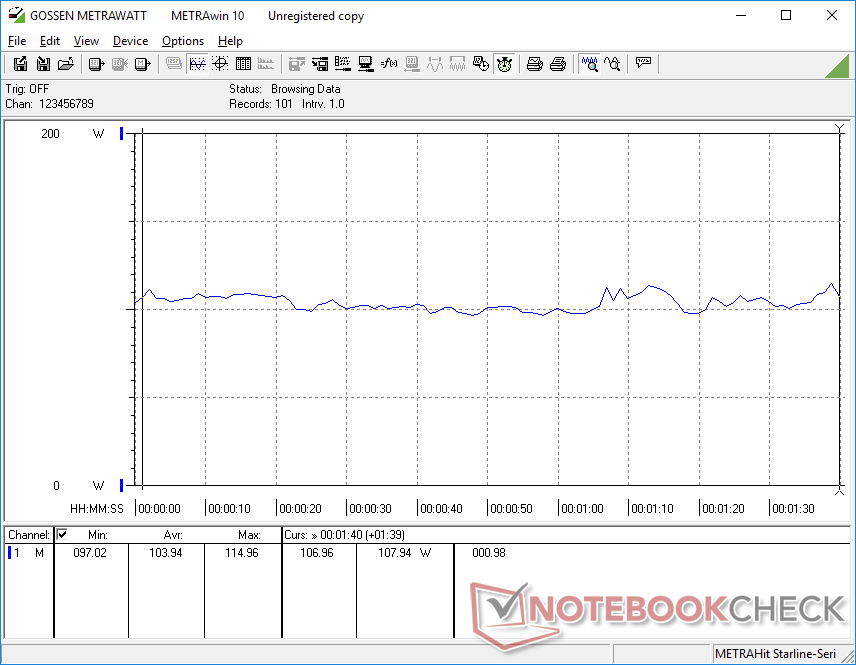
The highest consumption we can record is 131 W when running both Prime95 and FurMark simultaneously. This is unsustainable due to throttling, however, and consumption quickly falls to about 103 W after just a minute or so. The medium-sized (~14.4 x 6.5 x 2.2 cm) 130 W AC adapter is therefore just barely sufficient for powering the notebook under extreme processing loads.
Note that the small spikes in power consumption when running Prime95 in the graph below align with the spikes in core temperature from our Stress Test section.


| Off / Standby | |
| Idle | |
| Load |
|
Key:
min: | |
| Dell XPS 15 9570 Core i9 UHD i9-8950HK, GeForce GTX 1050 Ti Max-Q, Samsung SSD PM981 MZVLB1T0HALR, IPS, 3840x2160, 15.6" | Dell XPS 15 9570 i7 UHD i7-8750H, GeForce GTX 1050 Ti Max-Q, Toshiba XG5 KXG50ZNV512G, IPS, 3840x2160, 15.6" | Asus ZenBook Pro 15 UX580GE i9-8950HK, GeForce GTX 1050 Ti Mobile, Samsung SSD PM961 1TB M.2 PCIe 3.0 x4 NVMe (MZVLW1T0), IPS, 3840x2160, 15.6" | Lenovo ThinkPad X1 Extreme-20MF000XGE i7-8750H, GeForce GTX 1050 Ti Max-Q, Samsung SSD PM981 MZVLB1T0HALR, IPS, 3840x2160, 15.6" | Dell XPS 15 9575 i7-8705G i7-8705G, Vega M GL / 870, SK hynix PC401 NVMe 500 GB, IPS, 3840x2160, 15.6" | Razer Blade 15 Base Model i7-8750H, GeForce GTX 1060 Max-Q, Samsung SSD PM981 MZVLB256HAHQ, IPS, 1920x1080, 15.6" | |
|---|---|---|---|---|---|---|
| Power Consumption | -12% | -24% | 0% | 15% | -12% | |
| Idle Minimum * (Watt) | 7.1 | 9.48 -34% | 11.7 -65% | 7.6 -7% | 6.2 13% | 10.2 -44% |
| Idle Average * (Watt) | 13.6 | 16.1 -18% | 18.5 -36% | 14.8 -9% | 12.9 5% | 13.2 3% |
| Idle Maximum * (Watt) | 14.1 | 16.9 -20% | 22.8 -62% | 17.6 -25% | 13.6 4% | 17.6 -25% |
| Load Average * (Watt) | 103.9 | 90.8 13% | 97.5 6% | 86 17% | 76.1 27% | 99.5 4% |
| Witcher 3 ultra * (Watt) | 103 | 102.9 -0% | 85 17% | 84.3 18% | 113.6 -10% | |
| Load Maximum * (Watt) | 130.9 | 134.4 -3% | 111.1 15% | 118.9 9% | 99.4 24% | 133.3 -2% |
* ... smaller is better
Battery Life
Runtimes are slightly shorter than the i7 XPS 15 SKU. Nonetheless, users can still expect around 8 hours of constant WLAN use before needing to recharge the large 97 Wh internal battery. Be sure to run on Power Saver, Cool, or Quiet mode alongside the integrated Intel UHD GPU to squeeze more from the battery.
Charging from near empty to full capacity takes 2 to 2.5 hours or almost a full hour longer than on most Ultrabooks.
| Dell XPS 15 9570 Core i9 UHD i9-8950HK, GeForce GTX 1050 Ti Max-Q, 97 Wh | Dell XPS 15 9570 i7 UHD i7-8750H, GeForce GTX 1050 Ti Max-Q, 97 Wh | Asus ZenBook Pro 15 UX580GE i9-8950HK, GeForce GTX 1050 Ti Mobile, 71 Wh | Lenovo ThinkPad X1 Extreme-20MF000XGE i7-8750H, GeForce GTX 1050 Ti Max-Q, 80 Wh | Dell XPS 15 9575 i7-8705G i7-8705G, Vega M GL / 870, 75 Wh | HP Spectre x360 15-ch011nr i5-8550U, GeForce MX150, 84 Wh | Razer Blade 15 Base Model i7-8750H, GeForce GTX 1060 Max-Q, 65 Wh | |
|---|---|---|---|---|---|---|---|
| Battery runtime | 21% | -1% | 17% | -11% | 51% | -3% | |
| Reader / Idle (h) | 15 | 14 -7% | 11.5 -23% | 11.2 -25% | 15.5 3% | 11.5 -23% | |
| WiFi v1.3 (h) | 8.6 | 9.6 12% | 6.3 -27% | 6.4 -26% | 7 -19% | 10.4 21% | 5.5 -36% |
| Load (h) | 1 | 1.3 30% | 1.3 30% | 2 100% | 1.1 10% | 2.3 130% | 1.5 50% |
| Witcher 3 ultra (h) | 1 | 1.1 |
Verdict
Pros
Cons

There's a reason why the same Core i9-8950HK runs much faster on the thick and heavy MSI GT75. To get the most out of the Core i9 CPU, the cooling solution must be up to snuff to sustain faster Turbo Boost clock rates at reasonable temperatures.
For our i9 XPS 15, this appears to be the classic case of jamming a very powerful Core i9 processor in a chassis more appropriate for a Core i7 instead. We've seen this before on both the i9 ZenBook UX580 and i9 Eurocom Q8 and the i9 XPS 15 is no different. The i9-8950HK is wholly capable of running 25 percent faster than the i7-8750H, but i9 XPS 15 owners will see a boost of just 10 percent at best compared to 50 percent between the i5 XPS 15 and i7 XPS 15.
As of this writing, the i9 XPS 15 SKU is $250 USD more than the i7 XPS 15. We recommend topping out at the Core i7 level and then investing in RAM, storage, display, and/or graphics for a more tangible boost in performance.
Dell XPS 15 9570 Core i9 UHD
- 11/10/2018 v6 (old)
Allen Ngo
Price comparison
