Reviews for the Intel Core i5-8300H processor
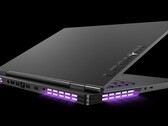
Lenovo Legion Y730-15ICH (i5-8300H, GTX 1050 Ti) Laptop Review
The Legion Y730 is the higher-end alternative to the Legion Y530 and legion Y7000 with flagship-like features including per-key RGB lighting, Thunderbolt 3, and dedicated Macro keys. It's just too bad that current SKUs are limited to the GeForce GTX 1050 Ti.
Intel Core i5-8300H, NVIDIA GeForce GTX 1050 Ti Mobile, 15.6", 2.2 kgMSI GF63 8RC (i5-8300H, GTX 1050) Laptop Review
The GF63 is nearly the same size and weight as the GS65 but for hundreds of dollars less. MSI has created an excellent budget gaming system that's also light enough for schoolwork and travel.
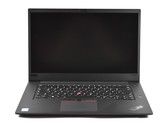
Intel Core i5-8300H, NVIDIA GeForce GTX 1050 Mobile, 15.6", 1.9 kgLenovo ThinkPad X1 Extreme (i5, FHD, GTX 1050 Ti Max-Q) Laptop Review
The more expensive model of the ThinkPad X1 Extreme has been found to be a worthy competitor to the Dell XPS 15 in many respects. Today, the question is whether the same is true for the base model with the i5-8300H and the matte FHD screen. Find out which configuration of the X1 Extreme fares better in this comprehensive review!
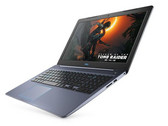
Intel Core i5-8300H, NVIDIA GeForce GTX 1050 Ti Max-Q, 15.6", 1.7 kgDell G3 15 3579 (i5-8300H, GTX 1050, FHD) Laptop Review
Value-oriented. The new Dell G series caters to gamers on tighter budgets who may find the Alienware series to be out of reach. While core performance remains intact, the cut corners for this inexpensive offering add up quickly.
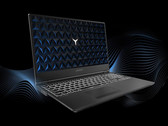
Intel Core i5-8300H, NVIDIA GeForce GTX 1050 Mobile, 15.6", 2.5 kgLenovo Legion Y530 (Core i5-8300H, GTX 1050 Ti) Laptop Review
Function over form. Lenovo doubles down on their Y520 with an even more subdued, business-like design and all the latest components. With a Core i5-8300H, GTX 1050 Ti, and NVMe SSD, is the Y530 the new entry-level gaming laptop to own?
Intel Core i5-8300H, NVIDIA GeForce GTX 1050 Ti Mobile, 15.6", 2.3 kgHP Omen 15-dc0001ng: NVIDIA GeForce GTX 1050 Ti Mobile, 15.60", 2.4 kg
Review » HP Omen 15 (i5-8300H, GTX 1050 Ti, FHD) Laptop Review
Dell G3 17 3779: NVIDIA GeForce GTX 1050 Mobile, 17.30", 3 kg
Review » Dell G3 17 3779 (i5-8300H, GTX 1050, SSD, IPS) Laptop Review
MSI GL63 8RC-069US: NVIDIA GeForce GTX 1050 Mobile, 15.60", 2.2 kg
Review » MSI GL63 8RC (i5-8300H, GTX 1050) Laptop Review
Dell G5 15 5587: NVIDIA GeForce GTX 1060 Max-Q, 15.60", 2.9 kg
Review » Dell G5 15 5587 (i5-8300H, GTX 1060 Max-Q, SSD, IPS) Laptop Review
MSI GV62 8RE-016US: NVIDIA GeForce GTX 1060 Mobile, 15.60", 2.2 kg
Review » MSI GV62 8RE (i5-8300H, GTX 1060, FHD) Laptop Review
Acer Predator Helios 300 PH317-52-51M6: NVIDIA GeForce GTX 1050 Ti Mobile, 17.30", 2.9 kg
Review » Acer Predator Helios 300 (i5-8300H, GTX 1050 Ti, Full-HD) Laptop Review
Dell XPS 15 2018 i5 FHD 97Wh: NVIDIA GeForce GTX 1050 Mobile, 15.60", 1.9 kg
Review » Dell XPS 15 2018 9570 (8300H, GTX 1050, 97Wh) Laptop Review
Asus FX504GD: NVIDIA GeForce GTX 1050 Mobile, 15.60", 2.3 kg
Review » Asus TUF FX504GD (Core i5-8300H, GTX 1050) Laptop Review
Asus X571GT-BQ597: NVIDIA GeForce GTX 1650 Mobile, 15.60", 2 kg
External Review » Asus X571GT-BQ597
Asus X571GD-BQ353: NVIDIA GeForce GTX 1050 Mobile, 15.60", 2 kg
External Review » Asus X571GD-BQ353
HP Pavilion Gaming 15-CX0020NS: NVIDIA GeForce GTX 1050 Mobile, 15.60", 2.4 kg
External Review » HP Pavilion Gaming 15-CX0020NS
Asus F571GD-BQ409: NVIDIA GeForce GTX 1050 Mobile, 15.60", 1.8 kg
External Review » Asus F571GD-BQ409
HP Pavilion Gaming 15-cx0001ns: NVIDIA GeForce GTX 1050 Mobile, 15.60", 2.2 kg
External Review » HP Pavilion Gaming 15-cx0001ns
HP Pavilion 15-BC416NS: NVIDIA GeForce GTX 1050 Mobile, 15.60", 2.2 kg
External Review » HP Pavilion 15-BC416NS
Acer Nitro 5 AN515-52-51P6: NVIDIA GeForce GTX 1050 Mobile, 15.60", 2.7 kg
External Review » Acer Nitro 5 AN515-52-51P6
Lenovo Legion Y740-15ICHg-81HE003YGE: NVIDIA GeForce RTX 2060 Mobile, 15.60", 2.2 kg
External Review » Lenovo Legion Y740-15ICHg-81HE003YGE
Acer Aspire 7 A715-72G-51XK: NVIDIA GeForce GTX 1050 Mobile, 15.60", 2.4 kg
External Review » Acer Aspire 7 A715-72G-51XK
Asus TUF FX504GD-DM194: NVIDIA GeForce GTX 1050 Mobile, 15.60", 2.3 kg
External Review » Asus TUF FX504GD-DM194
Acer Nitro 5 AN515-52-569N: NVIDIA GeForce GTX 1050 Mobile, 15.60", 2.7 kg
External Review » Acer Nitro 5 AN515-52-569N
HP Gaming Pavilion 15-cx0140tx: NVIDIA GeForce GTX 1050 Mobile, 15.60", 2.2 kg
External Review » HP Gaming Pavilion 15-cx0140tx
Lenovo IdeaPad 330-15ICH 81FK003XM: NVIDIA GeForce GTX 1050 Mobile, 15.60", 2.2 kg
External Review » Lenovo IdeaPad 330-15ICH 81FK003XM
HP OMEN 15-dc0004ns: NVIDIA GeForce GTX 1050 Mobile, 15.60", 2.4 kg
External Review » HP OMEN 15-dc0004ns
Lenovo Ideapad 330-15ICH-81FK00EGSP: NVIDIA GeForce GTX 1050 Mobile, 15.60", 2.2 kg
External Review » Lenovo Ideapad 330-15ICH-81FK00EGSP
Lenovo IdeaPad 330-15ICH-81FK003YMH: NVIDIA GeForce GTX 1050 Mobile, 15.60", 2.2 kg
External Review » Lenovo IdeaPad 330-15ICH-81FK003YMH
HP Pavilion 15-cx0025nf: NVIDIA GeForce GTX 1060 Mobile, 15.60", 2.4 kg
External Review » HP Pavilion 15-cx0025nf
HP EliteBook 1050 G1-3ZH19EA: Intel UHD Graphics 630, 15.60", 2.1 kg
External Review » HP EliteBook 1050 G1-3ZH19EA
Acer Predator Triton 500 PT515-51-557V: NVIDIA GeForce RTX 2060 Mobile, 15.60", 2.1 kg
External Review » Acer Predator Triton 500 PT515-51-557V
Asus TUF FX504GE-DM122T: NVIDIA GeForce GTX 1050 Ti Mobile, 15.60", 2.3 kg
External Review » Asus TUF FX504GE-DM122T
HP Pavilion 15-bc409ns: NVIDIA GeForce GTX 1050 Ti Mobile, 15.60", 2.2 kg
External Review » HP Pavilion 15-bc409ns
Acer Aspire 7 A717-72G-534E: NVIDIA GeForce GTX 1050 Mobile, 17.30", 2.9 kg
External Review » Acer Aspire 7 A717-72G-534E
Asus TUF FX705GD-EW081T: NVIDIA GeForce GTX 1050 Mobile, 17.30", 2.6 kg
External Review » Asus TUF FX705GD-EW081T
Lenovo Legion Y730-15ICH i5-8300H: NVIDIA GeForce GTX 1050 Ti Mobile, 15.60", 2.2 kg
External Review » Lenovo Legion Y730-15ICH i5-8300H
Dell G5 15 5587-M2NXM: NVIDIA GeForce GTX 1060 Max-Q, 15.60", 2.9 kg
External Review » Dell G5 15 5587-M2NXM
Lenovo Ideapad 330-15ICH-81FK00A1SP: NVIDIA GeForce GTX 1050 Mobile, 15.60", 2.2 kg
External Review » Lenovo Ideapad 330-15ICH-81FK00A1SP
HP Pavilion 15-cx0013ns: NVIDIA GeForce GTX 1050 Mobile, 15.60", 2.3 kg
External Review » HP Pavilion 15-cx0013ns
Lenovo Ideapad 330-15ICH-81FK0071SP: NVIDIA GeForce GTX 1050 Mobile, 15.60", 2.2 kg
External Review » Lenovo Ideapad 330-15ICH-81FK0071SP
Asus TUF FX504GD-DM521T: NVIDIA GeForce GTX 1050 Mobile, 15.60", 2.3 kg
External Review » Asus TUF FX504GD-DM521T
Dell XPS 15 9570 CNX97001: NVIDIA GeForce GTX 1050 Mobile, 15.60", 2 kg
External Review » Dell XPS 15 9570 CNX97001
Medion Erazer P6705-MD61205: NVIDIA GeForce GTX 1050 Ti Mobile, 15.60", 2.7 kg
External Review » Medion Erazer P6705-MD61205
Asus TUF FX505GD-BQ111: NVIDIA GeForce GTX 1050 Mobile, 15.60", 2.2 kg
External Review » Asus TUF FX505GD-BQ111
Asus TUF FX705GM-EW163T: NVIDIA GeForce GTX 1060 Mobile, 17.30", 2.7 kg
External Review » Asus TUF FX705GM-EW163T
Lenovo ThinkPad X1 Extreme-20MF000RGE: NVIDIA GeForce GTX 1050 Ti Max-Q, 15.60", 1.7 kg
External Review » Lenovo ThinkPad X1 Extreme-20MF000RGE
Lenovo Legion Y530-81FV00G0IX: NVIDIA GeForce GTX 1050 Mobile, 15.60", 2.3 kg
External Review » Lenovo Legion Y530-81FV00G0IX
Dell G3 15 3579-CN35711: NVIDIA GeForce GTX 1050 Mobile, 15.60", 2.5 kg
External Review » Dell G3 15 3579-CN35711
Medion Erazer P6705-MD61206: NVIDIA GeForce GTX 1050 Ti Mobile, 15.60", 2.7 kg
External Review » Medion Erazer P6705-MD61206
Asus TUF FX504GM-EN003: NVIDIA GeForce GTX 1060 Mobile, 15.60", 2.3 kg
External Review » Asus TUF FX504GM-EN003
Medion Erazer P6605-MD61174: NVIDIA GeForce GTX 1050 Mobile, 15.60", 2.7 kg
External Review » Medion Erazer P6605-MD61174
Lenovo Legion Y530-15ICH-81FV00GEMH: NVIDIA GeForce GTX 1050 Mobile, 15.60", 2.3 kg
External Review » Lenovo Legion Y530-15ICH-81FV00GEMH
Asus TUF FX505GE-BQ115T: NVIDIA GeForce GTX 1050 Ti Mobile, 15.60", 2.2 kg
External Review » Asus TUF FX505GE-BQ115T
HP Omen 17-an100nw: NVIDIA GeForce GTX 1050 Mobile, 17.30", 3.8 kg
External Review » HP Omen 17-an100nw
Acer Nitro 5 AN515-52-5336: NVIDIA GeForce GTX 1050 Mobile, 15.60", 2.7 kg
External Review » Acer Nitro 5 AN515-52-5336
Lenovo Legion Y530-81FV008VFR: NVIDIA GeForce GTX 1050 Mobile, 15.60", 2.3 kg
External Review » Lenovo Legion Y530-81FV008VFR
Acer Aspire 7 A715-72G-56E9: NVIDIA GeForce GTX 1050 Ti Mobile, 15.60", 2.4 kg
External Review » Acer Aspire 7 A715-72G-56E9
Lenovo Legion Y530-15ICH-81FV00G6GE: NVIDIA GeForce GTX 1050 Mobile, 15.60", 2.3 kg
External Review » Lenovo Legion Y530-15ICH-81FV00G6GE
Lenovo Legion Y530-81FV0018CK: NVIDIA GeForce GTX 1050 Mobile, 15.60", 2.3 kg
External Review » Lenovo Legion Y530-81FV0018CK
MSI GL63 8RC-255CZ: NVIDIA GeForce GTX 1050 Mobile, 15.60", 2.2 kg
External Review » MSI GL63 8RC-255CZ
Lenovo Ideapad 330-15ICH-81FK006WSP: NVIDIA GeForce GTX 1050 Mobile, 15.60", 2.2 kg
External Review » Lenovo Ideapad 330-15ICH-81FK006WSP
Lenovo IdeaPad 330-17ICH-81FL000CGE: NVIDIA GeForce GTX 1050 Mobile, 17.30", 2.8 kg
External Review » Lenovo IdeaPad 330-17ICH-81FL000CGE
HP Pavilion 15-cx0053ns: NVIDIA GeForce GTX 1050 Ti Mobile, 15.60", 2.3 kg
External Review » HP Pavilion 15-cx0053ns
Lenovo Legion Y530-15ICH-81FV0013US: NVIDIA GeForce GTX 1050 Mobile, 15.60", 2.3 kg
External Review » Lenovo Legion Y530-15ICH-81FV0013US
Dell Vostro 15 7580: NVIDIA GeForce GTX 1060 Max-Q, 15.60", 2.8 kg
External Review » Dell Vostro 15 7580
Acer Nitro 5 AN515-52-5228: NVIDIA GeForce GTX 1050 Ti Mobile, 15.60", 2.7 kg
External Review » Acer Nitro 5 AN515-52-5228
HP Gaming Pavilion 15-cx0002ng: NVIDIA GeForce GTX 1050 Ti Mobile, 15.60", 2.3 kg
External Review » HP Gaming Pavilion 15-cx0002ng
Asus ROG STRIX GL504GM-ES244T: NVIDIA GeForce GTX 1060 Mobile, 15.60", 2.4 kg
External Review » Asus ROG STRIX GL504GM-ES244T
HP Omen 15-dc0002ns: NVIDIA GeForce GTX 1050 Mobile, 15.60", 2.4 kg
External Review » HP Omen 15-dc0002ns
Dell G3 17 3779: NVIDIA GeForce GTX 1050 Mobile, 17.30", 3 kg
External Review » Dell G3 17 3779
Acer Predator Helios 300 PH315-51-50Y7: NVIDIA GeForce GTX 1060 Mobile, 15.60", 2.7 kg
External Review » Acer Predator Helios 300 PH315-51-50Y7
Acer Aspire Nitro 5 AN515-52-51T2: NVIDIA GeForce GTX 1050 Mobile, 15.60", 2.7 kg
External Review » Acer Aspire Nitro 5 AN515-52-51T2
Acer Predator Helios 300 PH317-52-571B: NVIDIA GeForce GTX 1060 Mobile, 17.30", 3 kg
External Review » Acer Predator Helios 300 PH317-52-571B
Acer Aspire 7 A715-72G-57R2: NVIDIA GeForce GTX 1050 Mobile, 15.60", 2.4 kg
External Review » Acer Aspire 7 A715-72G-57R2
MSI GL63 8RC-069US: NVIDIA GeForce GTX 1050 Mobile, 15.60", 2.2 kg
External Review » MSI GL63 8RC-069US
HP Omen 15-dc0001ng: NVIDIA GeForce GTX 1050 Ti Mobile, 15.60", 2.4 kg
External Review » HP Omen 15-dc0001ng
Acer Predator Helios 300 PH315-51-53MZ: NVIDIA GeForce GTX 1060 Mobile, 15.60", 2.7 kg
External Review » Acer Predator Helios 300 PH315-51-53MZ
HP Pavilion 15-bc450ns: NVIDIA GeForce GTX 1050 Mobile, 15.60", 2.2 kg
External Review » HP Pavilion 15-bc450ns
Acer Aspire Nitro 5 AN515-52-5825: NVIDIA GeForce GTX 1060 Mobile, 15.60", 2.7 kg
External Review » Acer Aspire Nitro 5 AN515-52-5825
Asus FX504GD: NVIDIA GeForce GTX 1050 Mobile, 15.60", 2.3 kg
External Review » Asus FX504GD
Asus TUF FX504GE-US52: NVIDIA GeForce GTX 1050 Ti Mobile, 15.60", 2.3 kg
External Review » Asus TUF FX504GE-US52
Asus TUF FX504GD-ES51: NVIDIA GeForce GTX 1050 Mobile, 15.60", 2.3 kg
External Review » Asus TUF FX504GD-ES51
Acer Nitro 5 AN515-53-52FA: NVIDIA GeForce GTX 1050 Mobile, 15.60", 2.3 kg
External Review » Acer Nitro 5 AN515-53-52FA
Acer Aspire 7 A715-72G-517N: NVIDIA GeForce GTX 1050 Mobile, 15.60", 2.4 kg
External Review » Acer Aspire 7 A715-72G-517N
Acer Nitro 5 AN515-53-55G9: NVIDIA GeForce GTX 1050 Ti Mobile, 15.60", 2.3 kg
External Review » Acer Nitro 5 AN515-53-55G9
Acer Aspire Nitro 5 AN515-52-58R5: NVIDIA GeForce GTX 1050 Mobile, 15.60", 2.3 kg
External Review » Acer Aspire Nitro 5 AN515-52-58R5
HP Pavilion 15-cx0002NS: NVIDIA GeForce GTX 1050 Mobile, 15.60", 2.2 kg
External Review » HP Pavilion 15-CX0002NS
Dell G3 15 3579: NVIDIA GeForce GTX 1050 Mobile, 15.60", 2.5 kg
External Review » Dell G3 15 3579
Lenovo Legion Y530-15ICH: NVIDIA GeForce GTX 1050 Ti Mobile, 15.60", 2.3 kg
External Review » Lenovo Legion Y530-15ICH
Dell G3 15 3579, GTX 1050 Ti, i5-8300H: NVIDIA GeForce GTX 1050 Ti Mobile, 15.60", 2.4 kg
External Review » Dell G3 3579, GTX 1050 Ti, i5-8300H
Dell XPS 15 2018 i5 FHD 97Wh: NVIDIA GeForce GTX 1050 Mobile, 15.60", 1.9 kg
External Review » Dell XPS 15 2018 i5 FHD 97Wh
Dell G5 15 5587-CN55802: NVIDIA GeForce GTX 1060 Max-Q, 15.60", 2.7 kg
External Review » Dell G5 15 5587-CN55802
MSI GV62 8RE-016US: NVIDIA GeForce GTX 1060 Mobile, 15.60", 2.2 kg
External Review » MSI GV62 8RE-016US
Acer Predator Helios 300 PH317-52-51M6: NVIDIA GeForce GTX 1050 Ti Mobile, 17.30", 2.9 kg
External Review » Acer Predator Helios 300 PH317-52-51M6
MSI GF63 8RC: NVIDIA GeForce GTX 1050 Mobile, 15.60", 1.9 kg
External Review » MSI GF63 8RC
Dell G5 15 5587: NVIDIA GeForce GTX 1050 Ti Mobile, 15.60", 2.6 kg
External Review » Dell G5 15 5587
Acer Aspire Nitro 5 AN515-52-50YX : NVIDIA GeForce GTX 1050 Ti Mobile, 15.60", 2.7 kg
External Review » Acer Aspire Nitro 5 AN515-52-50YX
Lenovo ThinkPad X1 Extreme-20MF000RGE: NVIDIA GeForce GTX 1050 Ti Max-Q, 15.60", 1.7 kg
» Lenovo ThinkPad X1 Extreme 4K vs. FHD
Dell XPS 15 2018 i5 FHD 97Wh: NVIDIA GeForce GTX 1050 Mobile, 15.60", 1.9 kg
» The XPS 15 9570 with i7-8750H CPU is almost twice as fast as its predecessor