MSI GL63 8RC (i5-8300H, GTX 1050) Laptop Review
Take a few steps down from the flagship MSI GT or GE series and you'll find yourself in the entry-level gaming segment populated by the GL, GP, and GF series. Our test unit today is the affordable GL63 that directly succeeds last year's GL62M and GL62. The refresh brings minor visual and internal adjustments as well as the all-important jump from the 7th gen Intel Core ix series to the current 8th gen Coffee Lake-H.
Current GL63 SKUs can be configured with the Core i5-8300H or i7-8750H CPU, 1080p IPS or 120 Hz/3 ms display, and the GTX 1050 or GTX 1050 Ti GPU. Storage options range wildly because of the dual internal storage slots. Our specific test unit is the lower-end configuration with the Core i5-8300H, GTX 1050, 8 GB of single-channel DDR4 RAM, and a 256 GB SATA III M.2 SSD for a retail price of roughly $800 to $900 USD. The MSI system competes directly with other inexpensive gaming notebooks like the Dell Inspiron 15 7577, Gigabyte Sabre 15, HP Pavilion Power, Lenovo Legion Y520, and the similarly named Asus GL series.
Other affordable MSI gaming laptops to consider:
Case
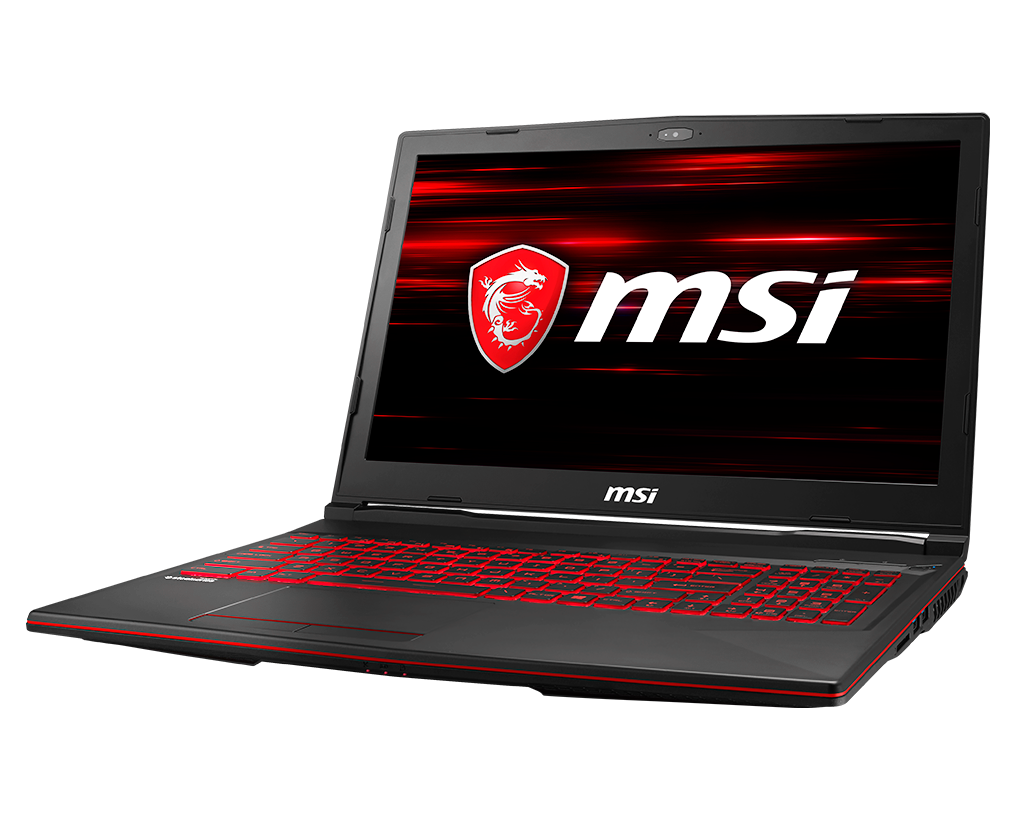
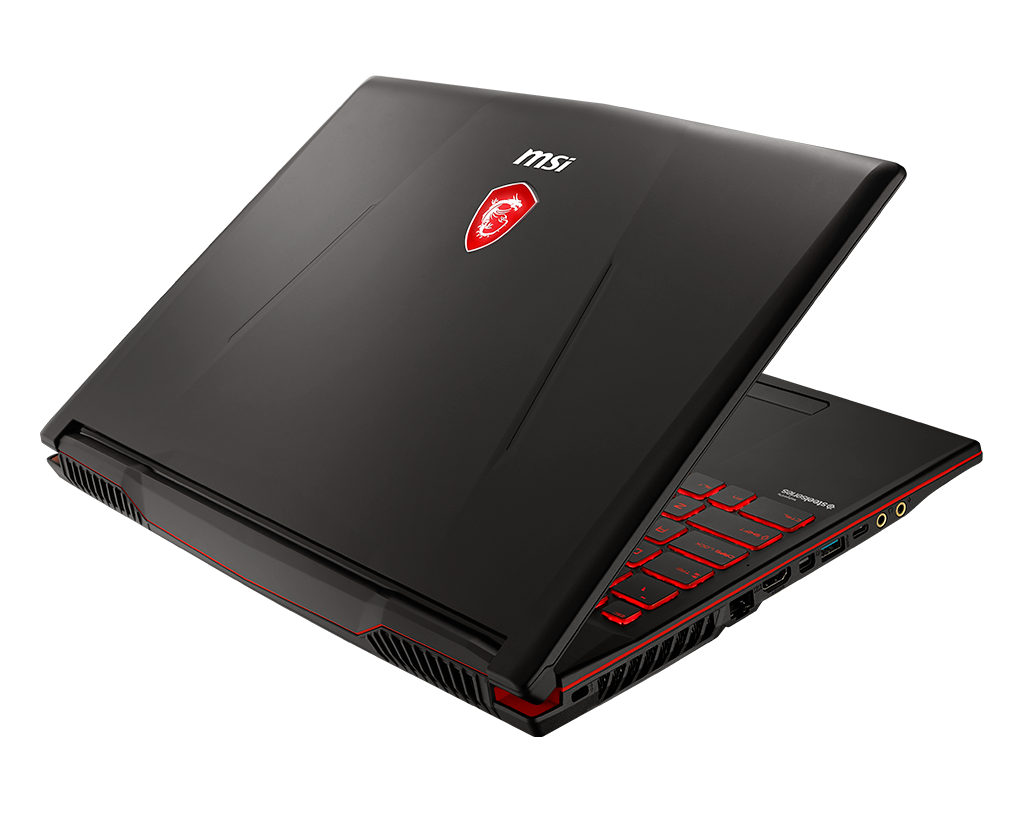
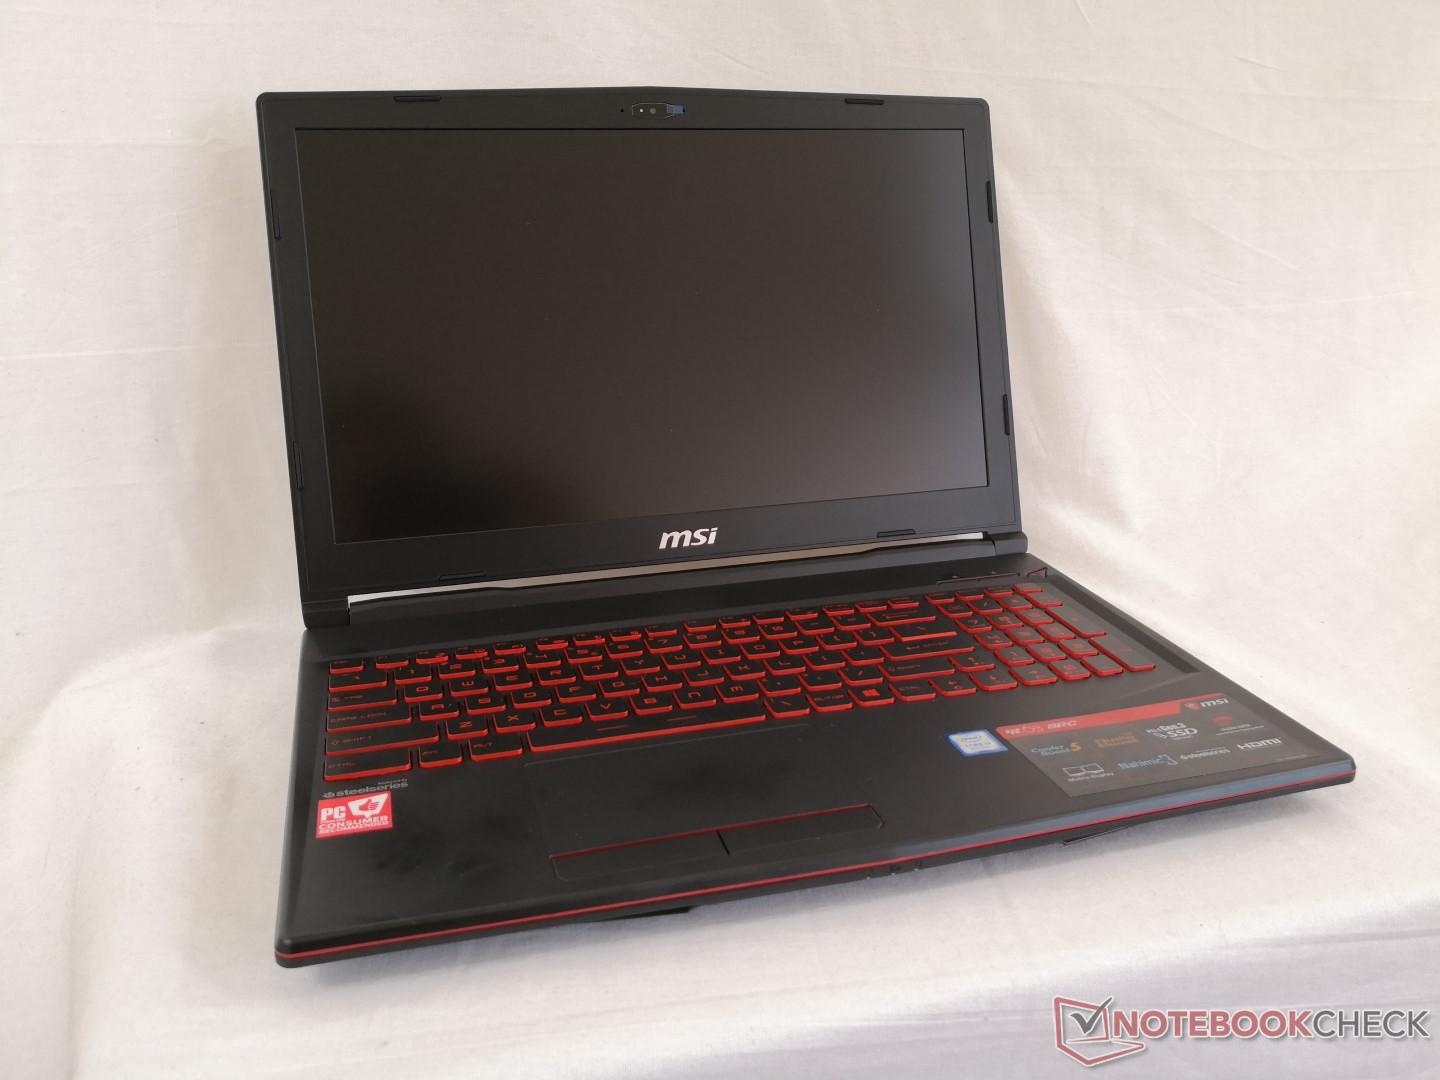
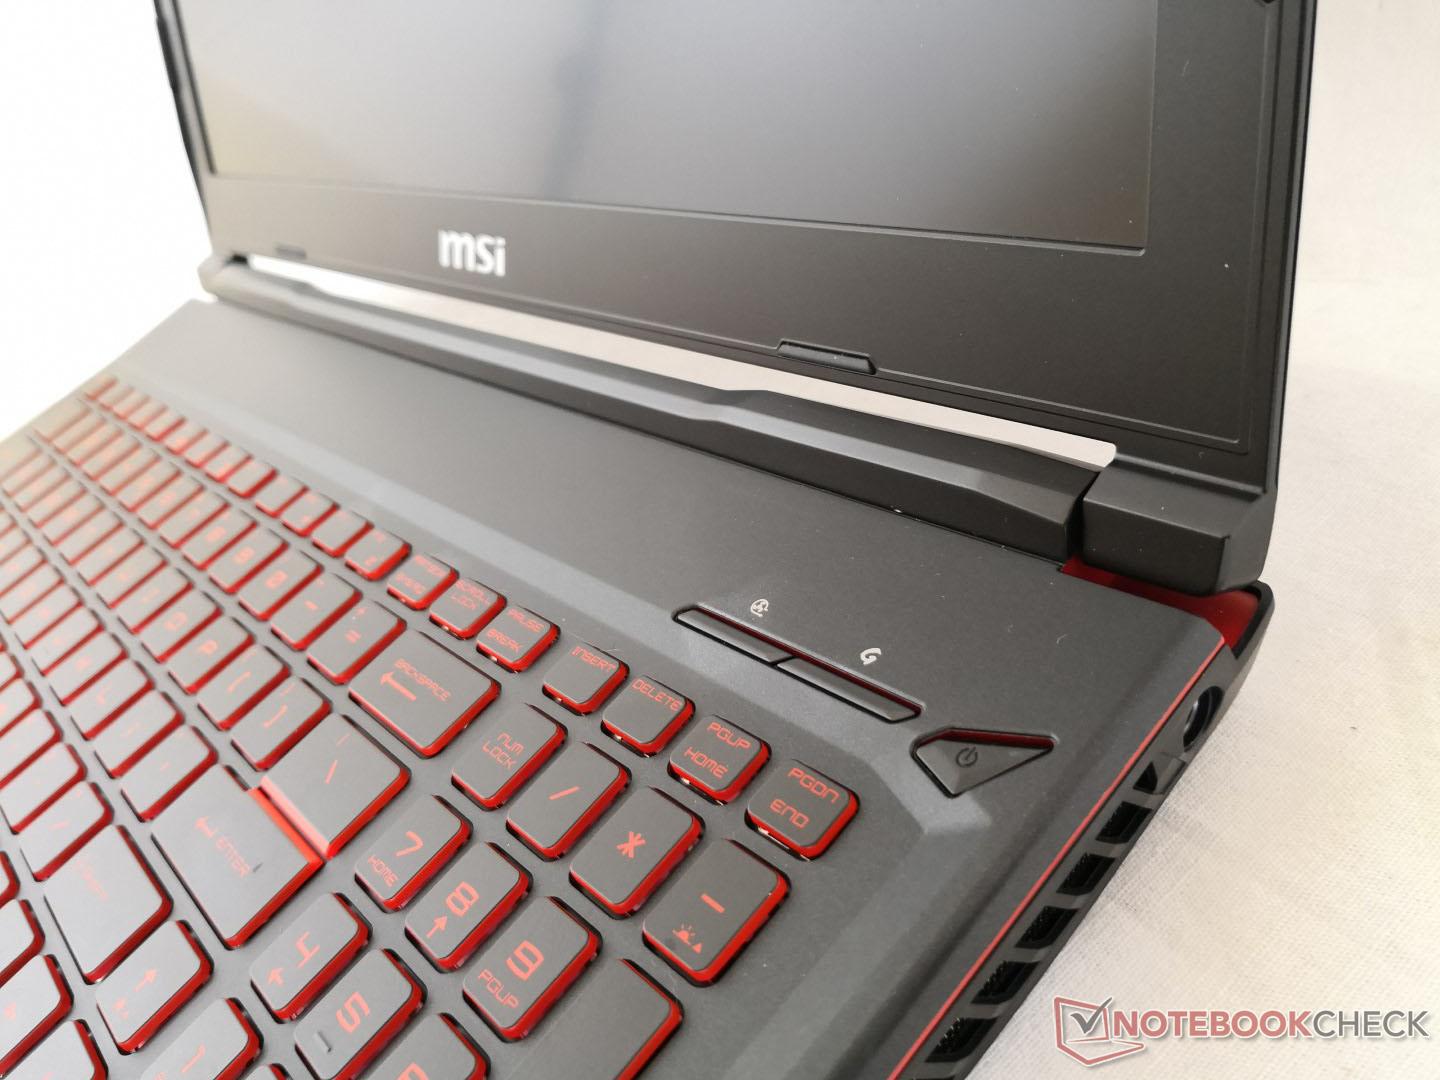
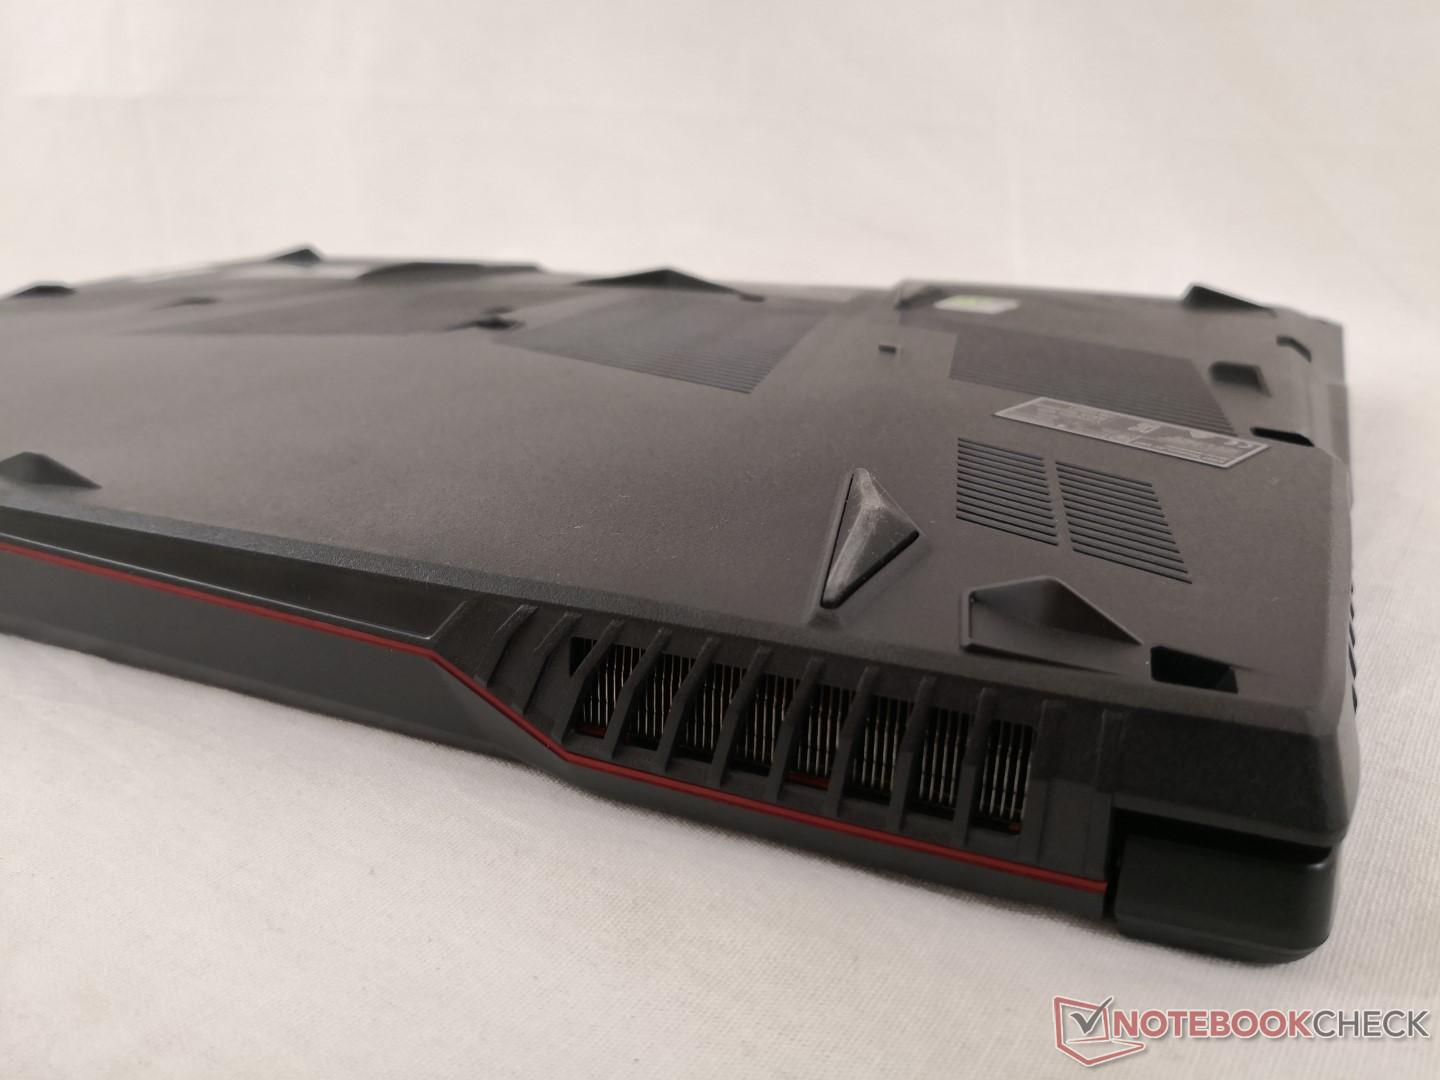
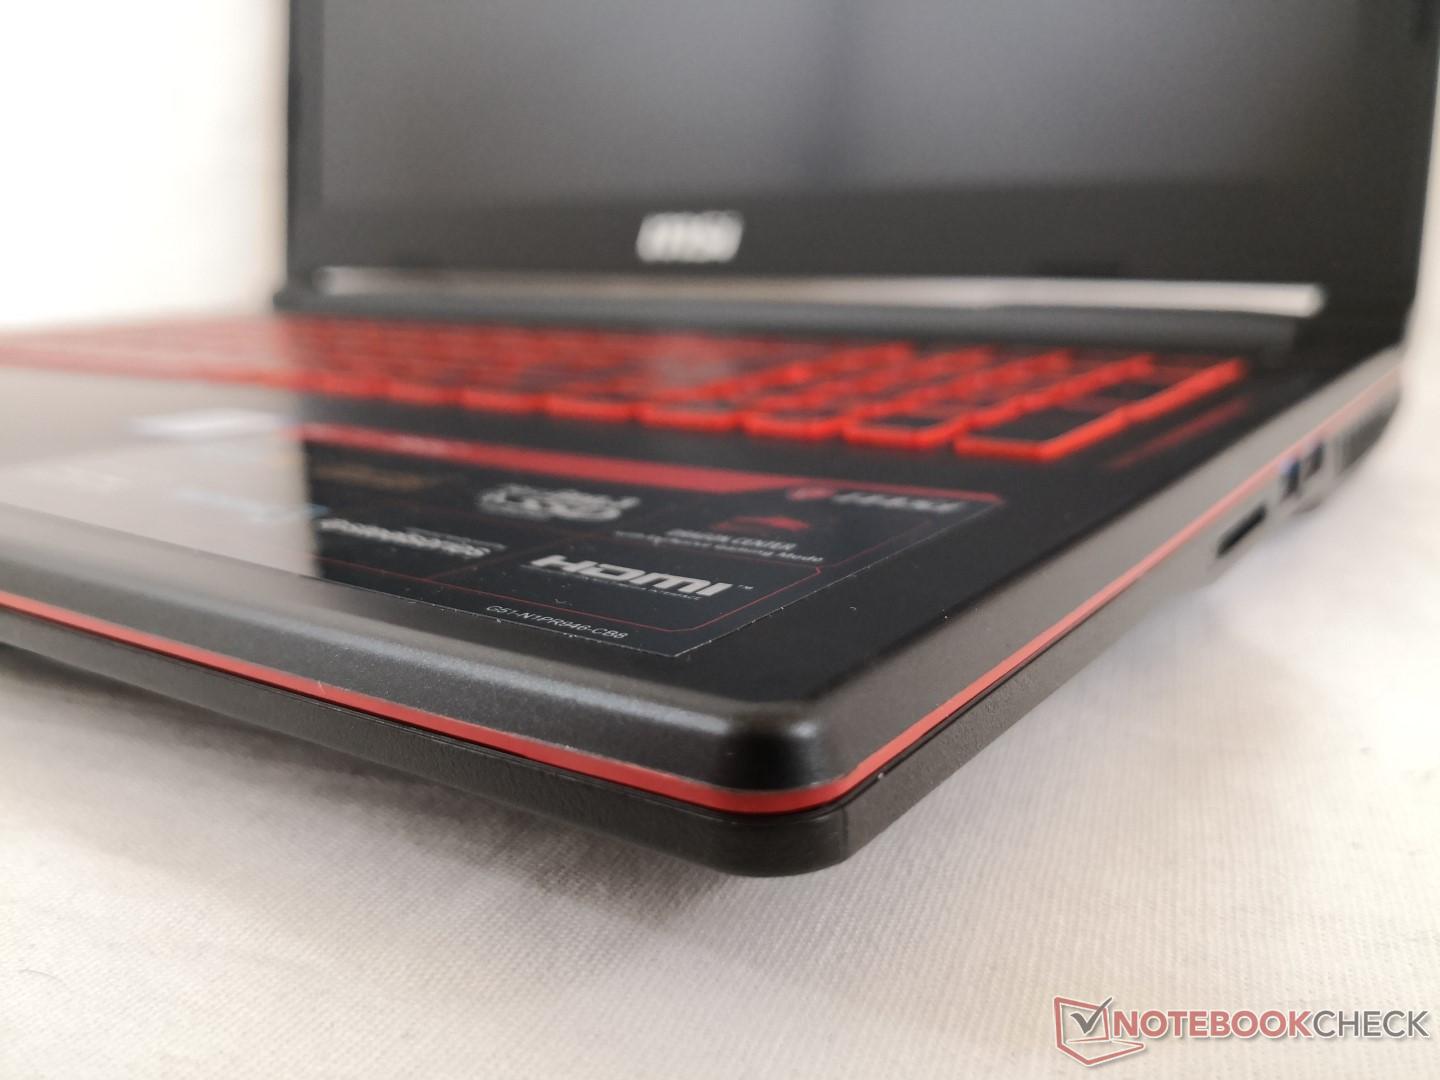
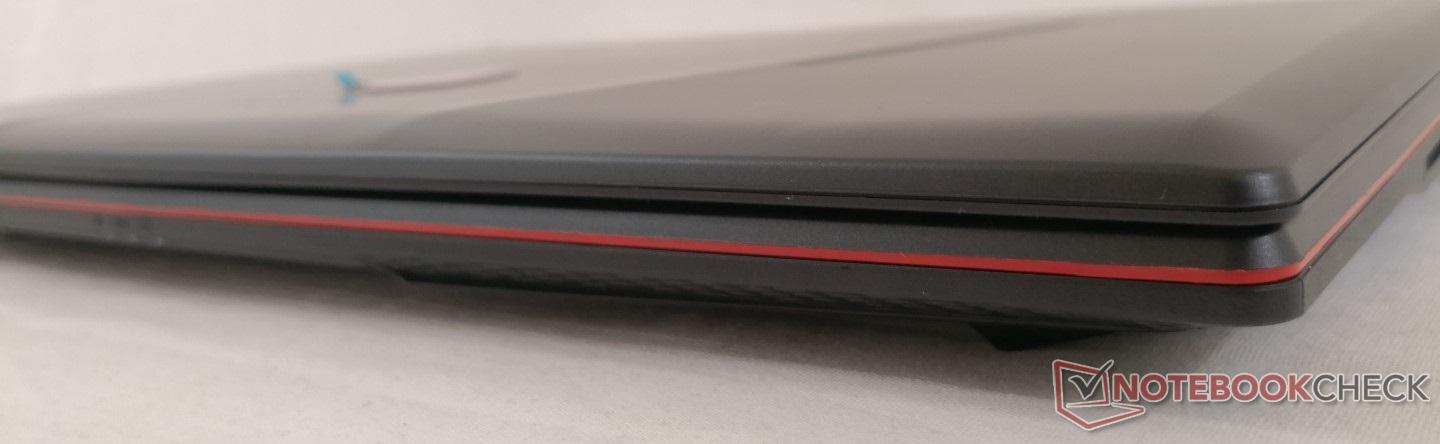
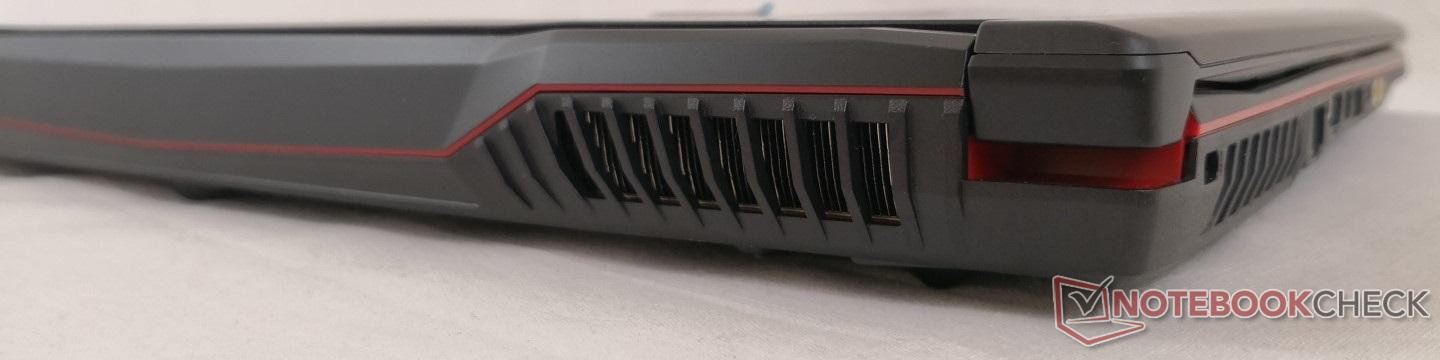
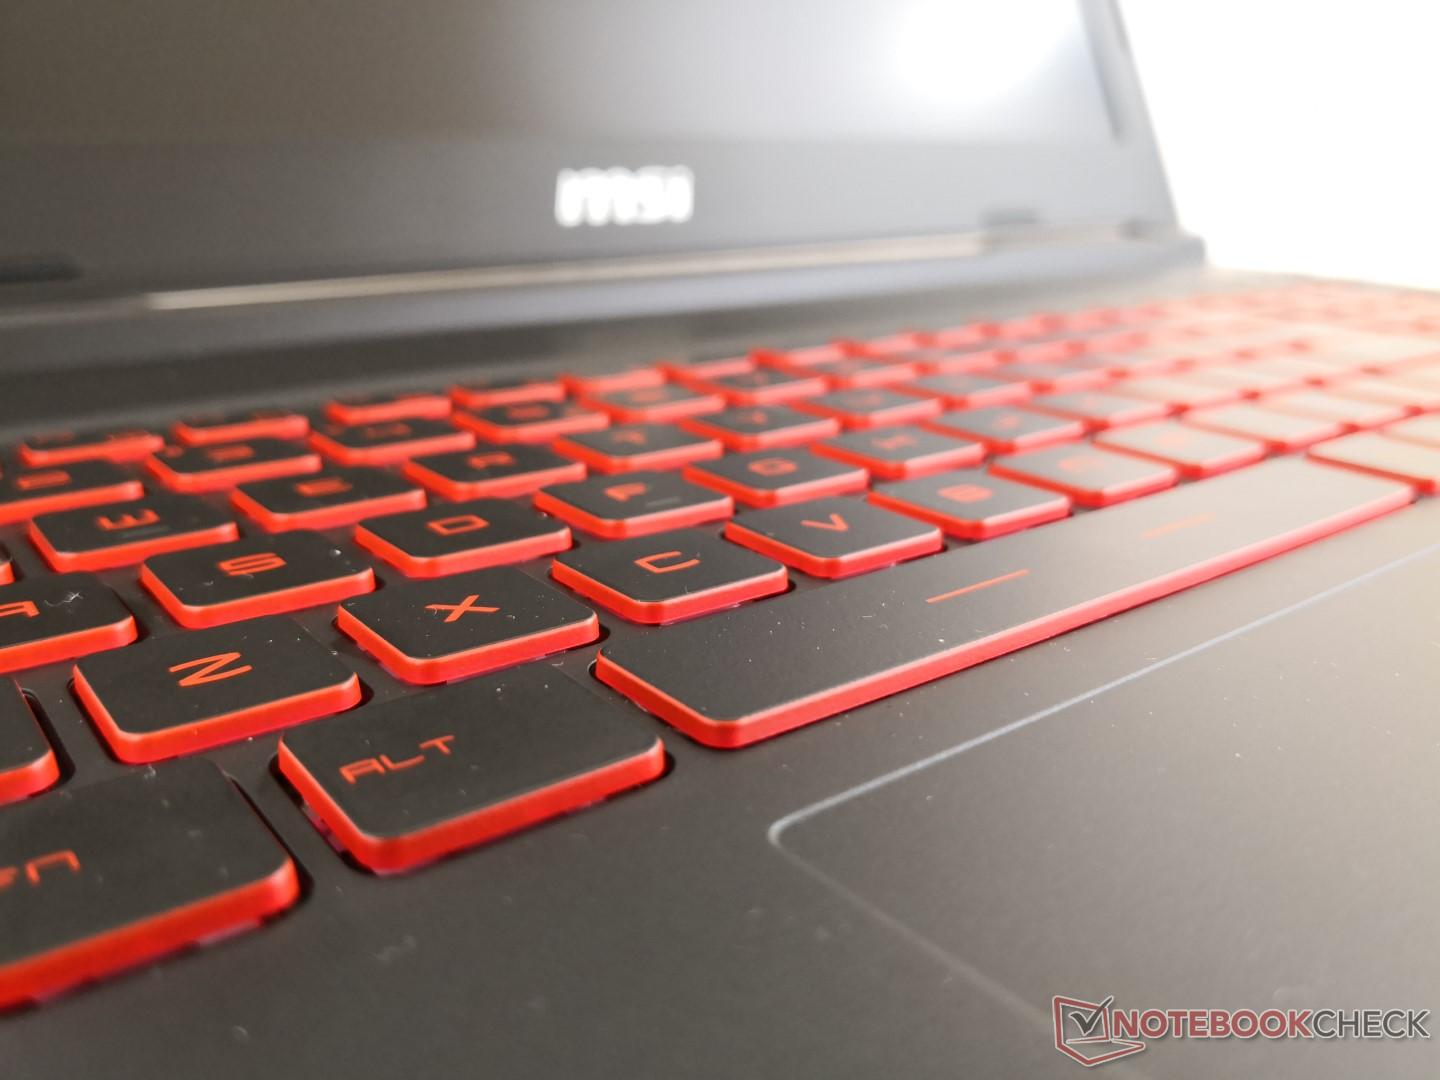
The chassis is visually distinct from the GP62 with newer accent marks, more red colors, and other superficial changes. The biggest change is the removal of the optical drive to make room for additional ventilation for improved cooling characteristics.
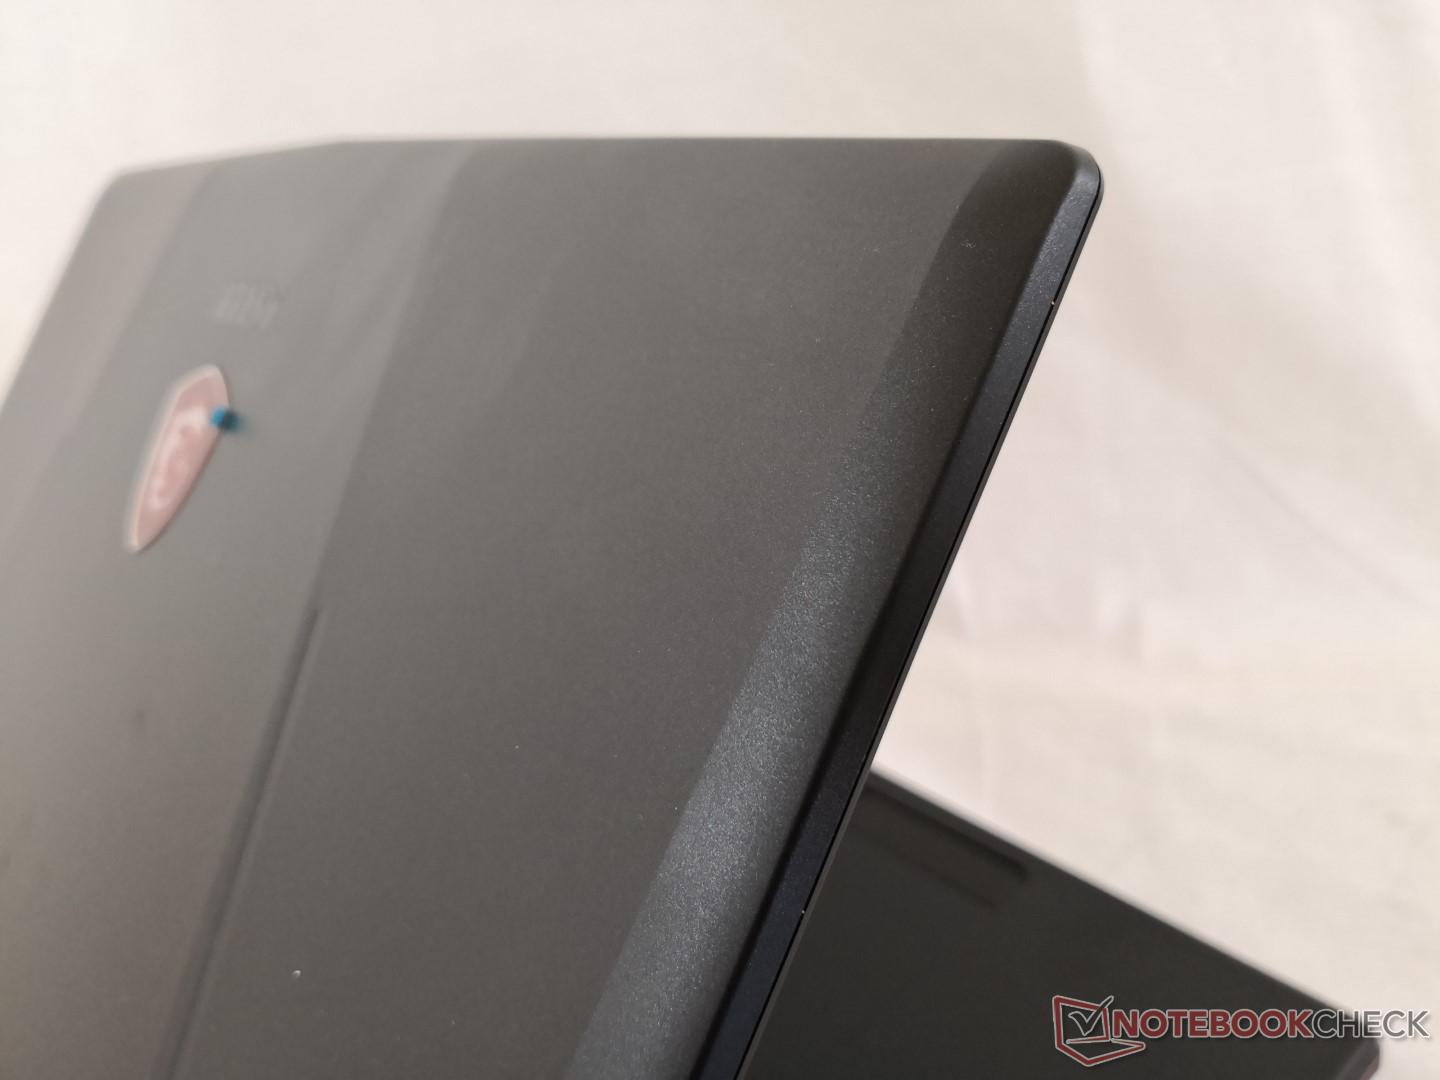
Other than the changes mentioned above, the GL63 still feels similar to the GL62 and GL62M. The plastic base is resistant to twists and depressions with almost no creaking while the lid is weaker and more susceptible to warping especially down its center. The small hinges are adequate and uniform up to their maximum of 150 degrees. One major drawback of the chassis is that grease and fingerprints are both difficult to clean and very easy to see. Perhaps a brushed aluminum or rubberized approach would have been better options to keep the system looking new for longer.
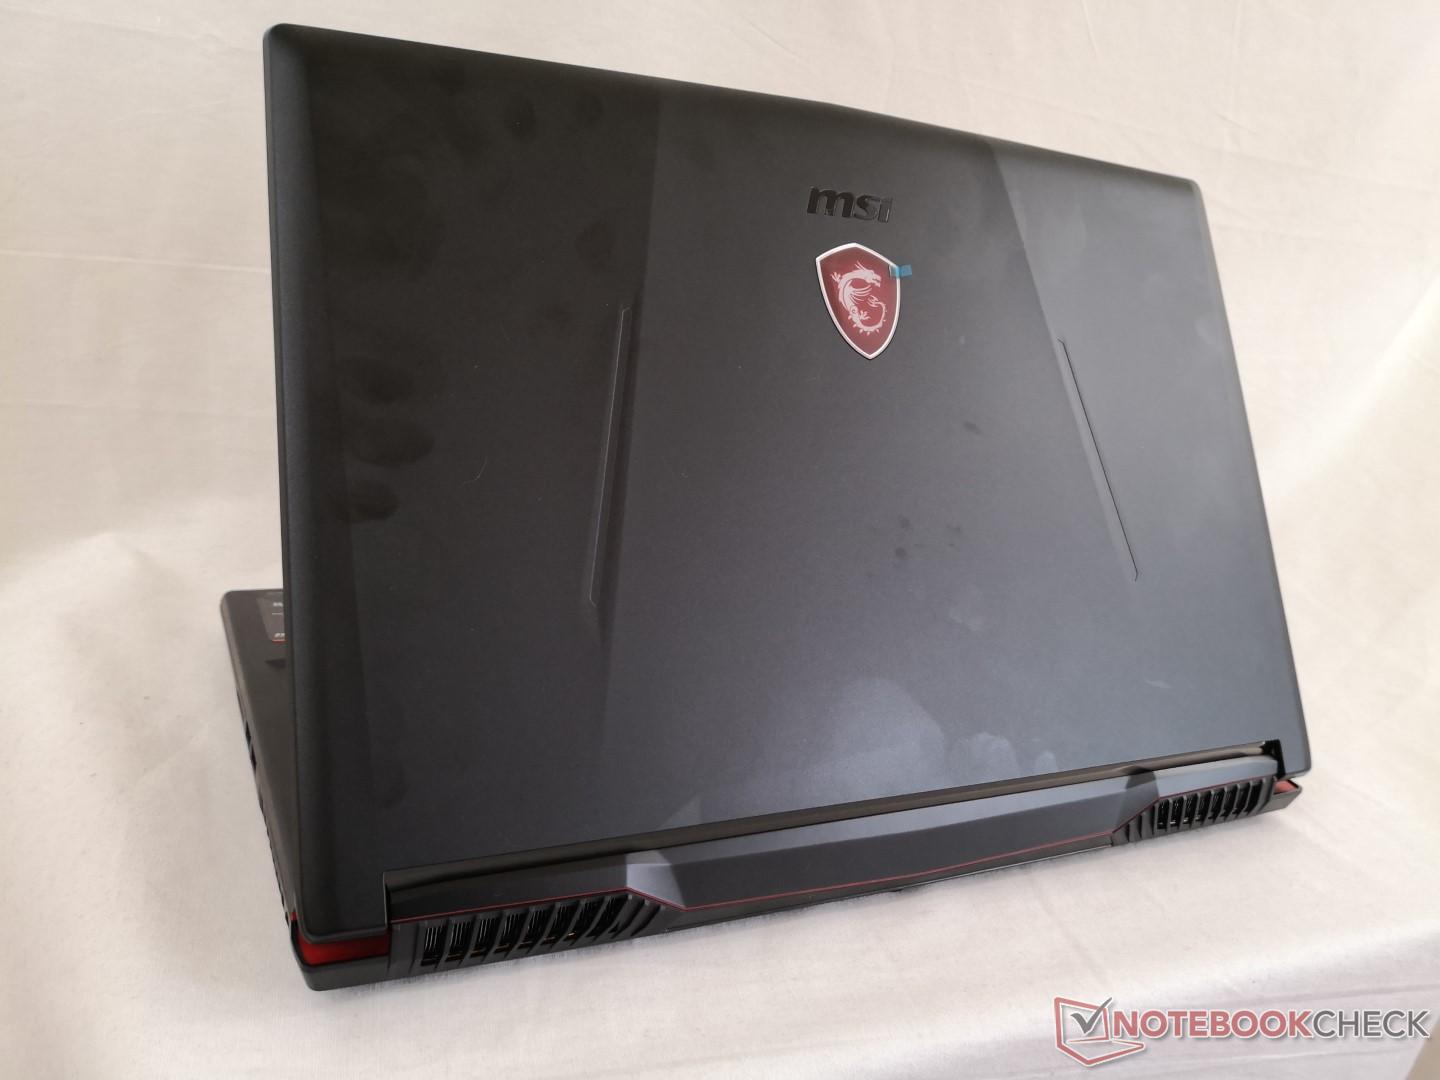
Dimensions are exactly the same as the GL62M and GL62 even though the GL63 introduces numerous visual changes. Nonetheless, the newer model is actually slightly lighter this time around by about 200 grams. The new Dell G5 15 is significantly heavier by about 700 g because of its more rigid base and materials.
Connectivity
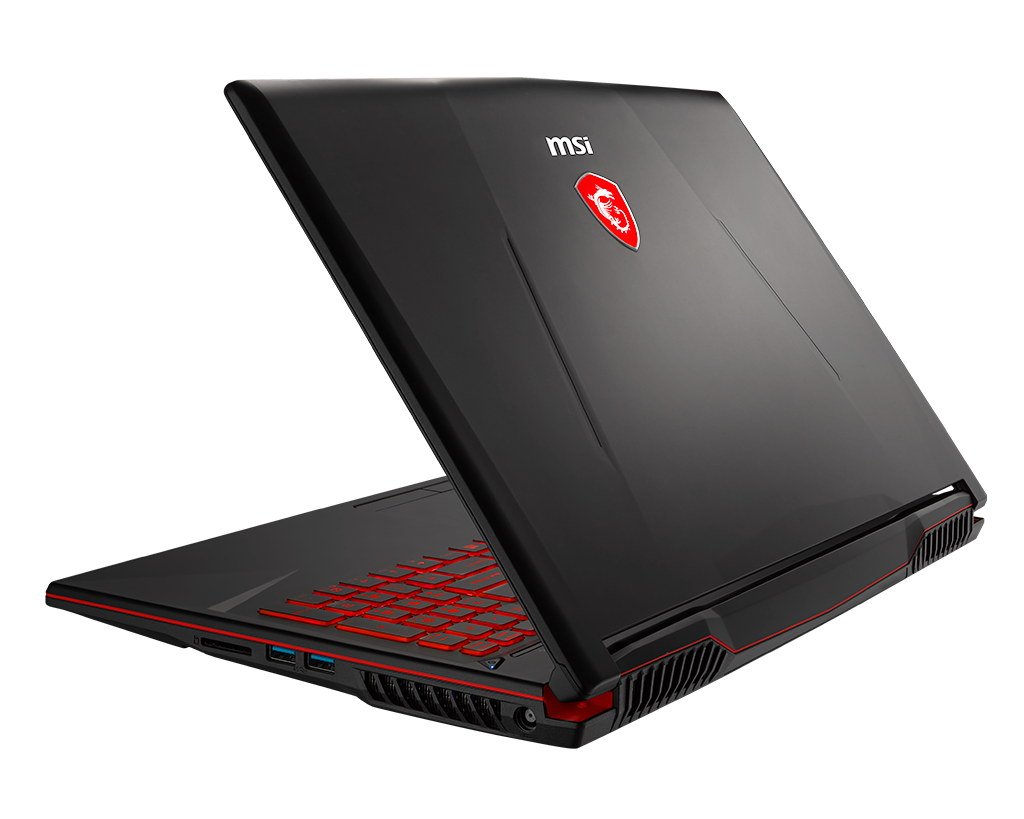
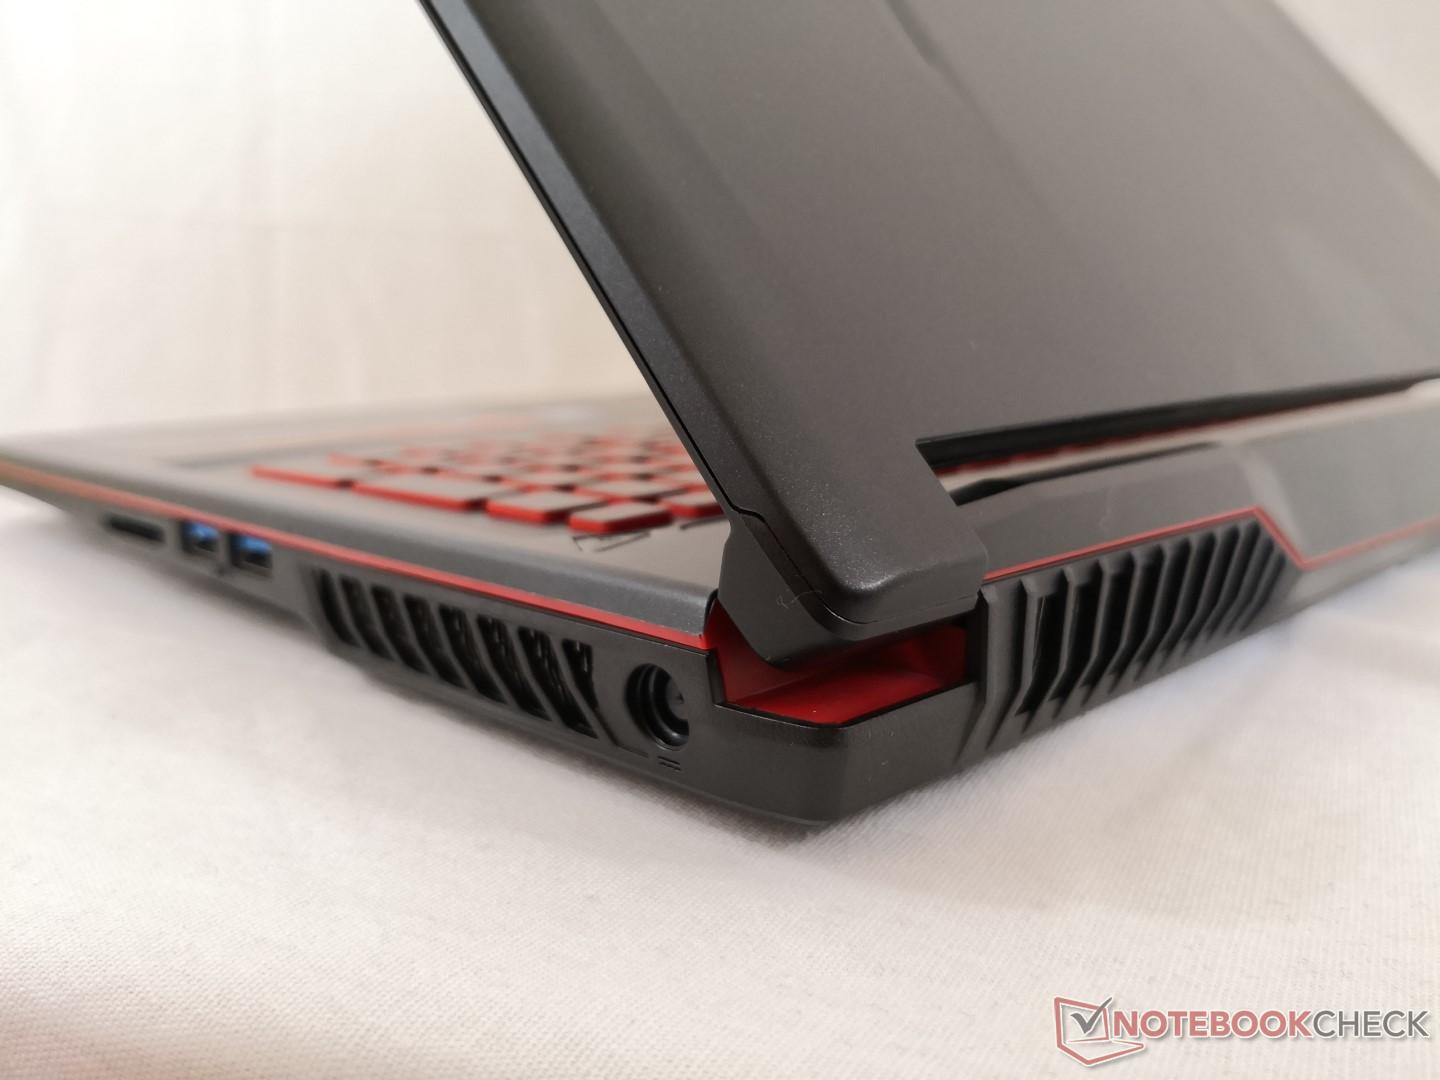
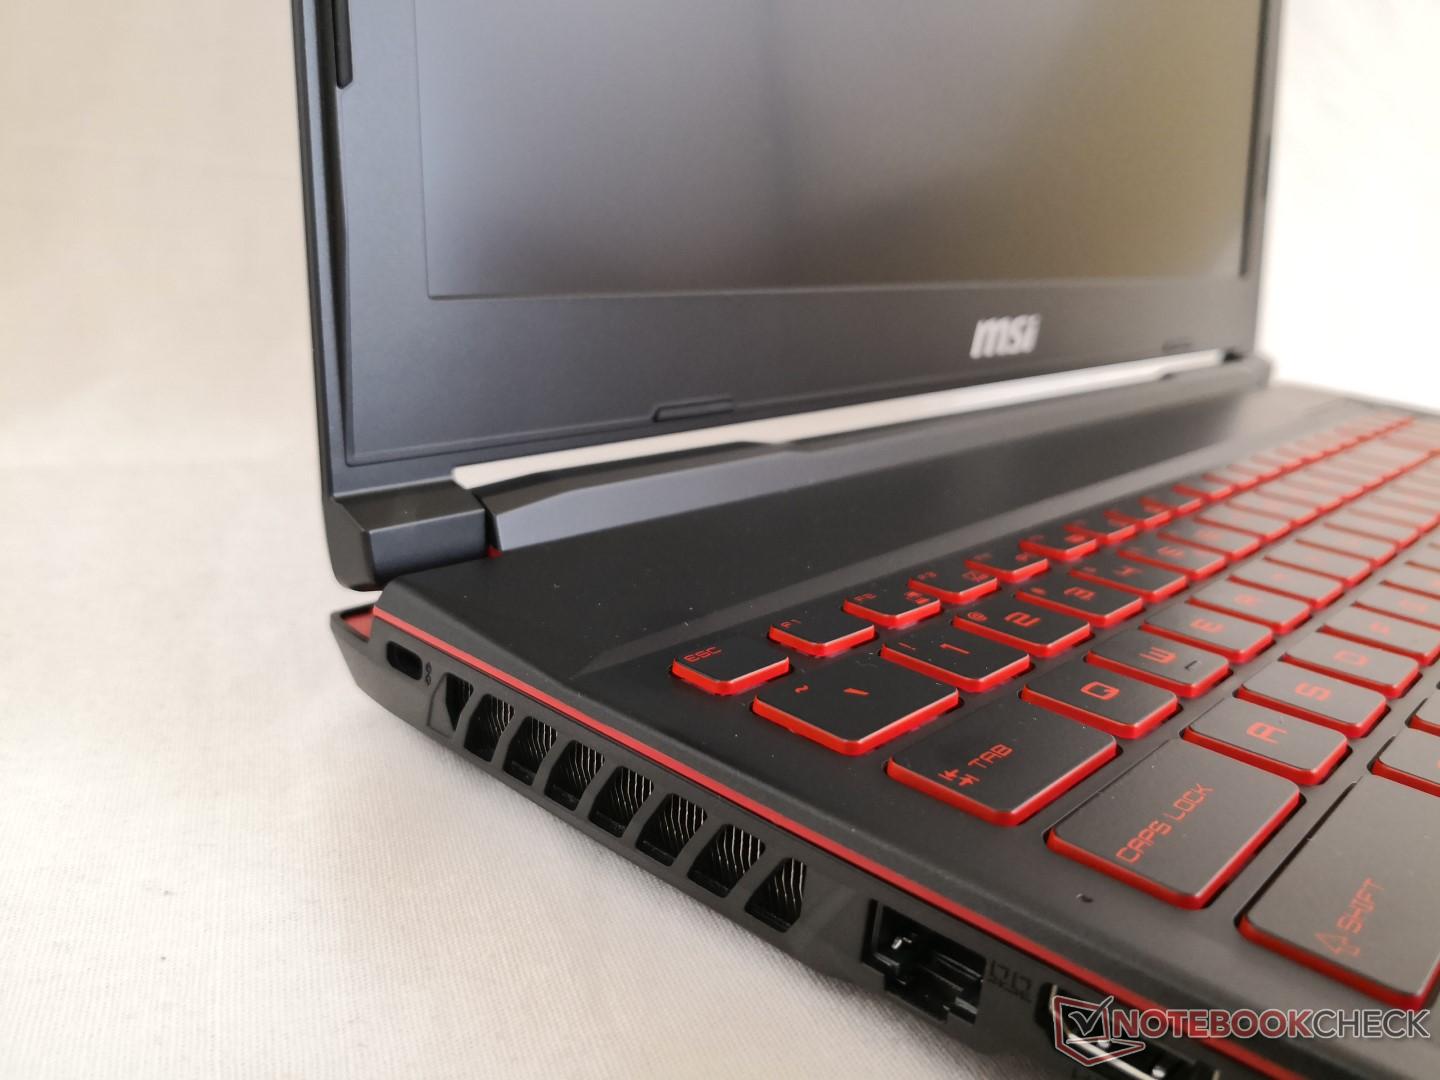
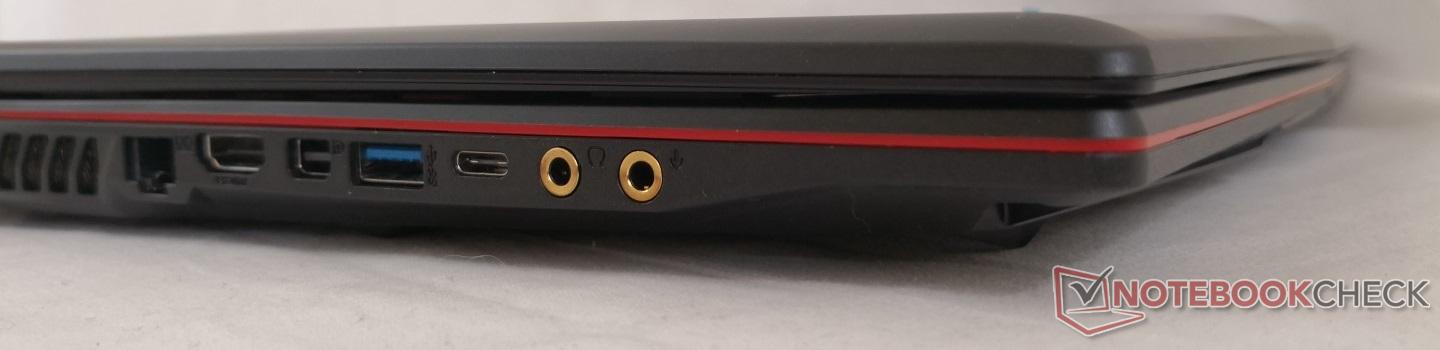
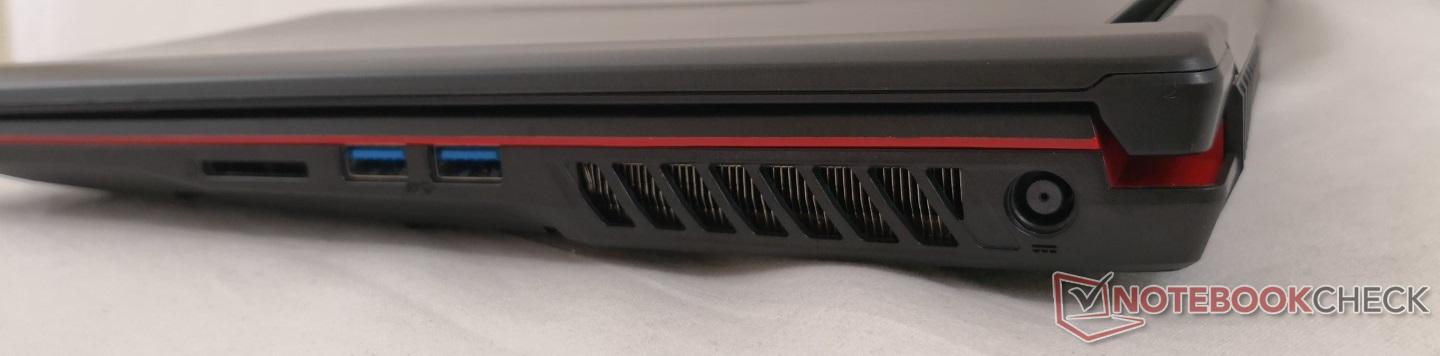
All ports from the GL62 have carried over to the GL63 with some small rearrangements. Note that the ports on the left edge are now more tightly-packed because of the new ventilation grilles. A few entry-level gaming laptops like the Dell Inspiron 7577 are starting to ship with Thunderbolt 3 to be more competitive.
SD Card Reader
The spring-loaded card reader offers very slow transfer rates at just under 22 MB/s with our UHS-II test card. Transferring 1 GB worth of images from card to desktop takes well over 60 seconds compared to only 8 seconds on the XPS 15.
A fully inserted SD card will protrude by about half a centimeter. We recommend ejecting the card before transporting to avoid bending or cracking.
| SD Card Reader | |
| average JPG Copy Test (av. of 3 runs) | |
| Gigabyte Sabre 15G (Toshiba Exceria Pro SDXC 64 GB UHS-II) | |
| Dell G5 15 5587 (Toshiba Exceria Pro SDXC 64 GB UHS-II) | |
| MSI GL63 8RC-069US (Toshiba Exceria Pro SDXC 64 GB UHS-II) | |
| maximum AS SSD Seq Read Test (1GB) | |
| Gigabyte Sabre 15G (Toshiba Exceria Pro SDXC 64 GB UHS-II) | |
| Dell G5 15 5587 (Toshiba Exceria Pro SDXC 64 GB UHS-II) | |
| MSI GL63 8RC-069US (Toshiba Exceria Pro SDXC 64 GB UHS-II) | |
Communication
WLAN and Bluetooth 5 are provided by the new and budget Intel 9462 M.2 module. The 1x1 card offers a maximum transfer rate of just 433 Mbps compared to 867 Mbps or 1.73 Gbps on most Ultrabooks and pricier gaming notebooks. While we didn't experience issues when connected to an 802.11ac network, our system would constantly disconnect from an 802.11n network. We're unsure if this is a widespread issue or something unique to our specific test unit, but it is worth mentioning nonetheless.
| Networking | |
| iperf3 transmit AX12 | |
| Dell G5 15 5587 | |
| Gigabyte Sabre 15G | |
| MSI GL63 8RC-069US | |
| iperf3 receive AX12 | |
| Dell G5 15 5587 | |
| MSI GL63 8RC-069US | |
| Gigabyte Sabre 15G | |
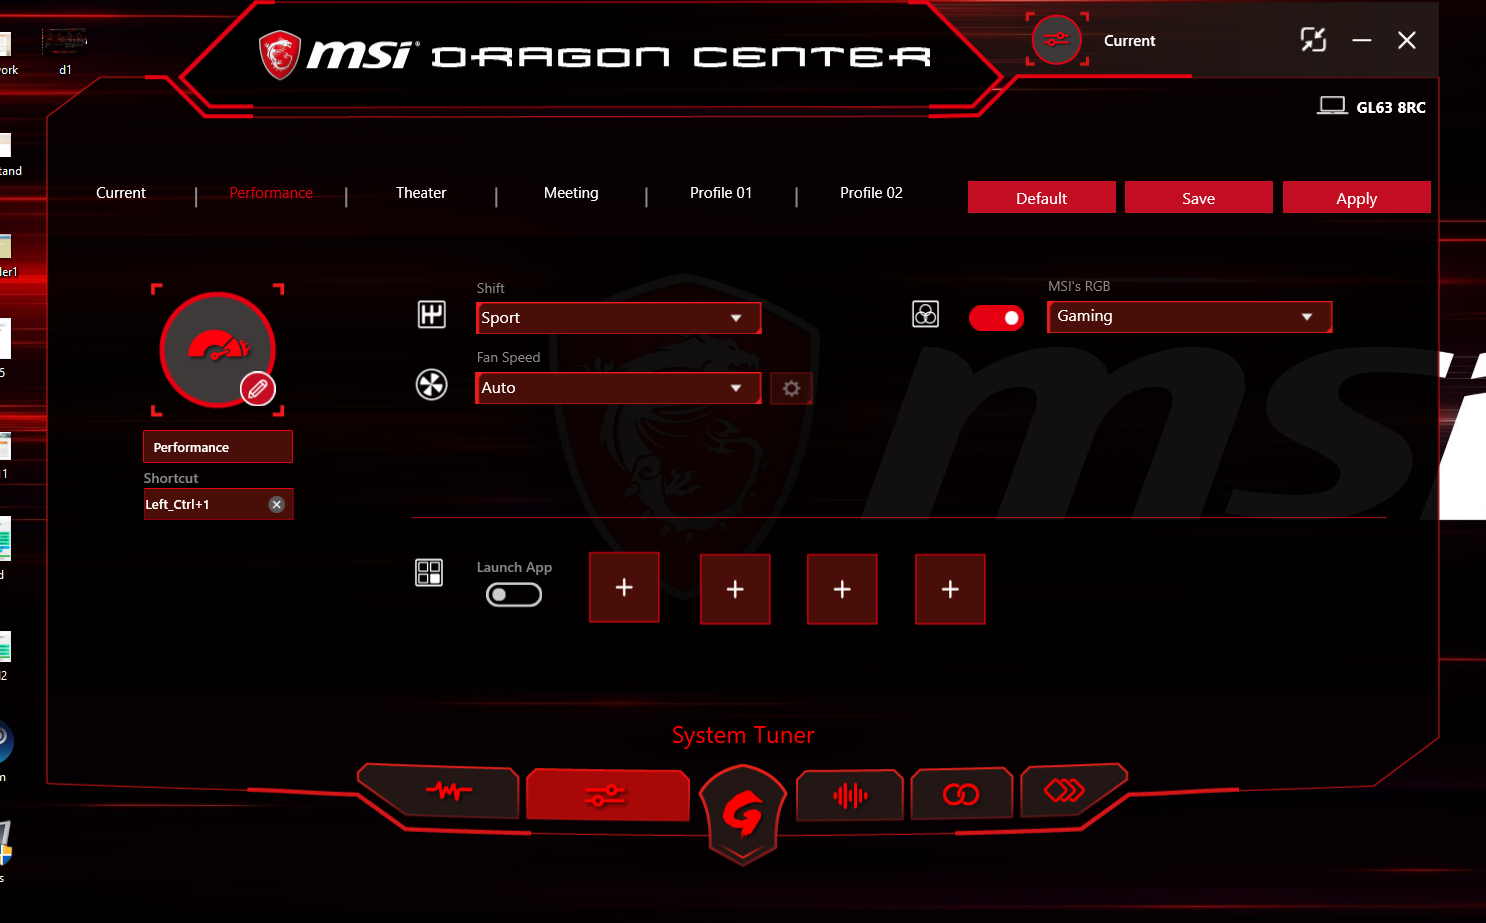
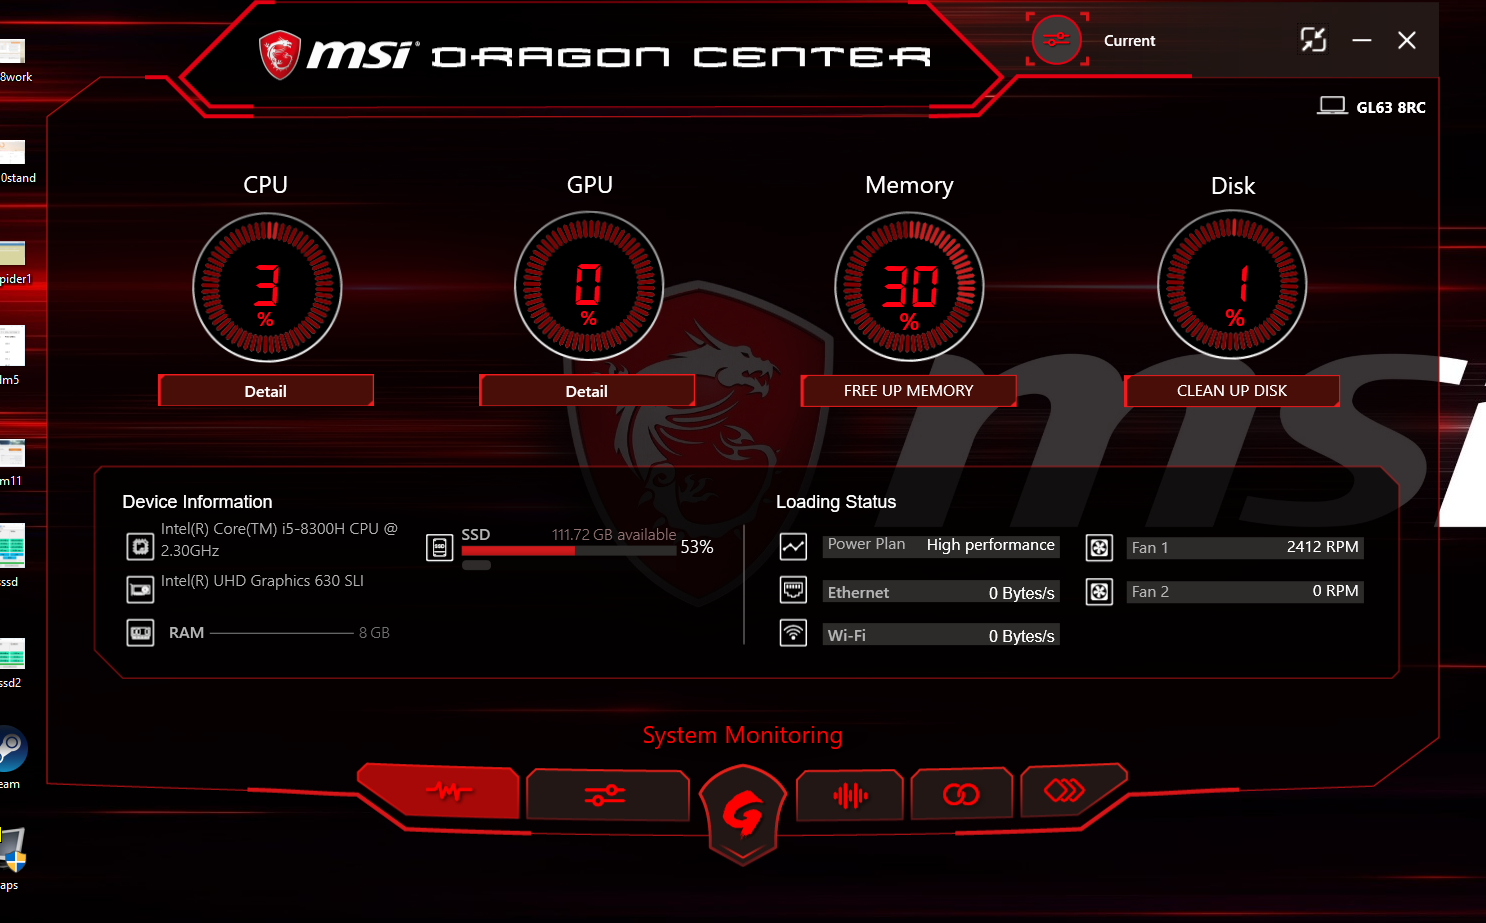
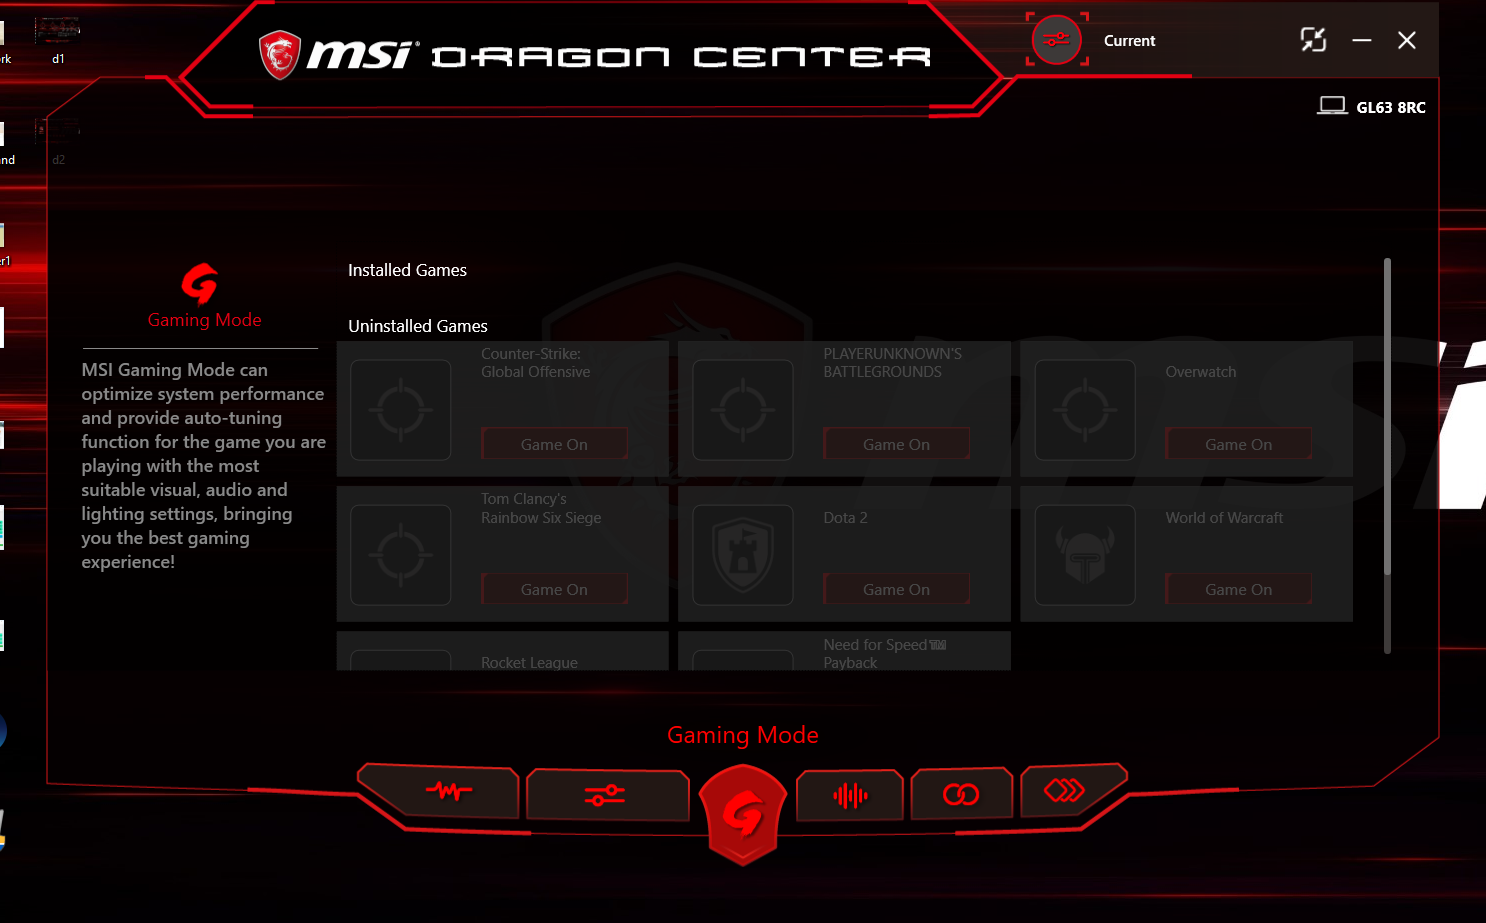
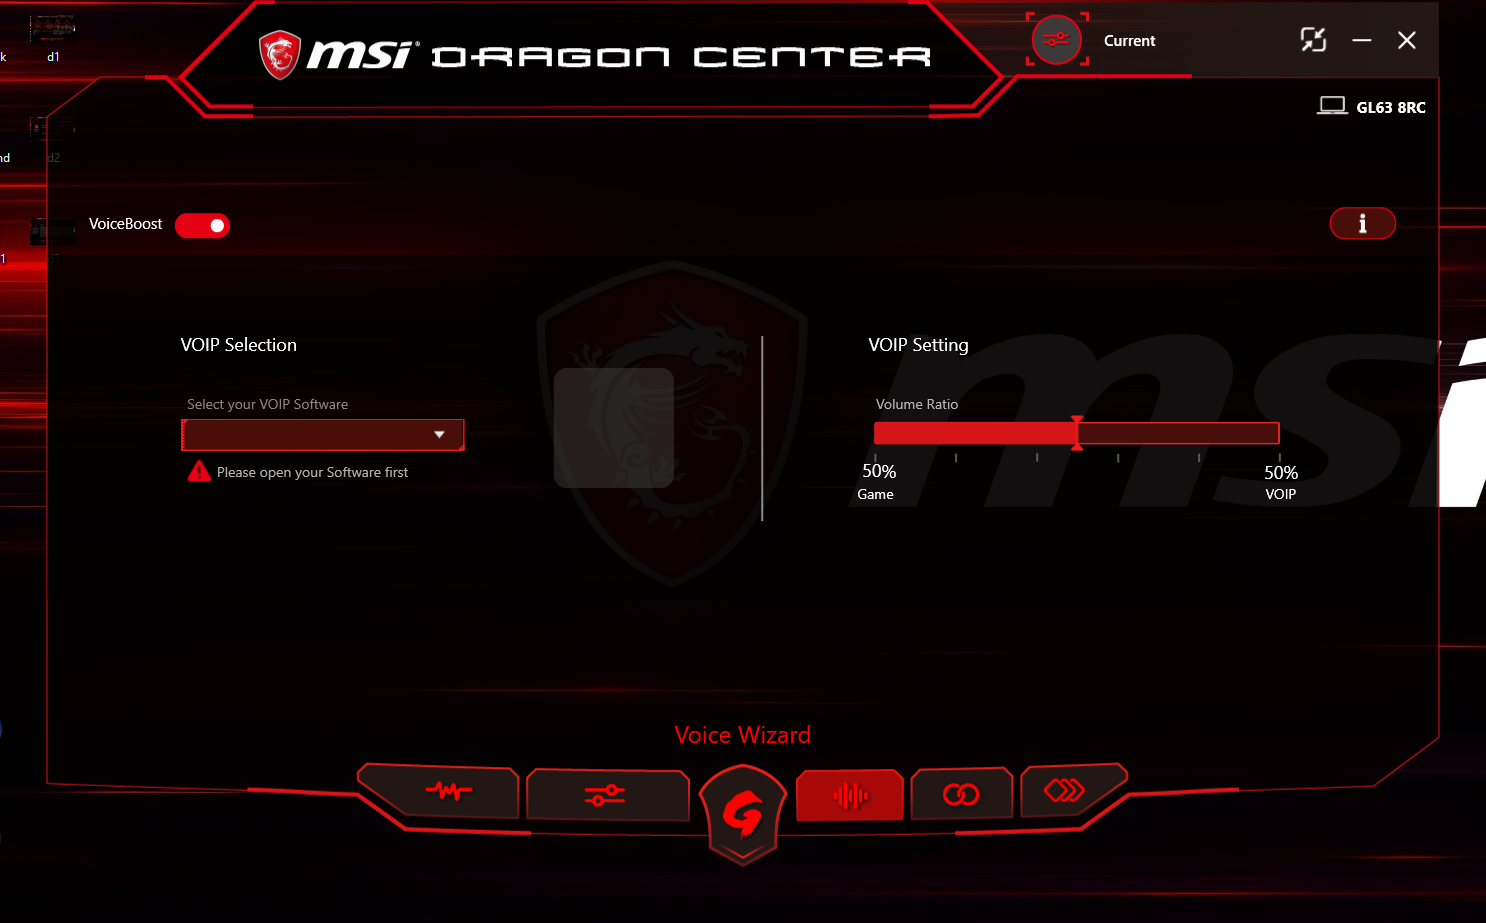
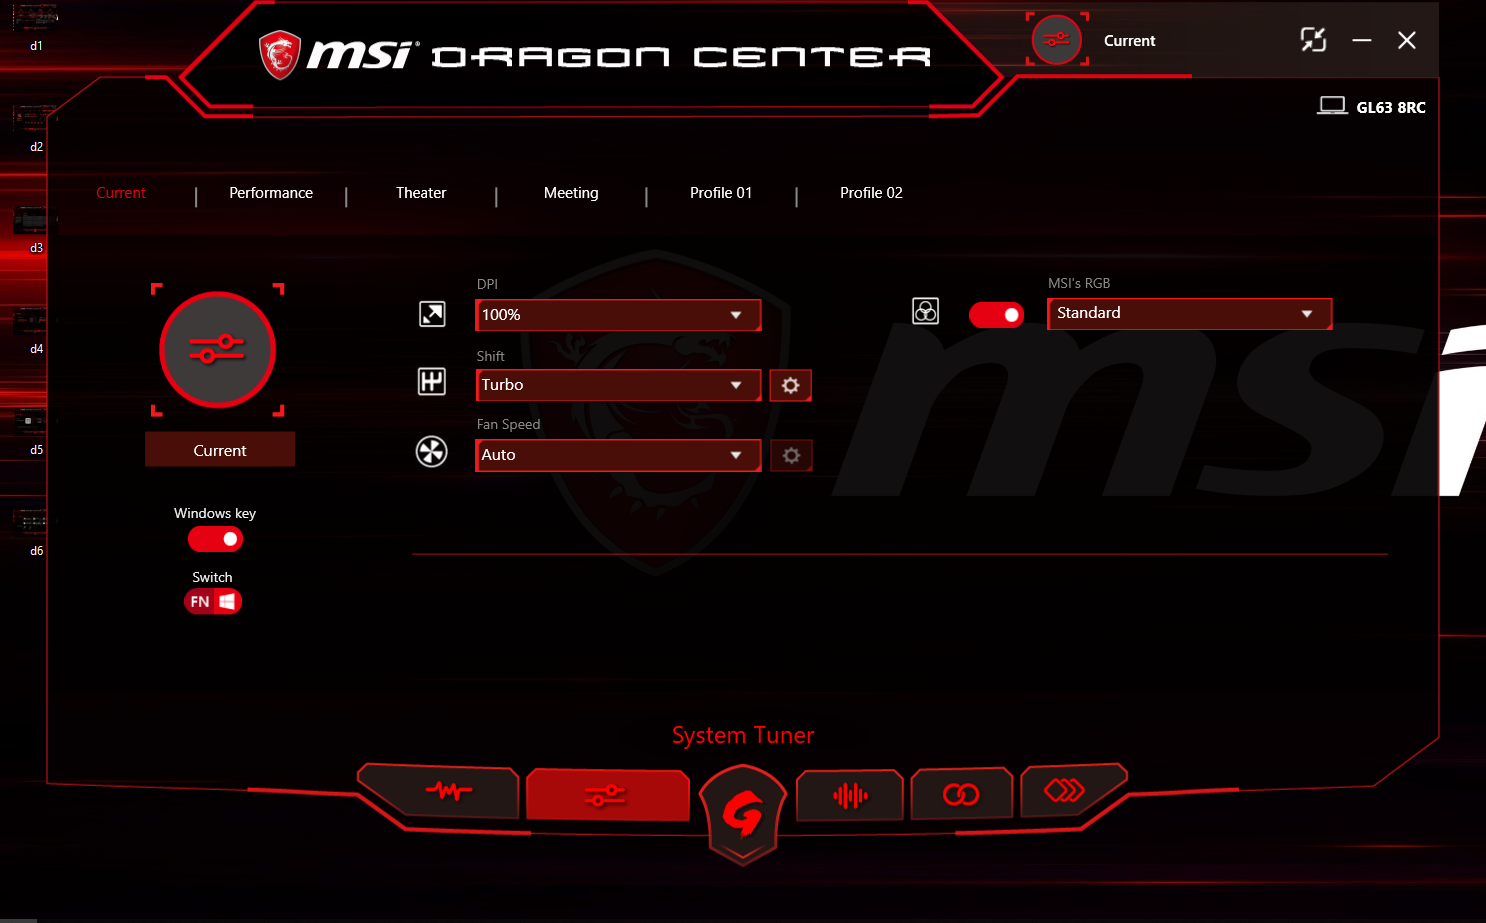
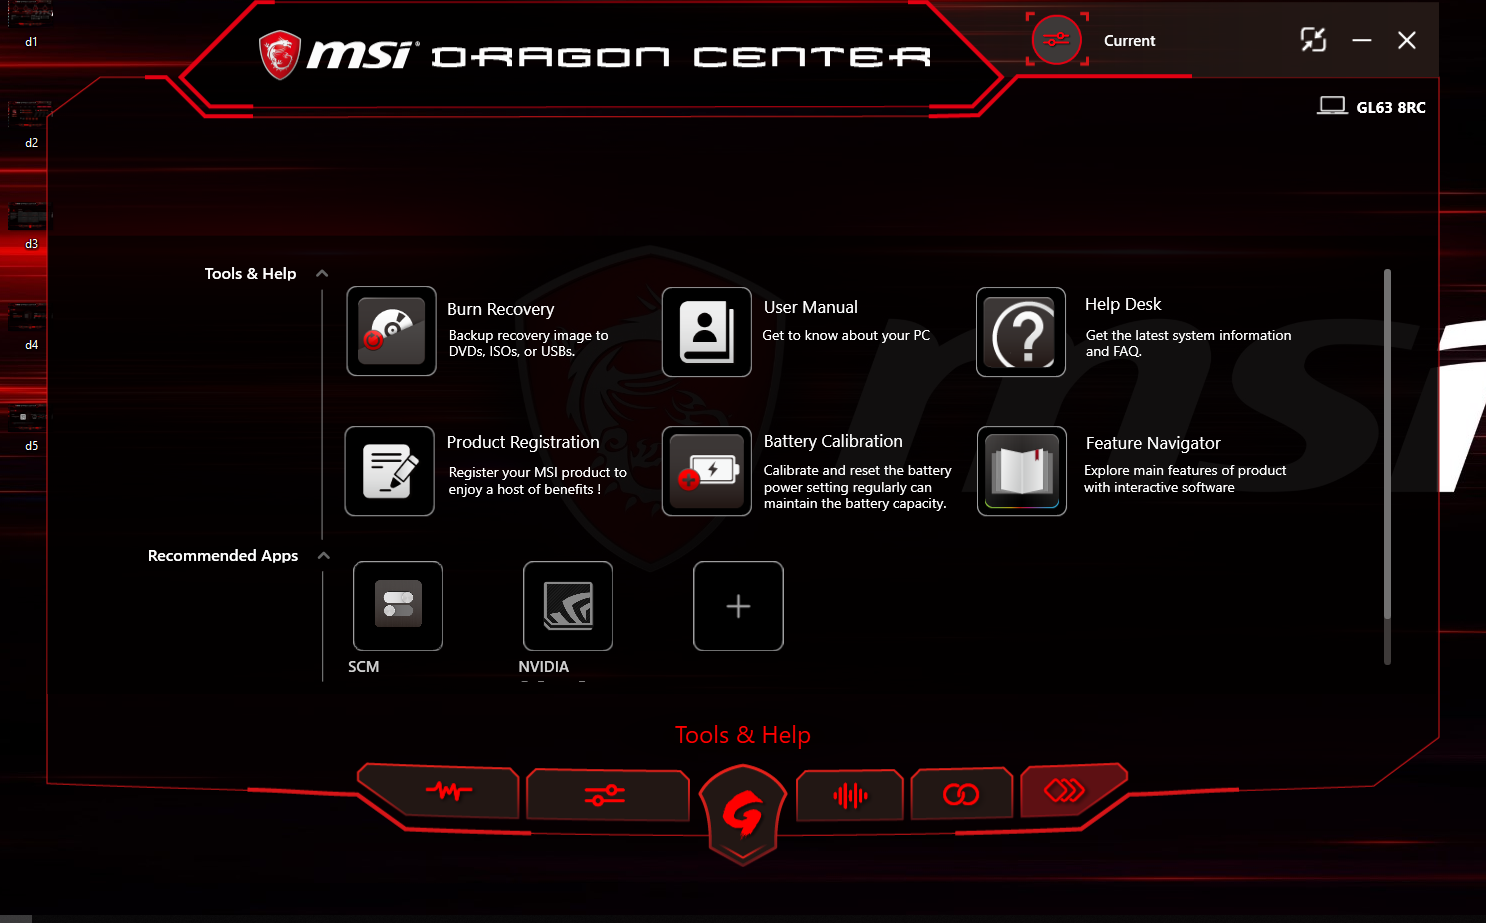
Dragon Center 2.0
Accessories
A Quick Start guide is included alongside the AC adapter. MSI-branded accessories like caps, mice, headsets, and mousepads are also available.
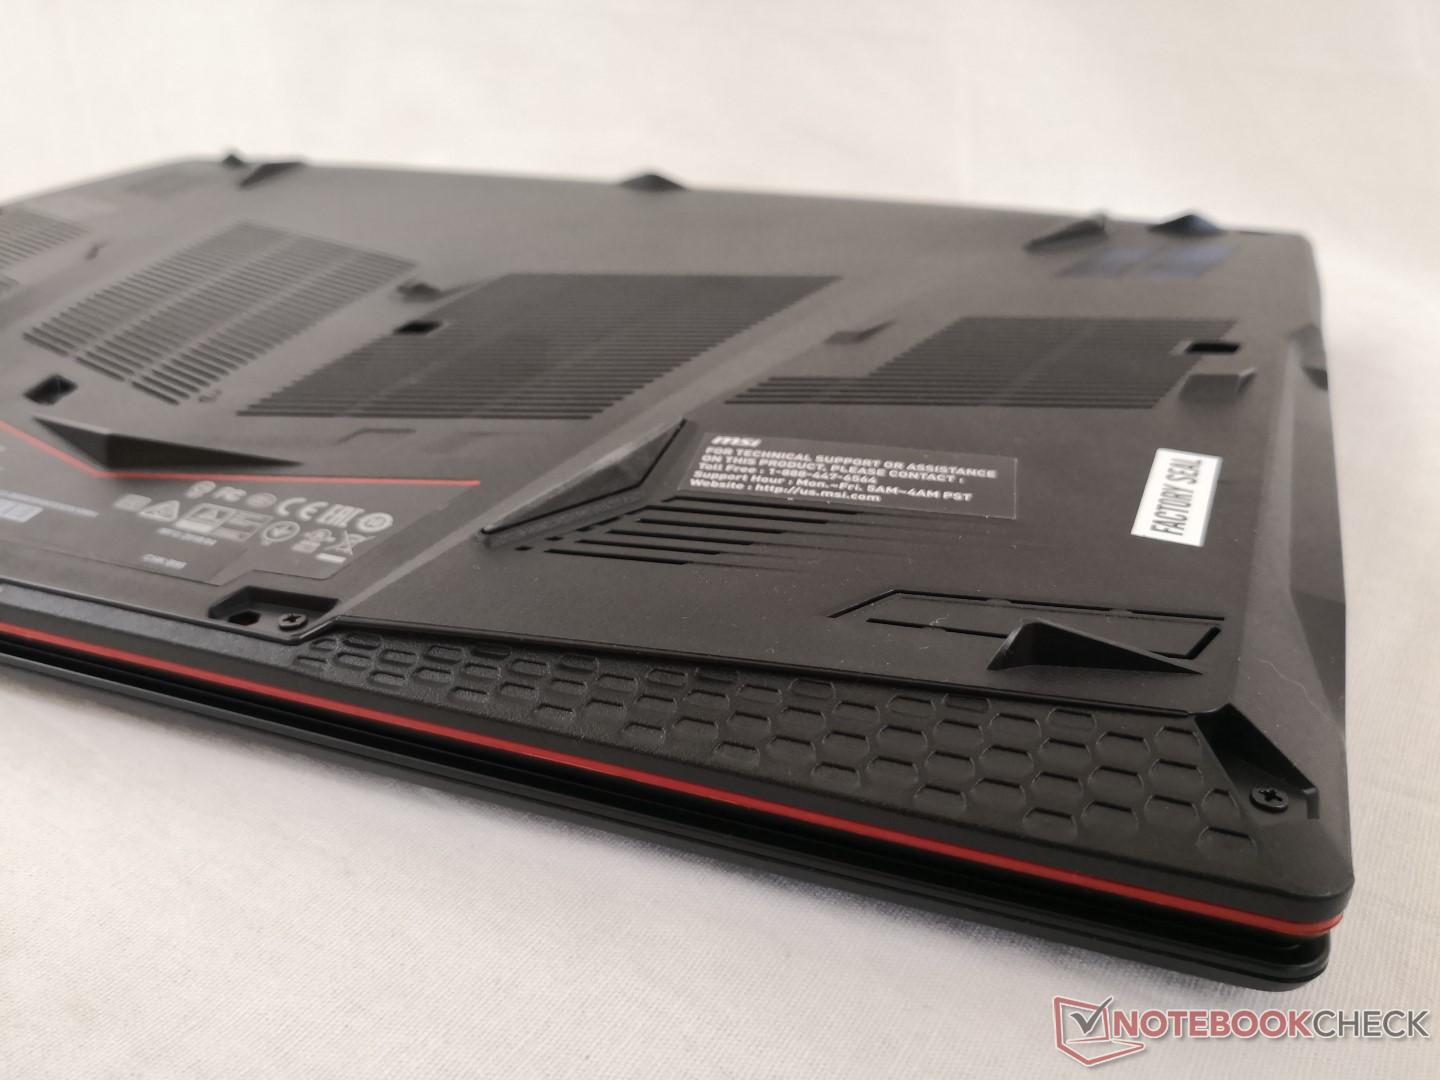
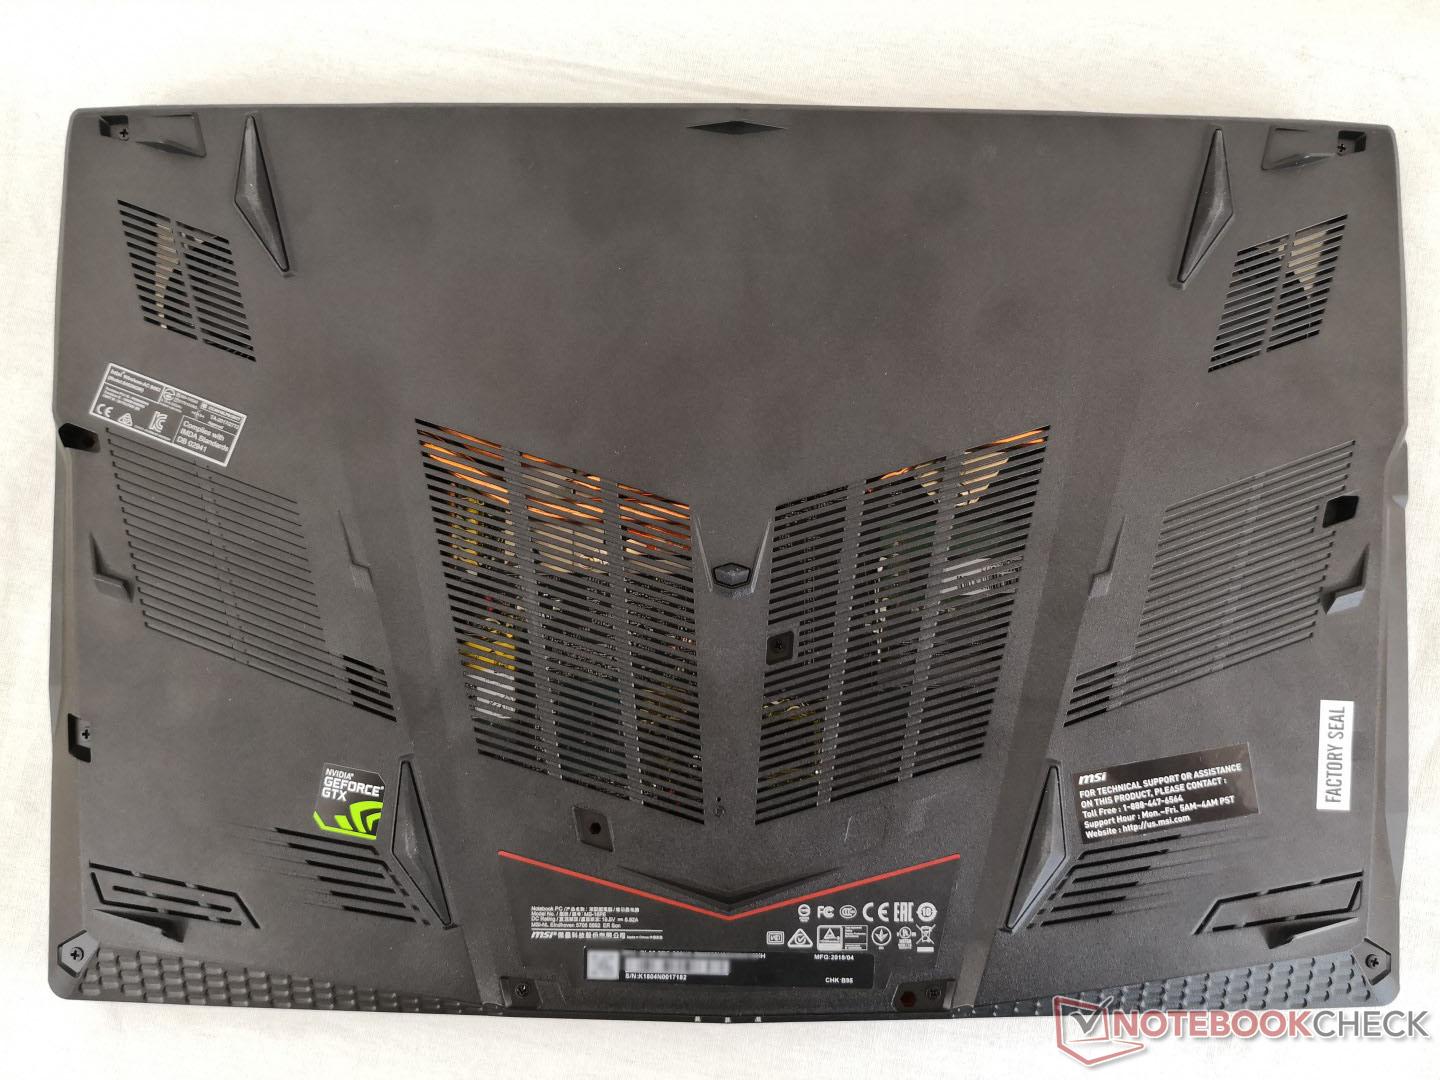
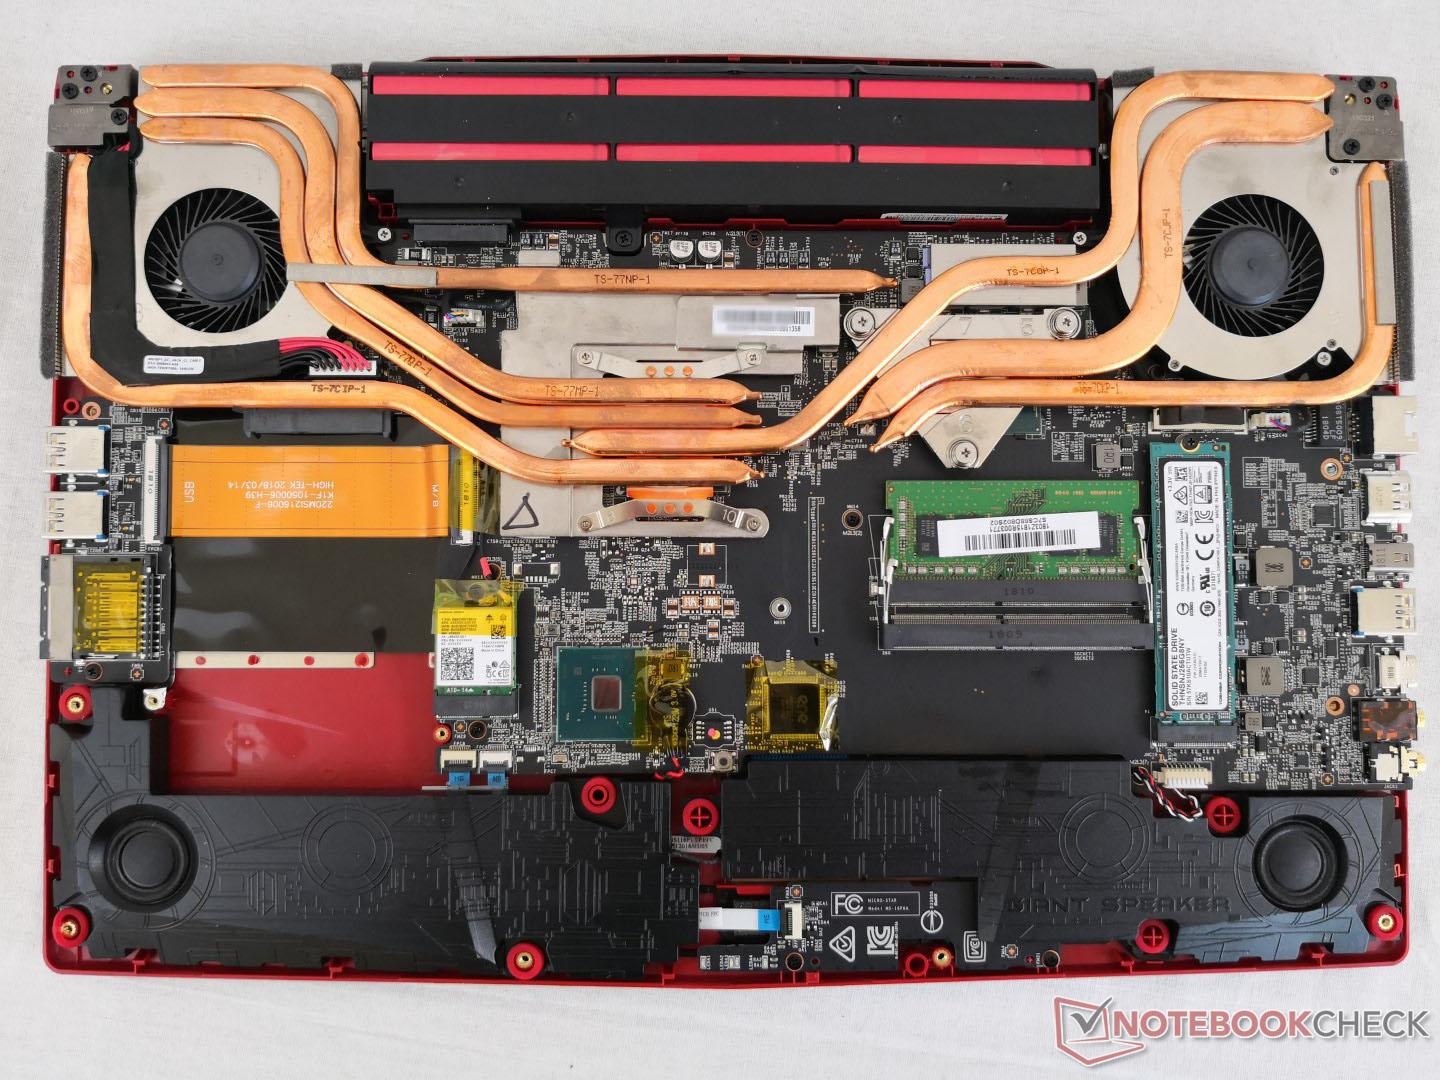
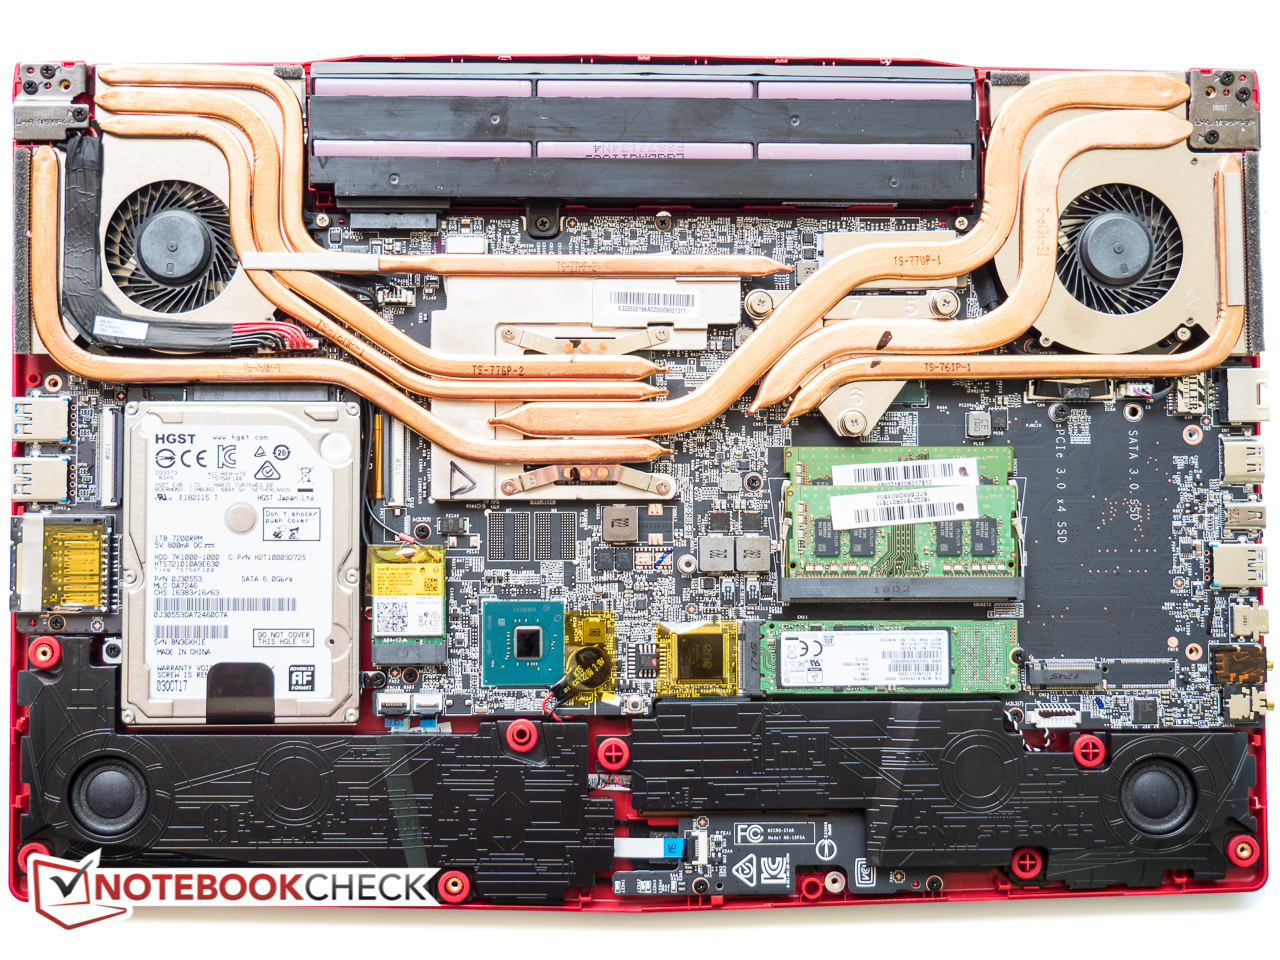
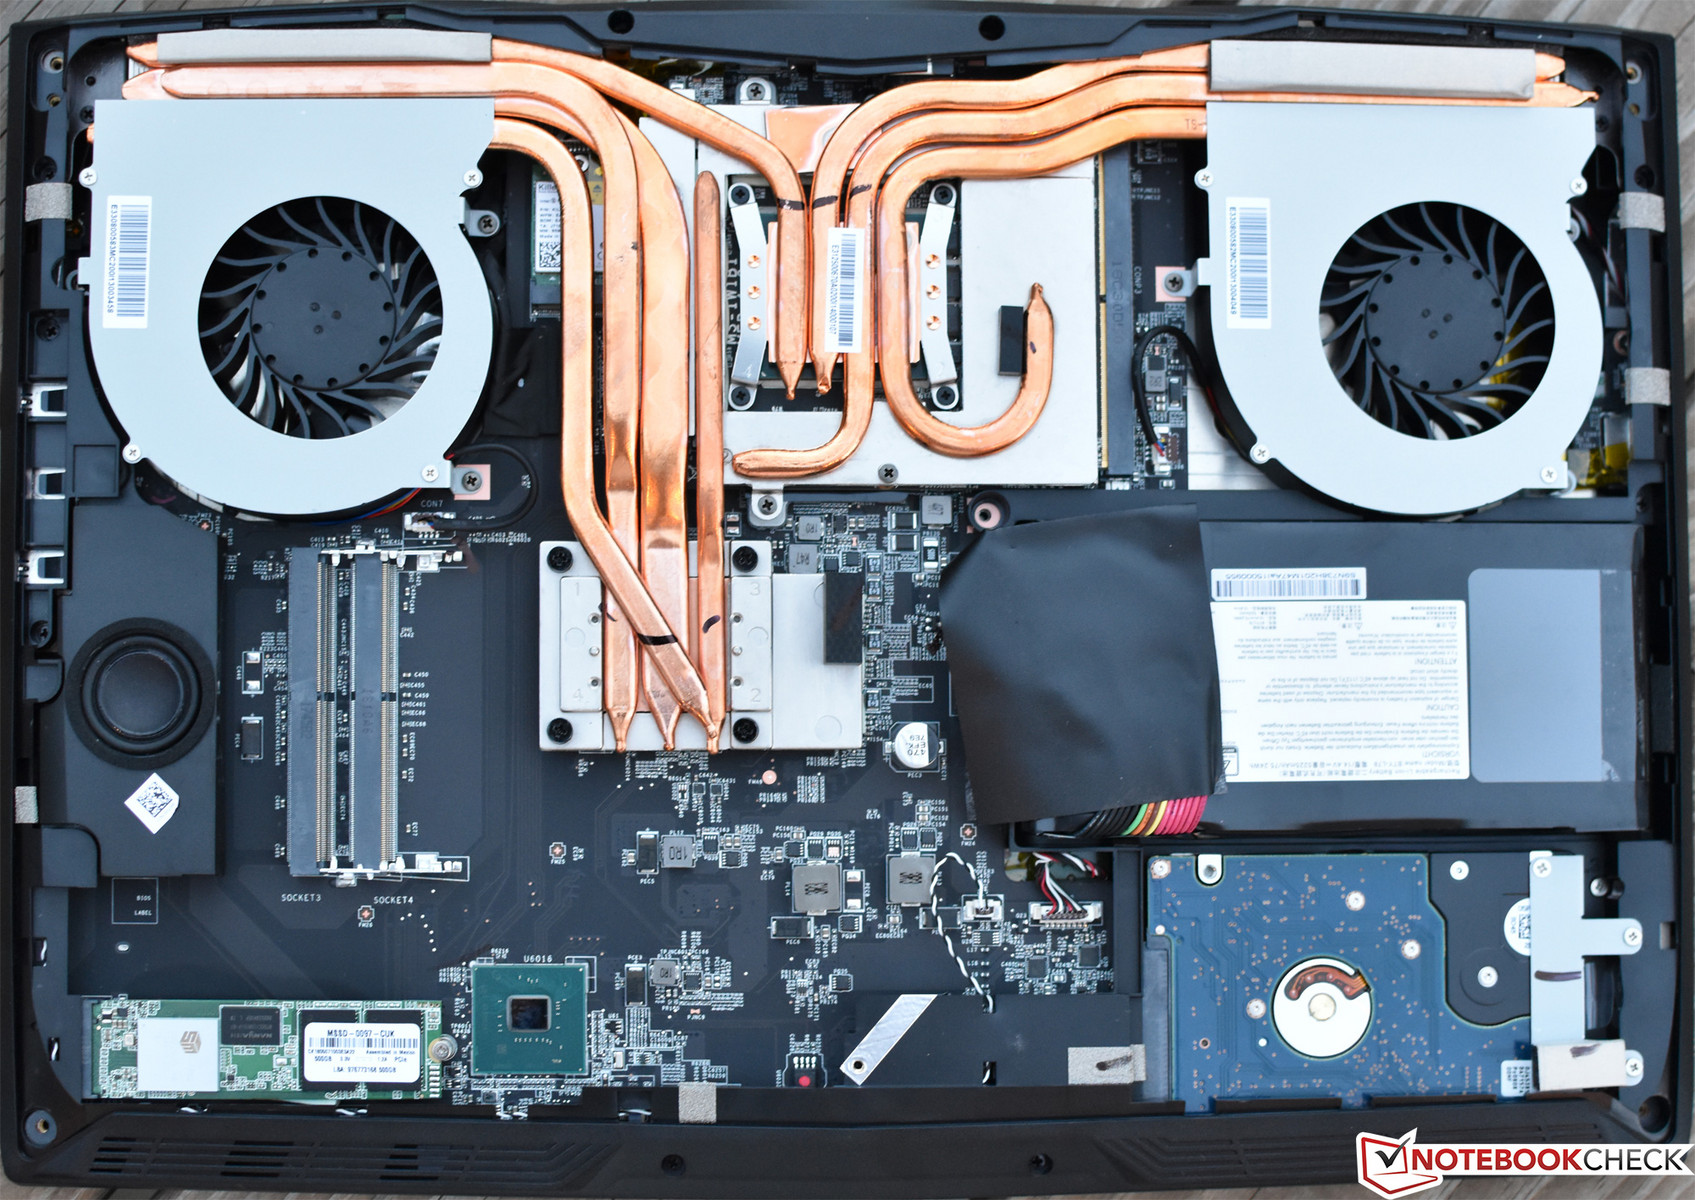
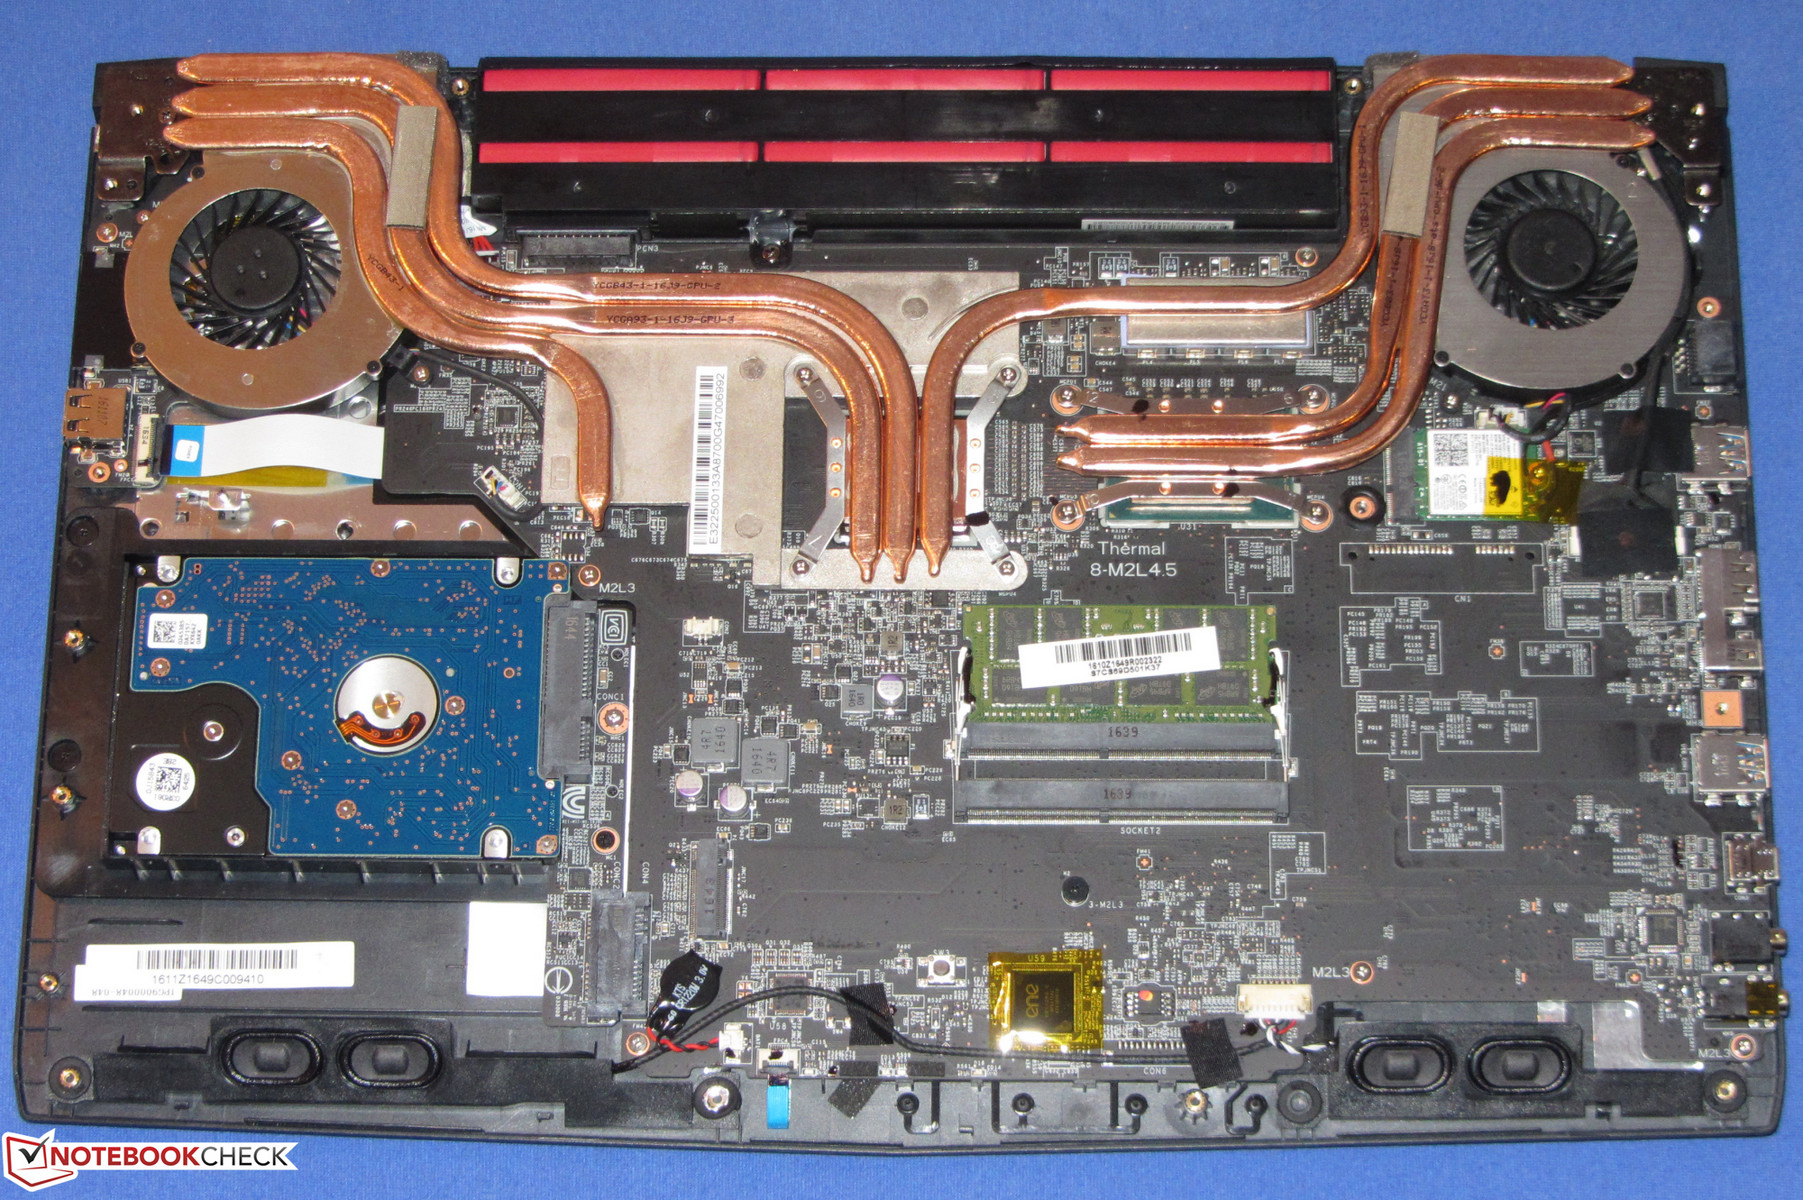
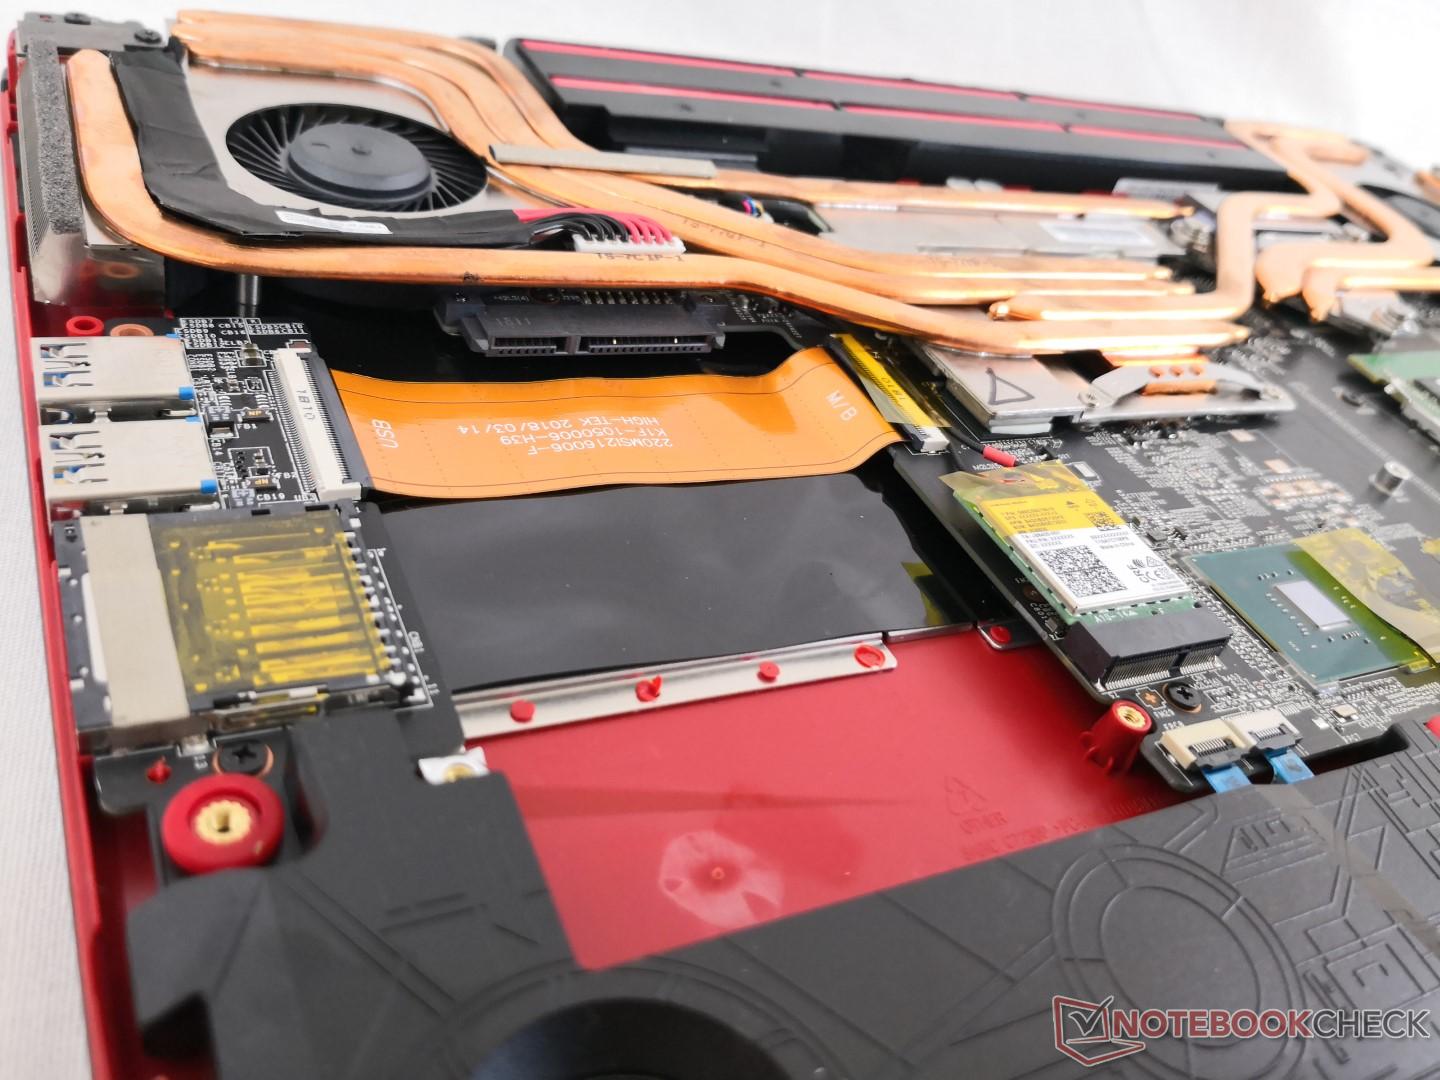
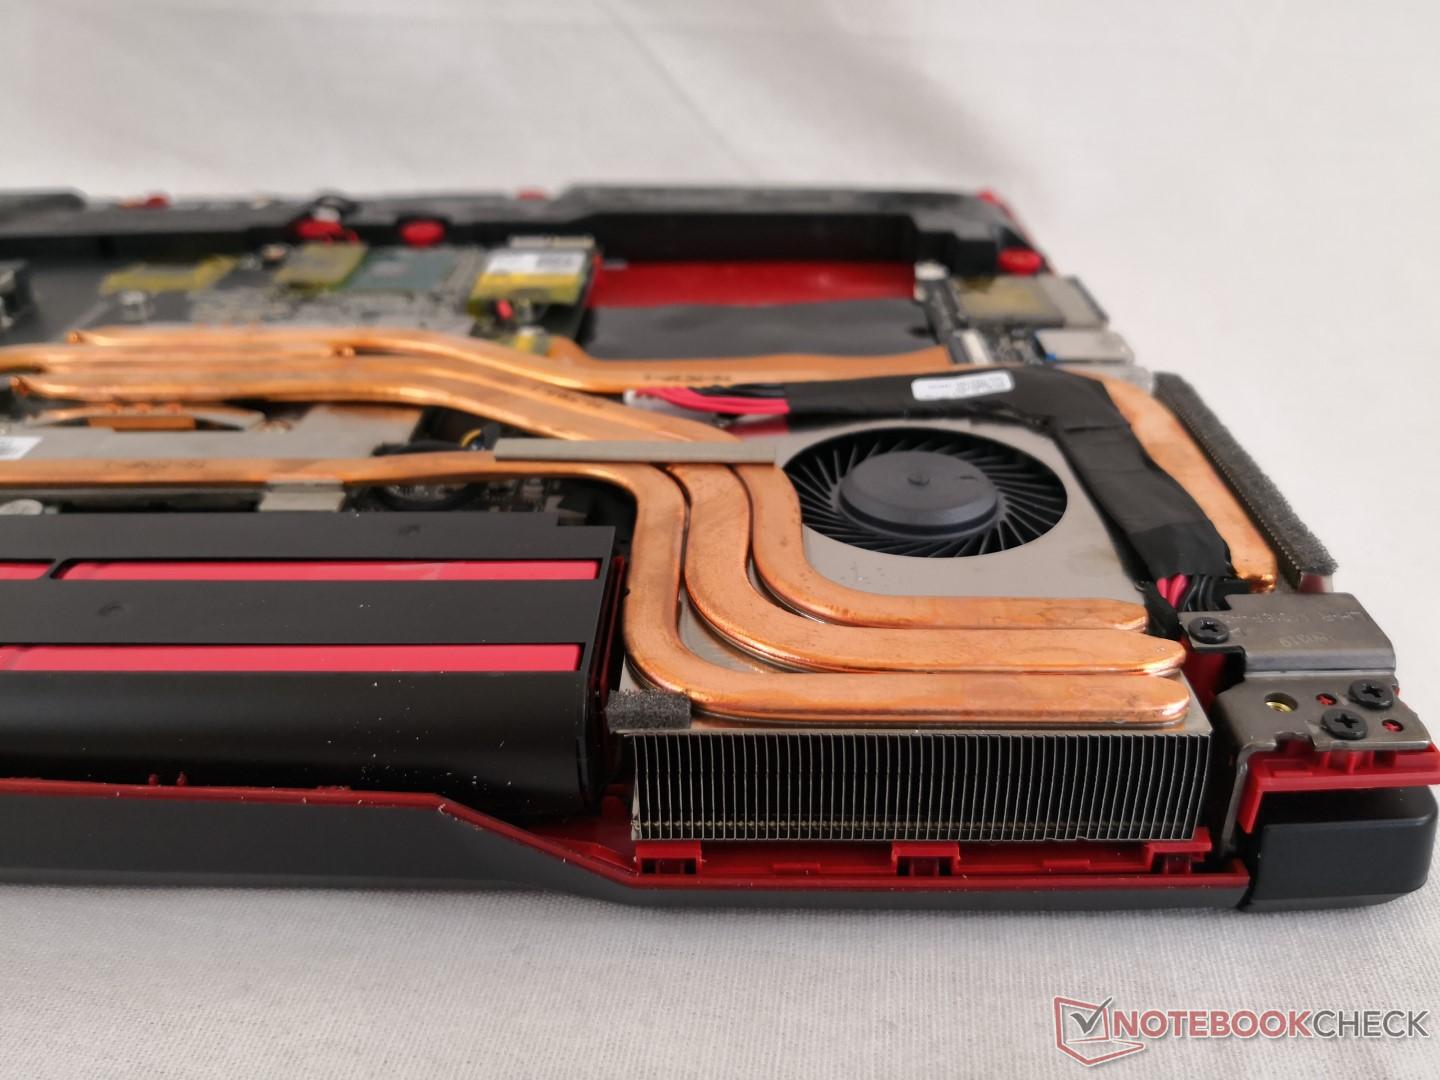
Maintenance
The bottom panel requires a Philips screwdriver and a thin edge to pry apart the edges and corners. The rear edges are especially difficult to separate without a sharp edge and one screw requires tearing a "Factory Seal" sticker that may impact warranty.
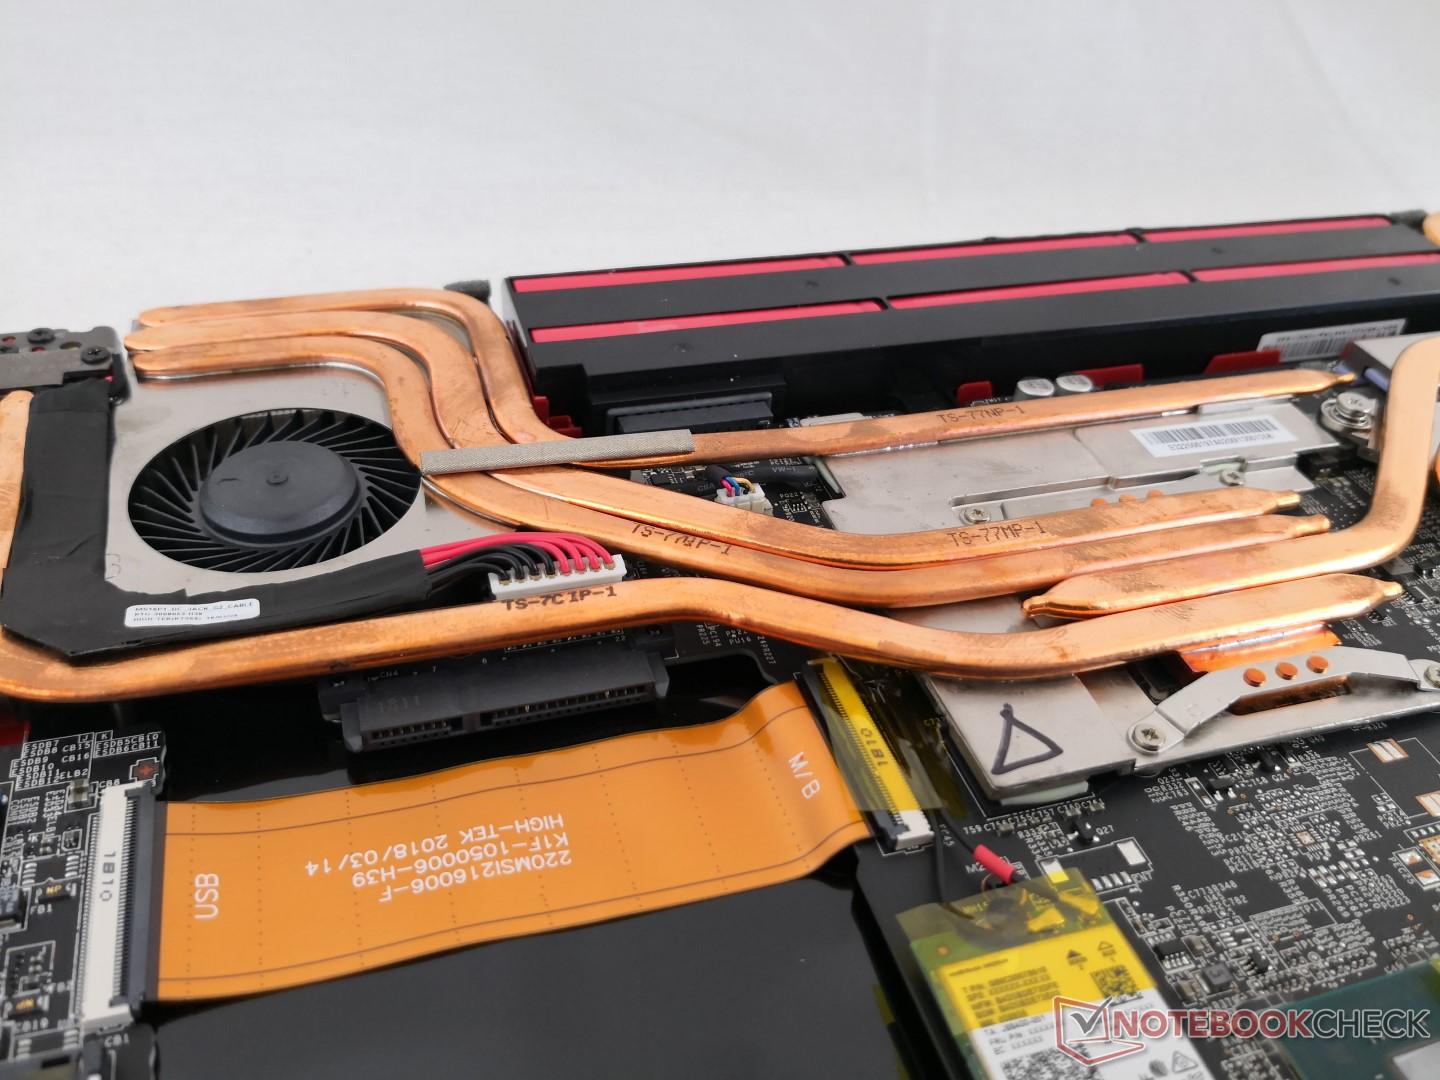
Internals are very similar to the GP63 as shown below.
Warranty
The usual one-year warranty applies when purchased in the United States.
Input Devices
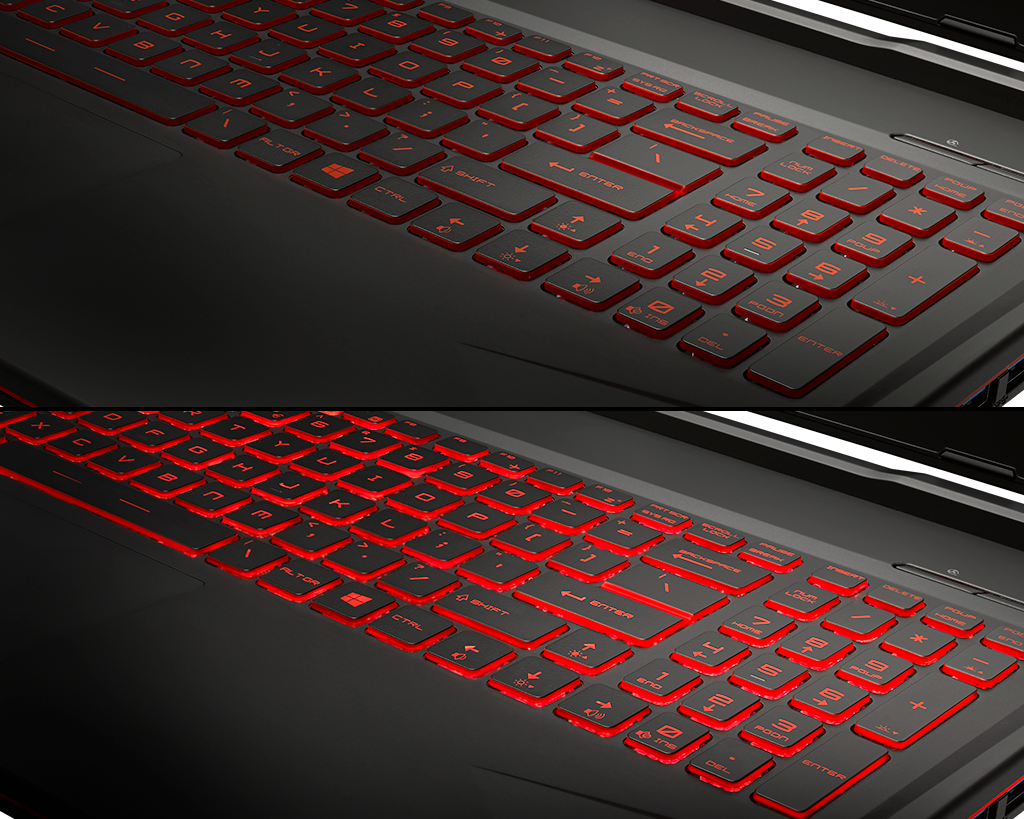
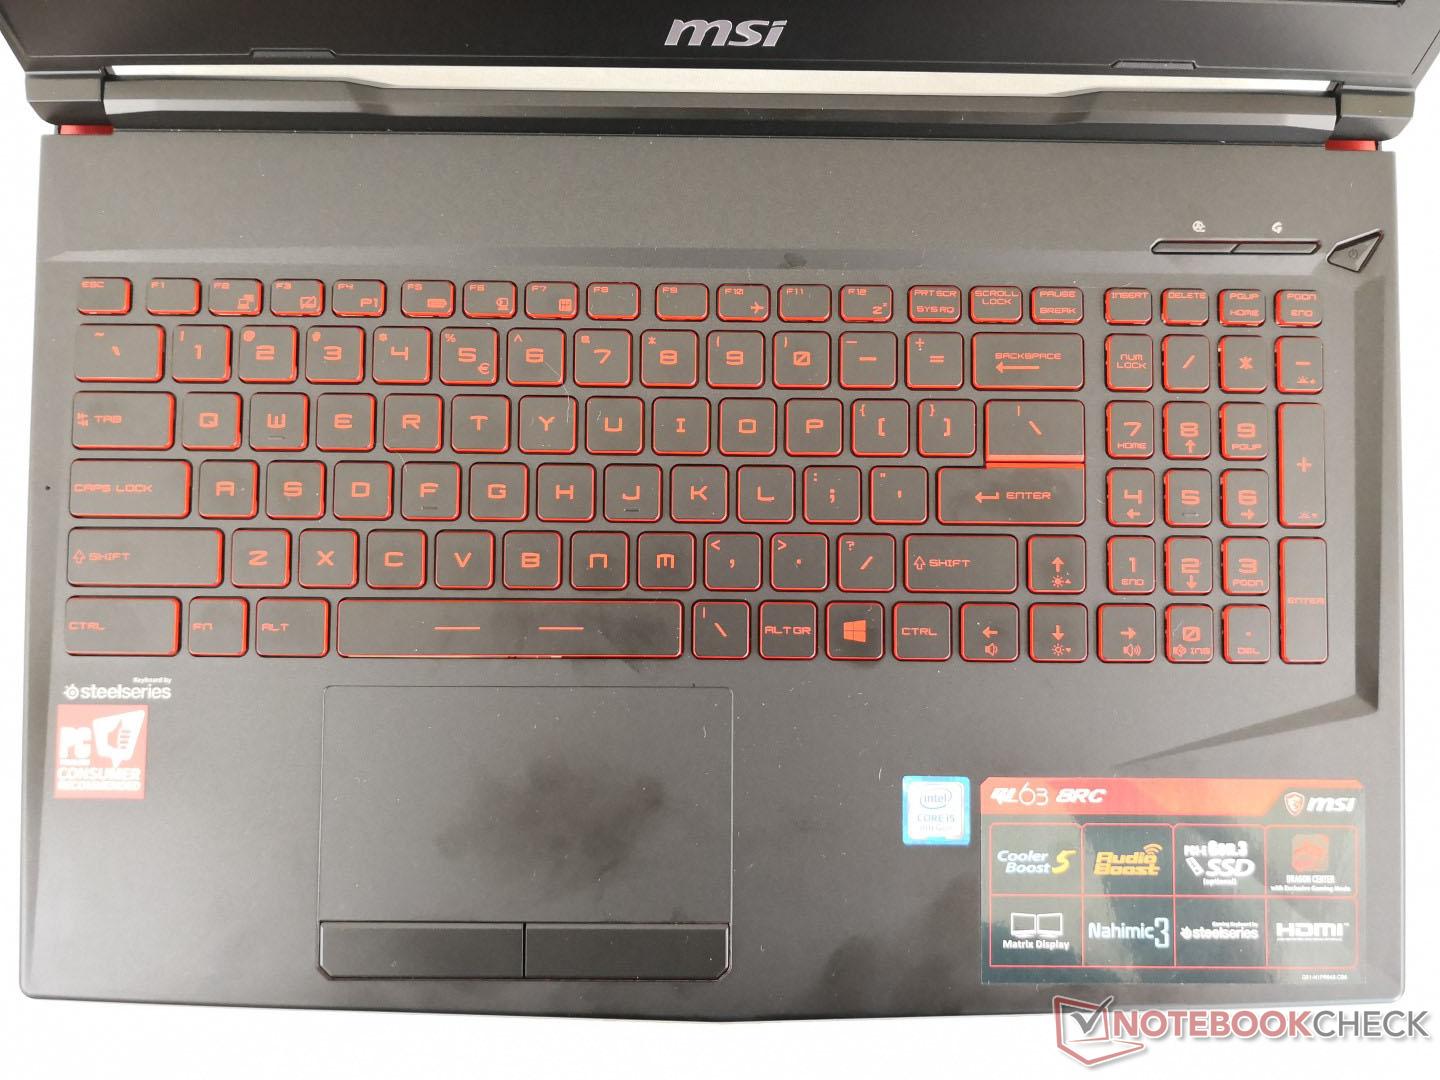
Keyboard and Touchpad
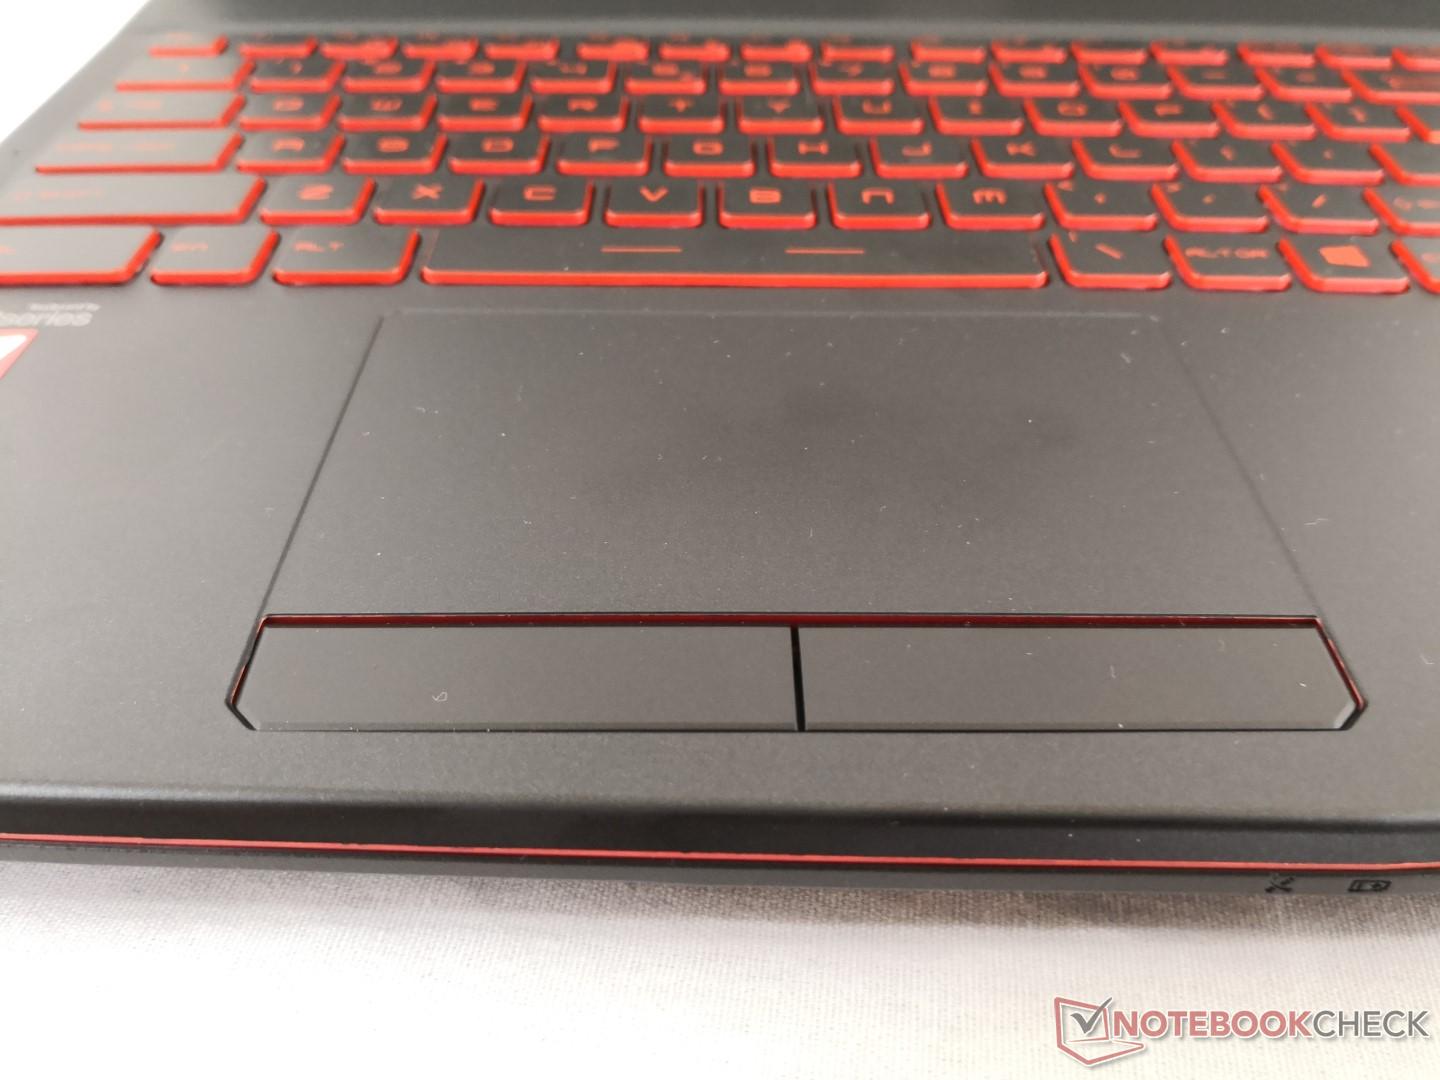
The keyboard (34.5 x 10.5 cm) and trackpad (~11.0 x 6.3 cm) feel identical to the ones on the GL62 and GL62M. Thus, we refer to our two existing reviews for more information. Users can expect satisfactory feedback from the main QWERTY keys while the NumPad keys are unfortunately a bit spongier since the individual keys are smaller. Keys are not as firm as on the MSI GT series because the base underneath the keys of the GL63 is a bit thinner and not as sturdy.
The completely smooth trackpad offers uniform glide for reliable cursor control and multi-touch gestures. We suspect that the dedicated left-click key on our unit is faulty because it is very spongy in feedback compared to the firmer and more audible right-click key.
Display
The GL series is limited to only 1080p options whereas higher-end MSI models may have 4K UHD options. The 1080p IPS display on our GL63 configuration offers excellent contrast levels and comparable brightness levels to the competition. Display quality is very similar to the Gigabyte Sabre 15G and new Dell G5 15 since both competitors also utilize very similar LP156WF6 panels from LG Philips.
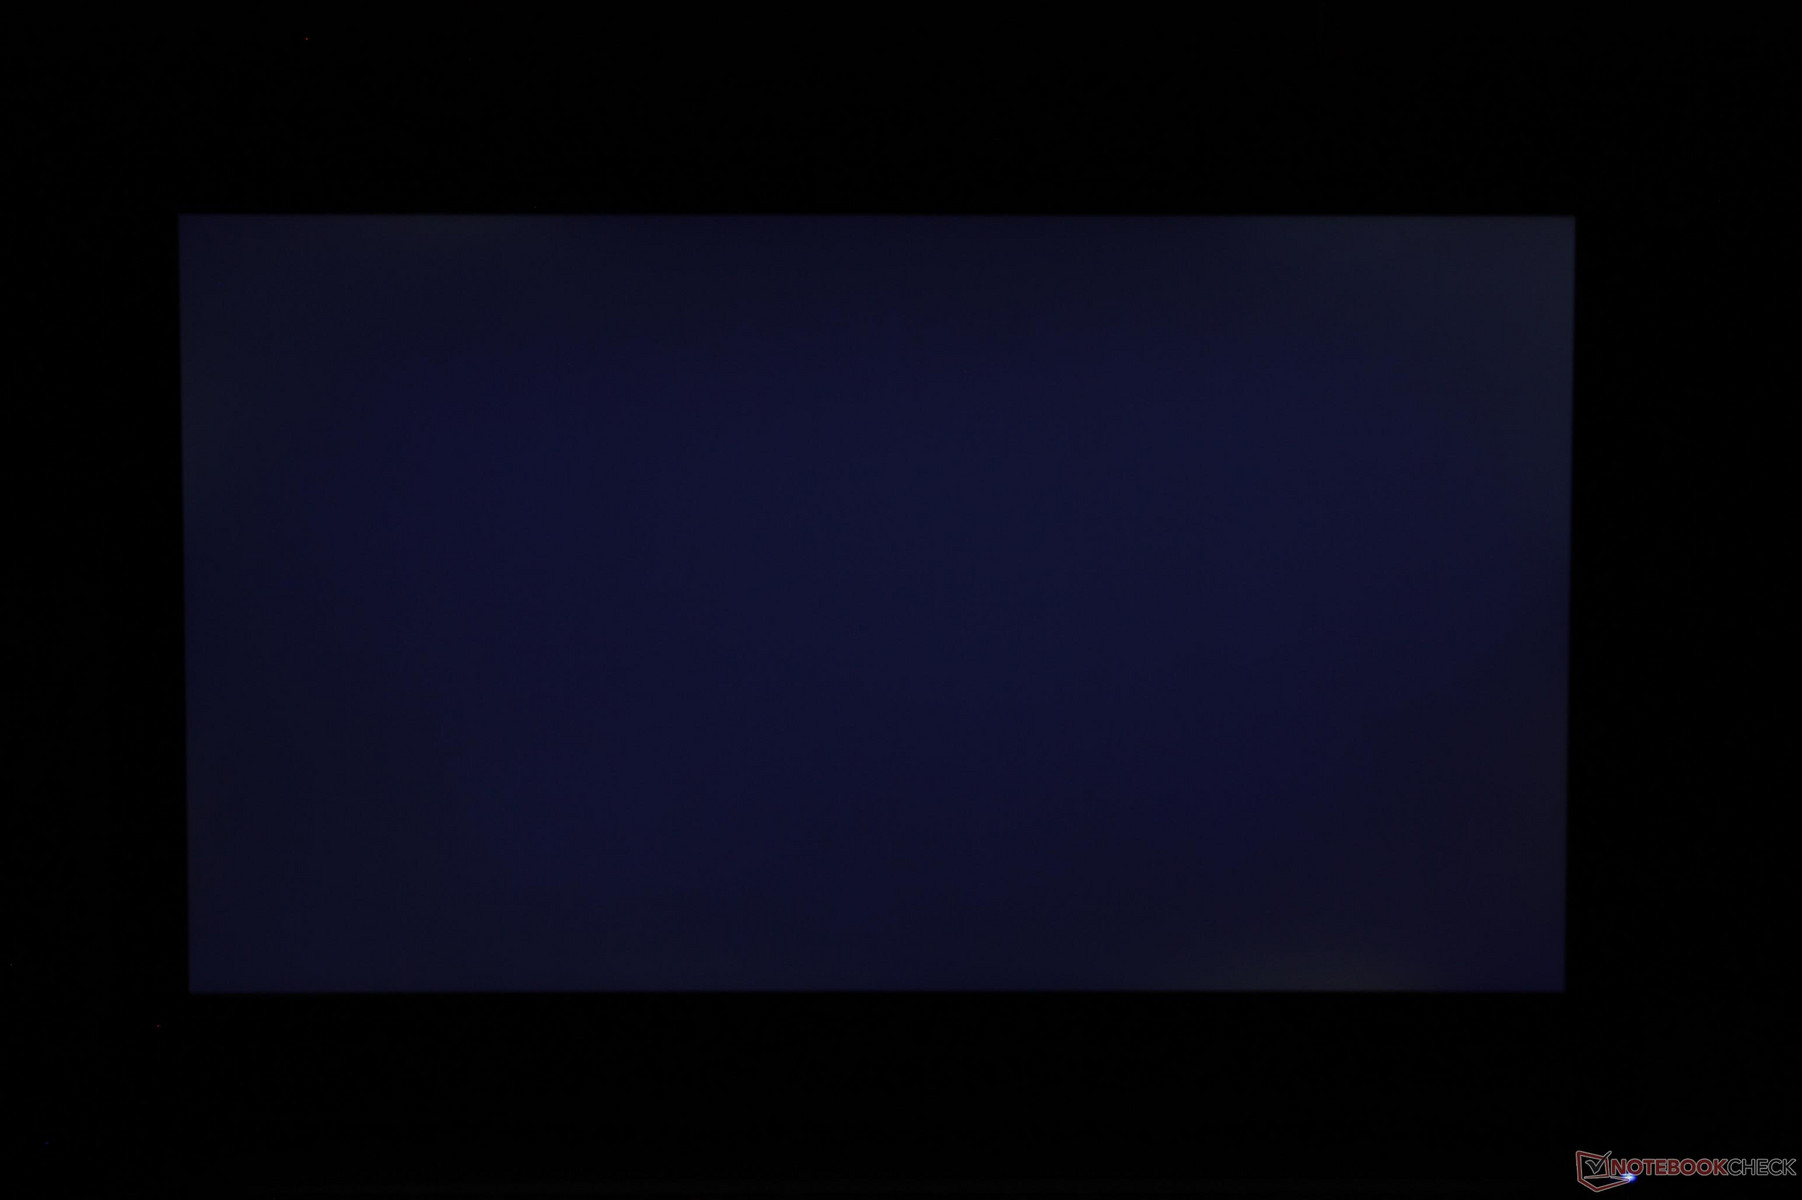
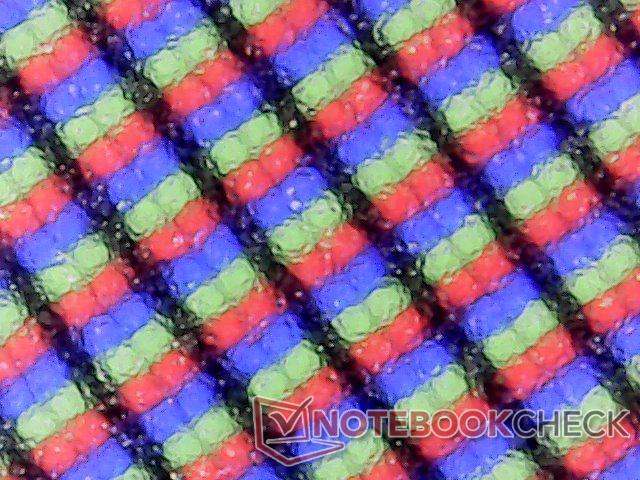
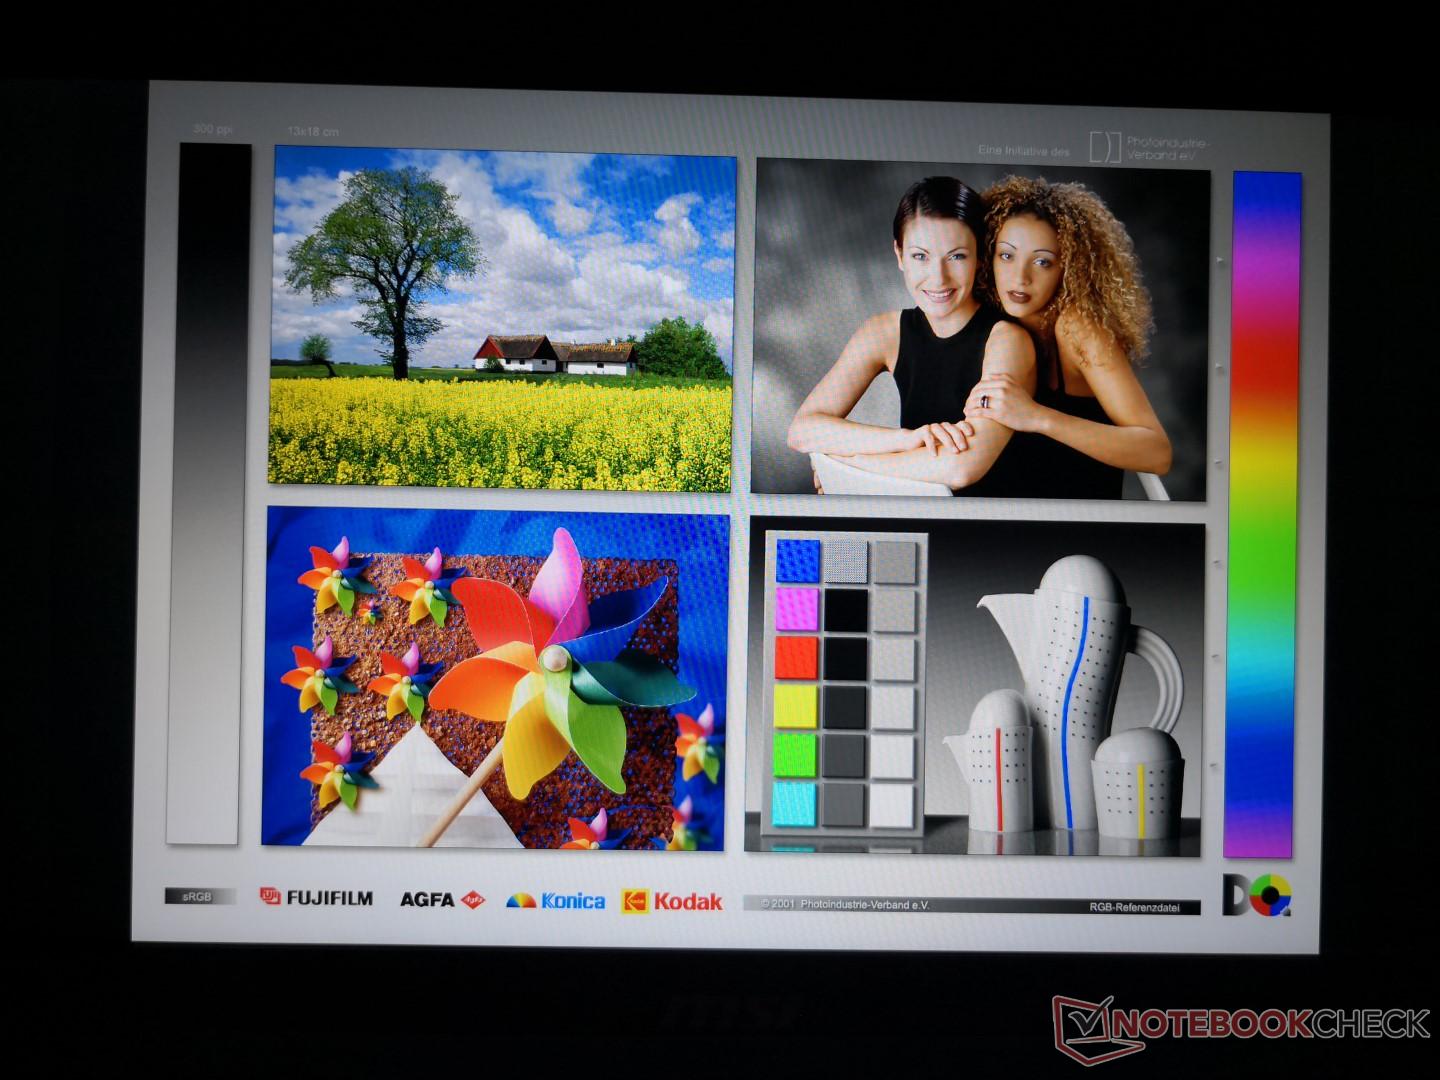
Subjectively, the matte screen is clean and crisp with almost no noticeable grains. The backlight bleeding around the edges and corners is minor and easy to ignore during video playback or when gaming.
| |||||||||||||||||||||||||
Brightness Distribution: 82 %
Center on Battery: 286.5 cd/m²
Contrast: 843:1 (Black: 0.34 cd/m²)
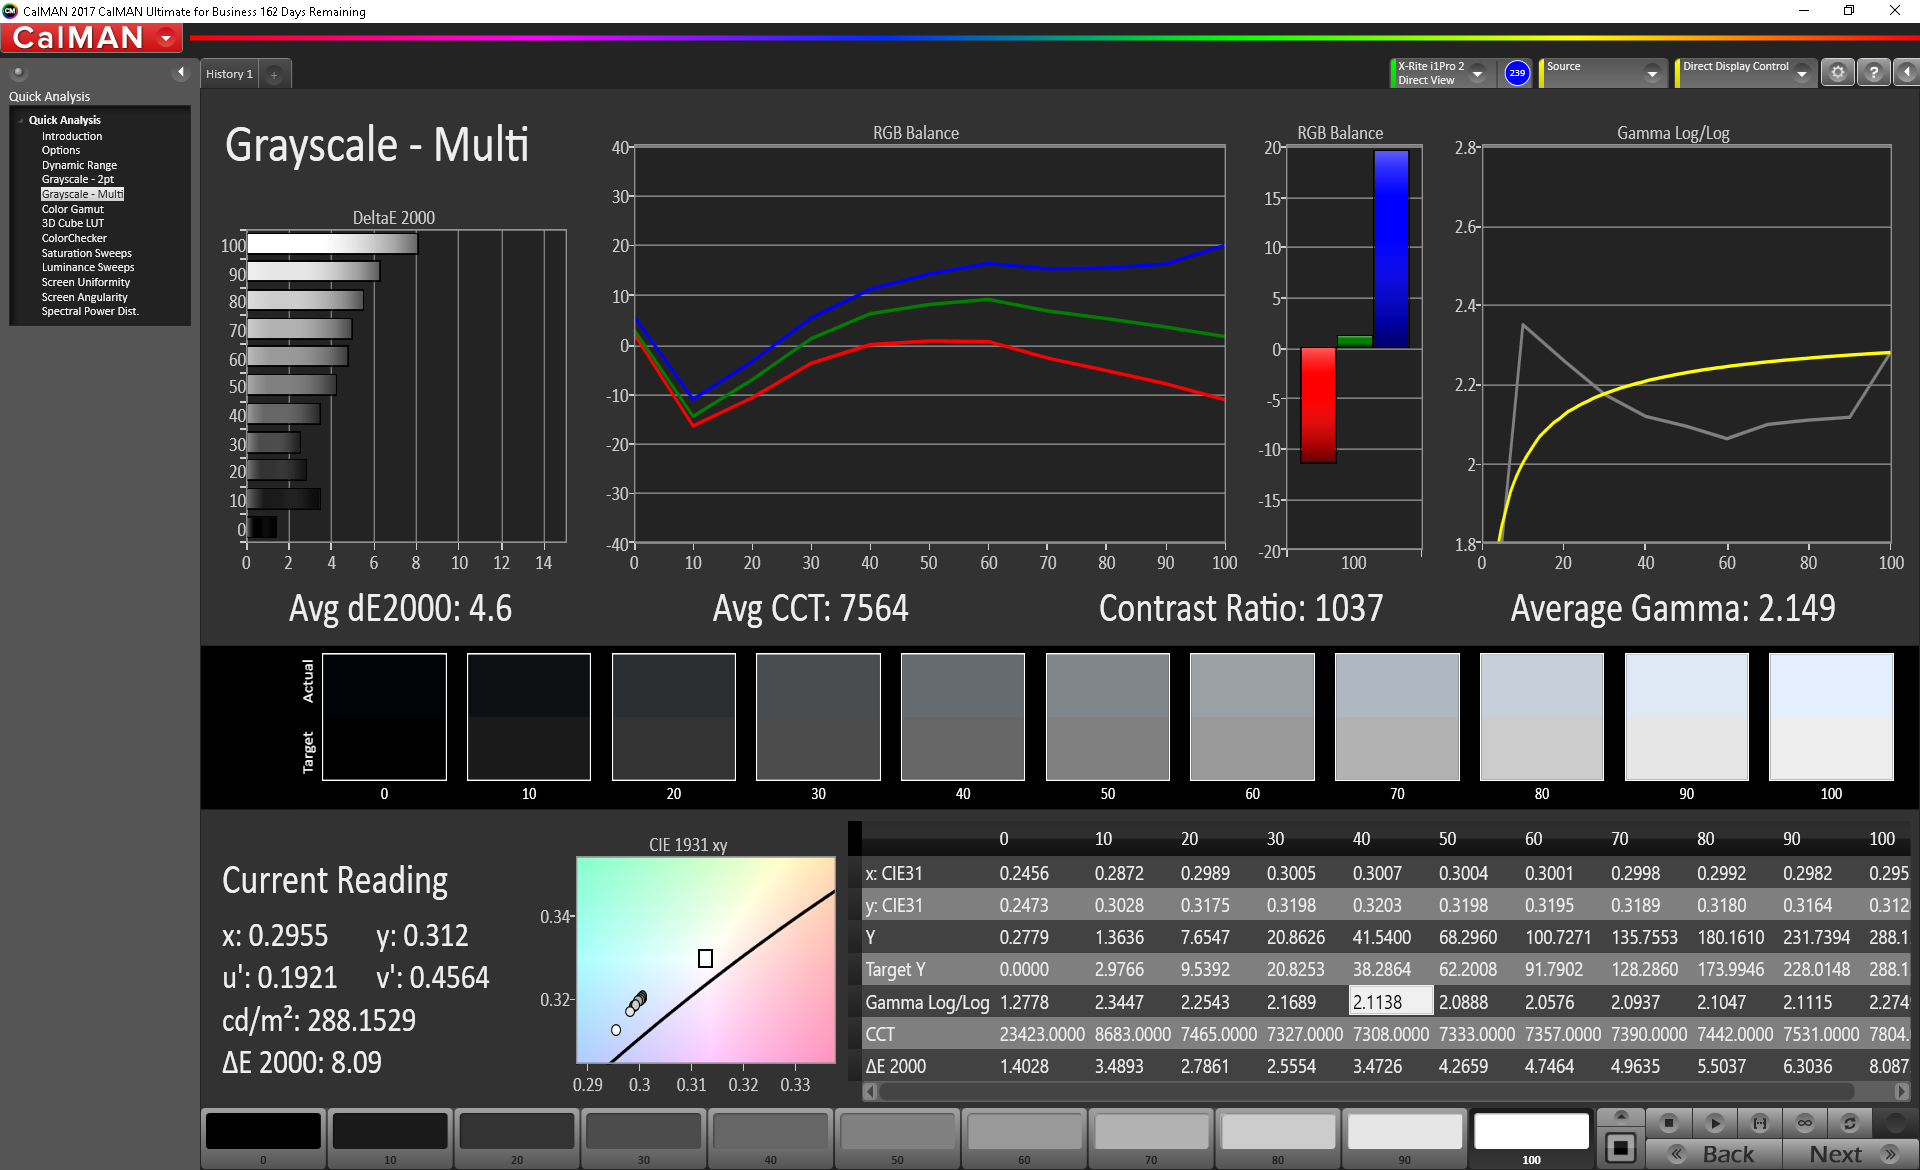
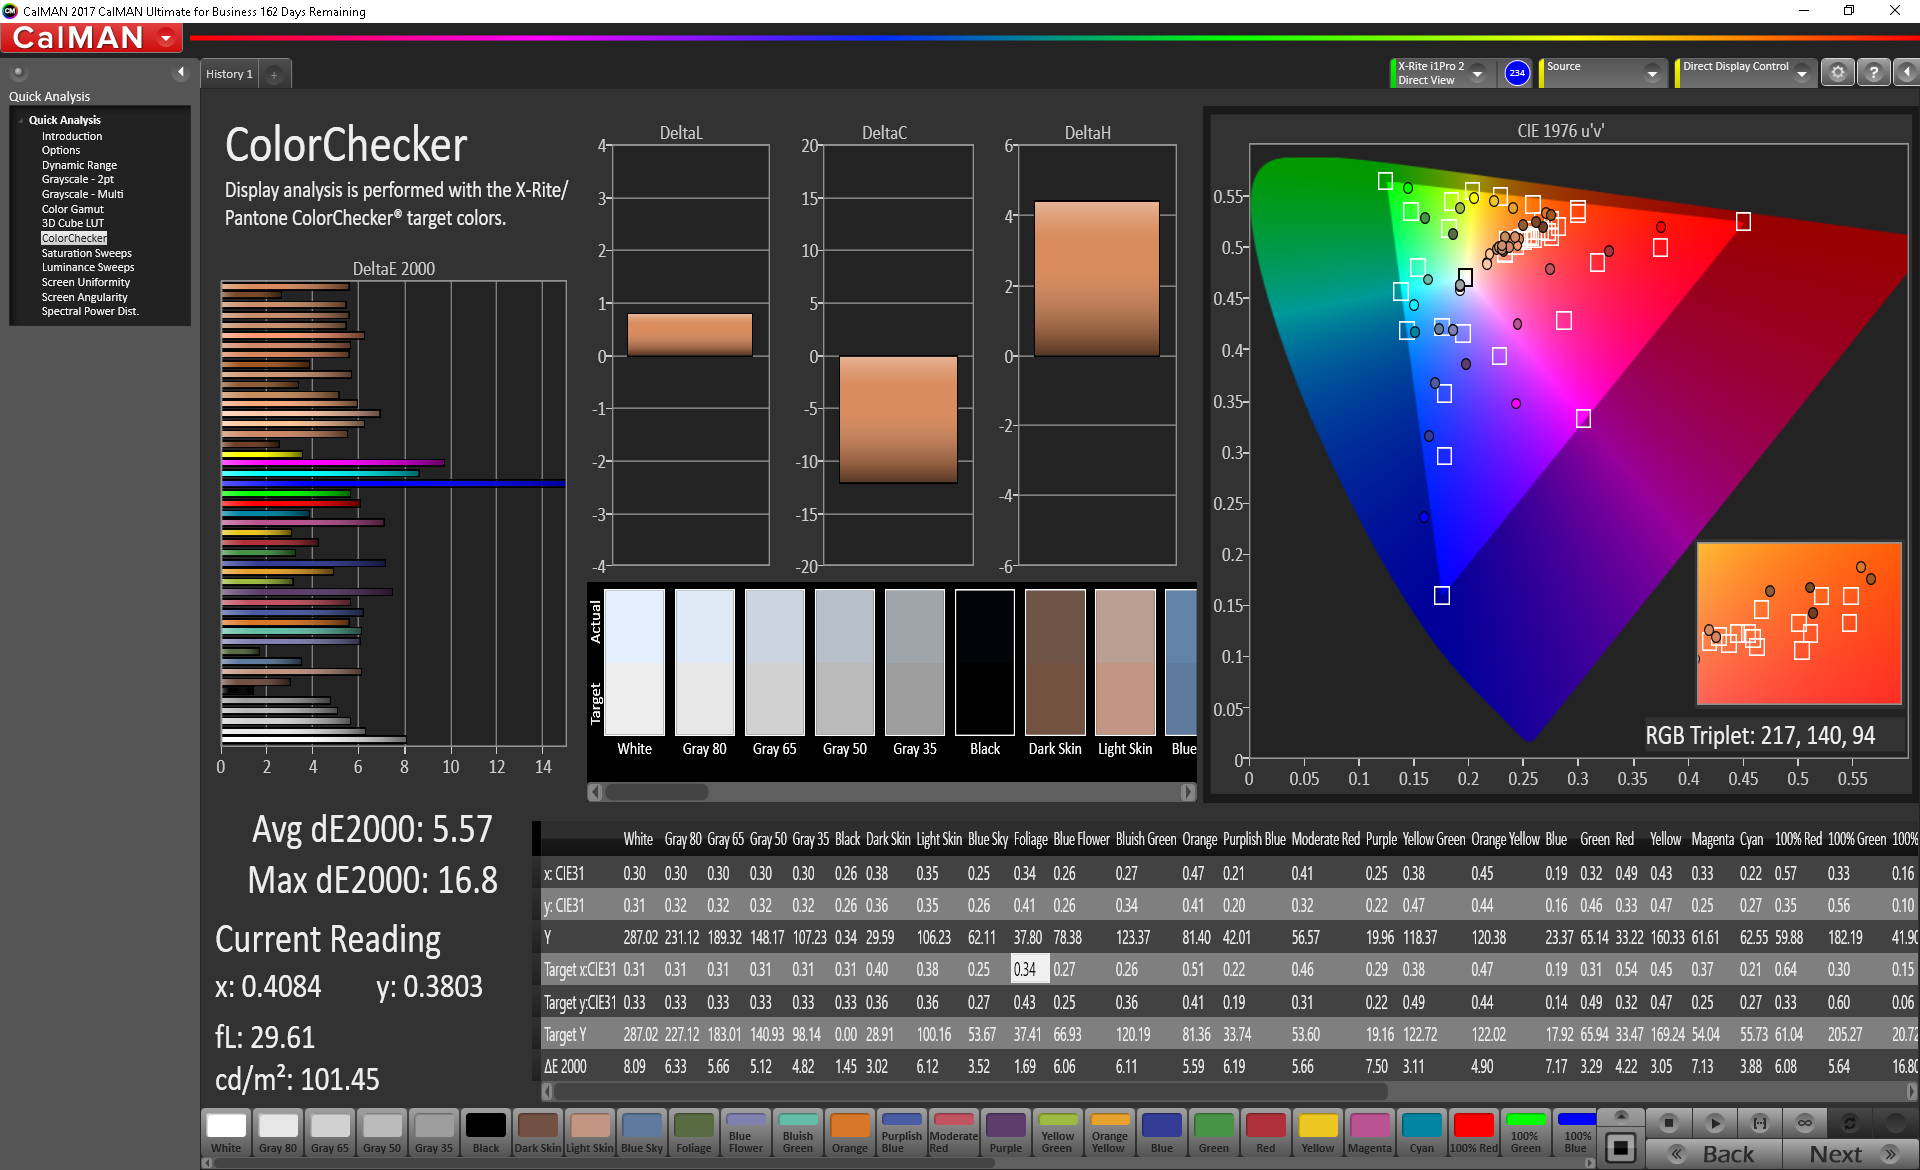
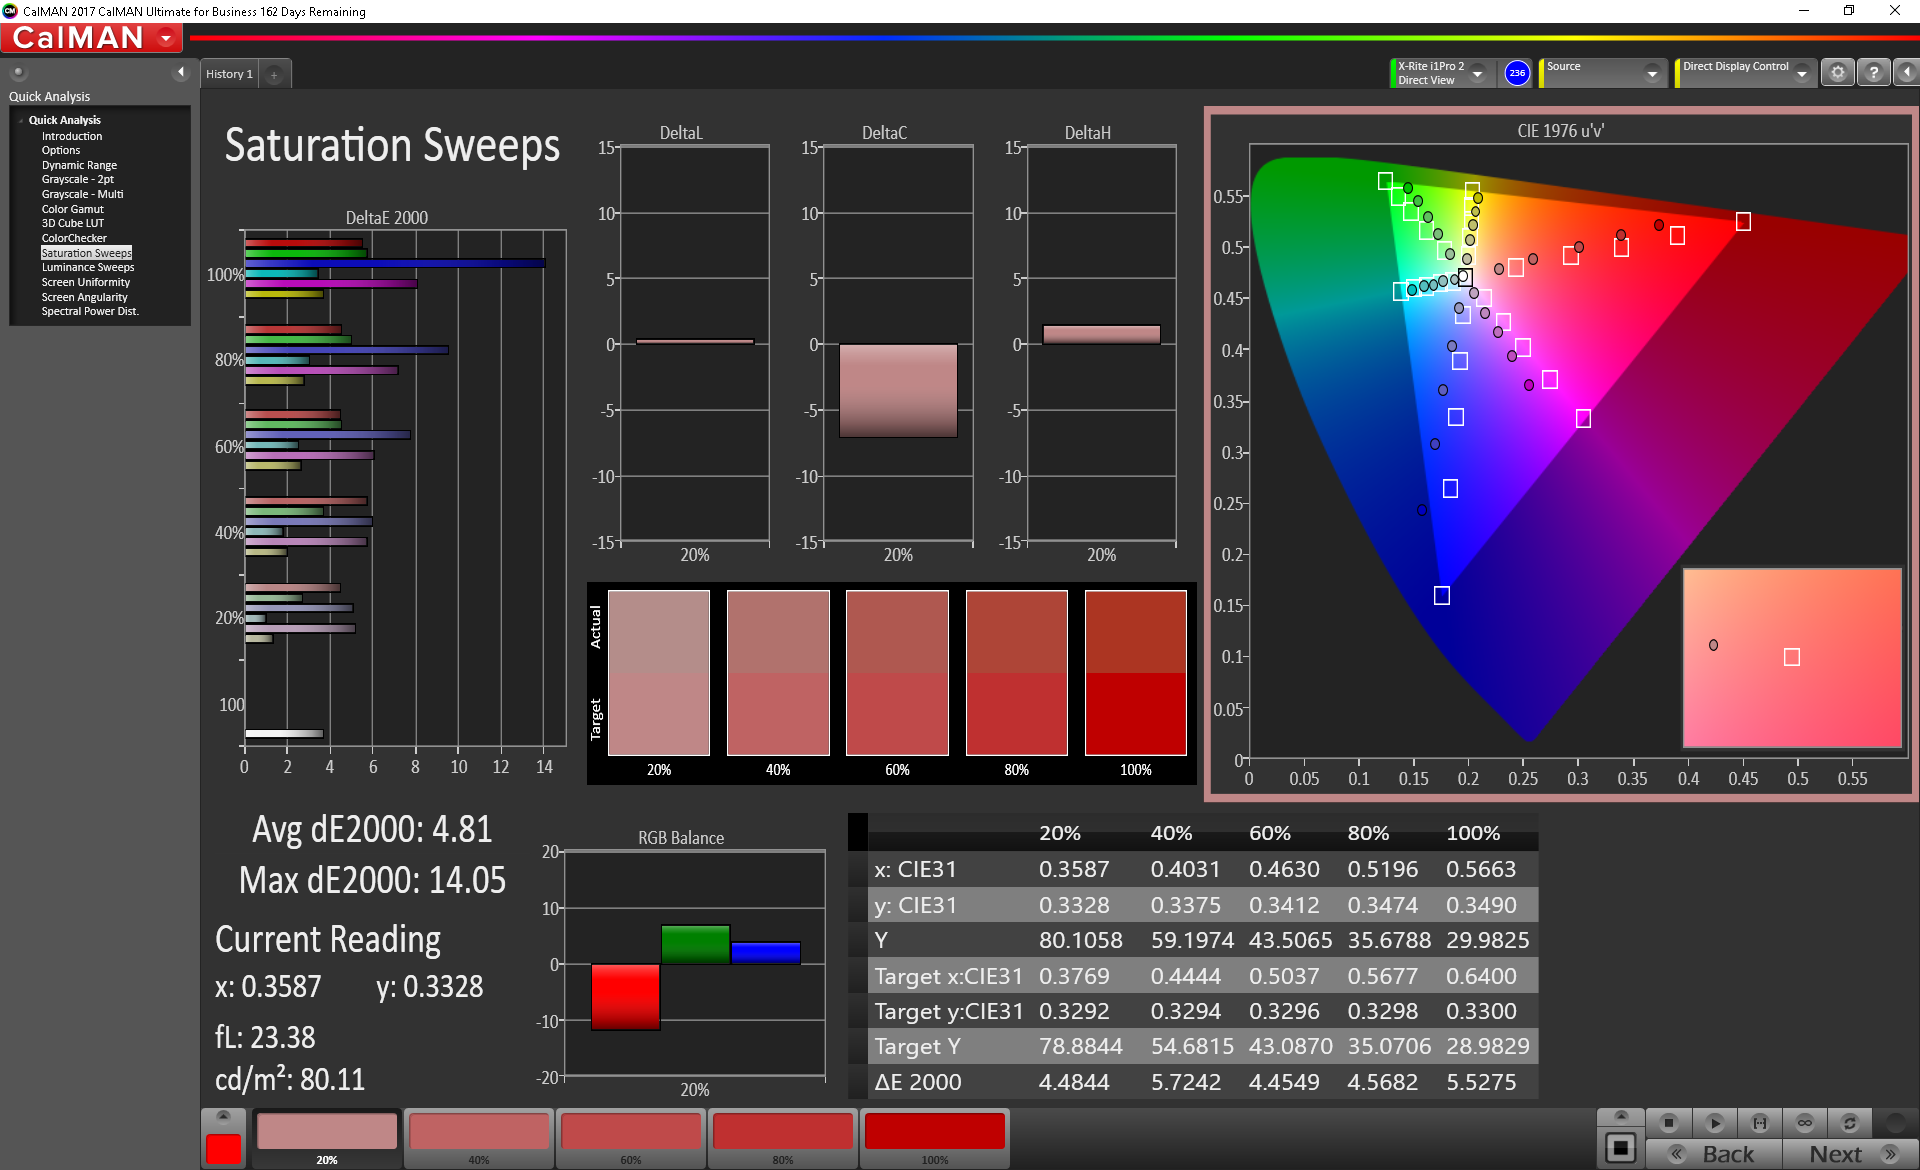
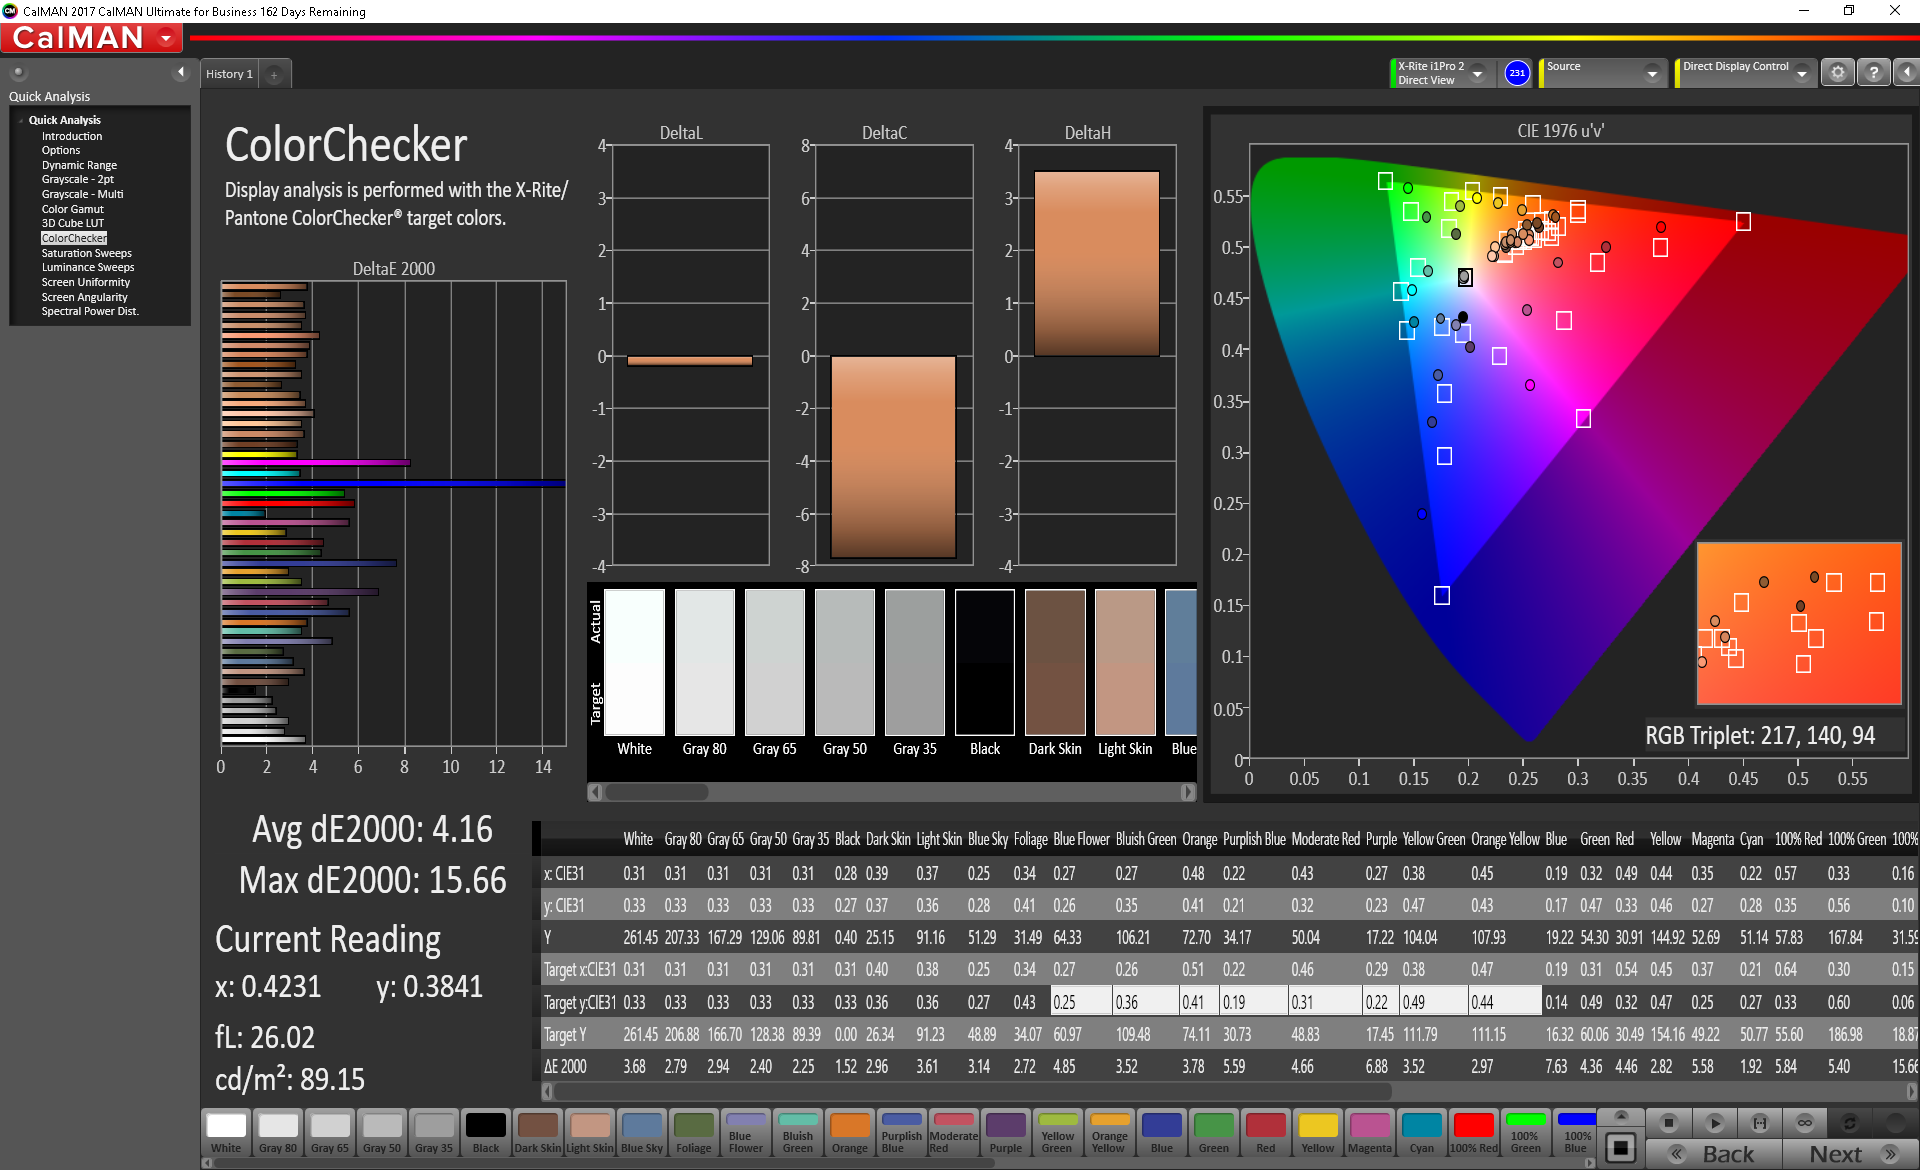
ΔE ColorChecker Calman: 5.57 | ∀{0.5-29.43 Ø4.71}
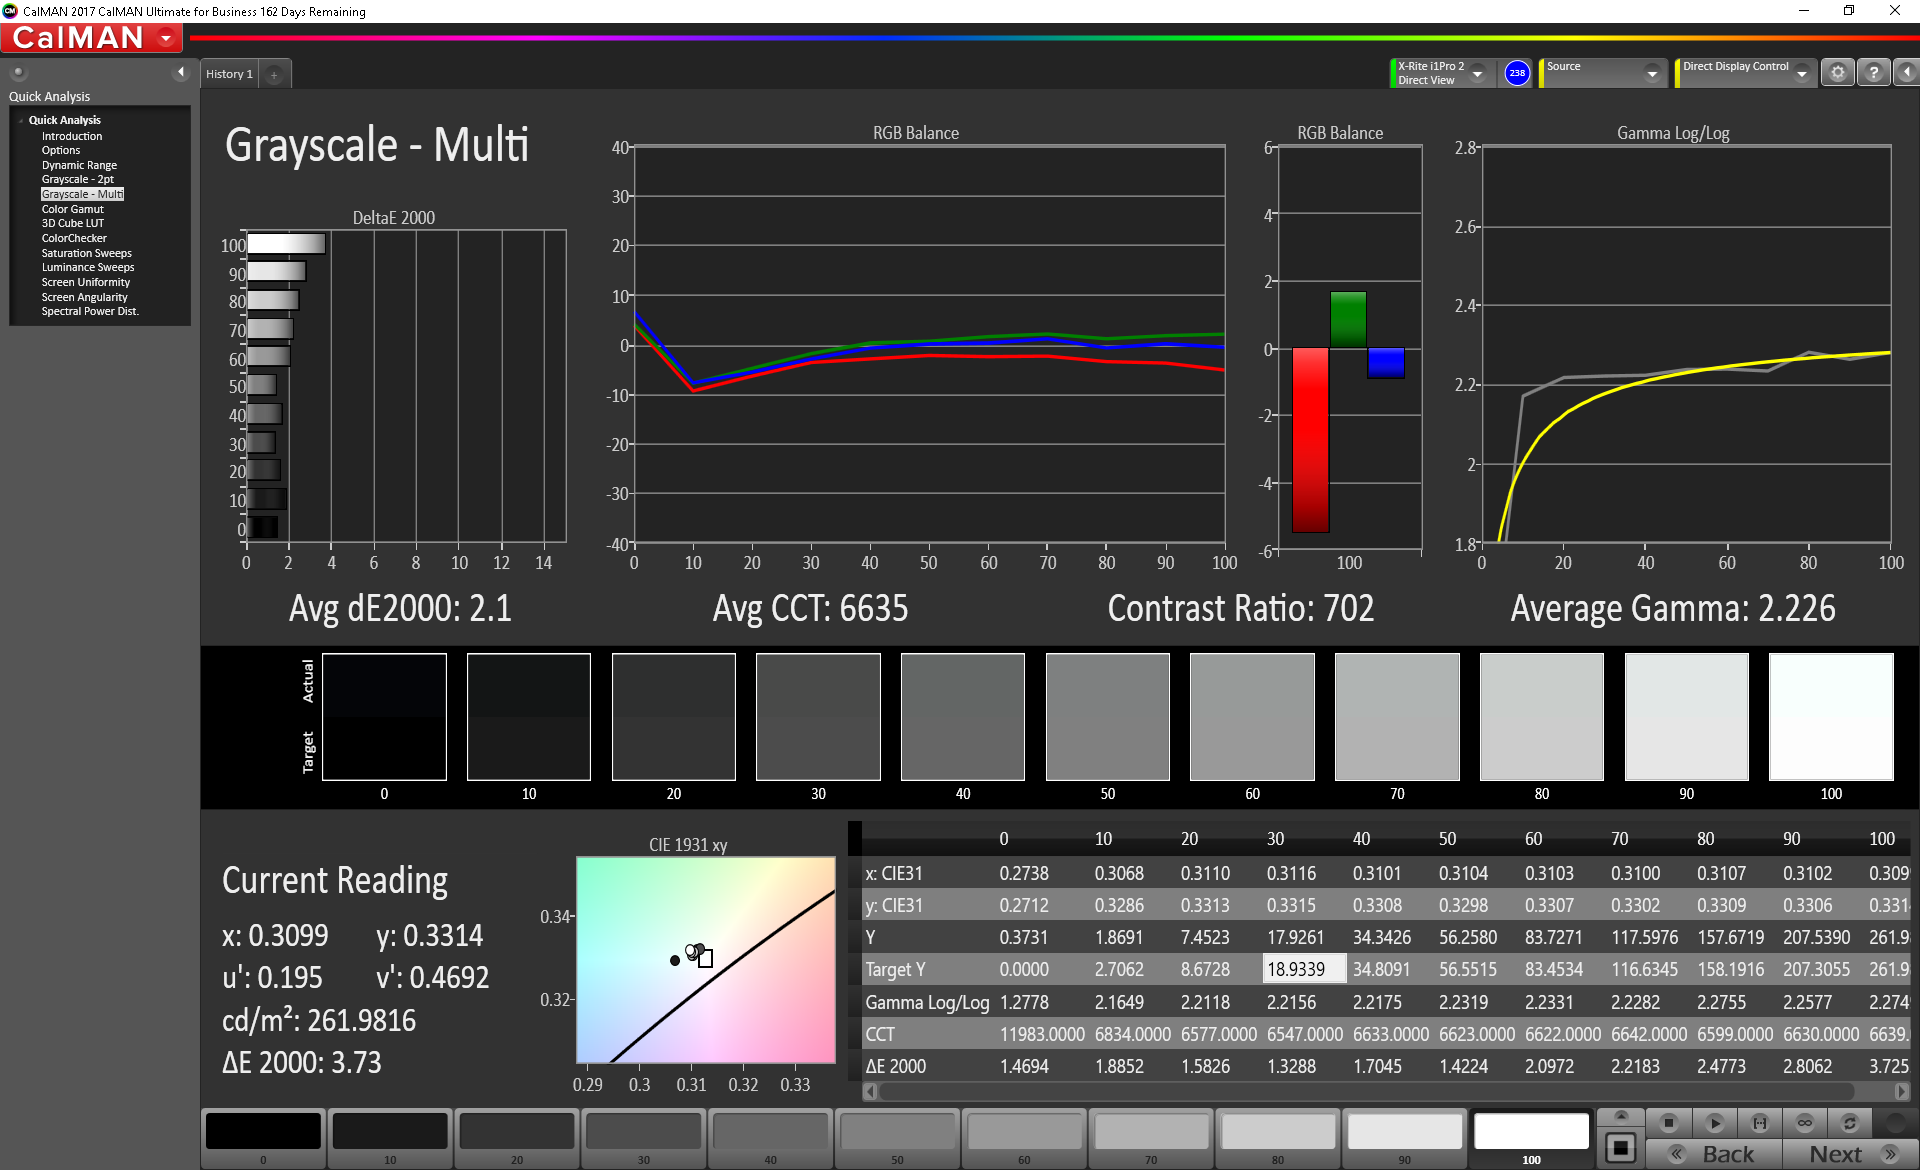
calibrated: 4.16
ΔE Greyscale Calman: 4.6 | ∀{0.09-98 Ø4.96}
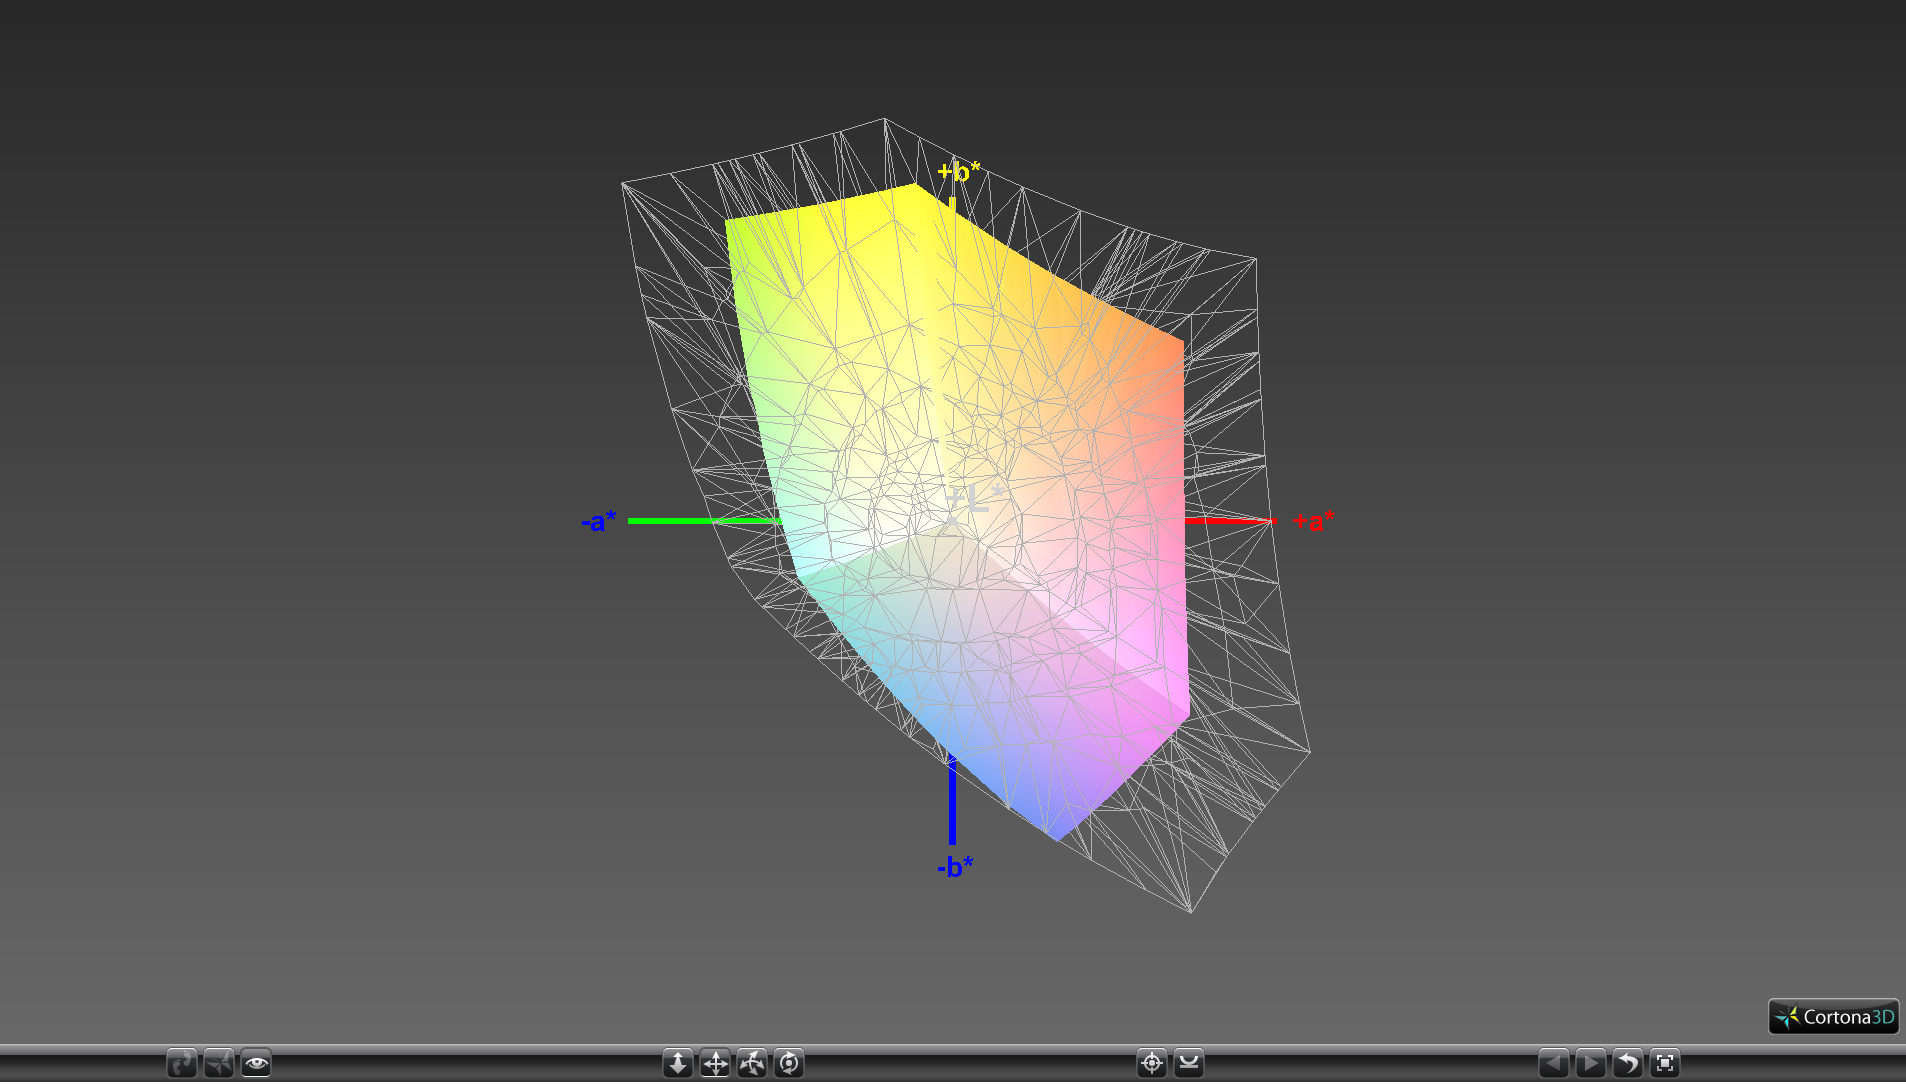
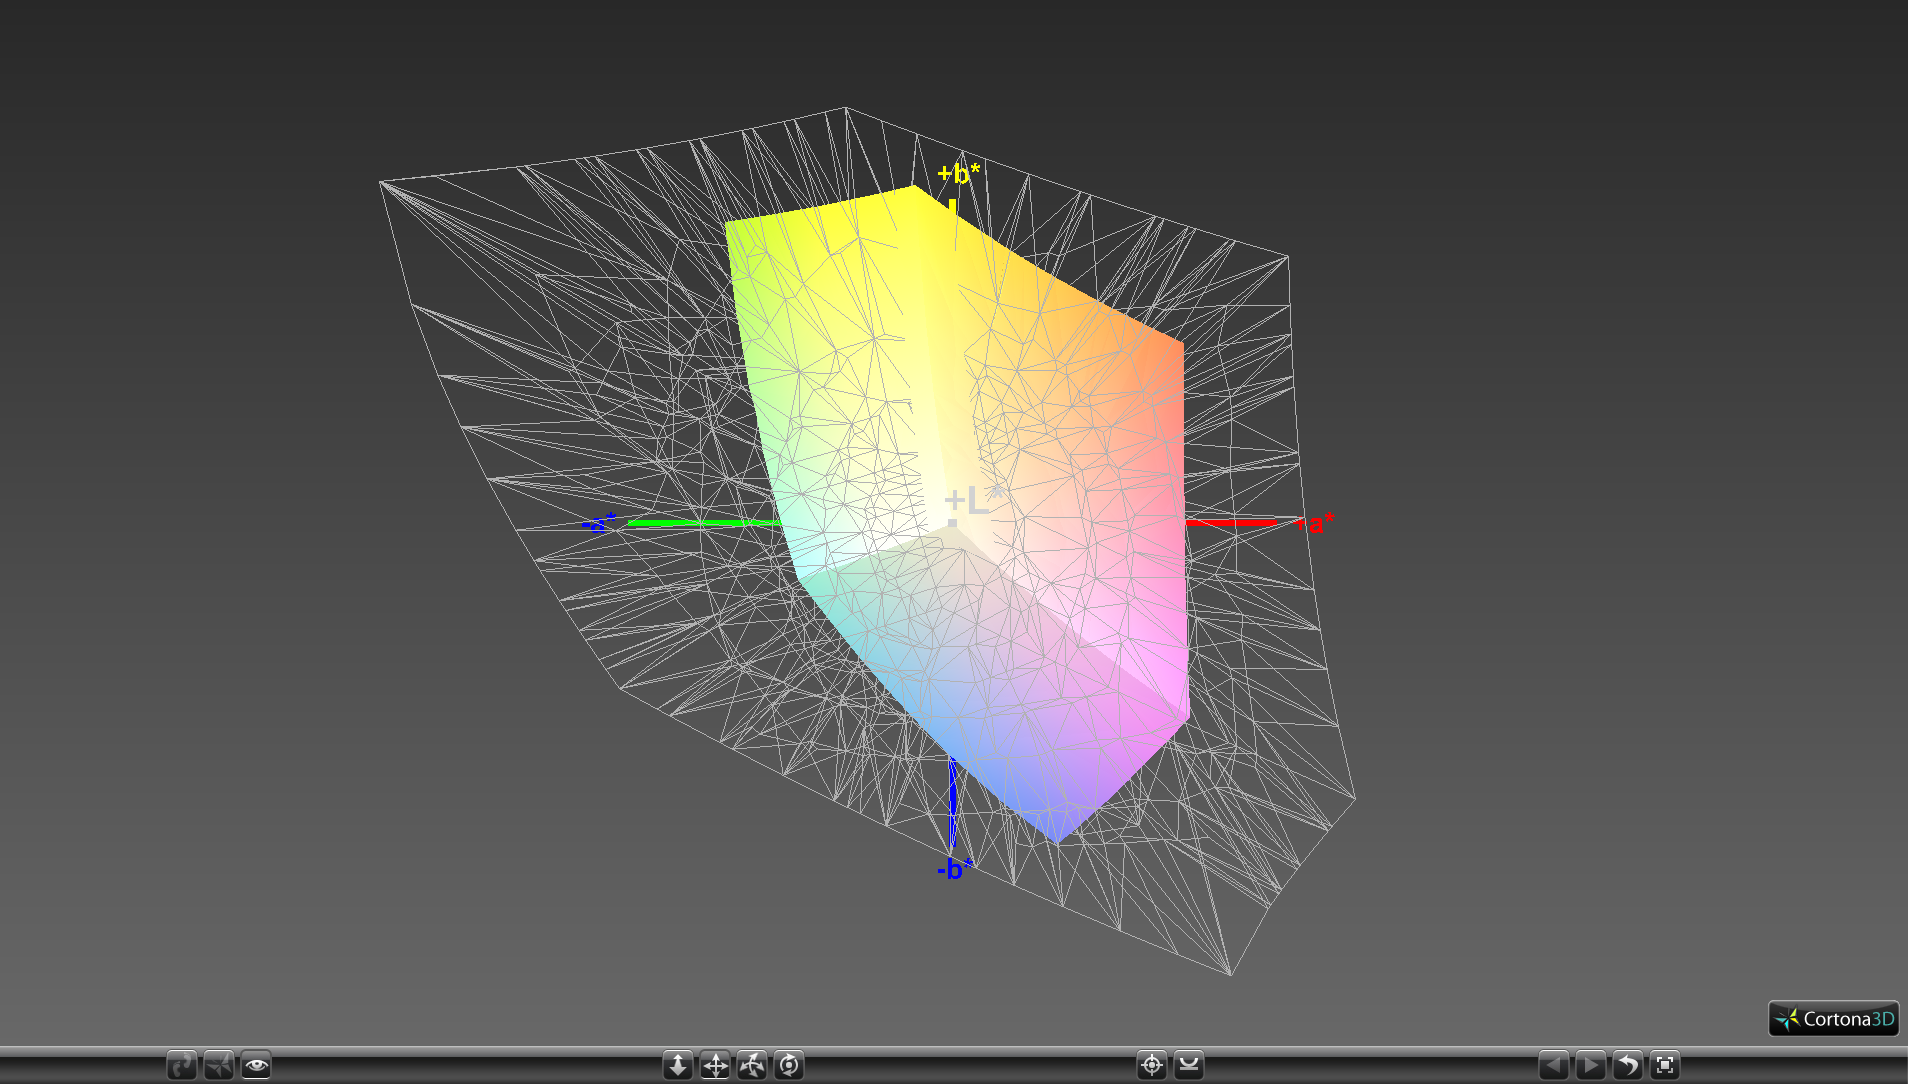
58.9% sRGB (Argyll 1.6.3 3D)
37.4% AdobeRGB 1998 (Argyll 1.6.3 3D)
40.72% AdobeRGB 1998 (Argyll 3D)
59.2% sRGB (Argyll 3D)
39.4% Display P3 (Argyll 3D)
Gamma: 2.15
CCT: 7564 K
| MSI GL63 8RC-069US LG Philips LP156WF6-SPK6, IPS, 15.6", 1920x1080 | Dell G5 15 5587 LGD053F, 156WF6, IPS, 15.6", 1920x1080 | MSI GL62M 7RD-077 Chi Mei N156HGE-EAL, TN LED, 15.6", 1920x1080 | Lenovo Legion Y520-15IKBA-80WY001VGE LG Philips LGD0533, IPS, 15.6", 1920x1080 | HP Pavilion 15 Power 1GK62AV ID: AU Optronics AUO41ED, IPS, 15.6", 1920x1080 | Gigabyte Sabre 15G ID: LGD0533, Name: LG Display LP156WF6-SPK3, IPS, 15.6", 1920x1080 | |
|---|---|---|---|---|---|---|
| Display | -3% | 97% | 0% | -2% | -1% | |
| Display P3 Coverage (%) | 39.4 | 38.13 -3% | 85.4 117% | 39.53 0% | 38.81 -1% | 38.97 -1% |
| sRGB Coverage (%) | 59.2 | 56.8 -4% | 100 69% | 59.2 0% | 57.9 -2% | 58.2 -2% |
| AdobeRGB 1998 Coverage (%) | 40.72 | 39.47 -3% | 83.8 106% | 40.86 0% | 40.03 -2% | 40.3 -1% |
| Response Times | 1% | -26% | -19% | -16% | -1% | |
| Response Time Grey 50% / Grey 80% * (ms) | 33.6 ? | 33 ? 2% | 44 ? -31% | 42 ? -25% | 38.8 ? -15% | 32 ? 5% |
| Response Time Black / White * (ms) | 24 ? | 24 ? -0% | 29 ? -21% | 27 ? -13% | 28 ? -17% | 25.6 ? -7% |
| PWM Frequency (Hz) | 198 ? | 24900 ? | 20000 ? | |||
| Screen | -7% | -17% | -3% | 11% | -14% | |
| Brightness middle (cd/m²) | 286.5 | 229 -20% | 258 -10% | 243 -15% | 256.6 -10% | 248.4 -13% |
| Brightness (cd/m²) | 258 | 224 -13% | 234 -9% | 231 -10% | 243 -6% | 241 -7% |
| Brightness Distribution (%) | 82 | 87 6% | 79 -4% | 87 6% | 81 -1% | 84 2% |
| Black Level * (cd/m²) | 0.34 | 0.28 18% | 0.54 -59% | 0.24 29% | 0.19 44% | 0.3 12% |
| Contrast (:1) | 843 | 818 -3% | 478 -43% | 1013 20% | 1351 60% | 828 -2% |
| Colorchecker dE 2000 * | 5.57 | 6.1 -10% | 9.74 -75% | 6.36 -14% | 5 10% | 7.5 -35% |
| Colorchecker dE 2000 max. * | 16.8 | 12.2 27% | 14.6 13% | 12.76 24% | 20.1 -20% | 25.2 -50% |
| Colorchecker dE 2000 calibrated * | 4.16 | 6.12 -47% | 6.51 -56% | |||
| Greyscale dE 2000 * | 4.6 | 5.68 -23% | 11.59 -152% | 5.63 -22% | 2.7 41% | 6.5 -41% |
| Gamma | 2.15 102% | 2.4 92% | 2.19 100% | 2.47 89% | 2.32 95% | 2.19 100% |
| CCT | 7564 86% | 6989 93% | 11851 55% | 7411 88% | 6599 98% | 7852 83% |
| Color Space (Percent of AdobeRGB 1998) (%) | 37.4 | 36 -4% | 76 103% | 38 2% | 36.7 -2% | 37 -1% |
| Color Space (Percent of sRGB) (%) | 58.9 | 57 -3% | 100 70% | 59 0% | 57.7 -2% | 57.9 -2% |
| Total Average (Program / Settings) | -3% /
-5% | 18% /
5% | -7% /
-5% | -2% /
5% | -5% /
-10% |
* ... smaller is better
Color space is approximately 37 percent and 59 percent of the AdobeRGB and sRGB standards, respectively. Results are unsurprisingly very similar to the LG panels found on the Sabre 15 and Dell G5 15. Graphics artists may want to consider a different notebook with wider color gamuts like the XPS 15 or Gigabyte Aero 15X. The 100 percent sRGB Chi Mei option from last year's MSI GL62 is seemingly not available on the new GL63 series.
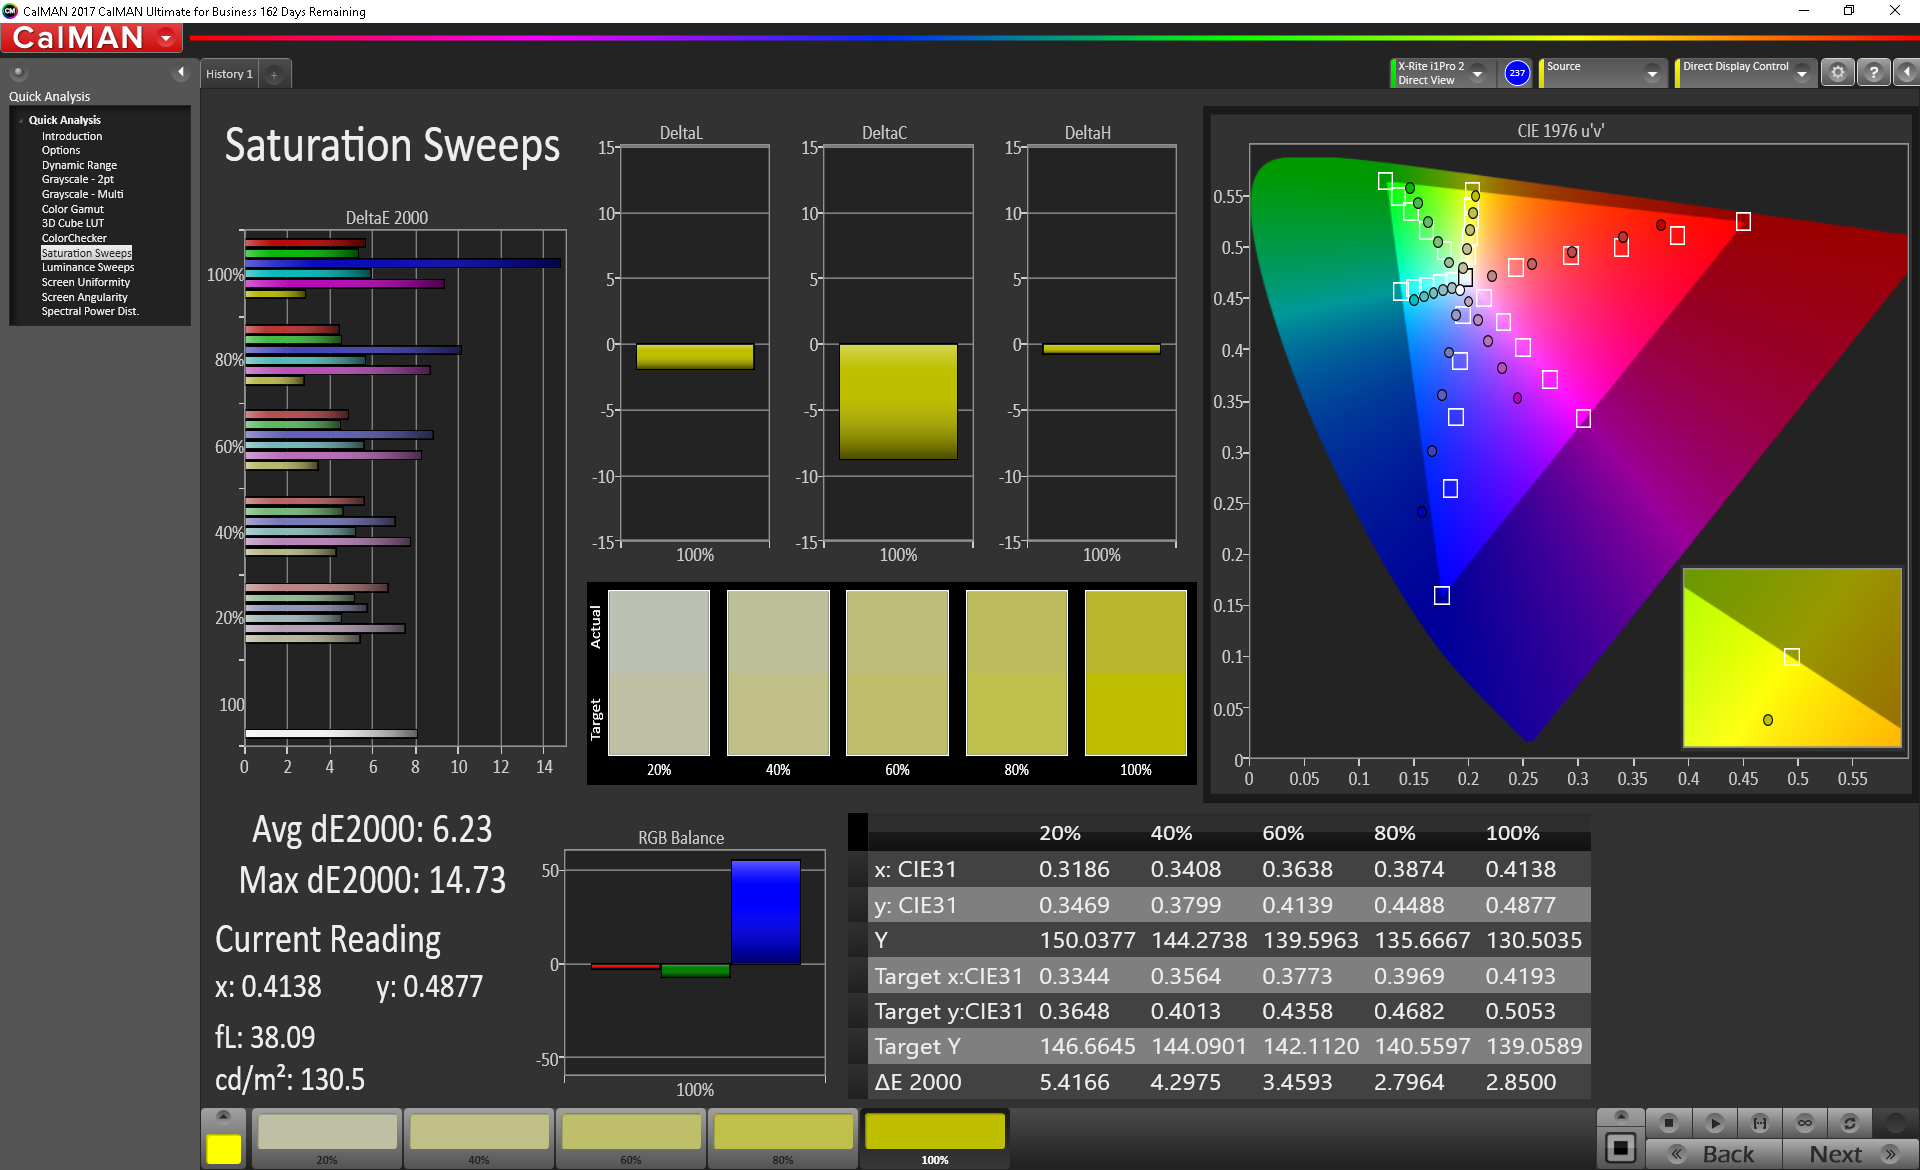
Further measurements with a X-Rite spectrophotometer show a generally inaccurate grayscale and an overly cool color temperature not unlike many budget MSI notebooks in the past. Our calibration attempts improve grayscale by noticeable margins with more accurate colors on lower saturation levels. Even so, the limited gamut prevents most colors from being very accurate. Pure blue, for example, appears Blue-violet even after calibration.
Display Response Times
| ↔ Response Time Black to White | ||
|---|---|---|
| 24 ms ... rise ↗ and fall ↘ combined | ↗ 13.2 ms rise | 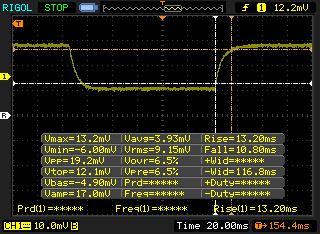 |
| ↘ 10.8 ms fall | ||
| The screen shows good response rates in our tests, but may be too slow for competitive gamers. In comparison, all tested devices range from 0.1 (minimum) to 240 (maximum) ms. » 54 % of all devices are better. This means that the measured response time is worse than the average of all tested devices (19.8 ms). | ||
| ↔ Response Time 50% Grey to 80% Grey | ||
| 33.6 ms ... rise ↗ and fall ↘ combined | ↗ 16.8 ms rise | 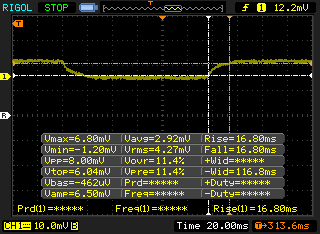 |
| ↘ 16.8 ms fall | ||
| The screen shows slow response rates in our tests and will be unsatisfactory for gamers. In comparison, all tested devices range from 0.165 (minimum) to 636 (maximum) ms. » 46 % of all devices are better. This means that the measured response time is similar to the average of all tested devices (30.9 ms). | ||
Screen Flickering / PWM (Pulse-Width Modulation)
| Screen flickering / PWM not detected |  | ||
In comparison: 52 % of all tested devices do not use PWM to dim the display. If PWM was detected, an average of 7748 (minimum: 5 - maximum: 343500) Hz was measured. | |||
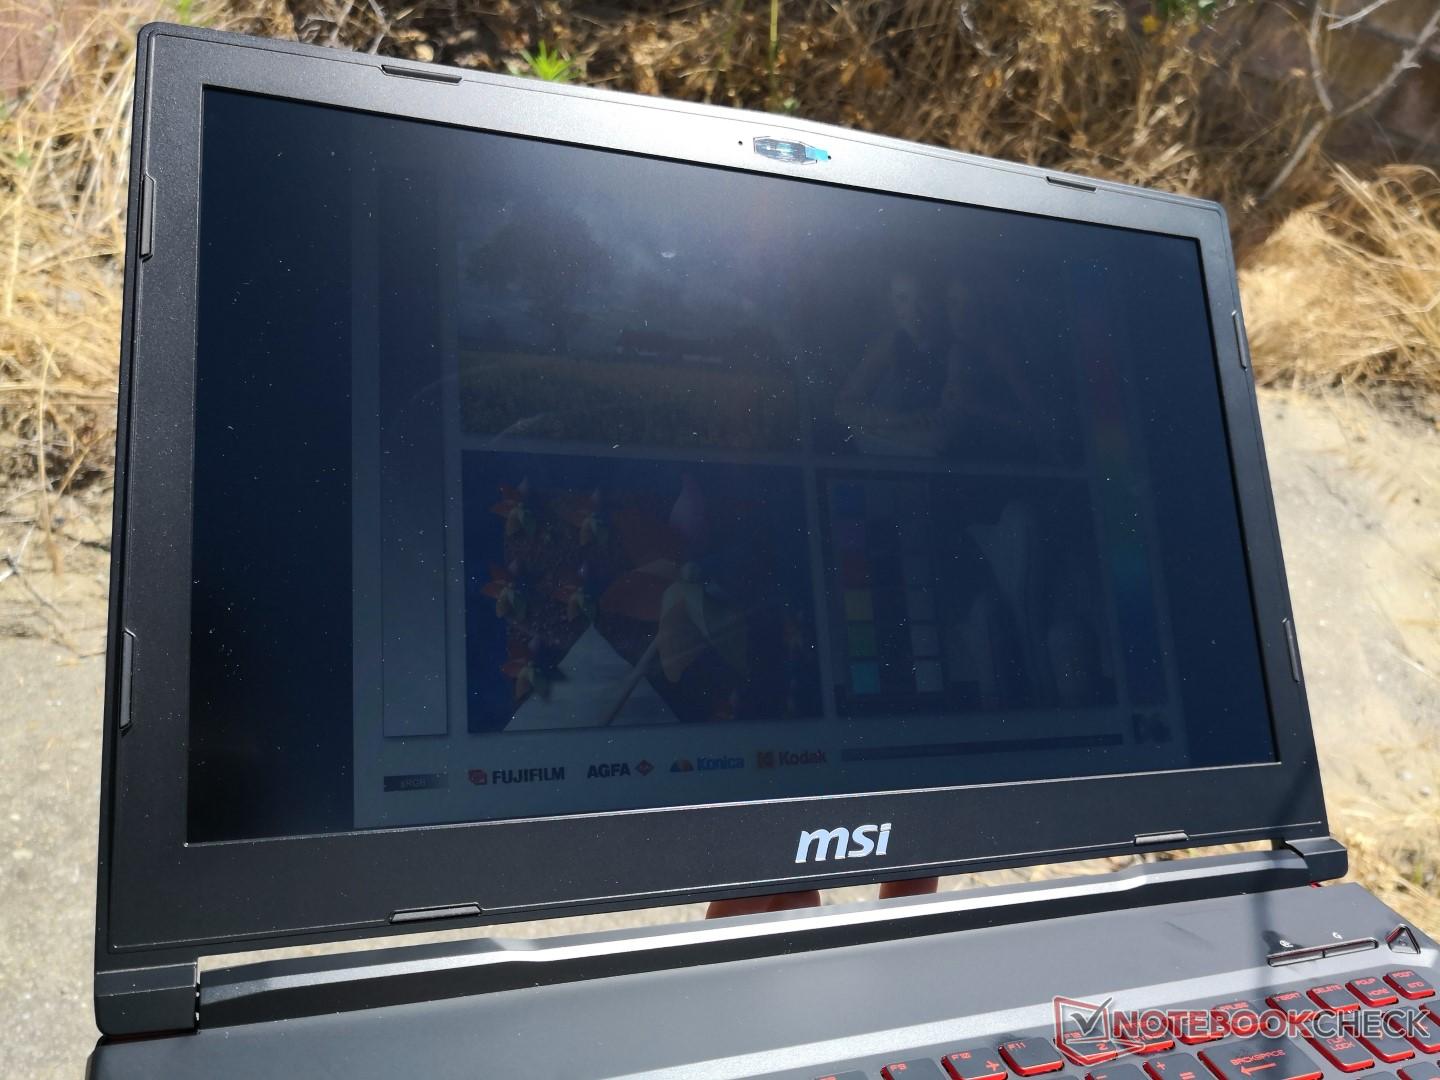
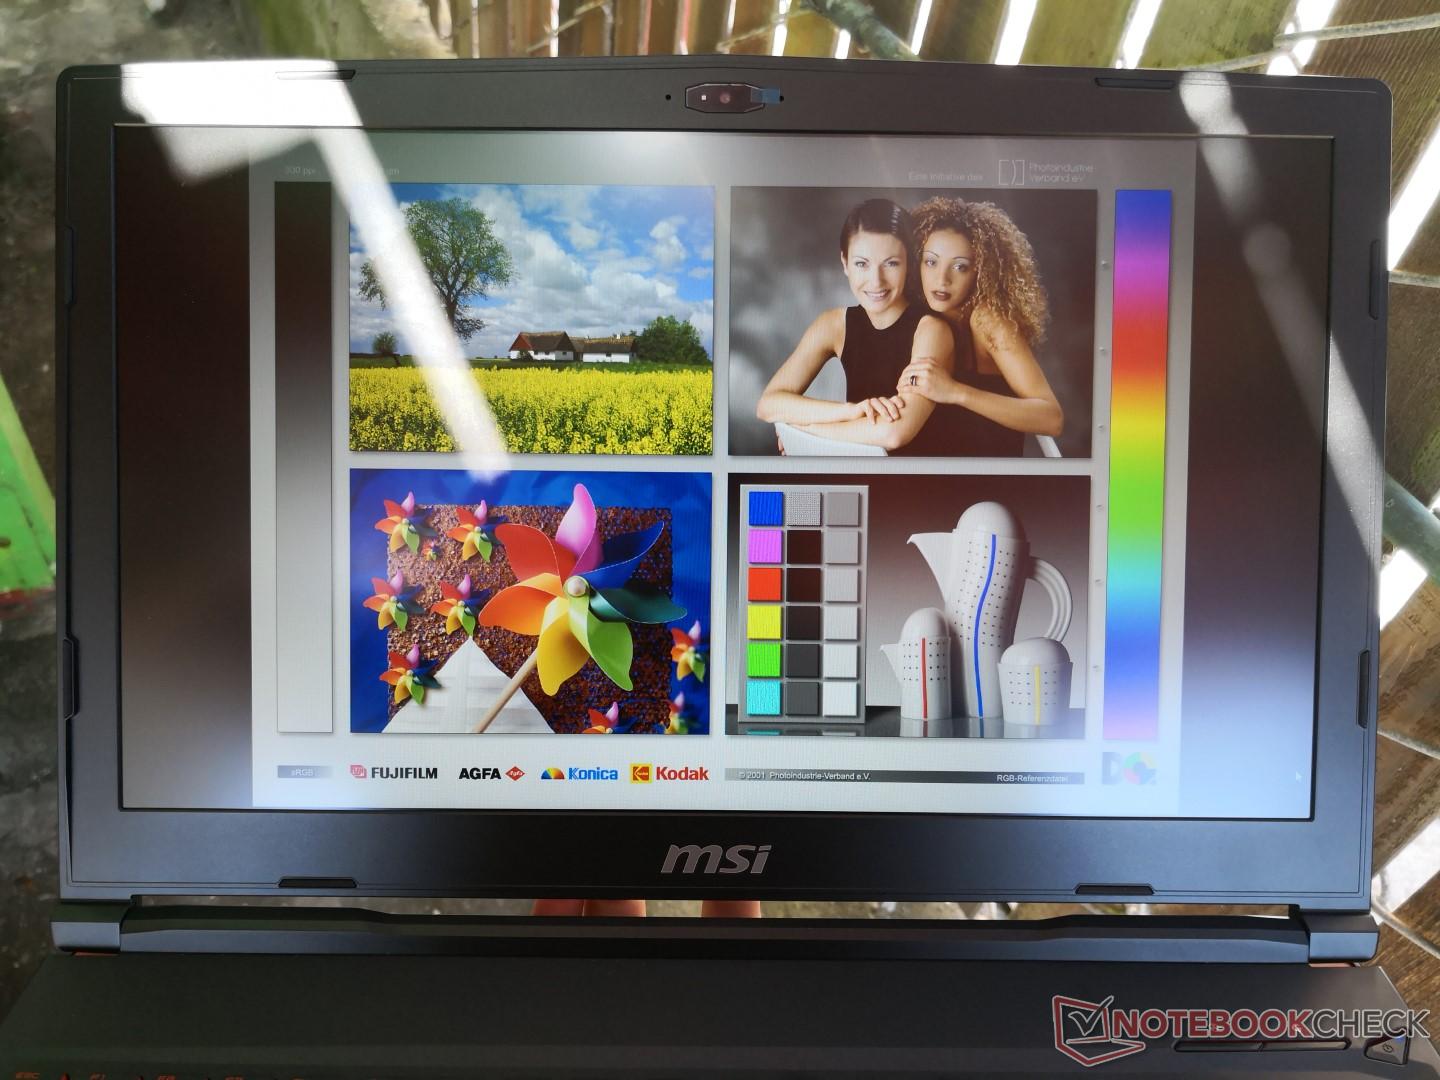
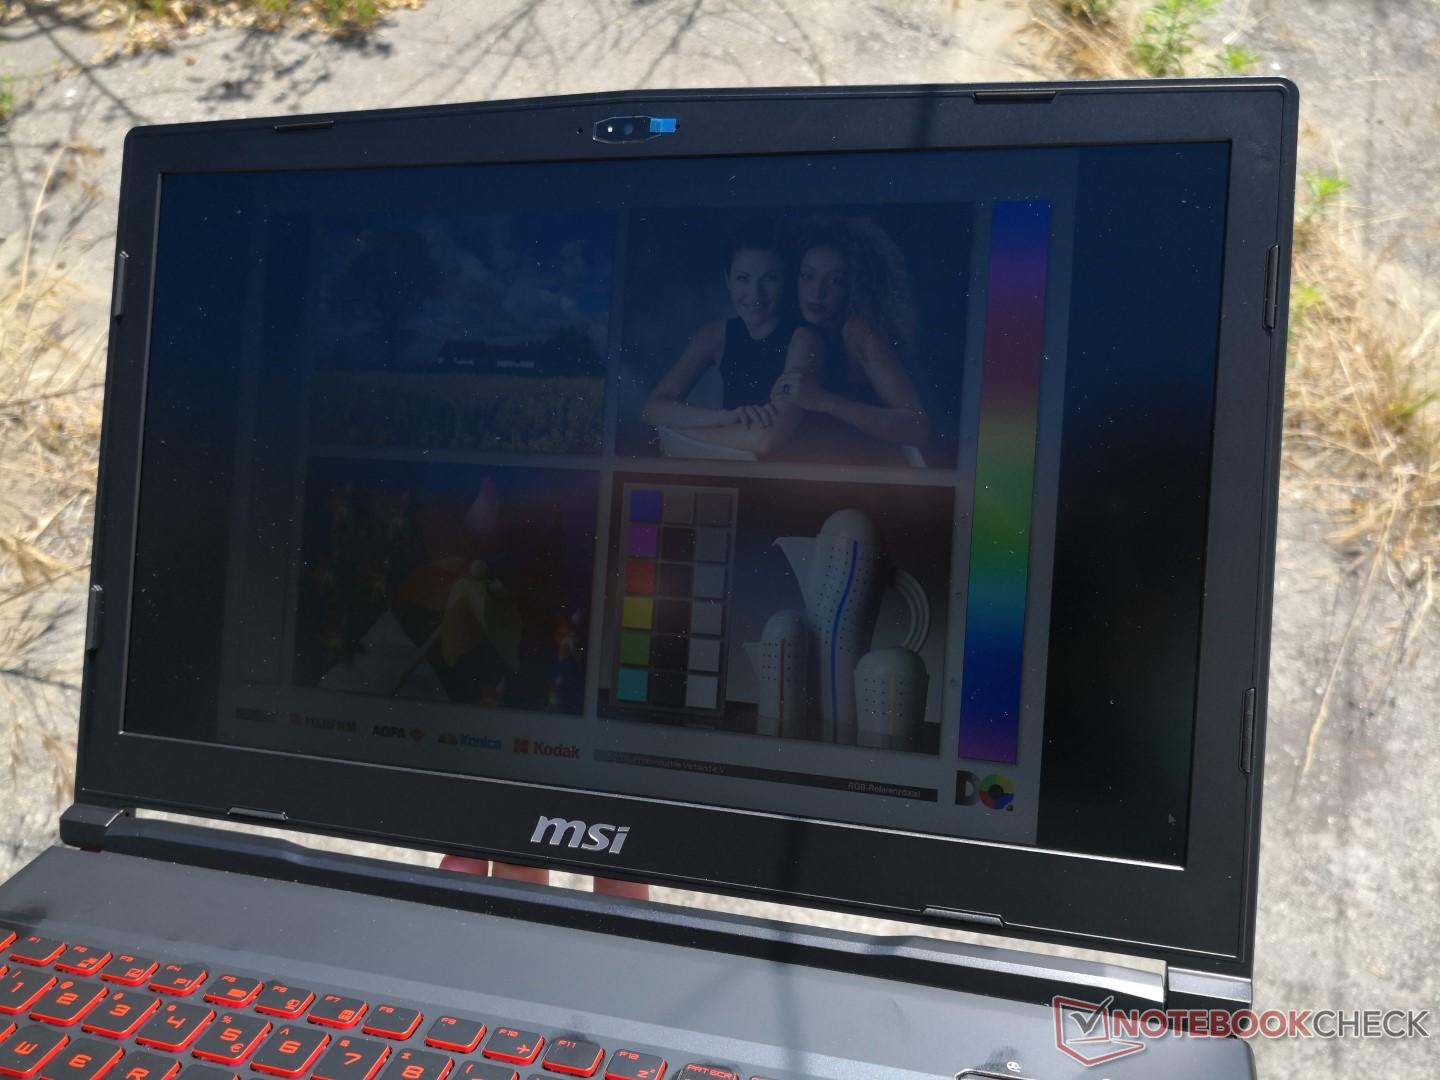
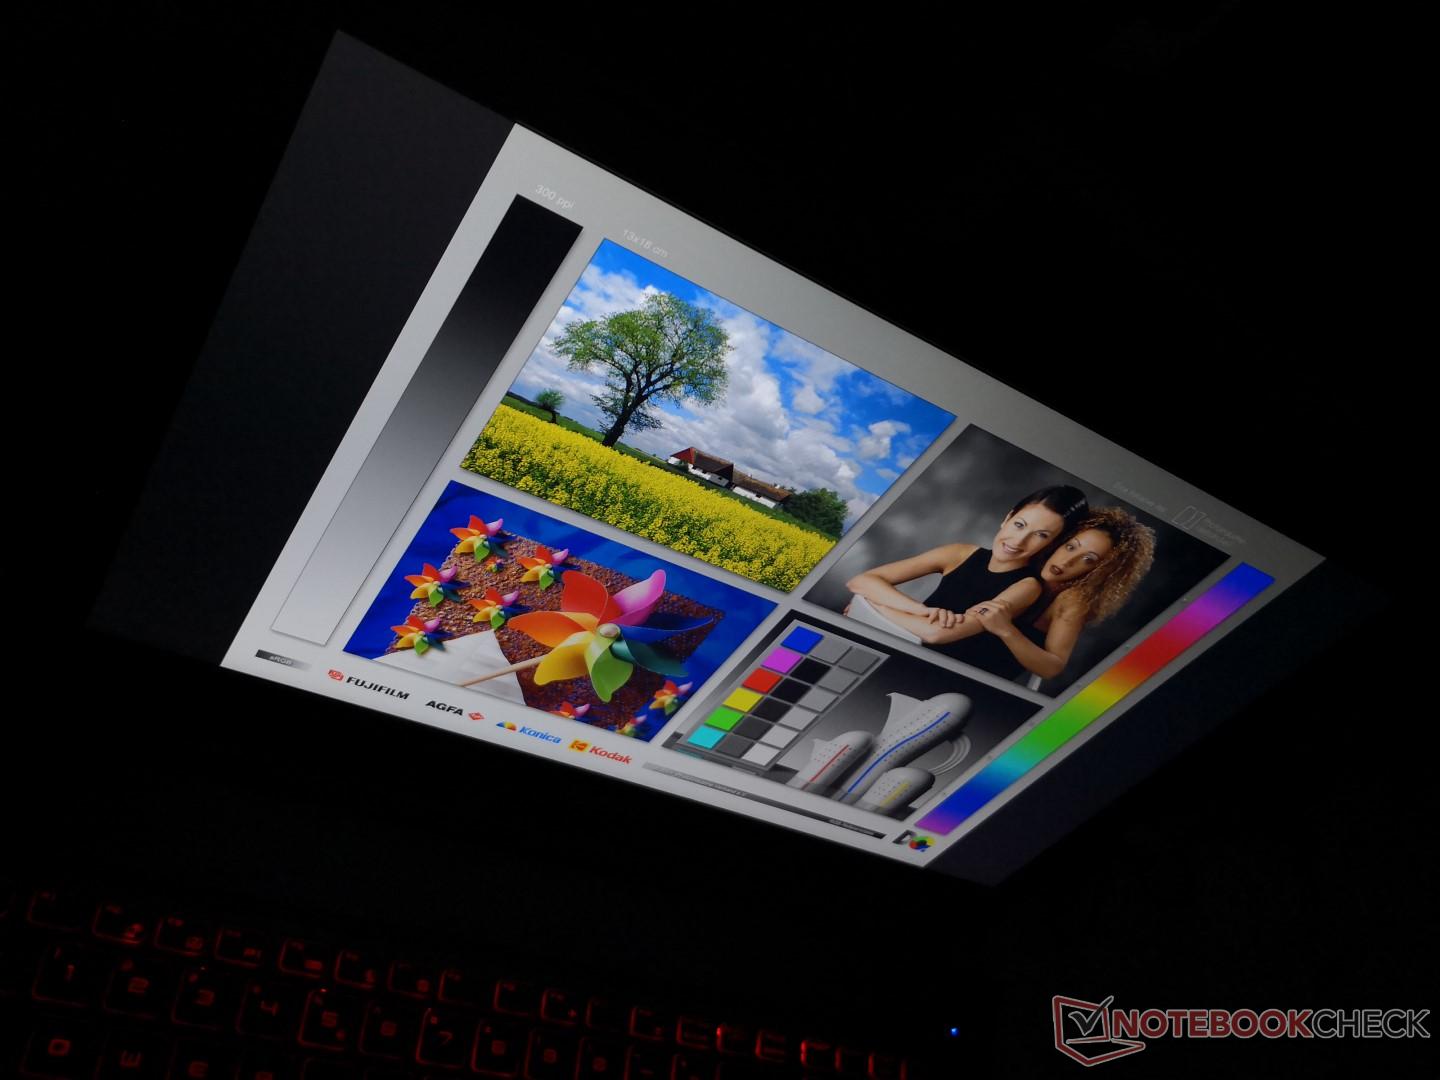
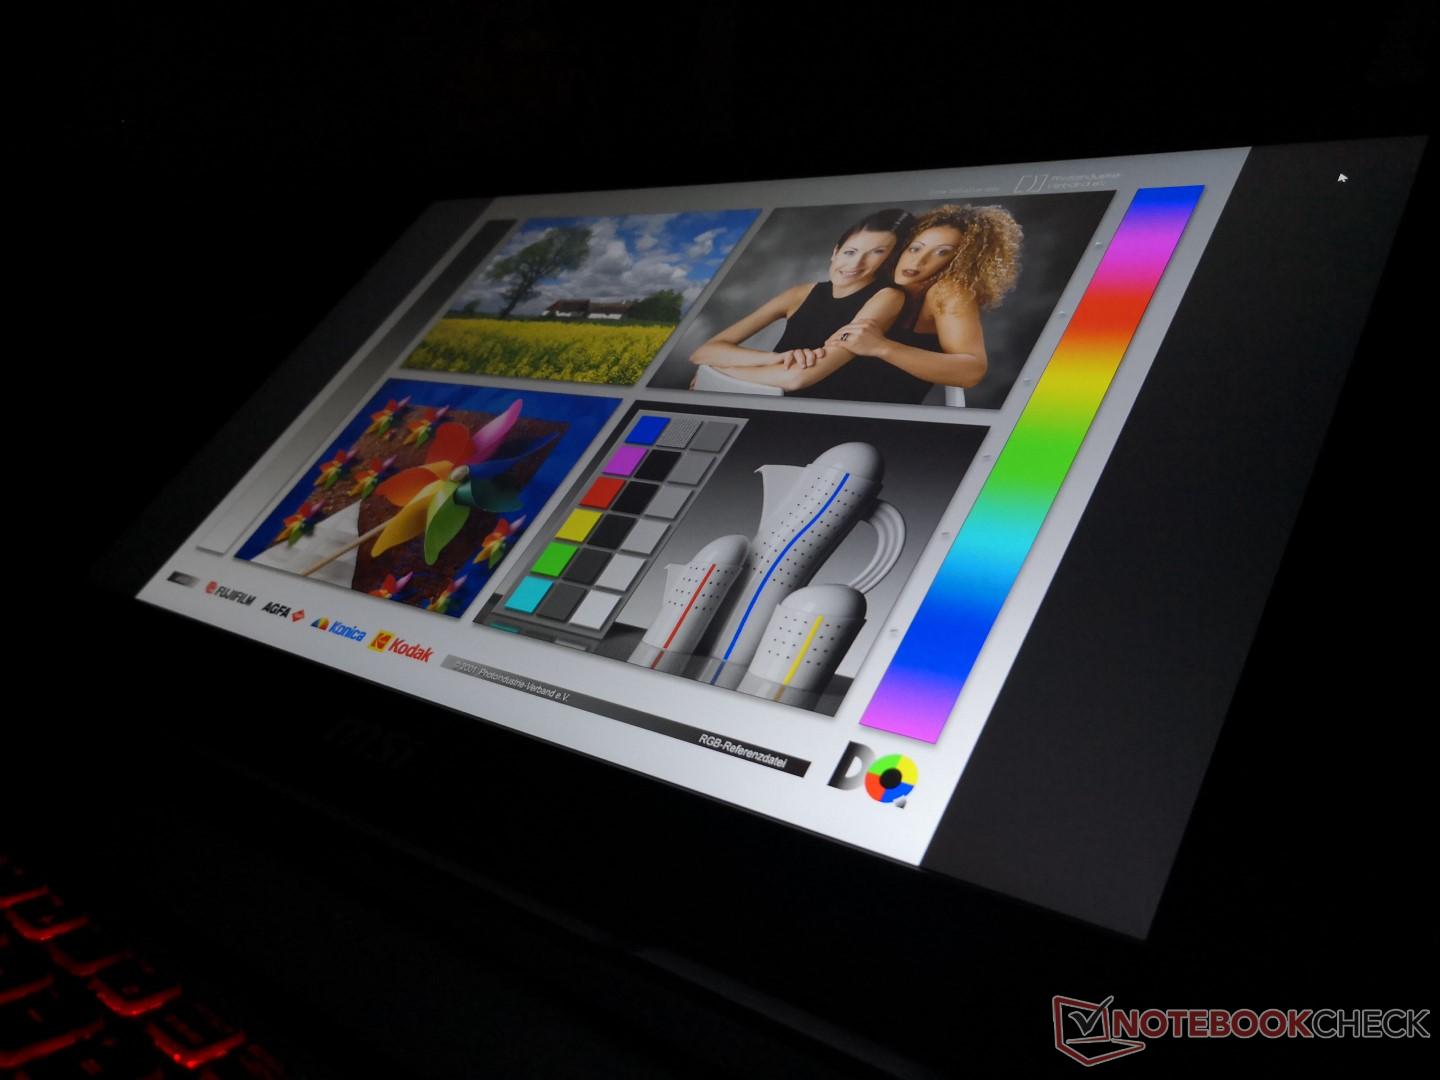
Outdoor visibility is average at best when under shade and poor when under direct sunlight or on an overcast day. The GL63 is not designed to be used outdoors frequently even though the matte panel is good at reducing glare. Viewing angles are excellent as one would expect from an IPS panel with no major color shifting and only slight changes in apparent brightness if viewing from extreme angles.
Performance
Much like how the i5-7300HQ was the CPU of choice for affordable gaming laptops of yesteryear, expect to see the i5-8300H on more entry-level laptops moving forward. The biggest difference between it and its Kaby Lake predecessor is that the CPU now supports Hyper-Threading for 8 simultaneous threads. Performance is very similar to the last generation Core i7-7700HQ as a direct result.
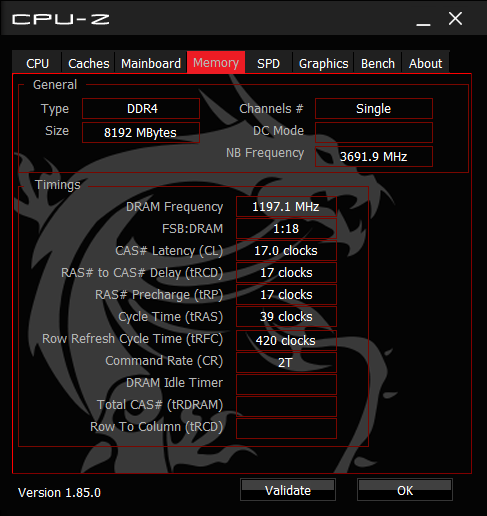
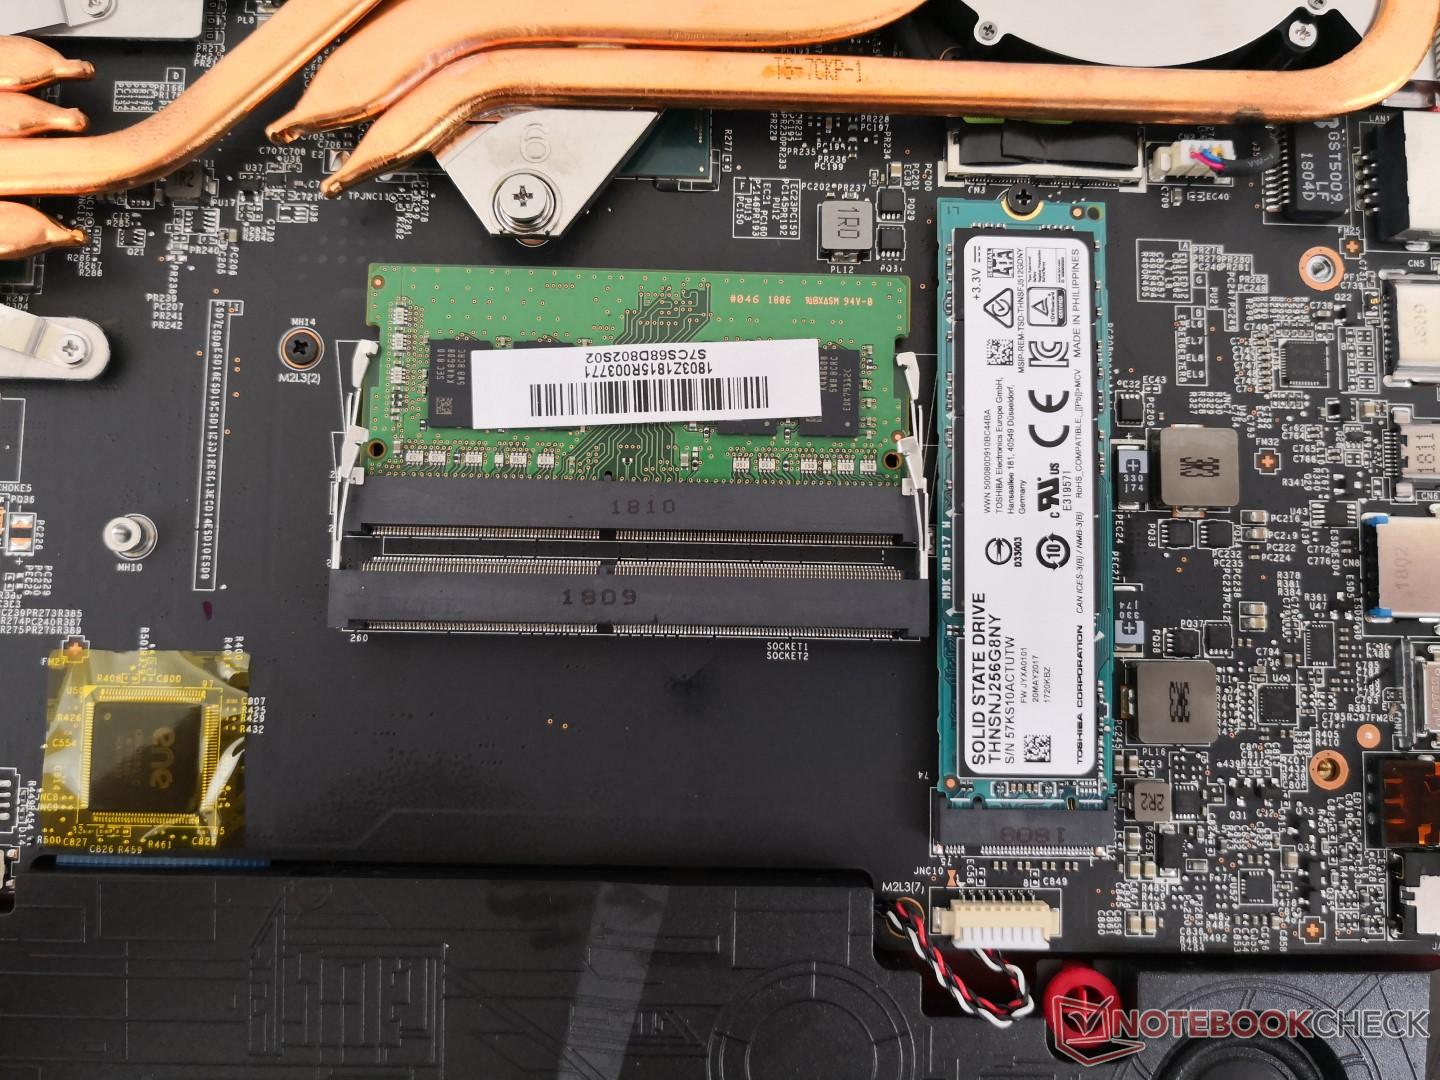
Nvidia Optimus is included by default with no option for G-Sync. RAM is exandable up to 32 GB across two SODIMM slots.
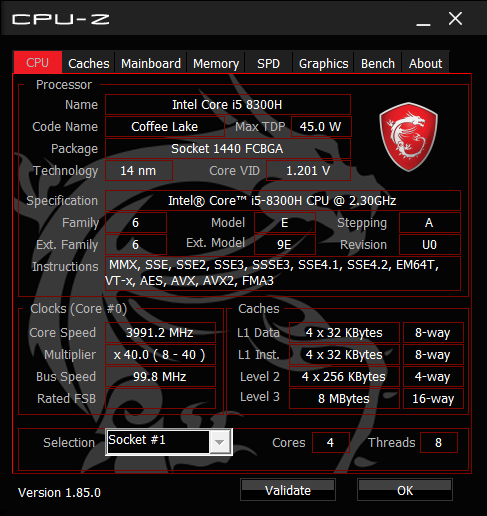

Processor
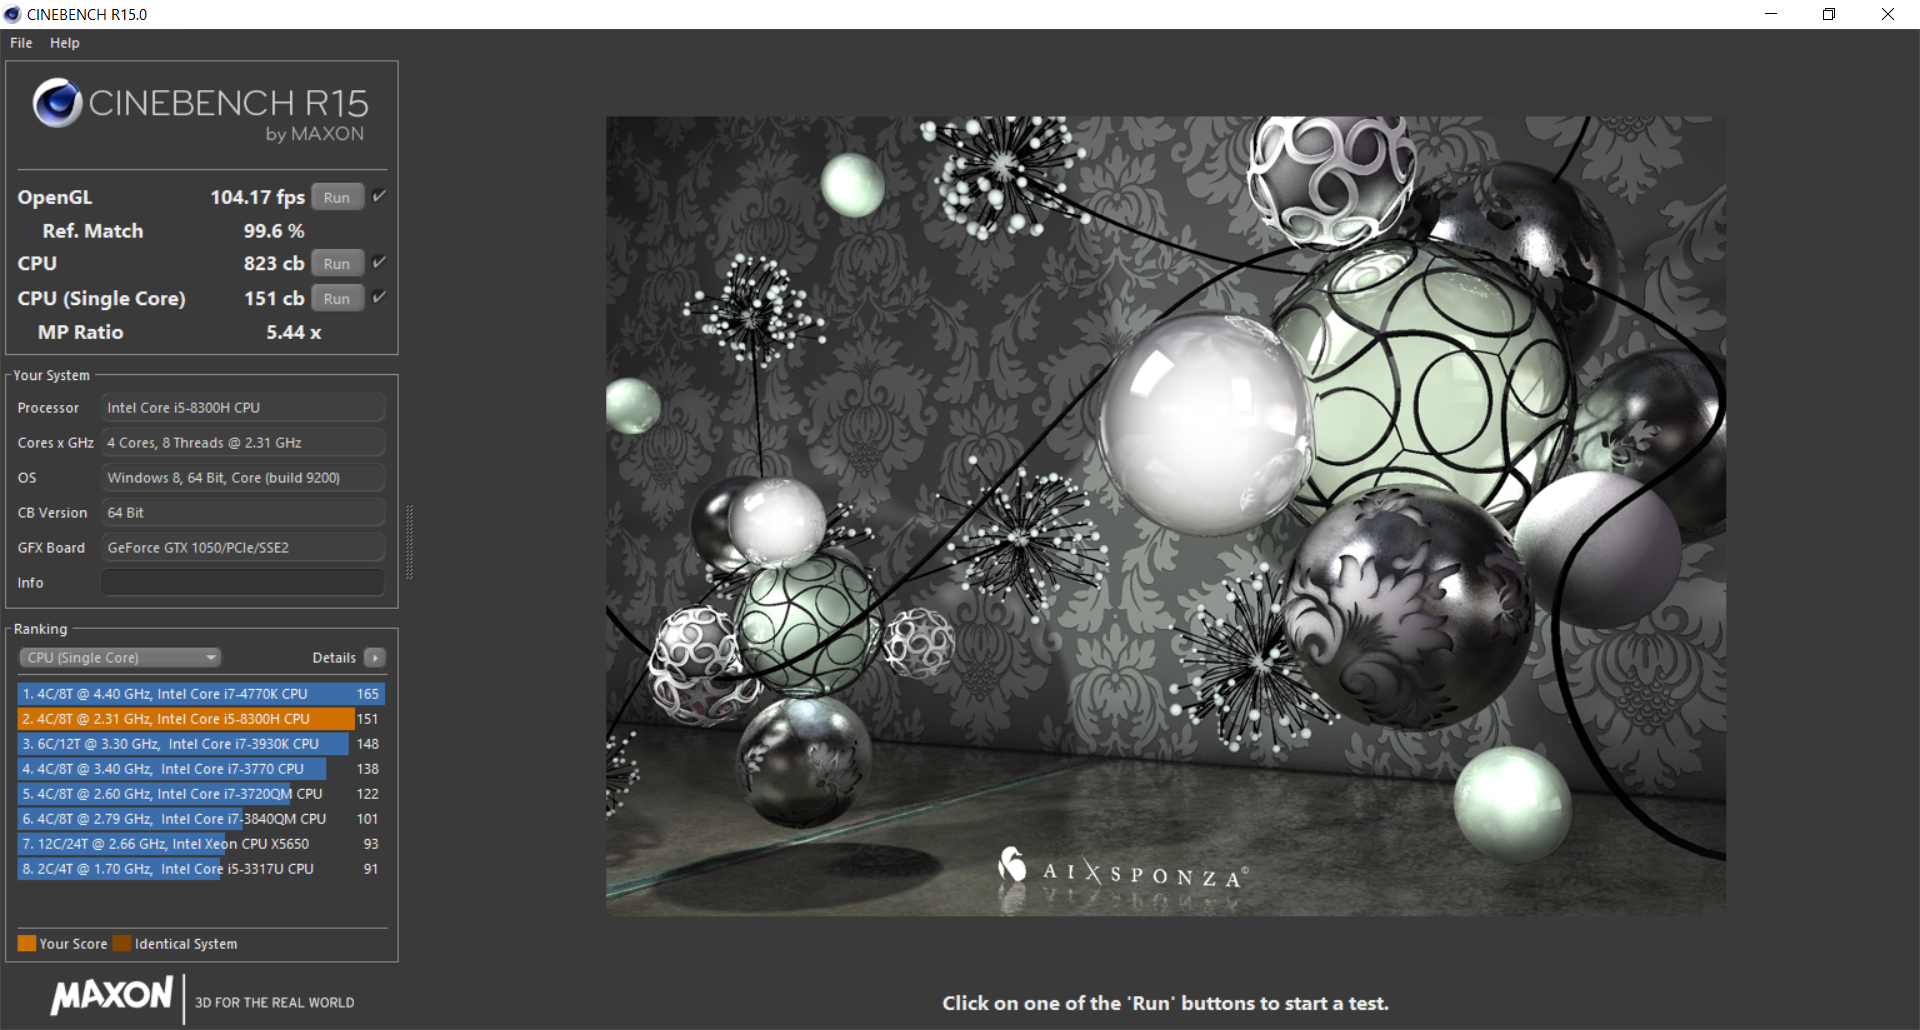
The i5-8300H in the MSI is performing where we expect it to be as its CineBench scores are nearly a match against other notebooks with the same processor. Performance is about 10 percent and 20 faster than the common i7-7700HQ and i7-6700HQ, respectively, found on most last generation gaming laptops. Users who opt in for the GL63 i7-8750H SKU will get a rough 30 percent performance boost in multi-threaded workloads.
Running CineBench R15 Multi-Thread in a loop results in very steady scores from beginning to end to suggest steady Turbo Boost performance. In contrast, super-thin alternatives like the Razer Blade 15 or GS65 commonly throttle their CPUs to keep temperatures in check.
See our dedicated page on the Core i5-8300H for more technical information and benchmark comparisons.
| wPrime 2.10 - 1024m | |
| Asus ROG Strix GL702ZC-GC204T | |
| Acer Swift 3 SF315-41-R6J9 | |
| Average Intel Core i5-8300H (206 - 286, n=4) | |
| MSI GF62VR 7RF-877 | |
| Eurocom Tornado F5 | |
* ... smaller is better
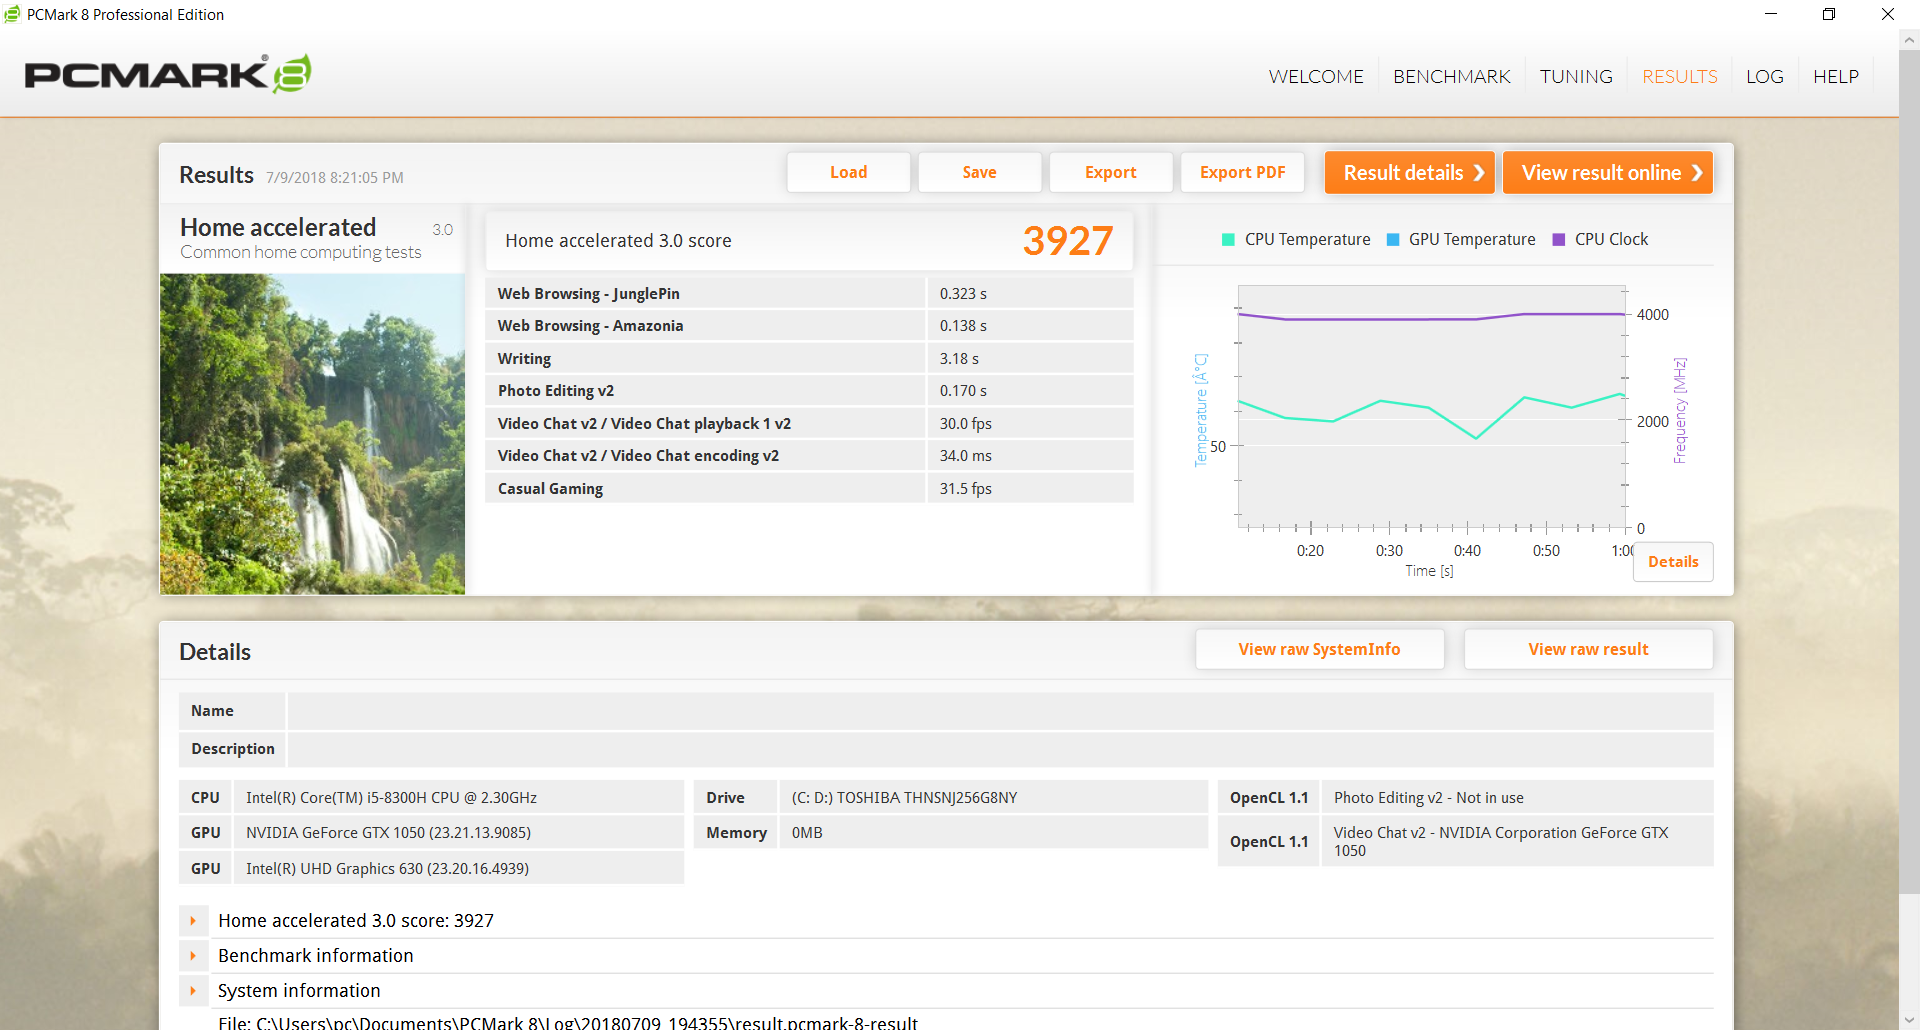
System Performance
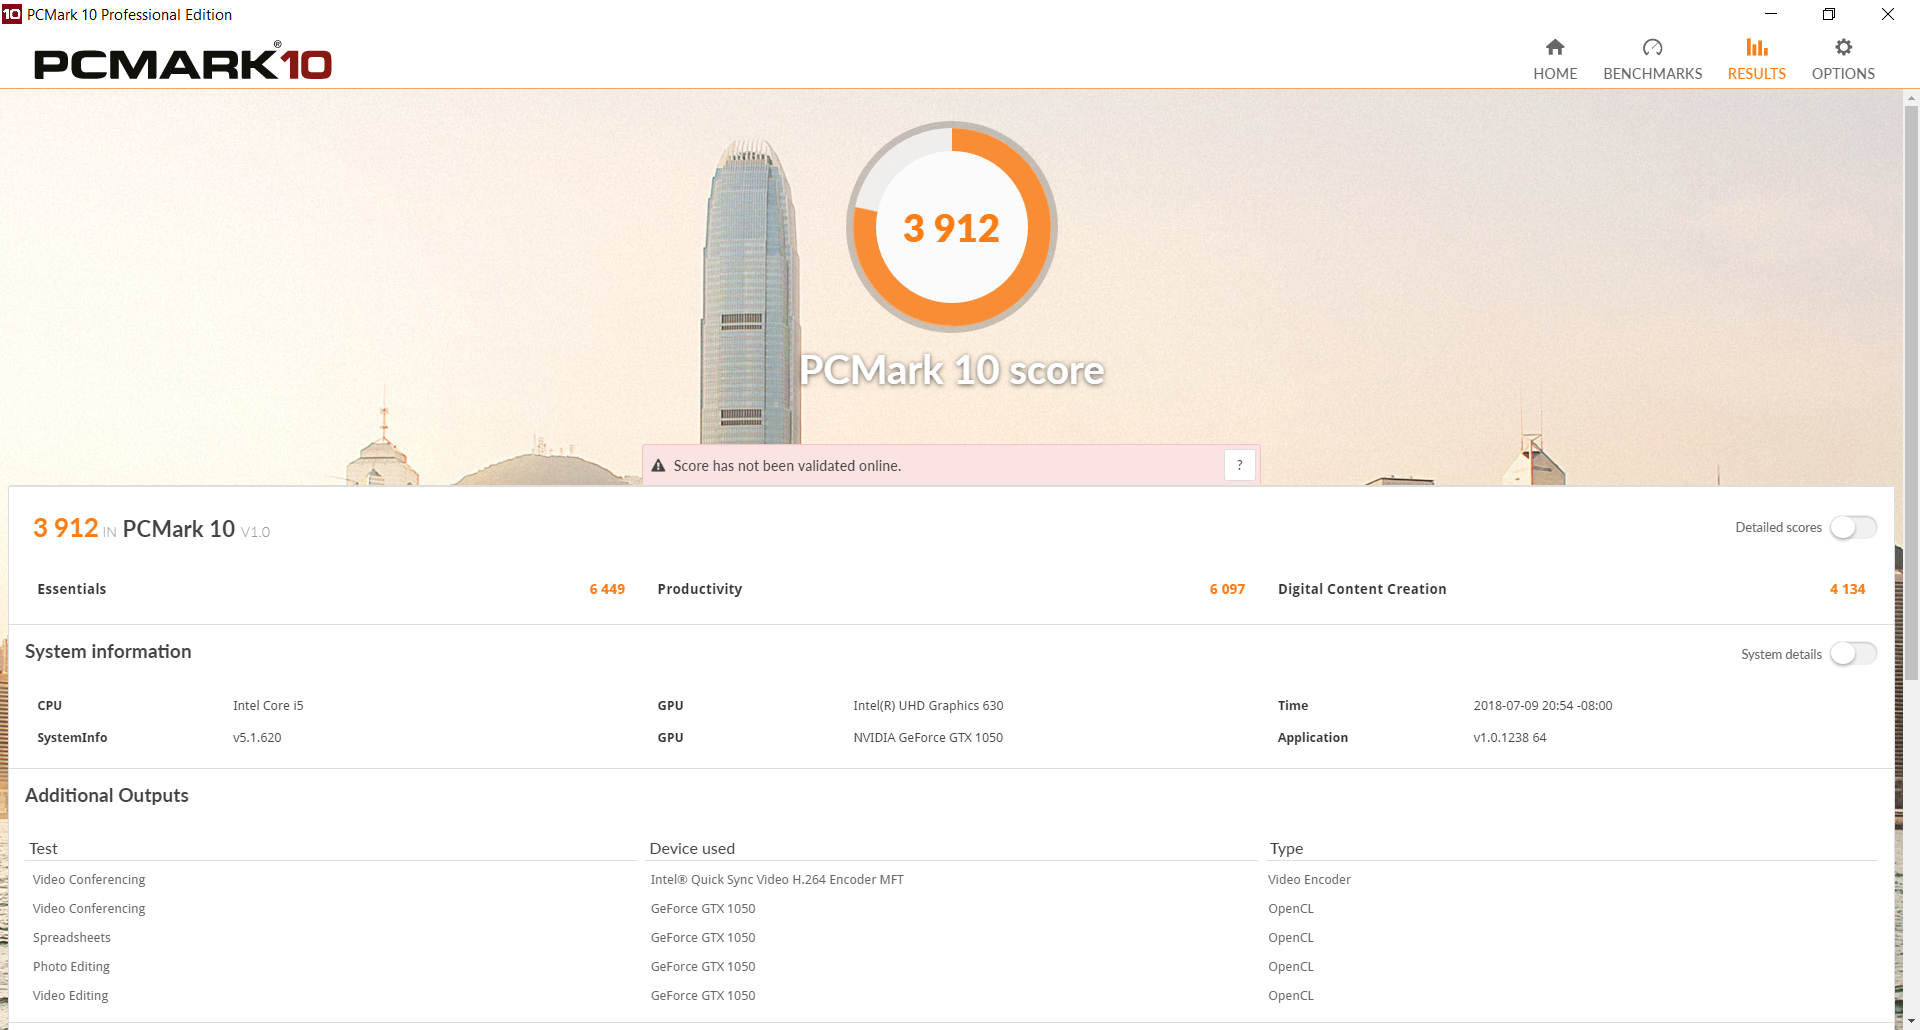
PCMark 10 ranks the GL63 slightly below many of its competitors including the Gigabyte Sabre 15 and Dell G5 15. The benchmark was performed before updating Windows and our attempts to rerun the benchmark after updating would always fail even when using the latest version of the benchmark tool (1.0.1238 64).
| PCMark 10 - Score | |
| MSI GT63 Titan 8RG-046 | |
| Dell G5 15 5587 | |
| MSI GF62VR 7RF-877 | |
| Gigabyte Sabre 15G | |
| MSI GL63 8RC-069US | |
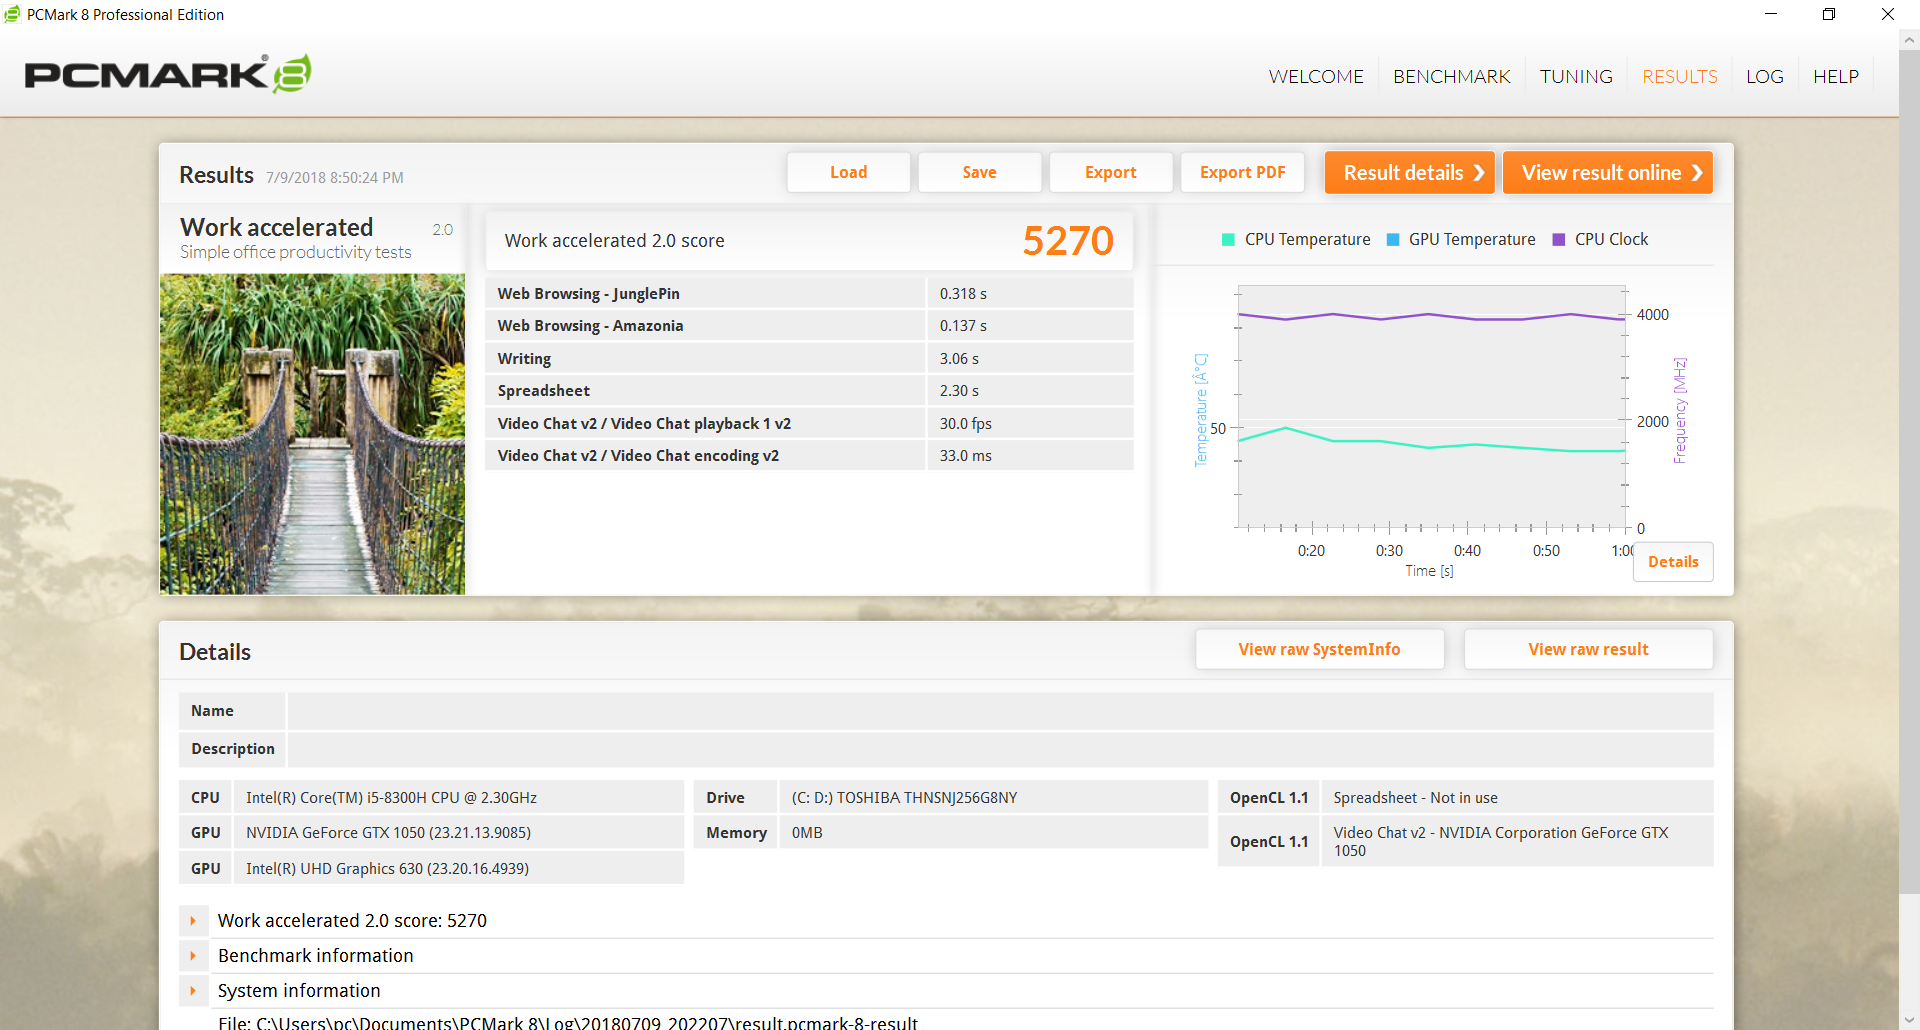
| PCMark 8 | |
| Home Score Accelerated v2 | |
| MSI GT63 Titan 8RG-046 | |
| Dell G5 15 5587 | |
| MSI GF62VR 7RF-877 | |
| MSI GL63 8RC-069US | |
| MSI GL62M 7RD-077 | |
| Gigabyte Sabre 15G | |
| Work Score Accelerated v2 | |
| MSI GT63 Titan 8RG-046 | |
| Dell G5 15 5587 | |
| MSI GL63 8RC-069US | |
| MSI GF62VR 7RF-877 | |
| Gigabyte Sabre 15G | |
| MSI GL62M 7RD-077 | |
| PCMark 8 Home Score Accelerated v2 | 3927 points | |
| PCMark 8 Work Score Accelerated v2 | 5270 points | |
| PCMark 10 Score | 3912 points | |
Help | ||
Storage Devices
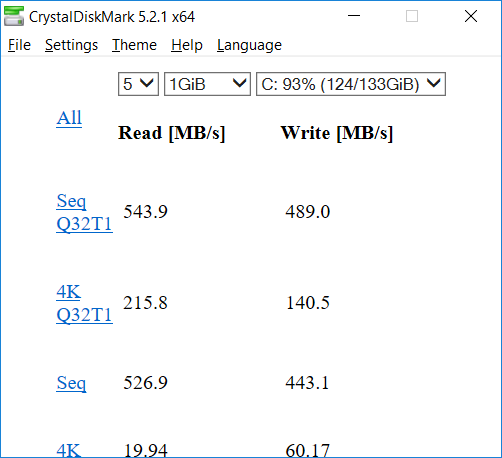
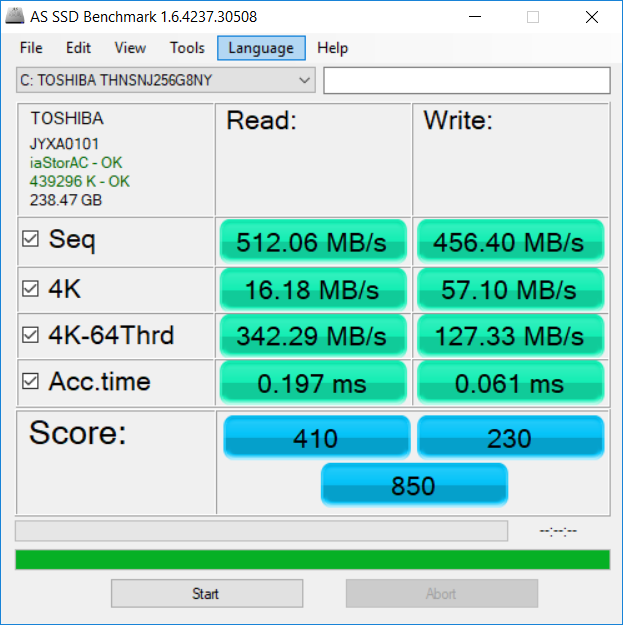
There are two internal storage options (1x M.2 2280 + 1x 2.5-inch SATA III) with no NVMe configurations available. The 256 GB Toshiba HG6 THNSNJ256G8NY SSD initially returned very slow sequential write rates of about 150 MB/s. It wasn't until after we applied Windows updates and stopped background activity from MSI Dragon Center and Norton Anti-Virus that sequential write rates would bounce back up to a more normal 489 MB/s. Most SATA III SSDs have comparable read and write rates in the 500 MB/s range.
See our table of SSDs and HDDs for more benchmark comparisons.
| MSI GL63 8RC-069US Toshiba HG6 THNSNJ256G8NY | Dell G5 15 5587 SK hynix SC311 M.2 | Gigabyte Sabre 15G Liteonit CV3-8D128 | MSI GF62VR 7RF-877 Intel SSD 600p SSDPEKKW256G7 | HP Spectre x360 15-ch011nr SK hynix PC401 NVMe 500 GB | Lenovo Legion Y520-15IKBA-80WY001VGE Seagate Mobile HDD 1TB ST1000LM035 | |
|---|---|---|---|---|---|---|
| CrystalDiskMark 5.2 / 6 | -8% | 26% | 82% | 145% | -91% | |
| Write 4K (MB/s) | 60.2 | 67 11% | 66.3 10% | 132.7 120% | 108.5 80% | 0.296 -100% |
| Read 4K (MB/s) | 19.94 | 25.8 29% | 36.68 84% | 32.25 62% | 37.67 89% | 0.363 -98% |
| Write Seq (MB/s) | 443.1 | 238 -46% | 469.2 6% | 476.5 8% | 1120 153% | 102.3 -77% |
| Read Seq (MB/s) | 527 | 506 -4% | 536 2% | 867 65% | 1300 147% | 85.3 -84% |
| Write 4K Q32T1 (MB/s) | 140.5 | 155.2 10% | 182 30% | 400.9 185% | 243.9 74% | 0.403 -100% |
| Read 4K Q32T1 (MB/s) | 215.8 | 195.8 -9% | 357.9 66% | 281.5 30% | 311.6 44% | 0.822 -100% |
| Write Seq Q32T1 (MB/s) | 489 | 232.7 -52% | 507 4% | 474.9 -3% | 1395 185% | 79.8 -84% |
| Read Seq Q32T1 (MB/s) | 544 | 549 1% | 562 3% | 1558 186% | 2667 390% | 97 -82% |
| Write 4K Q8T8 (MB/s) | 214 | |||||
| Read 4K Q8T8 (MB/s) | 205 |

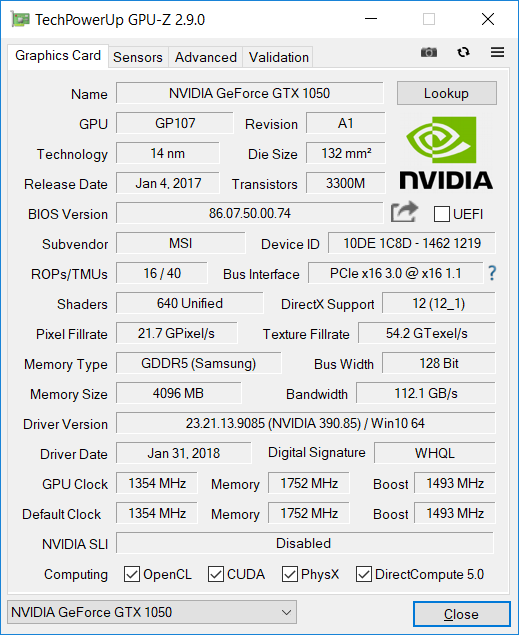
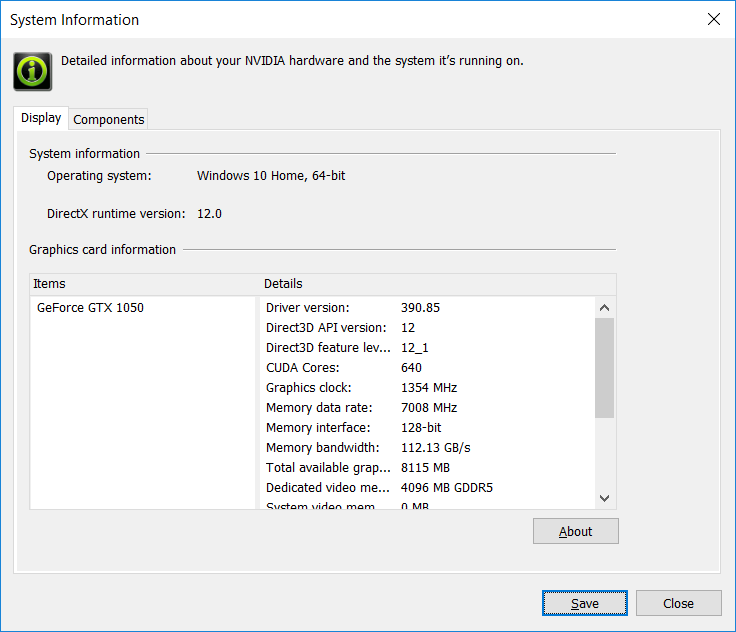
GPU Performance
The GeForce GTX 1050 is the go-to GPU for entry-level gaming laptops. Raw performance is about 15 to 20 percent slower than the last generation GTX 970M while being 20 to 30 percent faster than the GTX 960M. Users who want to upgrade to the GL63 GTX 1050 Ti SKU will see a 20 to 25 percent boost over the GTX 1050.
All modern titles are playable at the native 1080p resolution. To hit 60 FPS, however, most graphical settings will have to be turned down to Low or Medium especially on more demanding titles.
See our dedicated page on the GTX 1050 for more technical information and benchmark comparisons.
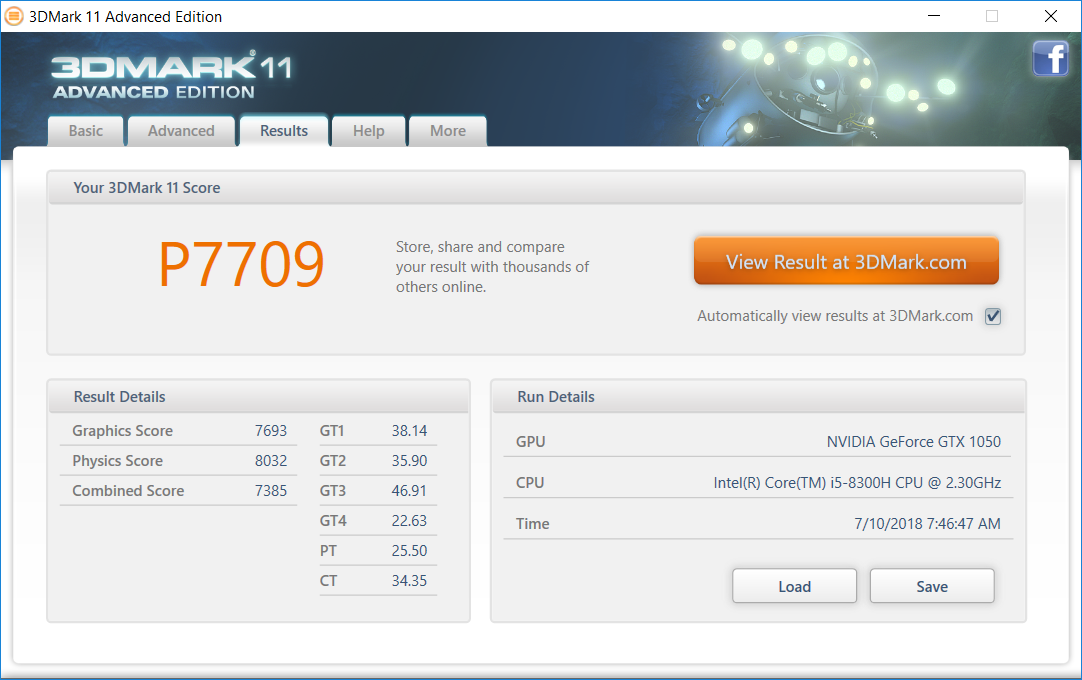
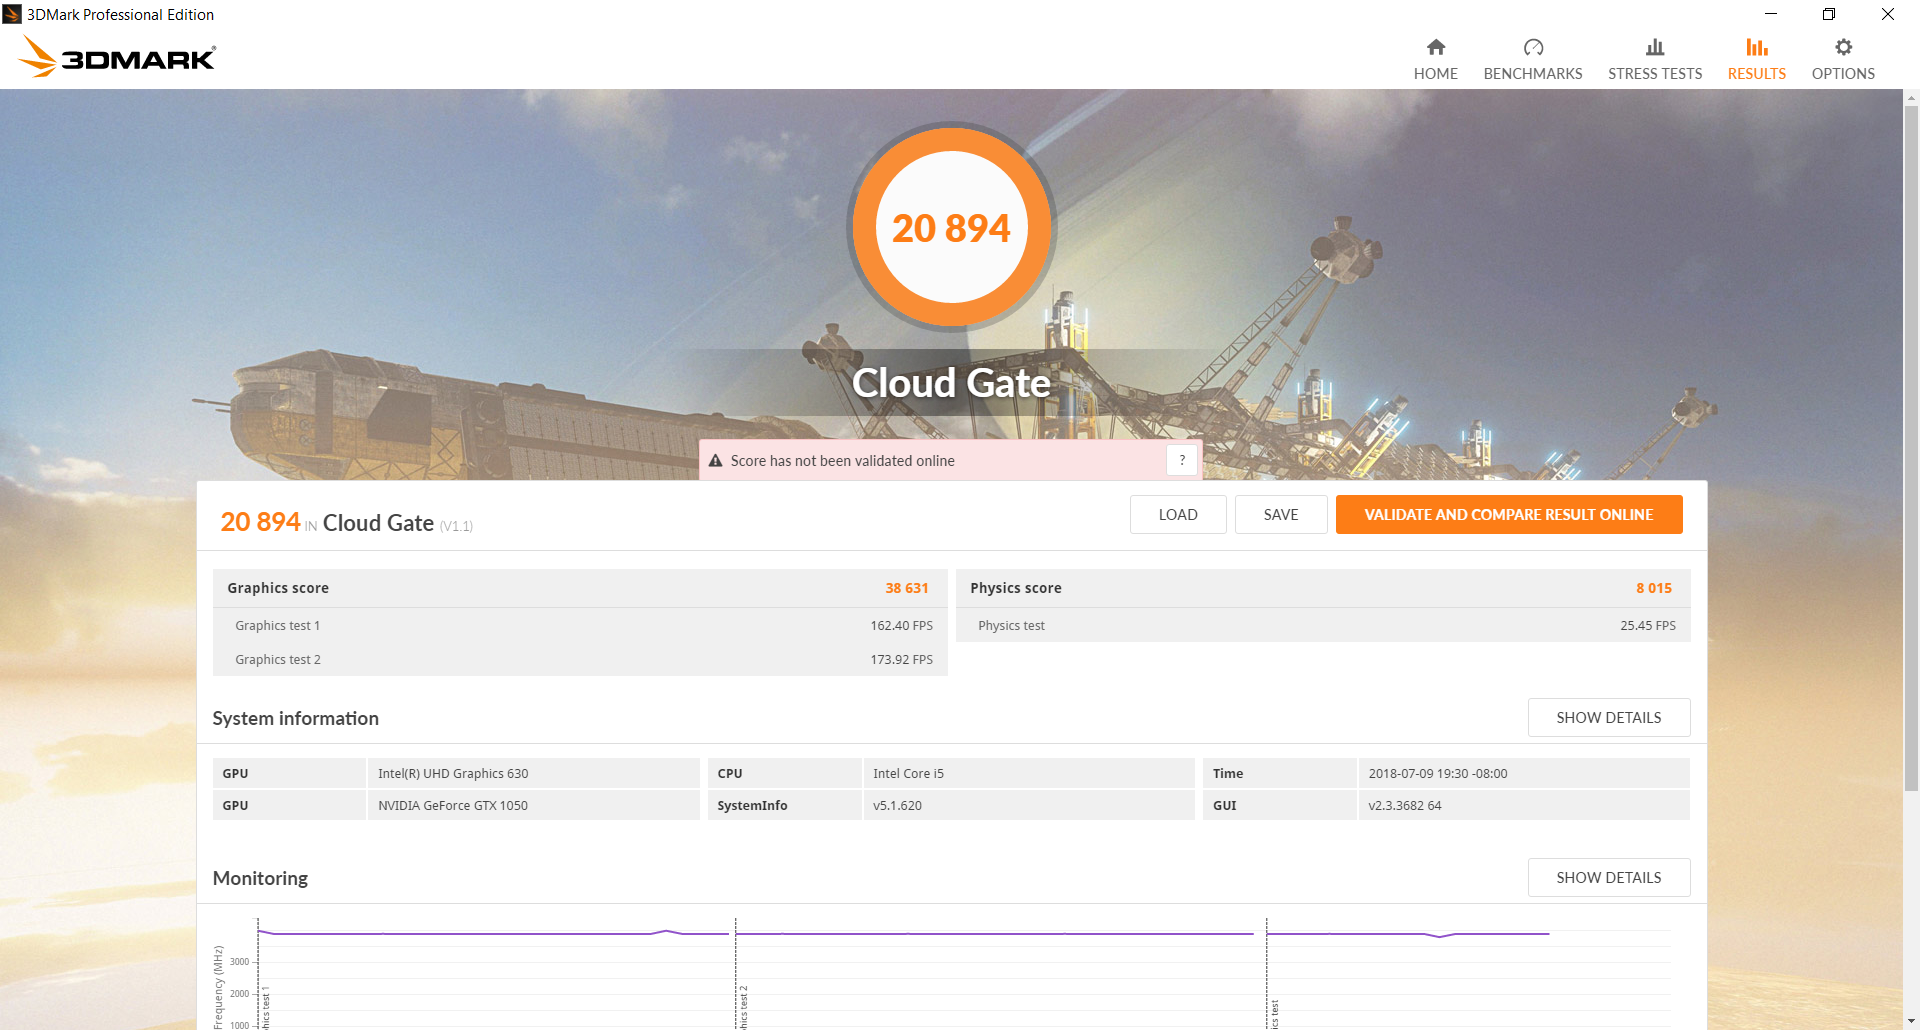
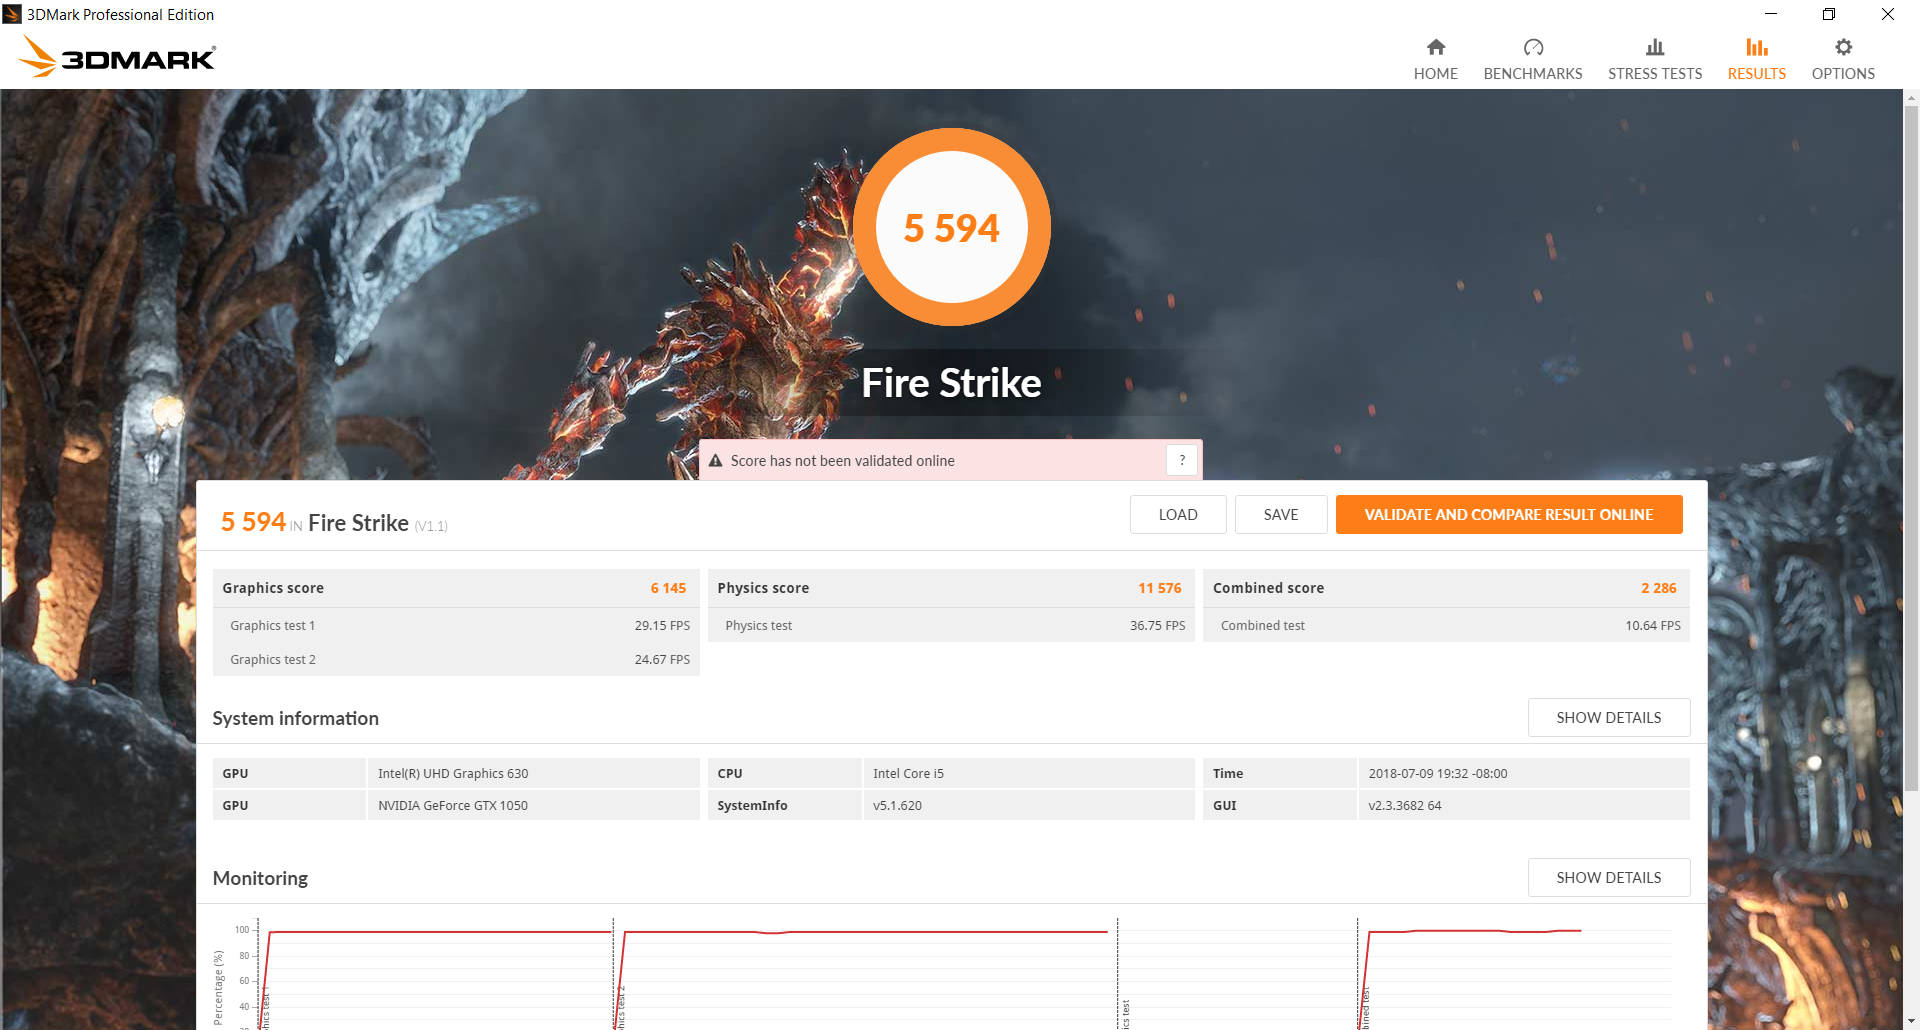
| 3DMark 11 Performance | 7709 points | |
| 3DMark Cloud Gate Standard Score | 20894 points | |
| 3DMark Fire Strike Score | 5594 points | |
Help | ||
| low | med. | high | ultra | |
|---|---|---|---|---|
| BioShock Infinite (2013) | 192.7 | 160.8 | 155.5 | 64 |
| The Witcher 3 (2015) | 125.1 | 74.9 | 42.4 | 21.9 |
| Rise of the Tomb Raider (2016) | 121.9 | 74.9 | 40.1 | 33.2 |
Stress Test
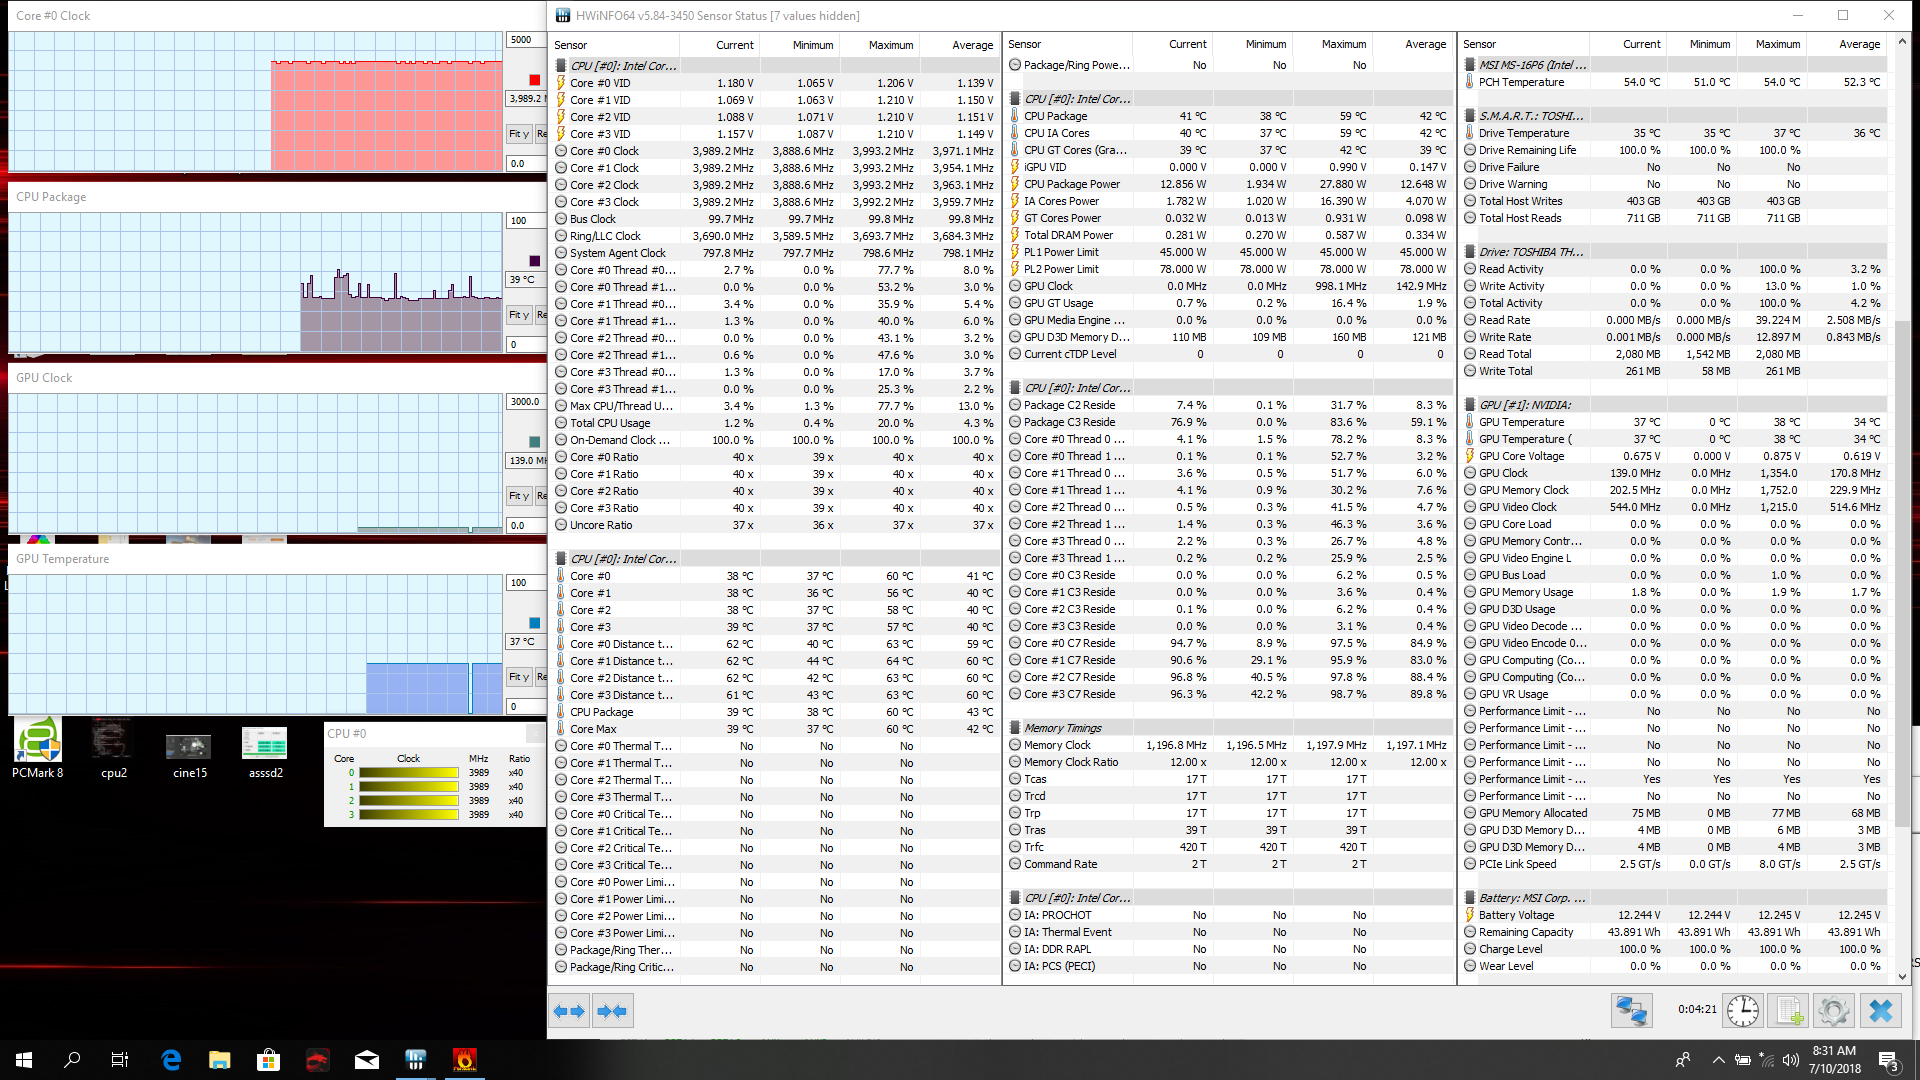
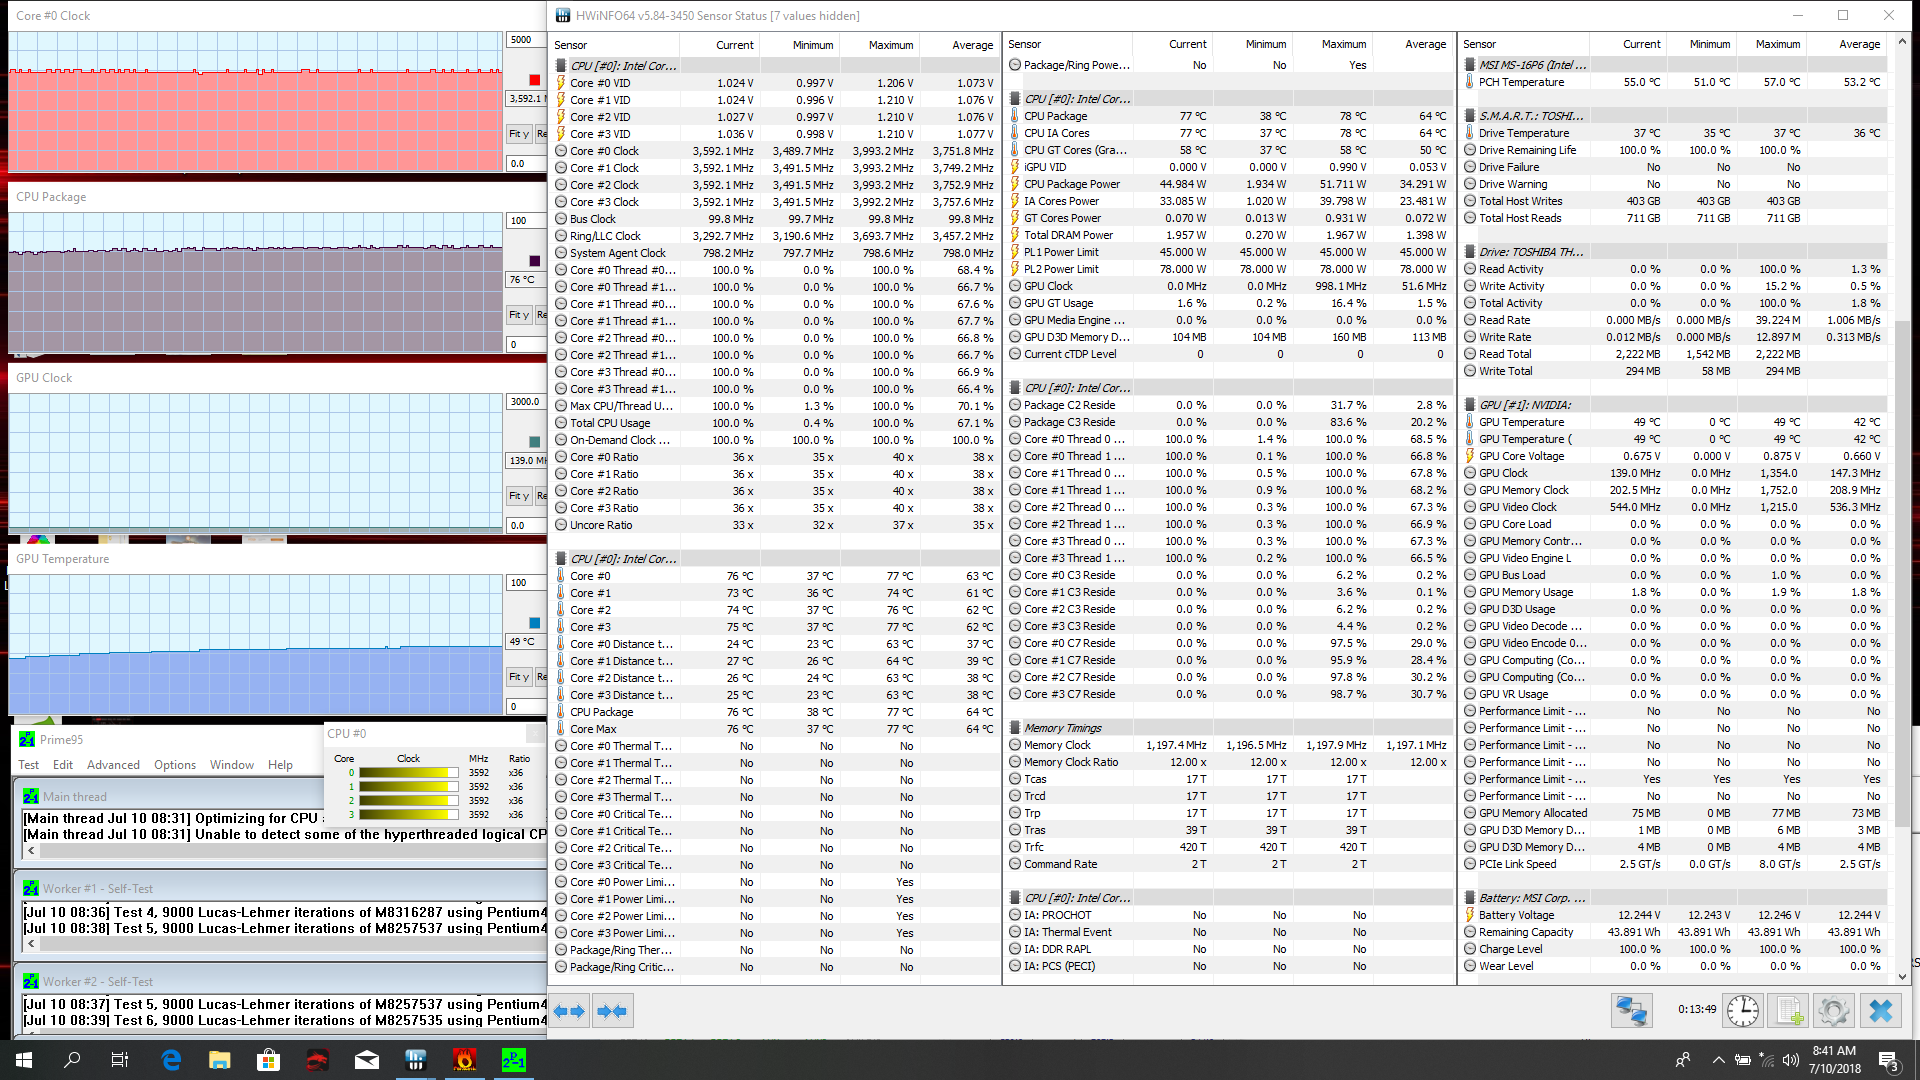
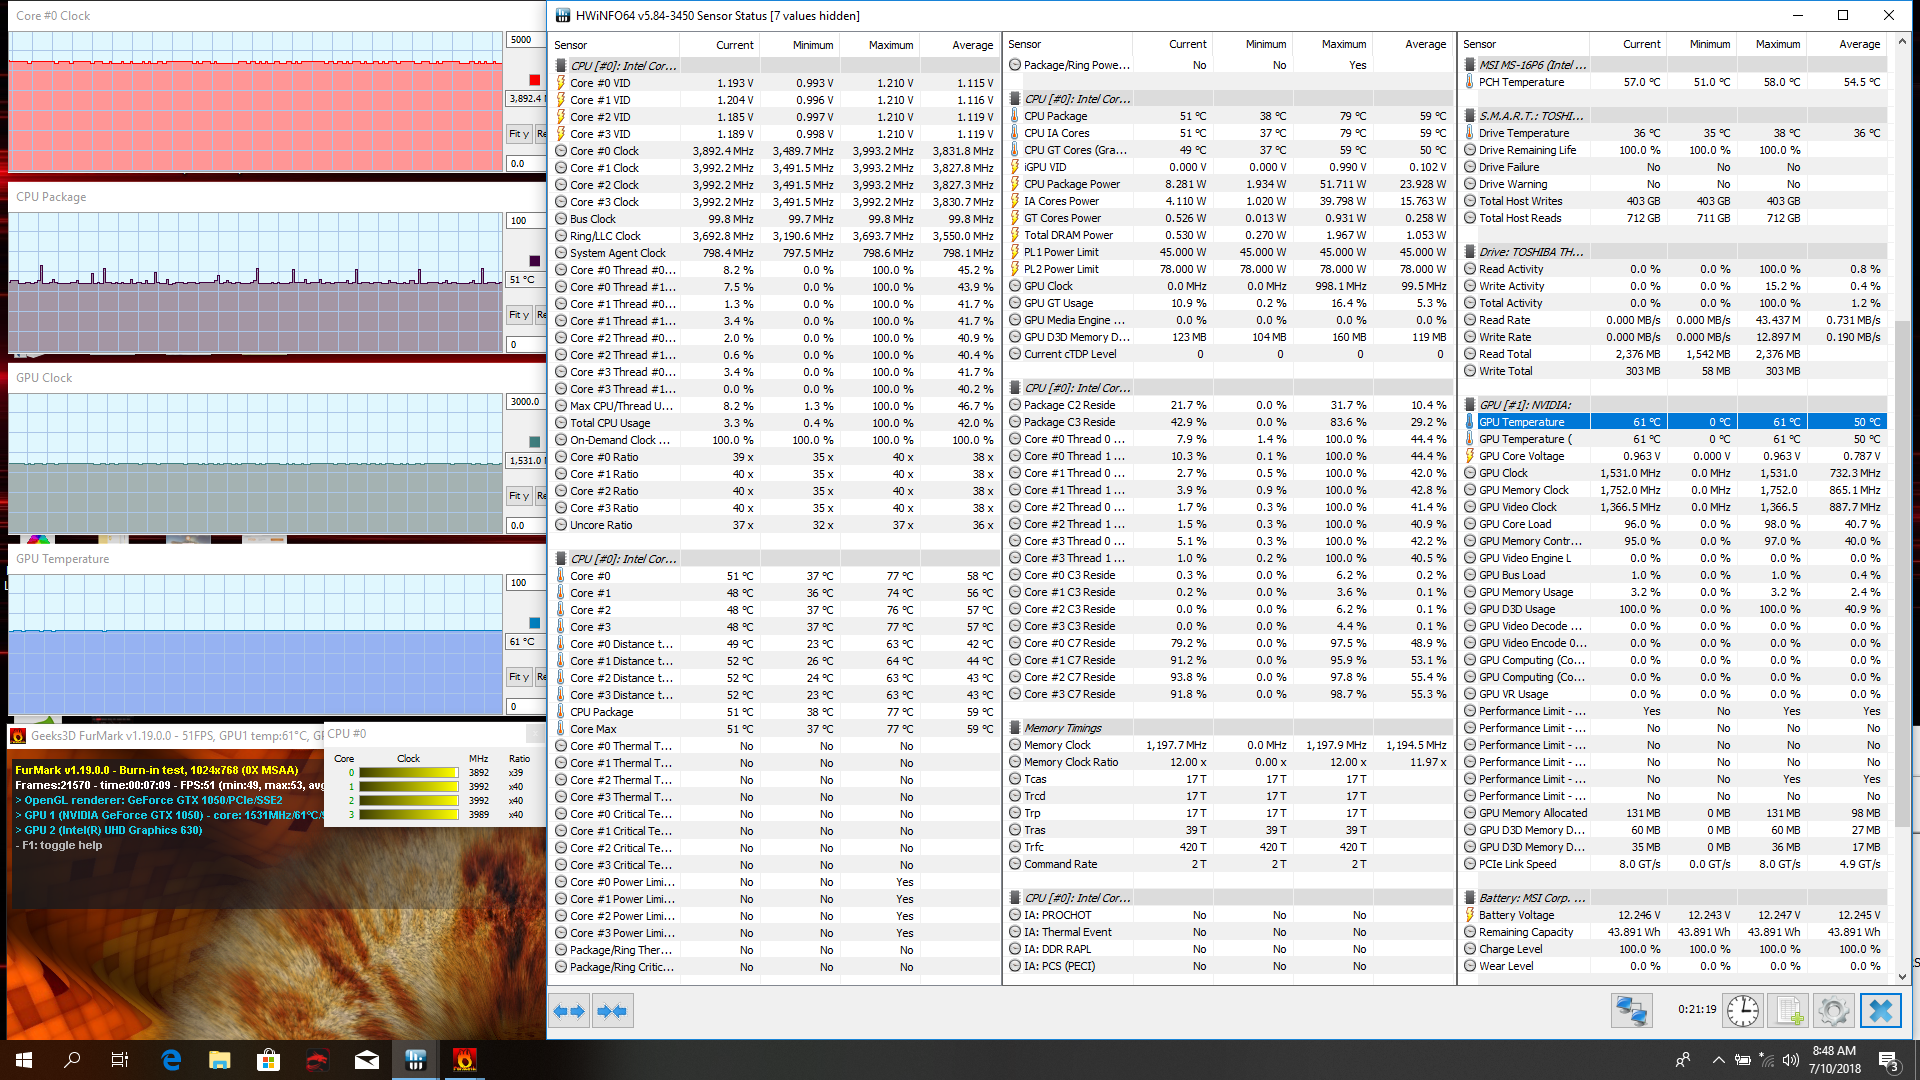
We stress the notebook to identify for any potential throttling or stability issues. When running Prime95, the CPU can be observed operating stably at 3.6 GHz with no dips and at a sustainable core temperature of 76 C. Running both Prime95 and FurMark simultaneously will cause CPU and GPU temperatures to rise up to 79 C and 67 C, respectively, which is relatively cool for a gaming laptop. Strangely, the CPU can be observed periodically dropping to 800 MHz for very short periods, but this thankfully does not occur when gaming. Performance is consistent when running Witcher 3 with a steady GPU clock rate of 1683 MHz and a core temperature of 62 C.
If Turbo Fan is toggled on, CPU and GPU temperatures will drop even further when gaming to 44 C and 50 C, respectively. It's important to note that Turbo Fan will not magically boost system performance and it's arguably unnecessary for day-to-day or gaming loads. Overclockers and enthusiasts, however, may appreciate the option nonetheless.
Running on battery power will severely limit CPU and GPU performance. A 3DMark Fire Strike test on batteries returns Physics and Graphics scores of 9457 and 1436 points, respectively, compared to 11576 and 6145 points when on mains. We double-checked to make sure that all system profiles on the Nvidia settings, Windows Power settings, and Dragon Center settings were set to Performance, but the disappointing results remain the same.
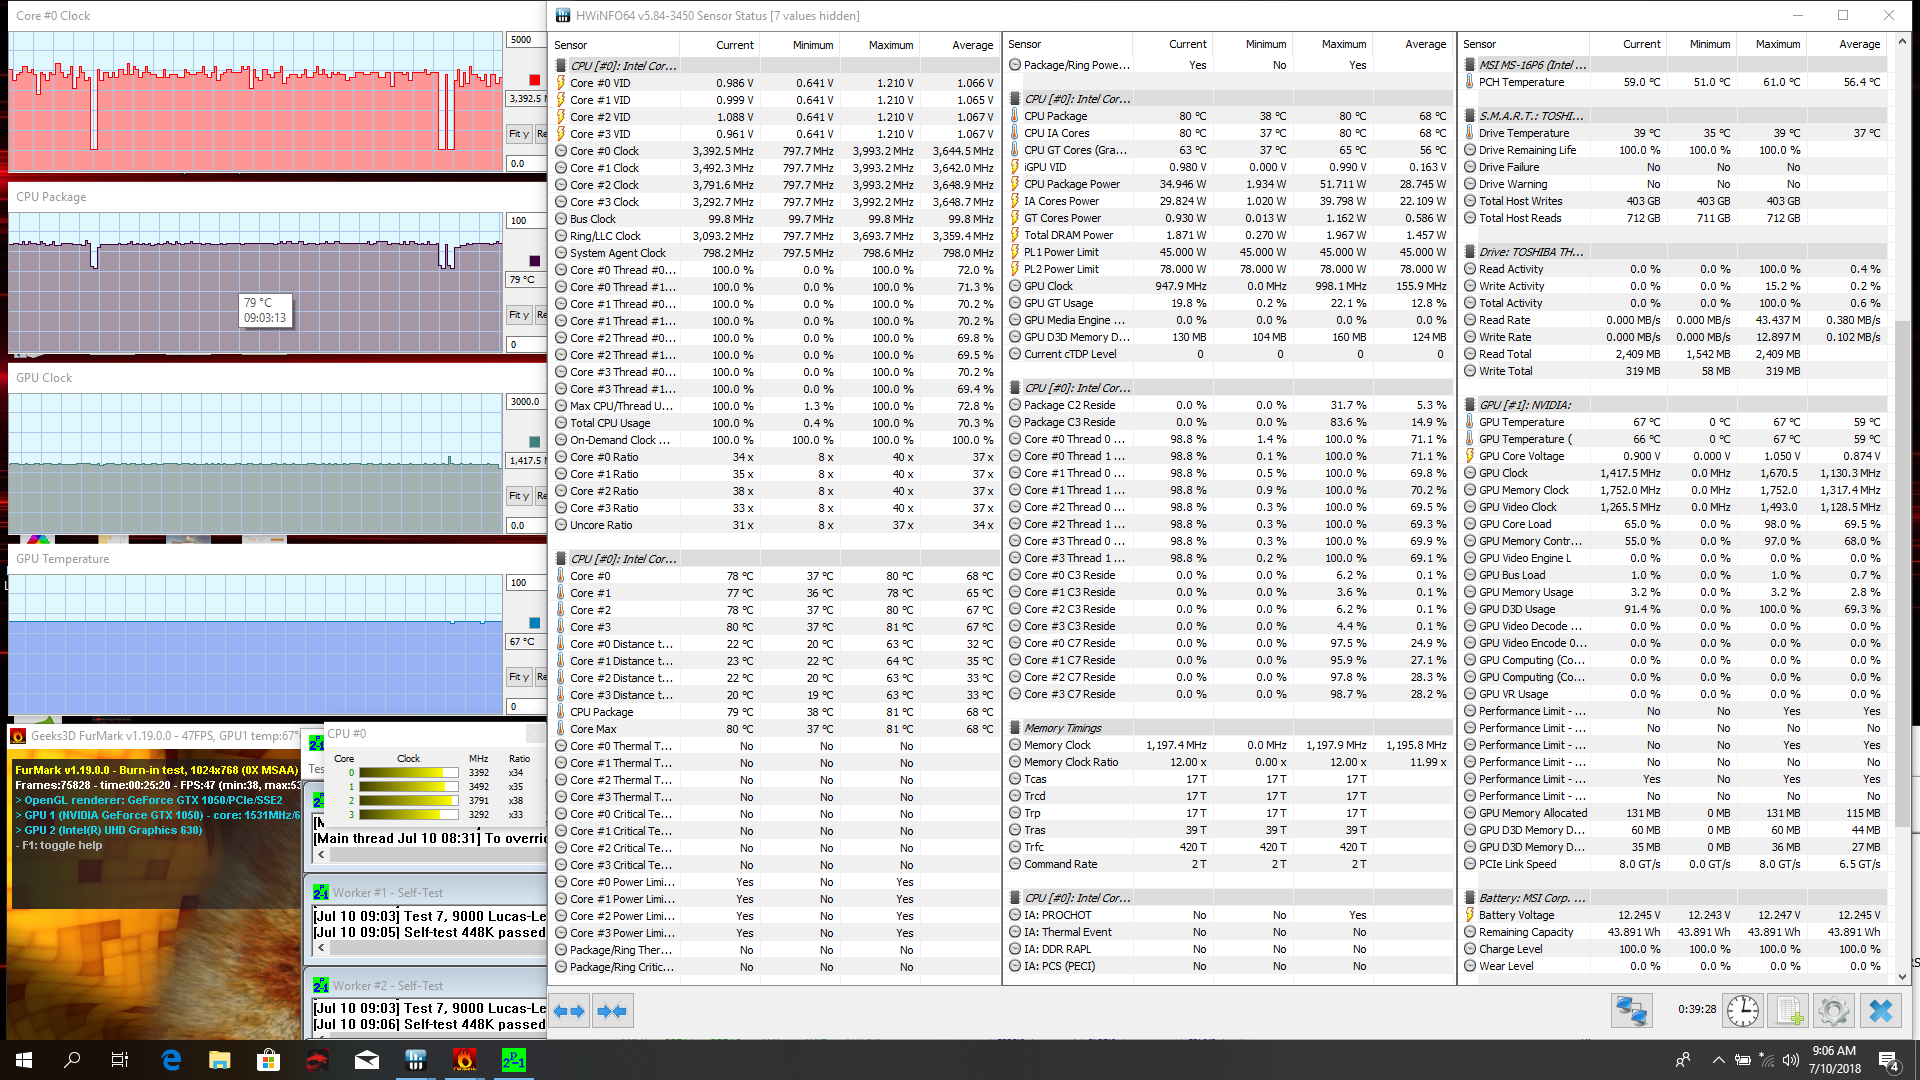
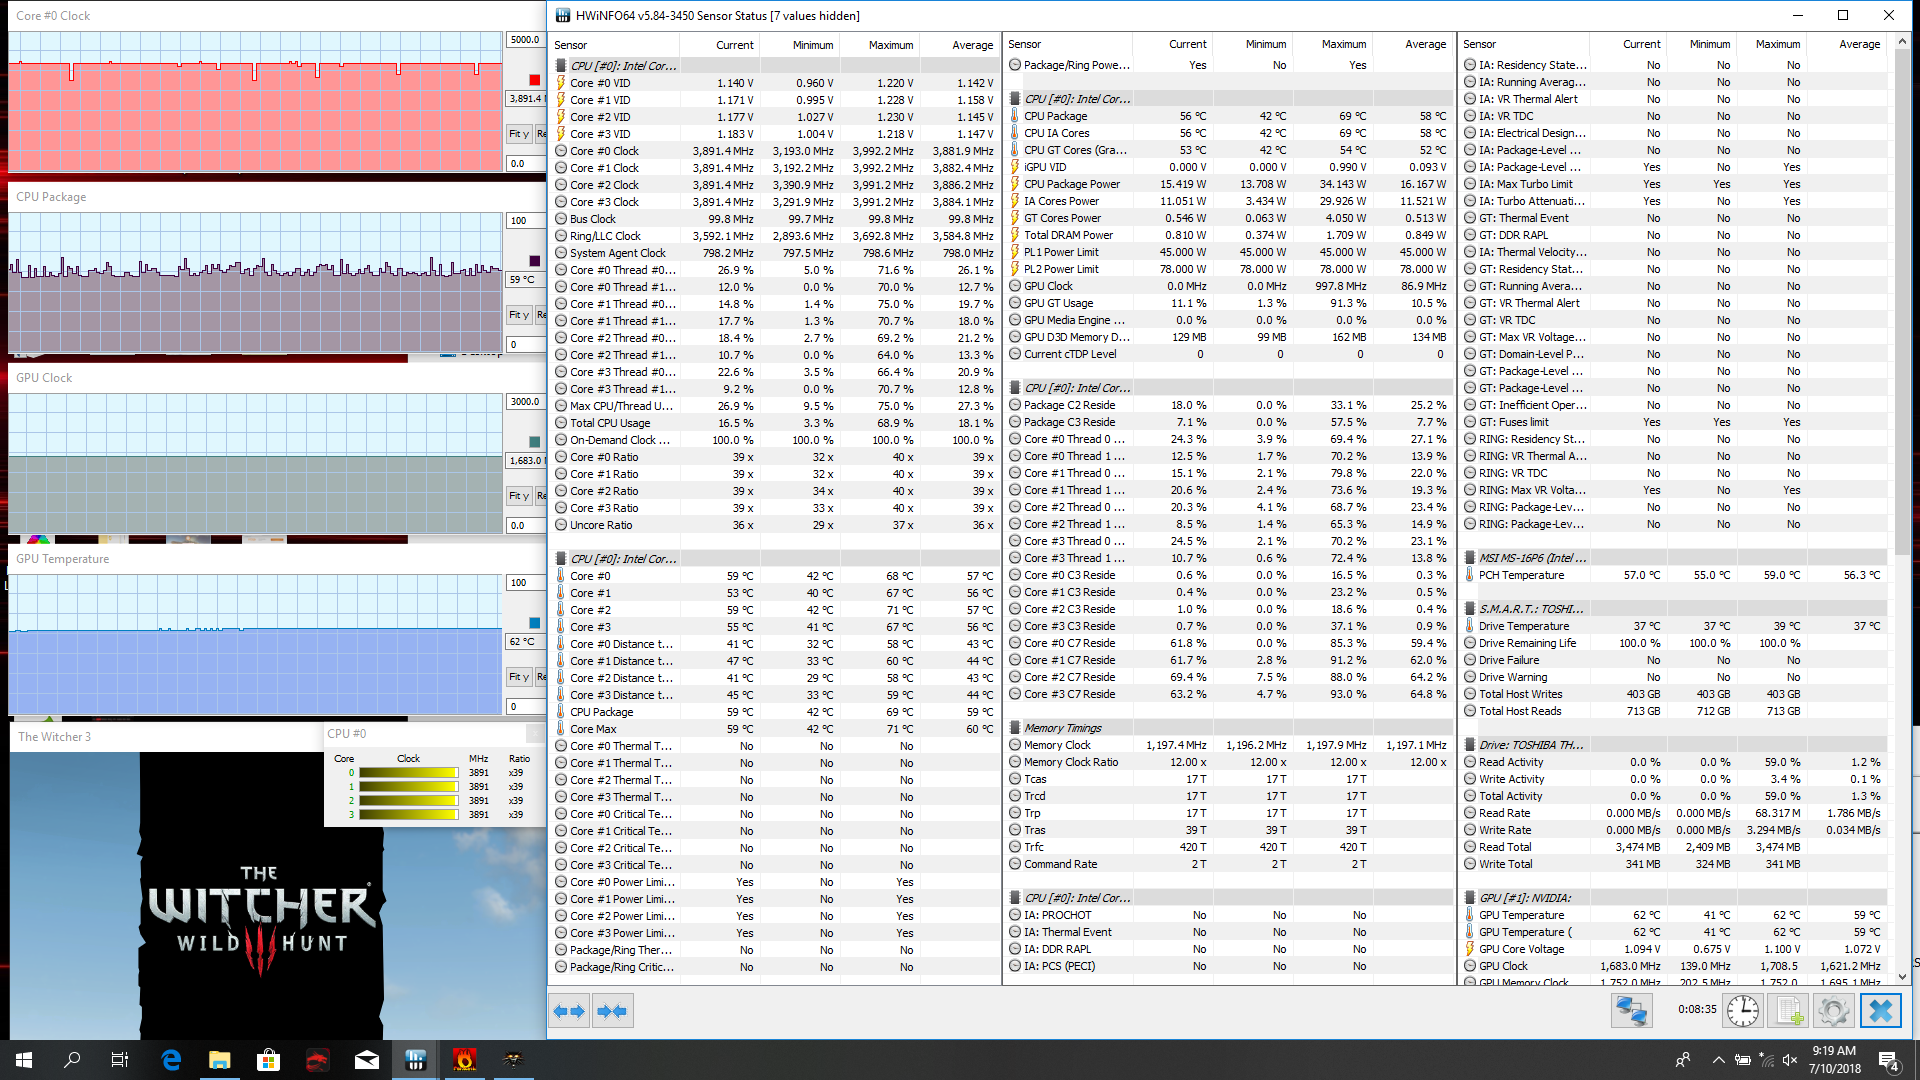
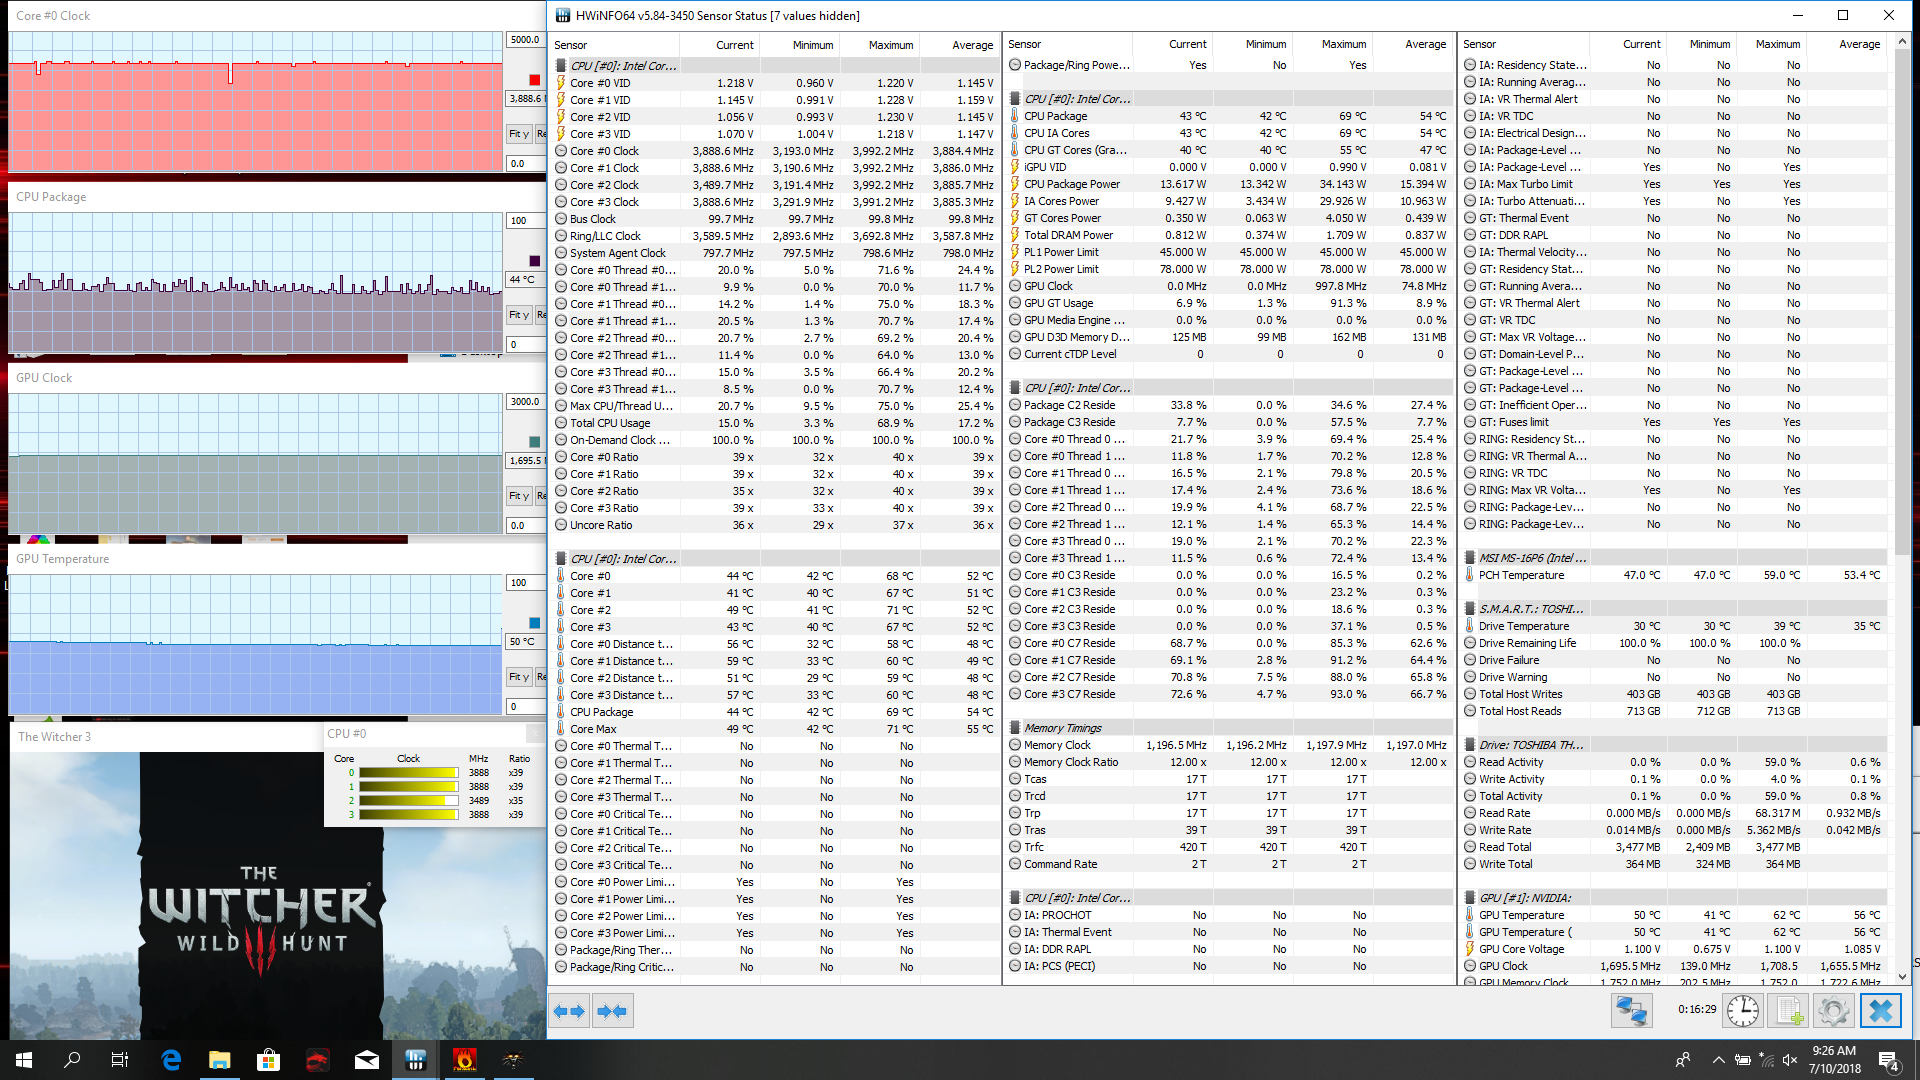
| CPU Clock (GHz) | GPU Clock (MHz) | Average CPU Temperature (°C) | Average GPU Temperature (°C) | |
| Prime95 Stress | 3.6 | -- | 76 | -- |
| FurMark Stress | -- | 1531 | -- | 61 |
| Prime95 + FurMark Stress | ~3.4 | 1418 | 79 | 67 |
| Witcher 3 Stress | 3.9 | 1683 | 59 | 62 |
| Witcher 3 Stress w/ Turbo Fan | 3.9 | 1695 | 44 | 50 |
Emissions
System Noise
The cooling solution is larger than on many other gaming notebooks and it consists of twin fans and seven copper heat pipes. The fans will idle when sitting on desktop and will eventually pulse to a low and unobtrusive 31.6 dB(A) after a few minutes of use.
When gaming, fan noise remains steady at 40.6 dB(A) to be significantly quieter than the Sabre 15 and Asus GL503VD each with the same GTX 1050 GPU. This makes the GL63 one of the least noisiest 15.6-inch gaming laptops available with Nvidia GTX graphics. Enabling Turbo Fan mode will swiftly boost fan noise up to a blistering 56.8 dB(A) regardless of onscreen activity.
Our test unit exhibits no noticeable electronic noise or coil whine.
Noise level
| Idle |
| 28.6 / 31.6 / 31.6 dB(A) |
| Load |
| 38.6 / 56.8 dB(A) |
 | ||
30 dB silent 40 dB(A) audible 50 dB(A) loud |
||
min: | ||
| MSI GL63 8RC-069US GeForce GTX 1050 Mobile, i5-8300H, Toshiba HG6 THNSNJ256G8NY | Dell G5 15 5587 GeForce GTX 1060 Max-Q, i5-8300H, SK hynix SC311 M.2 | Gigabyte Sabre 15G GeForce GTX 1050 Mobile, i7-7700HQ, Liteonit CV3-8D128 | MSI GV62 8RE-016US GeForce GTX 1060 Mobile, i5-8300H, Samsung PM871b MZNLN128HAHQ | Aorus X5 v8 GeForce GTX 1070 Mobile, i7-8850H, Toshiba NVMe THNSN5512GPU7 | Asus GL503VD-DB74 GeForce GTX 1050 Mobile, i7-7700HQ, ADATA SX7000NP 256 GB | |
|---|---|---|---|---|---|---|
| Noise | 1% | -8% | -8% | -14% | -2% | |
| off / environment * (dB) | 28.6 | 30.3 -6% | 28.2 1% | 28.2 1% | 30 -5% | 28.3 1% |
| Idle Minimum * (dB) | 28.6 | 31.1 -9% | 33 -15% | 33.5 -17% | 33 -15% | 30.6 -7% |
| Idle Average * (dB) | 31.6 | 31.1 2% | 33.3 -5% | 33.5 -6% | 35 -11% | 30.8 3% |
| Idle Maximum * (dB) | 31.6 | 34.2 -8% | 34.7 -10% | 33.7 -7% | 40 -27% | 32.8 -4% |
| Load Average * (dB) | 38.6 | 34.9 10% | 44.5 -15% | 41 -6% | 45 -17% | 37.6 3% |
| Witcher 3 ultra * (dB) | 40.6 | 42.7 -5% | 49.2 -21% | 52.3 -29% | 50 -23% | 47 -16% |
| Load Maximum * (dB) | 56.8 | 44 23% | 52.8 7% | 52.3 8% | 55 3% | 53.5 6% |
* ... smaller is better
Temperature
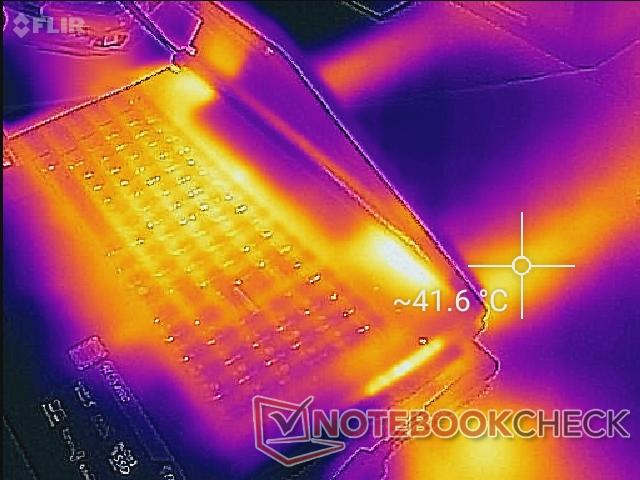
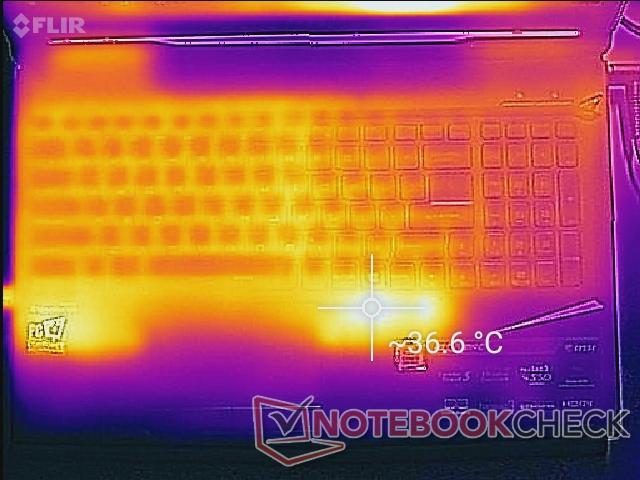
Surface temperatures are uniform and slightly on the warmer side when idling. Strangely, the area adjacent to the touchpad can be significantly warmer than the rest of the notebook as shown by the temperature map below.
Higher loads like gaming can cause the center of the keyboard to become as warm as 42 C. Fortunately, areas around the NumPad, palm rests, and WASD keys remain relatively cool for comfortable gaming.
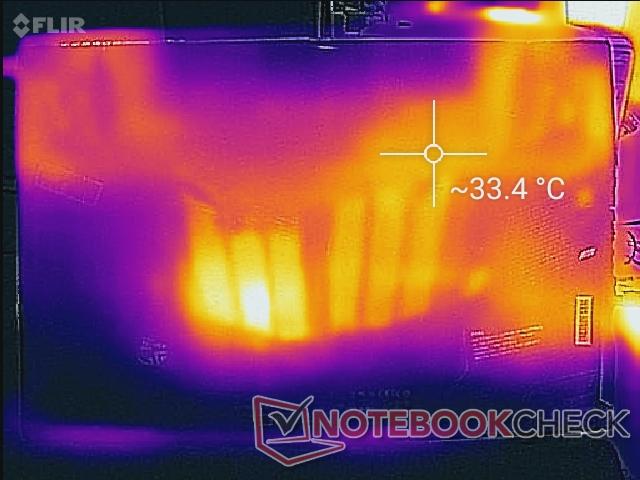
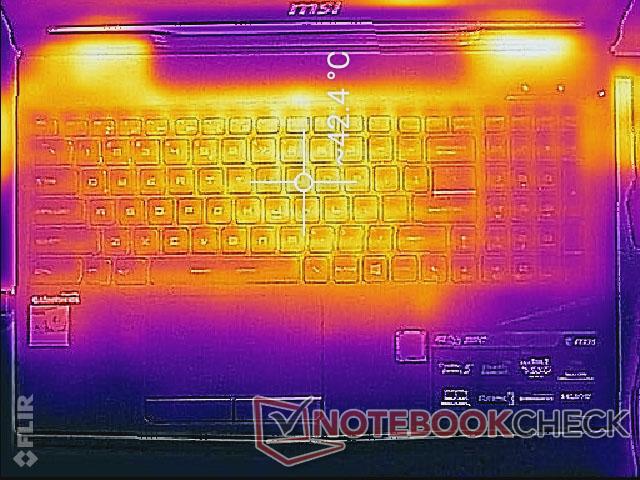
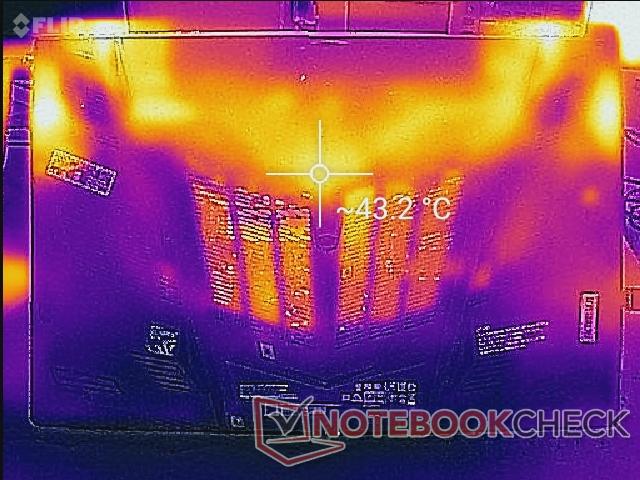
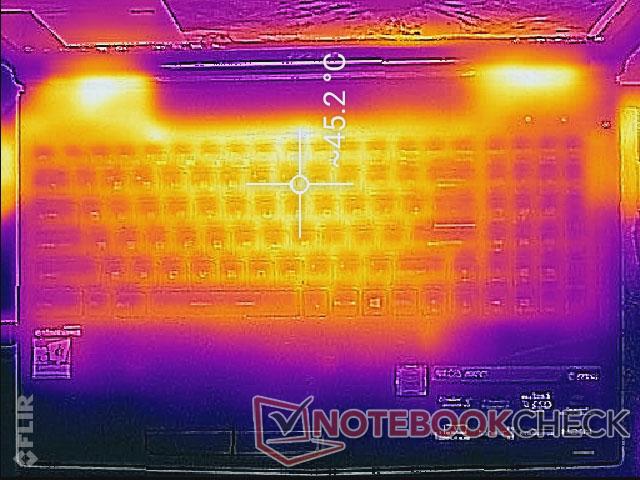
(-) The maximum temperature on the upper side is 47 °C / 117 F, compared to the average of 40.4 °C / 105 F, ranging from 21.2 to 68.8 °C for the class Gaming.
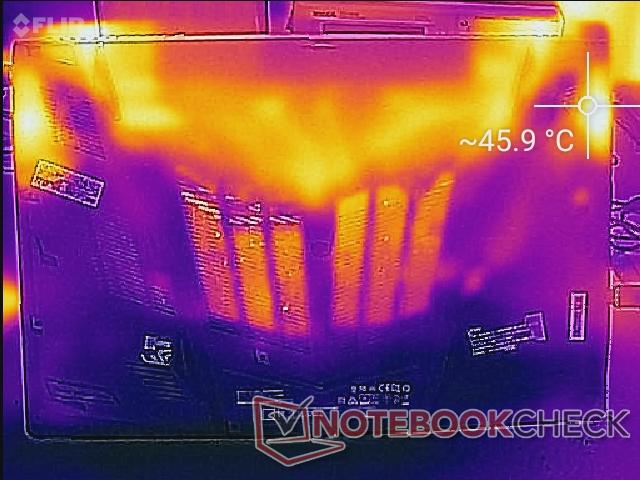
(-) The bottom heats up to a maximum of 48 °C / 118 F, compared to the average of 43.2 °C / 110 F
(±) In idle usage, the average temperature for the upper side is 32.1 °C / 90 F, compared to the device average of 33.9 °C / 93 F.
(±) Playing The Witcher 3, the average temperature for the upper side is 35.6 °C / 96 F, compared to the device average of 33.9 °C / 93 F.
(+) The palmrests and touchpad are reaching skin temperature as a maximum (35 °C / 95 F) and are therefore not hot.
(-) The average temperature of the palmrest area of similar devices was 28.8 °C / 83.8 F (-6.2 °C / -11.2 F).
Speakers
MSI has traded in the quad speakers on the GL62M for two 3 W speakers on the GL63. The results are excellent because sounds quality is very good even for a budget laptop. Whereas the speakers on most other laptops are 2 W or less, these 3 W speakers are quite powerful while being relatively balanced even on higher volume settings. There are slight chassis reverberations when on the 50 percent volume mark, but it's thankfully not distracting when gaming or typing.


MSI GL63 8RC-069US audio analysis
(±) | speaker loudness is average but good (74.1 dB)
Bass 100 - 315 Hz
(±) | reduced bass - on average 12.8% lower than median
(±) | linearity of bass is average (11.6% delta to prev. frequency)
Mids 400 - 2000 Hz
(+) | balanced mids - only 1.8% away from median
(+) | mids are linear (6.4% delta to prev. frequency)
Highs 2 - 16 kHz
(+) | balanced highs - only 3.3% away from median
(+) | highs are linear (5% delta to prev. frequency)
Overall 100 - 16.000 Hz
(+) | overall sound is linear (13.8% difference to median)
Compared to same class
» 21% of all tested devices in this class were better, 7% similar, 71% worse
» The best had a delta of 6%, average was 18%, worst was 132%
Compared to all devices tested
» 15% of all tested devices were better, 4% similar, 81% worse
» The best had a delta of 4%, average was 23%, worst was 134%
Apple MacBook 12 (Early 2016) 1.1 GHz audio analysis
(+) | speakers can play relatively loud (83.6 dB)
Bass 100 - 315 Hz
(±) | reduced bass - on average 11.3% lower than median
(±) | linearity of bass is average (14.2% delta to prev. frequency)
Mids 400 - 2000 Hz
(+) | balanced mids - only 2.4% away from median
(+) | mids are linear (5.5% delta to prev. frequency)
Highs 2 - 16 kHz
(+) | balanced highs - only 2% away from median
(+) | highs are linear (4.5% delta to prev. frequency)
Overall 100 - 16.000 Hz
(+) | overall sound is linear (10.2% difference to median)
Compared to same class
» 7% of all tested devices in this class were better, 2% similar, 90% worse
» The best had a delta of 5%, average was 18%, worst was 53%
Compared to all devices tested
» 5% of all tested devices were better, 1% similar, 94% worse
» The best had a delta of 4%, average was 23%, worst was 134%
Energy Management
Power Consumption
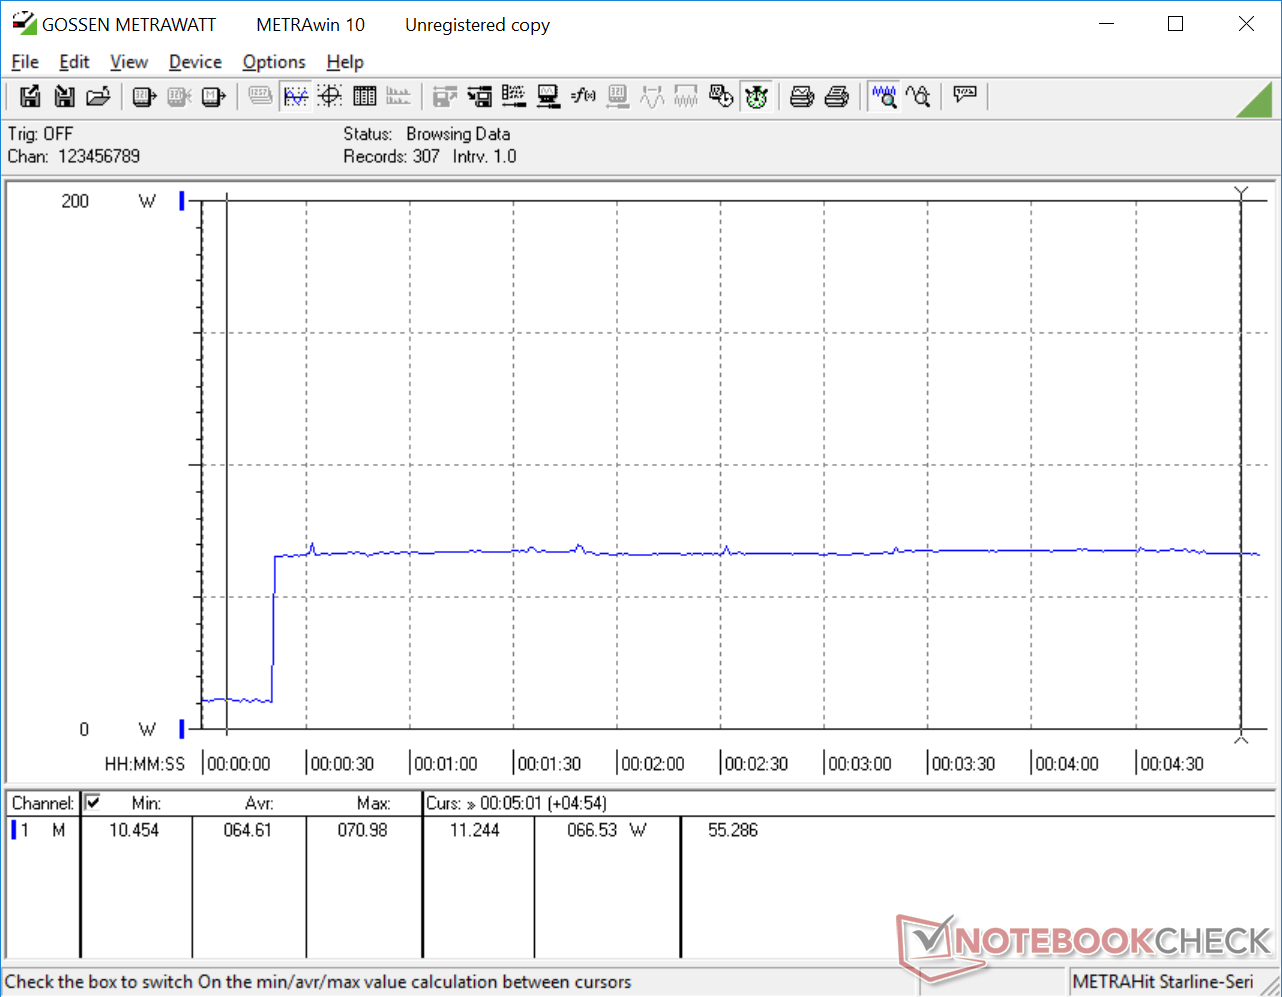
Idling on desktop will draw anywhere from 7 W to 11 W depending on the Power profile and screen brightness setting. Gaming will demand about 93 W to be very similar to both the Gigabyte Sabre 15 and Asus GL503VD. The faster MSI GF62VR with the more powerful GTX 1060 will draw about 30 W more than our GL63 when gaming.
Maximum load with Prime95 and FurMark will demand 133 W from a medium-sized (~14.3 x 6.3 x 3 cm) 135 W AC adapter. We would have preferred a more capable 150 W AC adapter for the additional power overhead.
| Off / Standby | |
| Idle | |
| Load |
|
Key:
min: | |
| MSI GL63 8RC-069US i5-8300H, GeForce GTX 1050 Mobile, Toshiba HG6 THNSNJ256G8NY, IPS, 1920x1080, 15.6" | Dell G5 15 5587 i5-8300H, GeForce GTX 1060 Max-Q, SK hynix SC311 M.2, IPS, 1920x1080, 15.6" | Gigabyte Sabre 15G i7-7700HQ, GeForce GTX 1050 Mobile, Liteonit CV3-8D128, IPS, 1920x1080, 15.6" | Asus GL503VD-DB74 i7-7700HQ, GeForce GTX 1050 Mobile, ADATA SX7000NP 256 GB, IPS, 1920x1080, 15.6" | MSI GF62VR 7RF-877 i7-7700HQ, GeForce GTX 1060 Mobile, Intel SSD 600p SSDPEKKW256G7, TN LED, 1920x1080, 15.6" | Aorus X5 v8 i7-8850H, GeForce GTX 1070 Mobile, Toshiba NVMe THNSN5512GPU7, IPS, 1920x1080, 15.6" | |
|---|---|---|---|---|---|---|
| Power Consumption | 5% | 0% | -5% | -58% | -148% | |
| Idle Minimum * (Watt) | 7.1 | 4.9 31% | 8 -13% | 8.2 -15% | 16.2 -128% | 25 -252% |
| Idle Average * (Watt) | 9.8 | 8.5 13% | 10.9 -11% | 11.1 -13% | 18.2 -86% | 31 -216% |
| Idle Maximum * (Watt) | 10.4 | 9.1 13% | 11 -6% | 11.8 -13% | 18.9 -82% | 33 -217% |
| Load Average * (Watt) | 88.8 | 90.7 -2% | 76.7 14% | 81 9% | 82.7 7% | 102 -15% |
| Witcher 3 ultra * (Watt) | 93.3 | 110 -18% | 94.9 -2% | 95.1 -2% | 125.7 -35% | 194 -108% |
| Load Maximum * (Watt) | 132.5 | 144 -9% | 106.4 20% | 123.3 7% | 162.3 -22% | 239 -80% |
* ... smaller is better
Battery Life
Battery capacity remains the same as last year's model at 41 Wh. In comparison, many pricier laptops have larger capacities like the GT63 (75 Wh) or Alienware 15 (99 Wh) for potentially longer runtimes. Users can expect about 4 to 4.5 hours of real-world WLAN use from the GL63 to be about average for a gaming laptop.
Charging from near empty to full capacity takes just under 2 hours.
| MSI GL63 8RC-069US i5-8300H, GeForce GTX 1050 Mobile, 41 Wh | Dell G5 15 5587 i5-8300H, GeForce GTX 1060 Max-Q, 56 Wh | Gigabyte Sabre 15G i7-7700HQ, GeForce GTX 1050 Mobile, 47 Wh | Asus GL503VD-DB74 i7-7700HQ, GeForce GTX 1050 Mobile, 64 Wh | MSI GF62VR 7RF-877 i7-7700HQ, GeForce GTX 1060 Mobile, 41 Wh | MSI GL62M 7RD-077 i7-7700HQ, GeForce GTX 1050 Mobile, 41 Wh | |
|---|---|---|---|---|---|---|
| Battery runtime | 109% | 33% | 51% | -39% | -8% | |
| Reader / Idle (h) | 7.3 | 11.8 62% | 8.2 12% | 10.8 48% | 2.8 -62% | 6.5 -11% |
| WiFi v1.3 (h) | 4.3 | 6.5 51% | 4.4 2% | 5.8 35% | 1.9 -56% | 3.8 -12% |
| Load (h) | 0.7 | 2.2 214% | 1.3 86% | 1.2 71% | 0.7 0% | 0.7 0% |
Pros
Cons
Verdict
The MSI GL63 chassis is clearly capable of housing more demanding GPUs than the GTX 1050 because of its many ventilation grilles and oversized cooling solution. The consequence of this is a net positive because buyers will get a system that subsequently runs cooler and quieter as a direct result. We can't stress how important these qualities are in a gaming laptop because many are notorious for being loud, hot, and high-pitched during heavy loads. Owners of the Razer Blade 14, MSI GS73VR, Aorus X5, or Asus GL503VD will know how distracting their system fans can become when playing their favorite titles.
Other surprises include the above average speakers and excellent CPU performance with sustainable Turbo Boost because of the large temperature overhead. More powerful and expensive gaming notebooks have a thing or two to learn from the GL63.
There are notable drawbacks and cut corners to reflect the inexpensive price. In particular, we recommend double-checking the WLAN and mouse keys and updating Windows immediately after purchase since we experienced issues on our test unit. The SD reader is incredibly slow, both Thunderbolt 3 and NVMe are absent, the WLAN module is 1x1 only, and common luxuries like per-key RGB lighting or 4K UHD are not included. This is a system that focuses on the core gaming essentials and we think it hits that mark so long as the above negatives aren't major hurdles.
Cool core temperatures, quieter fans, and sustainable CPU Turbo Boost. The GL63 is a great entry-level gaming system that checks all the right boxes for casual and mainstream gamers. Some QA concerns on our test unit means users should be wary of certain defects.
MSI GL63 8RC-069US
- 07/13/2018 v6 (old)
Allen Ngo
Price comparison
