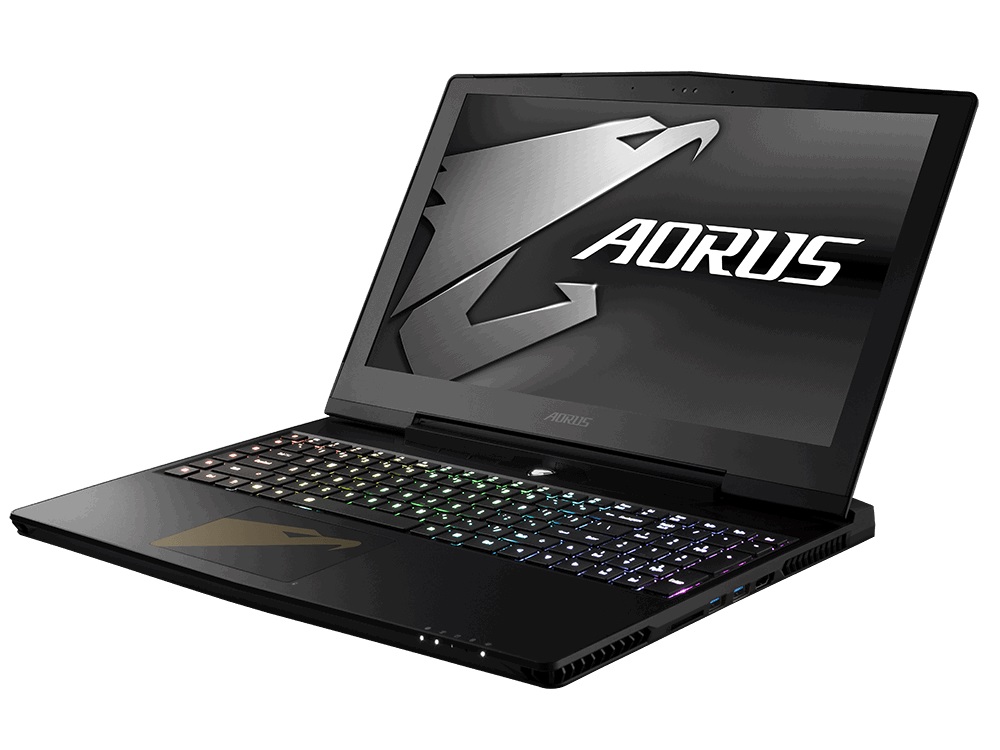
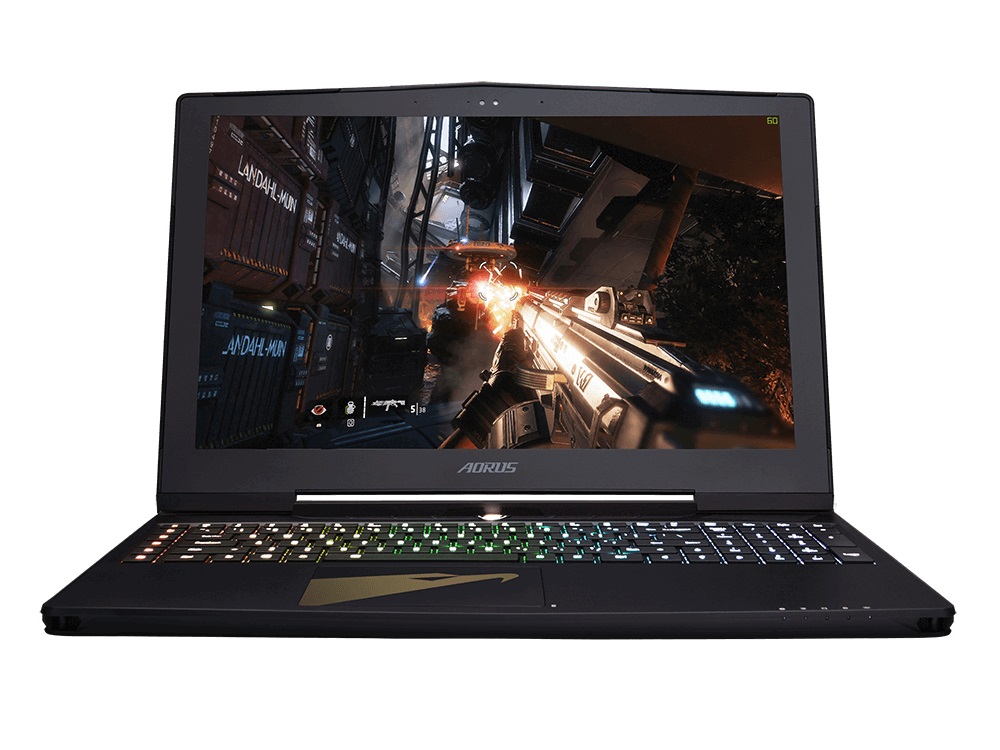
Aorus X5 v8 (i7-8850H, GTX 1070, Full HD) Laptop Review

While Gigabyte's – also very powerful – Aero 15X targets not only the gaming sector but also the multimedia sector, its 15-inch brother Aorus X5 is a high-end platform meant primarily for gaming.
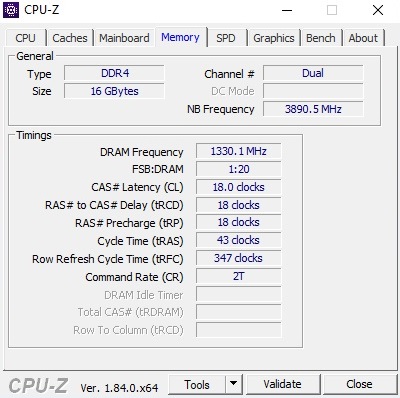
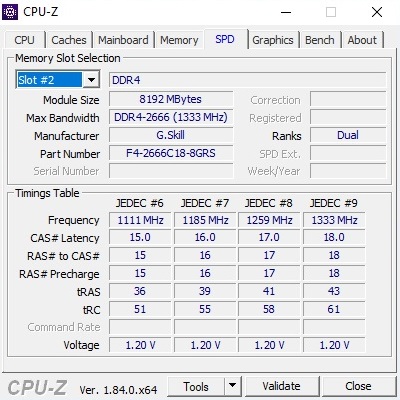
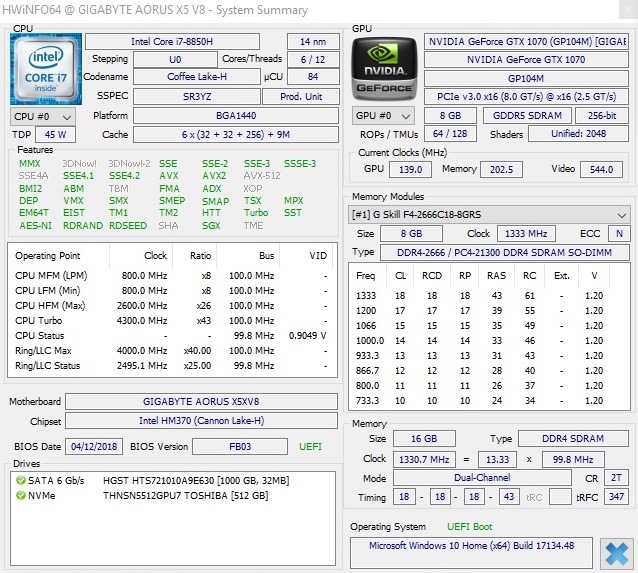
Despite the laptop's low height of 2.3 cm, the manufacturer installed a GeForce GTX 1070 and a Core i7-8850H. Additionally, our test edition at a price of 2700 Euros (~$3161) was equipped with 16 GB DDR4 RAM (2x 8 GB @2666 MHz) and a combination of a 512 GB SSD and a 1 TB HDD. The display is a matte 144 Hz panel based on IPS technology and supporting G-Sync. According to our information, a 4K version will be released as well.
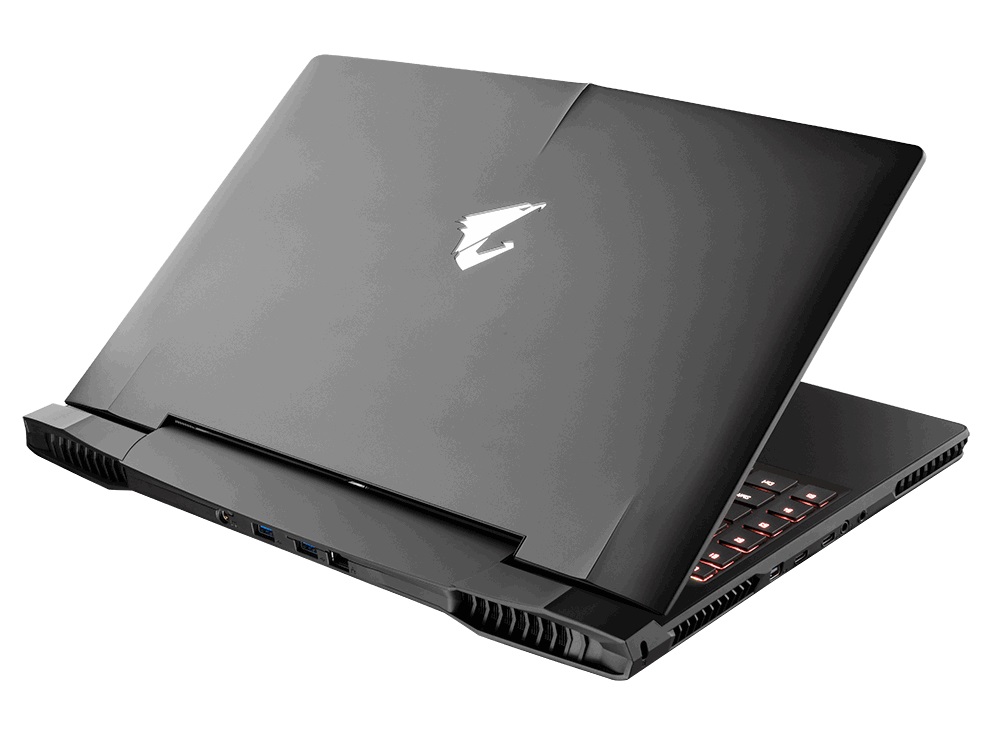
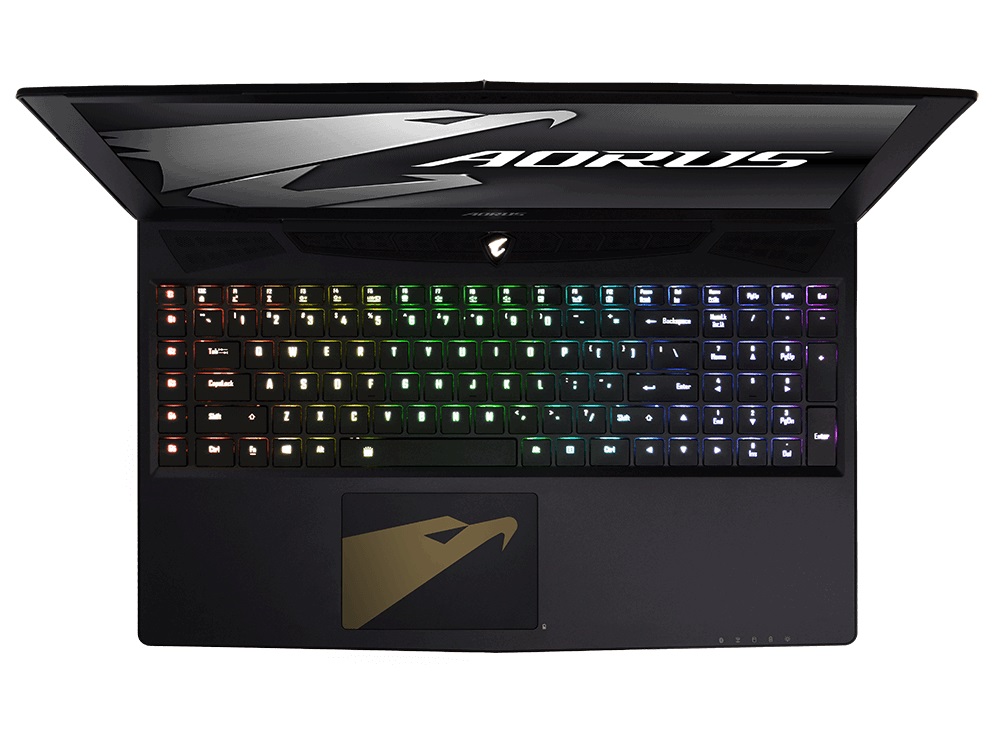
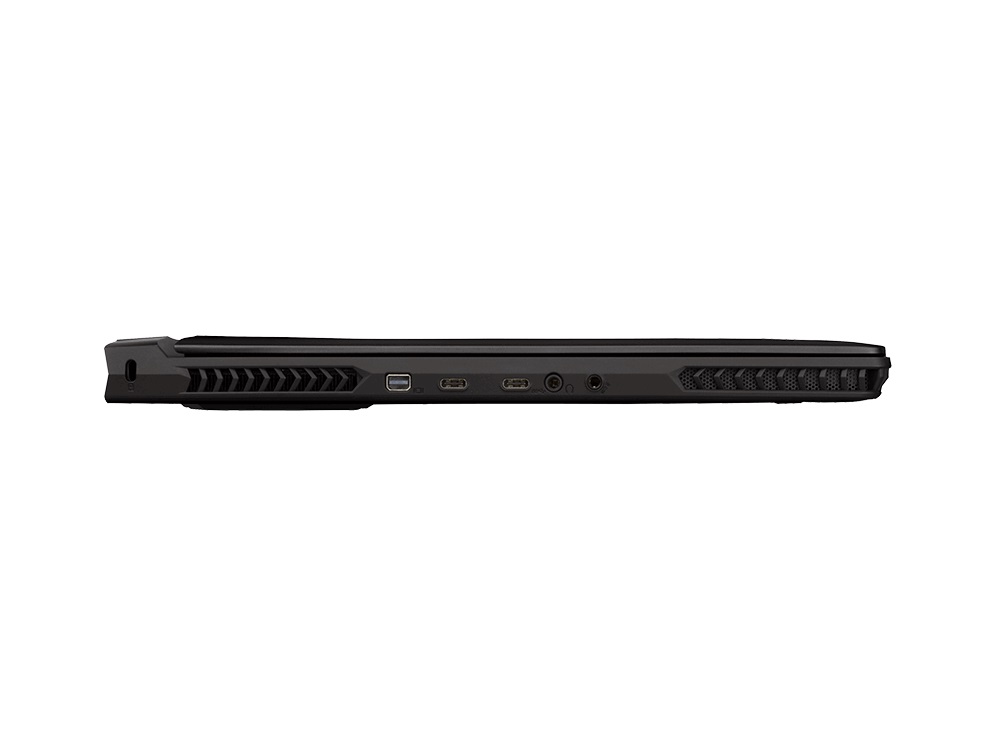
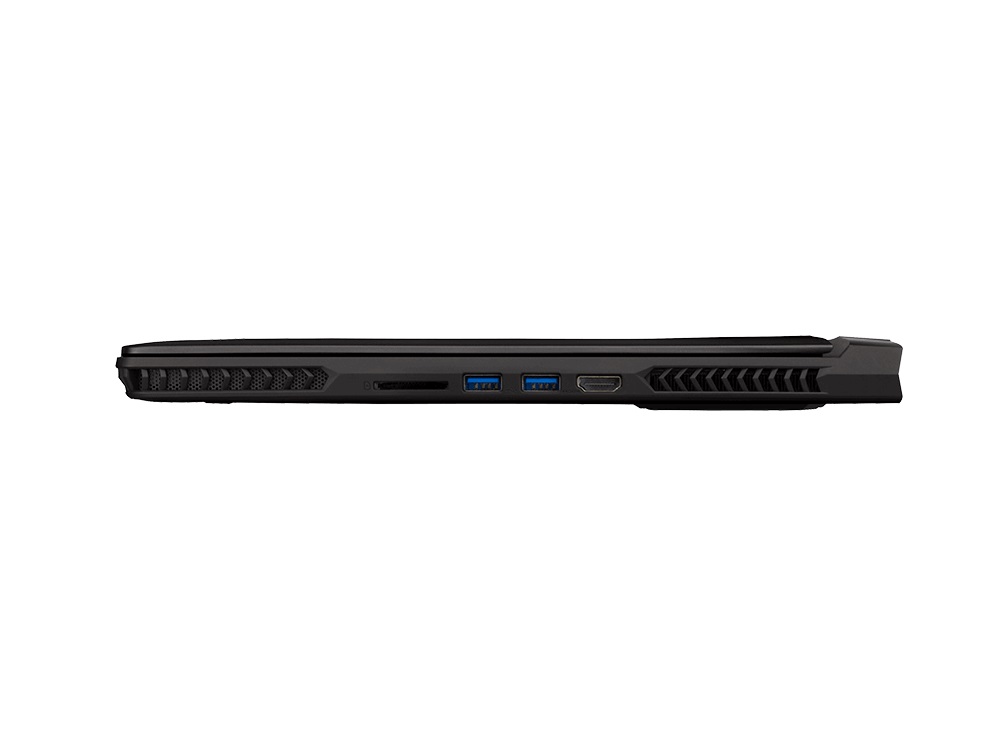
As there have been no changes to the laptop's visual appearance, this review will not go further into detail about the case, the connectivity, and the input devices. The respective details can be found in the review of the predecessor model.
The competitors of the Aorus X5 v8 include other slim gaming devices released in 2017 and 2018, such as the Asus ROG Zephyrus M GM501, the MSI GS65 Stealth Thin, the Acer Predator Triton 700 and the aforementioned Aero 15X. All of these can be found in our mobile gaming top 10. Because of its relatively high weight (2.7 kg), the Aorus X5 v8 did not make it onto this list. We will determine if it is still convincing enough to make it into the "normal" gaming top 10.
| SD Card Reader | |
| average JPG Copy Test (av. of 3 runs) | |
| Aorus X5 v8 (Toshiba Exceria Pro SDXC 64 GB UHS-II) | |
| Gigabyte Aero 15X v8 (Toshiba Exceria Pro SDXC 64 GB UHS-II) | |
| Average of class Gaming (20.9 - 210, n=54, last 2 years) | |
| maximum AS SSD Seq Read Test (1GB) | |
| Gigabyte Aero 15X v8 (Toshiba Exceria Pro SDXC 64 GB UHS-II) | |
| Aorus X5 v8 (Toshiba Exceria Pro SDXC 64 GB UHS-II) | |
| Average of class Gaming (25.5 - 261, n=51, last 2 years) | |
Display - X-Rite Makes the Difference
In contrast to the predecessor that was equipped with a UHD display, the current model utilizes a significantly faster 144 Hz display (also IPS). The display of the older X5 had response times of 26.4 ms (black to white) and 44 ms (gray to gray), while the new 144 Hz display impressed us with fairly quick, but not quite perfect times of 12 and 18.8 ms, respectively. The MSI GT75 8RG, among others, proves that even faster times are possible, but it utilizes TN technology which has far worse viewing angles.
| |||||||||||||||||||||||||
Brightness Distribution: 87 %
Center on Battery: 271 cd/m²
Contrast: 1004:1 (Black: 0.27 cd/m²)
ΔE ColorChecker Calman: 1.81 | ∀{0.5-29.43 Ø4.72}
ΔE Greyscale Calman: 1.09 | ∀{0.09-98 Ø4.97}
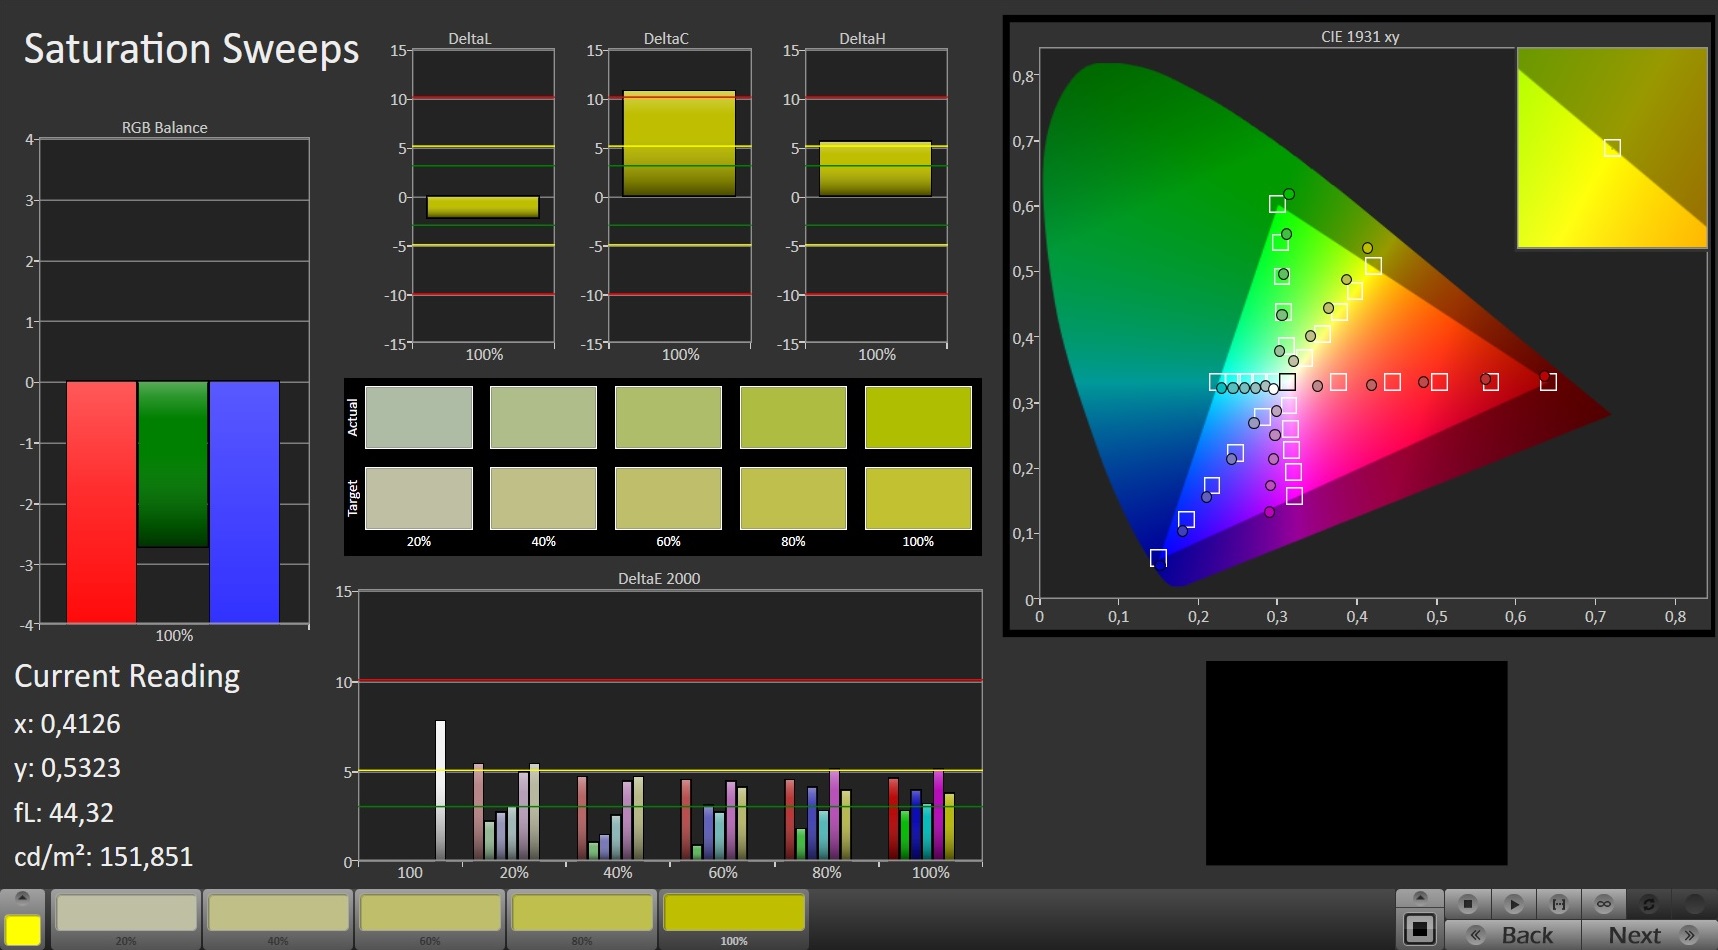
93% sRGB (Argyll 1.6.3 3D)
61% AdobeRGB 1998 (Argyll 1.6.3 3D)
68.1% AdobeRGB 1998 (Argyll 3D)
93.4% sRGB (Argyll 3D)
67.1% Display P3 (Argyll 3D)
Gamma: 2.45
CCT: 6435 K
| Aorus X5 v8 AU Optronics B156HAN07.0 (AUO70ED), IPS, 1920x1080 | Gigabyte Aero 15X v8 LGD05C0, IPS, 1920x1080 | MSI GS65 8RF-019DE Stealth Thin AU Optronics B156HAN08.0 (AUO80ED), IPS, 1920x1080 | Asus Zephyrus M GM501 AUO B156HAN07.1 (AUO71ED), IPS, 1920x1080 | Acer Predator Triton 700 AUO B156HAN04.2 (AUO42ED), IPS, 1920x1080 | |
|---|---|---|---|---|---|
| Display | -3% | -1% | -1% | -6% | |
| Display P3 Coverage (%) | 67.1 | 63.6 -5% | 66.2 -1% | 66.1 -1% | 62.5 -7% |
| sRGB Coverage (%) | 93.4 | 93.8 0% | 92.1 -1% | 92.7 -1% | 88.7 -5% |
| AdobeRGB 1998 Coverage (%) | 68.1 | 64.9 -5% | 67.2 -1% | 67.2 -1% | 63.5 -7% |
| Response Times | 9% | -1% | 39% | -143% | |
| Response Time Grey 50% / Grey 80% * (ms) | 18.8 ? | 16.8 ? 11% | 17.6 ? 6% | 6.6 ? 65% | 44.8 ? -138% |
| Response Time Black / White * (ms) | 12 ? | 11.2 ? 7% | 12.8 ? -7% | 10.4 ? 13% | 29.6 ? -147% |
| PWM Frequency (Hz) | |||||
| Screen | 10% | -9% | -89% | -88% | |
| Brightness middle (cd/m²) | 271 | 313 15% | 254 -6% | 307 13% | 291 7% |
| Brightness (cd/m²) | 259 | 300 16% | 262 1% | 296 14% | 277 7% |
| Brightness Distribution (%) | 87 | 78 -10% | 89 2% | 89 2% | 84 -3% |
| Black Level * (cd/m²) | 0.27 | 0.33 -22% | 0.22 19% | 0.25 7% | 0.22 19% |
| Contrast (:1) | 1004 | 948 -6% | 1155 15% | 1228 22% | 1323 32% |
| Colorchecker dE 2000 * | 1.81 | 1.29 29% | 2.37 -31% | 5.74 -217% | 5.52 -205% |
| Colorchecker dE 2000 max. * | 3.33 | 2.04 39% | 4.71 -41% | 11.32 -240% | 10.72 -222% |
| Greyscale dE 2000 * | 1.09 | 0.69 37% | 1.58 -45% | 6.44 -491% | 6.59 -505% |
| Gamma | 2.45 90% | 2.43 91% | 2.48 89% | 2.48 89% | 2.44 90% |
| CCT | 6435 101% | 6550 99% | 6785 96% | 8395 77% | 7816 83% |
| Color Space (Percent of AdobeRGB 1998) (%) | 61 | 60 -2% | 60 -2% | 60 -2% | 58 -5% |
| Color Space (Percent of sRGB) (%) | 93 | 94 1% | 92 -1% | 93 0% | 89 -4% |
| Colorchecker dE 2000 calibrated * | 1.84 | 1.94 | |||
| Total Average (Program / Settings) | 5% /
7% | -4% /
-6% | -17% /
-54% | -79% /
-79% |
* ... smaller is better
Our only points of criticism were the moderate luminosity (about 260 cd/m²) and the strong backlight bleeding that was visible in the lower right corner of our test device. Other than that, a contrast of about 1000:1 is as decent for a gaming laptop as is an sRGB color-space coverage of 93%. The X5 v8 still covers 61% of the AdobeRGB color space.
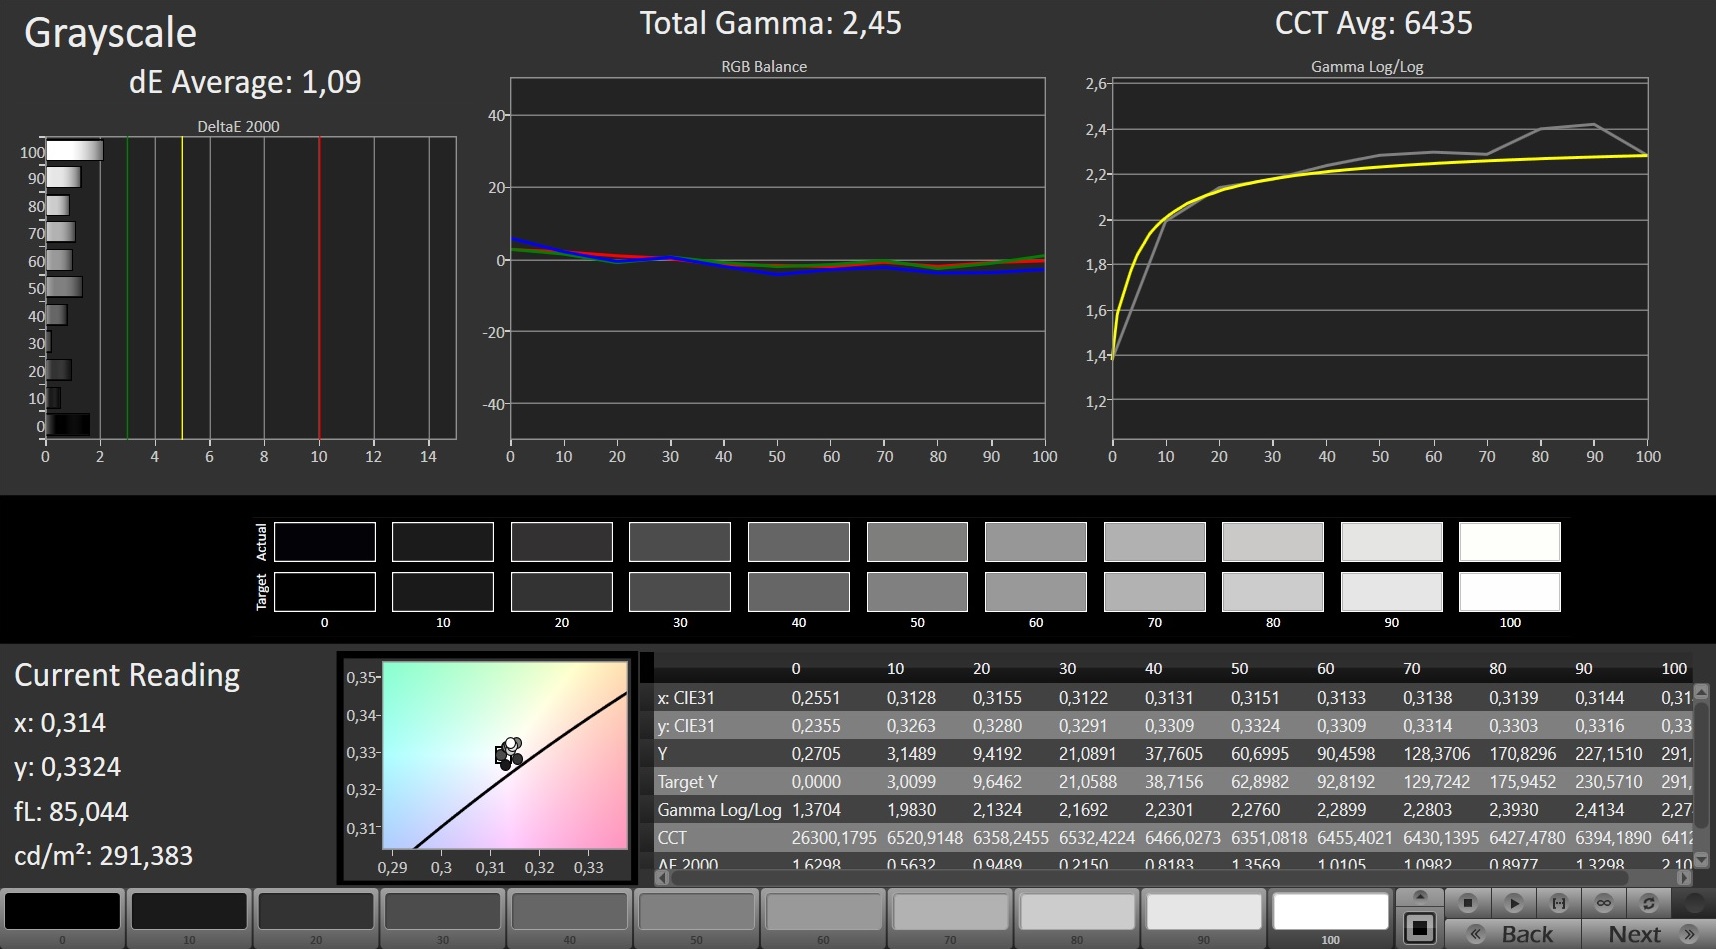
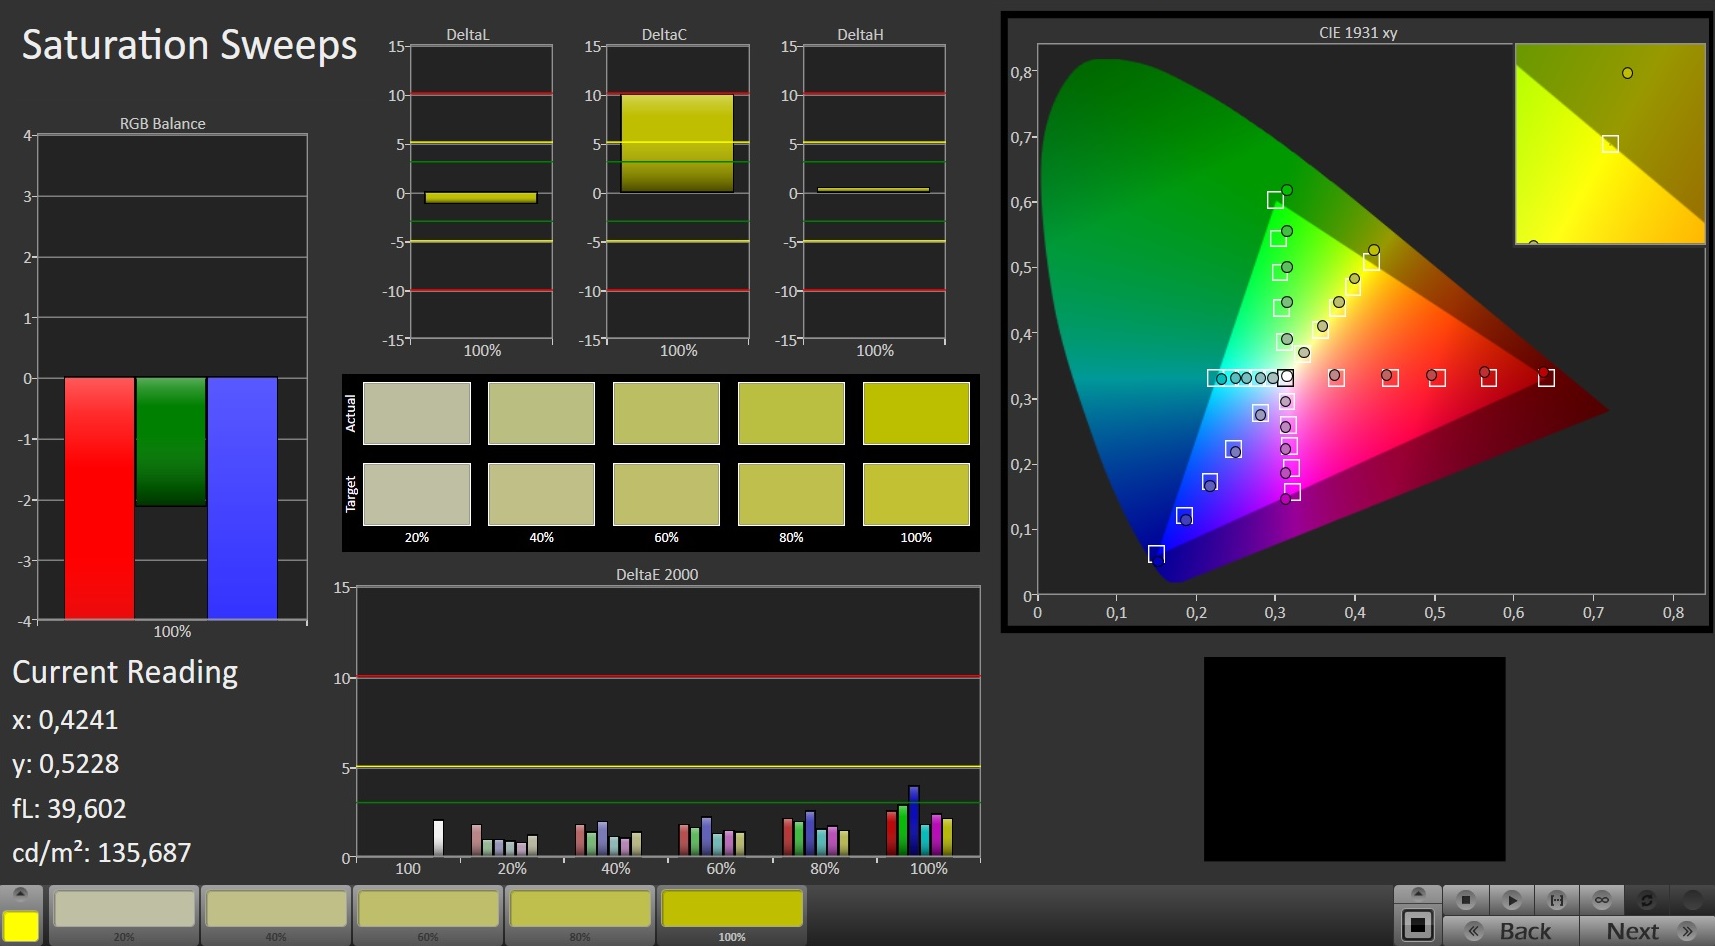
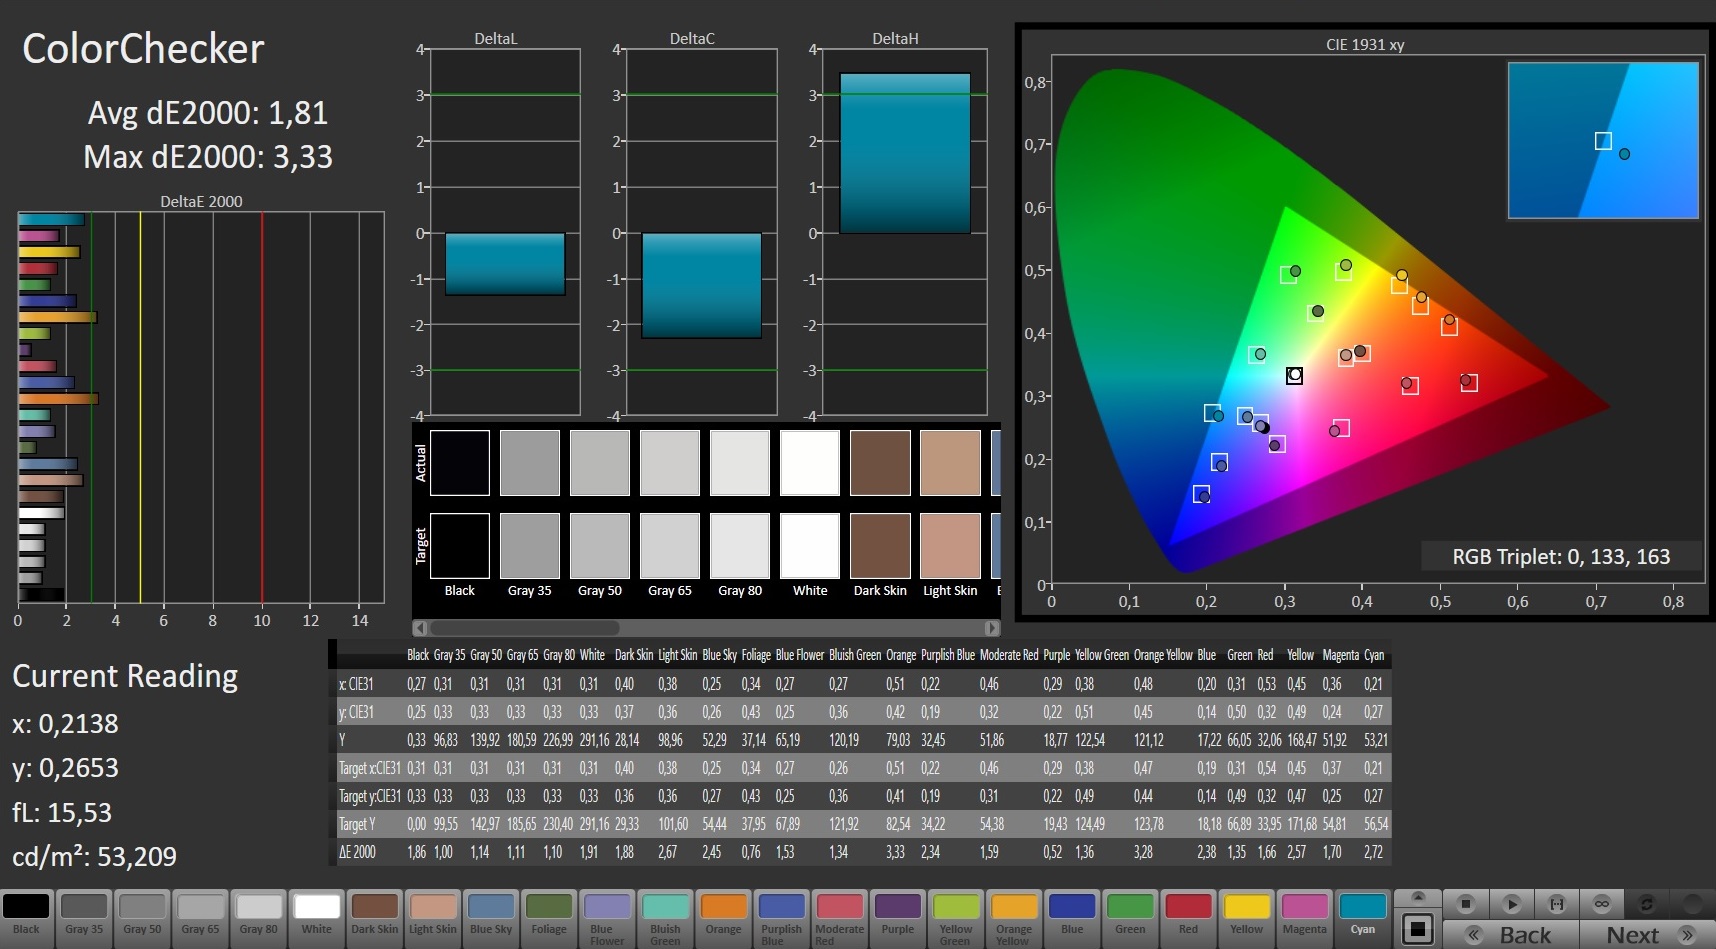
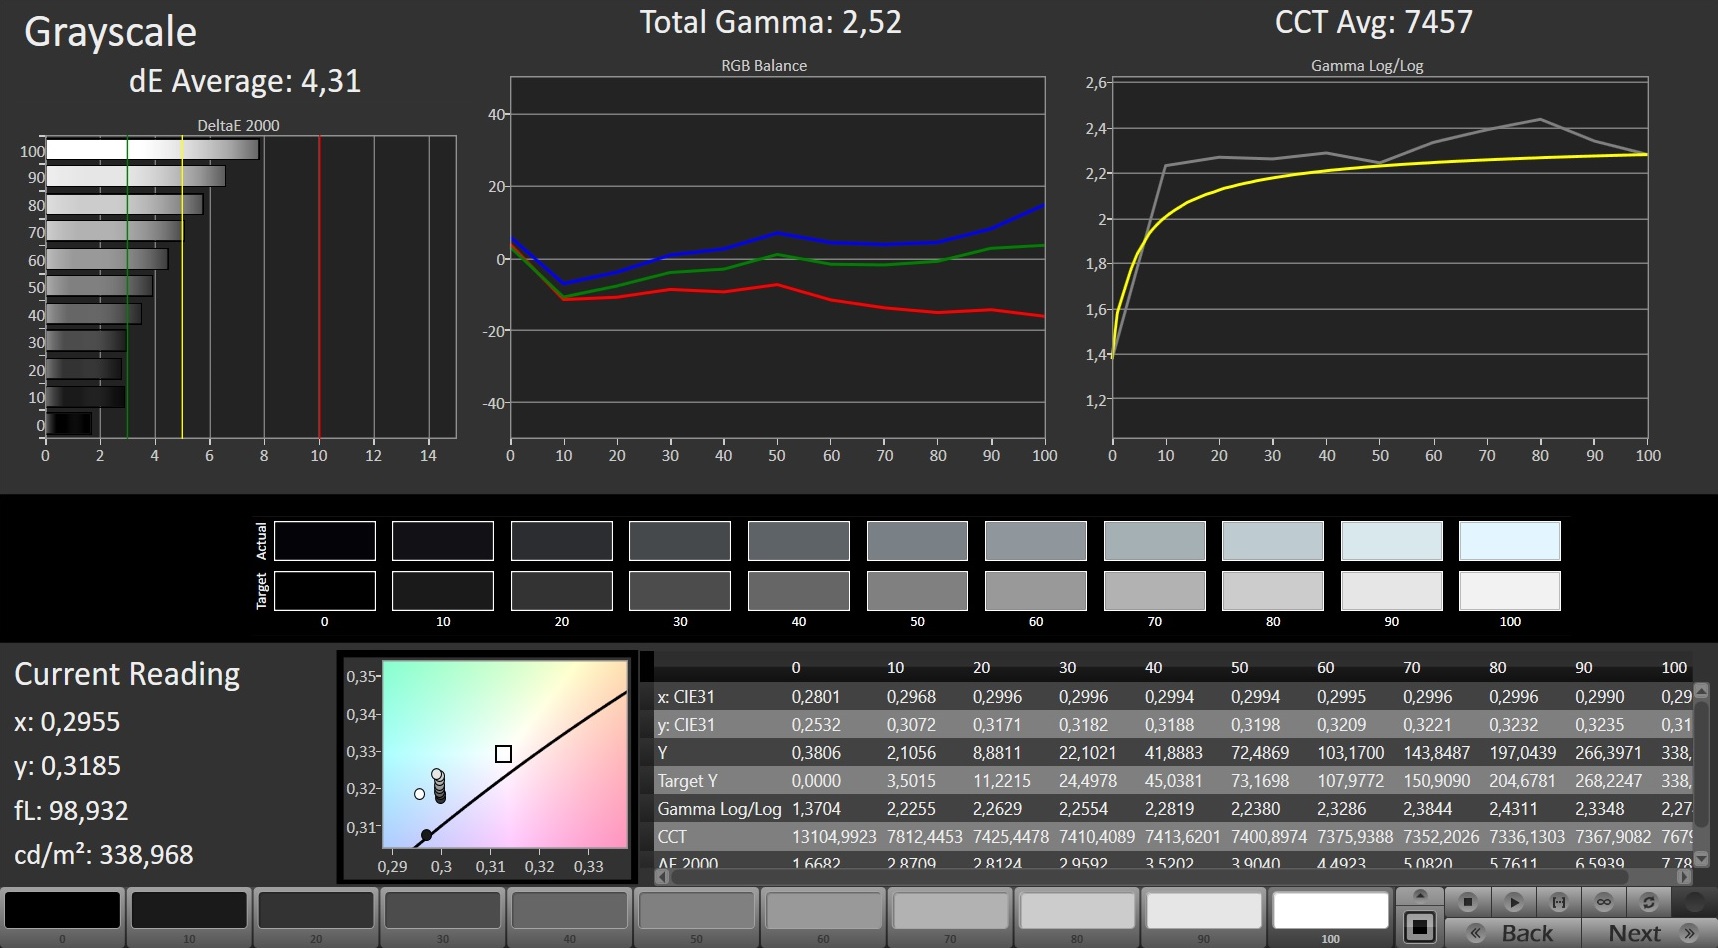
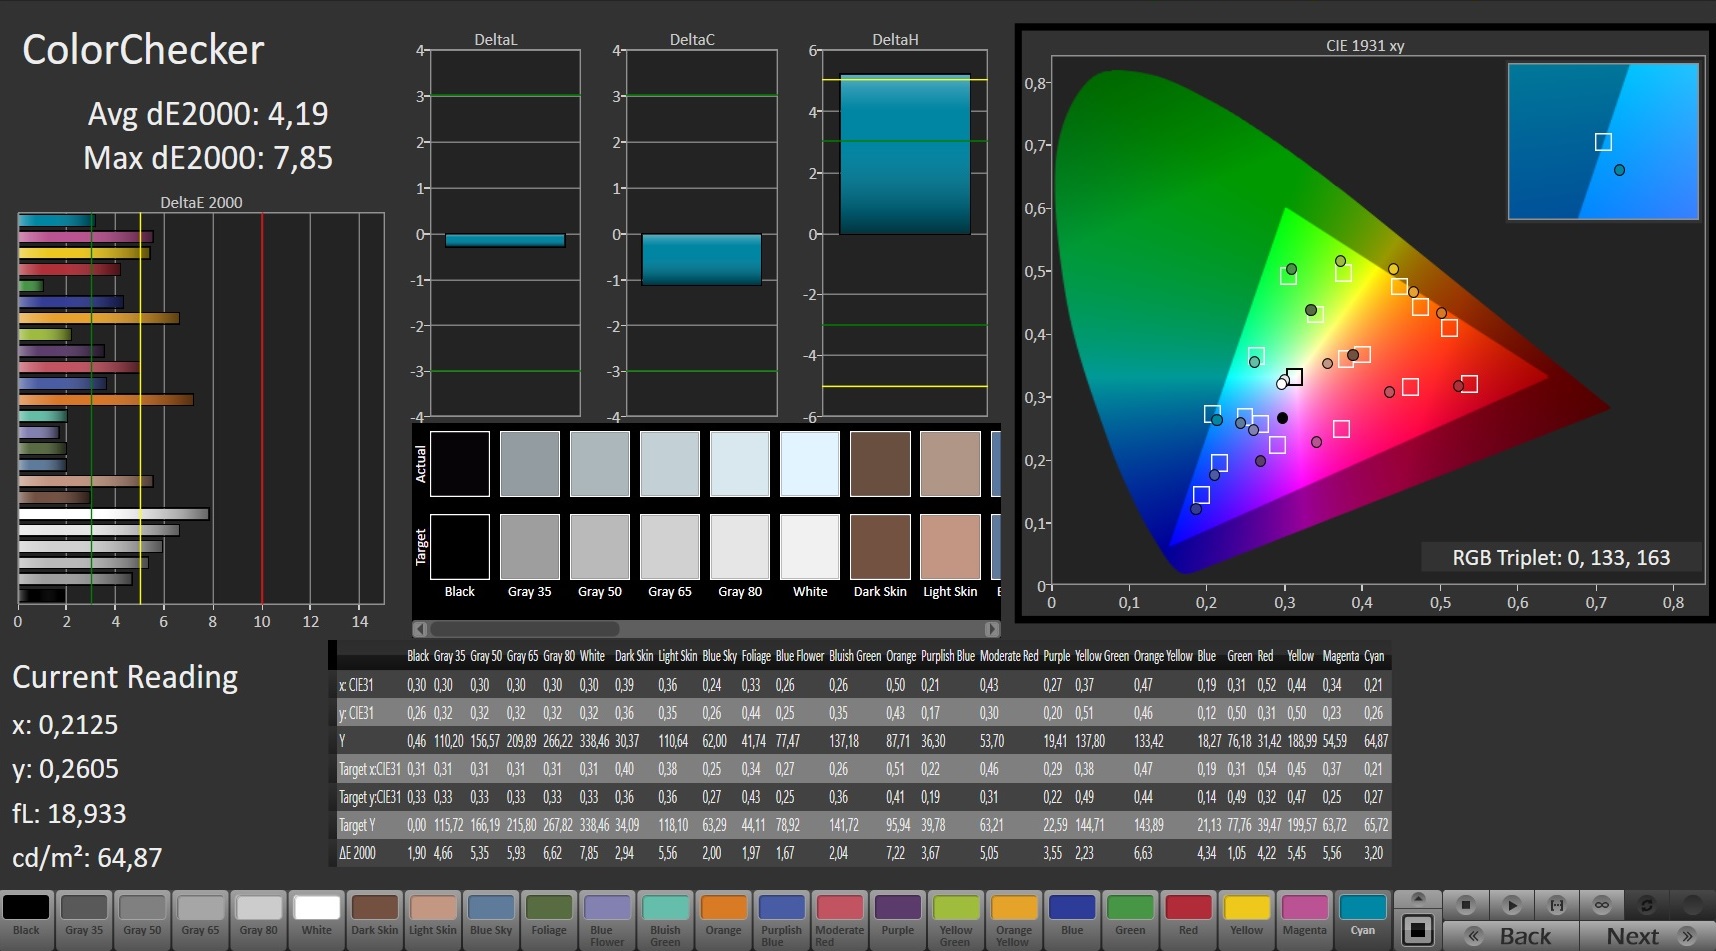
The panel's biggest highlight, other than its lavish refresh rate, is its certification for X-Rite Pantone, which lends the 15-inch device a rather accurate color representation (see screenshots).

In the "Native Color" mode, which deactivates the X-Rite profile, the display has a slight blue tint but an even better brightness (more than 300 cd/m² in the center of the screen).
Display Response Times
| ↔ Response Time Black to White | ||
|---|---|---|
| 12 ms ... rise ↗ and fall ↘ combined | ↗ 7.6 ms rise | 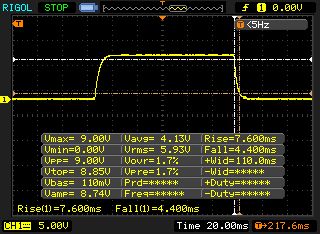 |
| ↘ 4.4 ms fall | ||
| The screen shows good response rates in our tests, but may be too slow for competitive gamers. In comparison, all tested devices range from 0.1 (minimum) to 240 (maximum) ms. » 31 % of all devices are better. This means that the measured response time is better than the average of all tested devices (19.9 ms). | ||
| ↔ Response Time 50% Grey to 80% Grey | ||
| 18.8 ms ... rise ↗ and fall ↘ combined | ↗ 10 ms rise | 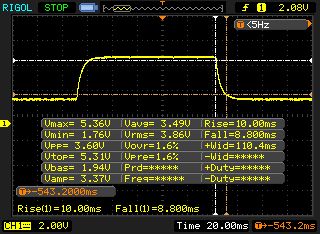 |
| ↘ 8.8 ms fall | ||
| The screen shows good response rates in our tests, but may be too slow for competitive gamers. In comparison, all tested devices range from 0.165 (minimum) to 636 (maximum) ms. » 32 % of all devices are better. This means that the measured response time is better than the average of all tested devices (31.1 ms). | ||
Screen Flickering / PWM (Pulse-Width Modulation)
| Screen flickering / PWM not detected | 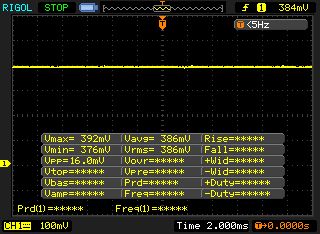 | ||
In comparison: 52 % of all tested devices do not use PWM to dim the display. If PWM was detected, an average of 7784 (minimum: 5 - maximum: 343500) Hz was measured. | |||
Performance - A Feast for Gamers
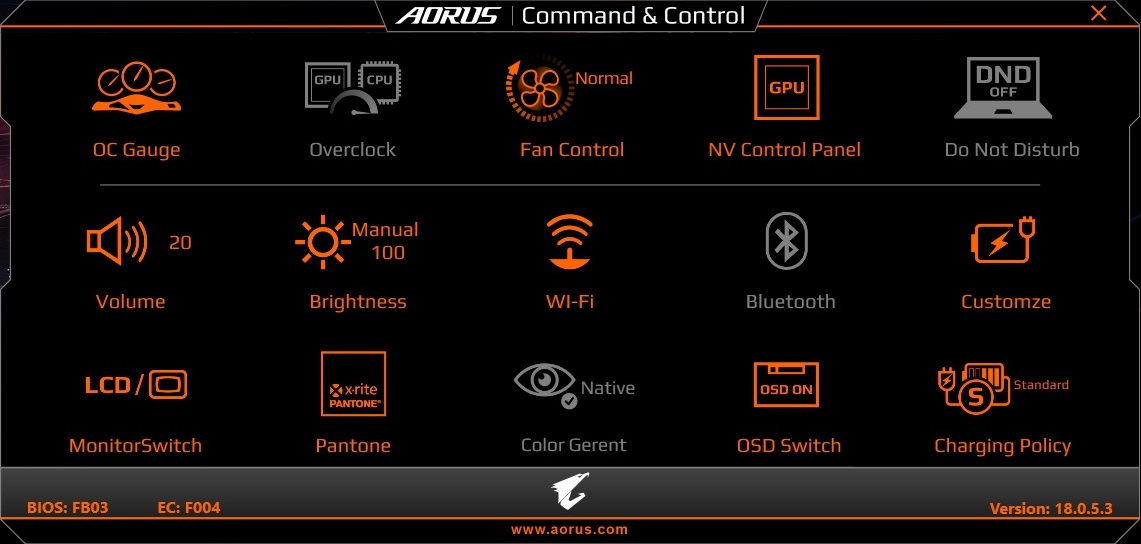
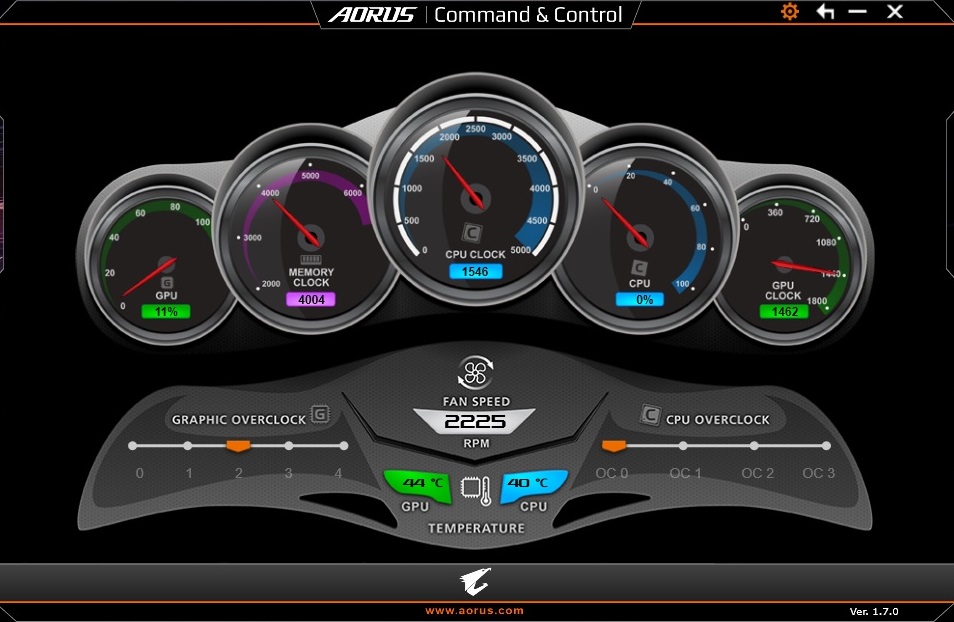
Thanks to the preinstalled tool Command & Control, not only the image reproduction can be adjusted; the energy-saving mode and the fan control can also be adjusted. We used the fan control mode "Normal" for our measurements. Those looking to overclock the 15-inch device have to use the fan profile "Gaming" or the manual controls.
Processor
Most of the Coffee Lake laptops we have tested so far were powered by a Core i7-8750H, but the Aorus X5 v8 is equipped with the slightly more powerful Core i7-8850H. Under load, it clocks at 2.6 to 4.3 GHz instead of 2.2 to 4.1 GHz, which is noticeable in the benchmarks. The 15-inch device manages to outperform the competitors Asus GM501, Gigabyte Aero 15X and MSI GS65 by 8 to 20% in the multi-core test of Cinebench R15.
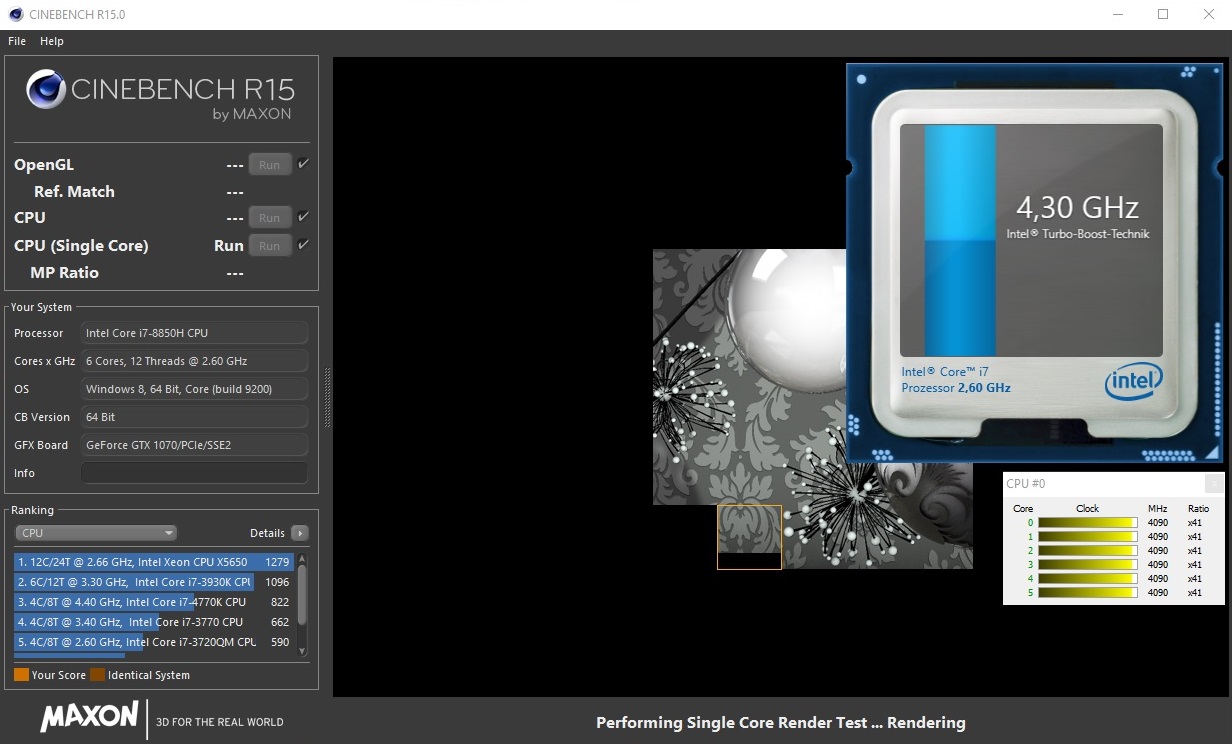
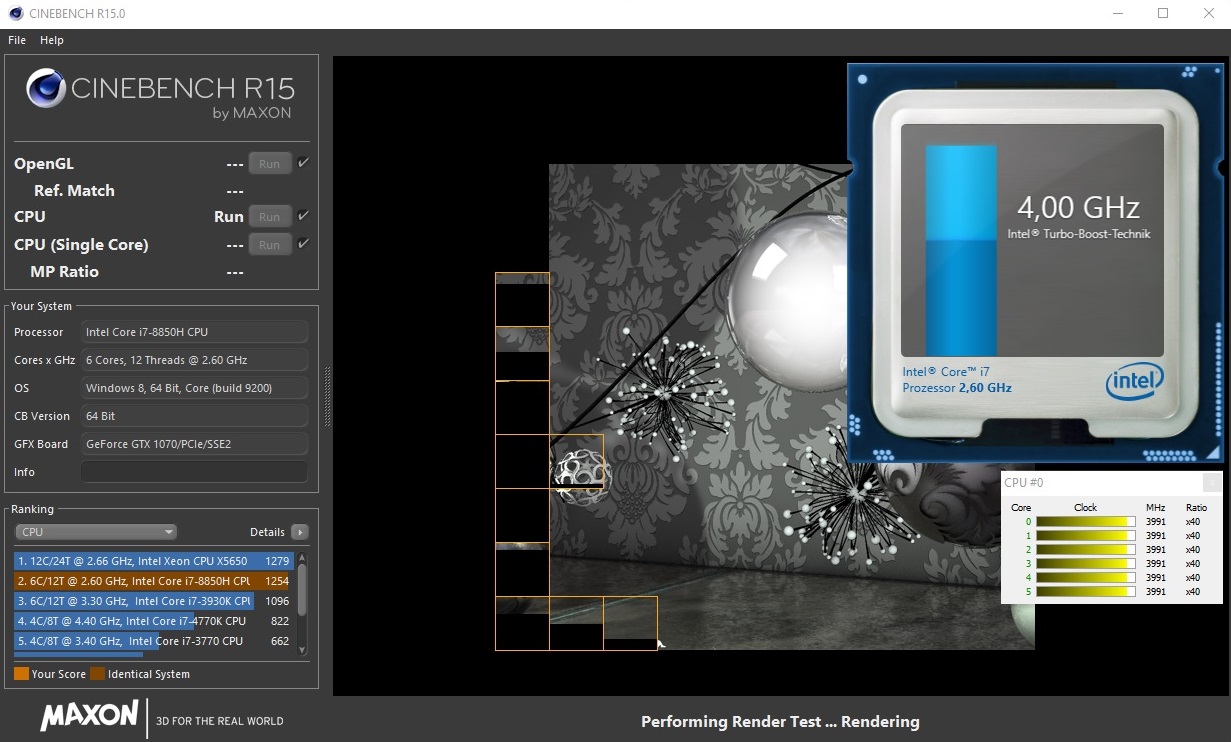
The performance deviations of the 8750H devices can be explained by the different efficiency in using Turbo. Despite its small to medium advantage, even the Core i7-8850H installed in the X5 v8 does not exhaust its Turbo Boost to its fullest potential, as evidenced by our Cinebench loop.
While the first iteration was still processed at 4.0 GHz (= maximum possible value for six cores under load), the clock speed dropped to 3.5 to 3.6 GHz from the second iteration onwards. However, given the laptop's low height, this result is acceptable.
System Performance
Even though the X5 v8 does not have the fastest SSD of our comparison field, the 15-inch device scored first in our system benchmarks. The high-end laptop easily claimed the first place for both PCMark 10 and PCMark 8. The subjective operating speed was rather convincing as well. Windows booted pleasantly fast and reacted quickly in general (starting of programs, loading times, etc.).
| PCMark 10 - Score | |
| Average of class Gaming (5828 - 11574, n=94, last 2 years) | |
| Aorus X5 v8 | |
| Acer Predator Triton 700 | |
| Asus Zephyrus M GM501 | |
| MSI GS65 8RF-019DE Stealth Thin | |
| Gigabyte Aero 15X v8 | |
| PCMark 8 Home Score Accelerated v2 | 5773 points | |
| PCMark 8 Work Score Accelerated v2 | 5953 points | |
| PCMark 10 Score | 6154 points | |
Help | ||
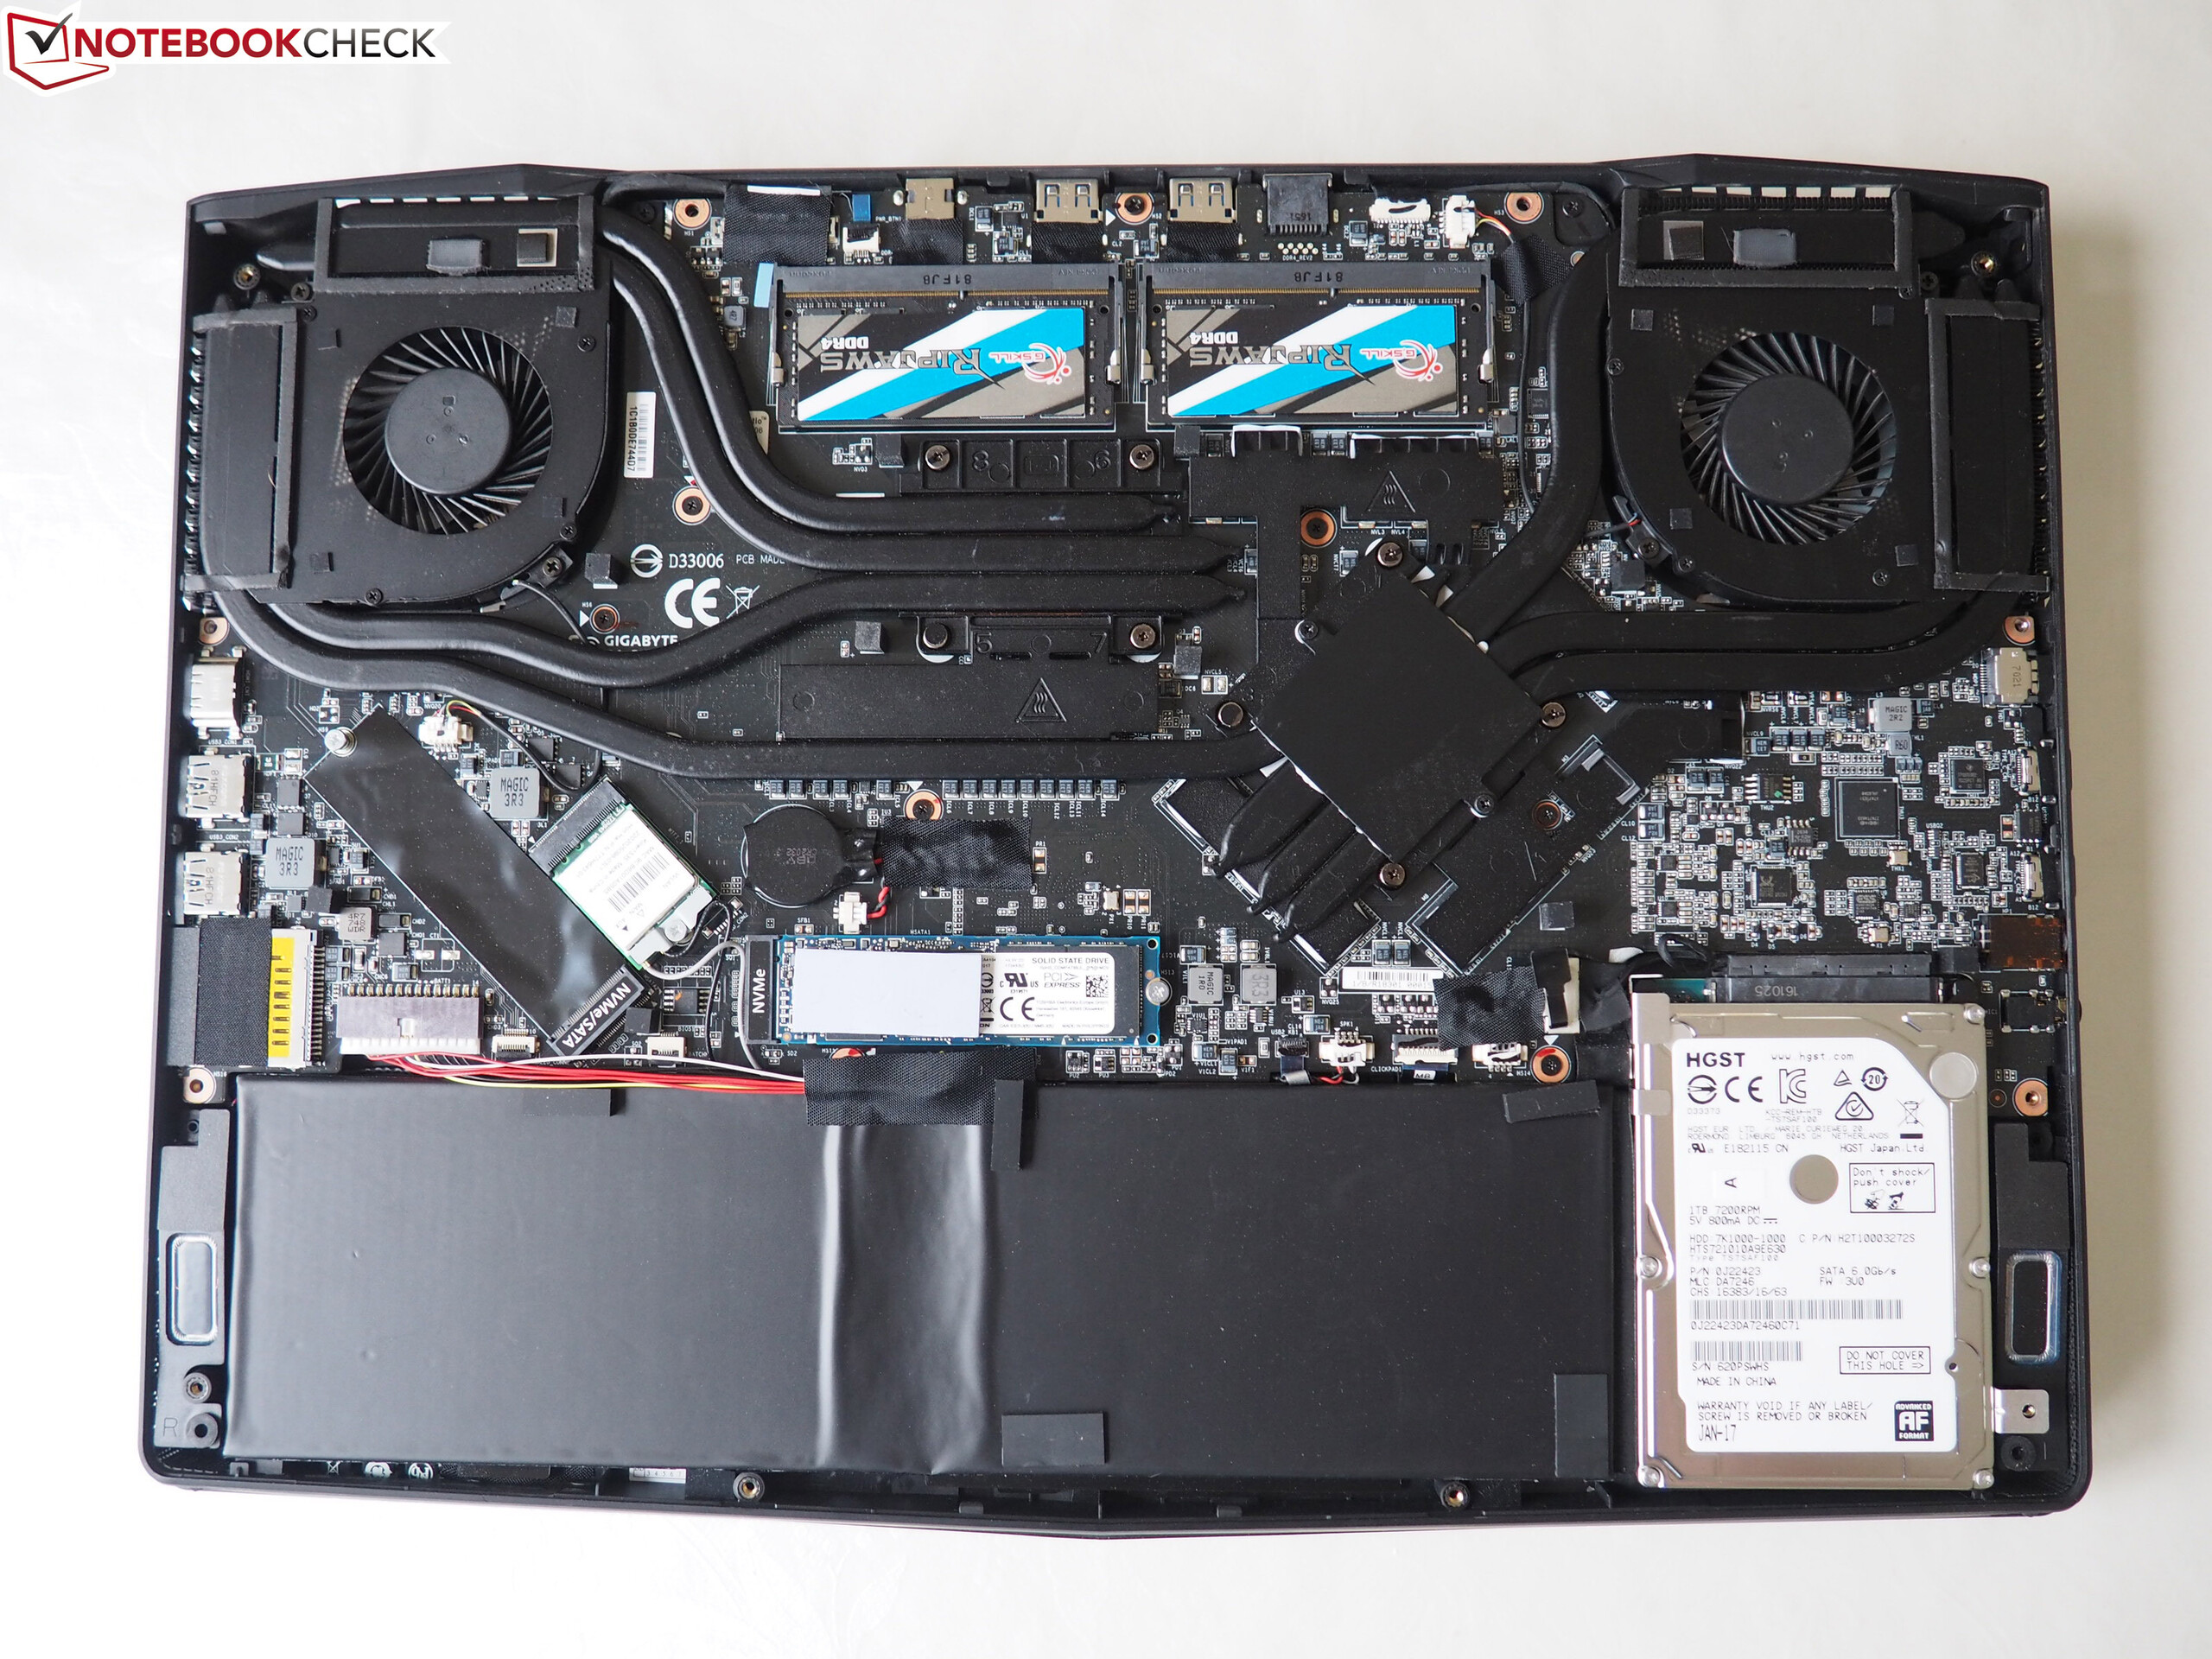
Storage Devices
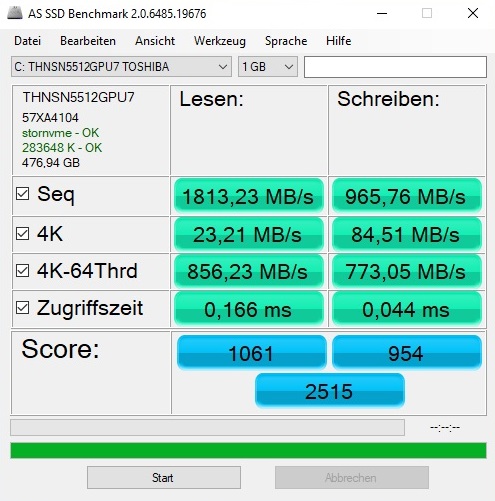
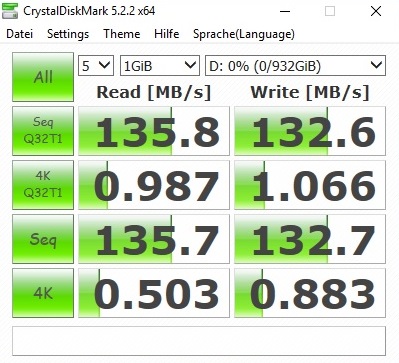
The high Windows performance is no surprise, as the operating system works on a modern solid state drive. Gigabyte installed a model by Toshiba utilizing NVMe technology. The THNSN5512GPU7 with a capacity of 512 GB is the same model that has been used for the Aero 15X. The M.2 drive's performance is not quite equal to the current Samsung SSDs, but the values measured in the AS SSD benchmark are still decent at 1813 MB/s for sequential reading and 966 MB/s for sequential writing. The difference is barely noticeable anyway.
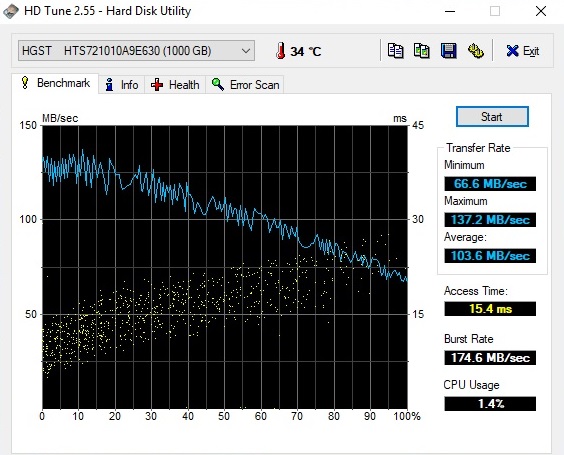
The manufacturer integrated a 1 TB HDD by HGST as the secondary storage device. The Travelstar 7K1000 works at 7200 rpm and performs well for an HDD, but games and frequently used programs should still be installed onto the SSD instead if possible.
| Aorus X5 v8 Toshiba NVMe THNSN5512GPU7 | Gigabyte Aero 15X v8 Toshiba NVMe THNSN5512GPU7 | MSI GS65 8RF-019DE Stealth Thin Samsung SSD PM981 MZVLB512HAJQ | Asus Zephyrus M GM501 Samsung SM961 MZVKW512HMJP m.2 PCI-e | Acer Predator Triton 700 2x SK Hynix Canvas SC300 512GB M.2 (HFS512G39MND) (RAID 0) | |
|---|---|---|---|---|---|
| AS SSD | 6% | 58% | 44% | 52% | |
| Seq Read (MB/s) | 1813 | 2213 22% | 1266 -30% | 2091 15% | 2517 39% |
| Seq Write (MB/s) | 966 | 1163 20% | 1834 90% | 1580 64% | 2372 146% |
| 4K Read (MB/s) | 23.21 | 23.36 1% | 48.94 111% | 43.42 87% | 41.47 79% |
| 4K Write (MB/s) | 84.5 | 80.4 -5% | 107.2 27% | 90.2 7% | 93 10% |
| Score Read (Points) | 1061 | 1092 3% | 1346 27% | 1471 39% | 1350 27% |
| Score Write (Points) | 954 | 939 -2% | 2051 115% | 1446 52% | 1243 30% |
| Score Total (Points) | 2515 | 2536 1% | 4122 64% | 3649 45% | 3282 30% |

Graphics
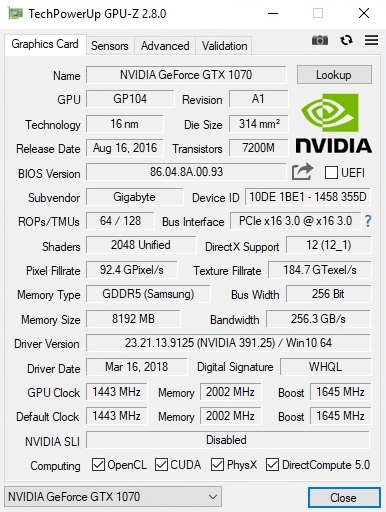
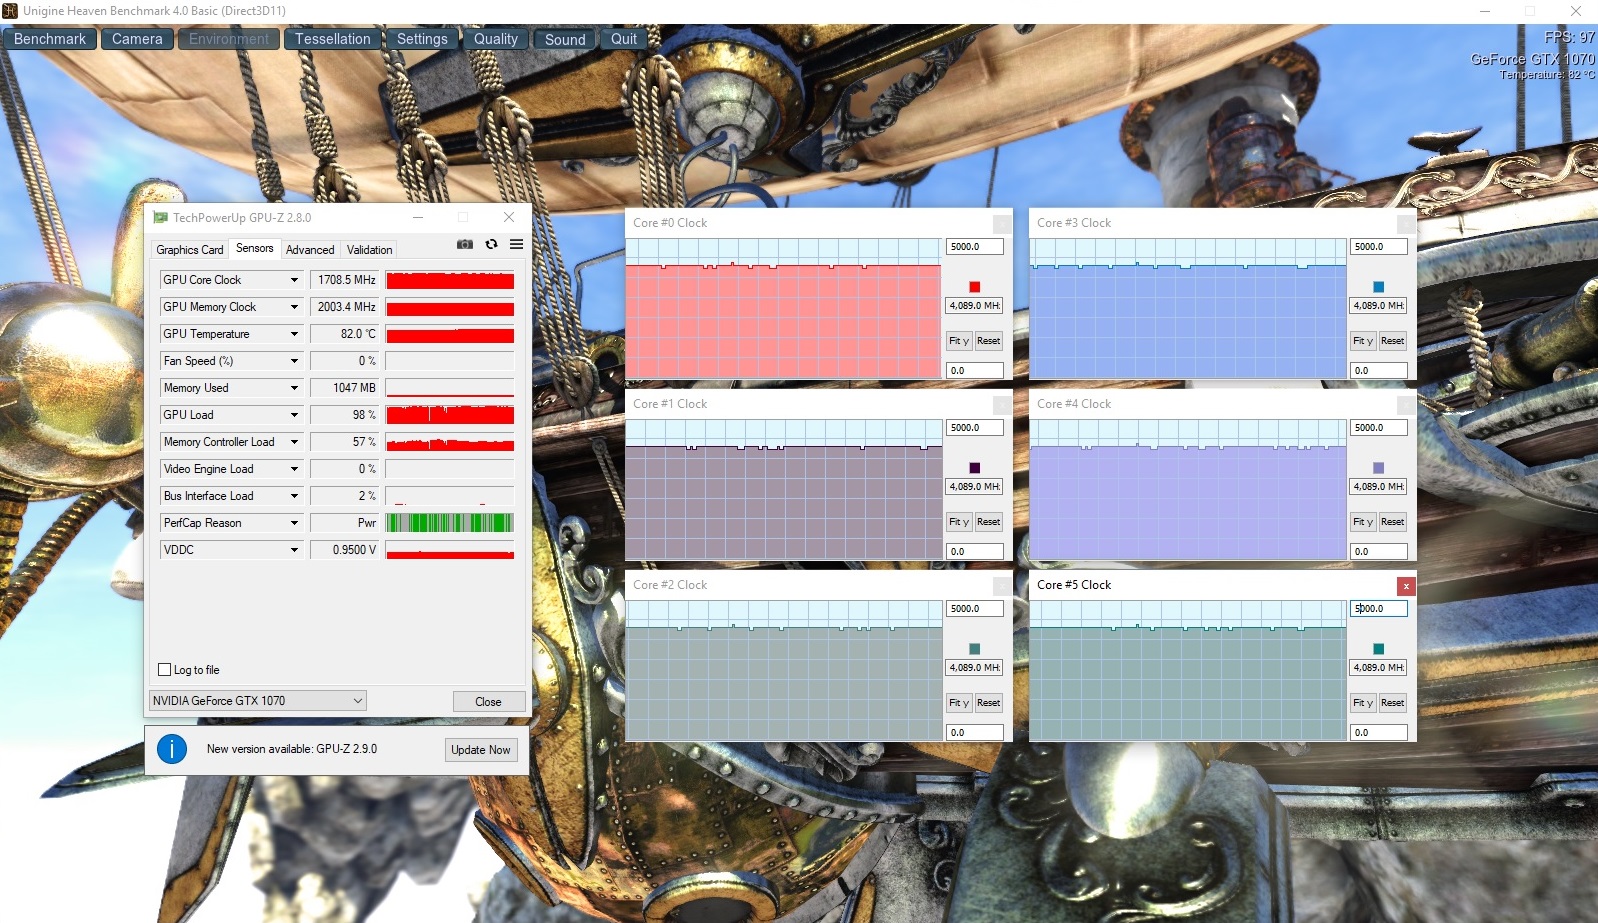
The graphics are calculated by Nvidia's second most powerful Pascal chip without Max-Q design. The GeForce GTX 1070 is definitely powerful enough for operation in 1920x1080 pixels and even the WQHD resolution of 2560x1440 pixels still works well. However, at 4K, gamers have to compromise between performance and image quality.
| 3DMark - 1920x1080 Fire Strike Graphics | |
| Average of class Gaming (12242 - 62849, n=118, last 2 years) | |
| Acer Predator Triton 700 | |
| Aorus X5 v8 | |
| Asus Zephyrus M GM501 | |
| Gigabyte Aero 15X v8 | |
| MSI GS65 8RF-019DE Stealth Thin | |
There were no surprises regarding the performance of the X5 v8 in our benchmark course. 3DMark 11 and the Fire Strike test of 3DMark 13 rank the 15-inch device as equal to the Asus GM501, which is also equipped with a GTX 1070. Because of the Max-Q version, the Gigabyte Aero 15X and the MSI GS65 fall behind by over 10%. The GTX 1080 Max-Q in the Acer Triton 700, however, is faster by several percentage points, but this still does not justify the much higher price.
| 3DMark 06 Standard Score | 38437 points | |
| 3DMark 11 Performance | 18621 points | |
| 3DMark Ice Storm Standard Score | 172098 points | |
| 3DMark Cloud Gate Standard Score | 37234 points | |
| 3DMark Fire Strike Score | 15226 points | |
Help | ||
Just like the Intel processors, the Nvidia GPUs can overclock automatically. The Turbo works really well in the Aorus X5 v8. Even under protracted gaming load, the GTX 1070 is clearly above its standard value of 1443 MHz. After 60 minutes of The Witcher 3 (Full HD, Ultra), the DirectX 12 chip leveled off at around 1700 MHz. In an ideal situation, it reaches up to 1873 MHz.
Gaming Performance
The fact that the GTX 1070 is great for gaming is proven as soon as the user tries a game on the Aorus X5 v8. Even more-demanding titles can be played fluently on maximum settings, although the 144 Hz panel is not always provided with the corresponding FPS numbers. In combination with the G-Sync technology, however, the screen content still appears less edgy than it does on classic 60 Hz laptops, be it for gaming or just during desktop operation.
| low | med. | high | ultra | |
|---|---|---|---|---|
| The Witcher 3 (2015) | 113 | 60 | ||
| Fortnite (2018) | 166 | 127 | ||
| Final Fantasy XV Benchmark (2018) | 53.3 | |||
| Kingdom Come: Deliverance (2018) | 87.8 | 65.2 | ||
| Far Cry 5 (2018) | 94 | 90 |
By the way, Nvidia's graphics-switching Optimus is not included for the X5 v8, so the processor's graphics chip (UHD Graphics 630) remains inactive constantly.
| The Witcher 3 - 1920x1080 Ultra Graphics & Postprocessing (HBAO+) | |
| Average of class Gaming (95 - 240, n=8, last 2 years) | |
| Acer Predator Triton 700 | |
| Aorus X5 v8 | |
| Asus Zephyrus M GM501 | |
| MSI GS65 8RF-019DE Stealth Thin | |
| Gigabyte Aero 15X v8 | |
Emissions - The Usual Weak Spots
Noise Emissions
As is the case for most gaming laptops, the noise level is one of this laptop's biggest flaws. At 45 to 55 dB, the 15-inch device is very loud, so it is recommended to use headphones. Other slim competitors have similarly bad results during 3D operation. The main rival by Asus, namely the GM501, also reaches an average of 50 dB after 60 minutes of The Witcher 3.
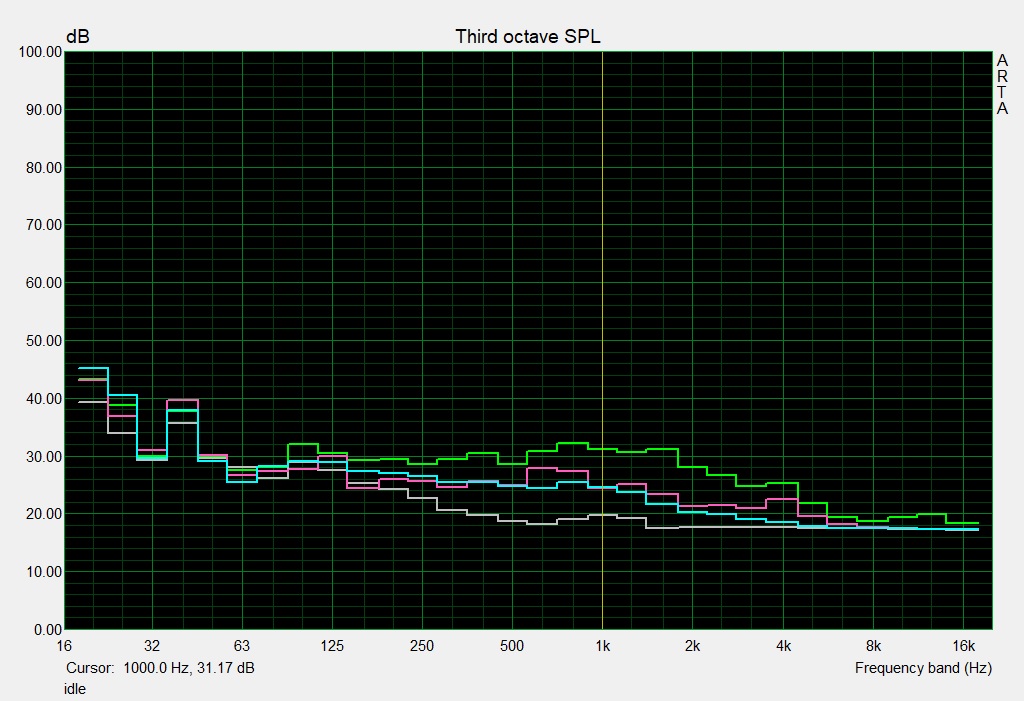
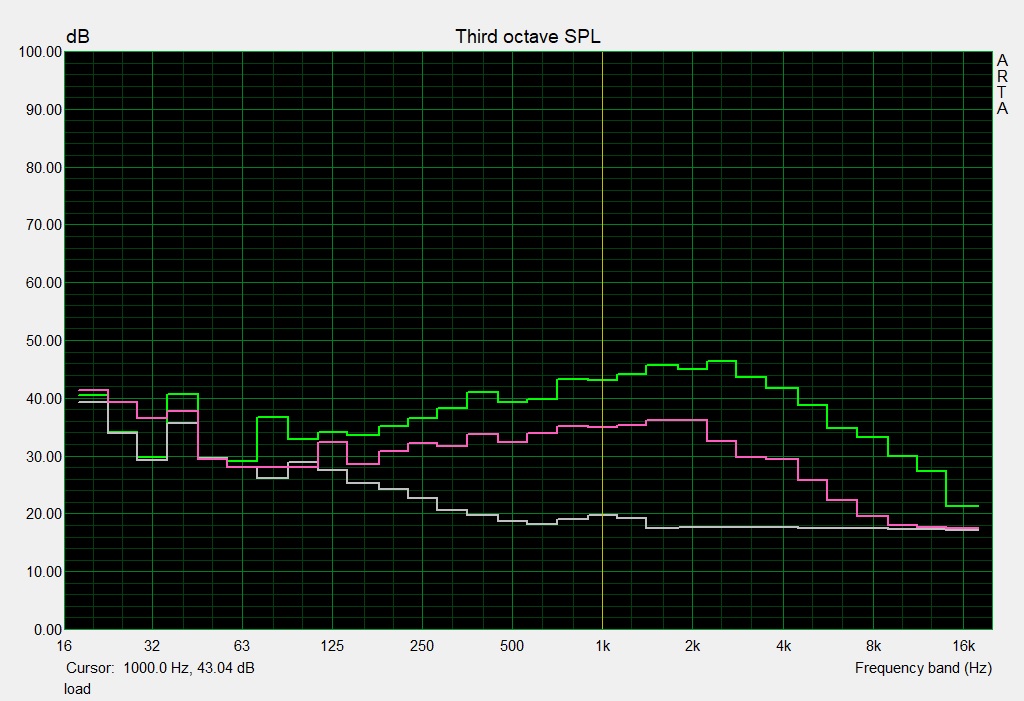
The X5 v8 is much quieter in idle mode, but 33 to 35 dB is still a noise level that is clearly audible (the value of 40 dB refers to the boot procedure). Tip: Those preferring quietness during undemanding activities should select the fan setting "Quiet" in the Command & Control tool, which turns off the fans completely (only the HDD will still be audible afterwards).
Noise level
| Idle |
| 33 / 35 / 40 dB(A) |
| HDD |
| 33 dB(A) |
| Load |
| 45 / 55 dB(A) |
 | ||
30 dB silent 40 dB(A) audible 50 dB(A) loud |
||
min: | ||
| Aorus X5 v8 GeForce GTX 1070 Mobile, i7-8850H | Gigabyte Aero 15X v8 GeForce GTX 1070 Max-Q, i7-8750H | MSI GS65 8RF-019DE Stealth Thin GeForce GTX 1070 Max-Q, i7-8750H | Asus Zephyrus M GM501 GeForce GTX 1070 Mobile, i7-8750H | Acer Predator Triton 700 GeForce GTX 1080 Max-Q, i7-7700HQ | Average of class Gaming | |
|---|---|---|---|---|---|---|
| Noise | 4% | 11% | 5% | 5% | 16% | |
| off / environment * (dB) | 30 | 29 3% | 30 -0% | 29 3% | 31 -3% | 24.1 ? 20% |
| Idle Minimum * (dB) | 33 | 30 9% | 30 9% | 30 9% | 33 -0% | 25.8 ? 22% |
| Idle Average * (dB) | 35 | 31 11% | 31 11% | 31 11% | 34 3% | 27.4 ? 22% |
| Idle Maximum * (dB) | 40 | 35 12% | 34 15% | 33 17% | 40 -0% | 29.9 ? 25% |
| Load Average * (dB) | 45 | 49 -9% | 43 4% | 49 -9% | 41 9% | 43 ? 4% |
| Witcher 3 ultra * (dB) | 50 | 51 -2% | 42 16% | 50 -0% | 43 14% | |
| Load Maximum * (dB) | 55 | 54 2% | 44 20% | 52 5% | 48 13% | 54 ? 2% |
* ... smaller is better
Temperature
The extremely slim build also takes its toll on the temperature development. During the stress test with the tools Furmark and Prime95, the CPU and GPU heated up to almost 90 °C (about 70 and 86 °C @The Witcher 3) without any throttling.
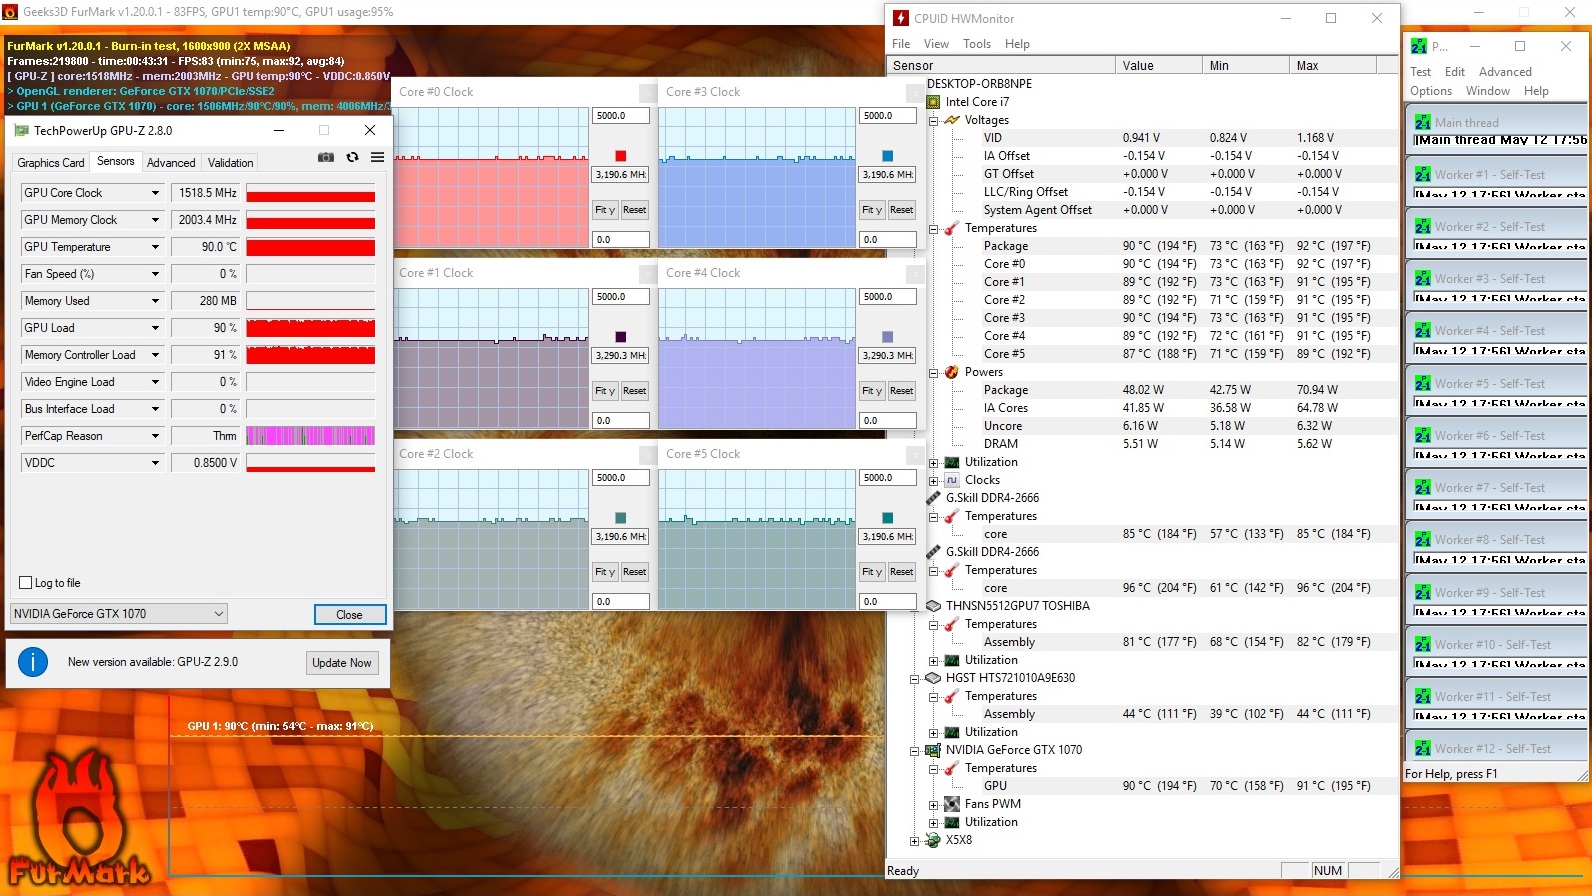
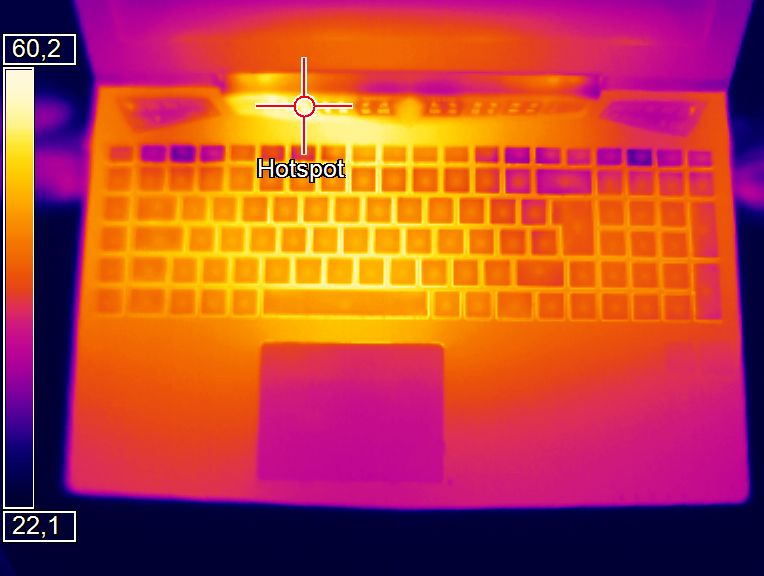
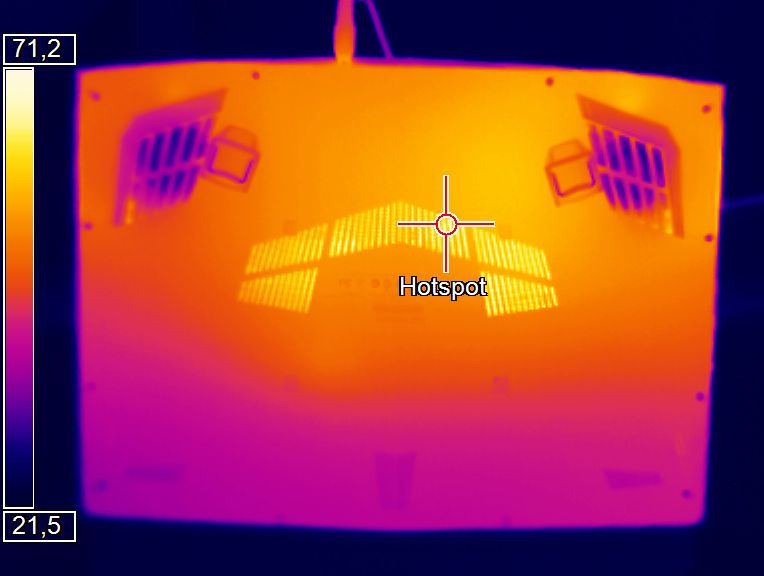
The case surface got rather warm as well. After 60 minutes of full load, the bottom of the case reached up to 62 °C, which speaks against placing the laptop on one's thighs during a gaming session. The top of the case is slightly cooler. A maximum of 47 °C in the WASD area and 42 °C near the wrist rest are far from good, but they are at least acceptable.
(-) The maximum temperature on the upper side is 50 °C / 122 F, compared to the average of 40.4 °C / 105 F, ranging from 21.2 to 68.8 °C for the class Gaming.
(-) The bottom heats up to a maximum of 62 °C / 144 F, compared to the average of 43.2 °C / 110 F
(+) In idle usage, the average temperature for the upper side is 25.2 °C / 77 F, compared to the device average of 33.9 °C / 93 F.
(-) Playing The Witcher 3, the average temperature for the upper side is 41.6 °C / 107 F, compared to the device average of 33.9 °C / 93 F.
(-) The palmrests and touchpad can get very hot to the touch with a maximum of 42 °C / 107.6 F.
(-) The average temperature of the palmrest area of similar devices was 28.8 °C / 83.8 F (-13.2 °C / -23.8 F).
| Aorus X5 v8 GeForce GTX 1070 Mobile, i7-8850H | Gigabyte Aero 15X v8 GeForce GTX 1070 Max-Q, i7-8750H | MSI GS65 8RF-019DE Stealth Thin GeForce GTX 1070 Max-Q, i7-8750H | Asus Zephyrus M GM501 GeForce GTX 1070 Mobile, i7-8750H | Acer Predator Triton 700 GeForce GTX 1080 Max-Q, i7-7700HQ | Average of class Gaming | |
|---|---|---|---|---|---|---|
| Heat | -3% | 6% | -1% | -13% | 0% | |
| Maximum Upper Side * (°C) | 50 | 53 -6% | 49 2% | 52 -4% | 61 -22% | 45.2 ? 10% |
| Maximum Bottom * (°C) | 62 | 65 -5% | 63 -2% | 49 21% | 69 -11% | 47.9 ? 23% |
| Idle Upper Side * (°C) | 27 | 26 4% | 24 11% | 31 -15% | 29 -7% | 31.1 ? -15% |
| Idle Bottom * (°C) | 29 | 30 -3% | 25 14% | 31 -7% | 32 -10% | 34.2 ? -18% |
* ... smaller is better
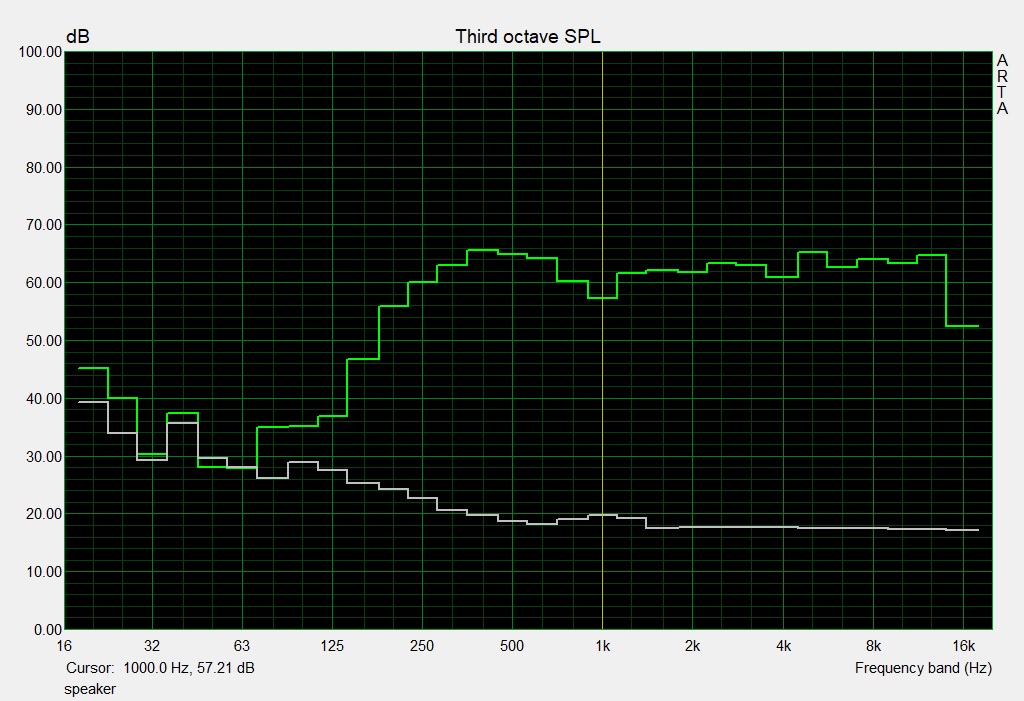
Speakers
Aorus X5 v8 audio analysis
(±) | speaker loudness is average but good (75 dB)
Bass 100 - 315 Hz
(±) | reduced bass - on average 12.8% lower than median
(±) | linearity of bass is average (10.6% delta to prev. frequency)
Mids 400 - 2000 Hz
(+) | balanced mids - only 2% away from median
(+) | mids are linear (4.7% delta to prev. frequency)
Highs 2 - 16 kHz
(+) | balanced highs - only 1.4% away from median
(+) | highs are linear (4.1% delta to prev. frequency)
Overall 100 - 16.000 Hz
(+) | overall sound is linear (13.8% difference to median)
Compared to same class
» 21% of all tested devices in this class were better, 7% similar, 72% worse
» The best had a delta of 6%, average was 18%, worst was 132%
Compared to all devices tested
» 15% of all tested devices were better, 4% similar, 81% worse
» The best had a delta of 4%, average was 24%, worst was 134%
Asus Zephyrus M GM501 audio analysis
(+) | speakers can play relatively loud (86 dB)
Bass 100 - 315 Hz
(+) | good bass - only 4.8% away from median
(±) | linearity of bass is average (8.3% delta to prev. frequency)
Mids 400 - 2000 Hz
(+) | balanced mids - only 3.2% away from median
(+) | mids are linear (3.6% delta to prev. frequency)
Highs 2 - 16 kHz
(±) | higher highs - on average 5.8% higher than median
(+) | highs are linear (6.5% delta to prev. frequency)
Overall 100 - 16.000 Hz
(+) | overall sound is linear (11.5% difference to median)
Compared to same class
» 10% of all tested devices in this class were better, 3% similar, 87% worse
» The best had a delta of 6%, average was 18%, worst was 132%
Compared to all devices tested
» 8% of all tested devices were better, 2% similar, 90% worse
» The best had a delta of 4%, average was 24%, worst was 134%
Energy Management - G-Sync vs. Optimus
Power Consumption
In comparison to other Coffee Lake gaming devices, the X5 v8 consumes a relatively high amount of power. The Asus GM501, which is equipped with comparable hardware, has a power consumption of about 16 to 26 watts in idle mode, whereas the Gigabyte laptop has a much higher consumption of 25 to 33 watts. Max-Q devices such as the Aero 15X and the MSI GS65 prove that this can be done better. At 102 to 239 watts under load, the X5 v8 is an outlier here as well and has even higher power consumption than the Acer Triton 700, which has a slightly better gaming performance and benefits from the Max-Q design of the GTX 1080 for its energy management.
| Off / Standby | |
| Idle | |
| Load |
|
Key:
min: | |
| Aorus X5 v8 GeForce GTX 1070 Mobile, i7-8850H | Gigabyte Aero 15X v8 GeForce GTX 1070 Max-Q, i7-8750H | MSI GS65 8RF-019DE Stealth Thin GeForce GTX 1070 Max-Q, i7-8750H | Asus Zephyrus M GM501 GeForce GTX 1070 Mobile, i7-8750H | Acer Predator Triton 700 GeForce GTX 1080 Max-Q, i7-7700HQ | Average of class Gaming | |
|---|---|---|---|---|---|---|
| Power Consumption | 31% | 39% | 20% | -2% | 20% | |
| Idle Minimum * (Watt) | 25 | 14 44% | 7 72% | 16 36% | 28 -12% | 13.2 ? 47% |
| Idle Average * (Watt) | 31 | 18 42% | 11 65% | 19 39% | 33 -6% | 18.9 ? 39% |
| Idle Maximum * (Watt) | 33 | 22 33% | 20 39% | 26 21% | 41 -24% | 24.3 ? 26% |
| Load Average * (Watt) | 102 | 91 11% | 98 4% | 103 -1% | 94 8% | 108.3 ? -6% |
| Witcher 3 ultra * (Watt) | 194 | 142 27% | 132 32% | 164 15% | 160 18% | |
| Load Maximum * (Watt) | 239 | 173 28% | 182 24% | 223 7% | 222 7% | 254 ? -6% |
* ... smaller is better
Battery Runtime
Gigabyte tries to make up for the lack of the graphics switching with an especially powerful battery. With 94 Wh, in line with the Aero 15x, the X5 v8 leaves behind not only the Asus GM501 (55 Wh) by far but also the Acer Triton 700 (54 Wh). Solely the MSI GS65 is able to keep up to at least some extent with 82 Wh. Due to the hefty power consumption, the runtimes are still shorter than those of the MSI laptop – with the exception of the load test. Instead of a maximum of 8.5 hours, the X5 v8 can only reach 5 hours in the idle test (more than 12 hours for the Aero 15X). For everyday operation, for example while surfing the Internet or during the playback of HD movies, the battery runtime amounts to about 3 to 4 hours.
| Aorus X5 v8 GeForce GTX 1070 Mobile, i7-8850H, 92.24 Wh | Gigabyte Aero 15X v8 GeForce GTX 1070 Max-Q, i7-8750H, 94.24 Wh | MSI GS65 8RF-019DE Stealth Thin GeForce GTX 1070 Max-Q, i7-8750H, 82 Wh | Asus Zephyrus M GM501 GeForce GTX 1070 Mobile, i7-8750H, 55 Wh | Acer Predator Triton 700 GeForce GTX 1080 Max-Q, i7-7700HQ, 54 Wh | Average of class Gaming | |
|---|---|---|---|---|---|---|
| Battery runtime | 122% | 43% | -21% | -40% | 68% | |
| Reader / Idle (h) | 4.9 | 12.7 159% | 8.5 73% | 4 -18% | 2.5 -49% | 8.71 ? 78% |
| H.264 (h) | 3.6 | 8.4 133% | 5.9 64% | 2.7 -25% | 1.8 -50% | 8.26 ? 129% |
| Load (h) | 1.5 | 2.6 73% | 1.4 -7% | 1.2 -20% | 1.2 -20% | 1.47 ? -2% |
| WiFi v1.3 (h) | 8.6 | 6 | 2.7 | 2.4 | 7.04 ? |
Verdict - Good Overall Appearance
Pros
Cons
The 2018 version of the Aorus X5 v8 is able to stand up to its rivals in most areas. Not only the rather robust metal case but also the connectivity, the input devices and the display were convincing. The 144 Hz IPS panel offers a perfect compromise between speed and image quality (keyword X-Rite Pantone).
A couple of the biggest flaws are the high temperature- and noise development, but this is an issue with a lot of slim gaming devices. Overall, we would place the X5 v8 at a level with the Asus GM501, which had very similar performance results.
The strongest rival, however, comes from the same manufacturer as the X5 v8. Those who can easily do without G-Sync in 3D applications and are fine with the loss of a few FPS might want to consider purchasing the Aero 15X instead. The 15-inch sibling is equipped with a more compact and lighter case and has a much better battery life, not to mention the lower price (2500 vs. 2700 Euros, ~$2926 vs. ~$3161).
Aorus X5 v8
- 05/15/2018 v6 (old)
Florian Glaser
Price comparison
