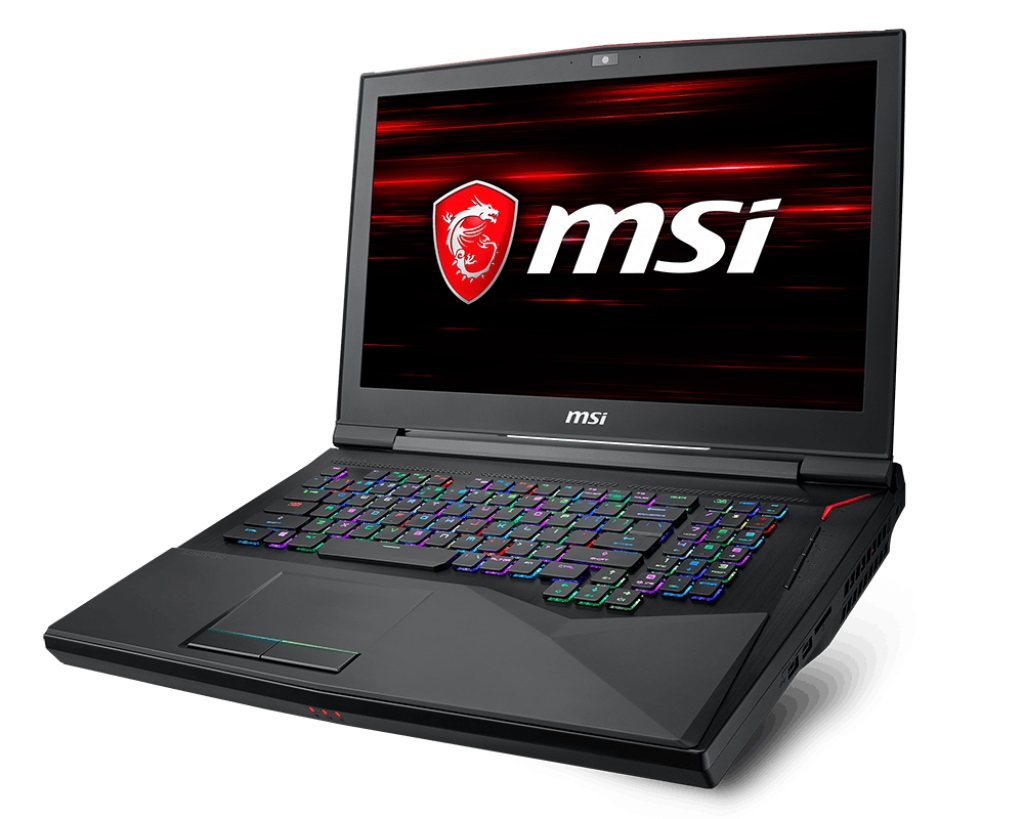
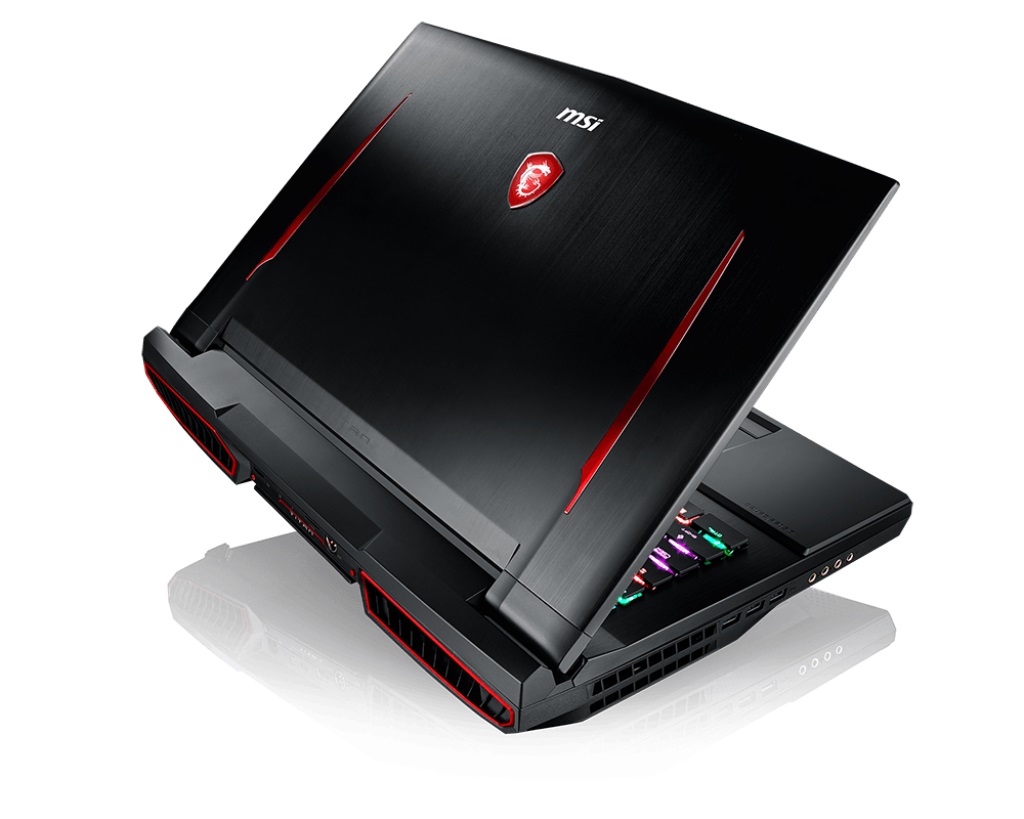
MSI GT75 8RG Titan (i9-8950HK, GTX 1080, Full-HD) Laptop Review

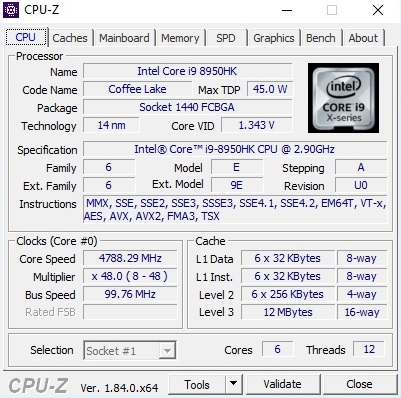
MSI’s product range not only includes compact laptops like the GS65 Stealth Thin but also thicker devices that are primarily thought of as remaining in one place. The best example apart from the 18-inch GT83 is the new 17-inch GT75, which has received a hardware update following the release of Intel’s new Coffee Lake architecture. This means that the GT75 now sports a six-core processor rather than a quad-core and comes in two flavours. There is the choice between the Core i7-8850H that clocks between 2.6-4.3 GHz with 9 MB L3 cache or the Core i9-8950HK. This has a higher base and maximum clock speed at 2.9 GHz-4.8GHz and 12 MB L3 cache. Both CPUs have unlocked multipliers.
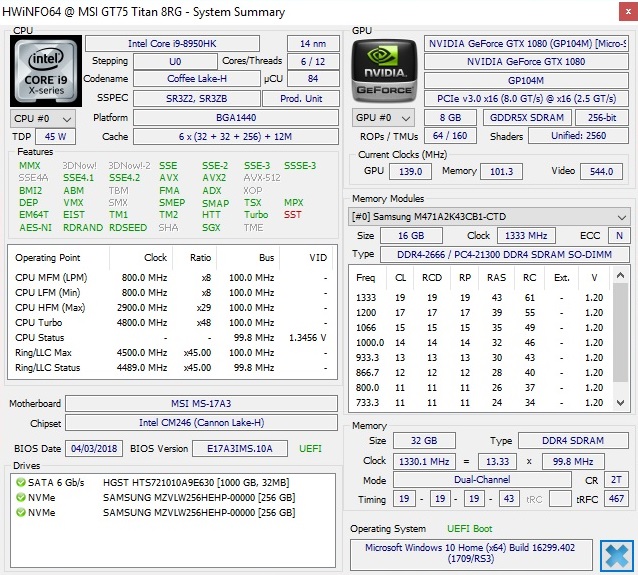
These high-end processors are complemented with 16 or 32 GB DDR4 RAM and an SSD-RAID two 128 GB and two 256 GB drives. MSI offers a choice of either a 120 Hz Full-HD panel or an IPS 4K display, both of which support G-Sync. Equally, there is a choice between two GPUs, for which MSI has distinguished with two GT75 model numbers. The GT75 8RF has a GeForce GTX 1070 onboard, while the GT75 8RG is equipped with the more powerful GeForce GTX 1080. Our review unit is based on the latter and has the specific model number GT75 8RG-090 Titan. This will be available on geizhals.de for approximately €4,200; the cheapest variant should start from €2,600.
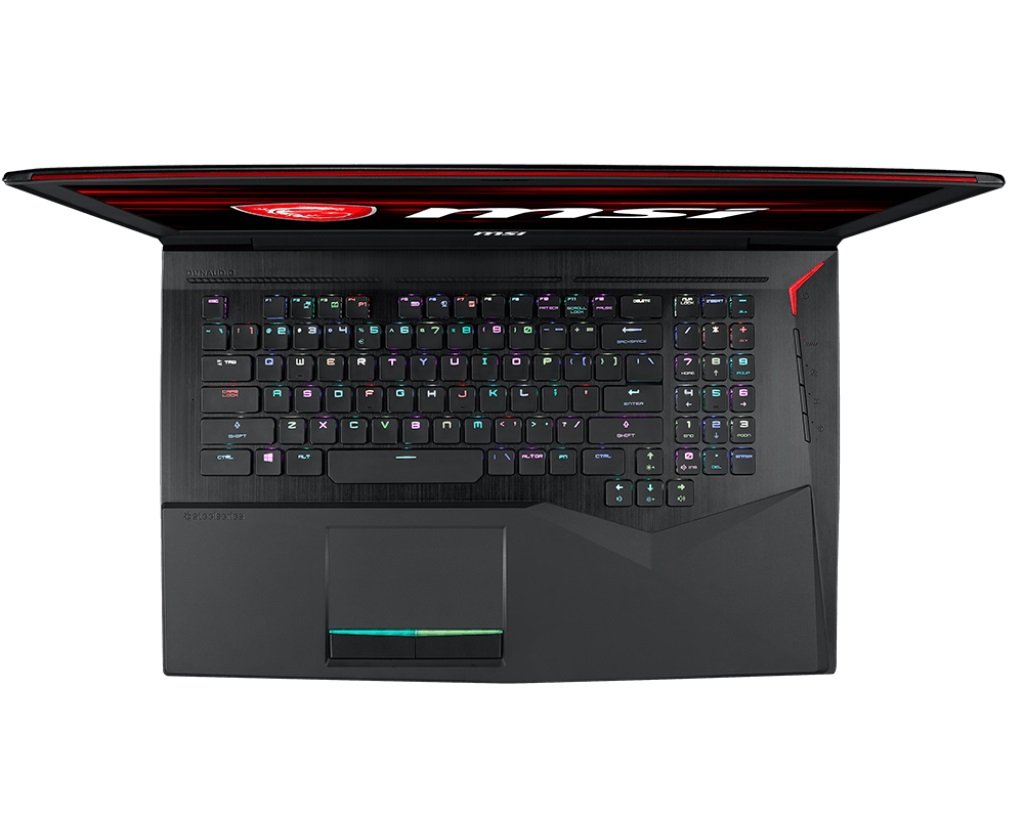
We will not be examining the case, the connectivity or the input devices in this article as they largely remain unchanged from last year’s GT75VR 7RF Titan Pro. Our views on these areas can be found in last year’s review.
The GT75 has plenty of competition. Despite recent manufacturer focus on releasing devices with more attractively priced GPUs like the GeForce GTX 1050 Ti, GTX 1060 and GTX 1070, there are now dozens of devices that are equipped with a GeForce GTX 1080. We have chosen five devices against which to compare the new GT75: The Acer Predator 17 X, the ASUS G703, the Alienware 17 R4, the HP Omen X 17, and the Aorus X9 DT. The X9 DT is currently the device to beat, what with its combination of a Core i9-8950HK processor and its small footprint.
| SD Card Reader | |
| average JPG Copy Test (av. of 3 runs) | |
| Aorus X9 DT (Toshiba Exceria Pro SDXC 64 GB UHS-II) | |
| Asus G703 (Toshiba Exceria Pro SDXC 64 GB UHS-II) | |
| Average of class Gaming (20.9 - 210, n=55, last 2 years) | |
| MSI GT75 8RG-090 Titan (Toshiba Exceria Pro SDXC 64 GB UHS-II) | |
| Acer Predator 17 X GX-792-76DL (Toshiba Exceria Pro SDXC 64 GB UHS-II) | |
| HP Omen X 17-ap0xx (Toshiba Exceria Pro SDXC 64 GB UHS-II) | |
| maximum AS SSD Seq Read Test (1GB) | |
| Aorus X9 DT (Toshiba Exceria Pro SDXC 64 GB UHS-II) | |
| Asus G703 (Toshiba Exceria Pro SDXC 64 GB UHS-II) | |
| Average of class Gaming (25.5 - 261, n=52, last 2 years) | |
| Acer Predator 17 X GX-792-76DL (Toshiba Exceria Pro SDXC 64 GB UHS-II) | |
| HP Omen X 17-ap0xx (Toshiba Exceria Pro SDXC 64 GB UHS-II) | |
| MSI GT75 8RG-090 Titan (Toshiba Exceria Pro SDXC 64 GB UHS-II) | |
Display
There are no surprises with the display. MSI uses a G-Sync capable 120 Hz panel in our review unit, like the one used in the previous GT75. This is a TN panel, presumably for the high response rates that TN panels can achieve. The model number is CMN N173HHE-G32 for reference. We measured 5.6 ms black to white response times and 8 ms for grey to grey. These are excellent values upon which none of our comparison devices can improve.
| |||||||||||||||||||||||||
Brightness Distribution: 83 %
Center on Battery: 240 cd/m²
Contrast: 1091:1 (Black: 0.22 cd/m²)
ΔE ColorChecker Calman: 2.14 | ∀{0.5-29.43 Ø4.73}
calibrated: 1.54
ΔE Greyscale Calman: 1.62 | ∀{0.09-98 Ø4.97}
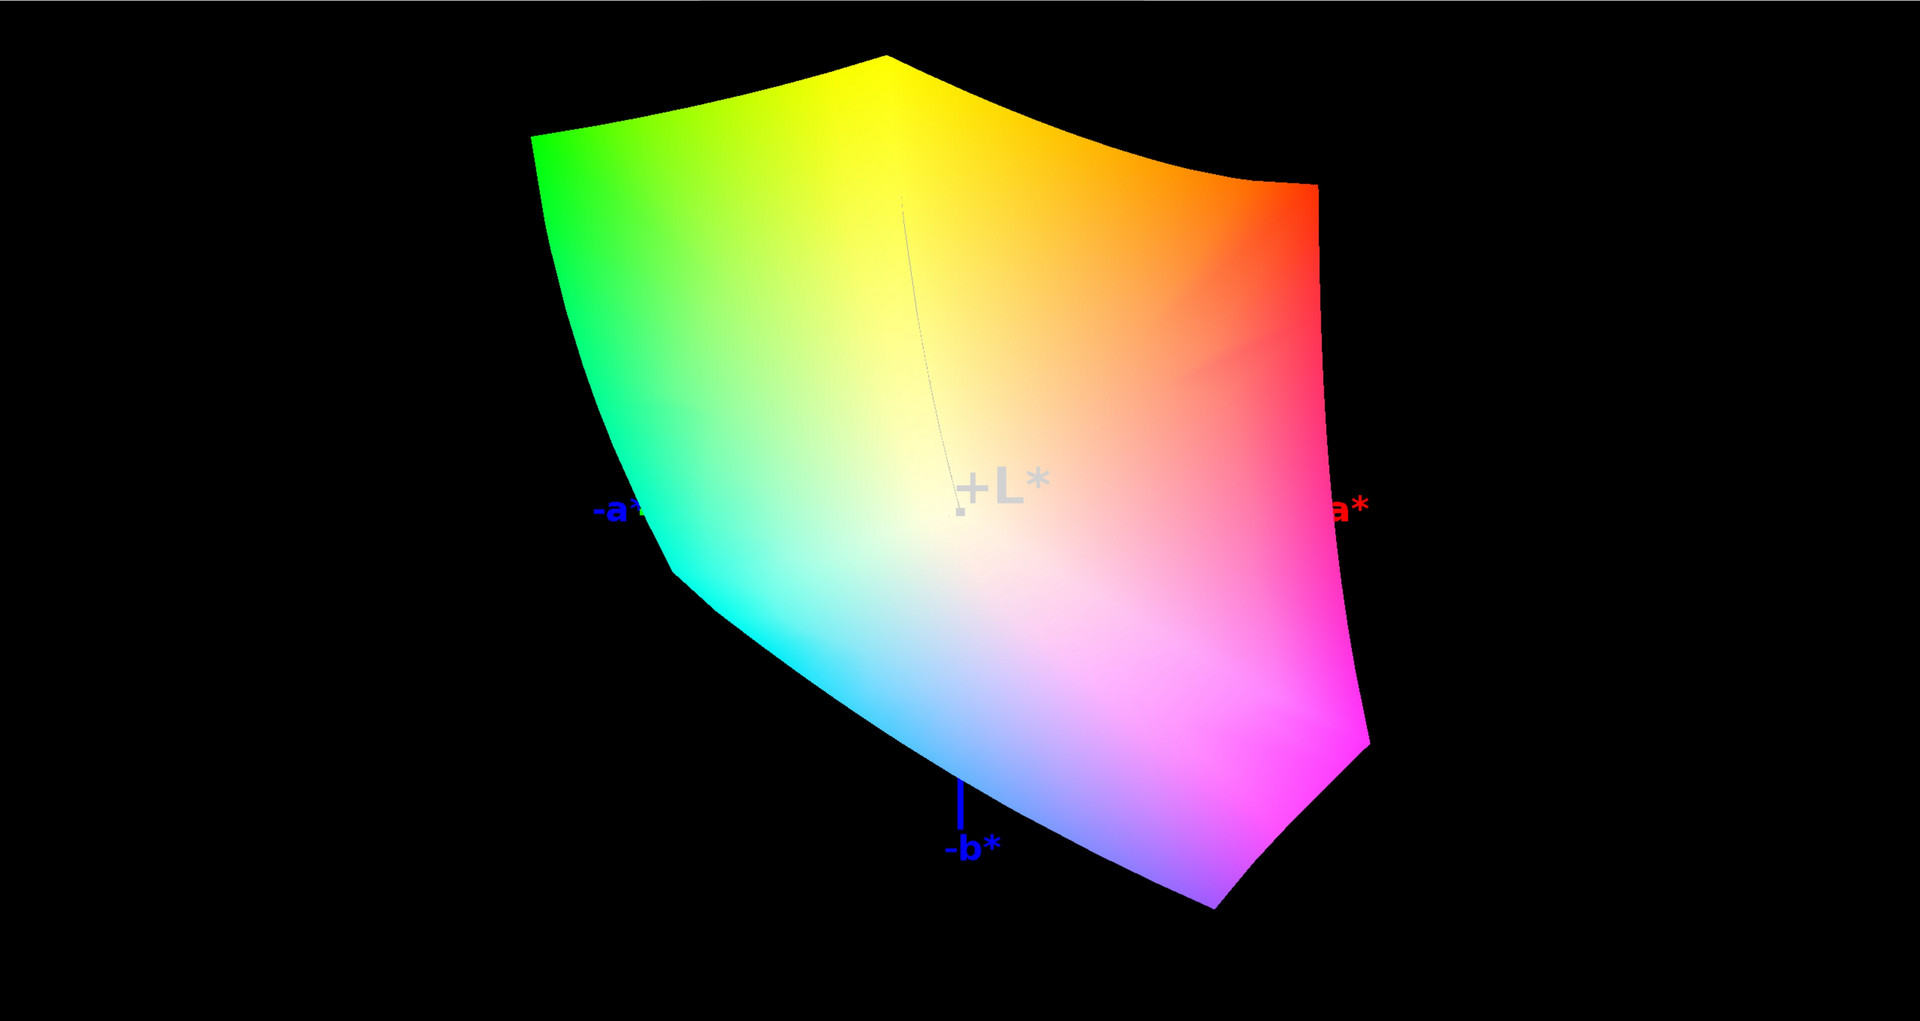
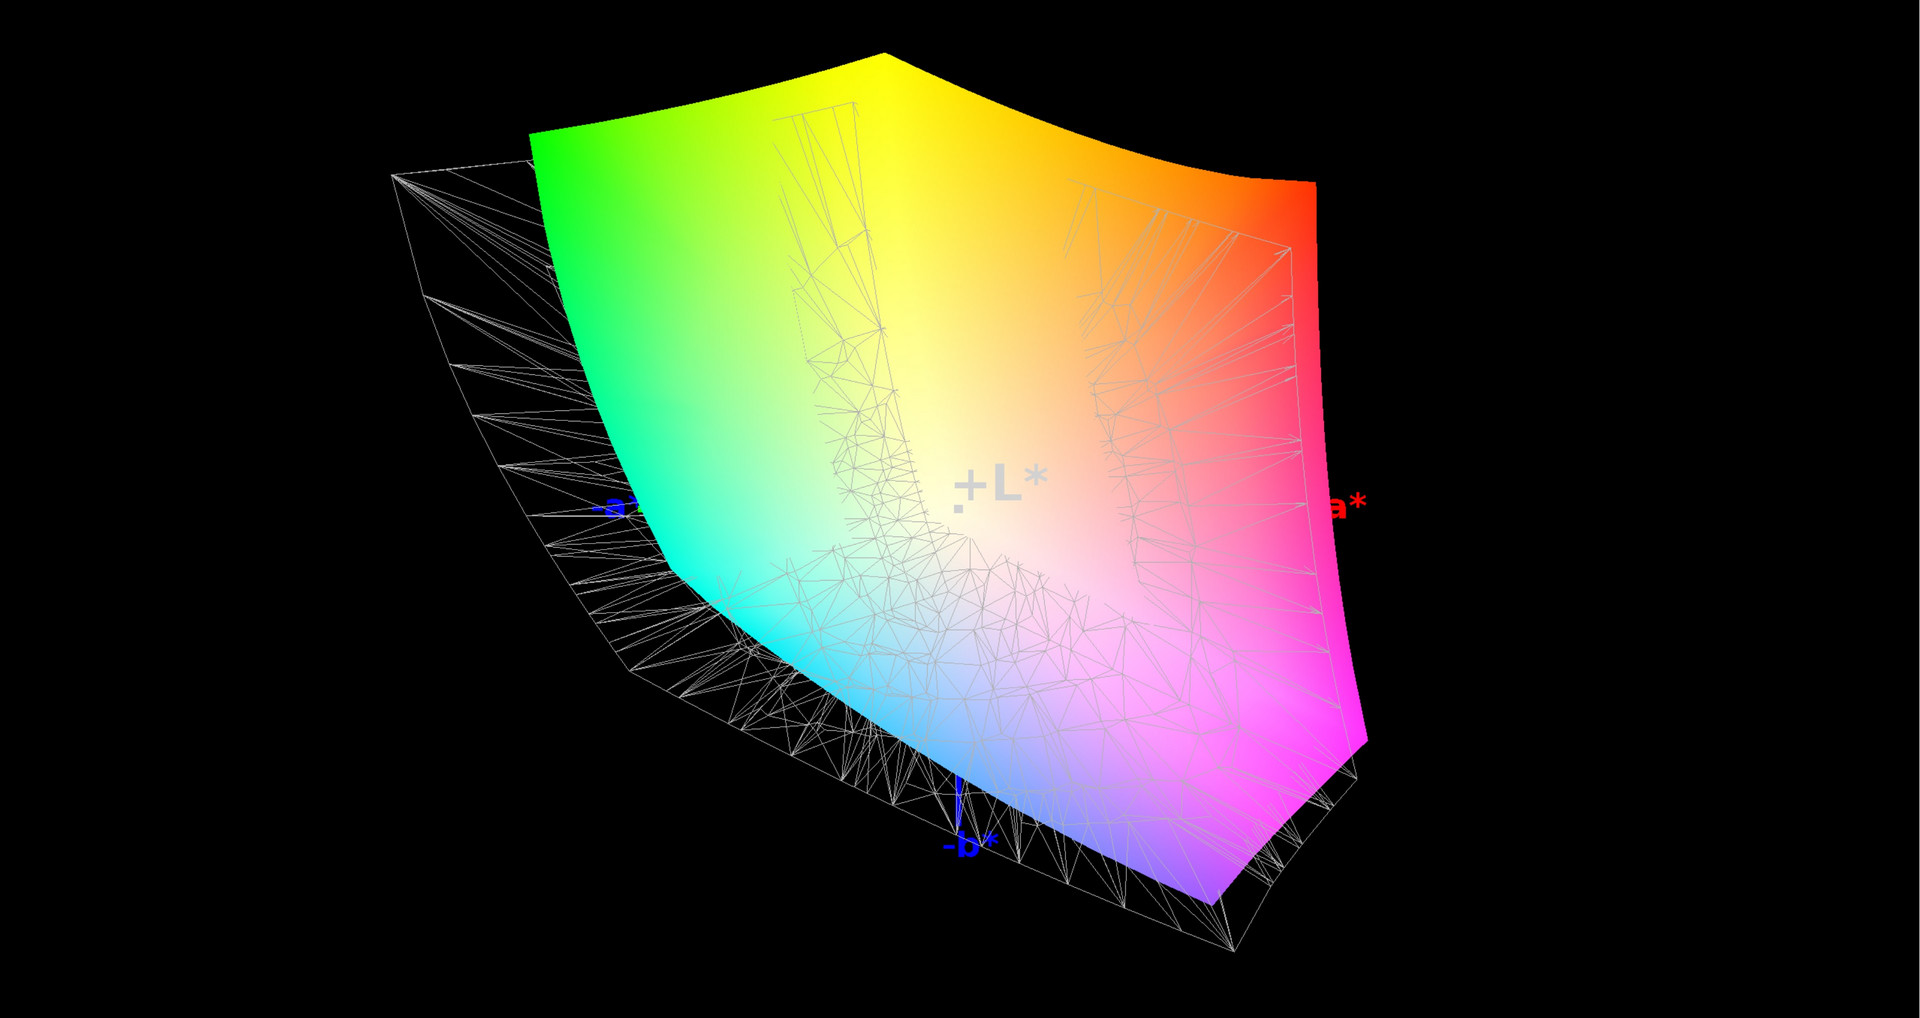
100% sRGB (Argyll 1.6.3 3D)
77% AdobeRGB 1998 (Argyll 1.6.3 3D)
86.2% AdobeRGB 1998 (Argyll 3D)
100% sRGB (Argyll 3D)
90.9% Display P3 (Argyll 3D)
Gamma: 2.28
CCT: 6846 K
| MSI GT75 8RG-090 Titan CMN N173HHE-G32 (CMN1747), TN, 1920x1080 | Aorus X9 DT AUO B173HAN03.0 (AUO309D), IPS, 1920x1080 | Asus G703 AUO B173HAN03.0 (AUO309D), IPS, 1920x1080 | Acer Predator 17 X GX-792-76DL LP173WF4-SPF5 (LGD056D), IPS, 1920x1080 | HP Omen X 17-ap0xx AU Optronics B173HW01, IPS, 1920x1080 | Alienware 17 R4 TN LED, 2560x1440 | |
|---|---|---|---|---|---|---|
| Display | -19% | -20% | -24% | -23% | -27% | |
| Display P3 Coverage (%) | 90.9 | 66.8 -27% | 65.5 -28% | 66 -27% | 63.7 -30% | 61.2 -33% |
| sRGB Coverage (%) | 100 | 92.1 -8% | 92.4 -8% | 83.7 -16% | 88.2 -12% | 82.9 -17% |
| AdobeRGB 1998 Coverage (%) | 86.2 | 67.3 -22% | 66.6 -23% | 61.2 -29% | 64.2 -26% | 60.5 -30% |
| Response Times | -122% | -110% | -432% | -457% | -202% | |
| Response Time Grey 50% / Grey 80% * (ms) | 8 ? | 18.4 ? -130% | 17.6 ? -120% | 45 ? -463% | 44 ? -450% | 30 ? -275% |
| Response Time Black / White * (ms) | 5.6 ? | 12 ? -114% | 11.2 ? -100% | 28 ? -400% | 31.6 ? -464% | 12.8 ? -129% |
| PWM Frequency (Hz) | 26000 ? | |||||
| Screen | 11% | -33% | -31% | -19% | -60% | |
| Brightness middle (cd/m²) | 240 | 280 17% | 274 14% | 380 58% | 343 43% | 402.3 68% |
| Brightness (cd/m²) | 248 | 262 6% | 268 8% | 362 46% | 332 34% | 372 50% |
| Brightness Distribution (%) | 83 | 86 4% | 80 -4% | 91 10% | 83 0% | 86 4% |
| Black Level * (cd/m²) | 0.22 | 0.22 -0% | 0.29 -32% | 0.37 -68% | 0.35 -59% | 0.62 -182% |
| Contrast (:1) | 1091 | 1273 17% | 945 -13% | 1027 -6% | 980 -10% | 649 -41% |
| Colorchecker dE 2000 * | 2.14 | 1.78 17% | 3.99 -86% | 4.12 -93% | 3.35 -57% | 5.6 -162% |
| Colorchecker dE 2000 max. * | 5.04 | 3.91 22% | 7.33 -45% | 8.19 -63% | 5.62 -12% | 9.8 -94% |
| Colorchecker dE 2000 calibrated * | 1.54 | 1.79 -16% | 2.5 -62% | |||
| Greyscale dE 2000 * | 1.62 | 0.74 54% | 4.14 -156% | 3.95 -144% | 2.4 -48% | 4.7 -190% |
| Gamma | 2.28 96% | 2.43 91% | 2.58 85% | 2.47 89% | 2.35 94% | 2.14 103% |
| CCT | 6846 95% | 6494 100% | 7352 88% | 6539 99% | 6495 100% | 7519 86% |
| Color Space (Percent of AdobeRGB 1998) (%) | 77 | 60 -22% | 60 -22% | 55 -29% | 57 -26% | 53.7 -30% |
| Color Space (Percent of sRGB) (%) | 100 | 92 -8% | 92 -8% | 84 -16% | 88 -12% | 82.2 -18% |
| Total Average (Program / Settings) | -43% /
-13% | -54% /
-40% | -162% /
-83% | -166% /
-74% | -96% /
-72% |
* ... smaller is better
The display is convincing overall, but there are exceptions. The GT75 has limited viewing angles because of its TN display and has mediocre brightness too. We measured average maximum brightness at almost 250 cd/m² in True Colour mode sRGB. The GT75 has a respectable black level and contrast ratio though, which we measured at 0.22 cd/m² and 1,100:1 respectively.
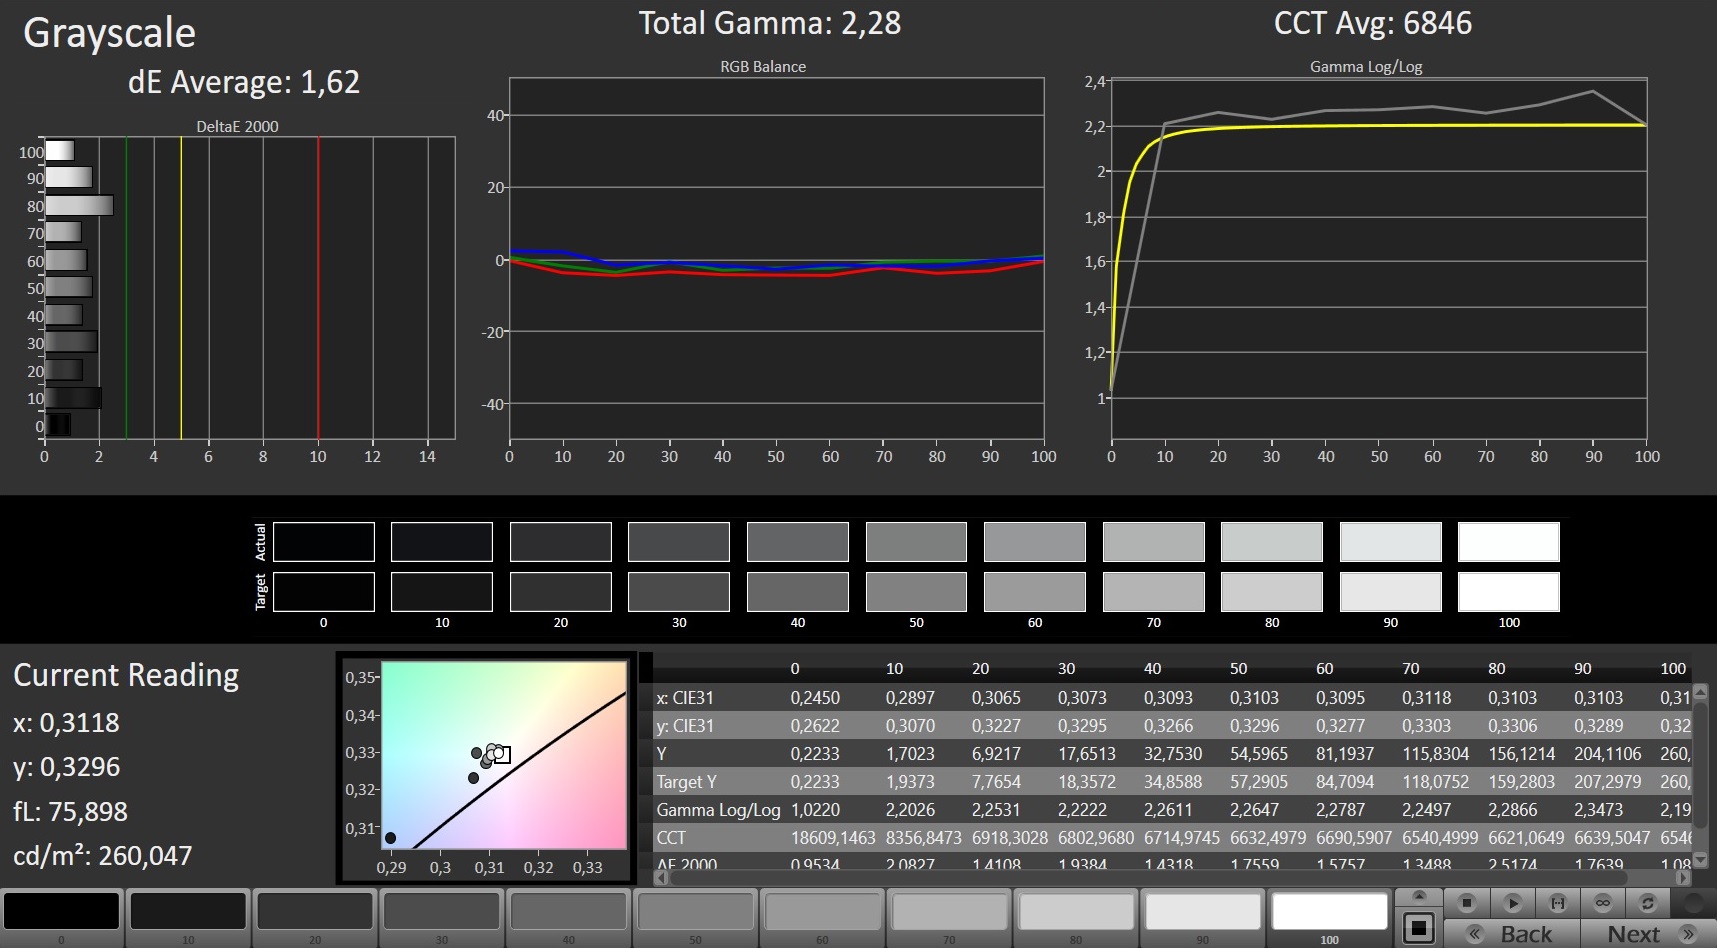
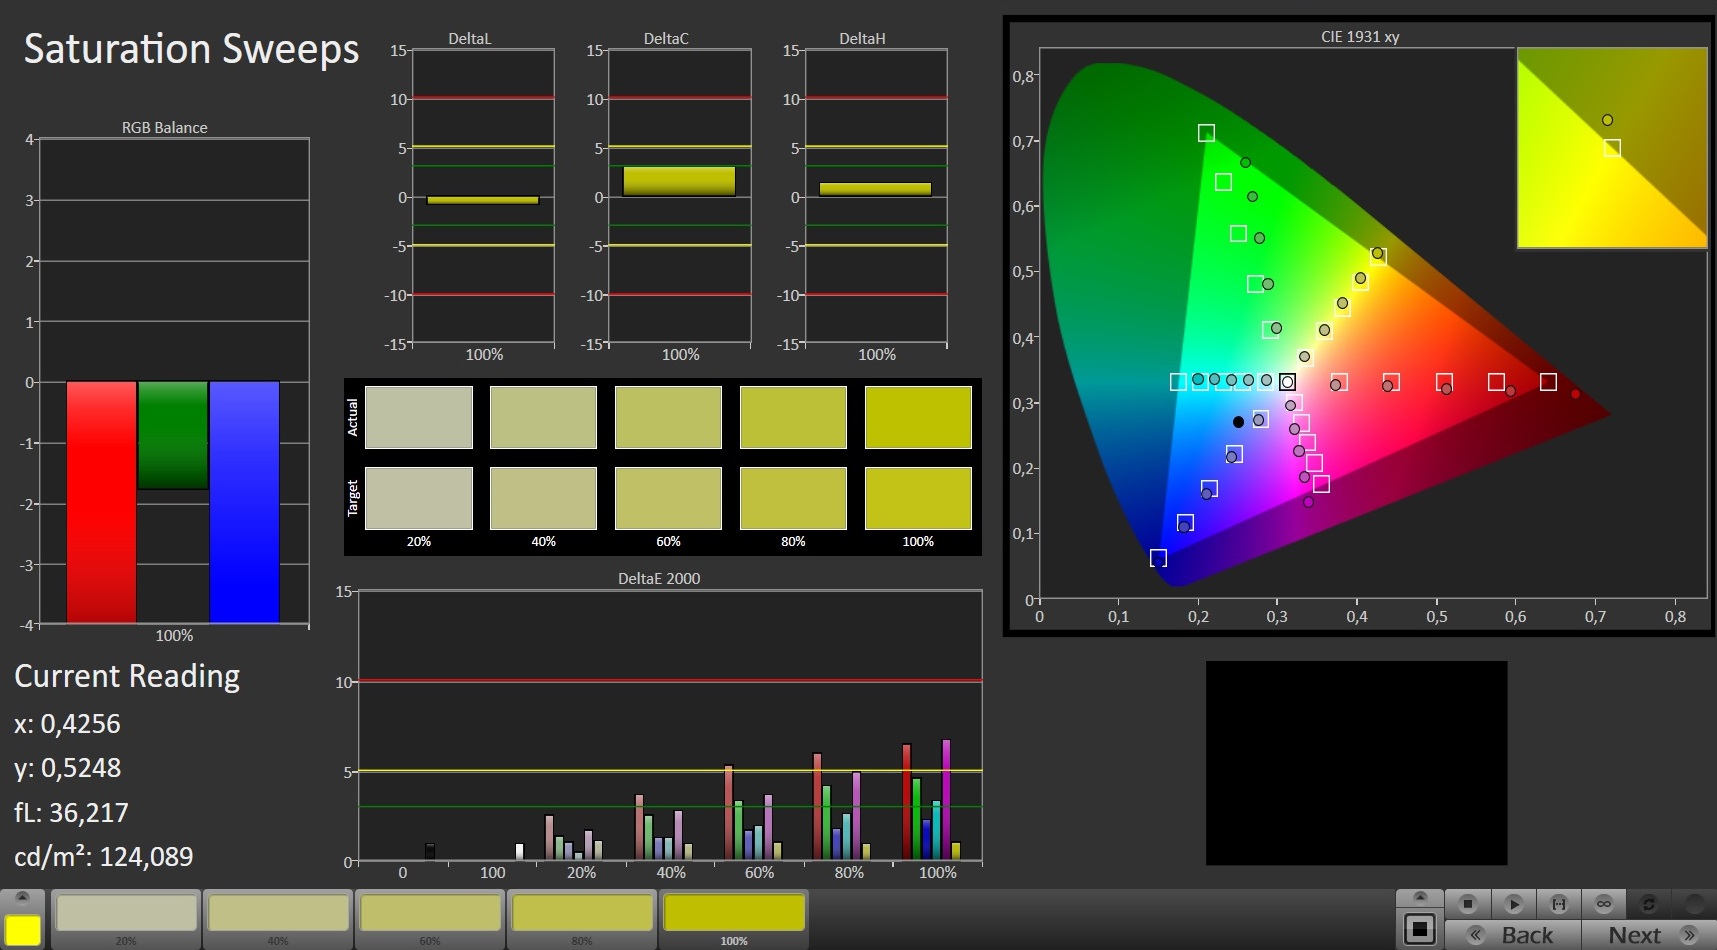
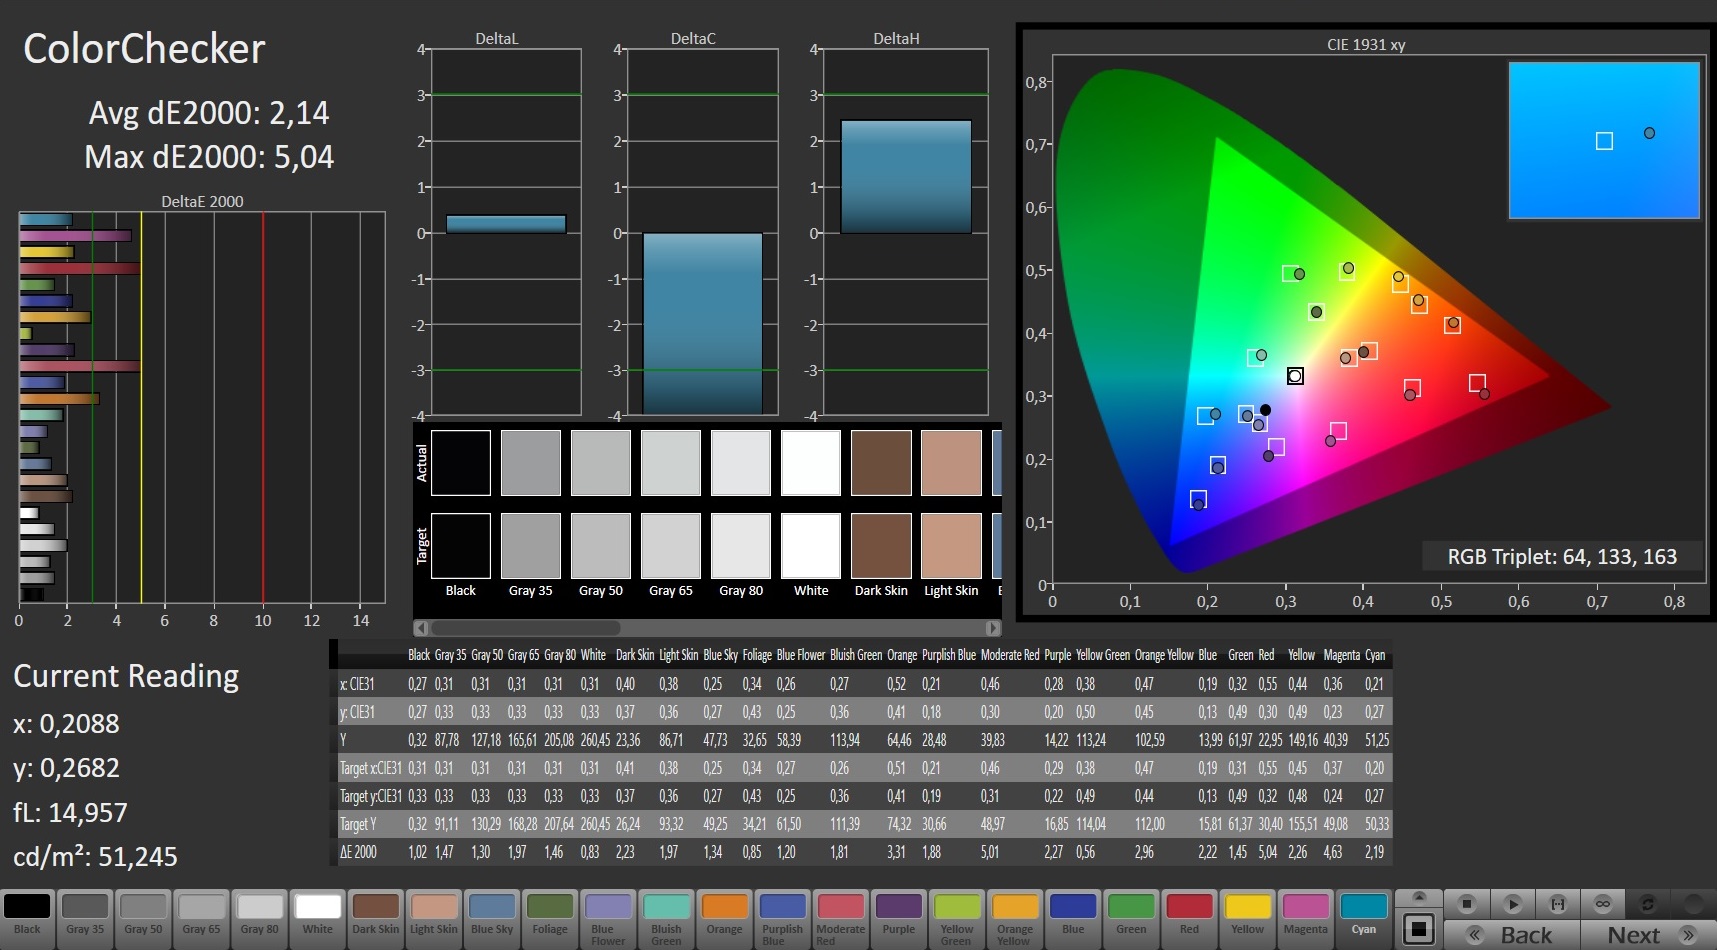
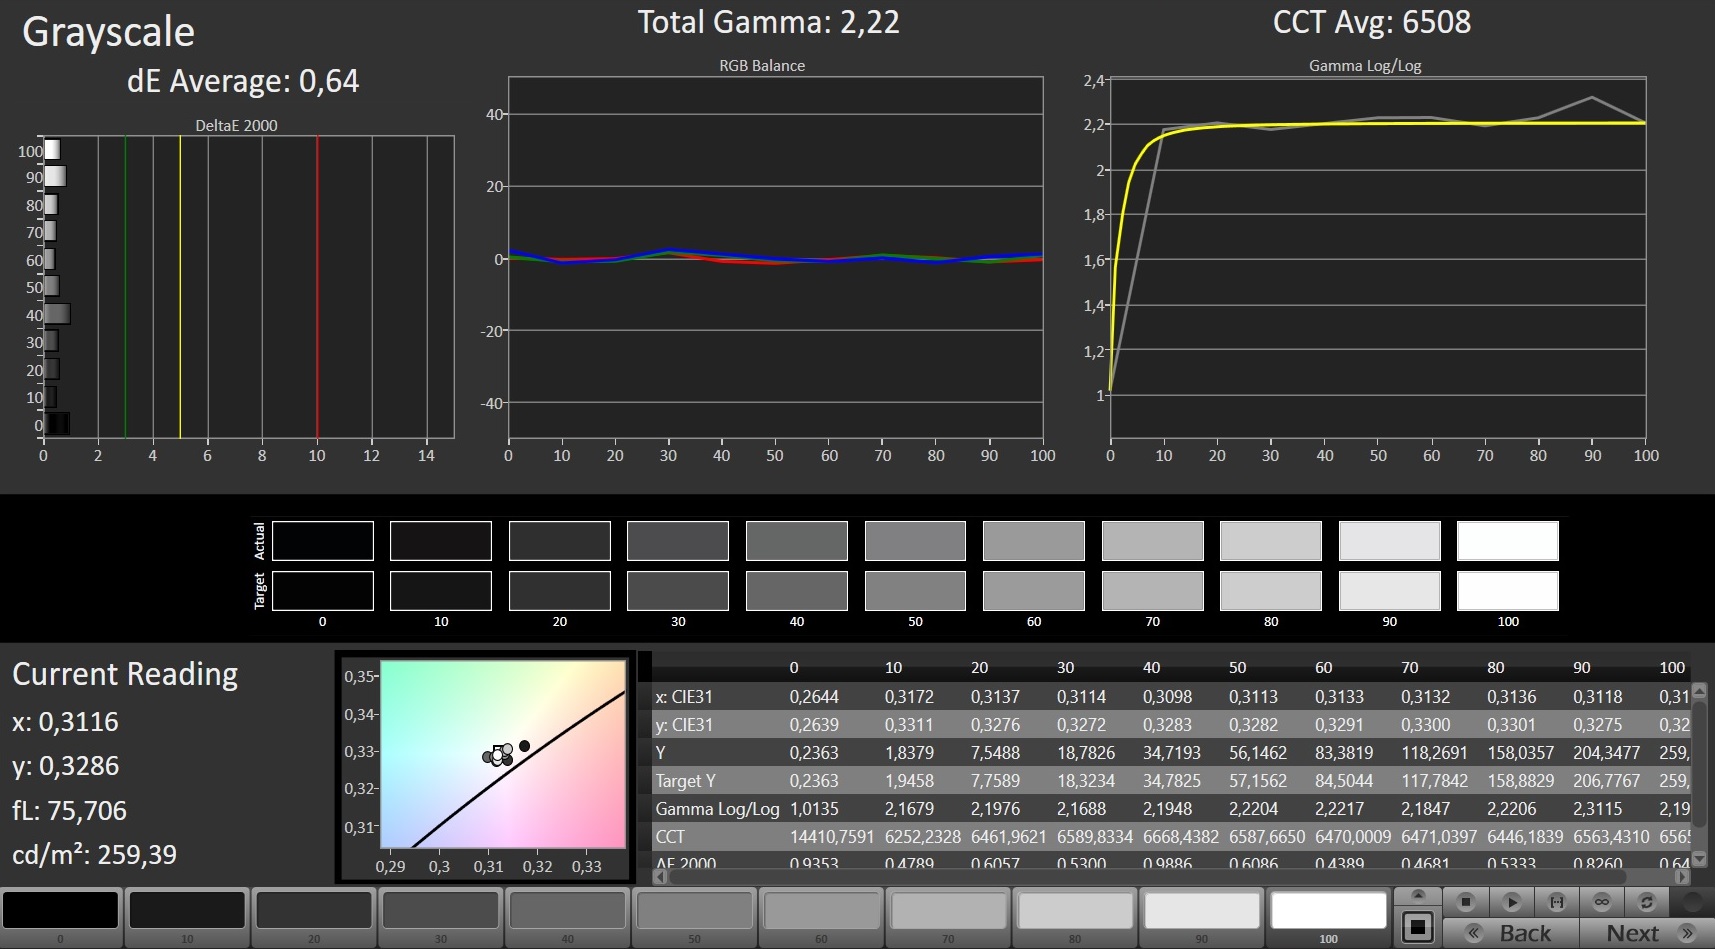
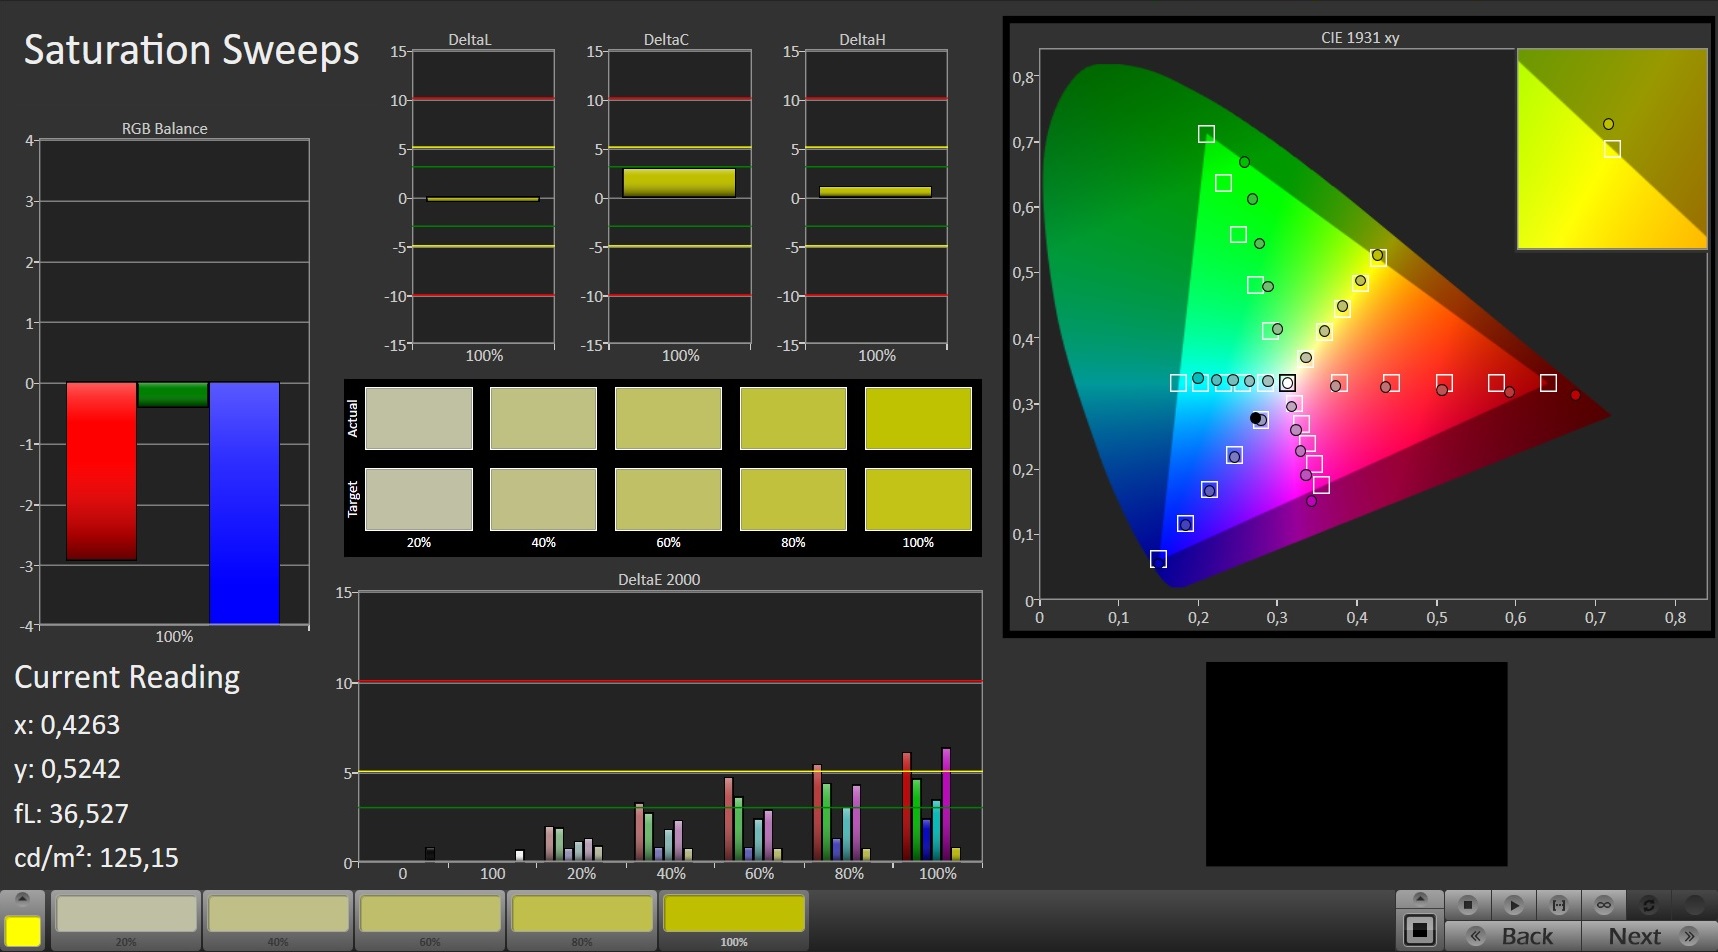
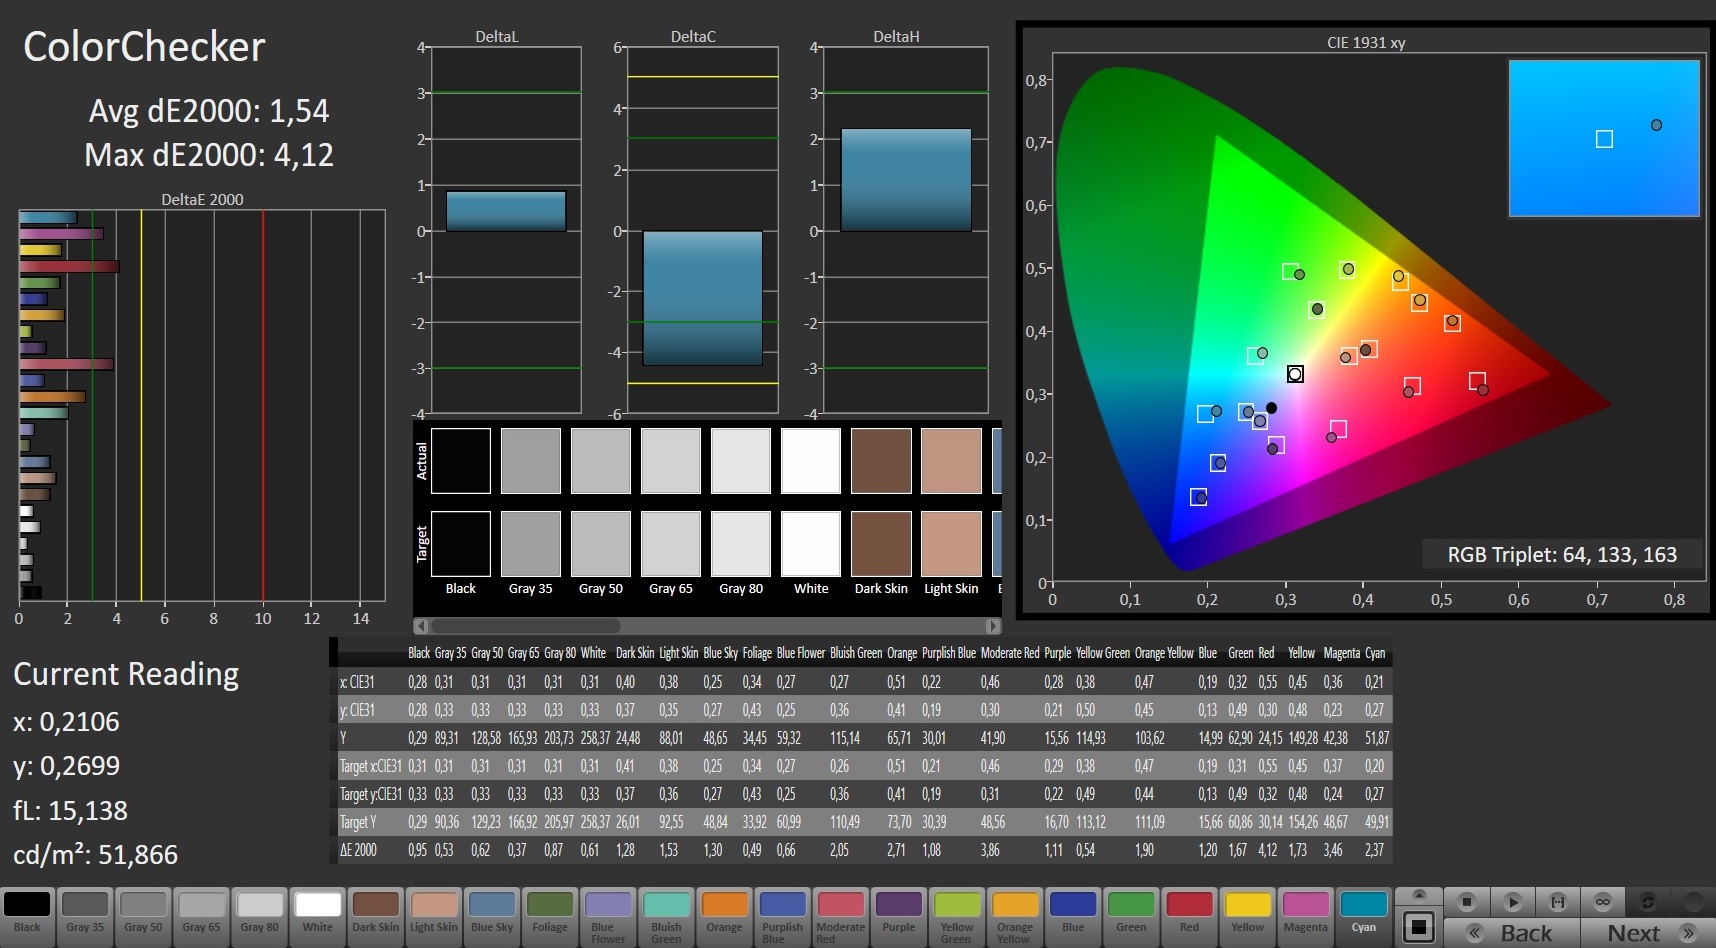
We must praise the GT75 for its impressive colour space coverage. We measured 100% sRGB and 77% AdobeRGB, values are more likely in a workstation or professional photo and video editing devices. By contrast, the Aorus X9 DT managed 60% AdobeRGB coverage.
The 120 Hz panel has decent colour accuracy out of the box, delivering a homogenous and natural picture. We saw no tangible gain in further calibrating the display.
Display Response Times
| ↔ Response Time Black to White | ||
|---|---|---|
| 5.6 ms ... rise ↗ and fall ↘ combined | ↗ 3.8 ms rise | 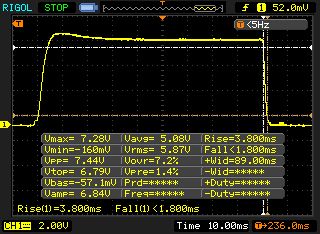 |
| ↘ 1.8 ms fall | ||
| The screen shows very fast response rates in our tests and should be very well suited for fast-paced gaming. In comparison, all tested devices range from 0.1 (minimum) to 240 (maximum) ms. » 18 % of all devices are better. This means that the measured response time is better than the average of all tested devices (19.9 ms). | ||
| ↔ Response Time 50% Grey to 80% Grey | ||
| 8 ms ... rise ↗ and fall ↘ combined | ↗ 4.4 ms rise | 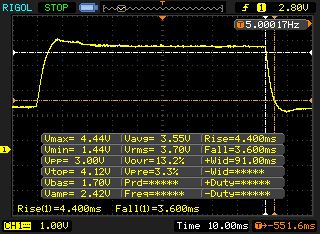 |
| ↘ 3.6 ms fall | ||
| The screen shows fast response rates in our tests and should be suited for gaming. In comparison, all tested devices range from 0.165 (minimum) to 636 (maximum) ms. » 20 % of all devices are better. This means that the measured response time is better than the average of all tested devices (31.1 ms). | ||
Screen Flickering / PWM (Pulse-Width Modulation)
| Screen flickering / PWM detected | 26000 Hz | ≤ 19 % brightness setting | 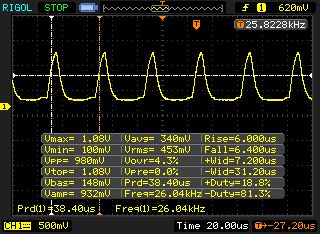 |
The display backlight flickers at 26000 Hz (worst case, e.g., utilizing PWM) Flickering detected at a brightness setting of 19 % and below. There should be no flickering or PWM above this brightness setting. The frequency of 26000 Hz is quite high, so most users sensitive to PWM should not notice any flickering. In comparison: 52 % of all tested devices do not use PWM to dim the display. If PWM was detected, an average of 7798 (minimum: 5 - maximum: 343500) Hz was measured. | |||
Performance
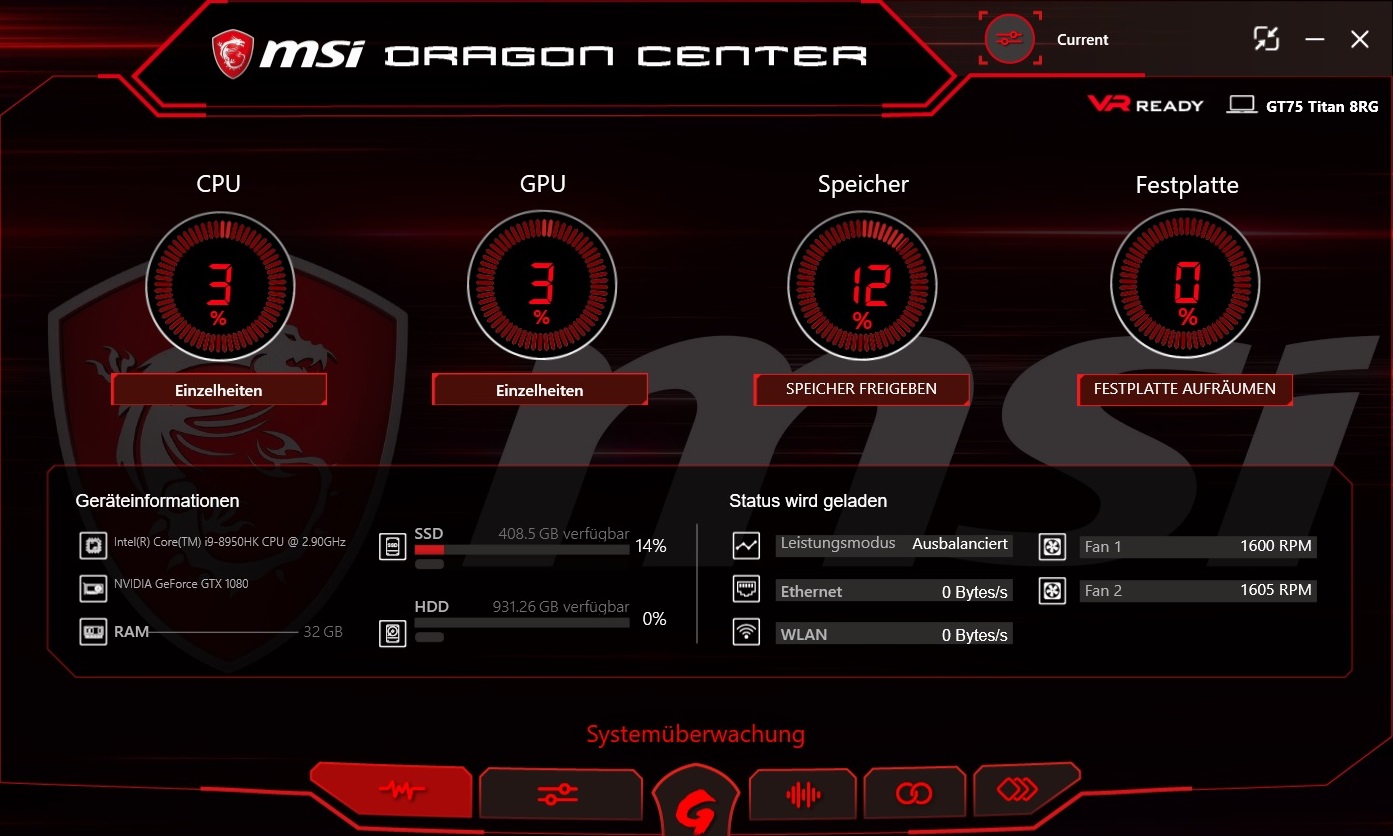
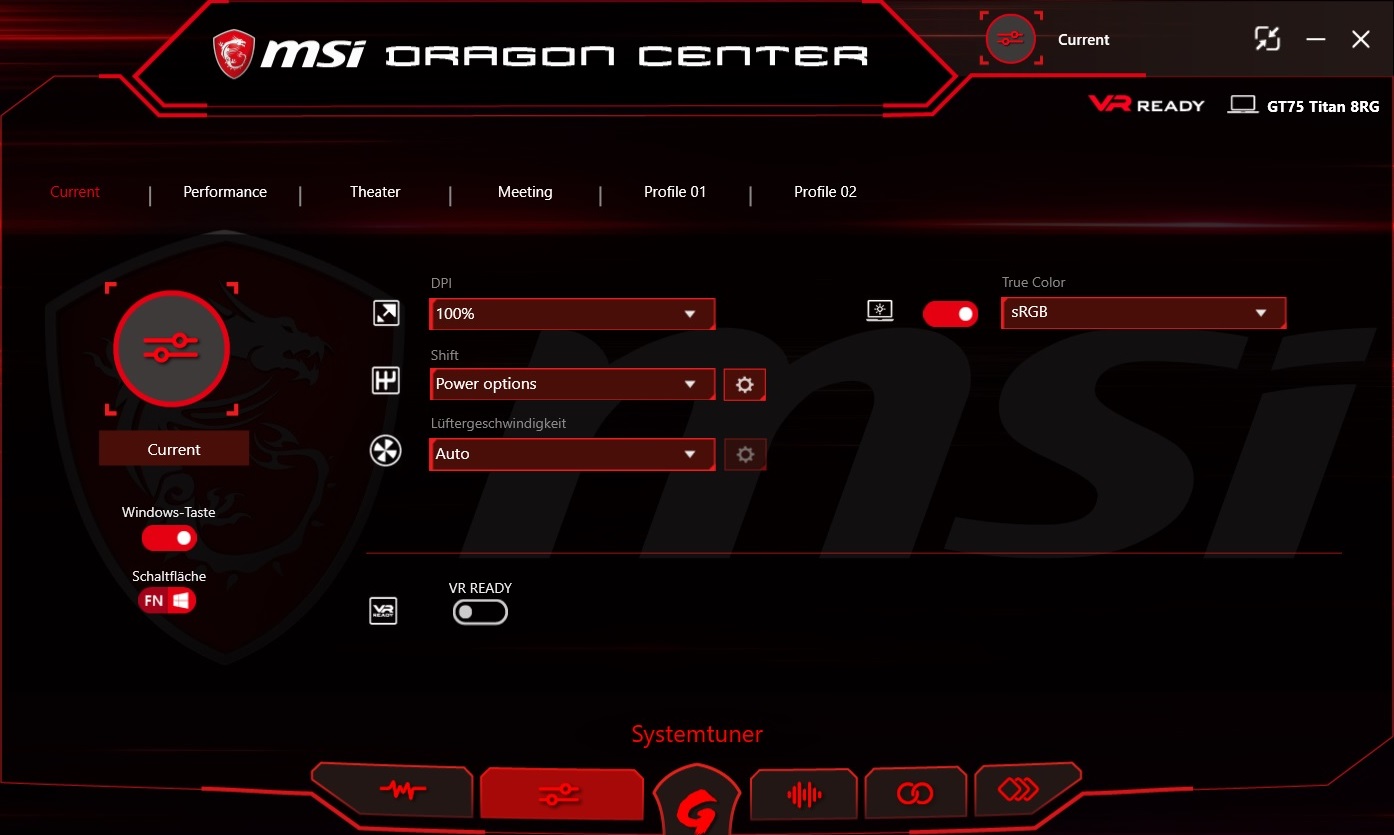
For reference, we set our review unit using the Power Options shift mode. This can be found in Dragon Center, the core software package that comes with MSI gaming notebooks. There is even full manual fan control; we set the fans to Auto for our tests, which is the default fan mode.
Processor
Our review unit is powered by an Intel Core i9-8950HK, Intel’s most powerful mobile Coffee Lake CPU. Despite having a higher clock rate than its sibling, the Core i9-8950HK has the same 45 W TDP.
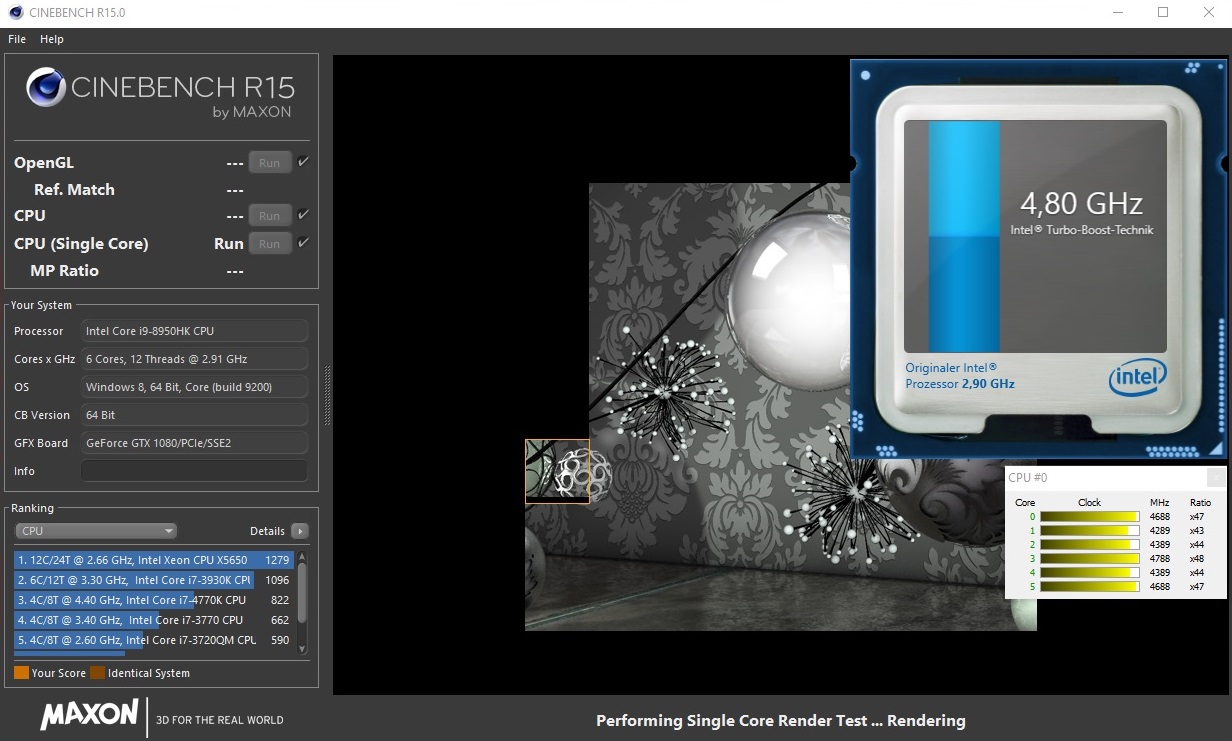
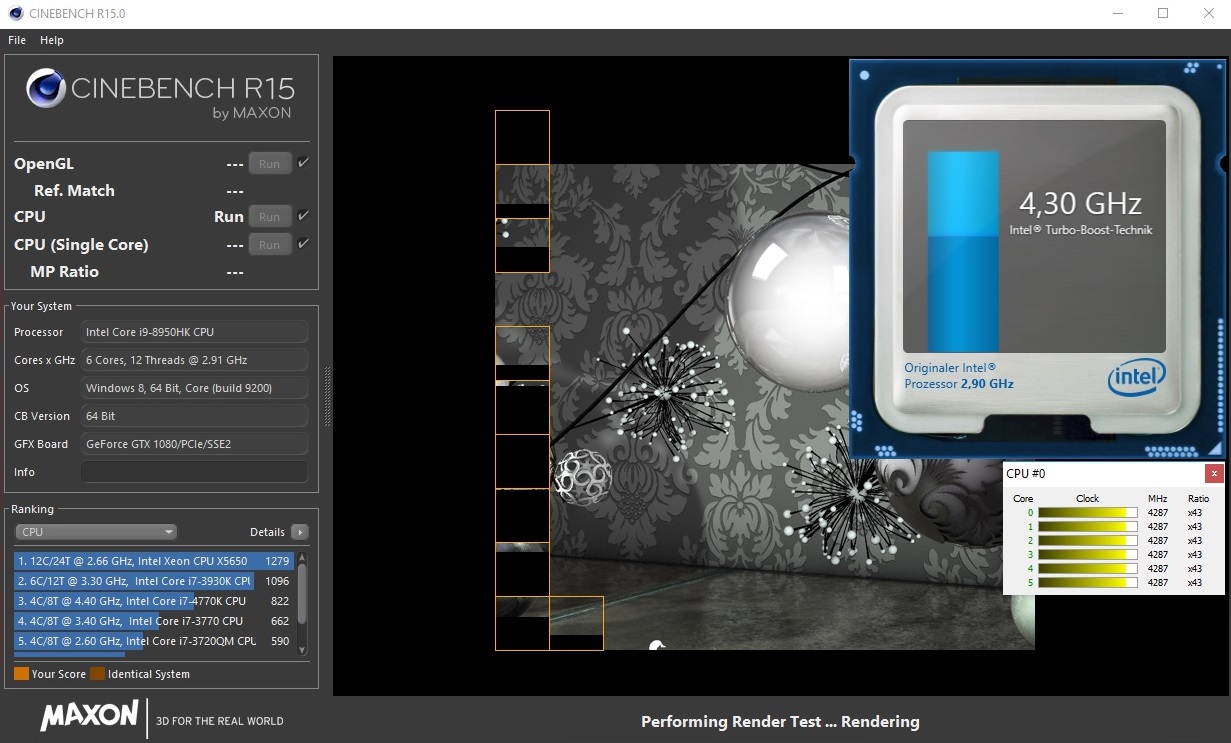
The increased number of cores results in much better performance in multi-core applications than last generation quad-core CPUs. In a Cinebench R15 multi-core benchmark the GT75 8RG scored 50-60% better than both the ASUS G703 and the Acer Predator 17 X, both of which are powered by an Intel Core i7-7820HK CPU that is overclocked to 4.3 GHz.
We tested the extent to which the Core i9-8950HK can maintain its initial performance with a thirty-minute Cinebench multi-core benchmark loop. The GT75 performed admirably, managing to maintain a relatively constant clock speed even after the 50th benchmark pass. The CPU averaged 4.3 GHz, the maximum Turbo Boost speed when working across all six cores.
System Performance
Expectedly, the GT75 8RG has extremely high system performance. This is reflected in PCMark 10 results, in which our review unit scored 6,558 points. This puts it in pole position among our comparison devices, with the Aorus X9 DT coming closest at 6,387; the remaining devices are much further behind.
| PCMark 10 - Score | |
| Average of class Gaming (5828 - 11574, n=96, last 2 years) | |
| MSI GT75 8RG-090 Titan | |
| Aorus X9 DT | |
| HP Omen X 17-ap0xx | |
| Asus G703 | |
| PCMark 8 Home Score Accelerated v2 | 5720 points | |
| PCMark 8 Work Score Accelerated v2 | 5801 points | |
| PCMark 10 Score | 6558 points | |
Help | ||
Storage Devices
One reason for the first-class system performance is the SSD-RAID. The GT75 8RG runs two Samsung PM961 256 GB M.2-2280 NVMe SSDs in RAID 0 to maximise transfer speeds. The PM961 is one of the fastest consumer drives currently available, so it is no surprise that running two of them in RAID 0 puts our review unit at the top of our storage devices benchmarks.
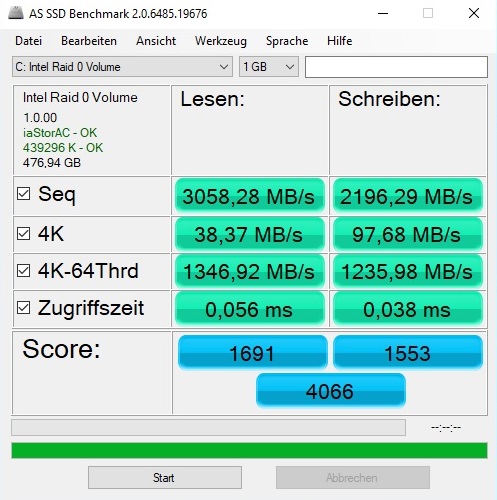
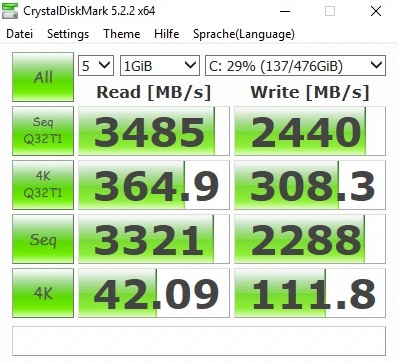
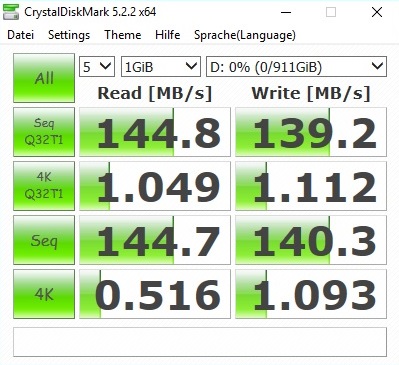
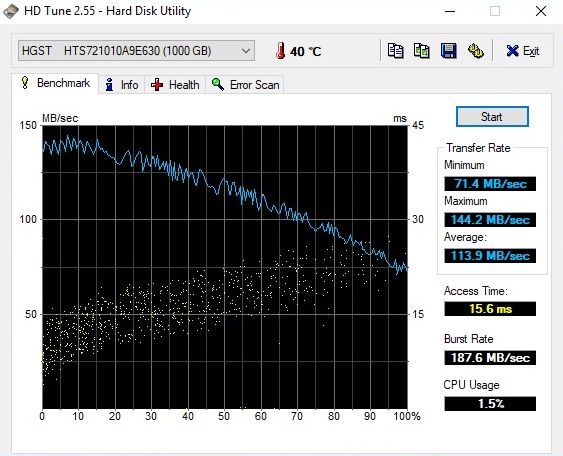
An example of the GT75 8RG’s benchmark performance is in AS SSD. This benchmark measured roughly 3,058 MB/s sequential read speeds and just under 2,196 MB/s sequential write speeds. These speeds are only beaten by the ASUS G703, that has two Samsung SM961 512 GB drives running also in RAID 0. The GT75 8RG blows notebooks with single SSDs out of the water in benchmarks and is 41% quicker on average than the Aorus X9 DT. It must be stressed that benchmarks are a measure of perceived performance and that in practice there is little noticeable difference between our comparison devices and the GT75 in this regard. If the 512 GB RAID array does not offer enough storage, then you could simply use the existing 1 TB HDD instead.
| MSI GT75 8RG-090 Titan 2x Samsung PM961 MZVLW256HEHP (RAID 0) | Aorus X9 DT Transcend TS1TMTE850 | Asus G703 2x Samsung SM961 MZVKW512HMJP NVMe (RAID 0) | Acer Predator 17 X GX-792-76DL Toshiba NVMe THNSN5512GPU7 | HP Omen X 17-ap0xx Samsung PM961 MZVLW256HEHP | Alienware 17 R4 SK Hynix PC300 NVMe 512 GB | |
|---|---|---|---|---|---|---|
| AS SSD | -41% | 13% | -19% | -18% | -35% | |
| Seq Read (MB/s) | 3058 | 1518 -50% | 3177 4% | 2261 -26% | 2352 -23% | 1752 -43% |
| Seq Write (MB/s) | 2196 | 1019 -54% | 2556 16% | 1338 -39% | 1145 -48% | 735 -67% |
| 4K Read (MB/s) | 38.37 | 22.23 -42% | 47.61 24% | 39.52 3% | 44.81 17% | 35.61 -7% |
| 4K Write (MB/s) | 97.7 | 98.9 1% | 148.4 52% | 133.8 37% | 116.2 19% | 113.4 16% |
| Score Read (Points) | 1691 | 828 -51% | 1633 -3% | 1118 -34% | 1248 -26% | 831 -51% |
| Score Write (Points) | 1553 | 916 -41% | 1519 -2% | 930 -40% | 1029 -34% | 858 -45% |
| Score Total (Points) | 4066 | 2145 -47% | 3962 -3% | 2581 -37% | 2862 -30% | 2072 -49% |

Graphics Card
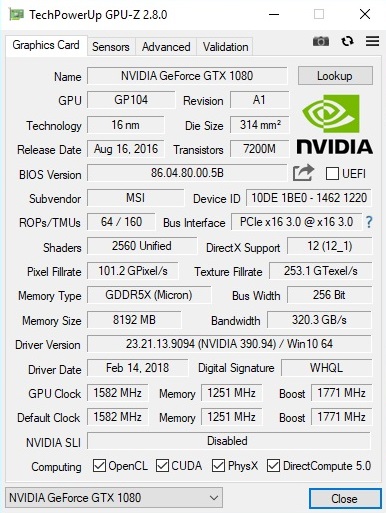
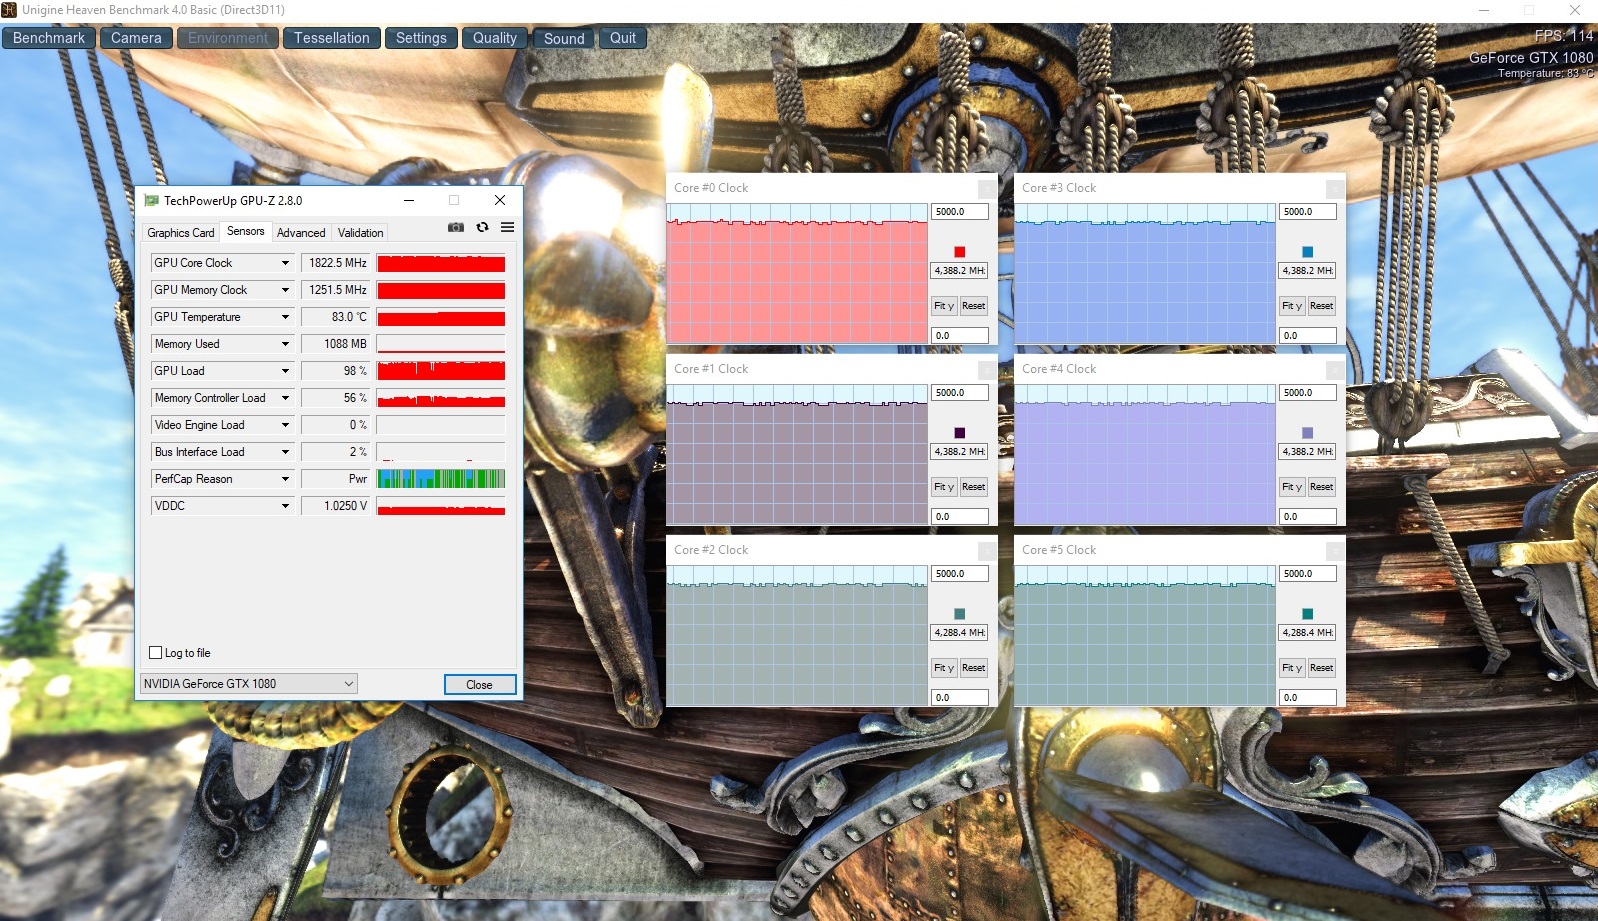
Graphics are handled by the NVIDIA GeForce GTX 1080, currently NVIDIA’s king of mobile GPUs. The DirectX 12 chip contains 2,560 shaders, 8 GB GDDR5X VRAM, and has a base clock of 1,582 MHz that can boost up to 1,911 MHz.
The automatic overclocking worked wonderfully in our review unit. After around an hour of The Witcher 3 in Full HD at Ultra settings, the GPU still clocked at 1,835 MHz. This matches the performance of most other GTX 1080 laptops in our tests, hence why the GT75 does not stand out from the crowd here. MSI still deserves credit for designing the GT75 well enough to get that level of performance out of the GTX 1080 as not all our comparison devices manage to do this.
| 3DMark - 1920x1080 Fire Strike Graphics | |
| Average of class Gaming (12242 - 62849, n=121, last 2 years) | |
| Acer Predator 17 X GX-792-76DL | |
| Aorus X9 DT | |
| Asus G703 | |
| Alienware 17 R4 | |
| MSI GT75 8RG-090 Titan | |
| HP Omen X 17-ap0xx | |
While the GTX 1080 is a fantastic GPU, the difference in price between the GTX 1070 equipped GT75 8RF and the GT75 8RG comes down to personal preference. In our opinion, a GTX 1070 would be sufficient in most applications and games when paired with a Full HD display.
| 3DMark 11 Performance | 23175 points | |
| 3DMark Ice Storm Standard Score | 193287 points | |
| 3DMark Cloud Gate Standard Score | 42660 points | |
| 3DMark Fire Strike Score | 18738 points | |
Help | ||
Gaming Performance
Thanks to the exquisite performance, even graphically intensive games like Star Wars Battlefront 2 make benefit from the 120 Hz refresh rate. Four out of the six games tested hit over 100 FPS at maximum details.
| The Witcher 3 - 1920x1080 Ultra Graphics & Postprocessing (HBAO+) | |
| Average of class Gaming (95 - 240, n=8, last 2 years) | |
| Alienware 17 R4 | |
| Asus G703 | |
| Aorus X9 DT | |
| MSI GT75 8RG-090 Titan | |
| Acer Predator 17 X GX-792-76DL | |
| HP Omen X 17-ap0xx | |
The GT75 would also be suitable for gaming on an external WQHD monitor. The GTX 1080 reaches its performance limit at 4K/UHD, which is a resolution of 3,840 x 2,160.
| low | med. | high | ultra | |
|---|---|---|---|---|
| The Witcher 3 (2015) | 148 | 76.8 | ||
| Ghost Recon Wildlands (2017) | 110 | 60.5 | ||
| FIFA 18 (2017) | 427 | 418 | ||
| Need for Speed Payback (2017) | 145 | 141 | ||
| Star Wars Battlefront 2 (2017) | 139 | 121 | ||
| Far Cry 5 (2018) | 120 | 113 |
Emissions
Fan Noise
Fan noise is unfortunately as loud as performance is high. While the upgrade to a hexa-core processor has not worsened this, the GT75 remains just as loud as its extremely loud predecessor. 43-62 dB(A) under load is loud even for a high-end gaming notebook. We would have thought that the GT75 would run quieter given its thickness and weight; it is one of the largest devices in its class.
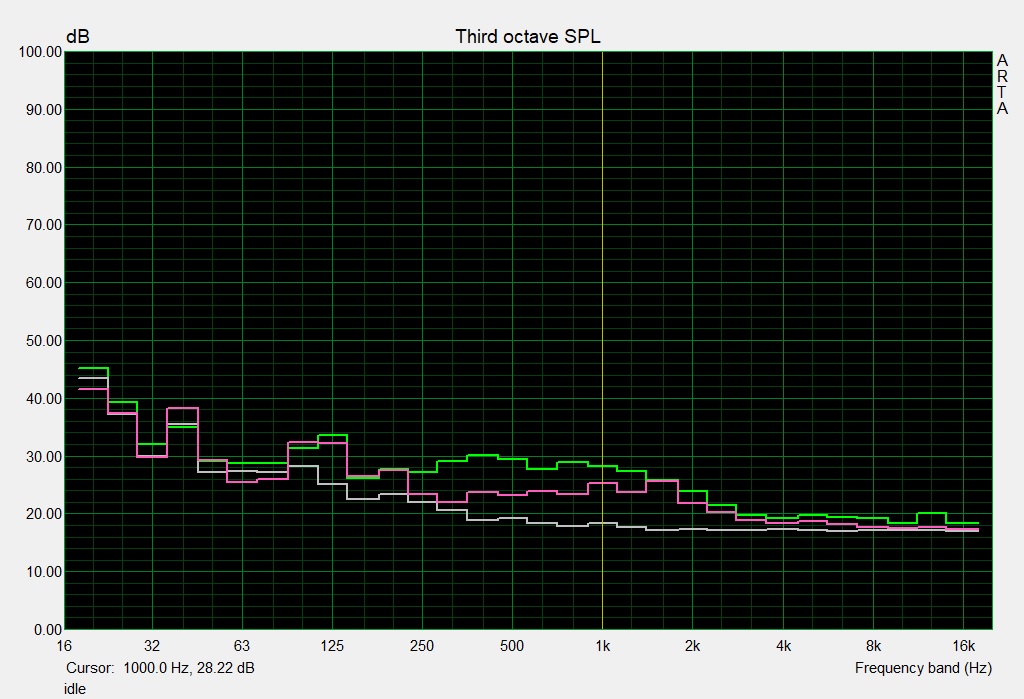
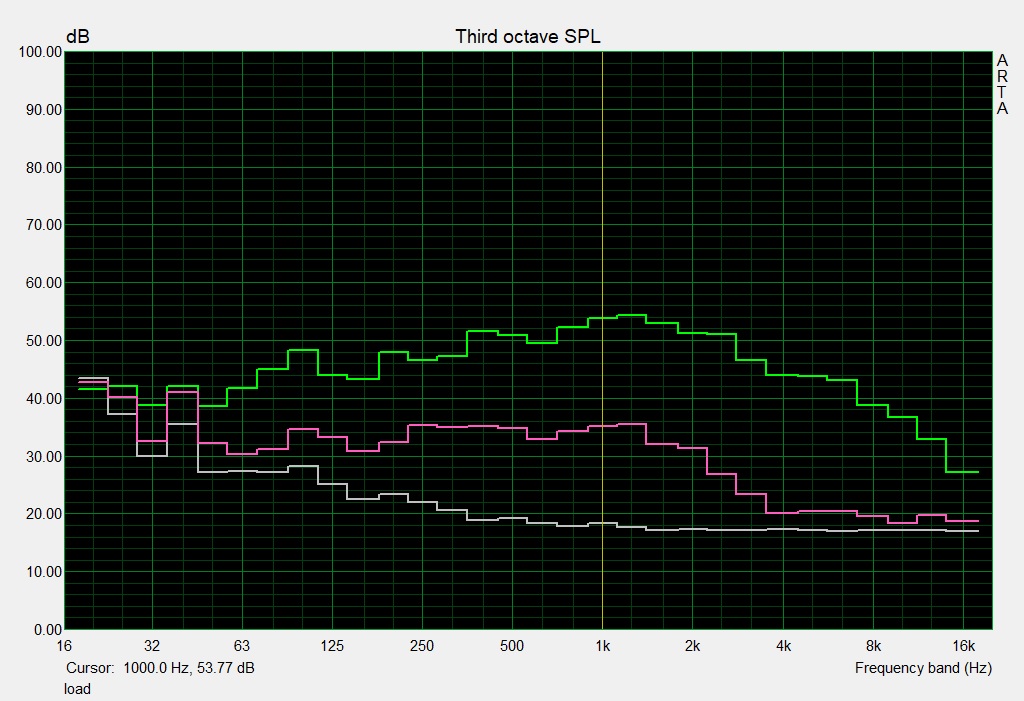
Gaming sessions are only enjoyable with headphones. The fan noise is so loud that we would recommend sound sensitive users to look for an alternative device. The Acer Predator 17 X is the device of our GTX 1080 equipped comparison devices.
Noise level
| Idle |
| 32 / 34 / 37 dB(A) |
| HDD |
| 34 dB(A) |
| Load |
| 43 / 62 dB(A) |
 | ||
30 dB silent 40 dB(A) audible 50 dB(A) loud |
||
min: | ||
| MSI GT75 8RG-090 Titan i9-8950HK, GeForce GTX 1080 Mobile | Aorus X9 DT i9-8950HK, GeForce GTX 1080 Mobile | Asus G703 i7-7820HK, GeForce GTX 1080 Mobile | Acer Predator 17 X GX-792-76DL i7-7820HK, GeForce GTX 1080 Mobile | HP Omen X 17-ap0xx i7-7820HK, GeForce GTX 1080 Mobile | Alienware 17 R4 i7-7820HK, GeForce GTX 1080 Mobile | |
|---|---|---|---|---|---|---|
| Noise | -7% | 1% | 3% | 11% | 1% | |
| off / environment * (dB) | 30 | 30 -0% | 30 -0% | 30 -0% | 28.3 6% | 28.2 6% |
| Idle Minimum * (dB) | 32 | 36 -13% | 35 -9% | 33 -3% | 31.5 2% | 35.6 -11% |
| Idle Average * (dB) | 34 | 37 -9% | 36 -6% | 35 -3% | 31.6 7% | 35.6 -5% |
| Idle Maximum * (dB) | 37 | 43 -16% | 38 -3% | 37 -0% | 31.6 15% | 35.7 4% |
| Load Average * (dB) | 43 | 50 -16% | 46 -7% | 40 7% | 36.8 14% | 50.2 -17% |
| Witcher 3 ultra * (dB) | 57 | 57 -0% | 48 16% | 48.2 15% | 50.2 12% | |
| Load Maximum * (dB) | 62 | 61 2% | 54 13% | 50 19% | 52.1 16% | 50.2 19% |
* ... smaller is better
Temperature
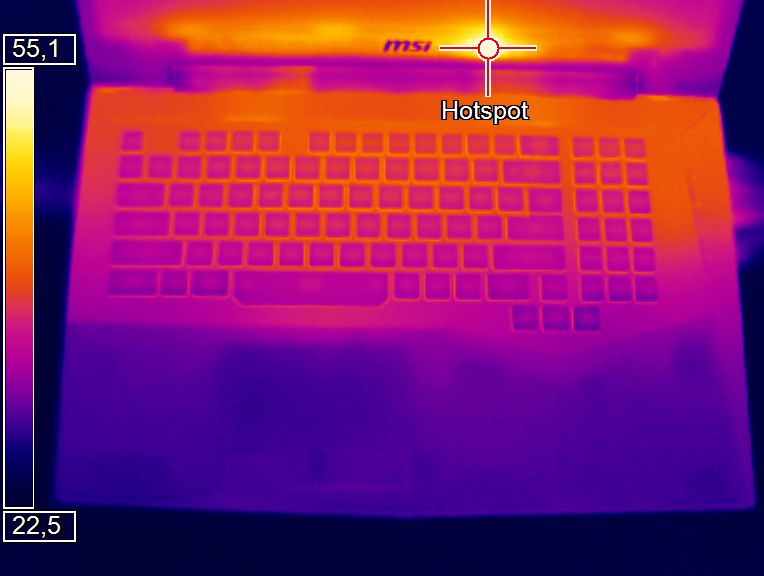
While the fan noise is a cause for criticism, and one which drops the GT75 below a “very good” emissions score, surface temperatures are pleasingly moderate. The keyboard and palm rest remain relatively cool under load, which makes extended gaming sessions reasonably pleasant.
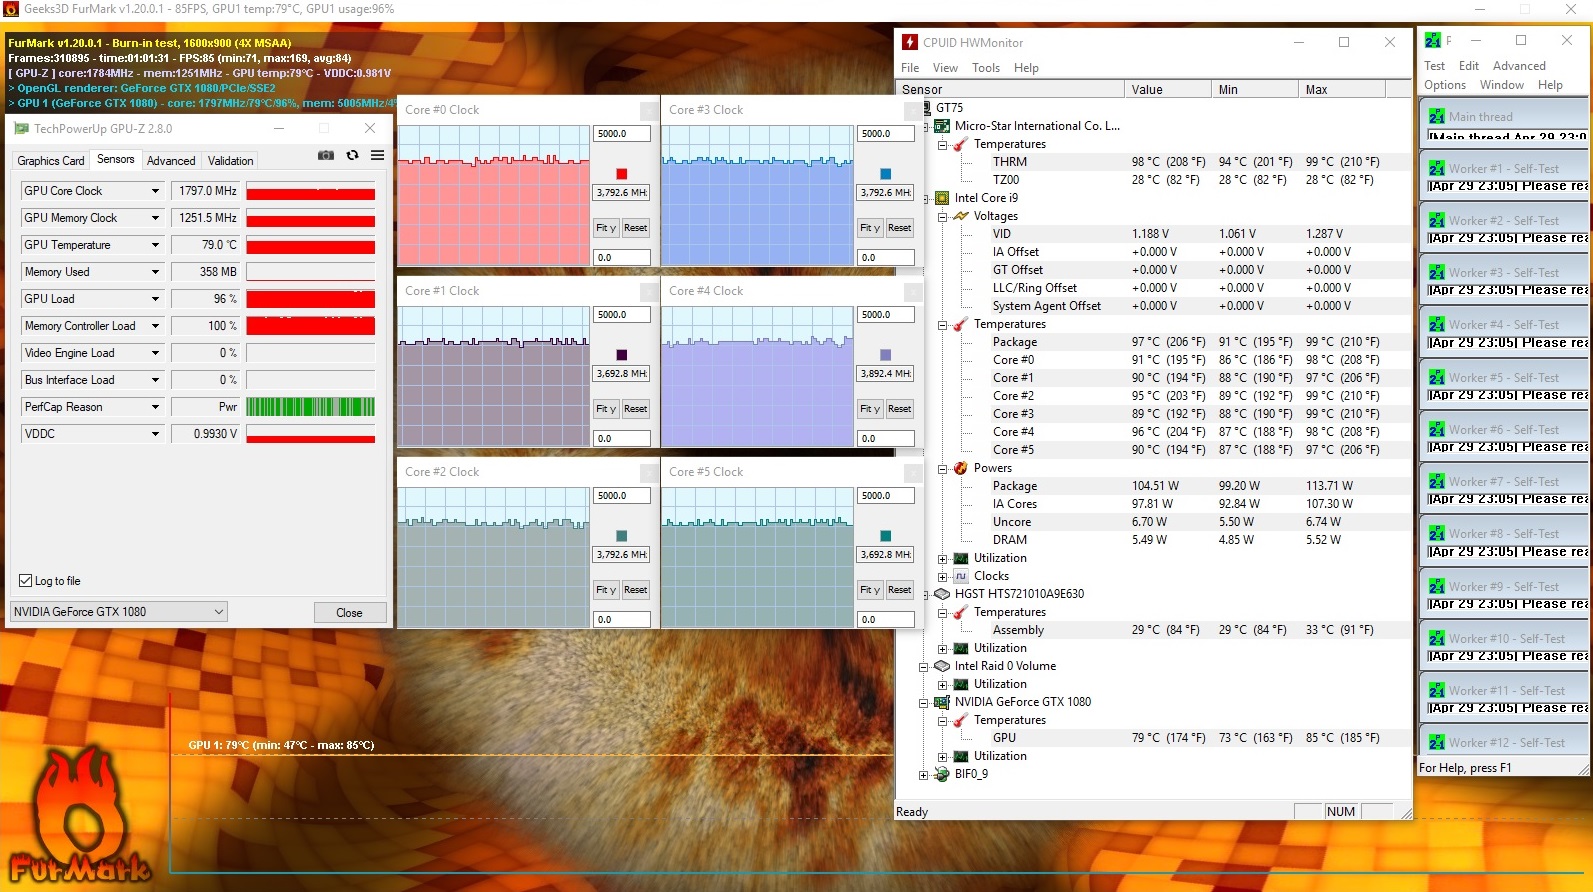
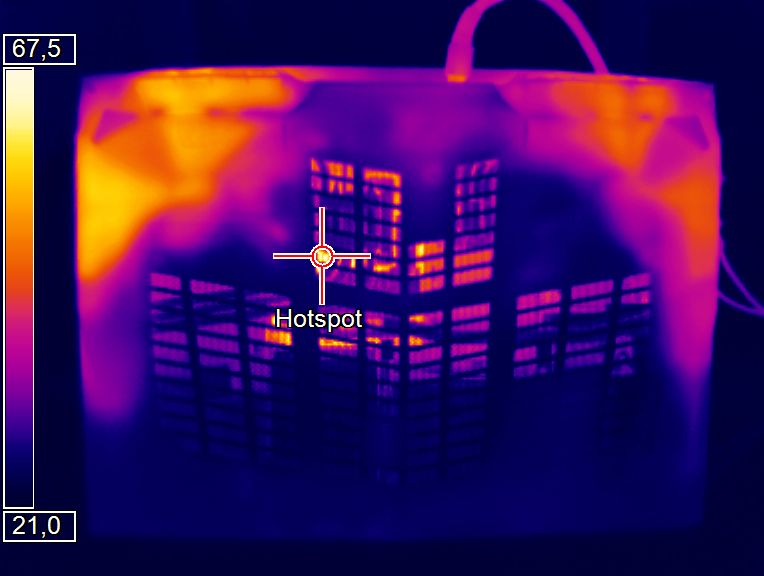
The situation is less rosy under the hood. After an hour of FurMark and Prime95 stress testing, the Core i9-8950HK had heated up to 99 °C, while the GTX 1080 had hit 85 °C. Fortunately, there is no thermal throttling under full load. Both chips are still making use of their turbo speeds after this time, but neither is operating at full power.
(-) The maximum temperature on the upper side is 47 °C / 117 F, compared to the average of 40.4 °C / 105 F, ranging from 21.2 to 68.8 °C for the class Gaming.
(-) The bottom heats up to a maximum of 53 °C / 127 F, compared to the average of 43.2 °C / 110 F
(+) In idle usage, the average temperature for the upper side is 24.9 °C / 77 F, compared to the device average of 33.9 °C / 93 F.
(±) Playing The Witcher 3, the average temperature for the upper side is 35.9 °C / 97 F, compared to the device average of 33.9 °C / 93 F.
(+) The palmrests and touchpad are cooler than skin temperature with a maximum of 30 °C / 86 F and are therefore cool to the touch.
(±) The average temperature of the palmrest area of similar devices was 28.8 °C / 83.8 F (-1.2 °C / -2.2 F).
| MSI GT75 8RG-090 Titan i9-8950HK, GeForce GTX 1080 Mobile | Aorus X9 DT i9-8950HK, GeForce GTX 1080 Mobile | Asus G703 i7-7820HK, GeForce GTX 1080 Mobile | Acer Predator 17 X GX-792-76DL i7-7820HK, GeForce GTX 1080 Mobile | HP Omen X 17-ap0xx i7-7820HK, GeForce GTX 1080 Mobile | Alienware 17 R4 i7-7820HK, GeForce GTX 1080 Mobile | |
|---|---|---|---|---|---|---|
| Heat | -2% | -13% | -5% | 14% | -9% | |
| Maximum Upper Side * (°C) | 47 | 43 9% | 55 -17% | 44.2 6% | 35.6 24% | 49.6 -6% |
| Maximum Bottom * (°C) | 53 | 55 -4% | 54 -2% | 43 19% | 39 26% | 56 -6% |
| Idle Upper Side * (°C) | 26 | 27 -4% | 29 -12% | 32.4 -25% | 24.2 7% | 29.6 -14% |
| Idle Bottom * (°C) | 27 | 29 -7% | 32 -19% | 32.8 -21% | 27.4 -1% | 29.2 -8% |
* ... smaller is better
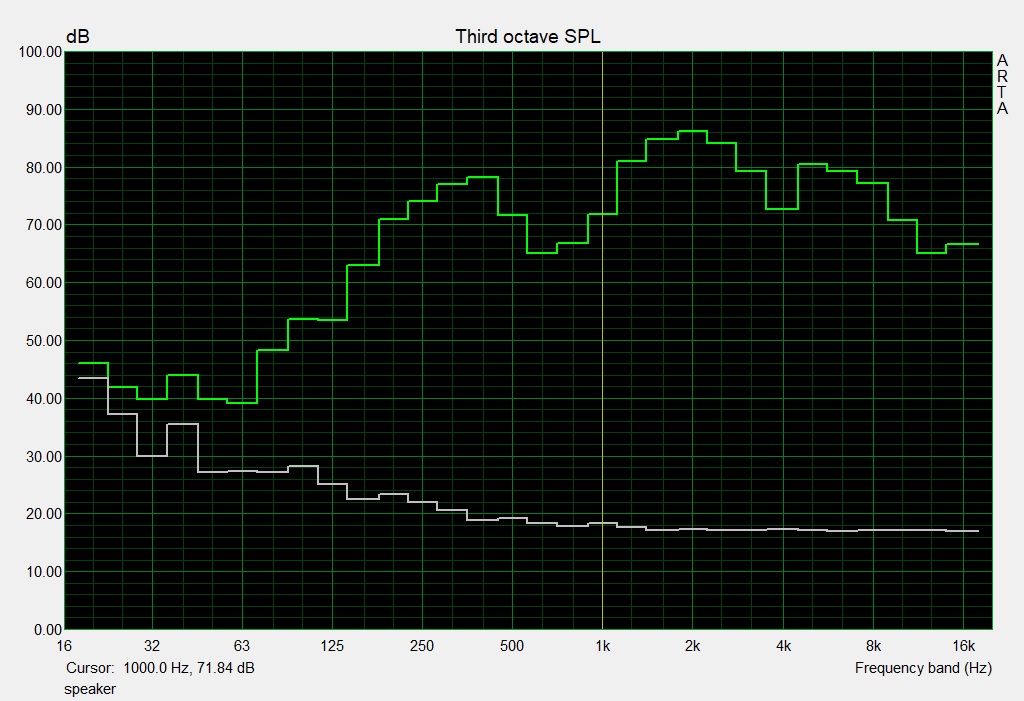
Speakers
MSI GT75 8RG-090 Titan audio analysis
(+) | speakers can play relatively loud (94 dB)
Bass 100 - 315 Hz
(±) | reduced bass - on average 9.4% lower than median
(±) | linearity of bass is average (8.7% delta to prev. frequency)
Mids 400 - 2000 Hz
(±) | higher mids - on average 6.8% higher than median
(±) | linearity of mids is average (8.4% delta to prev. frequency)
Highs 2 - 16 kHz
(±) | higher highs - on average 5% higher than median
(±) | linearity of highs is average (7.8% delta to prev. frequency)
Overall 100 - 16.000 Hz
(+) | overall sound is linear (14.4% difference to median)
Compared to same class
» 27% of all tested devices in this class were better, 7% similar, 66% worse
» The best had a delta of 6%, average was 18%, worst was 132%
Compared to all devices tested
» 18% of all tested devices were better, 4% similar, 78% worse
» The best had a delta of 4%, average was 24%, worst was 134%
Aorus X9 DT audio analysis
(±) | speaker loudness is average but good (78 dB)
Bass 100 - 315 Hz
(±) | reduced bass - on average 9.3% lower than median
(±) | linearity of bass is average (9.6% delta to prev. frequency)
Mids 400 - 2000 Hz
(+) | balanced mids - only 2.5% away from median
(+) | mids are linear (3.9% delta to prev. frequency)
Highs 2 - 16 kHz
(±) | reduced highs - on average 5.2% lower than median
(±) | linearity of highs is average (7.4% delta to prev. frequency)
Overall 100 - 16.000 Hz
(+) | overall sound is linear (14.4% difference to median)
Compared to same class
» 27% of all tested devices in this class were better, 7% similar, 66% worse
» The best had a delta of 6%, average was 18%, worst was 132%
Compared to all devices tested
» 18% of all tested devices were better, 4% similar, 78% worse
» The best had a delta of 4%, average was 24%, worst was 134%
Power Management
Power Consumption
By way of comparison, the GT75 consumes slightly more power than the Aorus X9 DT across most tests. The GT75’s relatively power consumption takes its toll on its twin power supplies. While the Aorus X9 DT uses a very powerful 330 W power supply, the GT75 8RG-090 Titan requires two 230 W power supplies, which weigh a combined 1.56 kg. Having to connect two power supplies frequently annoyed us during testing, what with having double the cabling and having to be near two free plug sockets.
| Off / Standby | |
| Idle | |
| Load |
|
Key:
min: | |
| MSI GT75 8RG-090 Titan i9-8950HK, GeForce GTX 1080 Mobile | Aorus X9 DT i9-8950HK, GeForce GTX 1080 Mobile | Asus G703 i7-7820HK, GeForce GTX 1080 Mobile | Acer Predator 17 X GX-792-76DL i7-7820HK, GeForce GTX 1080 Mobile | HP Omen X 17-ap0xx i7-7820HK, GeForce GTX 1080 Mobile | Alienware 17 R4 i7-7820HK, GeForce GTX 1080 Mobile | |
|---|---|---|---|---|---|---|
| Power Consumption | 7% | 11% | 17% | 31% | 9% | |
| Idle Minimum * (Watt) | 31 | 28 10% | 26 16% | 27 13% | 21.6 30% | 37.5 -21% |
| Idle Average * (Watt) | 35 | 37 -6% | 30 14% | 32 9% | 26.4 25% | 37.6 -7% |
| Idle Maximum * (Watt) | 45 | 40 11% | 37 18% | 41 9% | 26.6 41% | 37.6 16% |
| Load Average * (Watt) | 130 | 109 16% | 123 5% | 102 22% | 95.6 26% | 122.4 6% |
| Witcher 3 ultra * (Watt) | 268 | 256 4% | 257 4% | 221.7 17% | 180.3 33% | |
| Load Maximum * (Watt) | 374 | 353 6% | 341 9% | 248 34% | 199.6 47% | 277.4 26% |
* ... smaller is better
Battery Life
The GT75 has quite poor battery life in part because it does not support NVIDIA Optimus graphics switching. This means that the GTX 1080 is always active. Our review unit lasted just one hour under 3D load at maximum brightness and just under four hours idling at minimum brightness. This is unimpressive for a device released in 2018. By contrast, gaming notebooks that are designed for mobility, like the Gigabyte Aero 15X or the MSI GS65, have significantly better battery runtimes. As our video test demonstrates, in daily use you should expect to get just under three hours use from the GT75 before needing a recharge.
| MSI GT75 8RG-090 Titan i9-8950HK, GeForce GTX 1080 Mobile, 75 Wh | Aorus X9 DT i9-8950HK, GeForce GTX 1080 Mobile, 94.24 Wh | Asus G703 i7-7820HK, GeForce GTX 1080 Mobile, 71 Wh | Acer Predator 17 X GX-792-76DL i7-7820HK, GeForce GTX 1080 Mobile, 88.8 Wh | HP Omen X 17-ap0xx i7-7820HK, GeForce GTX 1080 Mobile, 99 Wh | Alienware 17 R4 i7-7820HK, GeForce GTX 1080 Mobile, 99 Wh | |
|---|---|---|---|---|---|---|
| Battery runtime | 15% | -16% | 30% | 68% | 15% | |
| Reader / Idle (h) | 3.8 | 4.2 11% | 3.3 -13% | 5.2 37% | 5.8 53% | 4.6 21% |
| H.264 (h) | 2.9 | 2.4 -17% | 3.4 17% | |||
| Load (h) | 1.1 | 1.3 18% | 0.9 -18% | 1.5 36% | 2 82% | 1.2 9% |
| WiFi v1.3 (h) | 3.2 | 2.5 | 4.2 | 5.6 | 3 |
Verdict
Pros
Cons
If you can get past its size and weight, then the MSI GT75 8RG is a high-quality, well equipped and incredibly powerful desktop replacement that is reminiscent of classic tower PCs. The GT75 has extensive maintenance and upgrade options and plenty of connections among other things.
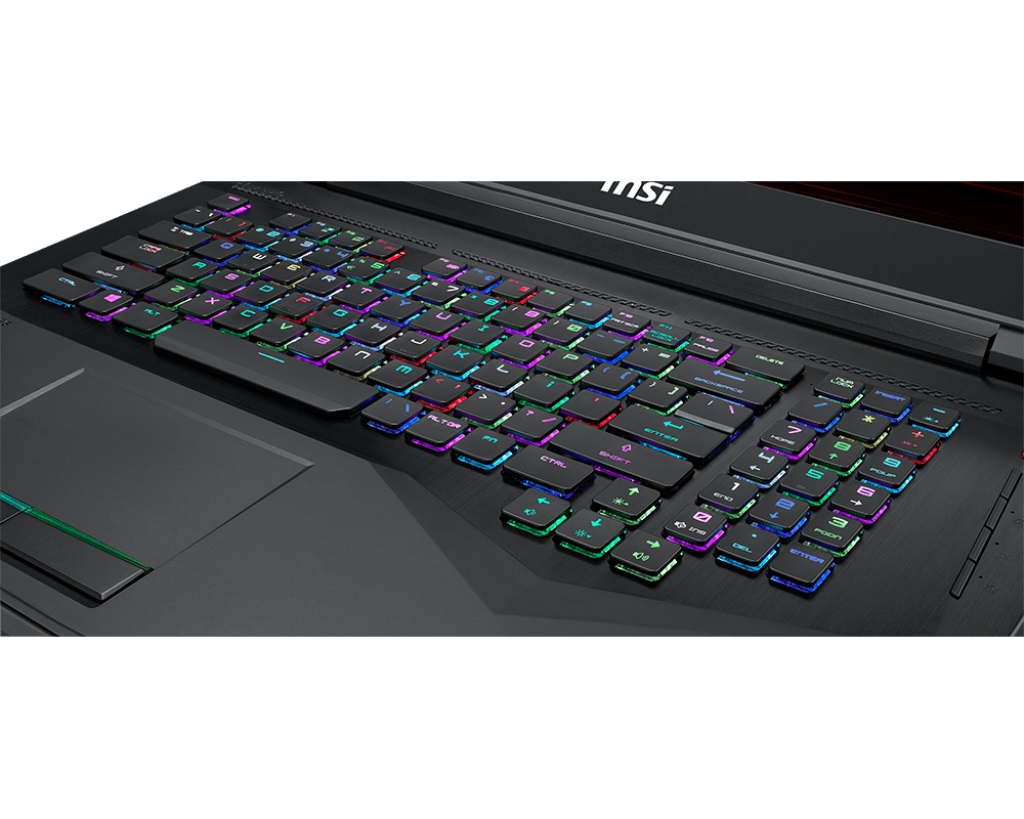
Added to this, MSI integrates a lightning fast and colour accurate 120 Hz display and a decent sound system. The input devices are equally impressive. One of the GT75’s highlights is its mechanical keyboard; whose typing experience is streets ahead of the competition.
We cannot fully recommend the GT75 8RG though. As with its predecessor, the fan noise is a real sticking point. Although the 17-inch device is practically 6 cm thick, the fans are extremely loud under load. They are so loud that you will need to use a headset when gaming. The same is true for the Aorus X9 DT, but this device is only 3 cm thick. This comparable performance shows MSI’s cooling system to be somewhat lacking.
MSI GT75 8RG-090 Titan
- 05/16/2018 v6 (old)
Florian Glaser
Price comparison

