Alienware 17 R4 (7820HK, QHD, GTX 1080) Laptop Review
The Alienware 17 series has evolved quite a bit since we first reviewed the introductory model back in 2008. Now, Alienware notebooks have become some of our favorite gaming systems because of their very high quality builds and reliability. The latest Alienware 17 R4 has been redesigned from the outgoing 17 R3 to be even heavier, larger, and faster with core components up to the i7-7820HK and the GTX 1080. This configuration places the system squarely in the enthusiast territory alongside the MSI GT73VR, Acer Predator 17 X, Asus G701VI/G752VS, and the various Clevo barebones from resellers. The i7-7820HK in particular is an uncommon find in the gaming laptop space where the i7-7700HQ or i7-6700HQ are more typical.
Lower-end SKUs of the Alienware 17 R4 can be configured with an i7-7700HQ, GTX 1050 Ti, 8 GB of RAM, and IPS FHD screen for a reasonable price of $1300 USD considering the strong chassis. The SKU on the other end of the spectrum is loaded with the i7-7820HK CPU, GTX 1080 GPU, 4K UHD IPS display, and Tobii eye-tracking IR cameras for games that support the feature. Our test model today is this latter configuration but with a G-Sync-compatible QHD TN panel instead retailing for about $2600 USD.
We recommend checking out the official Dell product page for a clean breakdown of the available SKUs and prices.
Case
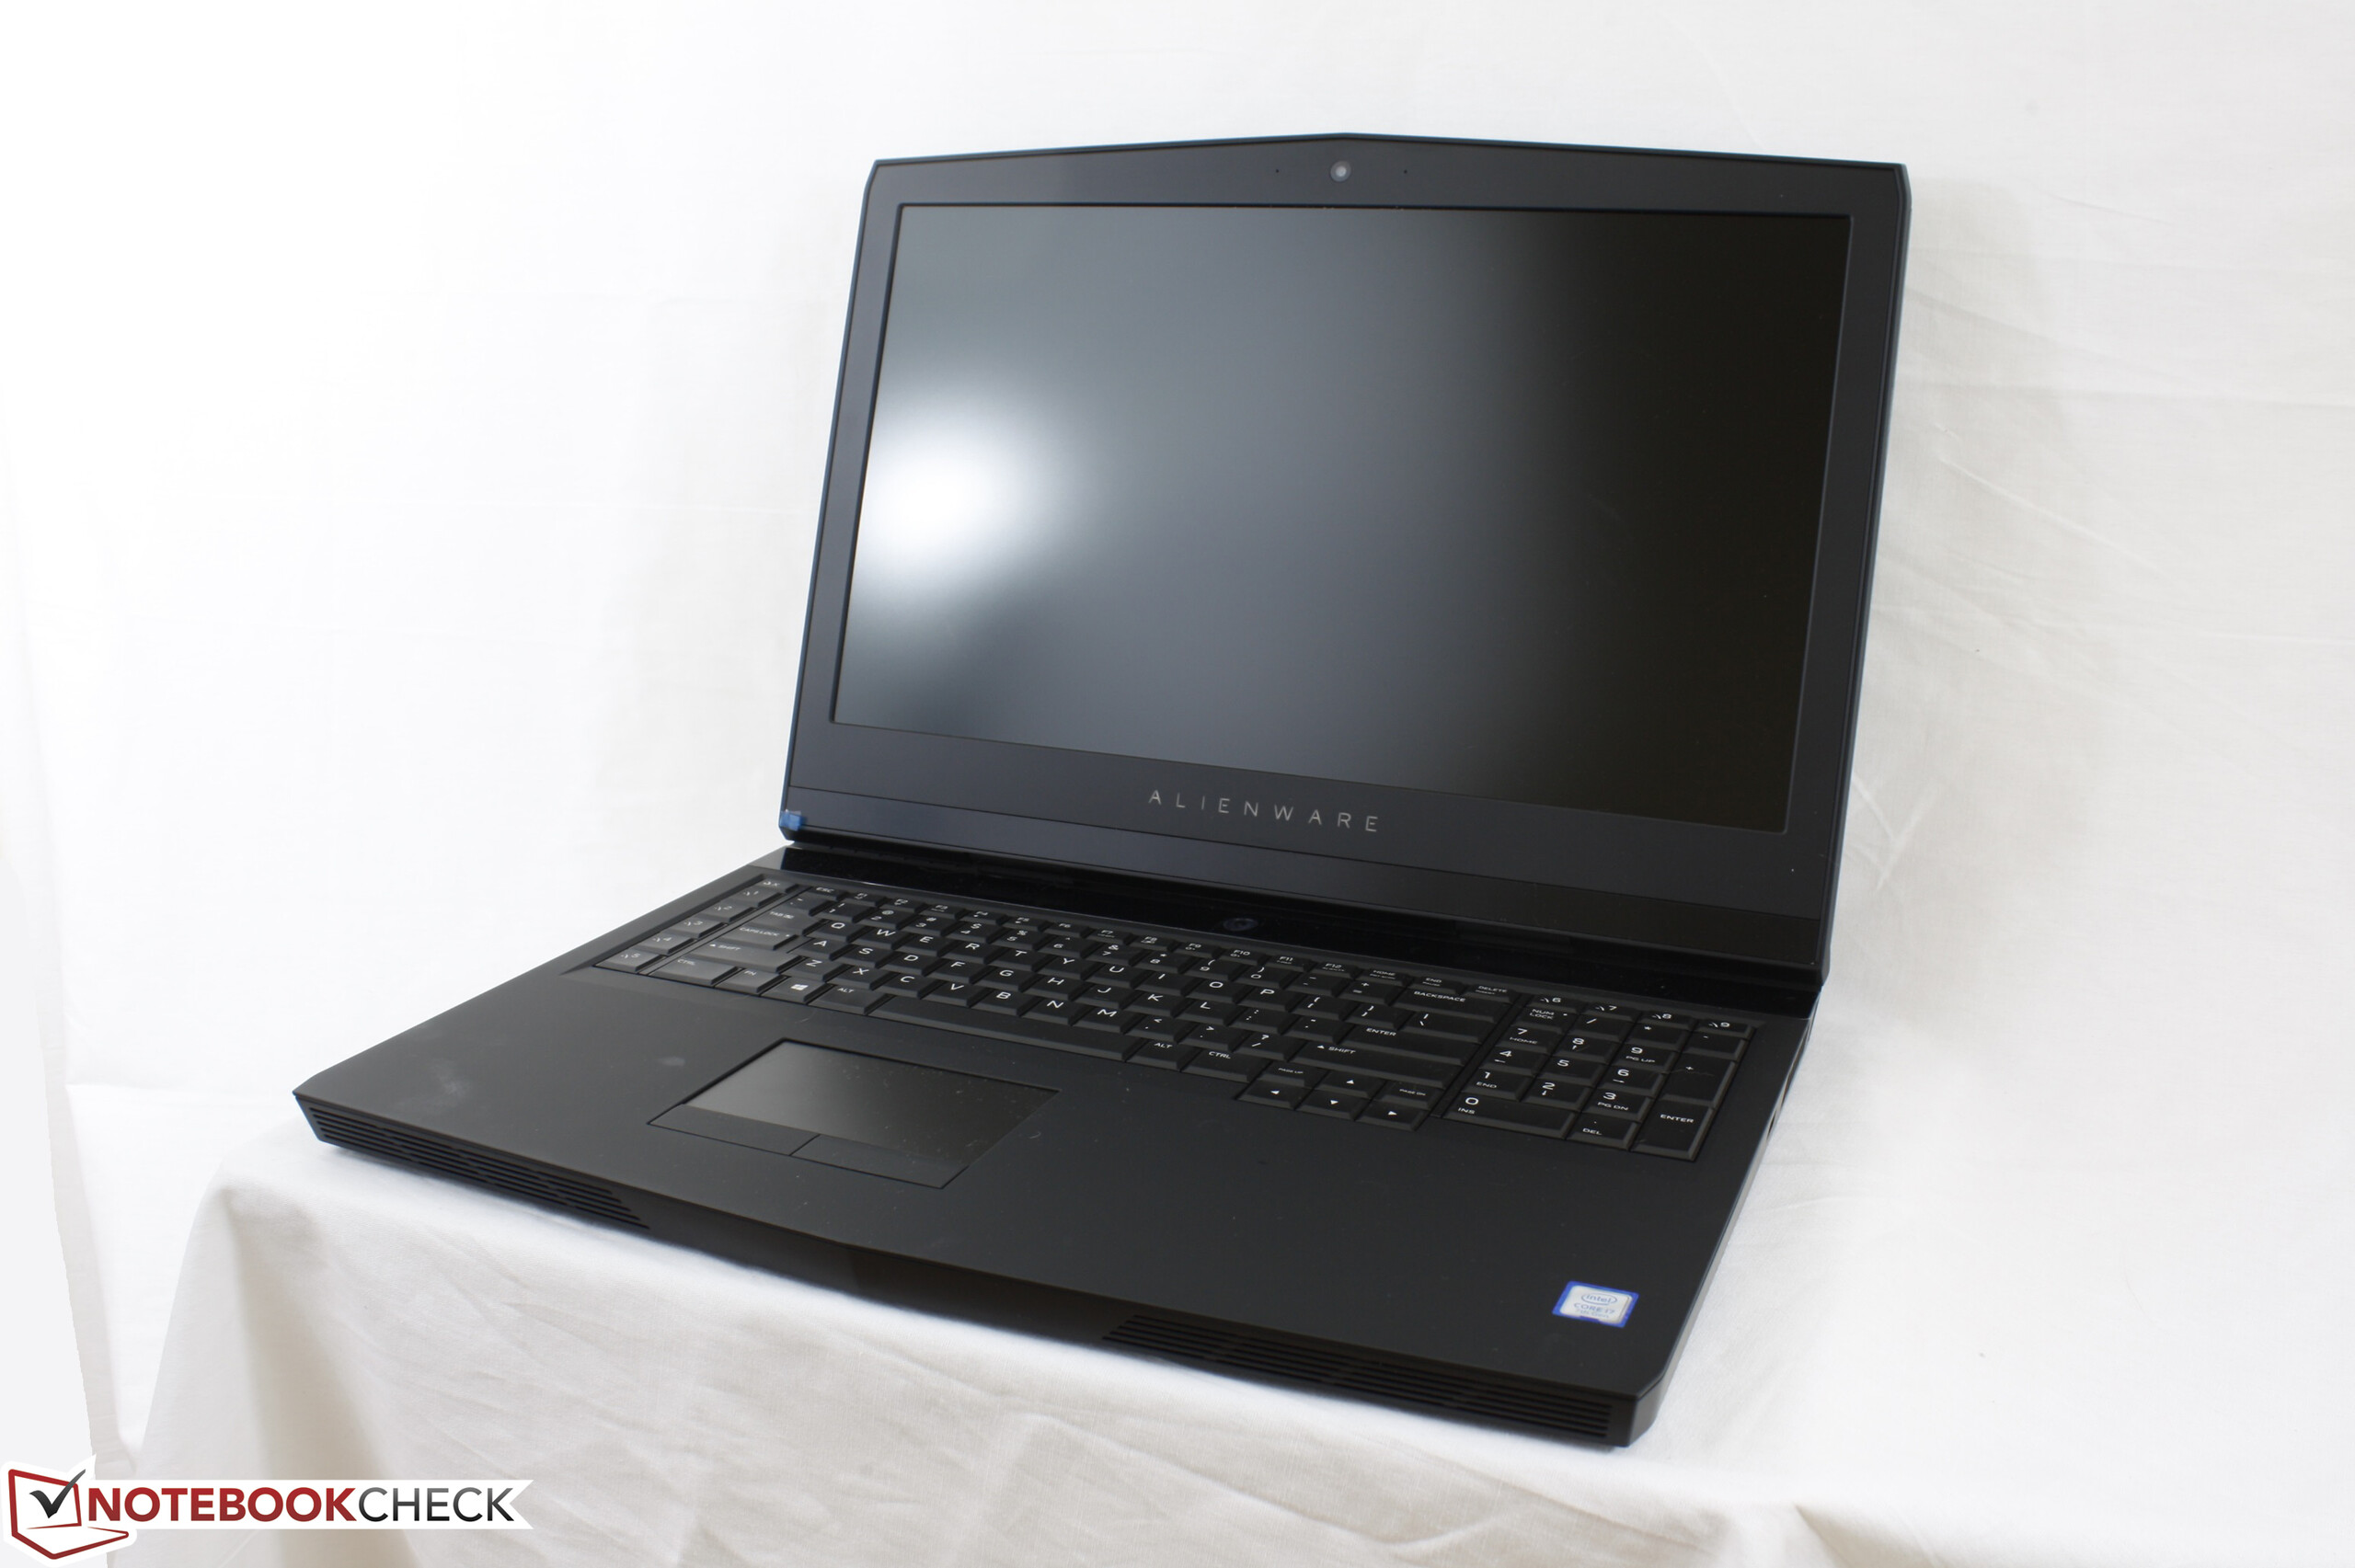
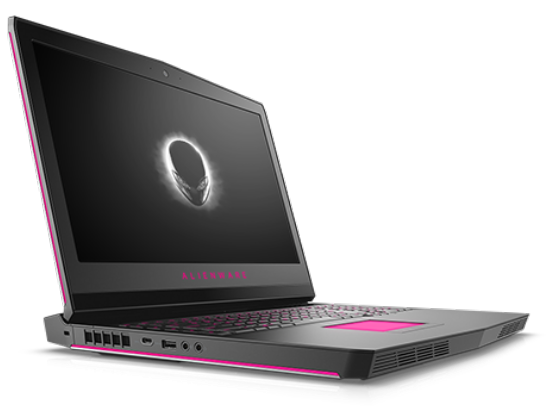
Alienware has gone all out in order to make the chassis feel as "premium" as possible. Like the 17 R3, the 17 R4 utilizes magnesium, steel, rubberized surfaces, and an anodized aluminum gray outer lid borrowed from the XPS series to create one of the most rigid gaming systems in its size class. This has its consequences when it comes to weight and serviceability as shown in our next few sections, but there's no denying that the notebook looks and feels meticulously designed. Brushed aluminum surfaces, glossy plastics, and overly showy accents need not apply.
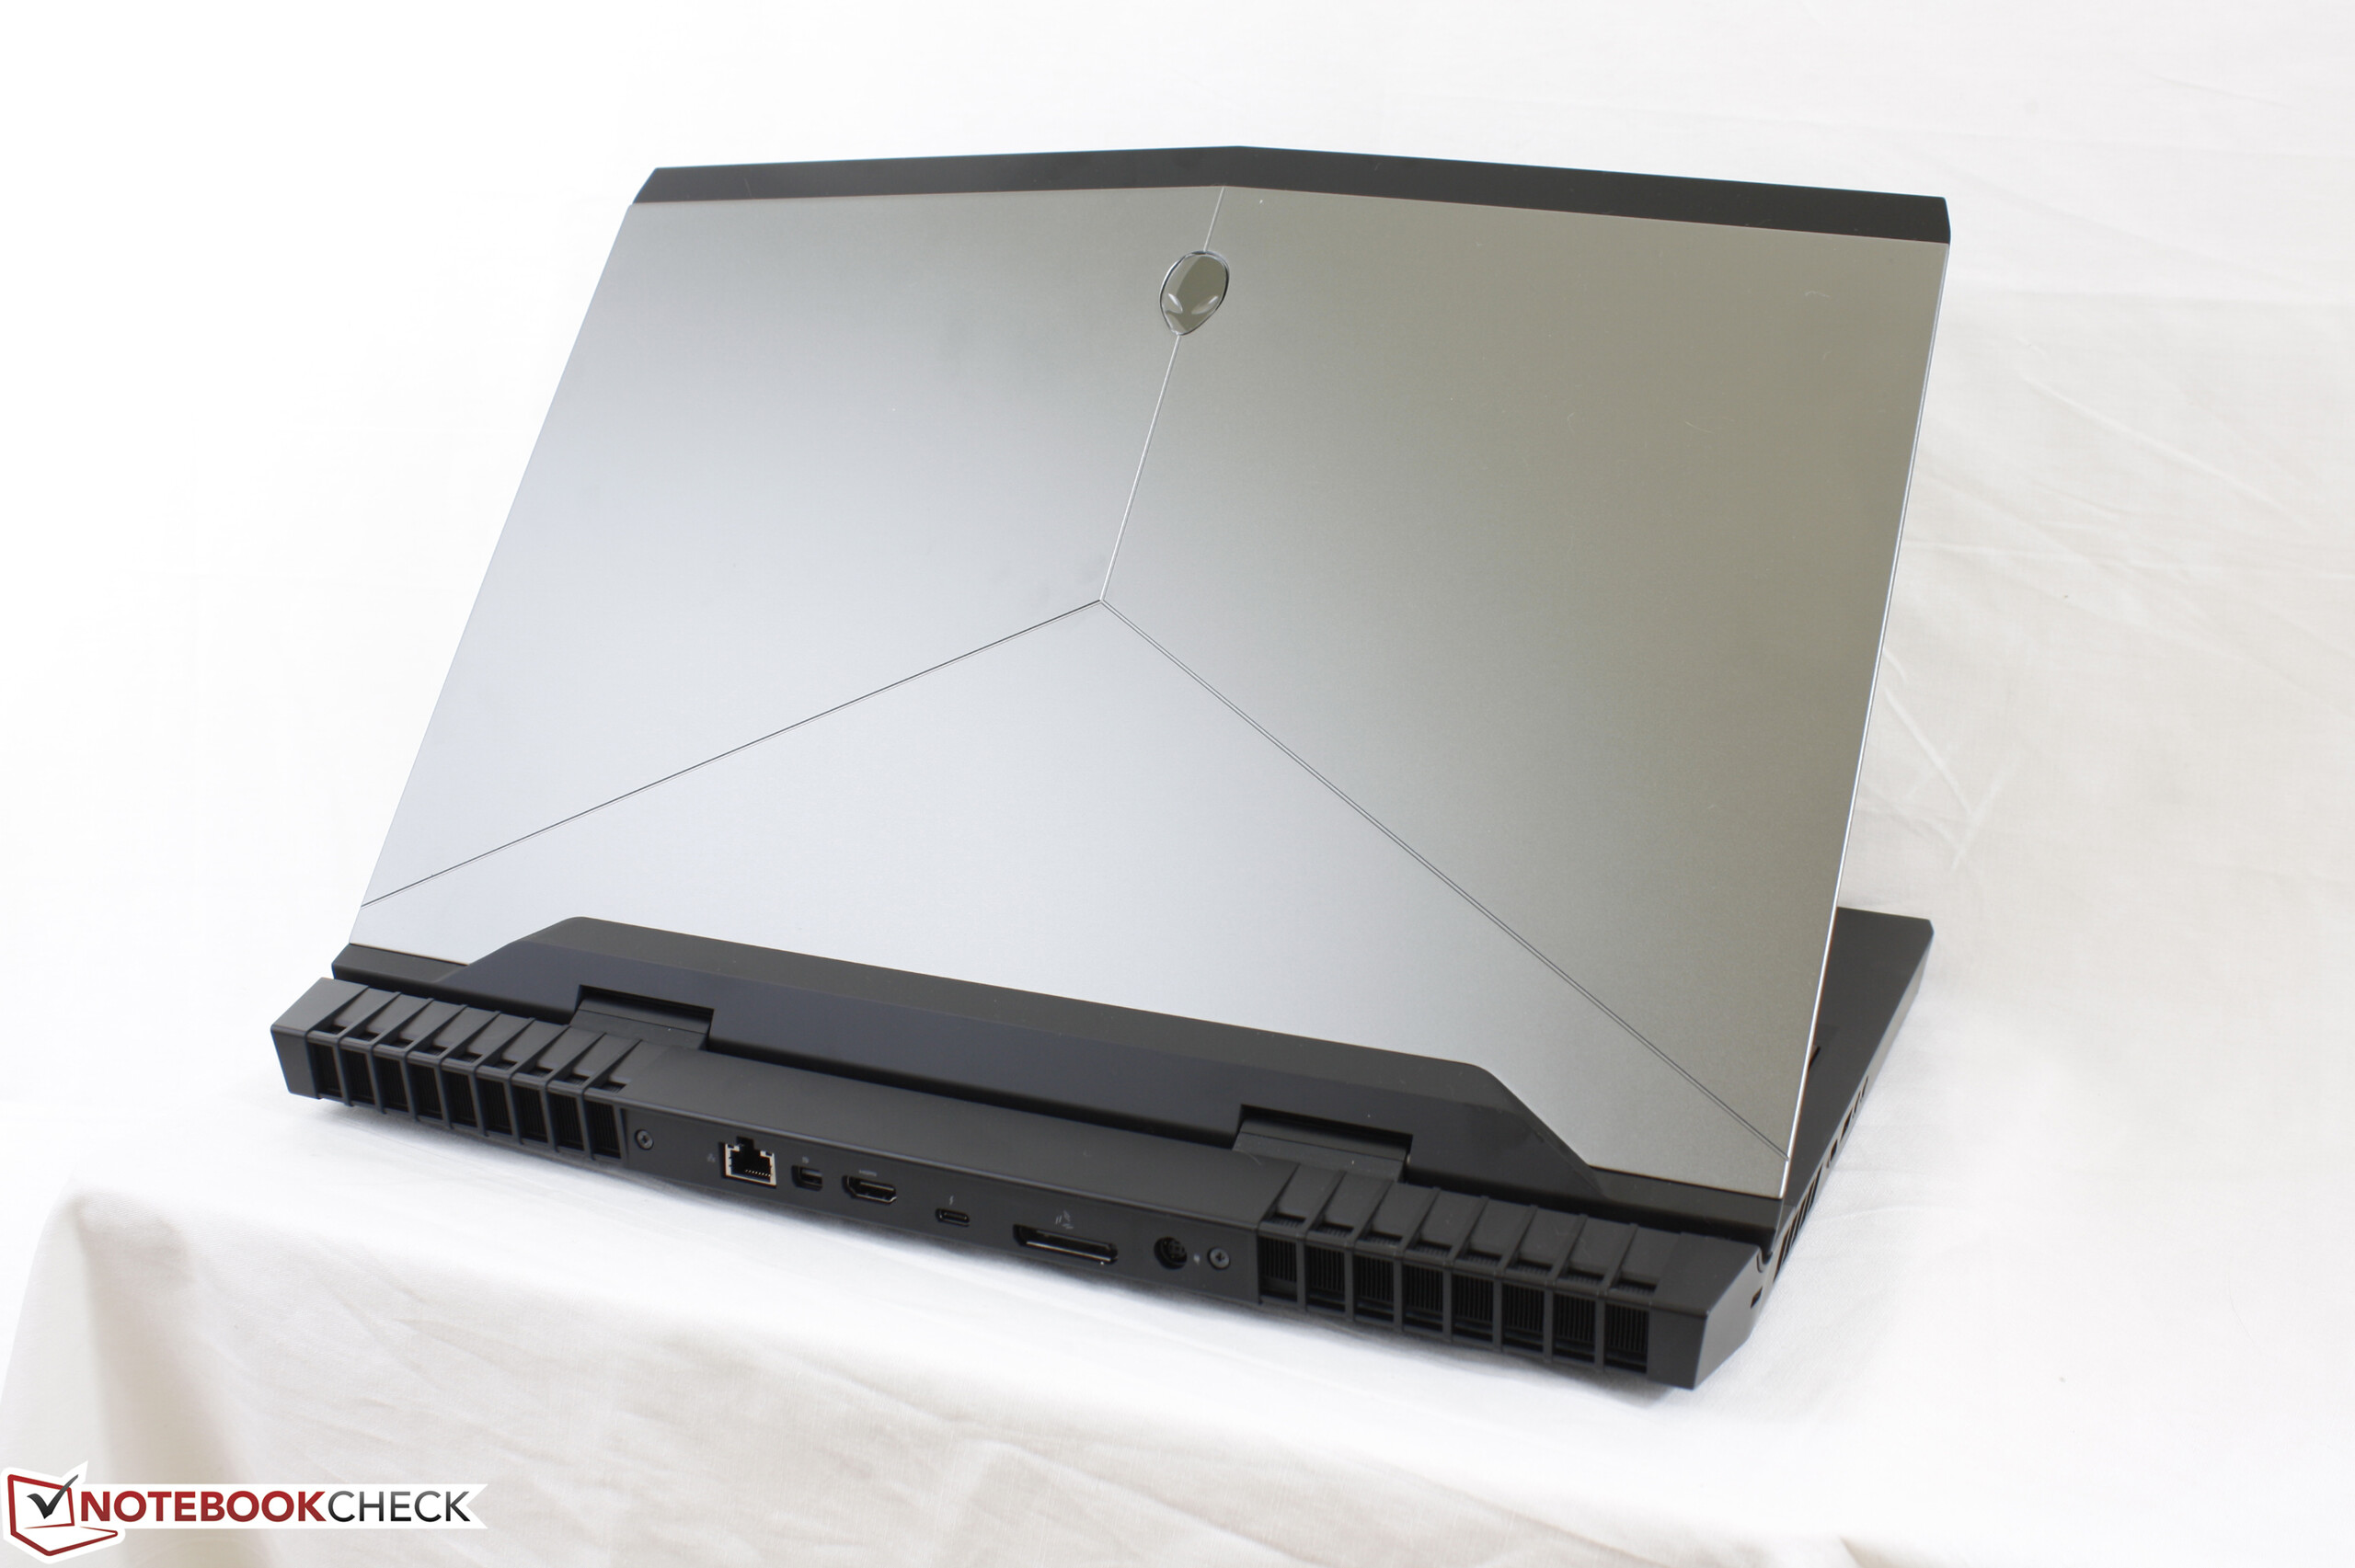
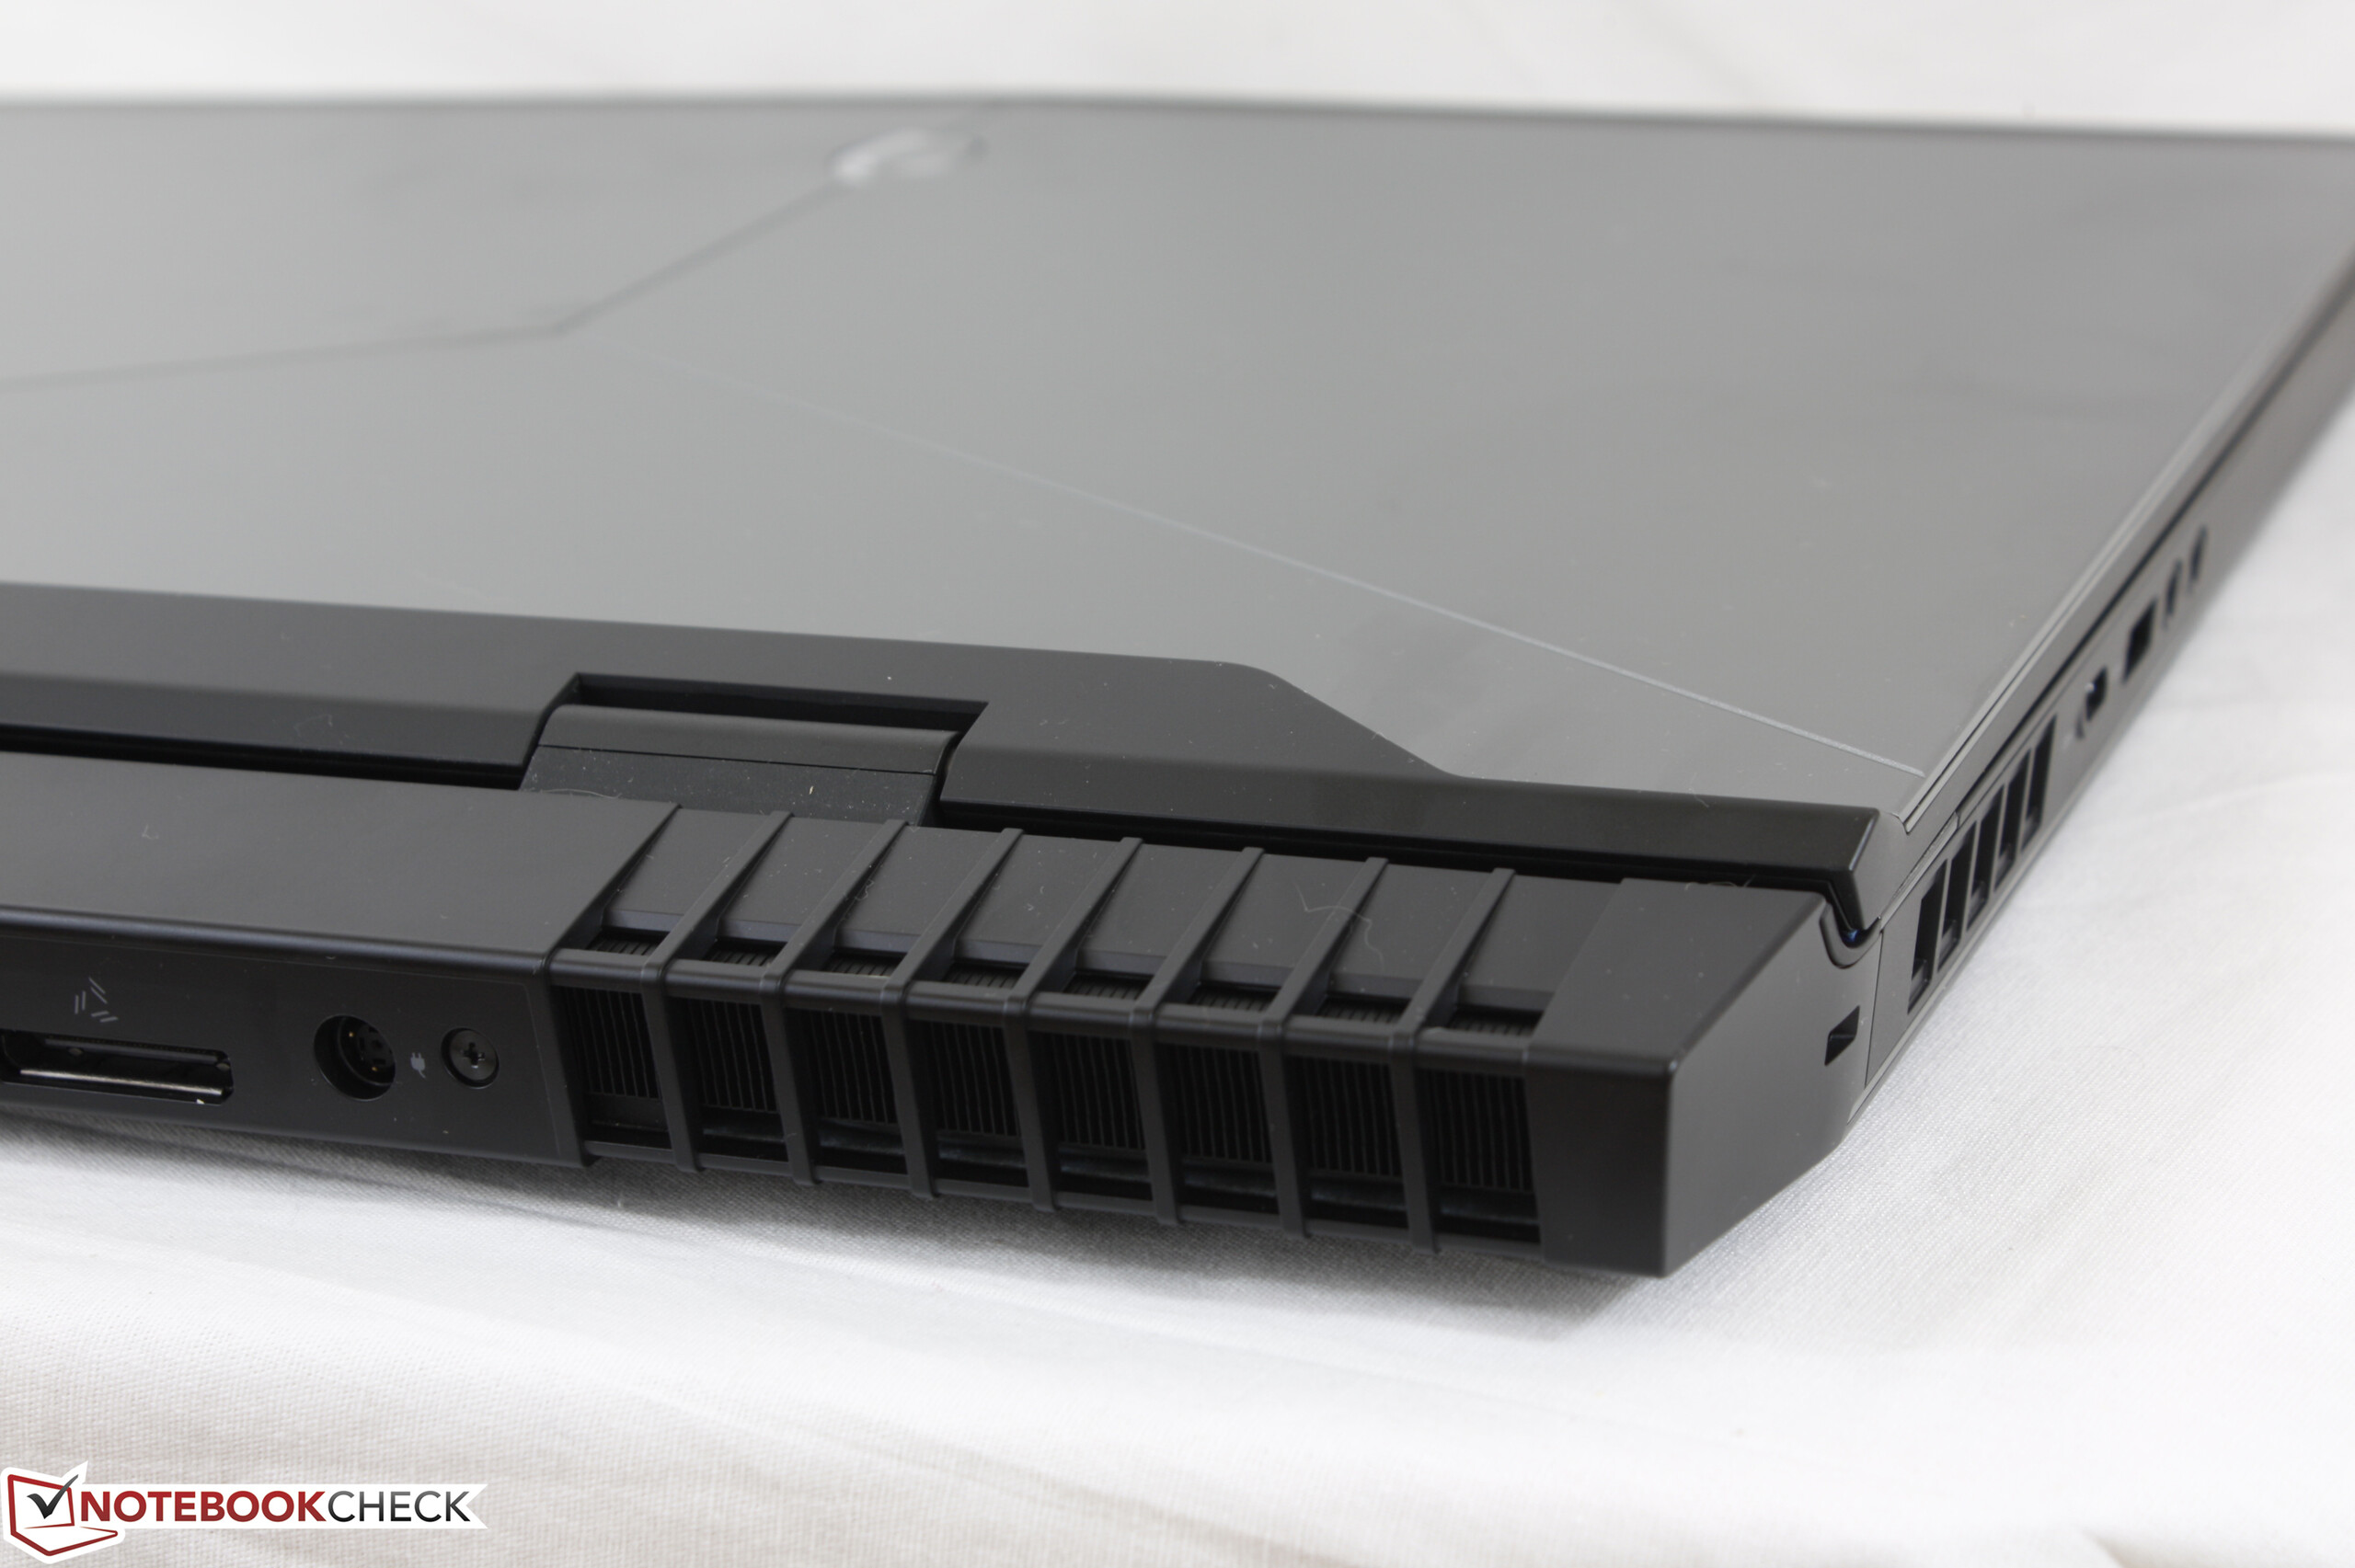
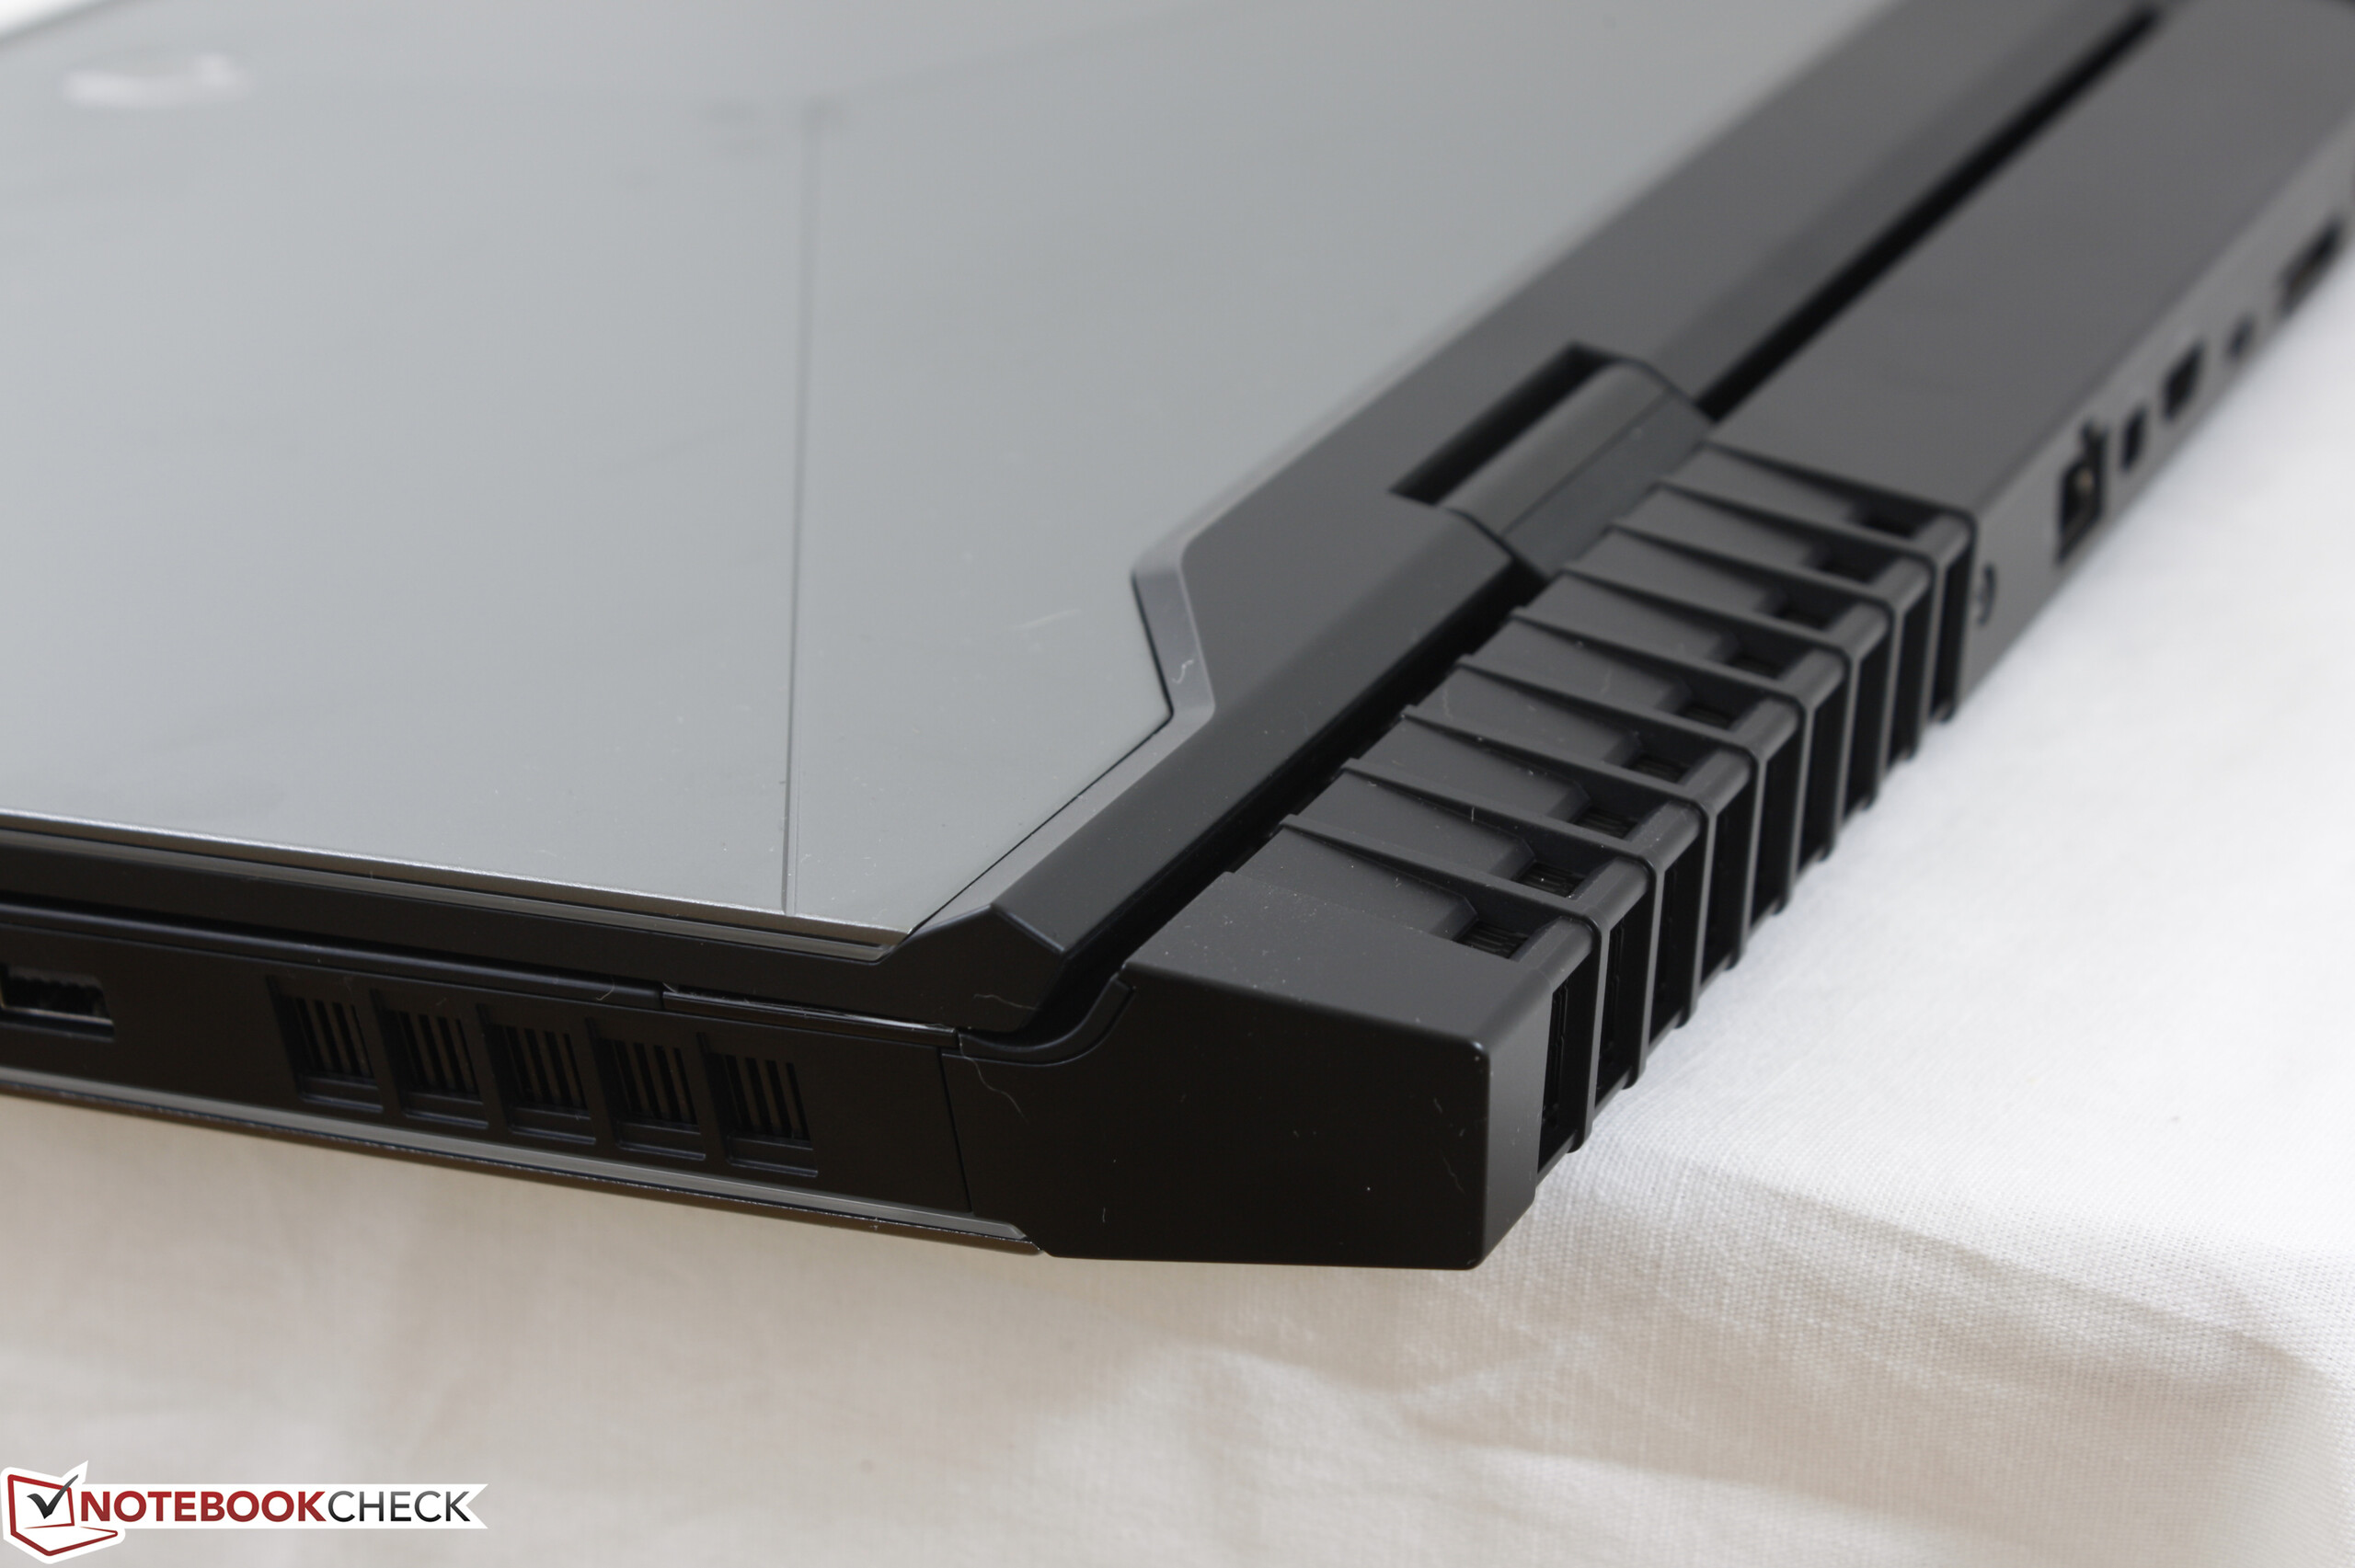
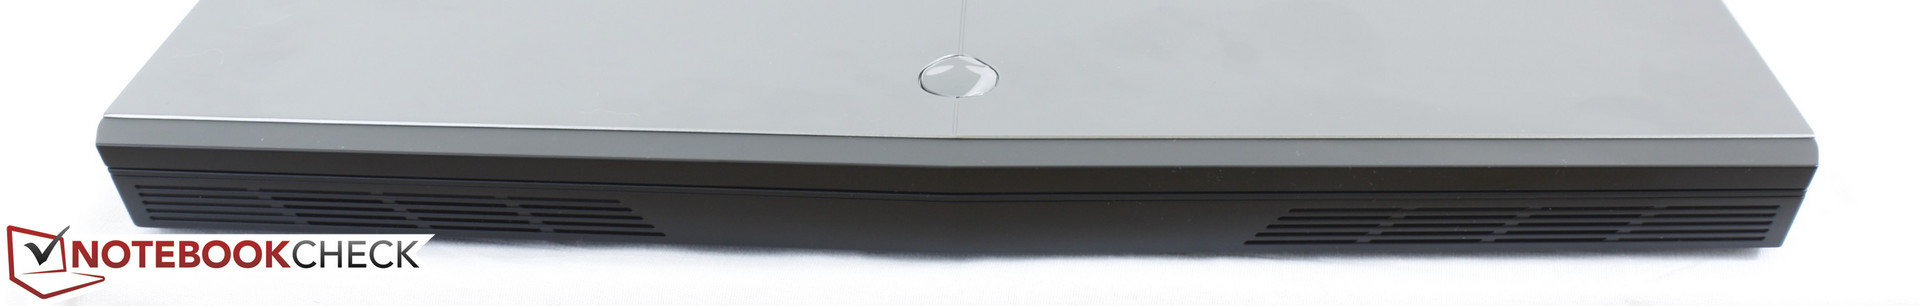
The biggest difference in this new refresh is its rear "jet engine style" ventilation grilles that protrude prominently from the back. Most enthusiast gaming systems feature something similar such as the Asus G752/G701 series, MSI GT80/GT83VR series, Aorus X series, and the Acer Predator series. The advantages are at least two-fold -- manufacturers can more efficiently move waste heat away from the sensitive keyboard area and potentially provide stronger cooling simultaneously. A notable drawback is the more limited maximum display angle of just 140 degrees compared to the full 180 degrees of the MSI GT72 series.
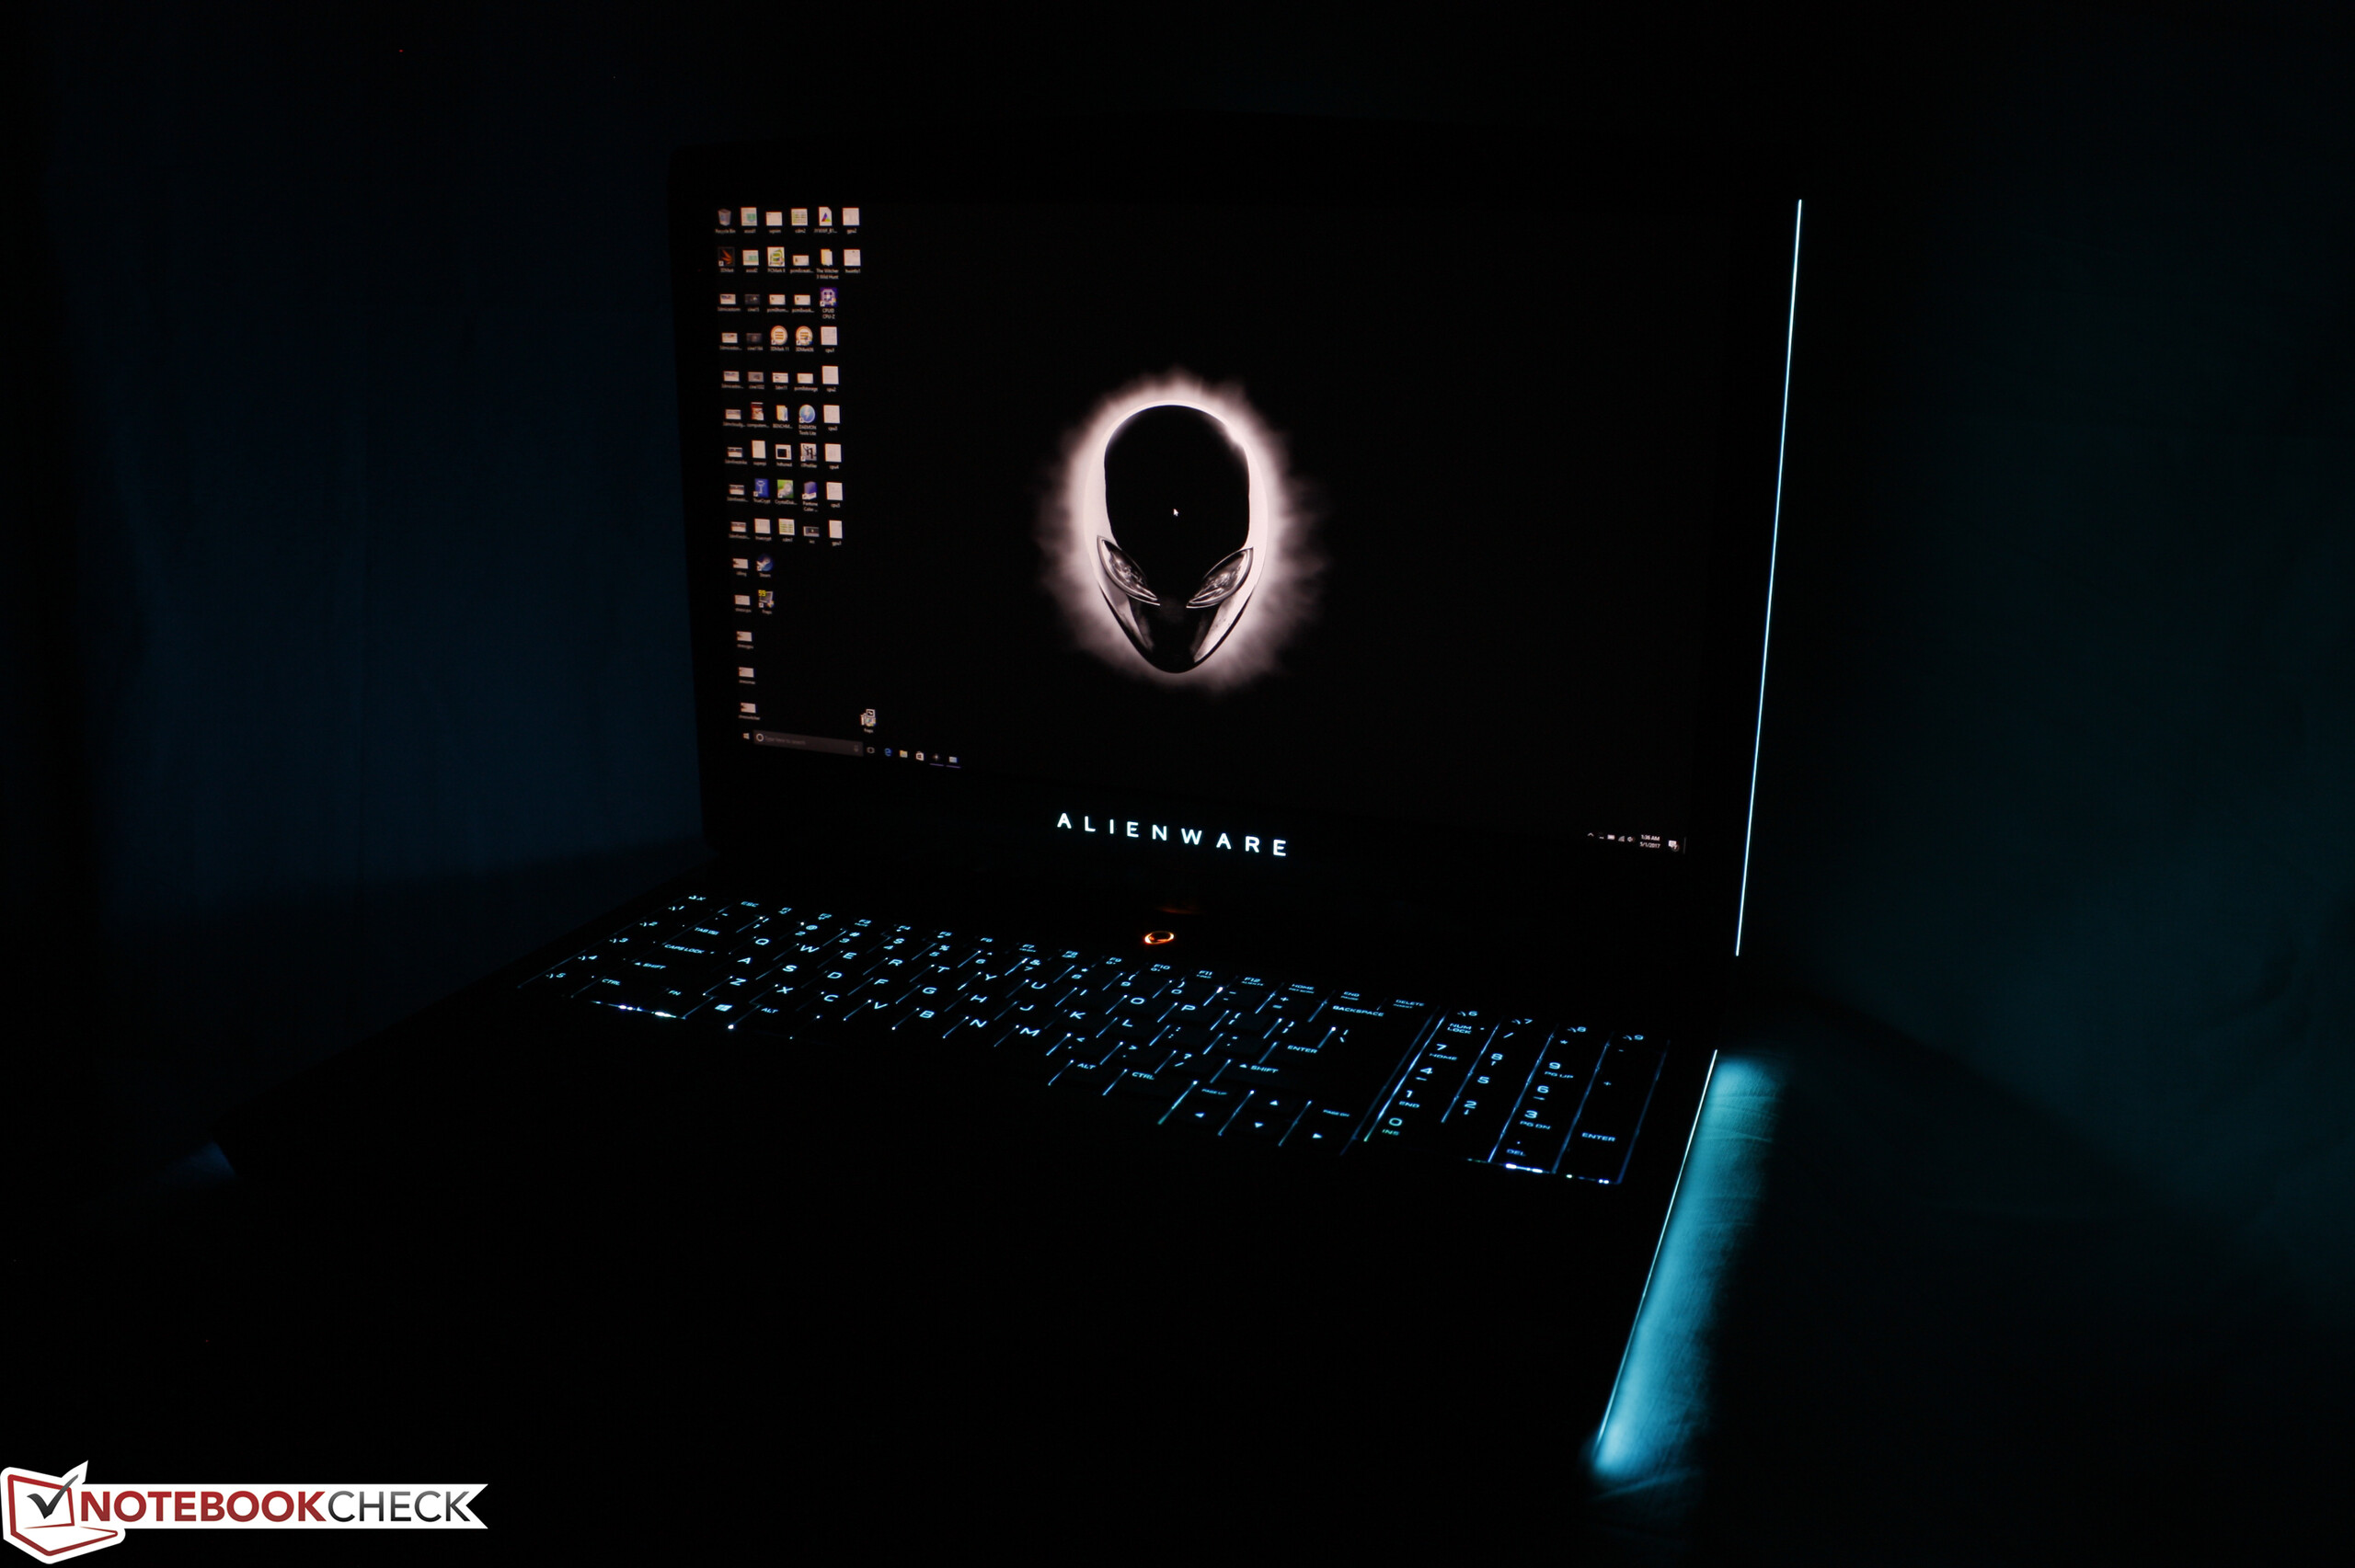
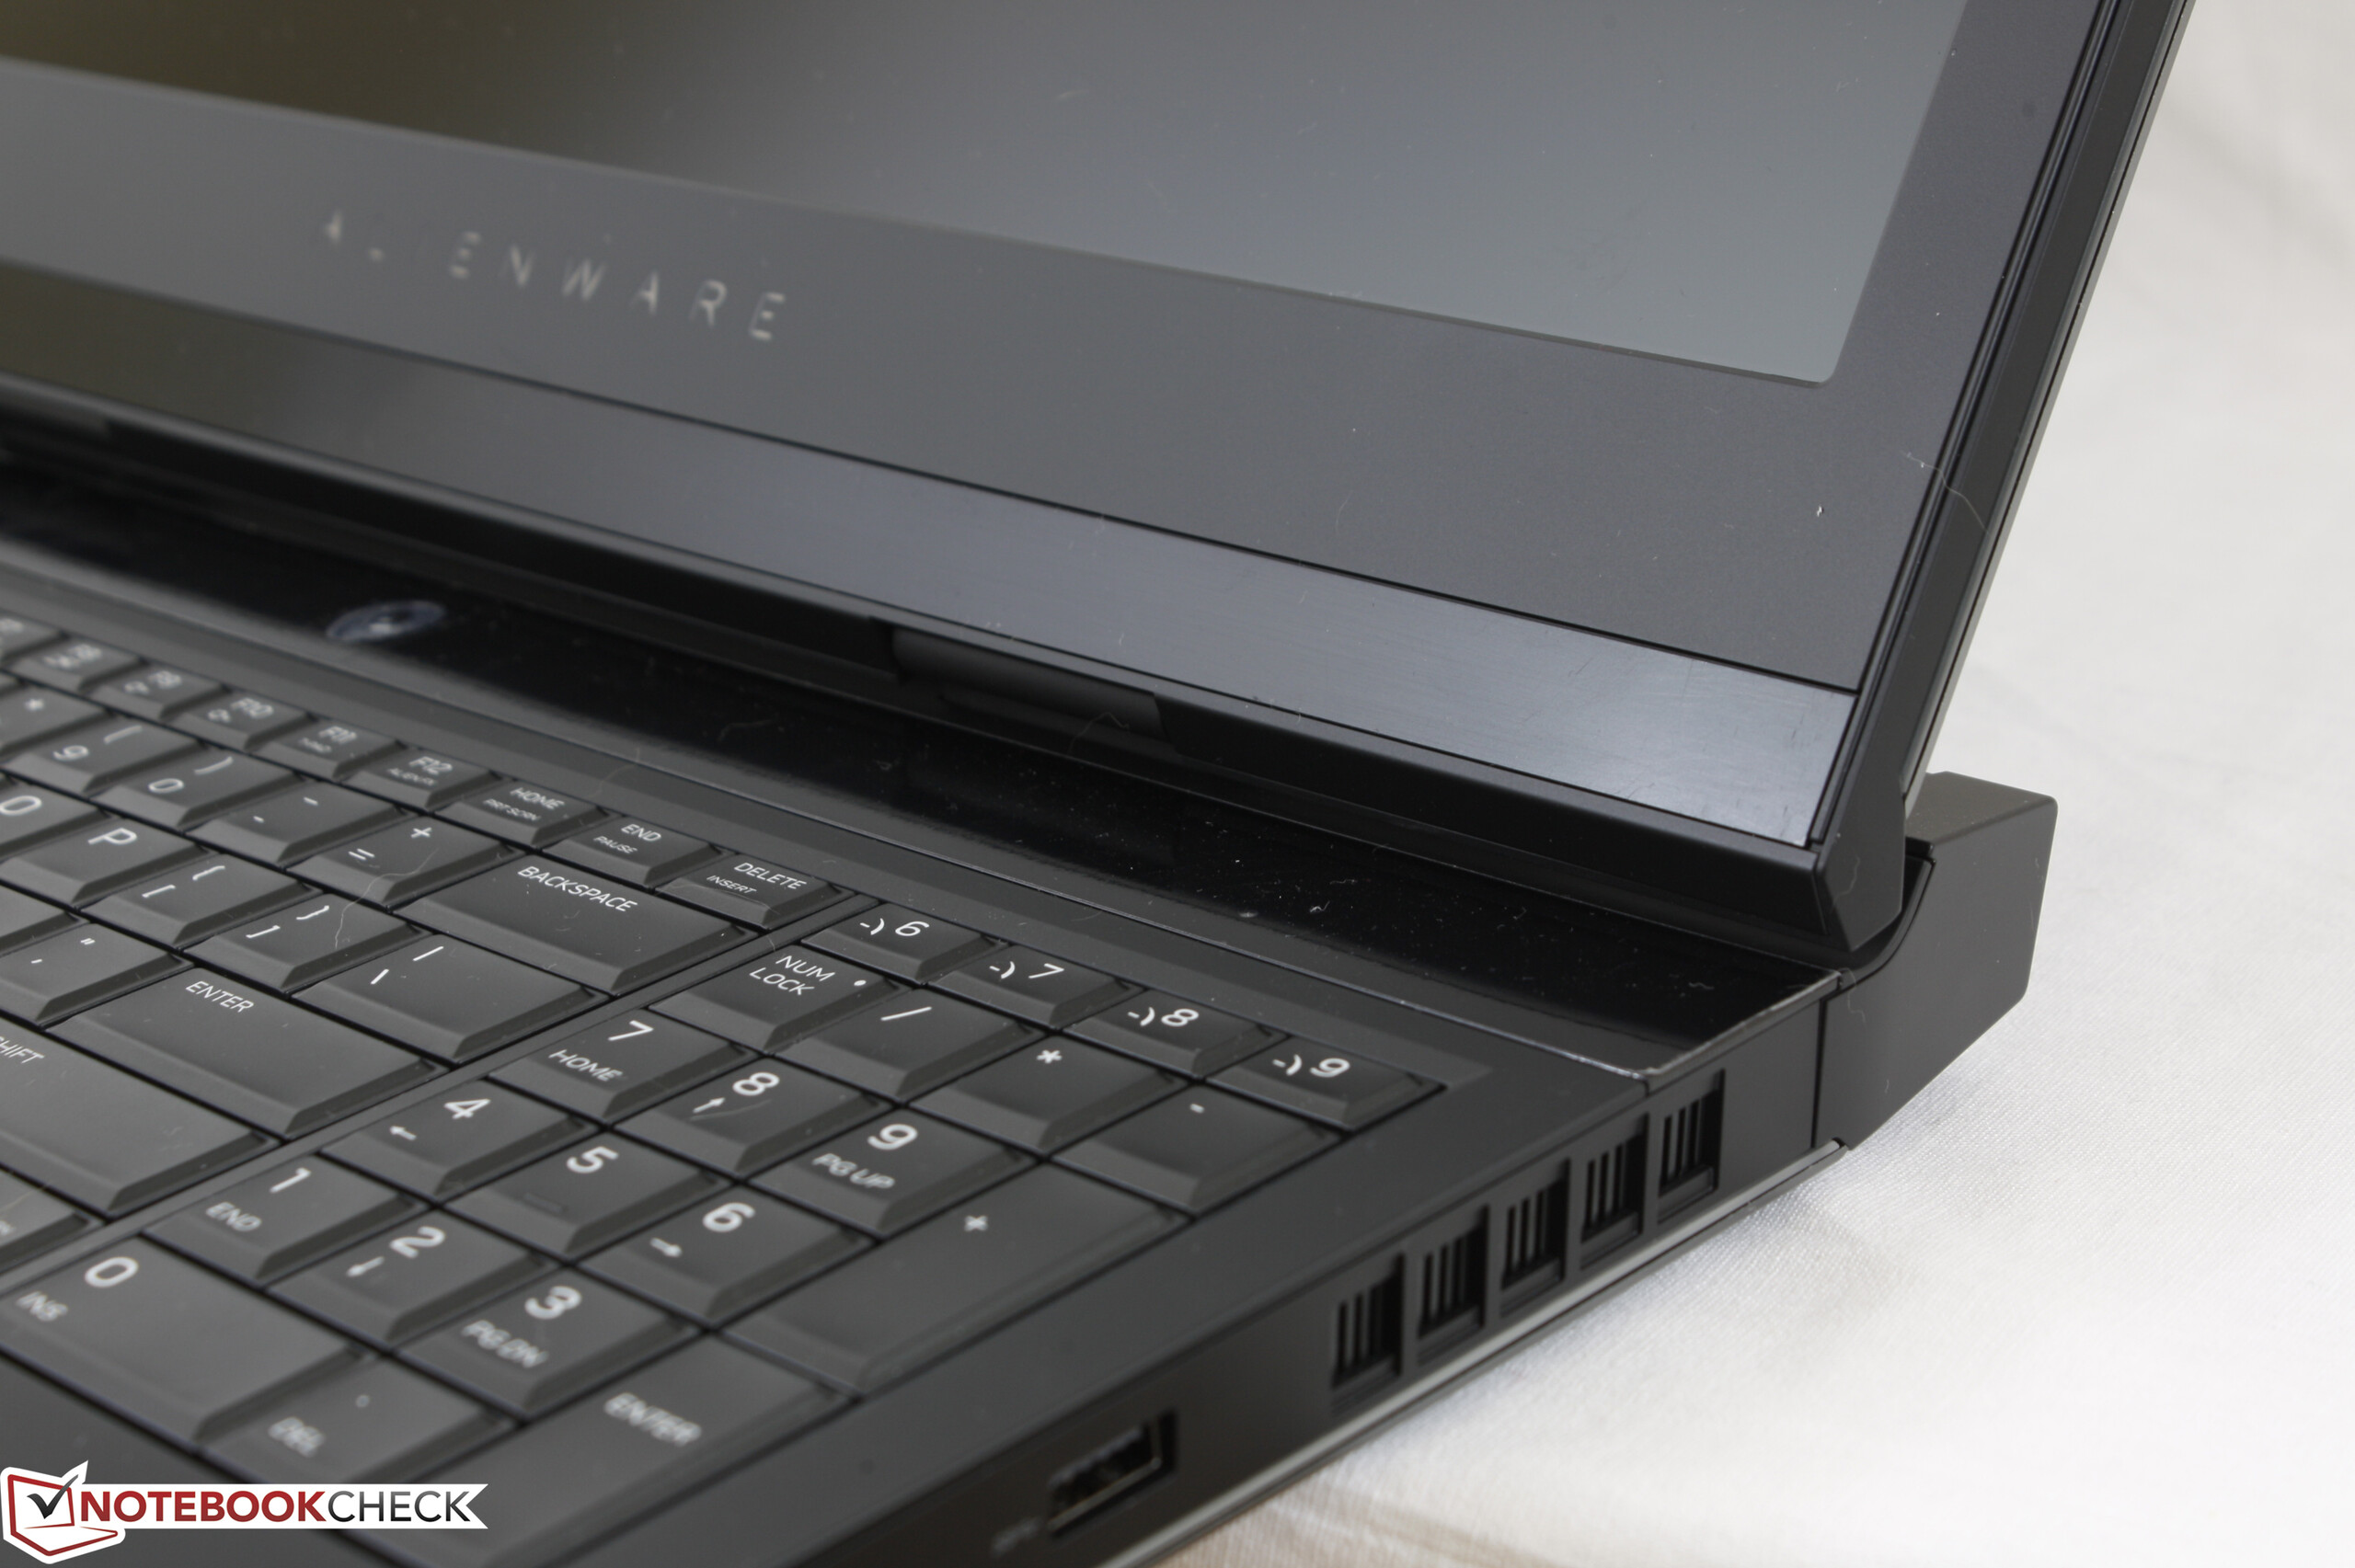
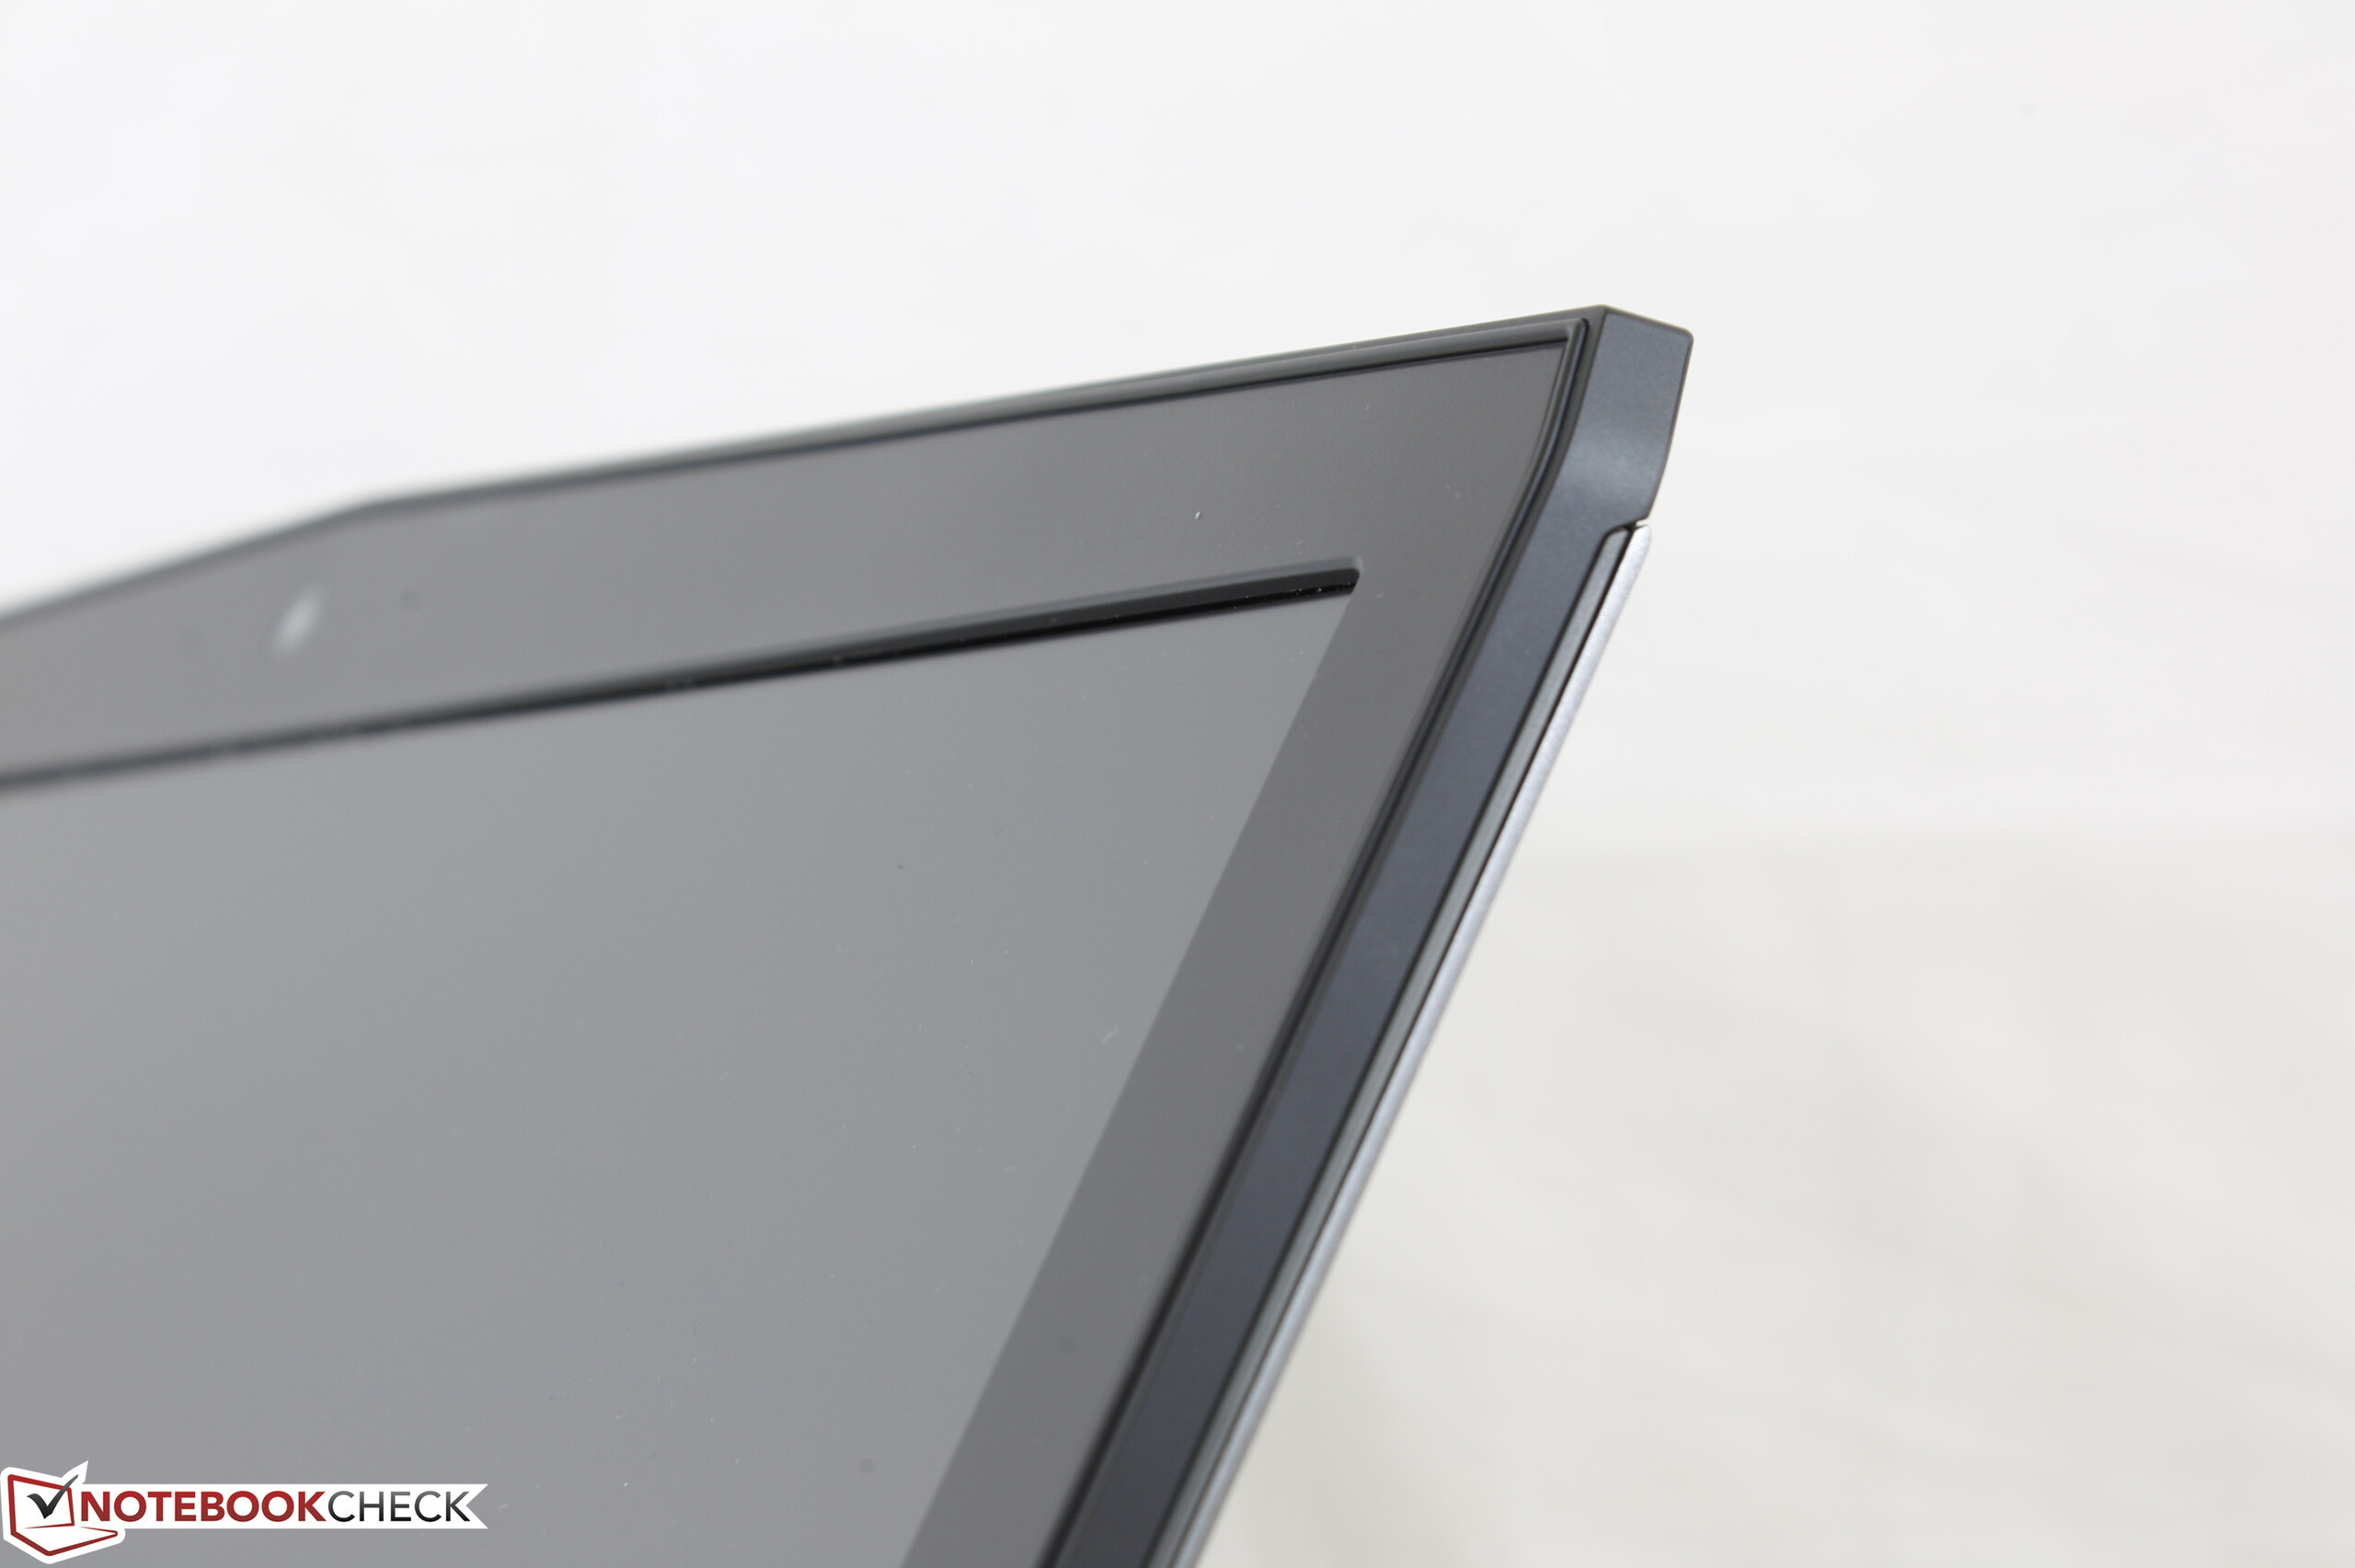
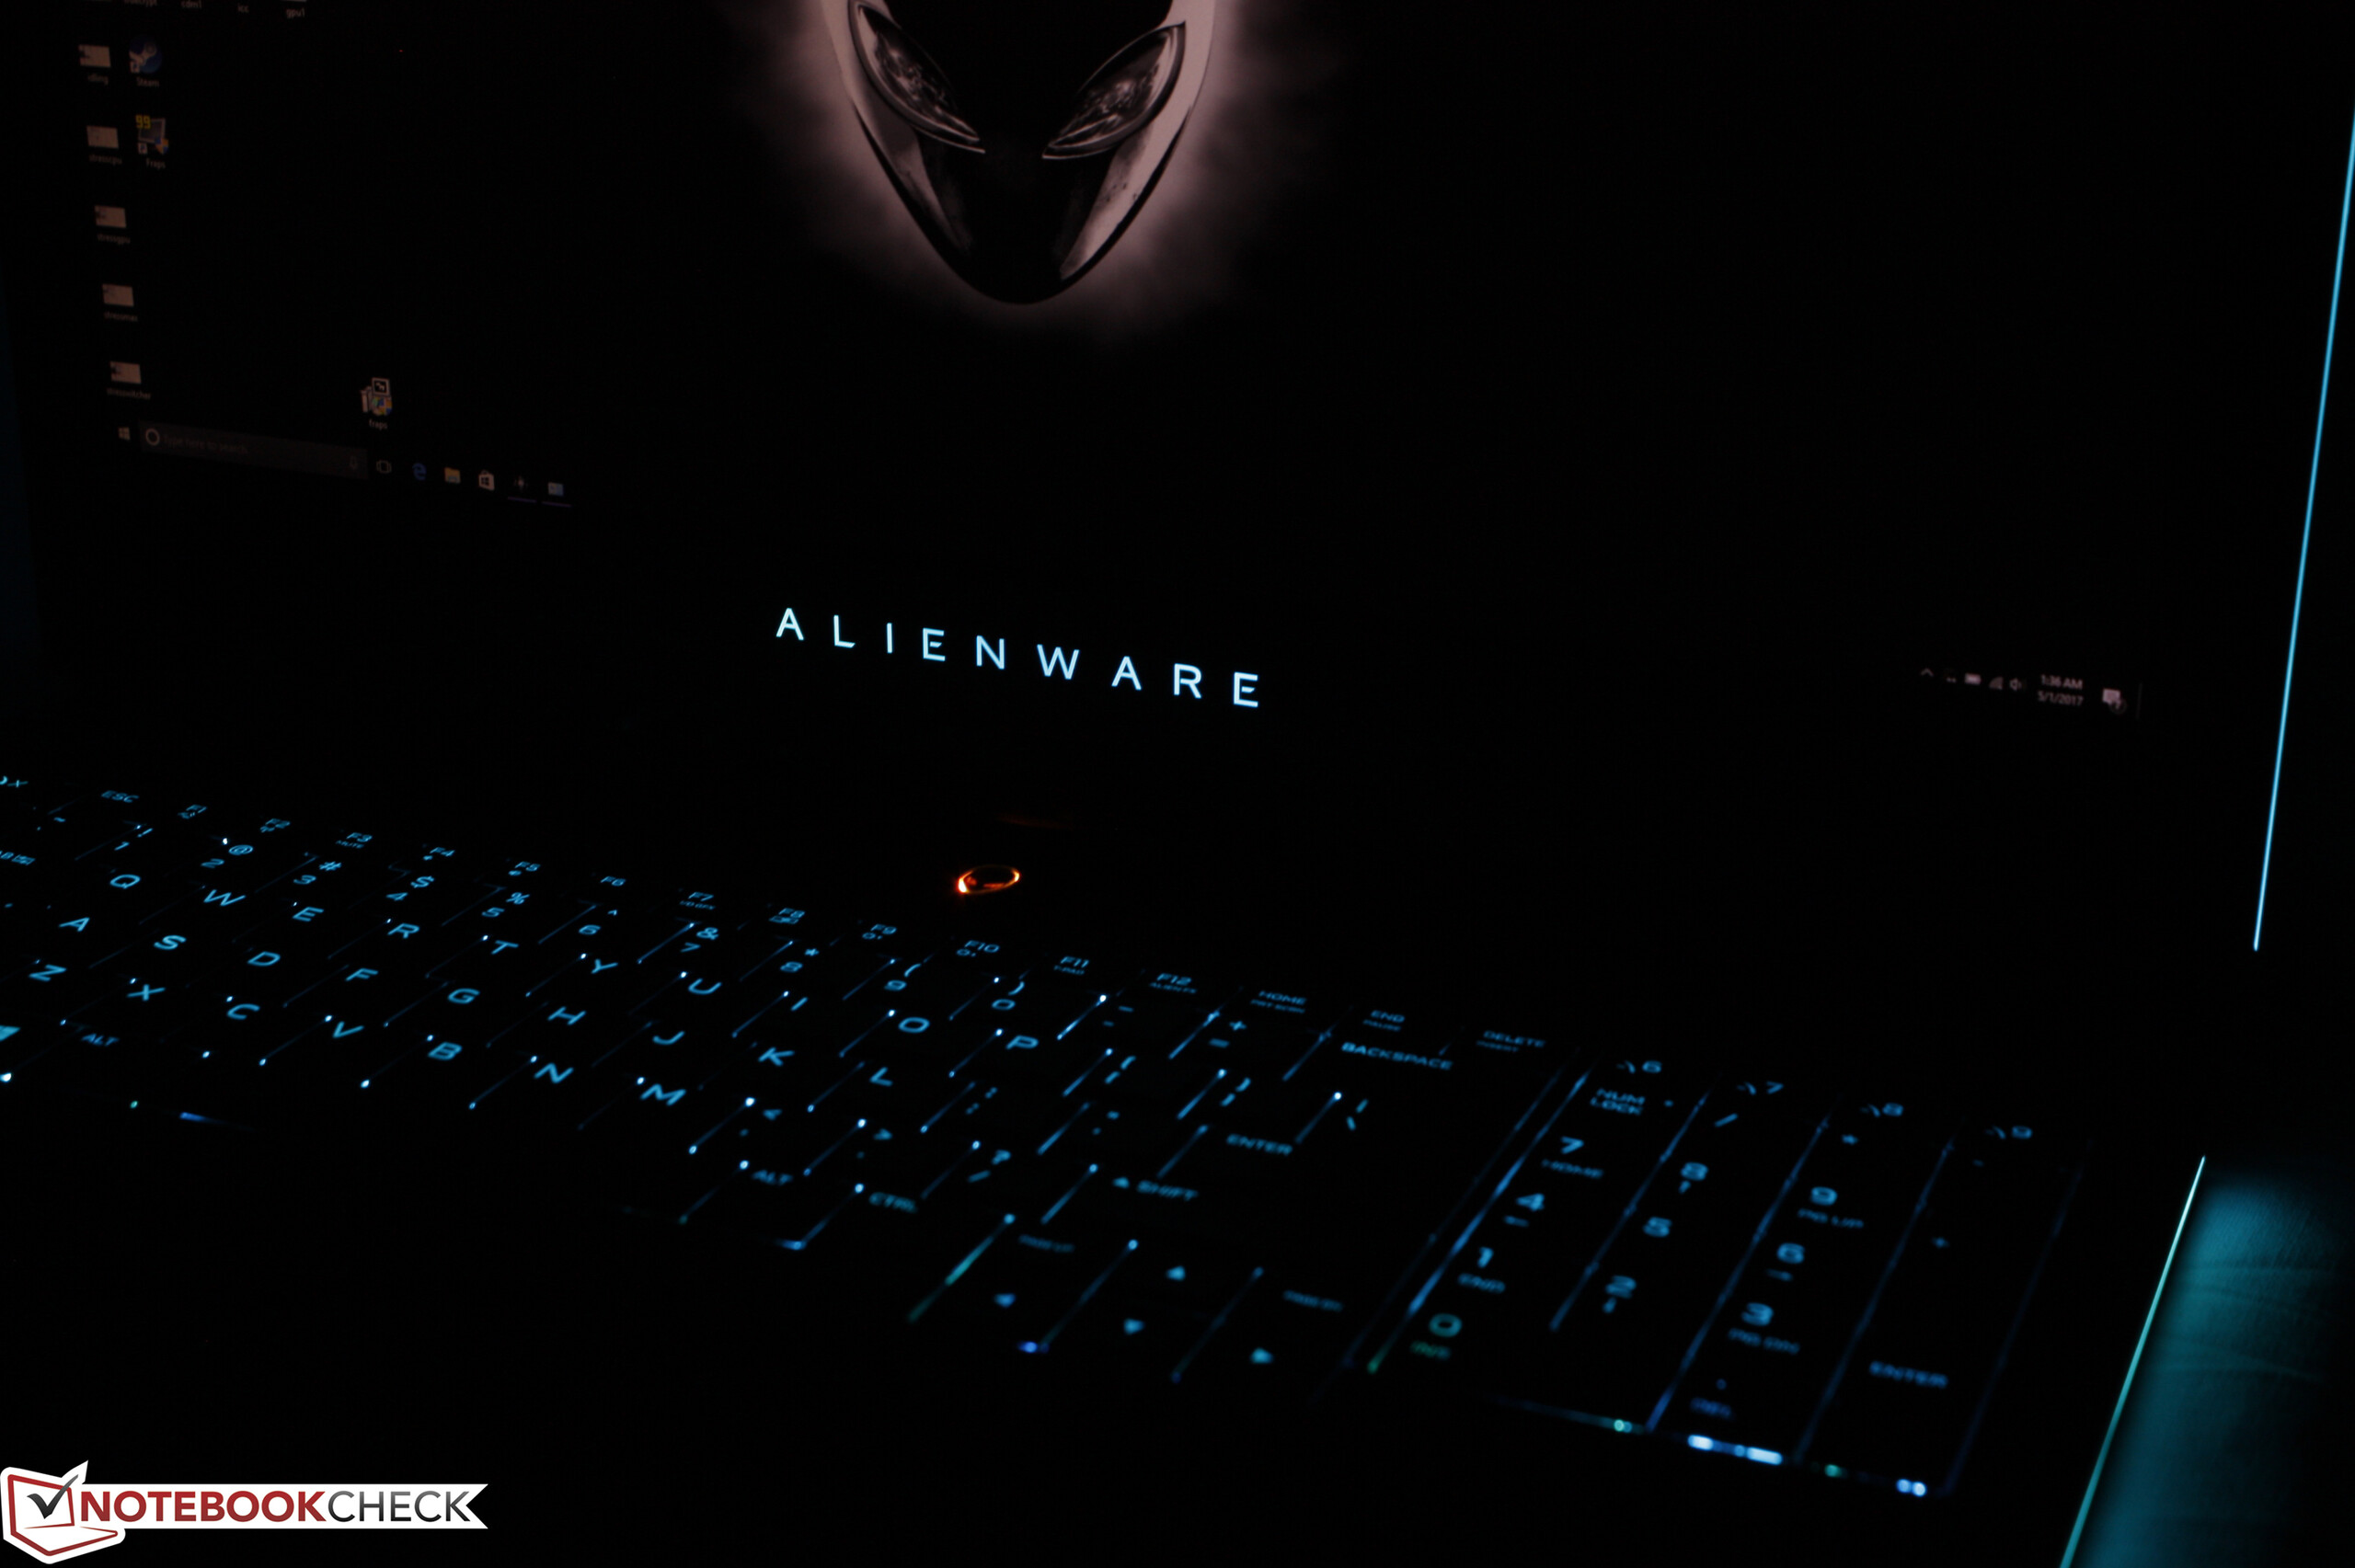
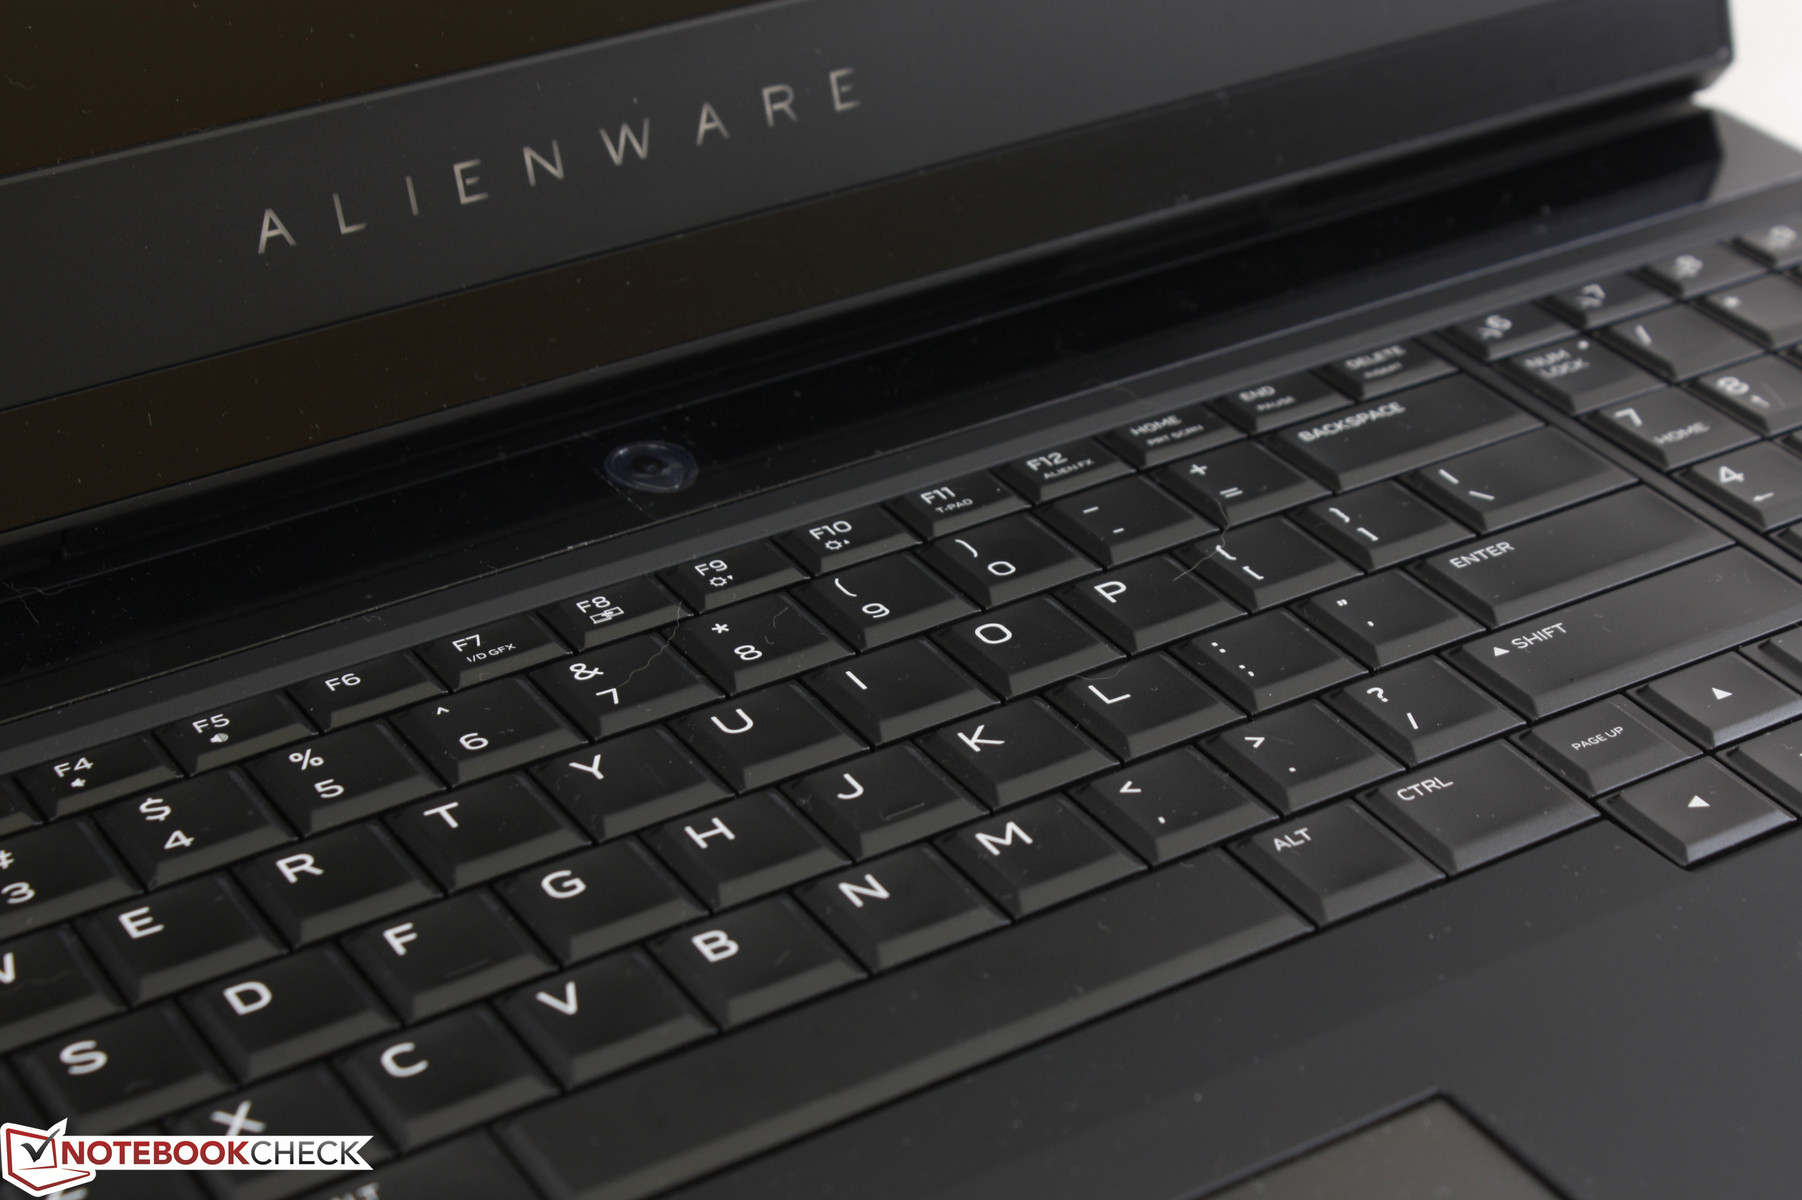
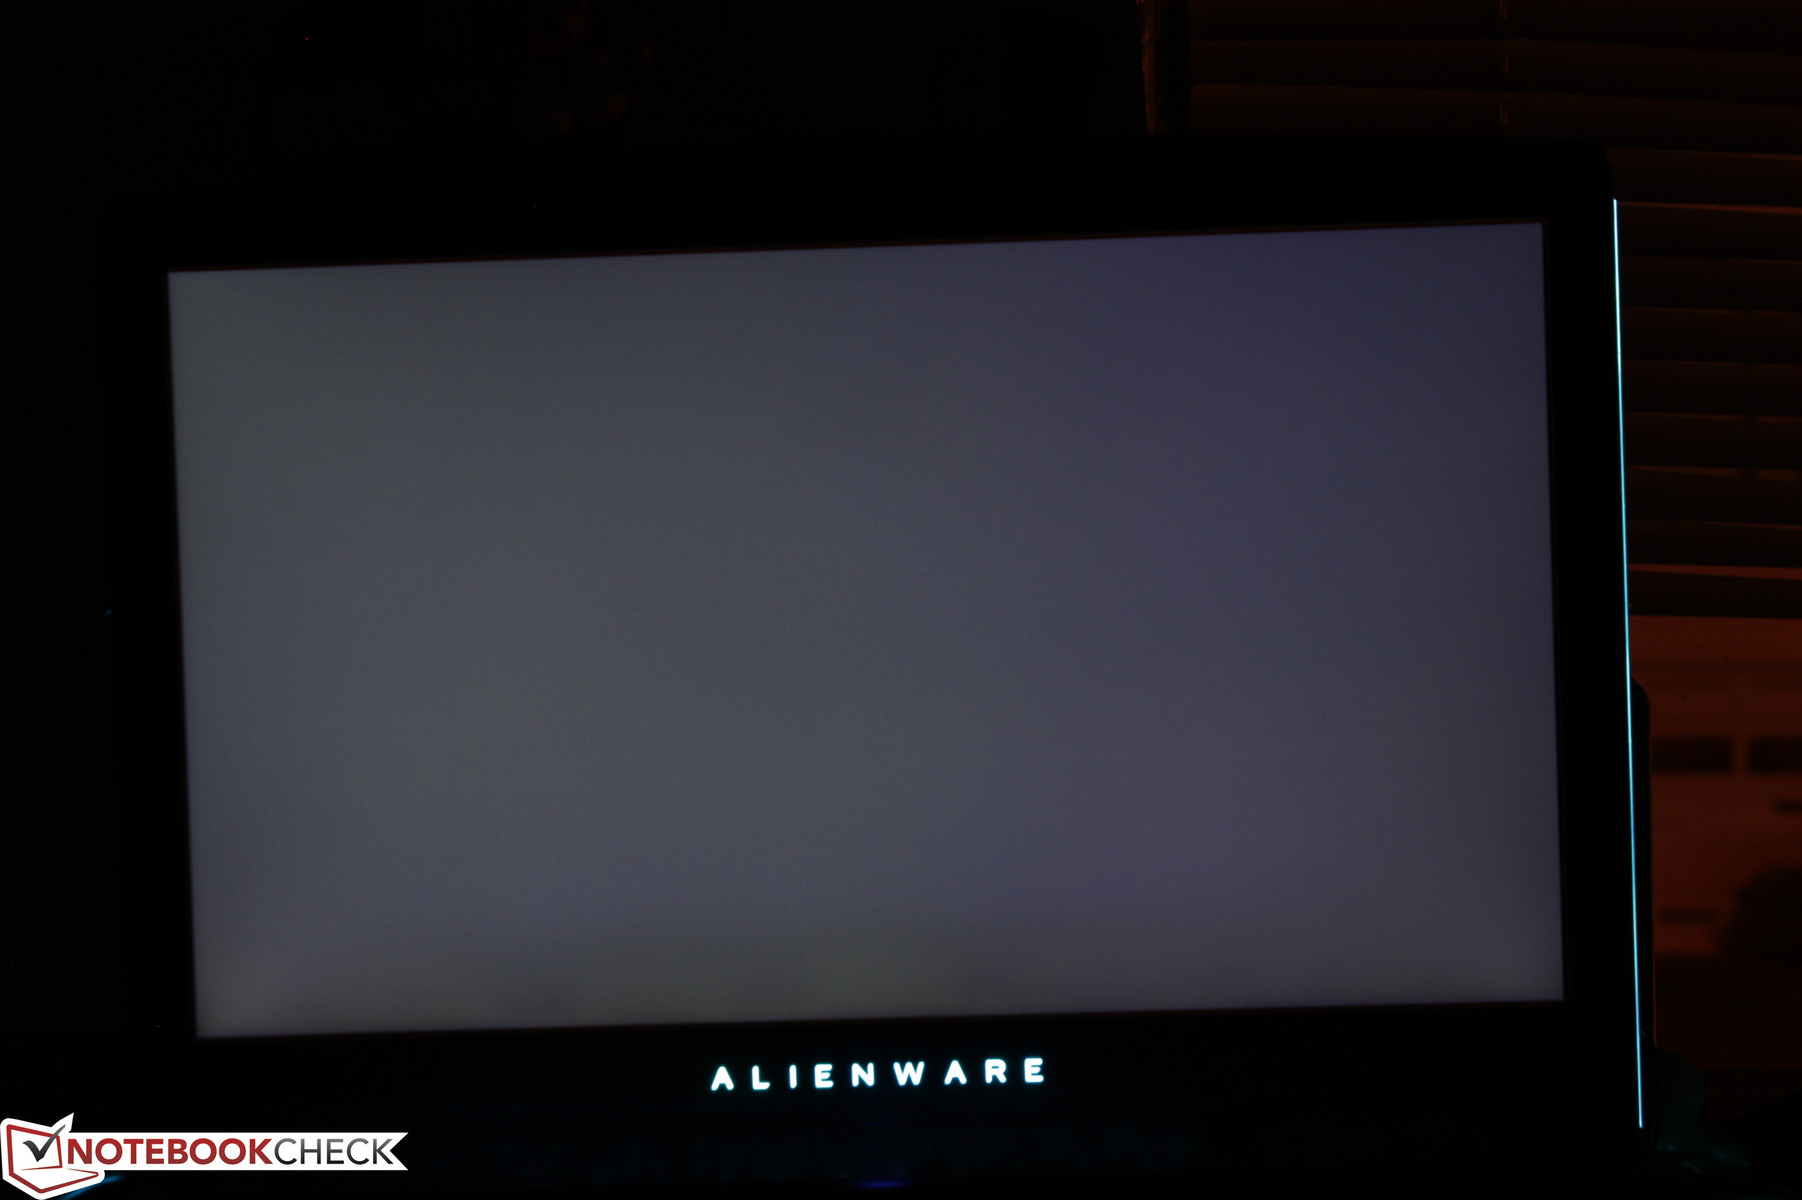
In terms of rigidity, the base feels very thick with no warping or bending and almost no creaking when attempting to twist the unit. The lid is naturally more flexible around its front corners, but it is otherwise firm on its outer surface and comparatively stiffer than the lids of the MSI GT series and Asus ROG series. One complaint is that the lid and its hinges will always creak when opening and closing the display. It's not significant enough to be a concern, though it certainly feels out of place on a system in this price range. We can otherwise notice no unintended gaps or protruding surfaces around the unit with the small exception of its inner display bezel. As shown by our image below, some blue light bleed from the Alienware logo can be seen as the bezel does not sit completely flat against the screen, but this is nowhere near as bad as on our previous GT72VR test unit and is unnoticeable during everyday use.
The dark keyboard keys and textured palm rests tend to attract and show fingerprints rather quickly in contrast to the outer lid. Expect the base and commonly used keys to become glossy over time from the accumulation of oils.
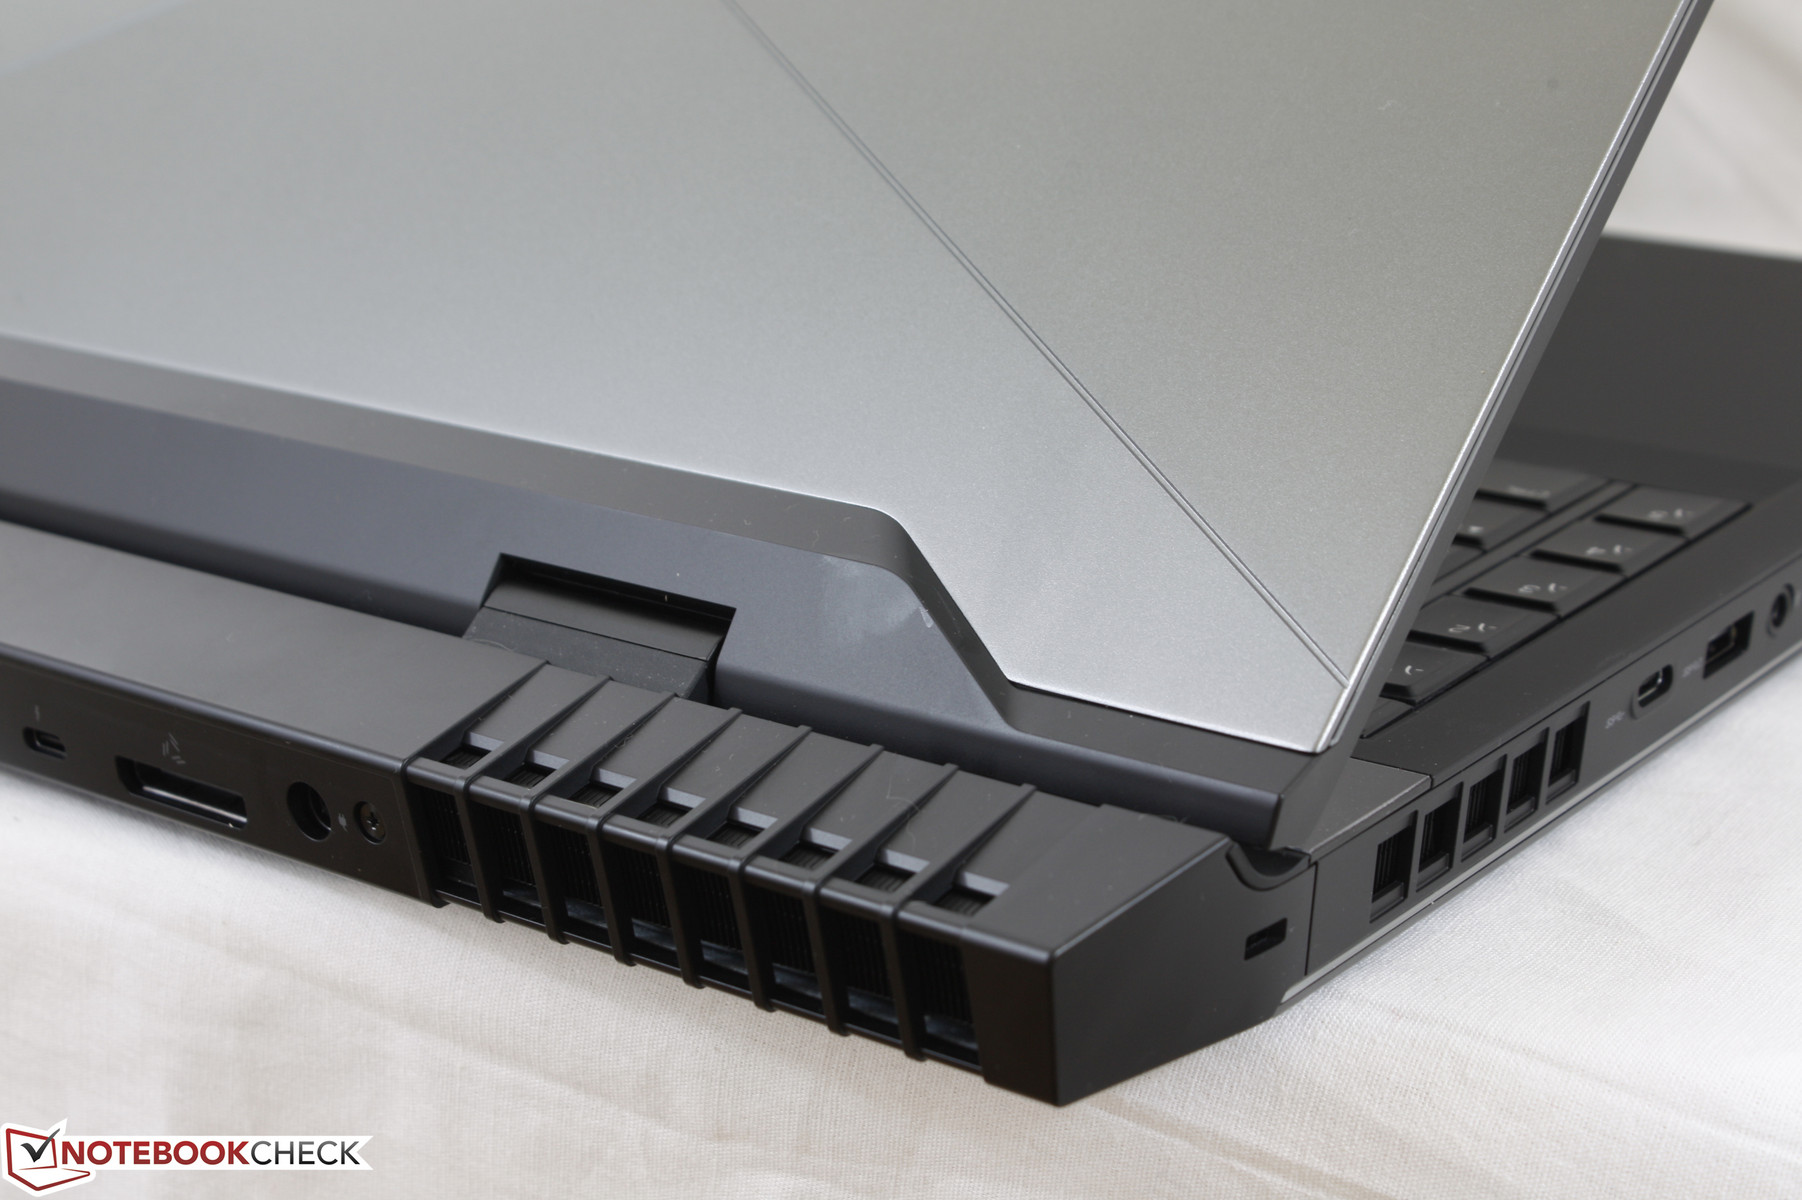
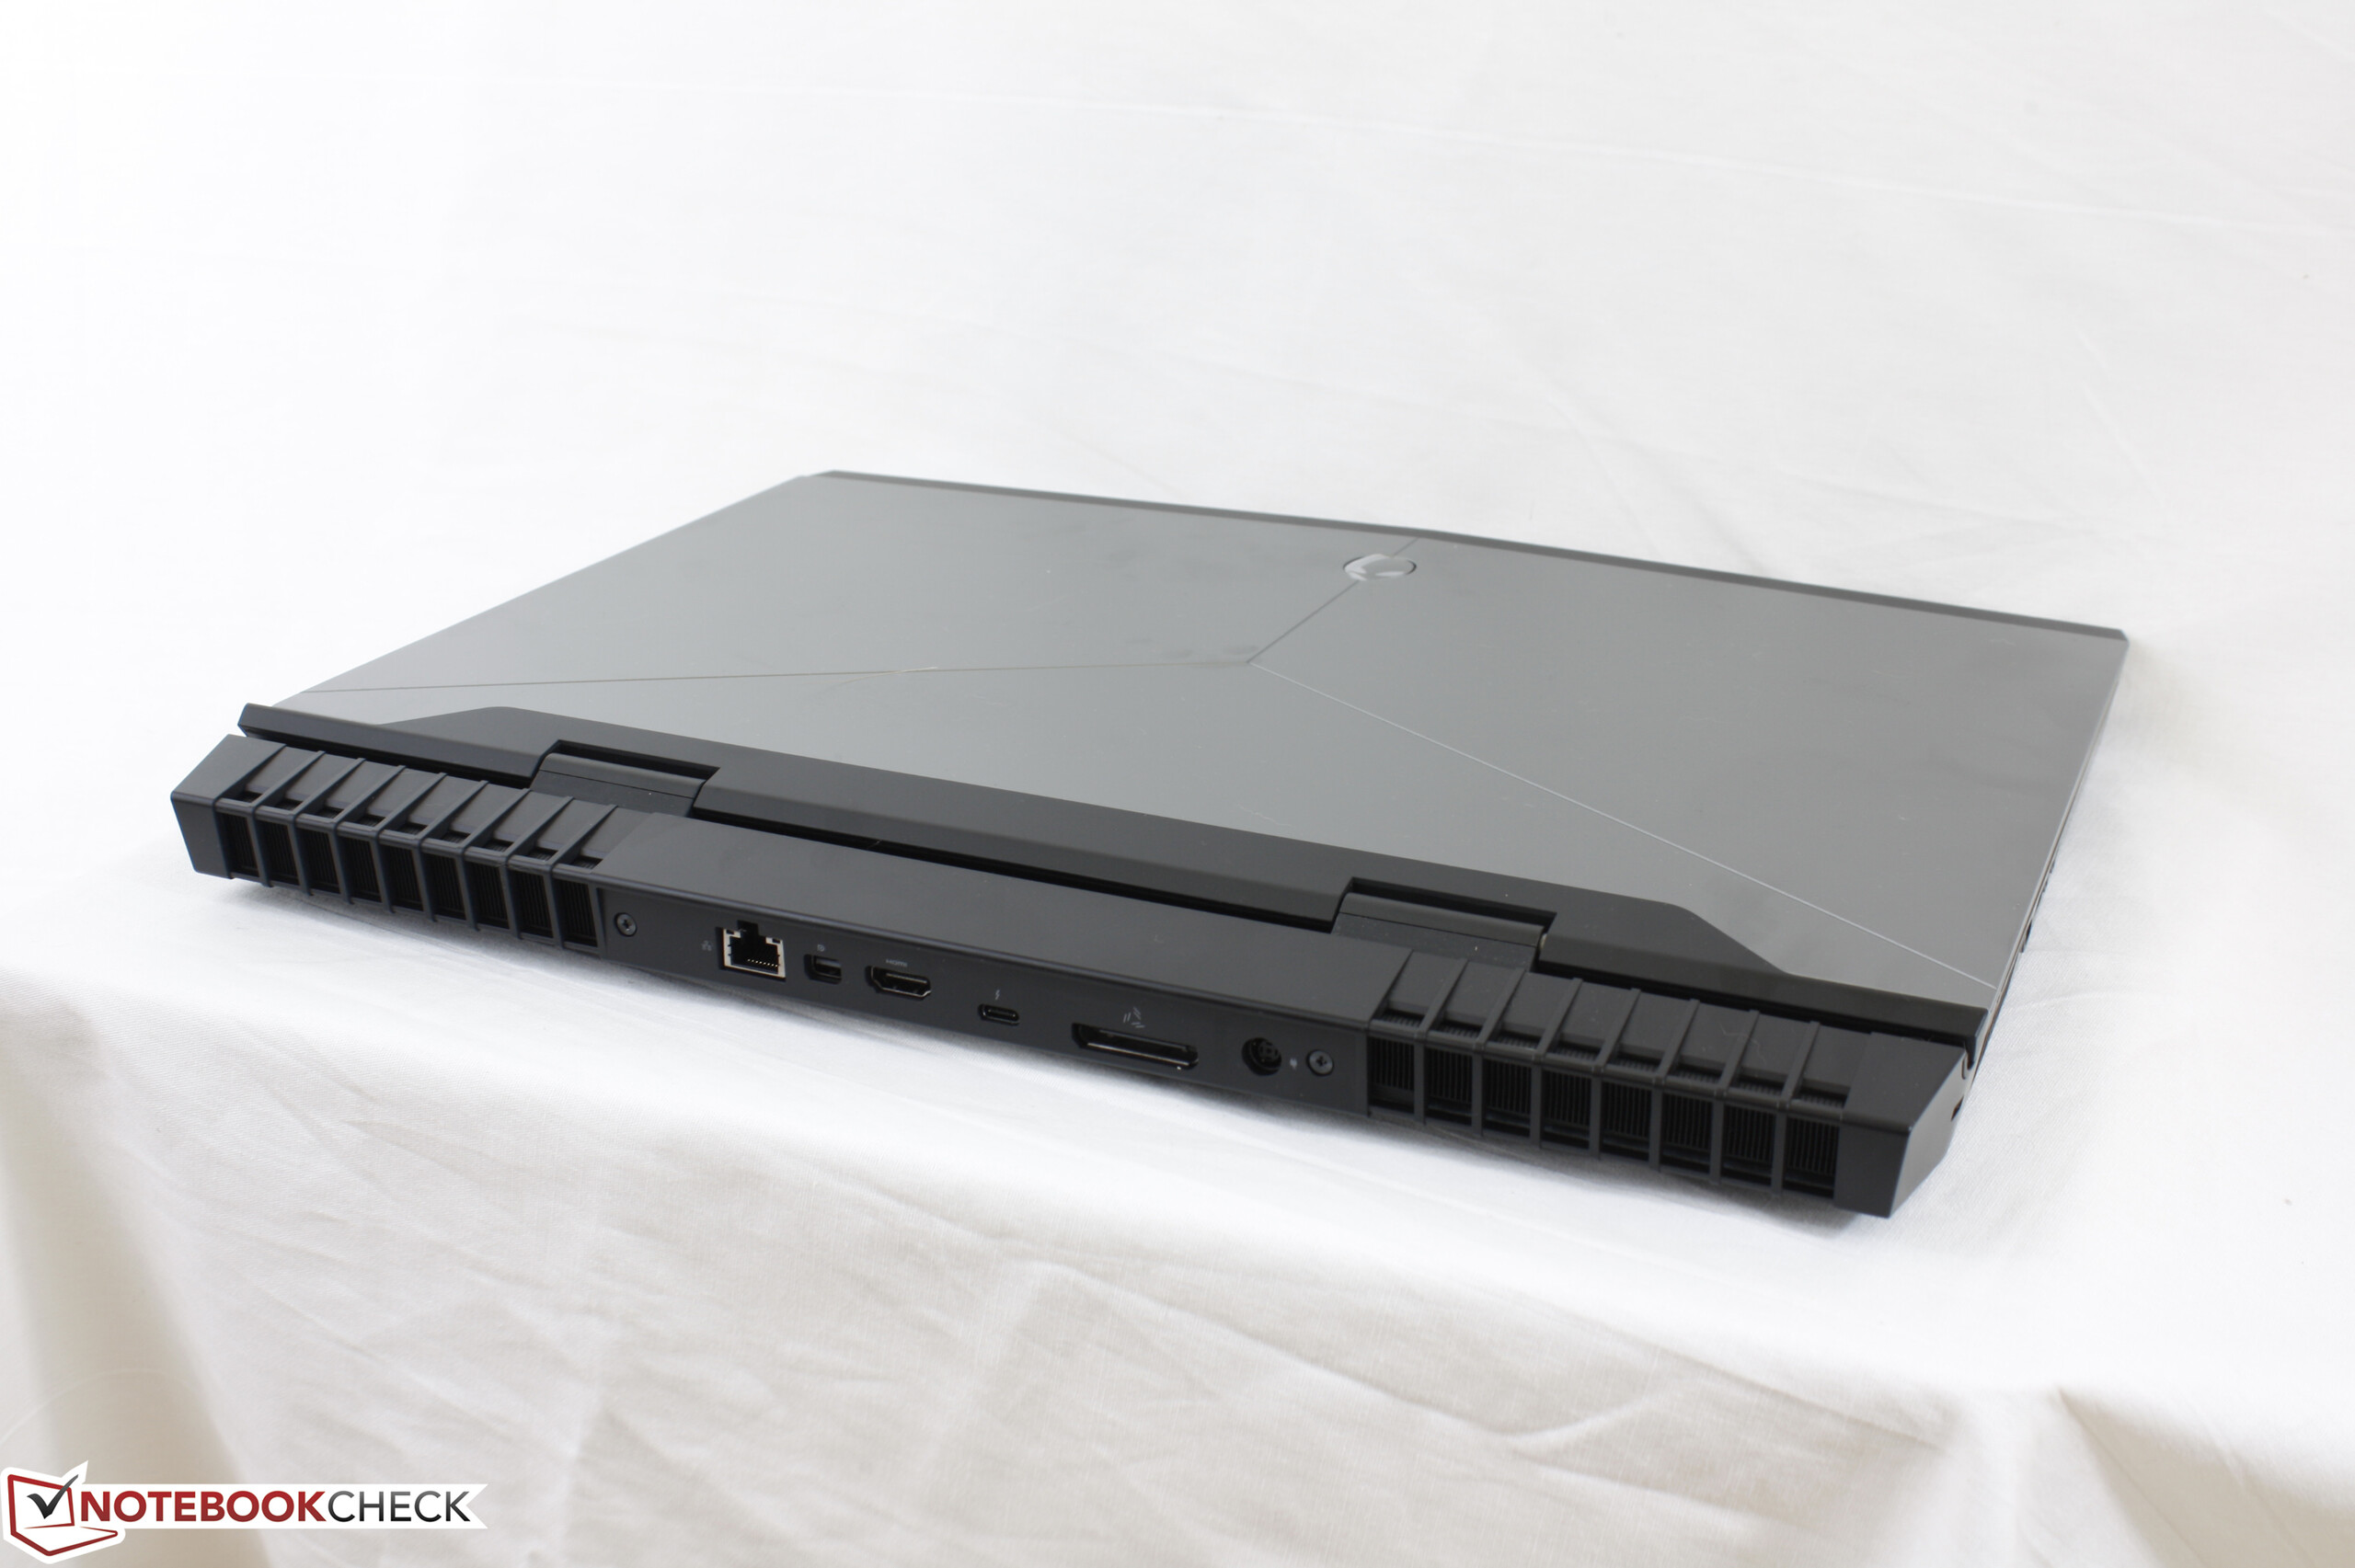
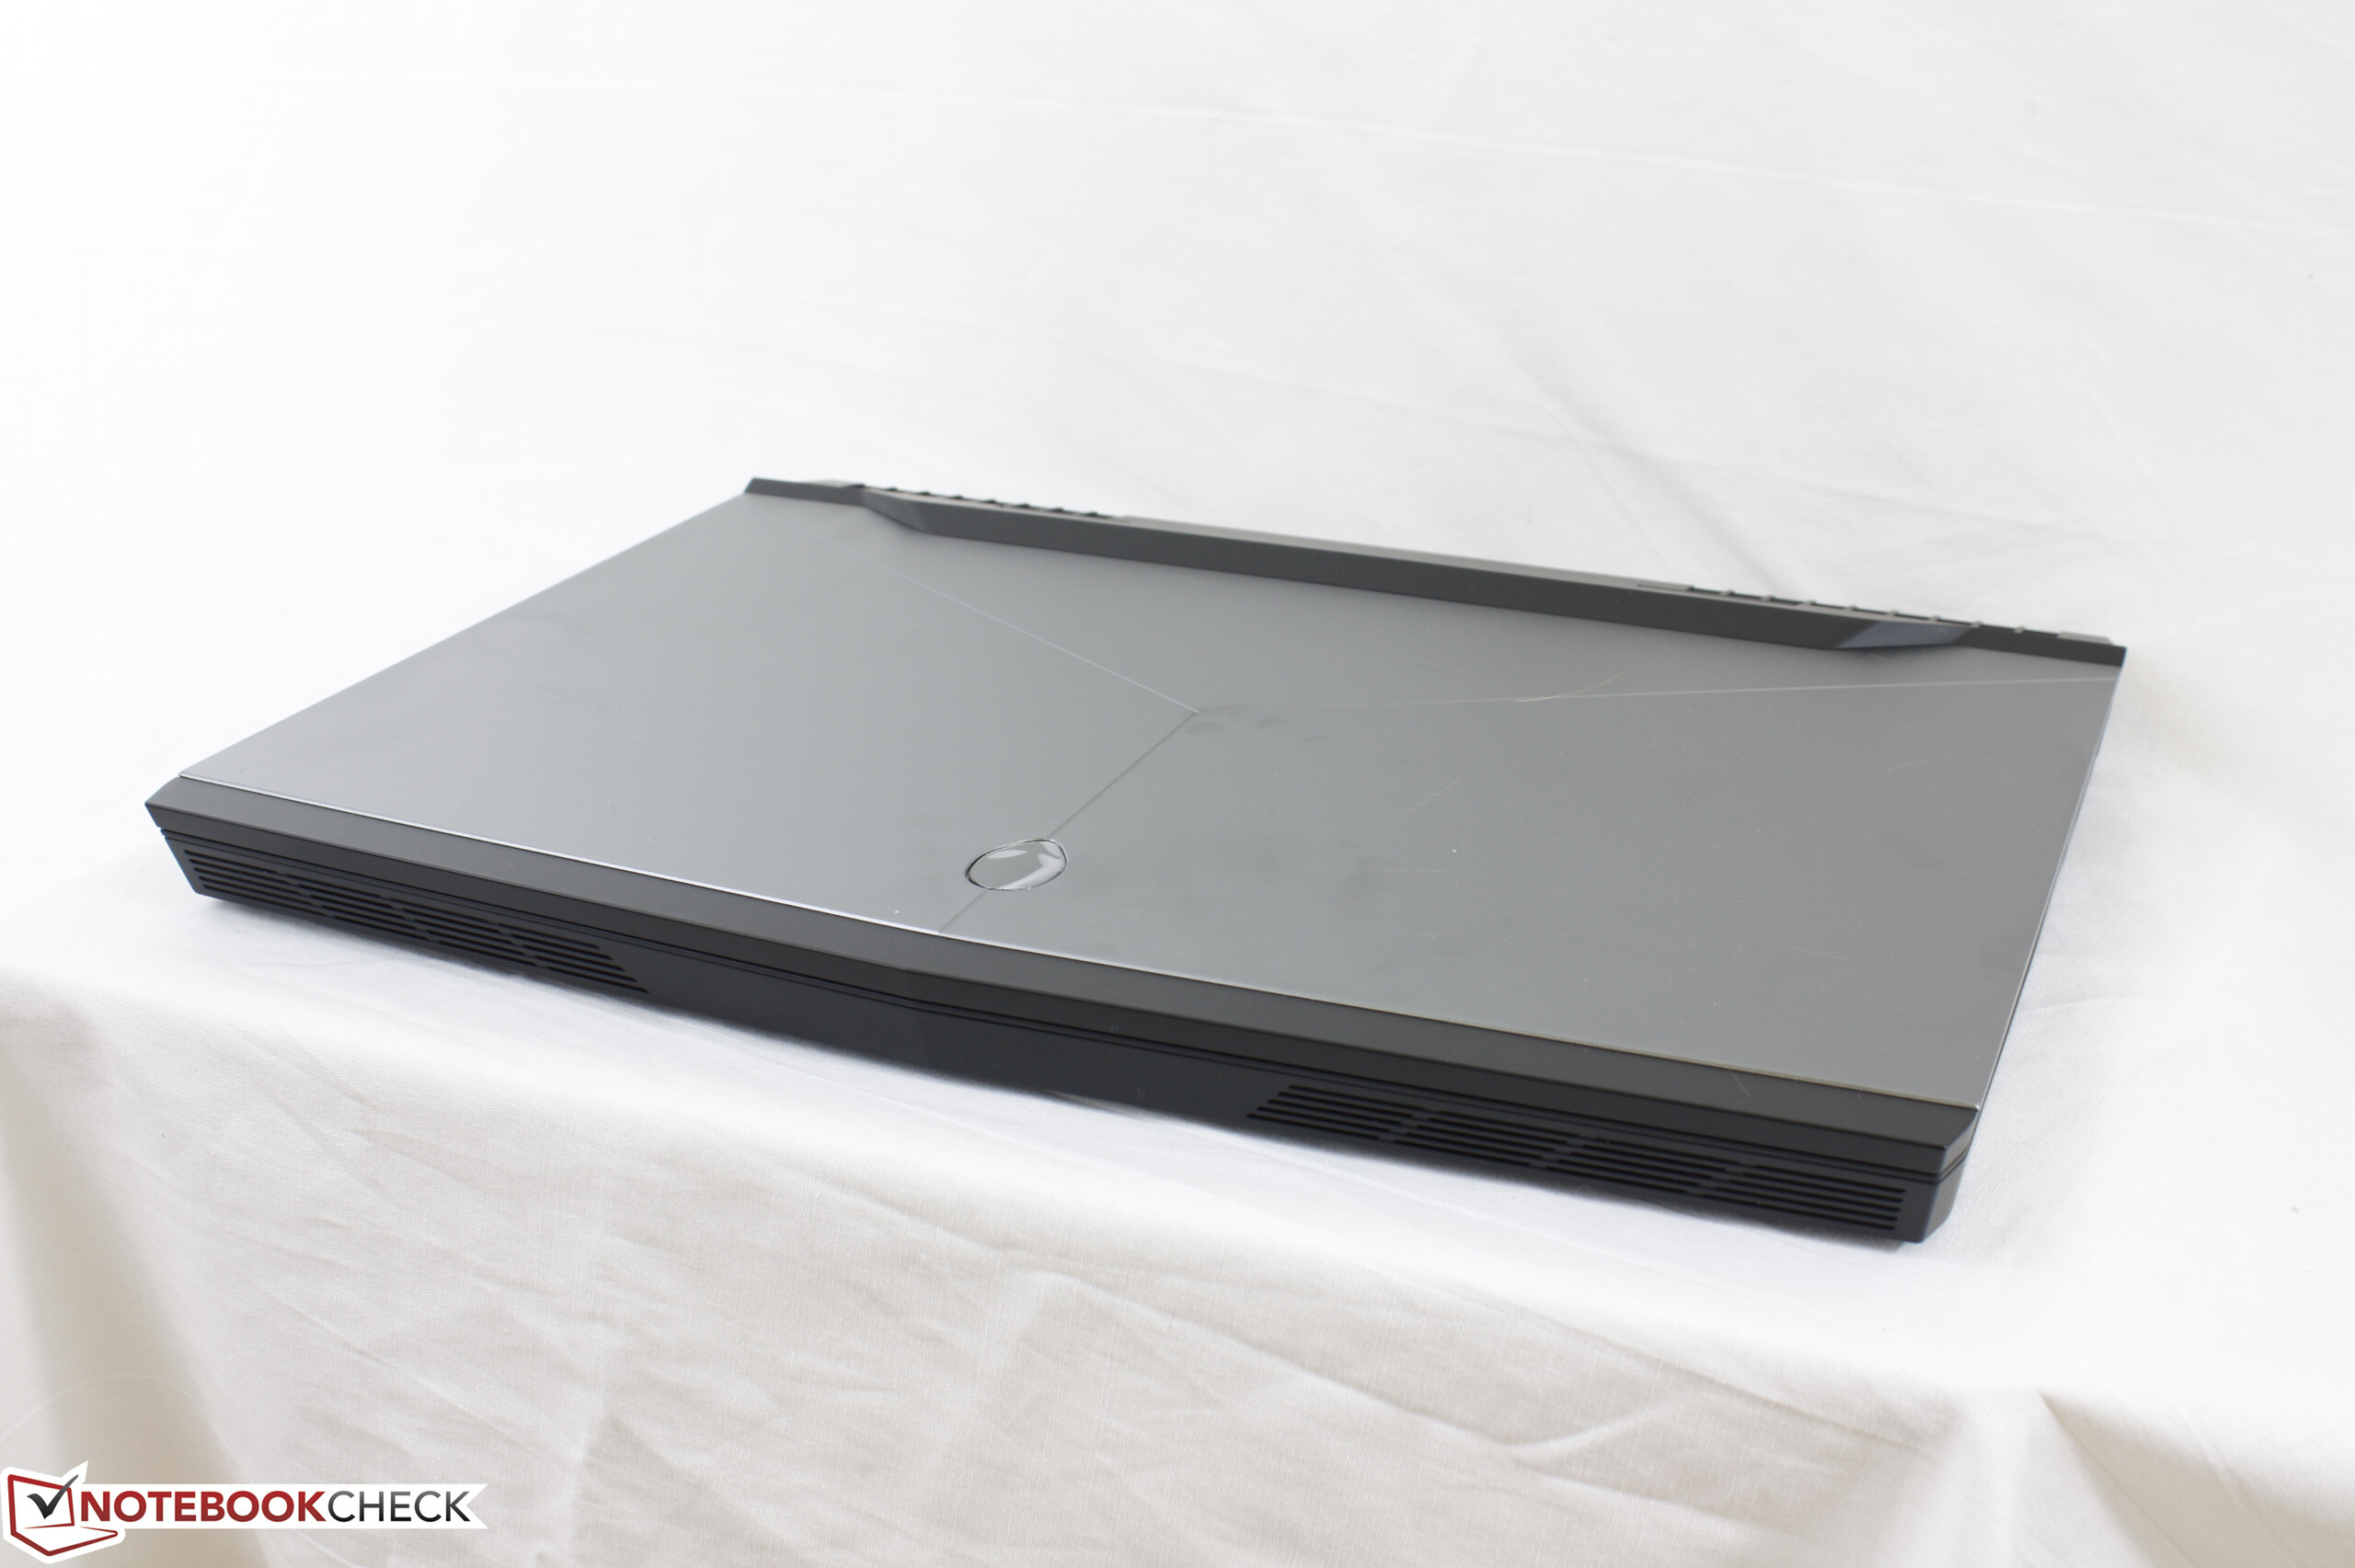
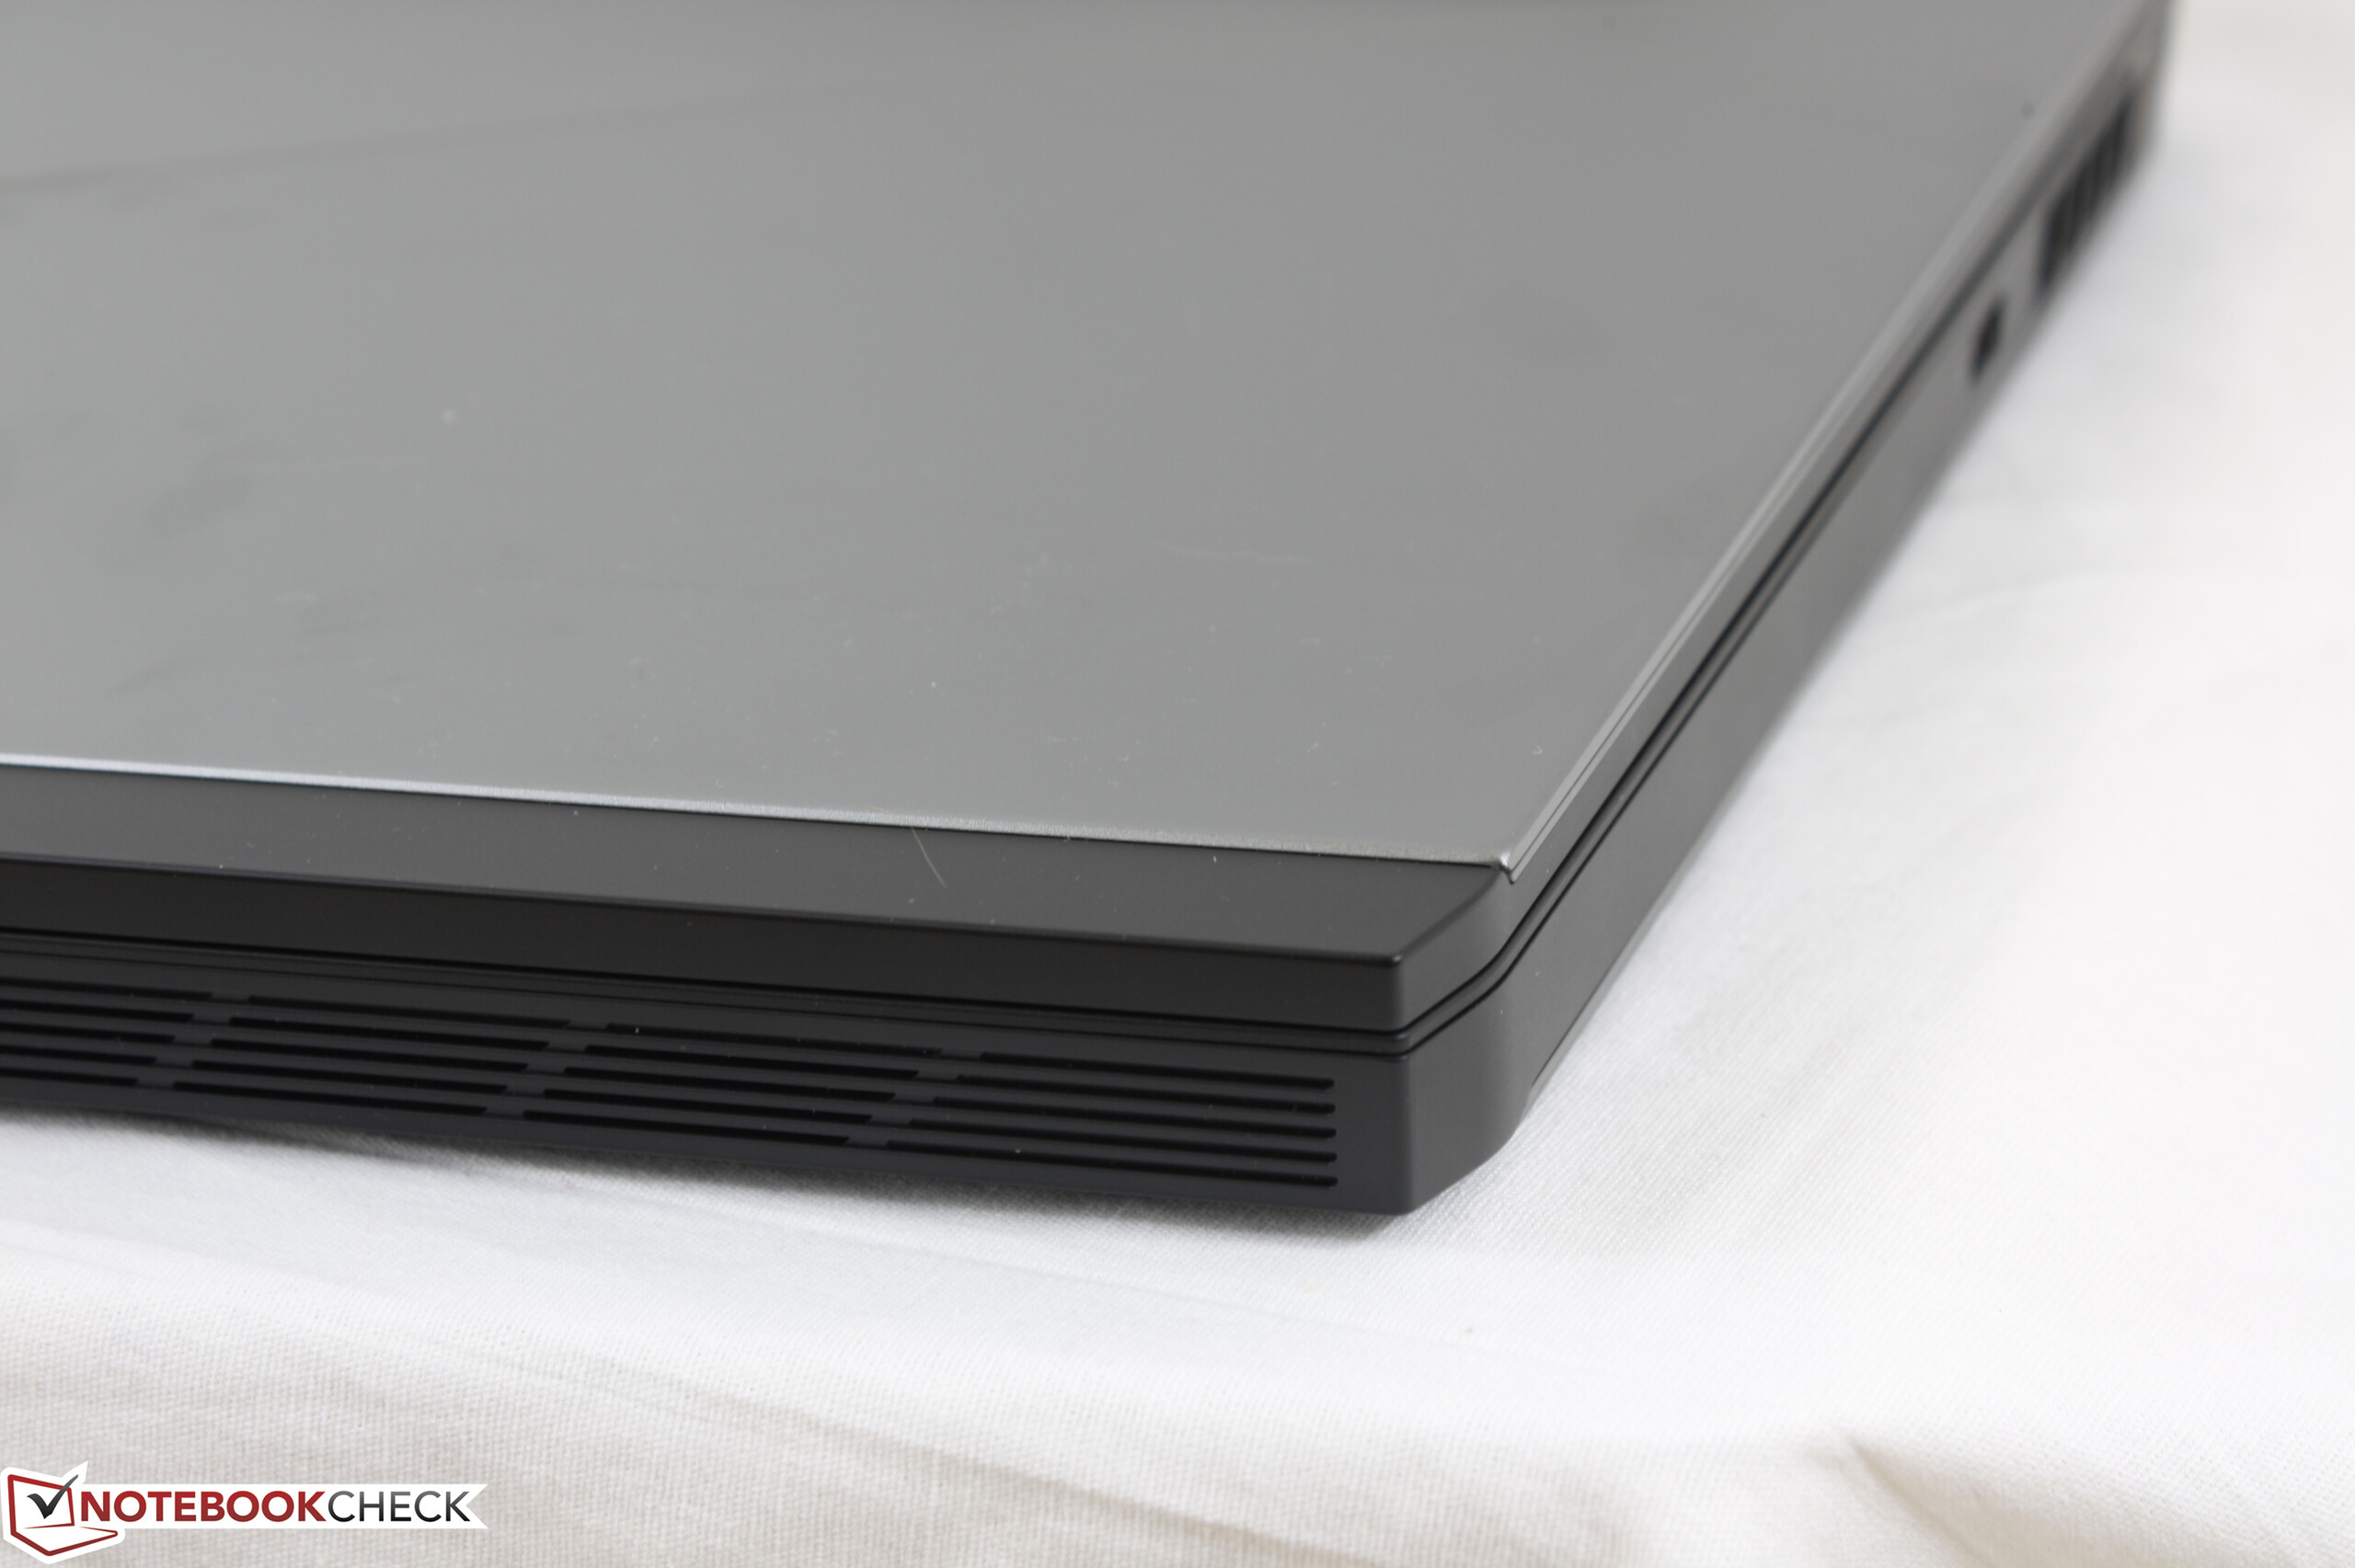
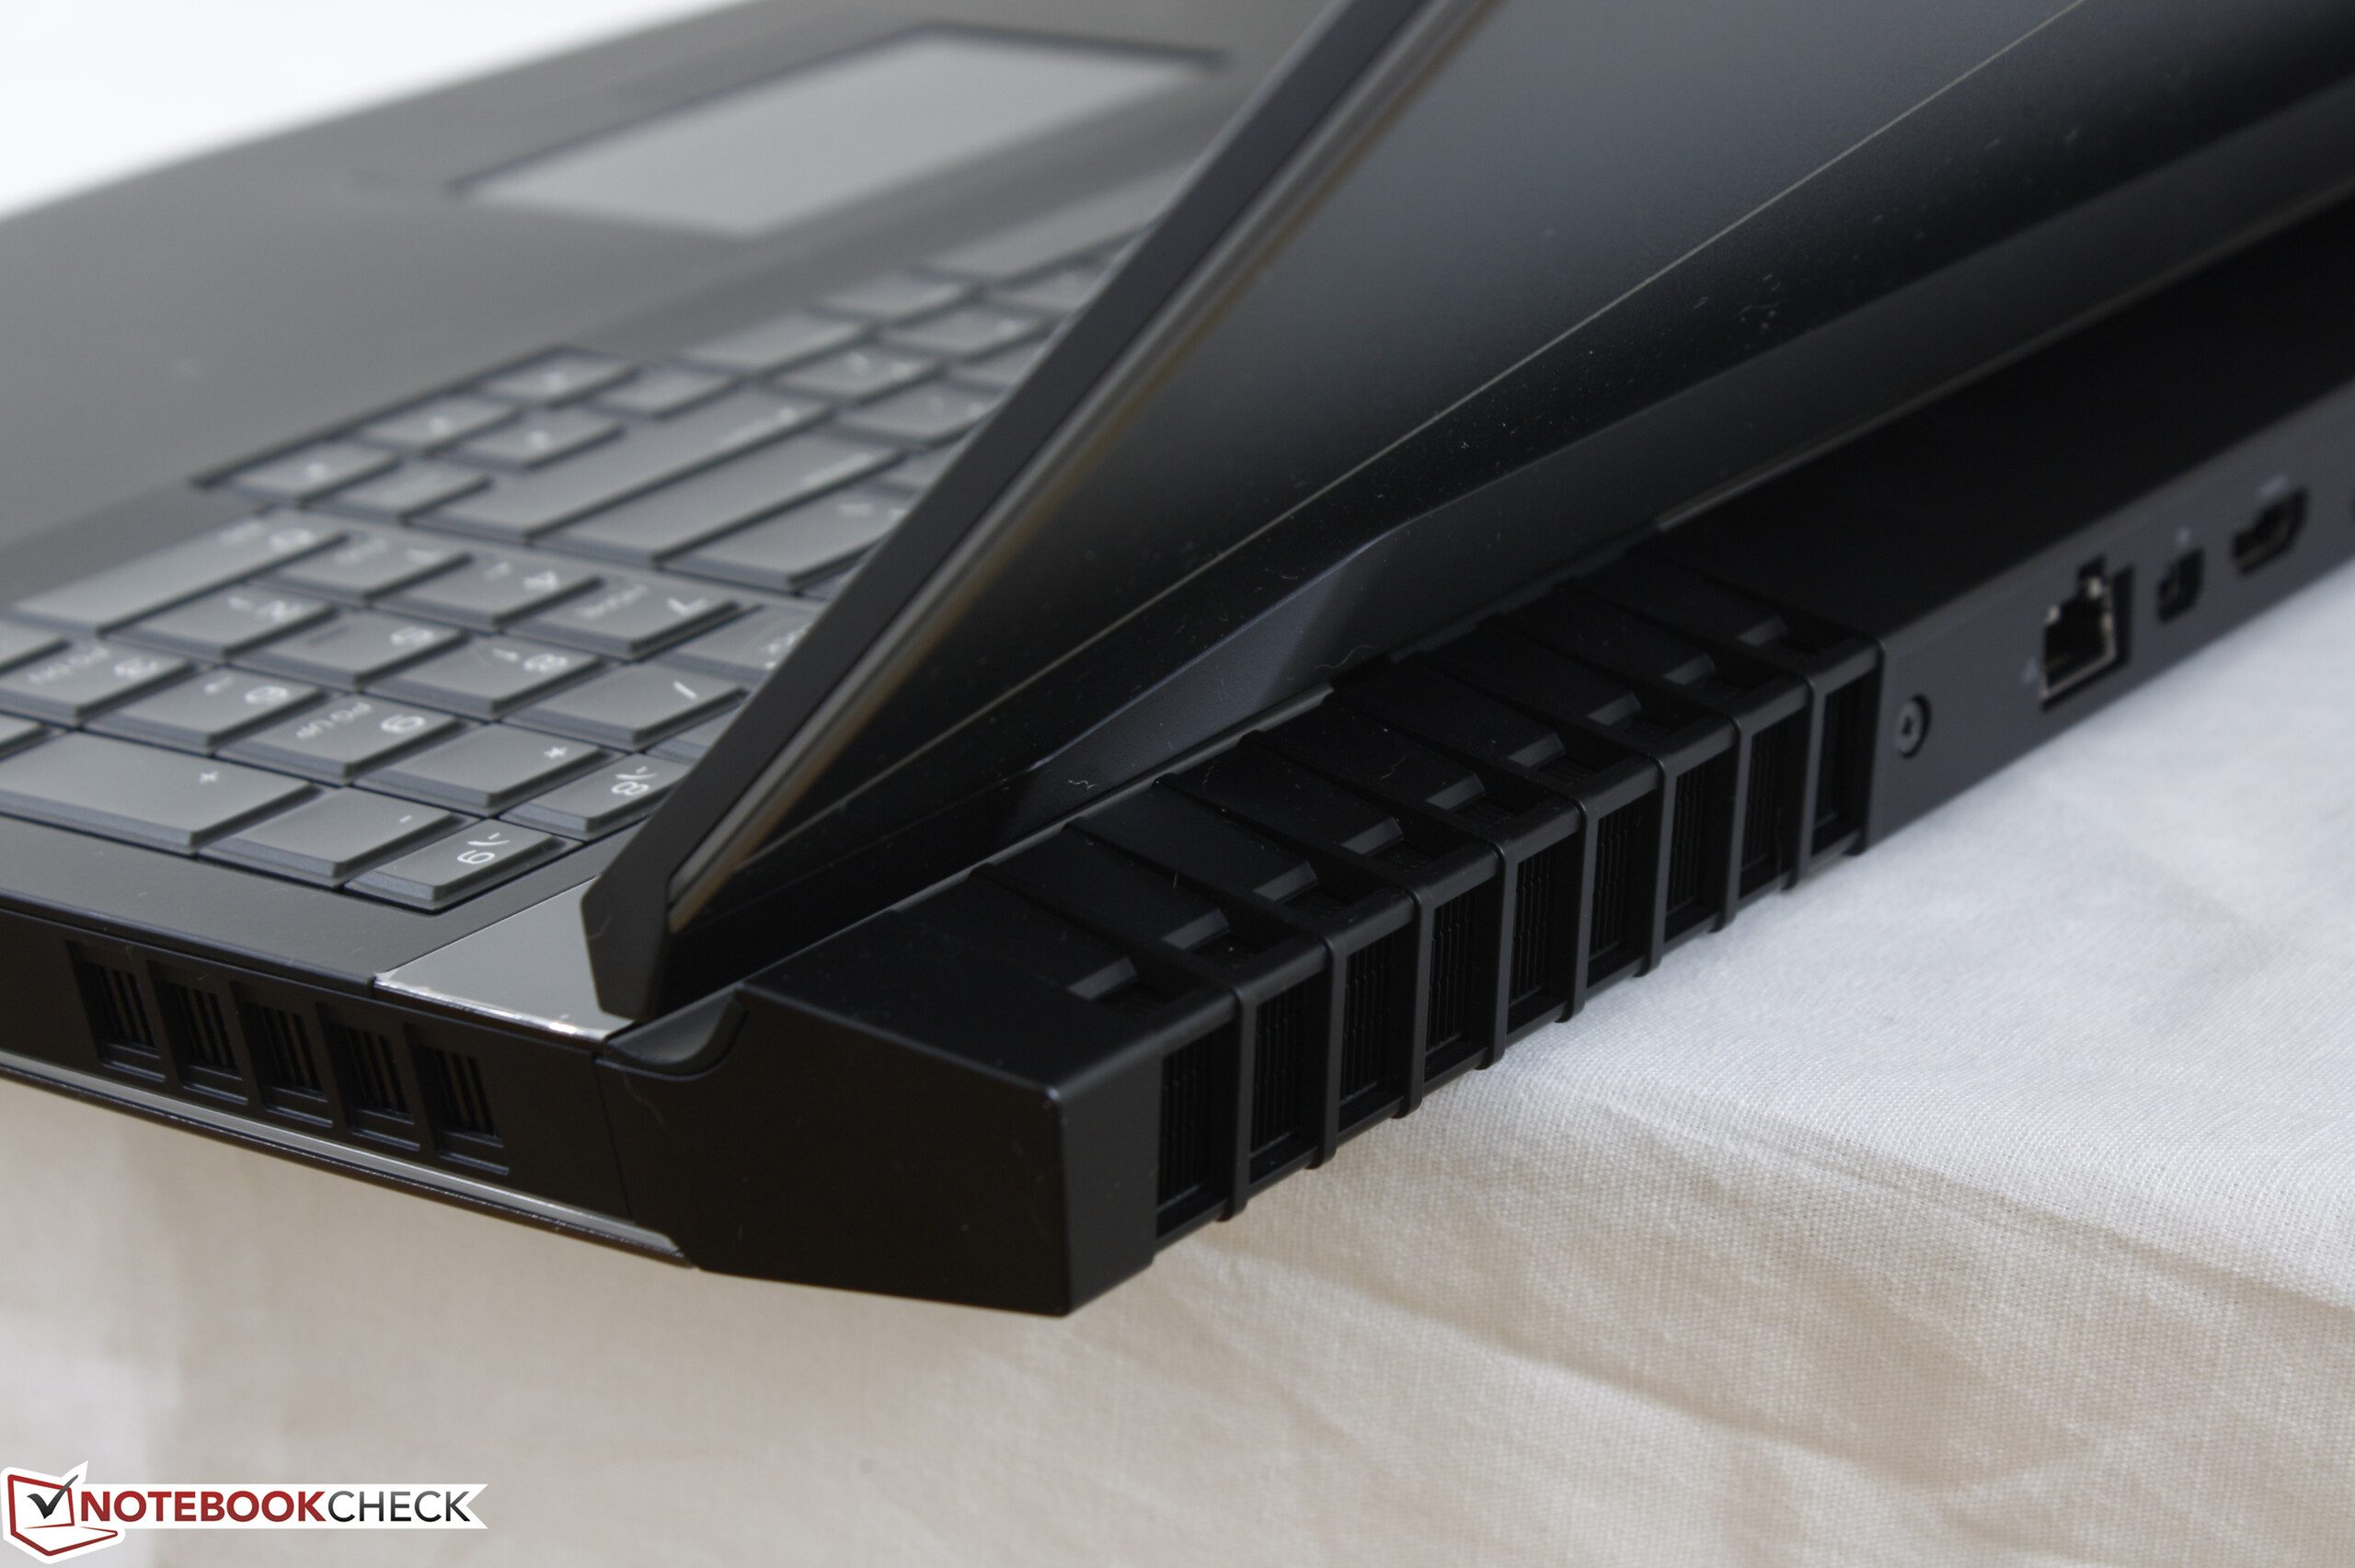
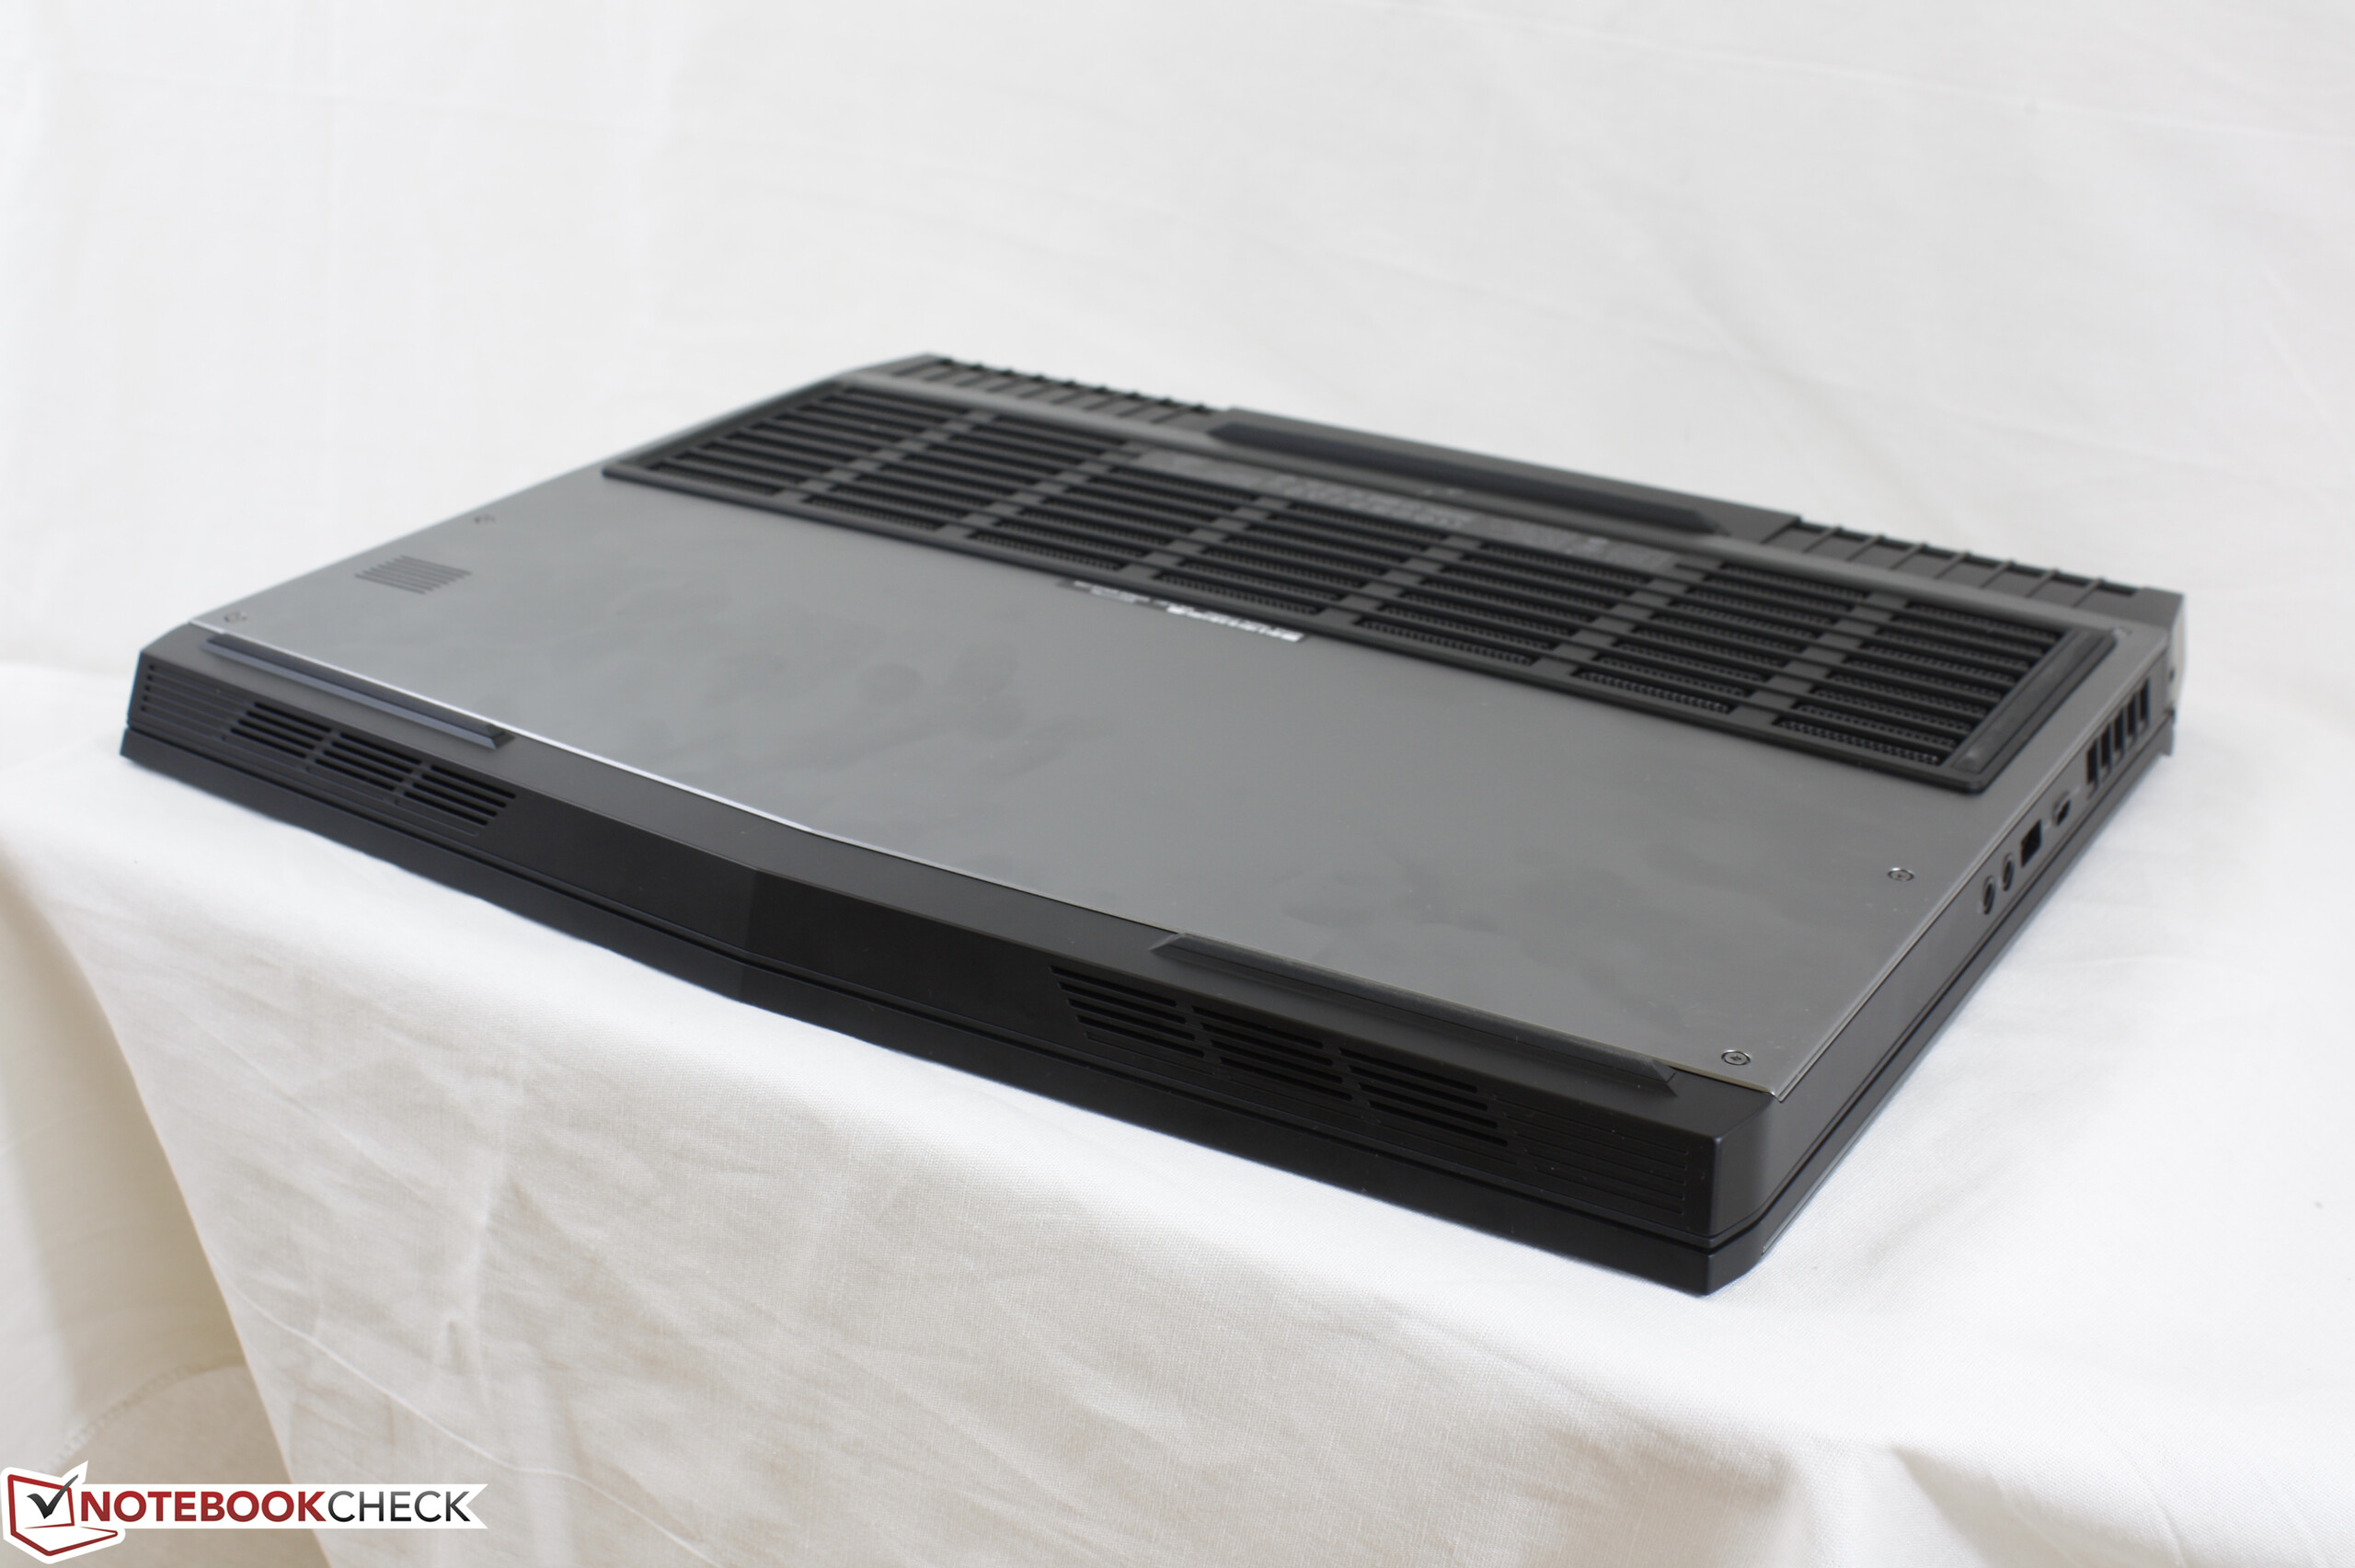
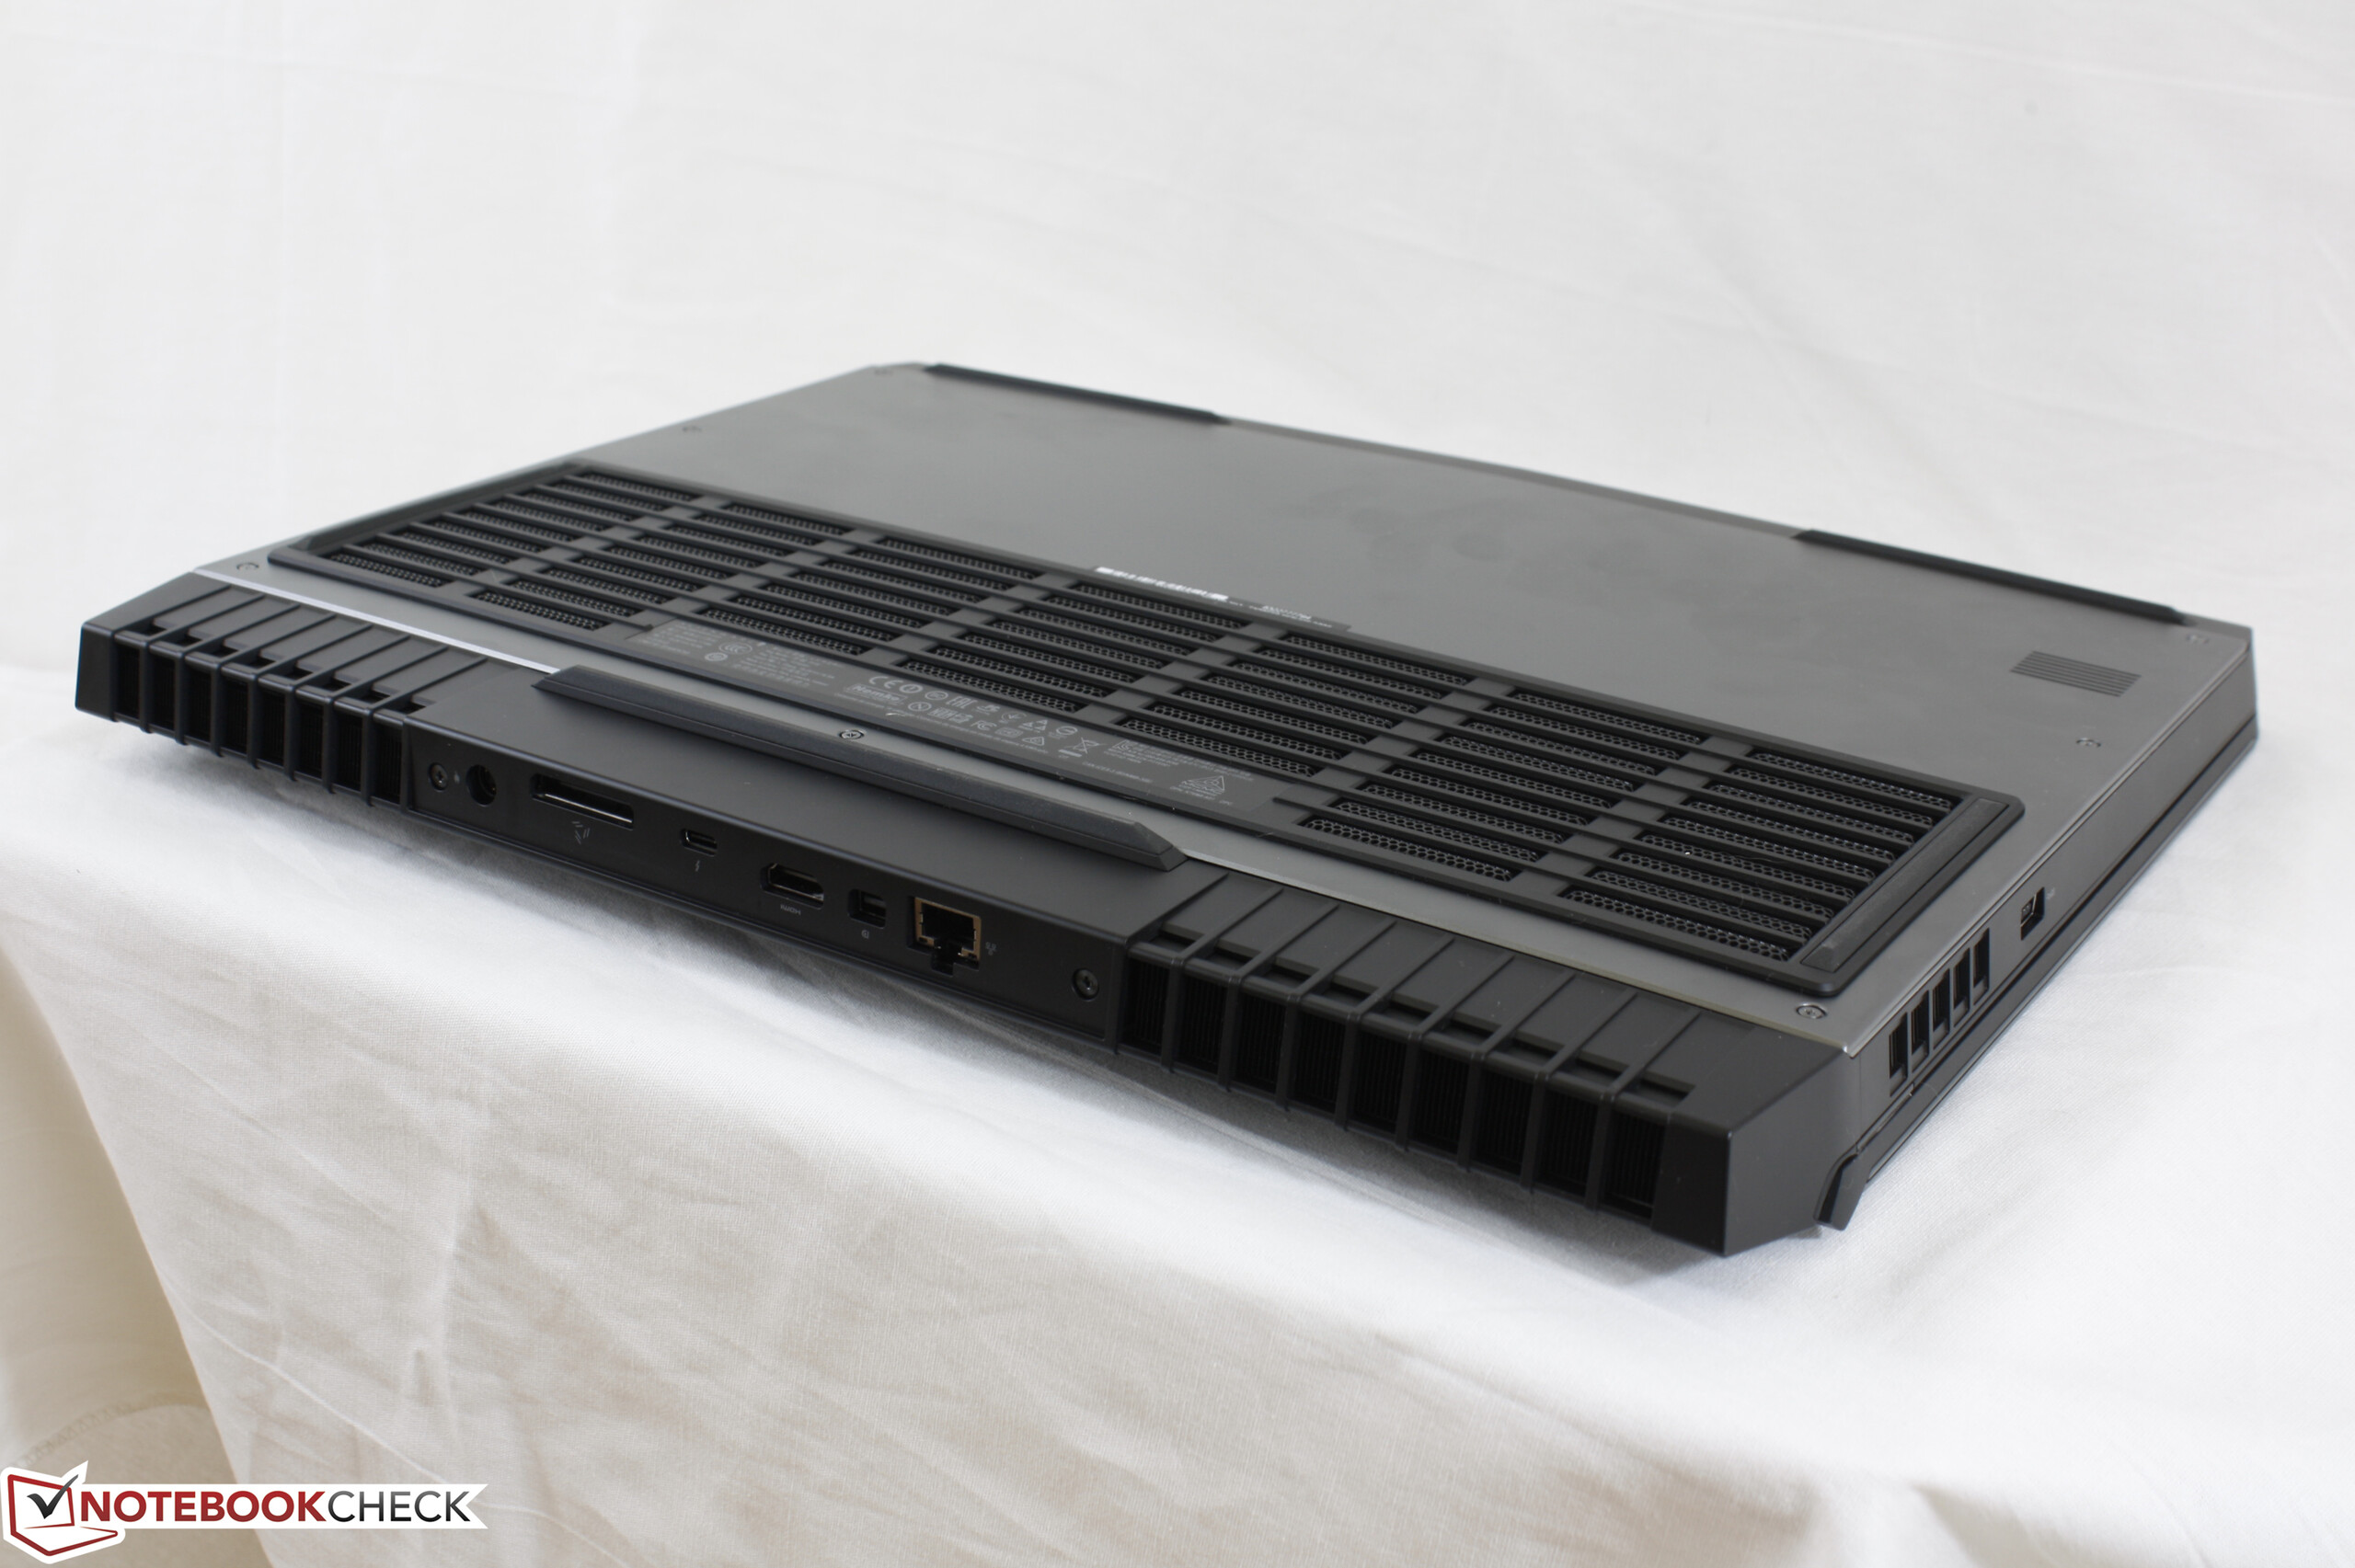
The addition of "jet engine" rear ventilation grilles on the 17 R4 has bumped up both the length and weight of the notebook significantly. The 17 R4 is about 700 g heavier than the 17 R3 while being 40 mm longer and 4 mm thinner. The result is a chassis that feels much denser than before and is one of the heaviest 17-inch gaming notebooks available alongside the vapor chamber-cooled Asus G752VY. In fact, the two are nearly identical in footprint whereas competing systems from MSI are noticeably smaller in length and width. We certainly appreciate the fact that the manufacturer is willing to make a heavier and larger successor instead of going the opposite direction where performance may subsequently suffer.
Connectivity
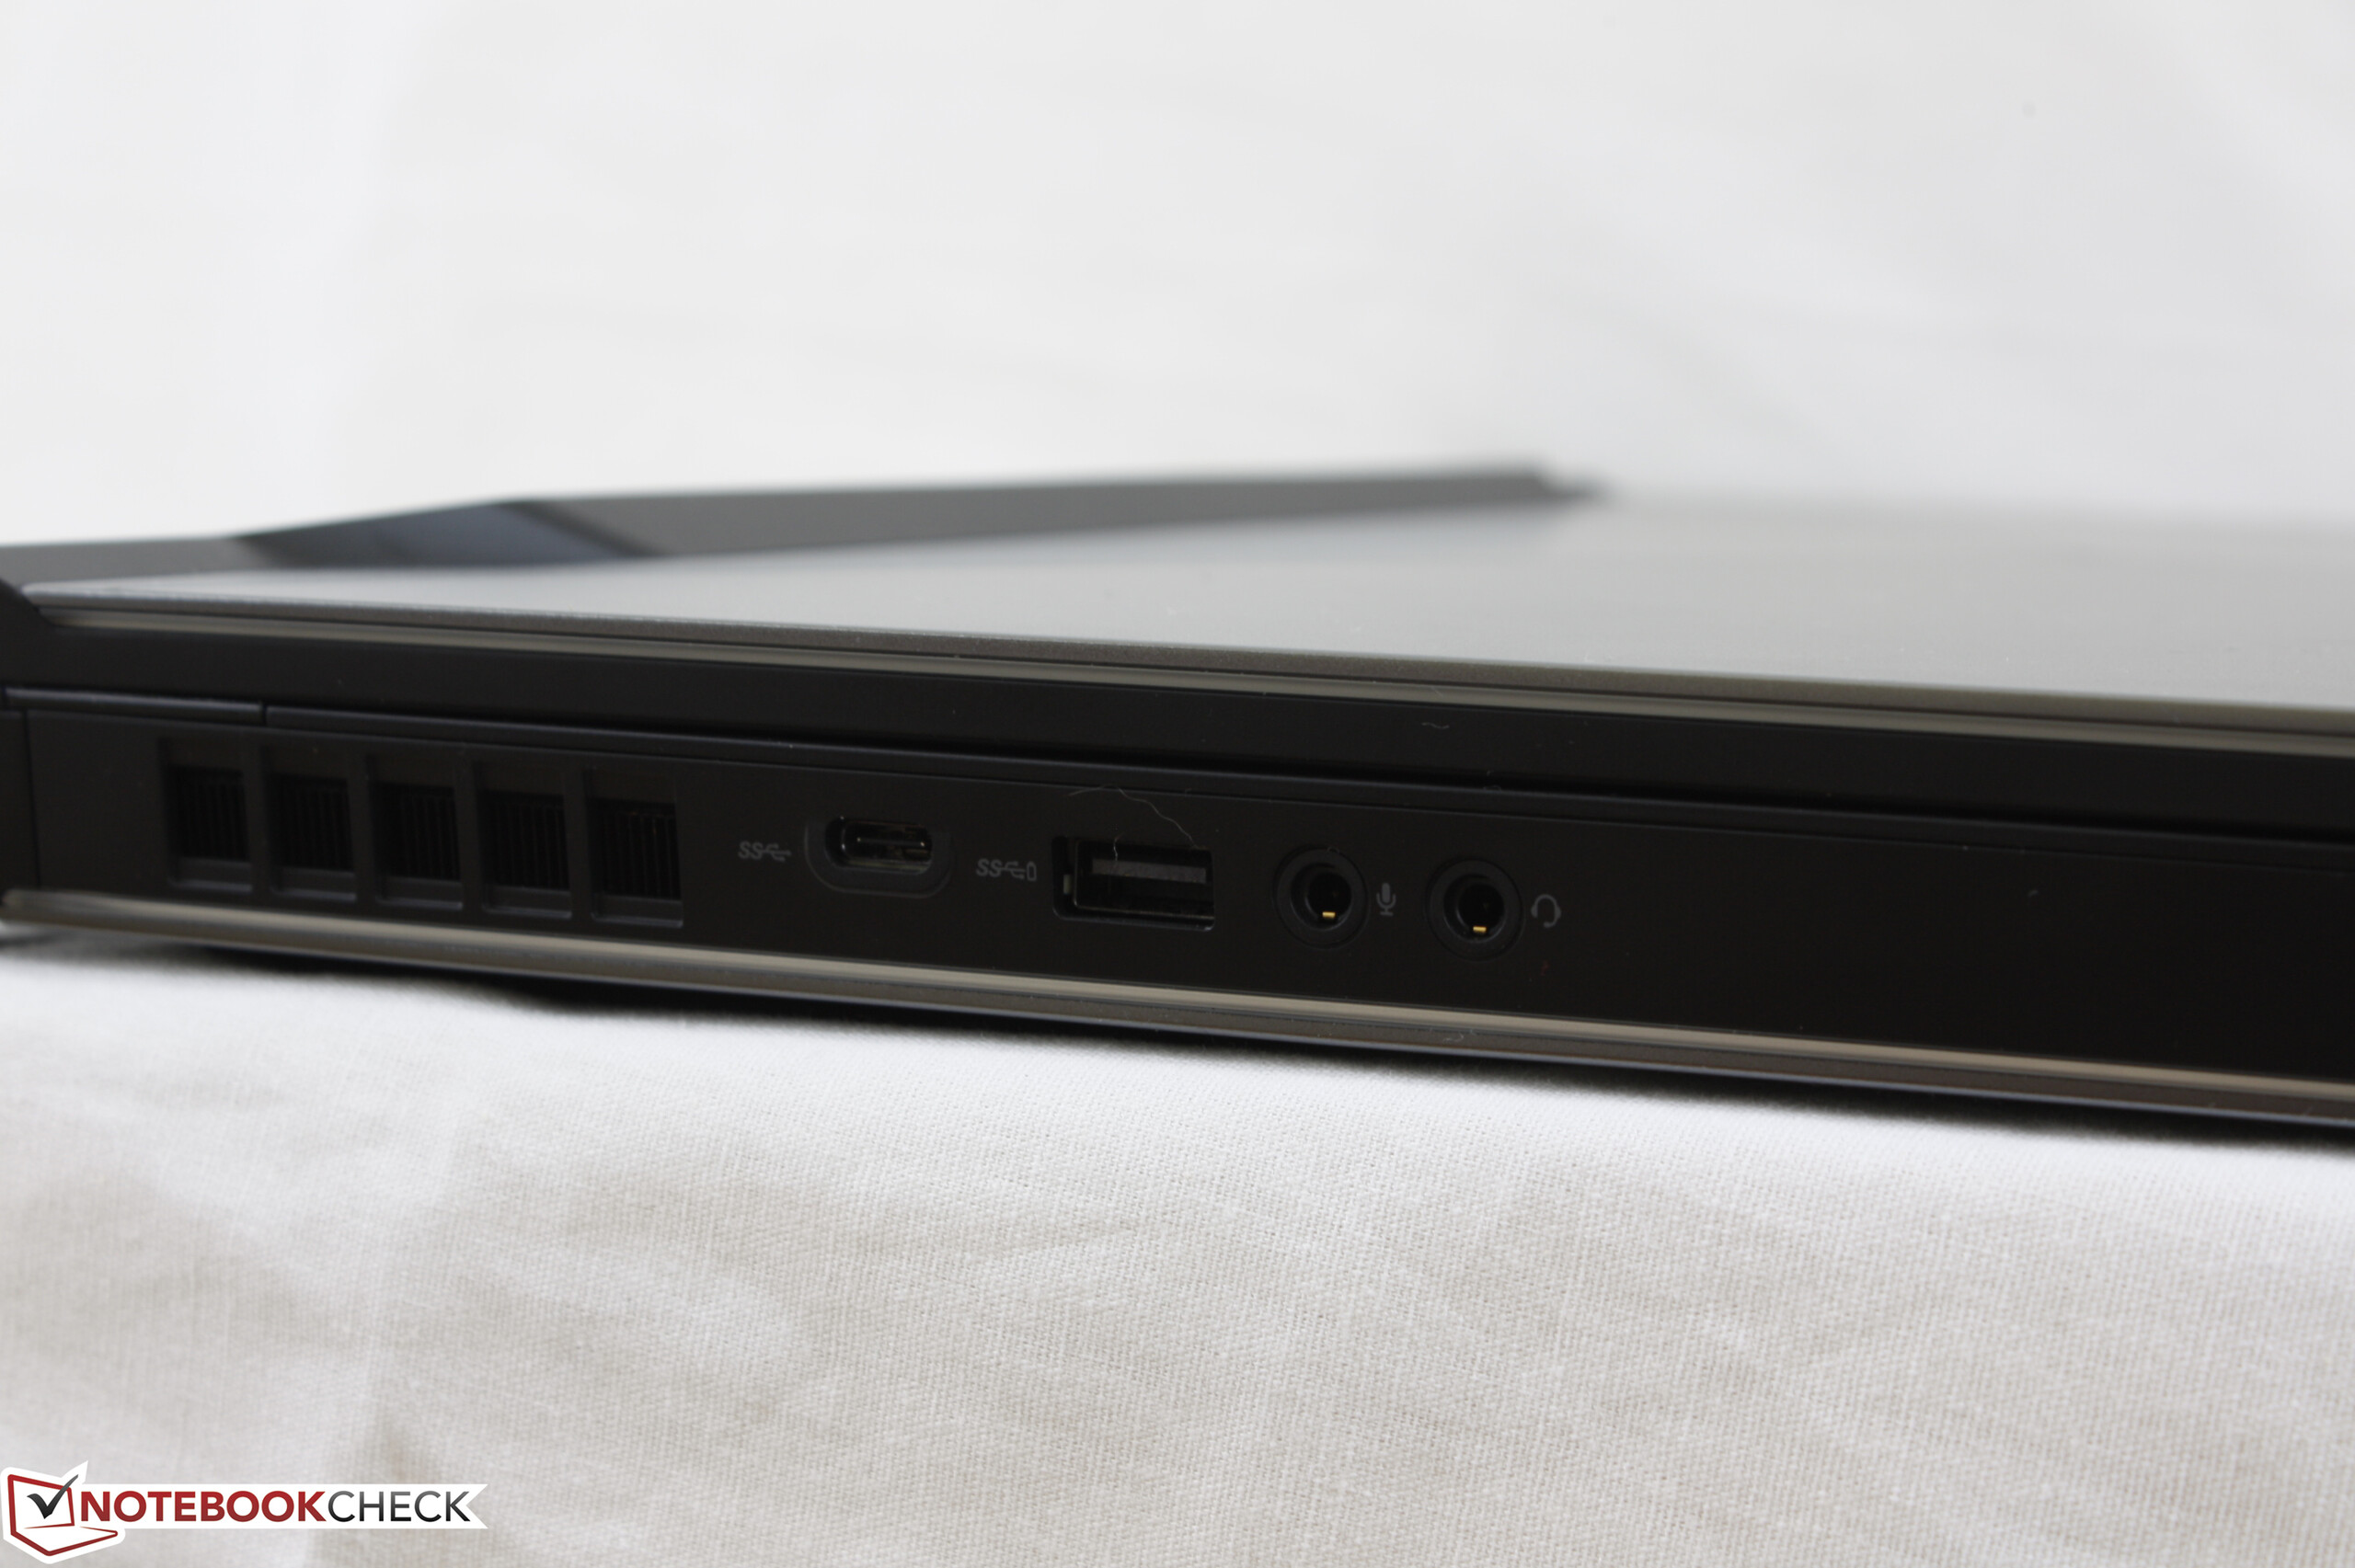
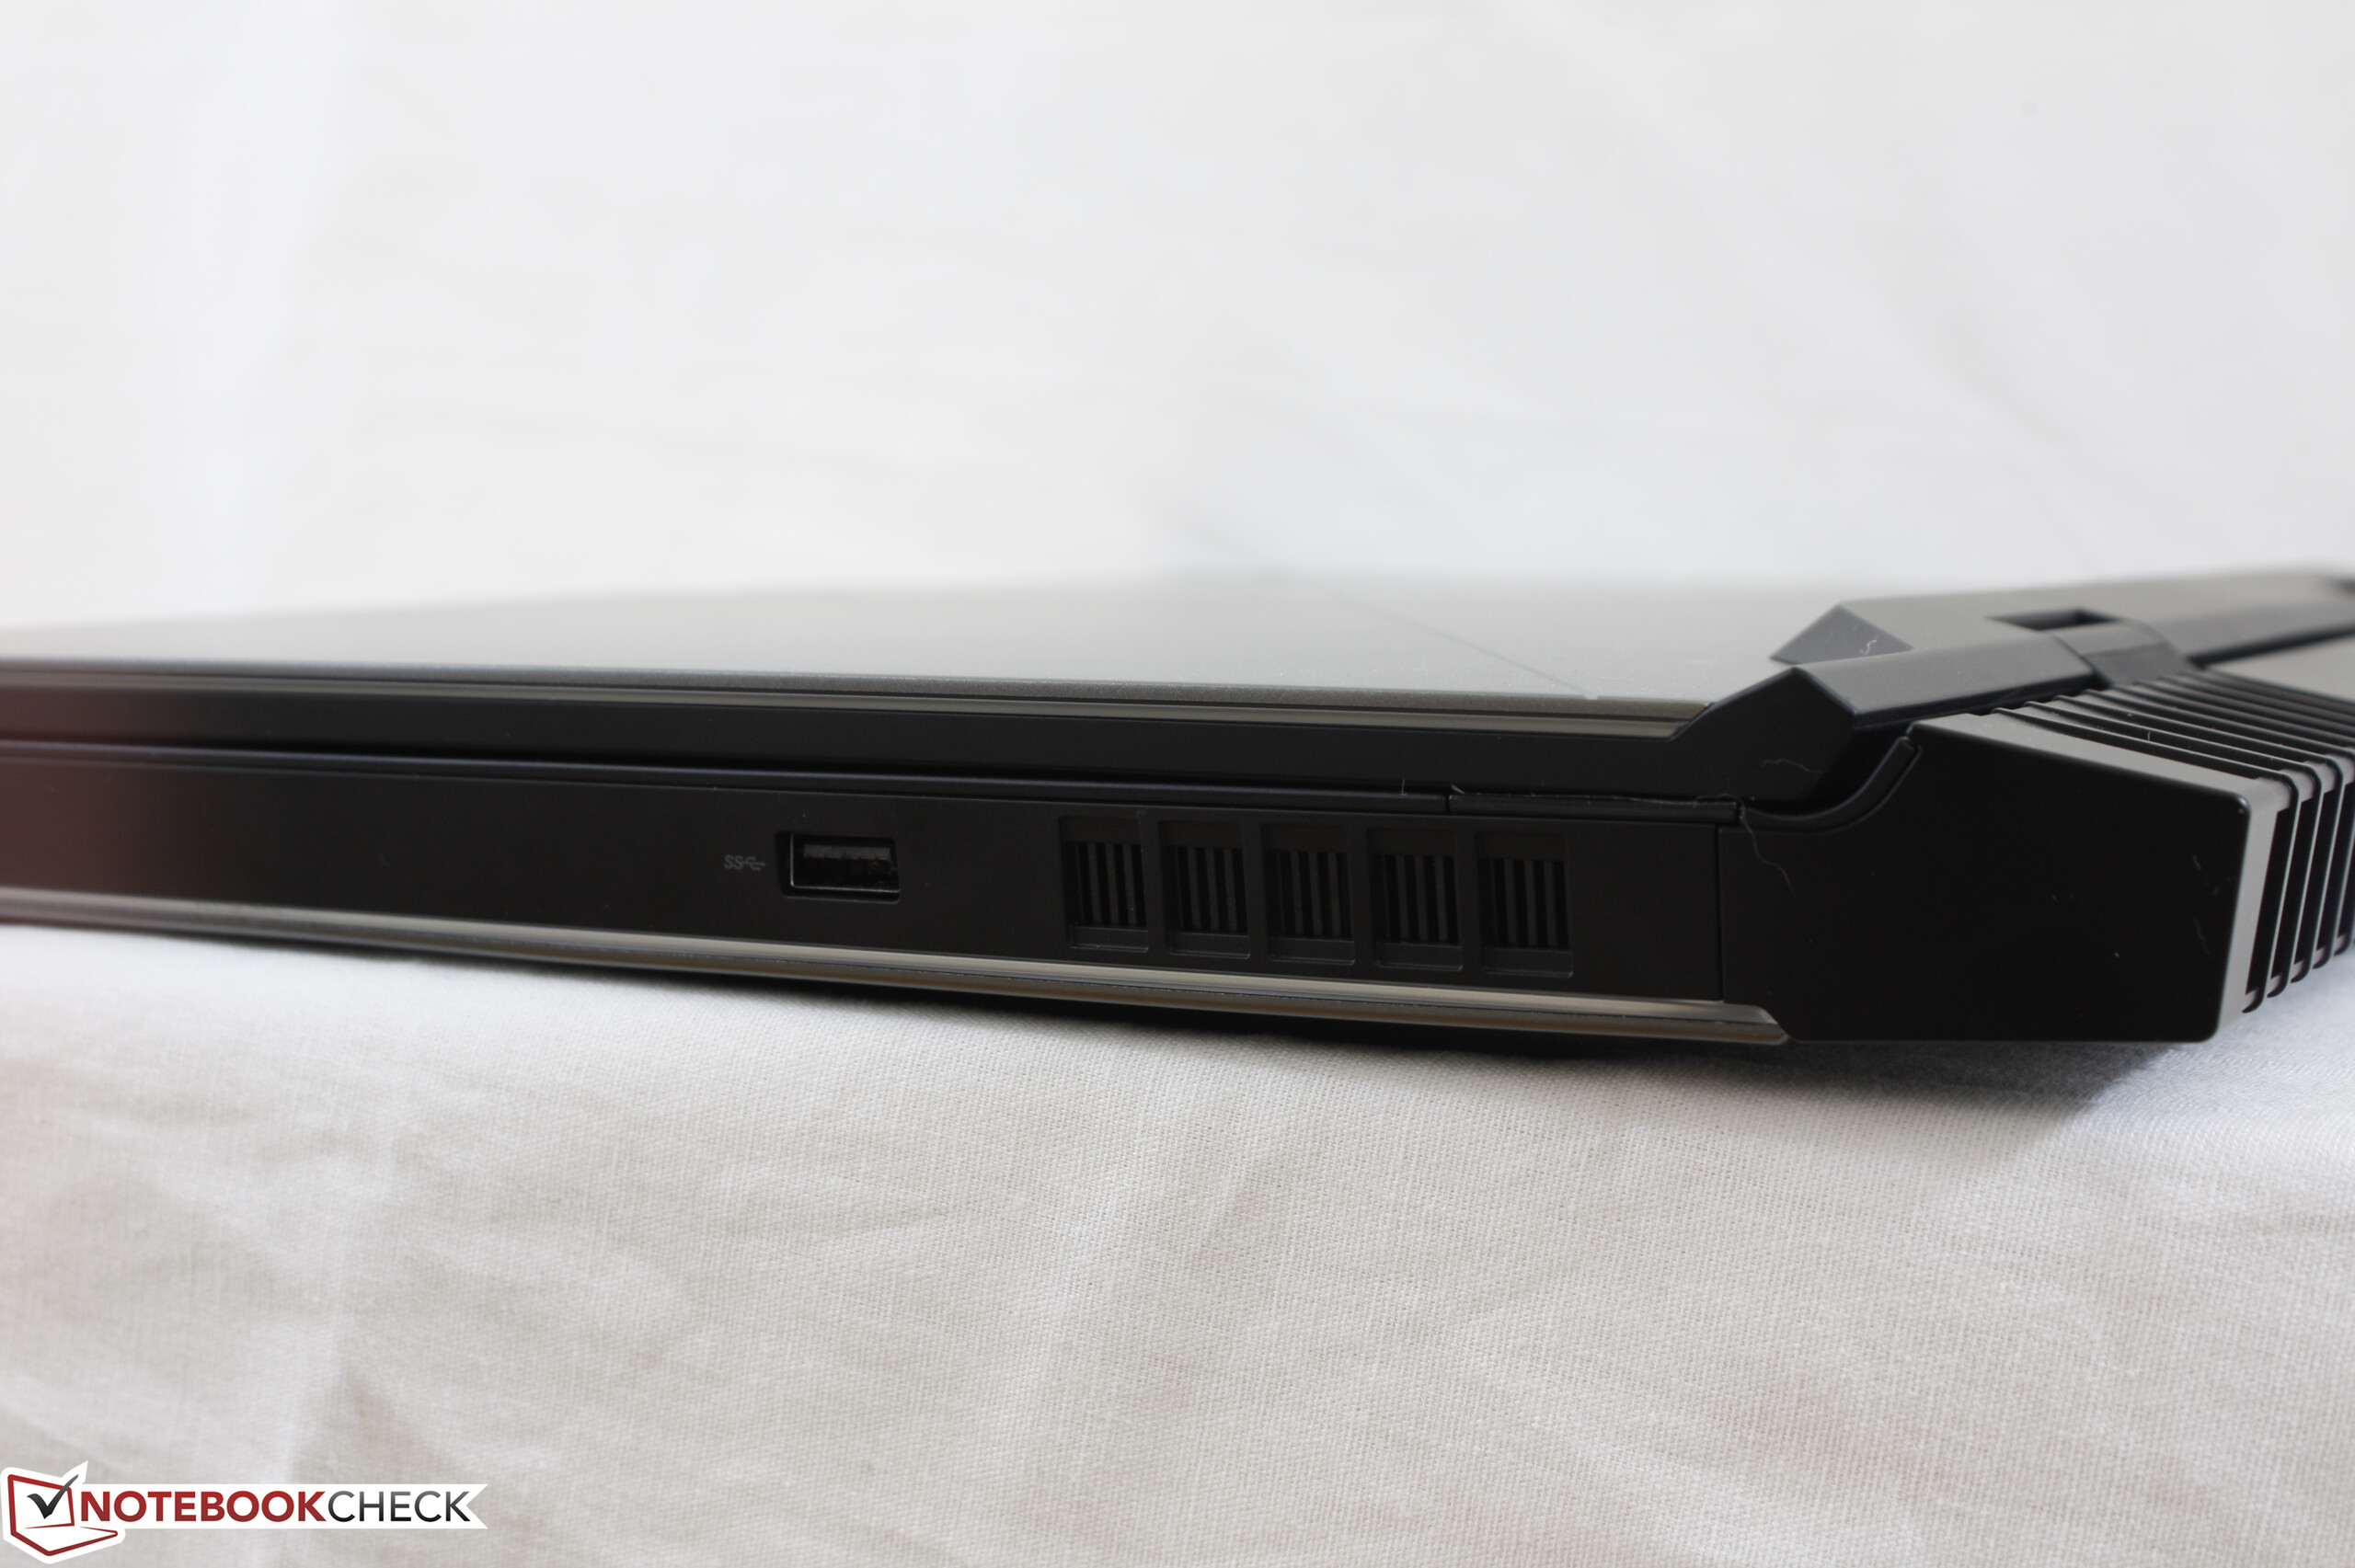
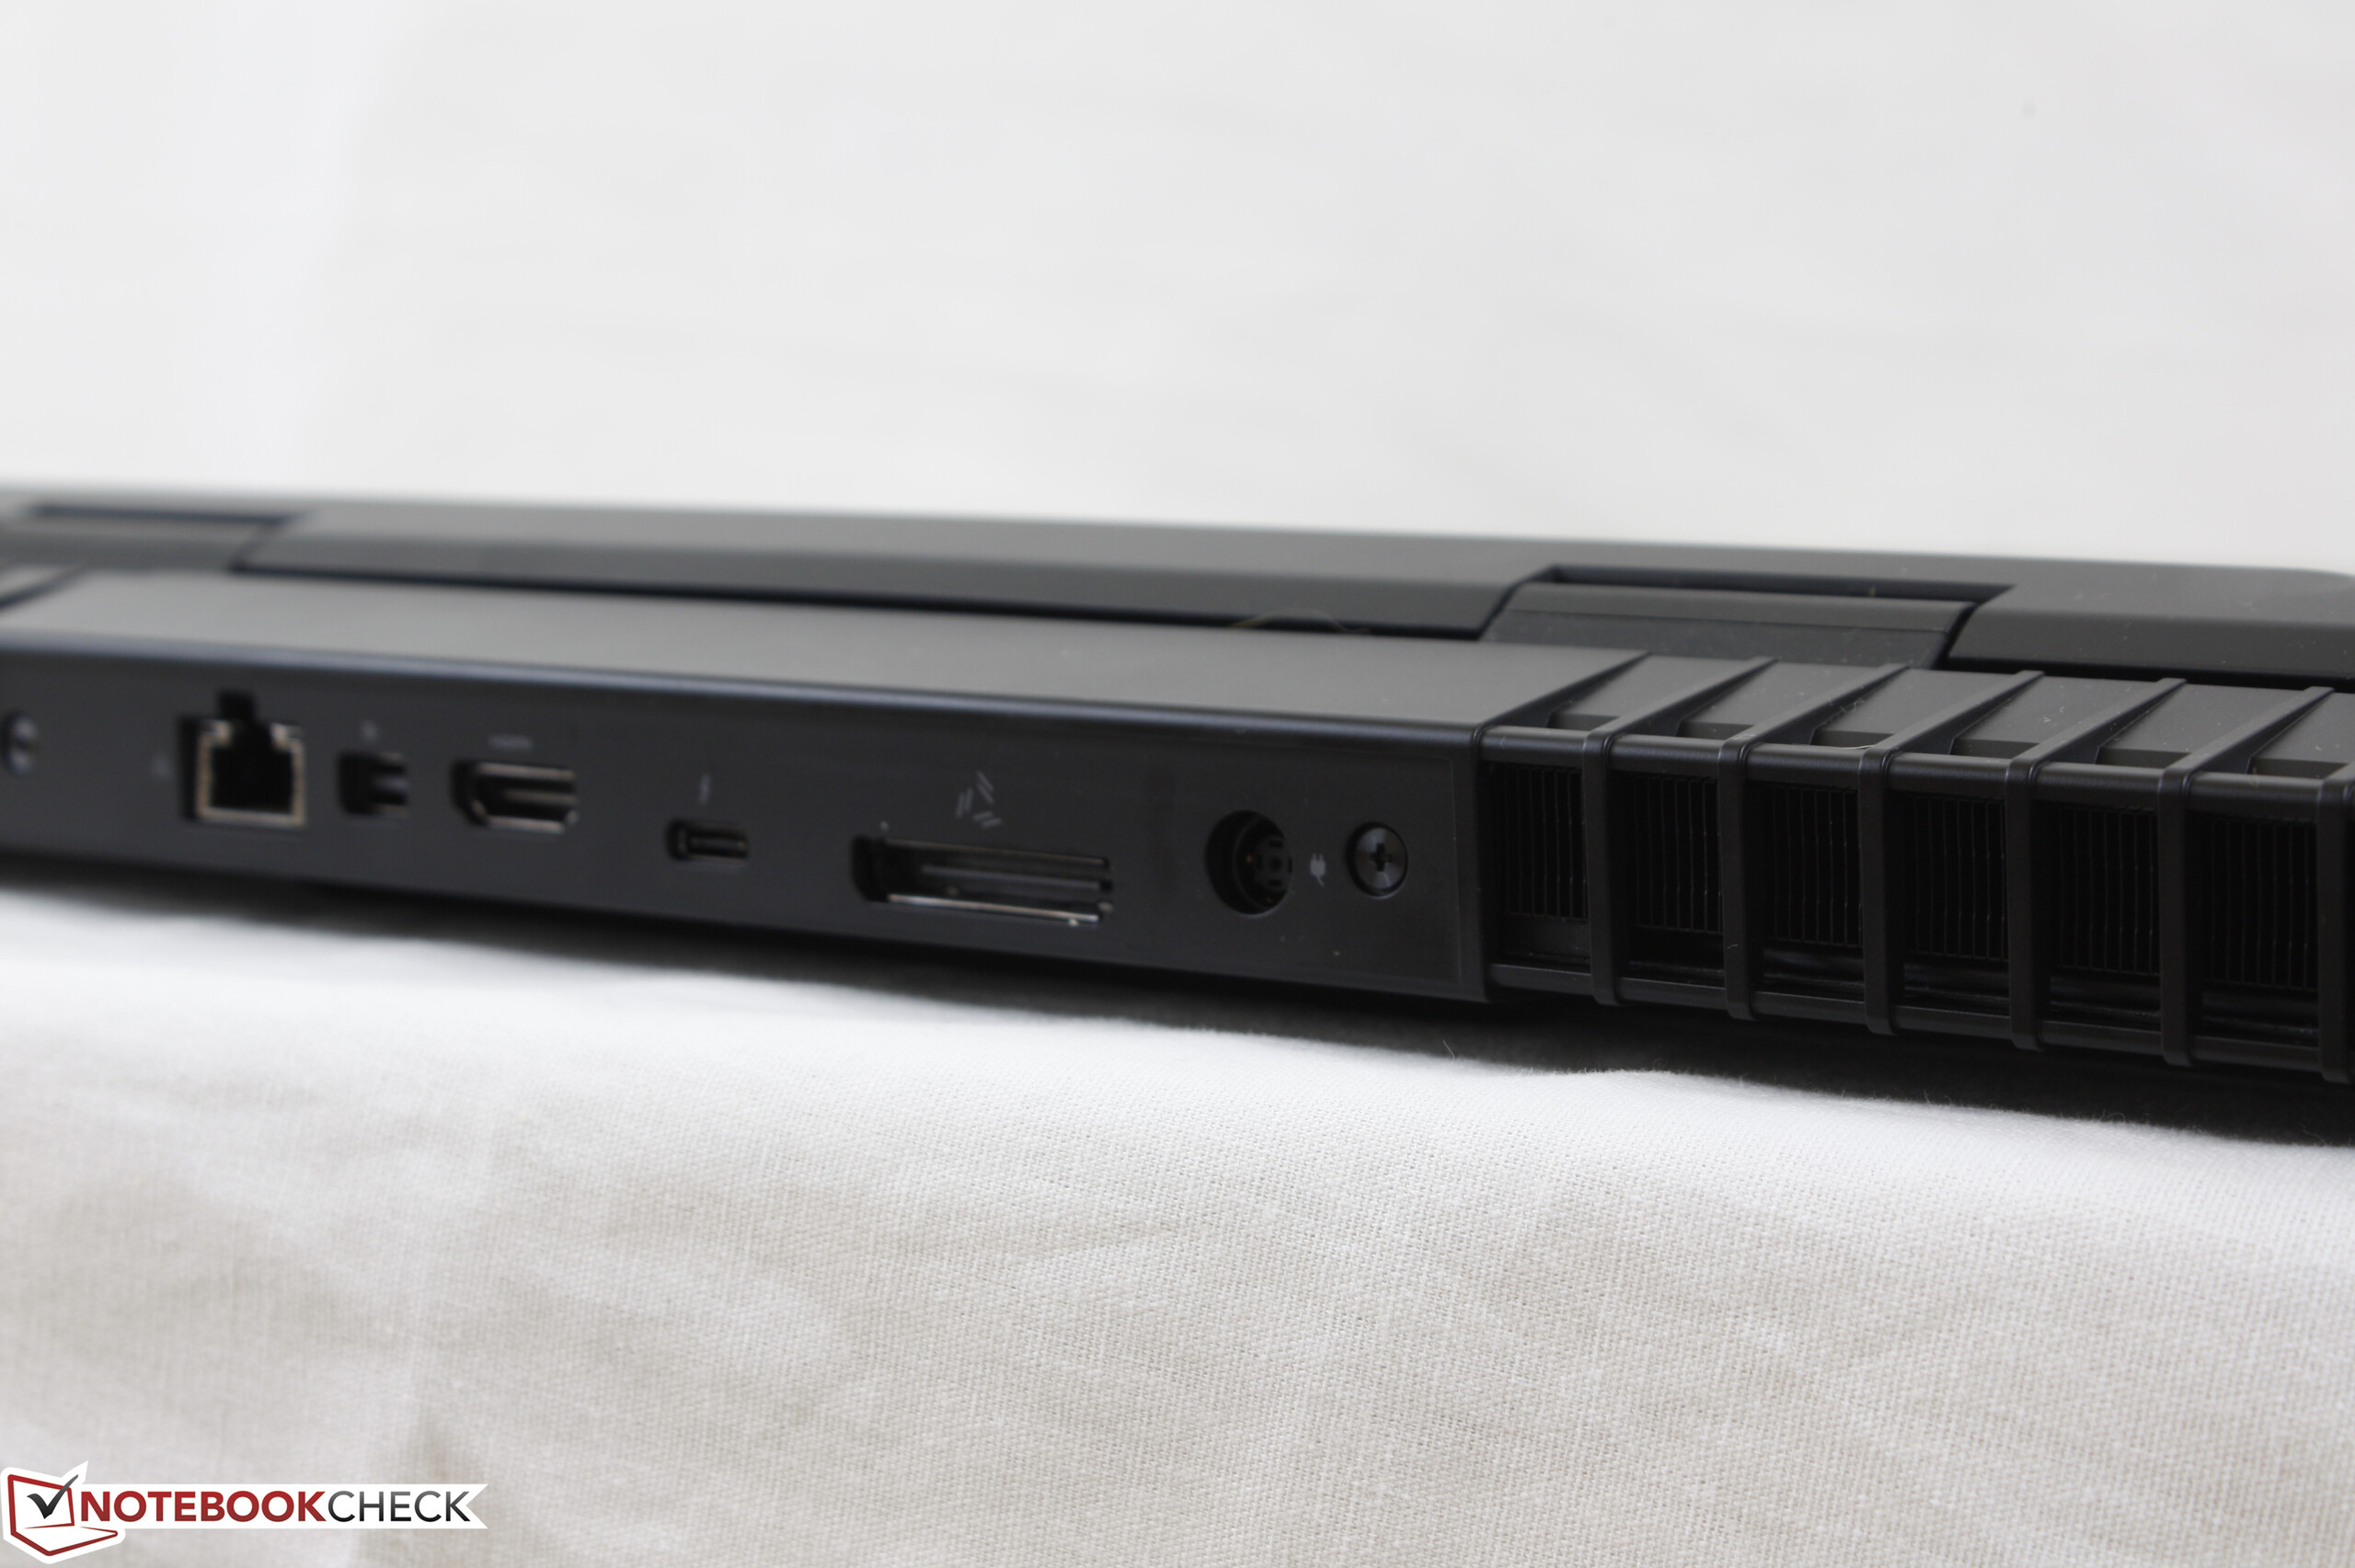
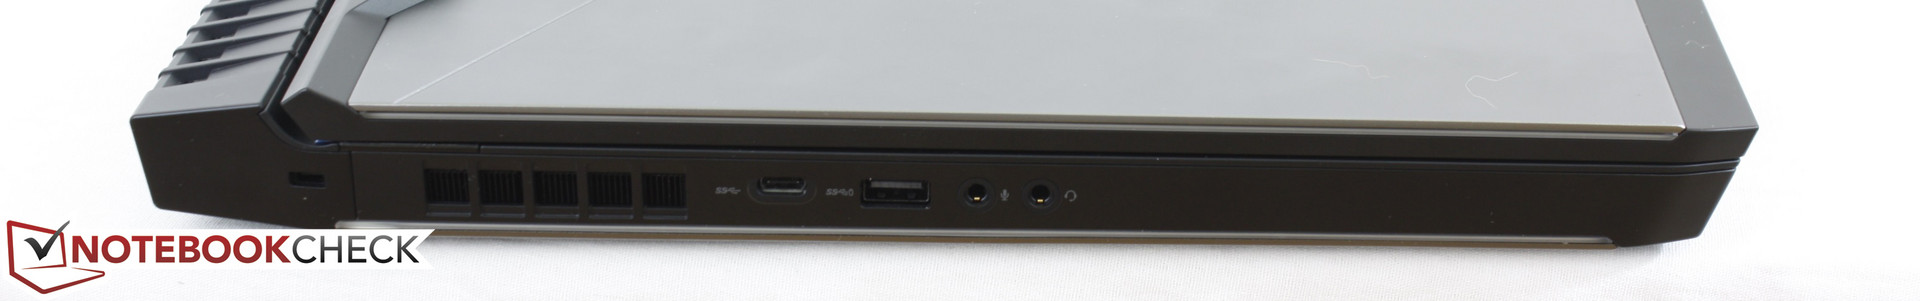
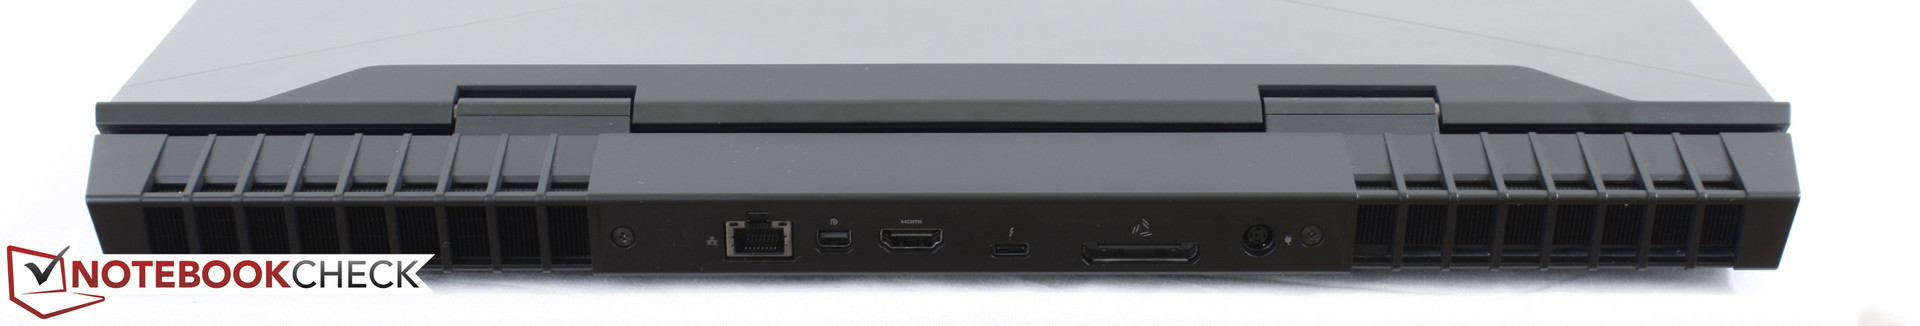
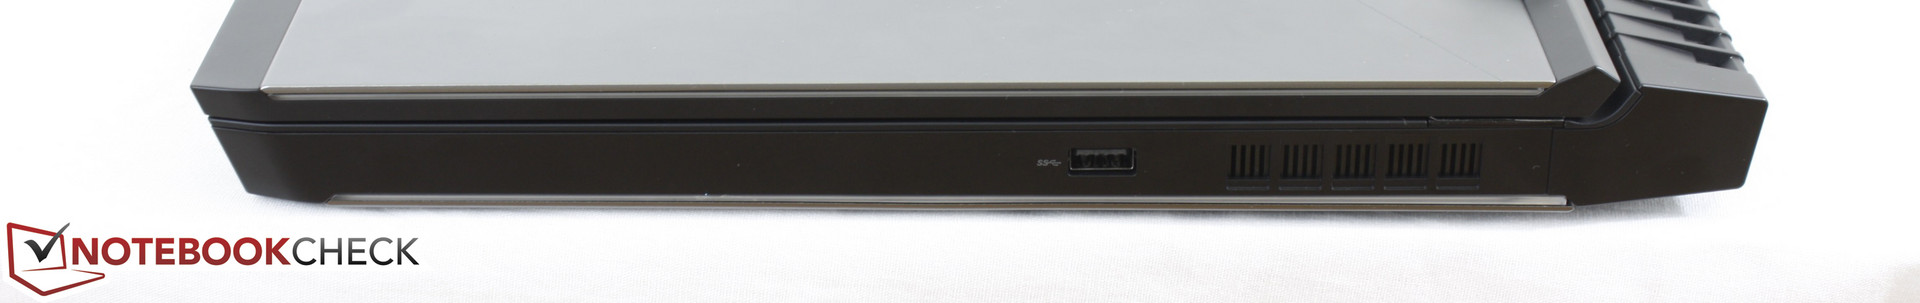
Gaming notebooks are often packed to the brim with ports and connectivity features since they are typically larger than the average multimedia notebook and can afford the space. Thus, we're a bit disappointed to see so few integrated ports on the 17 R4. The system carries just two USB Type-A ports (compared to six on the MSI GT72), two video-out ports (compared to three on the Eurocom Sky X7E2) and just two audio ports (compared to four on the MSI GT62VR). The manufacturer has also elected to drop the SD reader from the 17 R3 to force external readers instead not unlike the Razer Blade Pro or EVGA SC17. We can, however, appreciate the fact that there are two USB Type-C ports whereas most notebooks in this category include only one. Users are encouraged to make use of Thunderbolt 3 dongles in order to expand the connectivity features of the system.
HDMI 2.0 comes standard to support native external 4K displays at up to 60 Hz. It's also worth noting that the mDP port is version 1.2 instead of 1.3, so 4K at 120 Hz is not supported.
The proprietary Graphics Amplifier port makes a return in the 17 R4. While we can see this being useful at the lower 17 R4 GTX 1050 Ti configuration levels, its practicality wanes at higher configurations where the integrated GTX 1070 or 1080 should prove more than sufficient for the next couple of years. Dell claims that its proprietary PCIe x4 Gen 3 GPU docking solution suffers from no dramatic performance hits when outputting to the internal notebook display unlike on the Razer Core.
Software
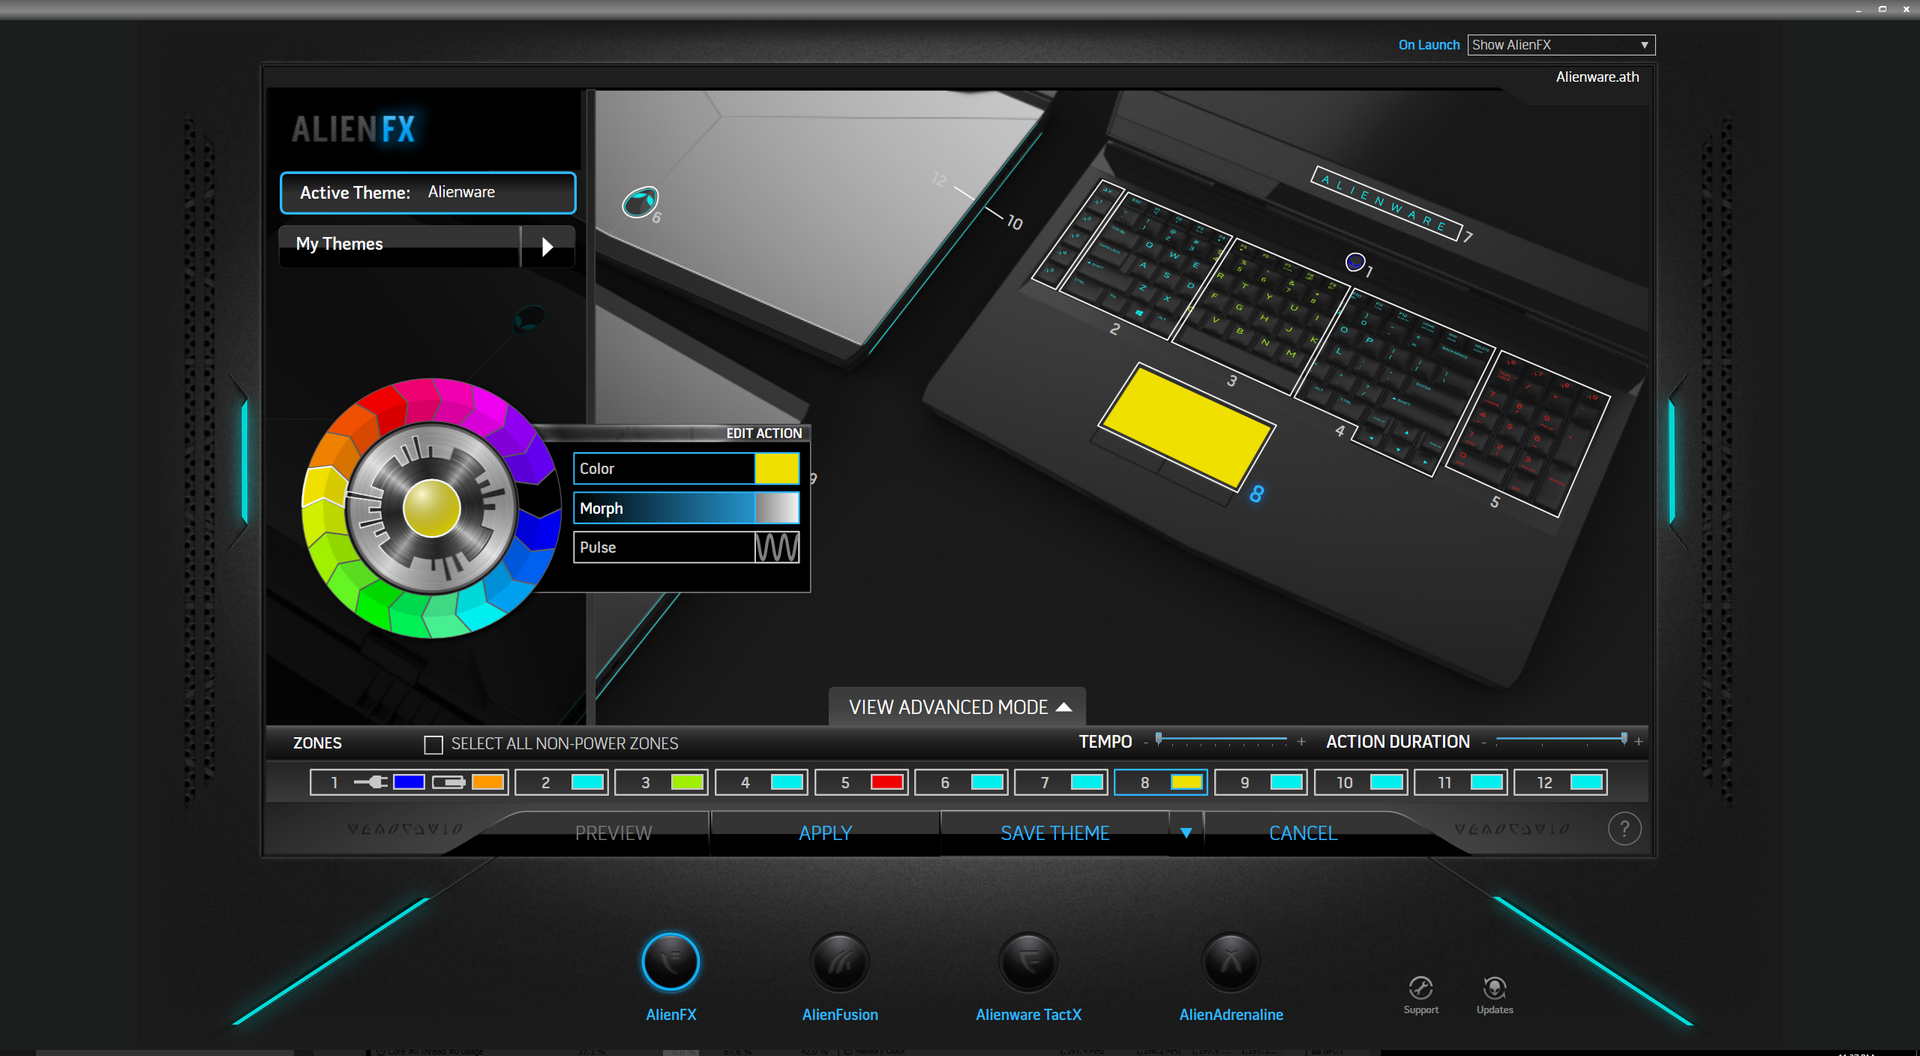
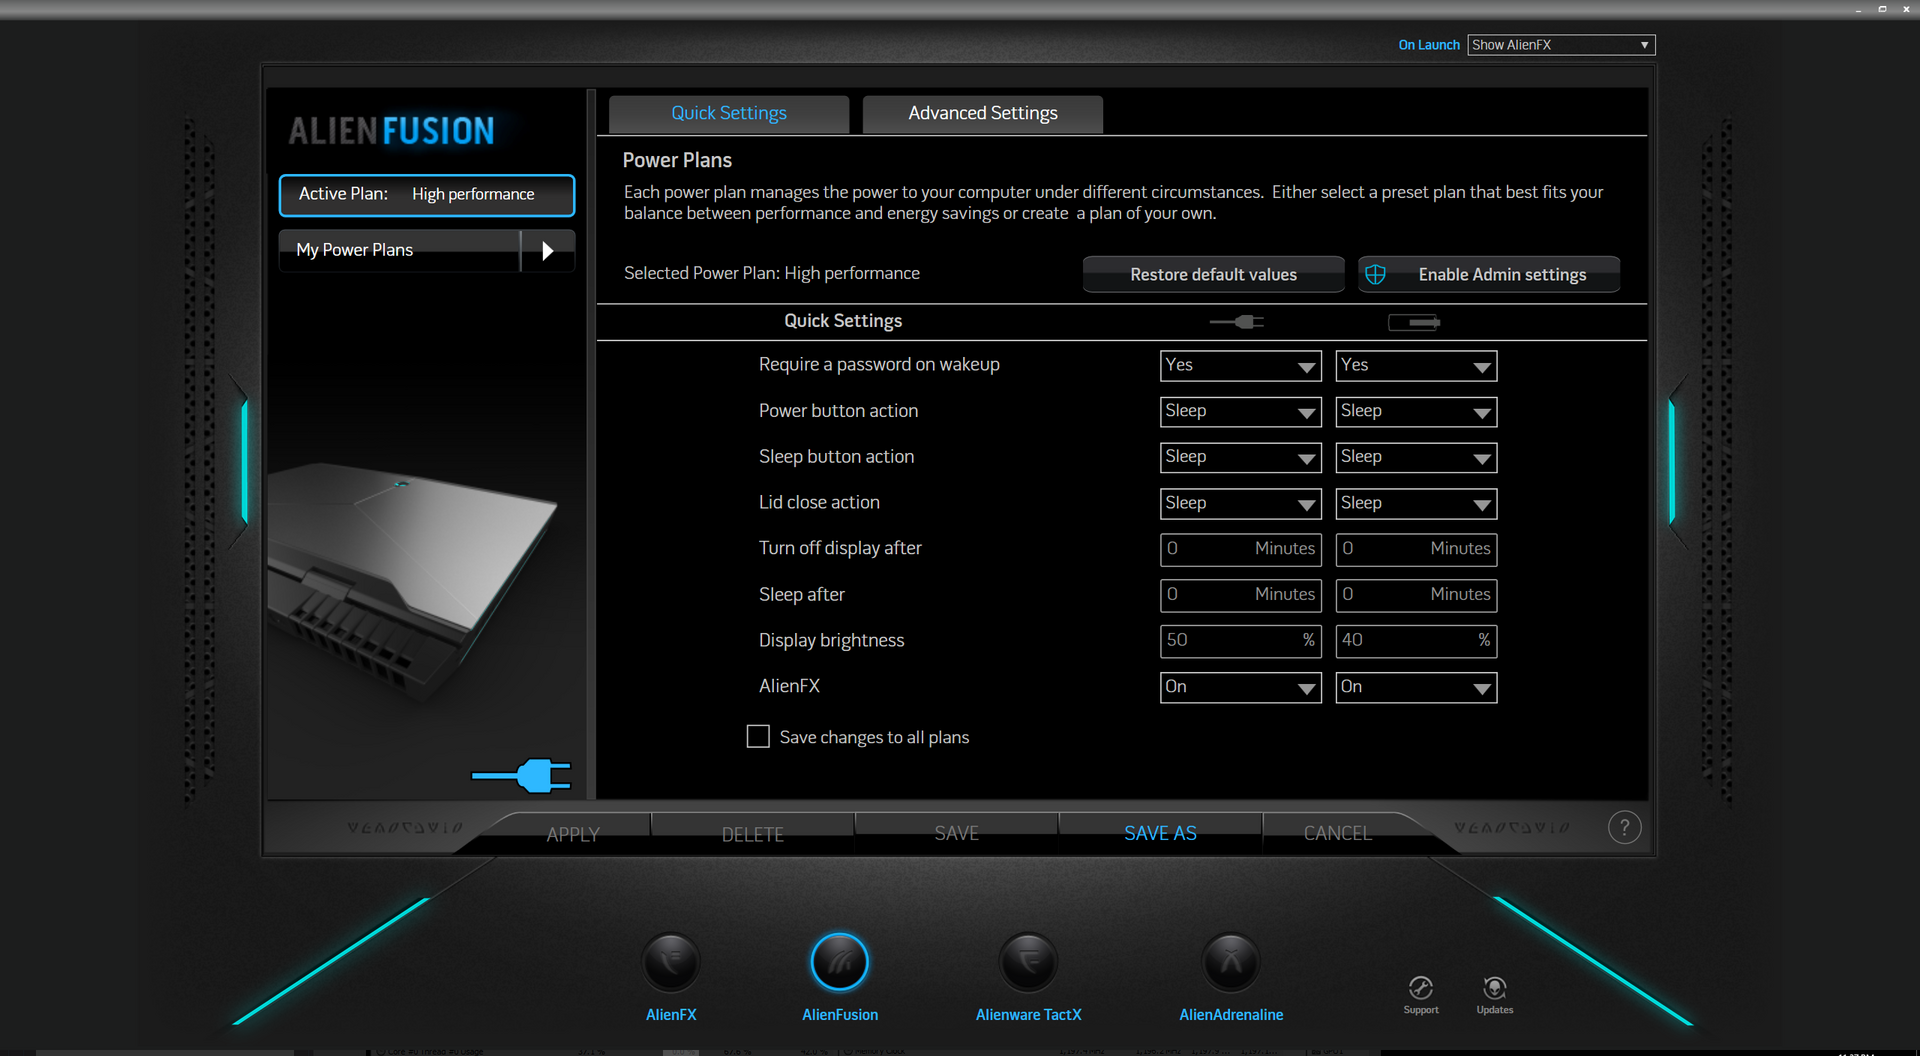
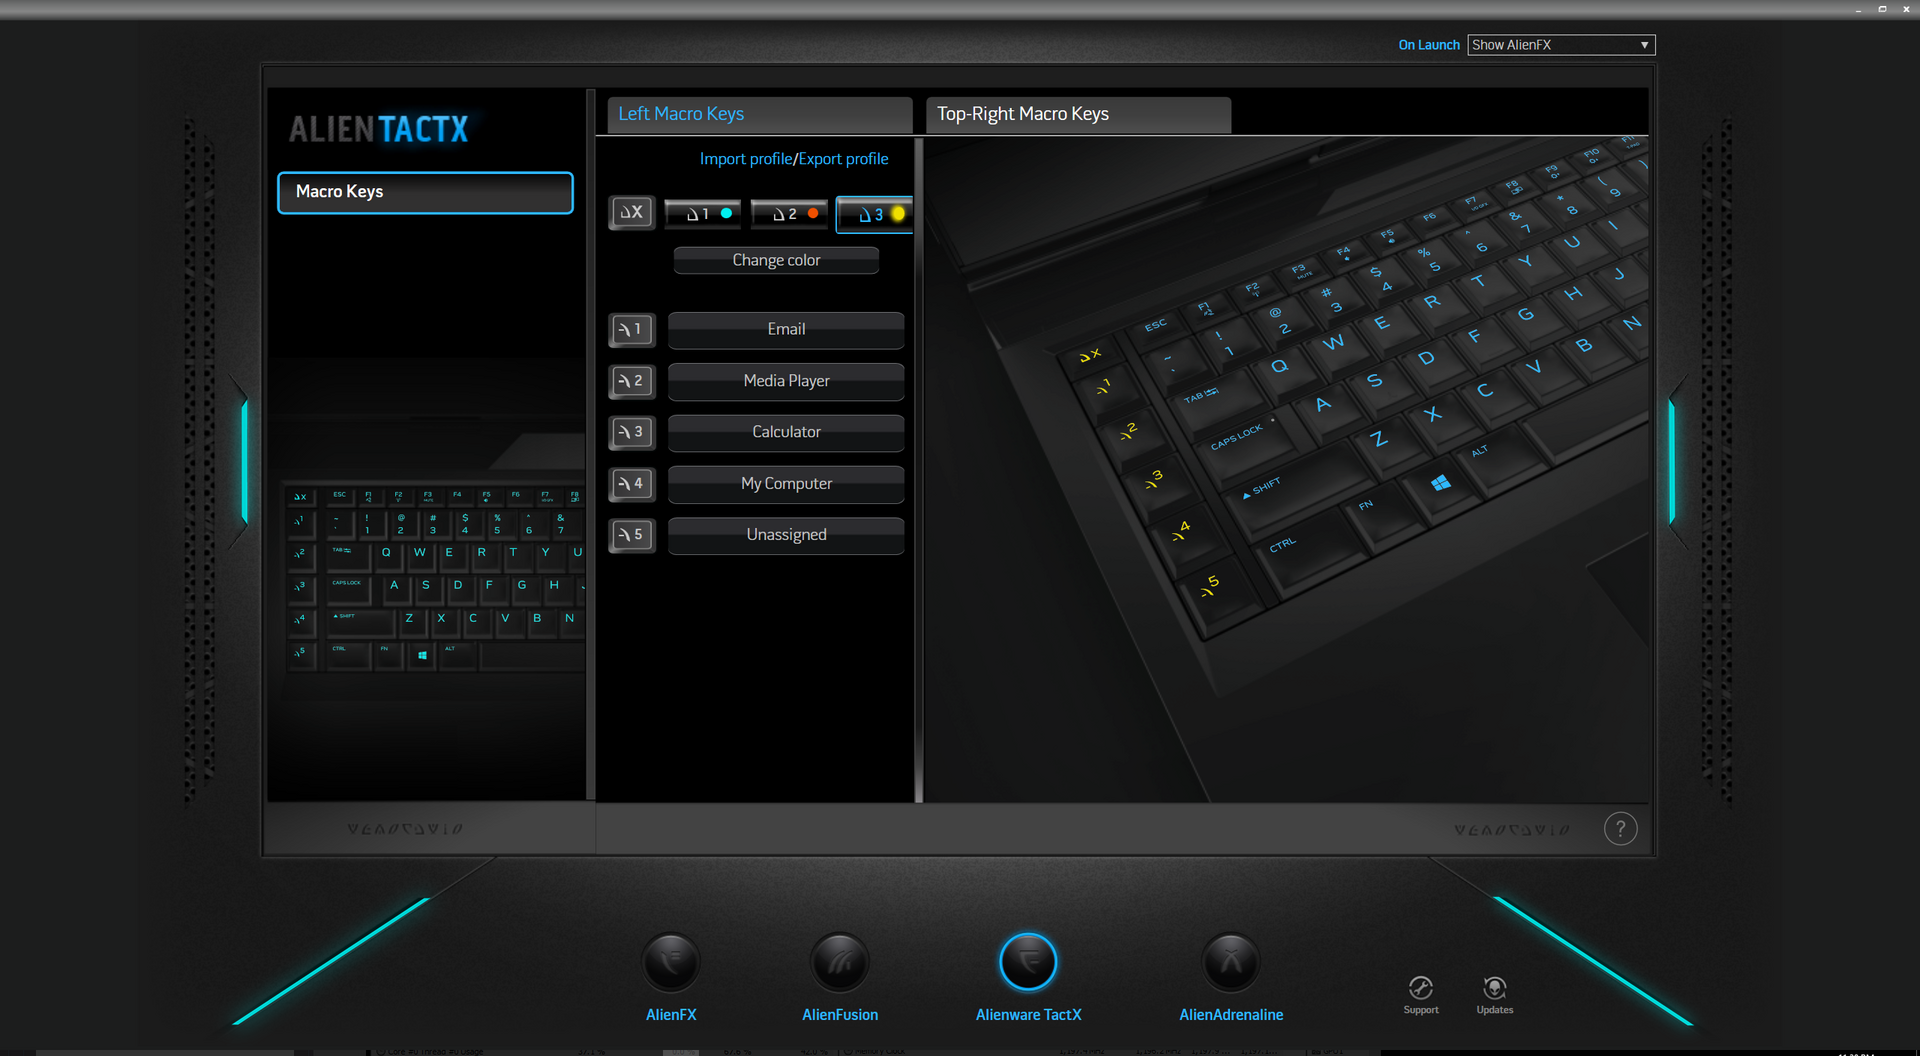
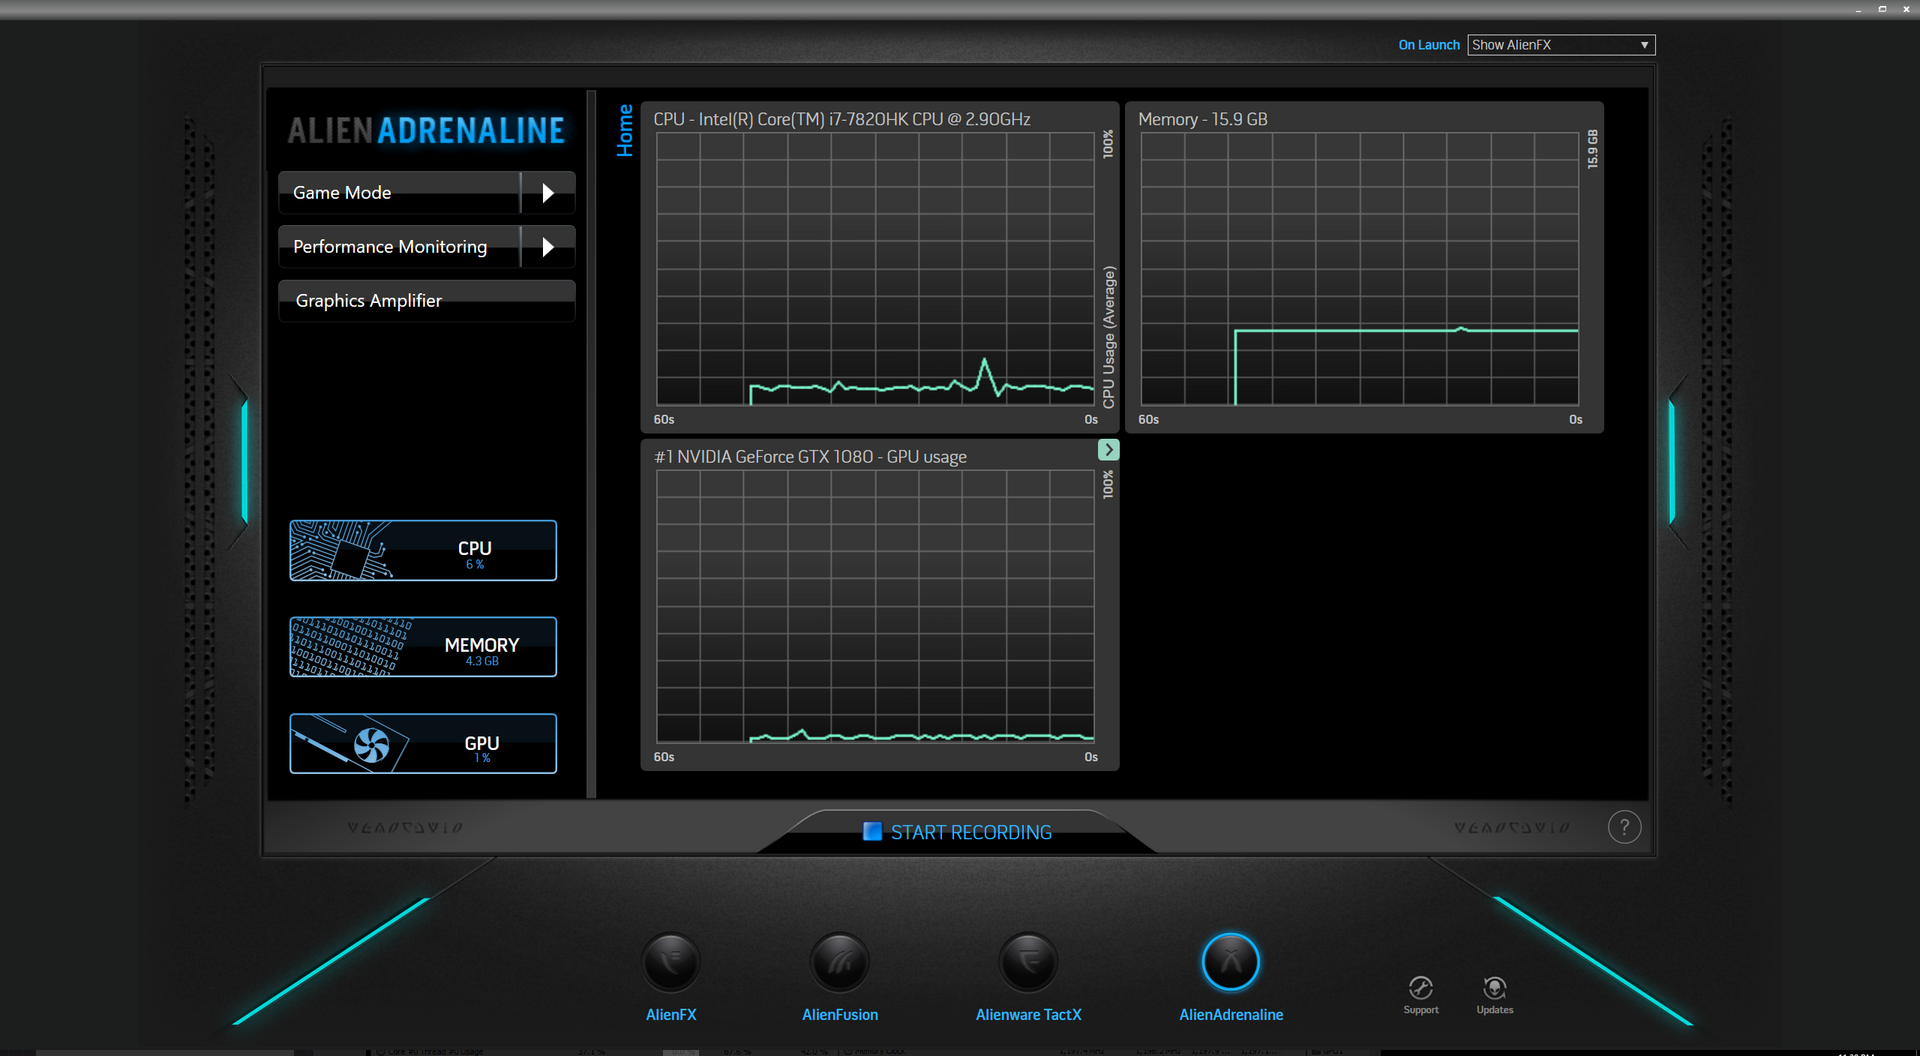
AlienFX serves as the control center for macro customization, keyboard color settings, system monitoring and recording, and performance profile options. The system makes use of nine dedicated macro keys of which five can be toggled between three different sets of functions. The system monitor portion of the software is rather poor and limited since its graphs cannot be minimized into individual widgets or smaller sizes. We hope that future revisions will add graphs for fan control and RPM monitoring.
Communication
All current configurations ship with the Killer 1435 WLAN module as standard with the option to upgrade to the Killer 1535. Besides some small differences in features, raw throughput is essentially identical to the Killer 1535 and both have integrated Bluetooth 4.1 connectivity. We were able to record a real-world average transfer rate of 606 Mbps against a theoretical maximum of 867 Mbps and experienced no notable latency issues when connected to our Linksys EA8500 test router.
The Killer Control Center software comes pre-installed for easy monitoring of throughput and for setting app priorities. See our dedicated review on the Killer 1535 for more information on performance and features.
| Networking | |
| iperf3 transmit AX12 | |
| Alienware 17 R4 | |
| MSI GT62VR 7RE-223 | |
| Dell XPS 15 9560 (i7-7700HQ, UHD) | |
| iperf3 receive AX12 | |
| MSI GT62VR 7RE-223 | |
| Dell XPS 15 9560 (i7-7700HQ, UHD) | |
| Alienware 17 R4 | |
Accessories
There are no included extras in the box outside of the usual AC adapter and Quick Start guide. There is not even a cleaning cloth that many higher-end systems tend to include as standard. The manufacturer offers Alienware-branded accessories, carrying cases and, of course, the Graphics Amplifier docking station. Other Thunderbolt 3 docks and dongles such as the Dell DA200 should also be compatible with the system as well.
Maintenance
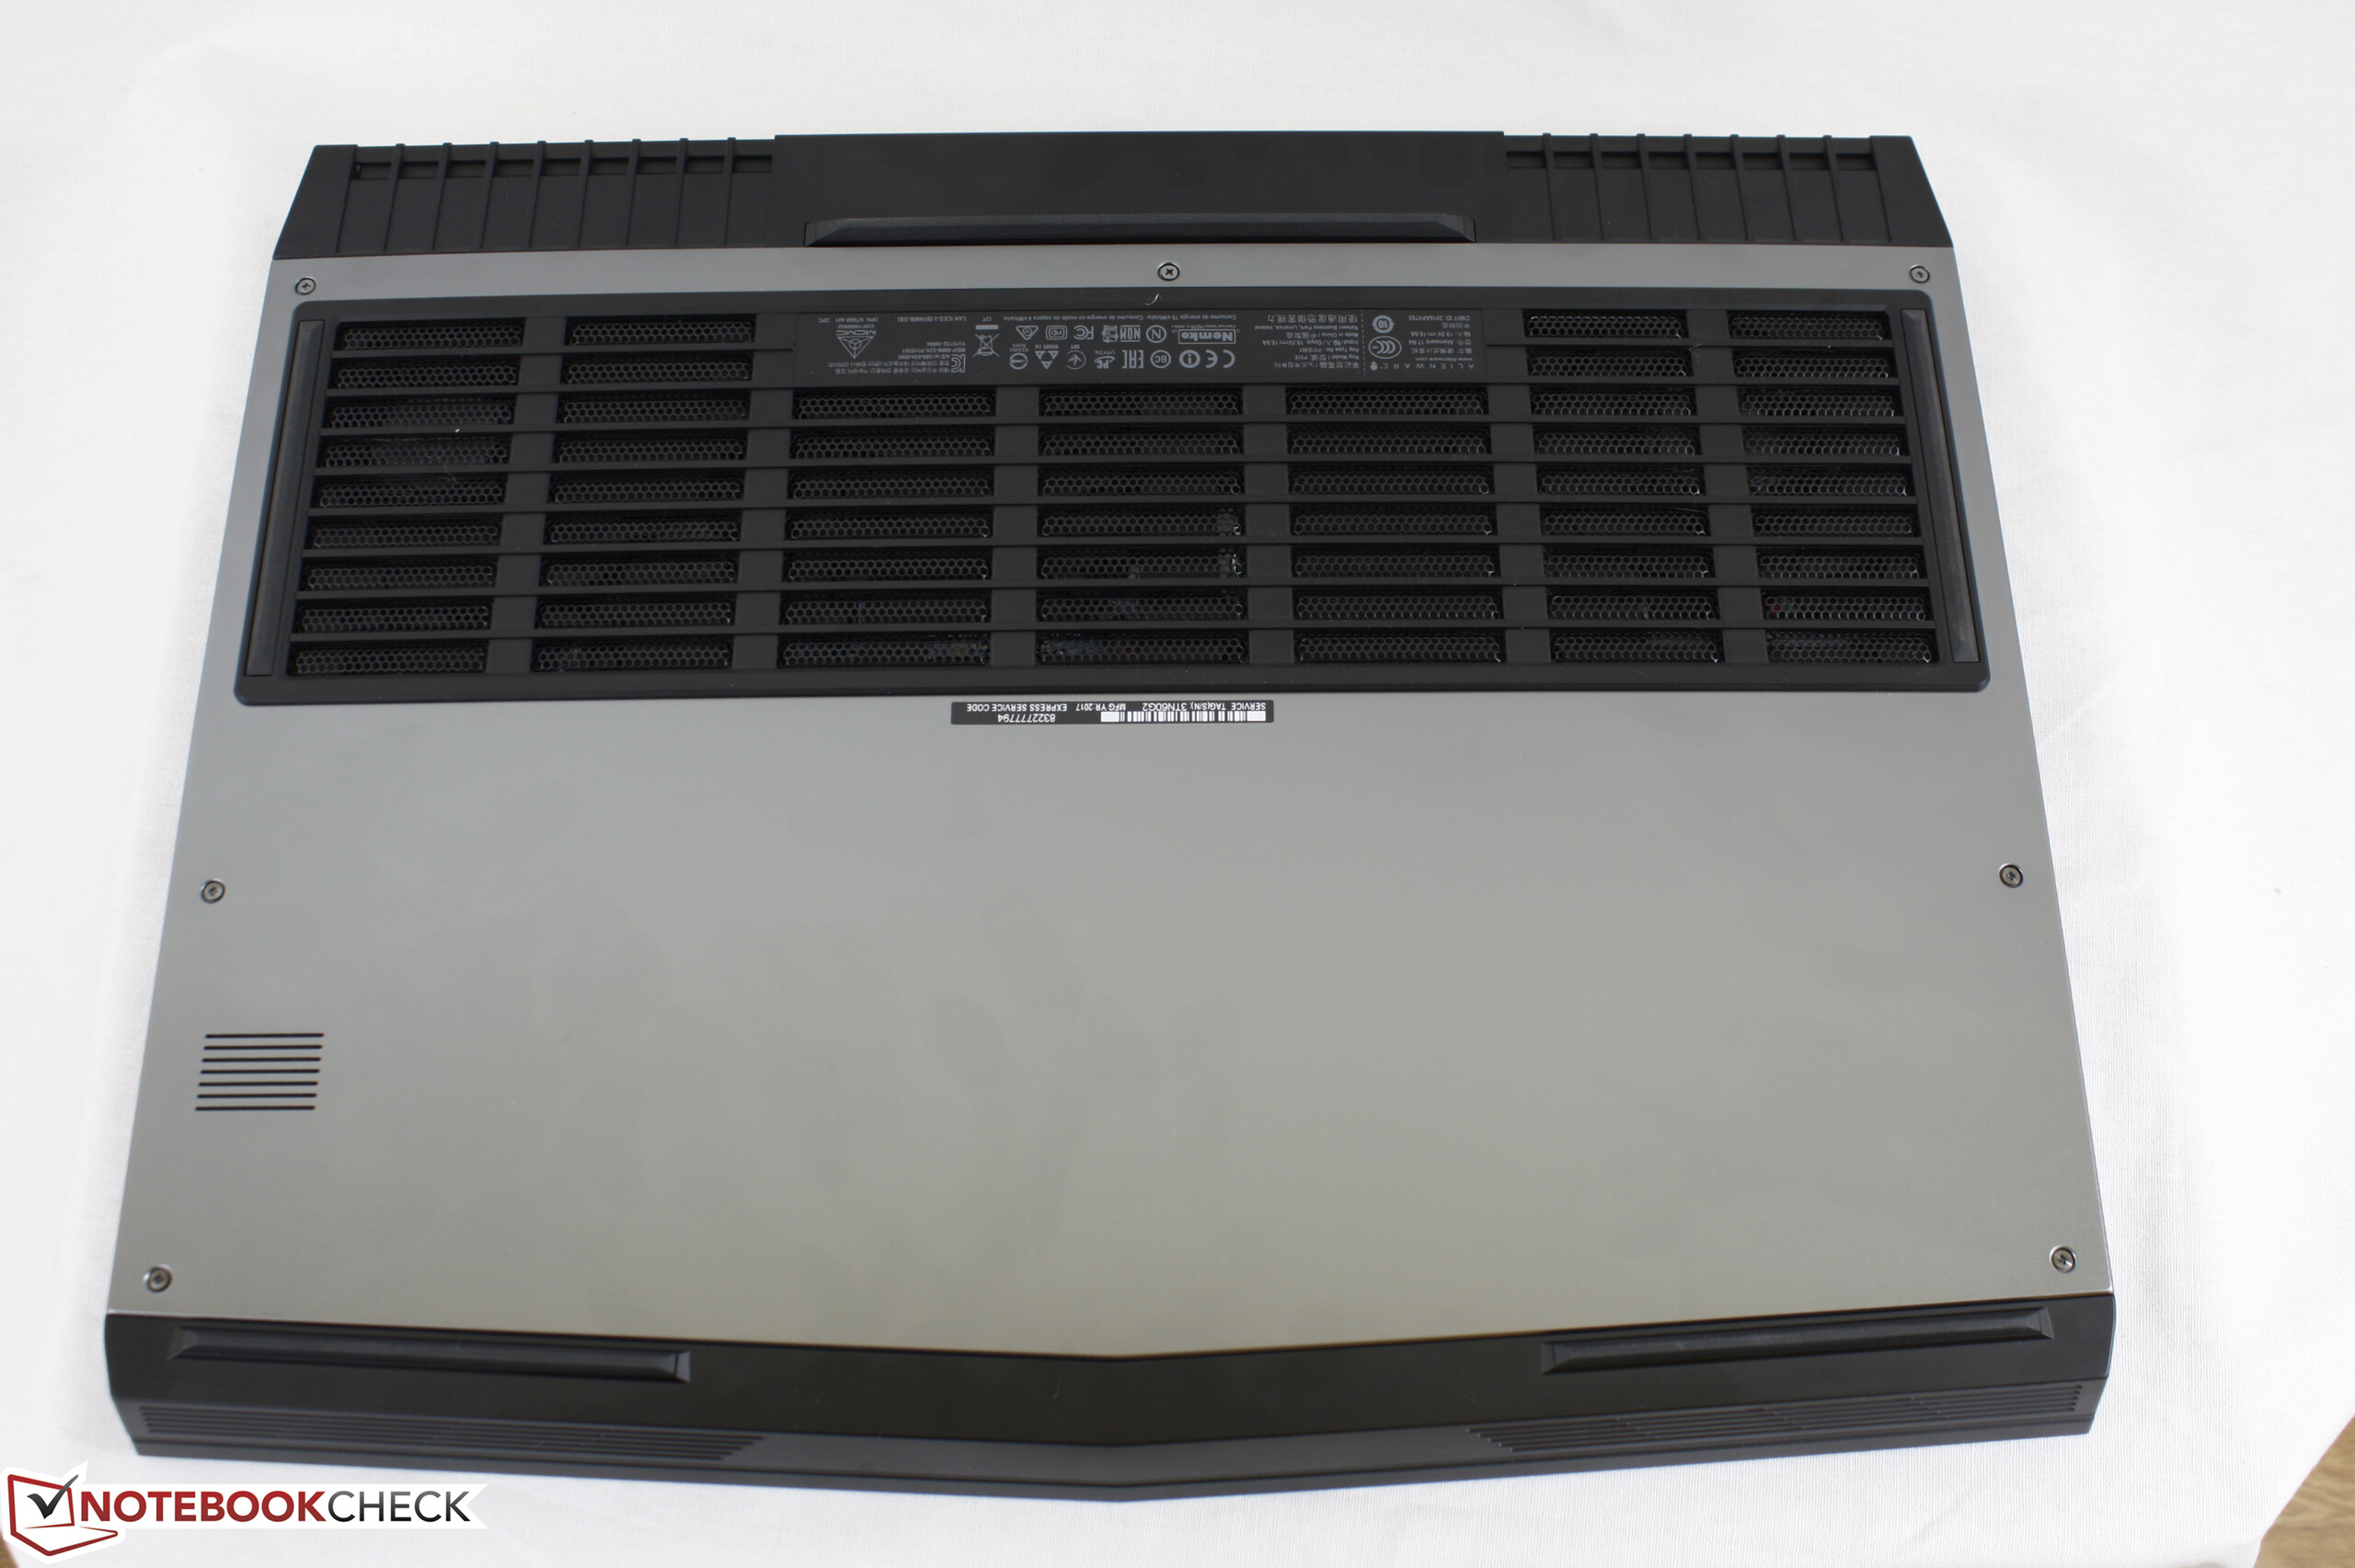
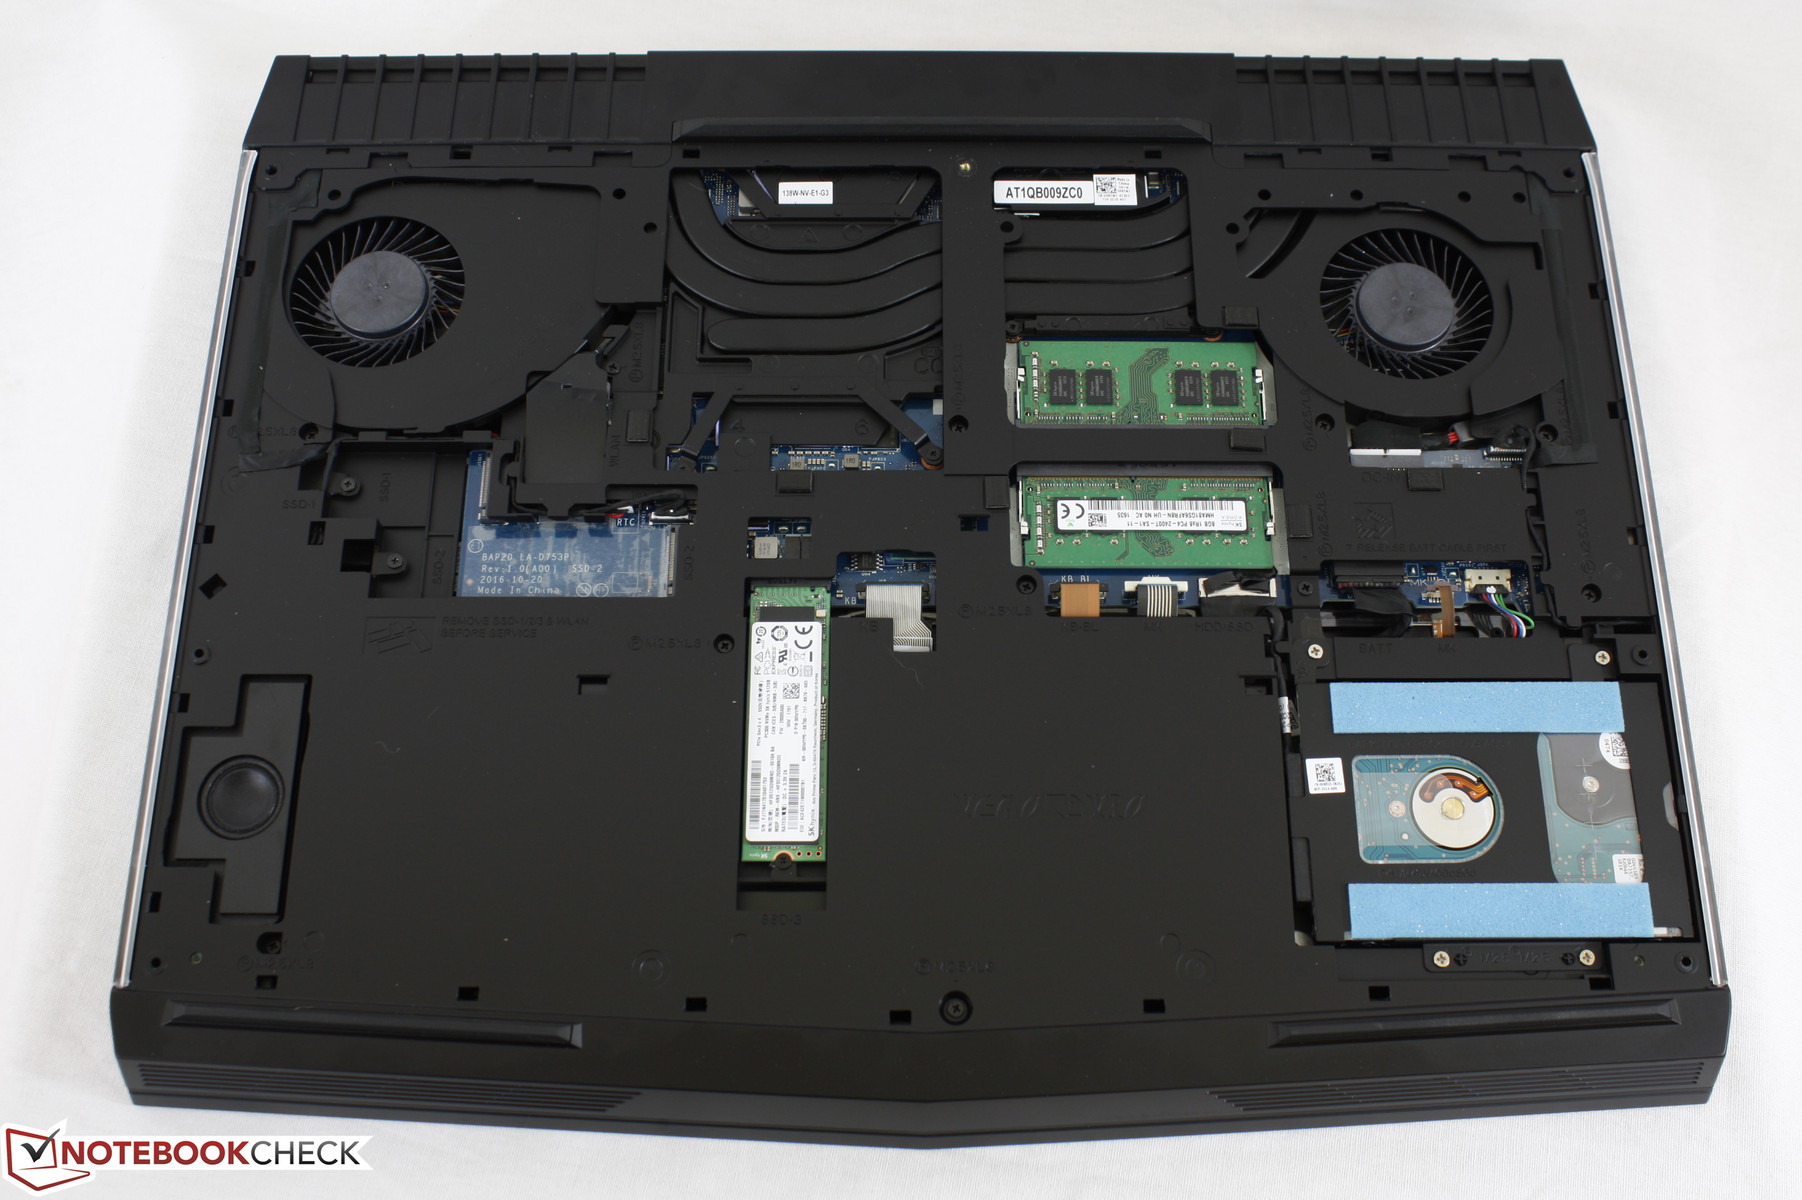
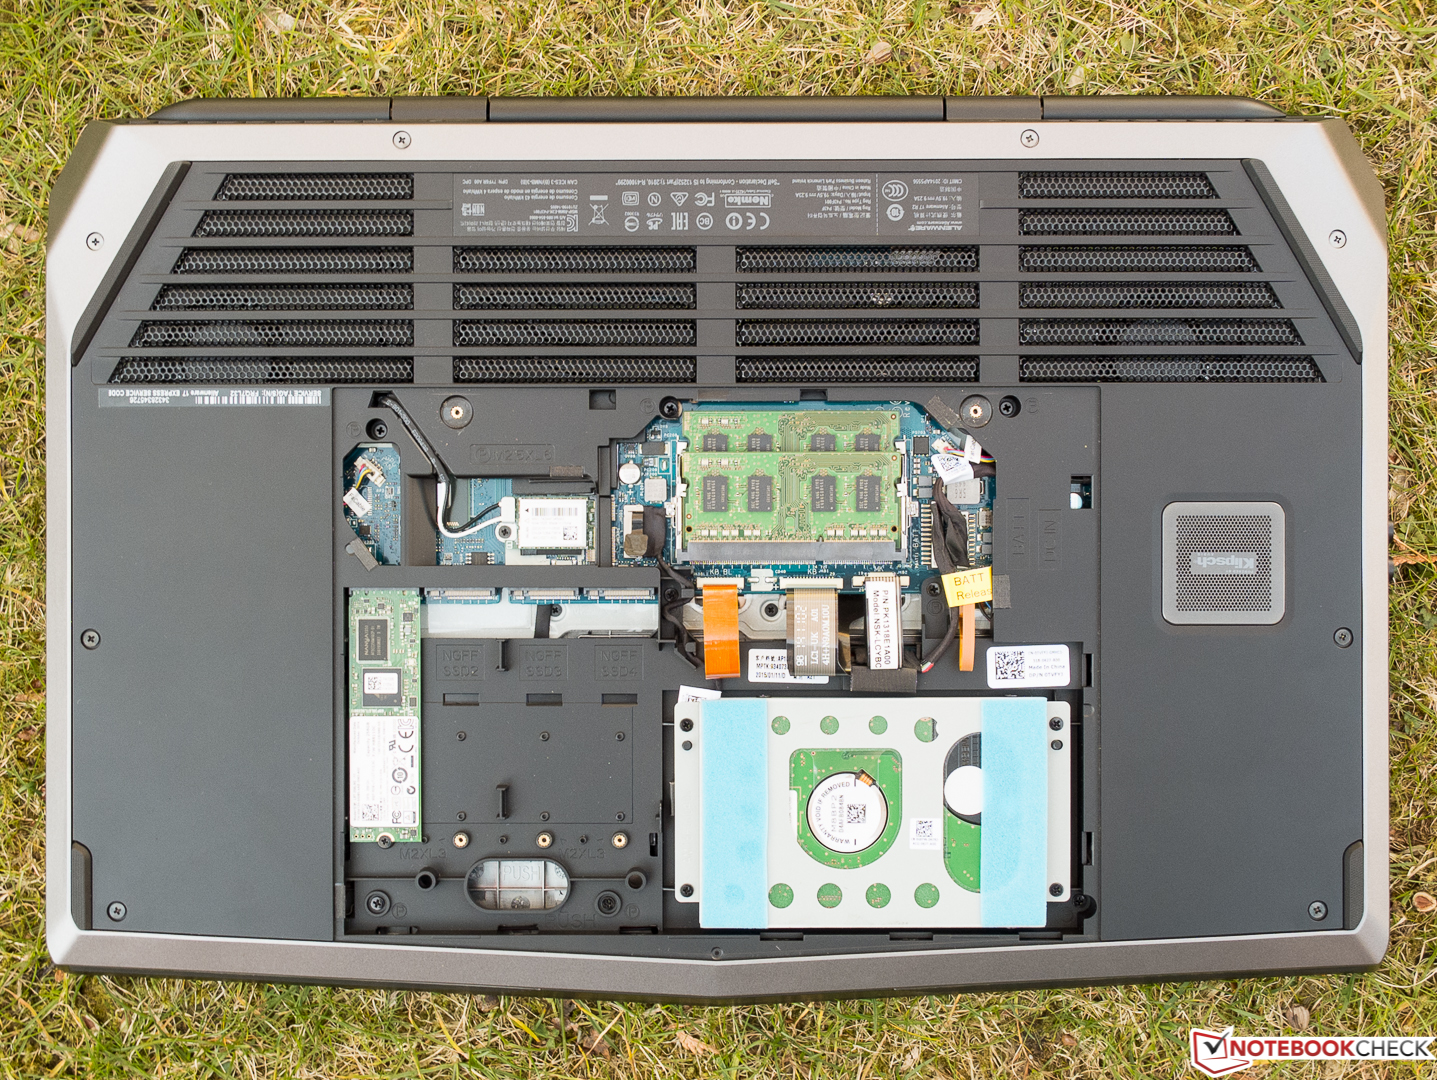
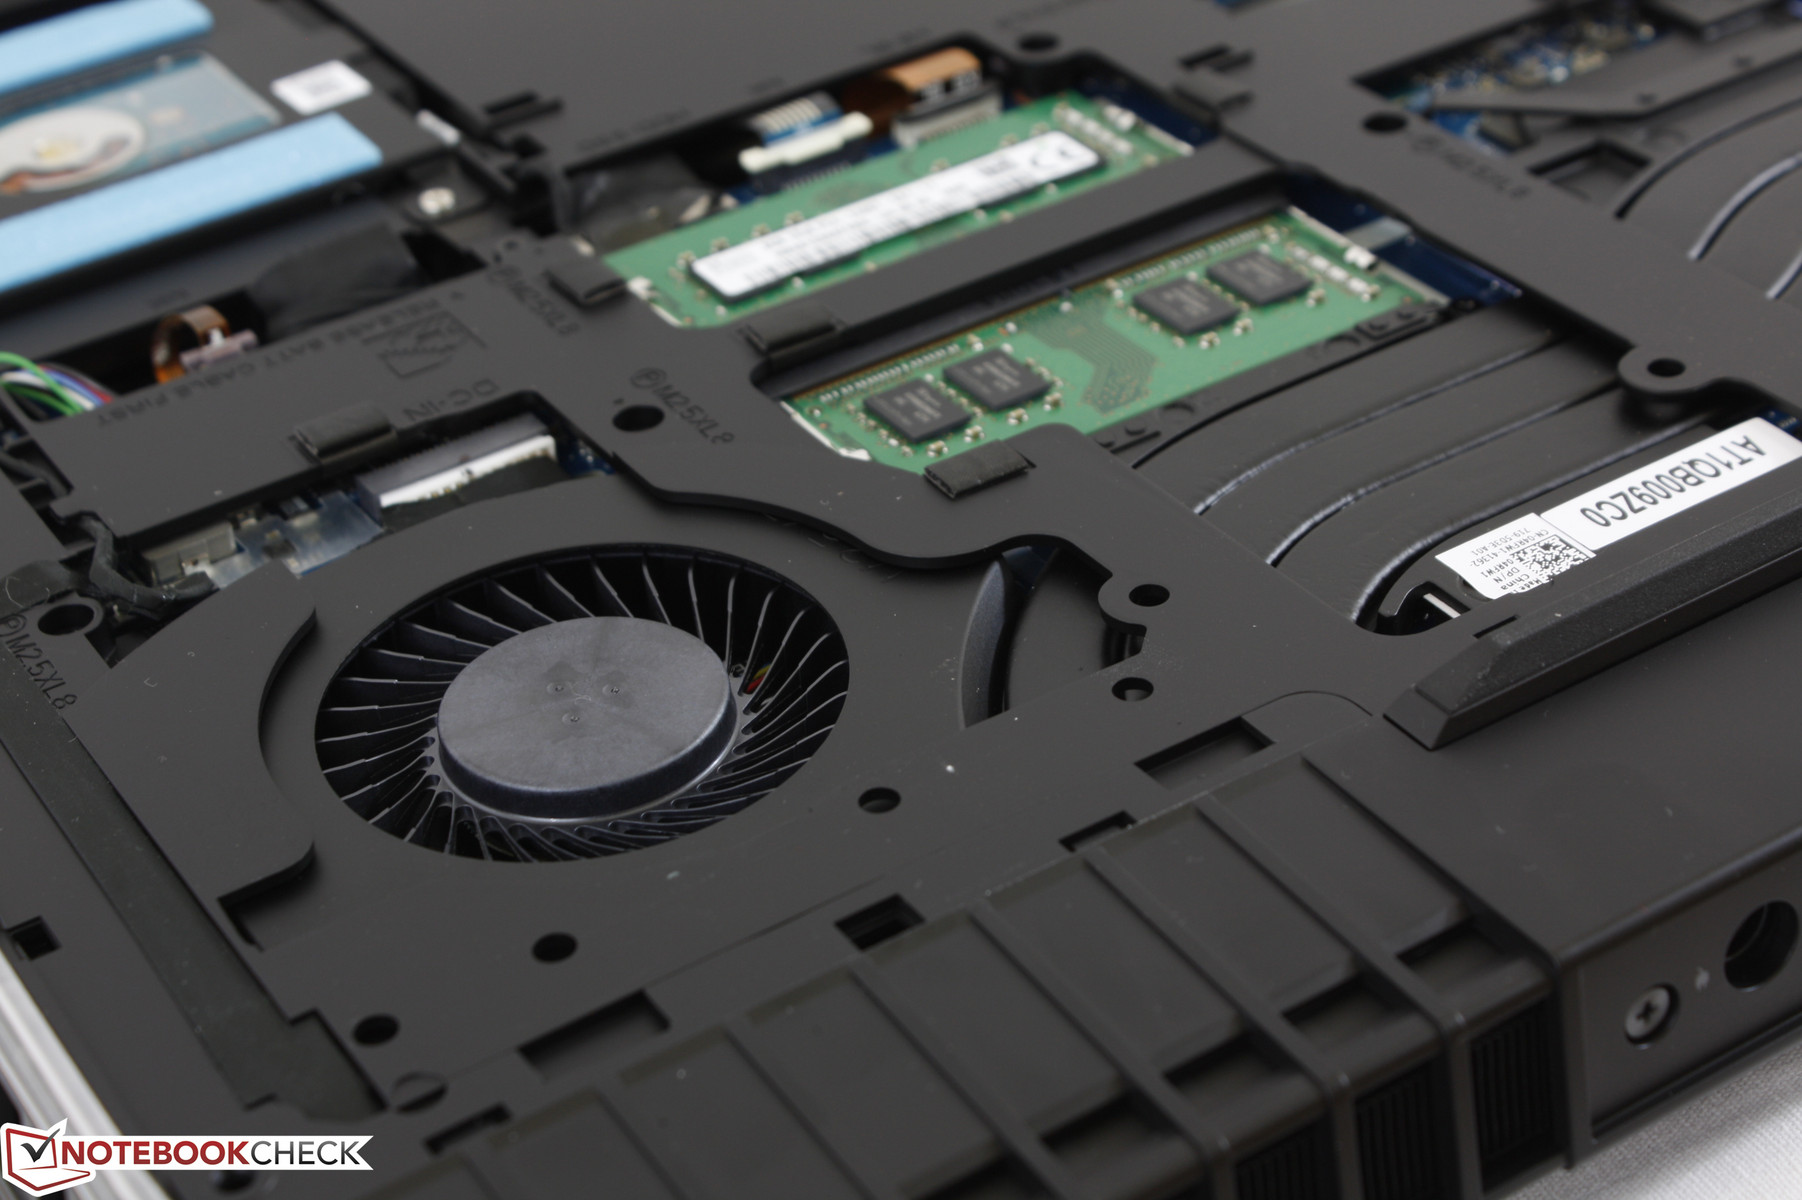
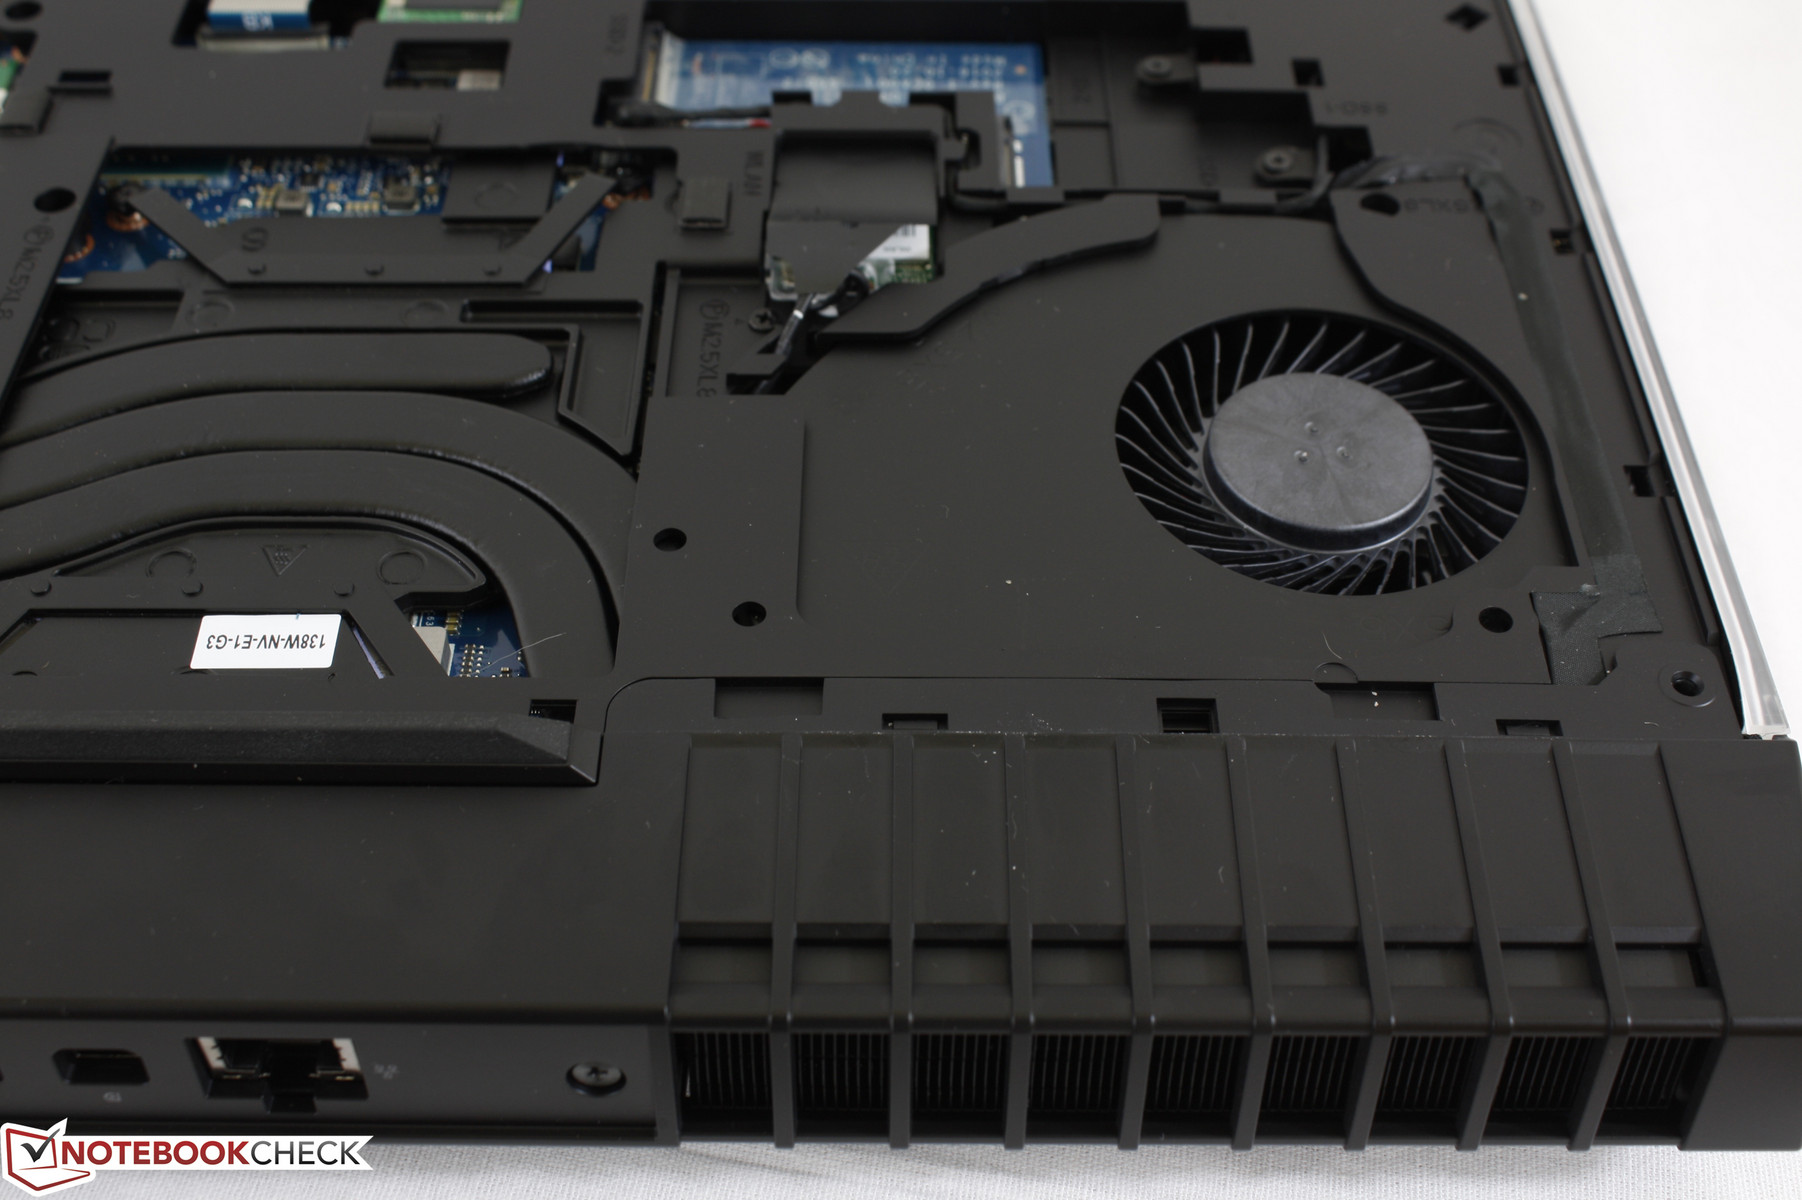
The bottom panel can be easily removed with a Philips screwdriver and a sharp edge. Its latches are quite tight, so the process is not as painless as on most Clevo or MSI notebooks. Once removed, users will have access to all four storage bays, the WLAN module, system fans, and both DDR4 SODIMM slots. Direct access to the battery and the rest of the motherboard continues to be tricky because of the thick chassis plating protecting key internal components. While this is responsible for the very sturdy design of the Alienware, it also makes troubleshooting more laborious compared to other notebooks with "open" motherboards. It's a small trade off that may irk some users who prefer easier accessibility.
Dell offers a comprehensive service guide for users who wish to disassemble the notebook further. Note that the GPU is soldered and does not utilize an upgradeable MXM 3.0 slot.
Warranty
A one-year limited warranty is included in the price whereas manufacturers like Gigabyte offer two years as standard. Buyers can extend the manufacturer warranty for up to four years with accidental damage protection. Dell is well-known for its extensive consumer support across its consumer and business products and the Alienware is no exception. Please see our Guarantees, Return policies and Warranties FAQ for country-specific information.
Input Devices
Keyboard
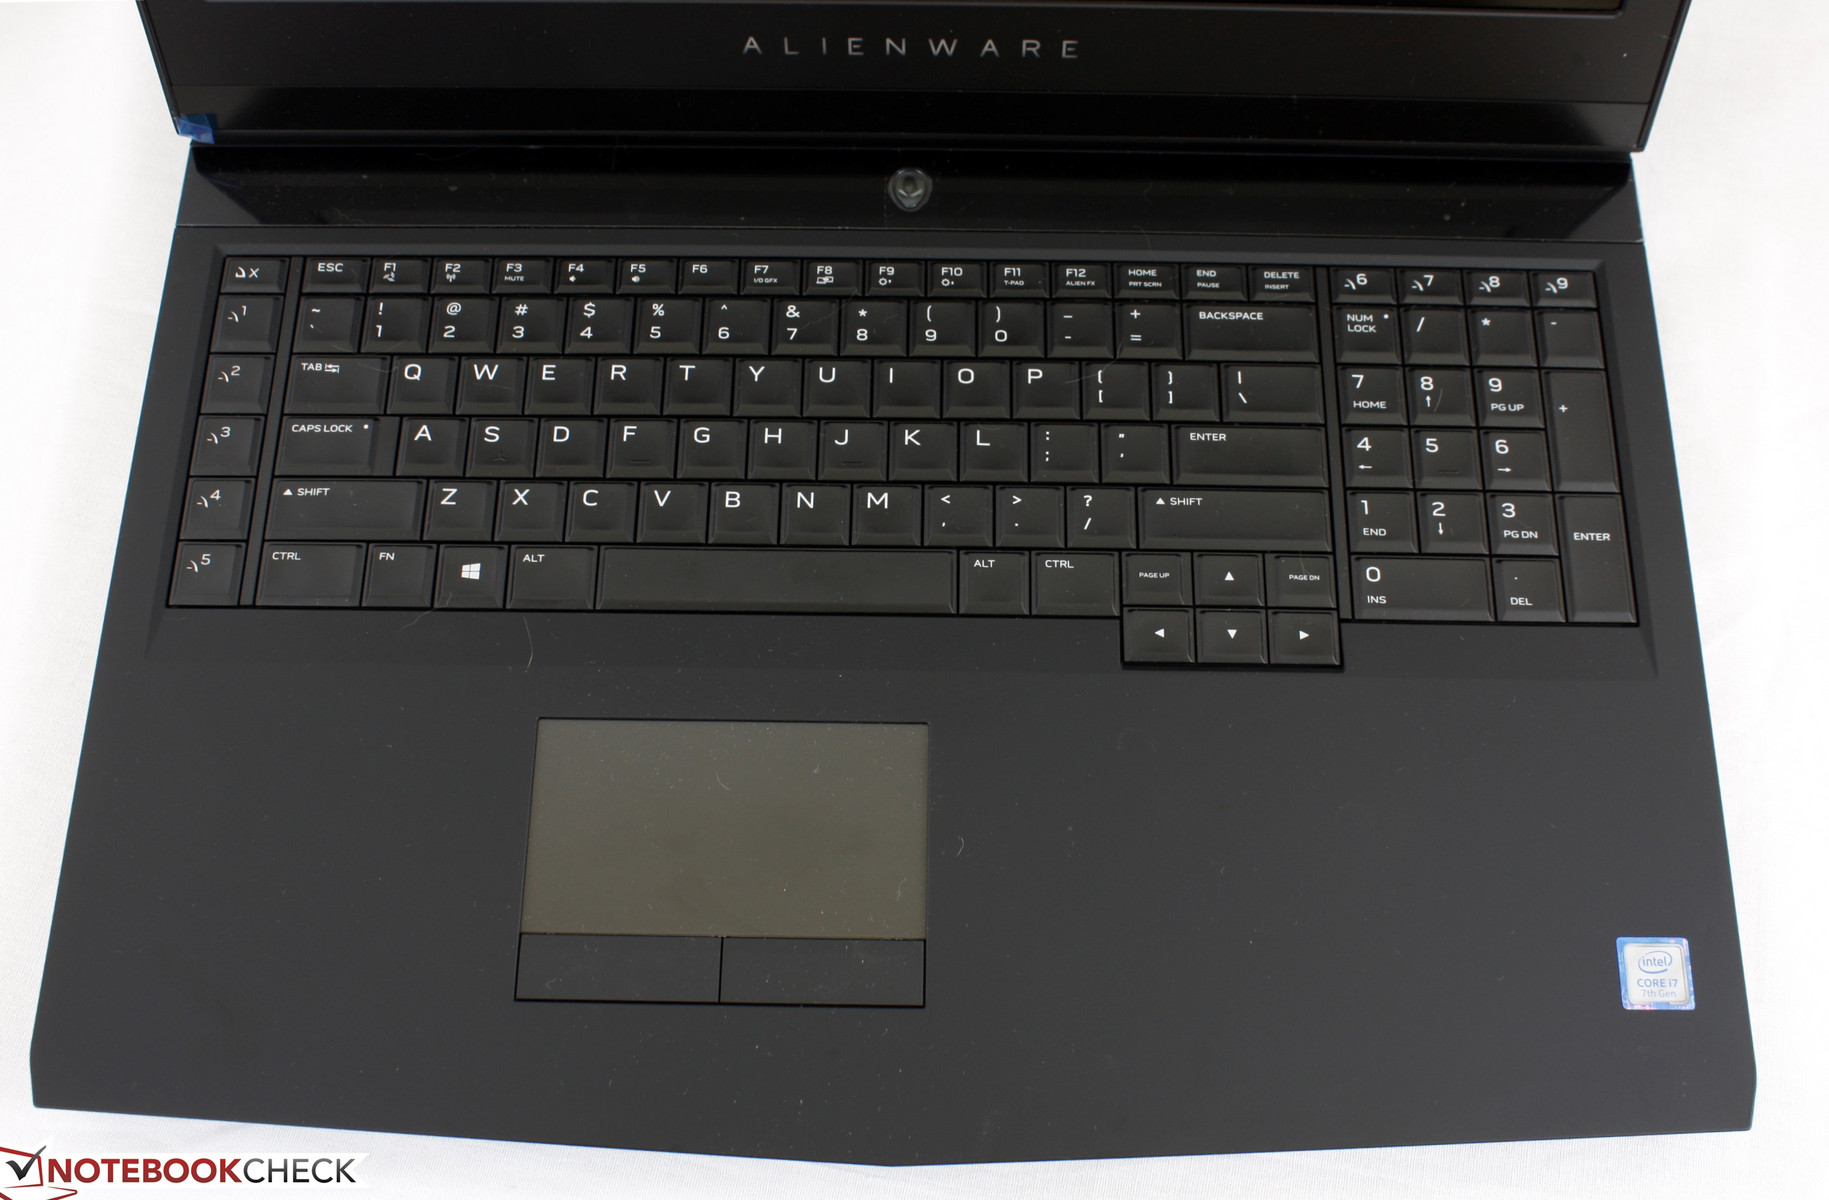
The feel of the QWERTY keys remains unchanged from the outgoing 17 R3. Unlike most other gaming notebooks, Dell is sticking to a beveled layout to reduce the spacing between each key. Feedback is firm yet quiet with no unevenness between keys of different sizes. In other words, the Function keys and Arrow keys are not any spongier simply due to their smaller sizes. Clatter is minimal and keys do not wiggle in place by any large degree. Interestingly, Dell is advertising the Alienware keyboard as "the only keyboard on a laptop with 2.2 mm of key travel", but this is blatantly false as the older Gigabyte P55W V4 was also advertised as having 2.2 mm of key travel. Regardless, this is still deeper than on most Ultrabooks and gaming notebooks where 2 mm of travel or shorter is common.
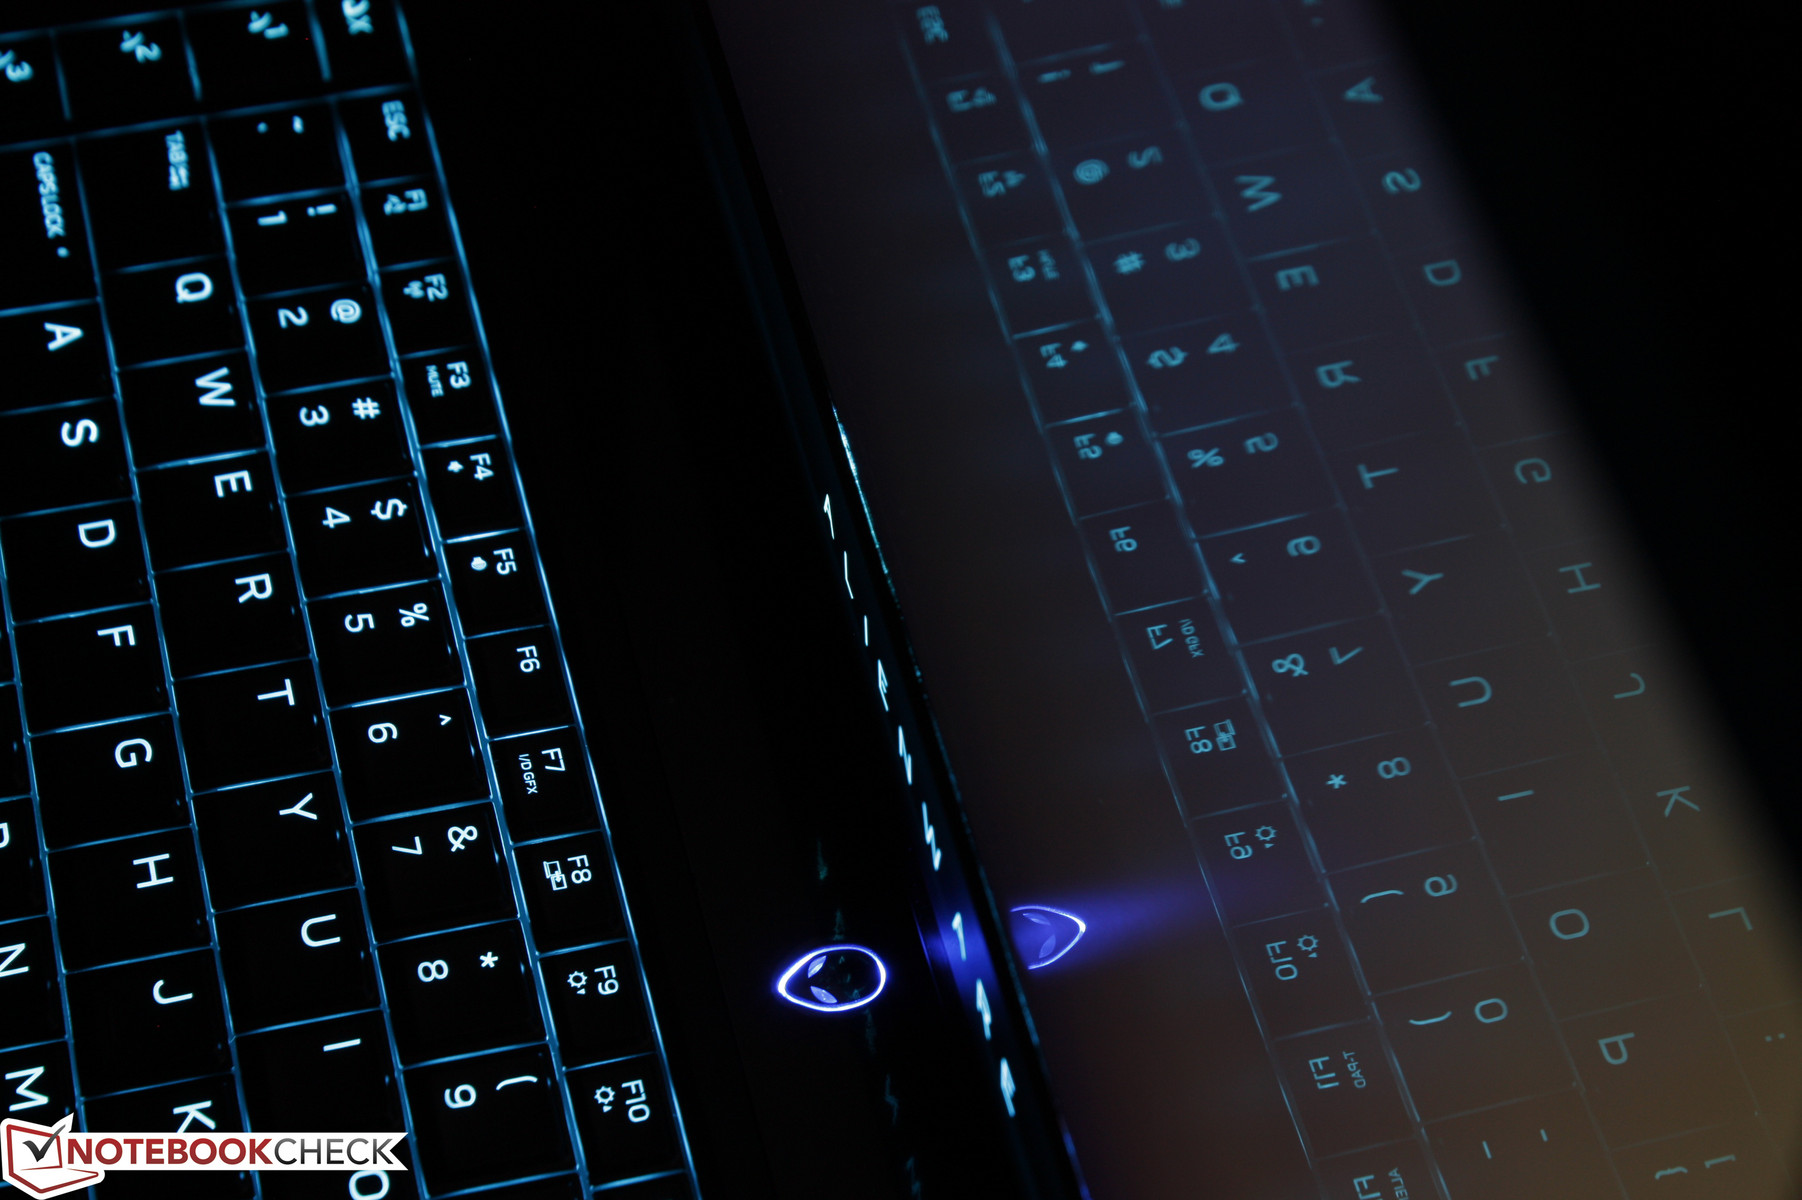
The AlienFX software allows customization of the keyboard backlight in four preset zones plus the trackpad, Alienware logo, and the rim lights along the outer edges of the notebook. As a result, the system does not include individually-lit keys with 16.7 million RGB colors and is instead limited to a color wheel of just 20 colors to choose from. In comparison, the Lenovo Y900 keyboard is split into seven distinct zones and the latest Aorus systems have full individually-lit RGB keys for a much wider range of effects. Strangely enough, there is no keyboard hotkey for adjusting light intensity and users will have to right-click the AlienFX icon for the brightness slider.
Touchpad
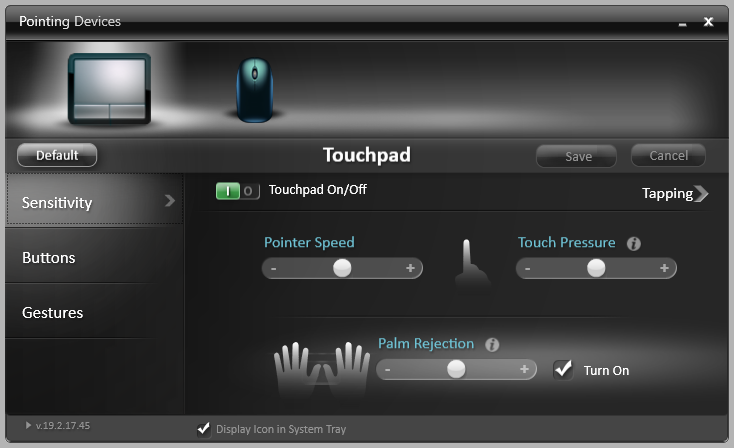
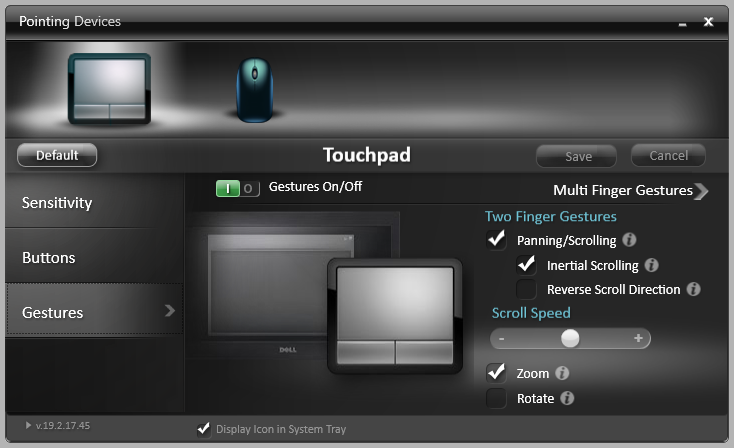
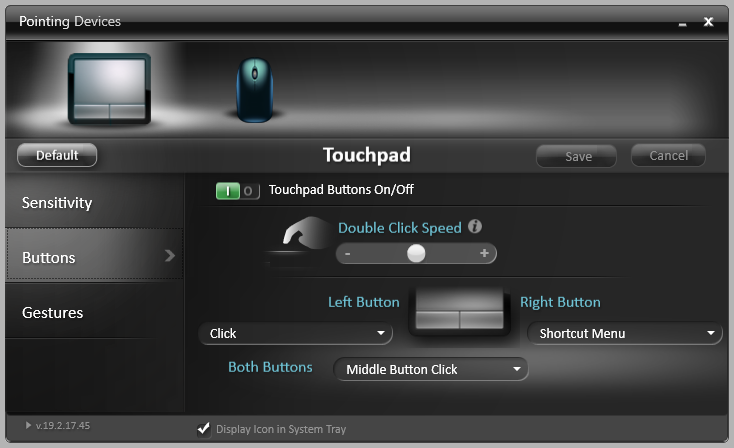
The small (10 x 5.5 cm) trackpad on the new Alienware is also largely unchanged from the 17 R3 with its smooth glide and ease of use. The surface is firm and will not warp if applying pressure with a finger. A larger surface area would have been appreciated, but the small dimensions may have been necessary in order to preserve chassis rigidity. Synaptics software powers the trackpad with a special Alienware-themed UI for adjusting sensitivity and gestures of up to four fingers.
The dedicated mouse keys are relatively quiet when pressed with deep travel and adequate feedback. This is in stark contrast to the mouse keys on the MSI GT series where the keys are firmer, louder, and shallower in travel. The softer keys on the Alienware are still comfortable to use even if they are spongier than on most gaming notebooks, so it is more a matter of preference. For longer sessions, however, we still find it faster to simply double-tap on the trackpad surface instead.
Display
Display options are wider than on most other gaming notebooks. Whereas models like the MSI GT73VR or Asus G701 include FHD and UHD options, the Alienware throws in the more uncommon QHD panel for a total of three different resolutions. This becomes more even confusing as certain resolution panels can carry G-Sync or no G-Sync, 120 Hz or 60 Hz refresh, brighter or dimmer backlighting, or even compatibility with the integrated Intel HD Graphics 620 GPU. In fact, these panels will very likely carry different contrast ratios and color gamuts between them as well, so we strongly suggest potential buyers to choose very carefully in regards to the display. Our small table below shows the different features of each of the three resolution options.
Why not offer a 4K UHD option with the best of all worlds including 120 Hz refresh, G-Sync, full sRGB coverage, and manual or automatic graphics switching? We've asked multiple manufacturers this same question and the responses are unanimous - there is not yet a supplier that can provide such a panel in sufficient quantities. Thus, the pros and cons of each resolution option available are understandable at this point in time.
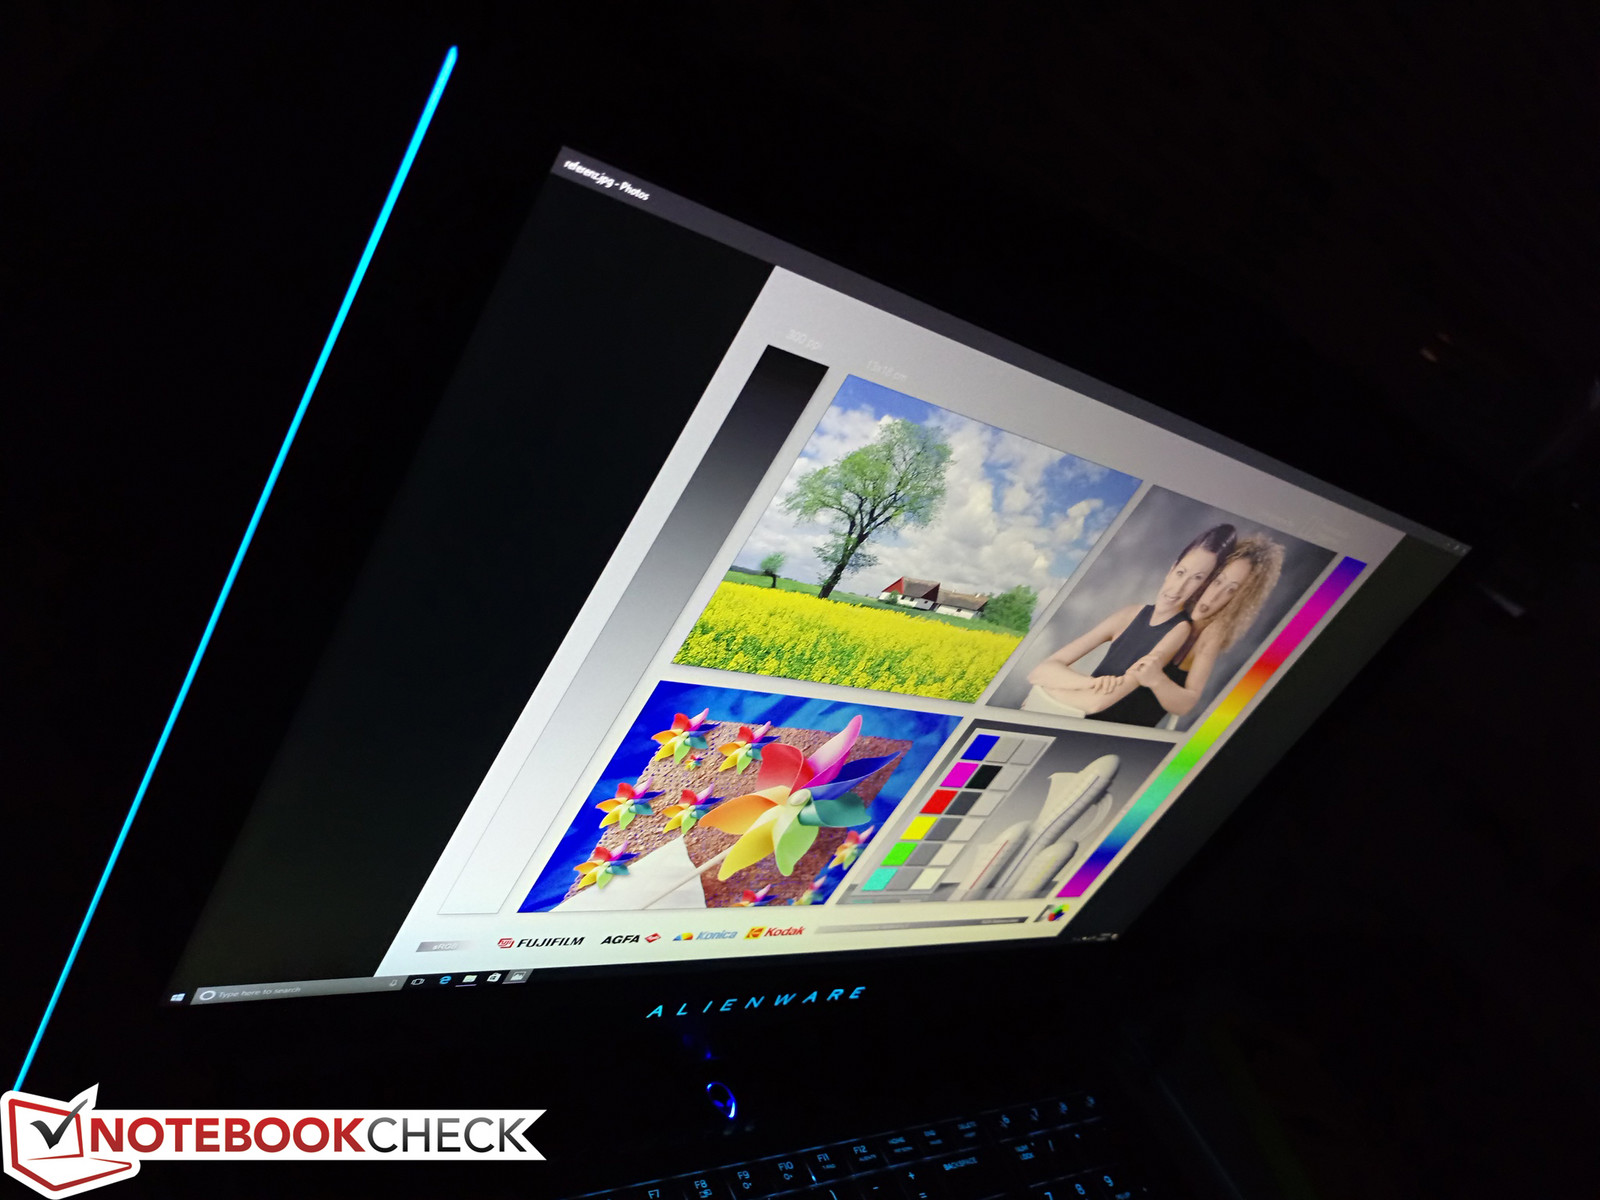
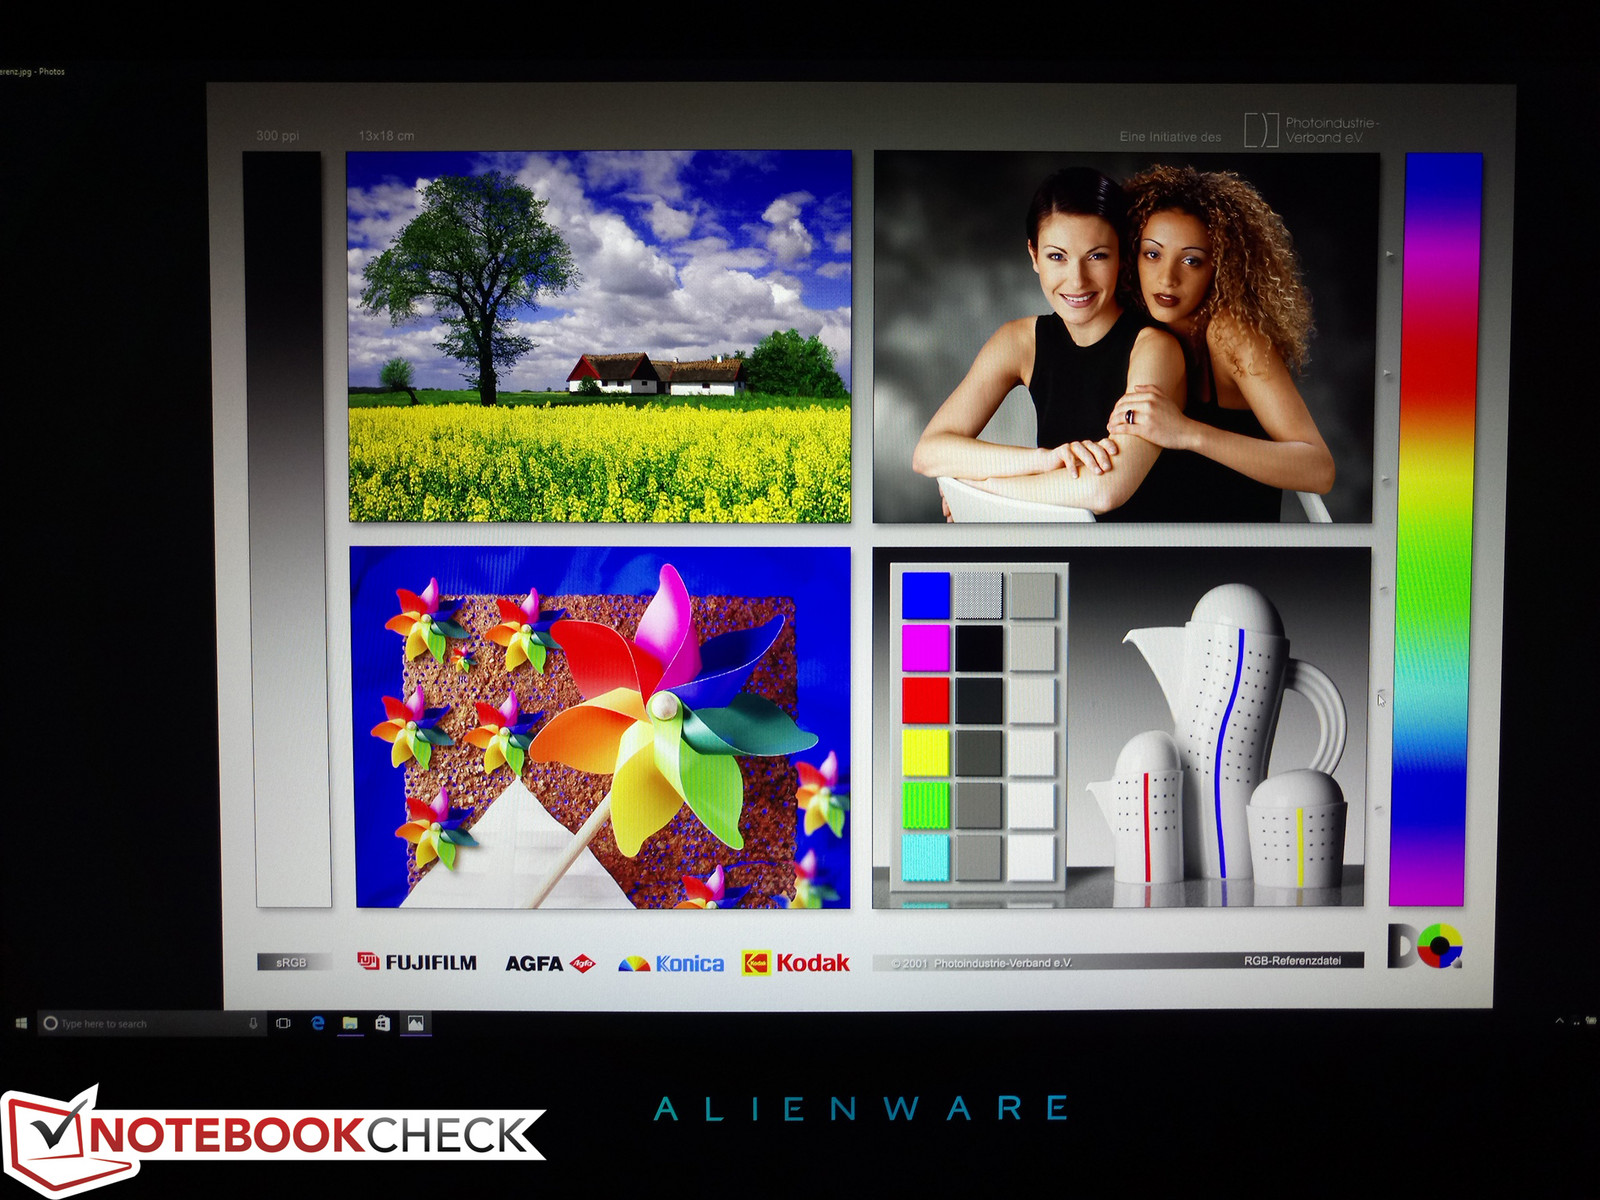
Our test model is equipped with a matte QHD AU Optronics AUO1496 panel that can be found on no other laptop in our current database. Dell promises a 400-nit backlight which we can confirm with our own X-Rite spectrophotometer on the very center of the screen, but brightness drops slightly around the edges and corners for an overall average of about 370 nits. Contrast is middling at about 700:1 compared to almost twice that on the Chi Mei panel of the MSI GT73VR. Again, our measurements below reflect only the QHD SKU of the Alienware 17 R4 as the FHD and UHD SKUs are very likely to exhibit different results.
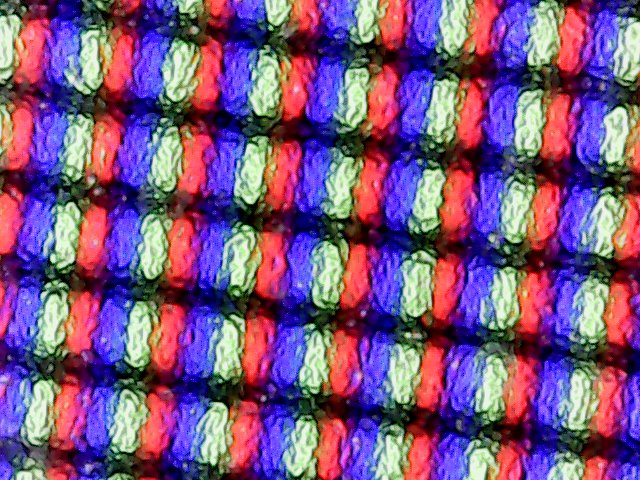
Subjectively, the QHD display is crisp and both the 120 Hz refresh rate and very fast black-white response times make for an extremely smooth experience. Simple actions like cursor movement or window dragging, for example, feel faster and more responsive. The screen suffers from a light-moderate amount of color graininess that becomes noticeable when displaying a white background such as a Word document or folder window. Such a phenomenon is common across most matte panels and is largely absent on glossy touchscreens. We can otherwise notice no major backlight bleeding issues around the edges or corners of the screen.
| FHD Option | QHD Option | 4K UHD Option |
| IPS | TN | IPS |
| 300 nits | 400 nits | 300 nits |
| No 120 Hz | 120 Hz | No 120 Hz |
| Integrated GPU | No integrated GPU | Integrated GPU |
| No G-Sync | G-Sync | No G-Sync |
| |||||||||||||||||||||||||
Brightness Distribution: 86 %
Center on Battery: 402.3 cd/m²
Contrast: 649:1 (Black: 0.62 cd/m²)
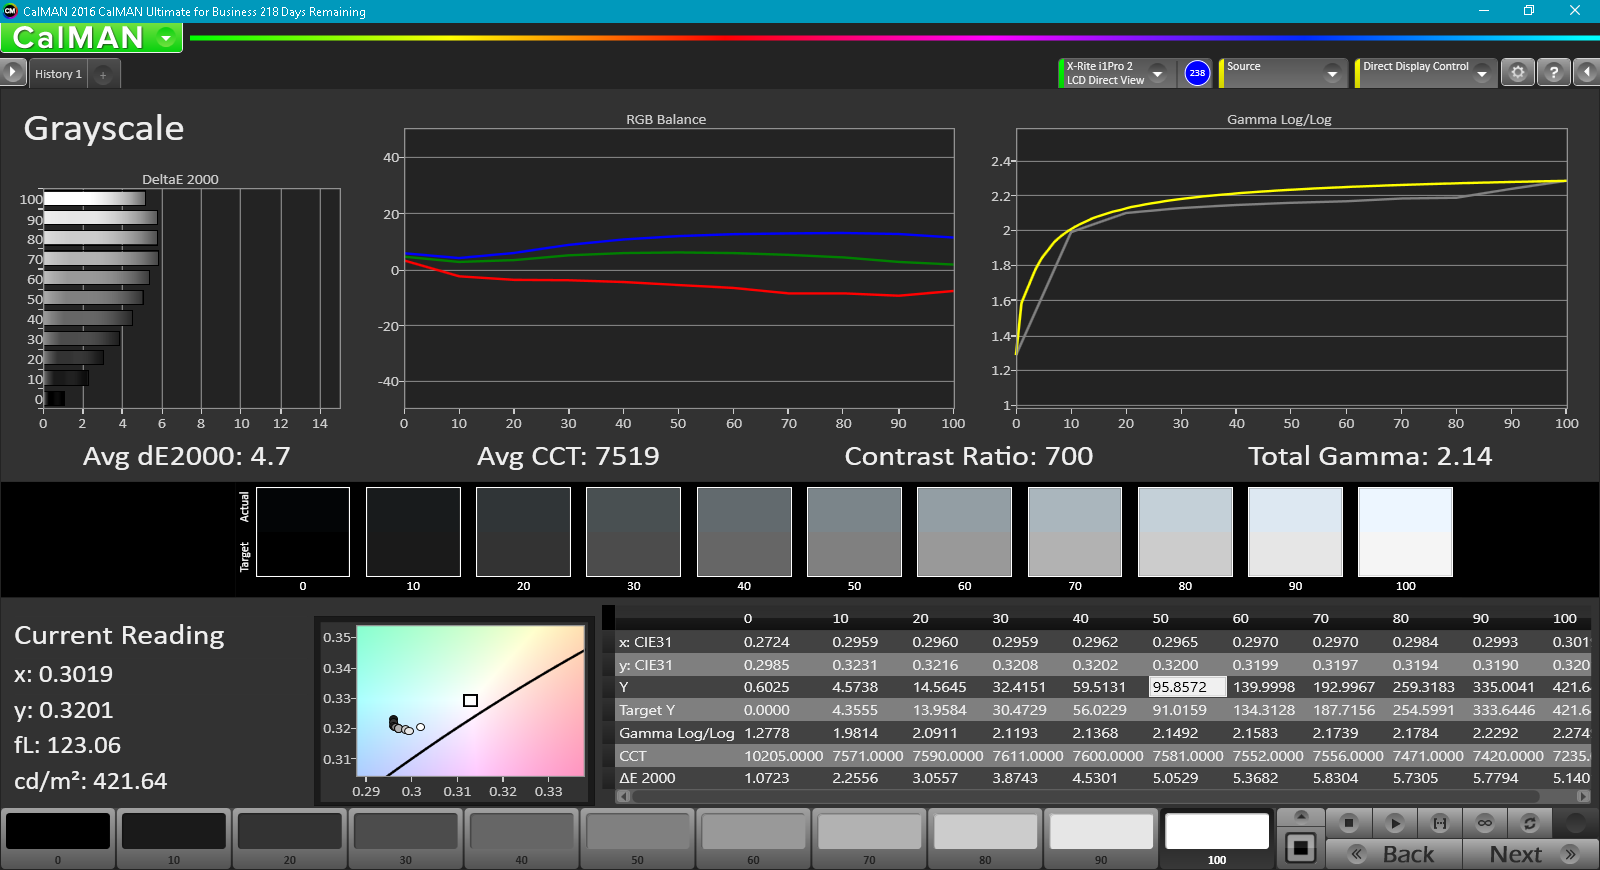
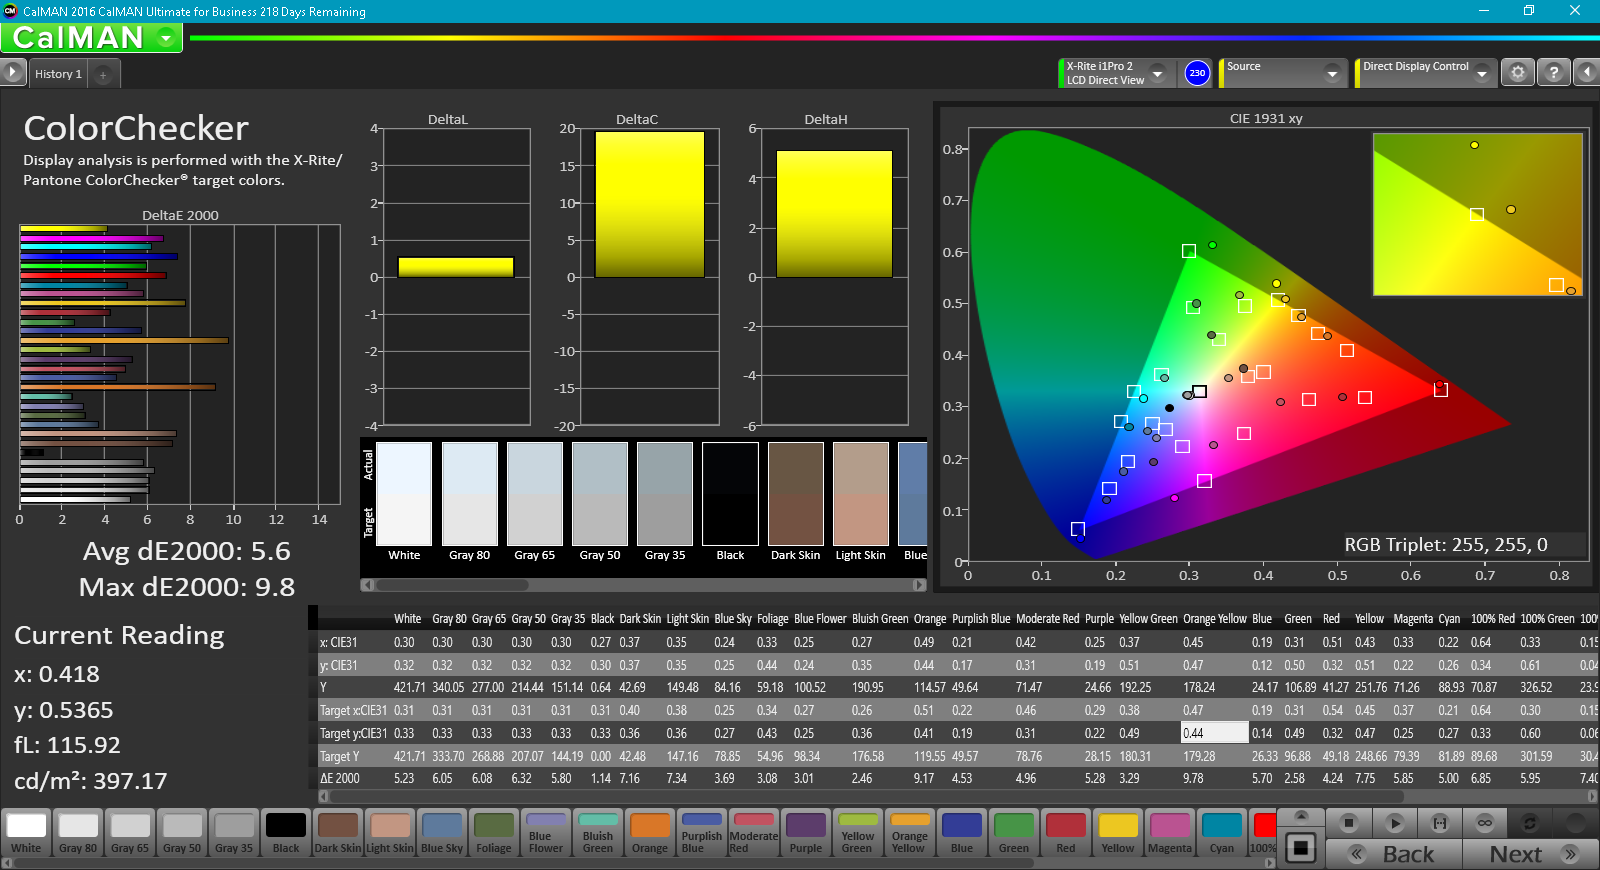
ΔE ColorChecker Calman: 5.6 | ∀{0.5-29.43 Ø4.73}
ΔE Greyscale Calman: 4.7 | ∀{0.09-98 Ø4.97}
82.2% sRGB (Argyll 1.6.3 3D)
53.7% AdobeRGB 1998 (Argyll 1.6.3 3D)
60.5% AdobeRGB 1998 (Argyll 3D)
82.9% sRGB (Argyll 3D)
61.2% Display P3 (Argyll 3D)
Gamma: 2.14
CCT: 7519 K
| Alienware 17 R4 TN LED, 17.3", 2560x1440 | Alienware 17 R3 (A17-9935) CV69H_173WF4 (LGD0459), IPS, 17.3", 1920x1080 | MSI GT73VR 7RF-296 N173HHE-G32 (CMN1747), TN LED, 17.3", 1920x1080 | Acer Predator 17 X GX-792-76DL LP173WF4-SPF5 (LGD056D), IPS, 17.3", 1920x1080 | Aorus X7 DT v6 AUO1096, TN LED, 17.3", 2560x1440 | |
|---|---|---|---|---|---|
| Display | 4% | 36% | 3% | -1% | |
| Display P3 Coverage (%) | 61.2 | 66.9 9% | 90.6 48% | 66 8% | 59.6 -3% |
| sRGB Coverage (%) | 82.9 | 83.9 1% | 99.9 21% | 83.7 1% | 82.8 0% |
| AdobeRGB 1998 Coverage (%) | 60.5 | 61.4 1% | 84.7 40% | 61.2 1% | 60.1 -1% |
| Response Times | -45% | 29% | -85% | 13% | |
| Response Time Grey 50% / Grey 80% * (ms) | 30 ? | 33 ? -10% | 26 ? 13% | 45 ? -50% | 21.6 ? 28% |
| Response Time Black / White * (ms) | 12.8 ? | 23 ? -80% | 7 ? 45% | 28 ? -119% | 13.2 ? -3% |
| PWM Frequency (Hz) | 59.5 | ||||
| Screen | 7% | -9% | 16% | -6% | |
| Brightness middle (cd/m²) | 402.3 | 360 -11% | 307 -24% | 380 -6% | 339.5 -16% |
| Brightness (cd/m²) | 372 | 336 -10% | 284 -24% | 362 -3% | 309 -17% |
| Brightness Distribution (%) | 86 | 90 5% | 85 -1% | 91 6% | 80 -7% |
| Black Level * (cd/m²) | 0.62 | 0.44 29% | 0.25 60% | 0.37 40% | 0.45 27% |
| Contrast (:1) | 649 | 818 26% | 1228 89% | 1027 58% | 754 16% |
| Colorchecker dE 2000 * | 5.6 | 4.76 15% | 9.65 -72% | 4.12 26% | 6.88 -23% |
| Colorchecker dE 2000 max. * | 9.8 | 10.8 -10% | 16.36 -67% | 8.19 16% | 9.99 -2% |
| Greyscale dE 2000 * | 4.7 | 3.69 21% | 10.07 -114% | 3.95 16% | 6.57 -40% |
| Gamma | 2.14 103% | 2.24 98% | 2.12 104% | 2.47 89% | 2.04 108% |
| CCT | 7519 86% | 6091 107% | 12145 54% | 6539 99% | 8608 76% |
| Color Space (Percent of AdobeRGB 1998) (%) | 53.7 | 55 2% | 75 40% | 55 2% | 54 1% |
| Color Space (Percent of sRGB) (%) | 82.2 | 84 2% | 100 22% | 84 2% | 82 0% |
| Total Average (Program / Settings) | -11% /
-1% | 19% /
5% | -22% /
-0% | 2% /
-3% |
* ... smaller is better
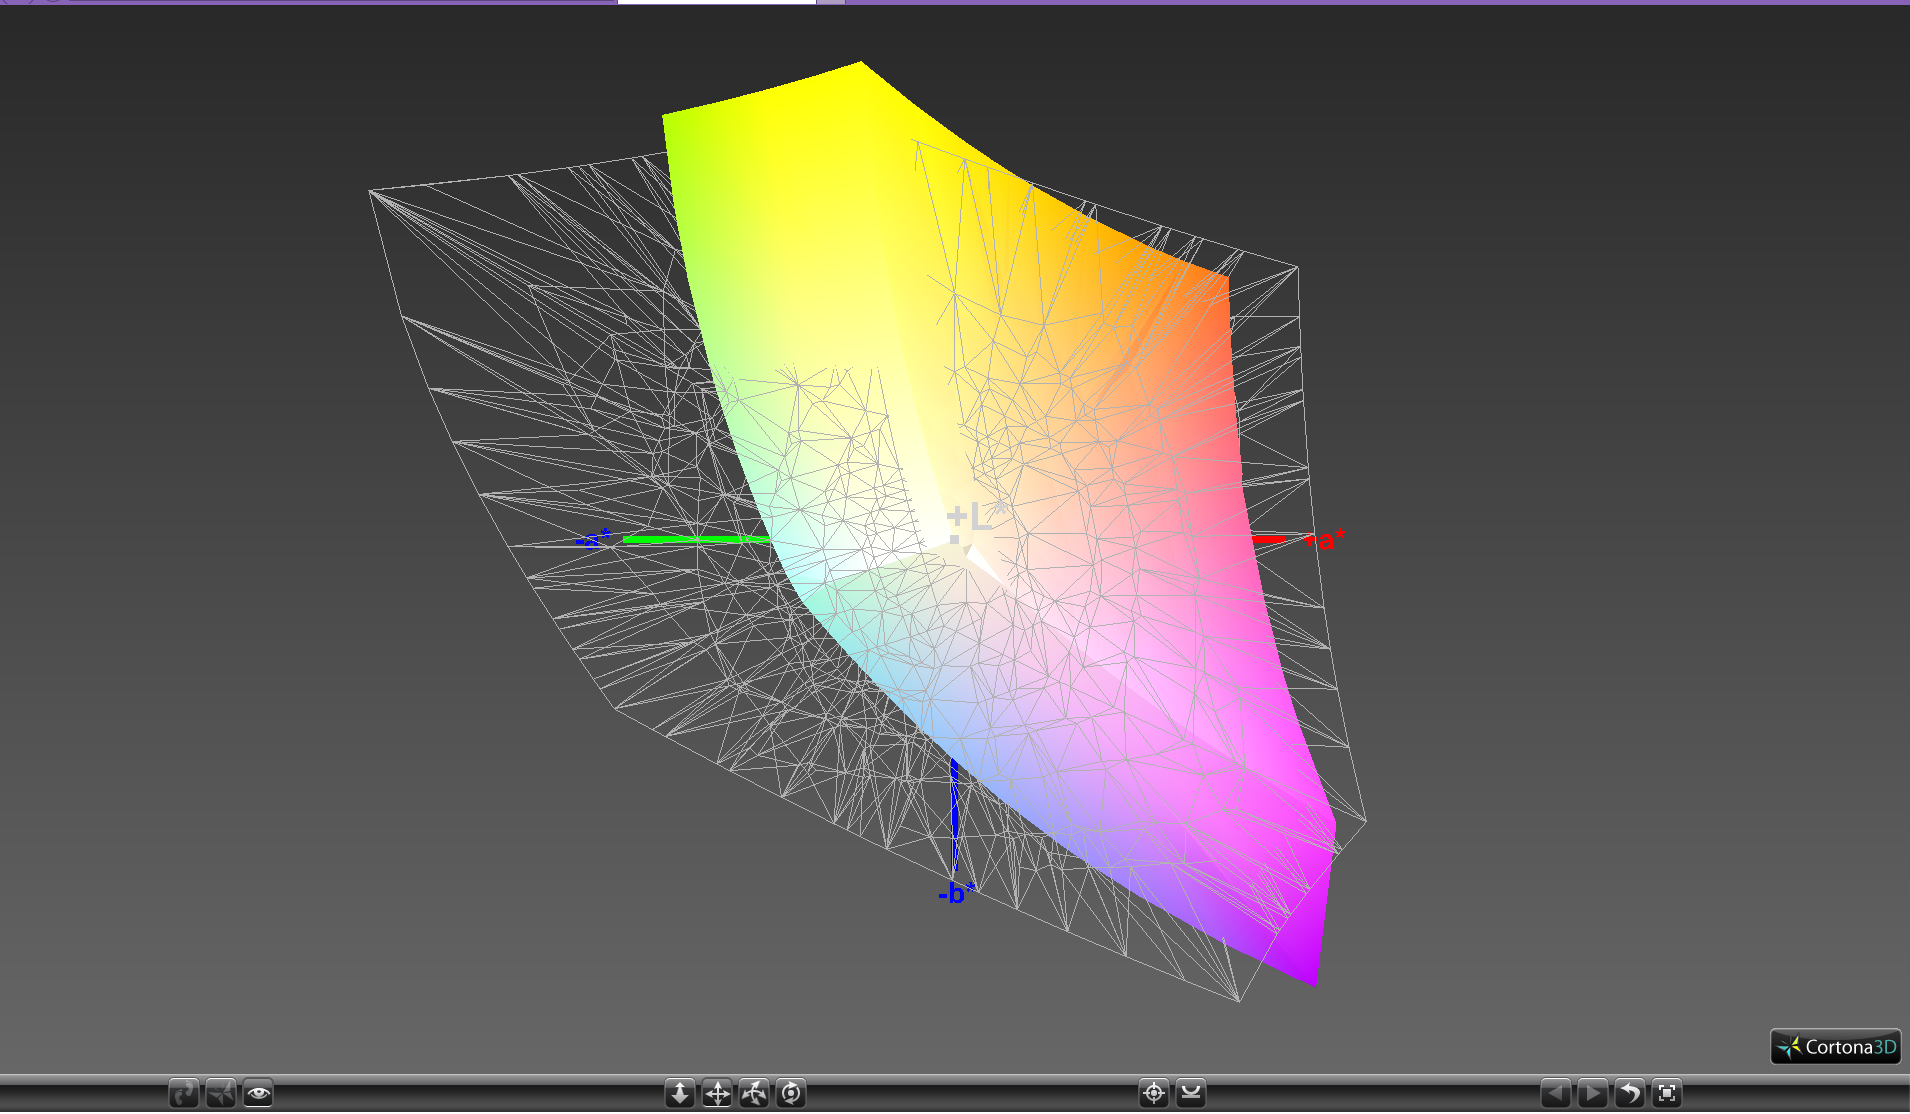
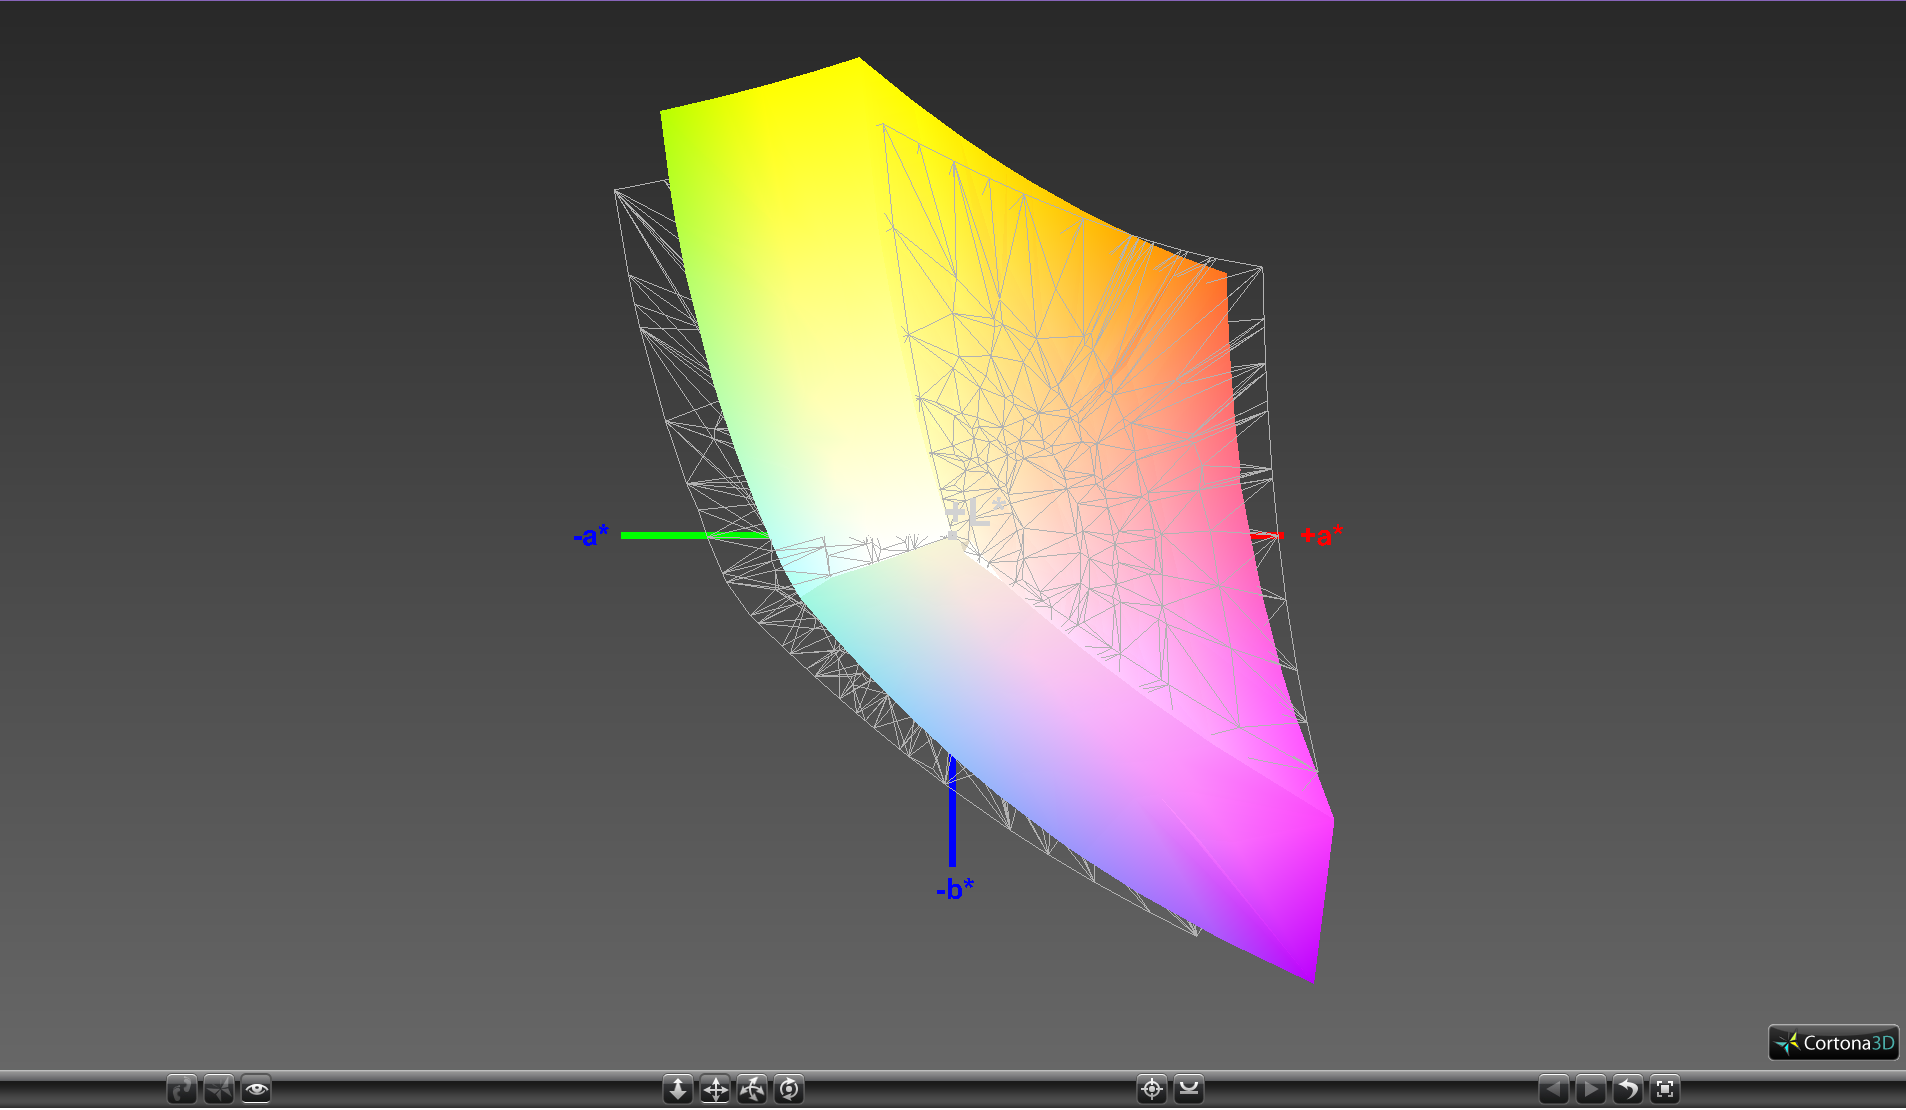
Color coverage is approximately 54 percent and 82 percent of the AdobeRGB and sRGB standards, respectively. This is similar to the displays on the Acer Predator 17 X and older Alienware 17 R3 and about average for a high-end gaming notebook. Certain competitors offer full sRGB coverage like the MSI GT73VR or Razer Blade Pro, though these alternatives may not have the same QHD/120 Hz/G-Sync options like our Alienware. For gaming purposes, however, response times and contrast generally take precedence over color accuracy.
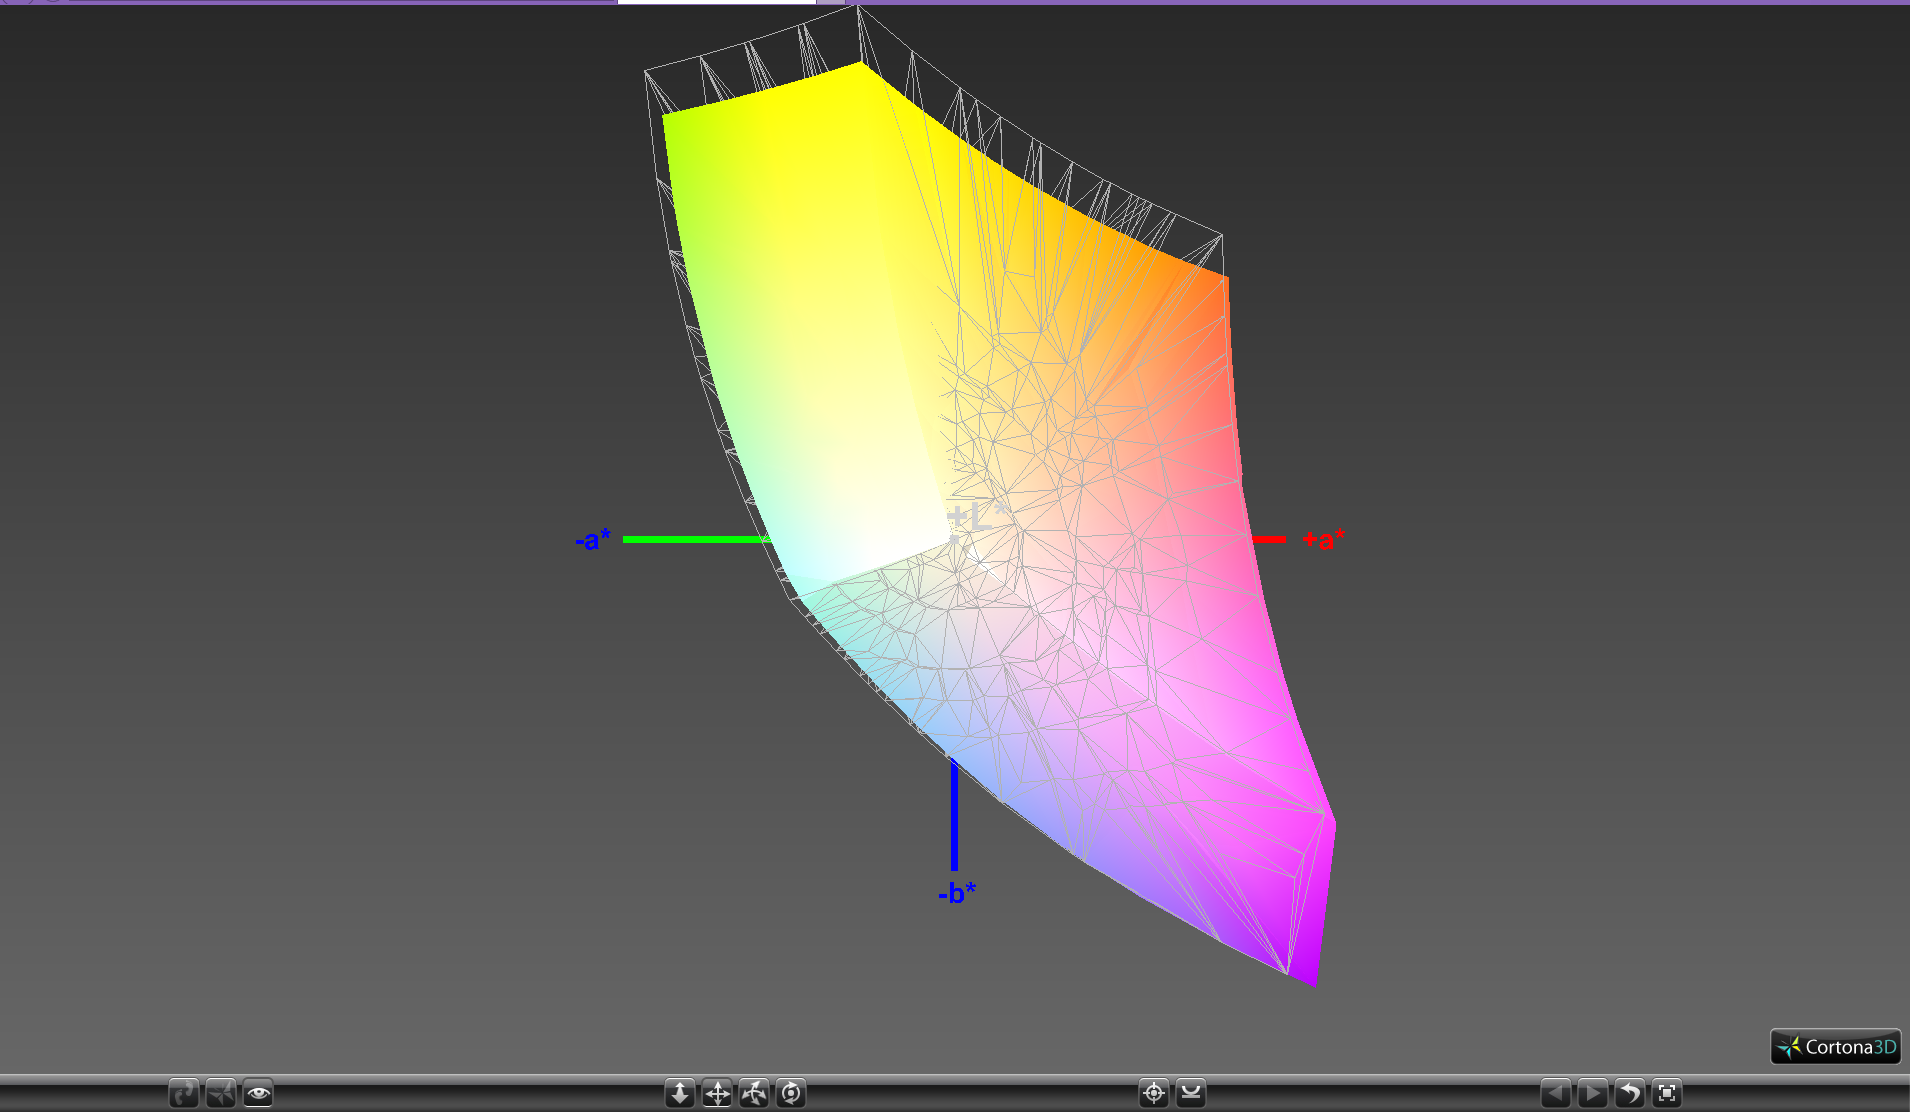
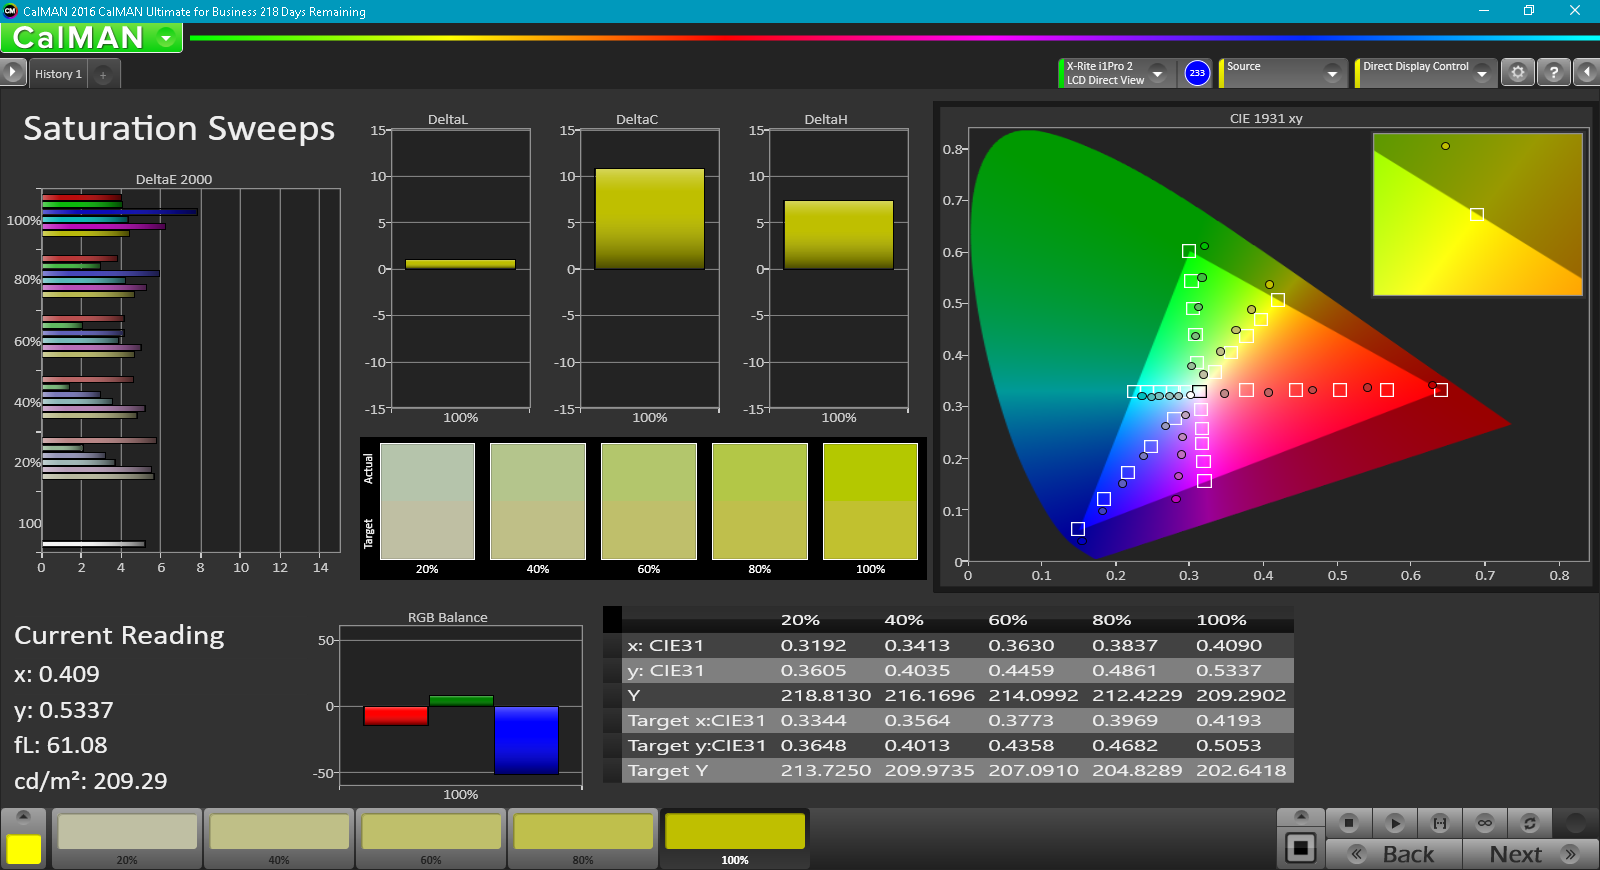
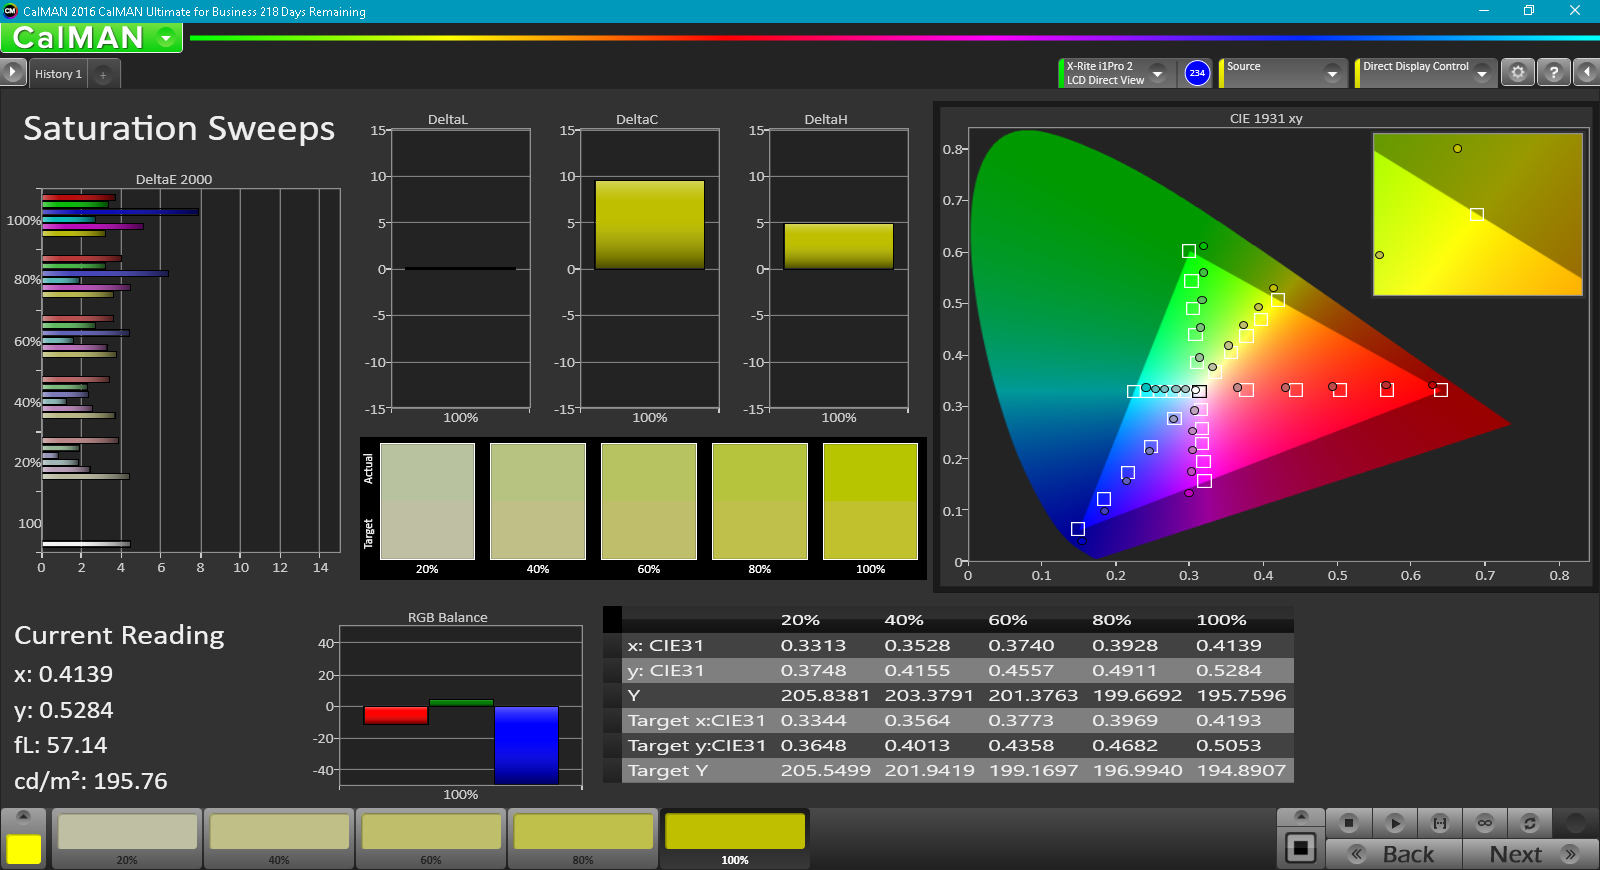
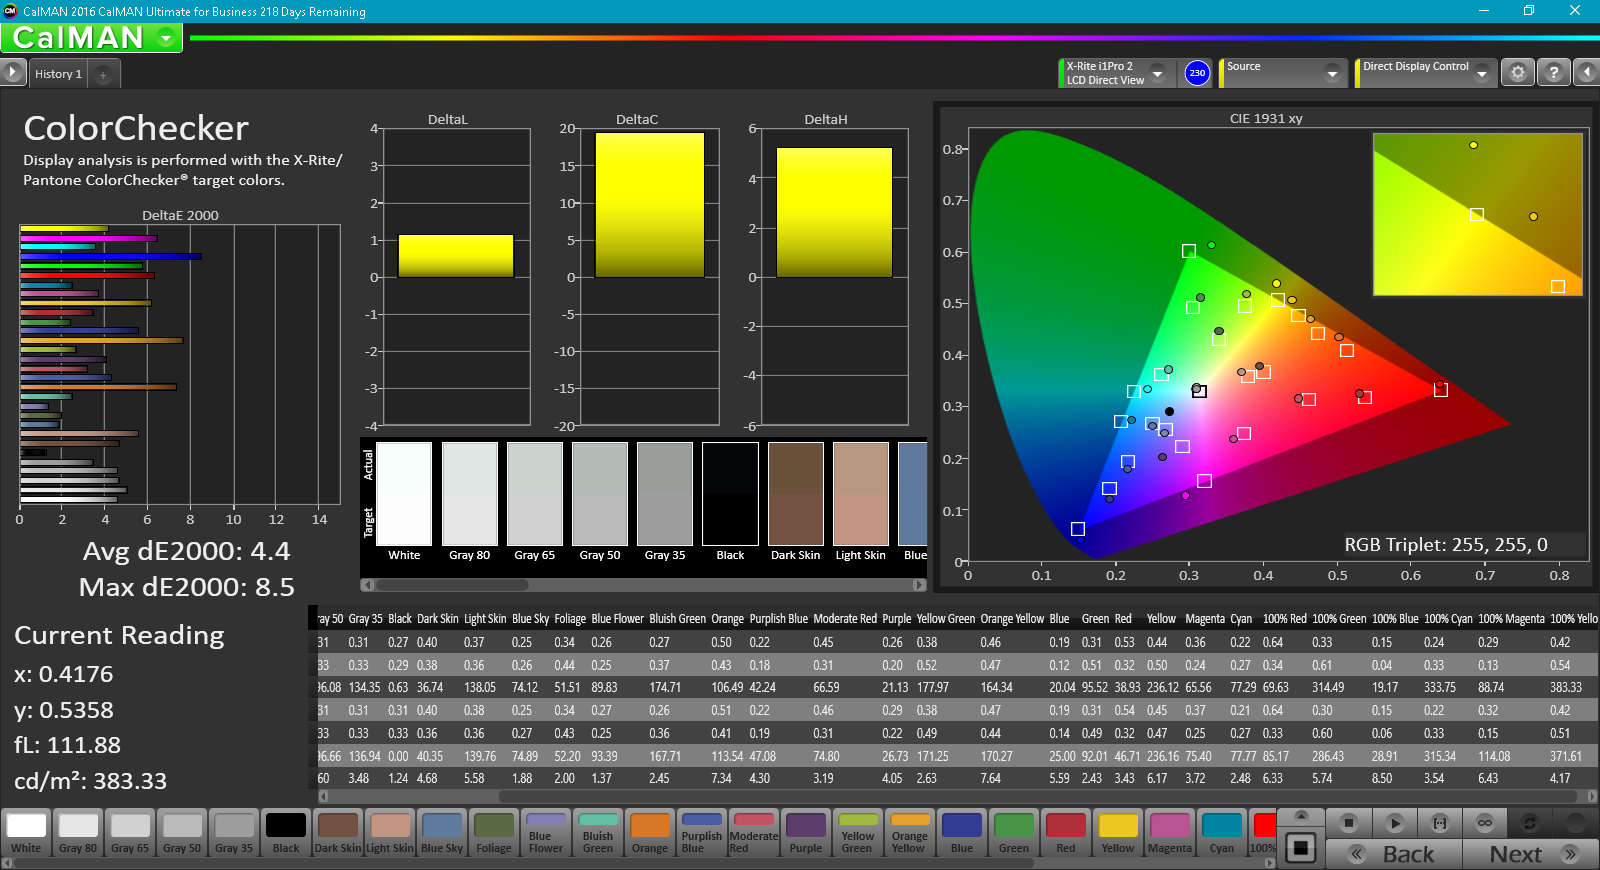
Further display measurements with an X-Rite spectrophotometer reveal generally accurate grayscale and colors out of the box. There are slight improvements after calibration as shown by our CalMan results below, but an end-user calibration is not absolutely necessary. Blue and Orange colors are represented slightly less accurately than others. All colors become increasingly inaccurate the higher the saturation level due to the imperfect sRGB coverage of the panel.

Display Response Times
| ↔ Response Time Black to White | ||
|---|---|---|
| 12.8 ms ... rise ↗ and fall ↘ combined | ↗ 10.8 ms rise | 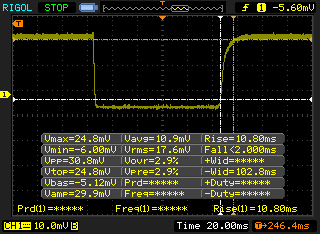 |
| ↘ 2 ms fall | ||
| The screen shows good response rates in our tests, but may be too slow for competitive gamers. In comparison, all tested devices range from 0.1 (minimum) to 240 (maximum) ms. » 33 % of all devices are better. This means that the measured response time is better than the average of all tested devices (19.9 ms). | ||
| ↔ Response Time 50% Grey to 80% Grey | ||
| 30 ms ... rise ↗ and fall ↘ combined | ↗ 18.8 ms rise | 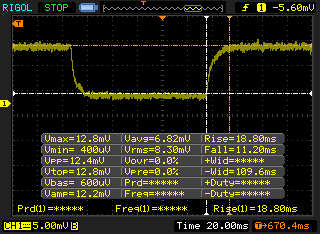 |
| ↘ 11.2 ms fall | ||
| The screen shows slow response rates in our tests and will be unsatisfactory for gamers. In comparison, all tested devices range from 0.165 (minimum) to 636 (maximum) ms. » 40 % of all devices are better. This means that the measured response time is similar to the average of all tested devices (31.1 ms). | ||
Screen Flickering / PWM (Pulse-Width Modulation)
| Screen flickering / PWM not detected |  | ||
In comparison: 52 % of all tested devices do not use PWM to dim the display. If PWM was detected, an average of 7798 (minimum: 5 - maximum: 343500) Hz was measured. | |||
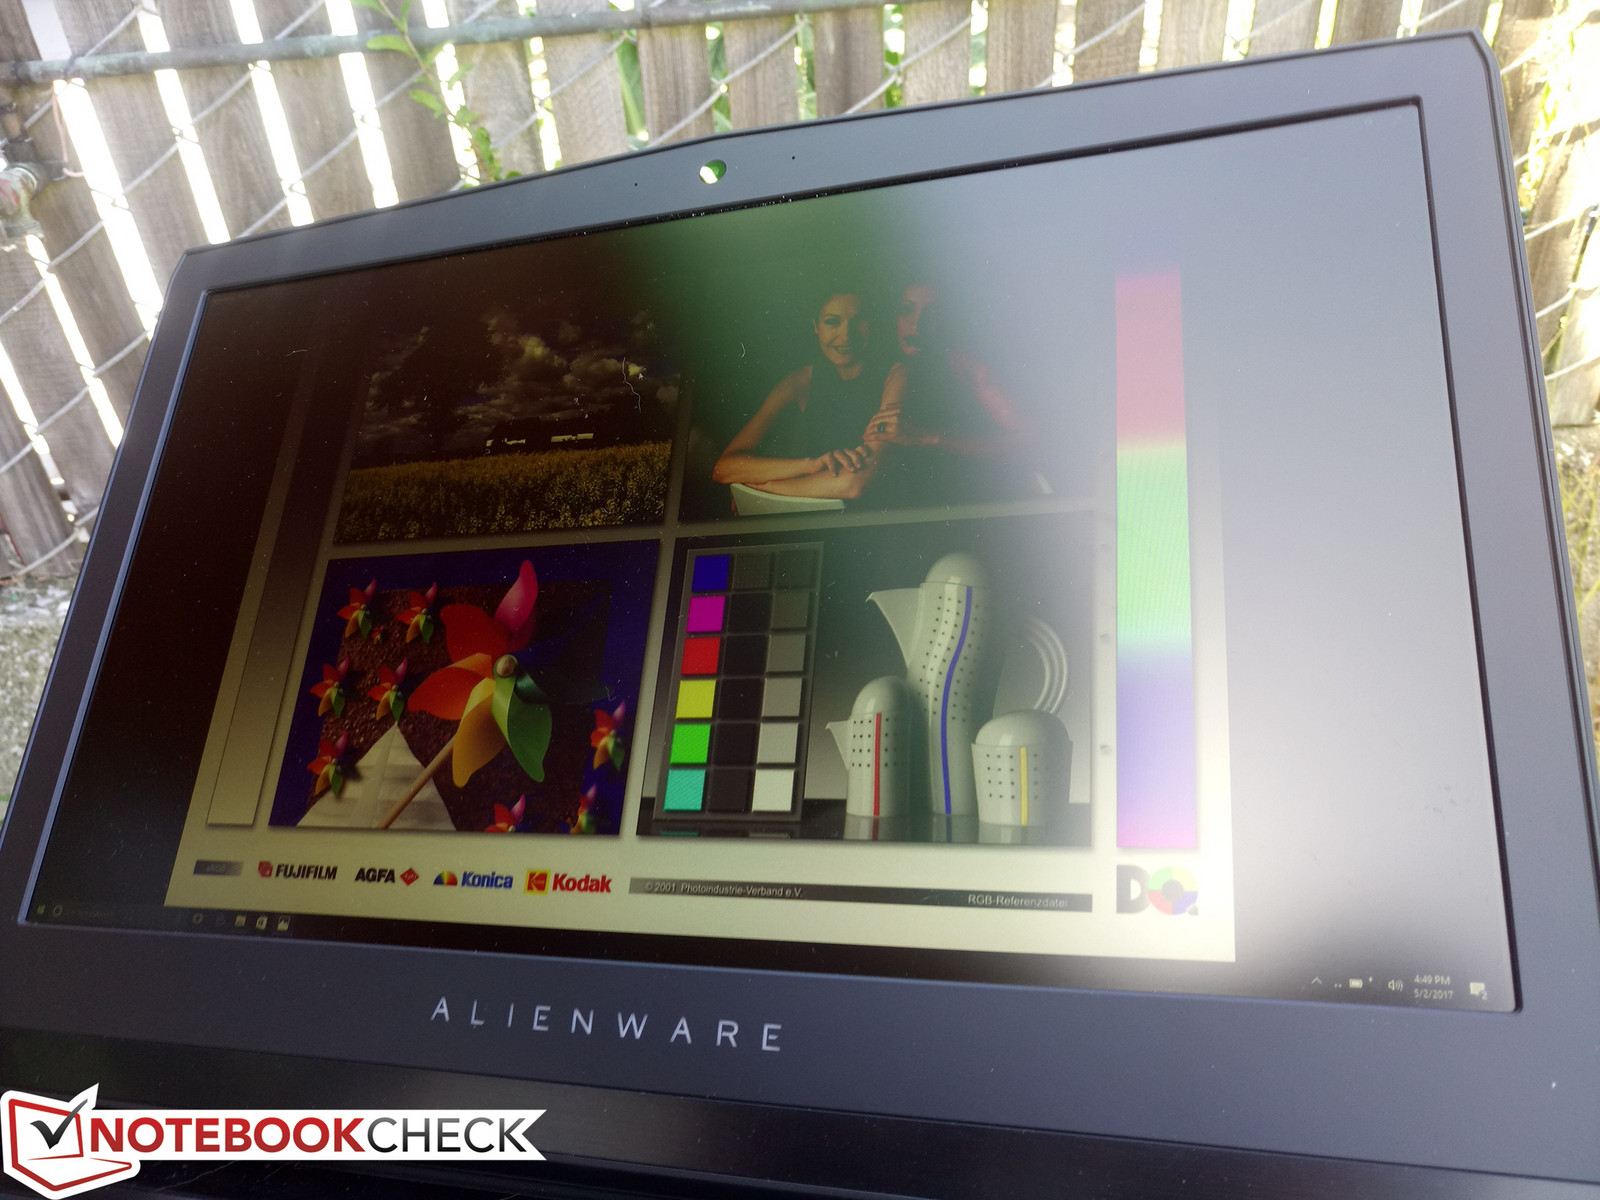
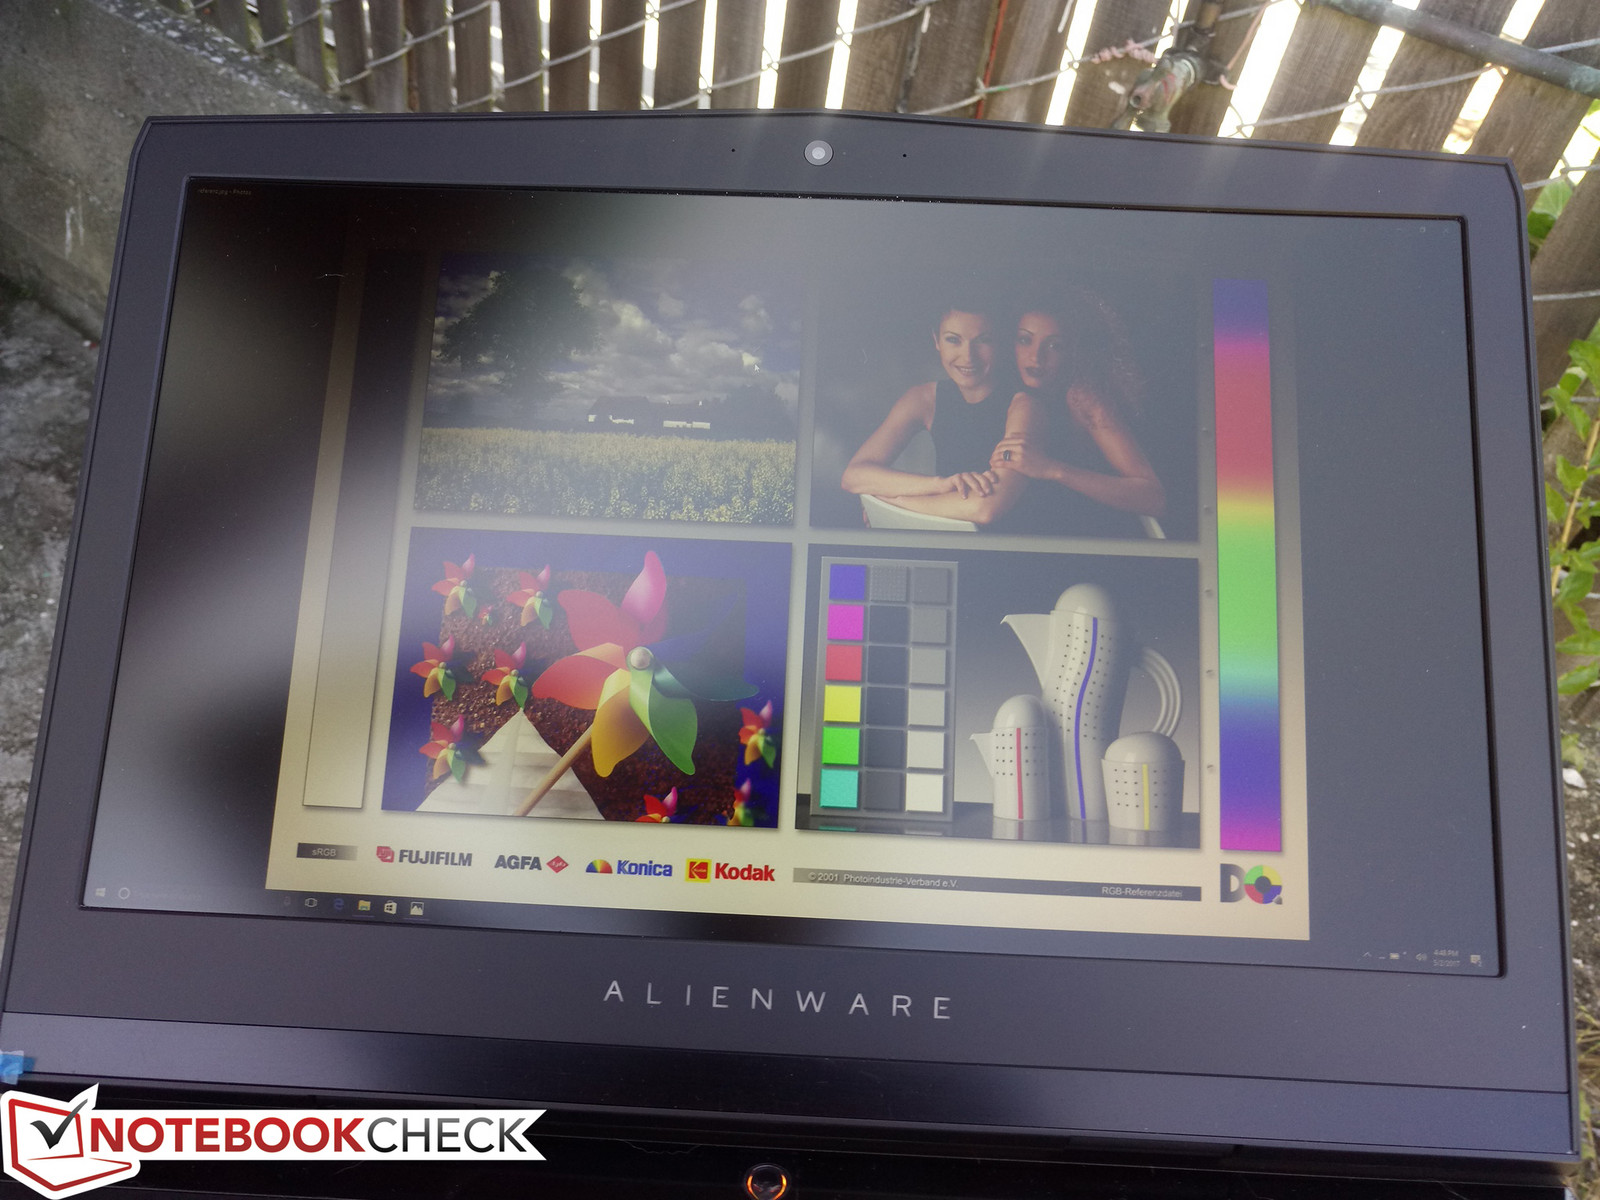
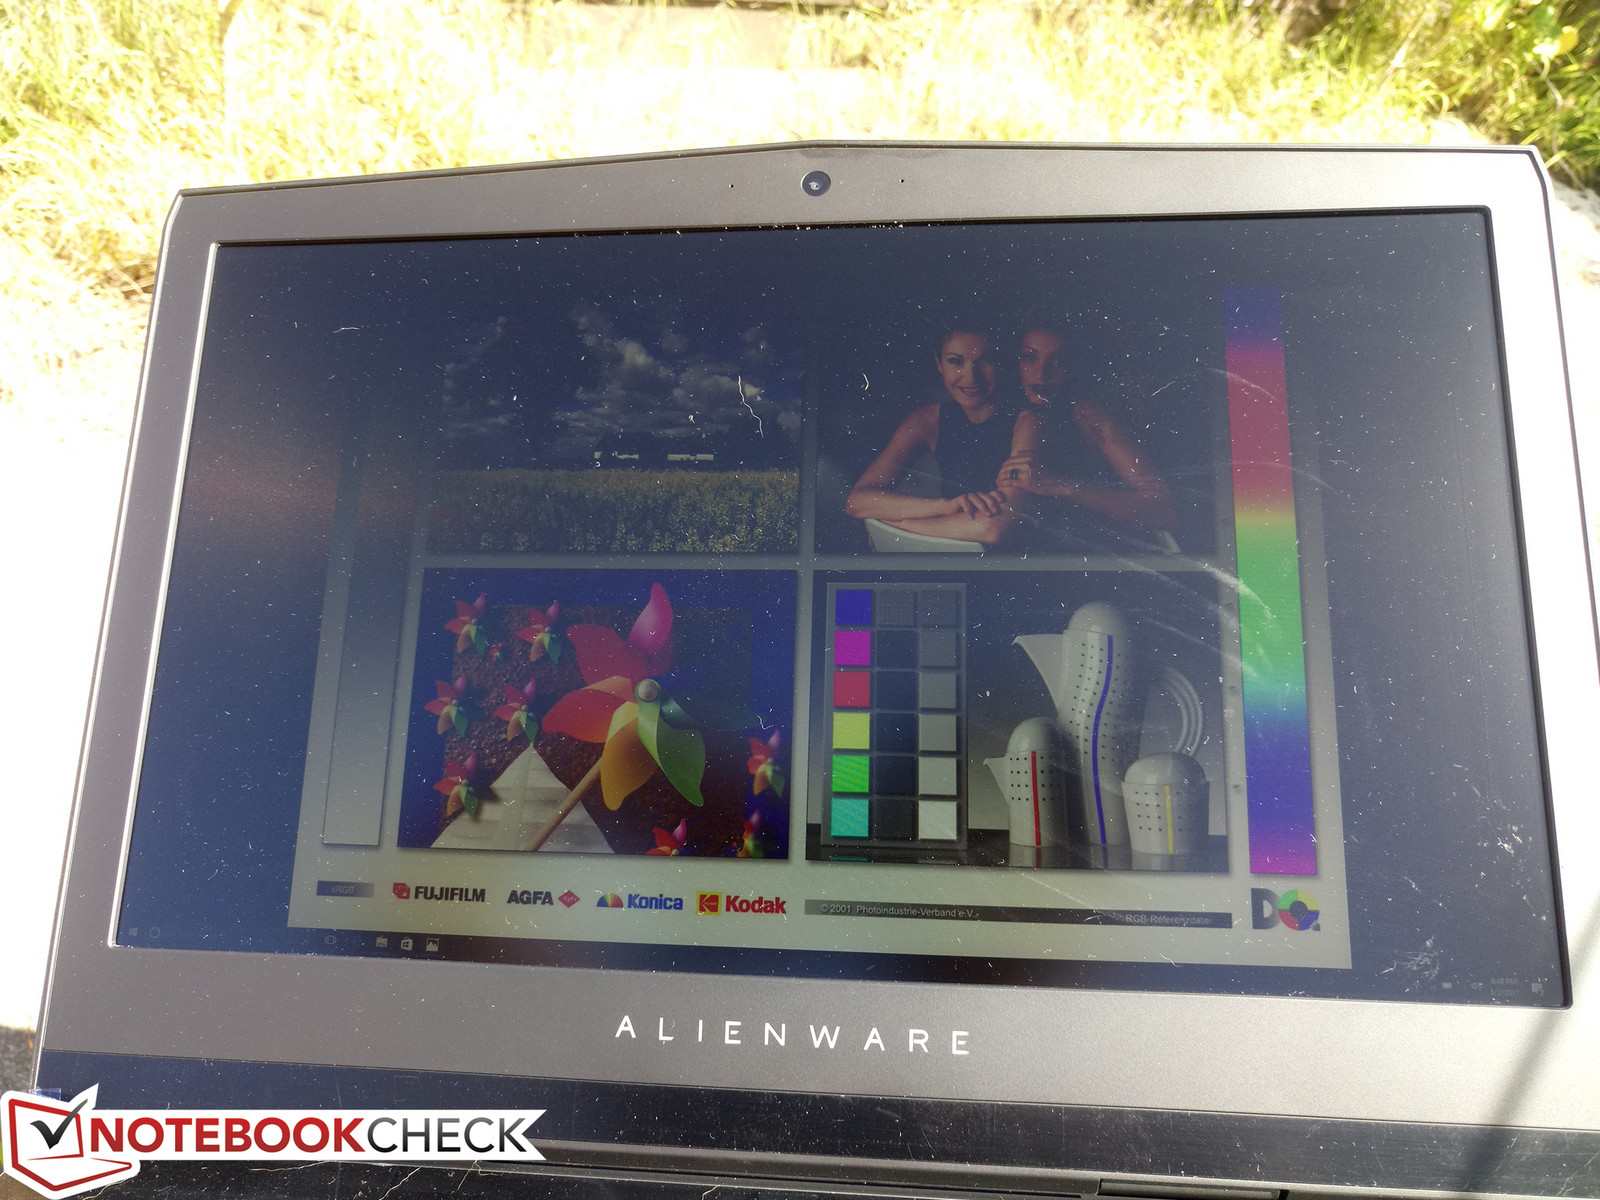
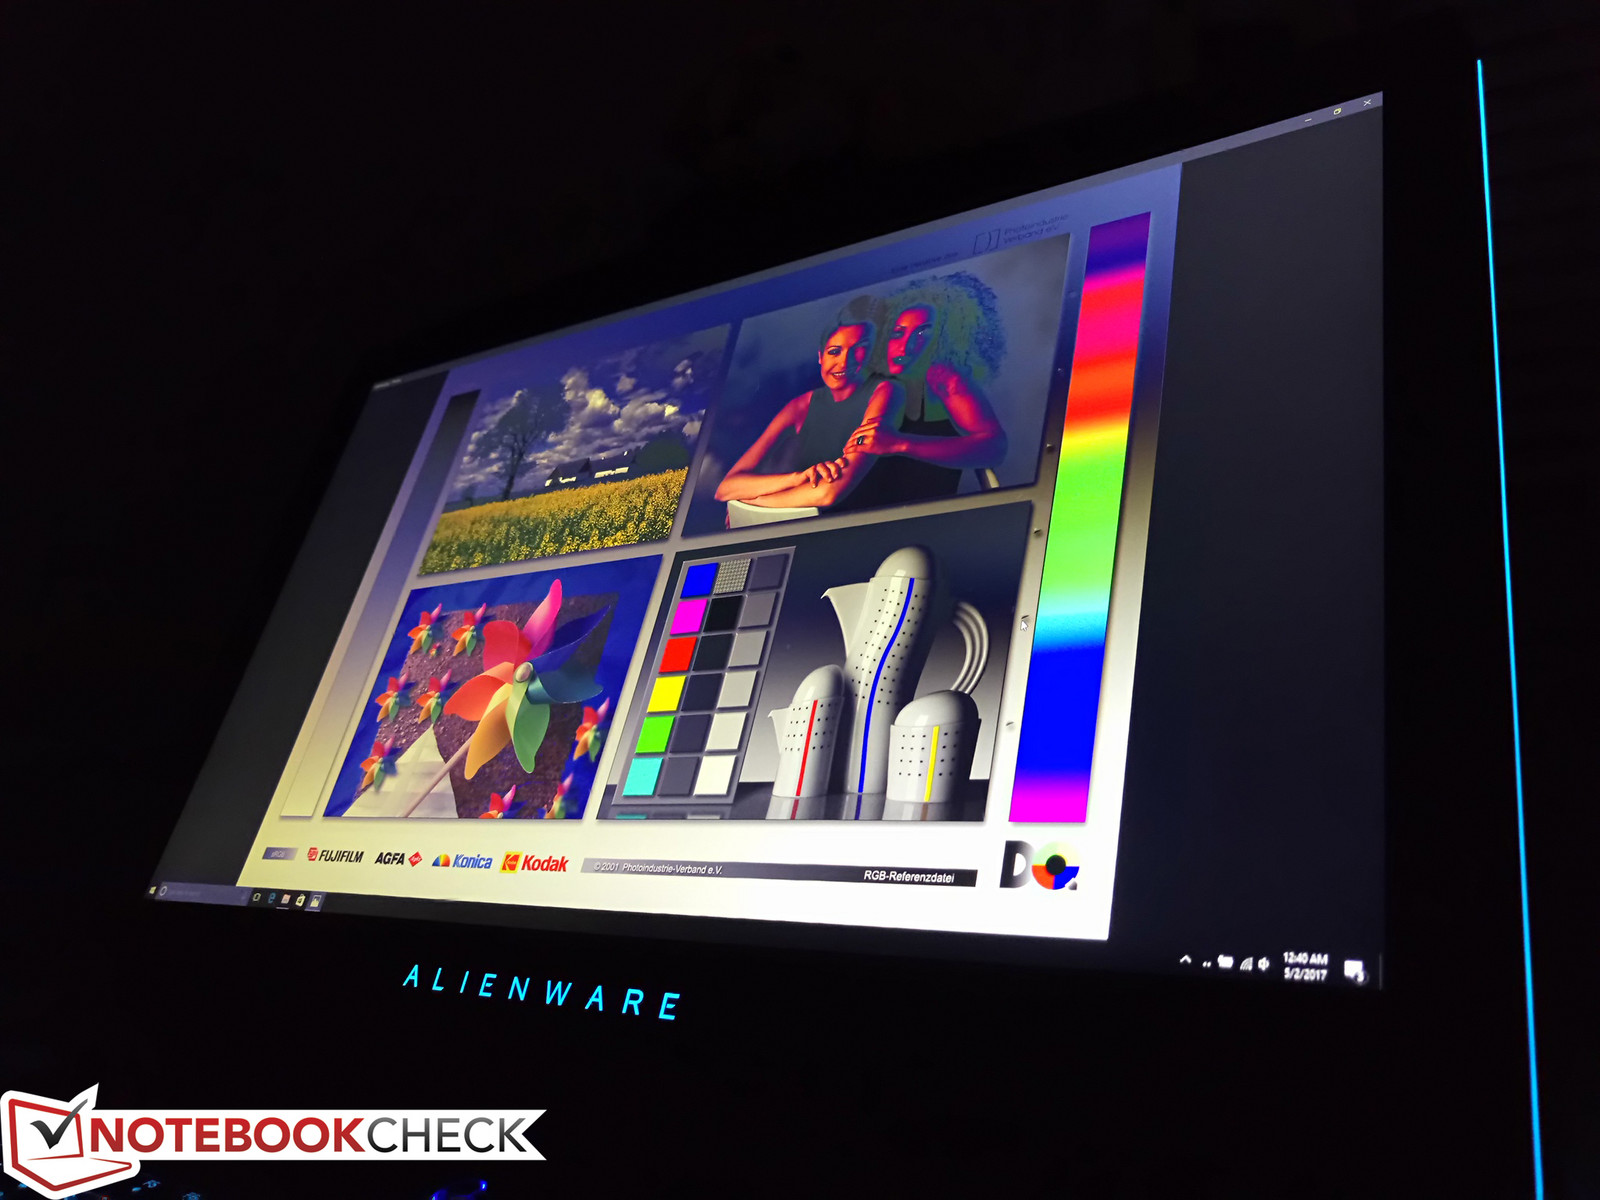
The 17-inch Alienware is clearly not meant to be used outdoors for long periods and the base 300-bit backlight brightness is already sufficient for comfortable viewing under typical indoor conditions. Thus, we find the 400-nit display option to be at odds with what the system is attempting to offer. The brighter 400-nit panel is not nearly enough to make outdoor viewing comfortable especially for such a large display. TN panels in general also don't work so well under outdoor conditions compared to their IPS counterpart, so colors will still wash out. The limited viewing angles make glare more difficult to avoid without experiencing color degradation.
Performance
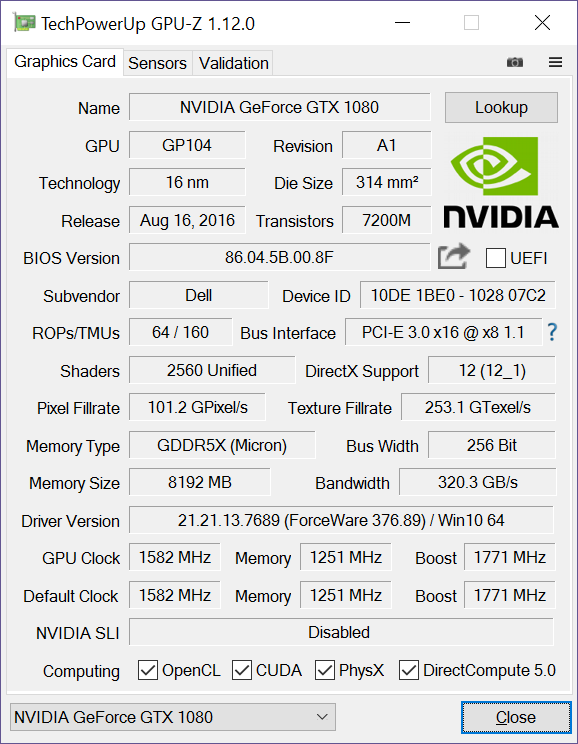
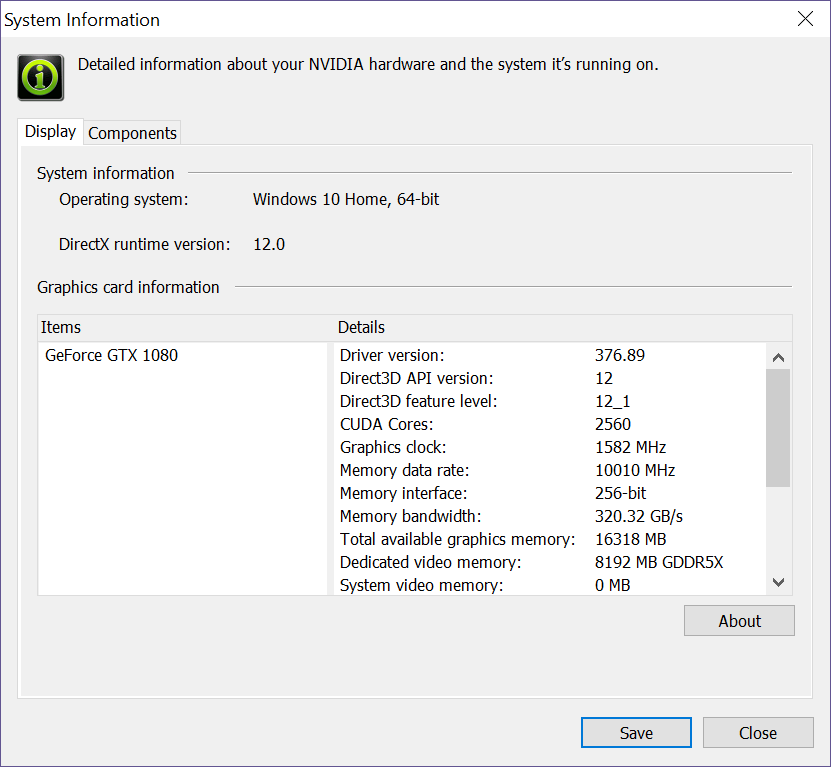
Few gaming notebooks ship with both the i7-7820HK and the GTX 1080 as these are some of the fastest processors currently available for the mobile space. We suspect that Nvidia will eventually bring the GTX 1080 Ti to notebooks similar to how the 980M received the 980 treatment in late 2015, but the GTX 1080 should be more than enough for now especially at the native 1440p resolution. Users who want to go even further up in specs may have to turn to Clevo SLI solutions, the Asus GX800, or the 18.4-inch MSI GT83VR Titan with the i7-7920HQ CPU.
As mentioned in our Display section, certain SKUs without G-Sync will be able to manually switch to the integrated HD Graphics 620 GPU via a hotkey on the keyboard. Since our particular configuration has the integrated GPU disabled, pressing this same hotkey will simply bring up a small error message instead. Automatic graphics switching with Optimus is supported on non-G-Sync SKUs.
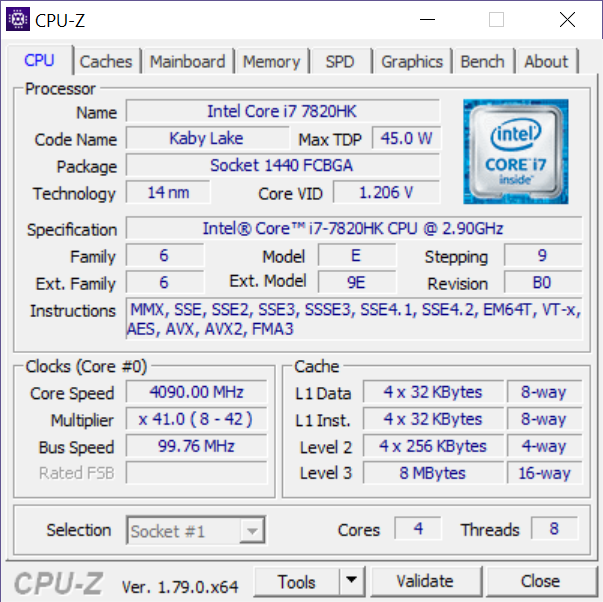
Processor
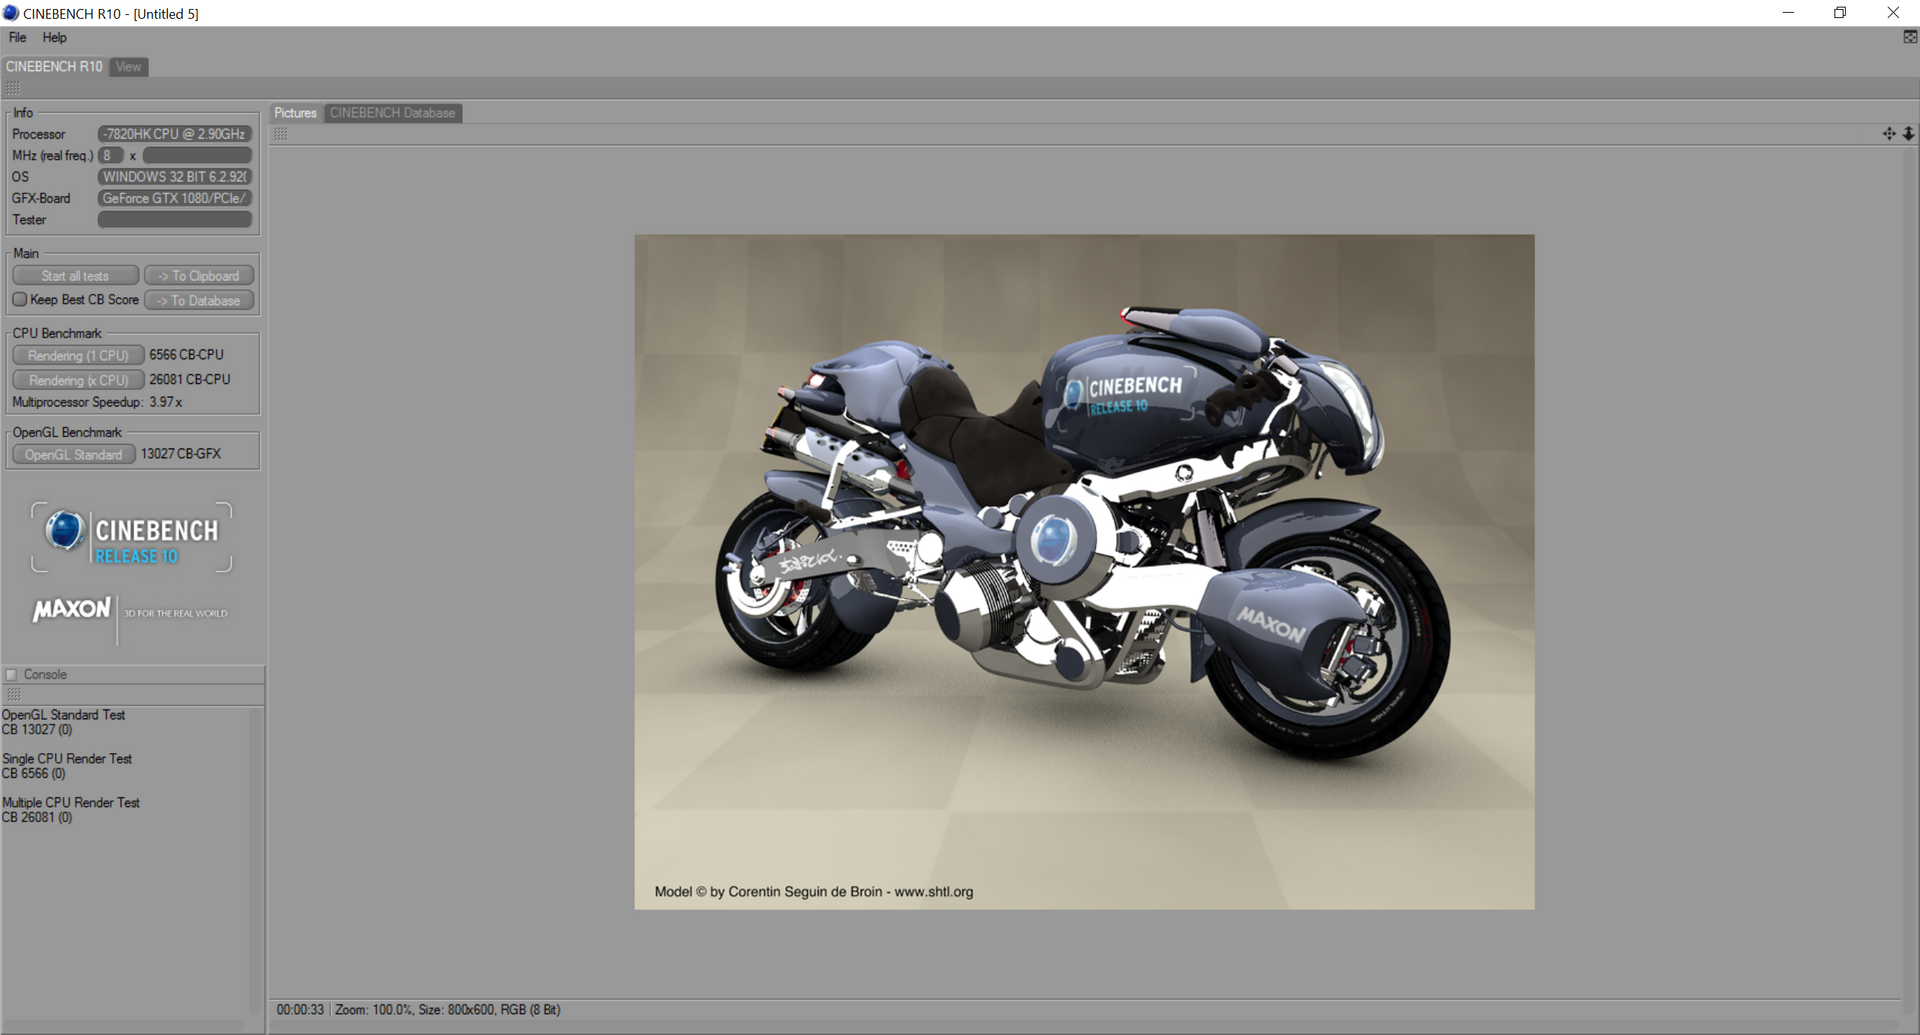
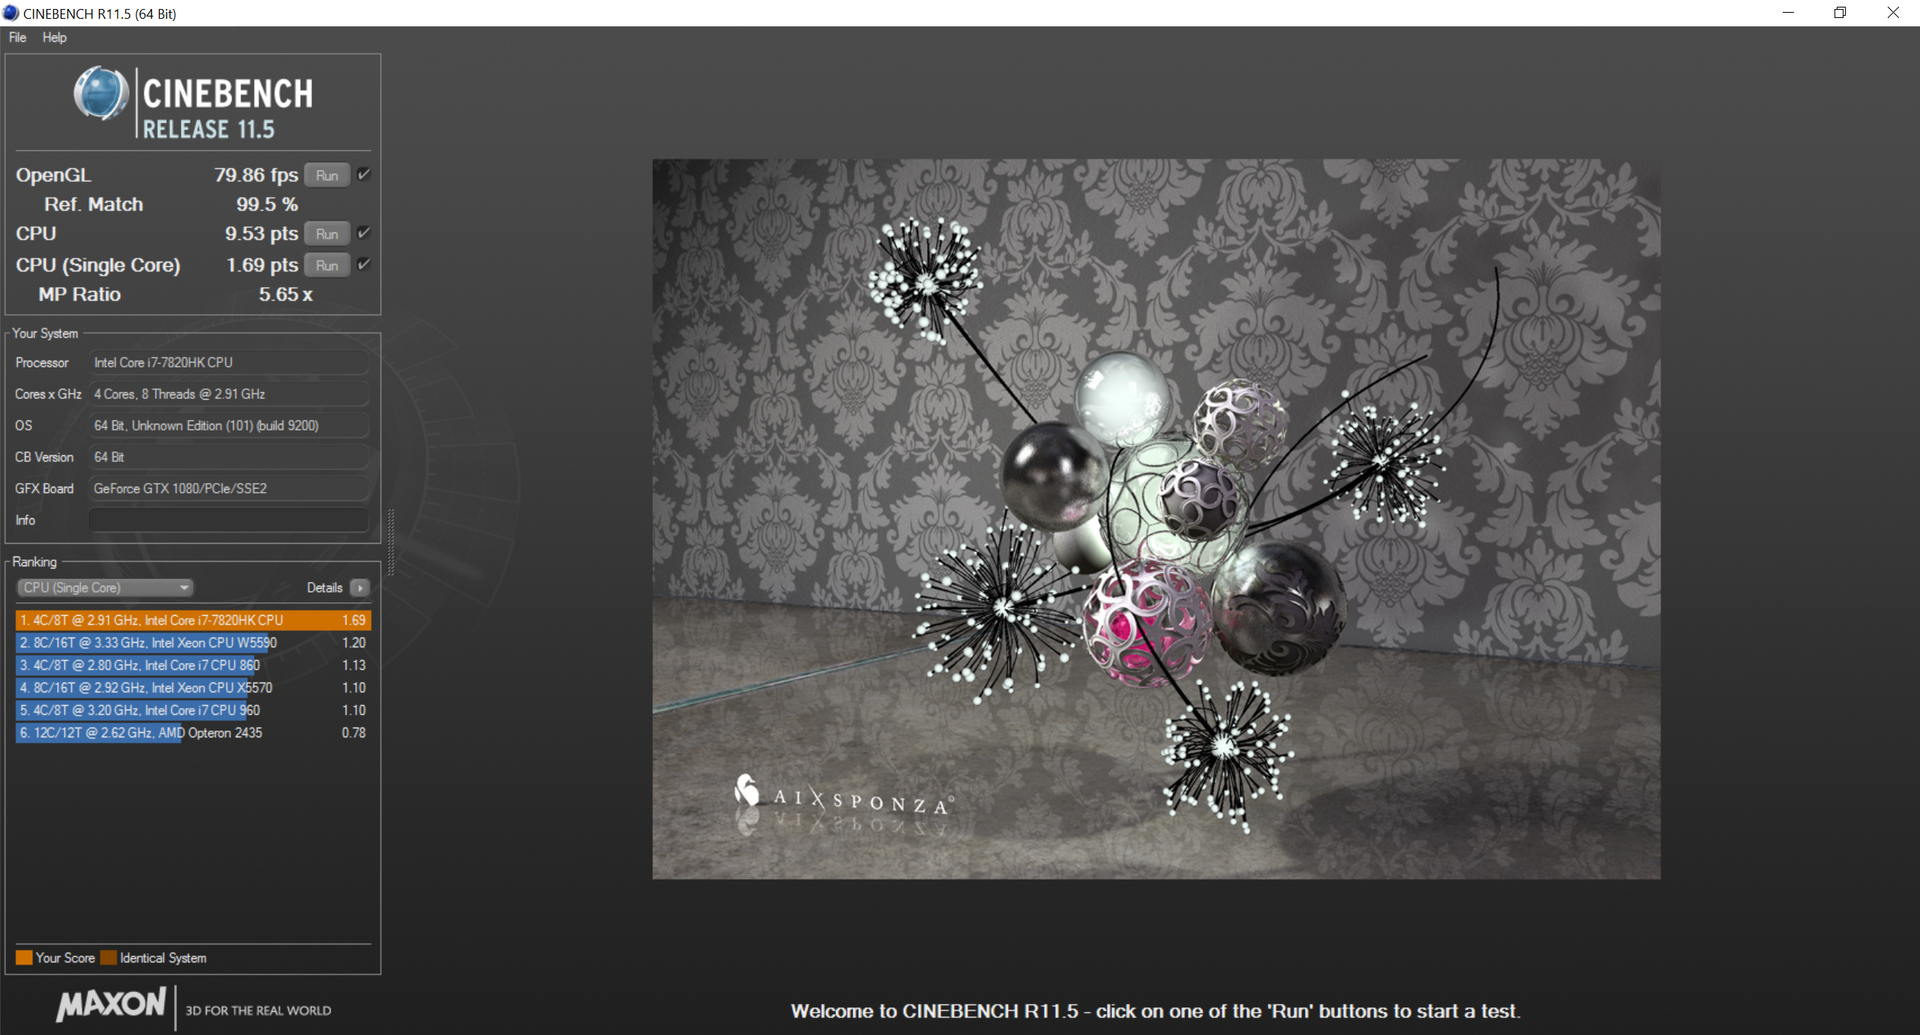
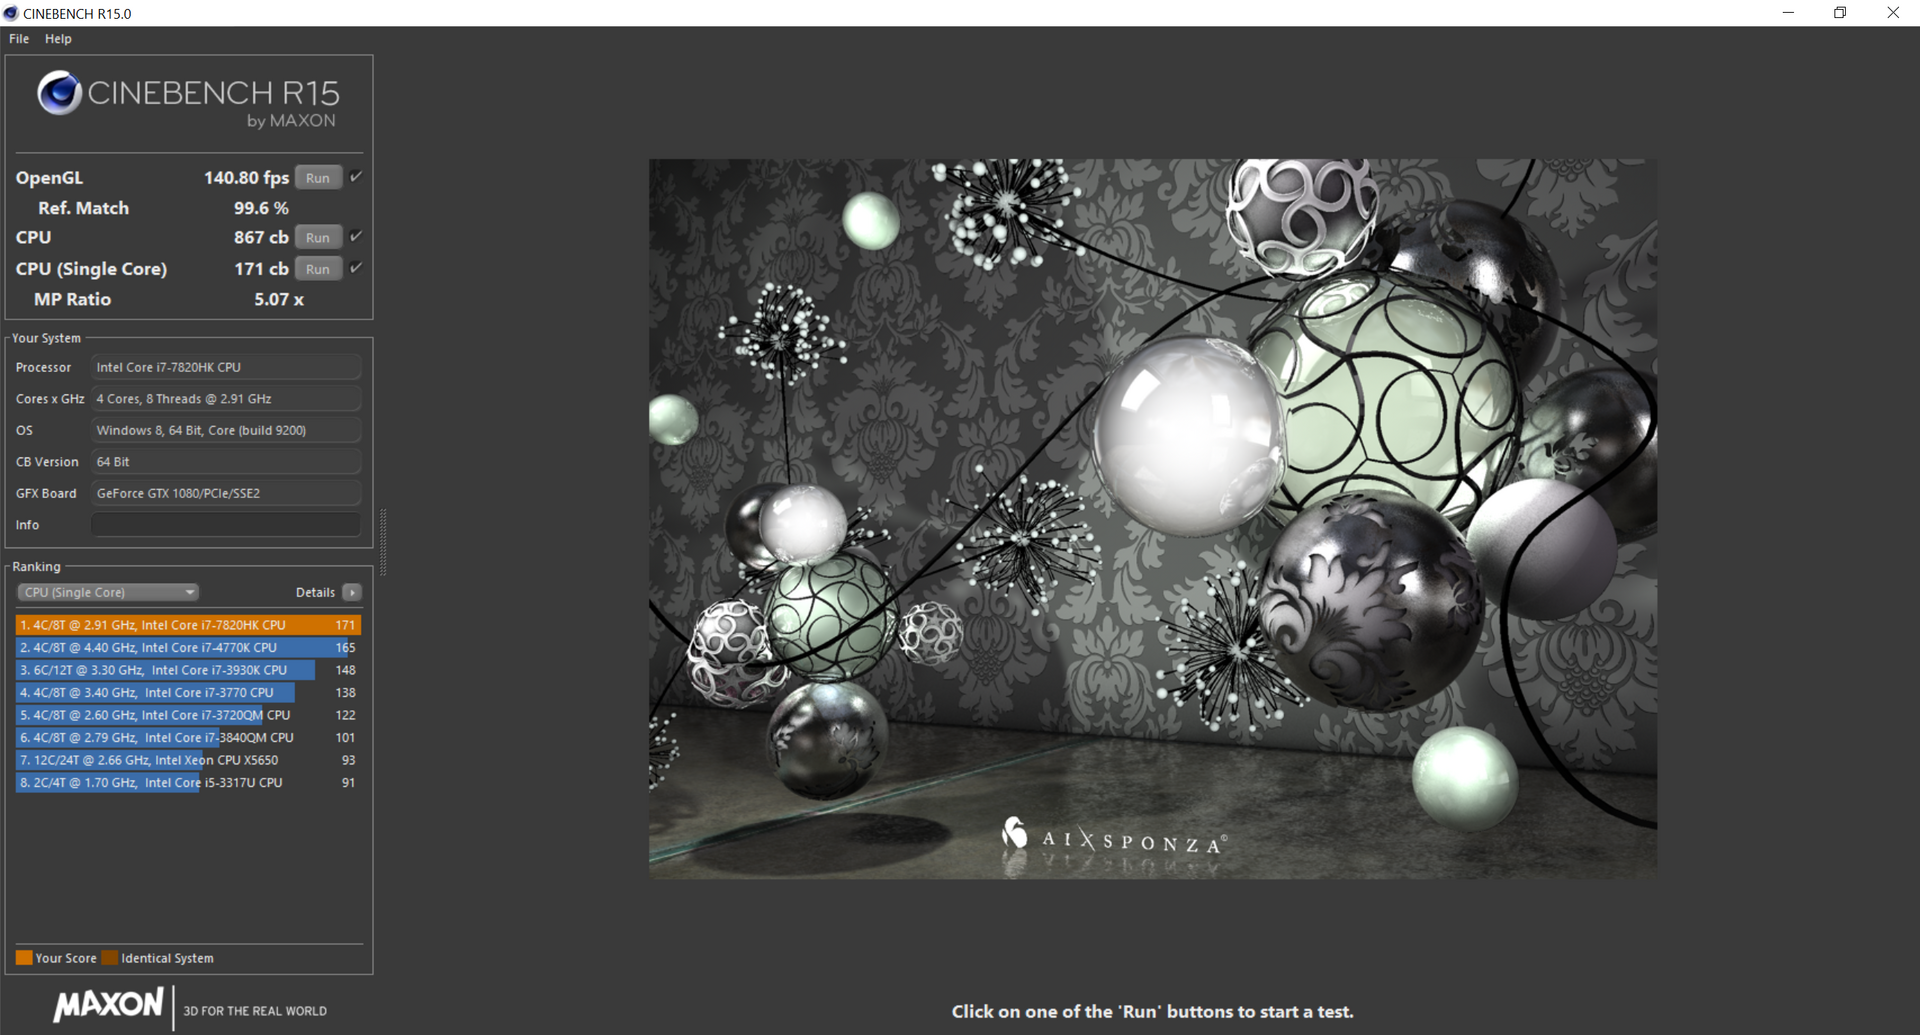
The i7-7820HK is one of the fastest mobile Kaby Lake CPUs available and its performance is predictably impressive. CineBench Single-Thread and Multi-Thread scores are about 10 percent and 25 percent faster than the i7-6820HQ in the latest MacBook Pro 15 while managing to be on par with the desktop i7-6700K at stock speeds. Interestingly, the Asus G701VIK with the same i7-7820HK CPU is able to outperform the Alienware by about 8 percent in single-threaded workloads. Gamers are unlikely to notice the performance benefits of the i7-7820HK as the popular i7-7700HQ is already more than sufficient for gaming.
Running CineBench R15 Multi-Thread in a loop shows no performance degradation over time. The initial score of 867 points remains relatively steady even after the 40th consecutive run. In comparison, the i7-7700HQ in the super-thin MSI GS63VR can drop by as much as 10 to 15 percent after the first few loops.
See our dedicated CPU page on the Core i7-7820HK for more technical information and benchmarks.
| wPrime 2.10 - 1024m | |
| Apple MacBook Pro 15 2016 (2.7 GHz, 455) | |
| EVGA SC17 GTX 1070 | |
| Samsung Odyssey NP800G5M-X01US | |
| Eurocom Sky X7E2 | |
| Alienware 17 R4 | |
| Eurocom Tornado F5 | |
* ... smaller is better
System Performance
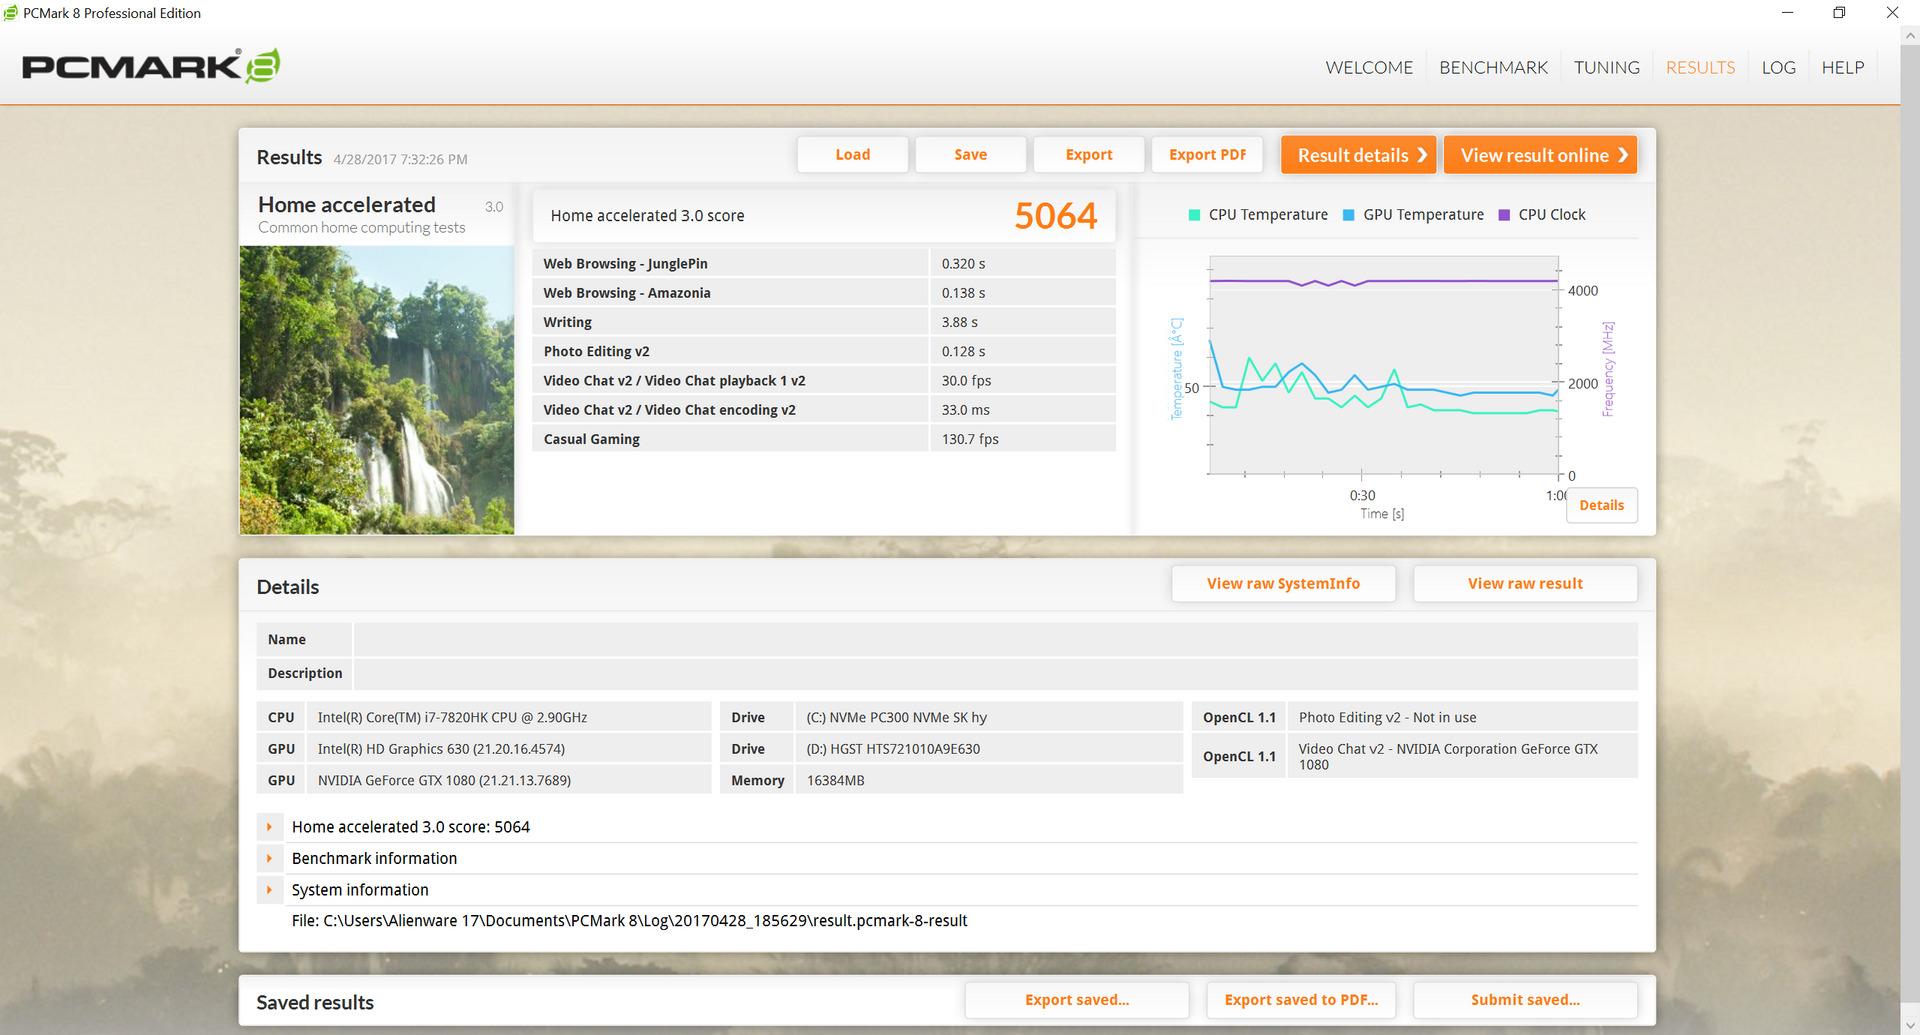
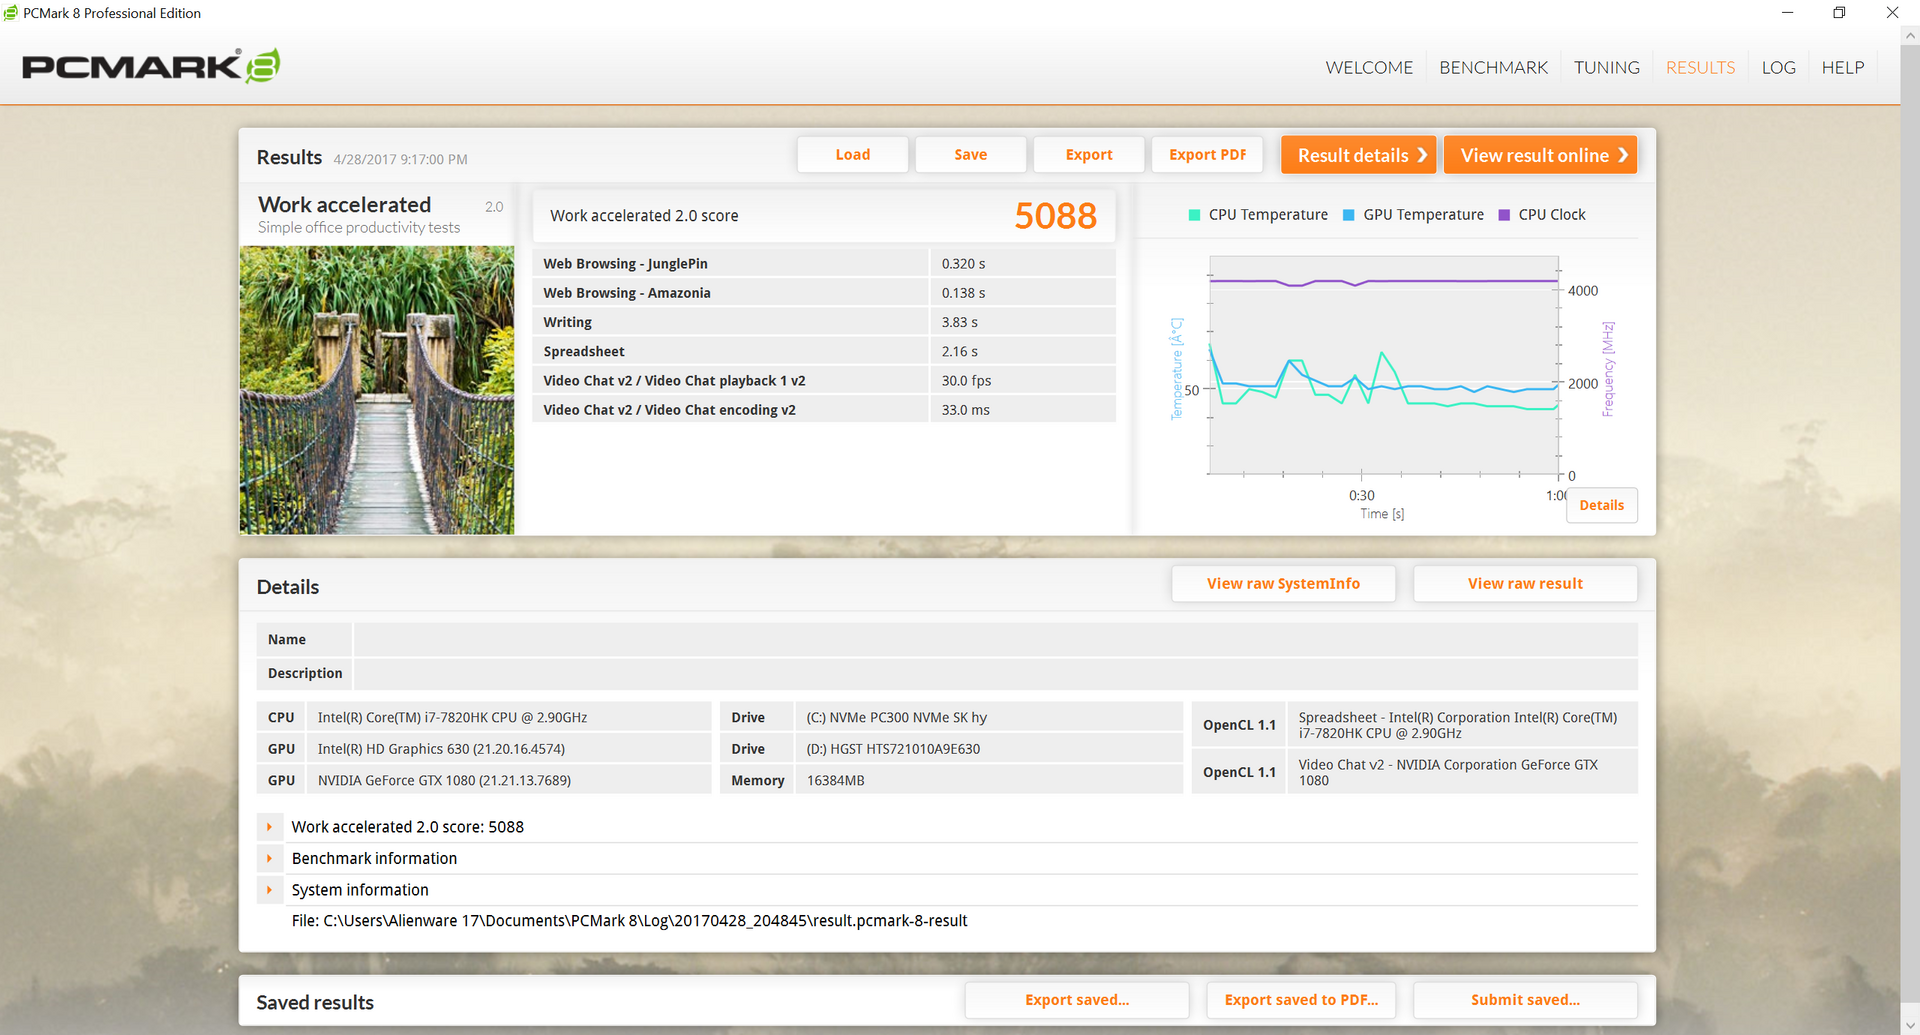
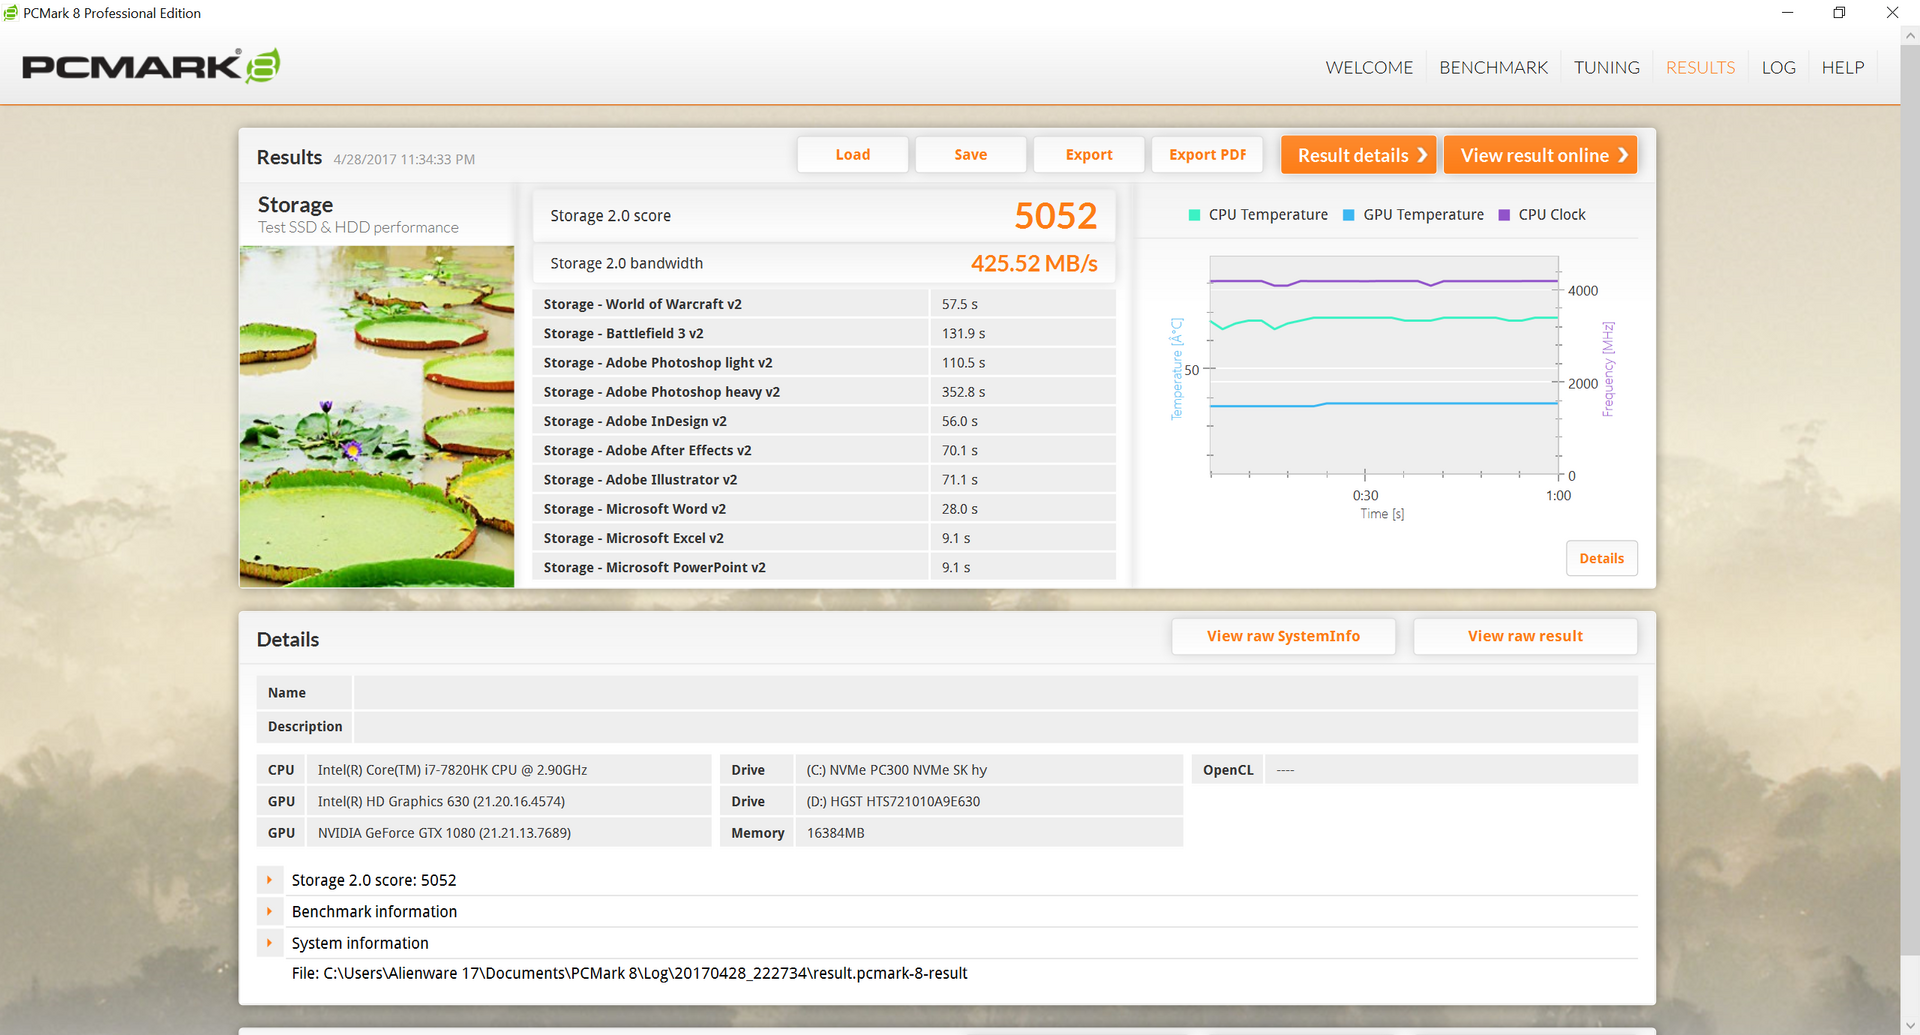
PCMark benchmarks rank the Alienware 17 R4 in the same ballpark as competing notebooks with comparable specifications. Subjectively, system boot up and applications launch almost instantaneously with no notable software or hardware issues during our time with the test unit.
| PCMark 8 | |
| Home Score Accelerated v2 | |
| Aorus X7 DT v6 | |
| Alienware 17 R4 | |
| Eurocom Tornado F5 Killer Edition | |
| Work Score Accelerated v2 | |
| Aorus X7 DT v6 | |
| Alienware 17 R4 | |
| Eurocom Tornado F5 Killer Edition | |
| Creative Score Accelerated v2 | |
| Aorus X7 DT v6 | |
| Eurocom Tornado F5 Killer Edition | |
| Alienware 17 R4 | |
| PCMark 8 Home Score Accelerated v2 | 5064 points | |
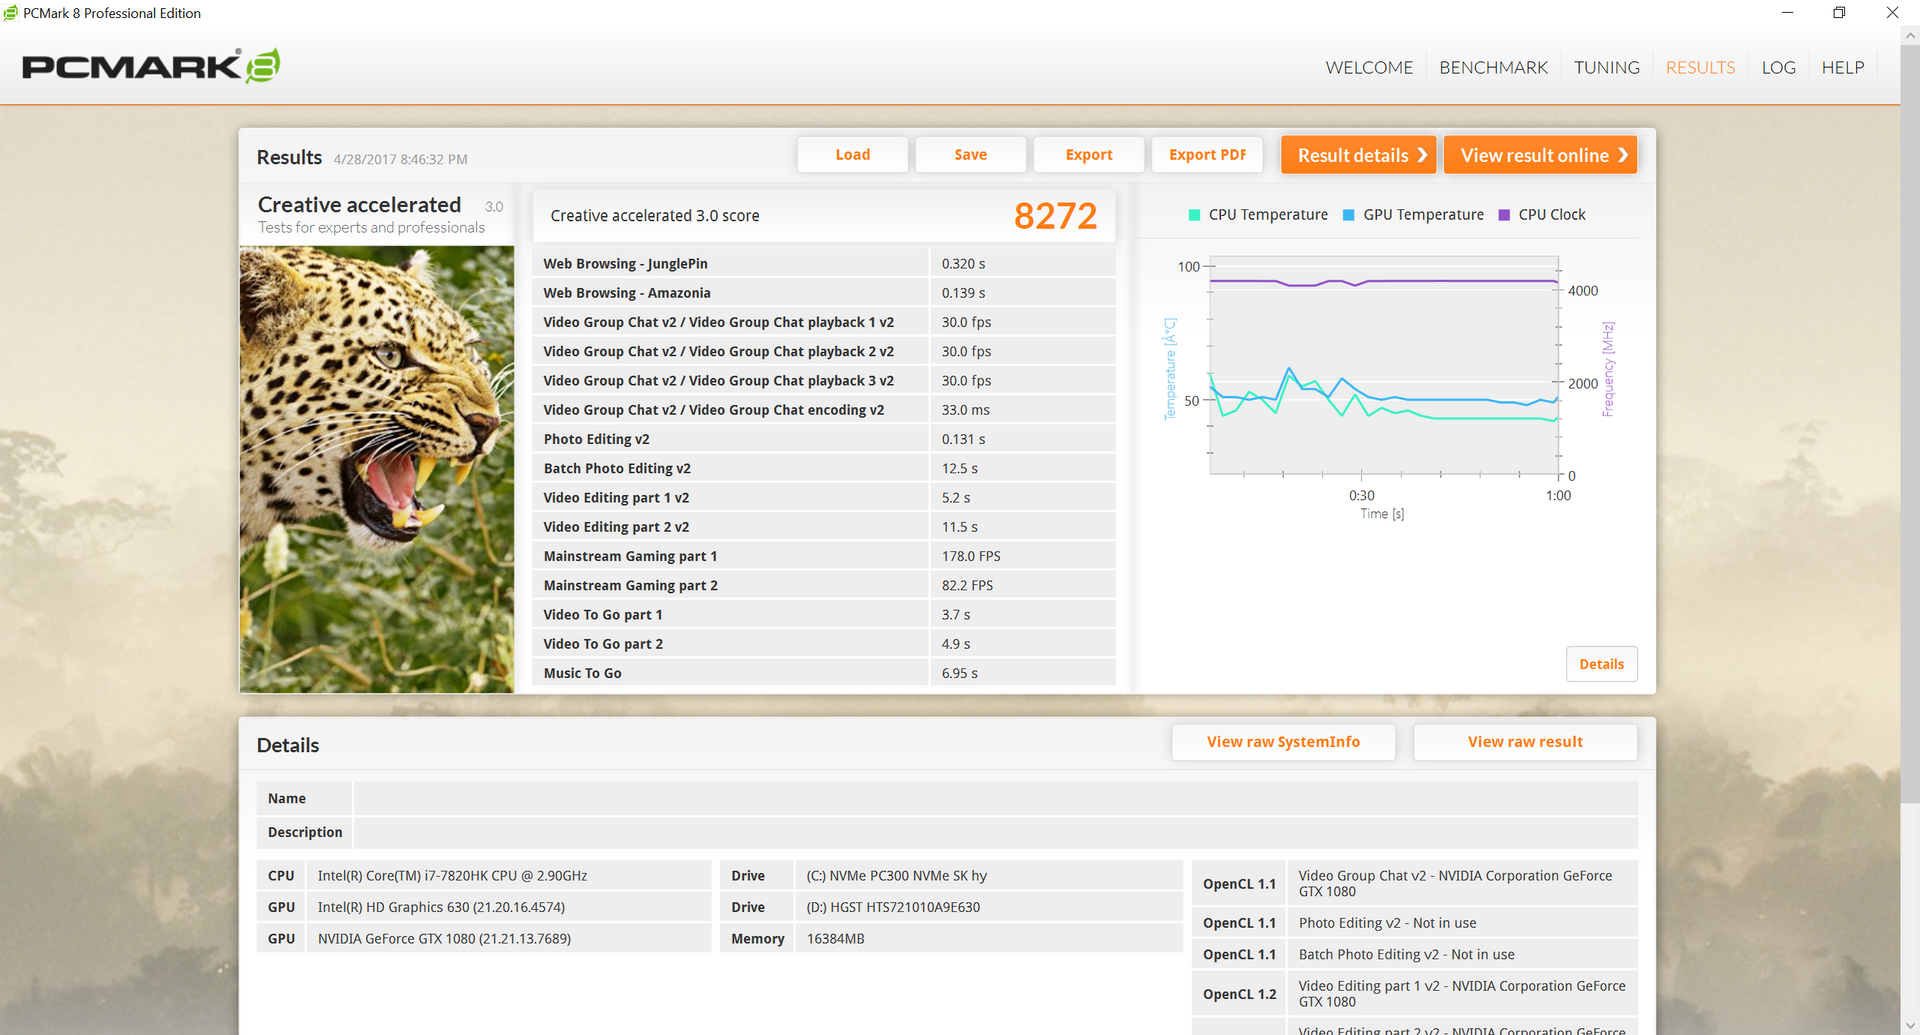
| PCMark 8 Creative Score Accelerated v2 | 8272 points | |
| PCMark 8 Work Score Accelerated v2 | 5088 points | |
Help | ||
Storage Devices
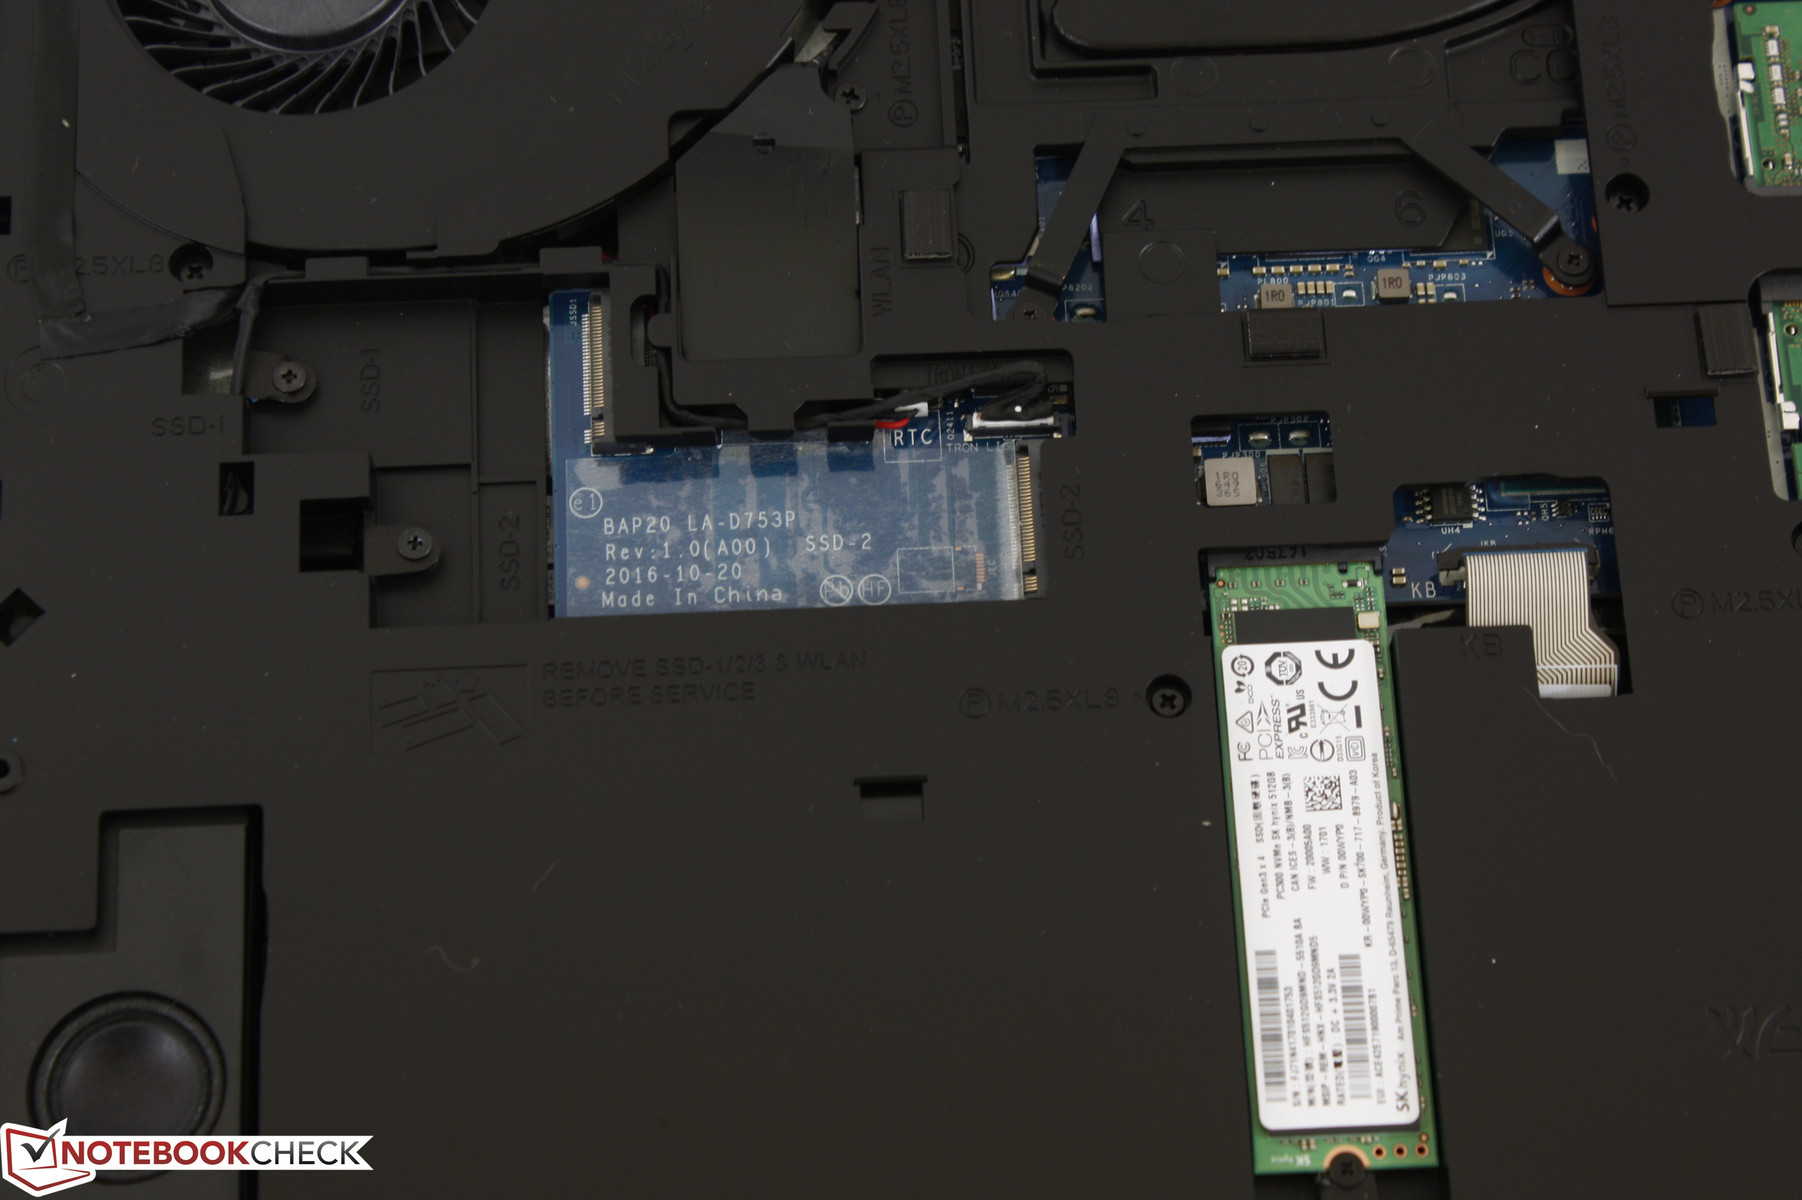
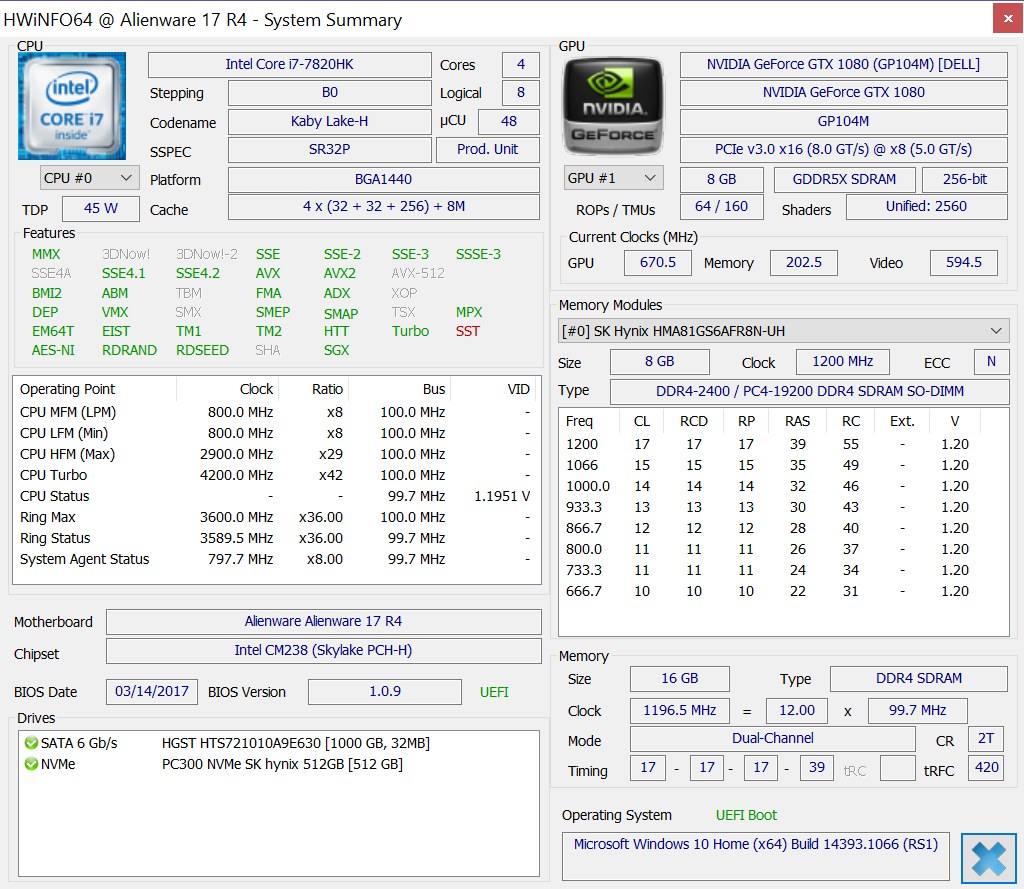
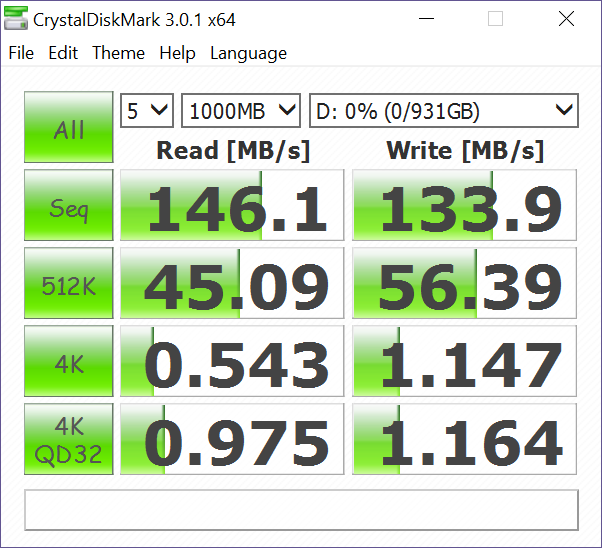
A total of four storage bays are available on the 17 R4 - down from five on last year's 17 R3. Users have easy access to 2x NVMe M.2 2280 slots, 1x 2.5-inch SATA III bay, and the uncommon 1x 2242 M.2 slot. Our test unit is configured with a primary 512 GB SK Hynix PC300 NVMe SSD and a secondary 1 TB Hitachi HGST HDD. The 2.5-inch bay is spacious enough to accept both 7 mm and 9.5 mm HDDs and RAID 0/1 setups are supported through the Intel CM238 chipset.
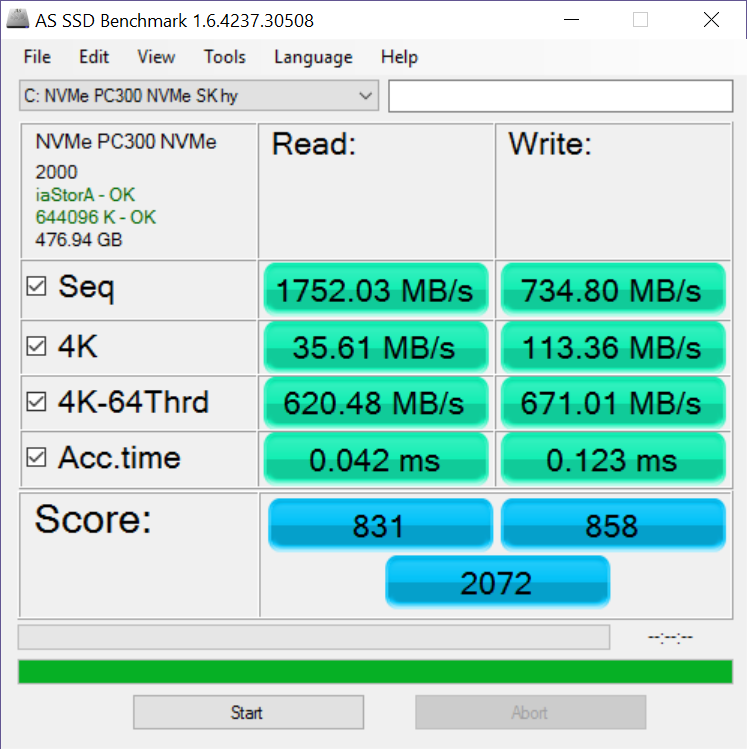
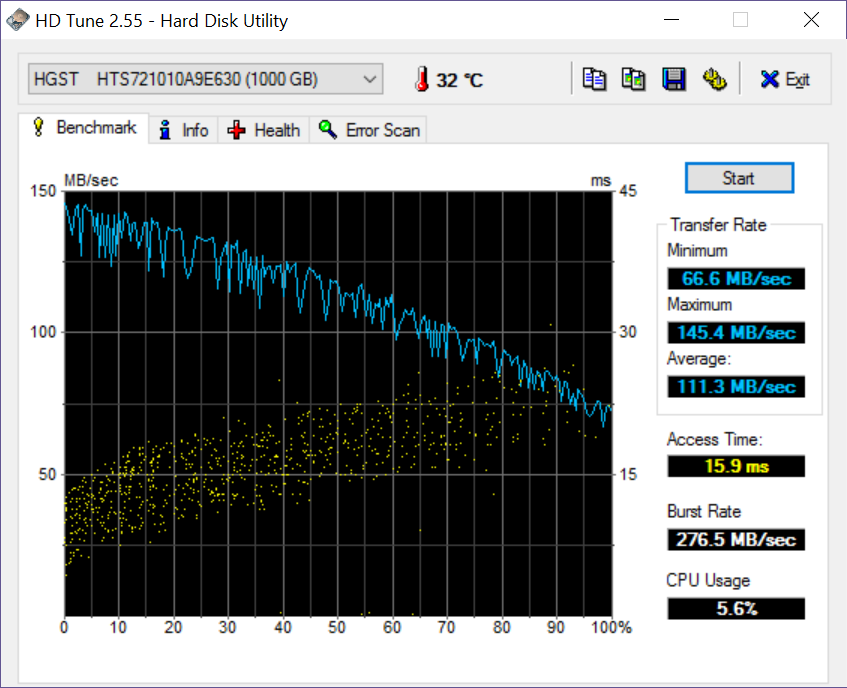
Sequential read and write rates are fast as expected from a primary SSD, but they are disappointingly average when compared to most other NVMe SSDs. In particular, the Toshiba THNSN5512GPU7 in the Acer Predator 17 X and the Samsung SM951 in the Aorus X7 DT v6 each have sequential write speeds about twice as fast as our Sk Hynix PC300. This is still a slight improvement from the Samsung PM951 in the older Alienware 17 R3, but this seems like a missed opportunity for Dell to source faster SSD solutions instead of the PC300. Meanwhile, transfer rates from the secondary HDD average about 111 MB/s according to HD Tune, which is where we expect a proper 7200 RPM HDD to perform.
See our growing list of HDDs and SSDs for more benchmark comparisons.
| Alienware 17 R4 SK Hynix PC300 NVMe 512 GB | Alienware 17 R3 (A17-9935) Samsung PM951 NVMe 512 GB | MSI GT73VR 7RF-296 2x Samsung SM951 MZVPV256HDGL (RAID 0) | Acer Predator 17 X GX-792-76DL Toshiba NVMe THNSN5512GPU7 | Aorus X7 DT v6 Samsung SM951 MZVPV512HDGL m.2 PCI-e | |
|---|---|---|---|---|---|
| CrystalDiskMark 3.0 | -20% | 100% | 30% | 43% | |
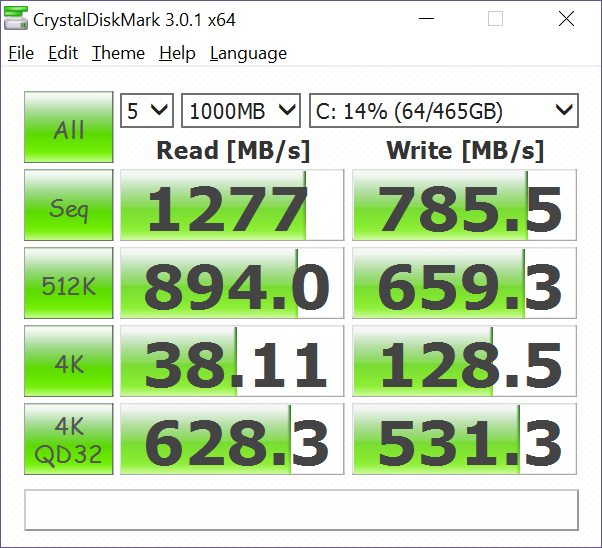
| Read Seq (MB/s) | 1277 | 1263 -1% | 3219 152% | 1494 17% | 1829 43% |
| Write Seq (MB/s) | 786 | 587 -25% | 2572 227% | 1371 74% | 1588 102% |
| Read 512 (MB/s) | 894 | 569 -36% | 1776 99% | 898 0% | 1064 19% |
| Write 512 (MB/s) | 659 | 265.2 -60% | 2445 271% | 1273 93% | 1507 129% |
| Read 4k (MB/s) | 38.11 | 42.59 12% | 51.1 34% | 43.82 15% | 52.9 39% |
| Write 4k (MB/s) | 128.5 | 140.6 9% | 141.3 10% | 161.6 26% | 161.1 25% |
| Read 4k QD32 (MB/s) | 628 | 610 -3% | 658 5% | 669 7% | 676 8% |
| Write 4k QD32 (MB/s) | 531 | 232.8 -56% | 554 4% | 552 4% | 419.1 -21% |

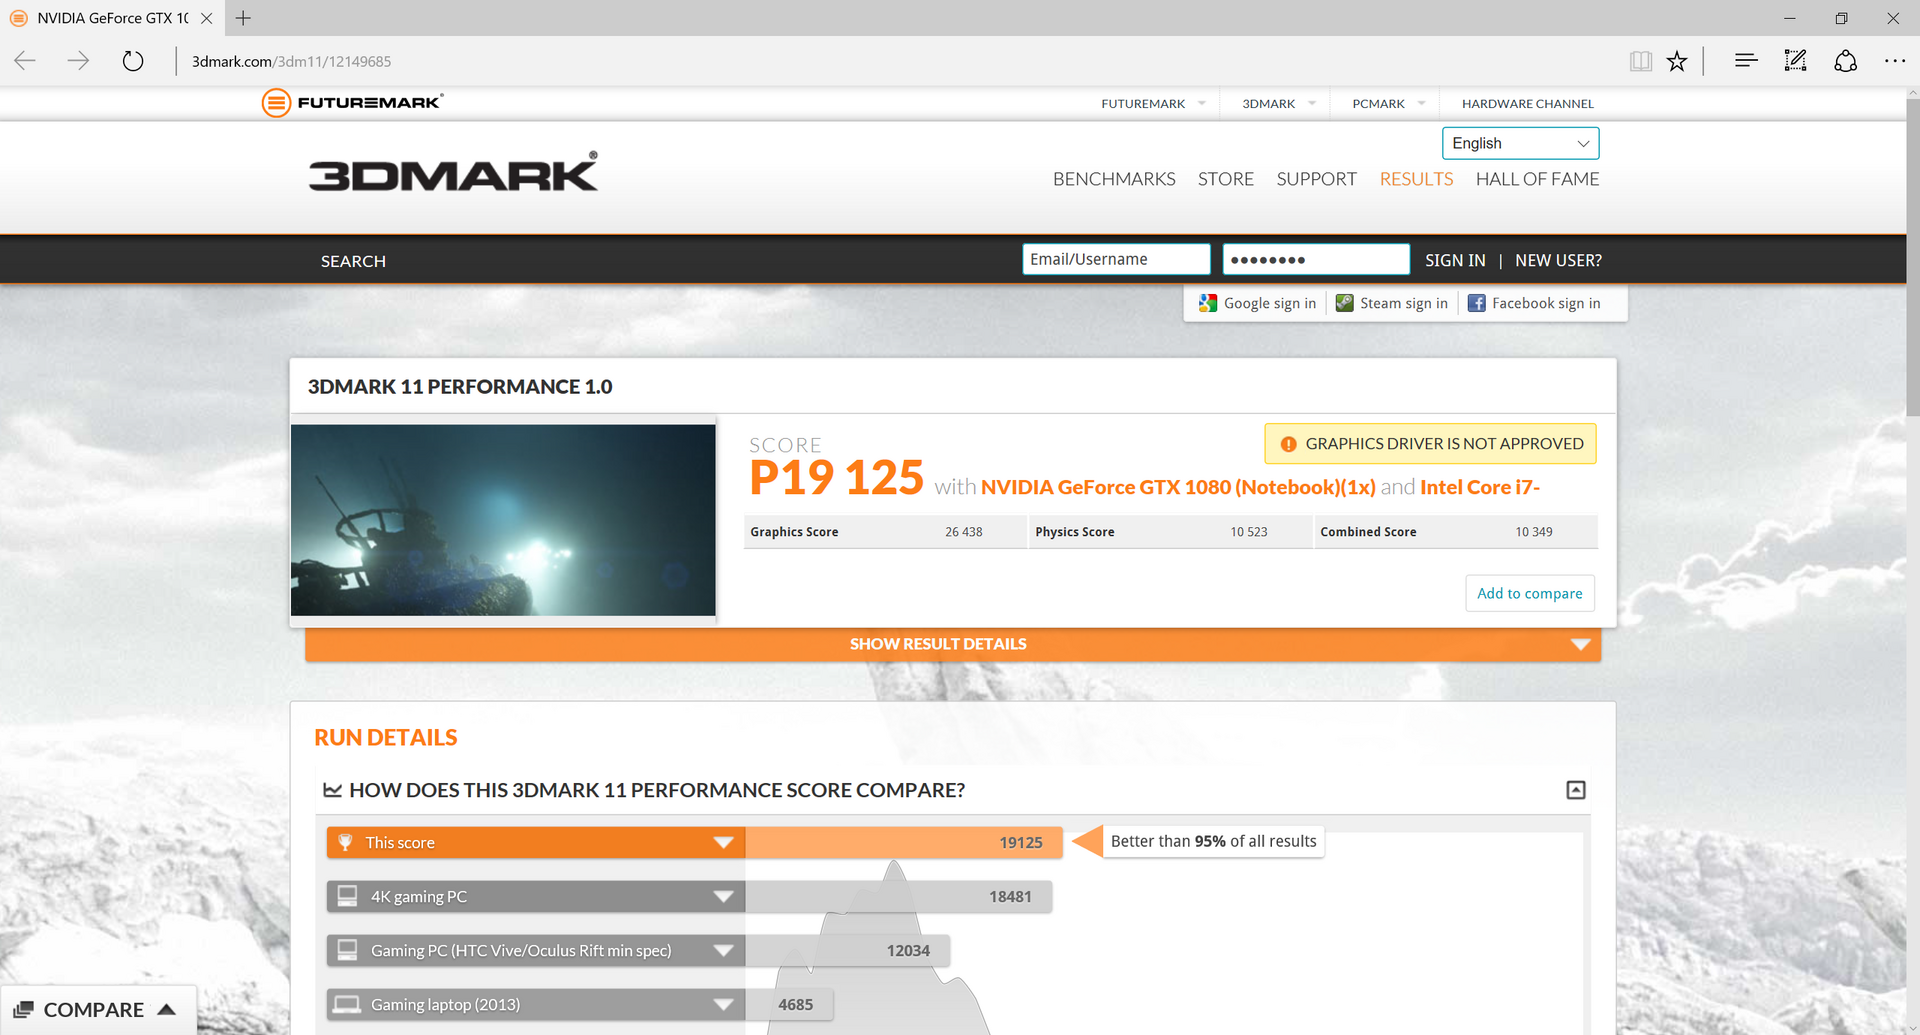
GPU Performance
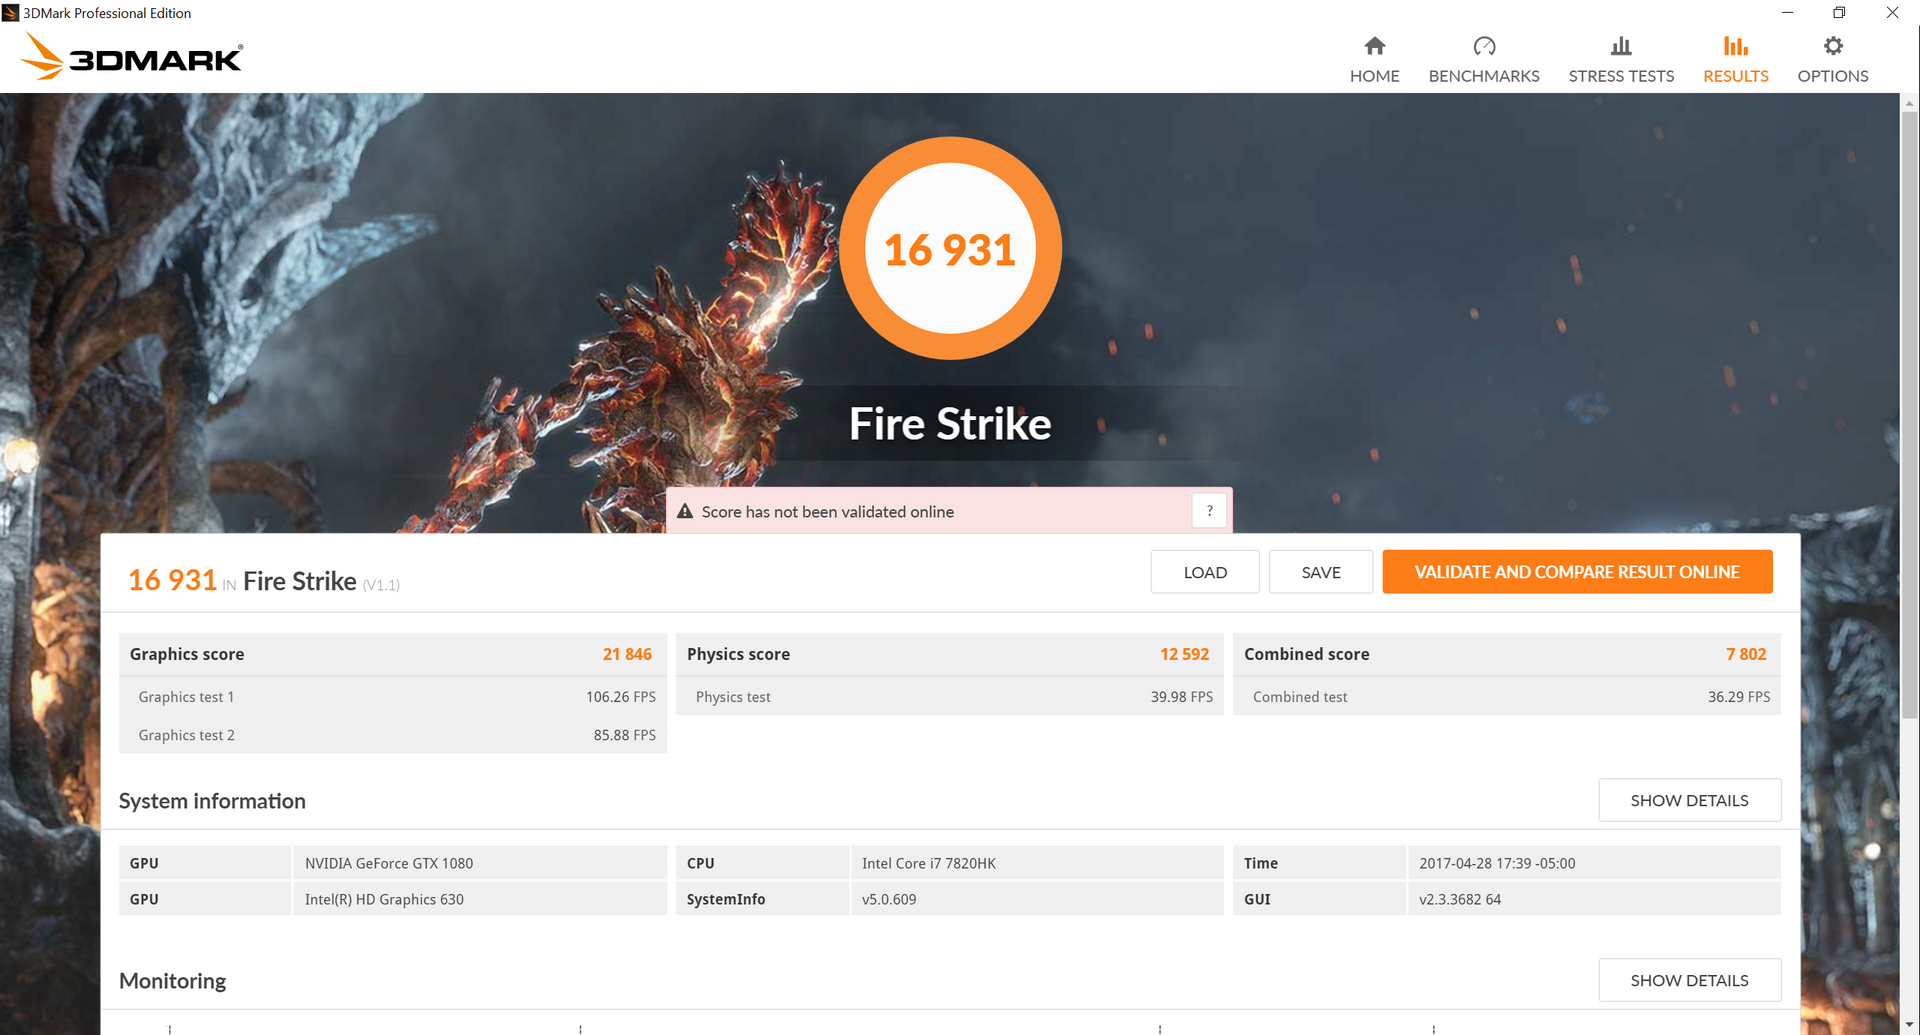
3DMark Fire Strike scores are roughly 30 percent higher than both the GTX 1070 in the Asus GL702VS and our reference desktop with a GTX 980 Ti. The Alienware is also consistently ahead of our Eurocom Tornado F5 with the same GTX 1080 GPU, though this may be due to the higher resolution 4K UHD panel on the Eurocom. Our reference desktop GTX 1080 outperforms the Alienware by just a few percentage points while our desktop GTX 1080 Ti is even faster by about 30 percent.
See our dedicated review on the GTX 1080 for more technical information on the Pascal series.
| 3DMark | |
| 1920x1080 Fire Strike Graphics | |
| Nvidia GeForce GTX 1080 Ti Founders Edition | |
| MSI Gaming X GeForce GTX 1080 Desktop PC | |
| Alienware 17 R4 | |
| Eurocom Tornado F5 Killer Edition | |
| Asus Strix GL702VSK | |
| Asus Strix GTX 980 Ti Desktop PC | |
| Asus G701VO-CS74K | |
| MSI GS63VR 7RF-228US | |
| Fire Strike Extreme Graphics | |
| Alienware 17 R4 | |
| Eurocom Tornado F5 Killer Edition | |
| Asus Strix GL702VSK | |
| Asus Strix GTX 980 Ti Desktop PC | |
| Asus G701VO-CS74K | |
| MSI GS63VR 7RF-228US | |
| 3840x2160 Fire Strike Ultra Graphics | |
| Nvidia GeForce GTX 1080 Ti Founders Edition | |
| Alienware 17 R4 | |
| Eurocom Tornado F5 Killer Edition | |
| Asus Strix GTX 980 Ti Desktop PC | |
| Asus G701VO-CS74K | |
| MSI GS63VR 7RF-228US | |
| 3DMark 11 | |
| 1280x720 Performance GPU | |
| Nvidia GeForce GTX 1080 Ti Founders Edition | |
| MSI Gaming X GeForce GTX 1080 Desktop PC | |
| Eurocom Tornado F5 Killer Edition | |
| Alienware 17 R4 | |
| Asus Strix GTX 980 Ti Desktop PC | |
| Asus Strix GL702VSK | |
| Asus G701VO-CS74K | |
| MSI GS63VR 7RF-228US | |
| 1280x720 Performance Combined | |
| Nvidia GeForce GTX 1080 Ti Founders Edition | |
| Asus Strix GTX 980 Ti Desktop PC | |
| MSI Gaming X GeForce GTX 1080 Desktop PC | |
| Alienware 17 R4 | |
| Asus G701VO-CS74K | |
| MSI GS63VR 7RF-228US | |
| Eurocom Tornado F5 Killer Edition | |
| Asus Strix GL702VSK | |
Gaming Performance
3DMark results translate well into real-world gaming performance. The GTX 1080 in the Alienware essentially matches our reference GTX 1080 Founders Edition card in 1080p Ultra settings on tested titles. The notebook outperforms the GTX 980 Ti and the more common GTX 1060 by about 30 percent and 80 percent, respectively, depending on the title. Many older or less demanding titles are able to sustain average frame rates above 120 FPS on maximum settings to take full advantage of the 120 Hz refresh rate.
Performance results in 1440p Ultra are provided in a separate table below as our database does not officially benchmark or record in QHD. Most titles take significant hits in average frame rates when moving up from 1080p including Fallout 4 (120.7 FPS to 81.6 FPS) and Rise of the Tomb Raider (118.3 FPS to 81.6 FPS). Nonetheless, this is still well above 60 FPS and G-Sync is available to reduce tearing for those few demanding titles that fall into the 50 FPS to 60 FPS range.
See our dedicated page on the GTX 1080 GPU for more benchmark comparisons.
| Rise of the Tomb Raider - 1920x1080 Very High Preset AA:FX AF:16x | |
| Nvidia GeForce GTX 1080 Ti Founders Edition | |
| Alienware 17 R4 | |
| Eurocom Tornado F5 Killer Edition | |
| Nvidia GeForce GTX 1080 Founders Edition | |
| Nvidia GeForce GTX 1080 Founders Edition | |
| Nvidia GeForce GTX 1080 Founders Edition | |
| Asus Strix GL702VSK | |
| Asus Strix GTX 980 Ti Desktop PC | |
| MSI GS63VR 7RF-228US | |
| Asus G701VO-CS74K | |
| BioShock Infinite - 1920x1080 Ultra Preset, DX11 (DDOF) | |
| Nvidia GeForce GTX 1080 Ti Founders Edition | |
| Nvidia GeForce GTX 1080 Founders Edition | |
| Alienware 17 R4 | |
| Asus Strix GTX 980 Ti Desktop PC | |
| Eurocom Tornado F5 Killer Edition | |
| Asus Strix GL702VSK | |
| Asus G701VO-CS74K | |
| MSI GS63VR 7RF-228US | |
| Metro: Last Light - 1920x1080 Very High (DX11) AF:16x | |
| Nvidia GeForce GTX 1080 Ti Founders Edition | |
| Nvidia GeForce GTX 1080 Founders Edition | |
| Alienware 17 R4 | |
| Asus Strix GTX 980 Ti Desktop PC | |
| Eurocom Tornado F5 Killer Edition | |
| Asus Strix GL702VSK | |
| Asus G701VO-CS74K | |
| MSI GS63VR 7RF-228US | |
| Thief - 1920x1080 Very High Preset AA:FXAA & High SS AF:8x | |
| Eurocom Tornado F5 Killer Edition | |
| Alienware 17 R4 | |
| Asus Strix GL702VSK | |
| MSI GS63VR 7RF-228US | |
| Asus G701VO-CS74K | |
| The Witcher 3 - 1920x1080 Ultra Graphics & Postprocessing (HBAO+) | |
| Nvidia GeForce GTX 1080 Ti Founders Edition | |
| Alienware 17 R4 | |
| Nvidia GeForce GTX 1080 Founders Edition | |
| Eurocom Tornado F5 Killer Edition | |
| Asus Strix GTX 980 Ti Desktop PC | |
| Asus Strix GL702VSK | |
| MSI GS63VR 7RF-228US | |
| Batman: Arkham Knight - 1920x1080 High / On AA:SM AF:16x | |
| Alienware 17 R4 | |
| Eurocom Tornado F5 Killer Edition | |
| Asus G701VO-CS74K | |
| MSI GS63VR 7RF-228US | |
| Fallout 4 - 1920x1080 Ultra Preset AA:T AF:16x | |
| Nvidia GeForce GTX 1080 Ti Founders Edition | |
| Nvidia GeForce GTX 1080 Founders Edition | |
| Alienware 17 R4 | |
| Asus Strix GTX 980 Ti Desktop PC | |
| Asus Strix GL702VSK | |
| Asus G701VO-CS74K | |
| MSI GS63VR 7RF-228US | |
| Ashes of the Singularity - 1920x1080 high | |
| Nvidia GeForce GTX 1080 Ti Founders Edition | |
| Asus Strix GTX 980 Ti Desktop PC | |
| Alienware 17 R4 | |
| Eurocom Tornado F5 Killer Edition | |
| Asus Strix GL702VSK | |
| Doom - 1920x1080 Ultra Preset AA:SM | |
| Nvidia GeForce GTX 1080 Ti Founders Edition | |
| Nvidia GeForce GTX 1080 Ti Founders Edition | |
| Alienware 17 R4 | |
| Nvidia GeForce GTX 1080 Founders Edition | |
| Asus Strix GTX 980 Ti Desktop PC | |
| Asus Strix GL702VSK | |
| MSI GS63VR 7RF-228US | |
| Asus G701VO-CS74K | |
| Overwatch - 1920x1080 Epic (Render Scale 100 %) AA:SM AF:16x | |
| Nvidia GeForce GTX 1080 Ti Founders Edition | |
| Nvidia GeForce GTX 1080 Founders Edition | |
| Alienware 17 R4 | |
| Asus Strix GTX 980 Ti Desktop PC | |
| Asus G701VO-CS74K | |
| MSI GS63VR 7RF-228US | |
| Mafia 3 - 1920x1080 High Preset | |
| Eurocom Tornado F5 Killer Edition | |
| Nvidia GeForce GTX 1080 Ti Founders Edition | |
| Alienware 17 R4 | |
| Nvidia GeForce GTX 1080 Founders Edition | |
| Asus Strix GL702VSK | |
| Asus Strix GTX 980 Ti Desktop PC | |
| MSI GS63VR 7RF-228US | |
| 3DMark 11 Performance | 19125 points | |
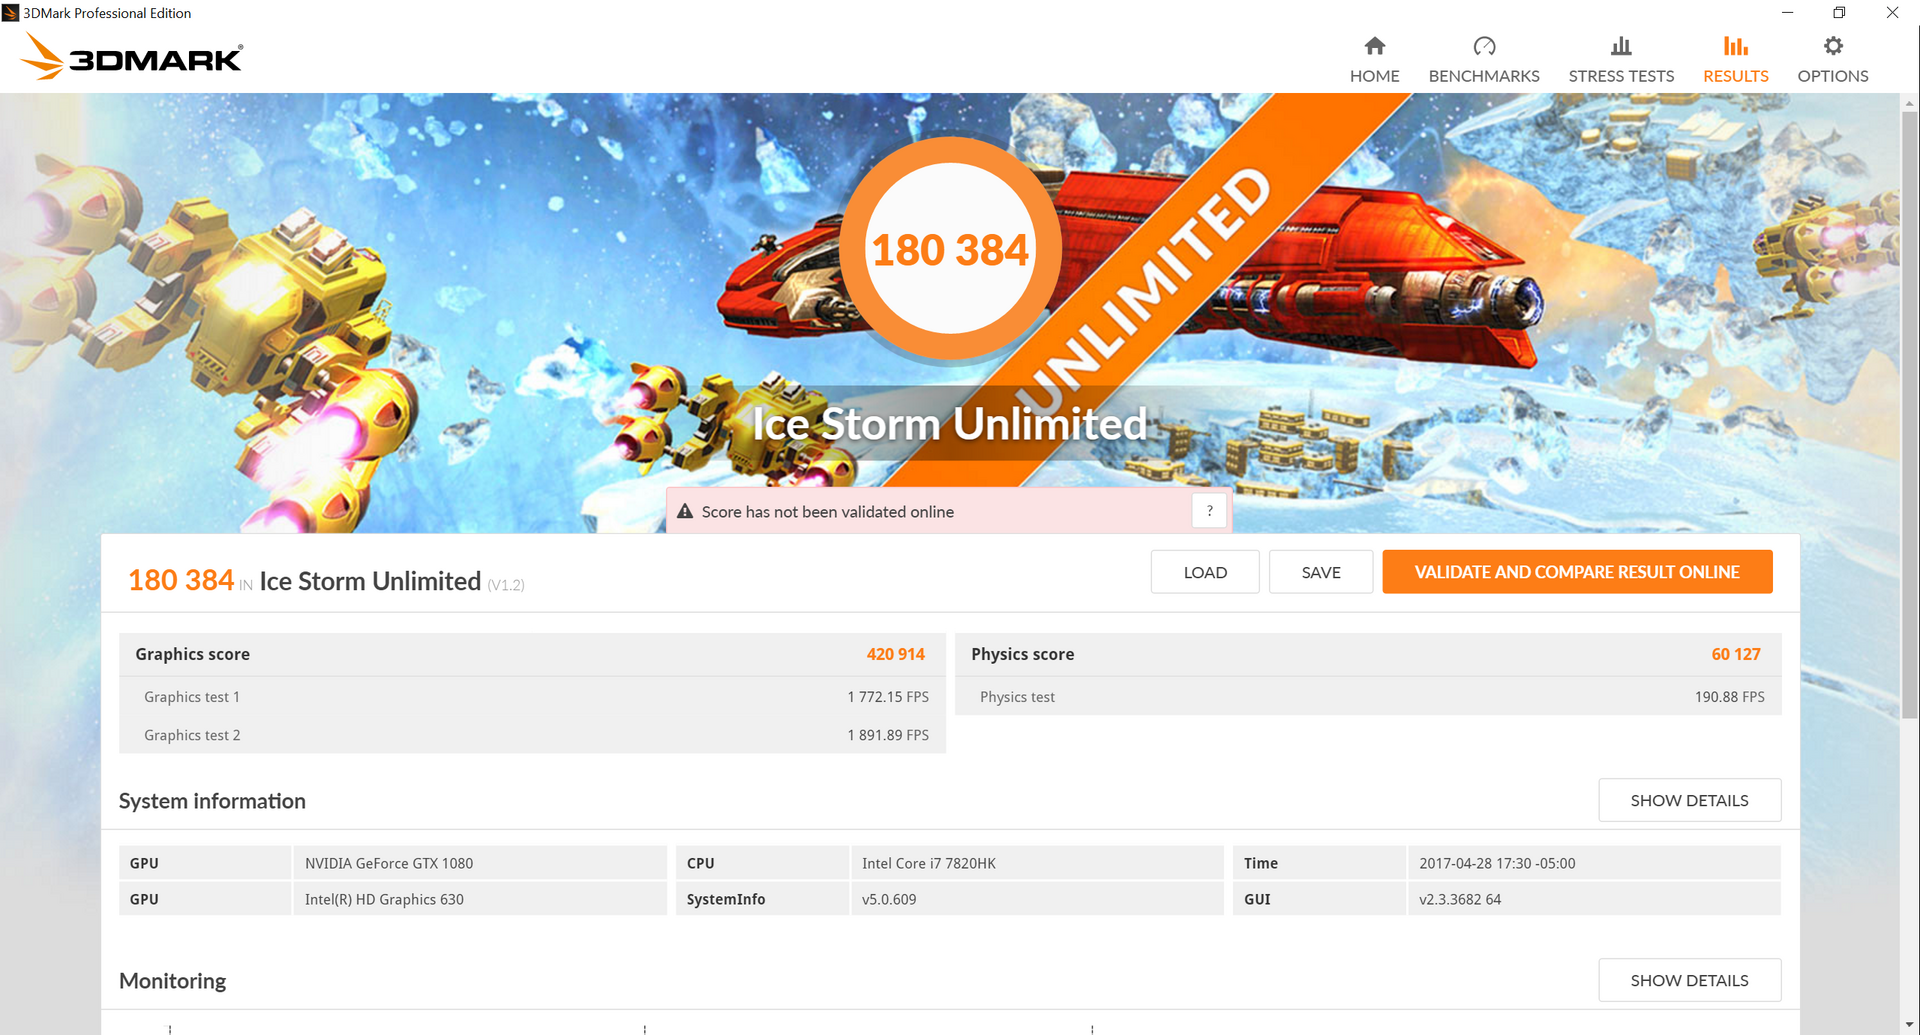
| 3DMark Ice Storm Standard Score | 171837 points | |
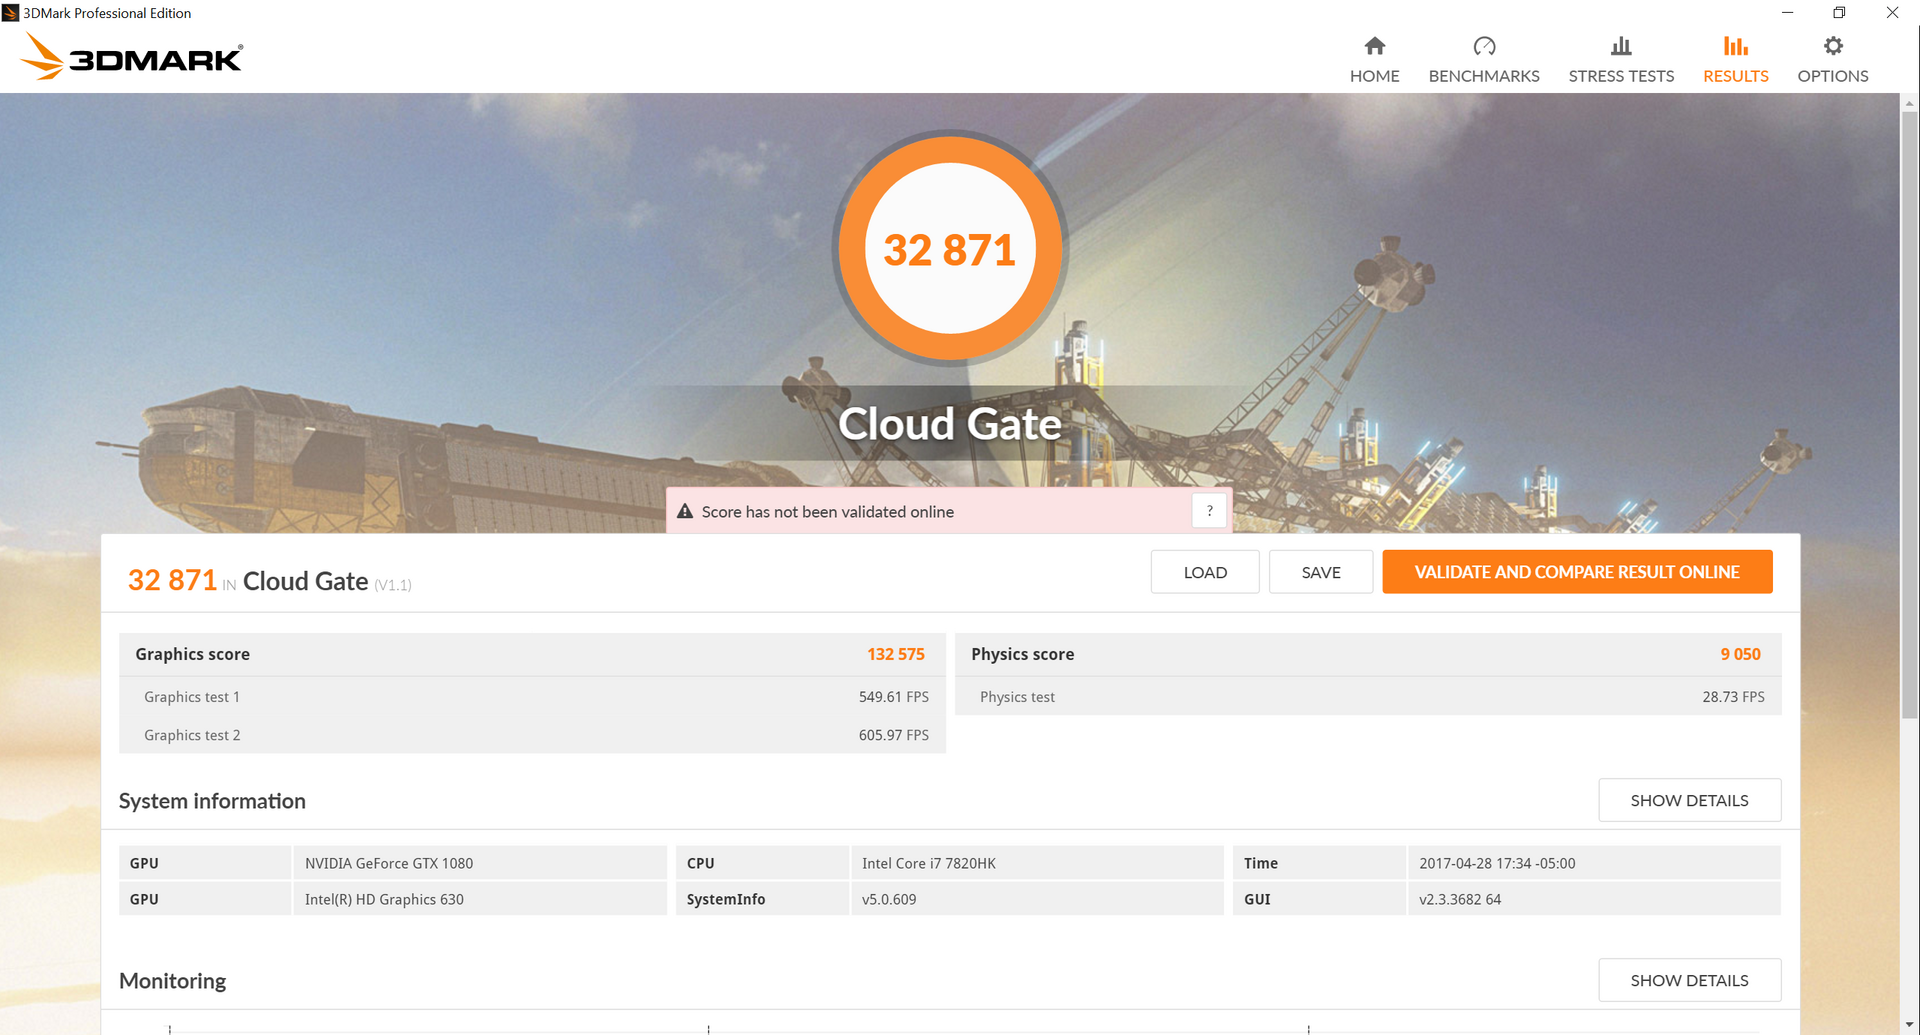
| 3DMark Cloud Gate Standard Score | 32871 points | |
| 3DMark Fire Strike Score | 16931 points | |
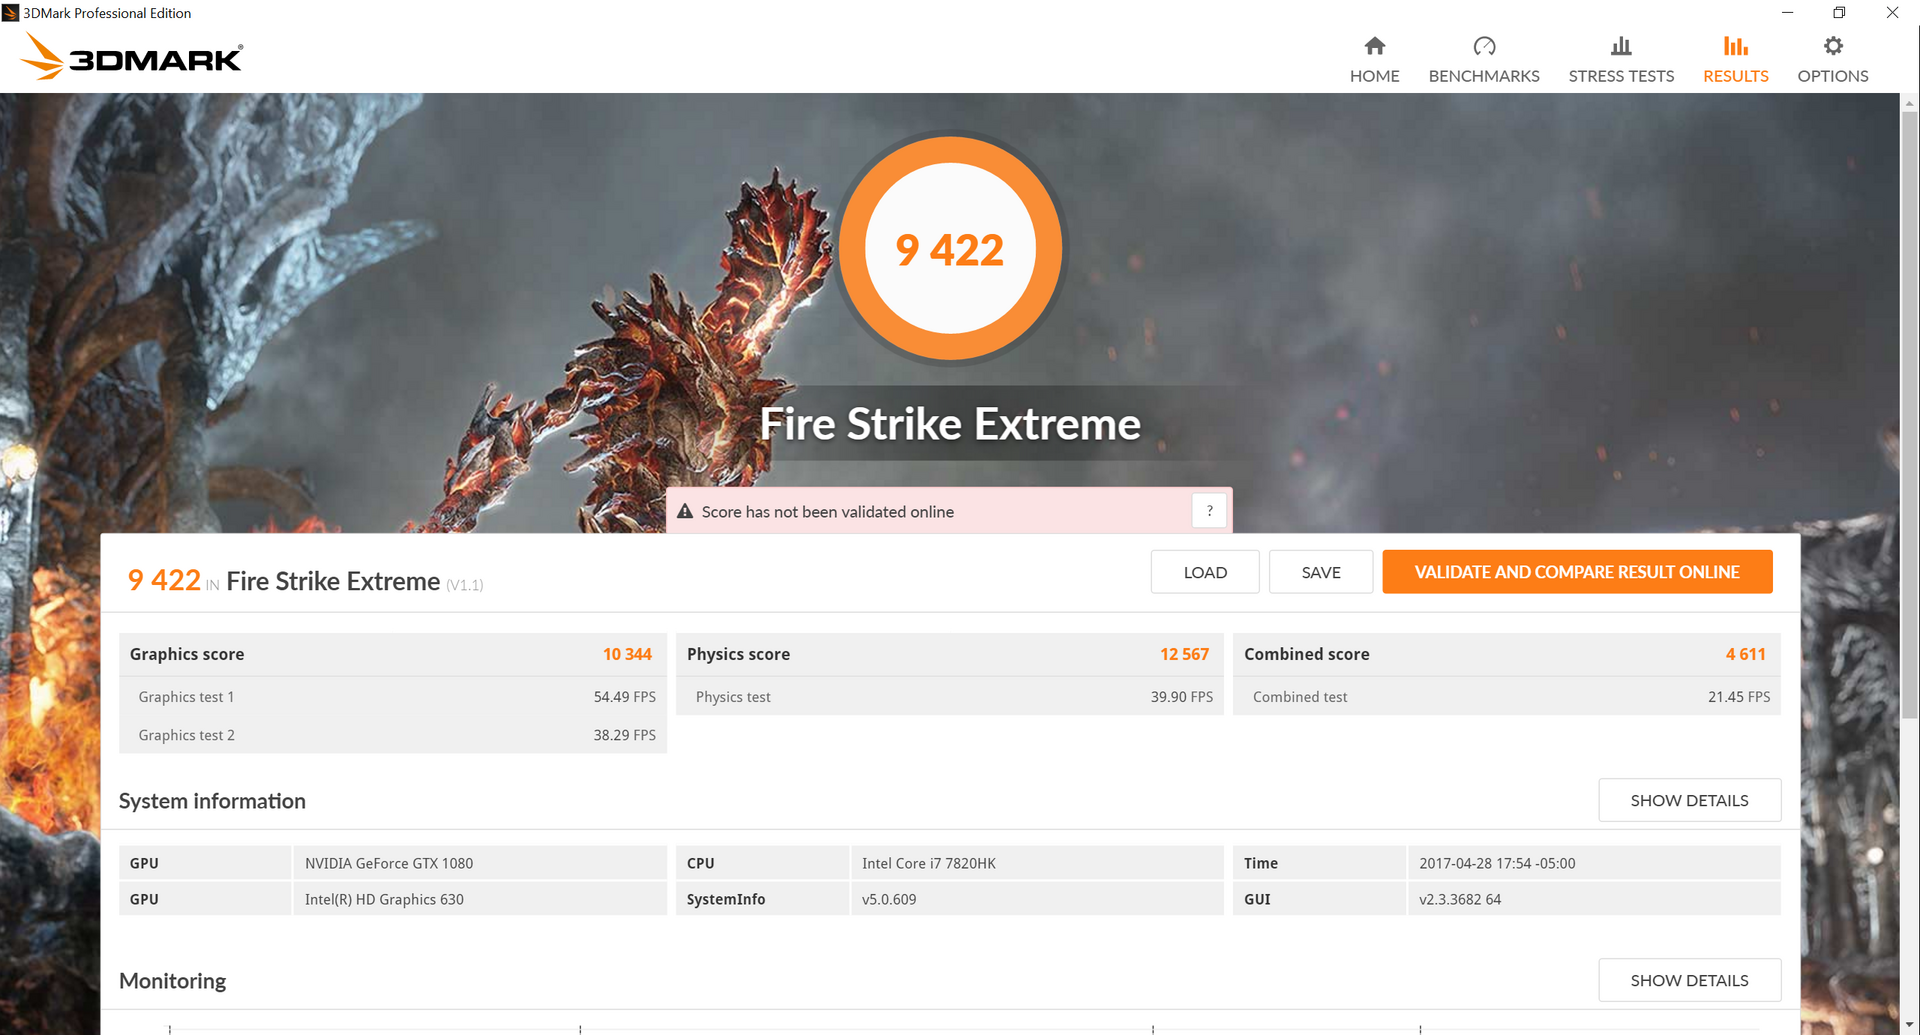
| 3DMark Fire Strike Extreme Score | 9422 points | |
Help | ||
| low | med. | high | ultra | |
|---|---|---|---|---|
| BioShock Infinite (2013) | 162.9 | |||
| Metro: Last Light (2013) | 132.2 | |||
| Thief (2014) | 107.2 | |||
| The Witcher 3 (2015) | 78.1 | |||
| Batman: Arkham Knight (2015) | 93 | |||
| Metal Gear Solid V (2015) | 60 | |||
| Dota 2 Reborn (2015) | 119.9 | |||
| Fallout 4 (2015) | 120.7 | |||
| Rise of the Tomb Raider (2016) | 118.3 | |||
| Ashes of the Singularity (2016) | 66.5 | |||
| Doom (2016) | 140.1 | |||
| Overwatch (2016) | 188 | |||
| Mafia 3 (2016) | 72.5 |
| Title | FPS> |
| BioShock Infinite | 123.3 |
| Metro: Last Light | 95.5 |
| Thief | 91 |
| The Witcher 3 | 57.3 |
| Batman: Arkham Knight | 73 |
| Metal Gear Solid V | 60 |
| Dota 2 Reborn | 114.4 |
| Fallout 4 | 81.6 |
| Rise of the Tomb Raider | 81.6 |
| Ashes of the Singularity | 63.2 |
| Doom | 108 |
| Overwatch | 133 |
| Mafia 3 | 54.5 |
Stress Test
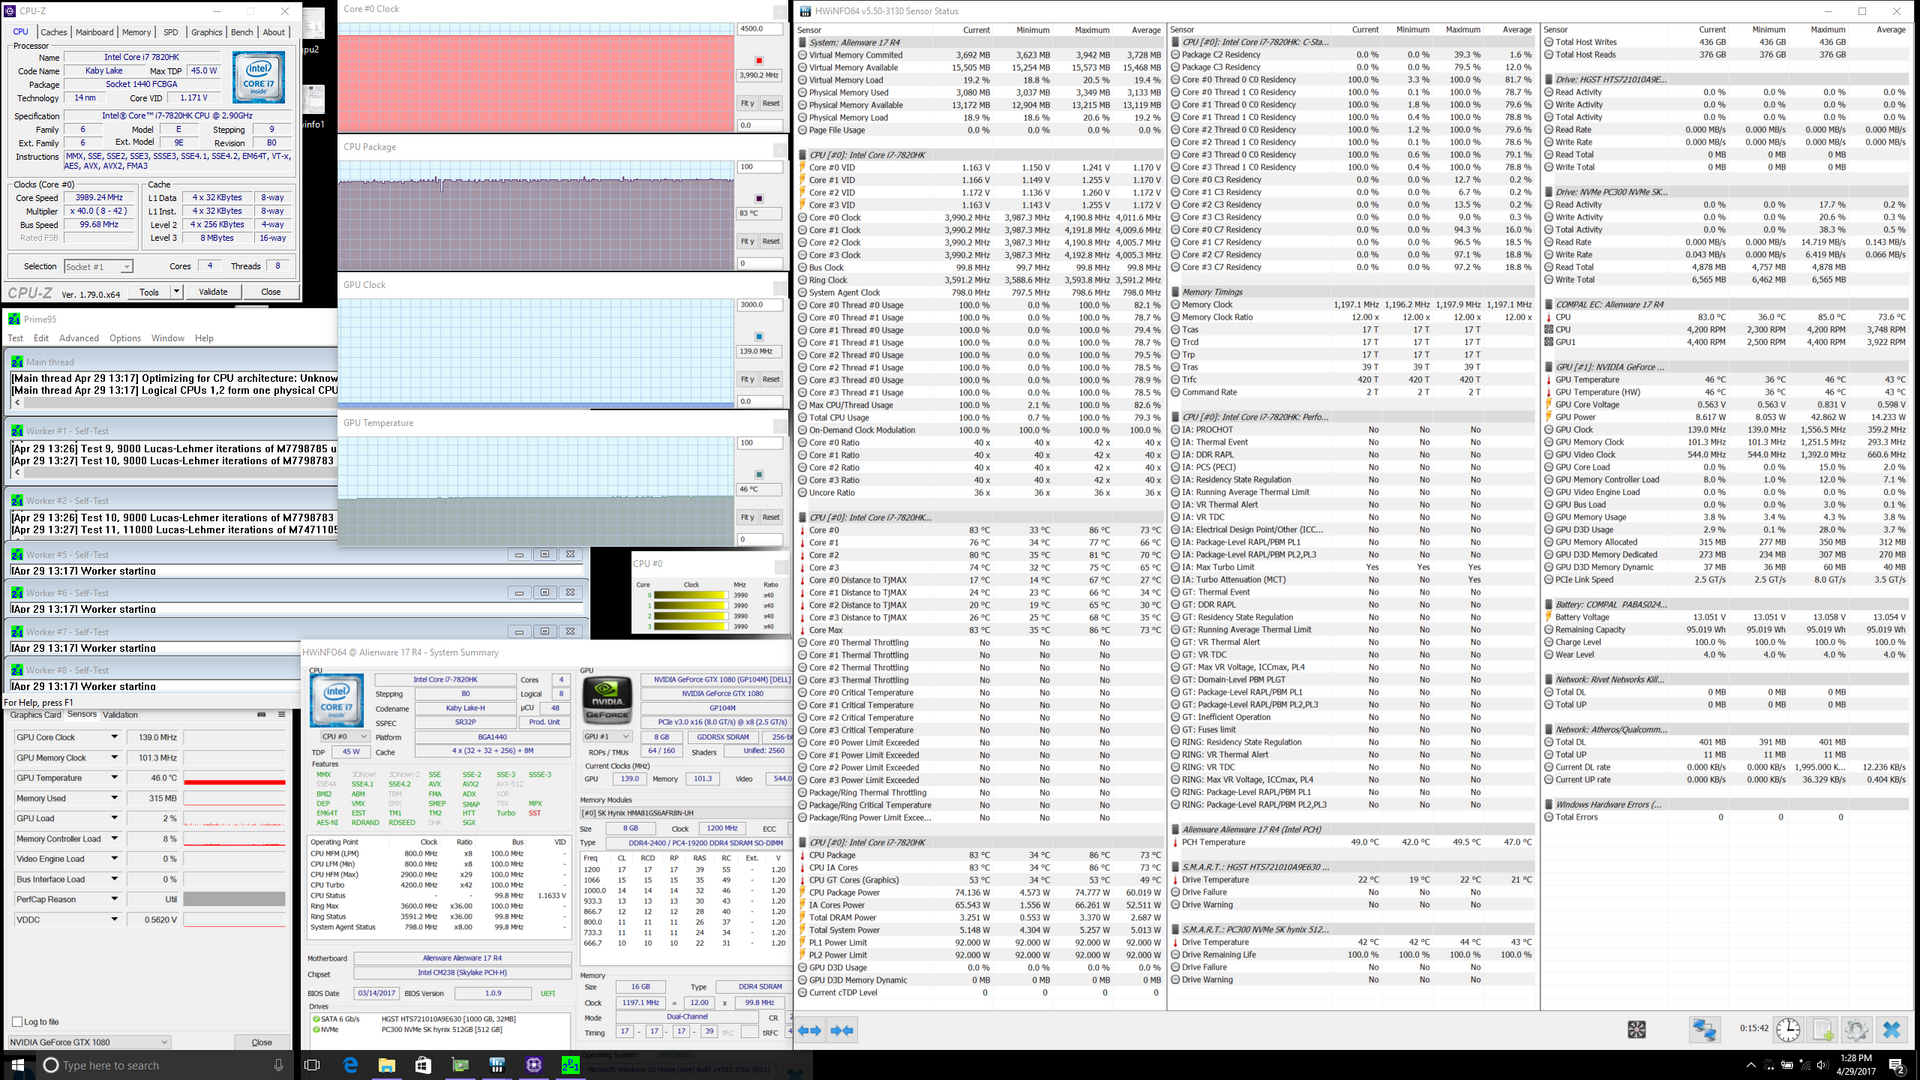
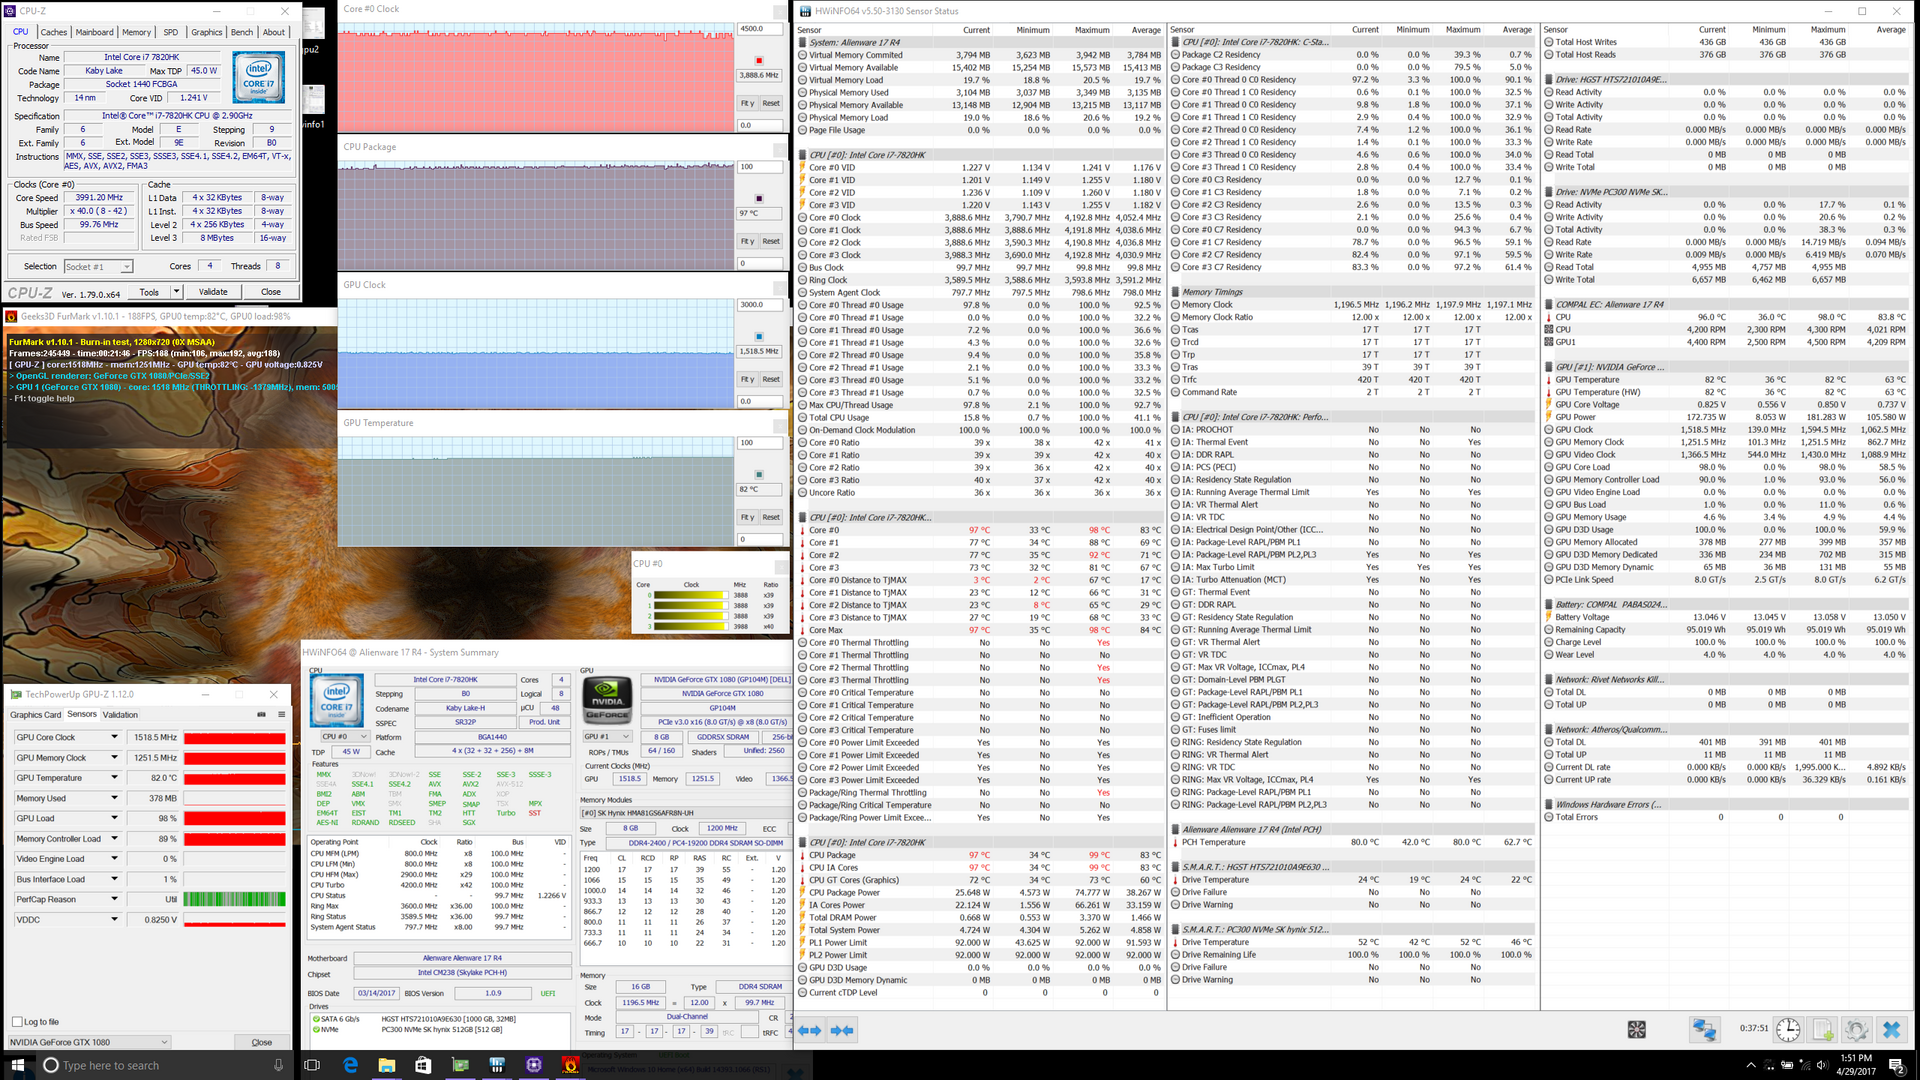
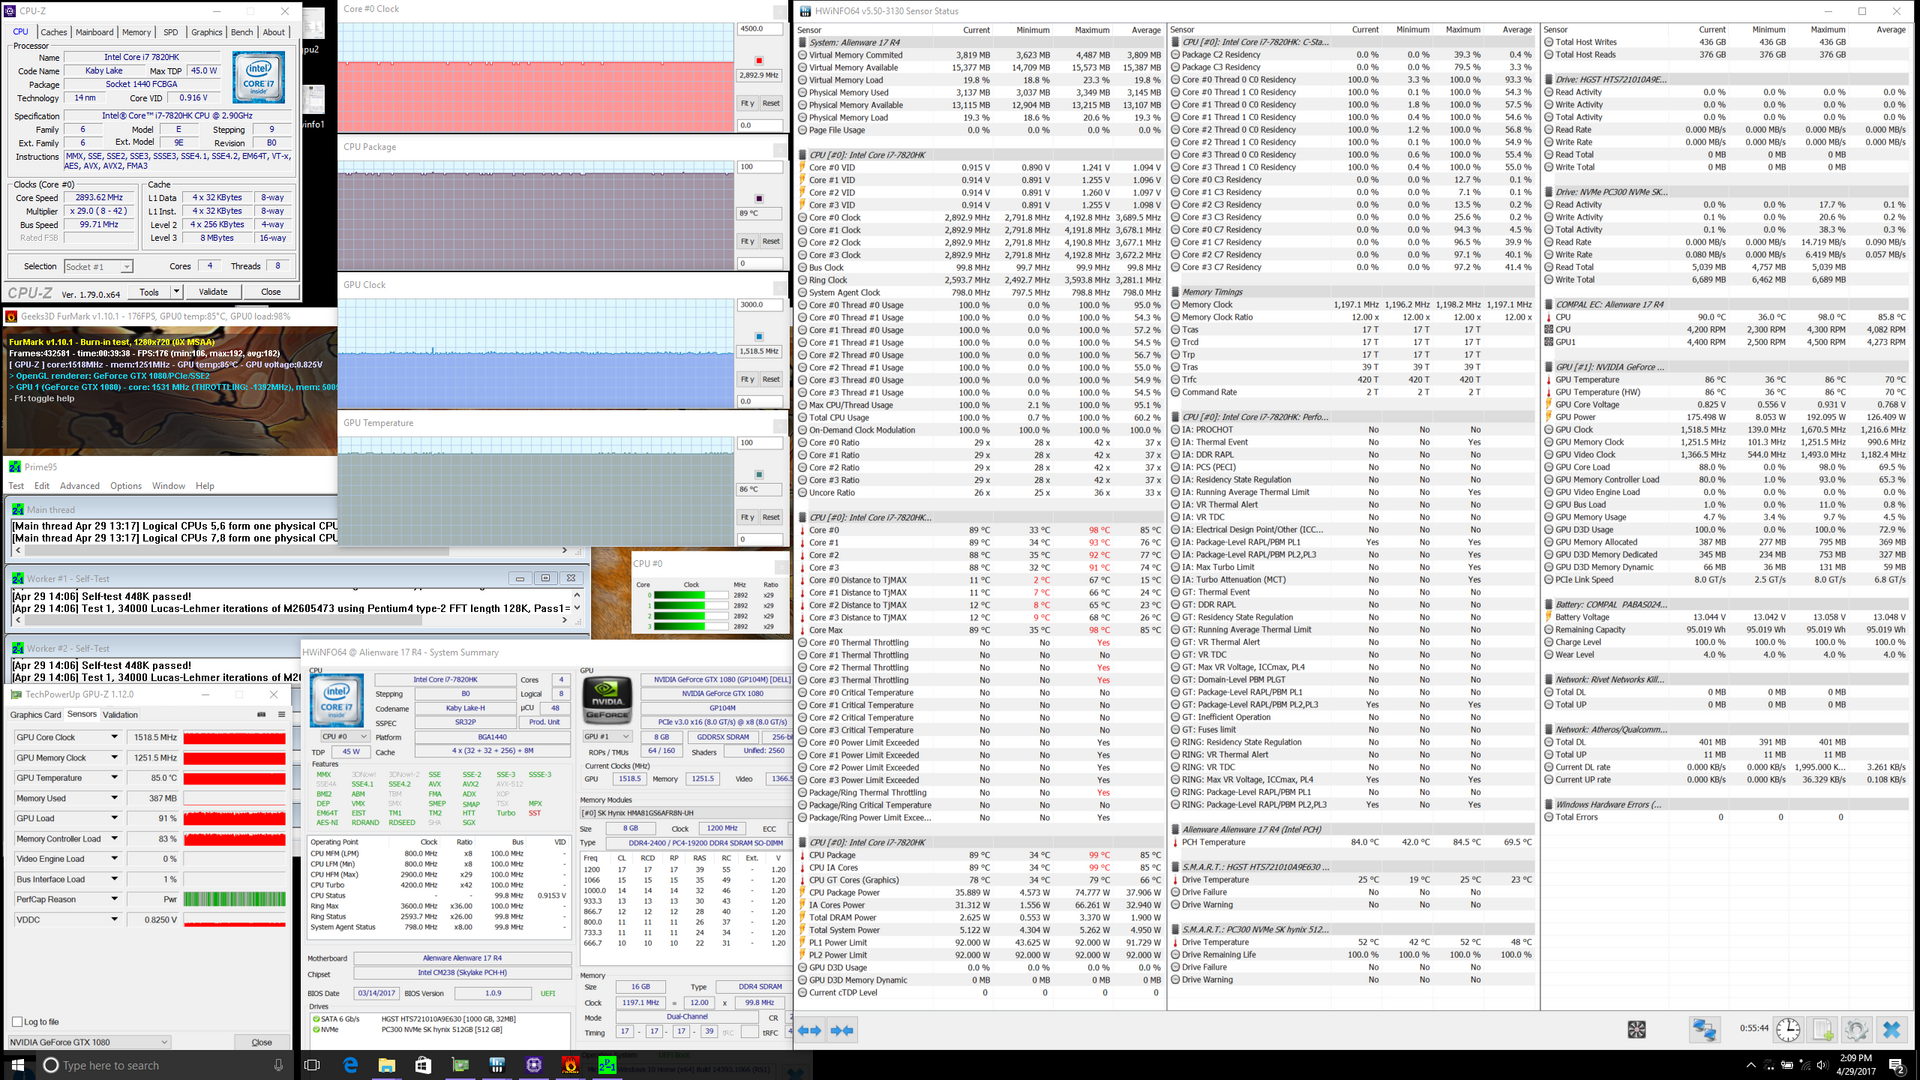
We stress the notebook to unrealistically high loads in order to identify for any potential throttling or stability issues. When under Prime95 load, the CPU is able to maintain a Turbo Boost clock rate of 4.0 GHz or a full 1.1 GHz above its base clock rate. While definitely impressive, core temperature is quite high at 83 C. Switching over to FurMark will put the GPU clock rate to a steady 1519 MHz or slightly below its base frequency of 1582 MHz. Running both Prime95 and FurMark simultaneously will strip away all Turbo Boost potential from the CPU to a steady base clock rate of 2.9 GHz and a core temperature of just under 90 C. In comparison, the MSI GT73VR under similar conditions stabilizes at both higher clock rates (3.5 GHz) and a lower core temperature (86 C) than our Alienware.
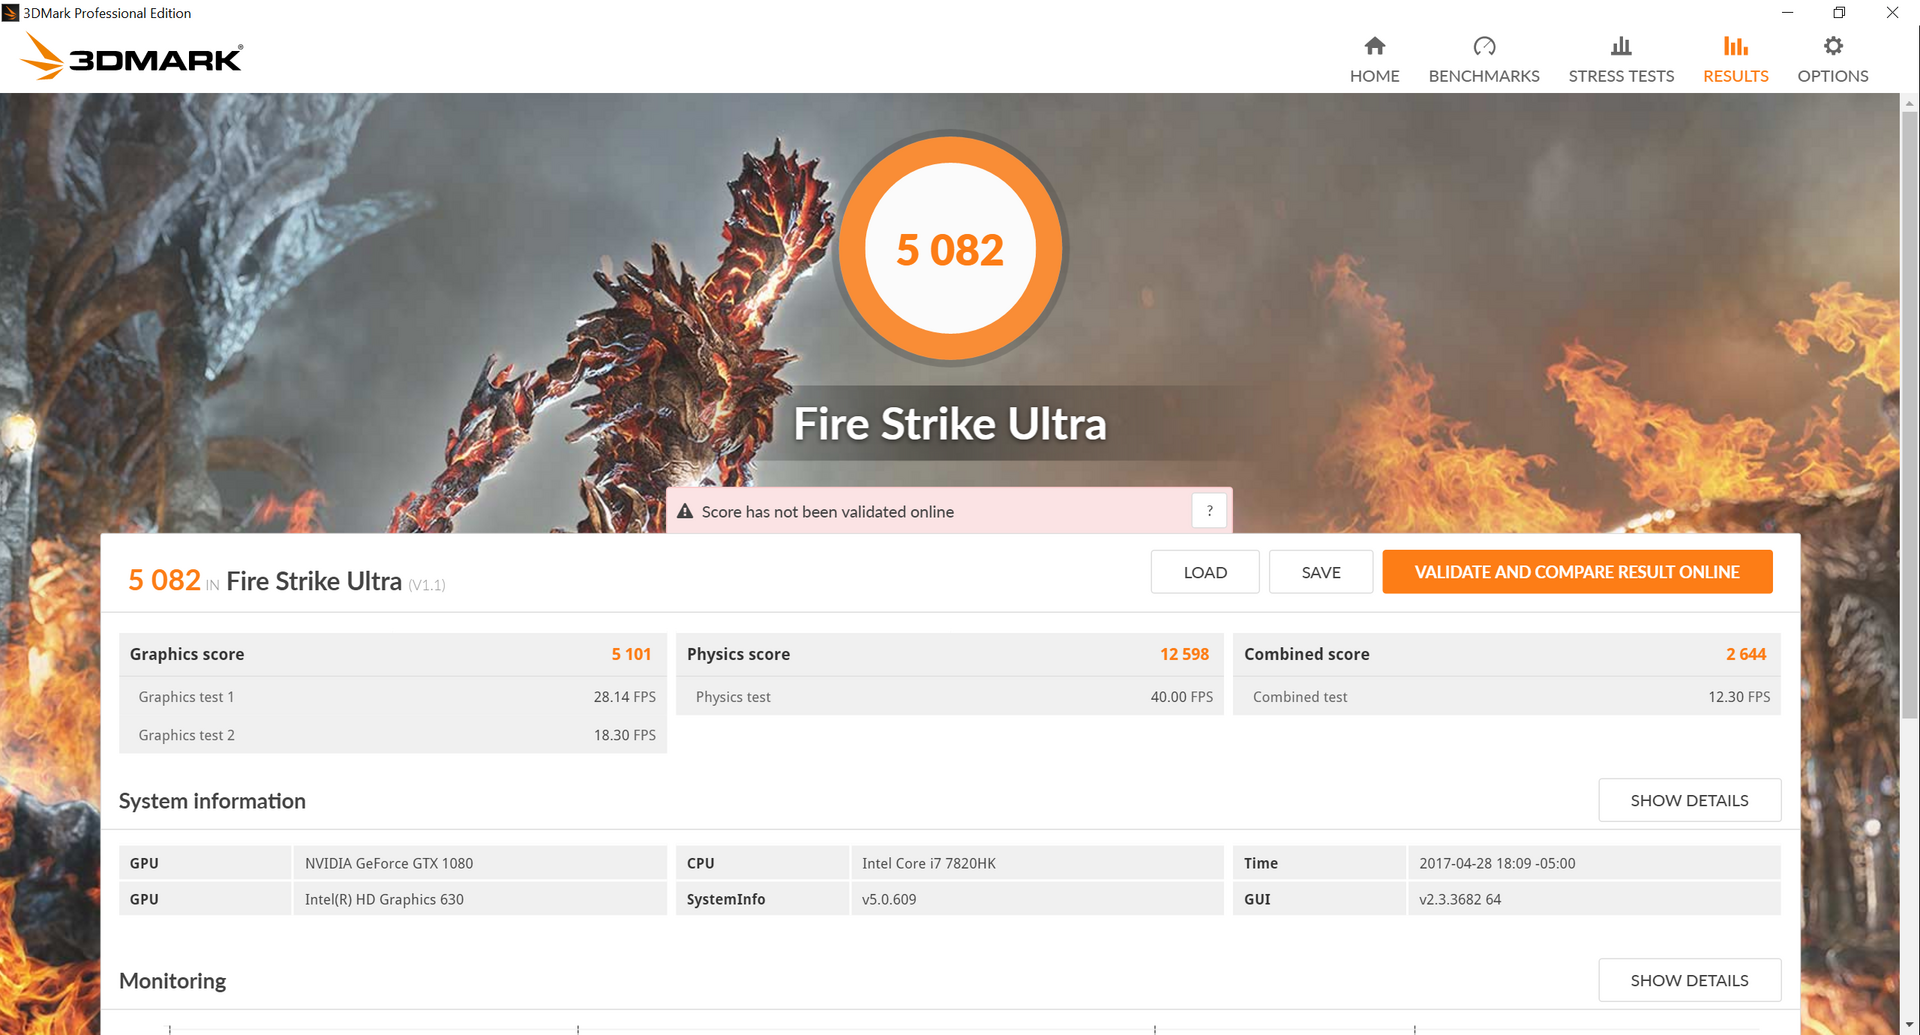
Running on batteries will limit CPU and GPU power. A 3DMark Fire Strike run on batteries returns Physics and Graphics scores of 9105 and 6902, respectively, compared to 12592 points and 21846 points when connected to mains. Note that frame rates are automatically limited to 30 FPS when on batteries to reduce power consumption.
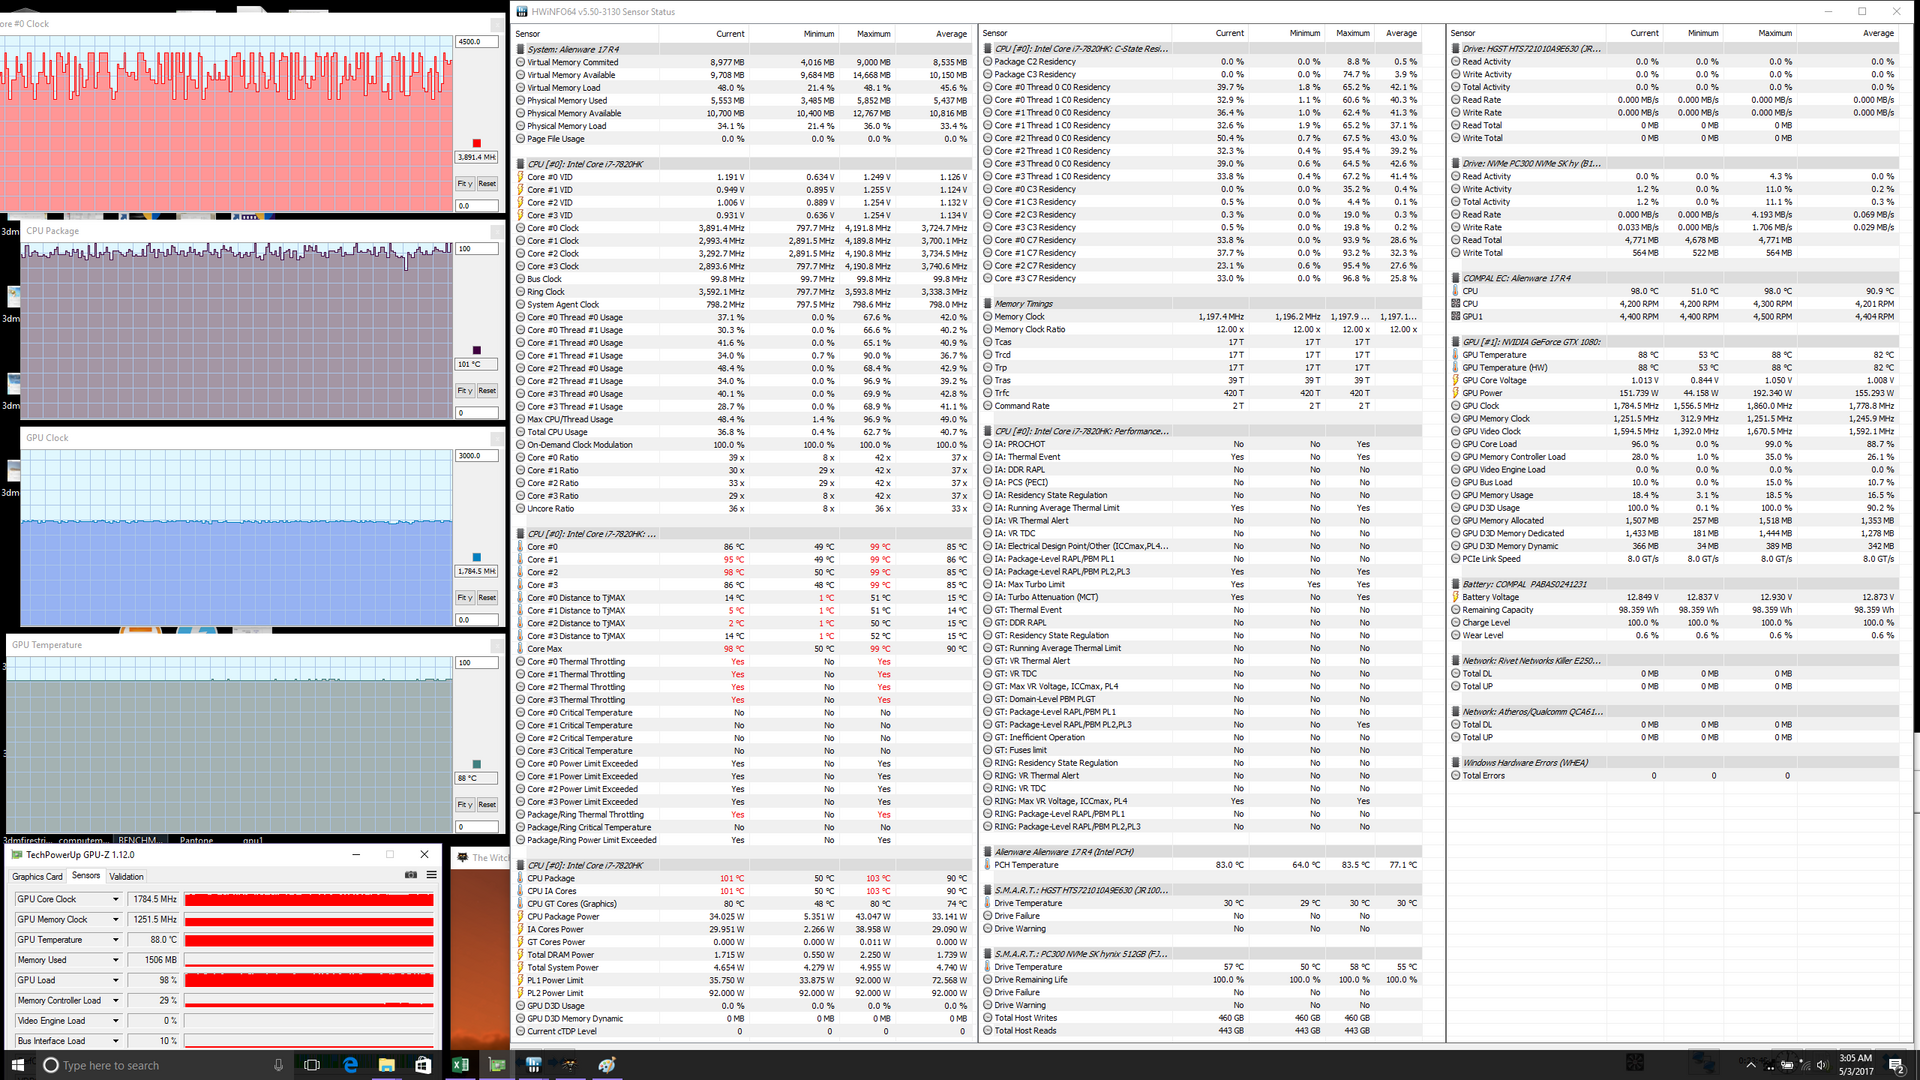
Witcher 3 load is a better representation of real-world gaming stress than both Unigine Valley and our extreme conditions above. Running the title for nearly an hour shows notable dips in frame rates over time from ~79 FPS to ~72 FPS as represented by our graph below, so the GPU is unable to sustain maximum Boost clock rates over extended periods. GPU clock rates can be seen slowly decreasing from 1848+ MHz down to a steady ~1771 MHz towards the end of the Witcher 3 stress test according to GPU-Z.
Both the CPU and GPU become alarmingly warm in the 100 C and 88 C ranges, respectively, so the variable clock rates are likely necessary to keep temperatures in check. Nonetheless, users can be assured that the CPU and GPU will not throttle and will in fact remain above their base respective clock rates of 2.9 GHz and 1582 MHz when gaming at the cost of some very warm silicon. We suspect that the lower-end SKUs of the 17 R4 will run cooler than our topped off configuration on hand.
| CPU Clock (GHz) | GPU Clock (MHz) | Average CPU Temperature (°C) | Average GPU Temperature (°C) | |
| Prime95 Stress | 4.0 | -- | 83 | 46 |
| FurMark Stress | -- | 1519 | 97 | 82 |
| Prime95 + FurMark Stress | 2.9 | 1519 | 89 | 86 |
| Witcher 3 Stress | 2.9+ | ~1771 | 101 | 88 |
Emissions
System Noise
The cooling solution consists of twin 60 mm fans and just three heat pipes compared to seven on the Eurocom Sky DLX7 or at least eight on the GT73VR. We were hoping that the size increase when moving from the 17 R3 to the 17 R4 would also result in quieter fans, but this is unfortunately not the case. The fans in the new Alienware are still always active and audible no matter the workload. Thankfully, the fans are insensitive to low-medium processing loads like web browsing or video playback, so users need not worry about constantly pulsing fans and varying fan noise levels.
Running 3DMark 06 or Witcher 3 will slowly increase fan noise until it flattens at a steady 50.2 dB(A). This is significantly louder than what we recorded on the GT73VR and Predator 17 X under similar testing conditions and is actually quite close to the similarly equipped Aorus X7 DT. Of course, this latter model is one of the thinnest gaming notebooks available with the GTX 1080 GPU, so this comparison doesn't do the heavier and larger Alienware 17 any favors. The 40 dB(A) range is generally expected from a high-power gaming notebook and anything in the 50 dB(A) range can begin to interfere with gameplay. This becomes particularly problematic on titles where sound awareness is crucial such as MGS V. We recommend a pair of headphones if possible.
Lastly, the system fans take a bit of time to fall back down to their minimum speeds even after a short gaming session. For example, exiting Witcher 3 after half an hour of play will still have the fans running at higher speeds in the 40 dB(A) noise range lasting about 5 minutes. Beyond this, we can notice no annoying coil whine or electronic noise emanating from the system during use.
Noise level
| Idle |
| 35.6 / 35.6 / 35.7 dB(A) |
| HDD |
| 35.7 dB(A) |
| Load |
| 50.2 / 50.2 dB(A) |
 | ||
30 dB silent 40 dB(A) audible 50 dB(A) loud |
||
min: | ||
| Alienware 17 R4 GeForce GTX 1080 Mobile, i7-7820HK, SK Hynix PC300 NVMe 512 GB | Alienware 17 R3 (A17-9935) GeForce GTX 980M, 6700HQ, Samsung PM951 NVMe 512 GB | MSI GT72VR 7RE-433 GeForce GTX 1070 Mobile, i7-7700HQ, Kingston RBU-SNS8152S3256GG5 | MSI GT73VR 7RF-296 GeForce GTX 1080 Mobile, i7-7820HK, 2x Samsung SM951 MZVPV256HDGL (RAID 0) | Acer Predator 17 X GX-792-76DL GeForce GTX 1080 Mobile, i7-7820HK, Toshiba NVMe THNSN5512GPU7 | Aorus X7 DT v6 GeForce GTX 1080 Mobile, 6820HK, Samsung SM951 MZVPV512HDGL m.2 PCI-e | |
|---|---|---|---|---|---|---|
| Noise | 8% | 5% | 1% | 3% | -1% | |
| off / environment * (dB) | 28.2 | 30 -6% | 31 -10% | 30 -6% | 30 -6% | 28.6 -1% |
| Idle Minimum * (dB) | 35.6 | 31 13% | 34 4% | 34 4% | 33 7% | 32.2 10% |
| Idle Average * (dB) | 35.6 | 32 10% | 35 2% | 35 2% | 35 2% | 35.2 1% |
| Idle Maximum * (dB) | 35.7 | 33 8% | 37 -4% | 37 -4% | 37 -4% | 35.2 1% |
| Load Average * (dB) | 50.2 | 38 24% | 37 26% | 39 22% | 40 20% | 51.7 -3% |
| Witcher 3 ultra * (dB) | 50.2 | |||||
| Load Maximum * (dB) | 50.2 | 50 -0% | 44 12% | 56 -12% | 50 -0% | 55.7 -11% |
* ... smaller is better
Temperature
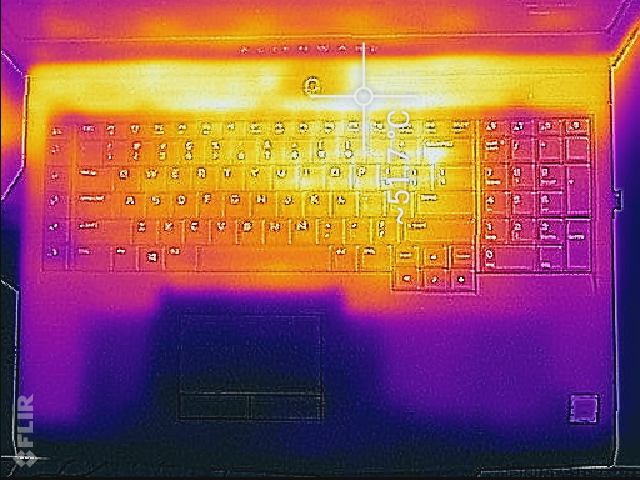
Surface temperatures remain relatively warm and flat in the 27 C range when simply idling on desktop with no running applications. Maximum load with Prime95 and FurMark will bump temperatures up to the 50 C range, but this hot spot is thankfully concentrated on the surface above the first row of keyboard keys where fingers are less likely to touch. The WASD keys, NumPad, and palm rests never become uncomfortable no matter the system load, which is something we can't say for all gaming notebooks. Core motherboard components are closer to the back of the system while the cooler battery is located upfront where temperature changes are less severe. Waste heat exits via ventilation grilles on the rear corners of the notebook away from external mice and keyboards.
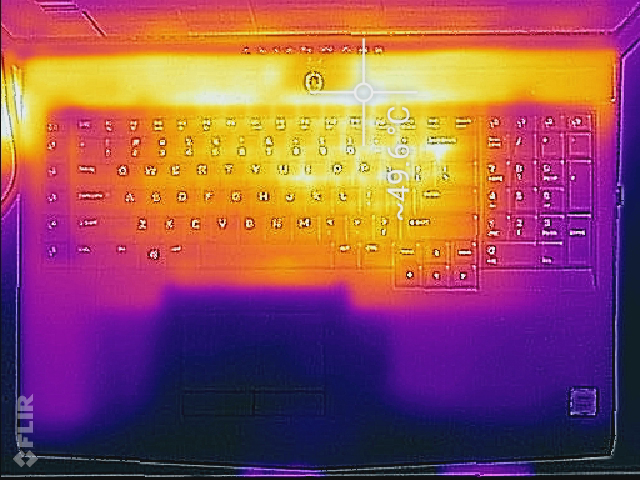
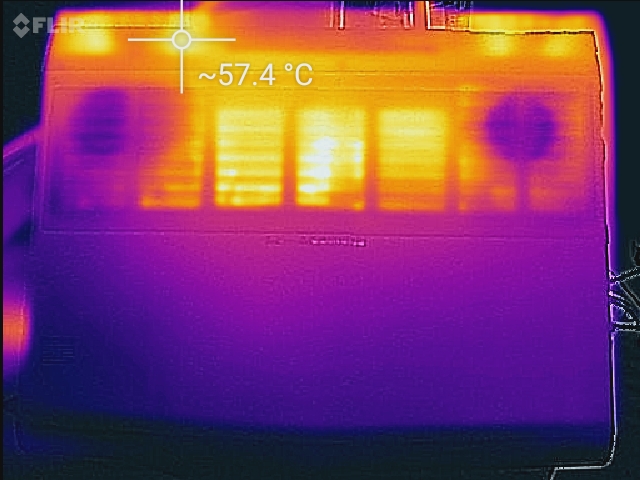
(-) The maximum temperature on the upper side is 49.6 °C / 121 F, compared to the average of 40.4 °C / 105 F, ranging from 21.2 to 68.8 °C for the class Gaming.
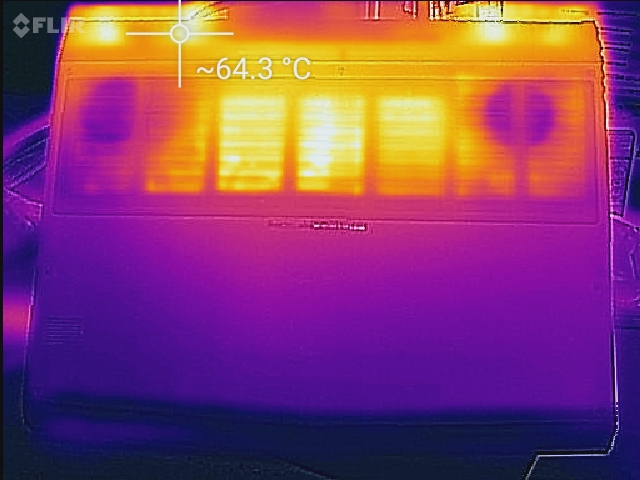
(-) The bottom heats up to a maximum of 56 °C / 133 F, compared to the average of 43.2 °C / 110 F
(+) In idle usage, the average temperature for the upper side is 27.5 °C / 82 F, compared to the device average of 33.9 °C / 93 F.
(±) Playing The Witcher 3, the average temperature for the upper side is 37.2 °C / 99 F, compared to the device average of 33.9 °C / 93 F.
(+) The palmrests and touchpad are cooler than skin temperature with a maximum of 27.4 °C / 81.3 F and are therefore cool to the touch.
(±) The average temperature of the palmrest area of similar devices was 28.8 °C / 83.8 F (+1.4 °C / 2.5 F).
Speakers

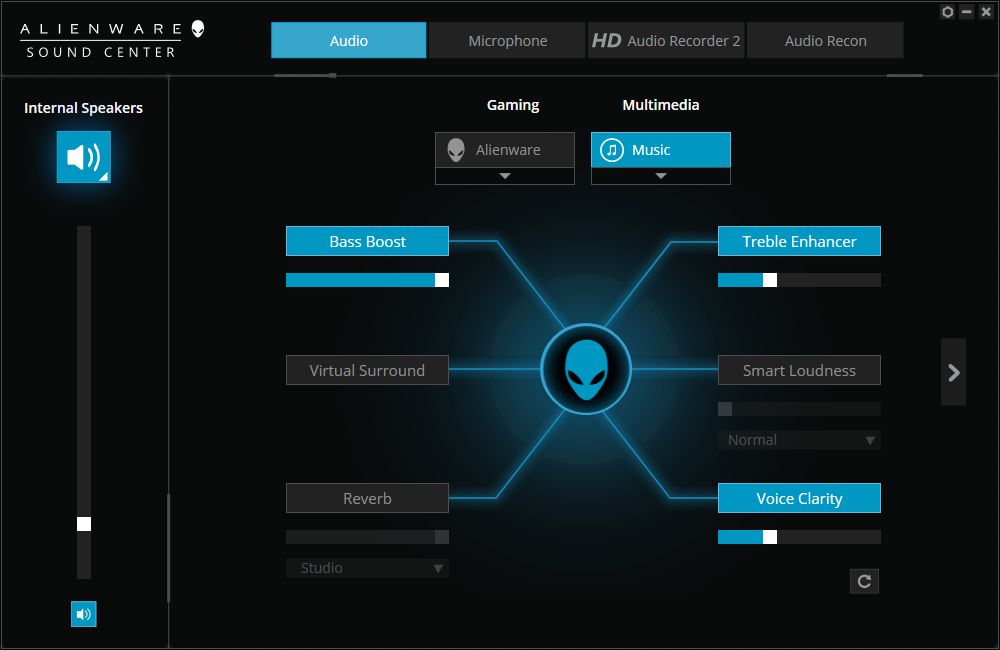
Dell claims an upgraded 2.1 sound system from the new chassis design. Sound quality is very good as bass is better reproduced and much more noticeable than on most mainstream or thinner laptops. Since the speakers and subwoofer are on the front edge of the notebook, however, the palm rests will reverberate even if on the 50 percent volume setting. The maximum volume setting is very loud and introduces no static or significant imbalances. Despite this, it's rather unfortunate that the loud fan noise when gaming will make it more difficult to really appreciate the sound quality of the system. We recommend launching the Alienware sound menu and setting sample rate to its 192 kHz maximum and then boosting the bass to get the most out of the internal speakers.
Users must rely on the HDMI port for outputting to external 7.1 sound systems since there is no dedicated 3.5 mm S/PDIF.
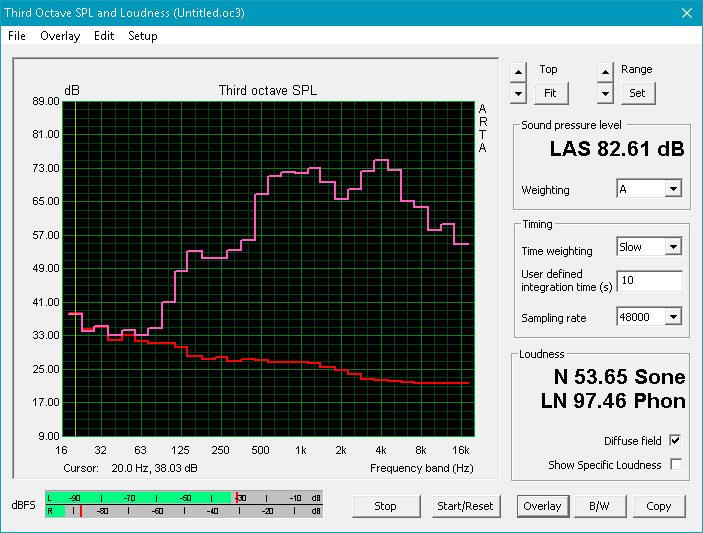
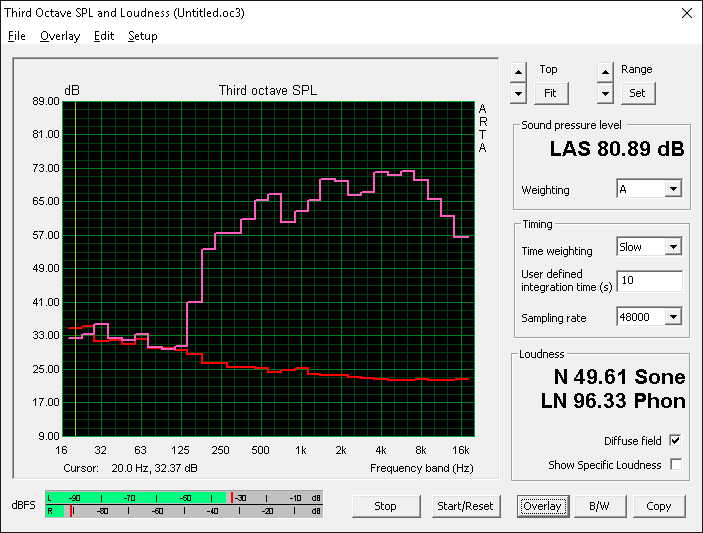
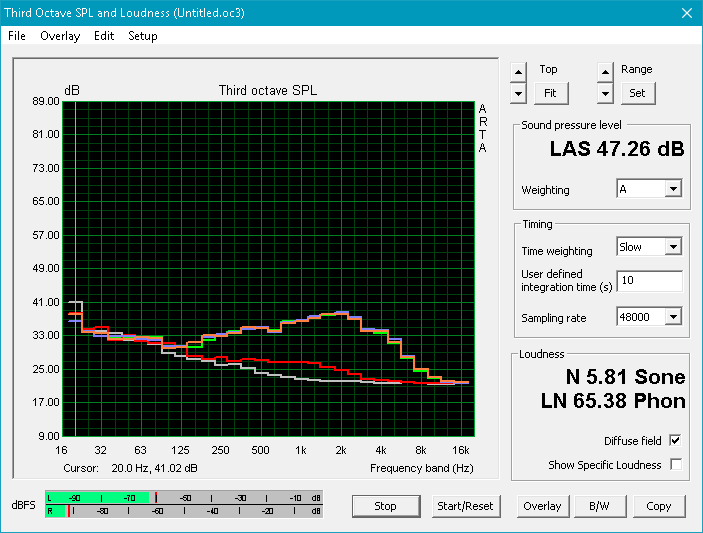
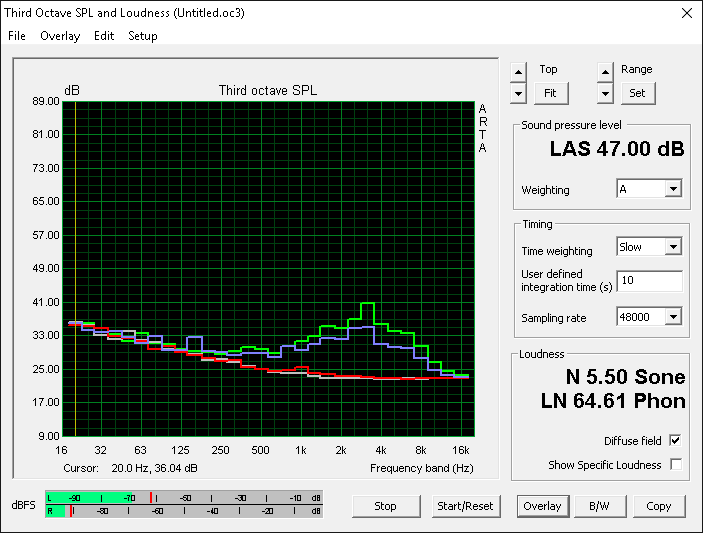
Alienware 17 R4 audio analysis
(±) | speaker loudness is average but good (75 dB)
Bass 100 - 315 Hz
(-) | nearly no bass - on average 15.3% lower than median
(±) | linearity of bass is average (9.6% delta to prev. frequency)
Mids 400 - 2000 Hz
(±) | higher mids - on average 5.5% higher than median
(±) | linearity of mids is average (8.9% delta to prev. frequency)
Highs 2 - 16 kHz
(±) | higher highs - on average 5.1% higher than median
(±) | linearity of highs is average (9.7% delta to prev. frequency)
Overall 100 - 16.000 Hz
(±) | linearity of overall sound is average (22.4% difference to median)
Compared to same class
» 80% of all tested devices in this class were better, 6% similar, 14% worse
» The best had a delta of 6%, average was 18%, worst was 132%
Compared to all devices tested
» 65% of all tested devices were better, 6% similar, 29% worse
» The best had a delta of 4%, average was 24%, worst was 134%
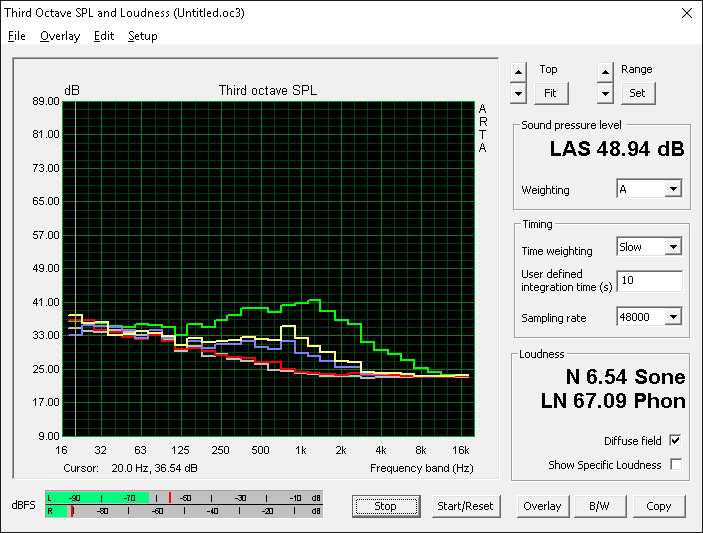
Apple MacBook 12 (Early 2016) 1.1 GHz audio analysis
(+) | speakers can play relatively loud (83.6 dB)
Bass 100 - 315 Hz
(±) | reduced bass - on average 11.3% lower than median
(±) | linearity of bass is average (14.2% delta to prev. frequency)
Mids 400 - 2000 Hz
(+) | balanced mids - only 2.4% away from median
(+) | mids are linear (5.5% delta to prev. frequency)
Highs 2 - 16 kHz
(+) | balanced highs - only 2% away from median
(+) | highs are linear (4.5% delta to prev. frequency)
Overall 100 - 16.000 Hz
(+) | overall sound is linear (10.2% difference to median)
Compared to same class
» 7% of all tested devices in this class were better, 2% similar, 91% worse
» The best had a delta of 5%, average was 18%, worst was 53%
Compared to all devices tested
» 5% of all tested devices were better, 1% similar, 94% worse
» The best had a delta of 4%, average was 24%, worst was 134%
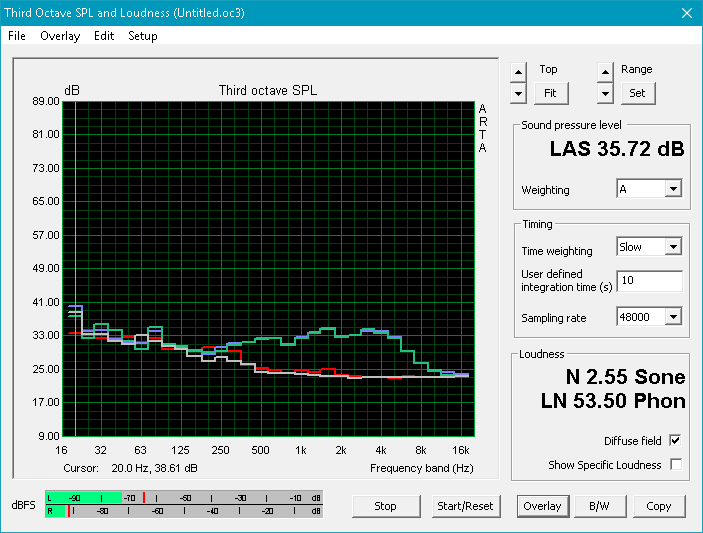
Frequency Comparison (Checkbox selectable!)
Graph 1: Pink Noise 100% Vol.; Graph 2: Audio off
Energy Management
Power Consumption
The Alienware consumes more power than many of its competitors under all tested conditions from idling to maximum load. At its minimum Power Saver settings (with AlienFX lighting active), we can measure a consumption of about 37 W compared to 12 W on the older Alienware 17 R3 or 29 W on the MSI GT73VR. Average loads (i.e., 3DMark06) will demand 122 W while running Witcher 3 will draw as much as 180 W.
Maximum load with both Prime95 and FurMark running simultaneously will draw 277 W from the large power adapter (20 x 10 x 4.5 cm) rated for up to 330 W. Dell has kept a healthy power overhead to reduce the chances of throttling from limitations of the AC adapter. In comparison, the Aorus X7 DT ships with a significantly less capable and smaller 230 W AC adapter.
| Off / Standby | |
| Idle | |
| Load |
|
Key:
min: | |
| Alienware 17 R4 i7-7820HK, GeForce GTX 1080 Mobile, SK Hynix PC300 NVMe 512 GB, TN LED, 2560x1440, 17.3" | Alienware 17 R3 (A17-9935) 6700HQ, GeForce GTX 980M, Samsung PM951 NVMe 512 GB, IPS, 1920x1080, 17.3" | MSI GT73VR 7RF-296 i7-7820HK, GeForce GTX 1080 Mobile, 2x Samsung SM951 MZVPV256HDGL (RAID 0), TN LED, 1920x1080, 17.3" | Acer Predator 17 X GX-792-76DL i7-7820HK, GeForce GTX 1080 Mobile, Toshiba NVMe THNSN5512GPU7, IPS, 1920x1080, 17.3" | Aorus X7 DT v6 6820HK, GeForce GTX 1080 Mobile, Samsung SM951 MZVPV512HDGL m.2 PCI-e, TN LED, 2560x1440, 17.3" | |
|---|---|---|---|---|---|
| Power Consumption | 41% | 7% | 12% | -5% | |
| Idle Minimum * (Watt) | 37.5 | 12 68% | 29 23% | 27 28% | 31.5 16% |
| Idle Average * (Watt) | 37.6 | 18 52% | 35 7% | 32 15% | 33.9 10% |
| Idle Maximum * (Watt) | 37.6 | 26 31% | 40 -6% | 41 -9% | 34.6 8% |
| Load Average * (Watt) | 122.4 | 95 22% | 94 23% | 102 17% | 205.6 -68% |
| Witcher 3 ultra * (Watt) | 180.3 | ||||
| Load Maximum * (Watt) | 277.4 | 188 32% | 315 -14% | 248 11% | 250.8 10% |
* ... smaller is better
Battery Life
Two battery capacities are available at 4-cell 67 Wh or 6-cell 99 Wh. Our test unit is equipped with the latter and is slightly higher in capacity than the 91 Wh battery in the Alienware 17 R3. As we understand it, there is no consumer notebook with an integrated Li-Ion battery larger than 99 Wh due to imposed safely limits aboard consumer airlines. The Razer Blade Pro and Aorus X7 DT, for example, are equipped with 99 Wh and 94 Wh batteries, respectively.
Despite the dense battery, runtimes on the Alienware 17 R4 are below average even for a gaming notebook. Users can expect just 3 hours of real-world WLAN use on the Balanced profile setting or about 4.5 hours if idling on desktop on the Power Saver profile. The unlocked i7-7820HK, higher resolution display, more demanding GTX 1080 GPU, and lack of Optimus compared to the Maxwell-powered Alienware 17 R3 all contribute to the short runtimes. Our last Alienware 17 R3 unit was able to last for over 7 hours under similar WLAN conditions and even the new Acer Predator 17 X can last for a little over an hour longer than our 17 R4 configuration. It's likely that the 17 R4 SKUs with integrated GPU support can run for significantly longer than what we've recorded here.
Charging from empty to full capacity is quite fast at under 2 hours considering the high capacity of the battery.
| Alienware 17 R4 i7-7820HK, GeForce GTX 1080 Mobile, 99 Wh | Alienware 17 R3 (A17-9935) 6700HQ, GeForce GTX 980M, 92 Wh | MSI GT73VR 7RF-296 i7-7820HK, GeForce GTX 1080 Mobile, 75.2 Wh | Acer Predator 17 X GX-792-76DL i7-7820HK, GeForce GTX 1080 Mobile, 88.8 Wh | Aorus X7 DT v6 6820HK, GeForce GTX 1080 Mobile, 94 Wh | |
|---|---|---|---|---|---|
| Battery runtime | 124% | -10% | 26% | -7% | |
| Reader / Idle (h) | 4.6 | 12.6 174% | 5.2 13% | 3 -35% | |
| WiFi v1.3 (h) | 3 | 7.4 147% | 2.7 -10% | 4.2 40% | 2.4 -20% |
| Load (h) | 1.2 | 1.8 50% | 1.5 25% | 1.6 33% |
Pros
Cons
Verdict
We revere the Alienware 17 series for its high standards in quality that thankfully remain unfazed in this latest iteration. A notebook is about much more than just the CPU and GPU configuration, but also the skeleton and design that fortify the core hardware. At this level, it becomes easier to recommend the latest Alienware over a 17-inch Aorus or older MSI GT72.
We begin to see some issues when at the very high-end configuration level. Our particular test unit is equipped with the fastest CPU and GPU available on the current 17 R4 and the chassis can just barely run these processors reliably at Boost clock rates. Yes, the CPU and GPU will not throttle even when under extreme loads, but core temperatures can reach 90 C or higher when gaming in spite of the fans working overtime at up to 50 dB(A). This is where thicker gaming systems with more developed cooling solutions like the MSI GT73VR or Acer Predator 17 X have the upper hand in temperatures and/or noise.
The findings above and the fact that a Graphics Amplifier port is present actually make for a more compelling reason to purchase a lower-end 17 R4 SKU with GTX 1050 Ti or GTX 1060 graphics. There is a good chance that the significantly lower TDP requirements of these GPUs will lead to quieter fans, lower temperatures, longer runtimes, or possibly all three. Then, users who may demand faster graphics power down the line can simply use the Graphics Amplifier port for future titles. This is the one trick that the Alienware series has up its sleeve against most competitors and these lower-end SKUs are definitely deserving of our full performance rundown to get a bigger picture of the 17 R4 series.
Beyond these red flags in performance, there is little to complain about the rest of the notebook. A wider range of features wouldn't hurt such as individually-lit RGB keys, more USB Type-A ports, and an integrated SD reader, though their omissions aren't necessarily the end of the world. Gamers who are interested in the Graphics Amplifier port and strong chassis design will find the entry-level SKUs to be worth considering. Otherwise, there are quieter (and thicker) systems out there for users who want to configure with the GTX 1080 GPU.
The new chassis is incredibly well-designed and feels premium to the touch. Just note that the GTX 1080 is pushing the limit of what the notebook's cooling solution can effectively handle.
Alienware 17 R4
- 05/03/2017 v6 (old)
Allen Ngo
Price comparison
