Alienware 15 R3 Notebook Review
For the original German review, see here.
Alienware's parent company Dell offers a configurator for the Alienware 15 R3, but you cannot combine every hardware component. The German shop currently lists four base models based on Kaby Lake priced between 1649 and 2459 Euros (~$1748 and ~$2607), but you can easily increase the prices with upgrades.
There are some basic components for every model. The processor is a powerful Intel quad-core, either with (i7-7700HQ) or without Hyper-Threading (i5-7300HQ). The amount of DDR4-RAM is from 8 up to 32 GB (2400 or 2666 MHz), whereas the storage solution consists of a conventional HDD or a combination of SSD and hard drive. Dell uses a Full HD panel, which is, depending on the refresh rate (60 or 120 Hz), based on the IPS or TN technology. Both models support G-Sync.
Dell also includes a high-end GPU from Nvidia's Pascal generation. While the GeForce GTX 1060 is equipped with 6 GB GDDR5-VRAM, the GeForce GTX 1070 comes with 8 GB GDDR5. The current high-end model GeForce GTX 1080 is reserved for the 17-inch sibling Alienware 17 R4, which can also be equipped with an AMD GPU (R9 470).
But back to the 15-inch model. Wireless communications are handled by the Killer chips 1435 or 1535, and the latter is a free upgrade (as of February 2017). The same applies for the switch from the German to the English keyboard layout. You will have to pay more for an upgrade from Windows 10 Home to Windows 10 Pro. The other options are limited to the warranty and the software (Office, security).
Our test model represents the high-end configuration for 2459 Euros (~$2607).
Case
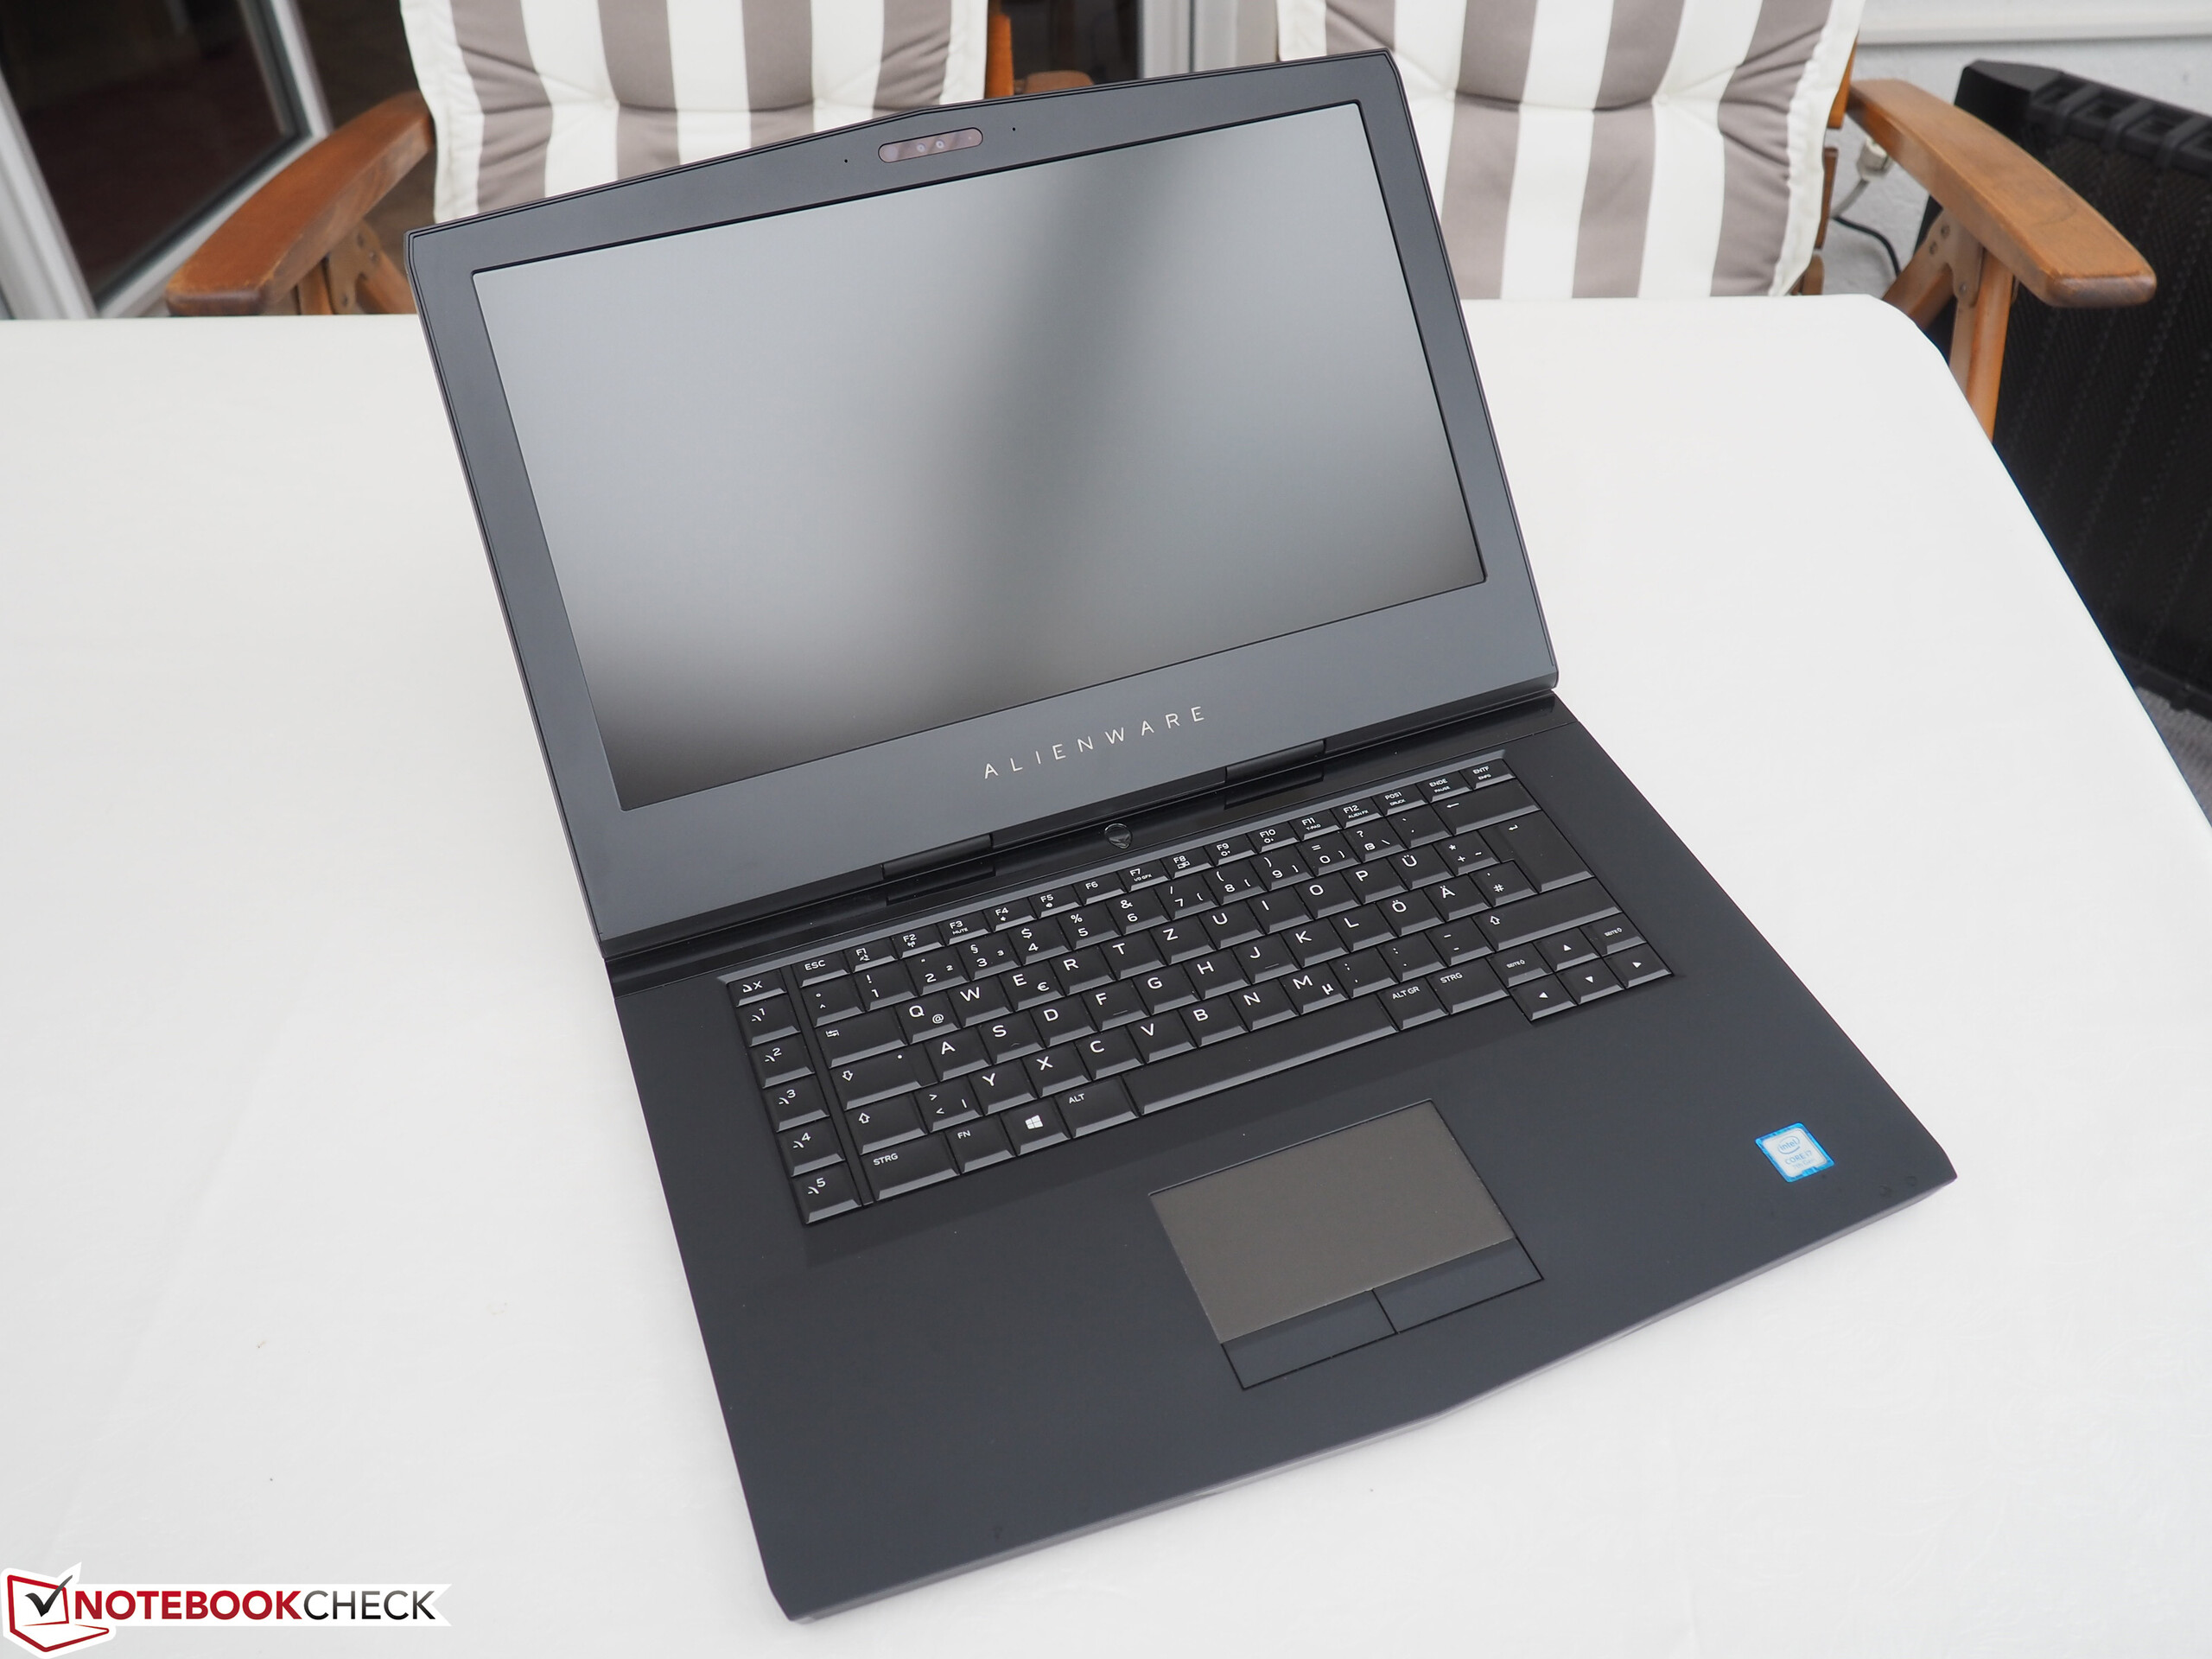
We start with the best news: The latest revision of the new gaming system also features the familiar Alienware quality. This is particularly true for the chassis, which is partly made of anodized aluminum as well as a magnesium alloy. Thanks to metal inlays on the lid and the notebook bottom, the 15-inch system features excellent stability that surpasses most competitors. One drawback is the weight: Around 3.5 kilograms is a lot, even for a high-end notebook. The previous Alienware 15 R2 (3.1 kg) is lighter, just like the GTX 1070 rivals MSI GT62VR 6RE and Schenker XMG P507 (2.9 kg). The Asus GL502VS even tips the scale at just 2.6 kg.
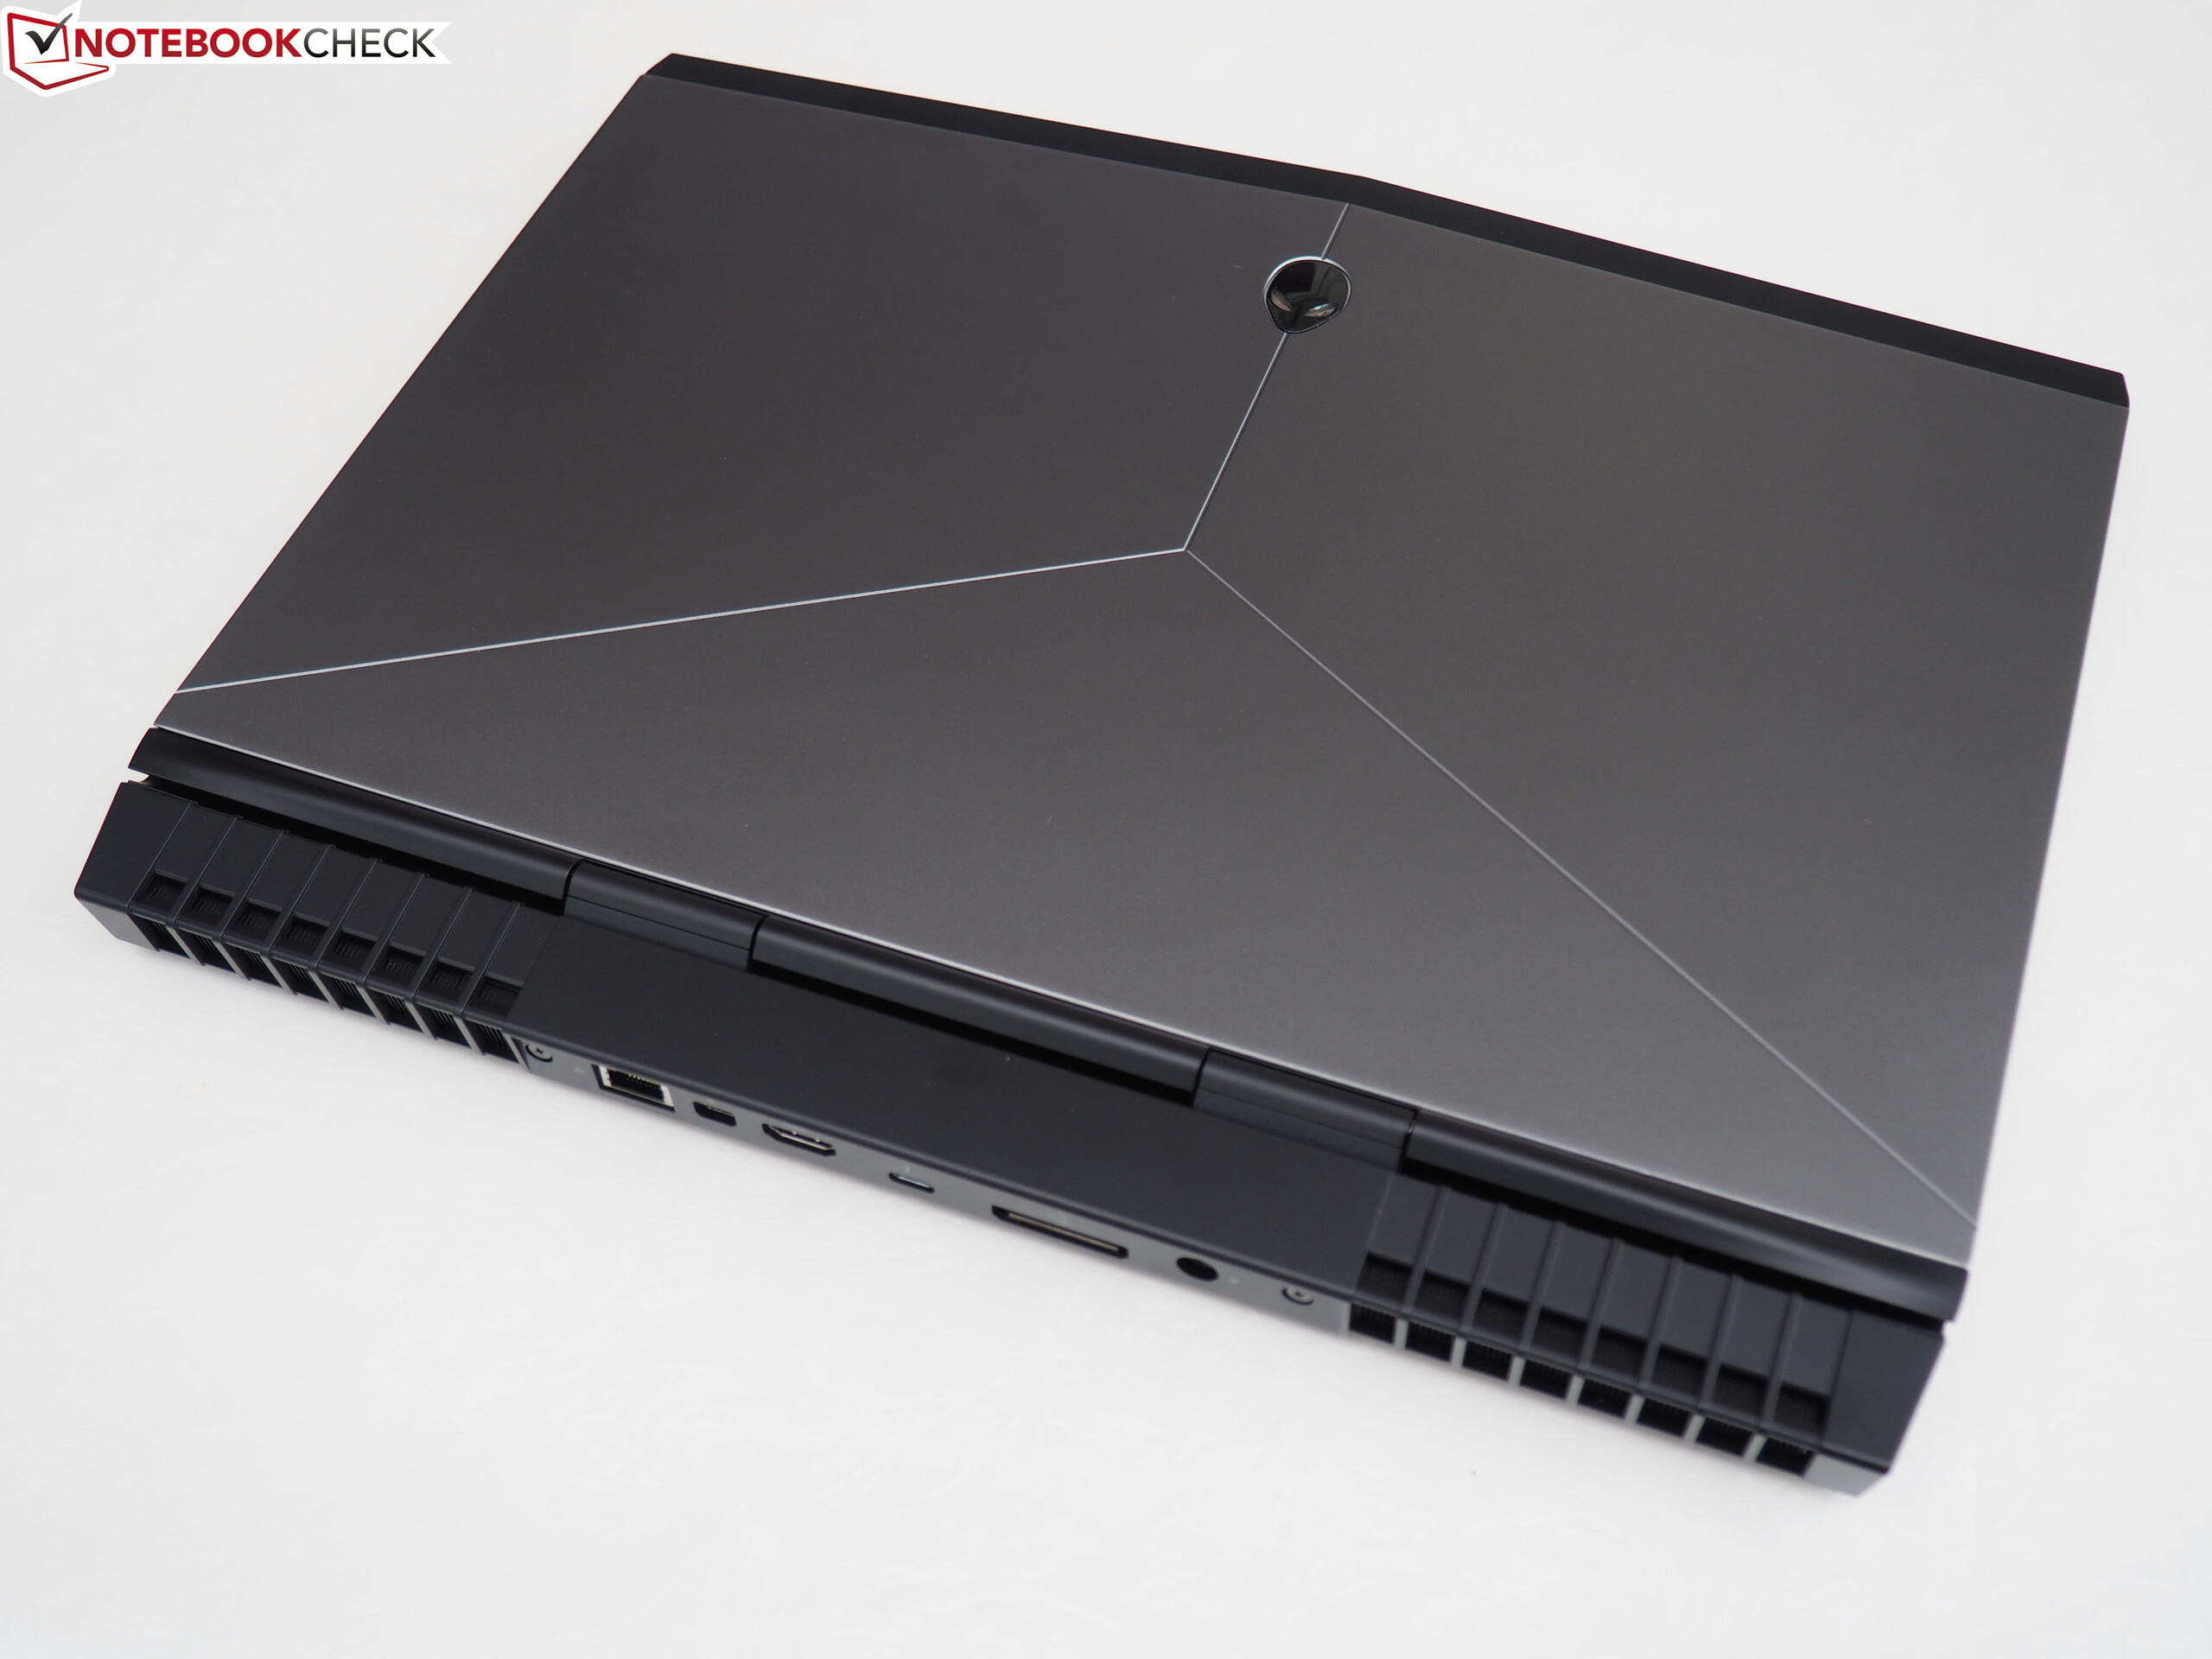
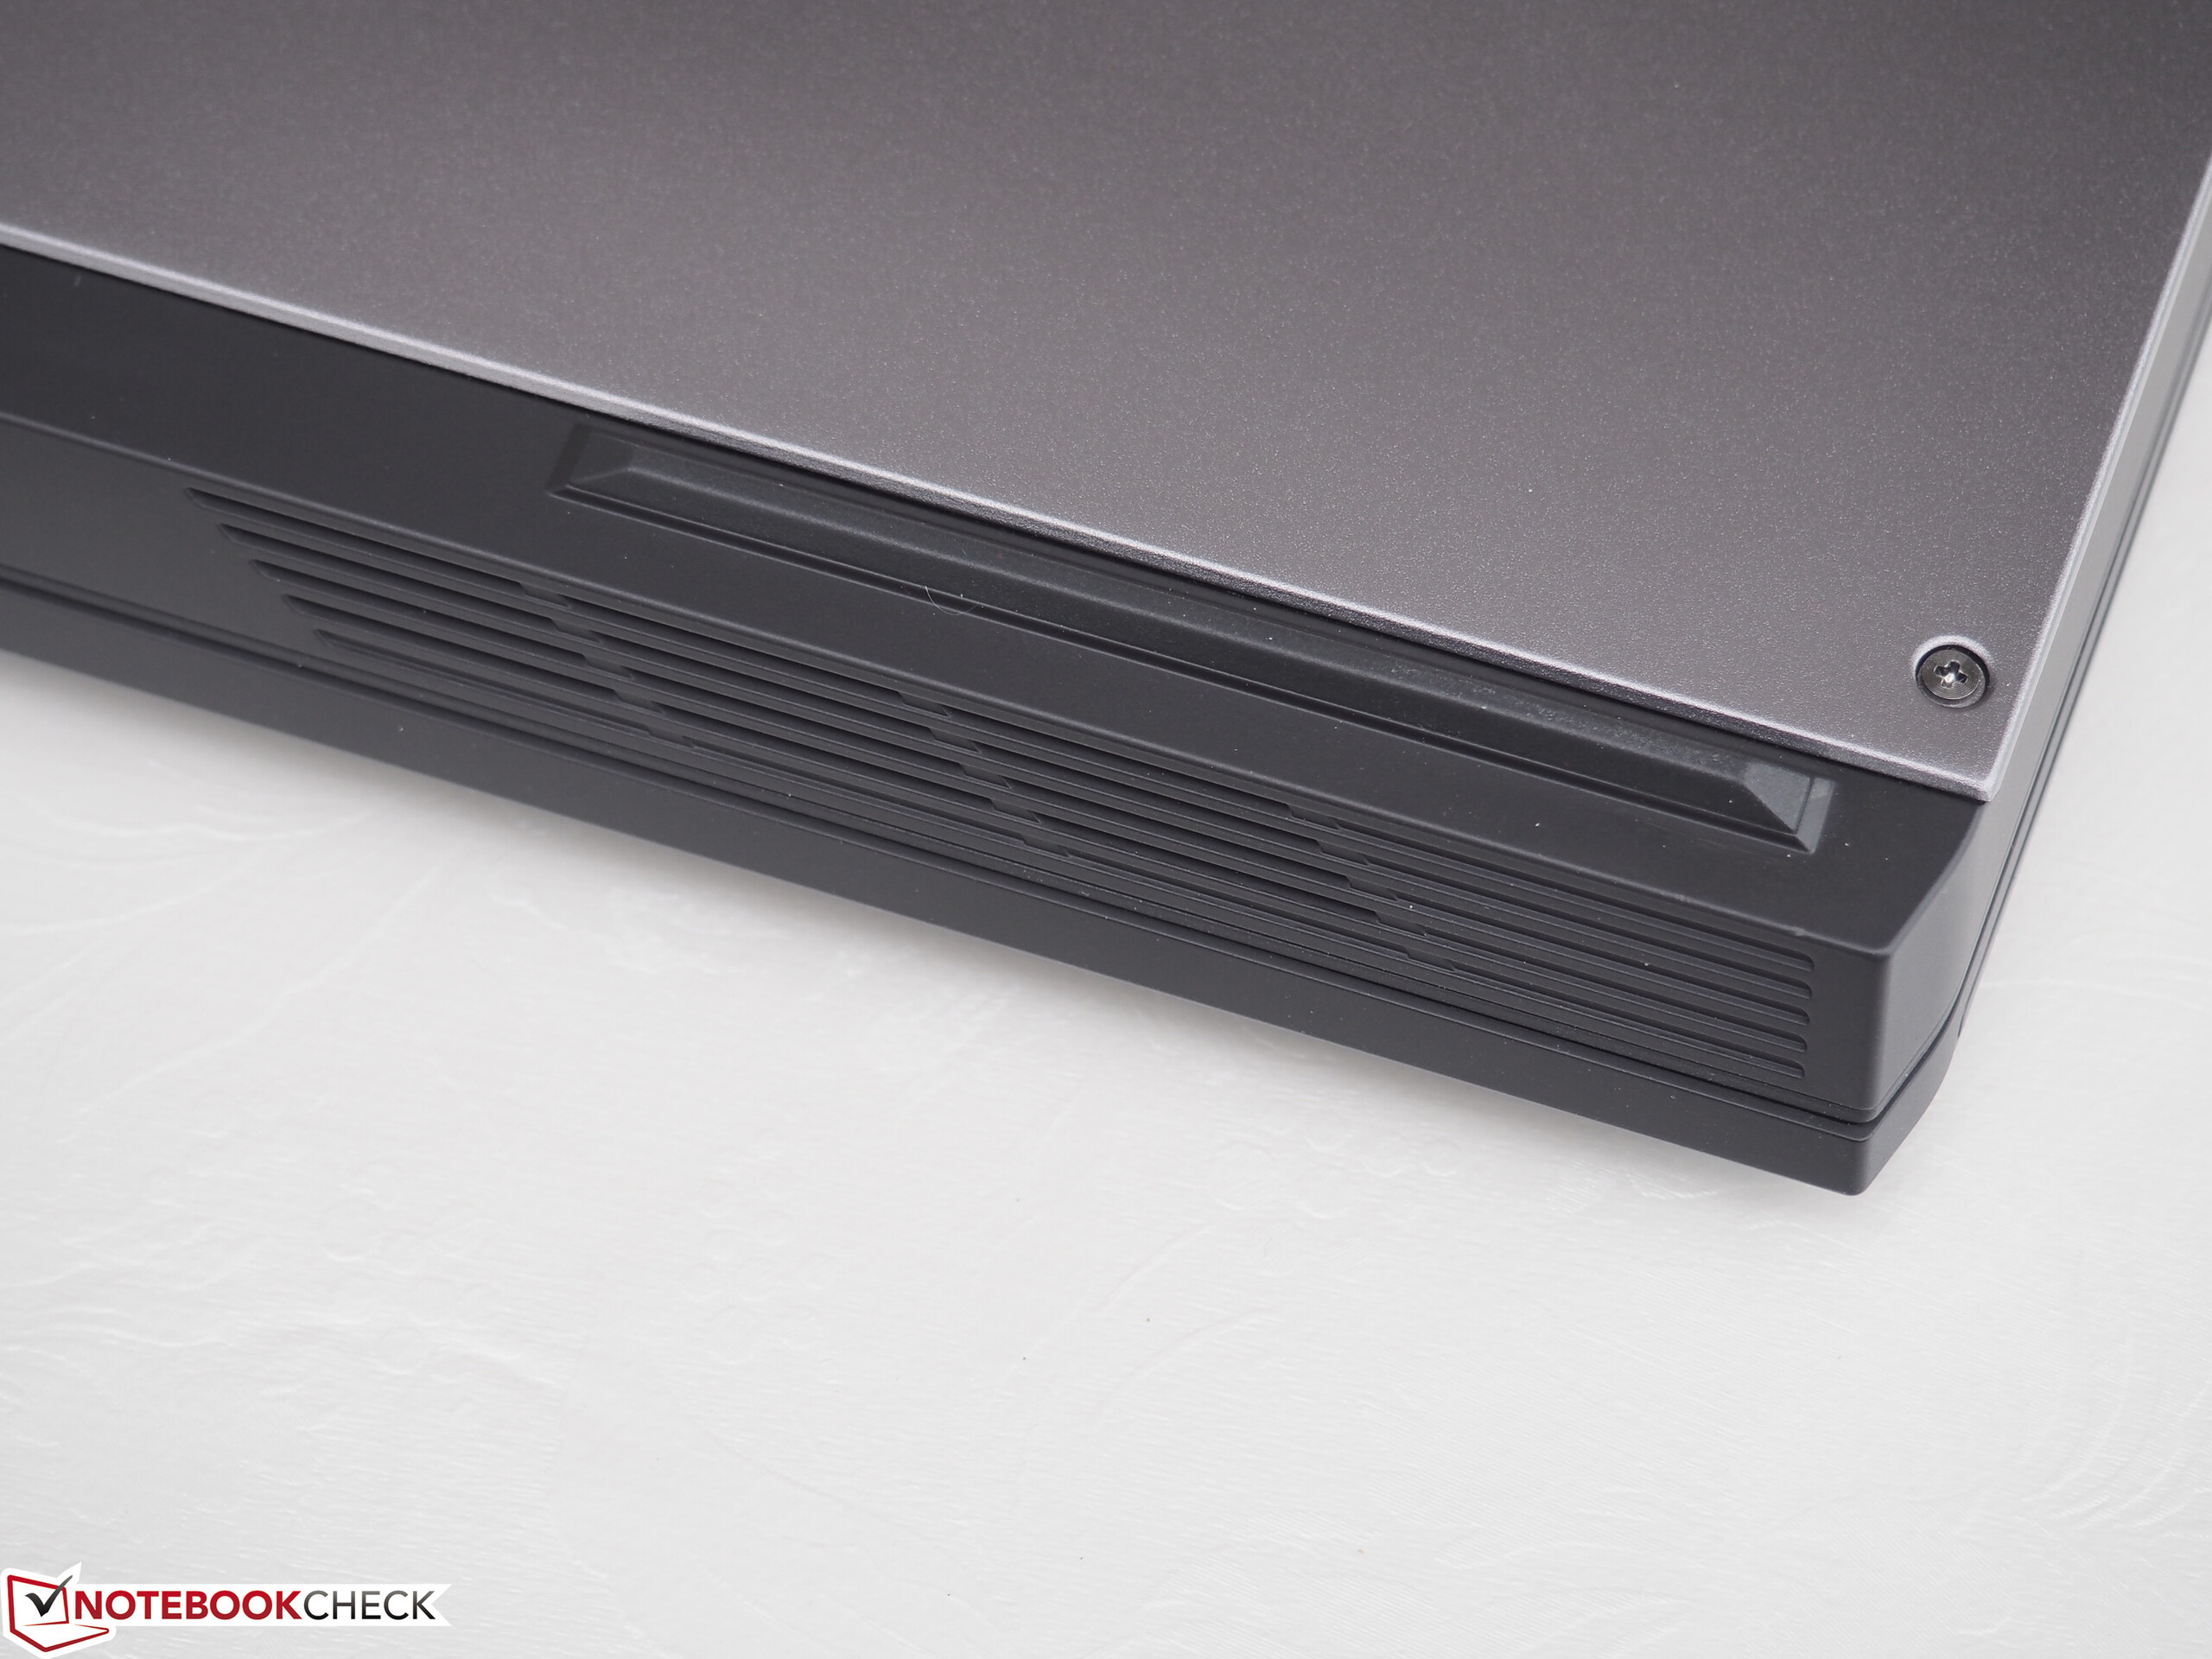
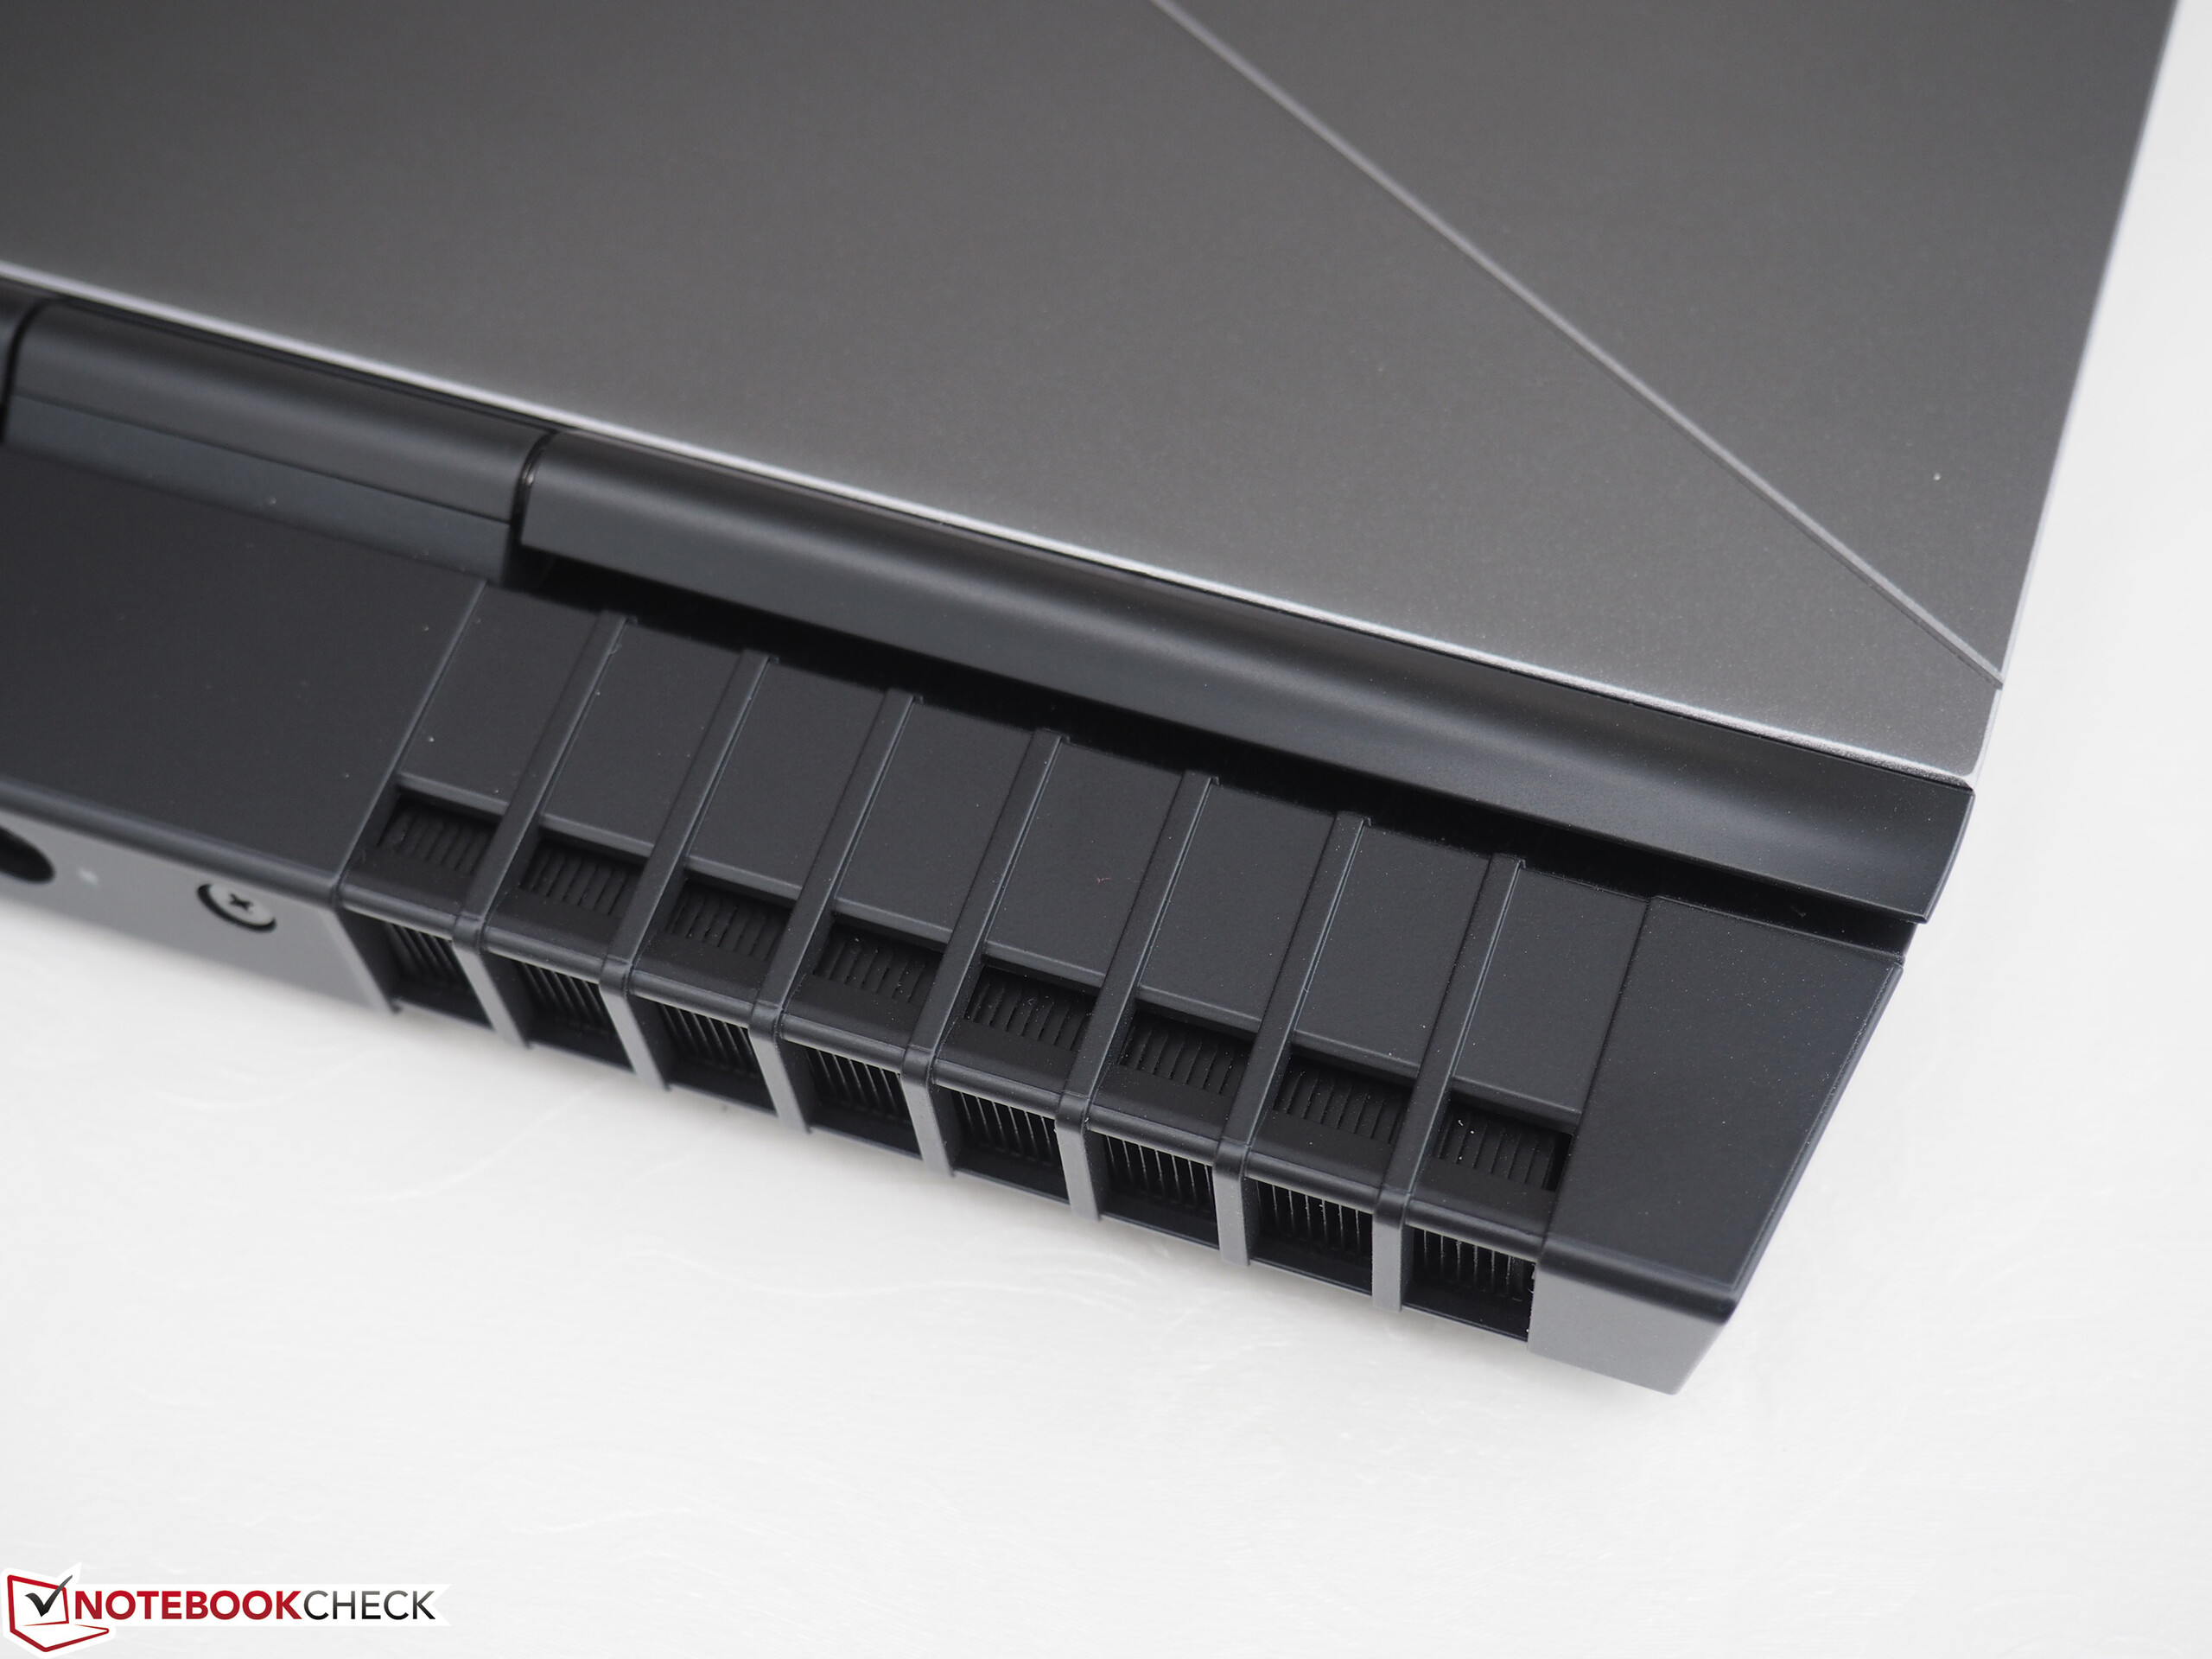
Another problem is the depth of the chassis. While the competition is about 27 centimeters, we can measure more than 30 centimeters on the Alienware 15 R3, which reminds us of a 17-inch system. The protruding fan area for better cooling (the hinge is shifted by about 3.5 centimeters) does not look that good.
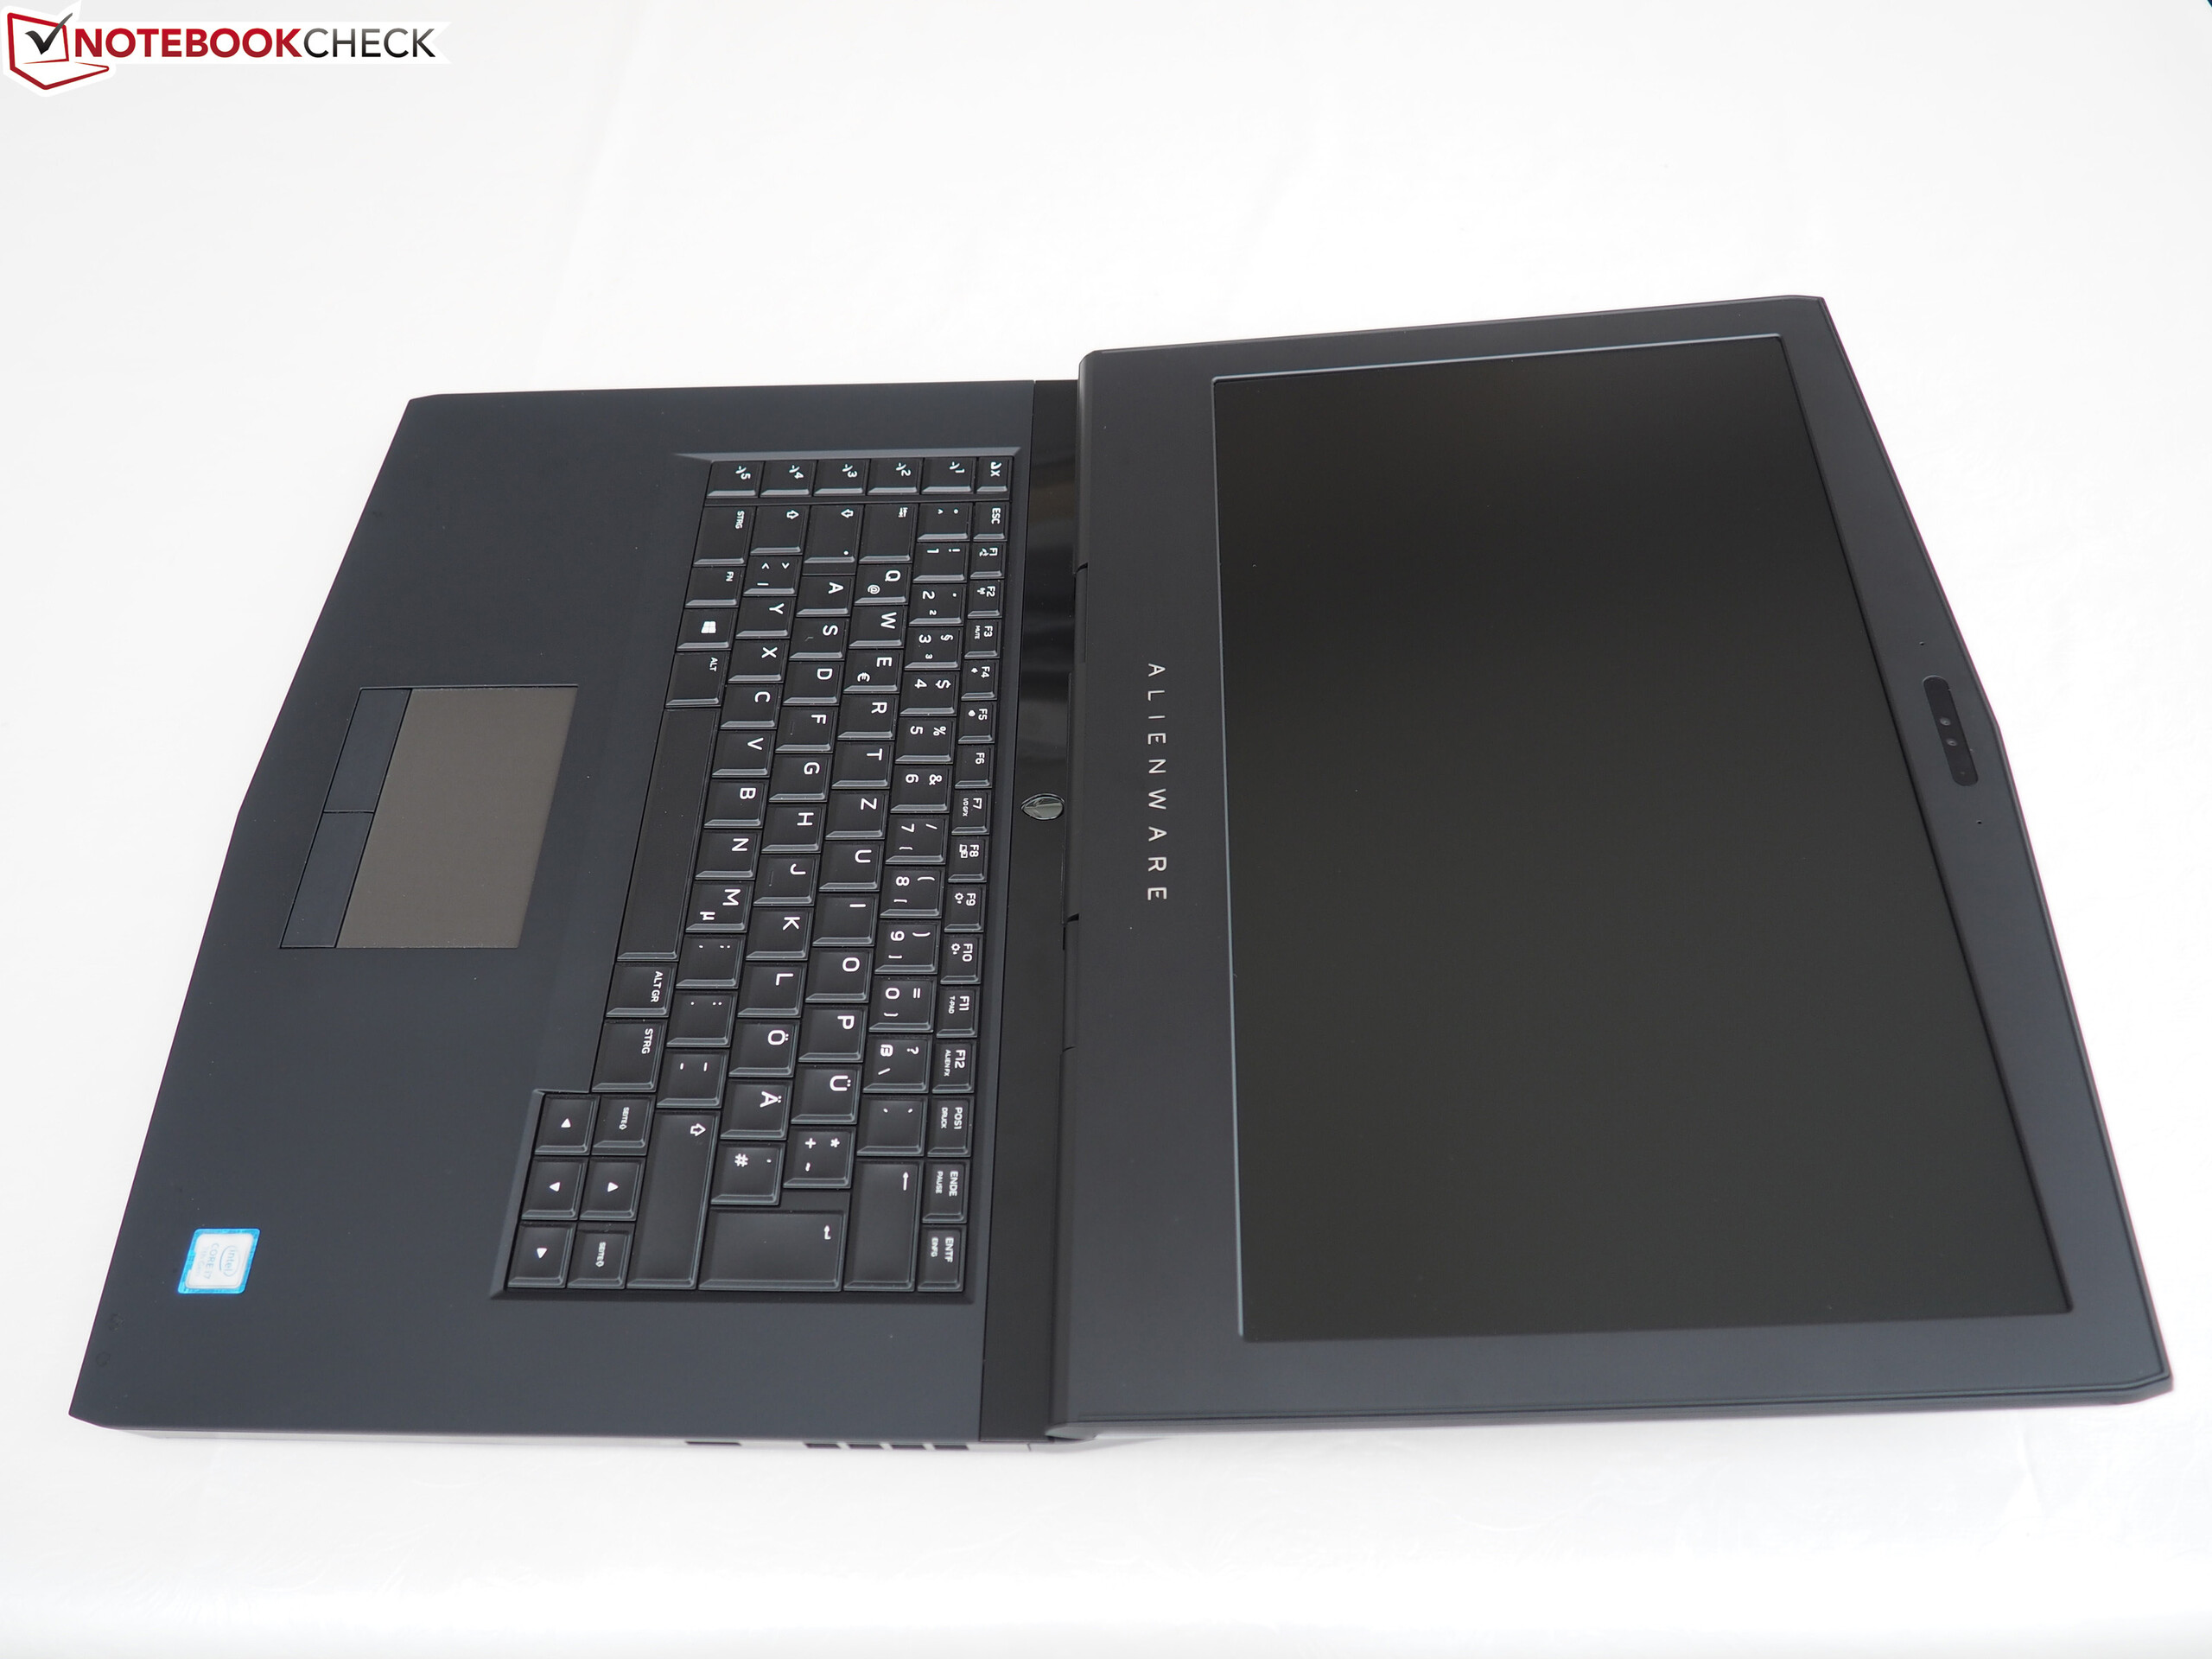
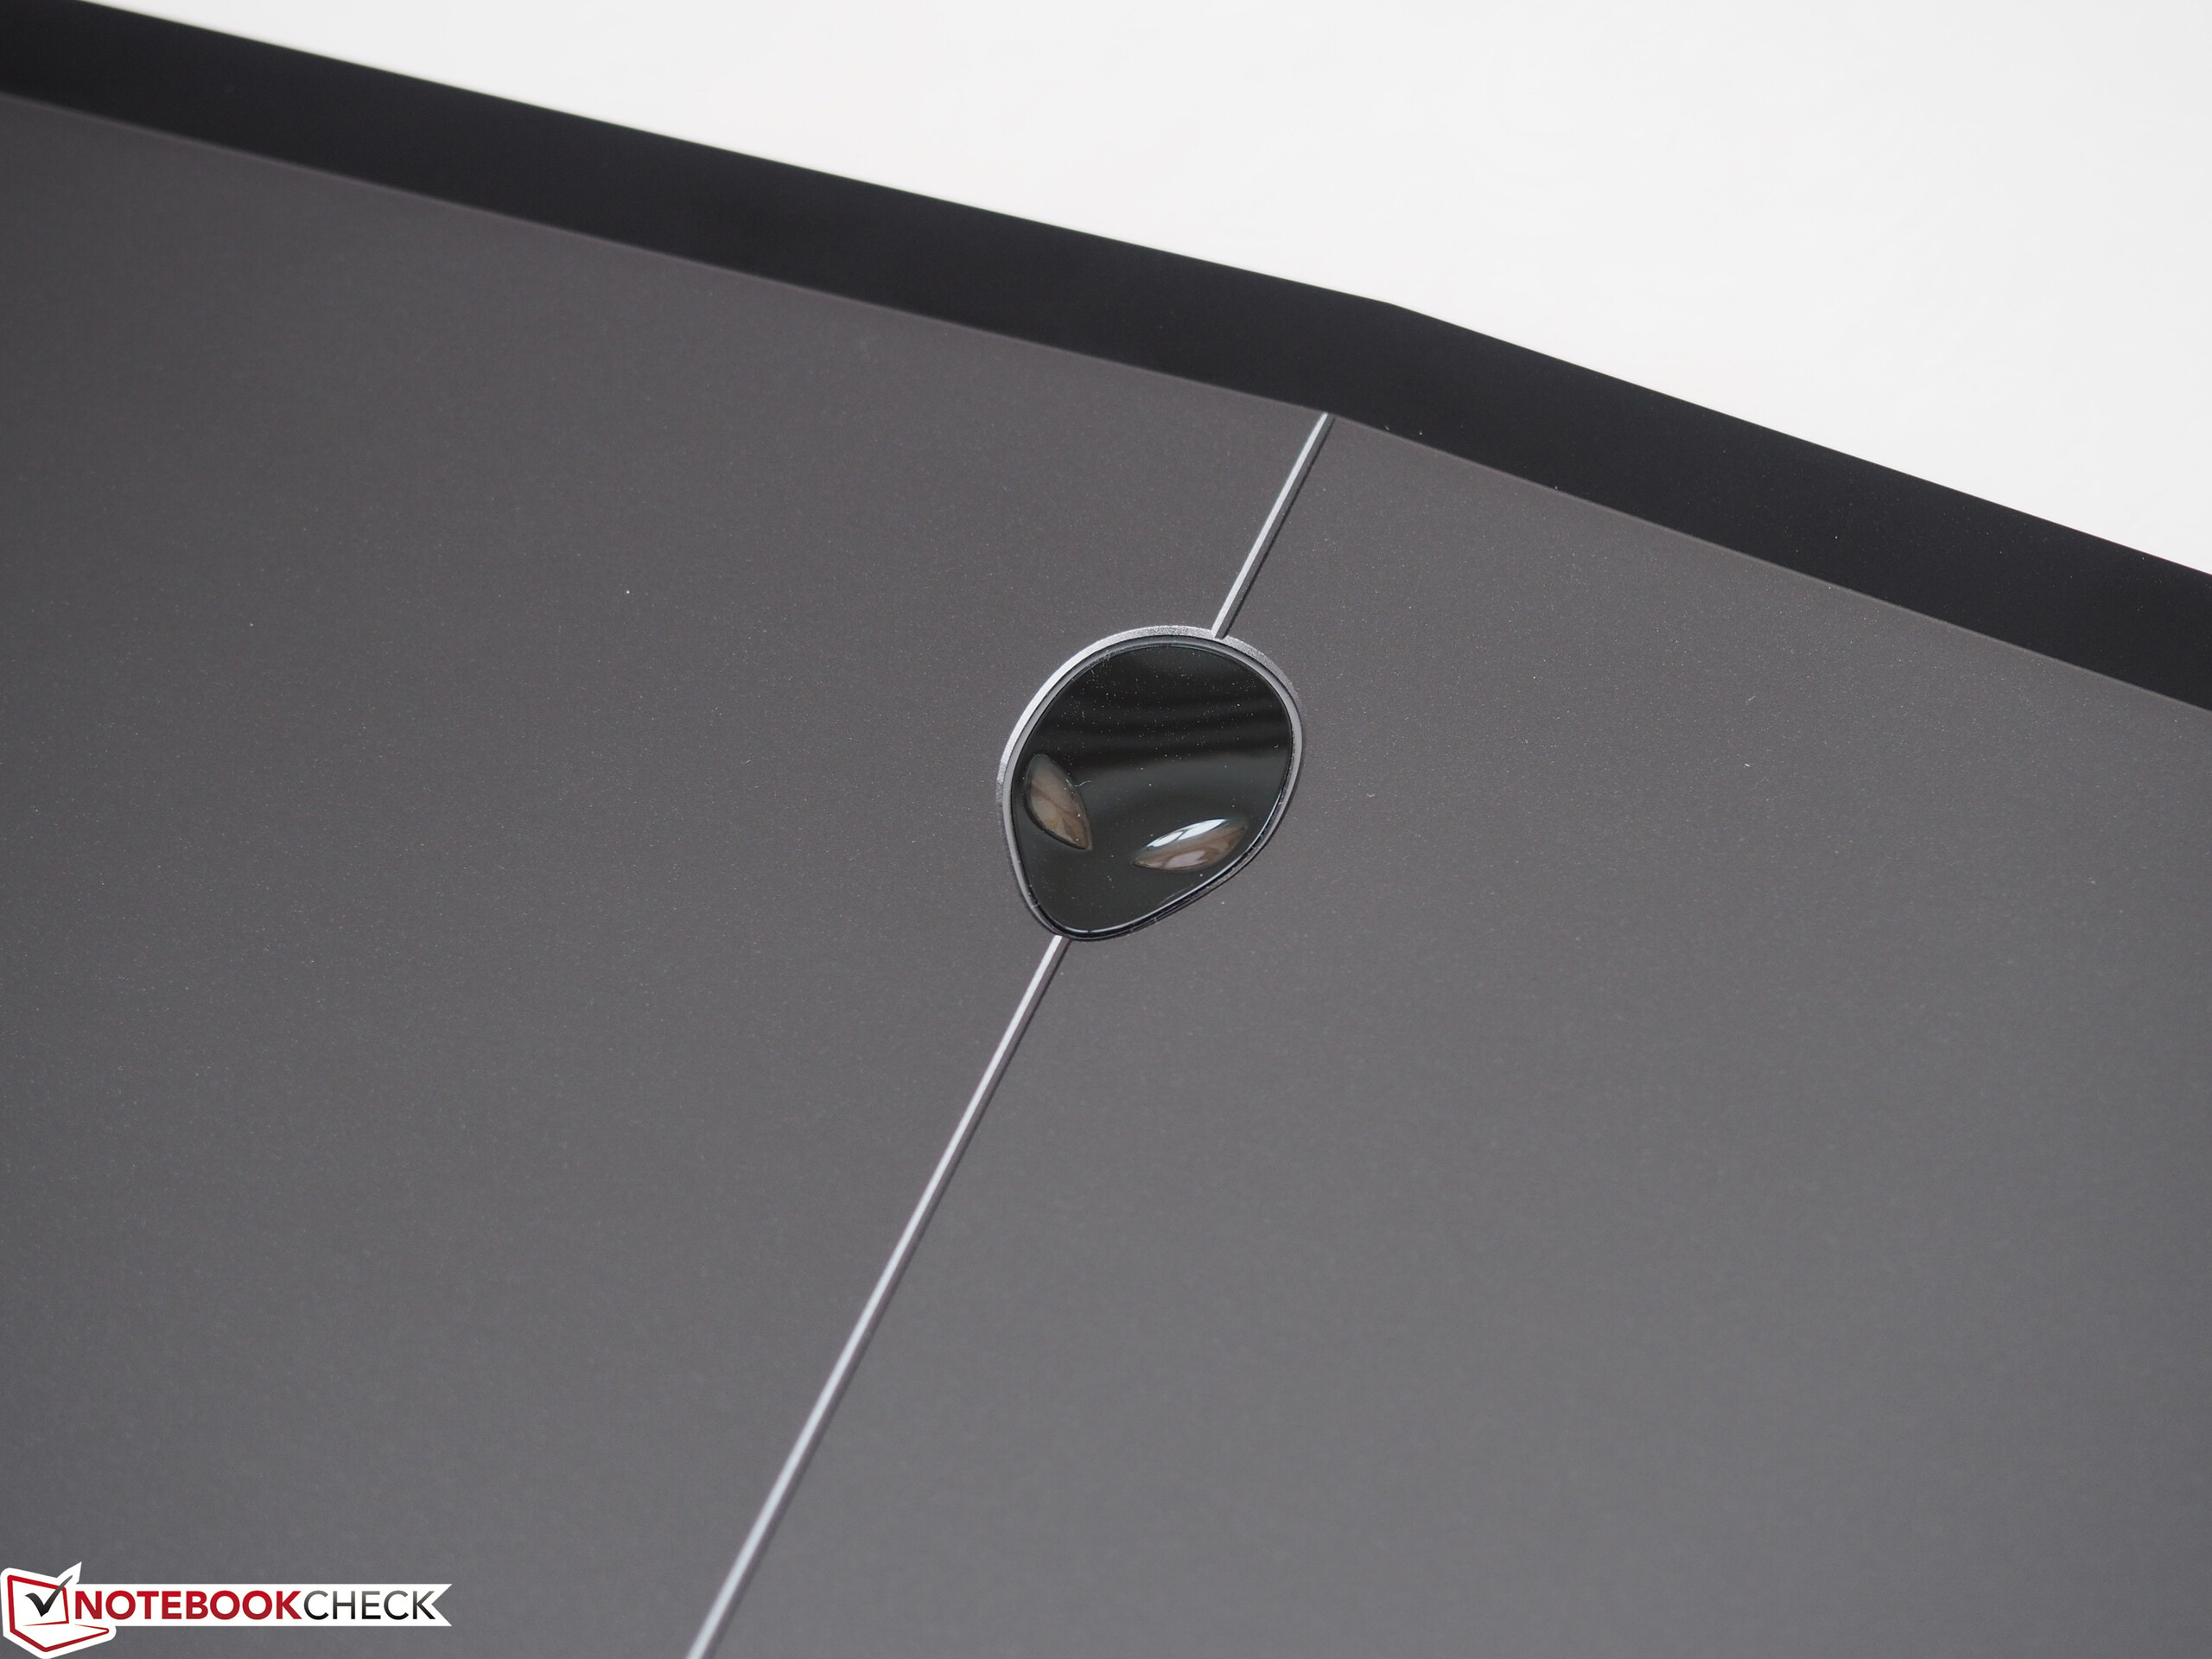
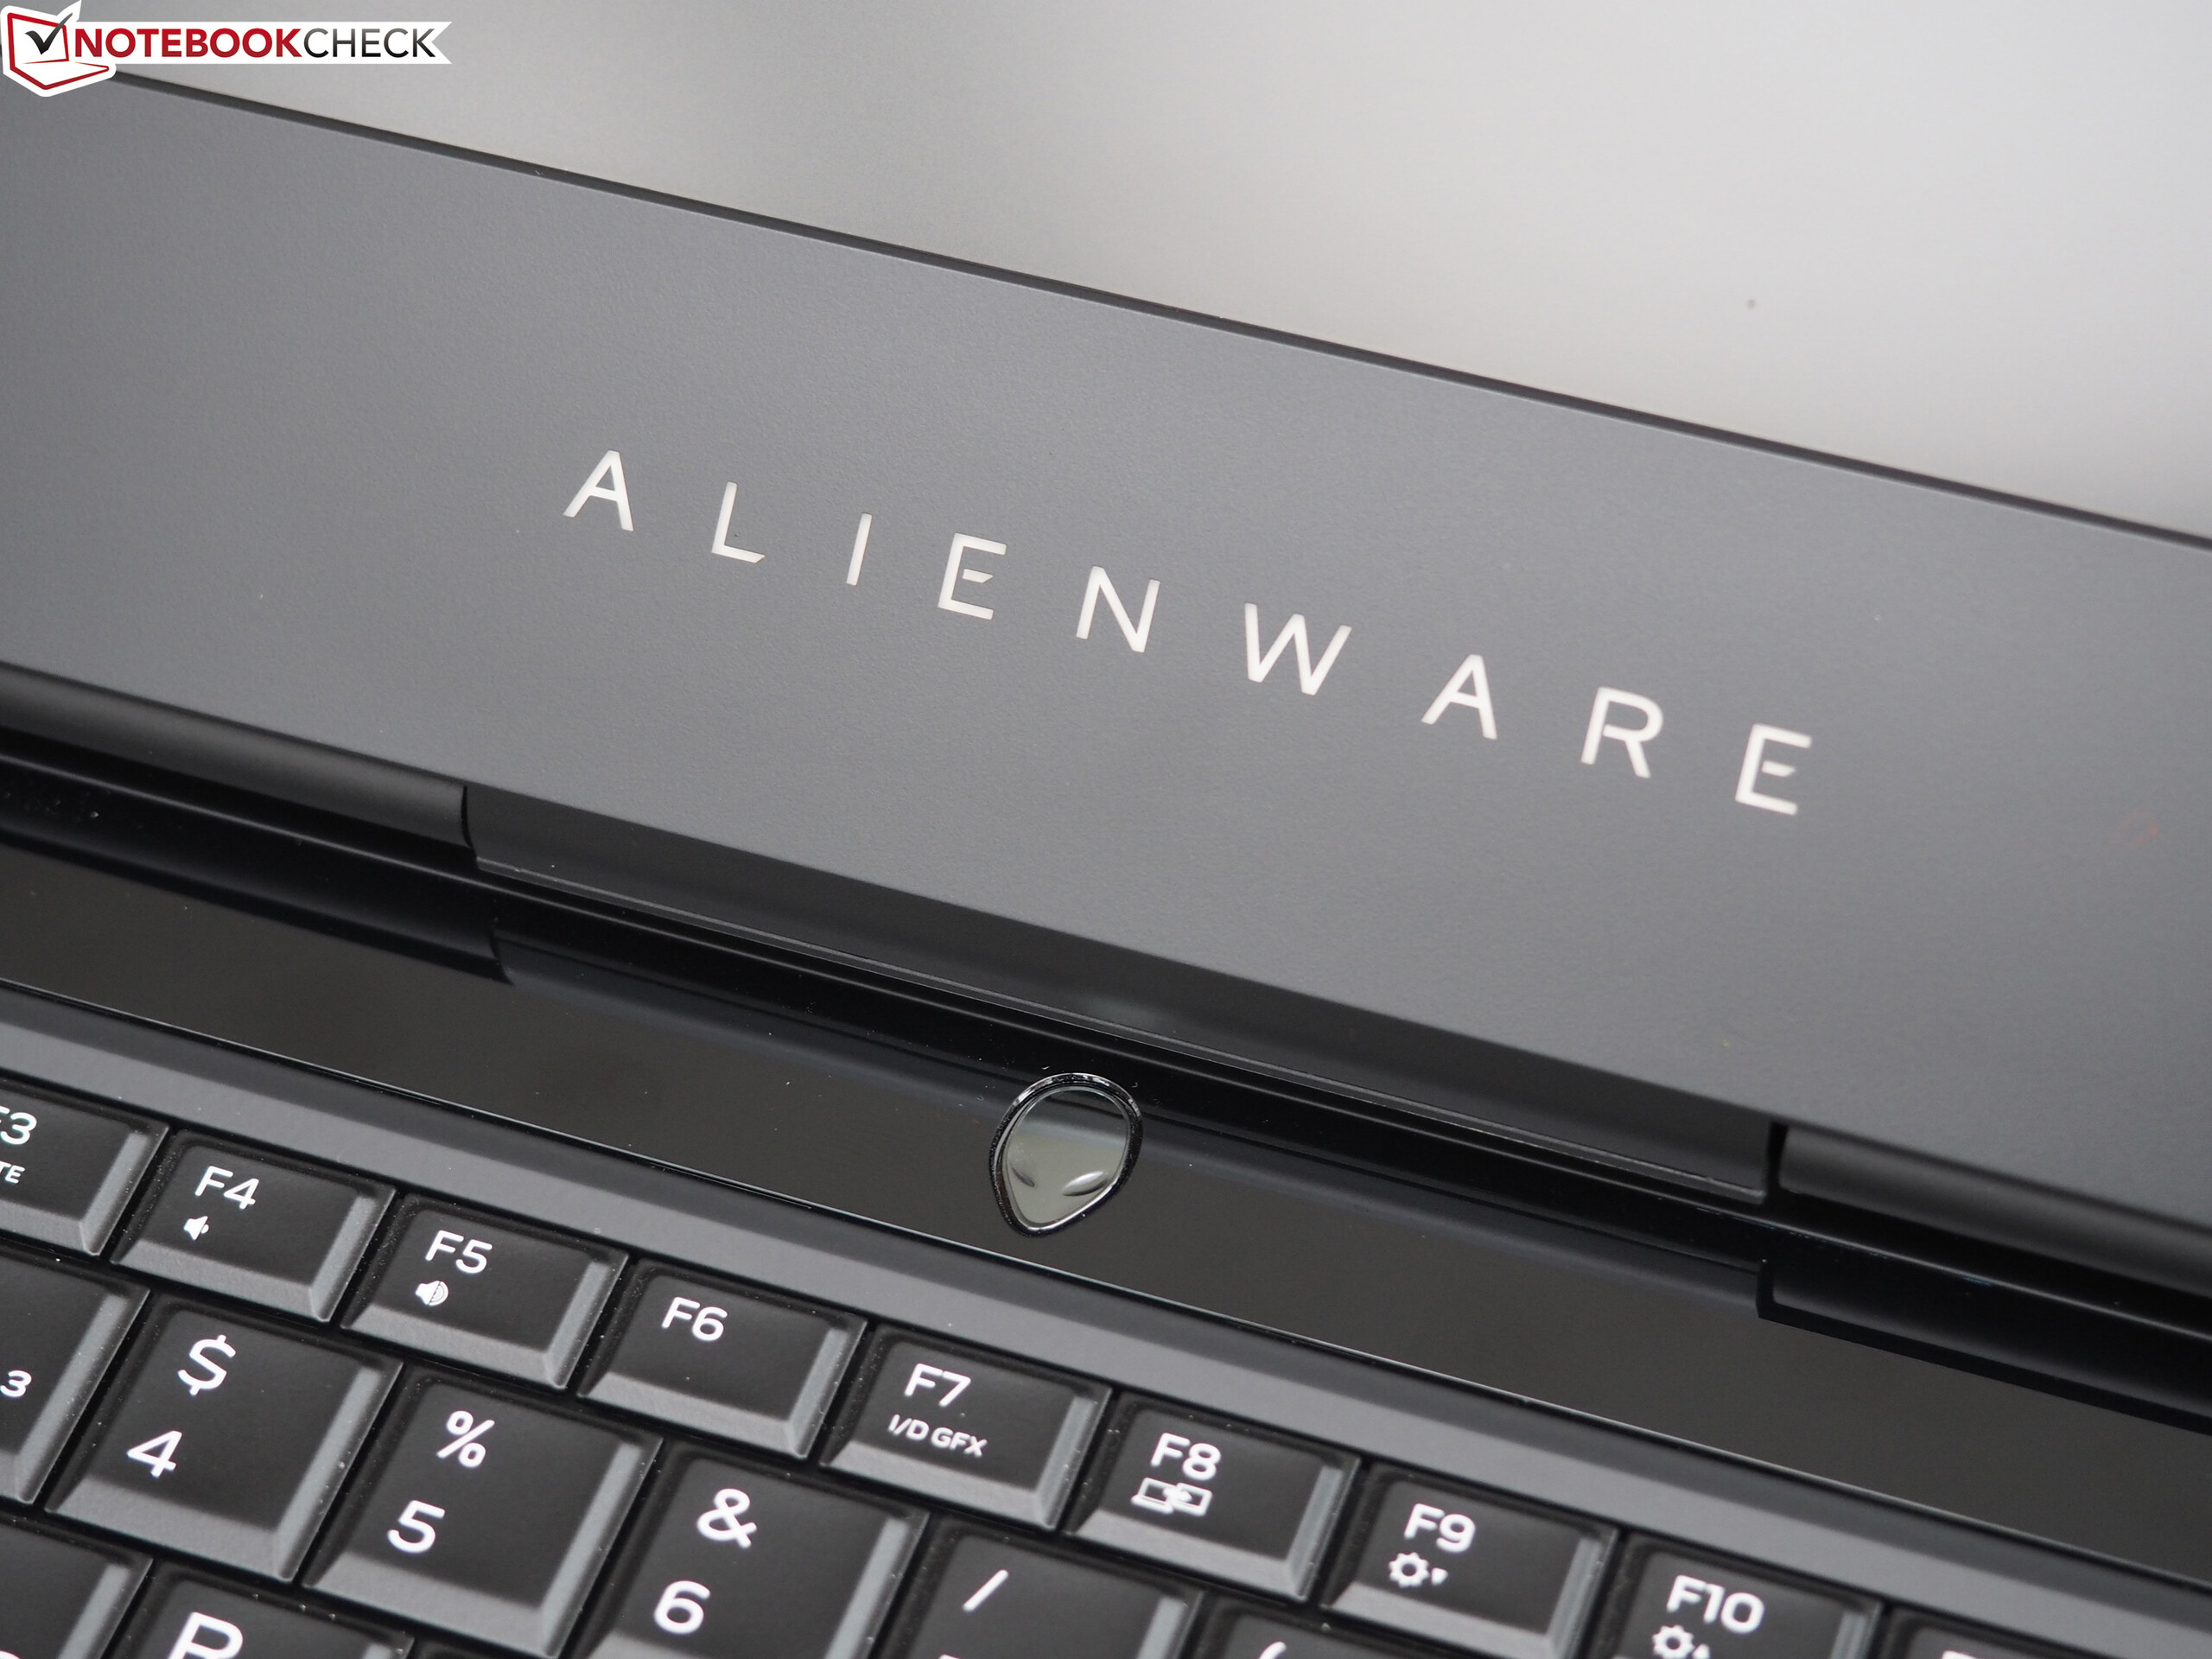
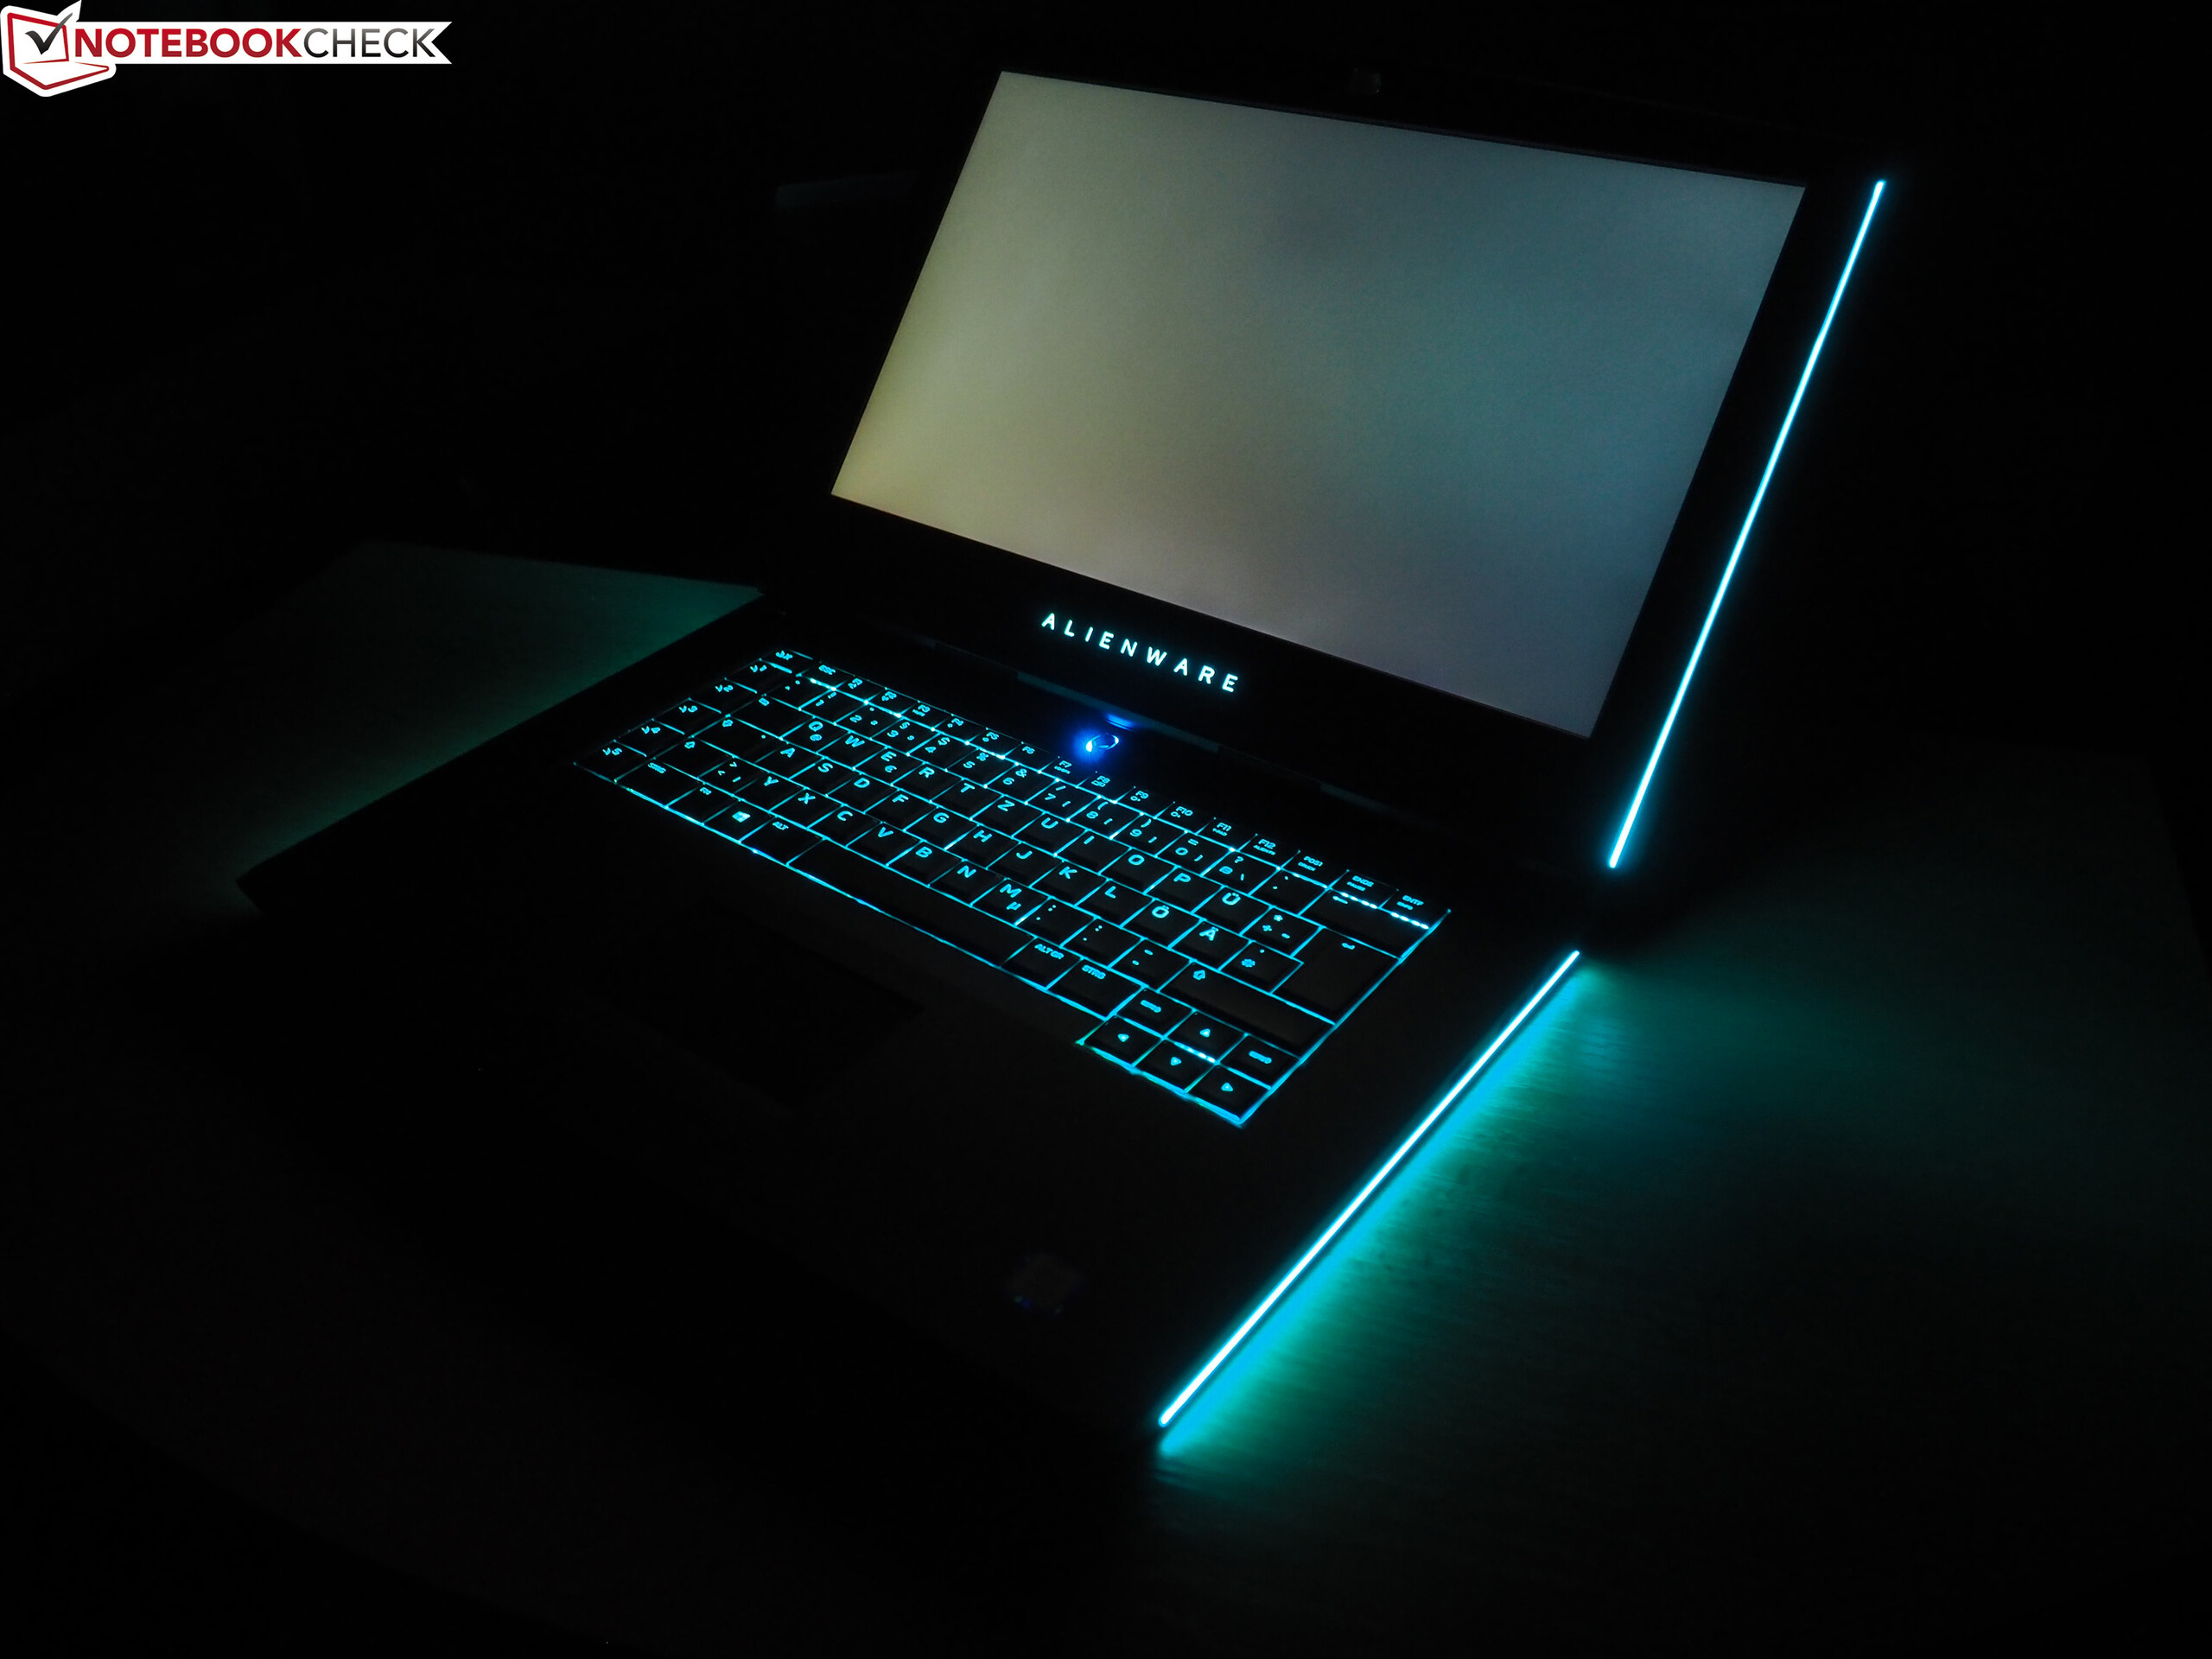
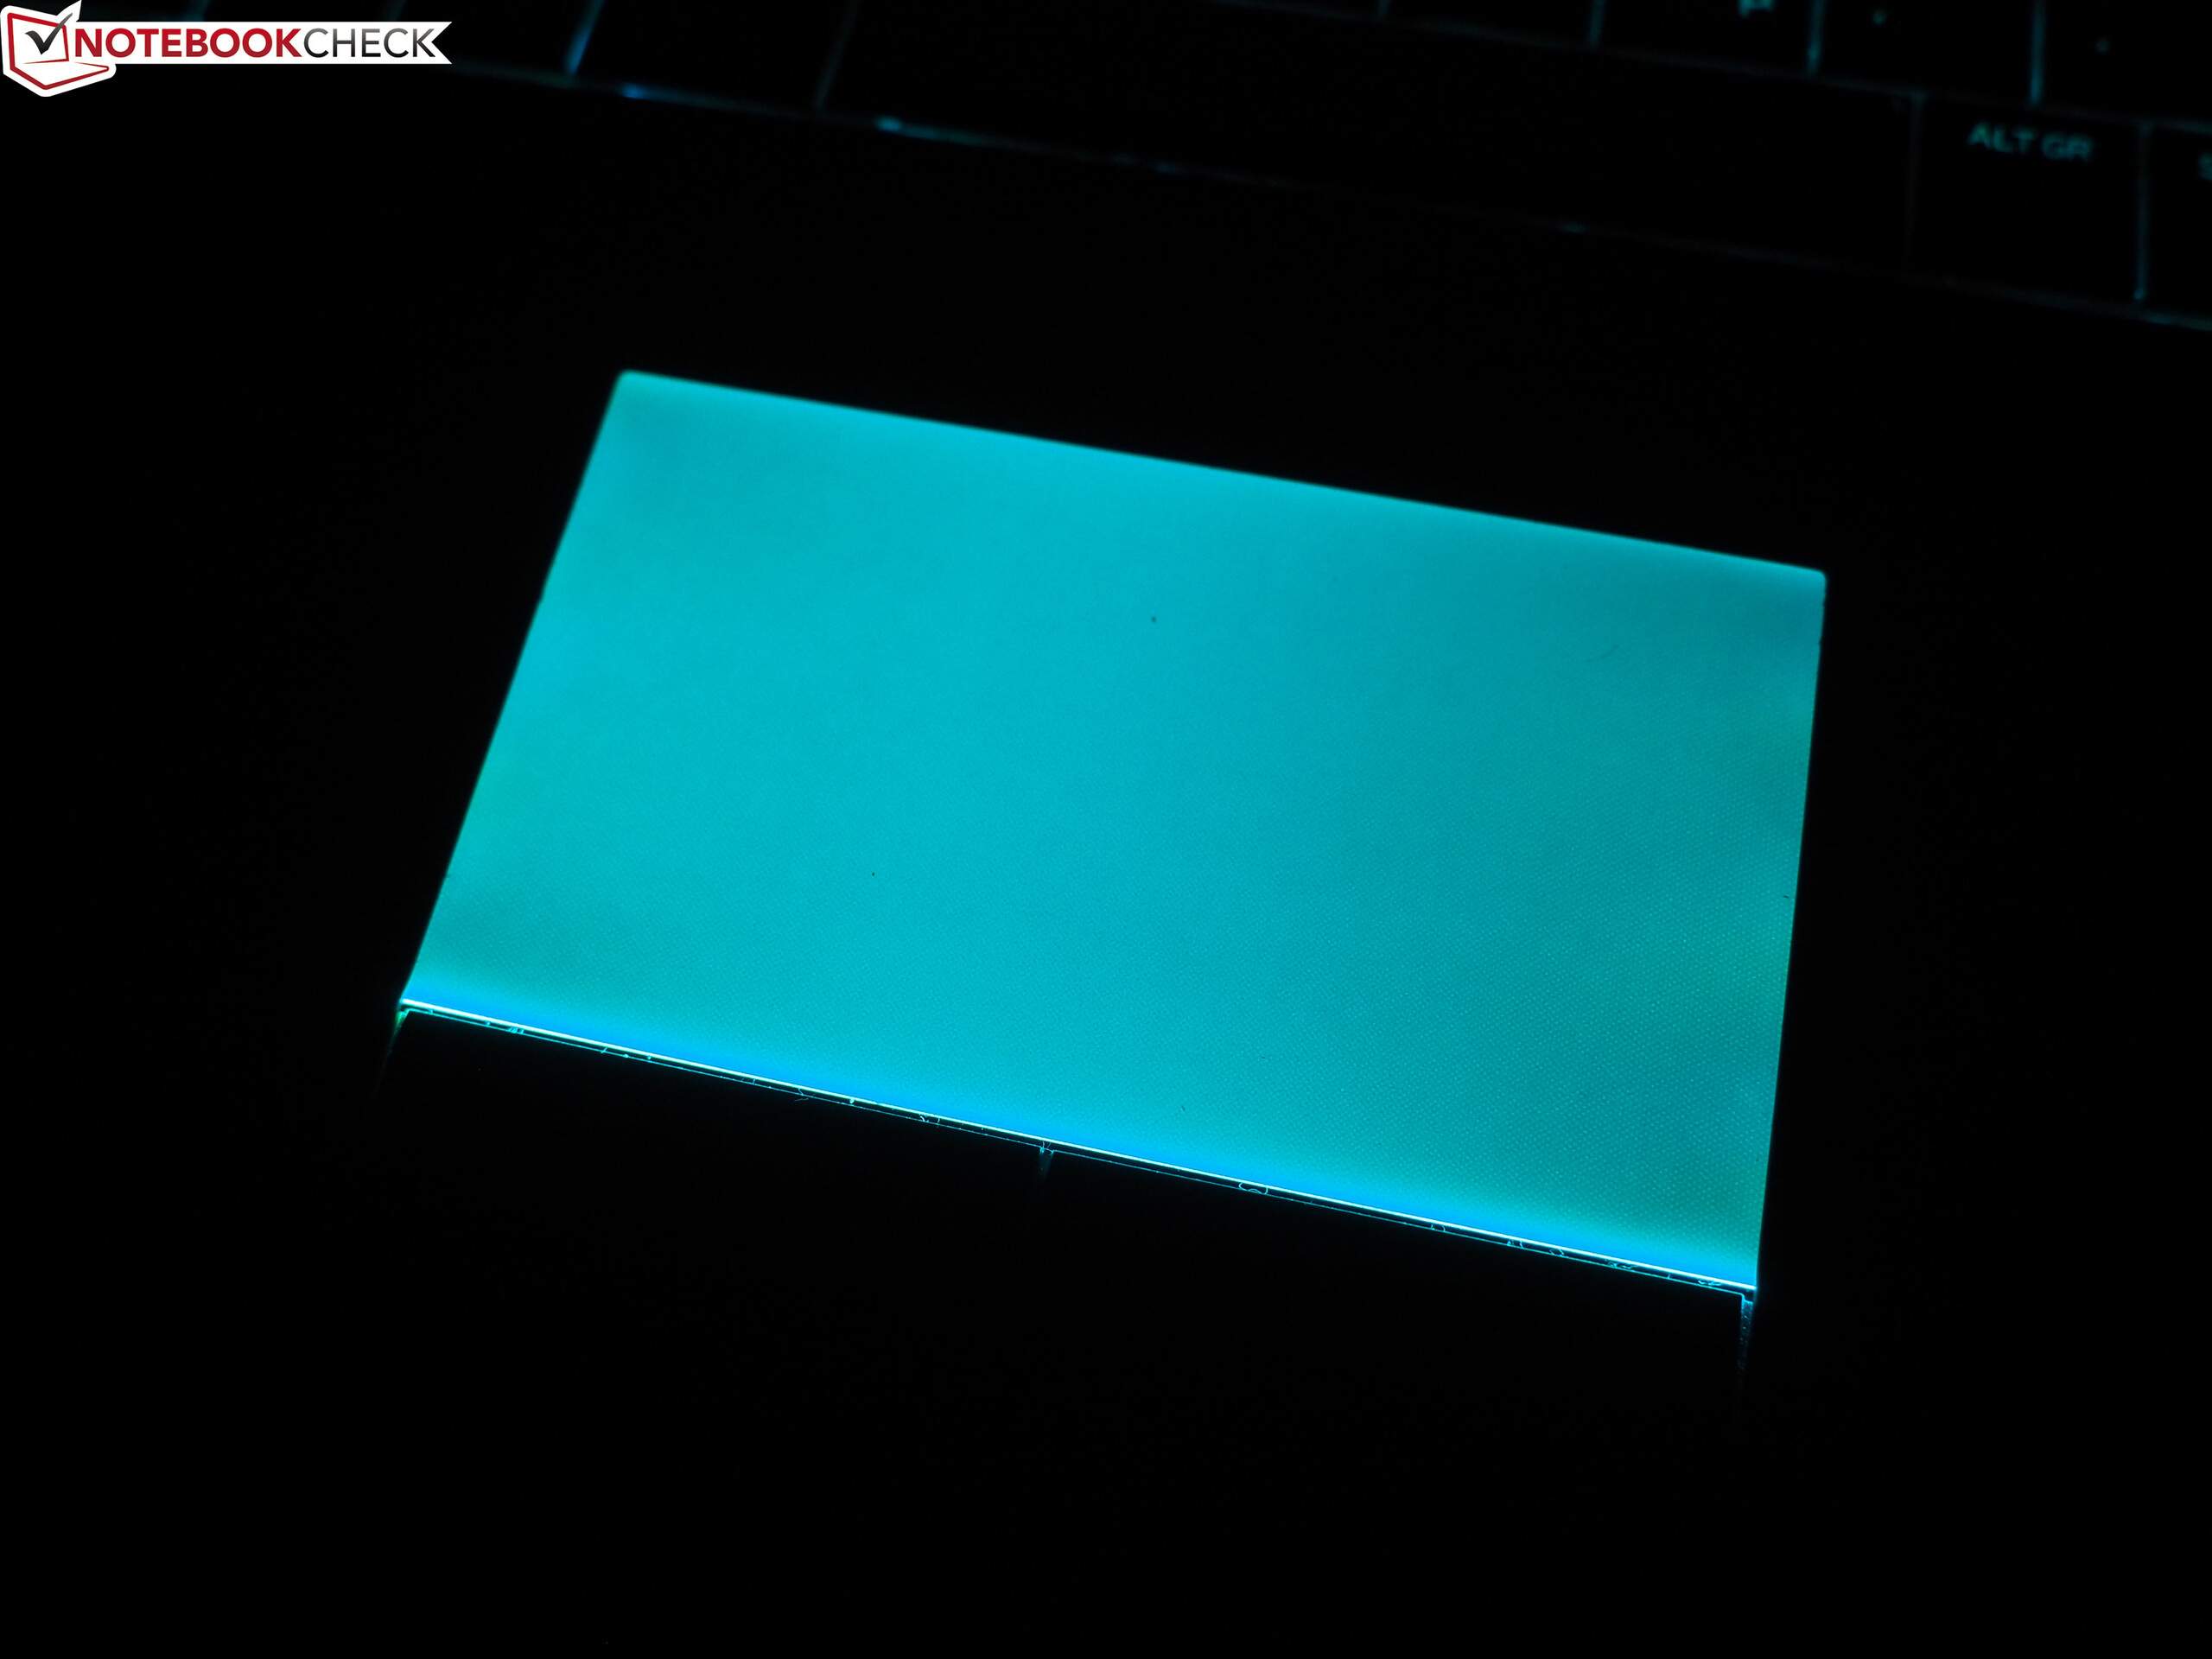
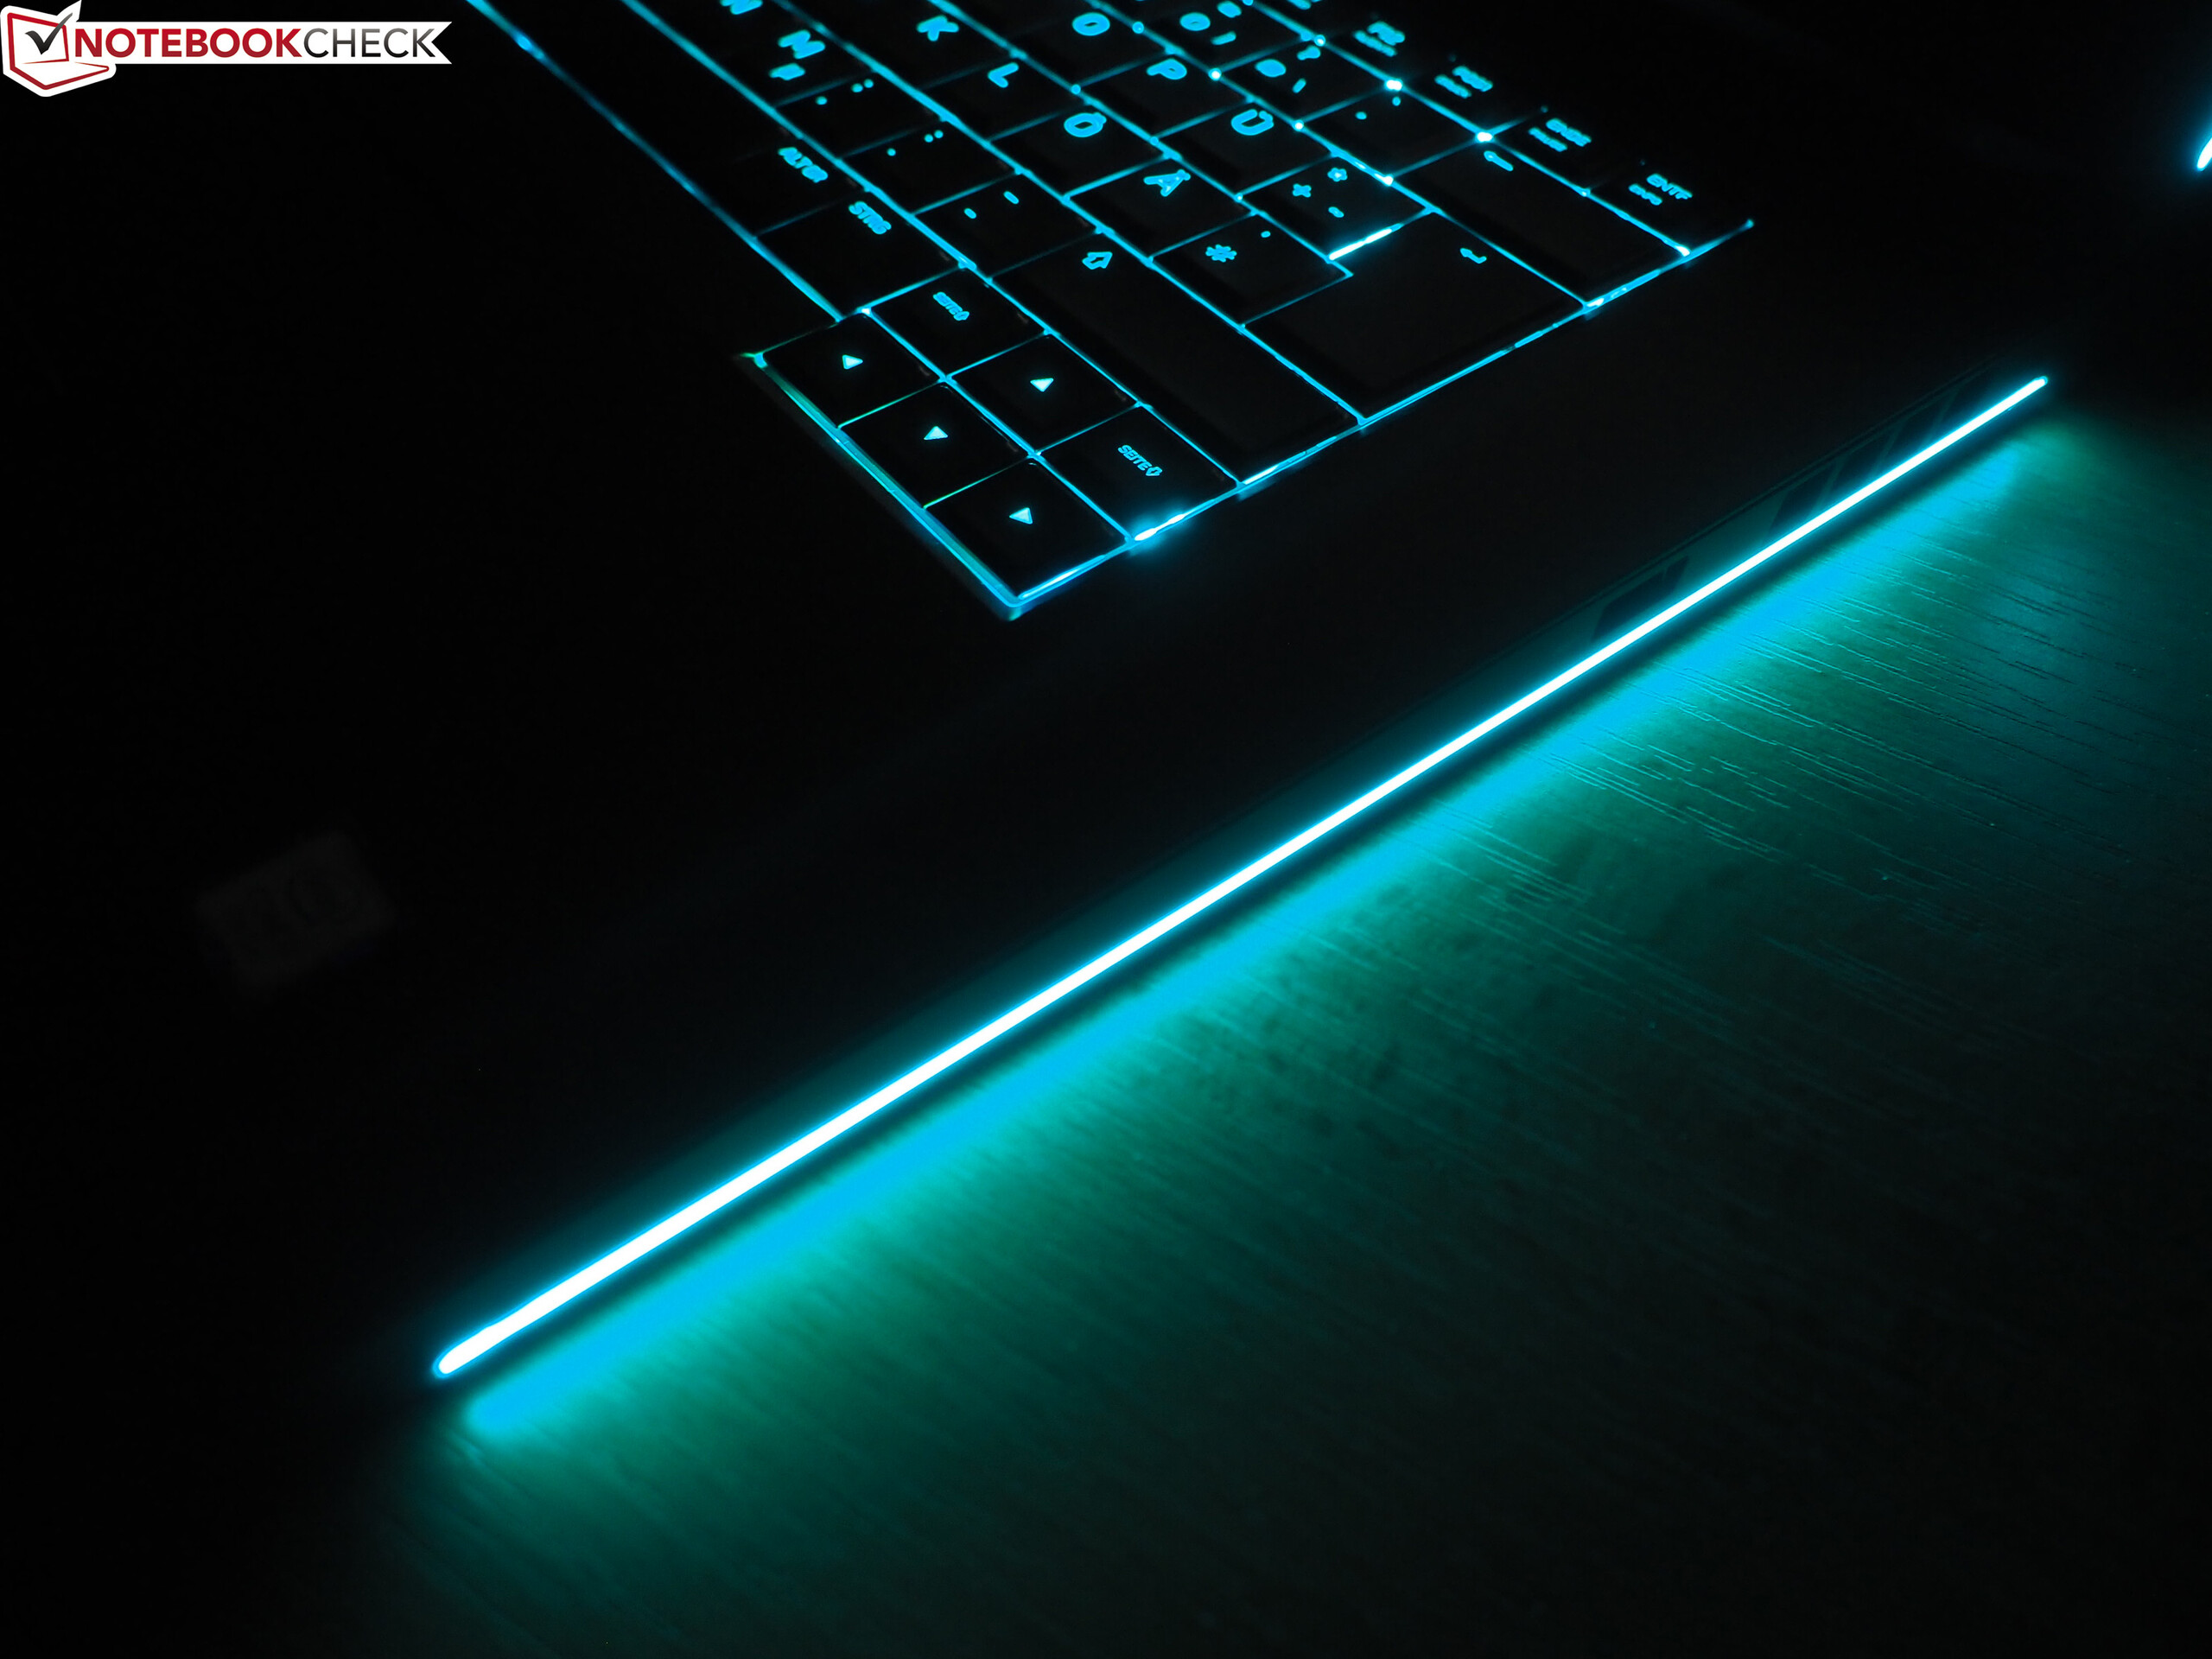
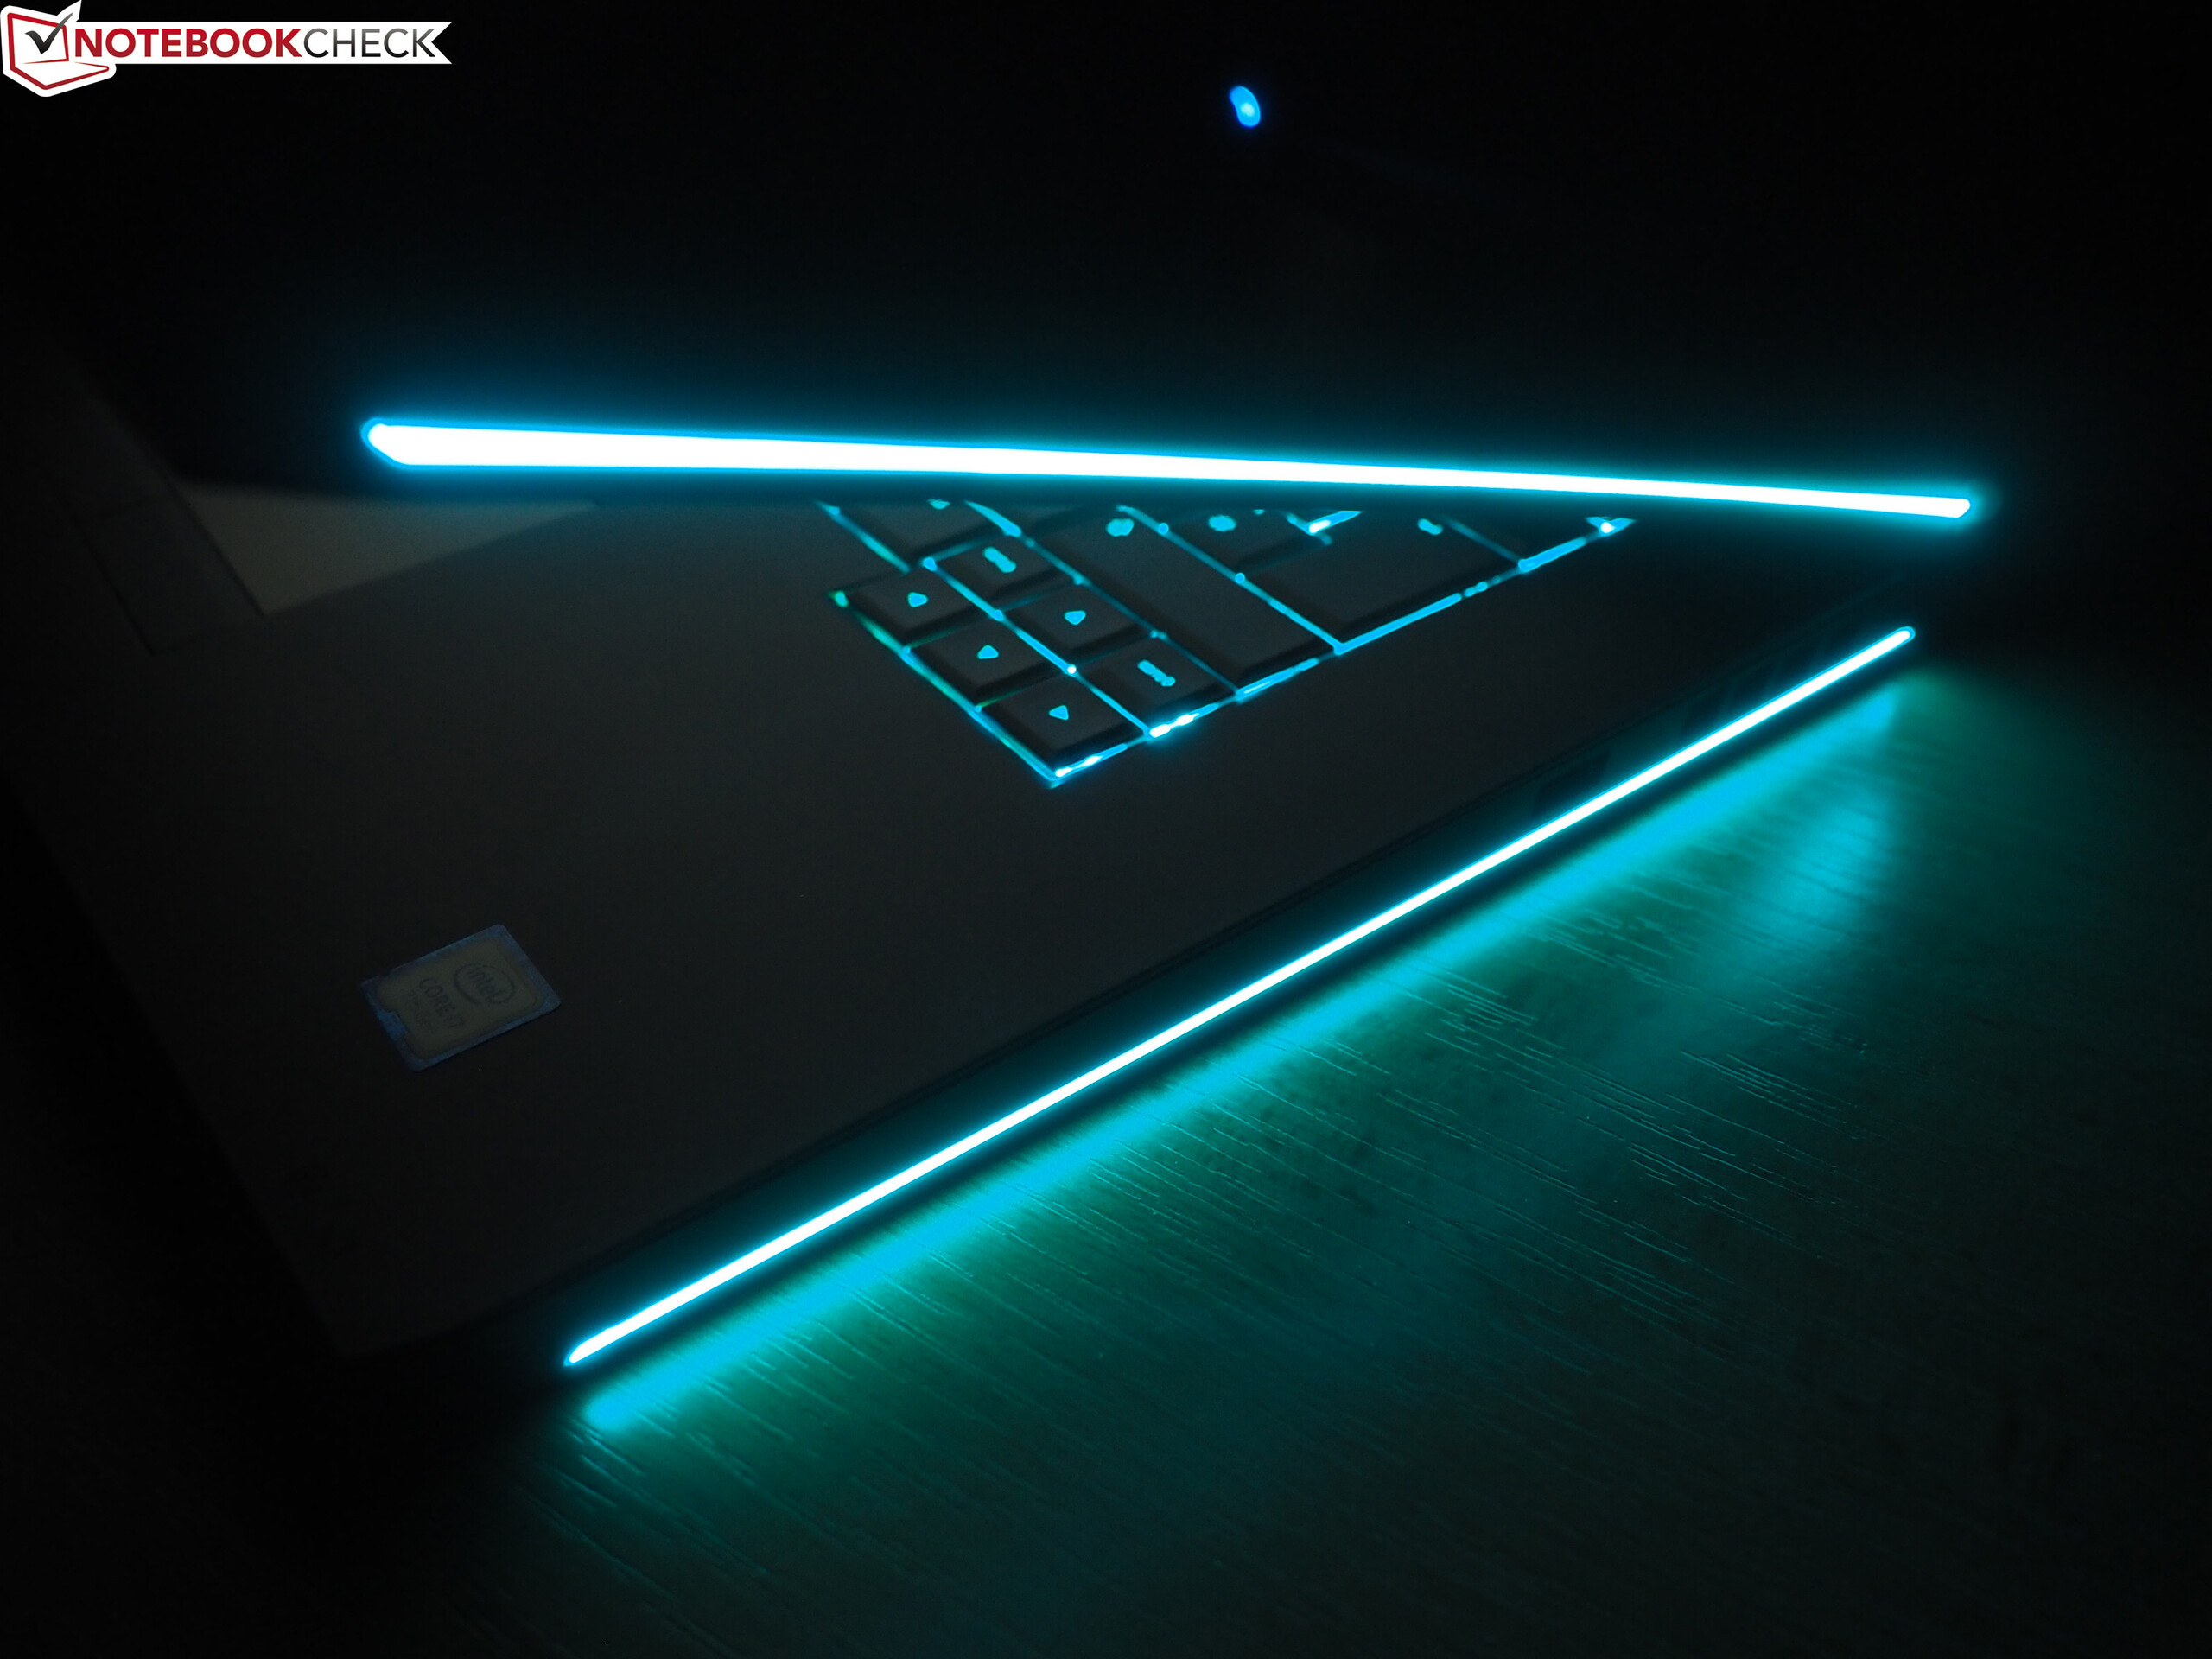
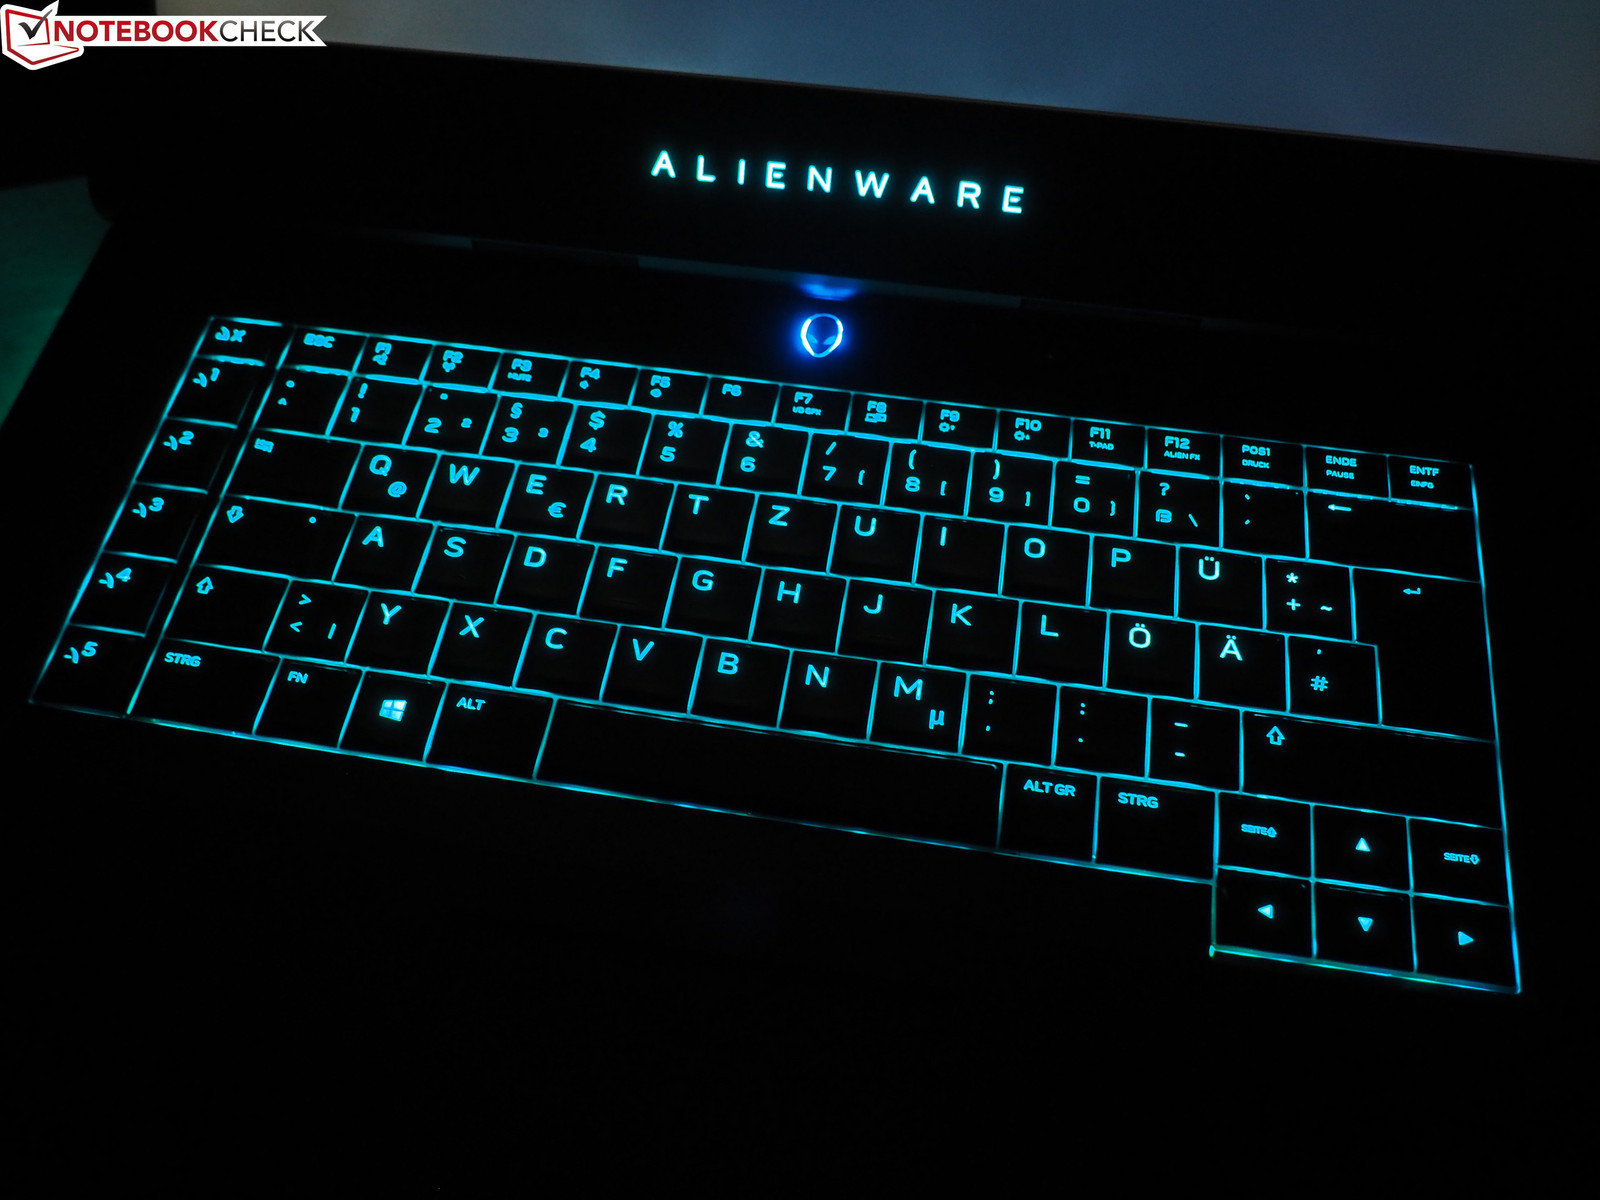
Otherwise, we would call the design convenient. Despite the fact that some elements are pretty playful and clearly indicate a gaming notebook, the overall appearance looks very noble and sophisticated. One of the most important trademarks, the comprehensive illumination, is obviously available as well. The illuminated side areas (see pictures) might look like a "poser gimmick" at first, but there are actually some advantages in the dark (better visibility of the ports and the mouse). Speaking of a mouse: Alienware not only illuminates the keyboard but also the touchpad to make inputs easier.
Whether you like the rubberized palm rests is a matter of taste. The surface is convenient to touch but quickly attracts dirt. At just 2.5 centimeters, the Alienware 15 R3 is surprisingly slim. The hinges are another nice surprise, because they keep the display well in position and leave a firm impression (it is possible to open the lid with one hand). The maximum opening angle is almost unrivaled at ~180 degrees.
Connectivity
Ports
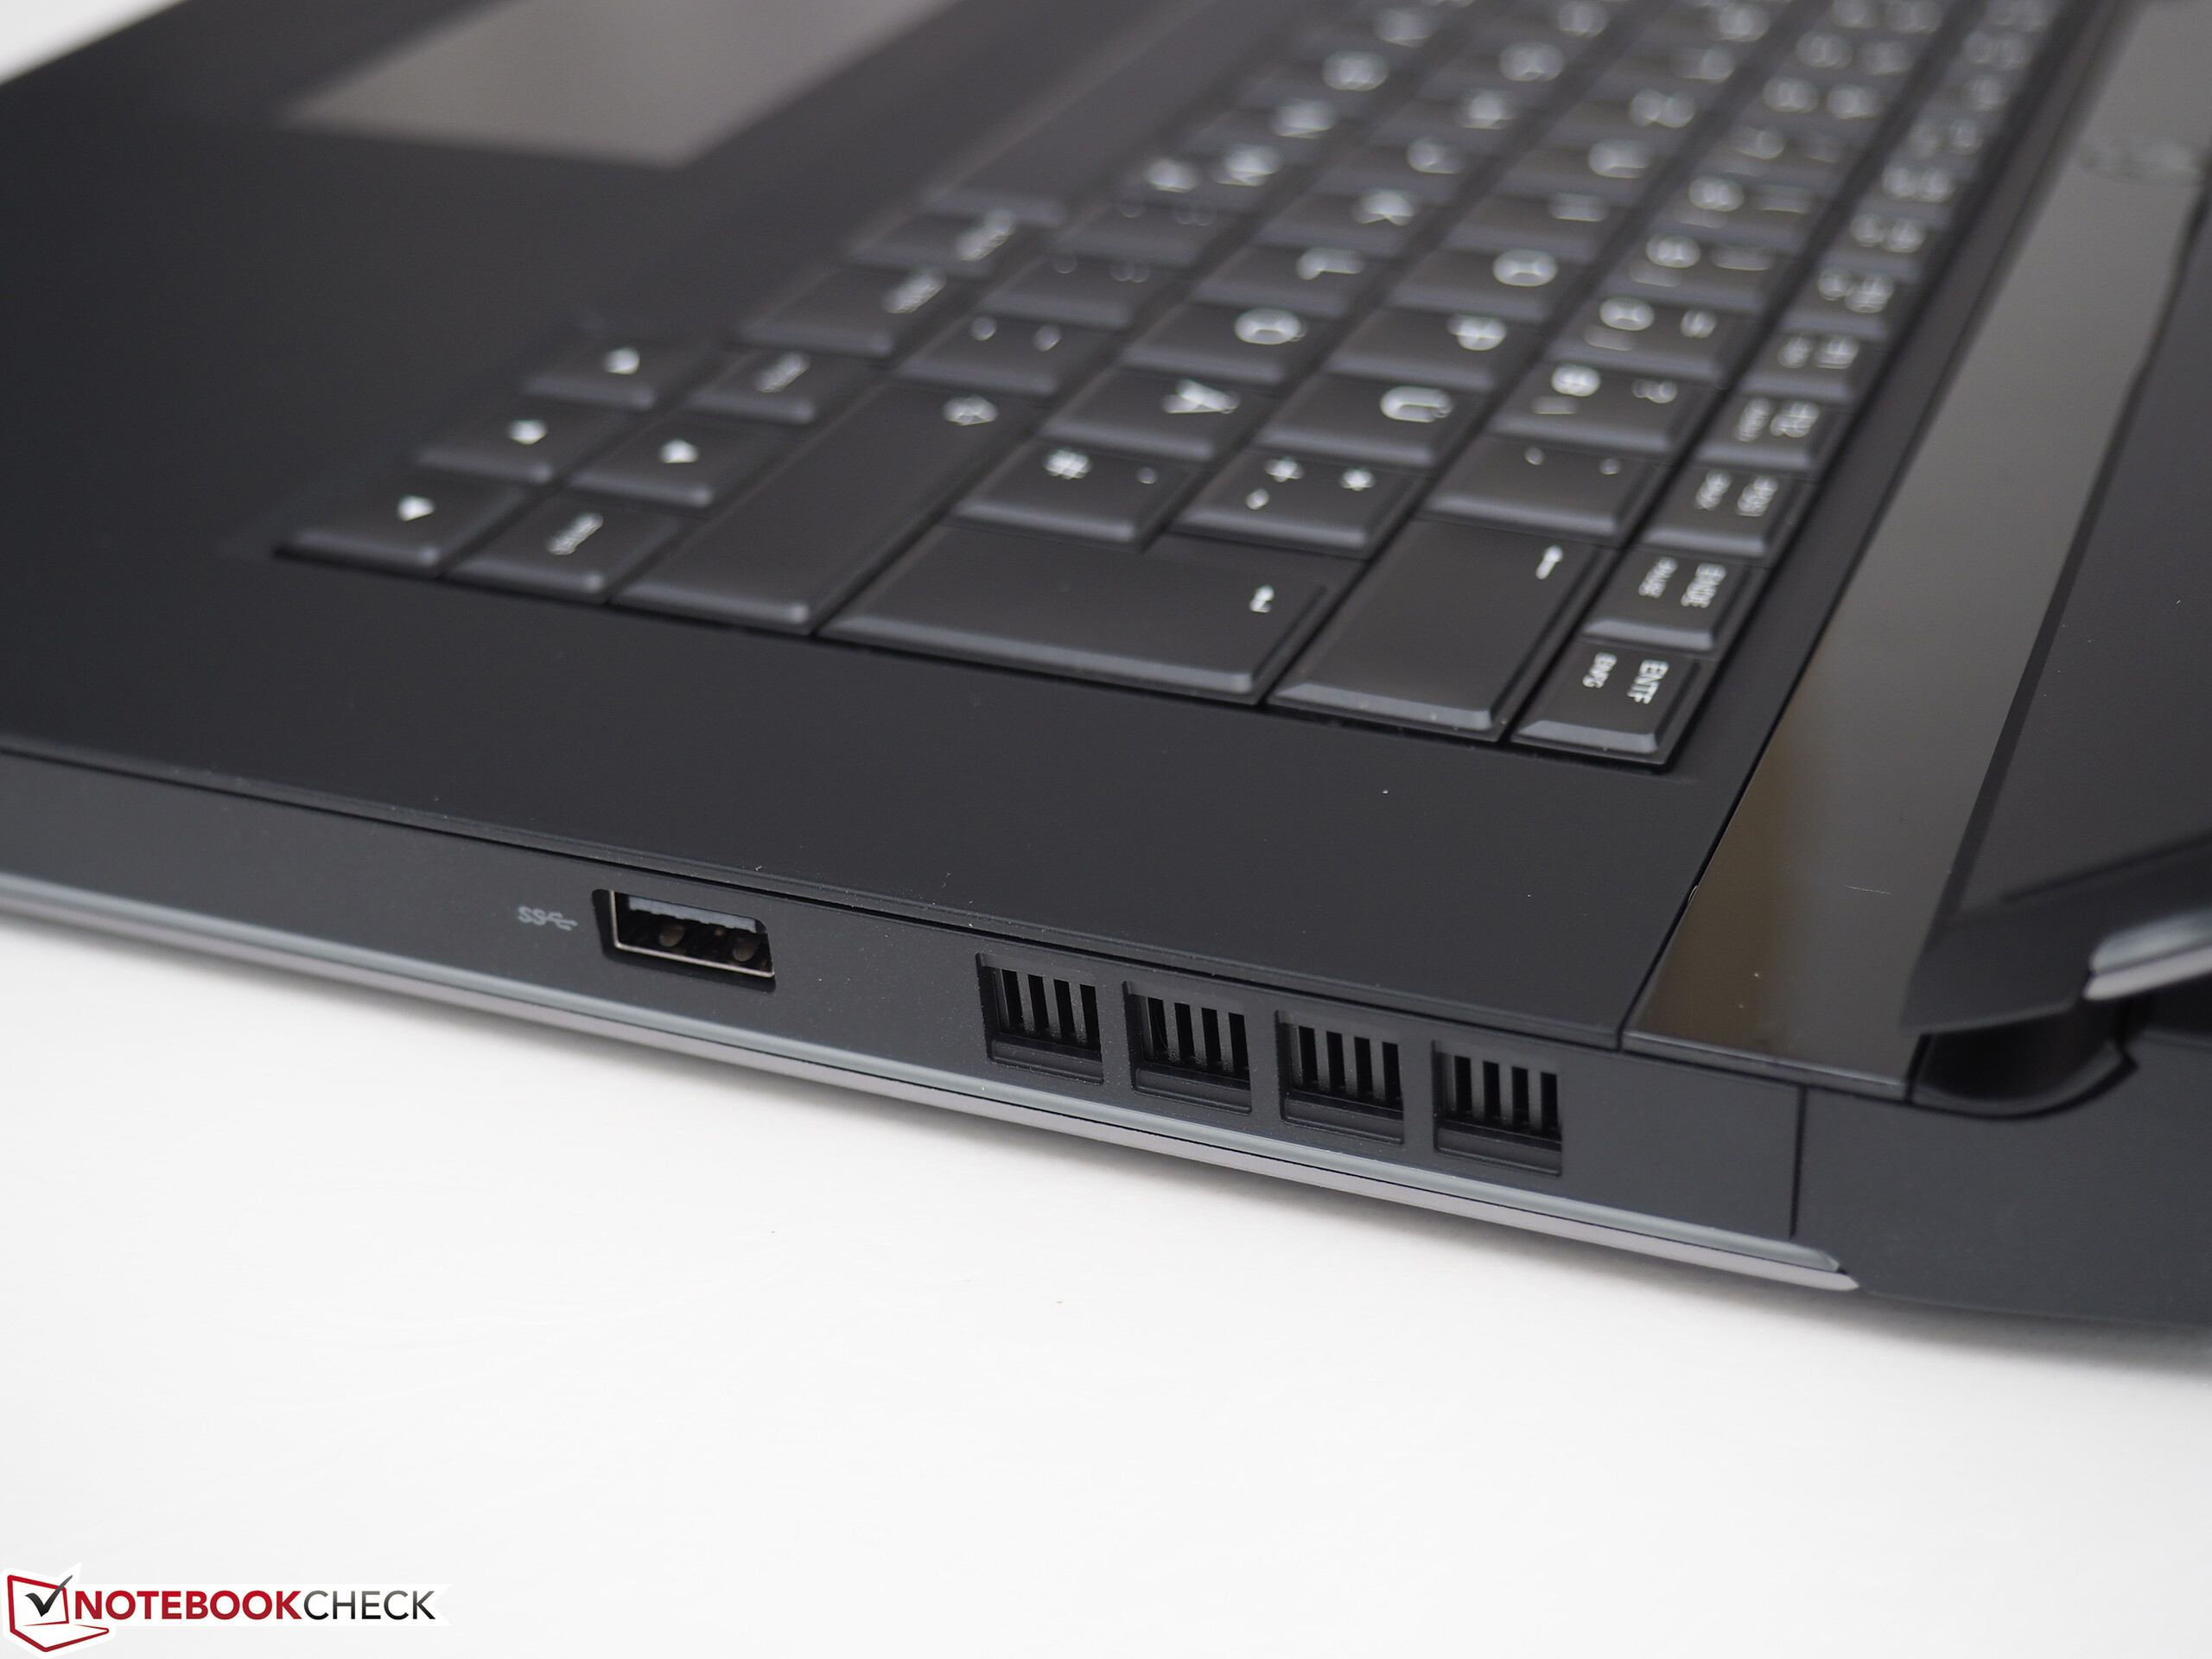
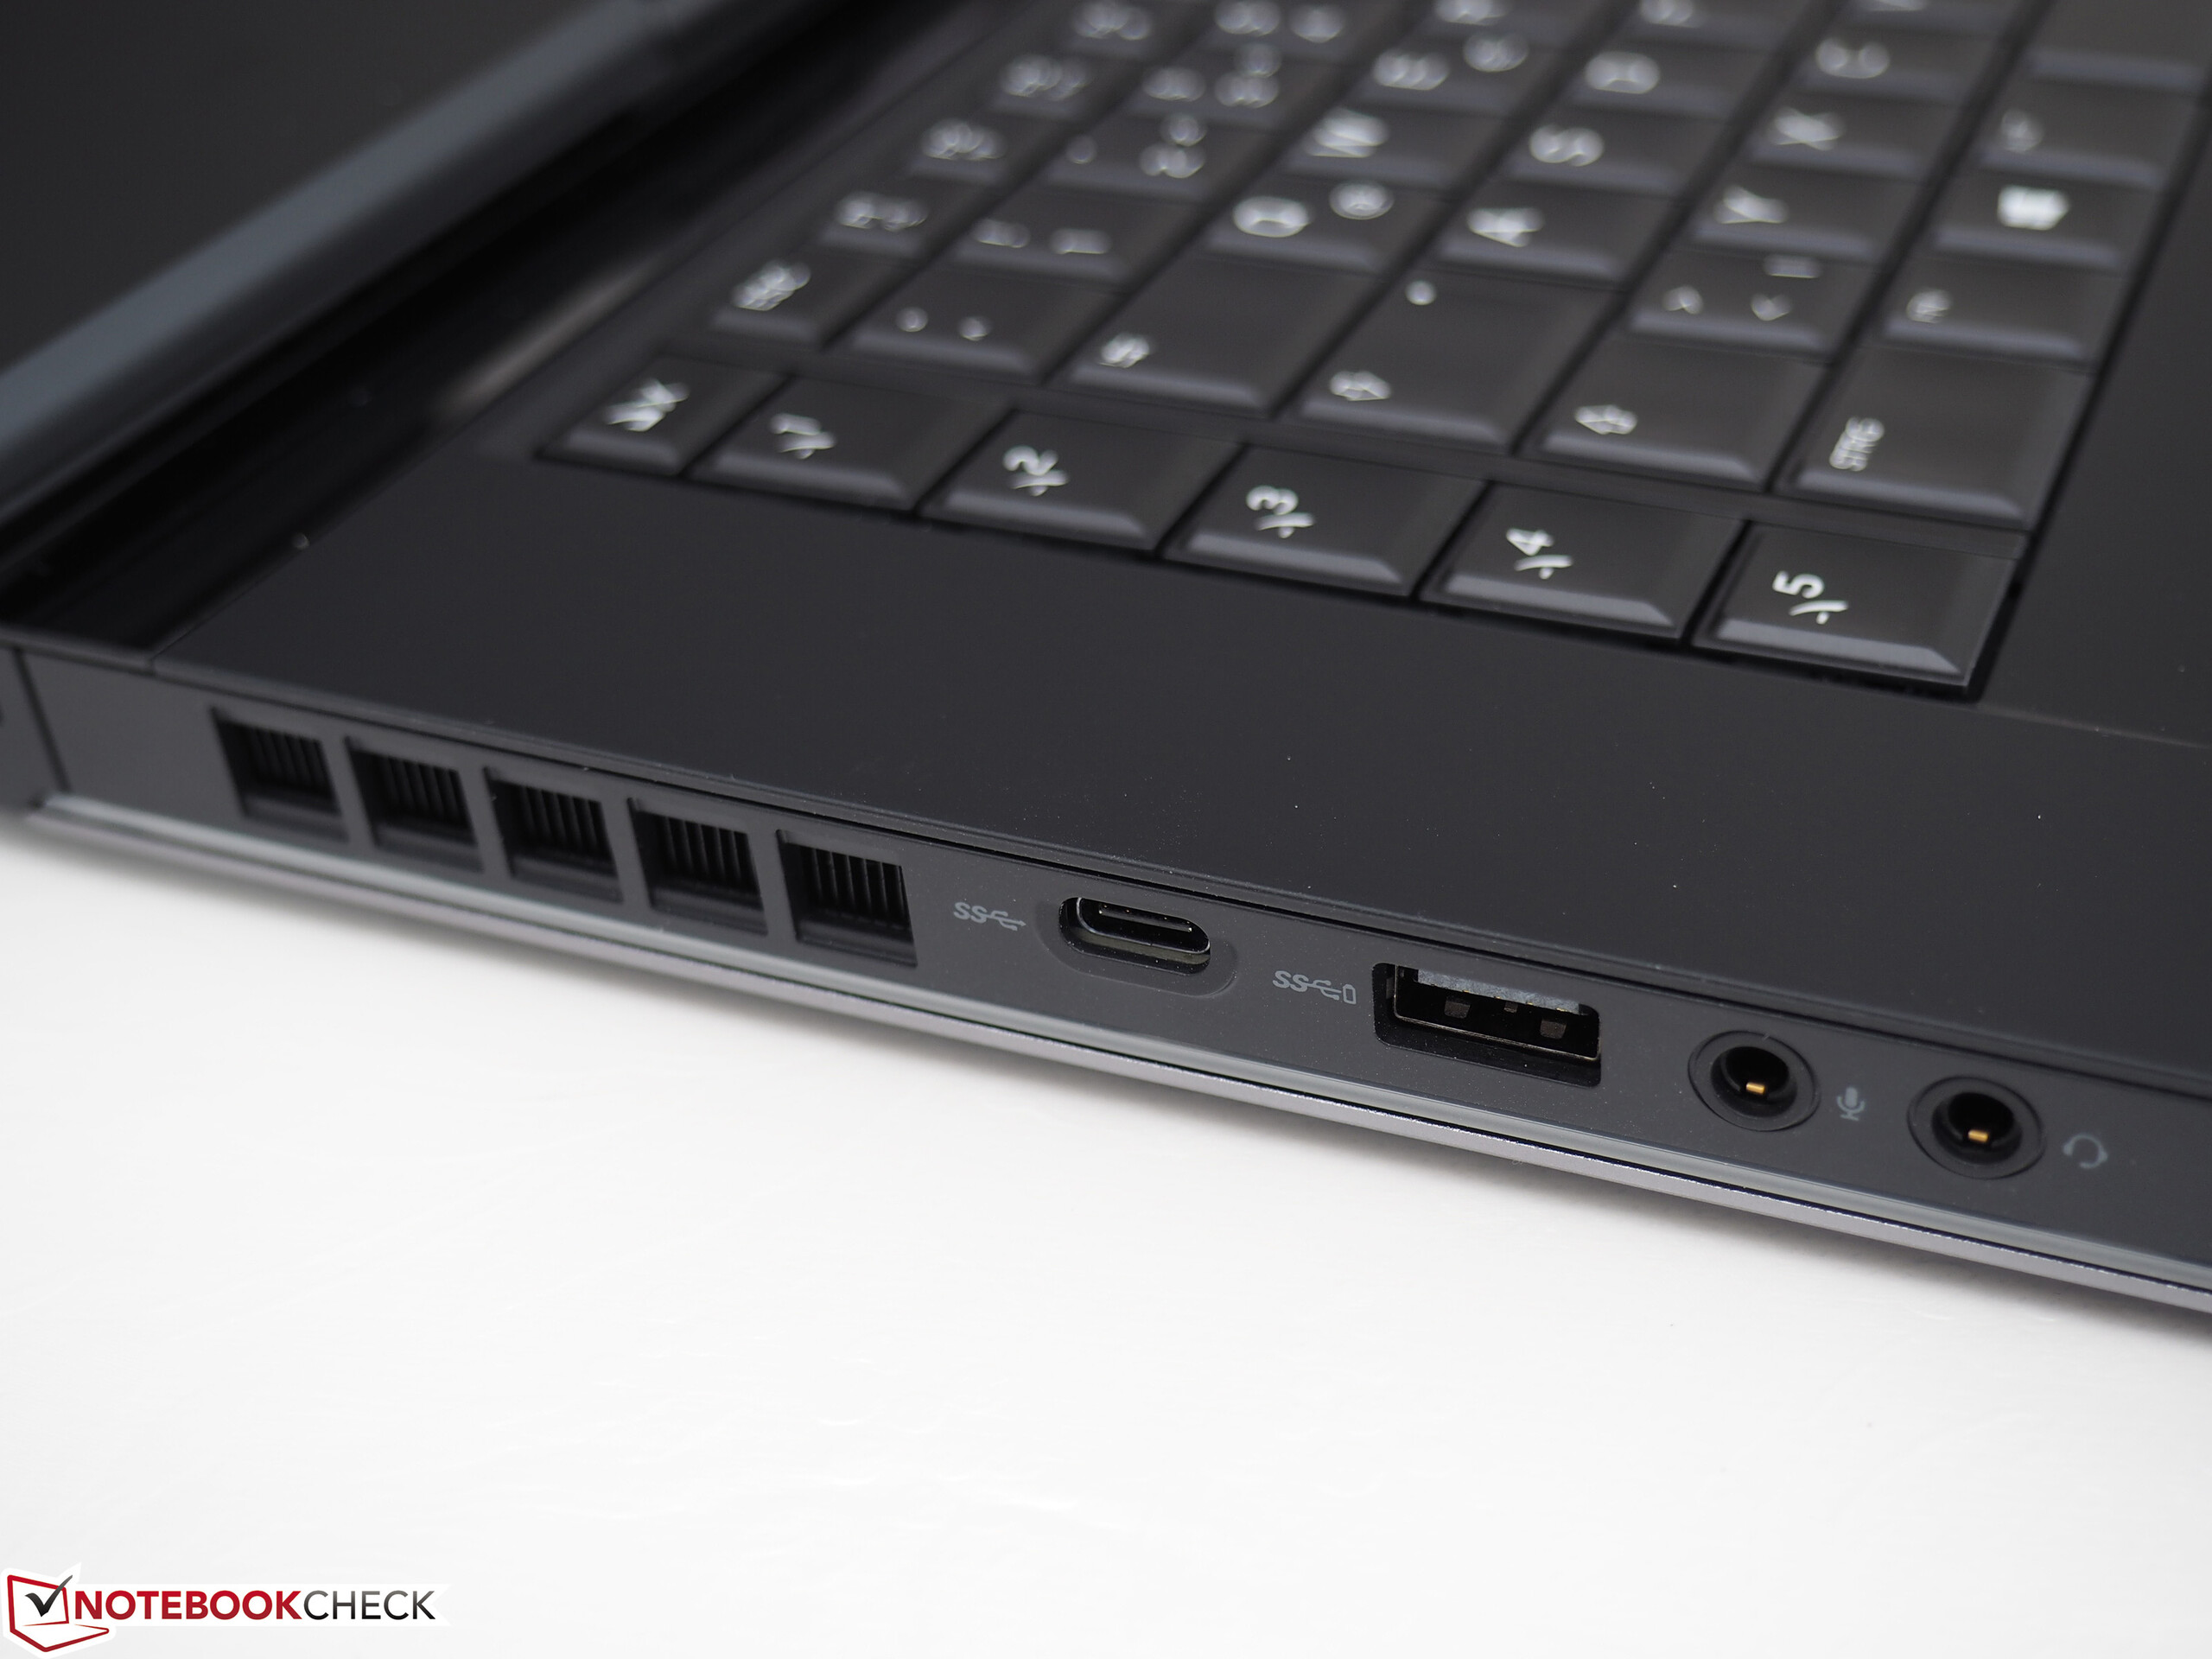
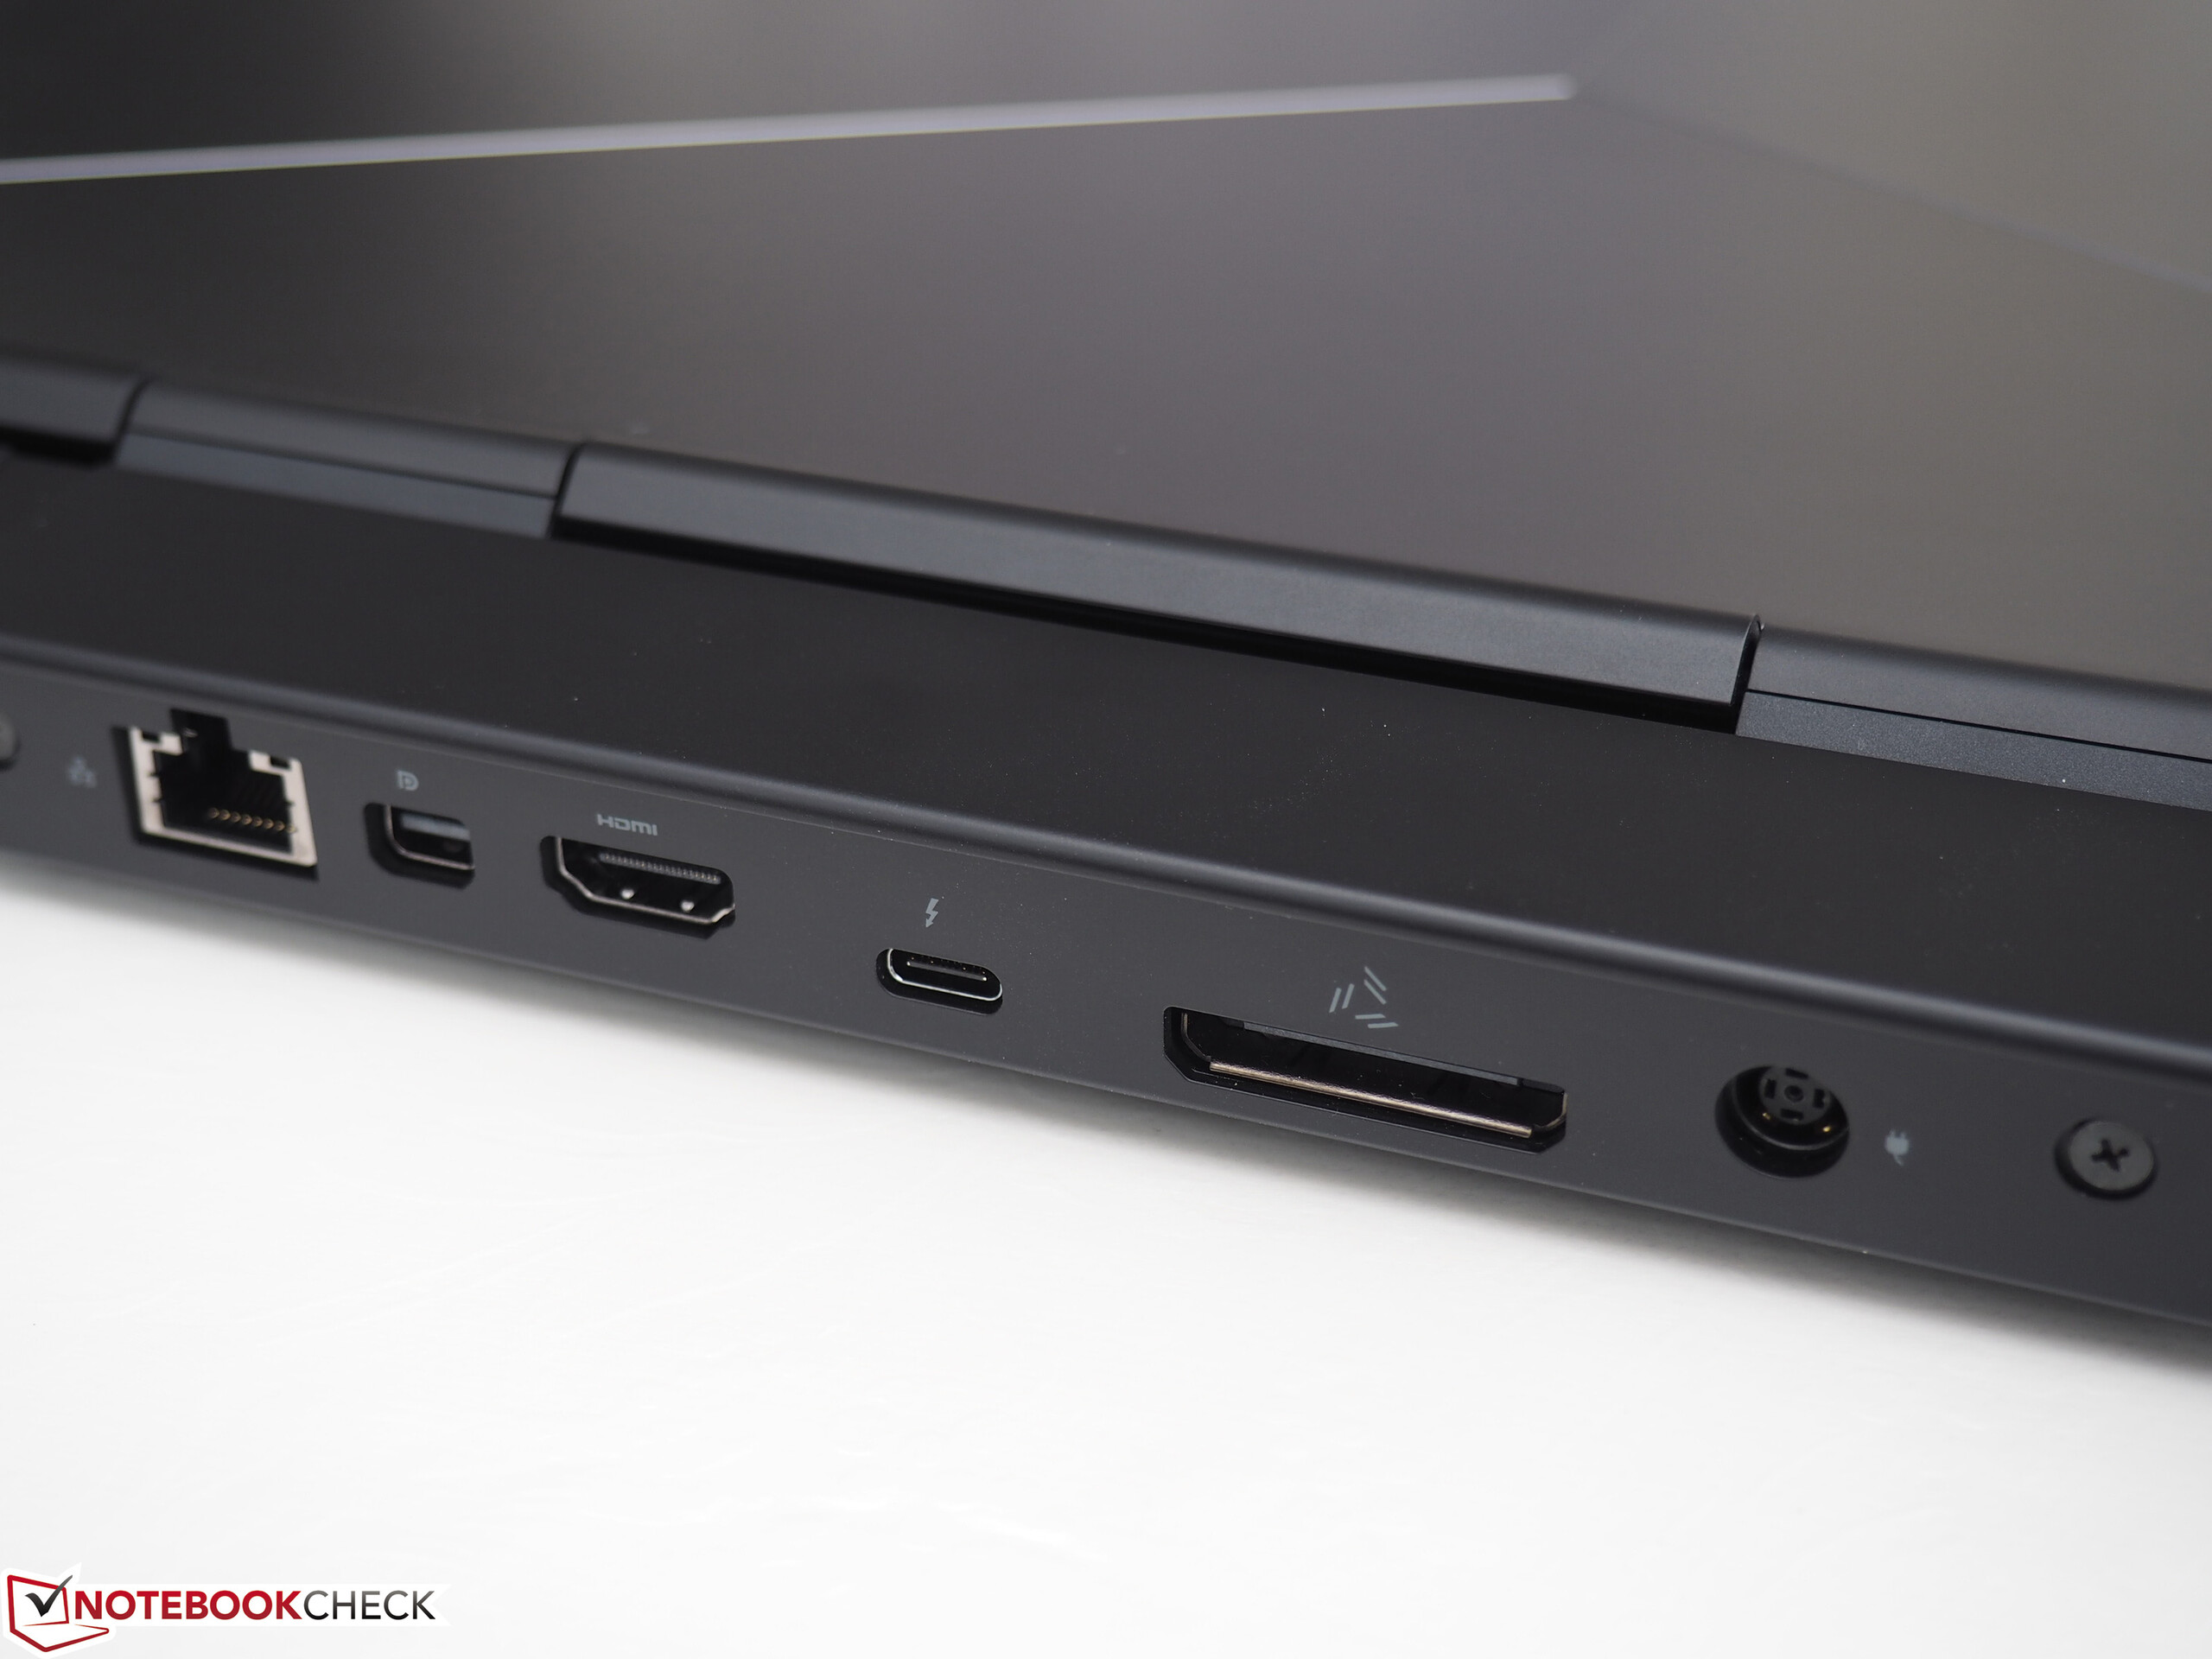
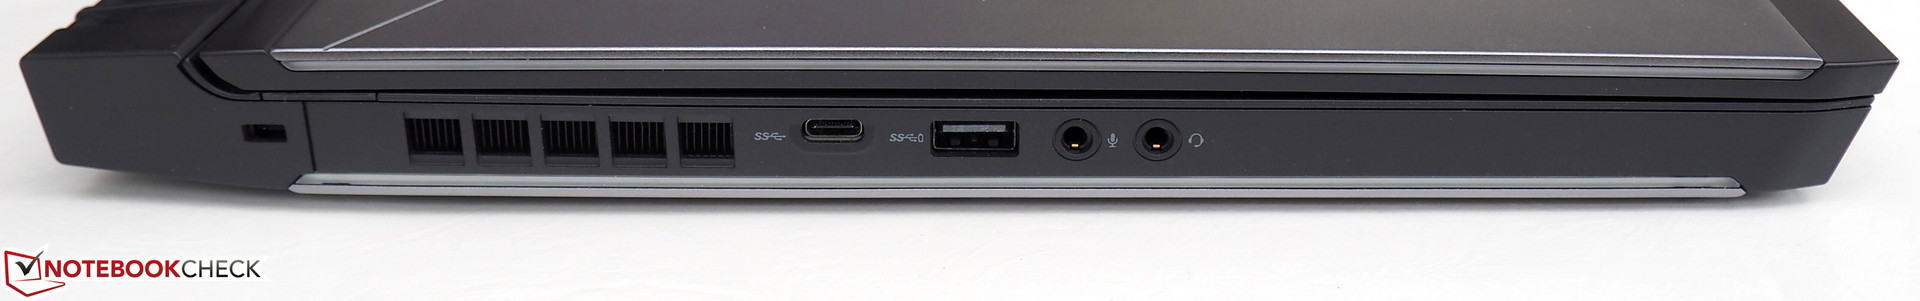
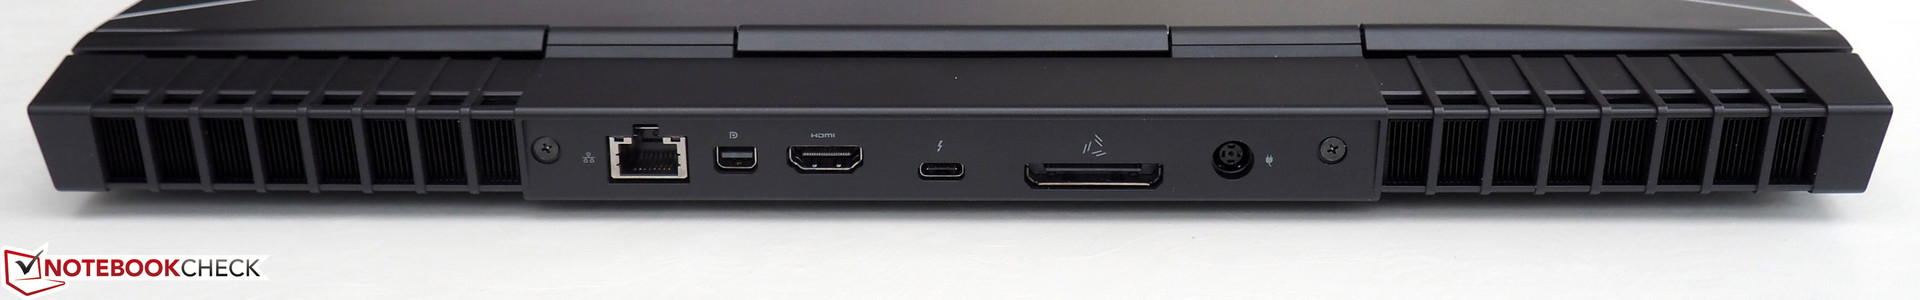
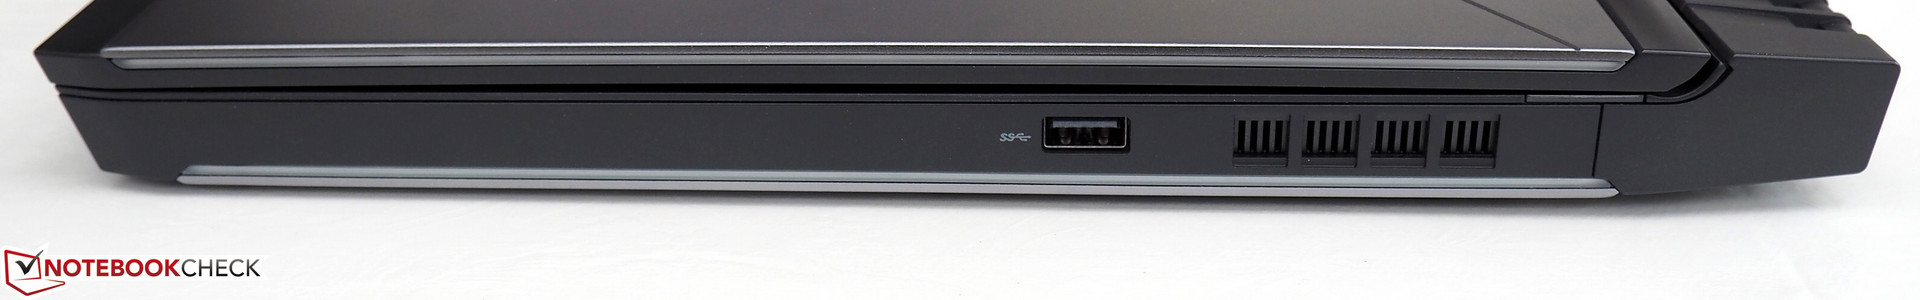
Although two USB 3.0 Type-A ports are pretty meager for a gaming system, the port selection generally meets the retail price. You can attach numerous peripherals in combination with the USB 3.0 Type-C port (left) and the Thunderbolt 3 port (rear), which also supports USB 3.1 and DisplayPort. The situation is similar for external monitors, where you can choose between the mini-DisplayPort and the HDMI 2.0 output. Both the RJ45 jack and the power connector are located at the rear as well. The Noble lock (counterpart to Kensington lock) and the two audio ports (3.5 mm jack for headset and microphone) are located on the left.
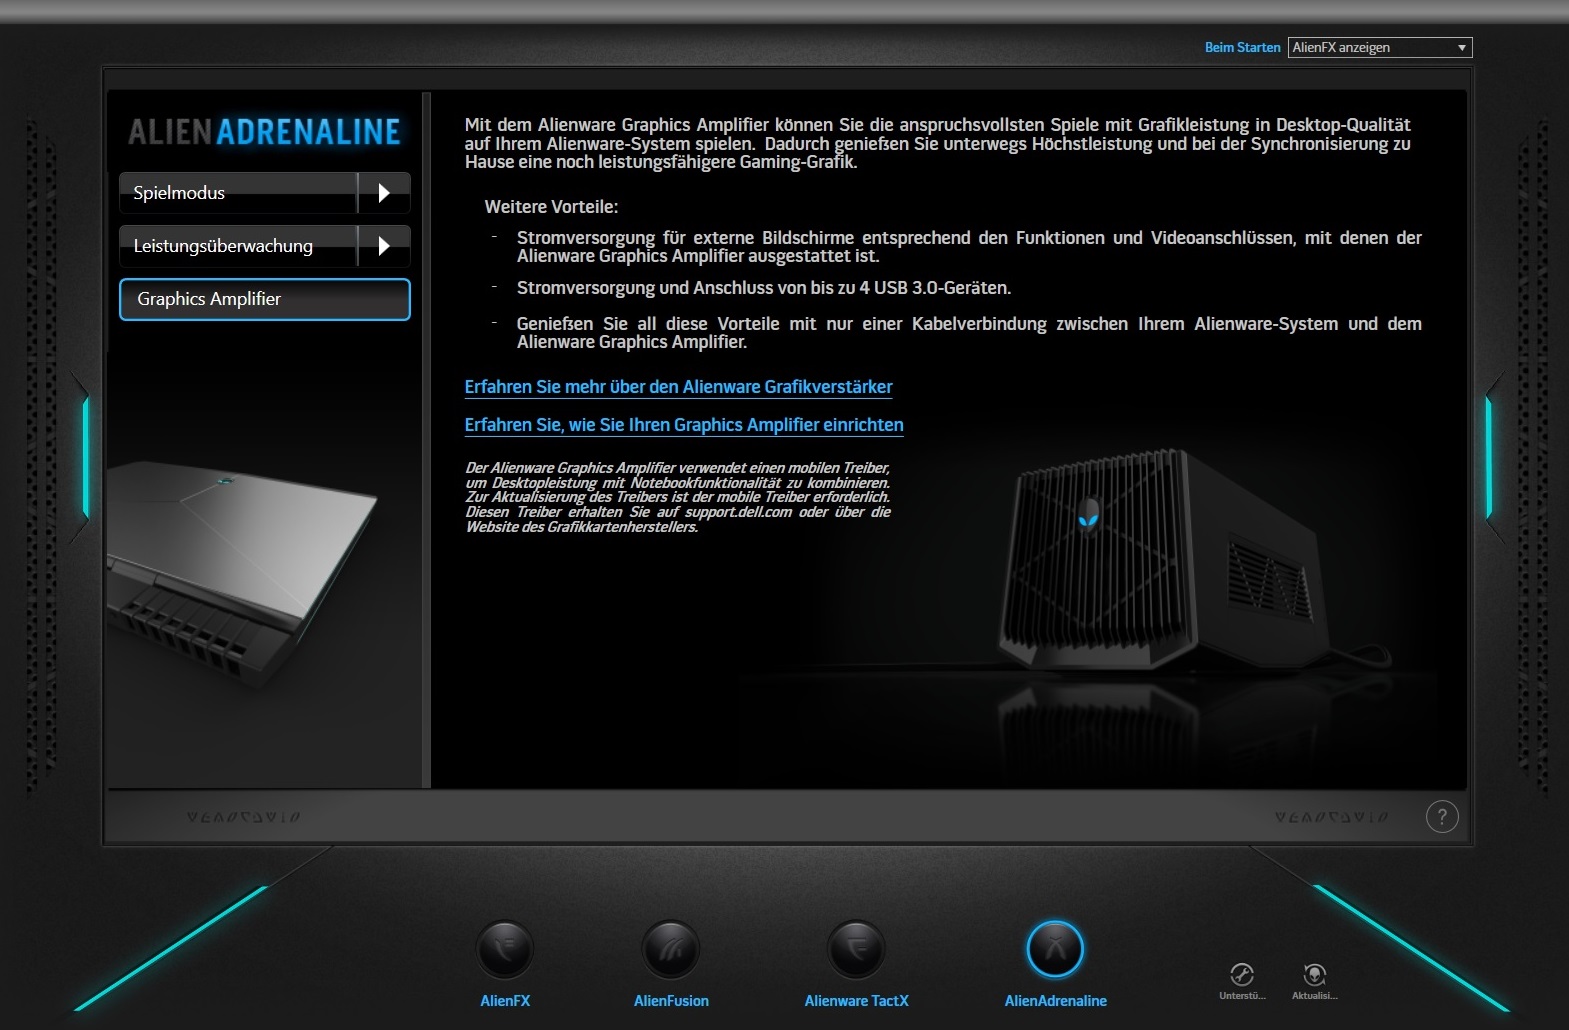
We think the connector for the proprietary Alienware Graphics Amplifier is the biggest highlight. It is an optional box that accommodates a desktop GPU. However, the box will probably become more interesting in a couple of years due to the enormous performance of the GeForce GTX 1070. That the manufacturer does not implement an optical drive is understandable in times of Steam and the like, especially since a DVD or Blu-ray burner would require a lot of space and probably affect the stability of the chassis. However, we cannot understand why there is no card reader.
Communication
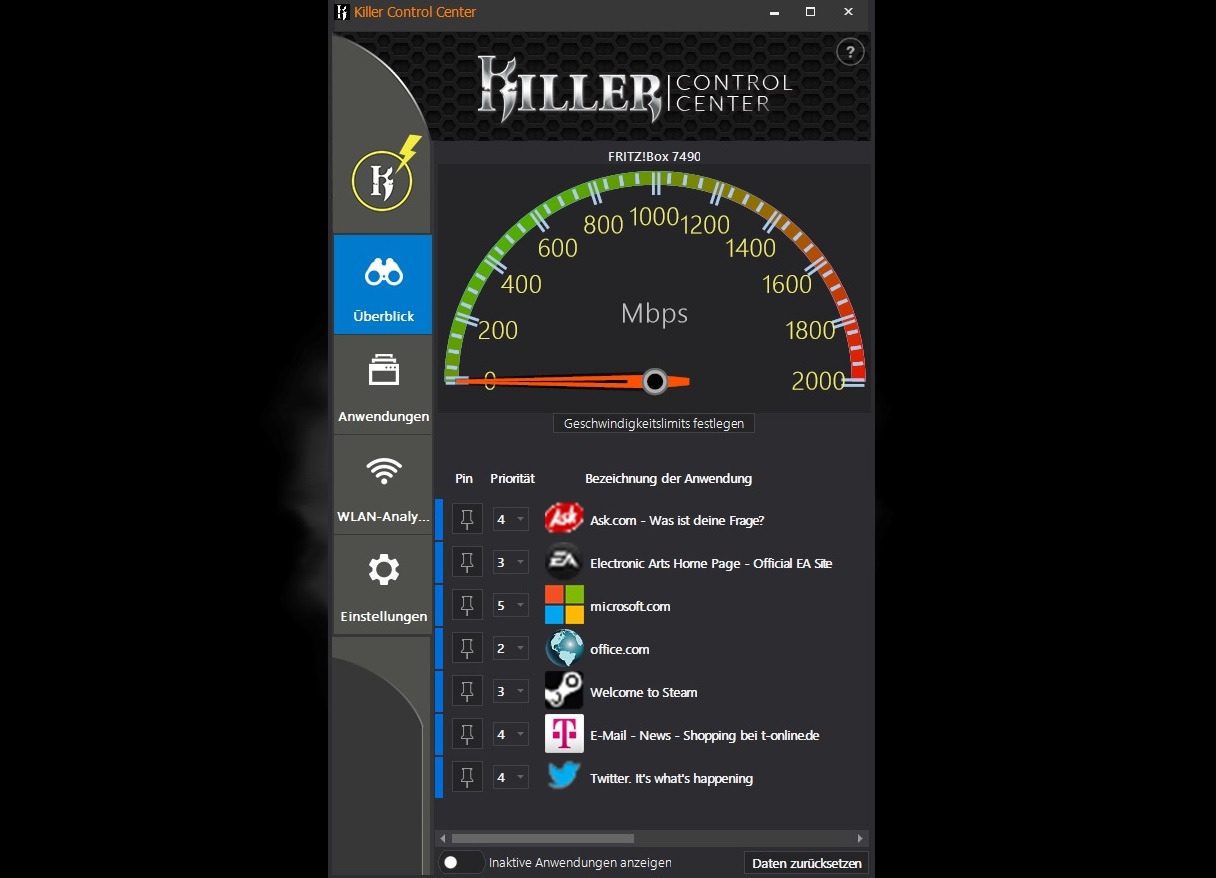
Dell uses products from Rivet Networks for communication. The Gigabit Ethernet Chip Killer E2500 and the wireless module Killer 1435 (WLAN 802.11 a/b/g/n/ac, Bluetooth 4.1, up to 867 Mbps) are supposed to be optimized for gamers, which is supported by the powerful Killer software (several controls and settings). Our standardized WLAN test with a distance of one meter to the router determines good transfer rates for the Alienware 15 R3. Average results of 560 Mbps (send) and 681 Mbps (receive), respectively, slightly beat the Intel Dual-Band Wireless-AC 8265 of the Schenker XMG P507 (513 and 674 Mbps, respectively).
| Networking | |
| iperf3 transmit AX12 | |
| Alienware 15 R3 | |
| Schenker XMG P507 PRO | |
| iperf3 receive AX12 | |
| Alienware 15 R3 | |
| Schenker XMG P507 PRO | |
Accessories
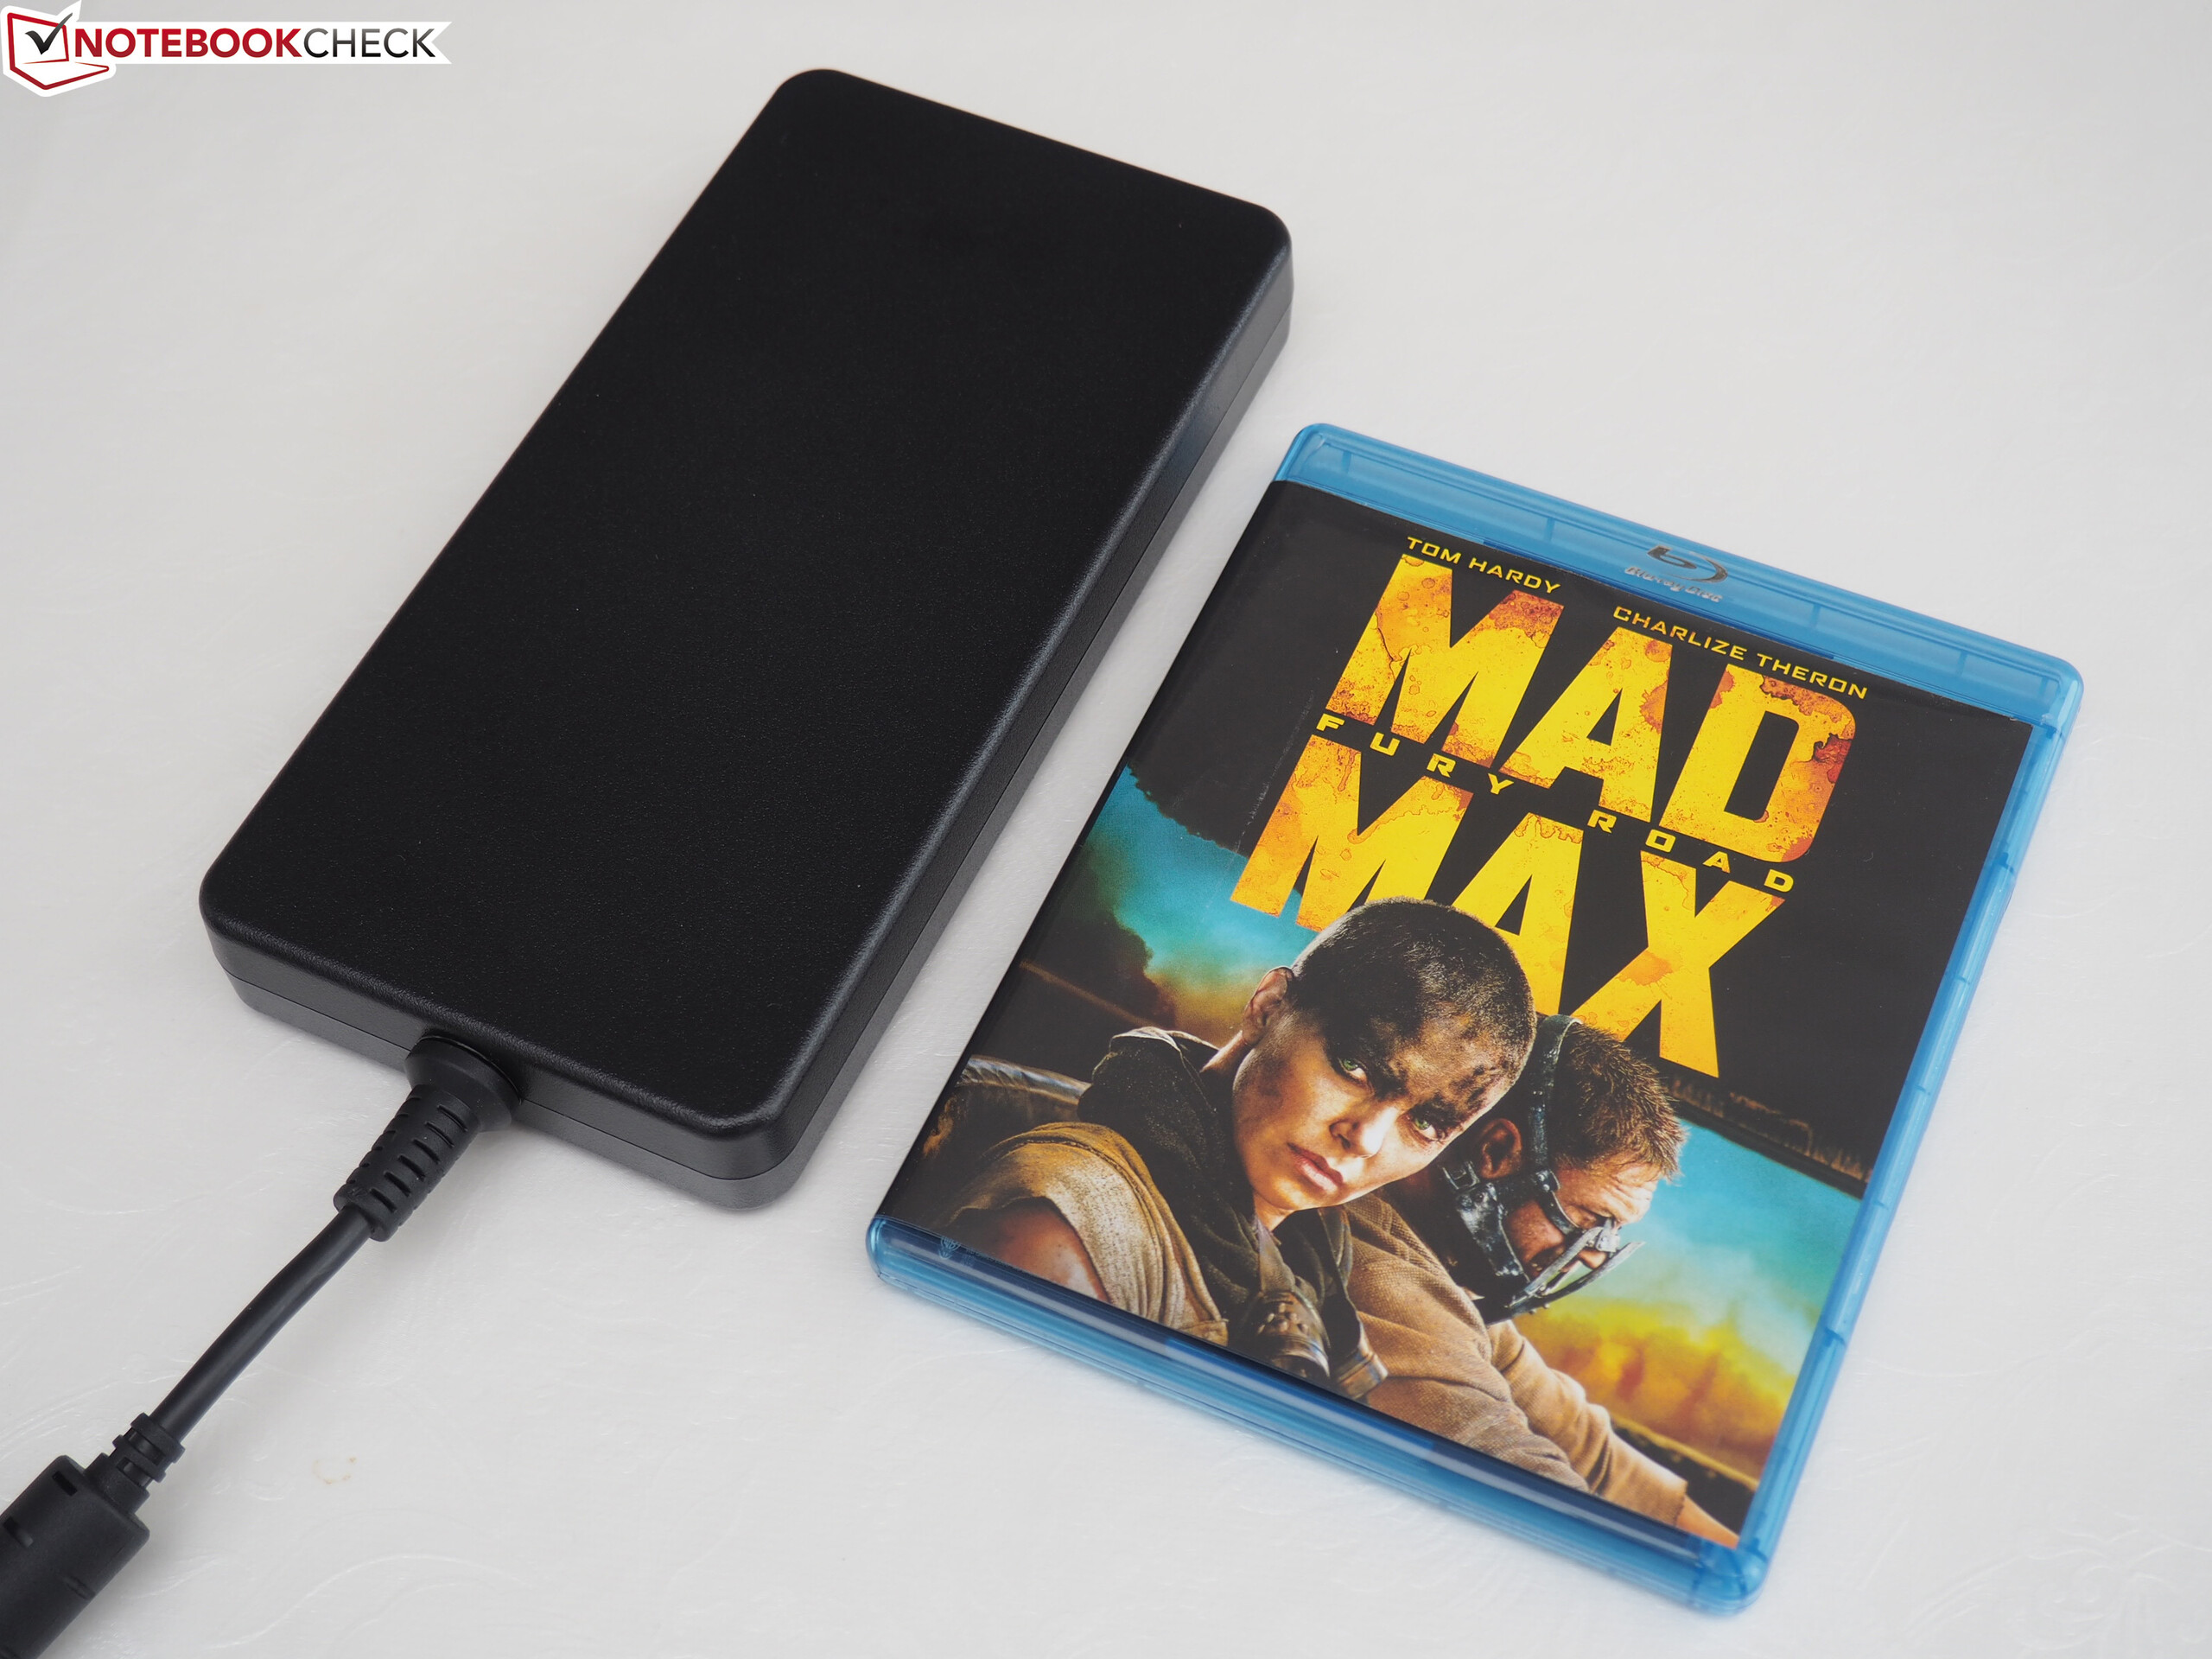
The scope of delivery is limited to a quick-start guide and the necessary power supply. The 240-Watt power adapter is surprisingly slim (2.5 cm), just like the laptop itself, but it has a pretty big footprint in return (20 x 10 cm). SKUs with the GTX 1060 are probably shipped with a more compact PSU.
Maintenance
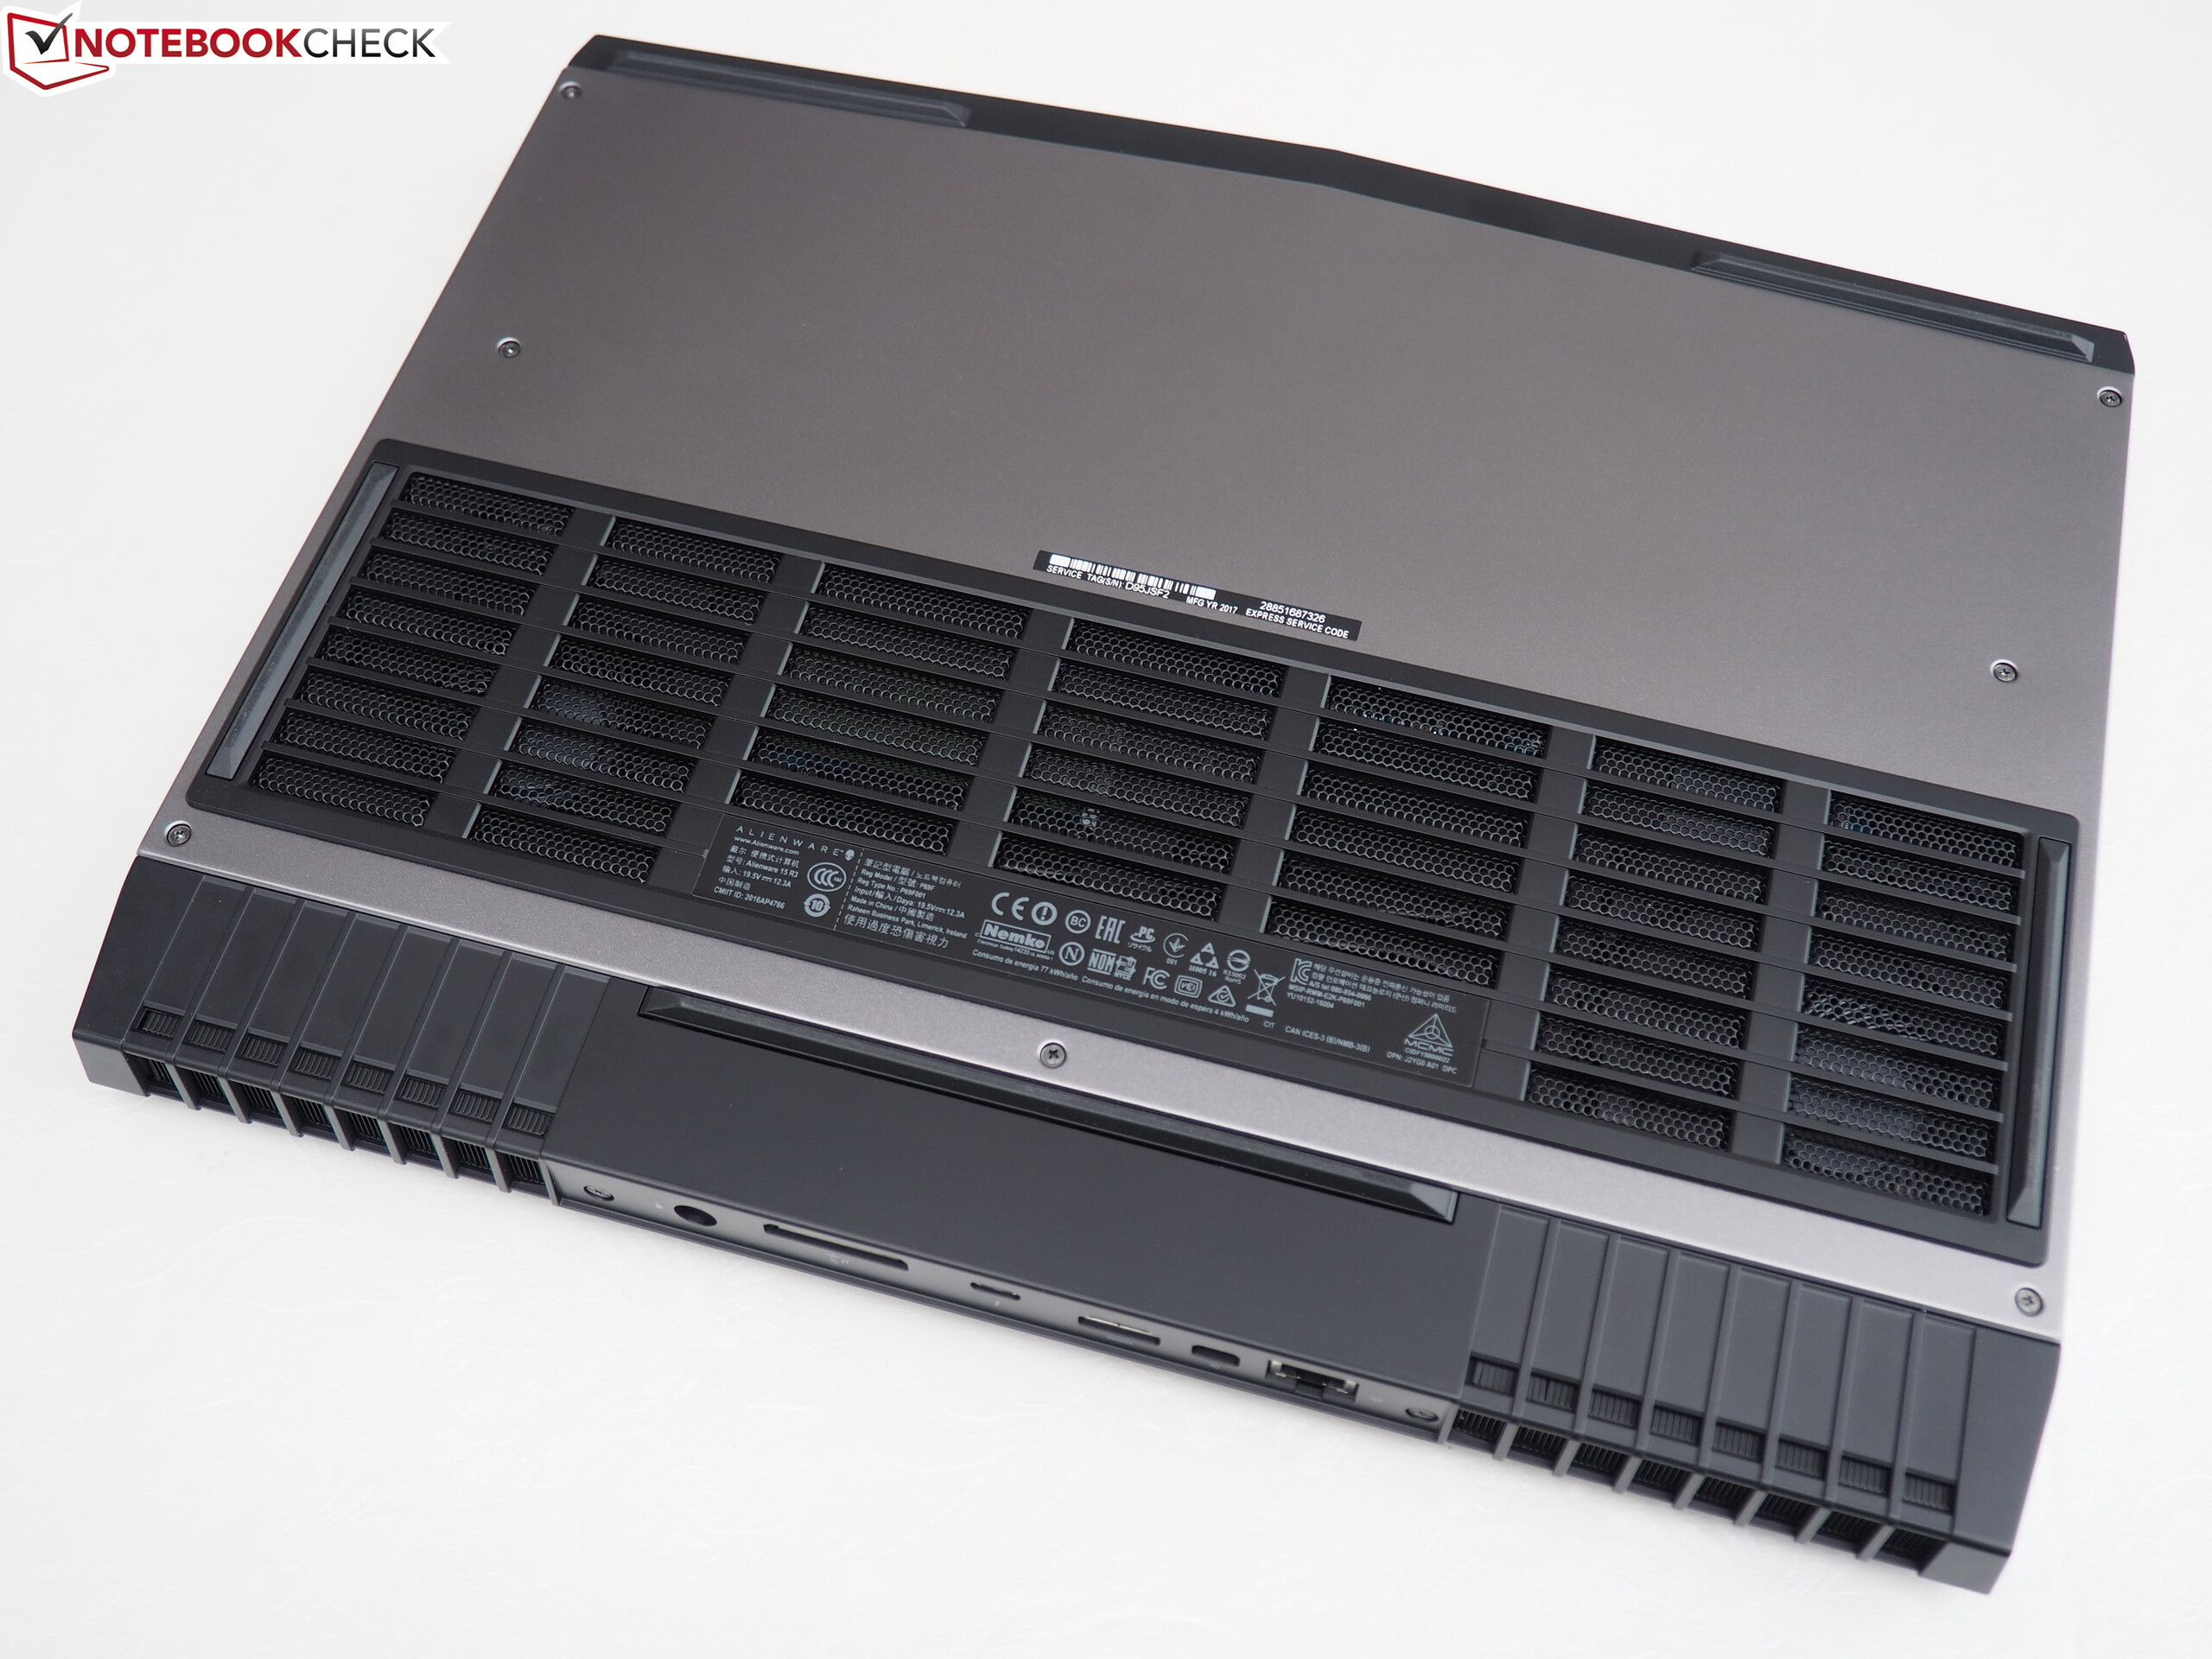
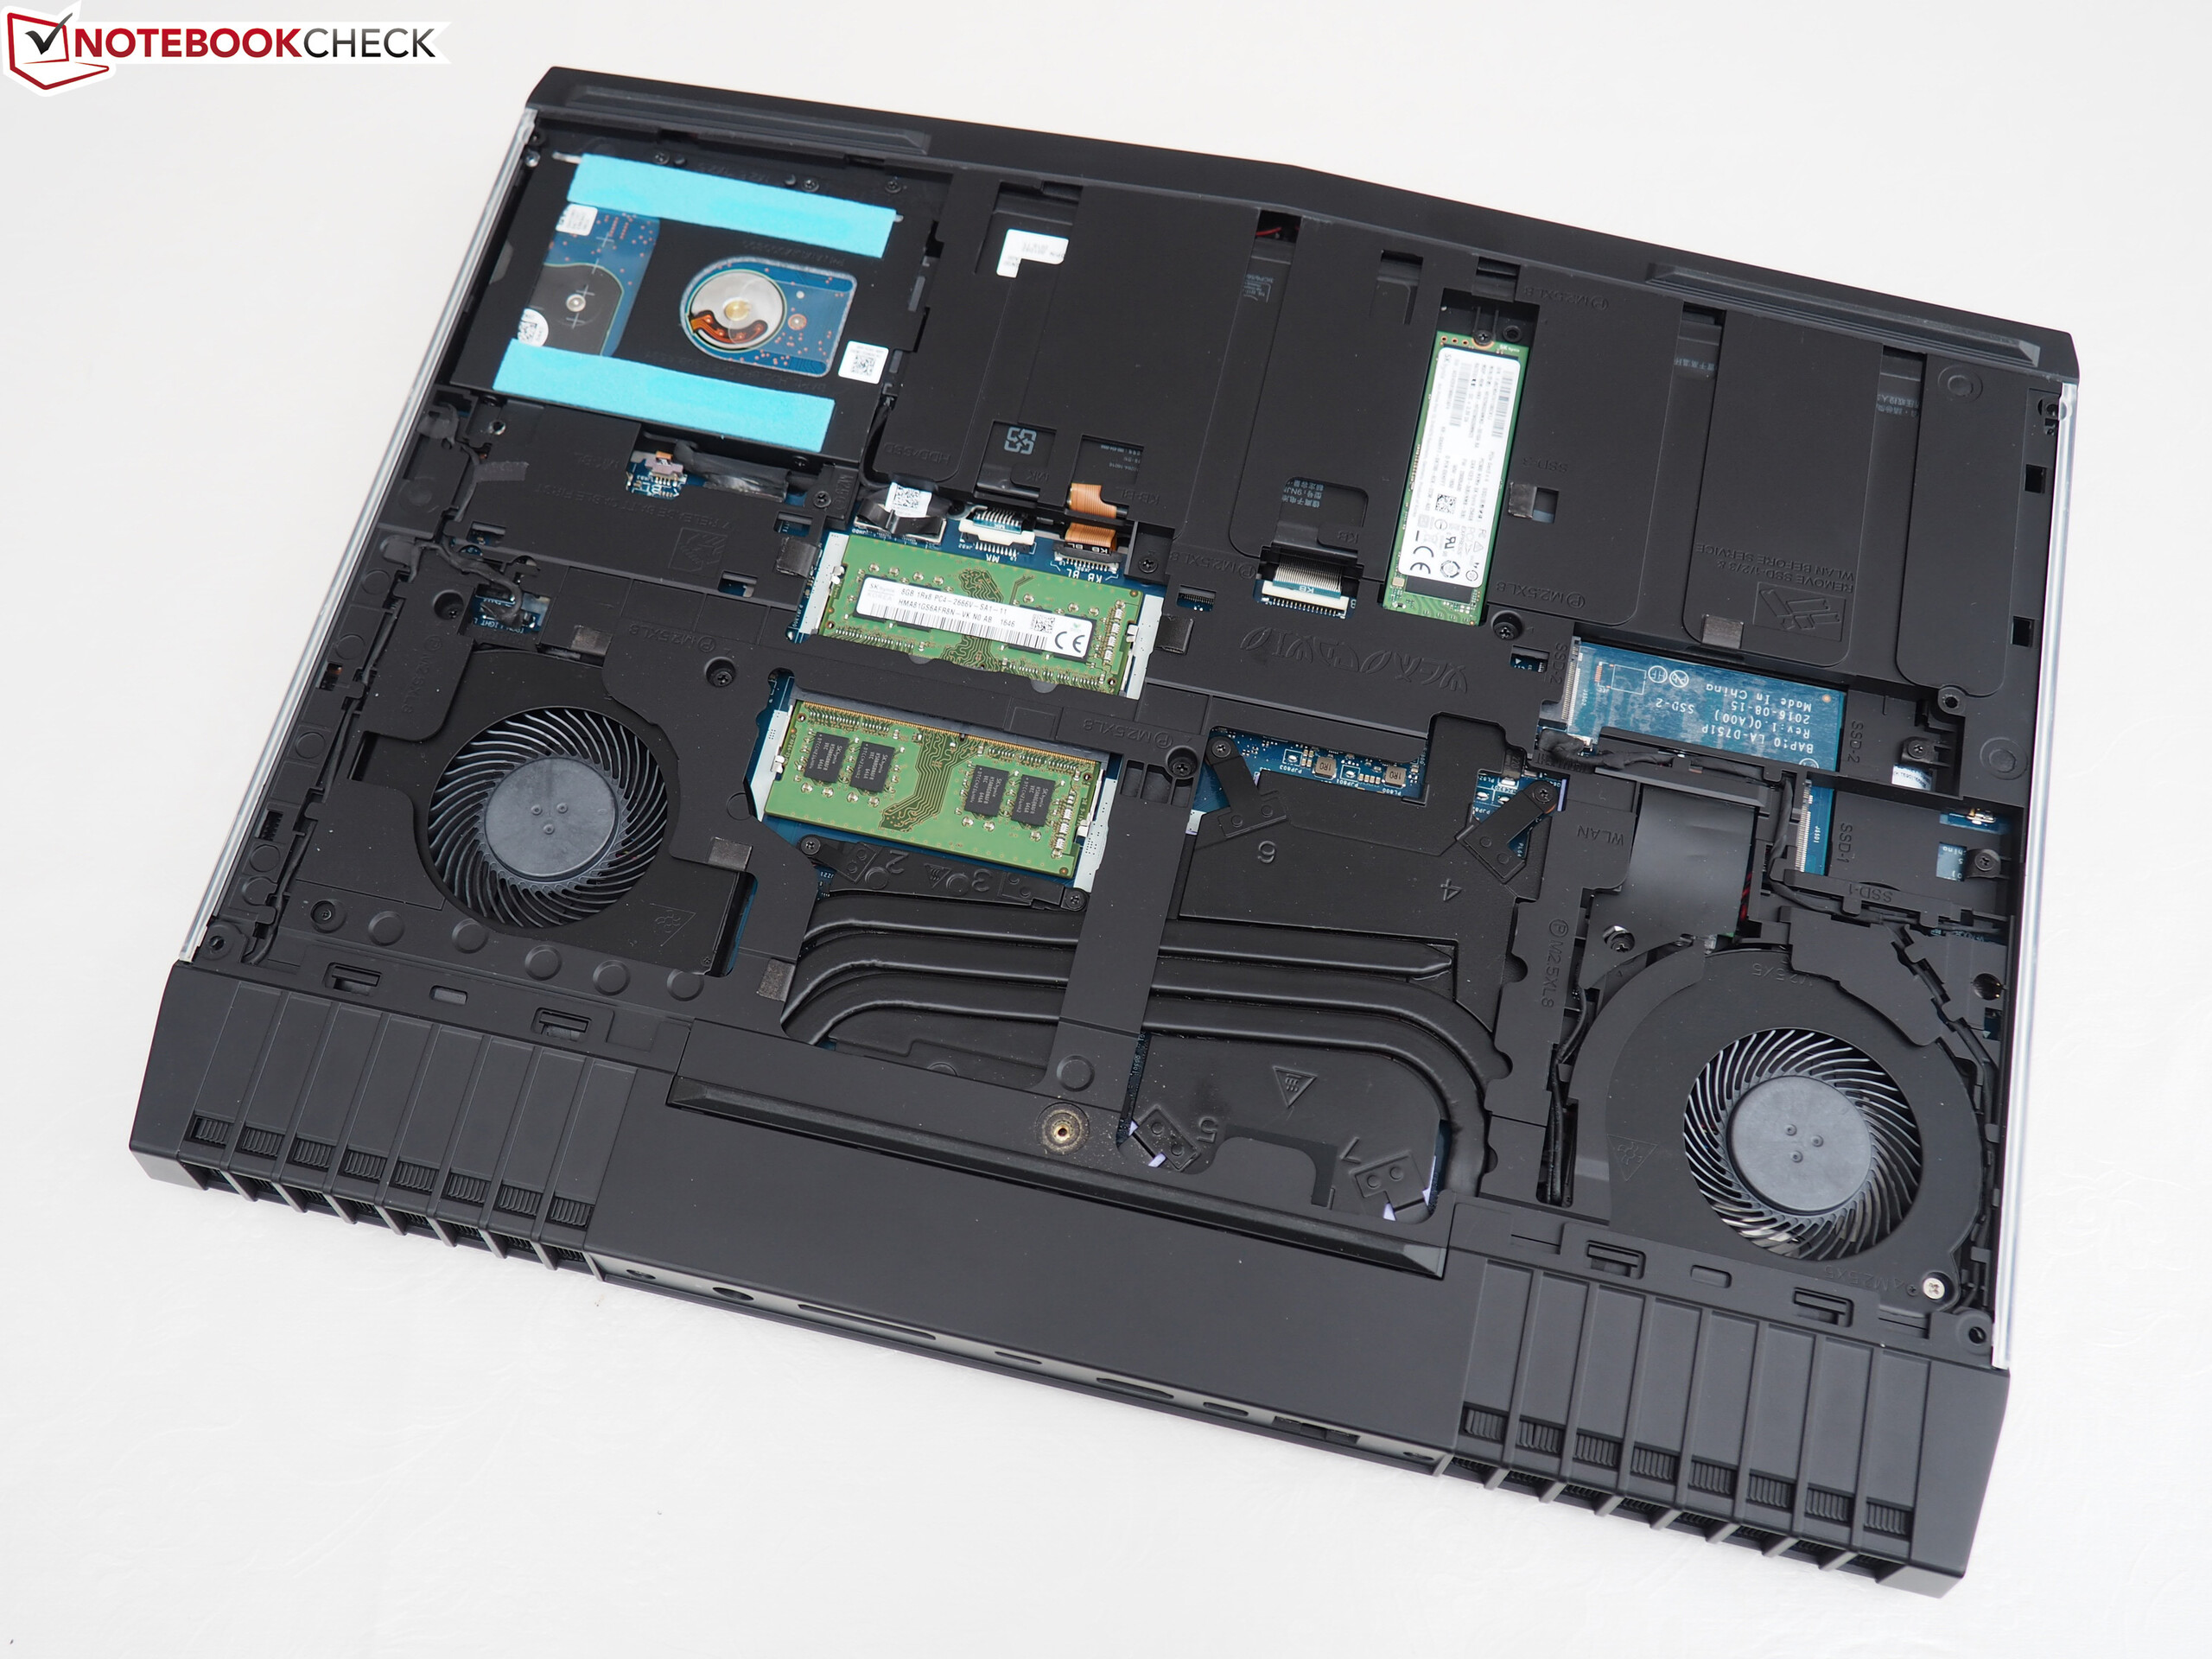
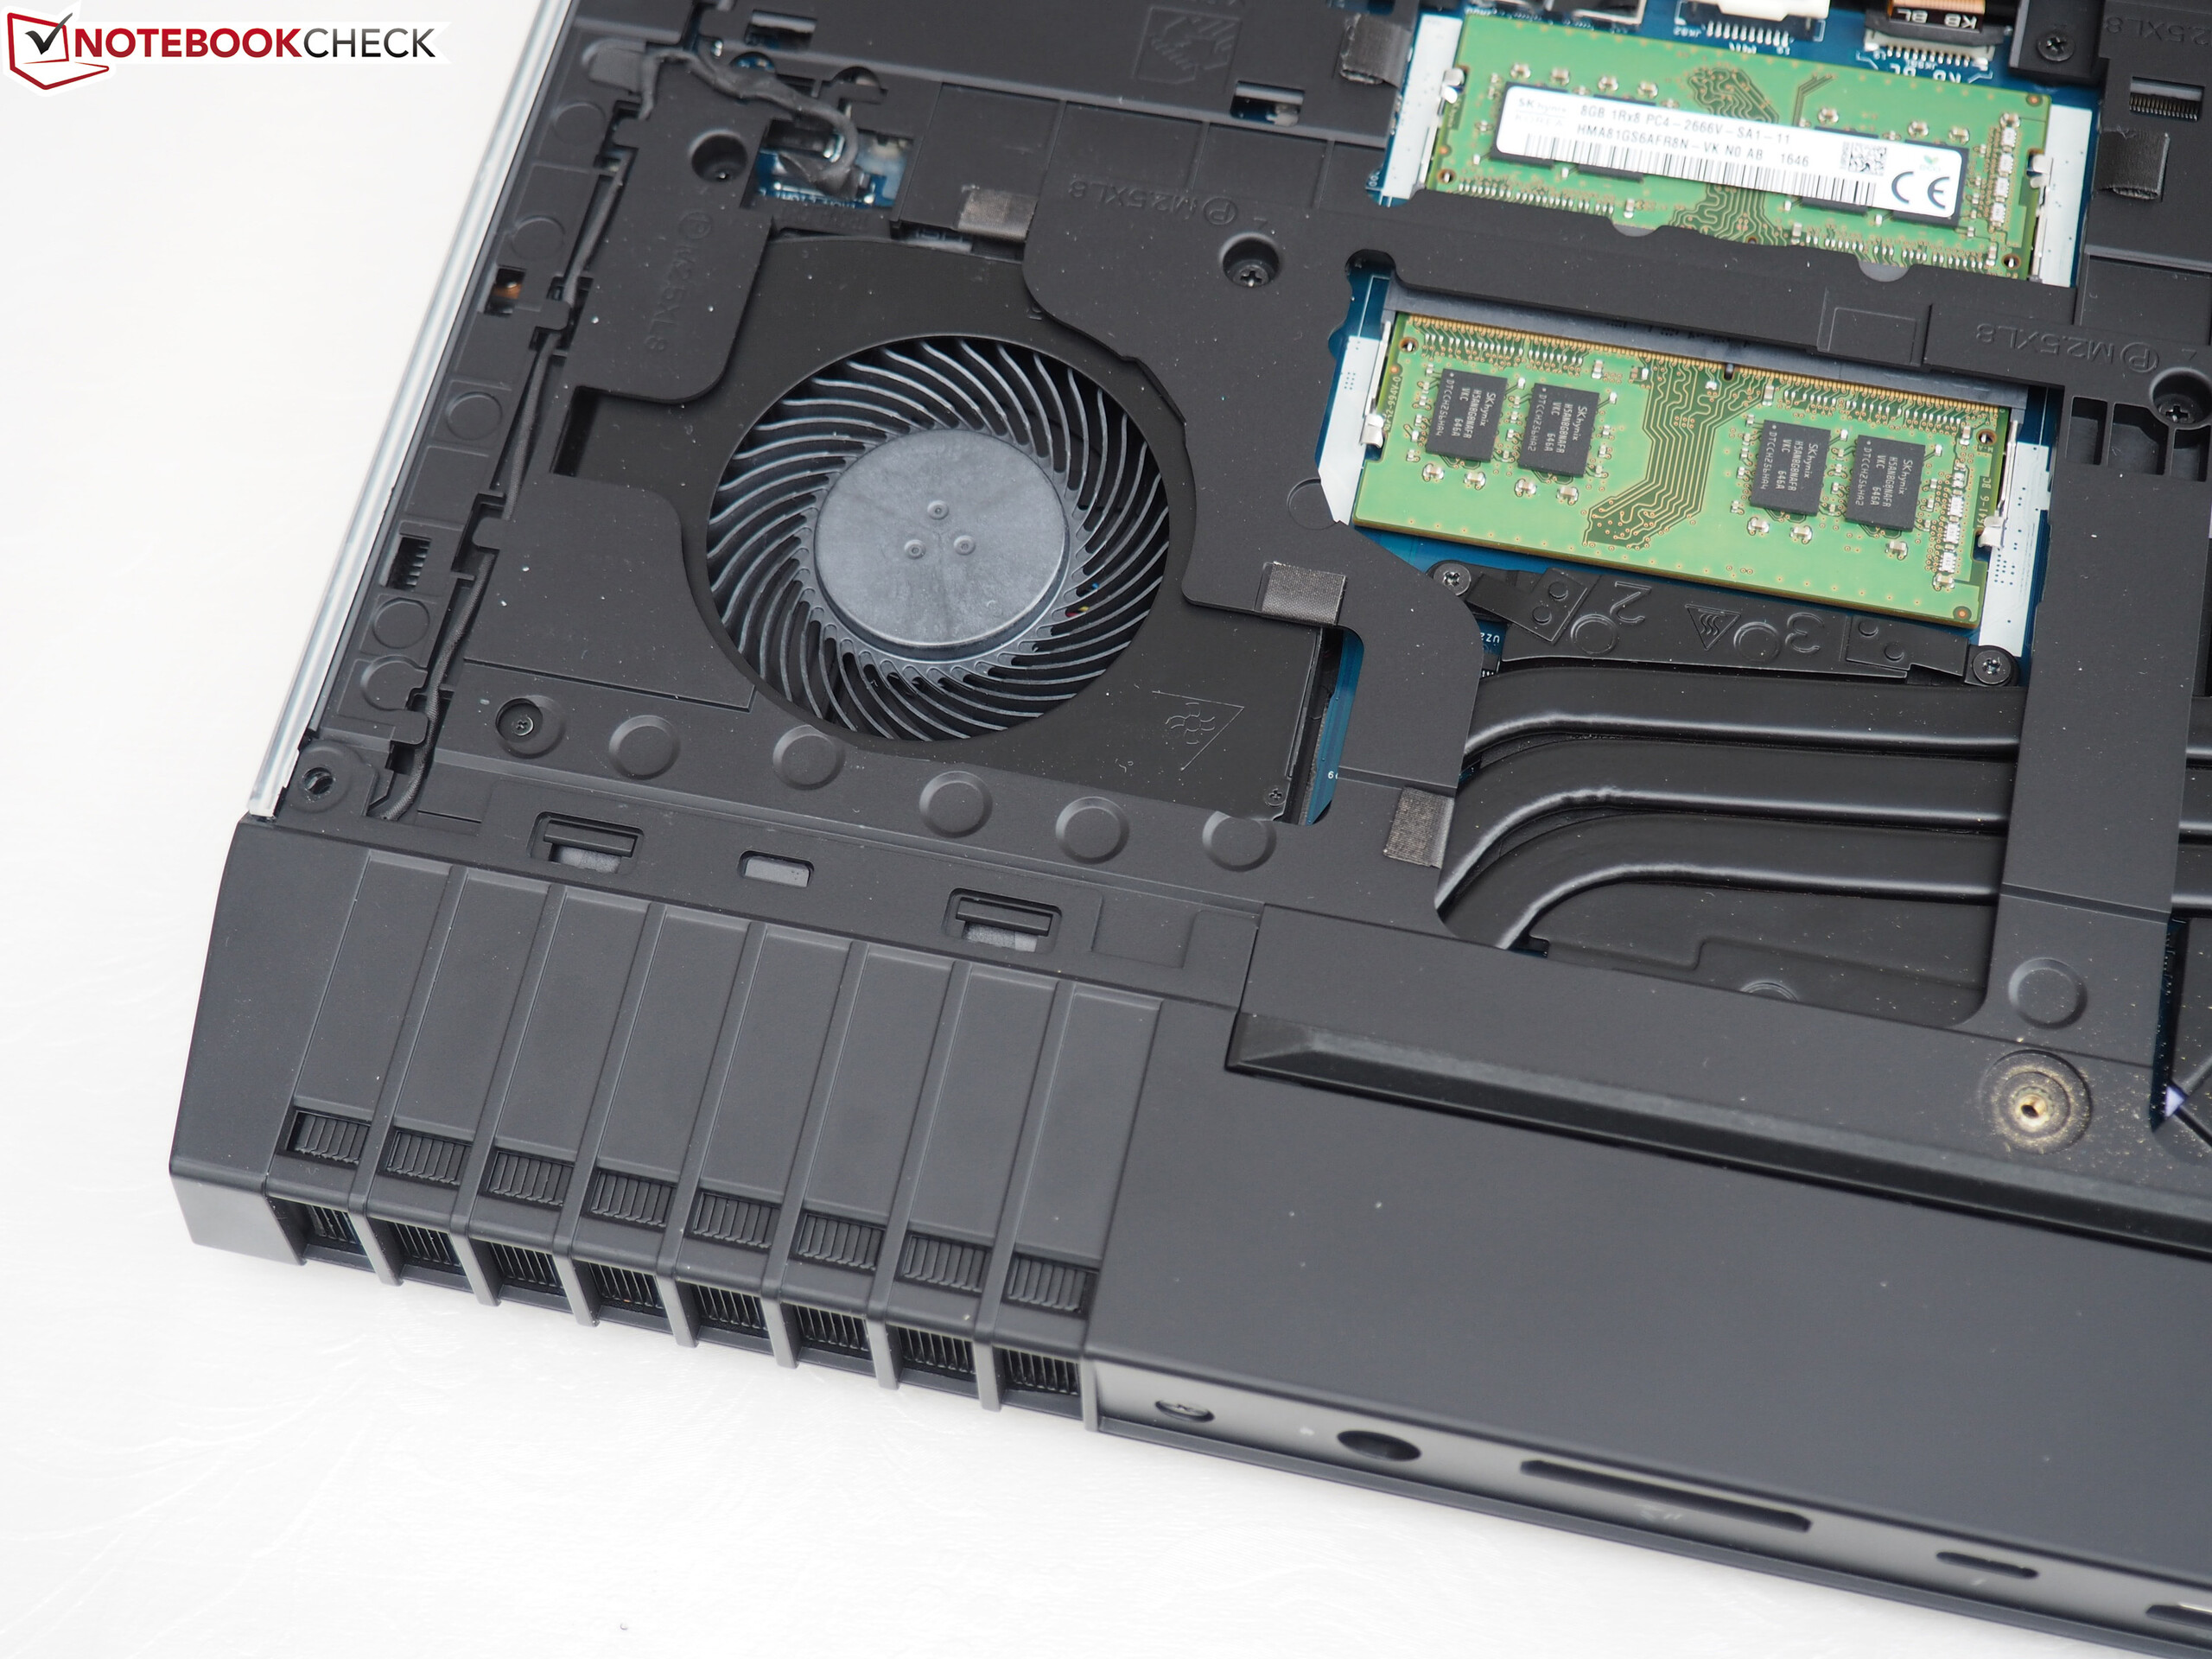
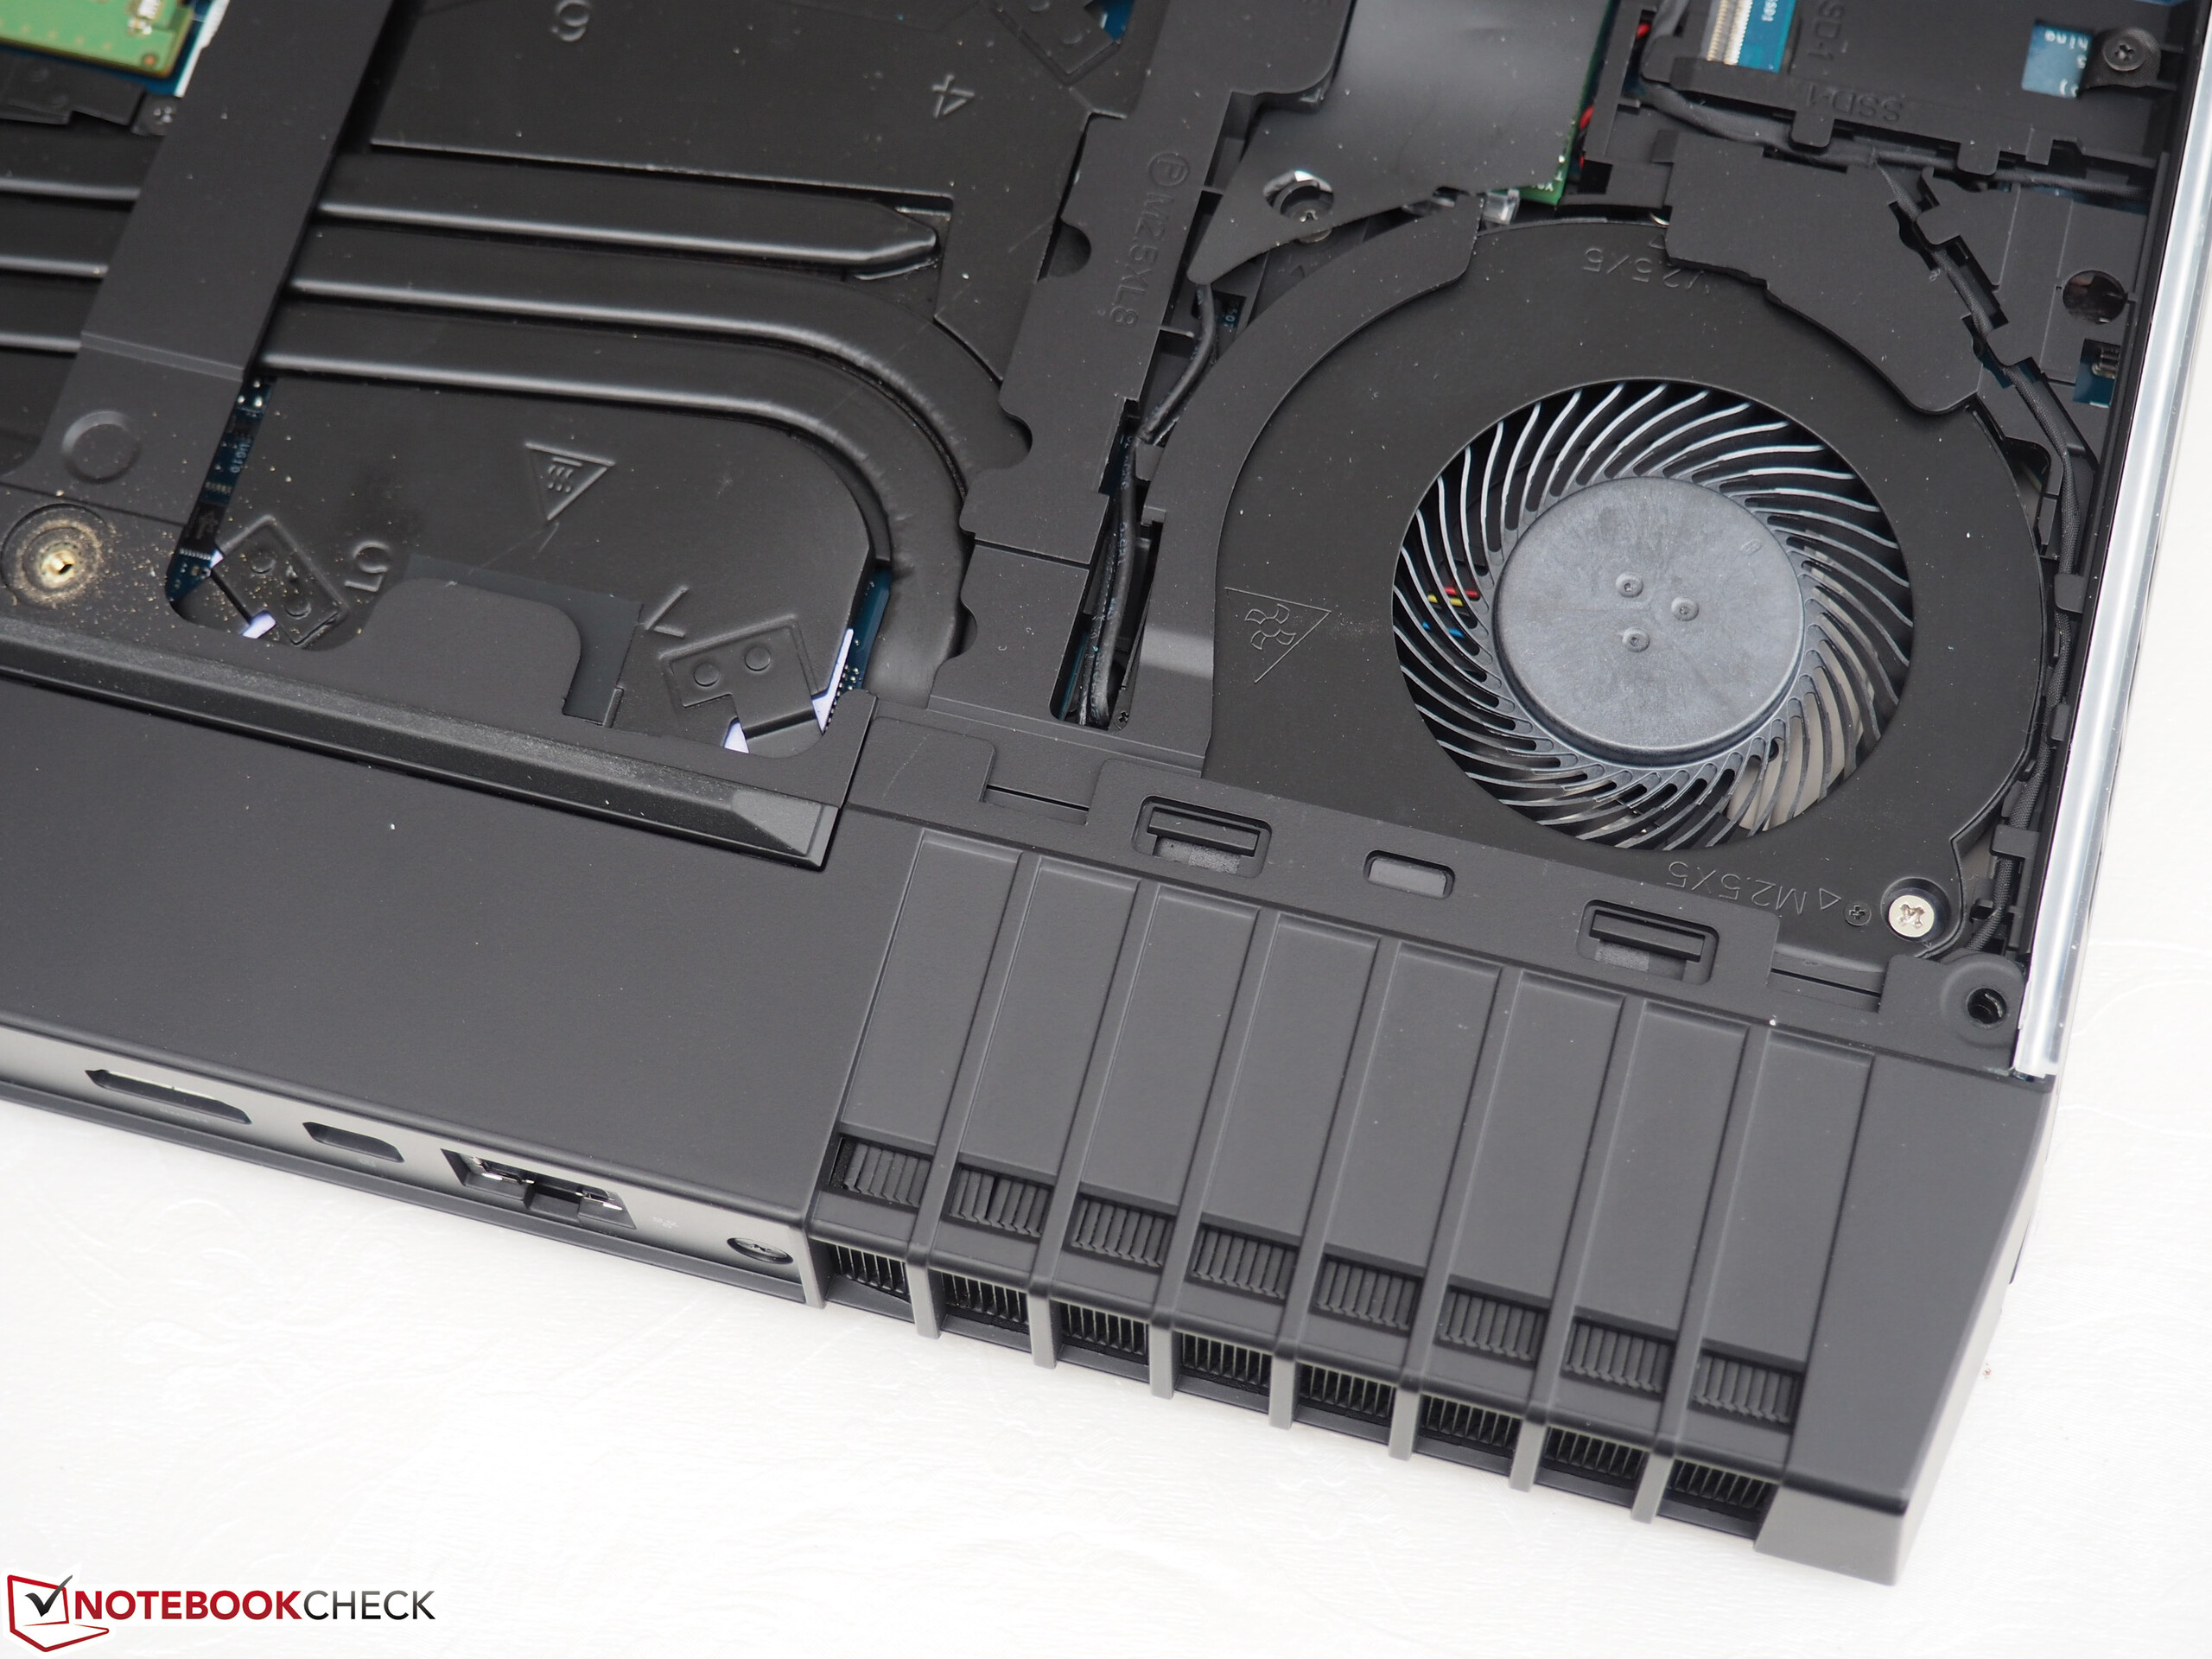
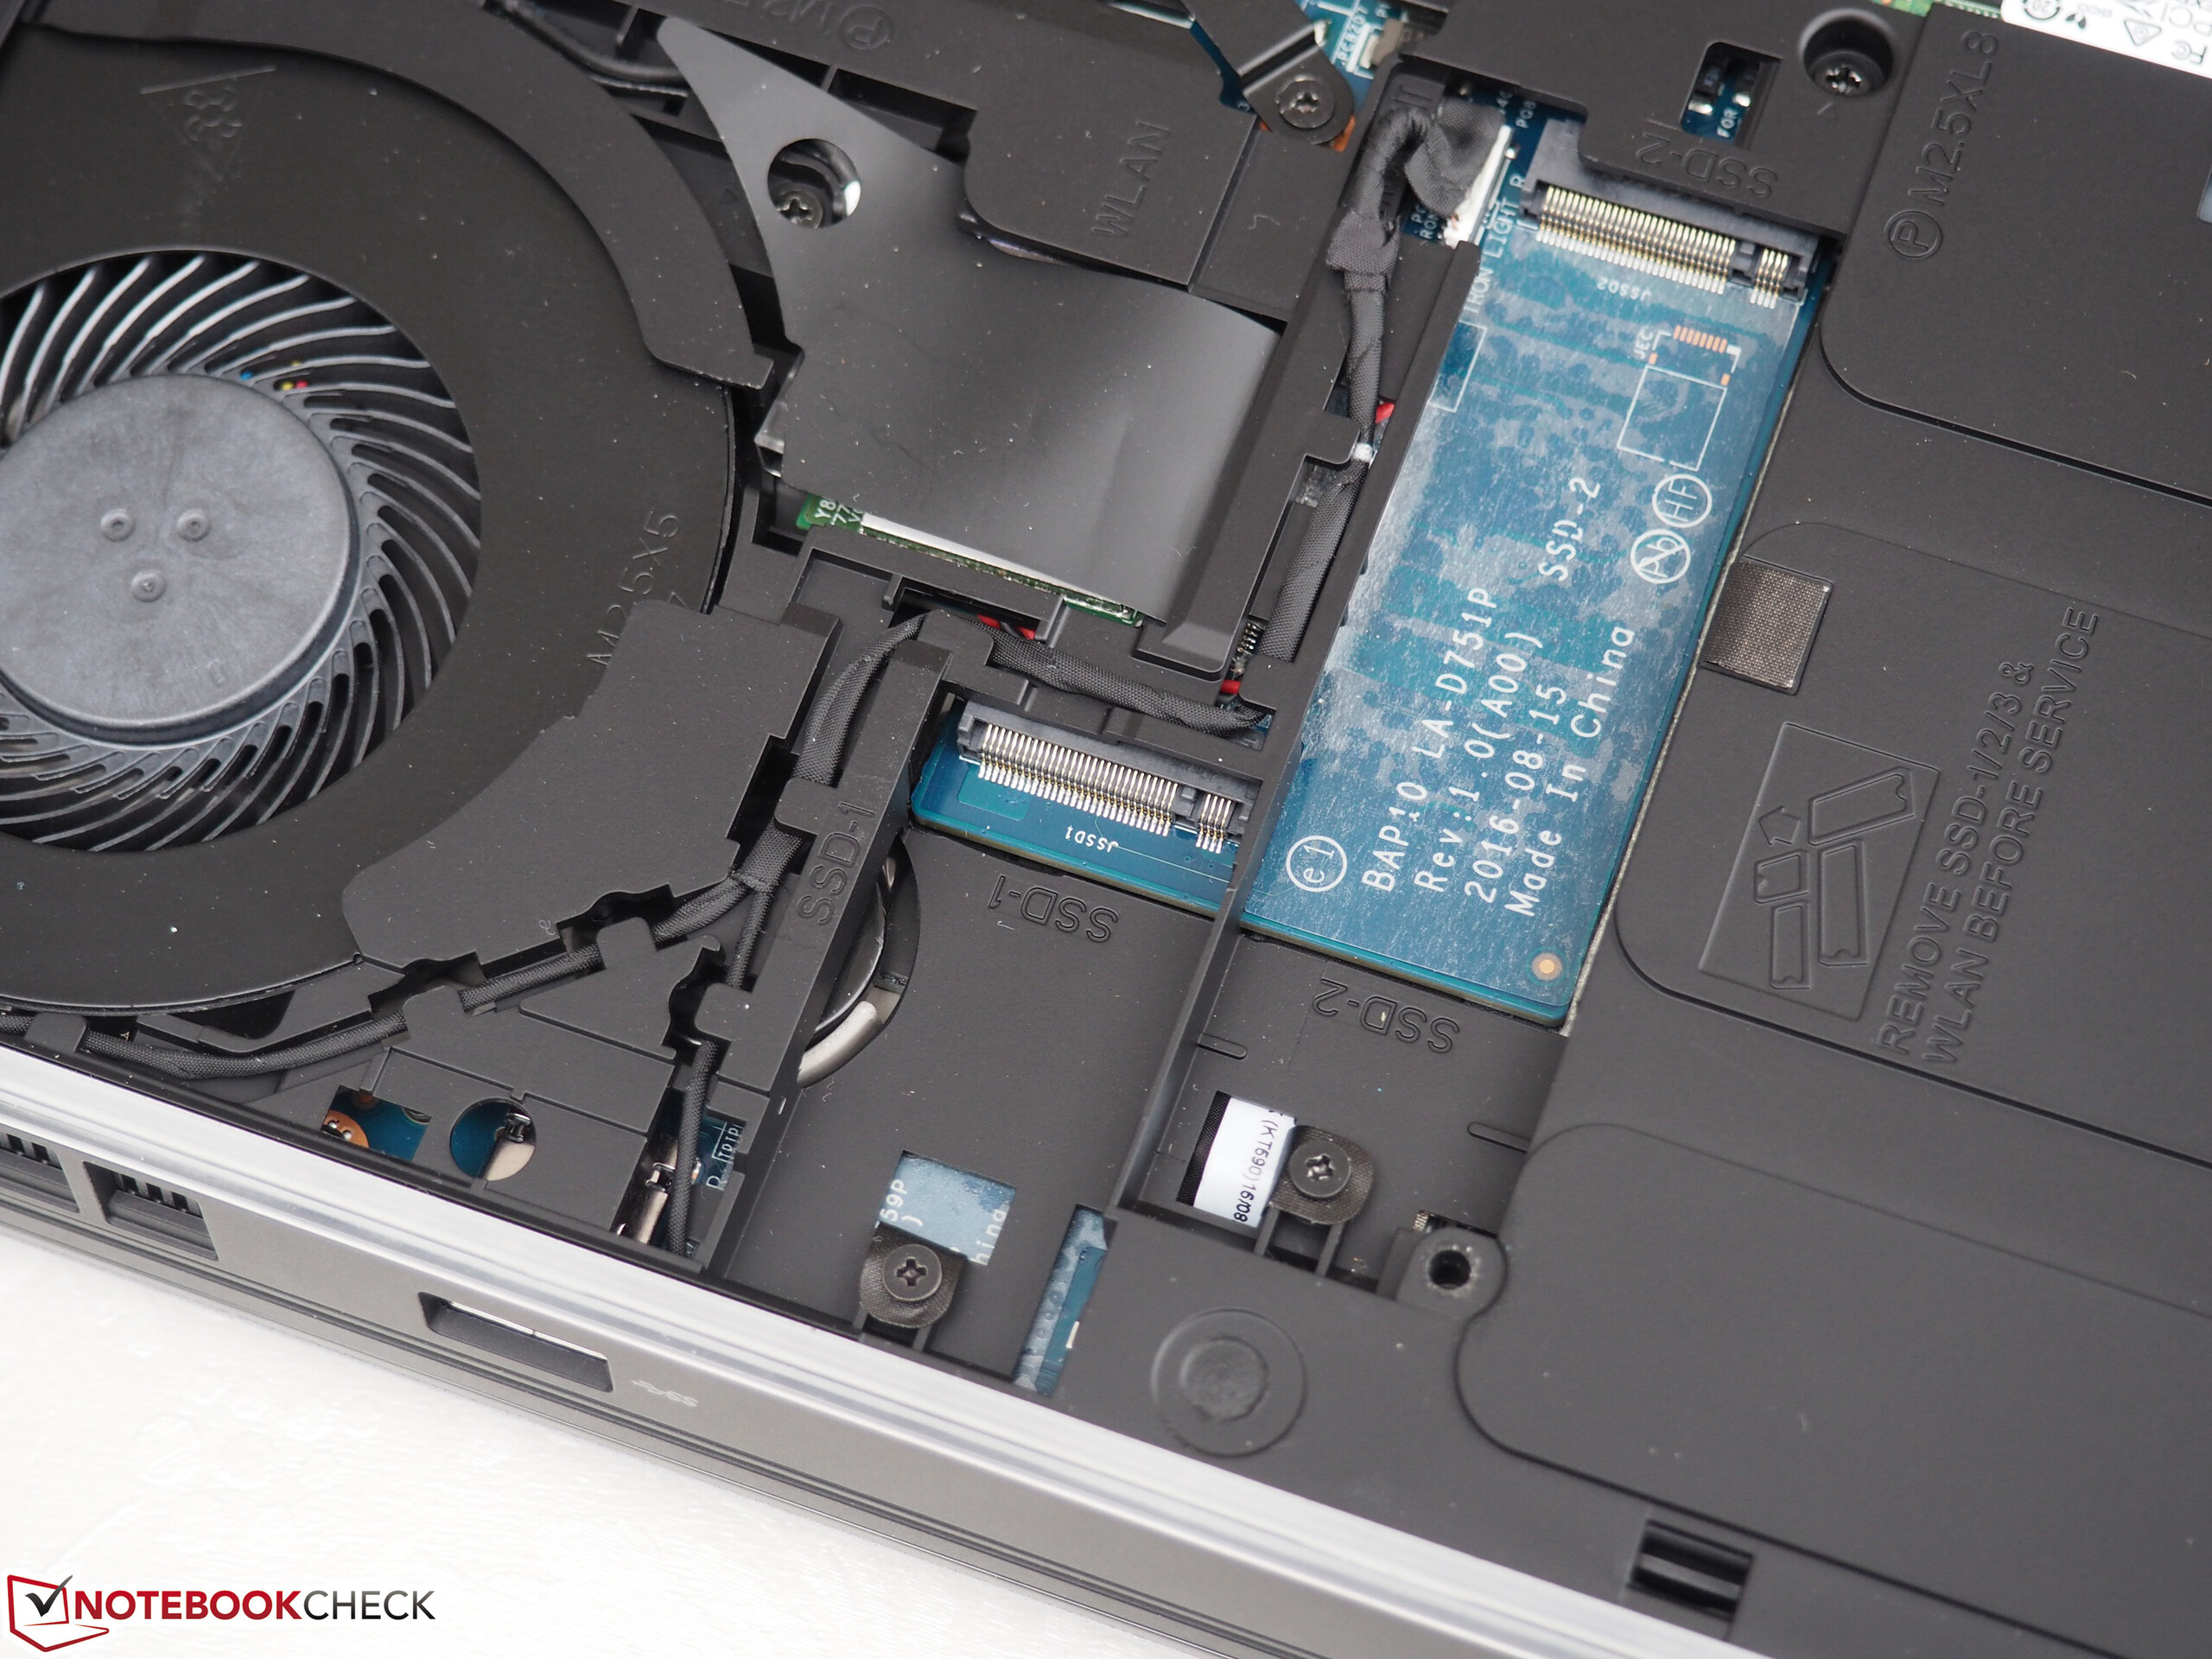
Many core gamers do not want to just use every option in the graphics menu; they also like to have full control over the upgrade and cleaning options inside the case. The Alienware 15 R3 performs better in this respect than the previous model. While you could only access the RAM, hard drives, and the wireless module via maintenance hatch on the Alienware 15 R2, you can now – with certain limitations – also access the fans and the cooling system.
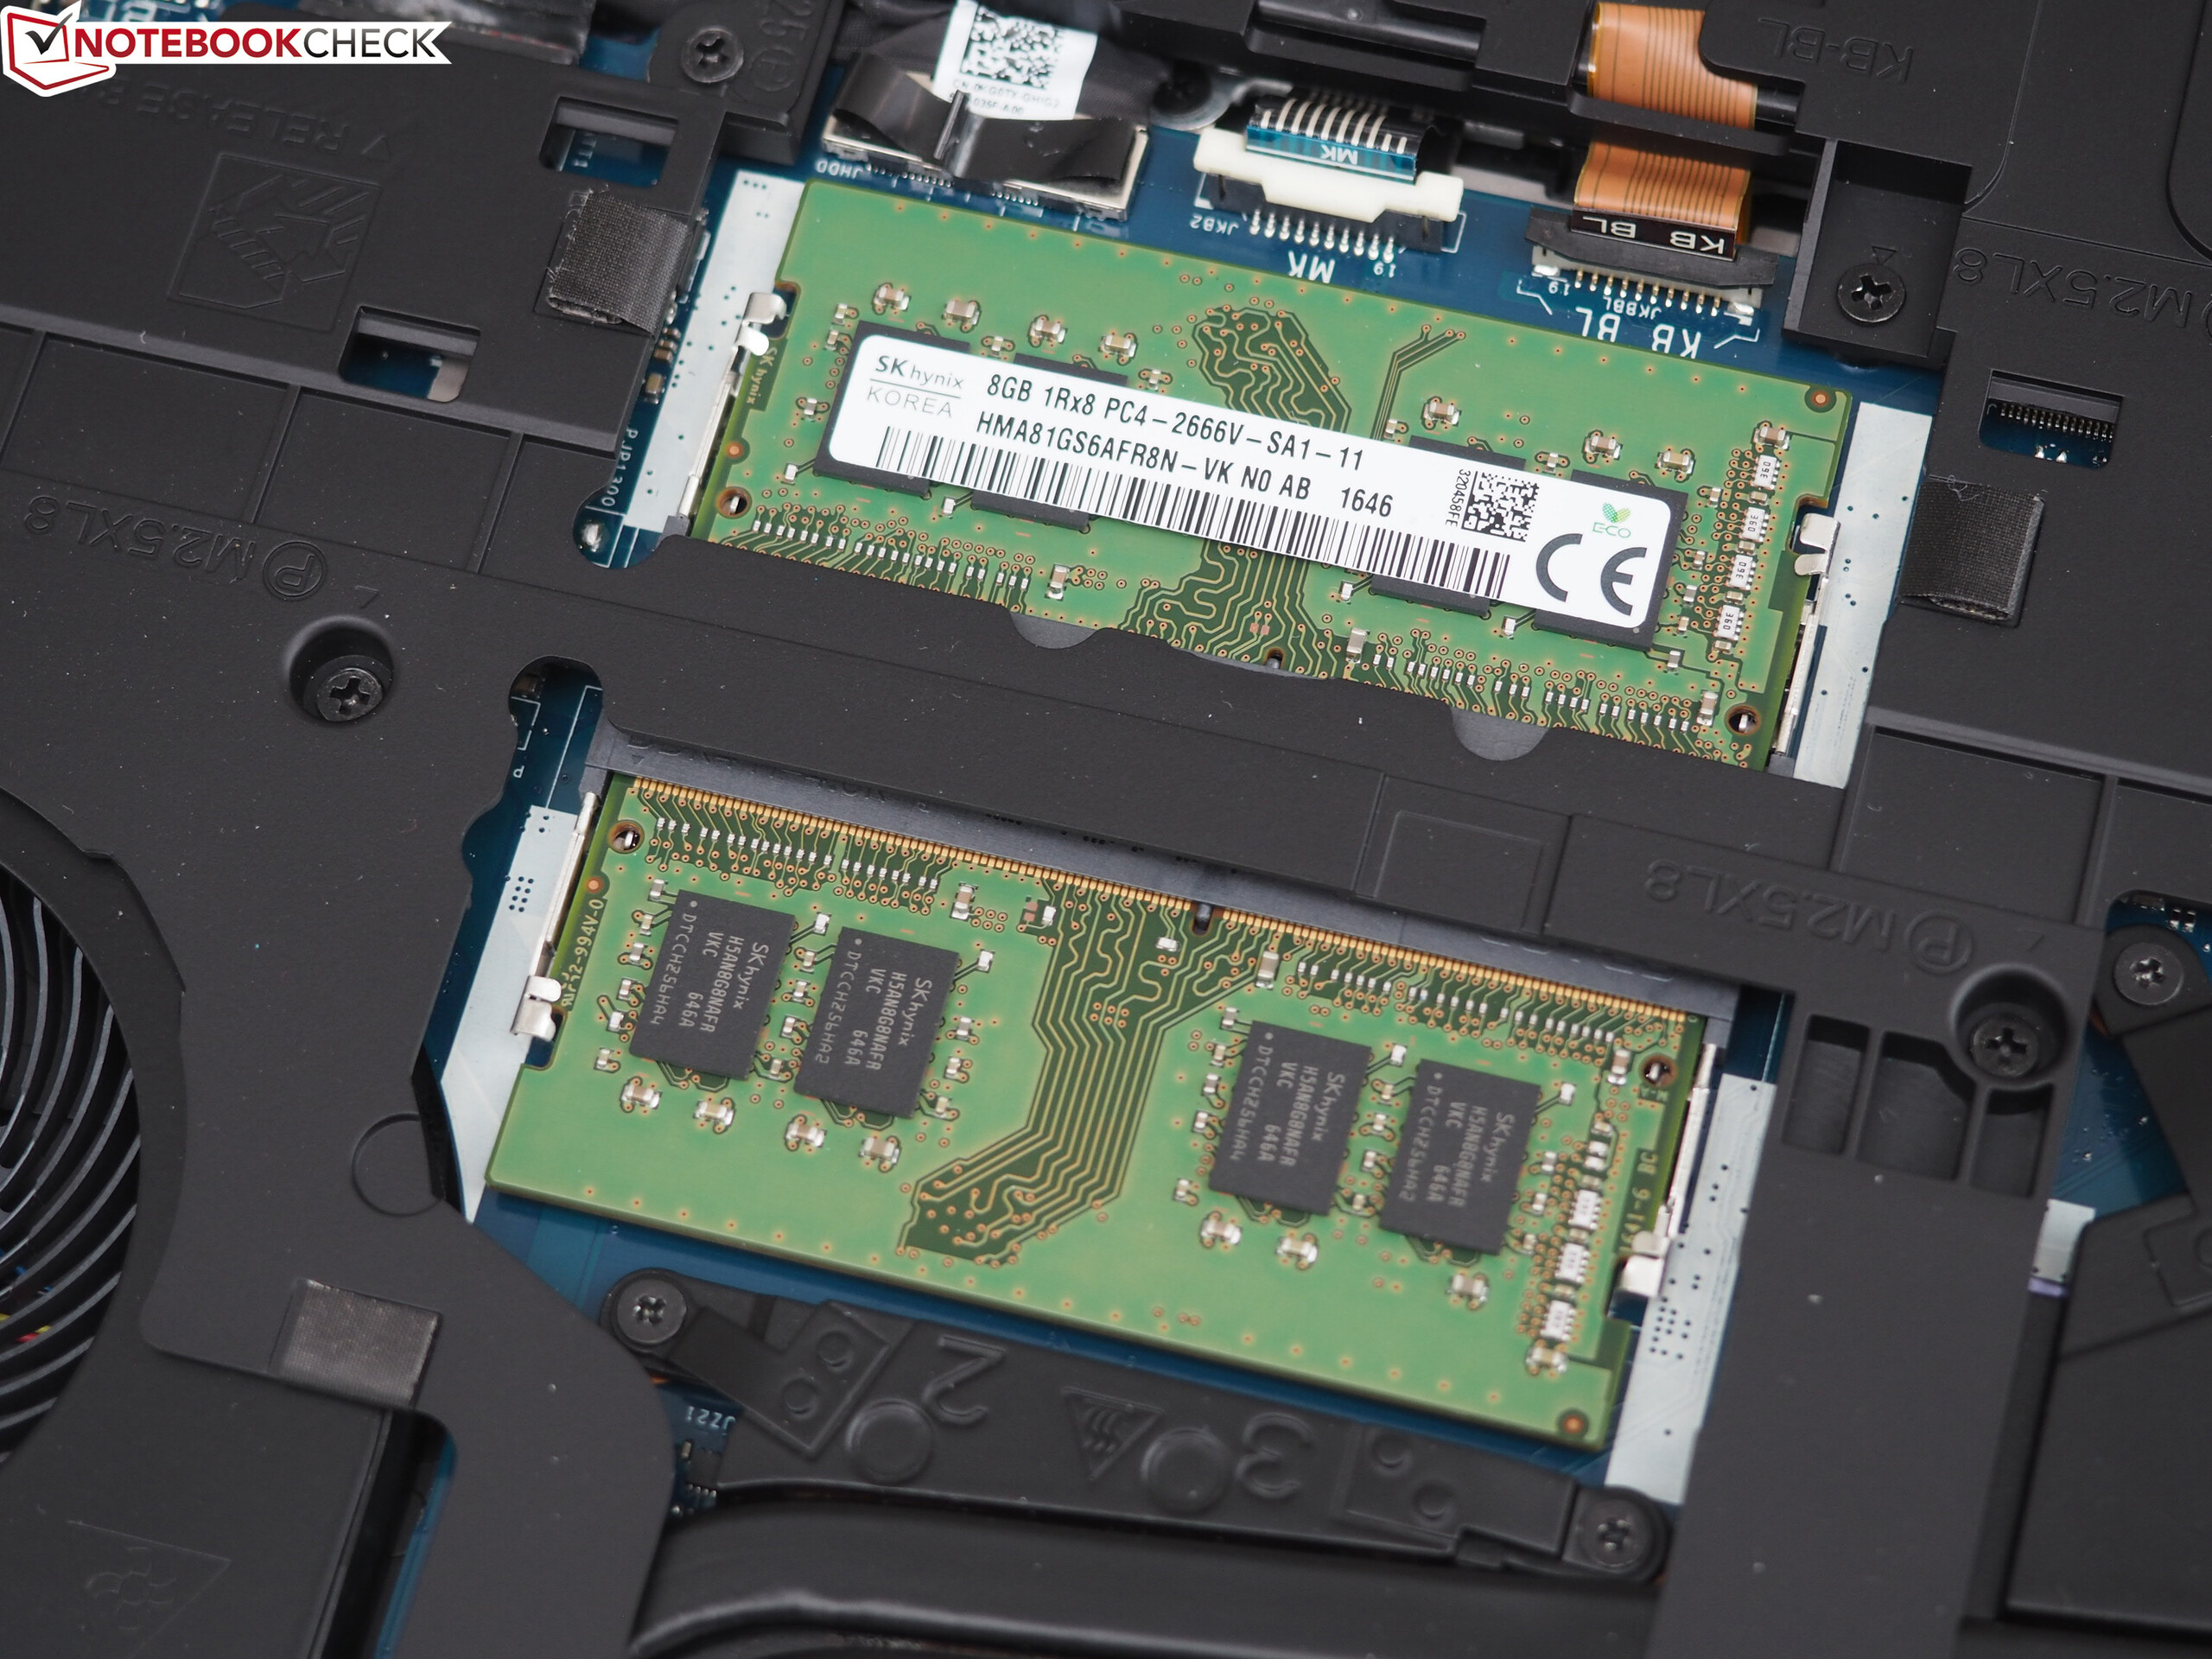
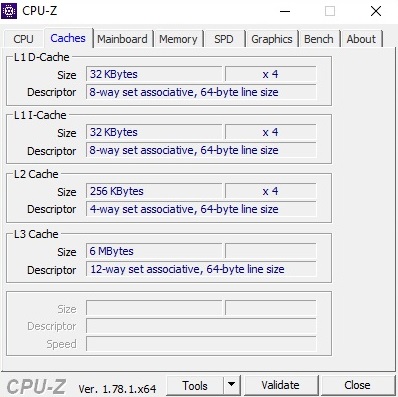
It is once again necessary to disassemble the chassis further to access all internals and the battery. The maintenance hatch itself is easy to remove since it is "only" secured by seven screws (and you also have to pry the hatch). The Alienware 15 R3 has a total of two DDR4-RAM slots, one 2.5-inch slot, two M.2 slots (2280) with NVMe/PCIe support and one smaller M.2 slot, which can also be equipped with an SSD according to the label. Processor and graphics card are not replaceable – which is pretty common nowadays.
Warranty
A 12-month base warranty (Premium support with on-site service) is pretty sparse. An upgrade to two, three, or four years costs between 375 and 1124 Euros (~$397 and ~$1192), which is quite a lot in our opinion. The optional coverage for accidents is much more affordable.
Please see our Guarantees, Return Policies and Warranties FAQ for country-specific information.
Software
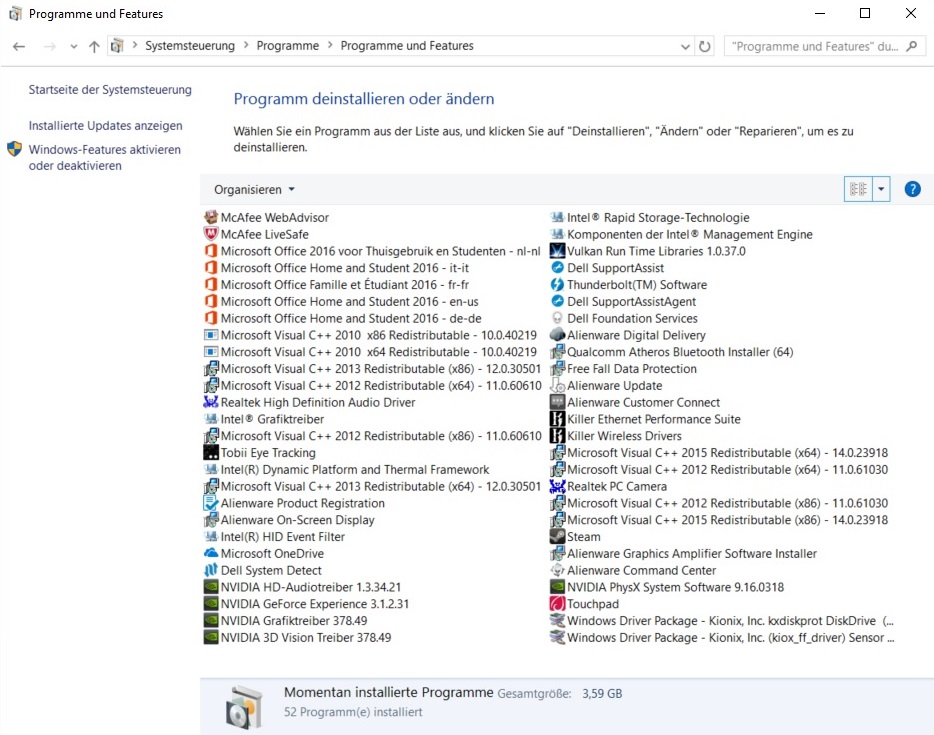
The software installation is quite comprehensive. Besides trial versions for Microsoft's Office 2016 and McAfee's LiveSafe as well as the previously mentioned Killer Performance Suite, you will also find several tools from Alienware.
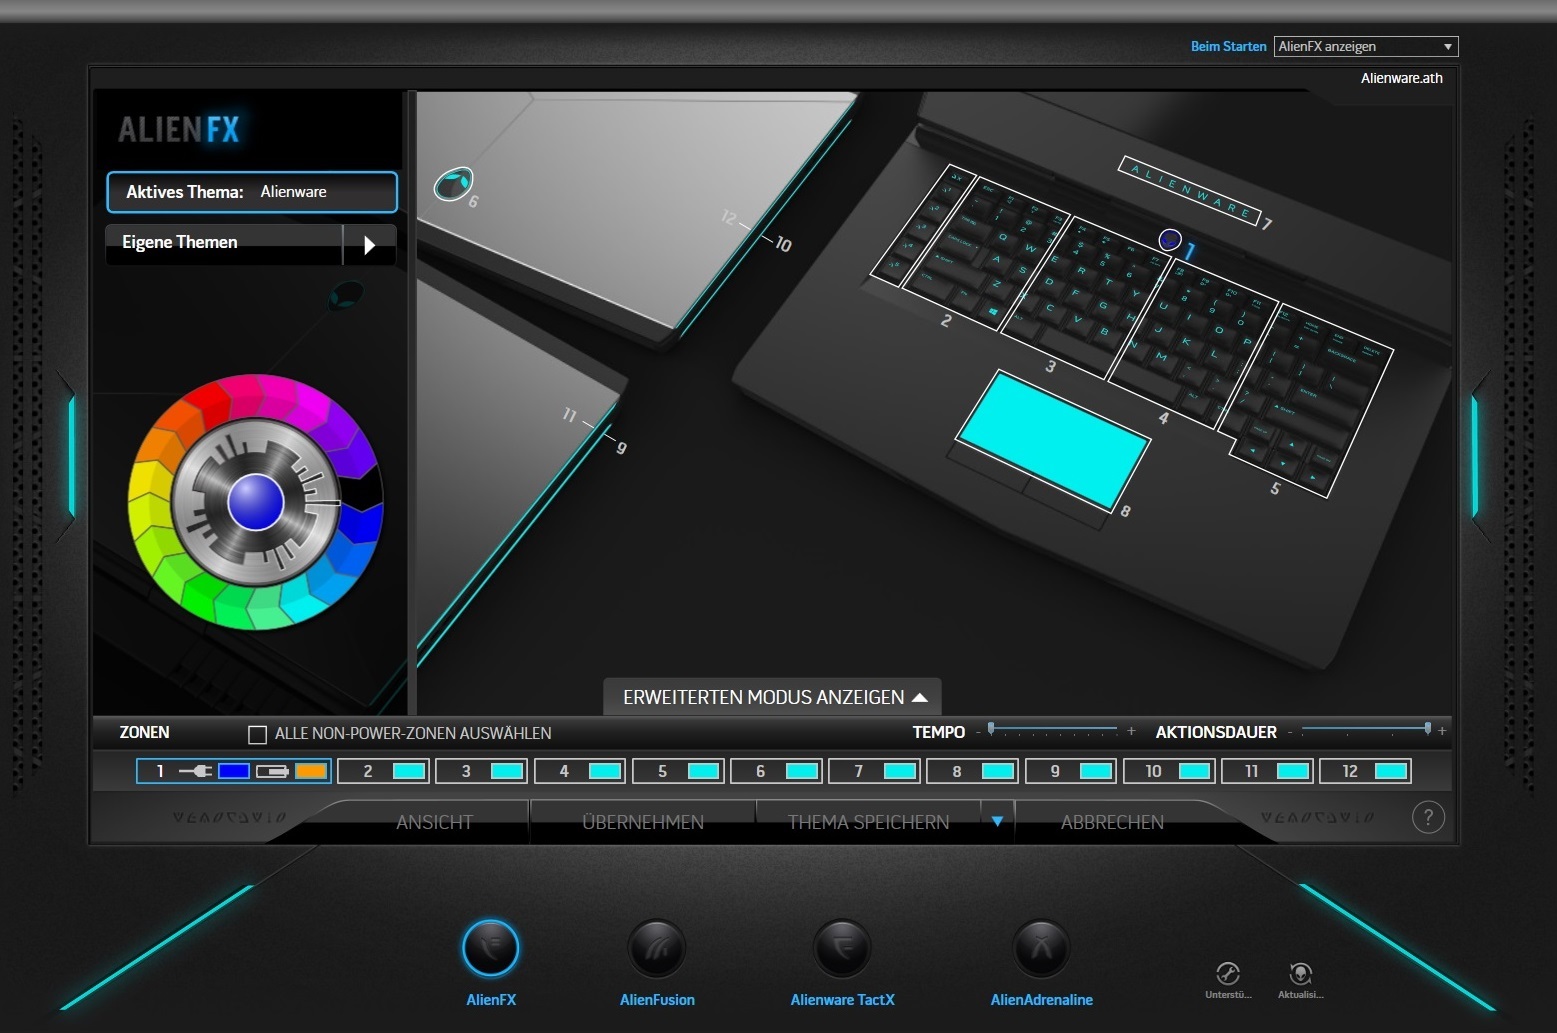
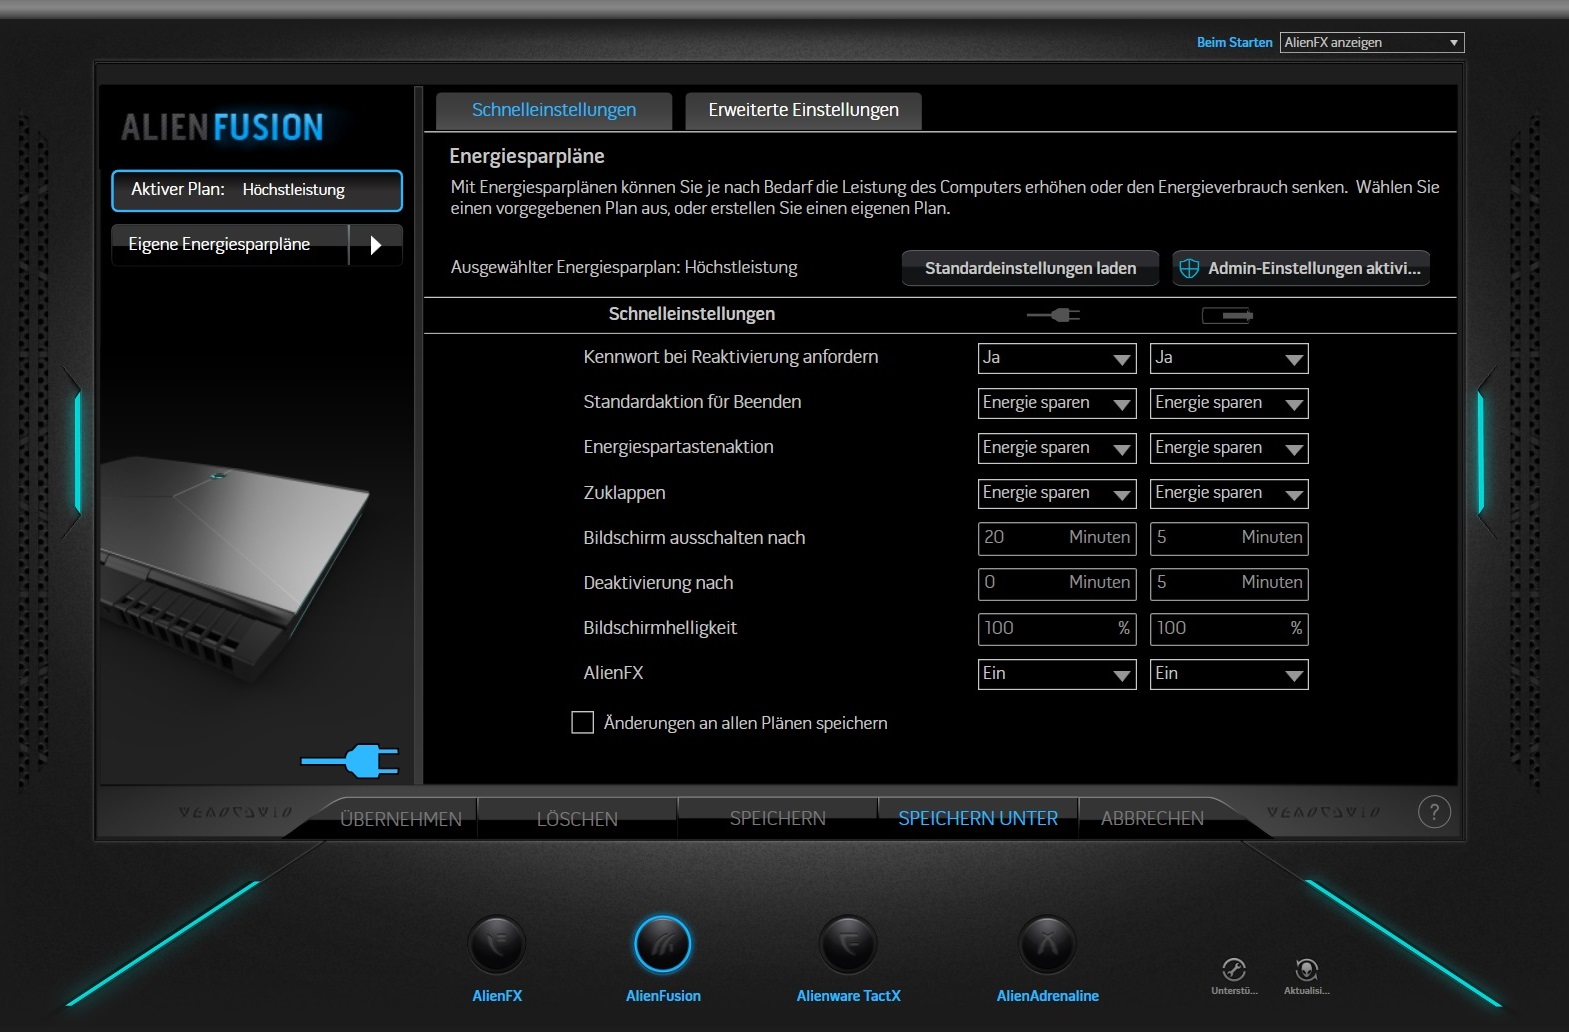
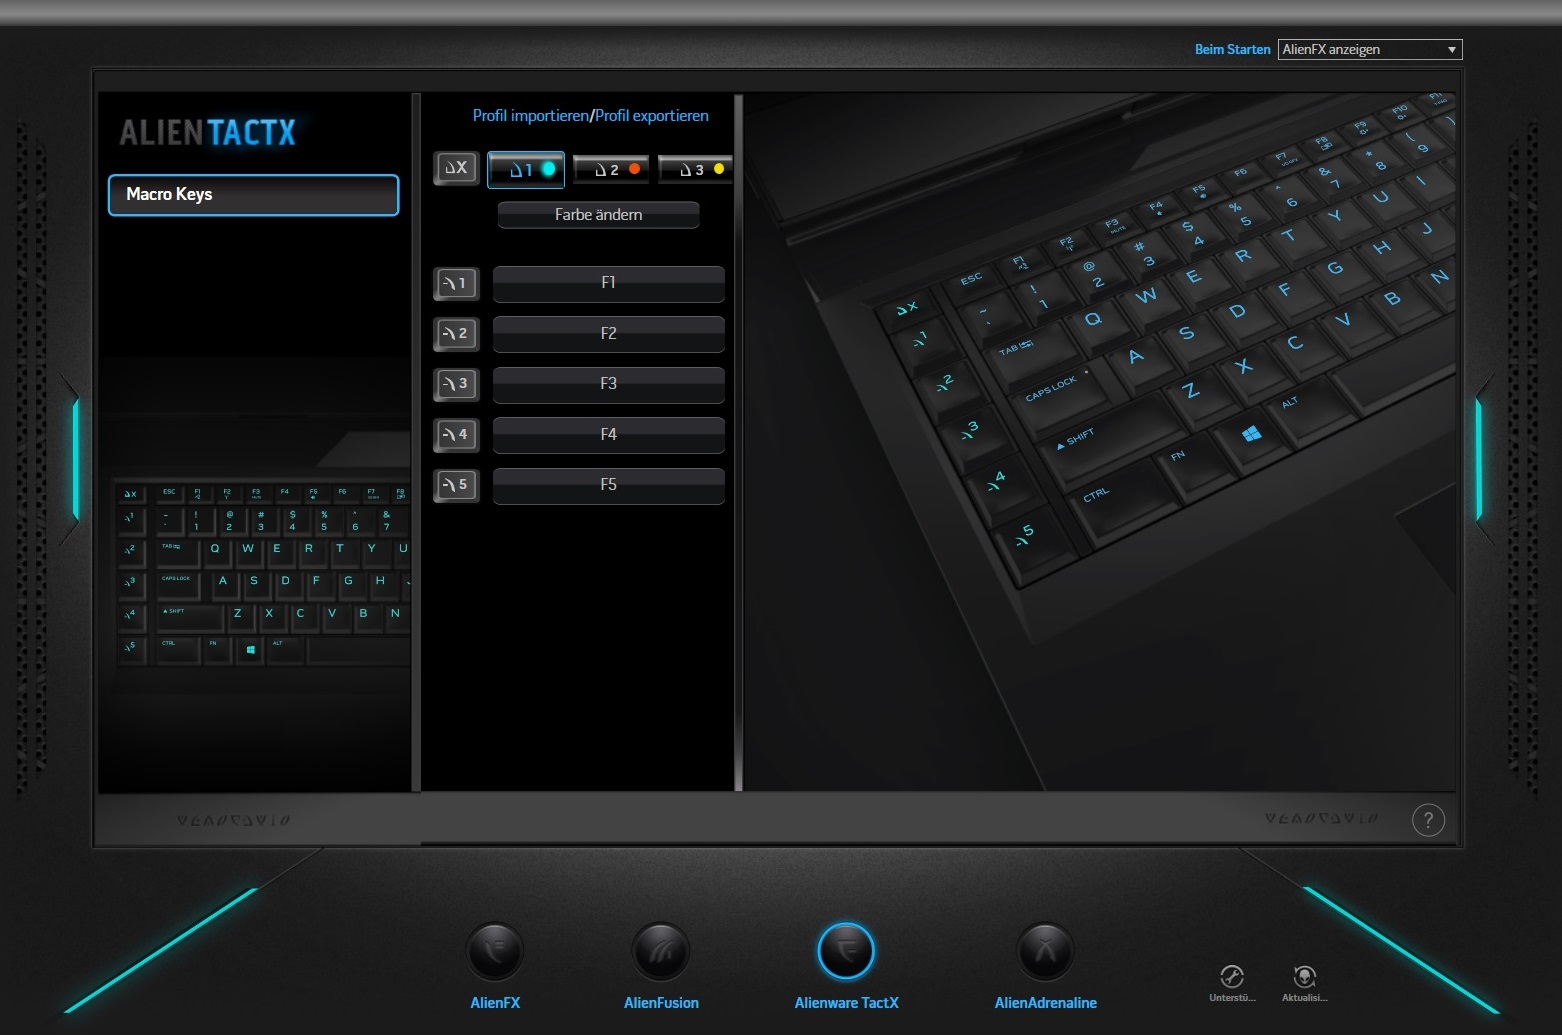
The central software hub is the Command Center, which is divided into four sub-menus. It starts with AlienFX, which helps with customizing the different lighting zones. The next items are AlienFusion (power-saving plans) and AlienTactX (configuration of the macro keys). The whole package is rounded off by AlienAdrenaline, which checks the status of the Graphics Amplifier. A manual fan control or an overclocking menu for the CPU and GPU are not available. Other notebook manufacturers (like MSI, Asus & Clevo, for example) usually offer more in this respect.
Input Devices
Keyboard
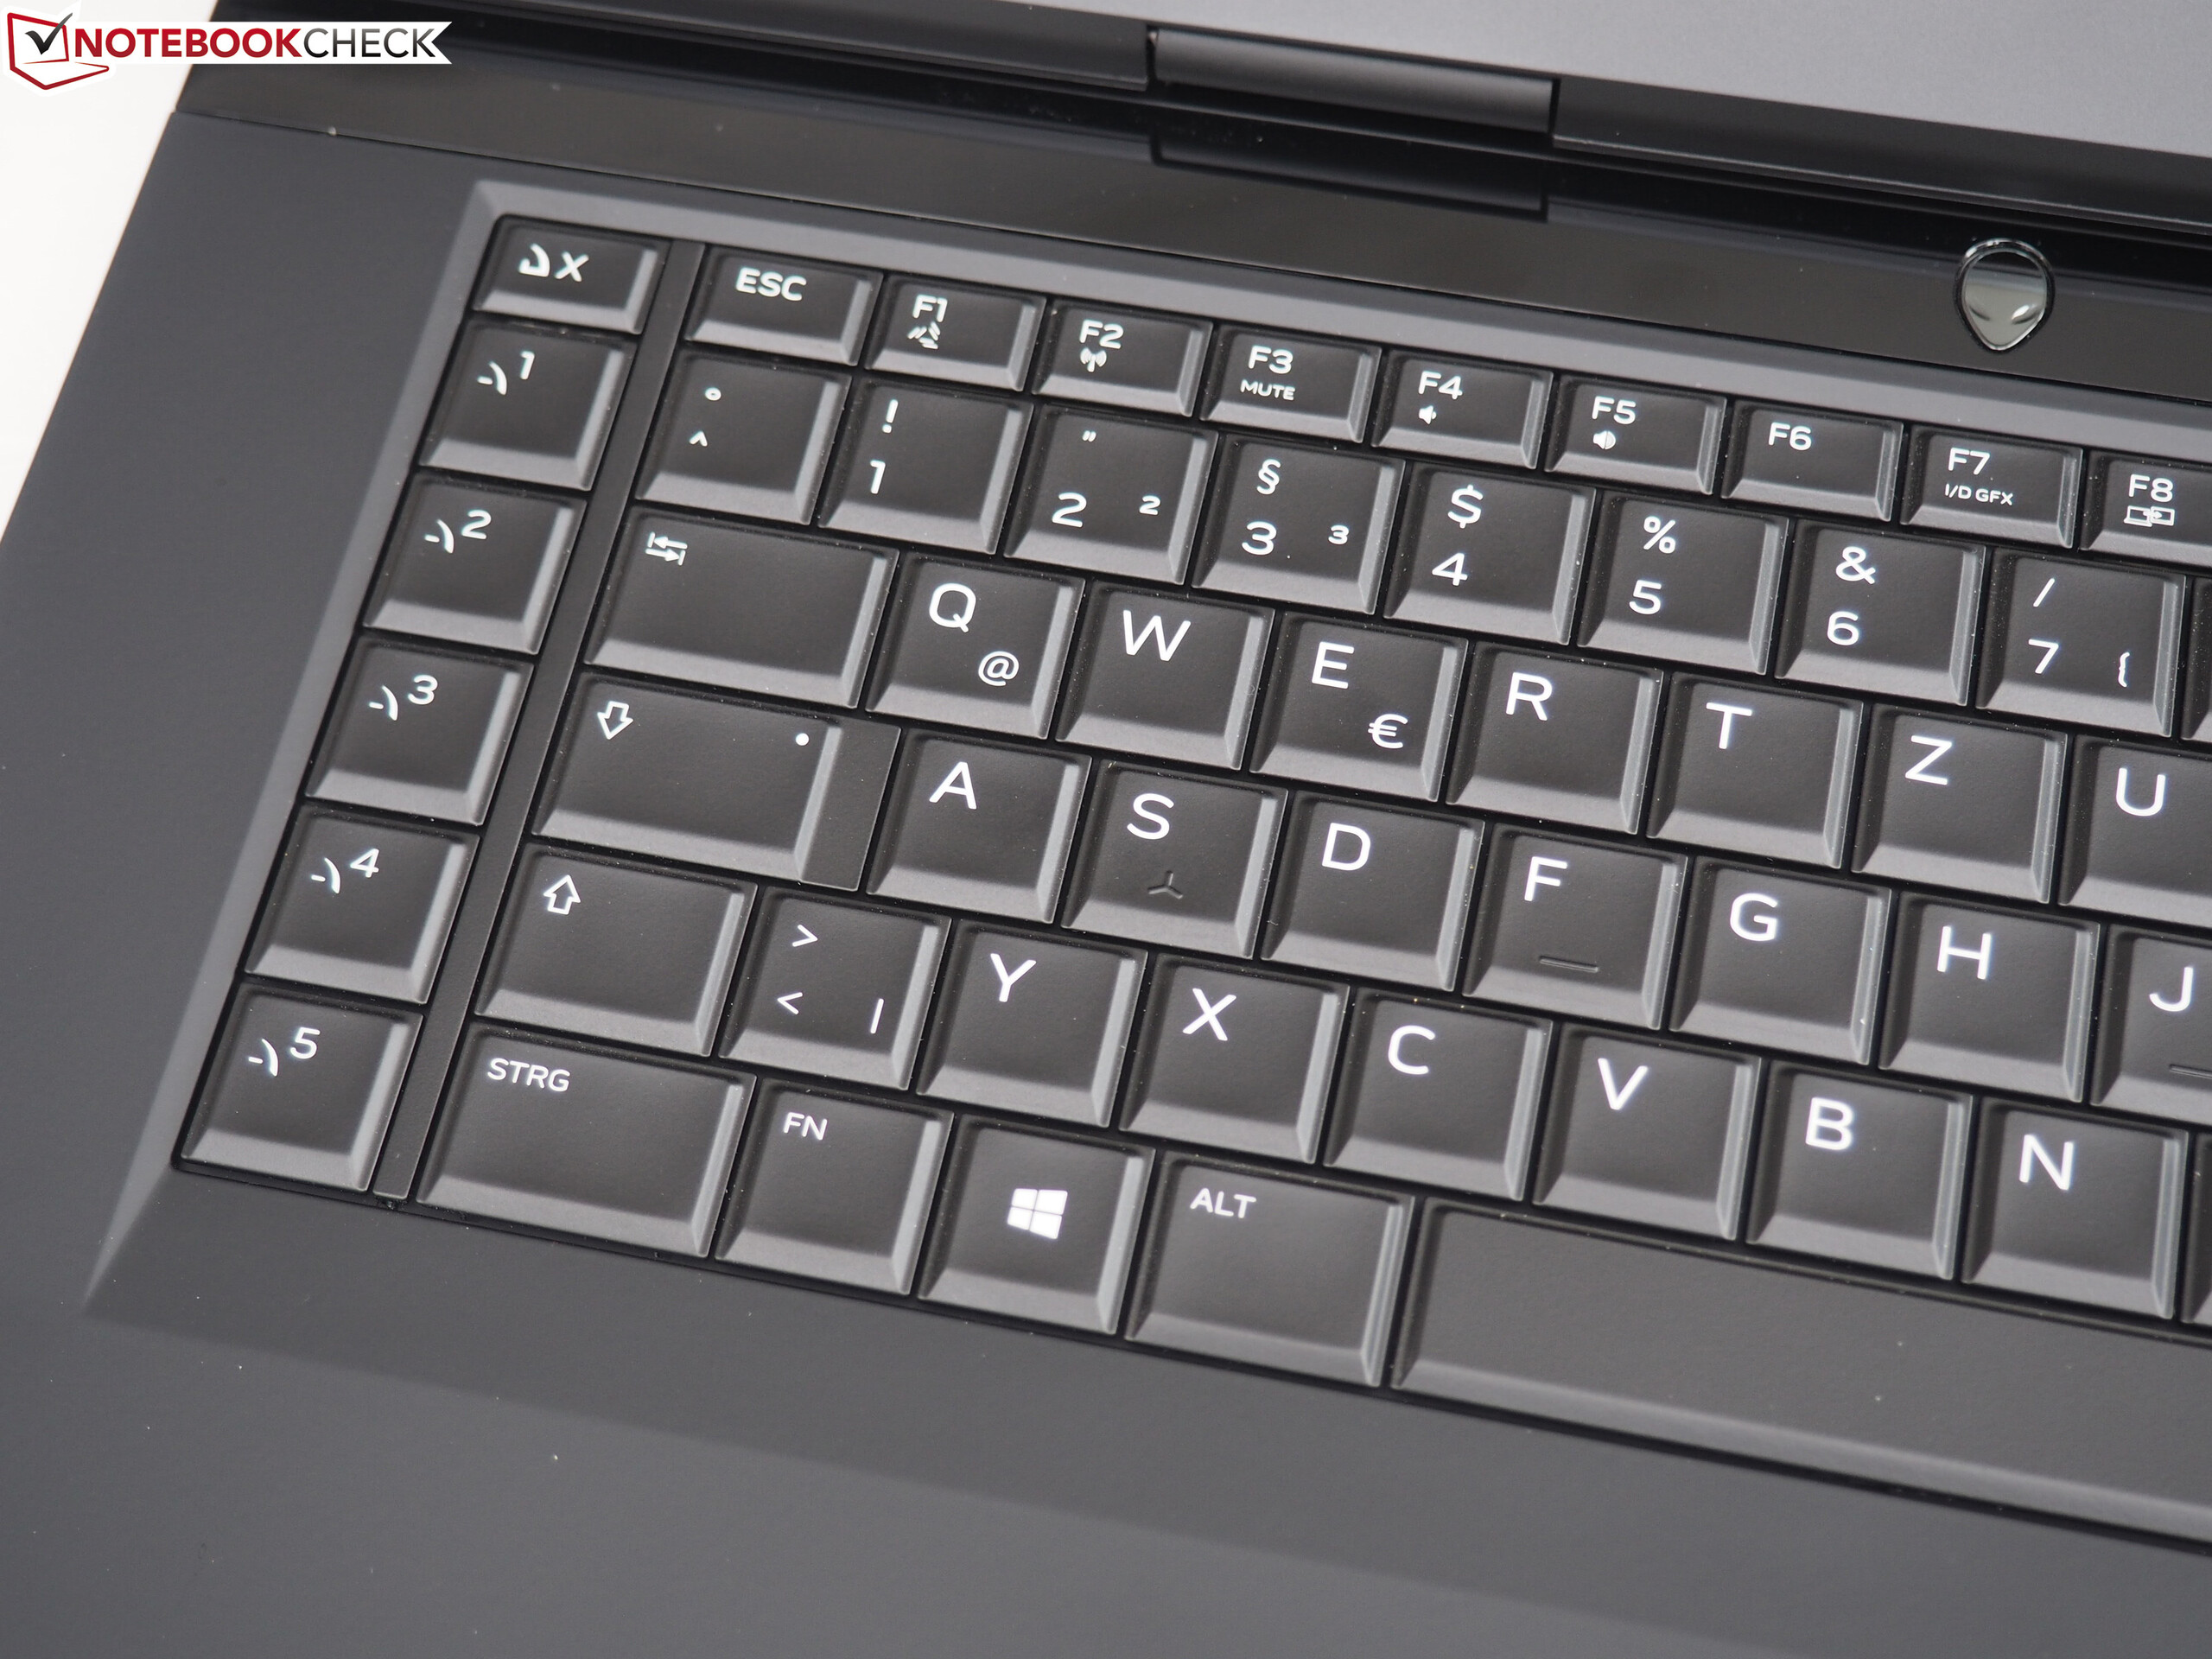
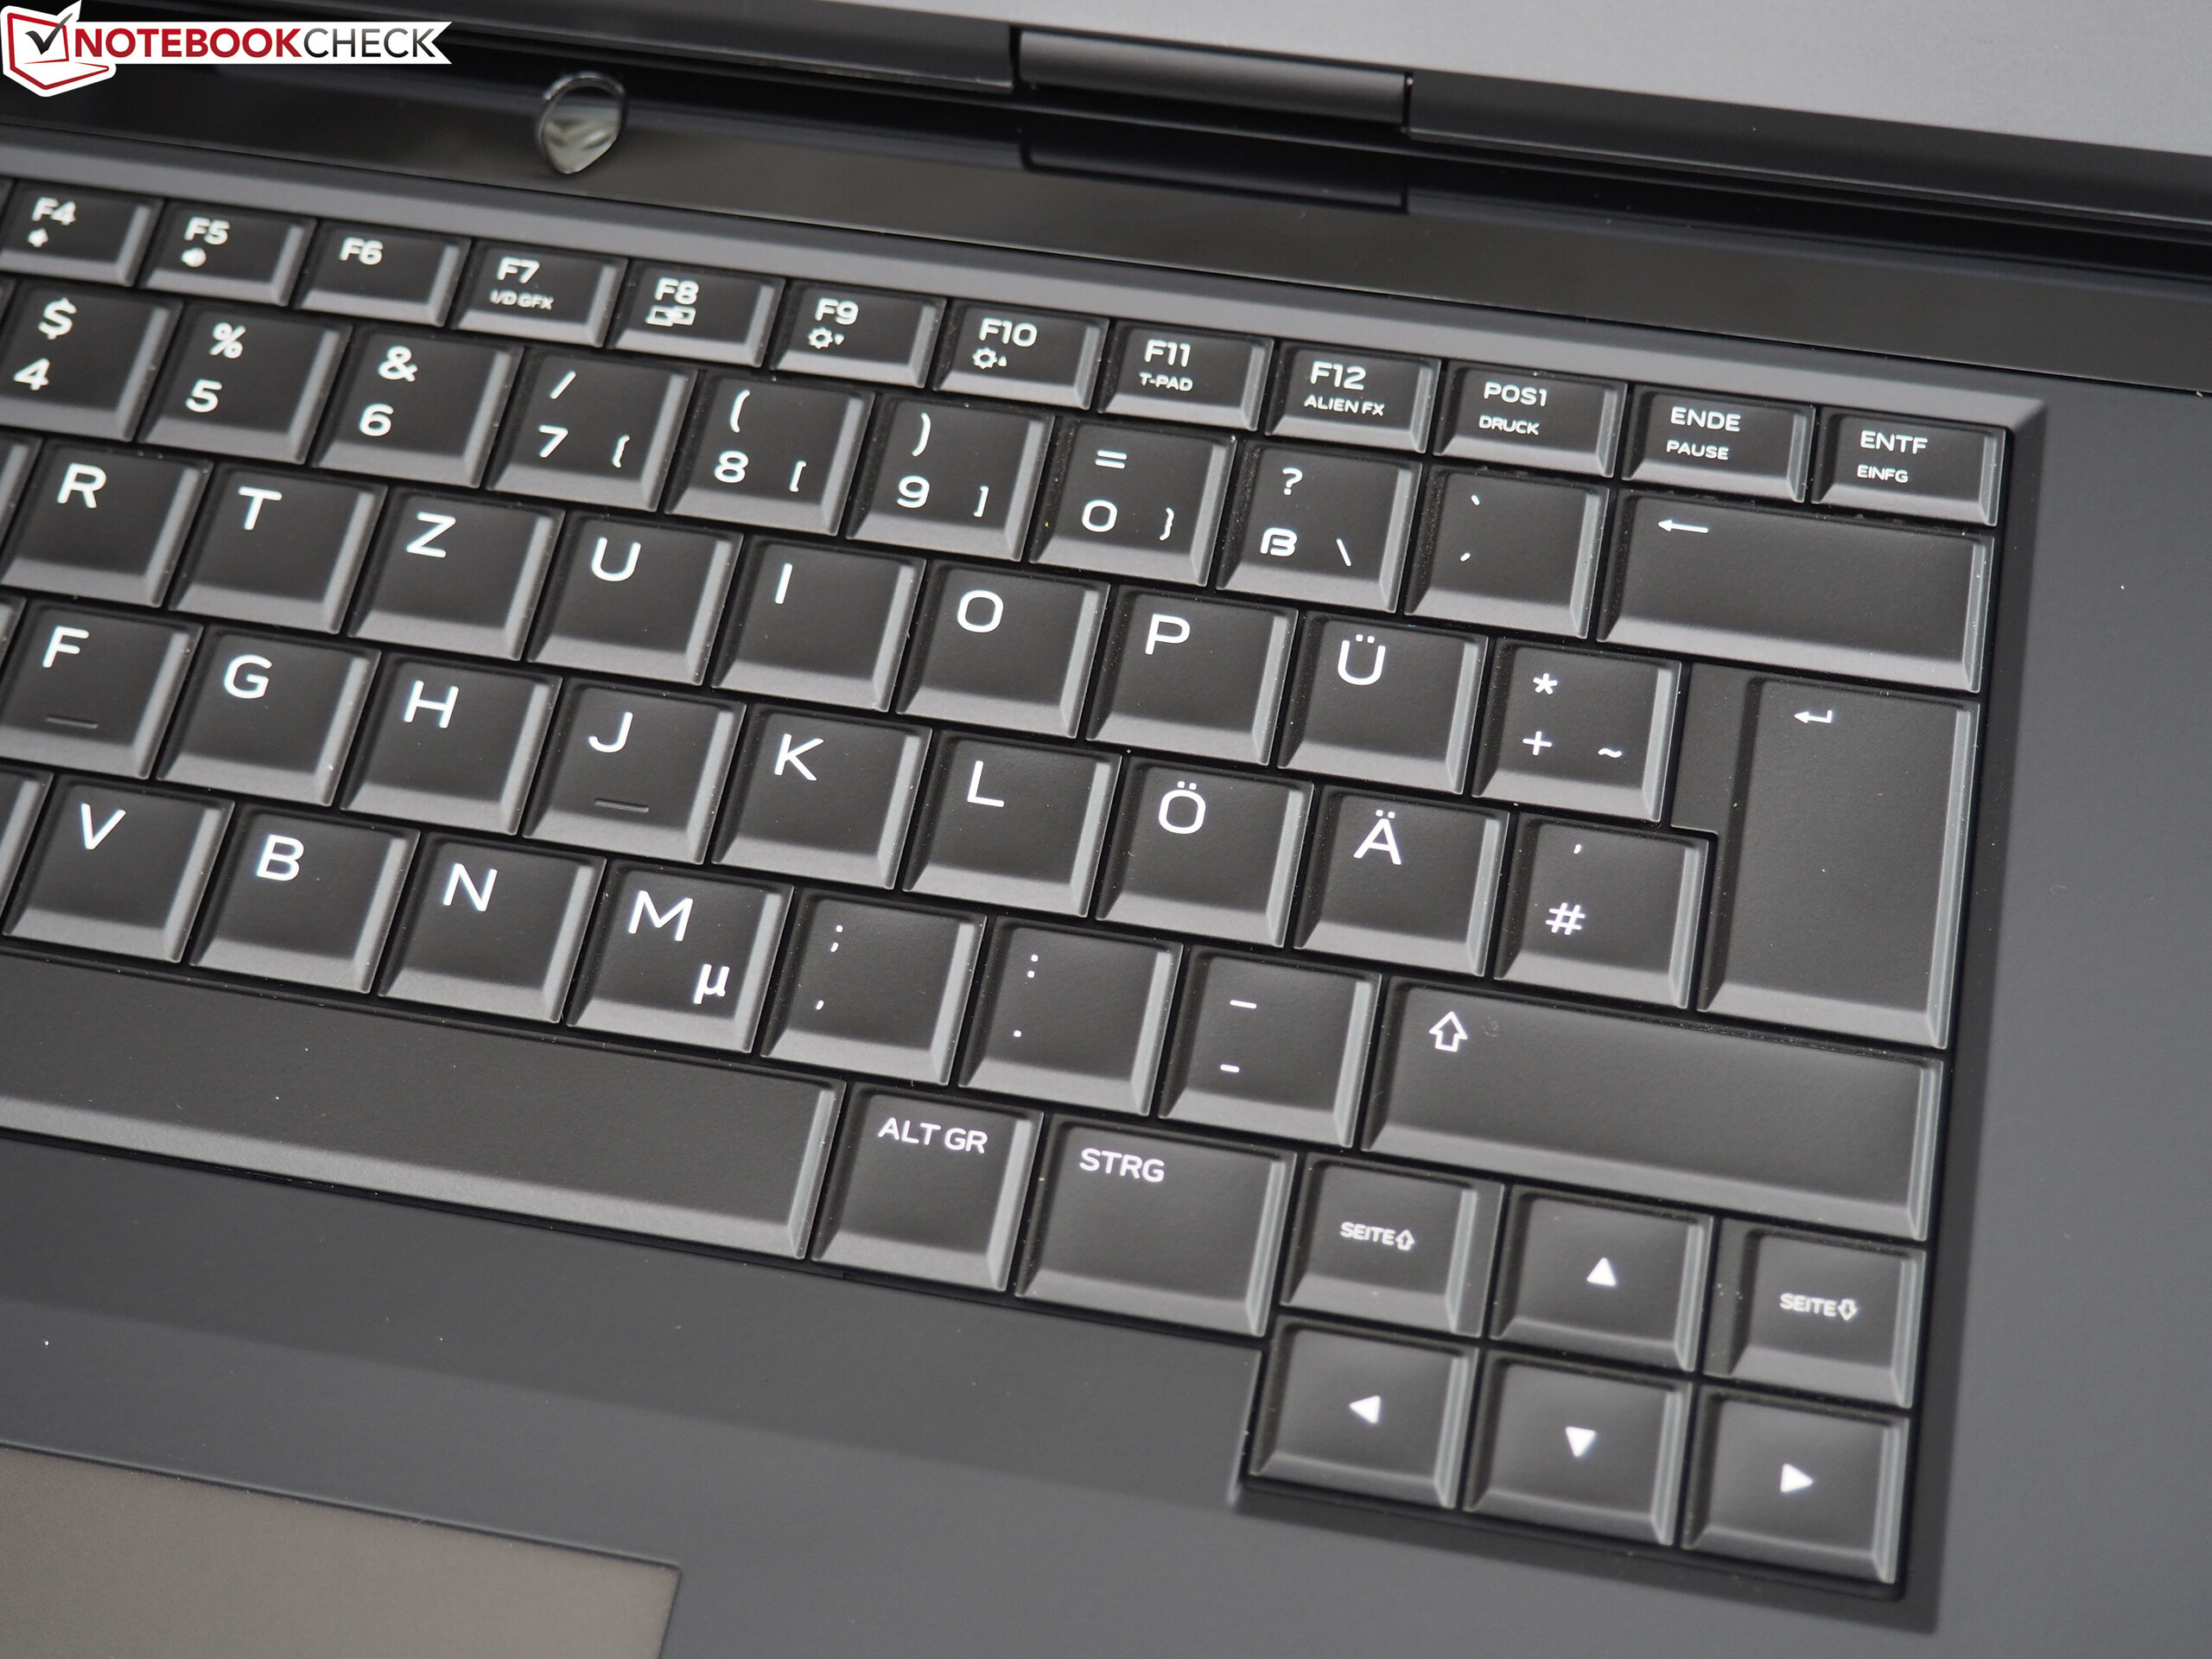
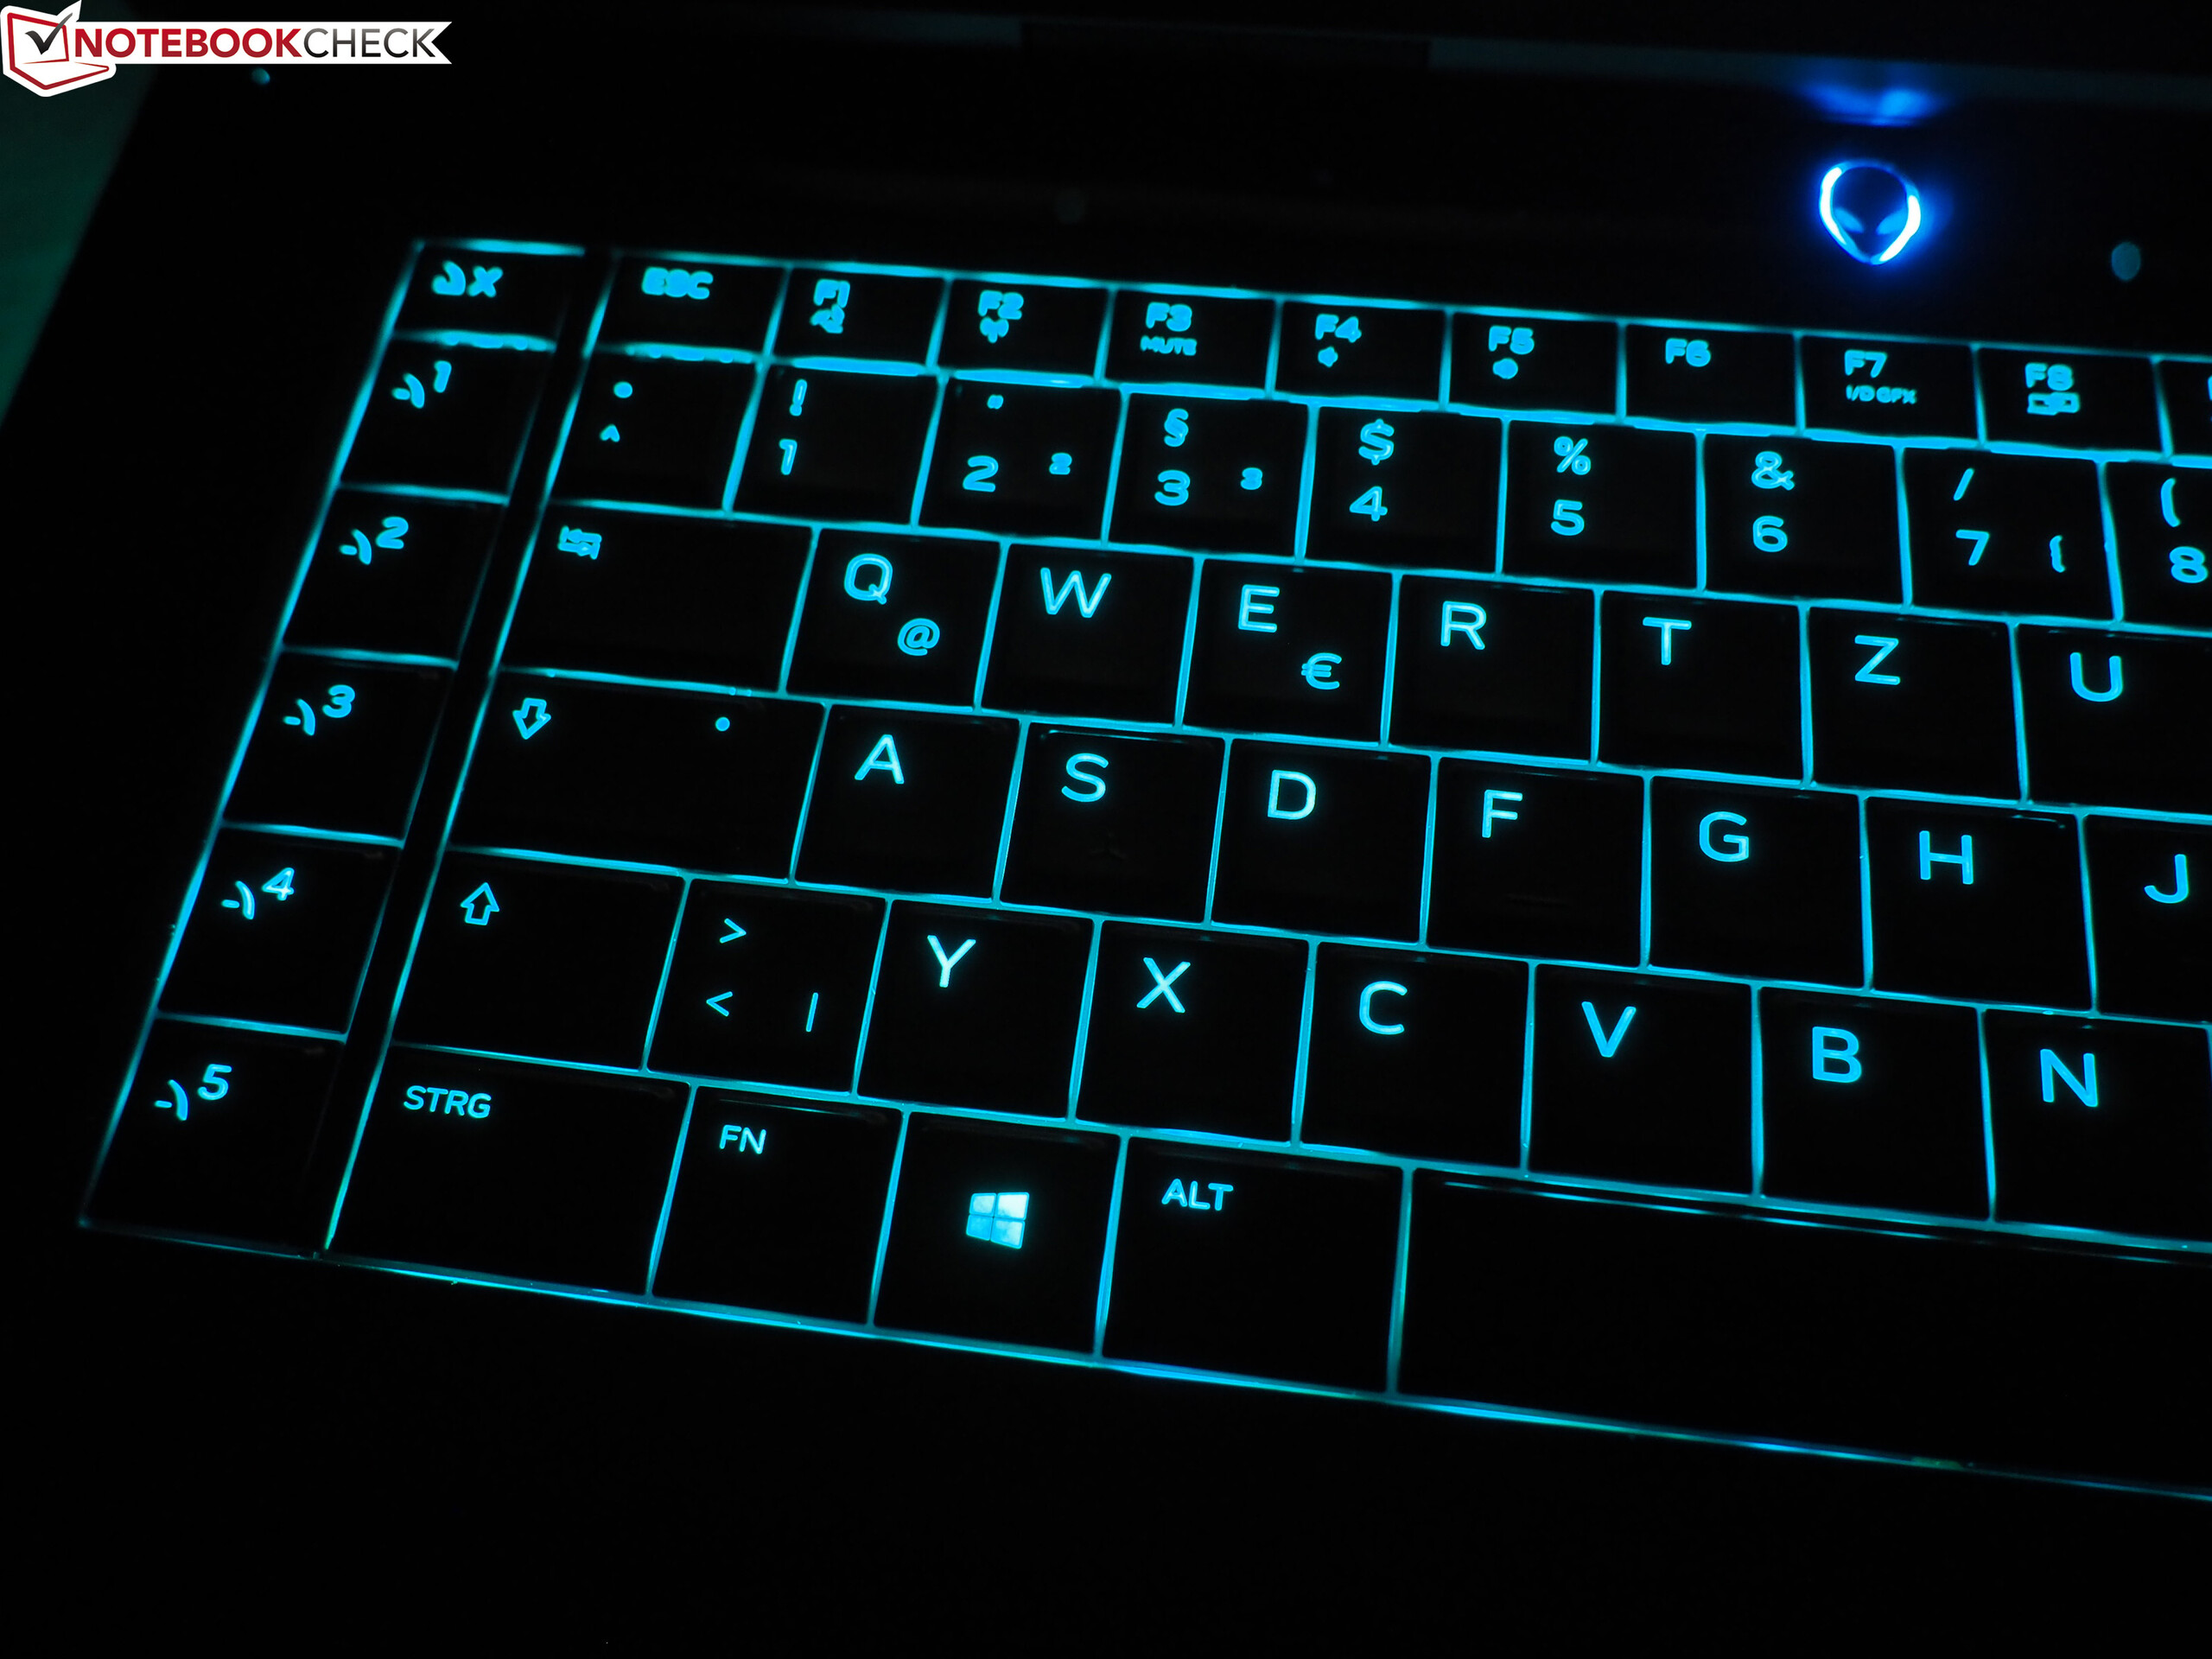
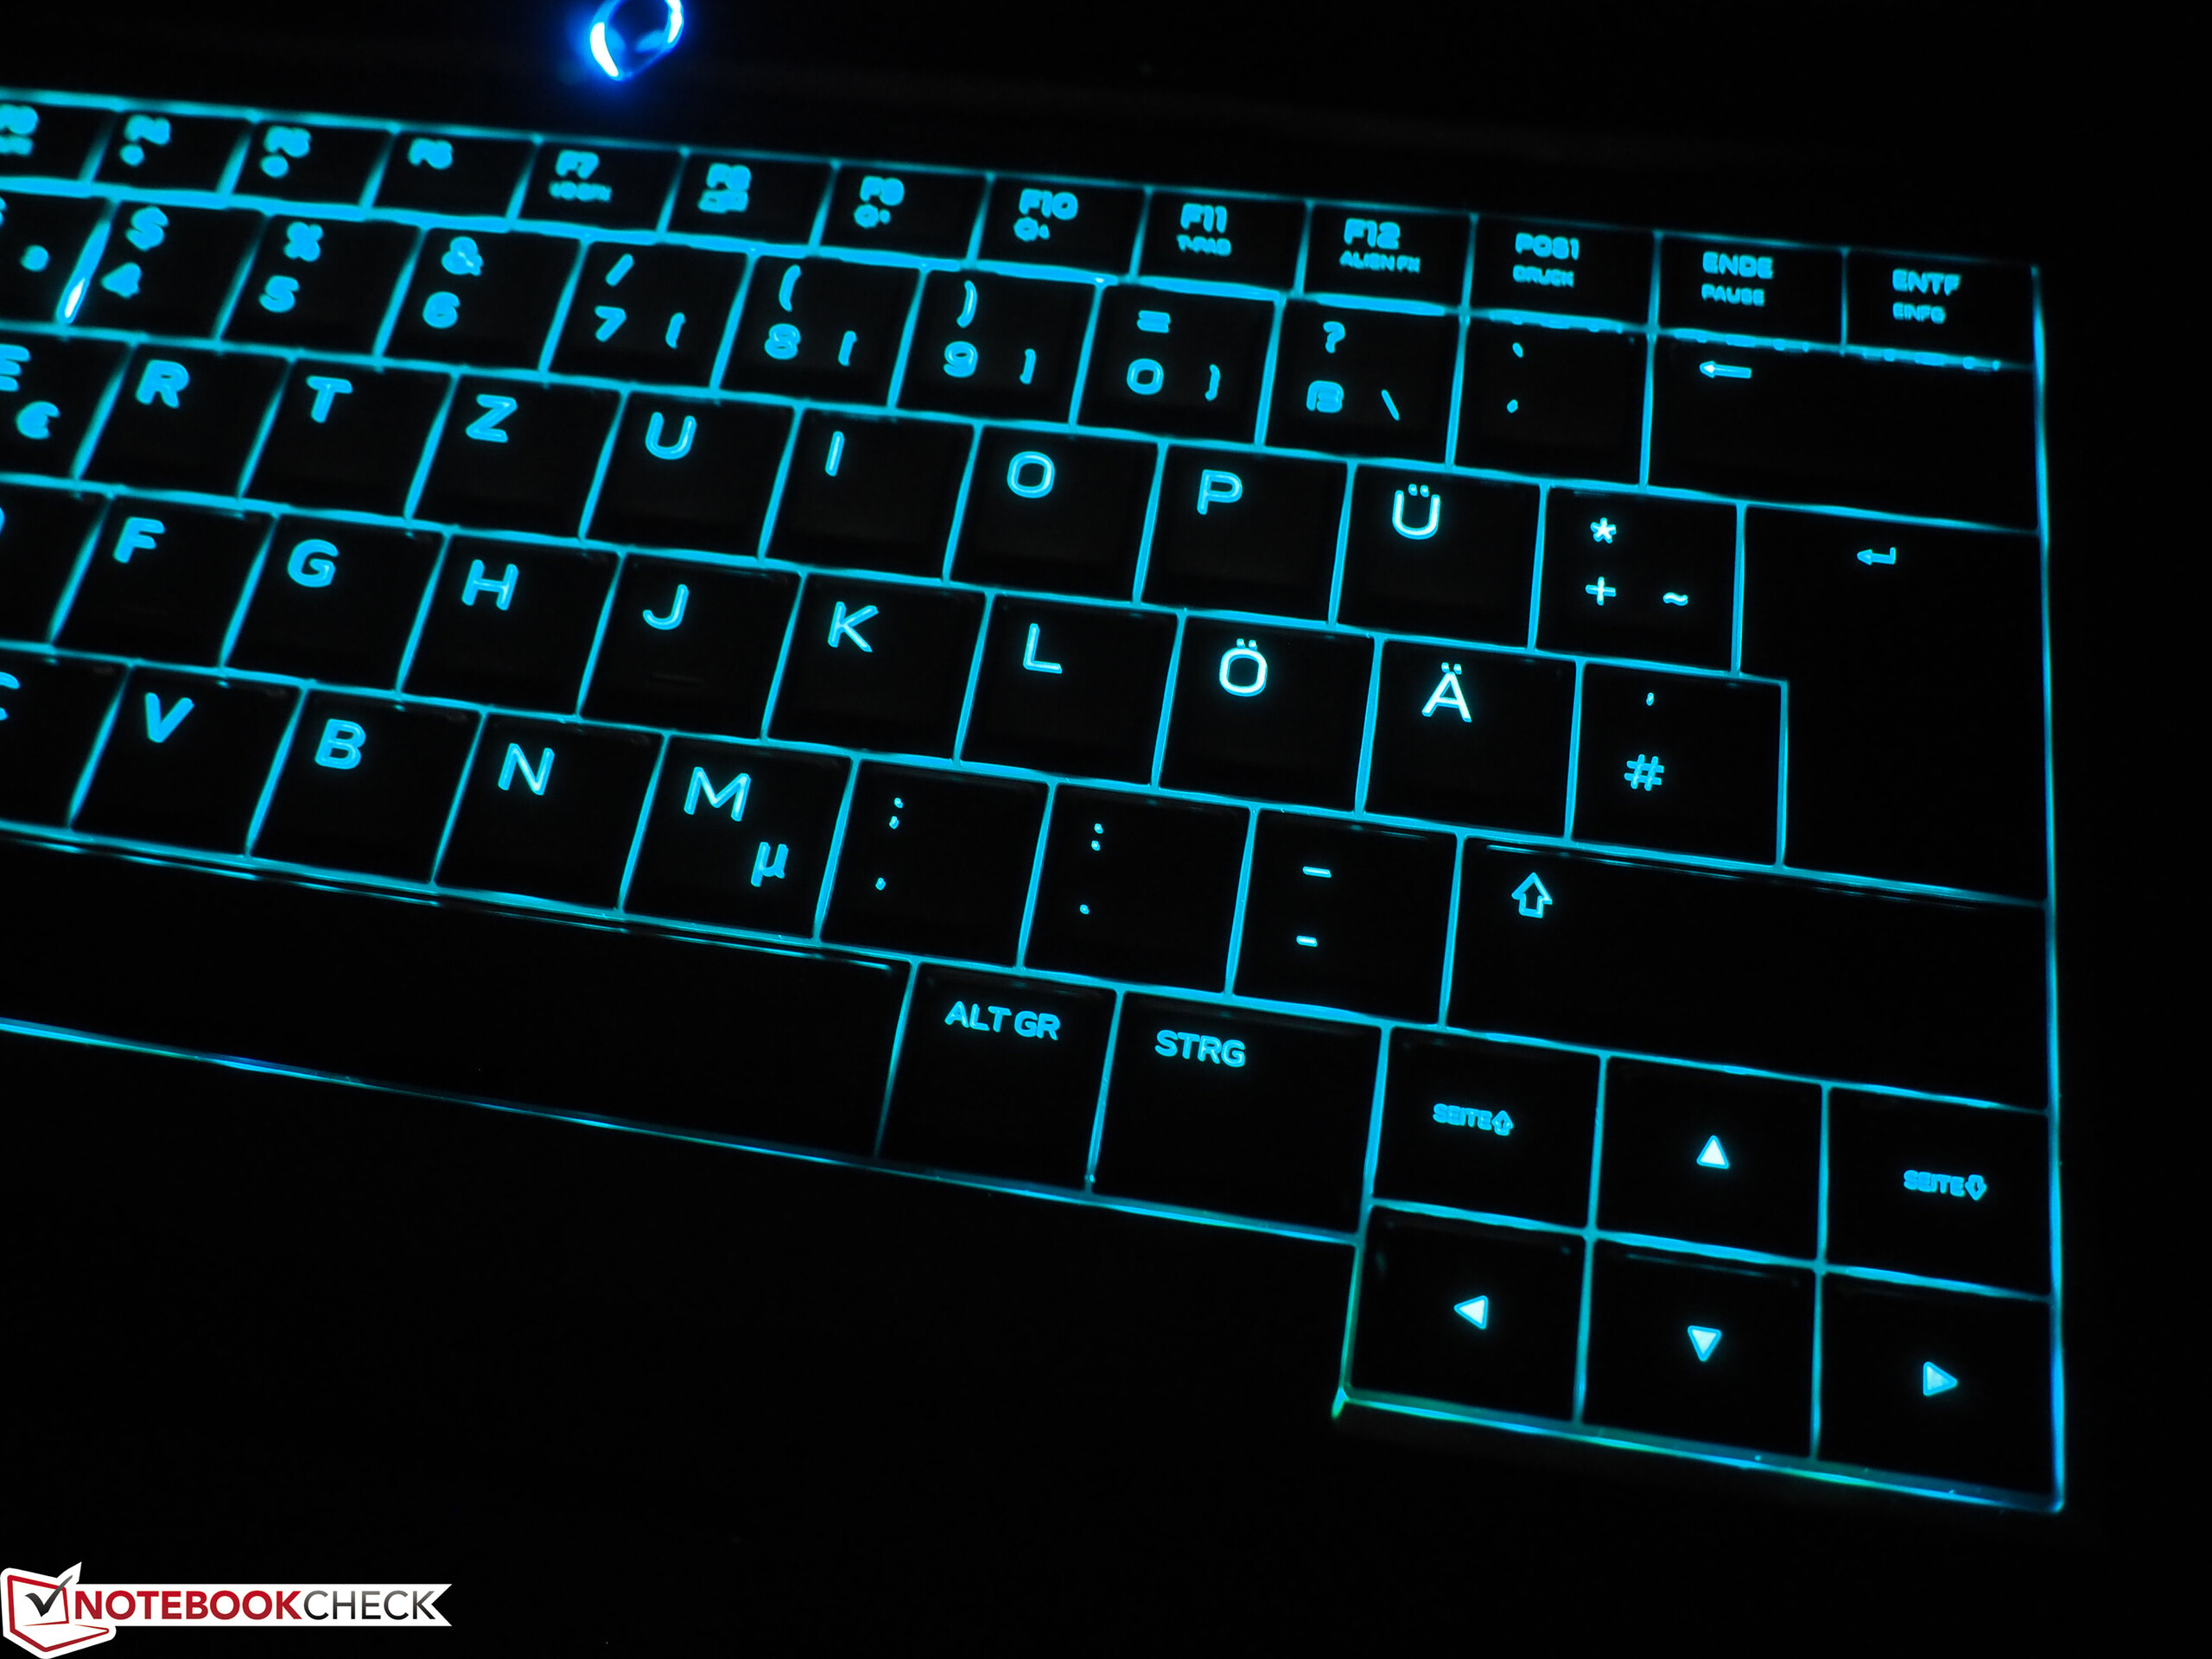
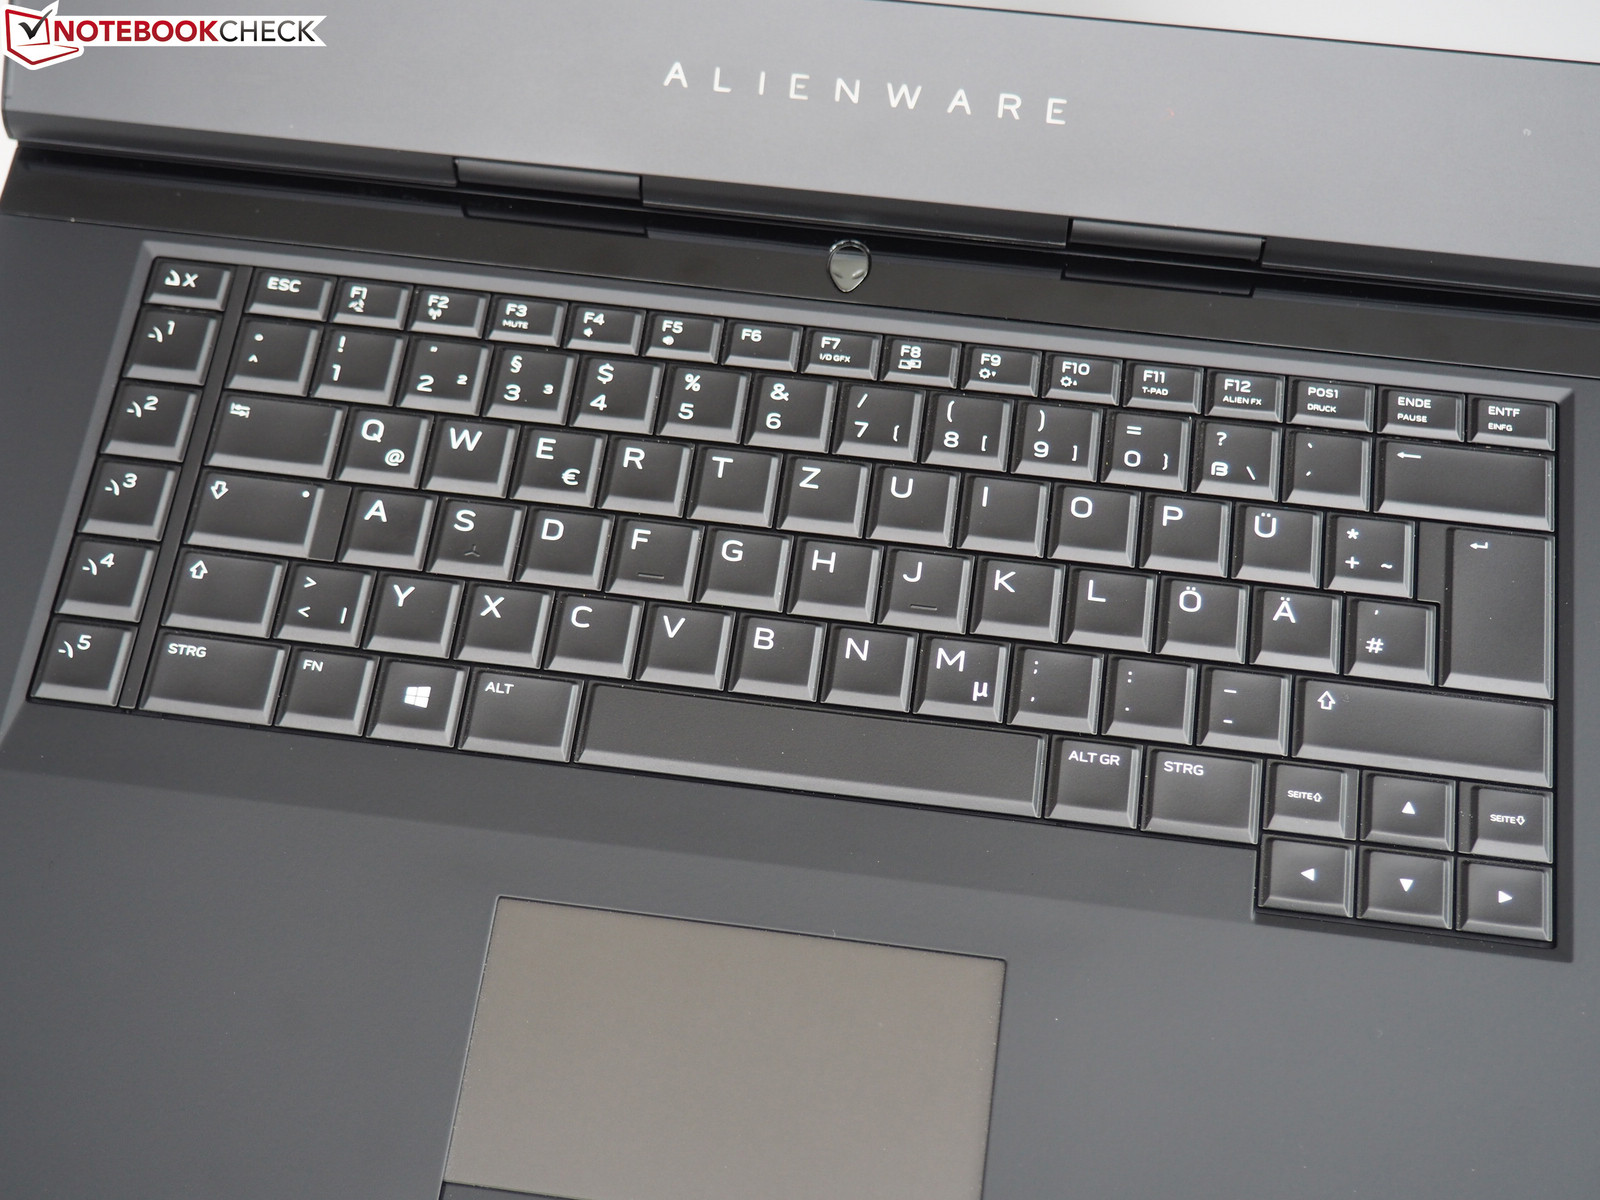
Except for the missing numeric keypad, although there is sufficient space, Dell does not make any mistakes in terms of the keyboard. The matte-black, closely arranged and slightly rubberized keys (no chiclet design) provide the familiar Alienware typing experience. It is pretty soft but is still precise and accurate; pressure point and stroke do not cause any criticism. Only some of the wider keys (especially Backspace) provide a slightly strange feedback. We cannot criticize Dell for the size, either. Letters and numbers are sized at 18 x 18 millimeters, and even the shifted directional keys are decently sized. You can see the German layout on the pictures below.
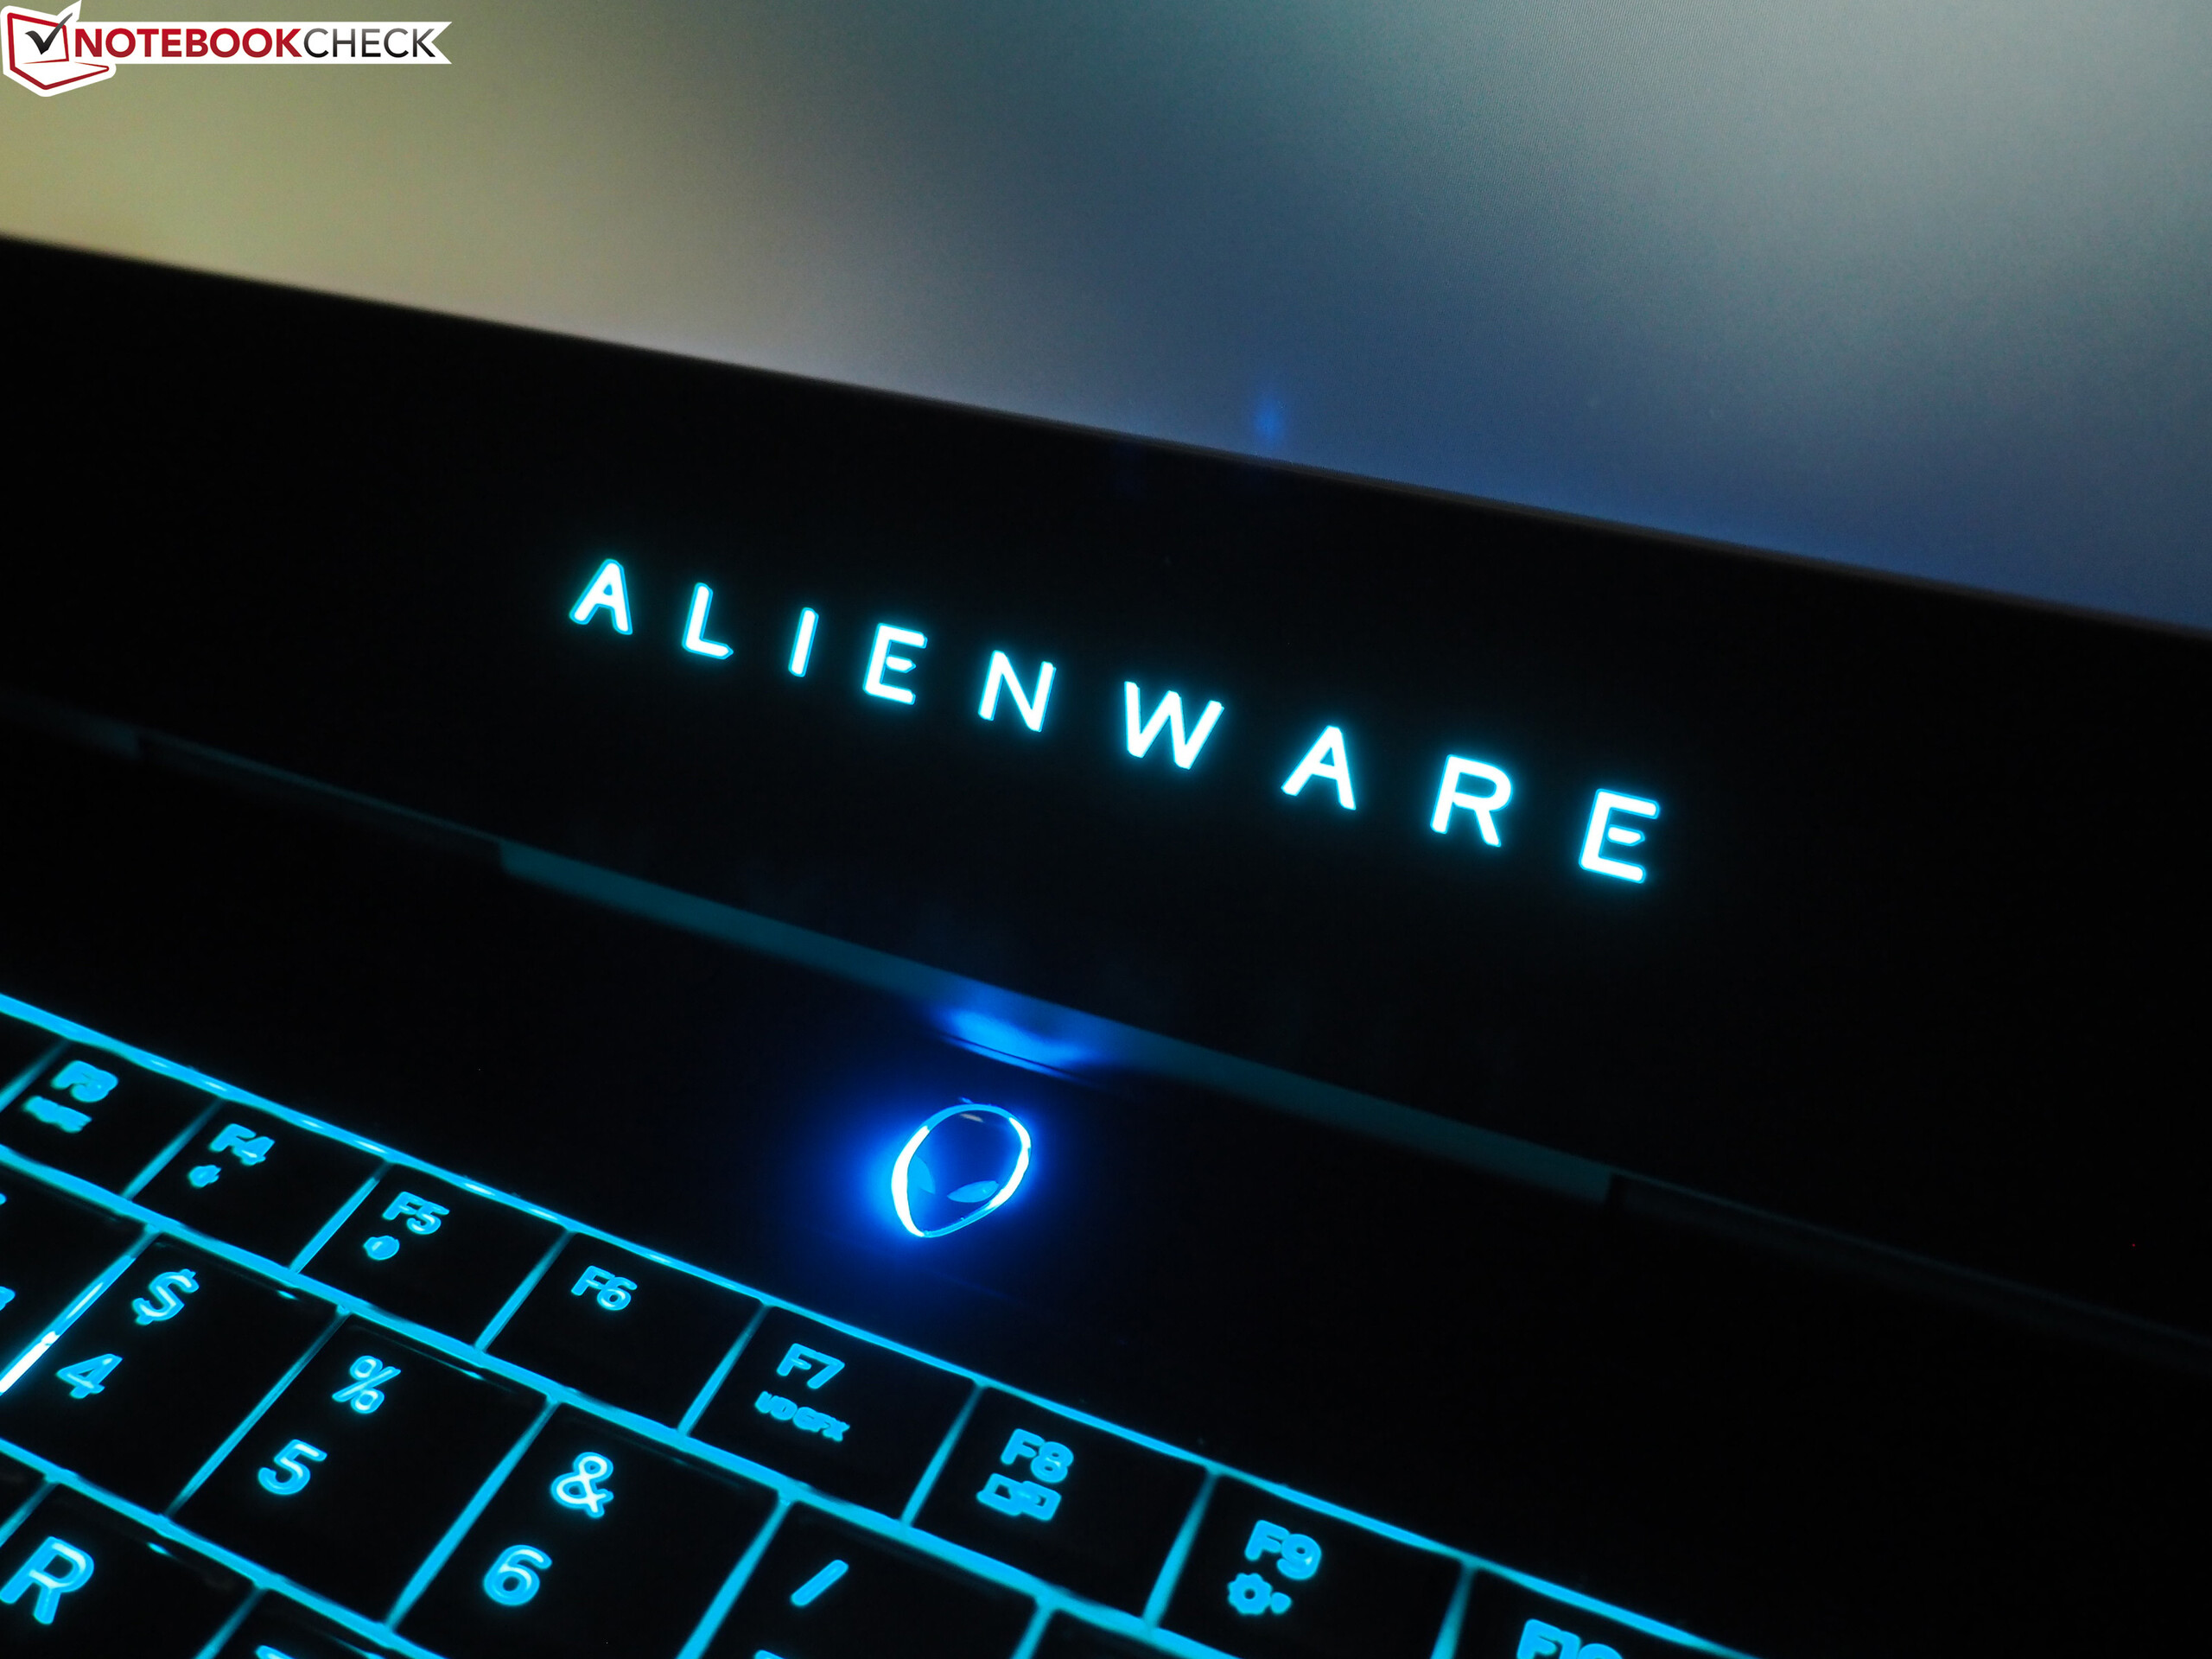
We are not particularly happy with the position of the keyboard. It is located very far to the top, which results in huge palm rests, but the main keys have an unusual central position due to the macro area on the left (5 keys with 3 levels) and the lack of a numeric keypad. We had problems with some typos in the beginning, so you will need a learning period. There are hardly any limitations in terms of illumination. Four zones, dozens of colors, profiles, and modes: Tuning fans will be very happy.
Touchpad
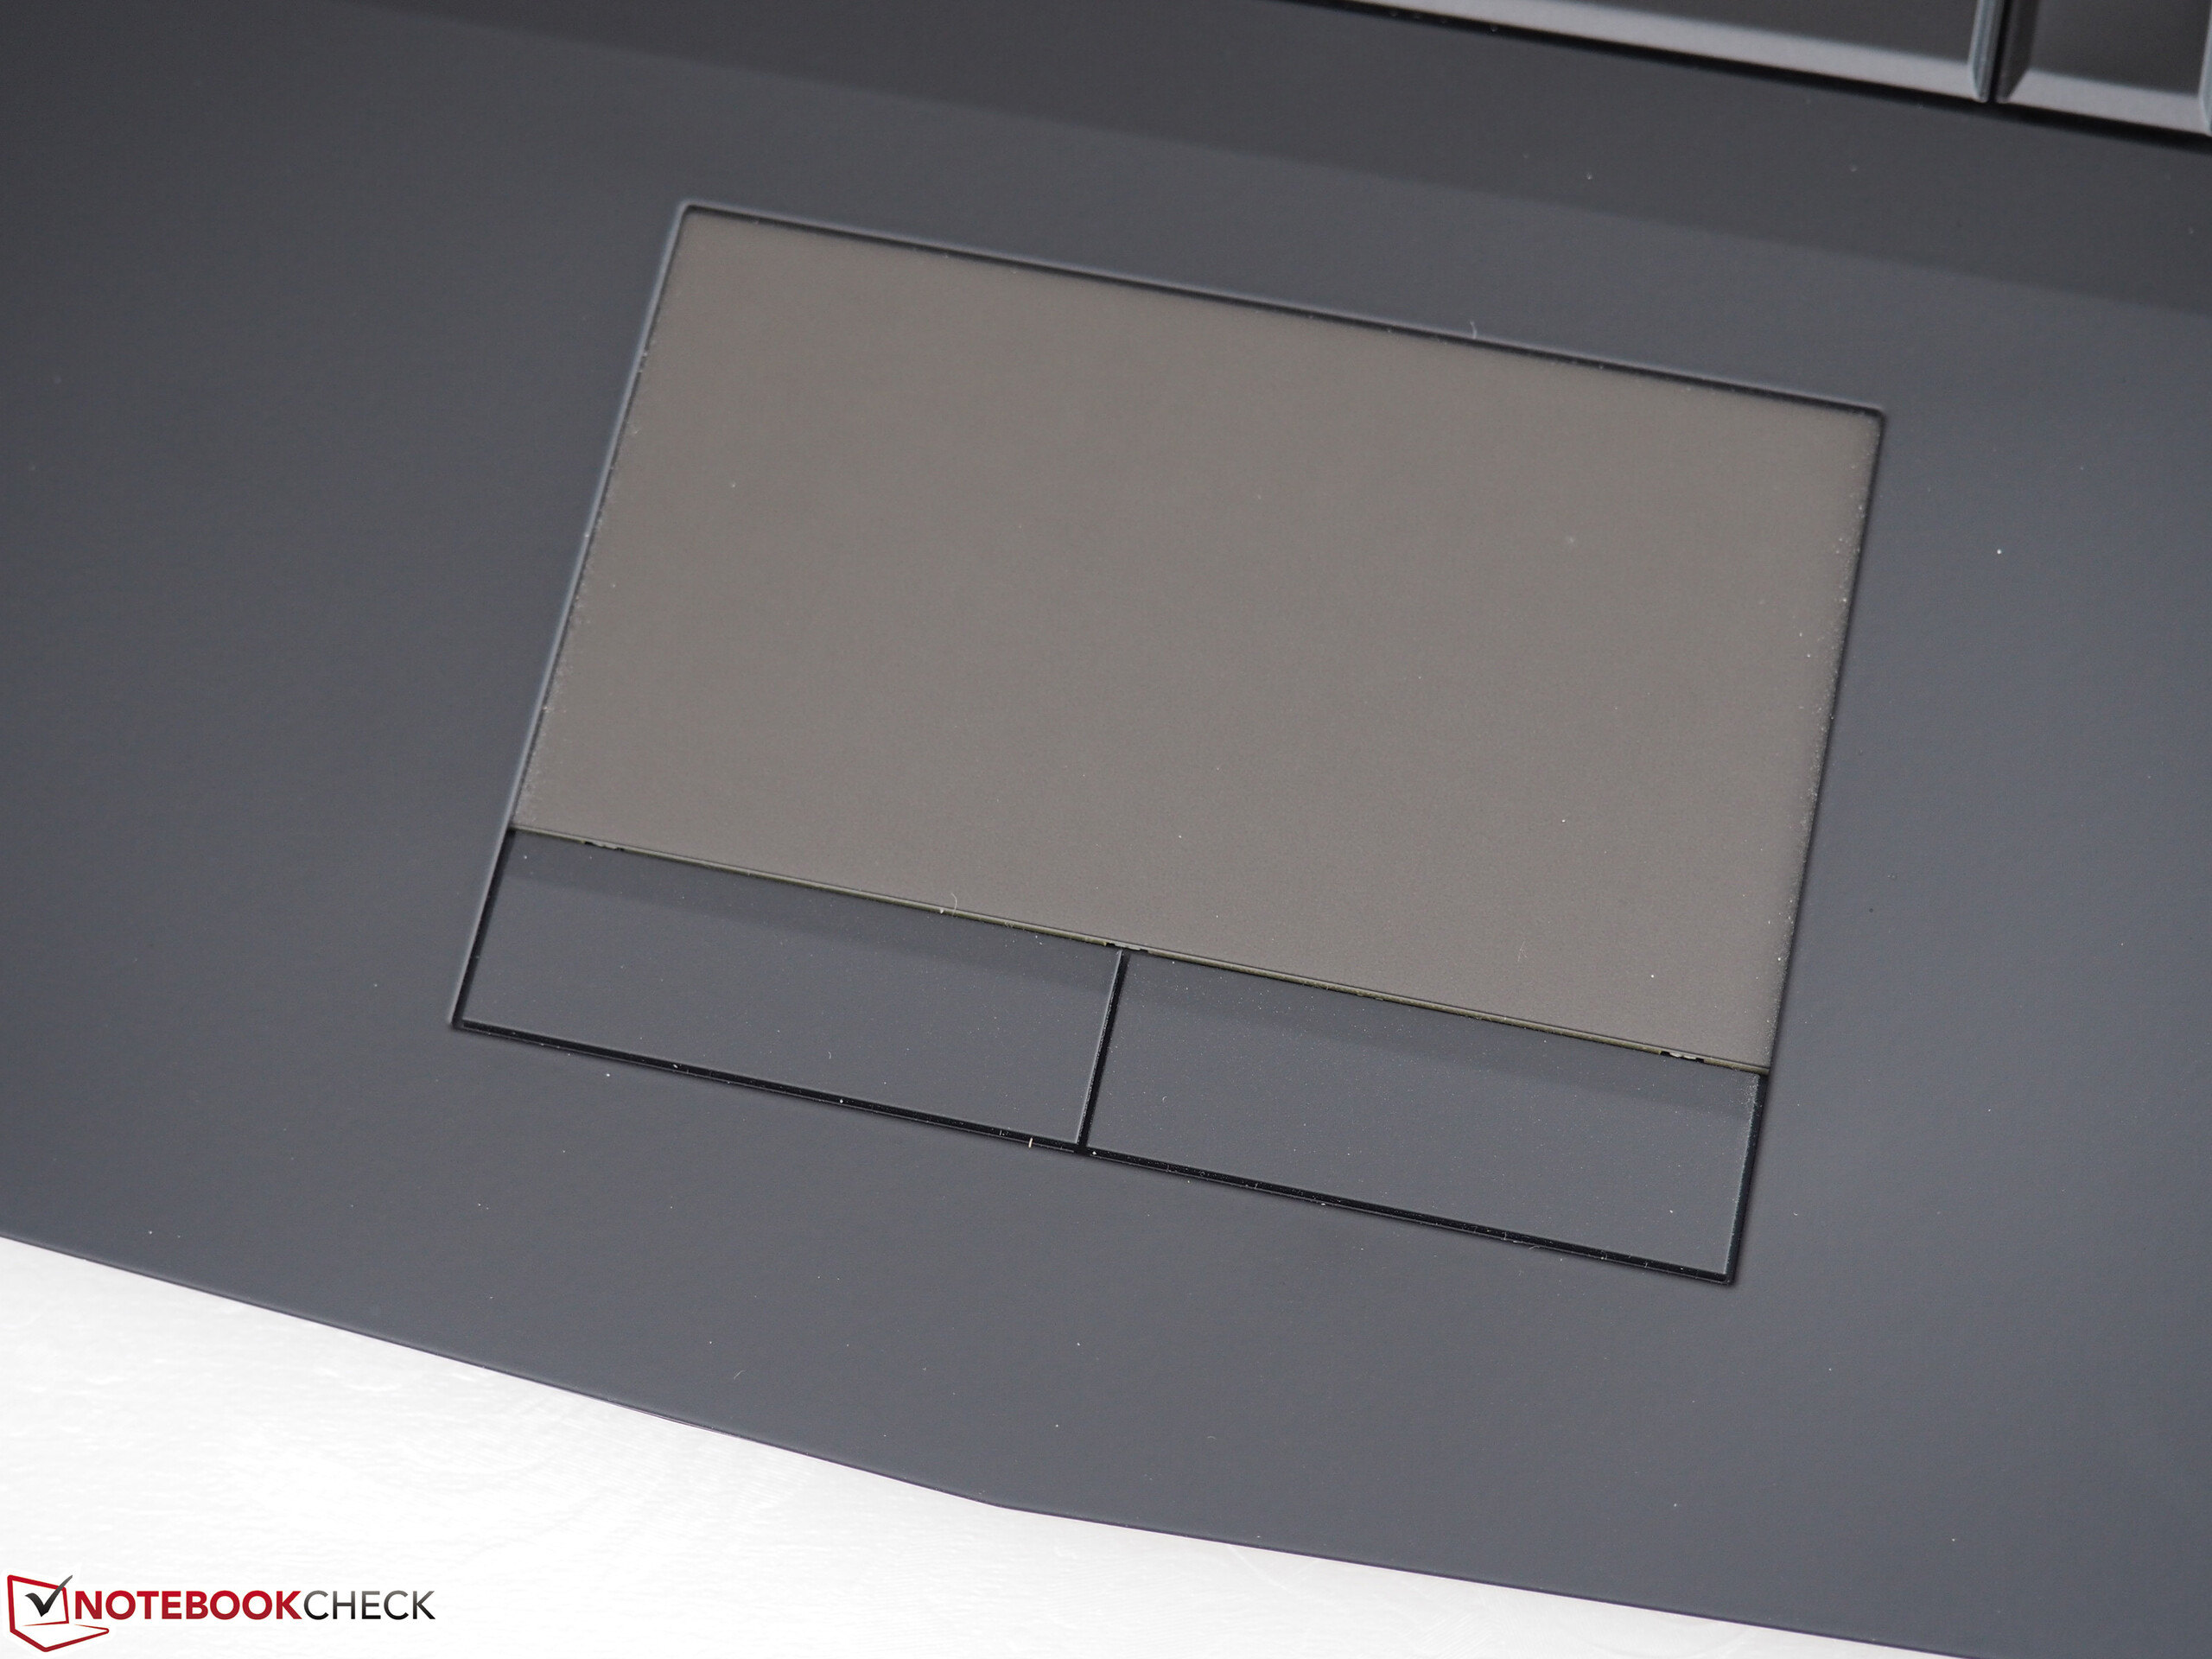
The touchpad surface, which is fully illuminated, is not all that large at 10 x 5.7 centimeters. We would have liked a couple of millimeters more, especially in height. There is certainly enough room. Otherwise, the mouse replacement works well. The gliding capabilities are decent thanks to the smooth finish and the precision is convincing as well. Multi-touch gestures (2-4 fingers) are controlled via Dell's own touchpad software. We usually had no problems with zooming and scrolling.
We also like the fact that Alienware does not implement a ClickPad; a conventional touchpad with dedicated mouse buttons is installed instead. They have a pretty soft and quiet pressure point, similar to the keyboard, but they are still reliable. Dell also considered symmetry: The touchpad is at the center of the palm rests. The perceptible indentation, which reminds us of the Acer Predator 15, is a bit too deep for our liking.
Display
Displays with 60 Hz have been the standard for many years, but now we are seeing more and more panels with higher refresh rates. Alienware also uses the modern technology and equips some of its 15-inch models with a fast 120 Hz display. Its biggest advantage is the fast response time. While many notebooks need more than 20 ms for black-to-black switch and more than 30 ms for gray-to-gray, the AW 15 R3 manages a fast 12 and 25 ms, respectively. These results could also be from the Schenker XMG P507, which is equipped with almost the exact same 120 Hz panel (AUO52ED vs. AUO51ED).
| |||||||||||||||||||||||||
Brightness Distribution: 93 %
Center on Battery: 386 cd/m²
Contrast: 990:1 (Black: 0.39 cd/m²)
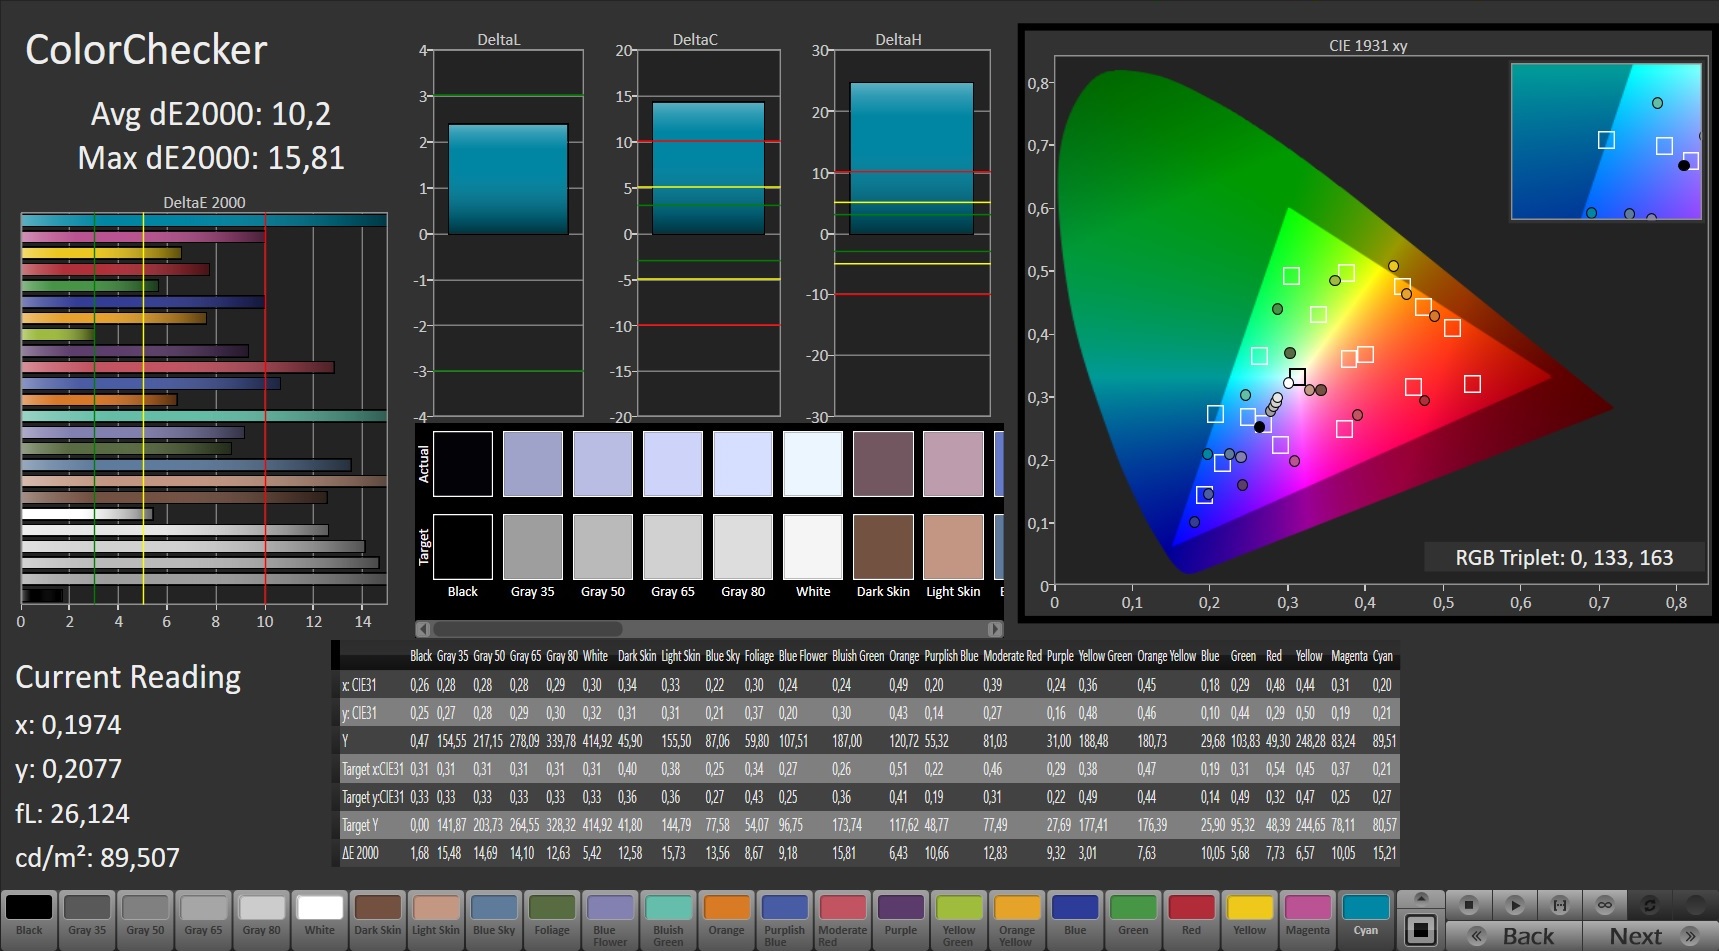
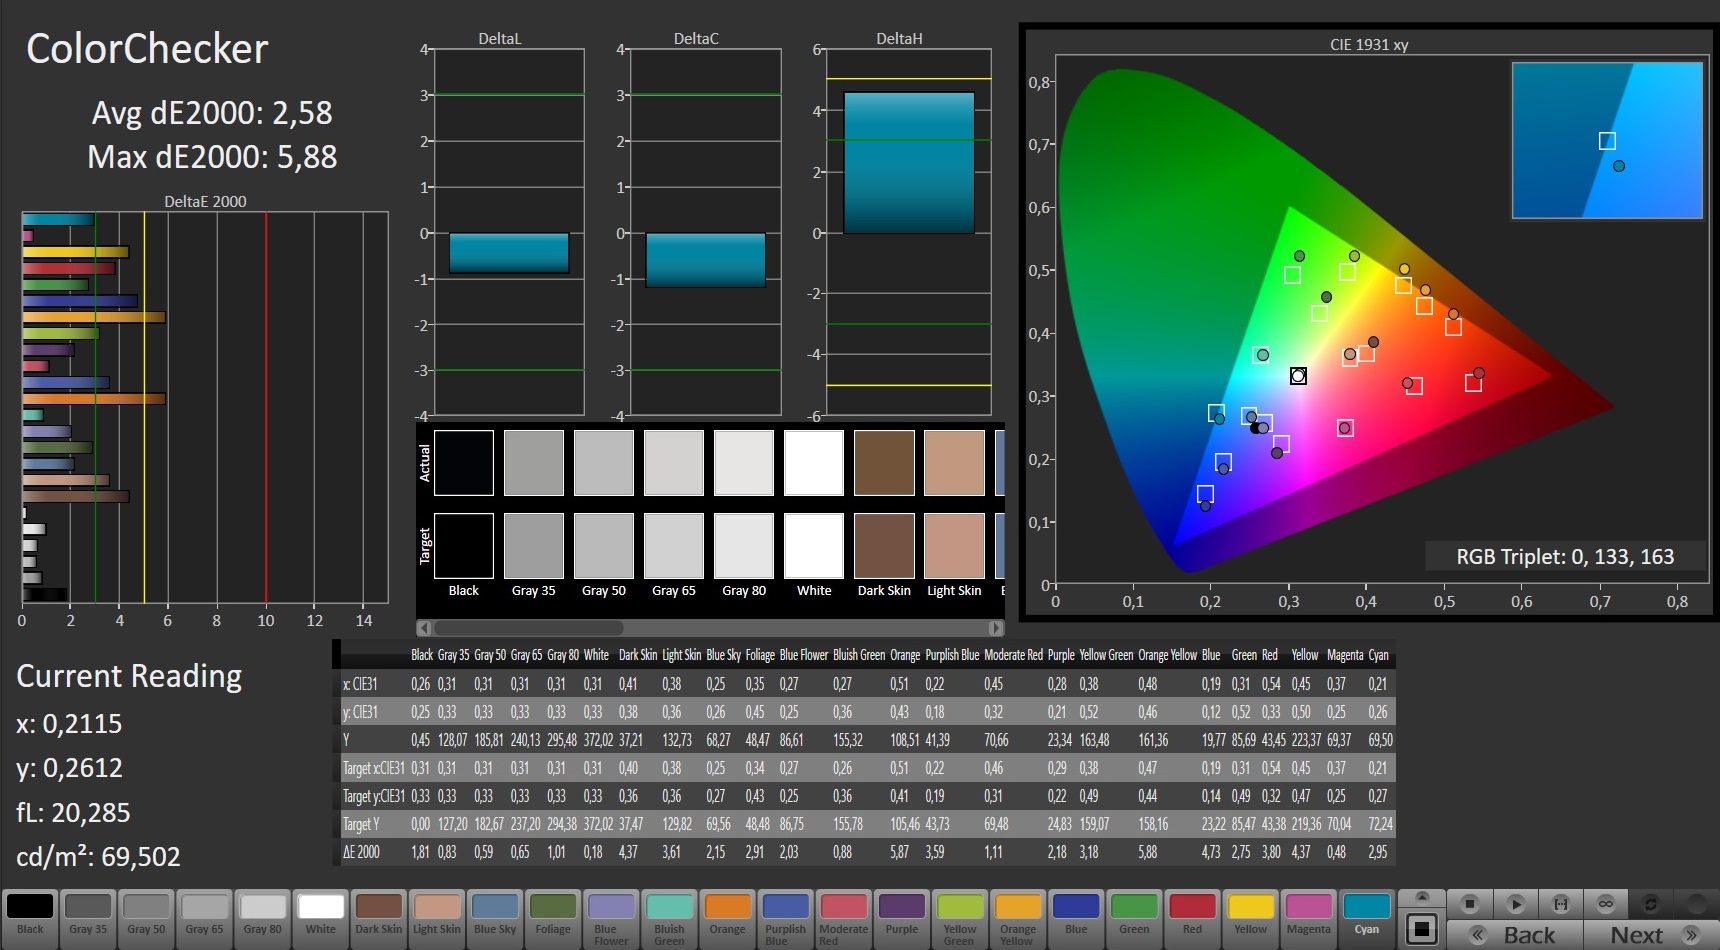
ΔE ColorChecker Calman: 10.2 | ∀{0.5-29.43 Ø4.73}
ΔE Greyscale Calman: 11.28 | ∀{0.09-98 Ø4.97}
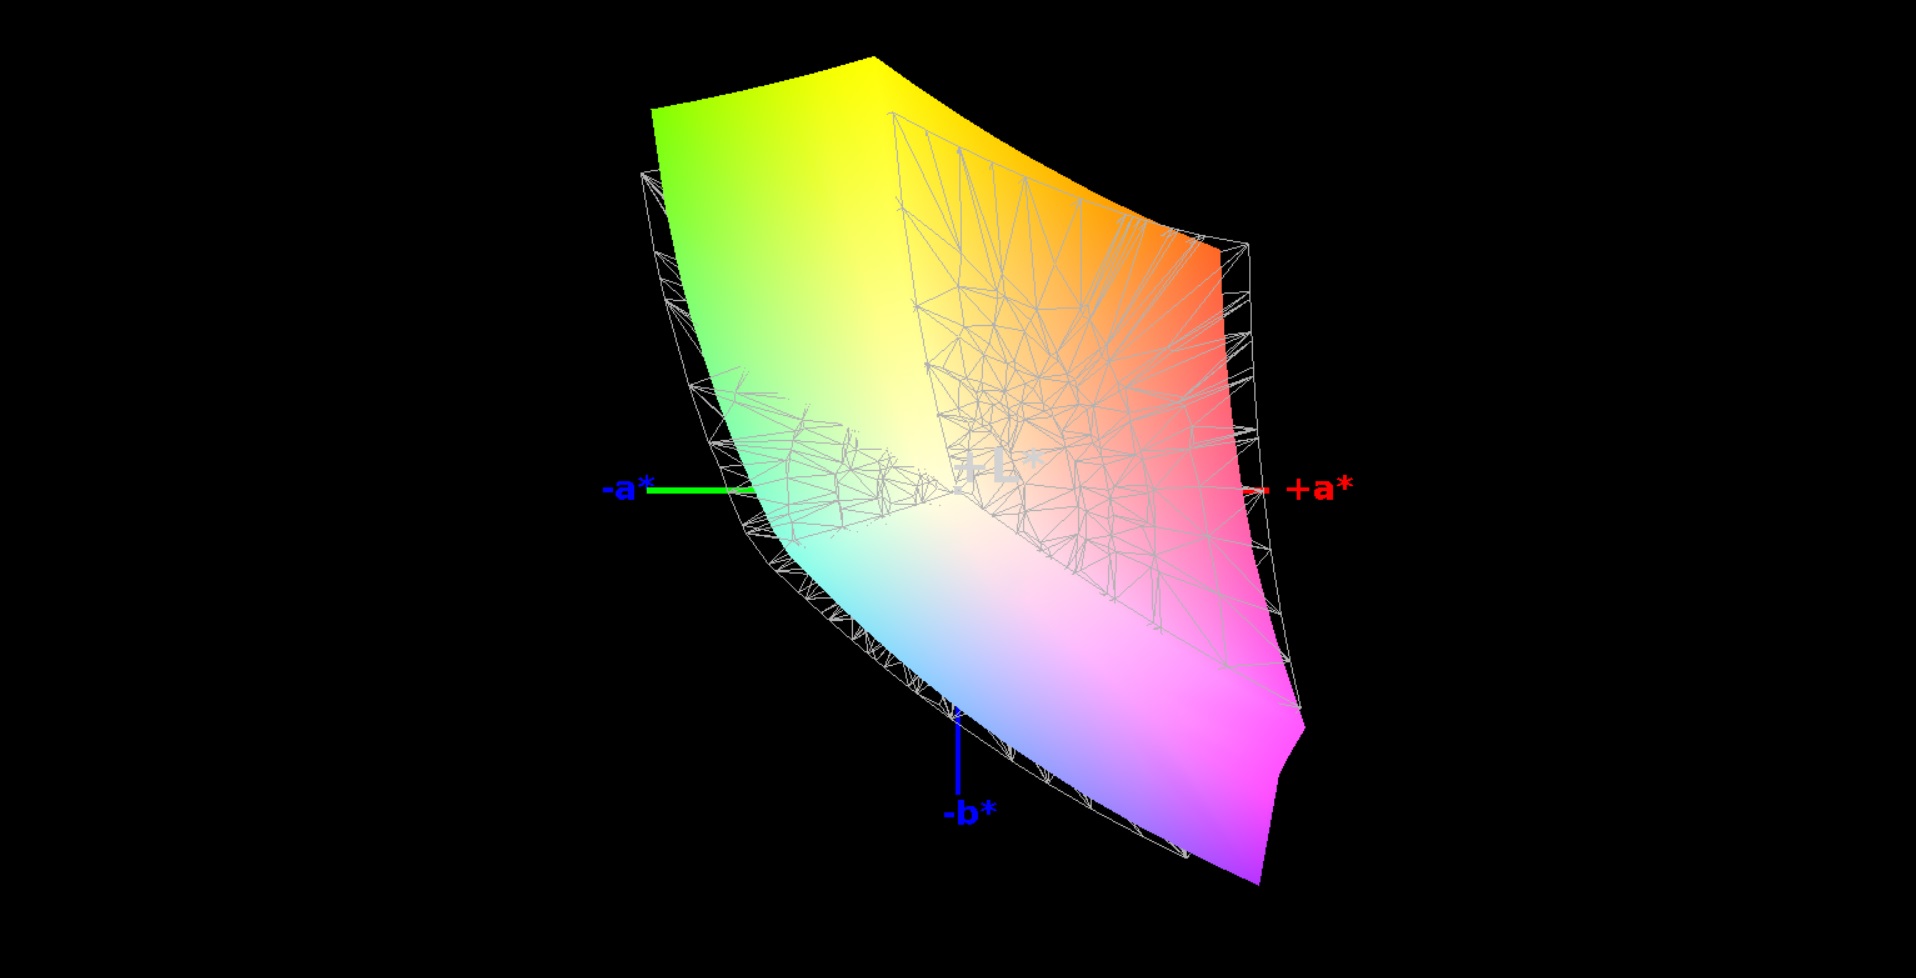
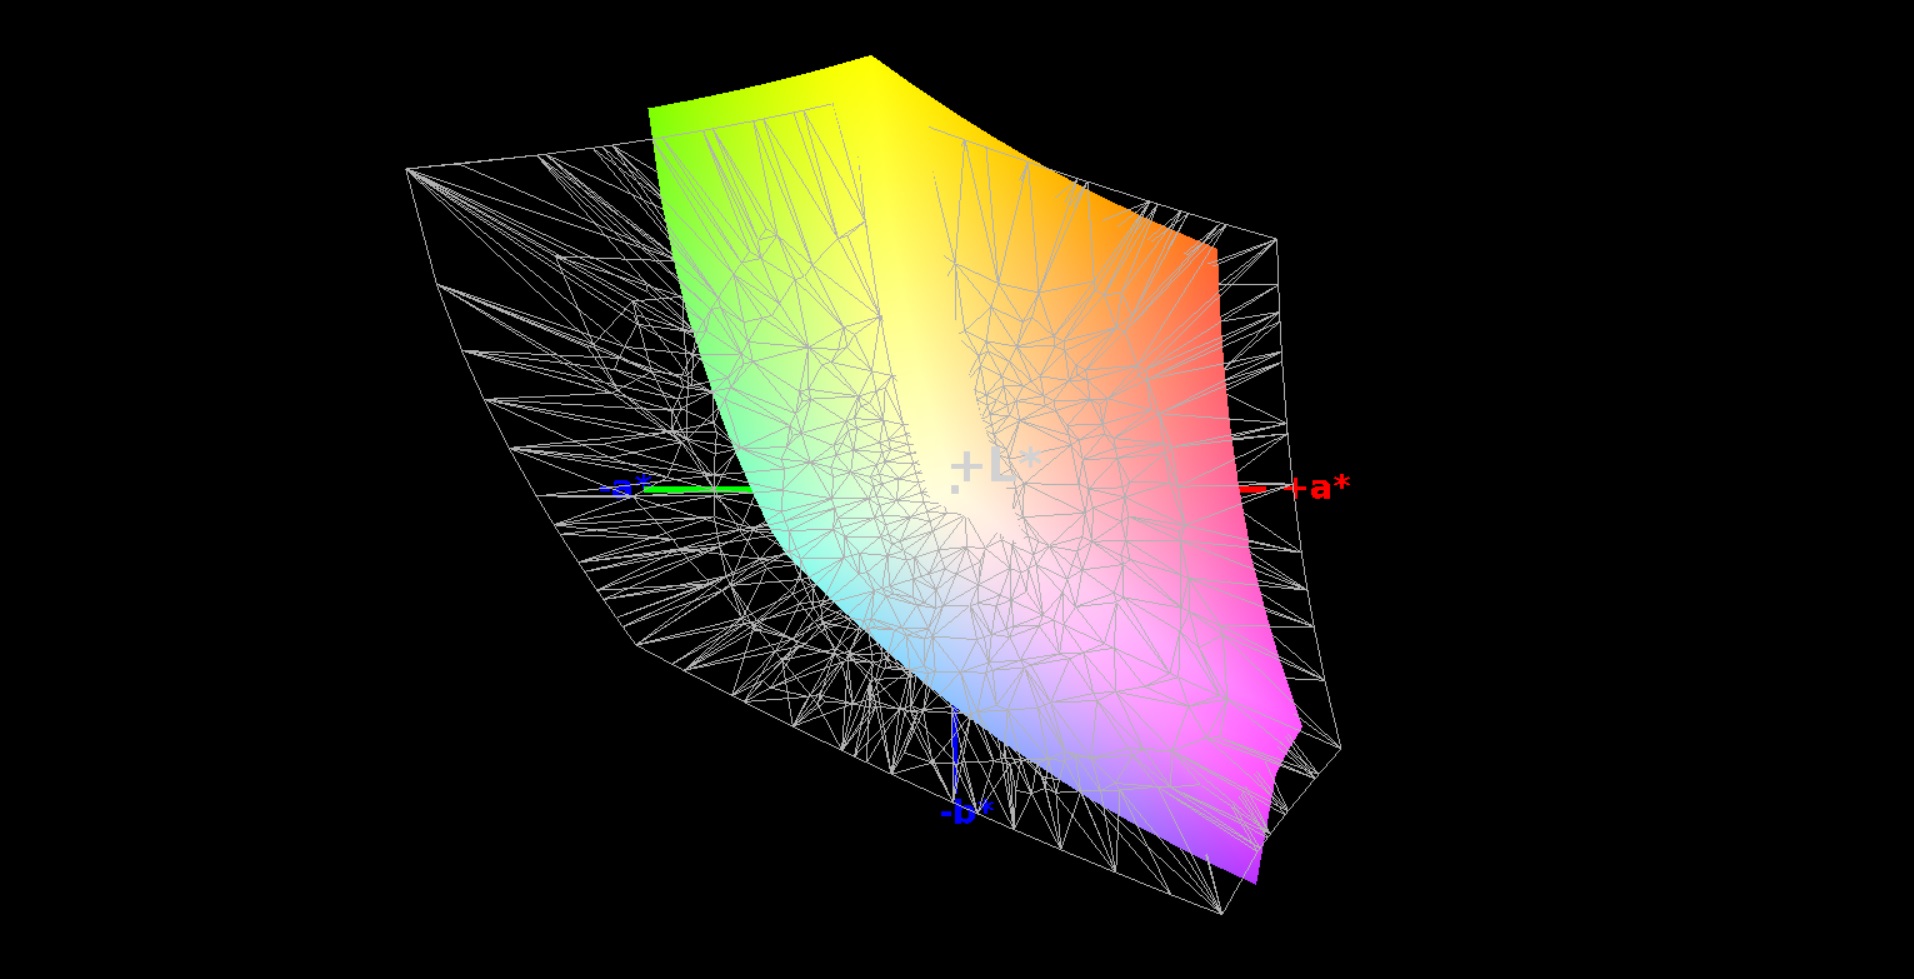
90% sRGB (Argyll 1.6.3 3D)
59% AdobeRGB 1998 (Argyll 1.6.3 3D)
66.2% AdobeRGB 1998 (Argyll 3D)
90.5% sRGB (Argyll 3D)
66% Display P3 (Argyll 3D)
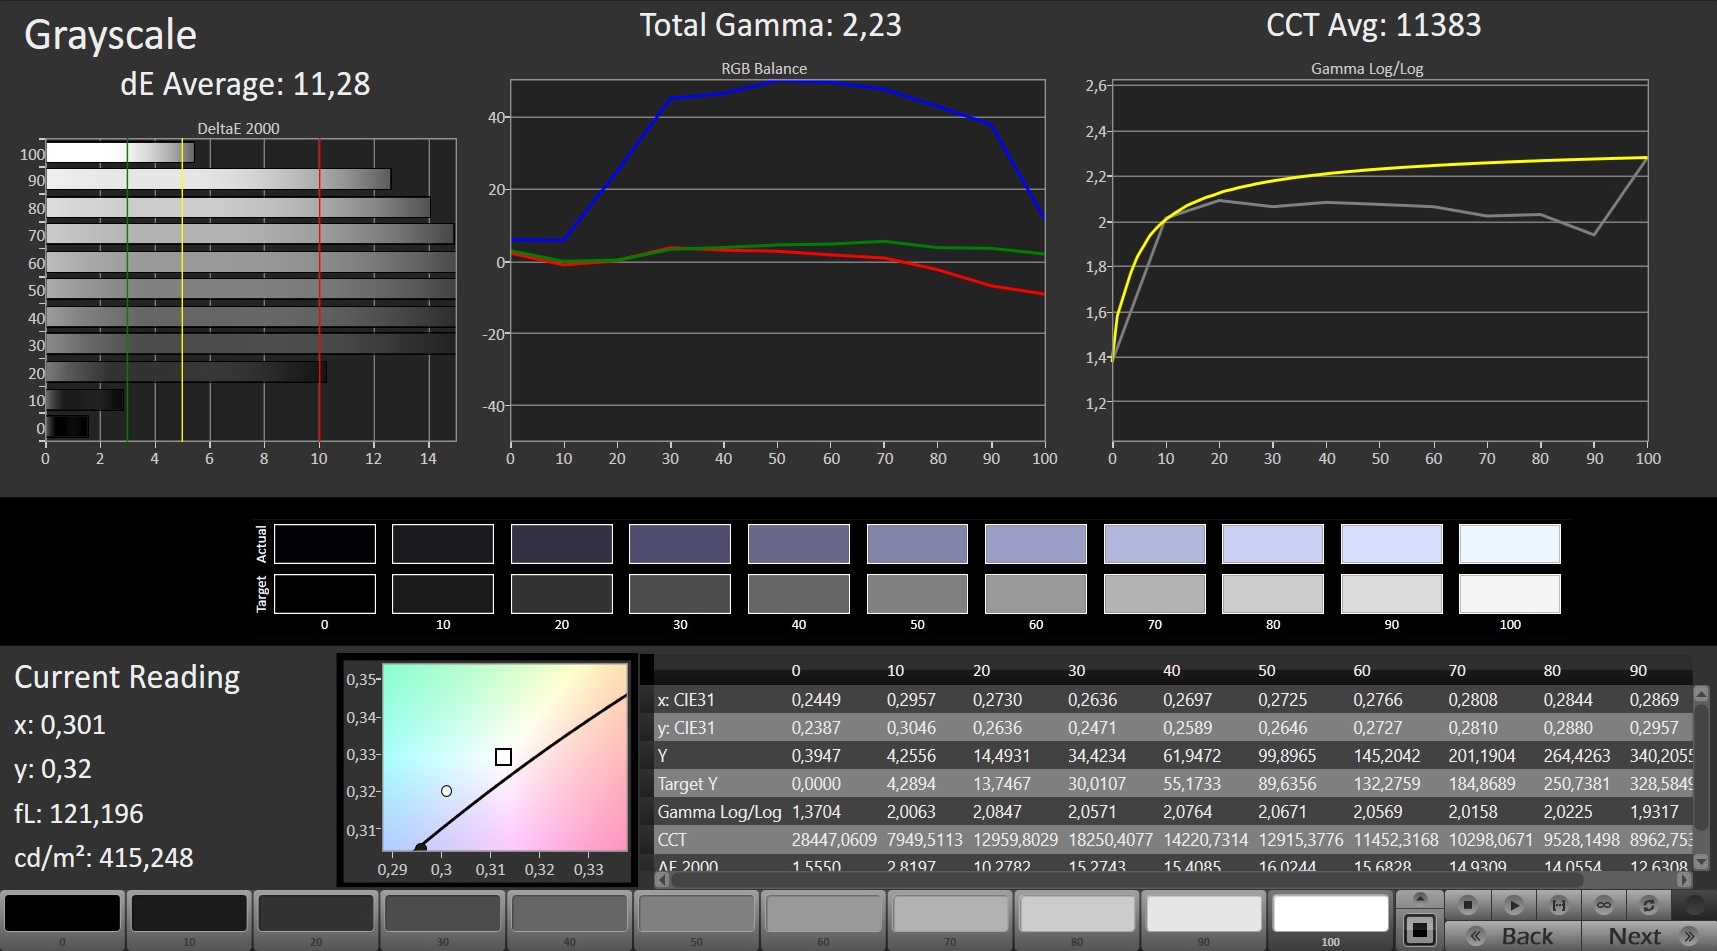
Gamma: 2.23
CCT: 11383 K
| Alienware 15 R3 HPJGK_B156HTN (AUO51ED), 1920x1080 | Alienware 15 R2 (Skylake) Samsung 4NDDJ_156HL (SDC4C48), 1920x1080 | Asus Strix GL502VS-FY032T LG Philips LP156WF6-SPB6 (LGD046F), 1920x1080 | MSI GT62VR-6RE16H21 LG Philips LP156WF6 (LGD046F), 1920x1080 | Schenker XMG P507 PRO AUO B156HTN05.2 (AUO52ED), 1920x1080 | |
|---|---|---|---|---|---|
| Display | -36% | -6% | -5% | -1% | |
| Display P3 Coverage (%) | 66 | 40.3 -39% | 64.5 -2% | 64.6 -2% | 66.4 1% |
| sRGB Coverage (%) | 90.5 | 60.2 -33% | 83.1 -8% | 84.6 -7% | 88.9 -2% |
| AdobeRGB 1998 Coverage (%) | 66.2 | 41.67 -37% | 60.8 -8% | 61.8 -7% | 65.1 -2% |
| Response Times | -114% | -72% | -60% | 2% | |
| Response Time Grey 50% / Grey 80% * (ms) | 25 ? | 48.8 ? -95% | 38 ? -52% | 34 ? -36% | 24 ? 4% |
| Response Time Black / White * (ms) | 12 ? | 28 ? -133% | 23 ? -92% | 22 ? -83% | 12 ? -0% |
| PWM Frequency (Hz) | 200 ? | ||||
| Screen | -7% | 11% | 15% | -6% | |
| Brightness middle (cd/m²) | 386 | 180 -53% | 315 -18% | 273 -29% | 357 -8% |
| Brightness (cd/m²) | 382 | 179 -53% | 290 -24% | 278 -27% | 365 -4% |
| Brightness Distribution (%) | 93 | 83 -11% | 85 -9% | 88 -5% | 85 -9% |
| Black Level * (cd/m²) | 0.39 | 0.19 51% | 0.32 18% | 0.27 31% | 0.5 -28% |
| Contrast (:1) | 990 | 947 -4% | 984 -1% | 1011 2% | 714 -28% |
| Colorchecker dE 2000 * | 10.2 | 6.74 34% | 4.88 52% | 3.67 64% | 9.93 3% |
| Colorchecker dE 2000 max. * | 15.81 | 8.88 44% | 8.33 47% | 14.87 6% | |
| Greyscale dE 2000 * | 11.28 | 6.44 43% | 4.17 63% | 2.73 76% | 10.32 9% |
| Gamma | 2.23 99% | 2.29 96% | 2.53 87% | 2.49 88% | 2.11 104% |
| CCT | 11383 57% | 6465 101% | 6683 97% | 7029 92% | 10096 64% |
| Color Space (Percent of AdobeRGB 1998) (%) | 59 | 38 -36% | 55 -7% | 55 -7% | 58 -2% |
| Color Space (Percent of sRGB) (%) | 90 | 60 -33% | 83 -8% | 84 -7% | 89 -1% |
| Total Average (Program / Settings) | -52% /
-29% | -22% /
-3% | -17% /
1% | -2% /
-4% |
* ... smaller is better
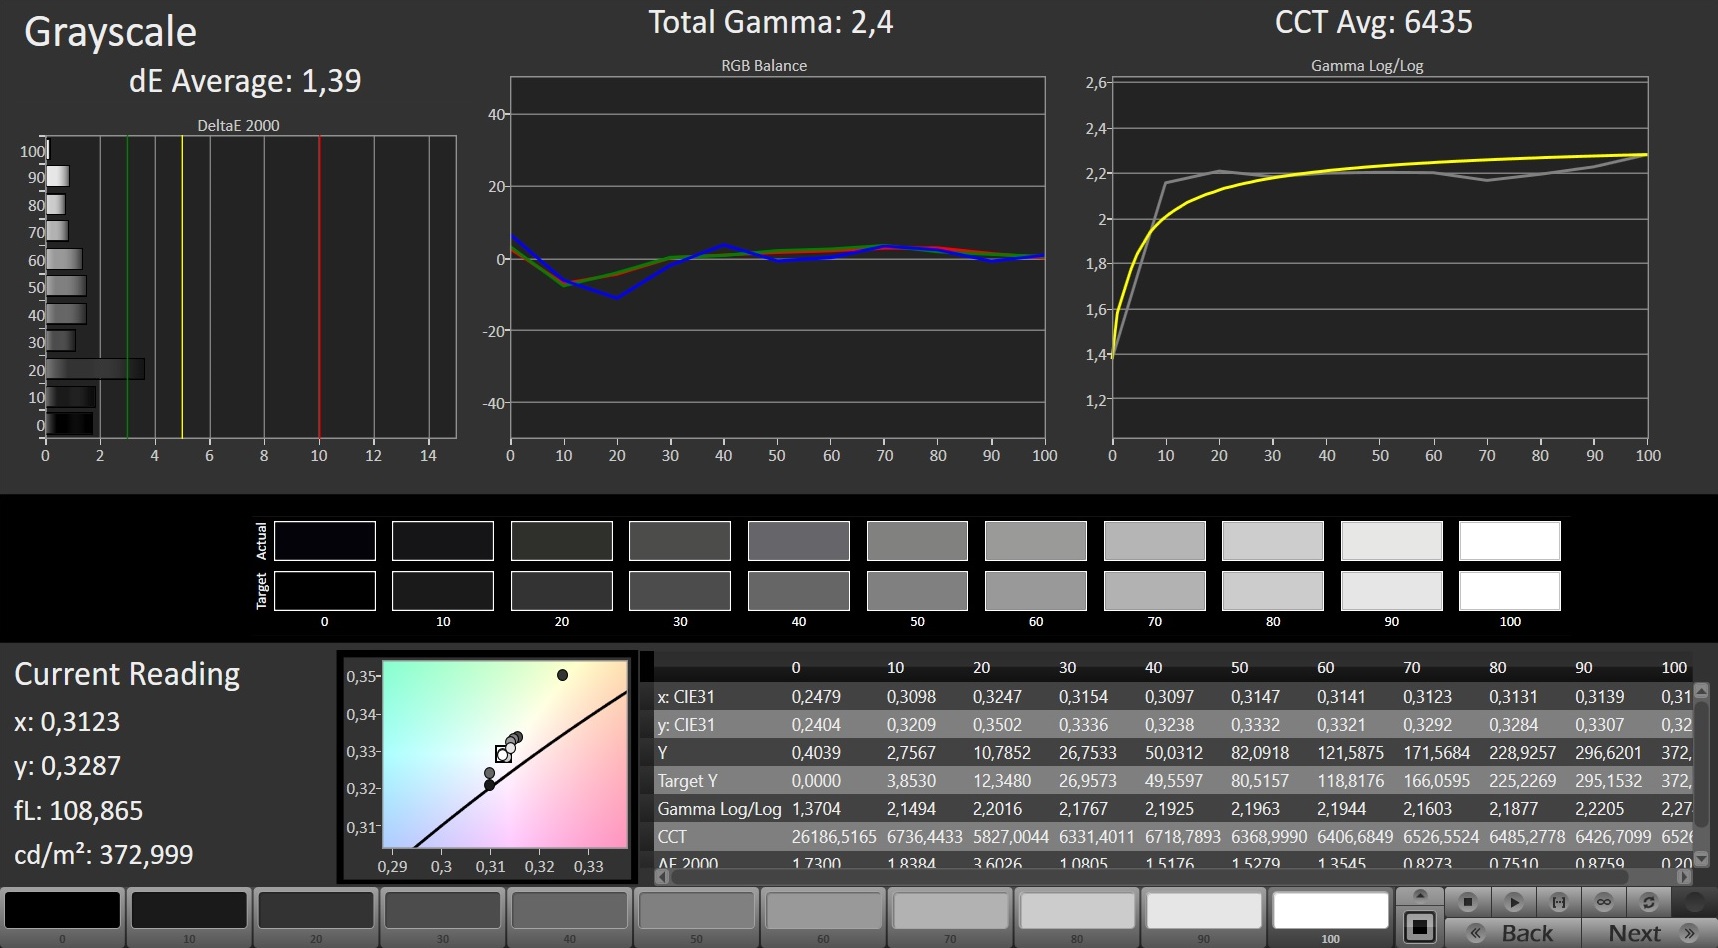
The 15-inch notebook manages a good luminance. 382 nits on average ensures a comfortable experience outdoors, and the brightness distribution (93%) is also great. Subjectively, we could not notice any clouding. The black value is not excellent at 0.39 cd/m², but the contrast is still 990:1 – a good result.
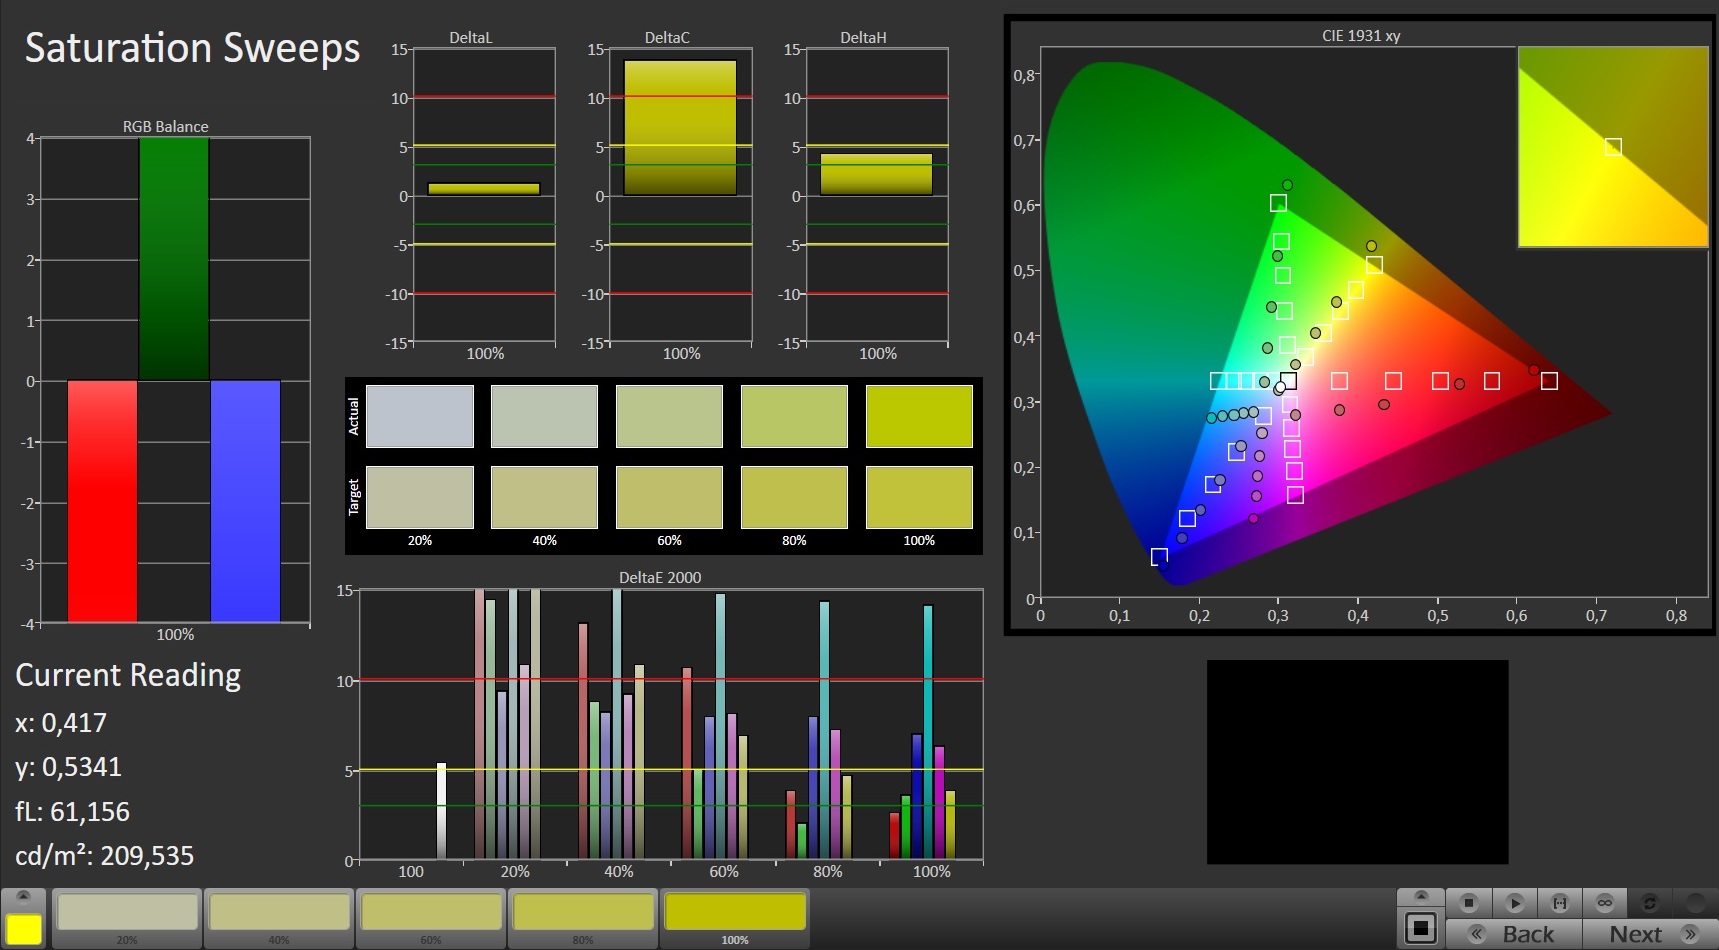
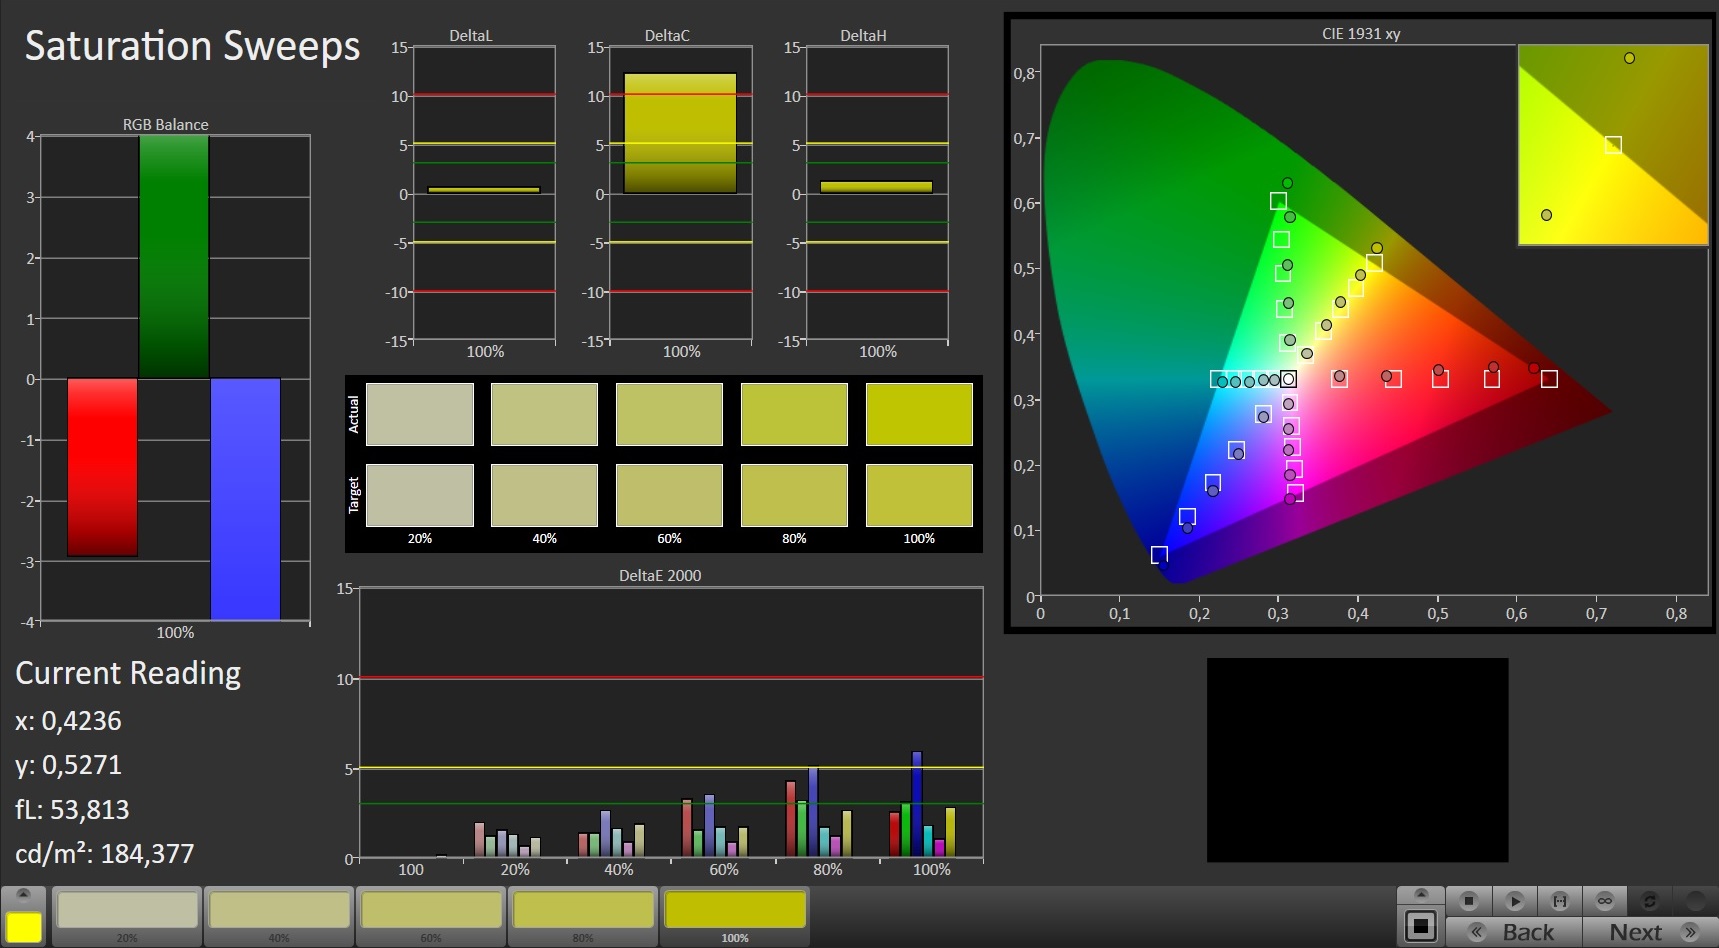
There is criticism for the mediocre color accuracy. A DeltaE-2000 deviation of more than 10 (Grayscale & ColorChecker) does not ensure an accurate picture. However, we managed to reduce the values to less than 3 by calibration, so we recommend tuning the device (our icc-file is linked in the box above). The Alienware 15 R3 is average in terms of color gamut; 90% sRGB and 59% AdobeRGB are typical for a laptop display.
The viewing-angle stability is between an inexpensive TN panel and a decent IPS screen. As long as you are the only user in front of the laptop, the provided viewing angles are still acceptable. This panel is not even close to OLED screens though. We have more information about the technology behind OLED panels in our dedicated article or the review of the Alienware 13 R3, which will be published soon.
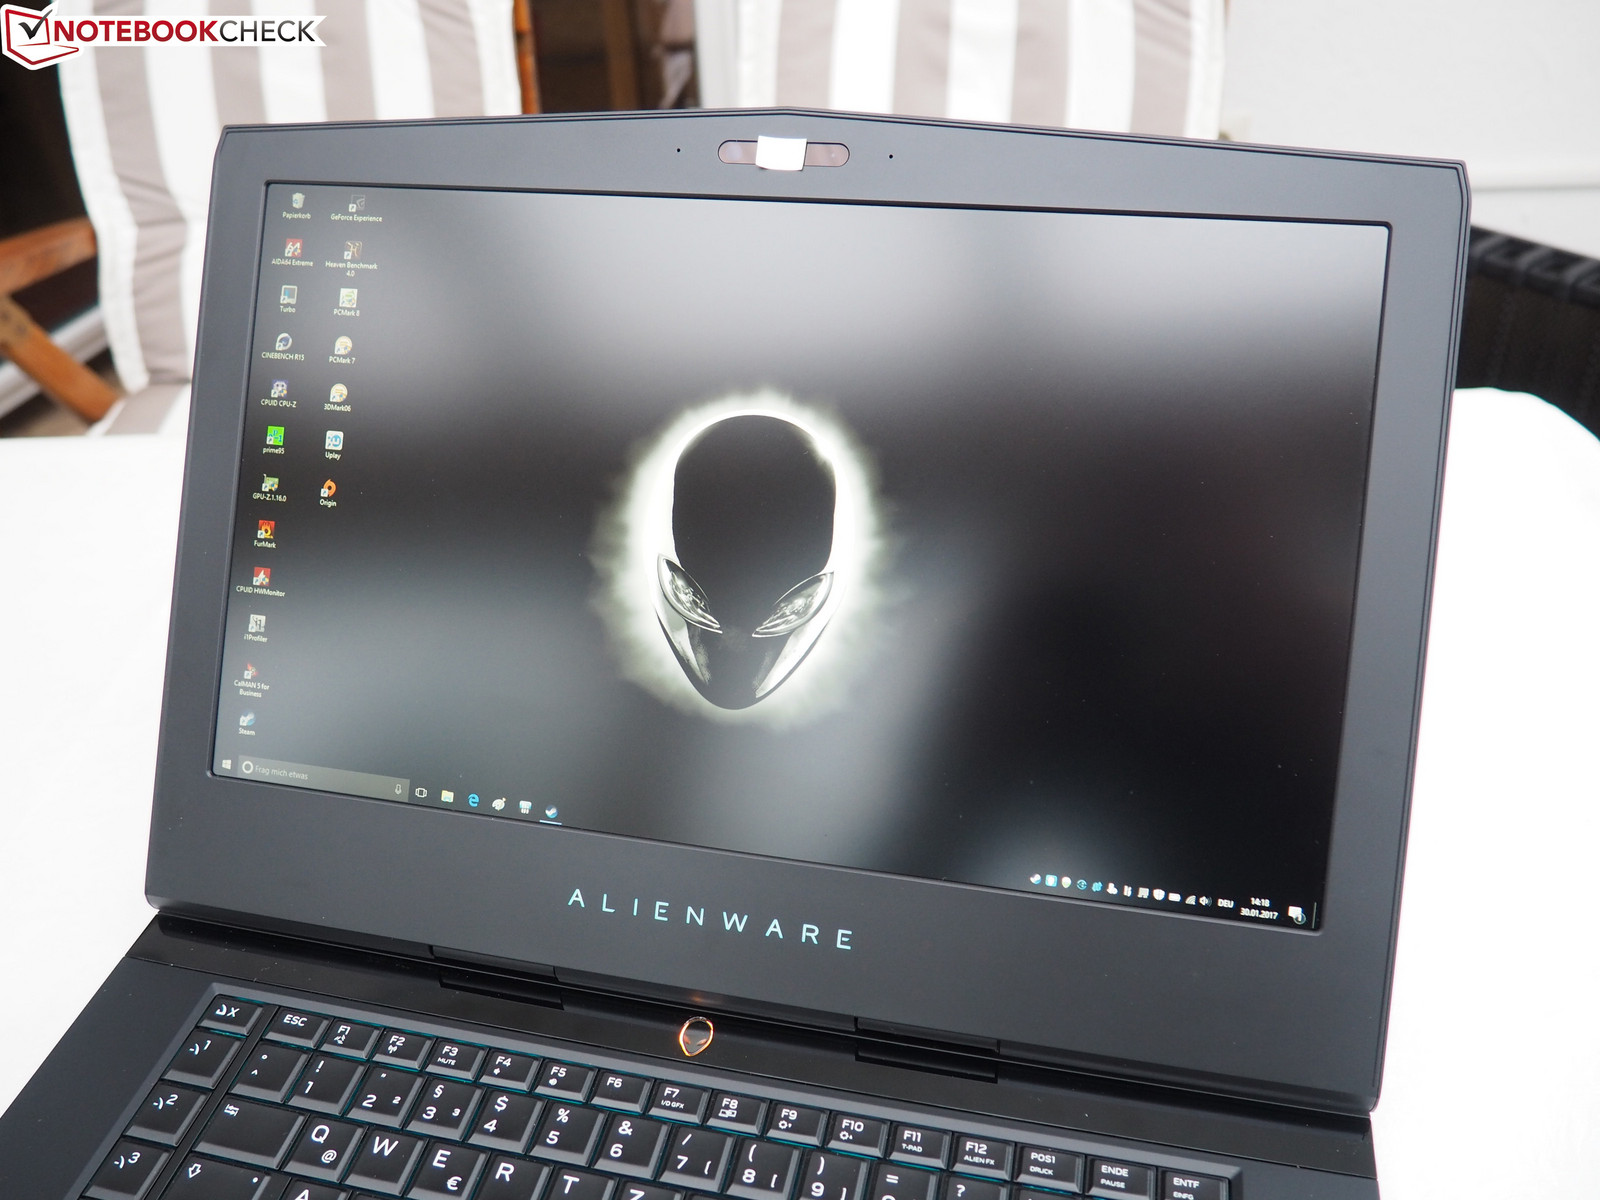

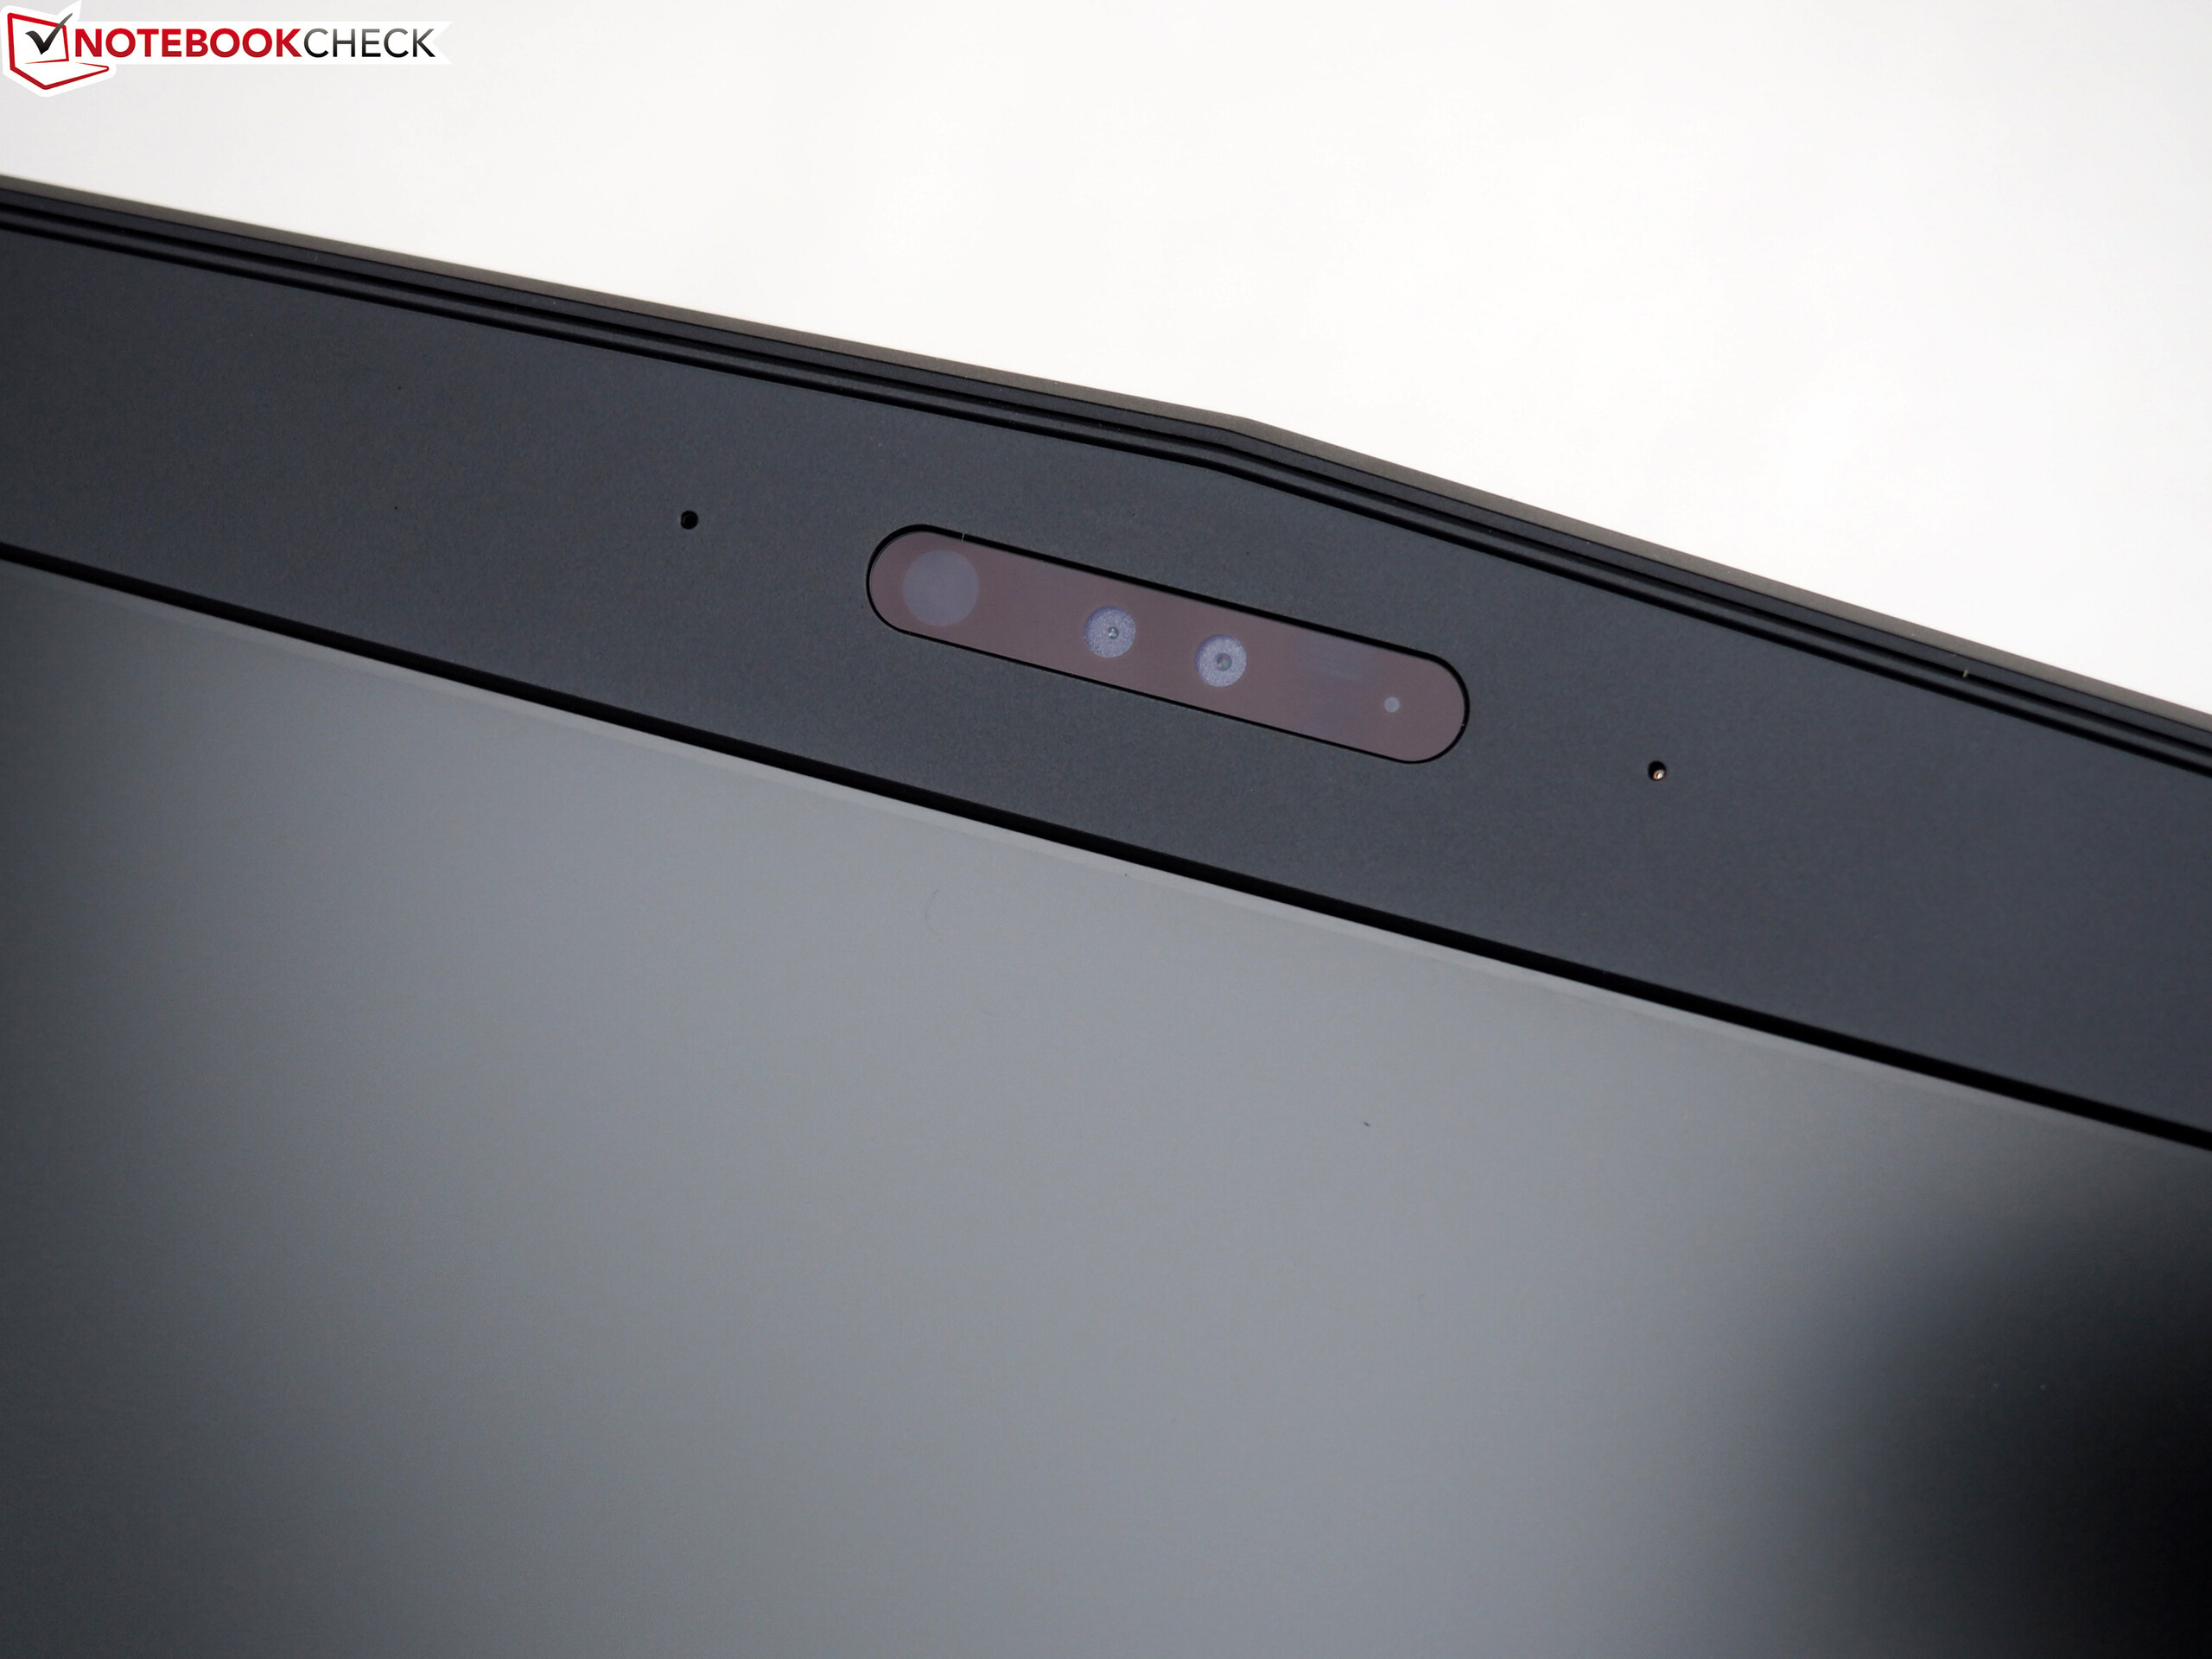
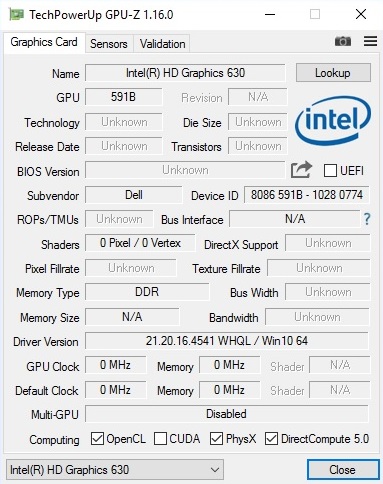
Note: It is not possible to use the processor GPU (HD Graphics 630) due to G-Sync. The corresponding iGFX switch (Fn + F7) therefore does not work. Many Clevo barebones provide a better solution, because you can just switch between G-Sync and Optimus via software/BIOS. A small consolation is the additional camera for eye-tracking.
Display Response Times
| ↔ Response Time Black to White | ||
|---|---|---|
| 12 ms ... rise ↗ and fall ↘ combined | ↗ 4 ms rise | 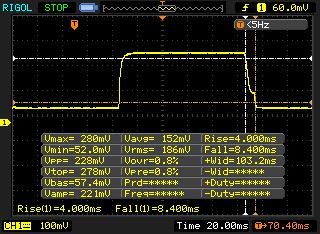 |
| ↘ 8 ms fall | ||
| The screen shows good response rates in our tests, but may be too slow for competitive gamers. In comparison, all tested devices range from 0.1 (minimum) to 240 (maximum) ms. » 31 % of all devices are better. This means that the measured response time is better than the average of all tested devices (19.9 ms). | ||
| ↔ Response Time 50% Grey to 80% Grey | ||
| 25 ms ... rise ↗ and fall ↘ combined | ↗ 12 ms rise | 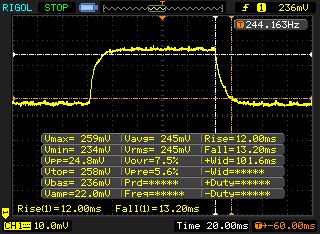 |
| ↘ 13 ms fall | ||
| The screen shows relatively slow response rates in our tests and may be too slow for gamers. In comparison, all tested devices range from 0.165 (minimum) to 636 (maximum) ms. » 35 % of all devices are better. This means that the measured response time is better than the average of all tested devices (31.1 ms). | ||
Screen Flickering / PWM (Pulse-Width Modulation)
| Screen flickering / PWM not detected | 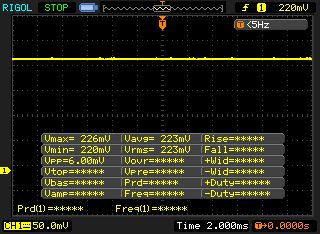 | ||
In comparison: 52 % of all tested devices do not use PWM to dim the display. If PWM was detected, an average of 7794 (minimum: 5 - maximum: 343500) Hz was measured. | |||
Performance
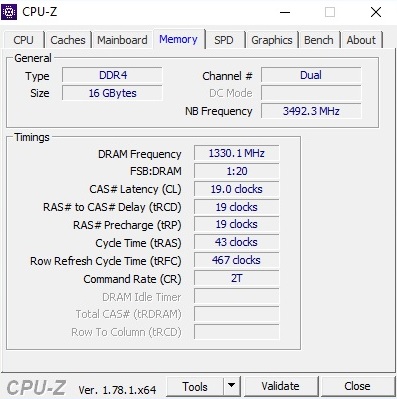
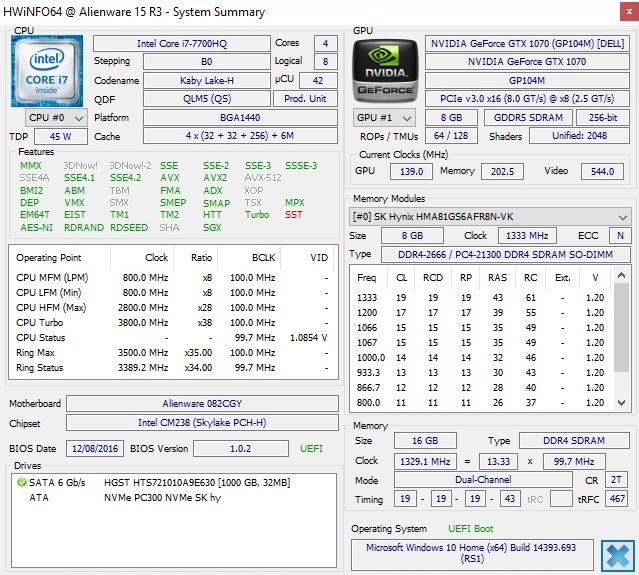
Our test model is equipped with pretty future-proof components. A quad-core processor from Intel and a high-end GPU with 8 GB VRAM should provide sufficient performance for the next couple of years. 16 GB DDR4-RAM and a total of 1.25 TB storage capacity are not bad, either.
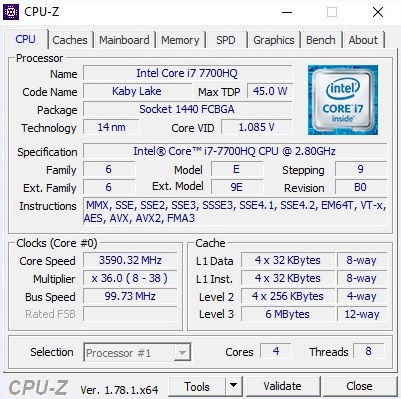
Processor
Even though the Core i5-7300HQ is a very good and powerful notebook CPU, we recommend the Core i7-7700HQ for passionate gamers. Thanks to the Hyper-Threading technology, the Kaby Lake model can execute eight instead of four threads simultaneously, and some games already benefit from it. The i7-7700HQ is also a bit faster at 2.8-3.8 instead of 2.5-3.5 GHz.


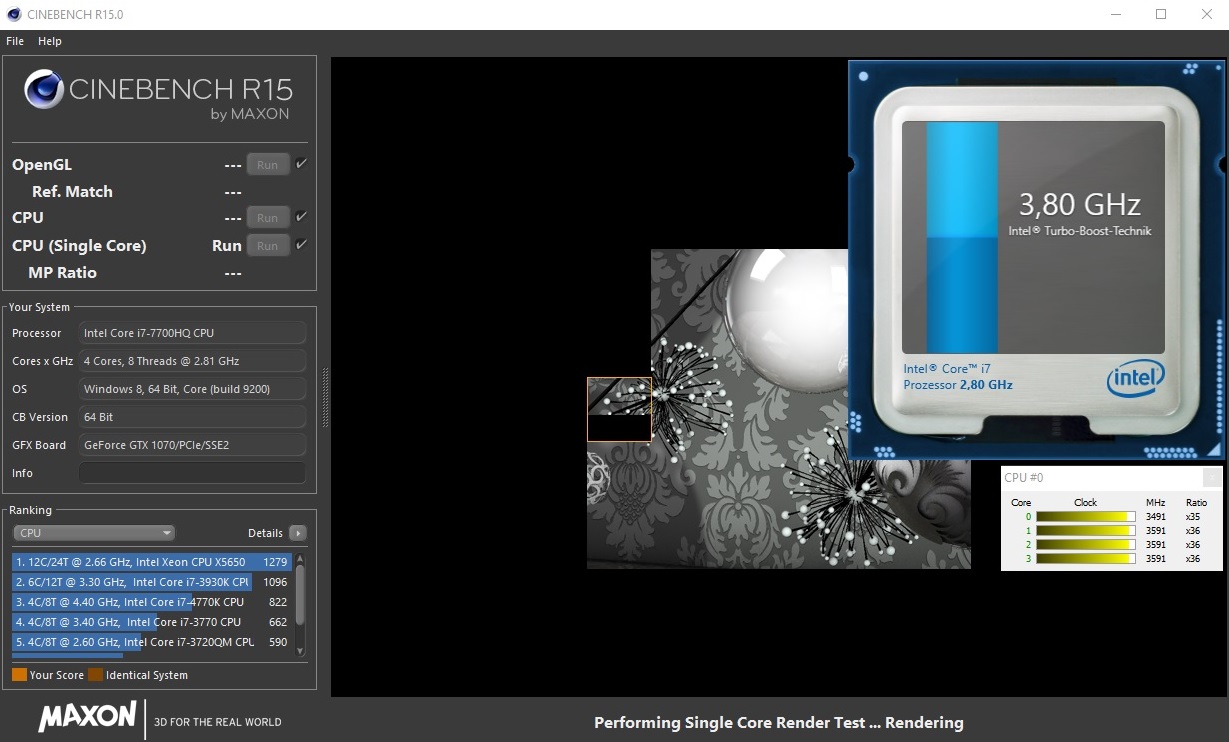
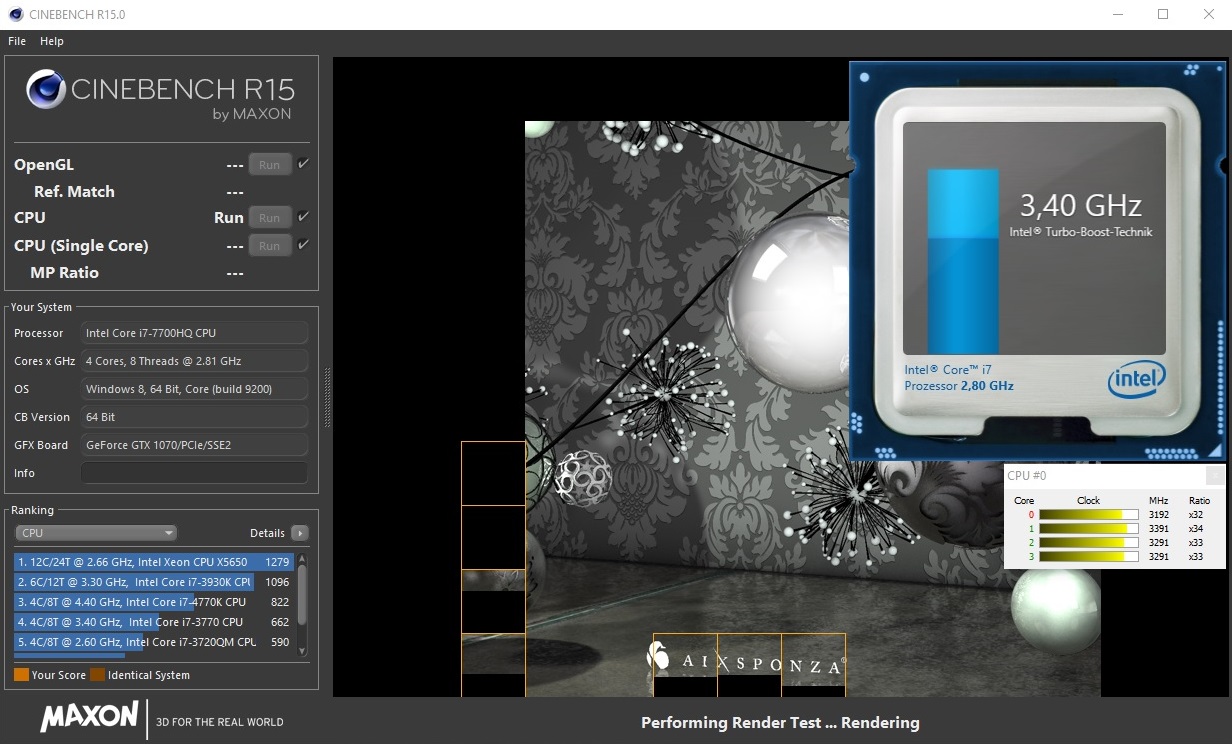
The Alienware 15 R3 can utilize the CPU Turbo very well. The 14 nm chip will –depending on the number of active cores – run at 3.4-3.8 GHz as long as the power adapter is attached and the CPU is not artificially stressed. The clock on battery power will heavily depend on the GPU load. Stress for the CPU results in 3.2-3.8 GHz, and 2.7 GHz on average in 3D applications. The latter behavior is typical for a notebook.
Our benchmark scores do not reveal any surprises. The Alienware 15 R3 is on par with other 7700HQ laptops like the Schenker XMG P507 in Cinebench R15 as well as R11.5. Older systems with the Skylake model Core i7-6700HQ are about 10% slower on average, but you will not notice any differences in practice.
System Performance
The 15-inch system manages very good scores in the system tests thanks to the balanced hardware configuration. Both PCMark 7 and PCMark 8 see the Alienware 15 R3 at the top of the comparison. The system is conveniently responsive and also boots up very quickly. You can also feel the advantage over laptops with conventional HDDs when you copy/transfer files or install applications.
| PCMark 8 | |
| Home Score Accelerated v2 | |
| Alienware 15 R3 | |
| Asus Strix GL502VS-FY032T | |
| MSI GT62VR-6RE16H21 | |
| Schenker XMG P507 PRO | |
| Alienware 15 R2 (Skylake) | |
| Work Score Accelerated v2 | |
| Alienware 15 R3 | |
| Schenker XMG P507 PRO | |
| Alienware 15 R2 (Skylake) | |
| Asus Strix GL502VS-FY032T | |
| MSI GT62VR-6RE16H21 | |
| PCMark 7 - Score | |
| Alienware 15 R3 | |
| Schenker XMG P507 PRO | |
| MSI GT62VR-6RE16H21 | |
| Alienware 15 R2 (Skylake) | |
| PCMark 7 Score | 6886 points | |
| PCMark 8 Home Score Accelerated v2 | 4966 points | |
| PCMark 8 Creative Score Accelerated v2 | 7678 points | |
| PCMark 8 Work Score Accelerated v2 | 5299 points | |
Help | ||
Storage Devices
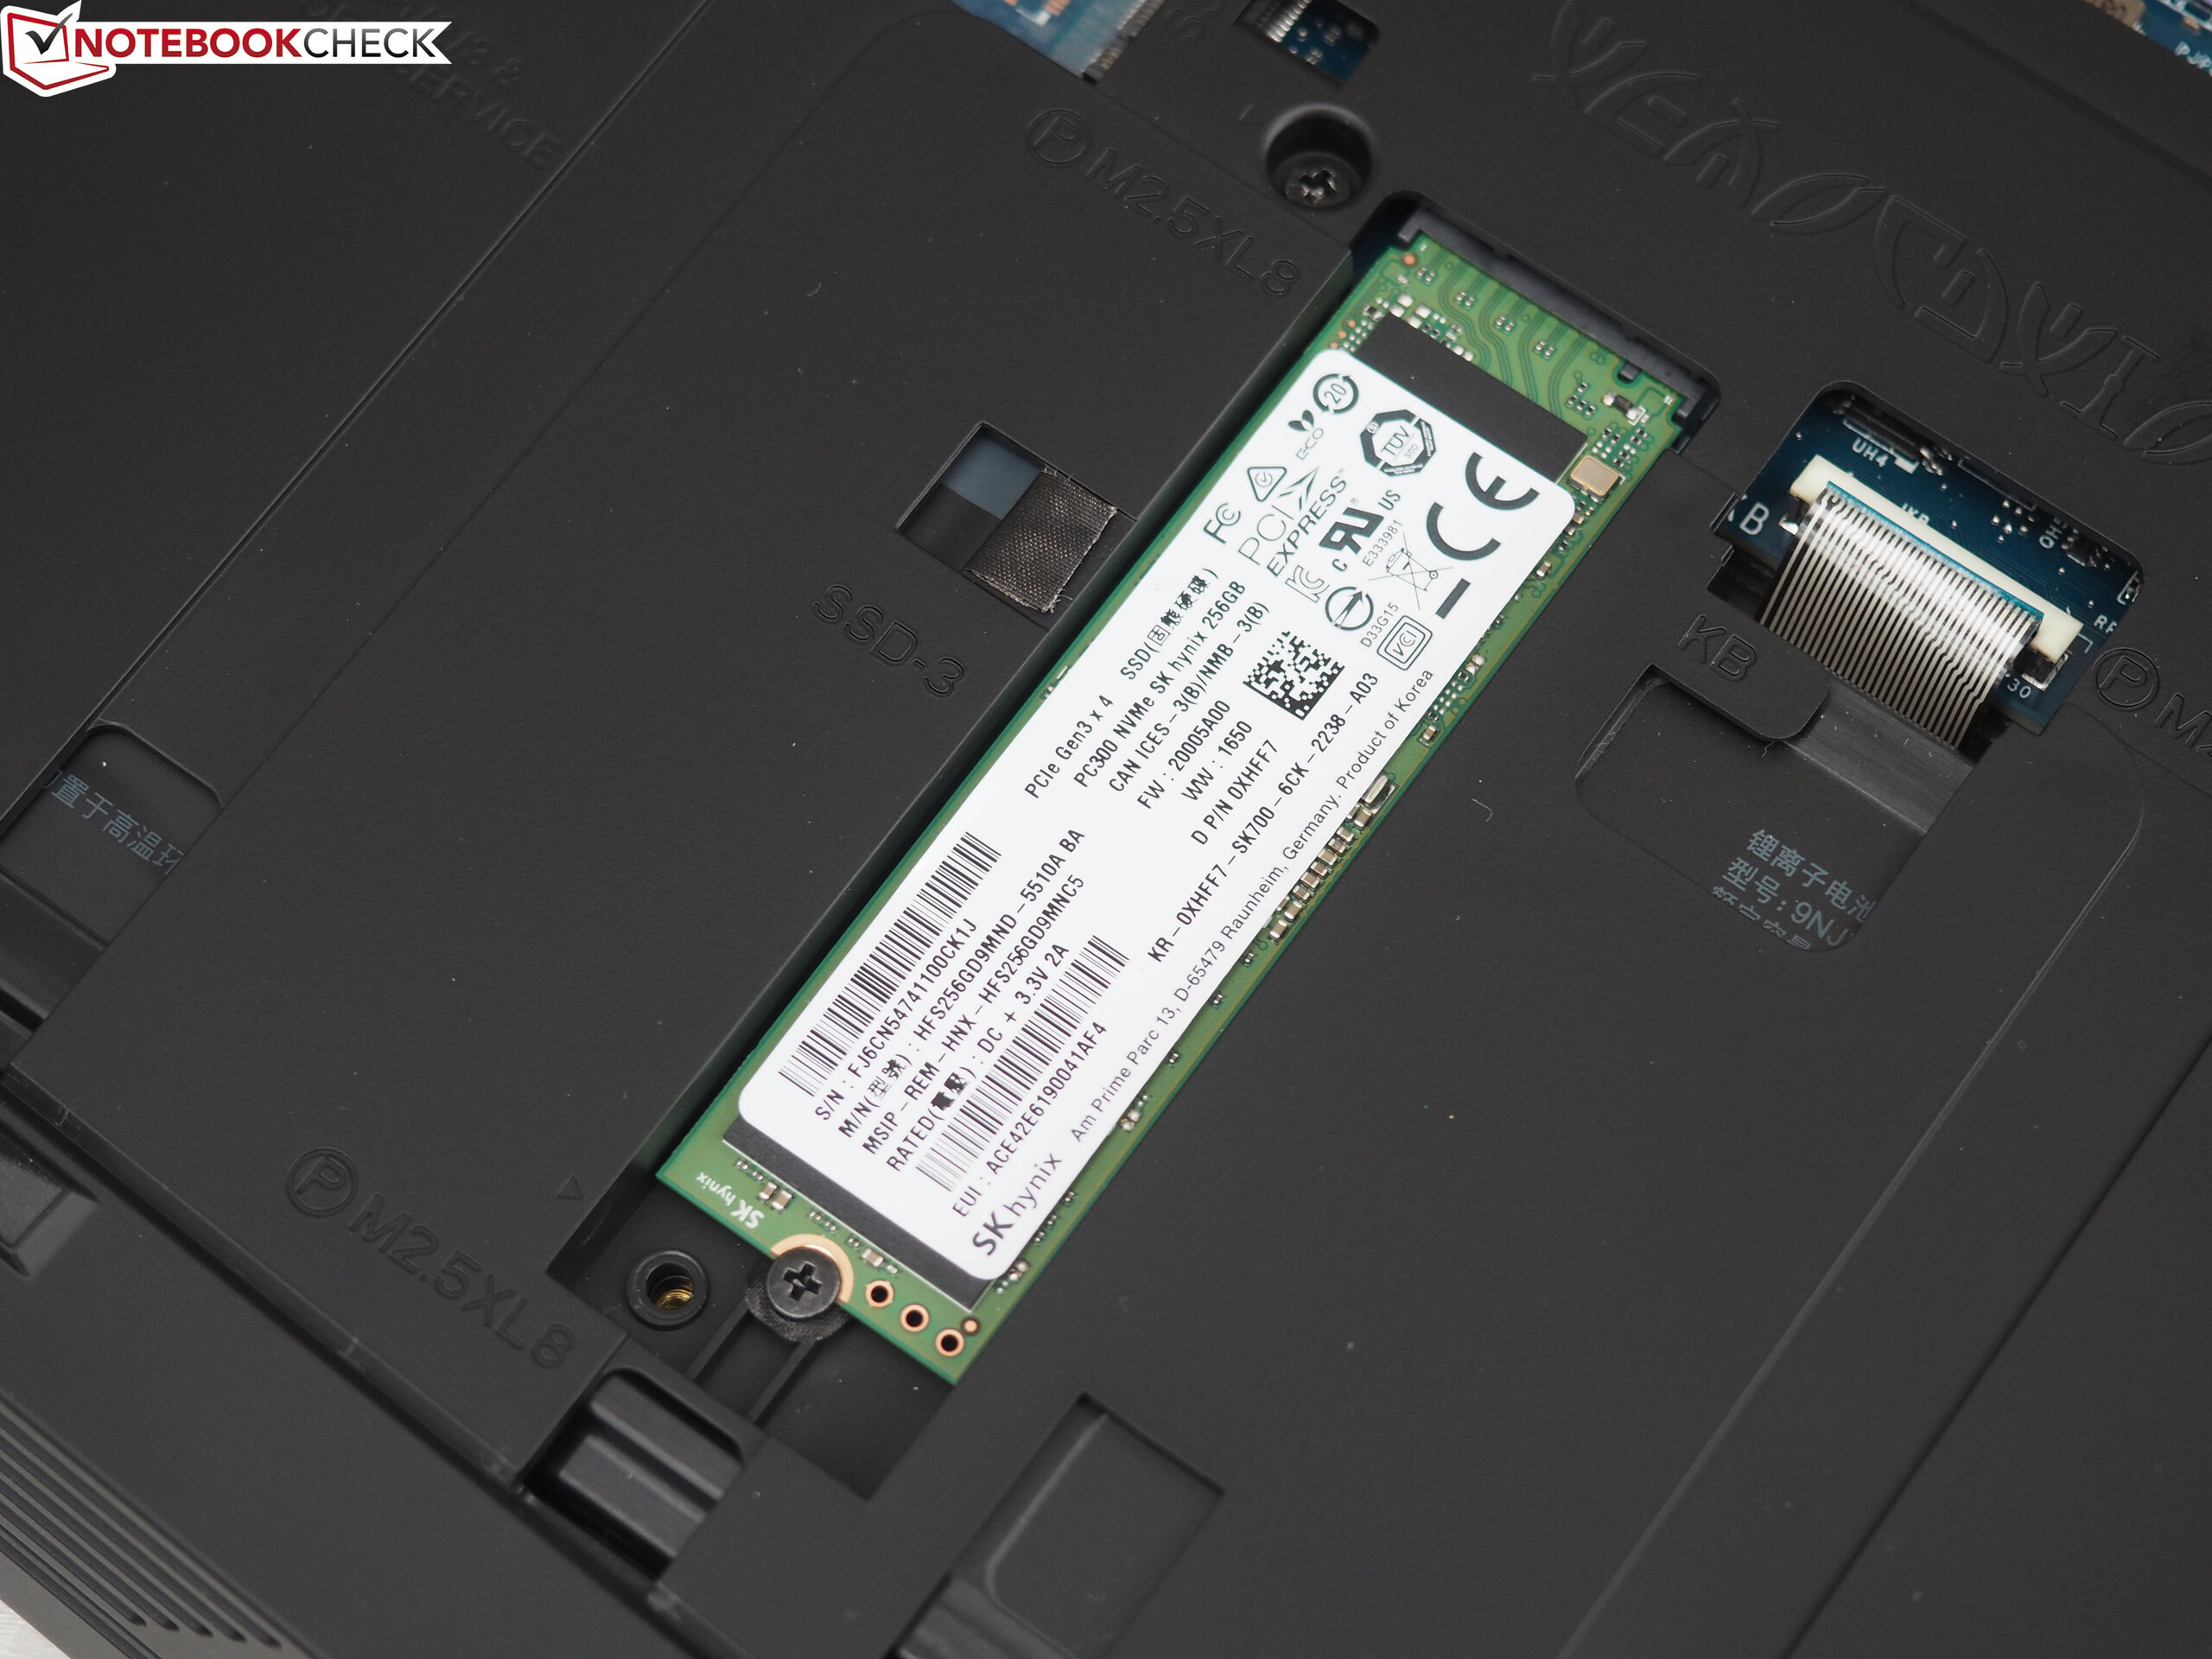
We are still a bit disappointed by the performance of the SSD. Dell equips the top model with a 256 GB drive with the designation SK Hynix PC300, which is attached via PCIe/NVMe, but it cannot utilize the full performance potential. While 1123 MB/s sequential read (CrystalDiskMark) deserves respect, 429 MB/s (sequential write) falls short of our expectations. This value reminds us of a SATA-III drive, which is limited at ~500 MB/s.
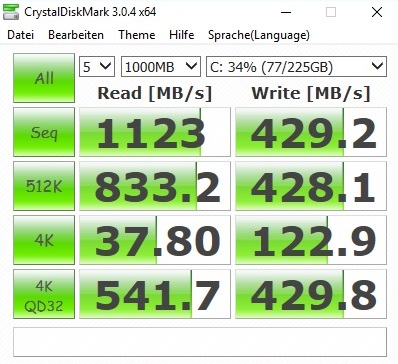
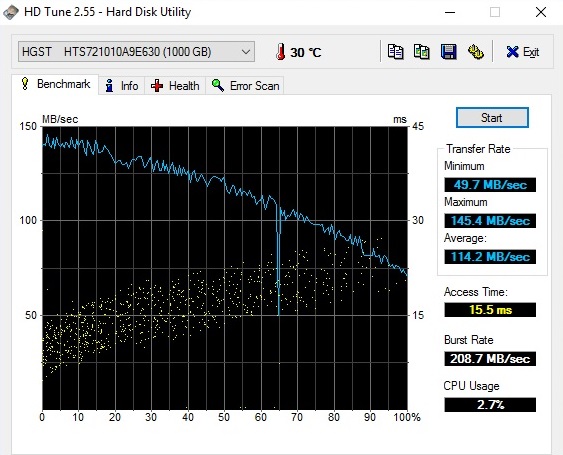
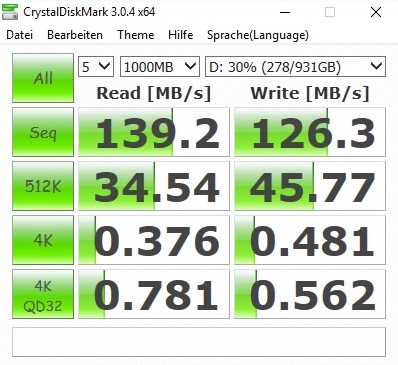
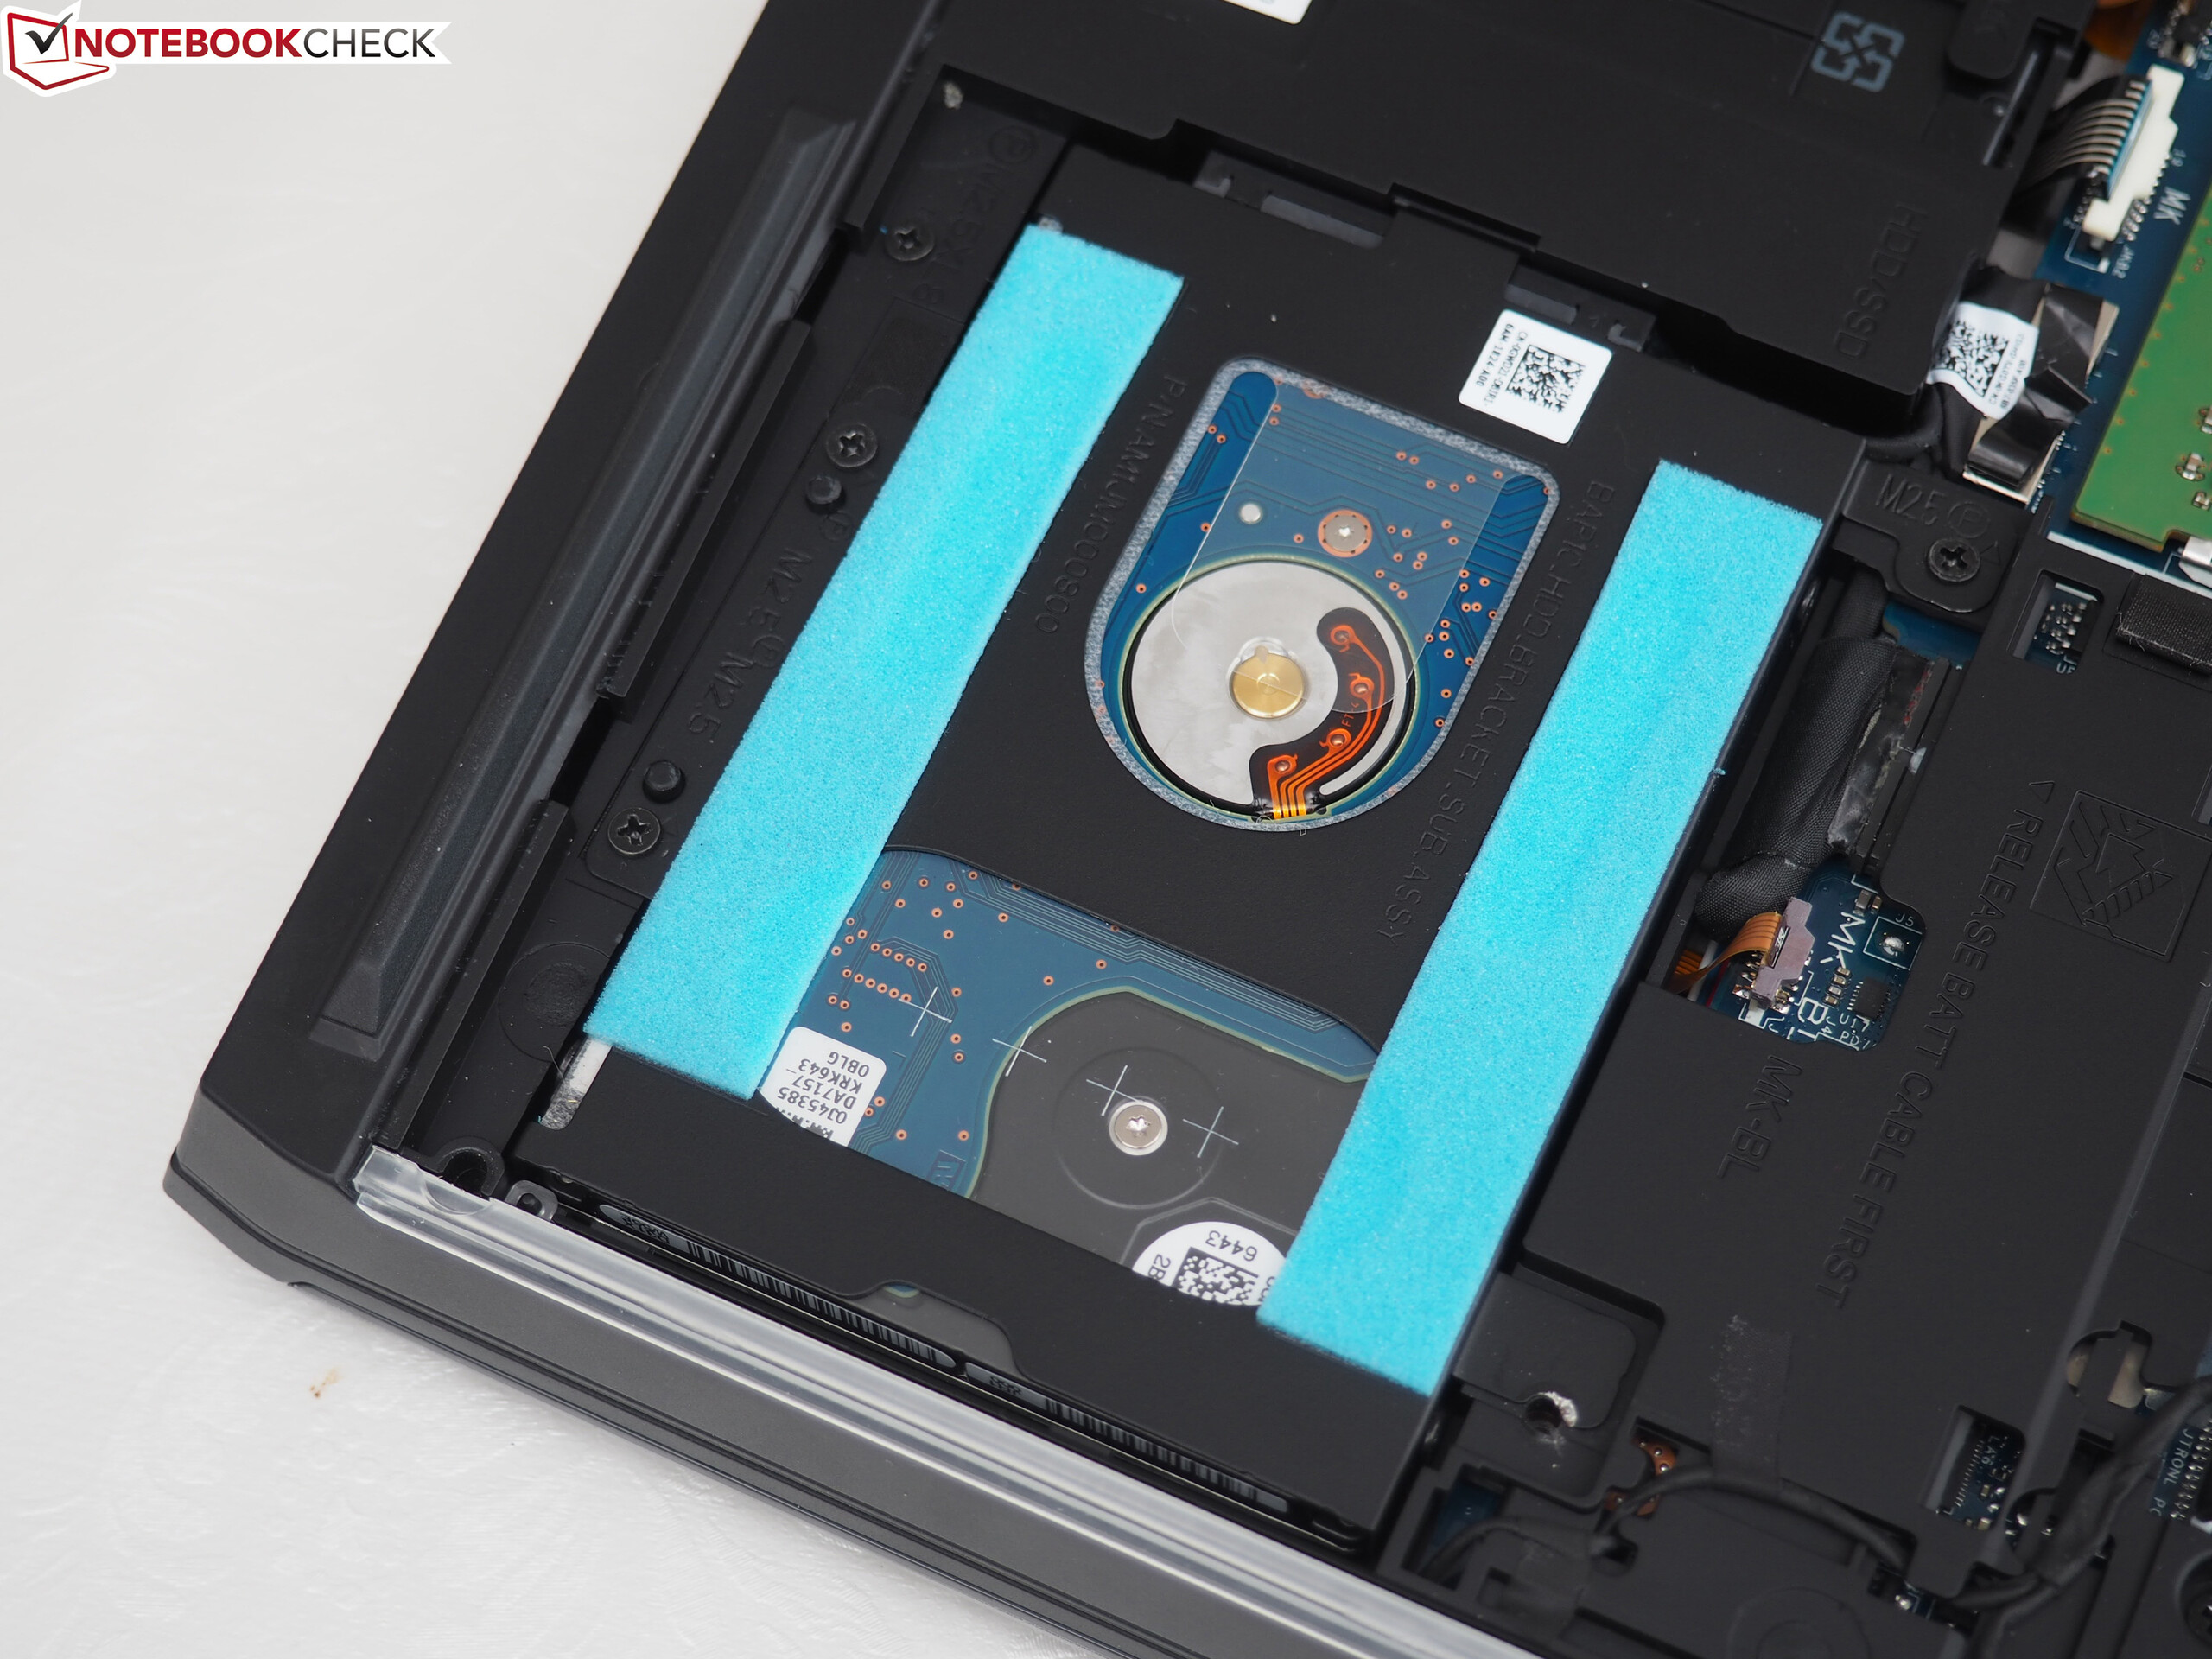
Many other PCIe/NVMe products (like the Samsung 960 Evo in the XMG P507) also manage more than 1000 MB/s for write operations. In short: Dell should use a faster SSD considering the price (similar performance figures for small files or not). There is no criticism for the secondary storage solution. The HGST Travelstar 7K1000 is fast enough and an extremely popular 1 TB HDD (7200 rpm).
| Alienware 15 R3 | Alienware 15 R2 (Skylake) Samsung PM951 NVMe MZ-VLV256D | Asus Strix GL502VS-FY032T SanDisk SD8SNAT256G1002 | MSI GT62VR-6RE16H21 Toshiba HG6 THNSNJ256G8NY | Schenker XMG P507 PRO Samsung SSD 960 Evo 500GB m.2 NVMe | |
|---|---|---|---|---|---|
| CrystalDiskMark 3.0 | -7% | -44% | -23% | 104% | |
| Read Seq (MB/s) | 1123 | 1213 8% | 485.4 -57% | 523 -53% | 1718 53% |
| Write Seq (MB/s) | 429.2 | 306 -29% | 312.4 -27% | 485.5 13% | 1635 281% |
| Read 512 (MB/s) | 833 | 652 -22% | 294.8 -65% | 444.7 -47% | 873 5% |
| Write 512 (MB/s) | 428.1 | 304.8 -29% | 287.8 -33% | 471.2 10% | 1216 184% |
| Read 4k (MB/s) | 37.8 | 42.62 13% | 21.44 -43% | 21.86 -42% | 59.1 56% |
| Write 4k (MB/s) | 122.9 | 143.7 17% | 75.7 -38% | 98.8 -20% | 177.5 44% |

GPU Performance
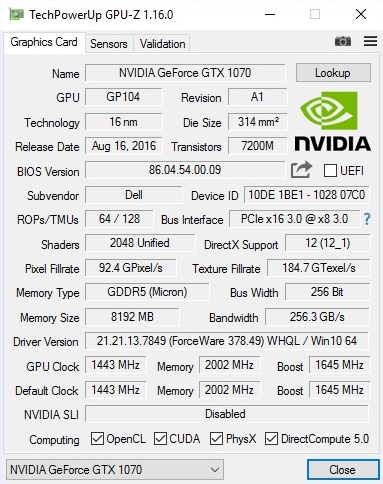
You can choose between the two GPUs GeForce GTX 1060 and GeForce GTX 1070. The less powerful Pascal model is sufficient when you only want to play on a Full HD screen. Enthusiasts, however, who always want to use all the details, picture optimizations and maybe 3K or 4K resolutions, should get the GTX 1070. The DirectX 12 chip is equipped with 2048 shaders and even surpasses its desktop counterpart (1920 shaders) in this respect.
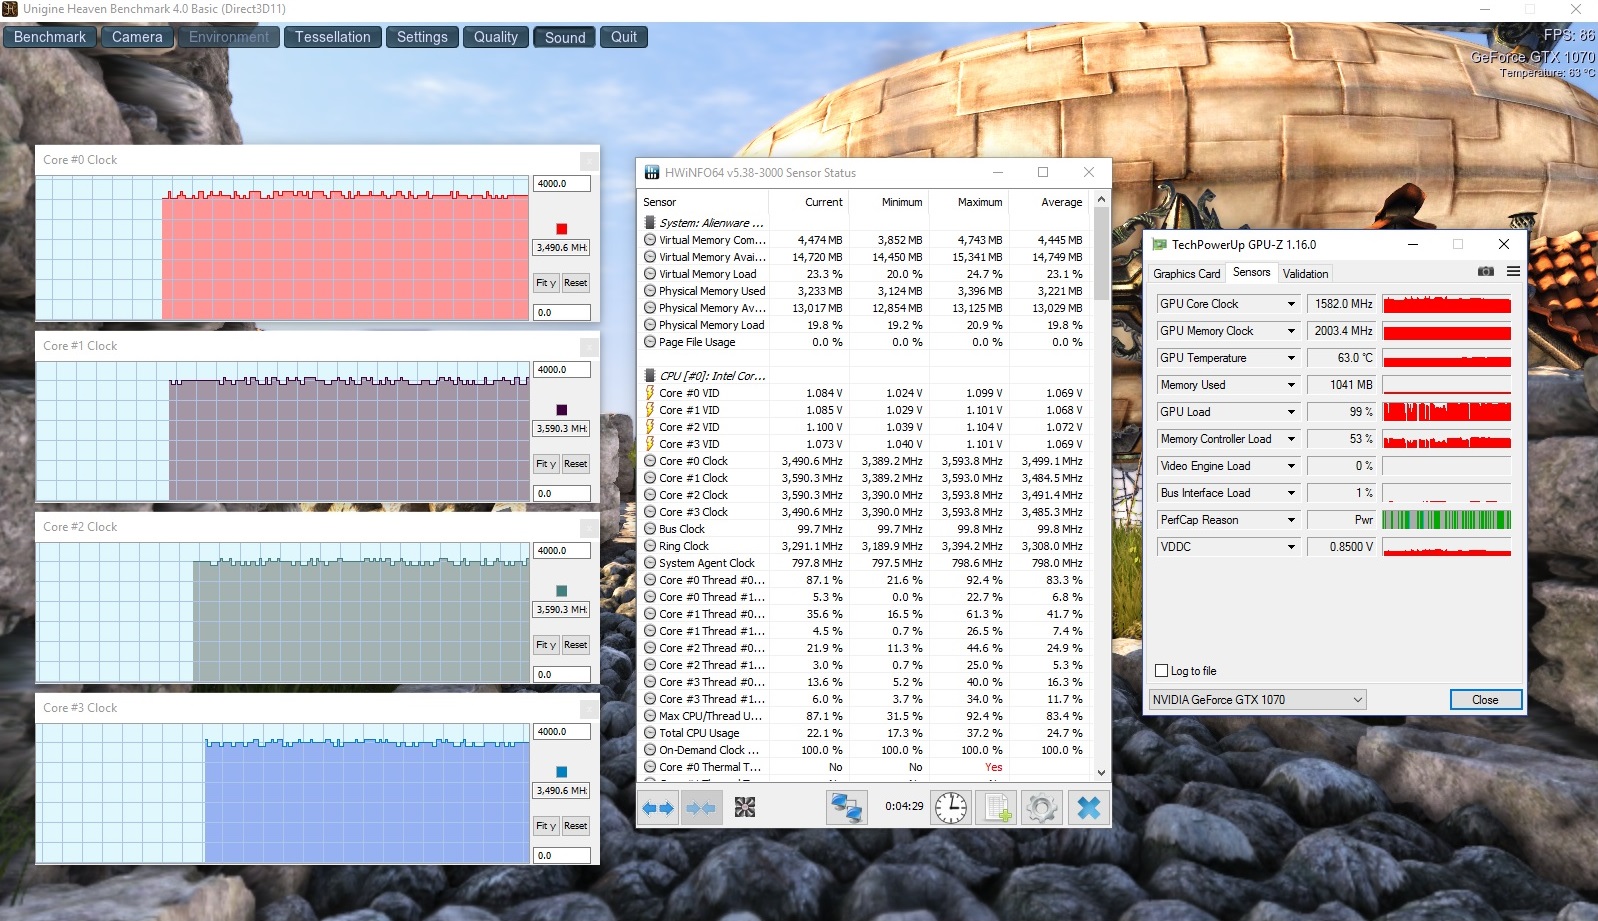
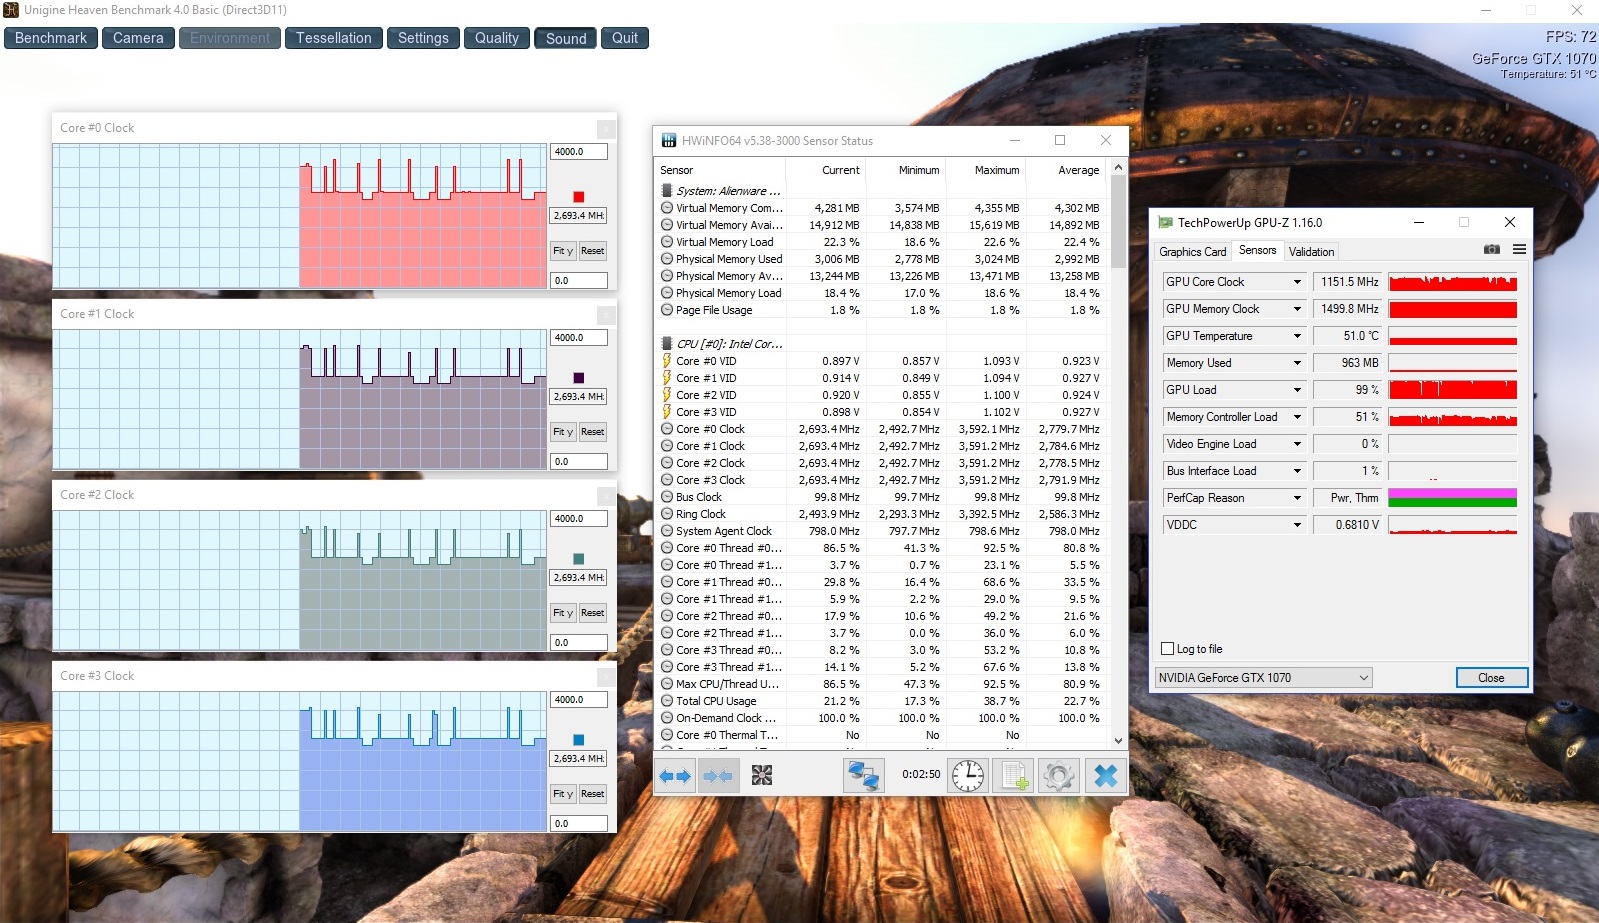
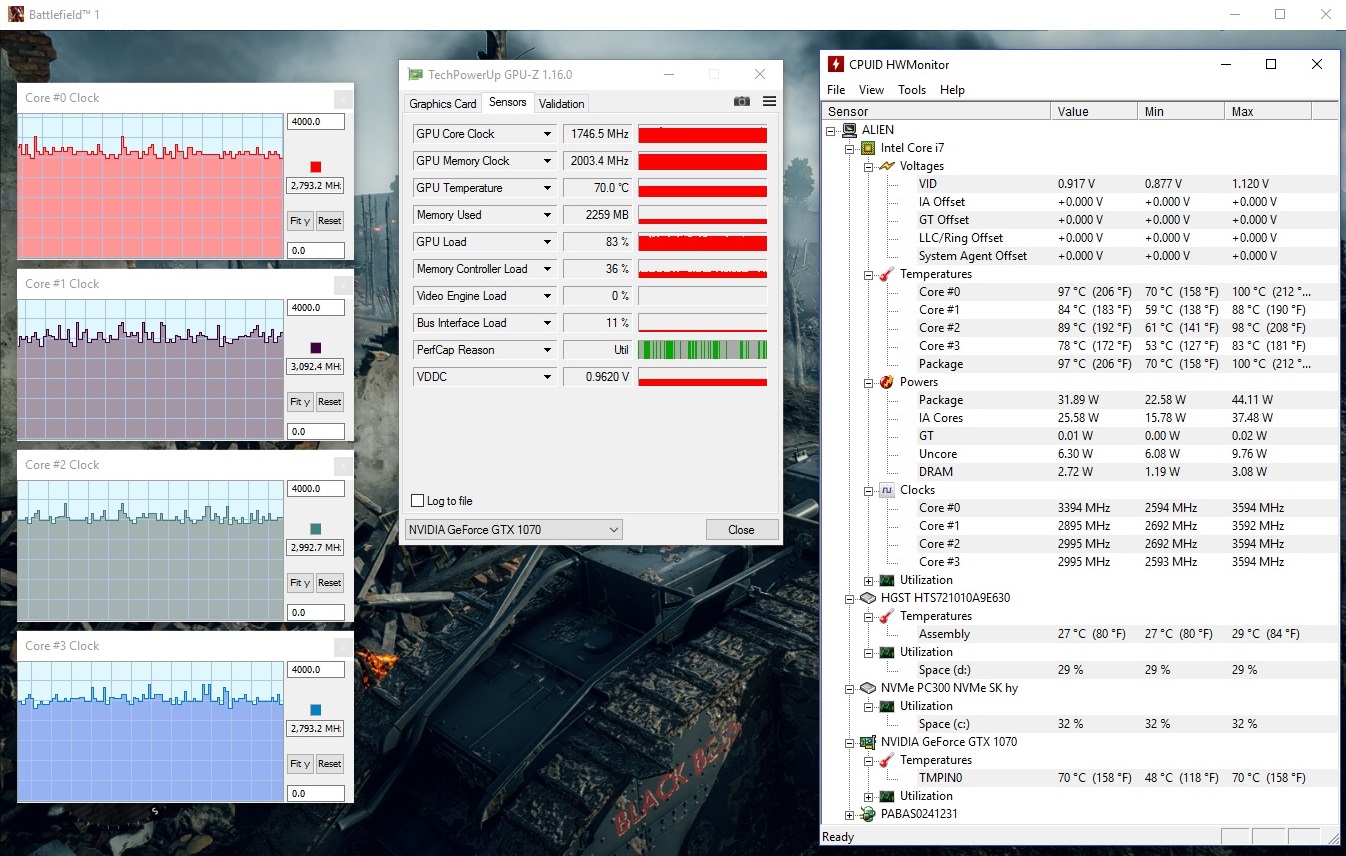
That the notebook model is still slightly slower is a result of the lower clocks or the worse Turbo utilization, respectively. Nvidia "only" advertises a Turbo range of 1443-1645 MHz, but the chip can reach up to 1900 MHz (GPU-Z Render test). The average clock of the GeForce GTX 1070 under load is ~1600 MHz in the Unigine Heaven 4.0 Benchmark (~1100 MHz on battery). The clock was ~100 MHz higher in Battlefield 1.
| 3DMark - 1920x1080 Fire Strike Graphics | |
| Alienware 15 R3 | |
| MSI GT62VR-6RE16H21 | |
| Schenker XMG P507 PRO | |
| Asus Strix GL502VS-FY032T | |
| Alienware 15 R2 (Skylake) | |
| 3DMark 11 - 1280x720 Performance GPU | |
| Alienware 15 R3 | |
| MSI GT62VR-6RE16H21 | |
| Asus Strix GL502VS-FY032T | |
| Schenker XMG P507 PRO | |
| Alienware 15 R2 (Skylake) | |
| Unigine Heaven 4.0 - Extreme Preset DX11 | |
| Alienware 15 R3 | |
| Schenker XMG P507 PRO | |
| MSI GT62VR-6RE16H21 | |
| Alienware 15 R2 (Skylake) | |
As per usual, we only noticed a drop below the base frequency (throttling) in the stress test with the tools FurMark and Prime95. The memory clock of the 8 GB GDDR5-VRAM (256-bit interface) is 4000 MHz in 3D applications.
That Nvidia's Pascal architecture is a big success is confirmed in the synthetic benchmarks. The new model is almost twice as fast as the GTX 980M of the Alienware 15 R2. We cannot see big differences compared to other GTX 1070 systems, but the Alienware 15 R3 can secure the top spot in 3DMark 13, 3DMark 11 and the Unigine Heaven 4.0 Benchmark. The small advantage could also be a result of the driver; our test model was equipped with the brand-new ForceWare 378.49.
| 3DMark 11 Performance | 16435 points | |
| 3DMark Ice Storm Standard Score | 135715 points | |
| 3DMark Cloud Gate Standard Score | 26672 points | |
| 3DMark Fire Strike Score | 13728 points | |
Help | ||
Gaming Performance
Our gaming check with six titles from 2016 and 2017 is not a big challenge for the GeForce GTX 1070. Even maximum details are conveniently smooth in the native resolution of 1920x1080 pixels. This includes first-person shooters (Battlefield 1, Titanfall 2, Call of Duty Infinite Warfare), open-world titles (Watch Dogs 2) or horror games (Resident Evil 7). Even the rather poorly optimized stealth adventure Dishonored 2 runs at more than 60 FPS in the Ultra preset. Only 3K and 4K resolutions can be a bit too demanding, and the GeForce GTX 1080 might be worth a look in this case.
| Titanfall 2 | |
| 1920x1080 Very High (Insane Texture Quality) / Enabled AA:TS AF:16x | |
| Alienware 15 R3 | |
| Schenker XMG P507 PRO | |
| 1920x1080 High / Enabled AA:TS AF:8x | |
| Alienware 15 R3 | |
| Schenker XMG P507 PRO | |
| Call of Duty Infinite Warfare | |
| 1920x1080 Ultra / On AA:T2X SM | |
| Alienware 15 R3 | |
| Schenker XMG P507 PRO | |
| 1920x1080 High / On AA:FX | |
| Alienware 15 R3 | |
| Schenker XMG P507 PRO | |
| Dishonored 2 | |
| 1920x1080 Ultra Preset AA:TX | |
| Alienware 15 R3 | |
| Schenker XMG P507 PRO | |
| 1920x1080 High Preset AA:TX | |
| Schenker XMG P507 PRO | |
| Alienware 15 R3 | |
| Watch Dogs 2 | |
| 1920x1080 Ultra Preset | |
| Alienware 15 R3 | |
| Schenker XMG P507 PRO | |
| 1920x1080 High Preset | |
| Alienware 15 R3 | |
| Schenker XMG P507 PRO | |
| Resident Evil 7 | |
| 1920x1080 Very High / On AA:FXAA+T | |
| Alienware 15 R3 | |
| 1920x1080 High / On AA:FXAA+T | |
| Alienware 15 R3 | |
| Battlefield 1 | |
| 1920x1080 Ultra Preset AA:T | |
| Alienware 15 R3 | |
| 1920x1080 High Preset AA:T | |
| Alienware 15 R3 | |
| low | med. | high | ultra | |
|---|---|---|---|---|
| Battlefield 1 (2016) | 121 | 109 | ||
| Titanfall 2 (2016) | 132 | 121 | ||
| Call of Duty Infinite Warfare (2016) | 121 | 114 | ||
| Dishonored 2 (2016) | 85 | 73.3 | ||
| Watch Dogs 2 (2016) | 83.2 | 62.9 | ||
| Resident Evil 7 (2017) | 156 | 130 |
Emissions
System Noise
The noise development of our test model is a problem. It does not matter if you run 3DMark06, Battlefield 1 or a maximum load scenario with Prime95 and FurMark: The Alienware 15 R3 always produces ~50 dB(A), which is very audible and also annoying for many users without a headset.
We suspected the fan control at first (too aggressive behavior), but the temperature measurements showed different temperatures for the CPU cores. A difference of almost 20 °C suggests a problem with the cooler position (no visual signs) or a poor job with the thermal paste. We can rule out a software bug that causes bad load scenarios, because all cores are utilized similarly in the task manager.
The situation is not perfect while idling, either. The fans are sometimes completely deactivated, so you can only hear a subtle murmur of the HDD, but they will sometimes pulsate and reach up to 40 dB(A), which is not necessary and is also annoying. This is untypical for Alienware systems and usually limited to Clevo barebones (where the issue can at least be improved via manual control for the fan speeds).
The Alienware 15 R3 does not really know any levels in-between. The CPU fan is either deactivated or subjectively running at full speed. Perhaps Dell can improve the big rpm changes with a BIOS update (the update tool already showed a fresh BIOS – we will test it when the time allows for it).
Noise level
| Idle |
| 31 / 32 / 42 dB(A) |
| HDD |
| 32 dB(A) |
| Load |
| 49 / 50 dB(A) |
 | ||
30 dB silent 40 dB(A) audible 50 dB(A) loud |
||
min: | ||
| Alienware 15 R3 GeForce GTX 1070 Mobile, i7-7700HQ | Alienware 15 R2 (Skylake) GeForce GTX 980M, 6700HQ | Asus Strix GL502VS-FY032T GeForce GTX 1070 Mobile, 6700HQ | MSI GT62VR-6RE16H21 GeForce GTX 1070 Mobile, 6700HQ | Schenker XMG P507 PRO GeForce GTX 1070 Mobile, i7-7700HQ | |
|---|---|---|---|---|---|
| Noise | 4% | 5% | 7% | -3% | |
| off / environment * (dB) | 30 | 30 -0% | 30 -0% | 31 -3% | |
| Idle Minimum * (dB) | 31 | 33.6 -8% | 32 -3% | 32 -3% | 33 -6% |
| Idle Average * (dB) | 32 | 33.8 -6% | 33 -3% | 33 -3% | 34 -6% |
| Idle Maximum * (dB) | 42 | 34 19% | 34 19% | 34 19% | 44 -5% |
| Load Average * (dB) | 49 | 39.3 20% | 39 20% | 40 18% | 46 6% |
| Load Maximum * (dB) | 50 | 51.4 -3% | 51 -2% | 46 8% | 52 -4% |
* ... smaller is better
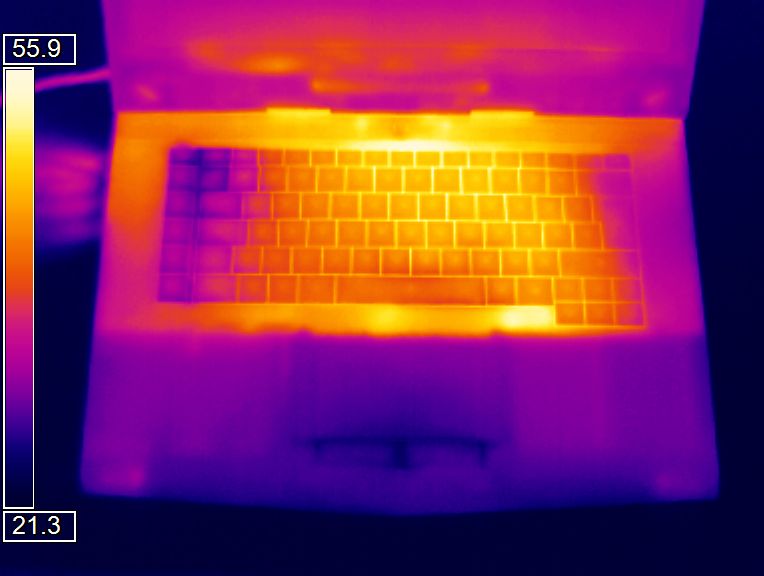
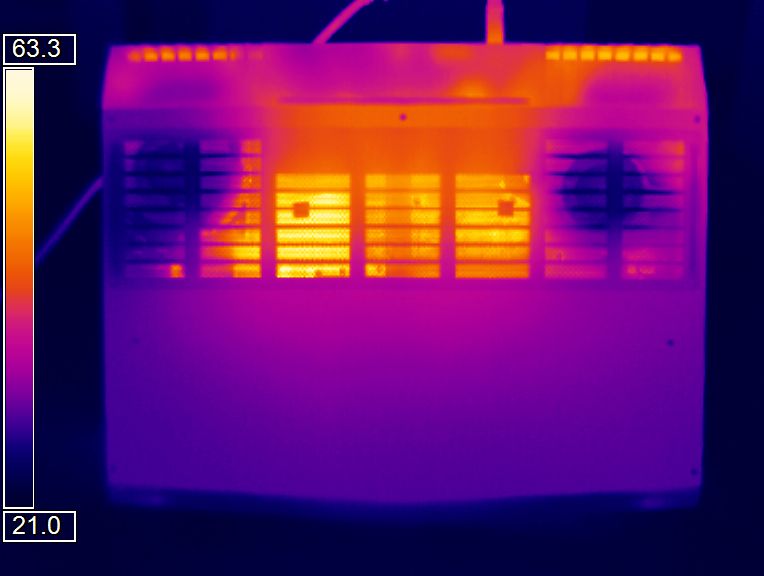
Temperature
There aren't any strange outliers when we look at the temperature development. 32-34 °C on average while idling and up to 46 °C (top) and 52 °C (bottom) in 3D scenarios are neither particularly high nor low. Longer gaming sessions are no problem thanks to the cool palm rests (up to 27 °C).
The components are much more stressed under load. We already mentioned that the Core i7-7700HQ shows very different temperatures. HWMonitor determined ~97 °C for Core #0 (up to 99 °C), but only 74 °C for Core #3 (up to 78 °C) during the stress test.

Differences of more than 10 °C are unusual based on our experiences. The cores in the Schenker XMG P507, for example, only differed by 4 °C. There was at least no significant throttling except for some very short drops to 700 MHz (according to HWiNFO). Our stress test was executed with a decent clock of 2.6 GHz.
Nvidia's Pascal generation impresses with a much better power efficiency, which is also noticeable in the temperatures. We never saw more than 70 °C on the GeForce GTX 1070. Intel on the other hand hardly made any improvements in terms of temperature management.
(-) The maximum temperature on the upper side is 46 °C / 115 F, compared to the average of 40.4 °C / 105 F, ranging from 21.2 to 68.8 °C for the class Gaming.
(-) The bottom heats up to a maximum of 51.8 °C / 125 F, compared to the average of 43.2 °C / 110 F
(+) In idle usage, the average temperature for the upper side is 31.7 °C / 89 F, compared to the device average of 33.9 °C / 93 F.
(+) The palmrests and touchpad are cooler than skin temperature with a maximum of 26.6 °C / 79.9 F and are therefore cool to the touch.
(+) The average temperature of the palmrest area of similar devices was 28.8 °C / 83.8 F (+2.2 °C / 3.9 F).
| Alienware 15 R3 GeForce GTX 1070 Mobile, i7-7700HQ | Alienware 15 R2 (Skylake) GeForce GTX 980M, 6700HQ | Asus Strix GL502VS-FY032T GeForce GTX 1070 Mobile, 6700HQ | MSI GT62VR-6RE16H21 GeForce GTX 1070 Mobile, 6700HQ | Schenker XMG P507 PRO GeForce GTX 1070 Mobile, i7-7700HQ | |
|---|---|---|---|---|---|
| Heat | 3% | 9% | 12% | -1% | |
| Maximum Upper Side * (°C) | 46 | 48 -4% | 48 -4% | 44 4% | 49.2 -7% |
| Maximum Bottom * (°C) | 51.8 | 57.3 -11% | 46.8 10% | 53.1 -3% | 62 -20% |
| Idle Upper Side * (°C) | 36.5 | 31.9 13% | 33.7 8% | 28.8 21% | 32.4 11% |
| Idle Bottom * (°C) | 38.2 | 33.4 13% | 30.5 20% | 28.2 26% | 33 14% |
* ... smaller is better
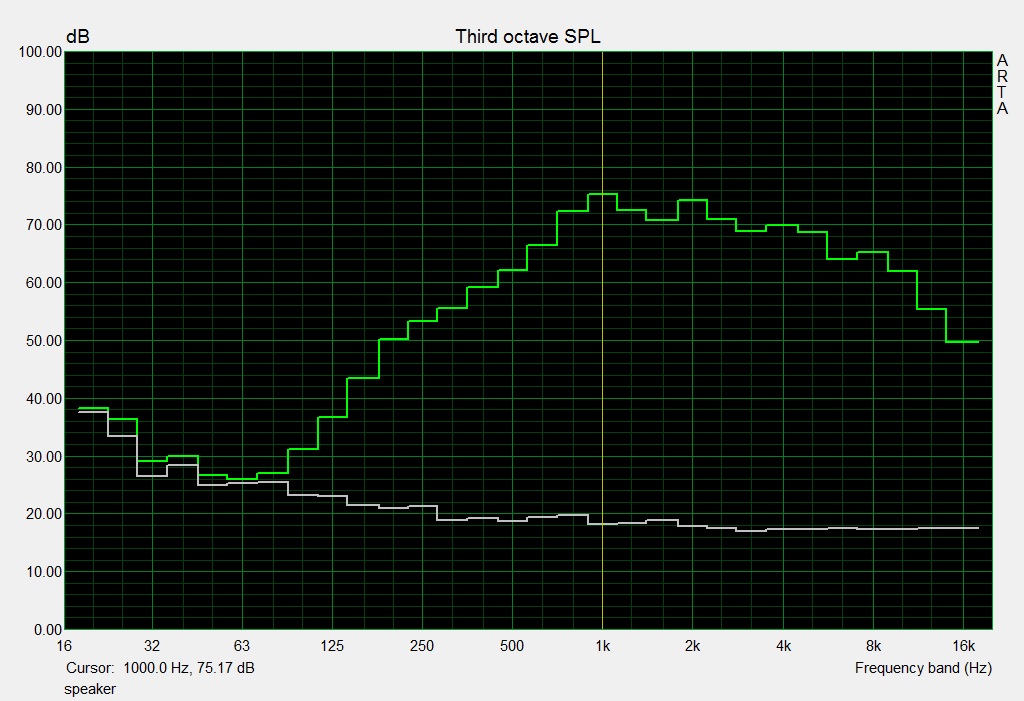
Speakers
The sound quality cannot fully meet the luxury image. Although the sound is not bad for a notebook, demanding users will want a more powerful bass and better precision in general. A subwoofer would have probably improved the situation for the deep tones.
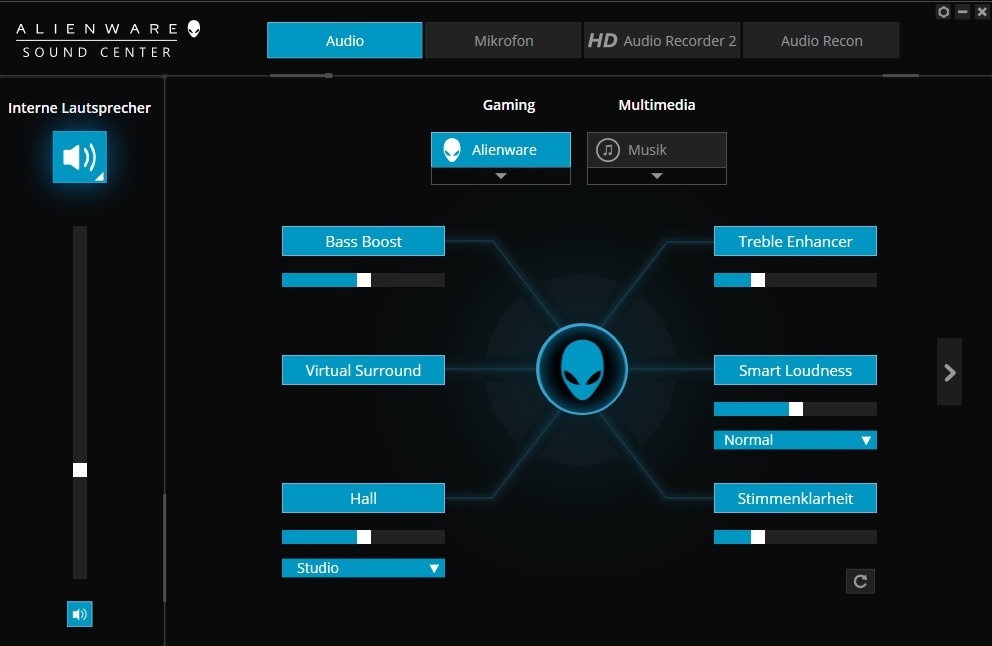
The 2.0 system is at least louder than the 15-inch rival Asus GL502VS (82 vs. 77 dB(A)), which produces more precise mids and little less precise high tones. Fine tuning is possible via Alienware's Sound Center, which can be used to adjust the microphone and the speakers. It includes multiple presets like Music or Movie.
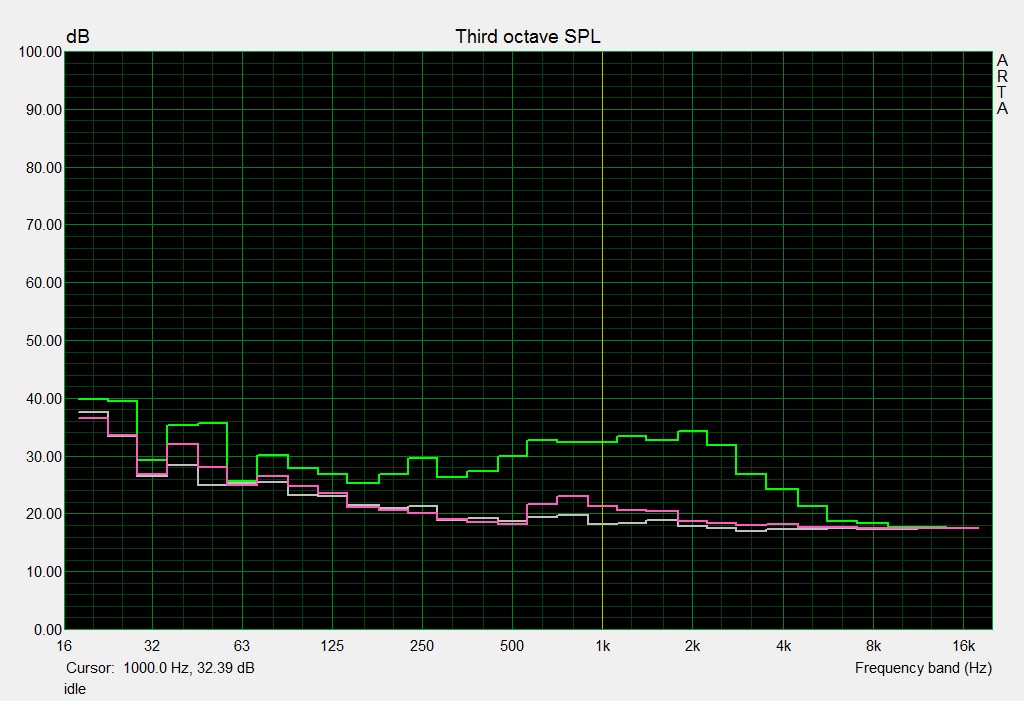
Alienware 15 R3 audio analysis
(+) | speakers can play relatively loud (82 dB)
Bass 100 - 315 Hz
(-) | nearly no bass - on average 19.1% lower than median
(±) | linearity of bass is average (10.4% delta to prev. frequency)
Mids 400 - 2000 Hz
(±) | higher mids - on average 6.7% higher than median
(±) | linearity of mids is average (7.5% delta to prev. frequency)
Highs 2 - 16 kHz
(+) | balanced highs - only 3.6% away from median
(+) | highs are linear (5.2% delta to prev. frequency)
Overall 100 - 16.000 Hz
(±) | linearity of overall sound is average (21.6% difference to median)
Compared to same class
» 77% of all tested devices in this class were better, 5% similar, 18% worse
» The best had a delta of 6%, average was 18%, worst was 132%
Compared to all devices tested
» 61% of all tested devices were better, 7% similar, 32% worse
» The best had a delta of 4%, average was 24%, worst was 134%
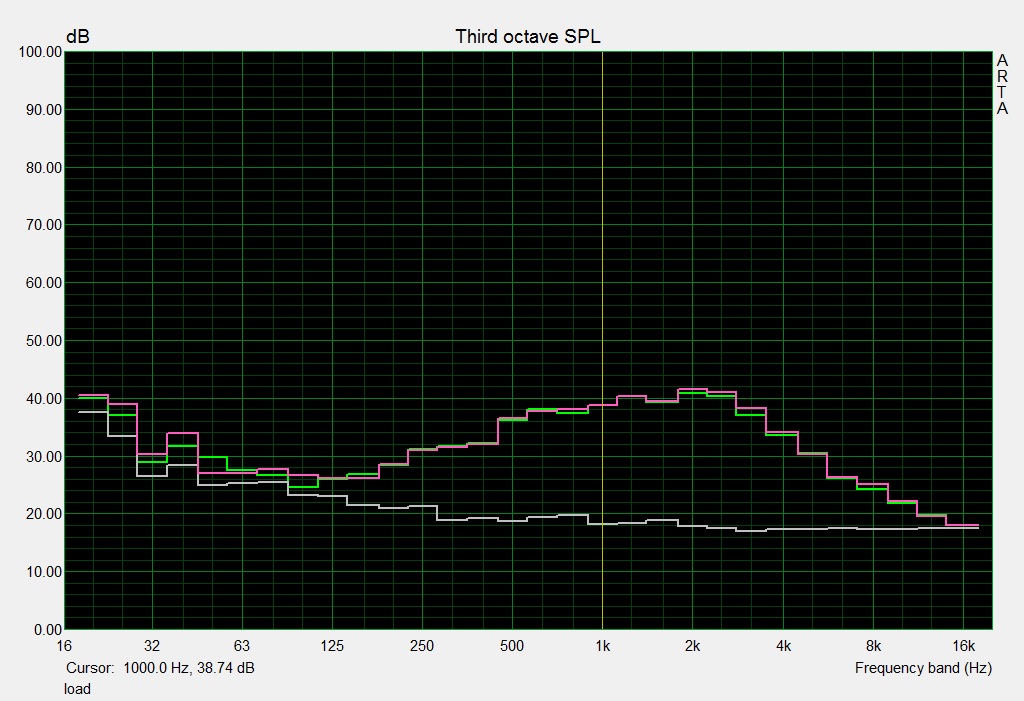
Asus Strix GL502VS-FY032T audio analysis
(±) | speaker loudness is average but good (77 dB)
Bass 100 - 315 Hz
(-) | nearly no bass - on average 16.2% lower than median
(±) | linearity of bass is average (11.9% delta to prev. frequency)
Mids 400 - 2000 Hz
(+) | balanced mids - only 0.7% away from median
(+) | mids are linear (3.1% delta to prev. frequency)
Highs 2 - 16 kHz
(+) | balanced highs - only 3.5% away from median
(±) | linearity of highs is average (7.4% delta to prev. frequency)
Overall 100 - 16.000 Hz
(±) | linearity of overall sound is average (16.8% difference to median)
Compared to same class
» 44% of all tested devices in this class were better, 11% similar, 46% worse
» The best had a delta of 6%, average was 18%, worst was 132%
Compared to all devices tested
» 29% of all tested devices were better, 8% similar, 63% worse
» The best had a delta of 4%, average was 24%, worst was 134%
Frequency Comparison (Checkboxes select/deselectable!)
Energy Management
Power Consumption
The power consumption is similar to other GTX 1070 notebooks without graphics switching. 19-29 Watts while idling and 85-192 Watts under load are almost identical to the Asus GL502VS. The MSI GT62VR consumes more power in all tests, while the Schenker XMG P507 is more efficient thanks to the Optimus technology. One interesting comparison is the Alienware 15 R2, which consumes more power but provides less 3D performance.
| Off / Standby | |
| Idle | |
| Load |
|
Key:
min: | |
| Alienware 15 R3 GeForce GTX 1070 Mobile, i7-7700HQ | Alienware 15 R2 (Skylake) GeForce GTX 980M, 6700HQ | Asus Strix GL502VS-FY032T GeForce GTX 1070 Mobile, 6700HQ | MSI GT62VR-6RE16H21 GeForce GTX 1070 Mobile, 6700HQ | Schenker XMG P507 PRO GeForce GTX 1070 Mobile, i7-7700HQ | |
|---|---|---|---|---|---|
| Power Consumption | 16% | -1% | -10% | 12% | |
| Idle Minimum * (Watt) | 19 | 11.4 40% | 20 -5% | 20 -5% | 14 26% |
| Idle Average * (Watt) | 23 | 16.5 28% | 24 -4% | 26 -13% | 18 22% |
| Idle Maximum * (Watt) | 29 | 22 24% | 29 -0% | 32 -10% | 24 17% |
| Load Average * (Watt) | 85 | 94.2 -11% | 86 -1% | 100 -18% | 87 -2% |
| Load Maximum * (Watt) | 192 | 192.2 -0% | 183 5% | 202 -5% | 201 -5% |
* ... smaller is better
Battery Runtime
Gaming systems without Optimus usually do not manage long battery runtimes. Dell can compensate for the problem a bit by implementing a very powerful 99-Wh battery. It lasts up to 6.5 hours while idling (low luminance). Around 4.5 hours web-browsing and 4.5 hours HD video playback are also okay and beat the rivals.
Even the XMG P507 with the deactivated GeForce does not stand a chance, which is not a surprise when you consider the small 60-Wh battery. The rivals from Asus (62 Wh @GL502VS) and MSI (75 Wh @GT62VR) also have smaller batteries. The Alienware 15 R2 on the other hand shows what a combination of switchable graphics and powerful battery is capable of. It ran for up to 13 hours (almost 7.5 hours @Wi-Fi and HD playback).
| Alienware 15 R3 GeForce GTX 1070 Mobile, i7-7700HQ, 99 Wh | Alienware 15 R2 (Skylake) GeForce GTX 980M, 6700HQ, 96 Wh | Asus Strix GL502VS-FY032T GeForce GTX 1070 Mobile, 6700HQ, 62 Wh | MSI GT62VR-6RE16H21 GeForce GTX 1070 Mobile, 6700HQ, 75.24 Wh | Schenker XMG P507 PRO GeForce GTX 1070 Mobile, i7-7700HQ, 60 Wh | |
|---|---|---|---|---|---|
| Battery runtime | 63% | -34% | -12% | -22% | |
| Reader / Idle (h) | 6.4 | 12.8 100% | 4.1 -36% | 5 -22% | |
| H.264 (h) | 4.4 | 7.6 73% | 3.6 -18% | ||
| WiFi v1.3 (h) | 4.4 | 7.4 68% | 3.3 -25% | 4.1 -7% | 3.3 -25% |
| Load (h) | 1.7 | 1.9 12% | 1 -41% | 1.6 -6% |
Pros
Cons
Verdict
The visuals of the third revision of the Alienware 15 R3 are beyond any doubt (except for the protruding fan area). There is currently no other gaming notebook with such a sophisticated, stable, and well-built chassis. Then there is also the unique design, great input devices and numerous illumination elements.
There should not be any problems in the next couple of years, either. When the GPU is not powerful enough anymore, you can just attach an external solution via Thunderbolt 3 or the Graphics Amplifier port. The 120 Hz display leaves mixed feelings. Response times, luminance and the contrast are great, but viewing angles, black value and color accuracy are below average. This is the result of the TN technology (60 Hz model is based on IPS).
However, the main problem of our test model was the temperature and noise development under load, which – as explained in the section Emissions – is probably connected to the uneven warming of the CPU cores. Almost 50 dB(A) in 3D scenarios is a lot, although the Alienware 15 R3 is surprisingly slim at 2.5 cm. Maybe we will review another configuration of the 15-inch system to see whether this is a bug on our test model or a general problem. We deduct 1% from the overall rating because of the fan and temperature problems.
If you ignore this detail as well as the mediocre sound, the Alienware 15 R3 convinces in almost every respect. The Core i7-7700HQ and the GeForce GTX 1070 can handle all modern games in the Ultra preset at 1920x1080 pixels.
Alienware 15 R3
- 02/08/2017 v6 (old)
Florian Glaser
Price comparison

