Alienware 15 R3 (i7-7820HK, GTX 1080 Max-Q, Full-HD) Laptop Review
For the original German review, click here.
The Alienware 15 R3 is not new to us: We tested a different configuration of this model a few months ago. Our current test unit is a little more powerful than the already-tested sister model. The Core i7-7820HK processor and GeForce GTX 1080 Max-Q GPU promise quite some processing power. Some of its competitors are devices such as the Aorus X5 v7, the Acer Predator Triton 700 and the Eurocom Q5.
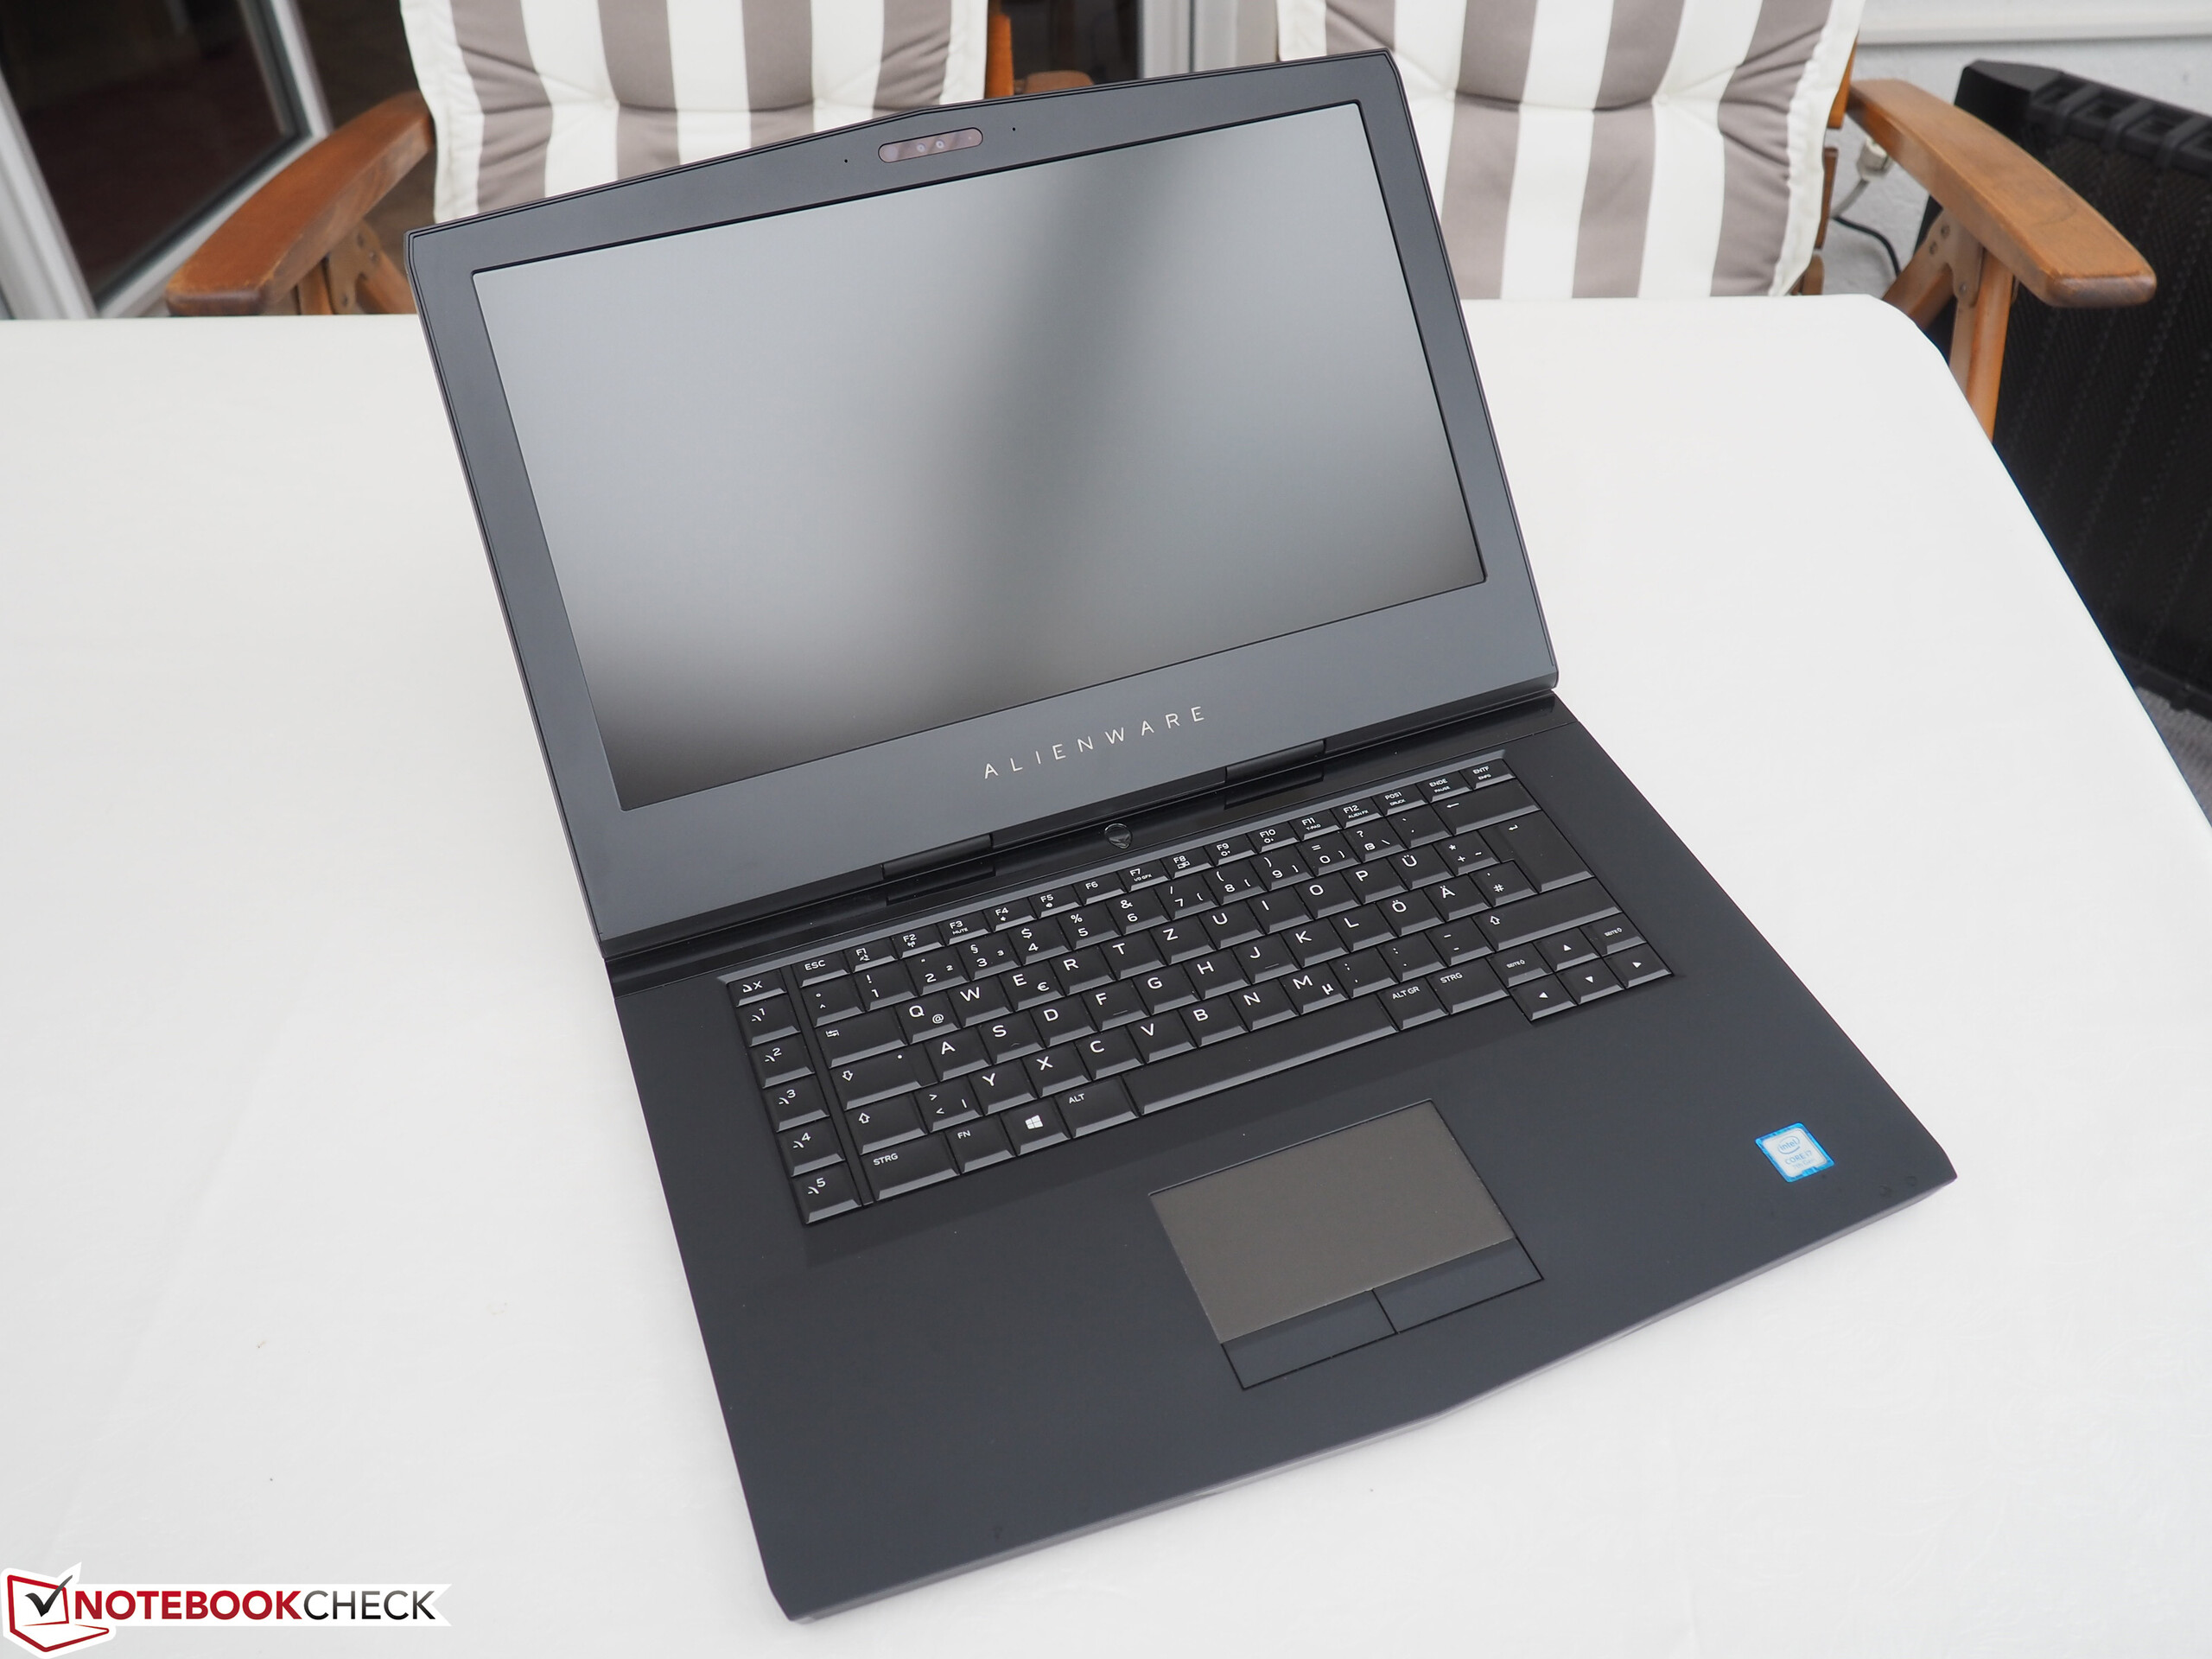
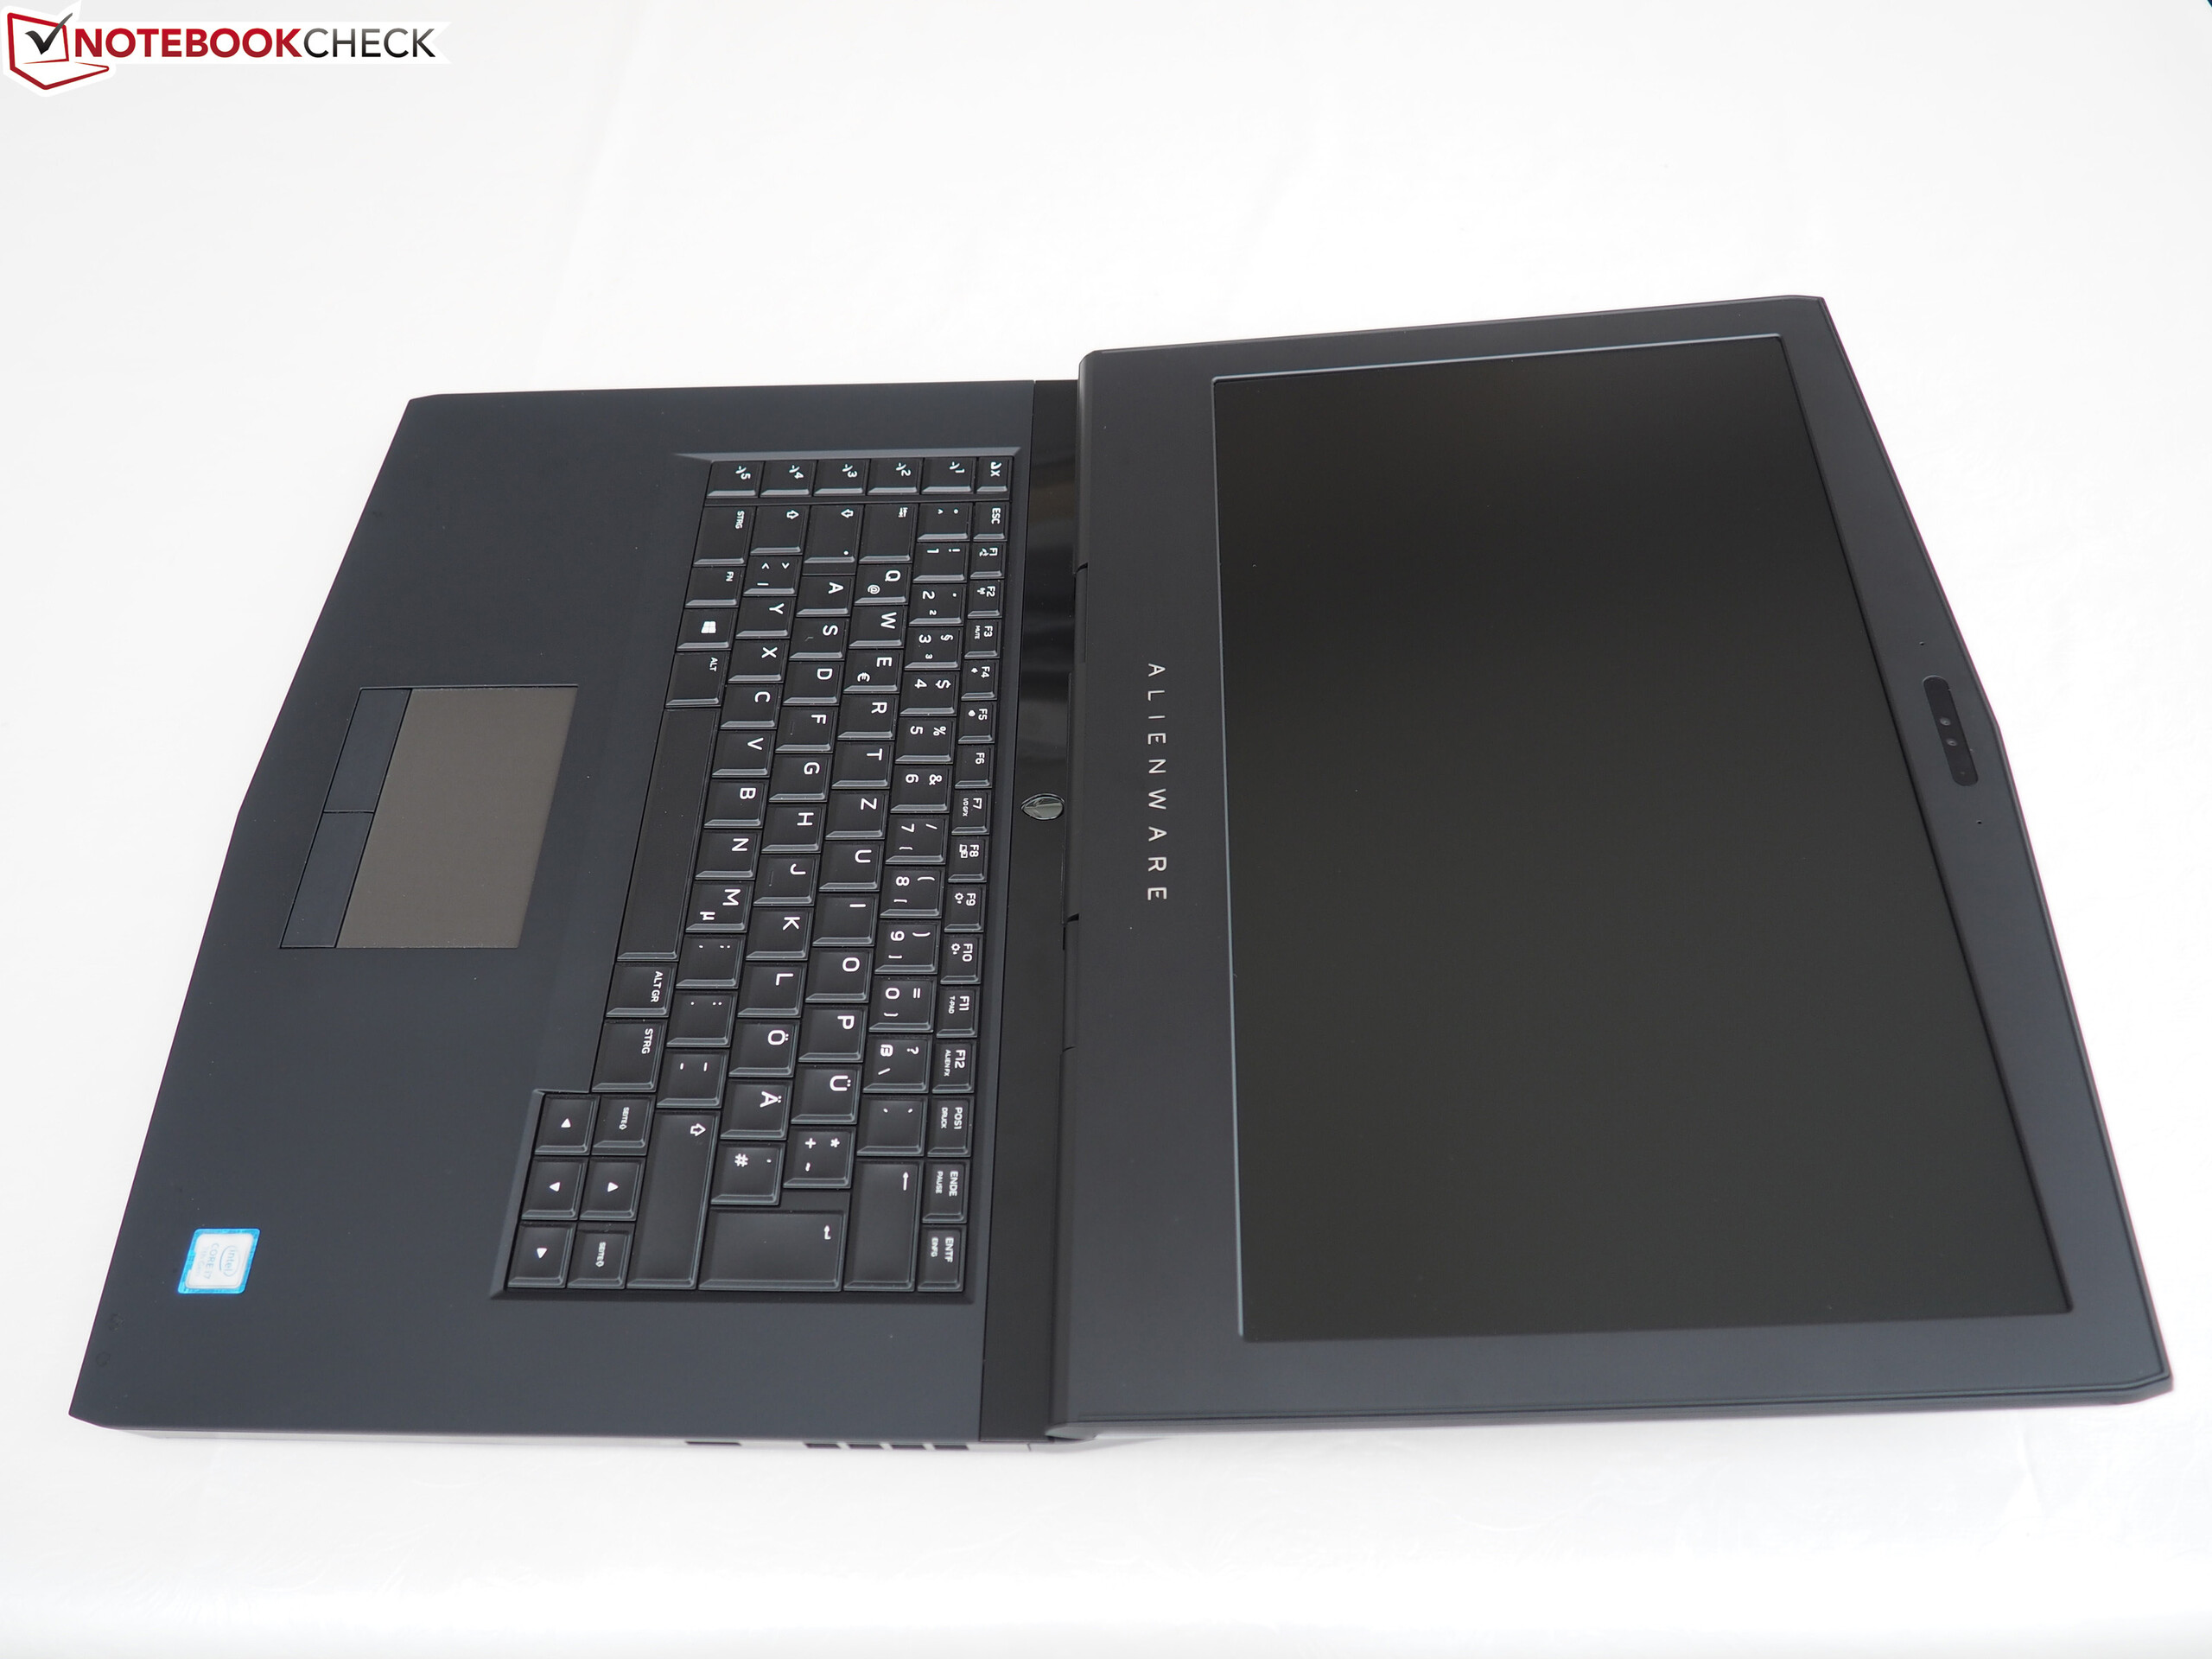
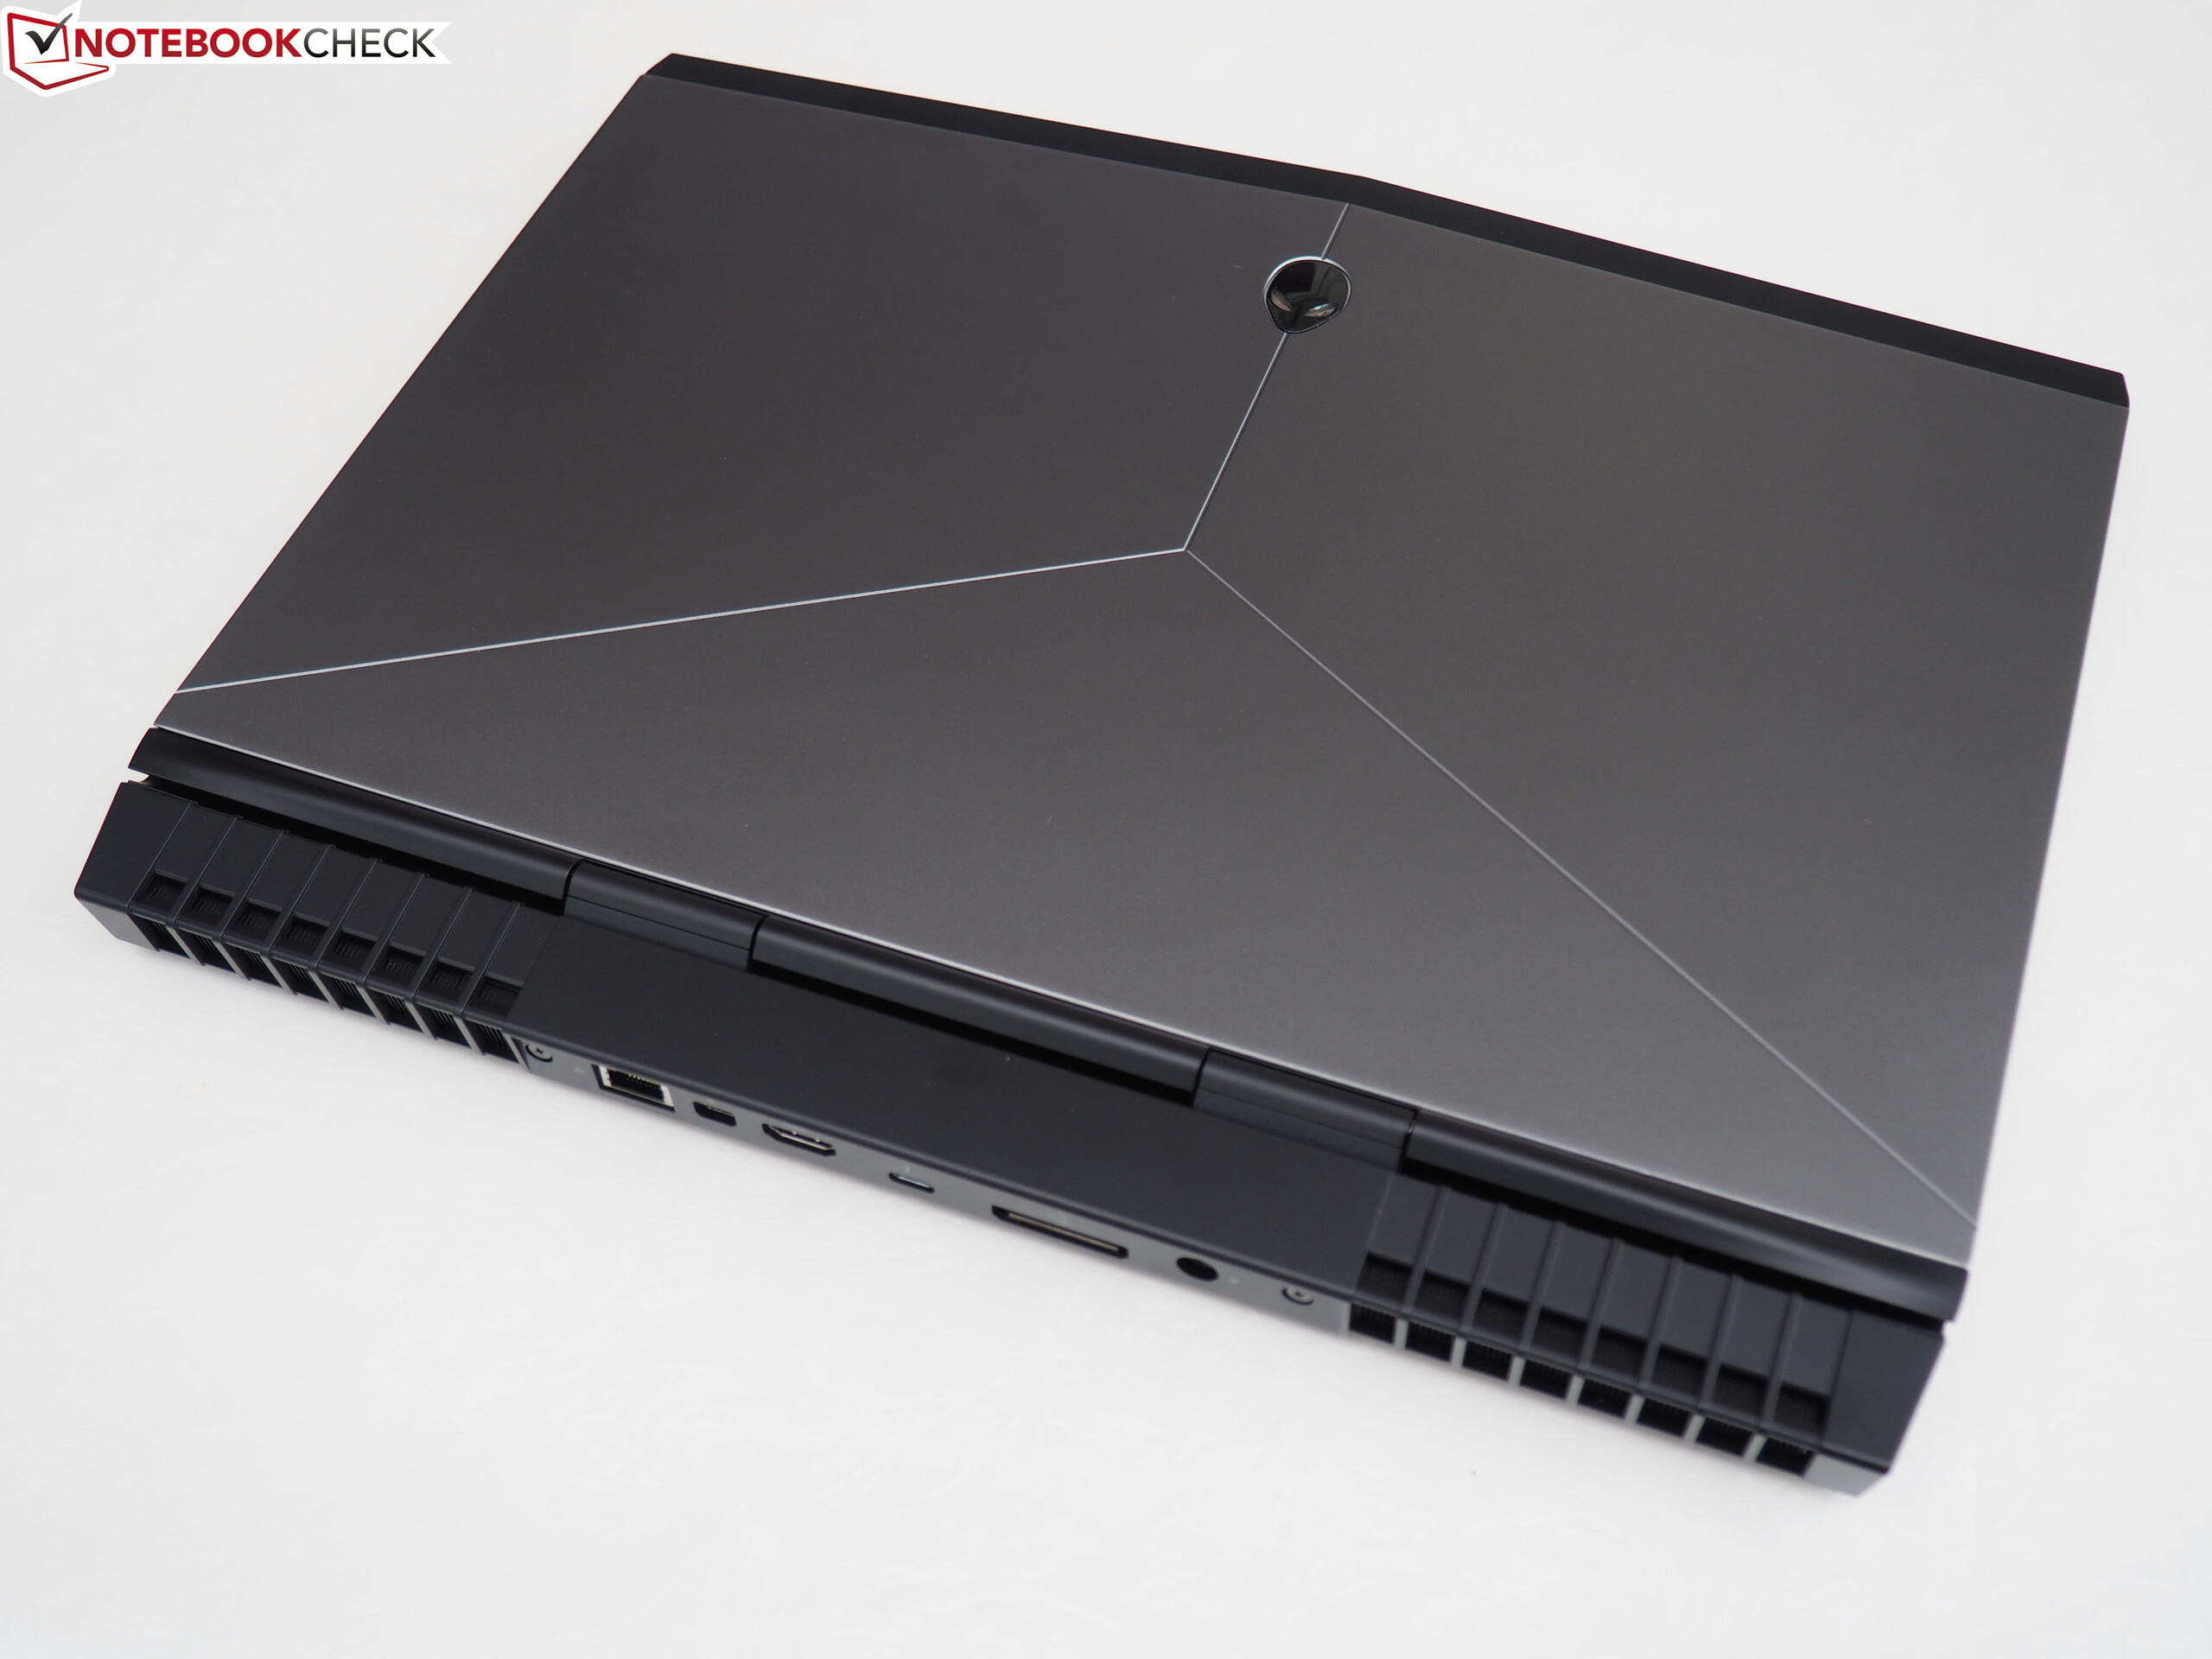
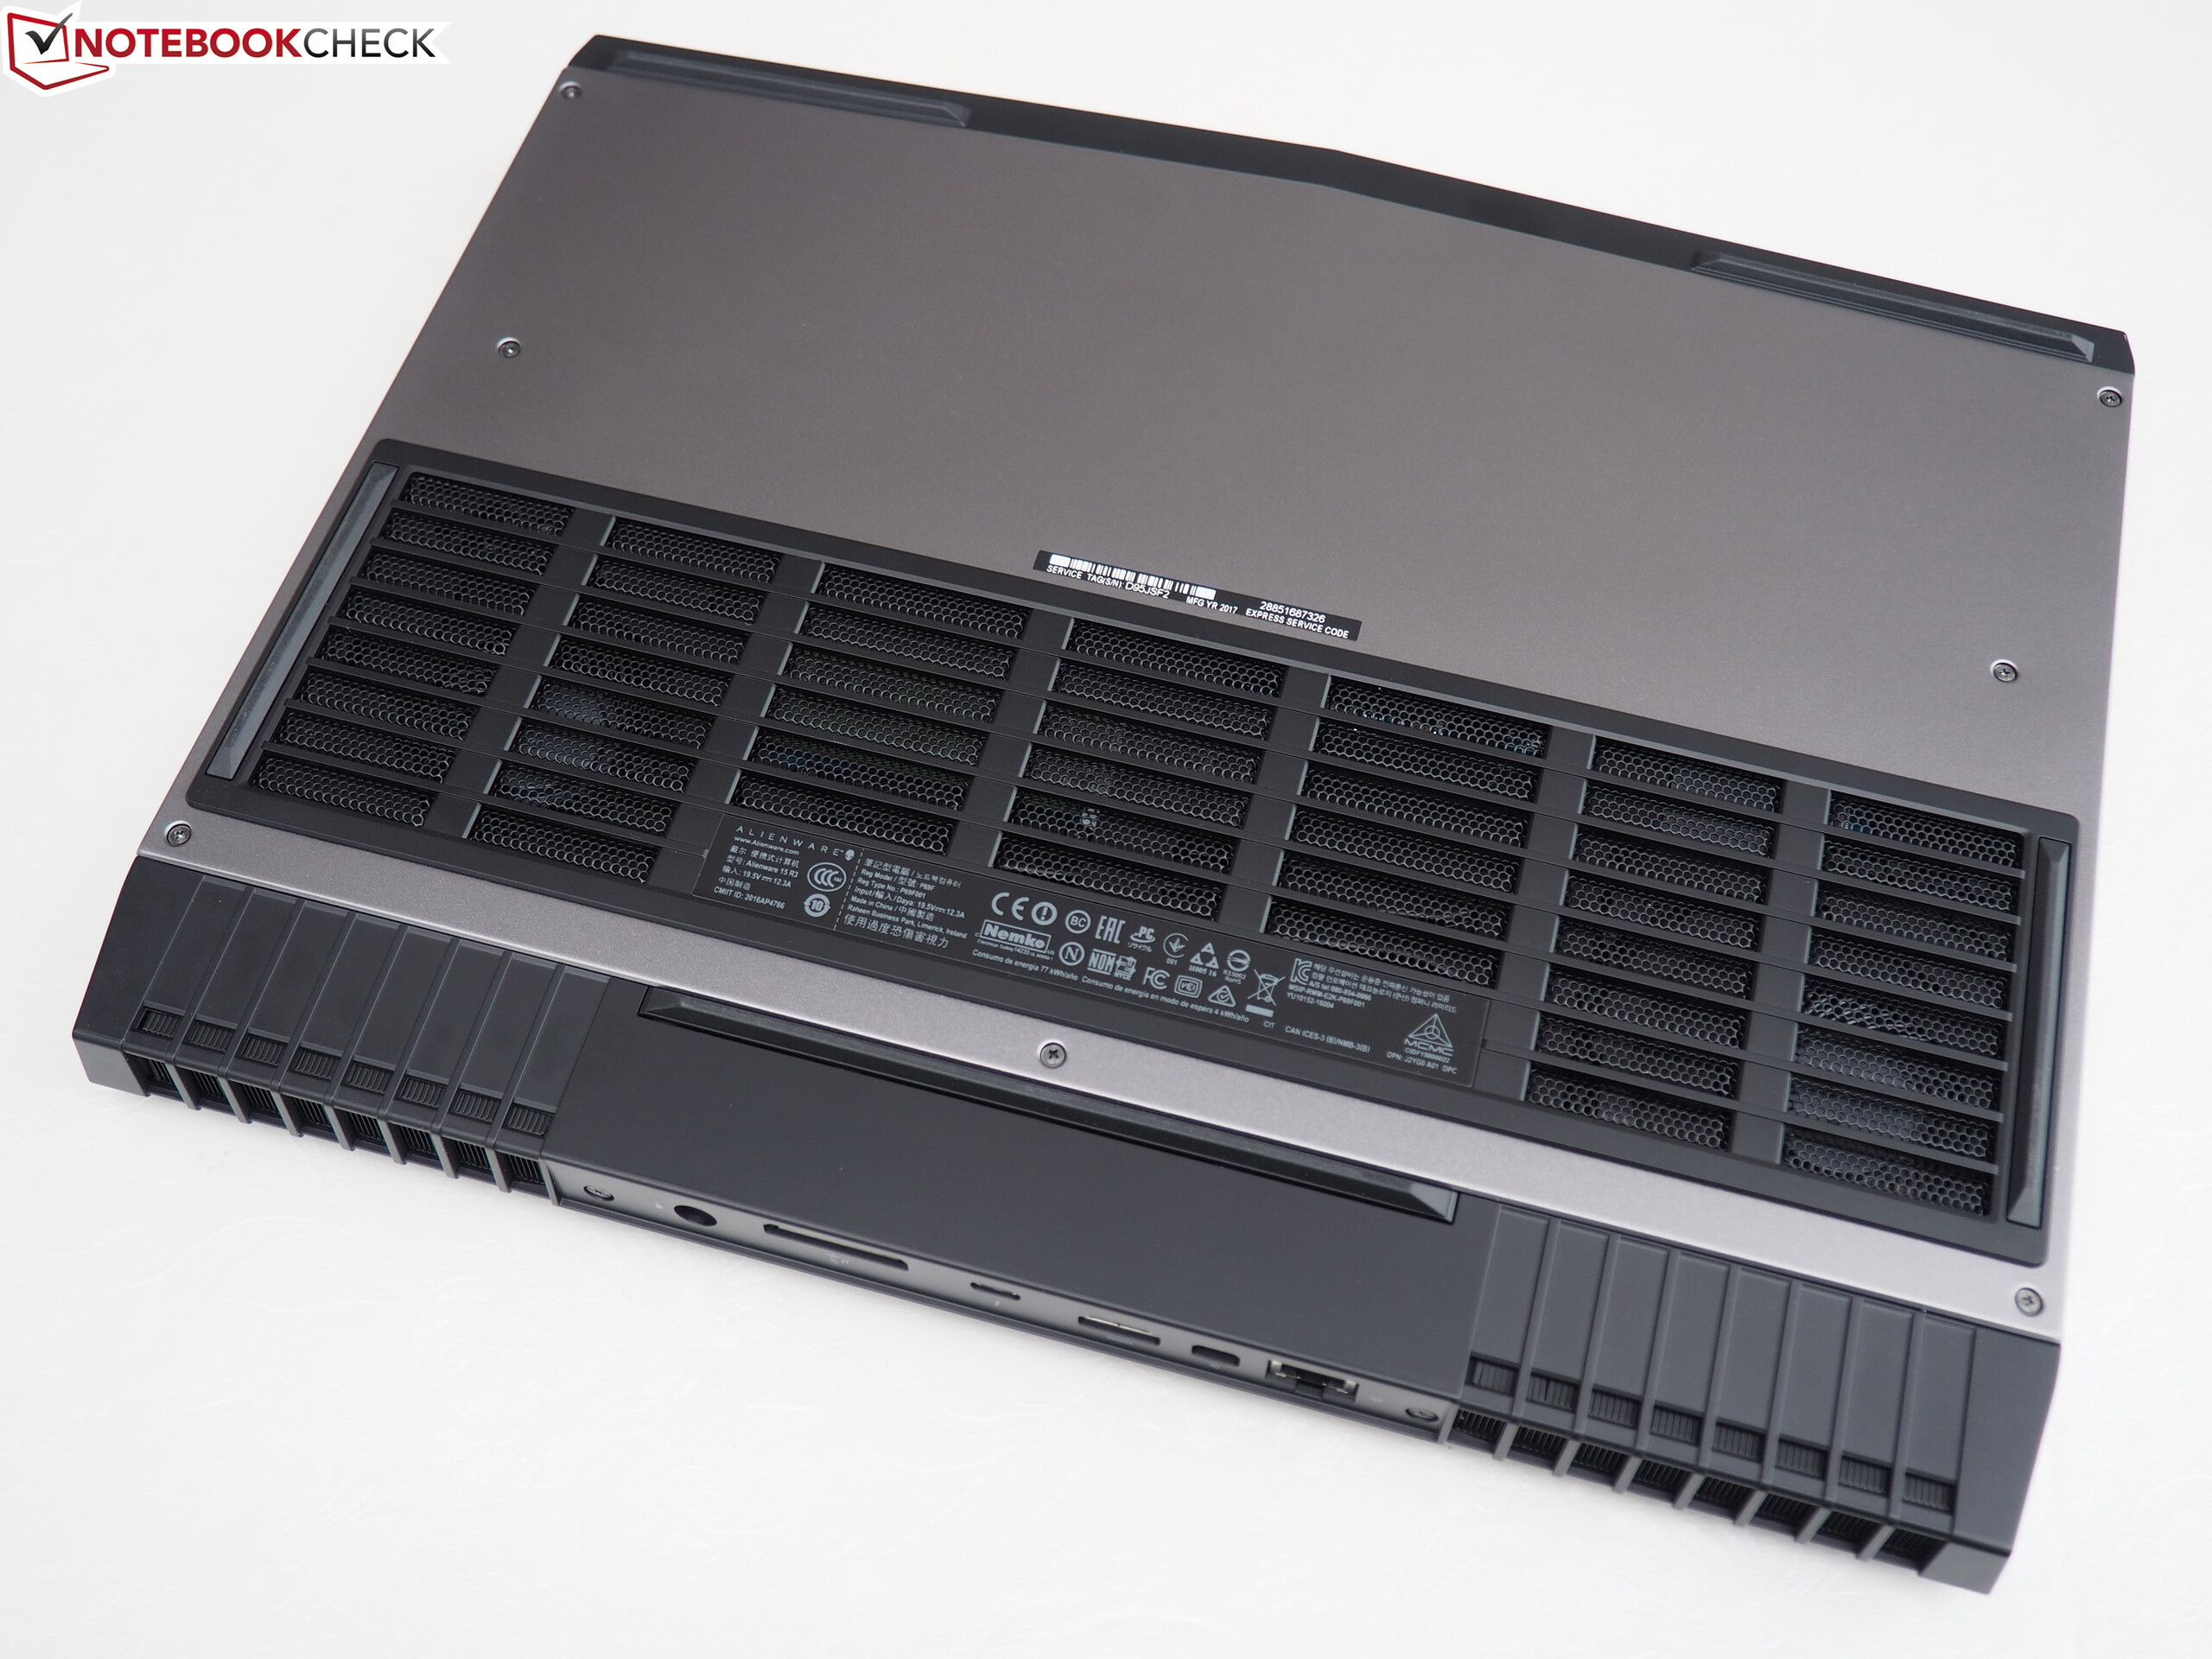
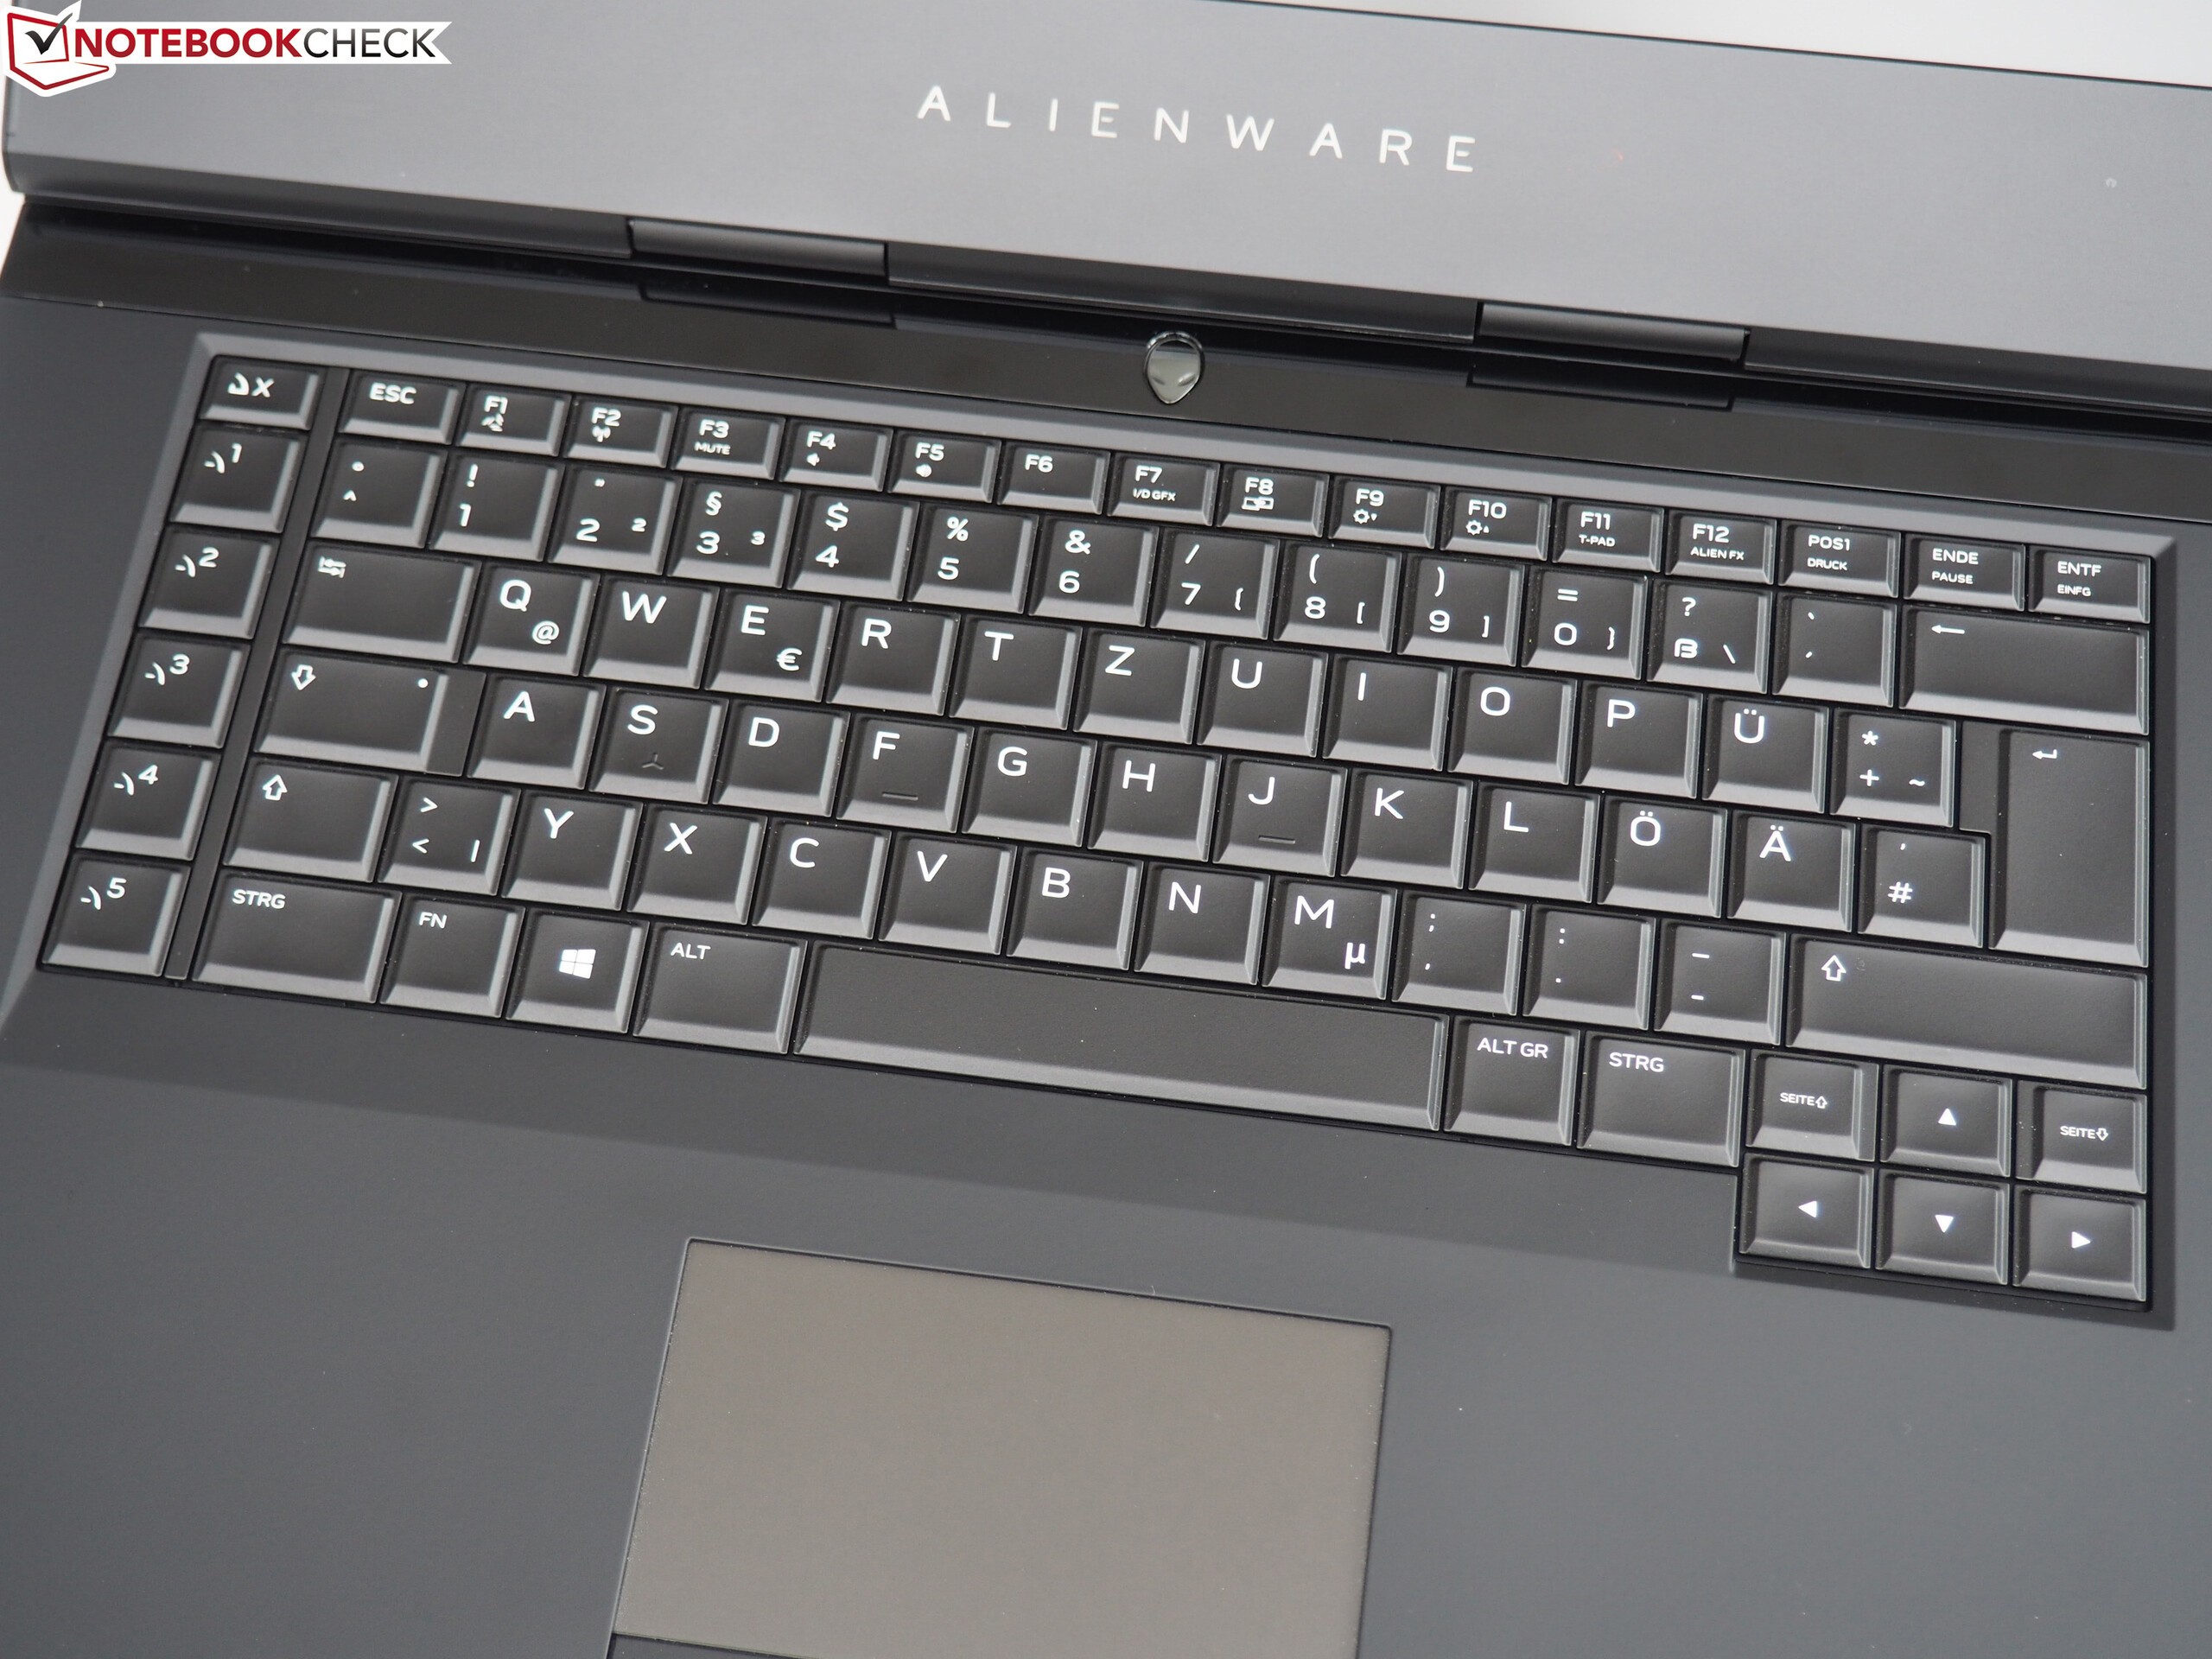
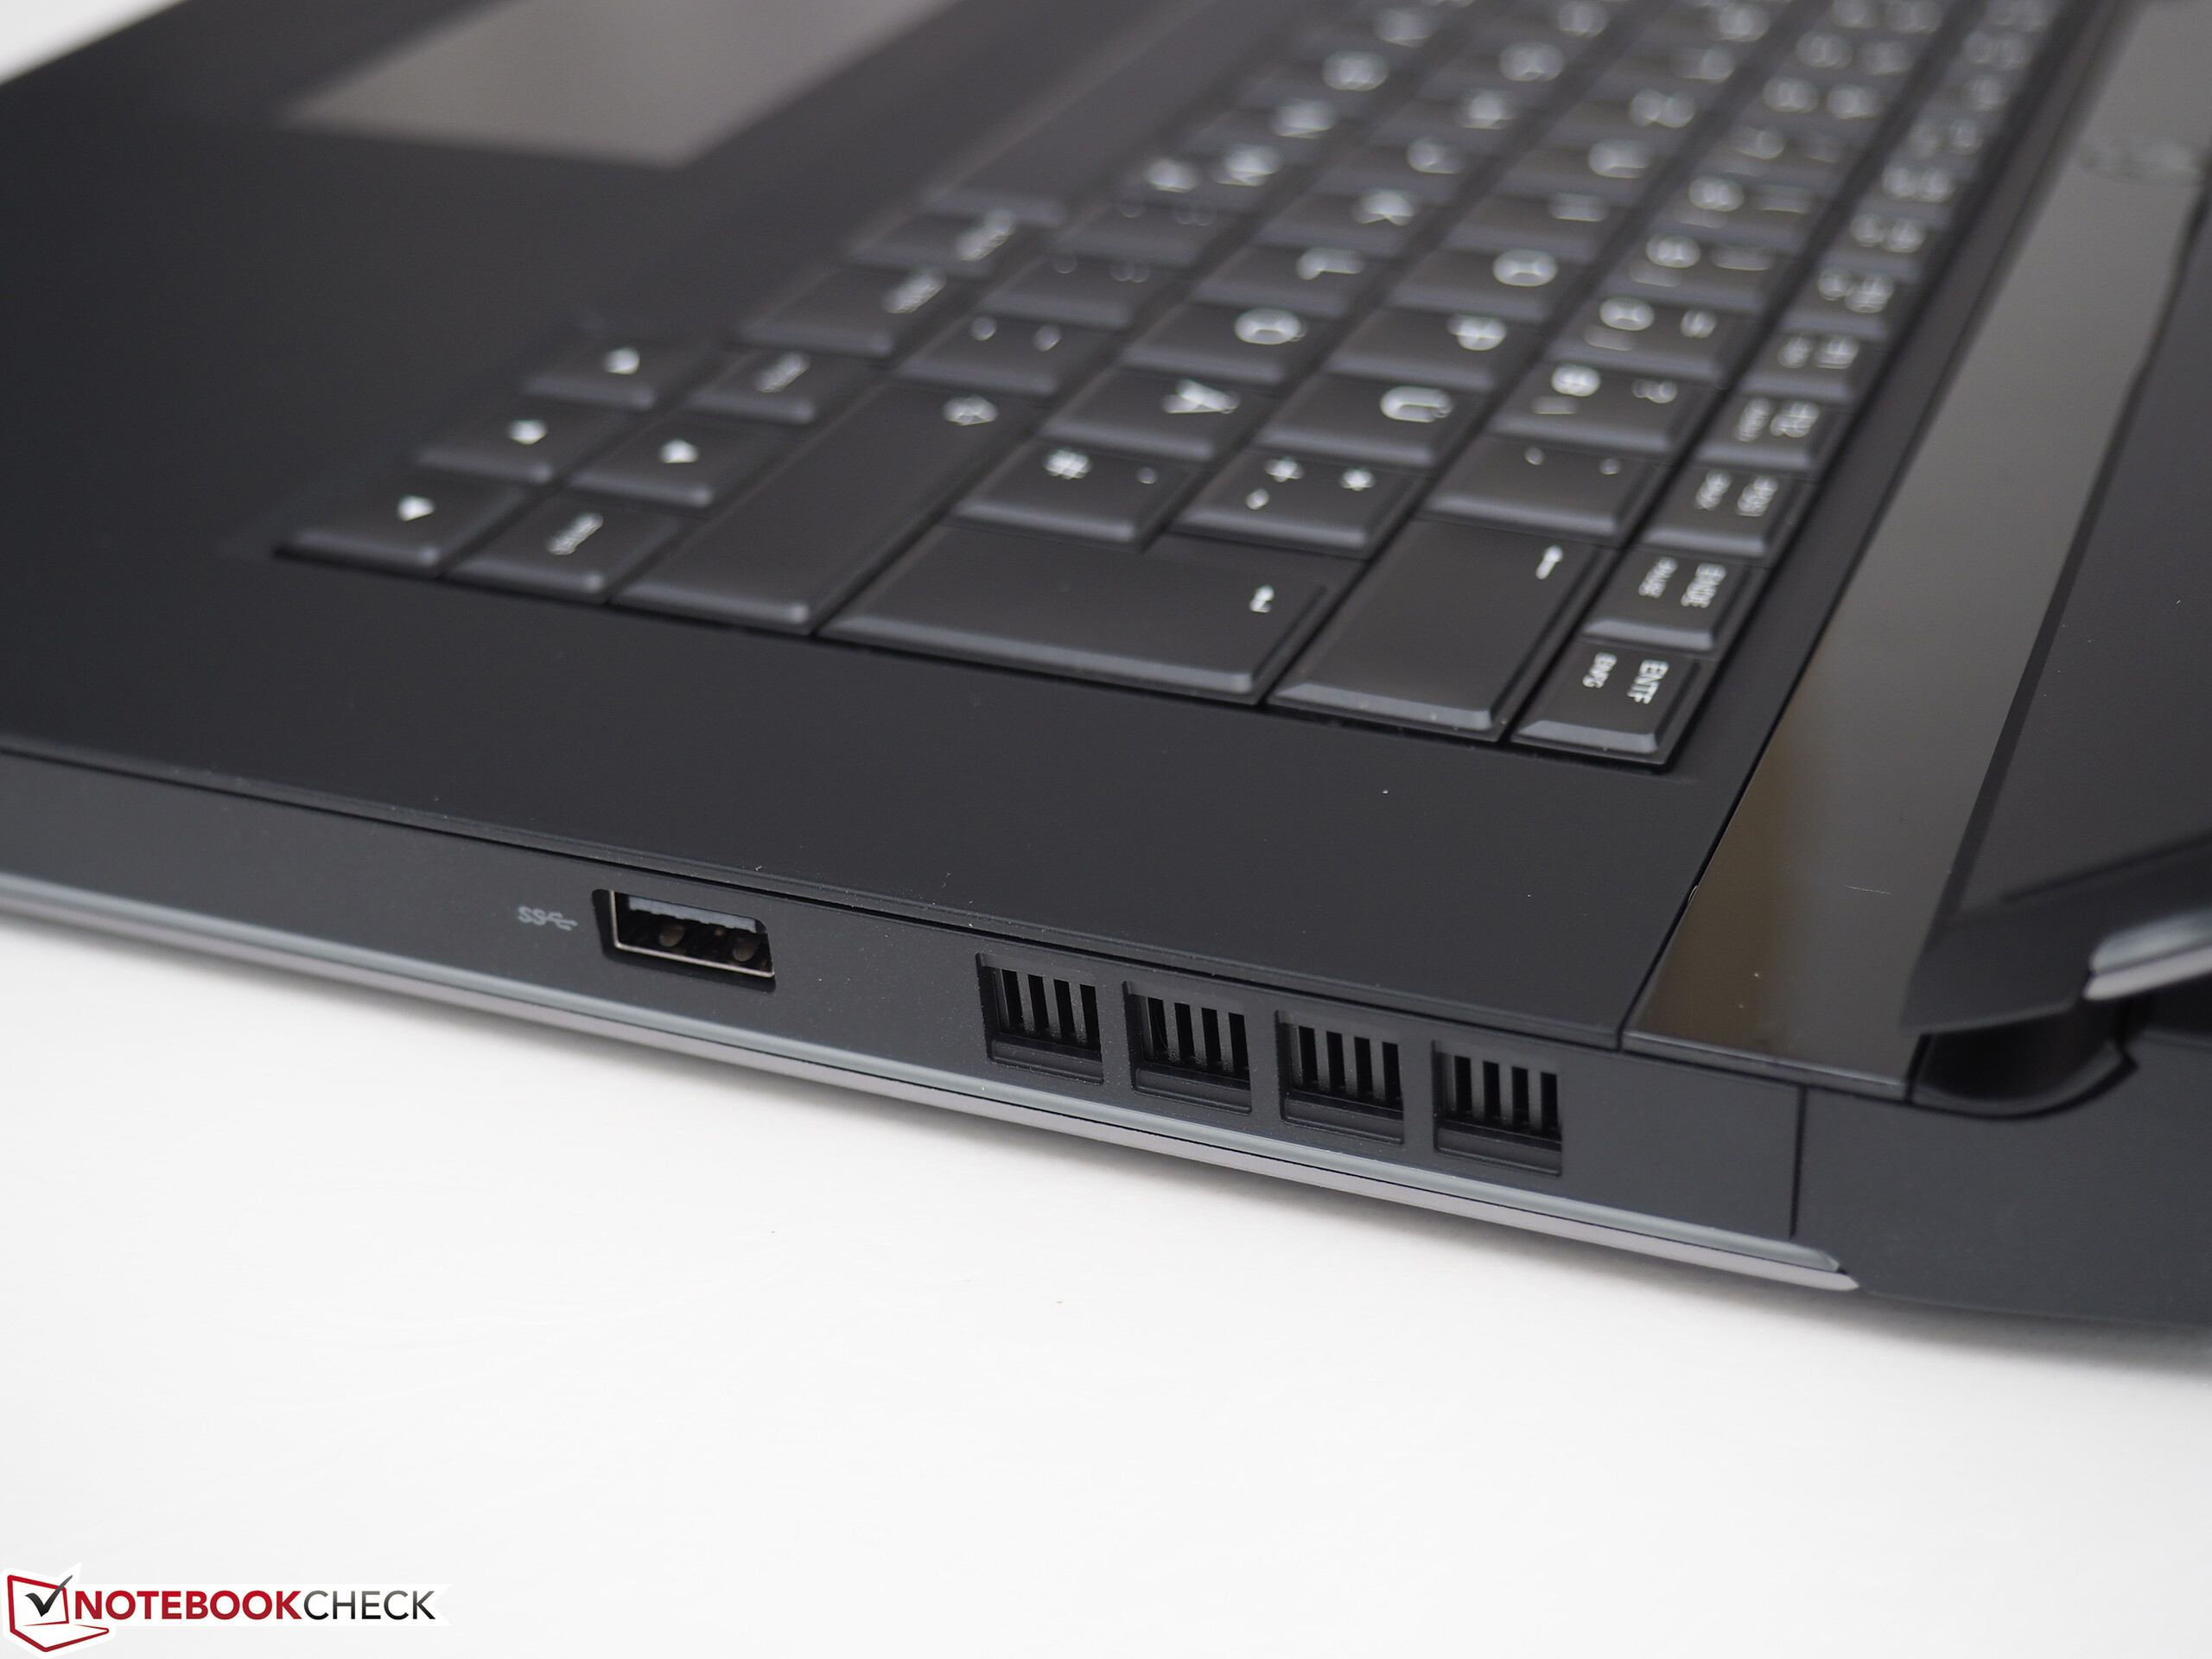
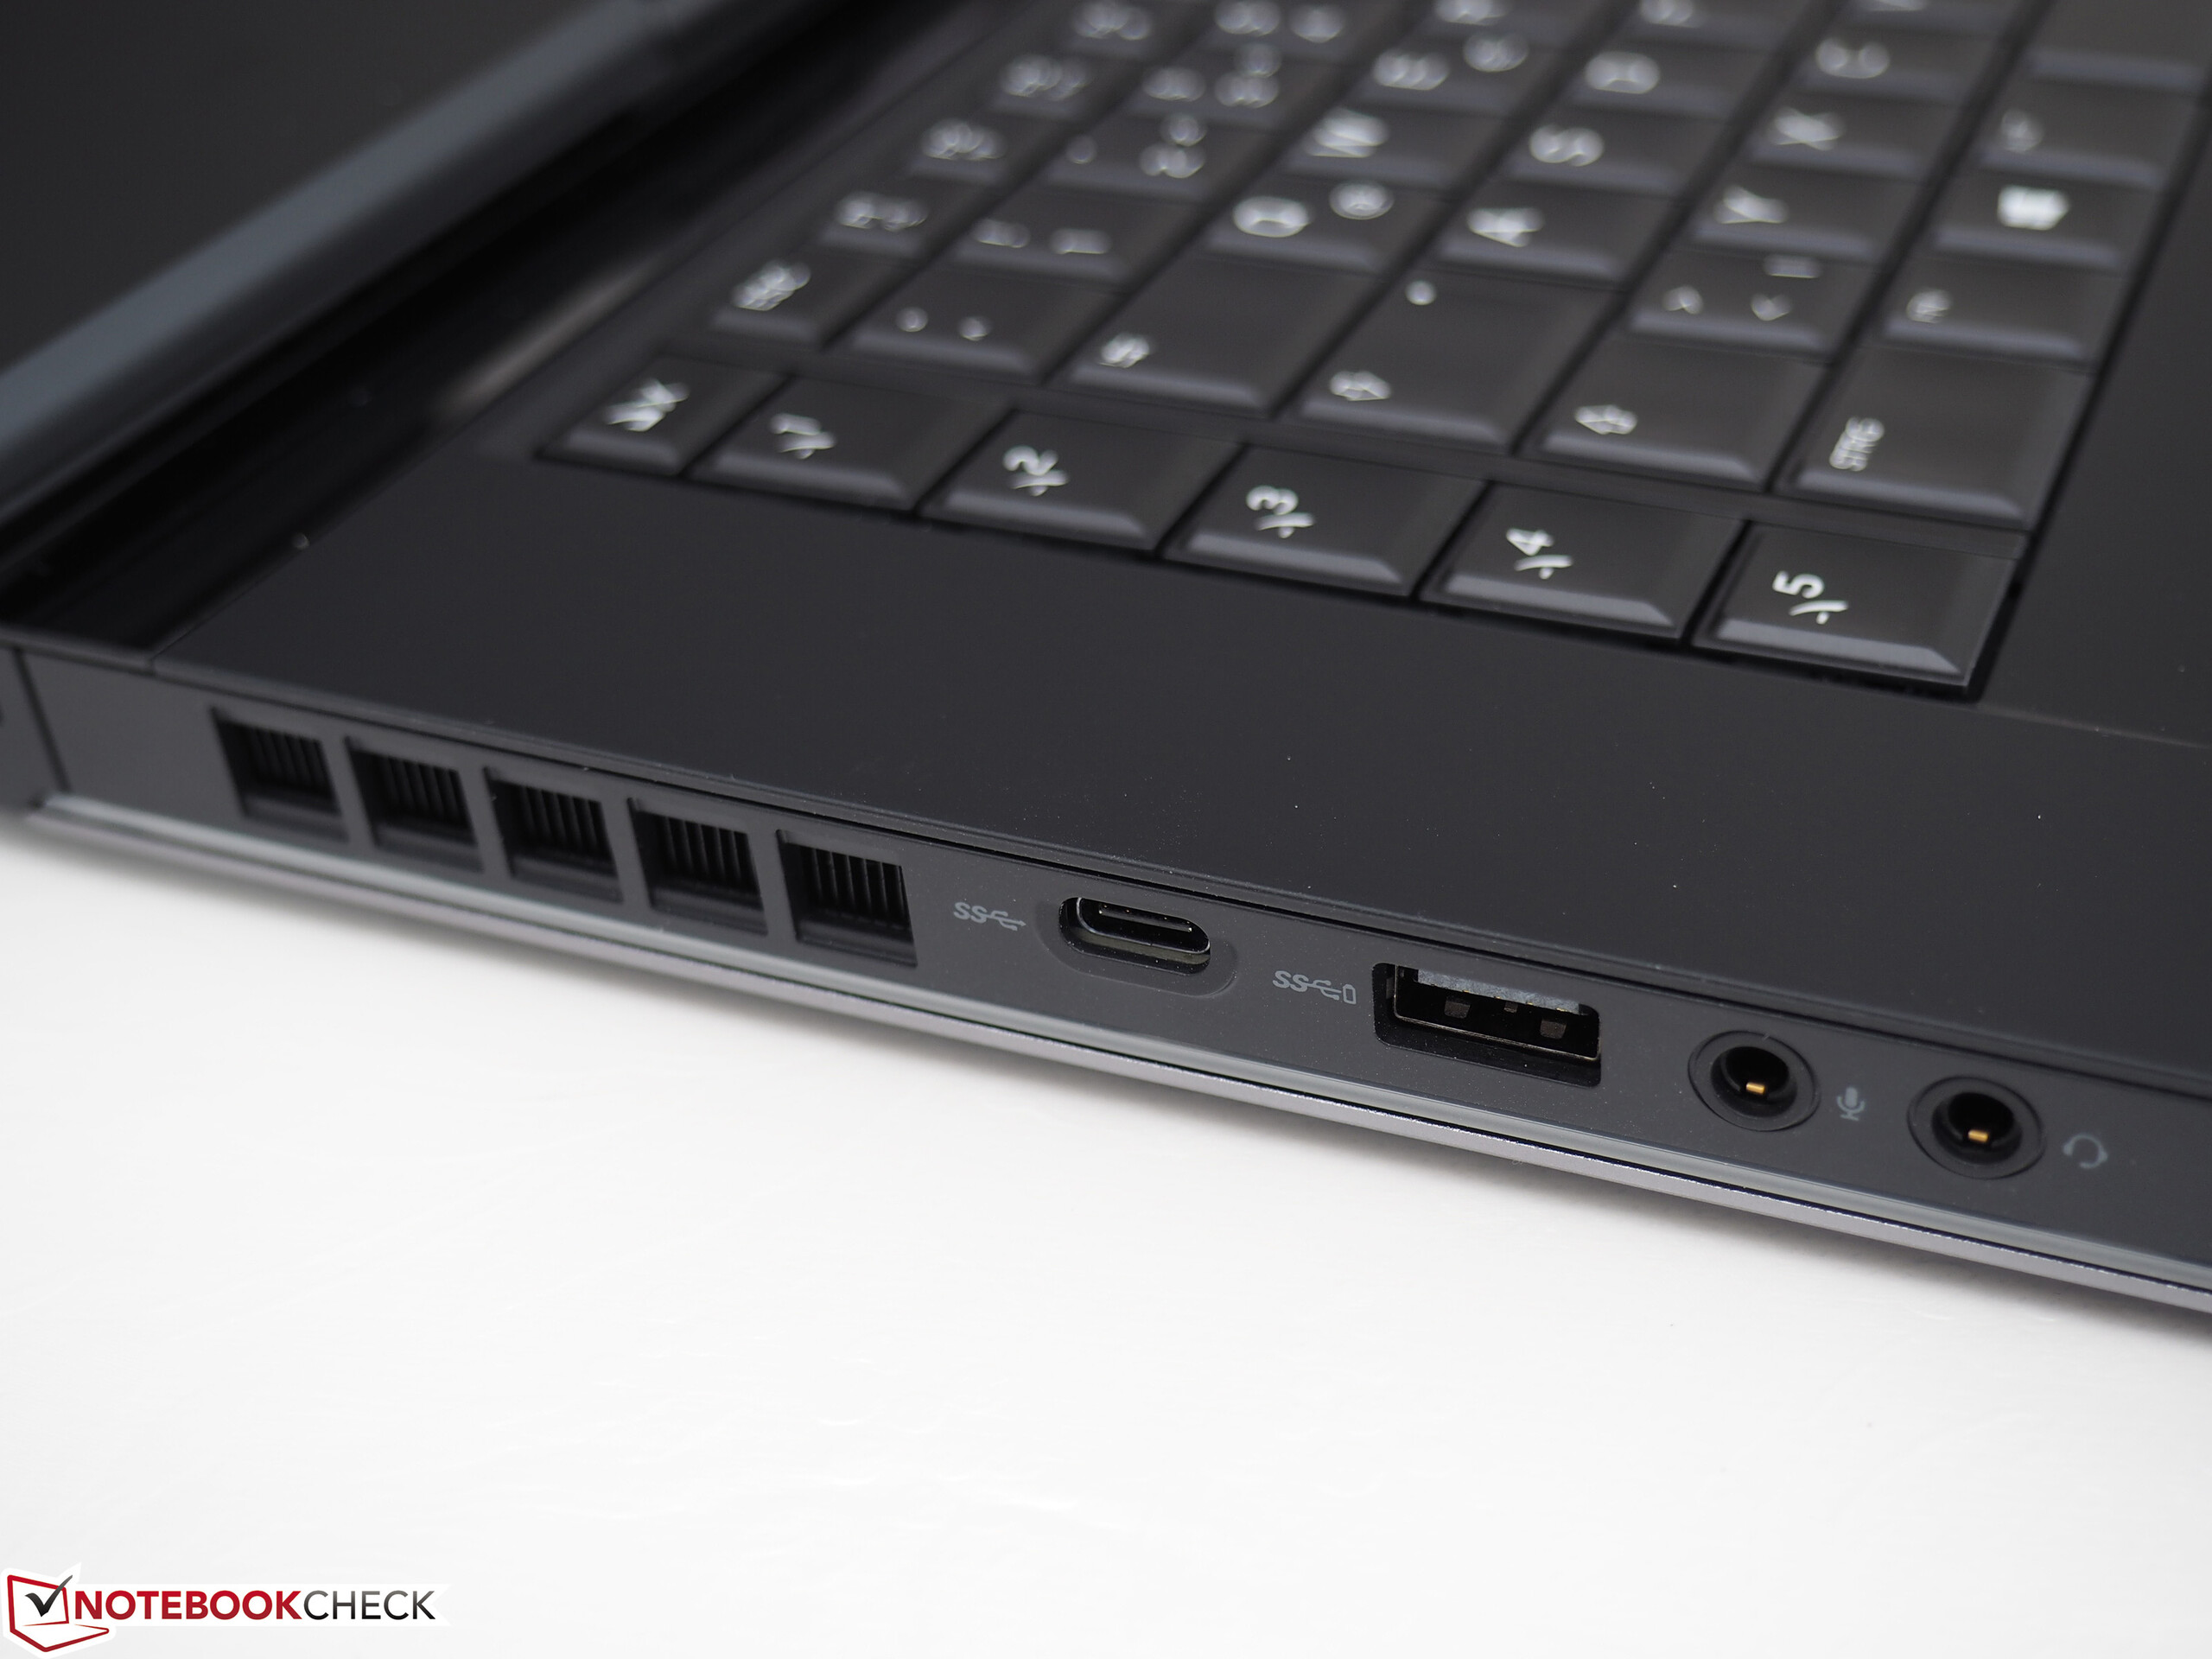
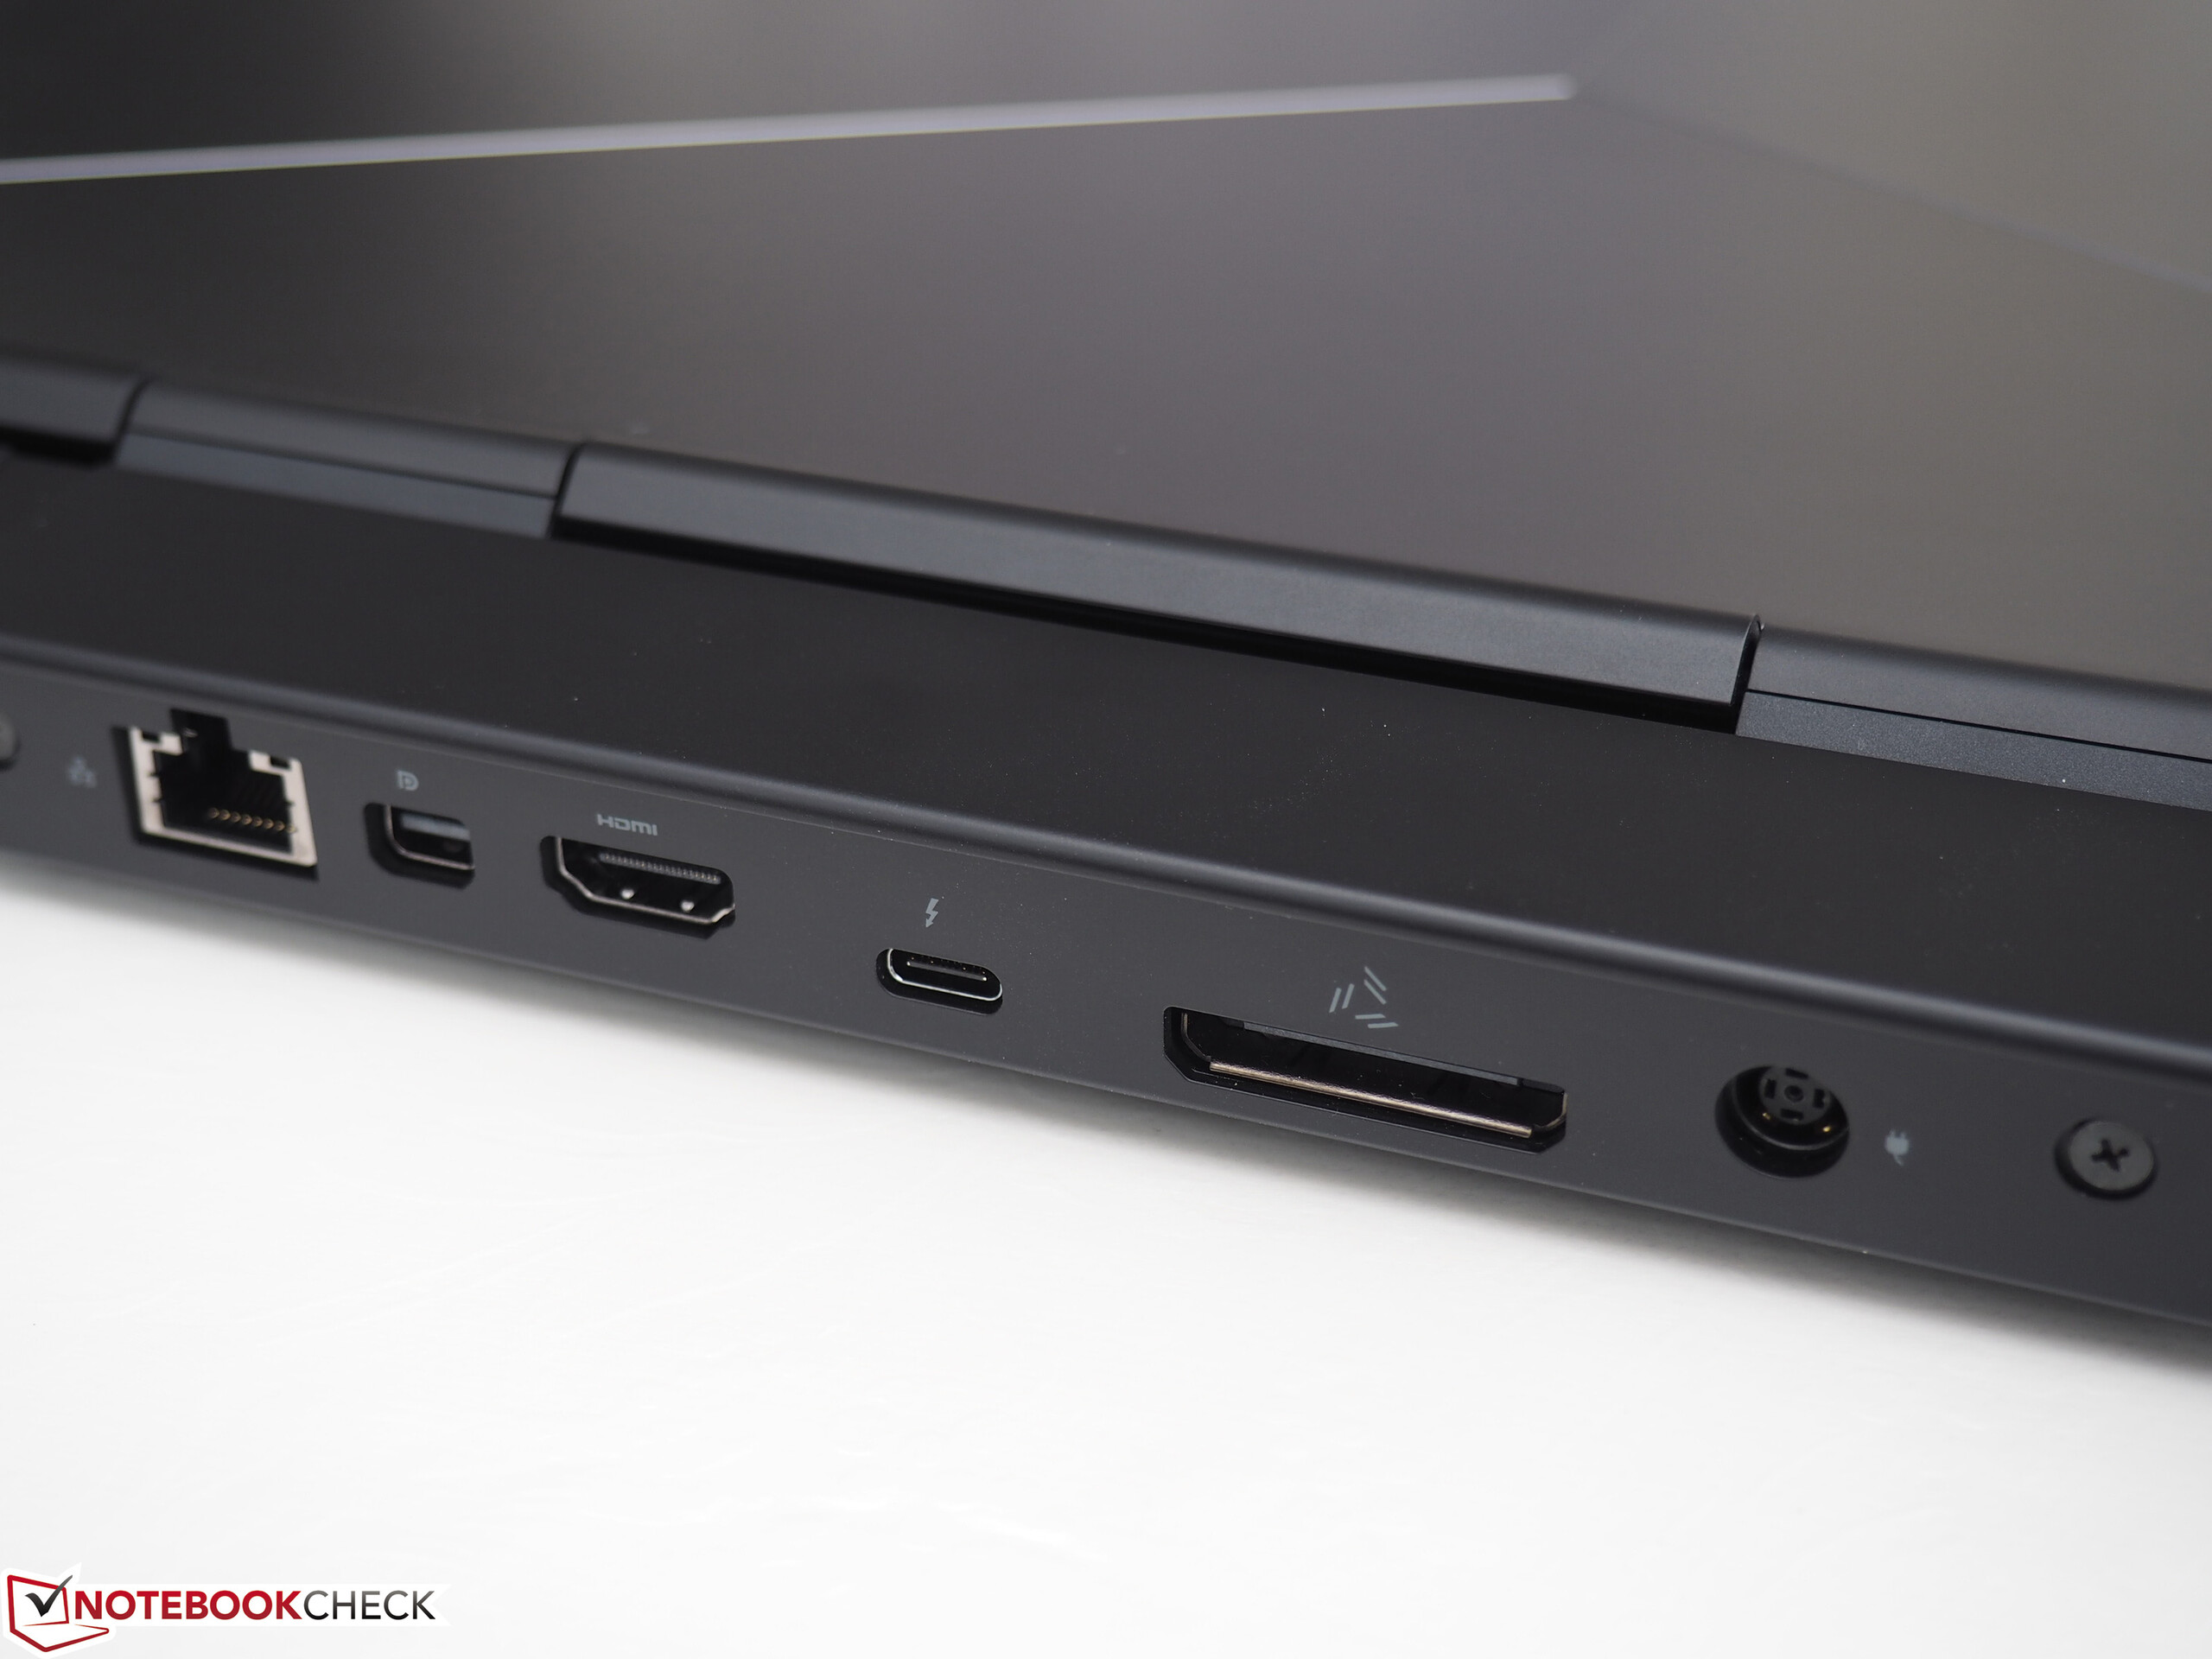
As both Alienware 15 R3 models have the same build, we will not be talking about case, connectivity, input devices and speakers. For more information on these aspects, please see the review of the already tested model.
| Networking | |
| iperf3 transmit AX12 | |
| Alienware 15 R3 Max-Q | |
| Alienware 15 R3 | |
| Acer Predator Triton 700 | |
| Aorus X5 v7 | |
| Eurocom Q5 | |
| iperf3 receive AX12 | |
| Alienware 15 R3 Max-Q | |
| Acer Predator Triton 700 | |
| Alienware 15 R3 | |
| Eurocom Q5 | |
| Aorus X5 v7 | |
Display
While the 15 R3 model that we have already tested was equipped with a matte 120-Hz TN screen, our current test unit has a 60-Hz IPS display. It has a native resolution of 1920x1080 pixels and good brightness (296.9 cd/m²) and contrast (1093:1).
Unfortunately, the display has PWM flickering at a brightness level of 95% and below. The frequency of 21000 Hz is so high, however, that even sensitive users should not suffer from eye problems or headaches as a result.
The 60-Hz panel supports Nvidia's G-Sync technology. This dynamically adjusts the frame rates of display and GPU. This is supposed to create as smooth an image as possible, especially for computer games.
| |||||||||||||||||||||||||
Brightness Distribution: 89 %
Center on Battery: 306 cd/m²
Contrast: 1093:1 (Black: 0.28 cd/m²)
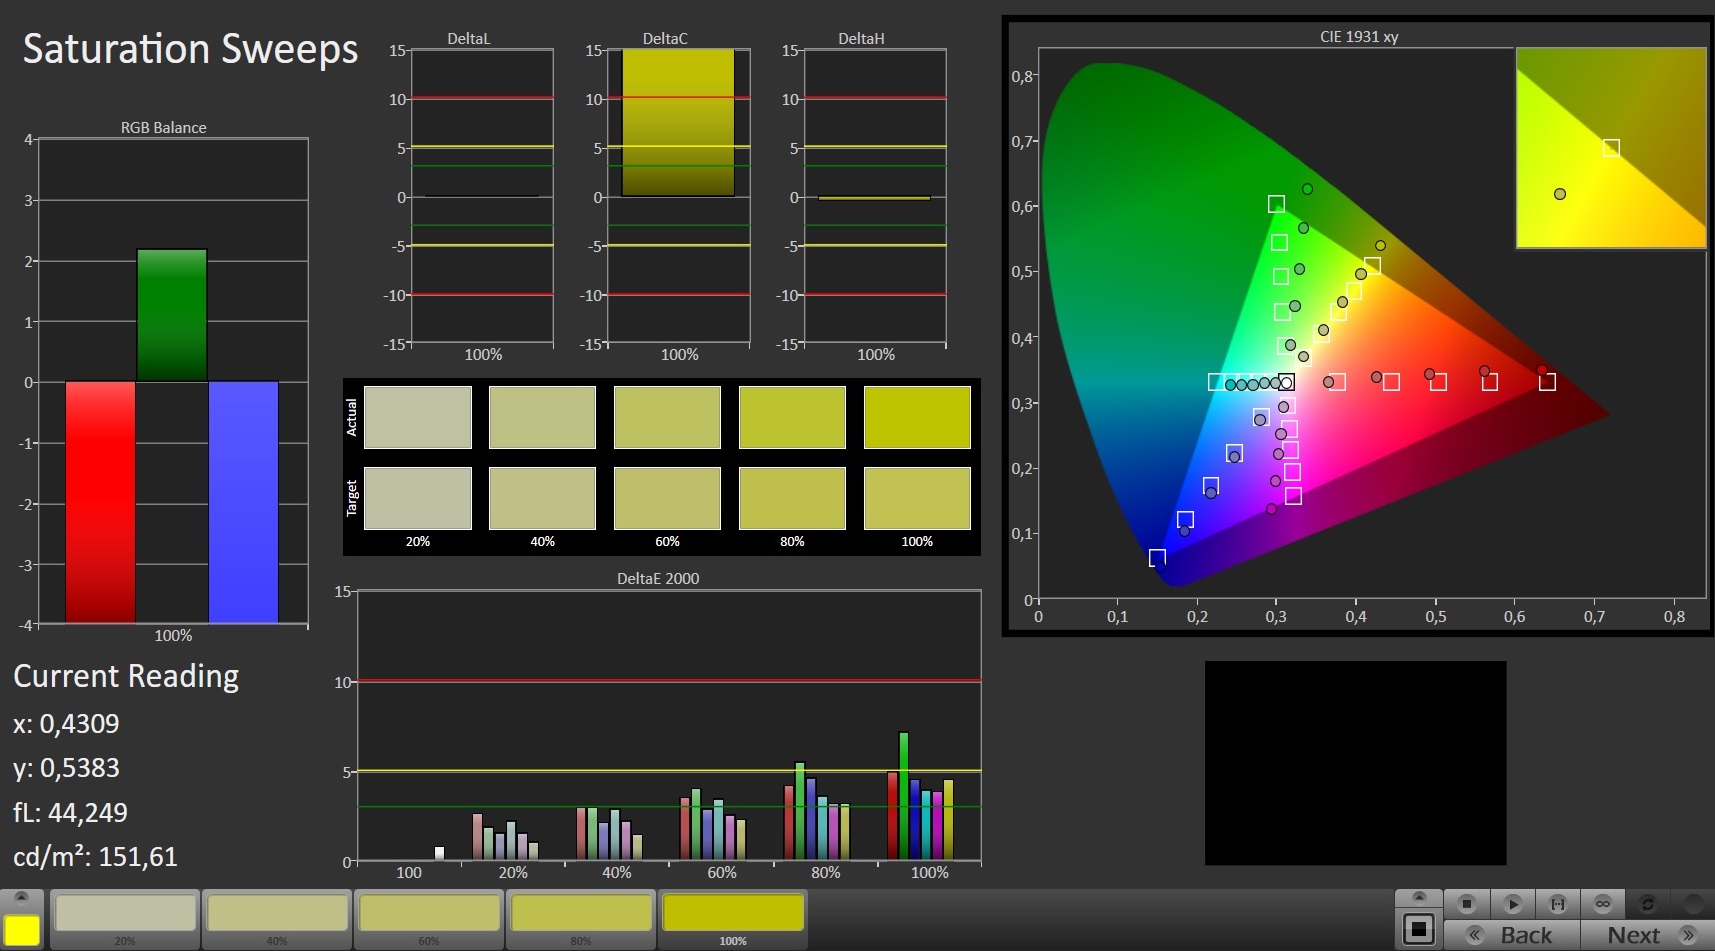
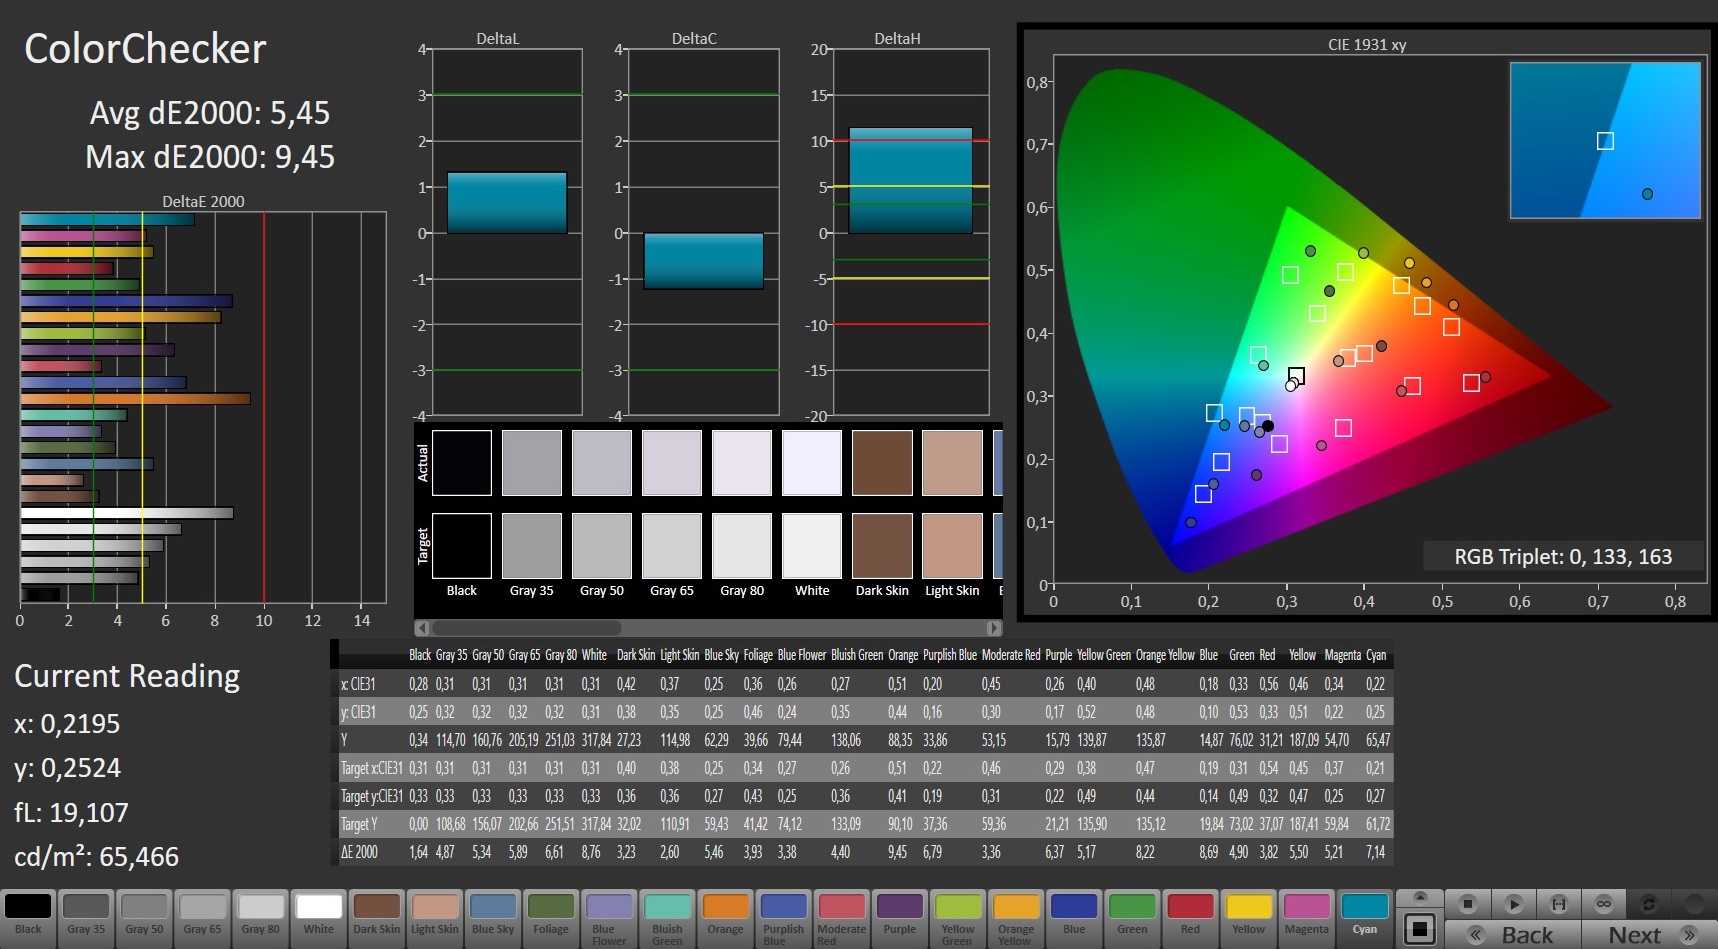
ΔE ColorChecker Calman: 5.45 | ∀{0.5-29.43 Ø4.73}
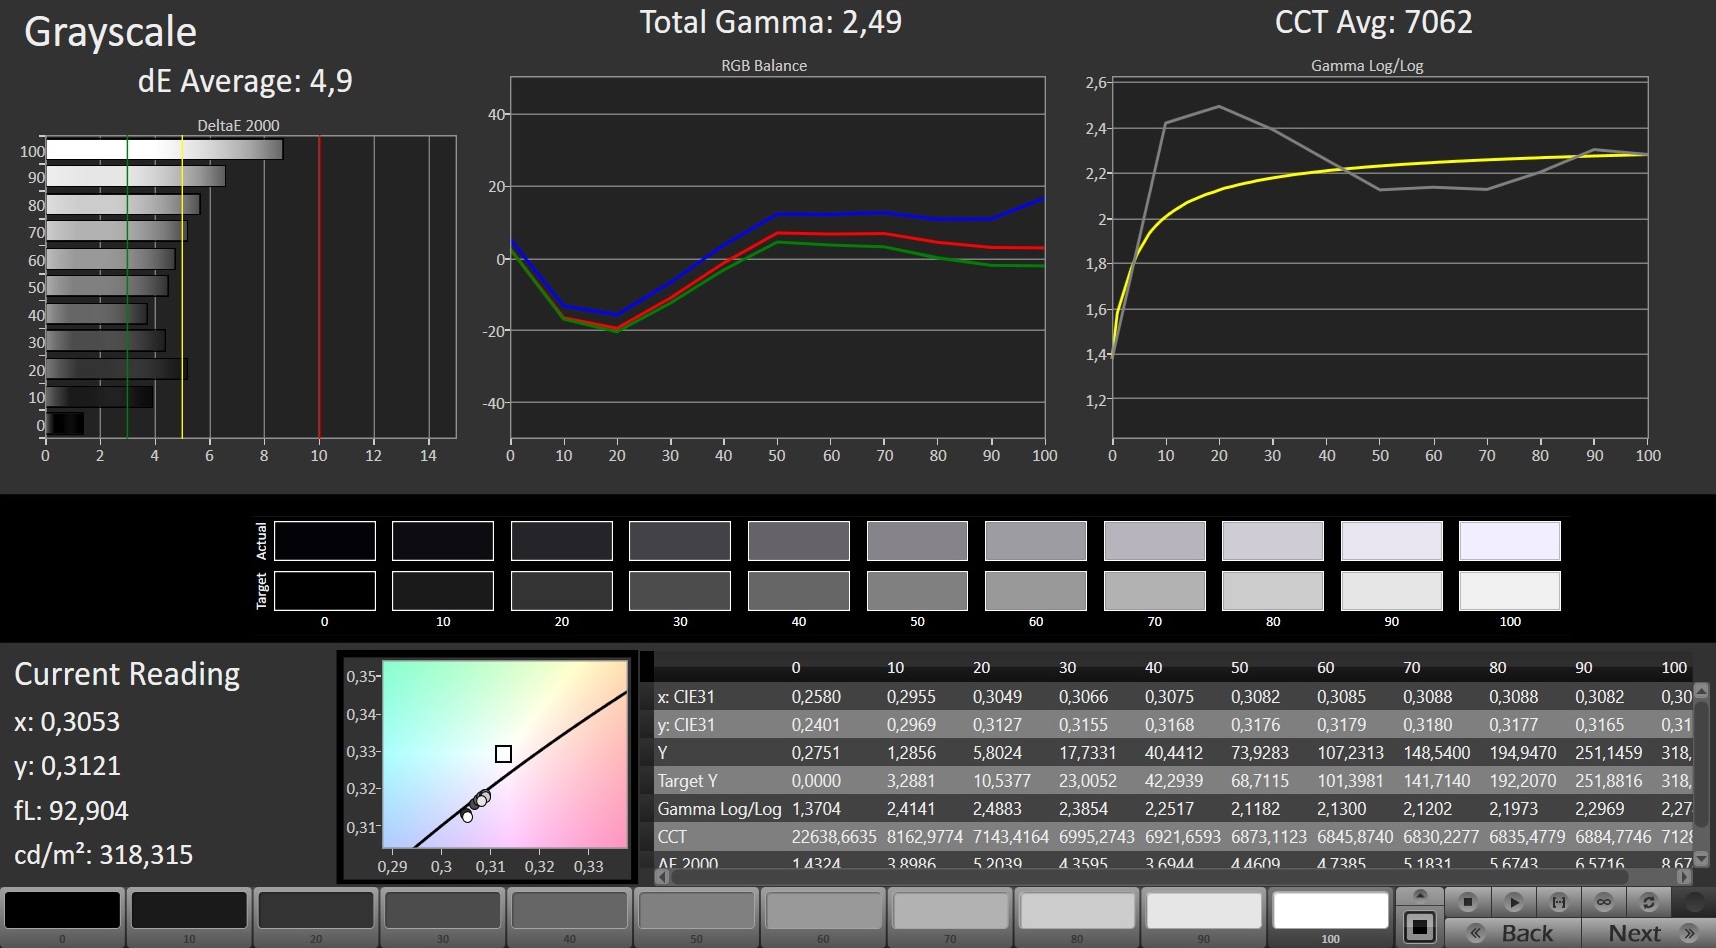
ΔE Greyscale Calman: 4.9 | ∀{0.09-98 Ø4.97}
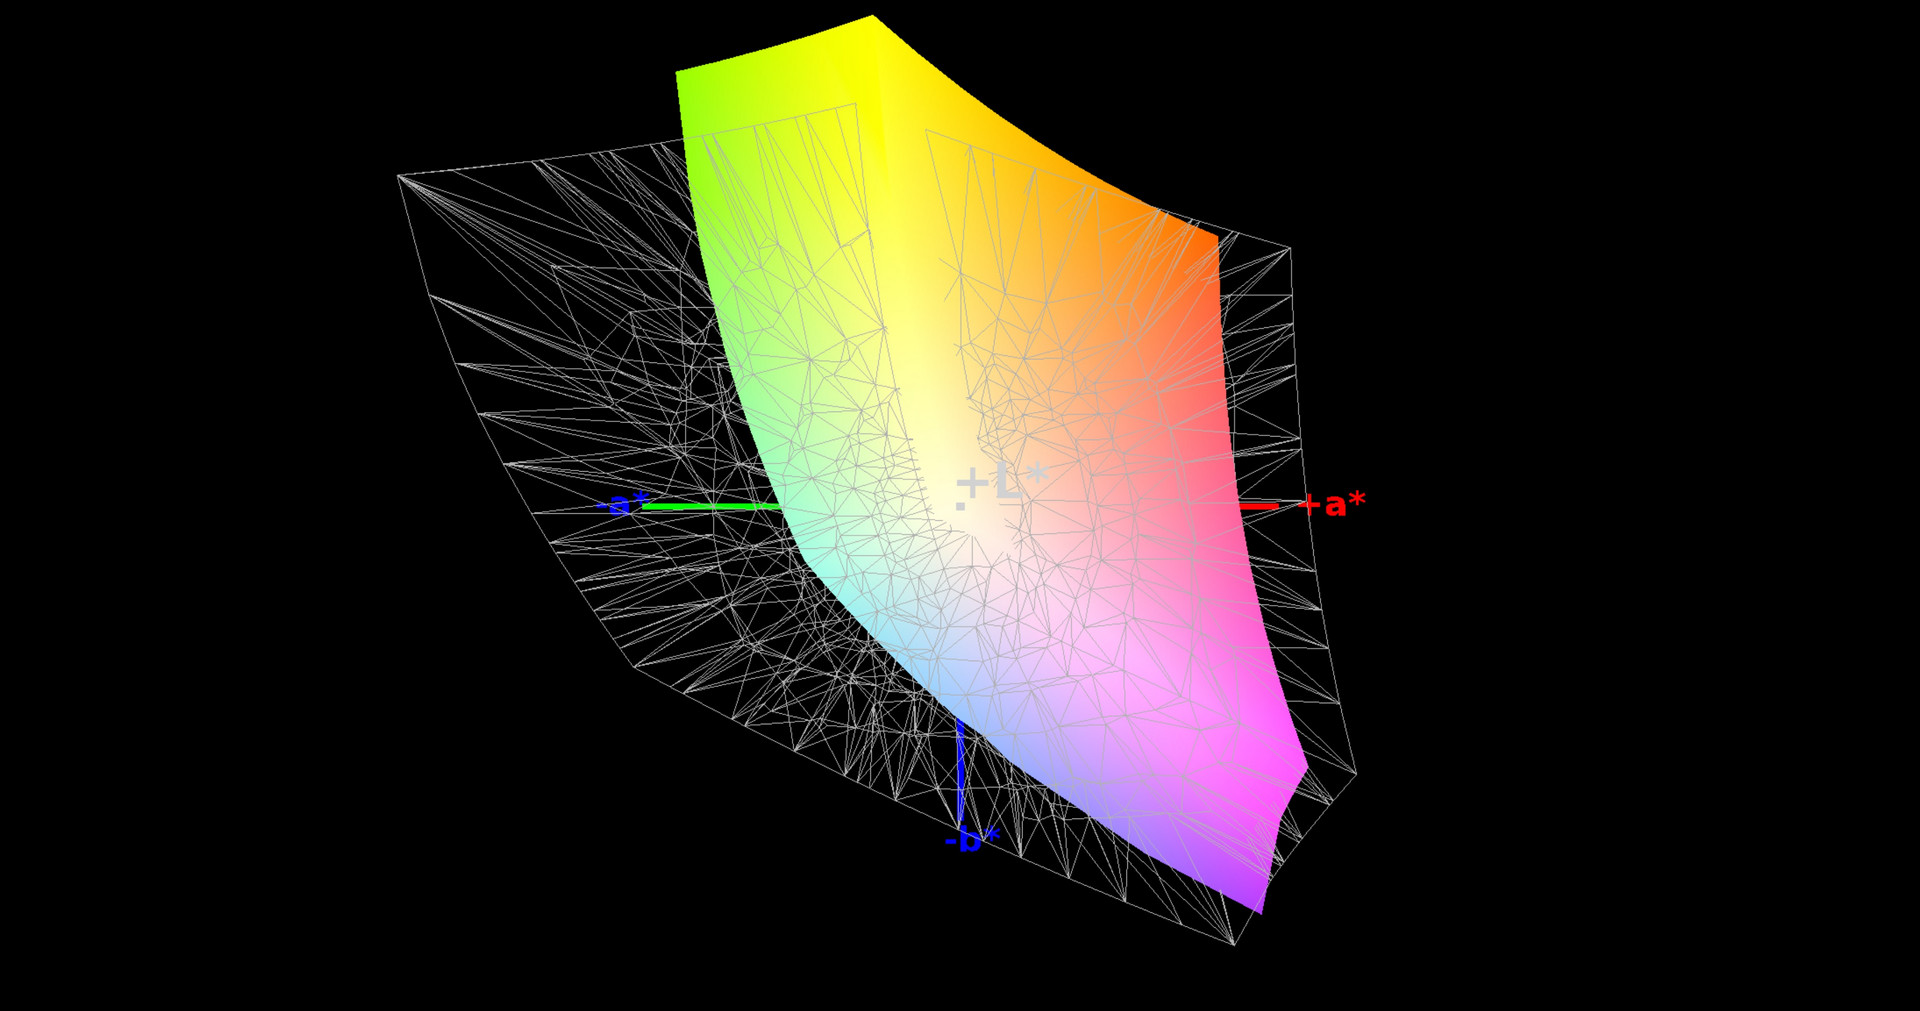
83% sRGB (Argyll 1.6.3 3D)
54% AdobeRGB 1998 (Argyll 1.6.3 3D)
60.6% AdobeRGB 1998 (Argyll 3D)
82.9% sRGB (Argyll 3D)
64.3% Display P3 (Argyll 3D)
Gamma: 2.49
CCT: 7062 K
| Alienware 15 R3 Max-Q LG Philips LP156WF6 (LGD049B), 1920x1080, 15.6" | Alienware 15 R3 HPJGK_B156HTN (AUO51ED), 1920x1080, 15.6" | Acer Predator Triton 700 AUO B156HAN04.2 (AUO42ED), 1920x1080, 15.6" | Aorus X5 v7 AU Optronics B156ZAN02.3 (AUO23EB), 3840x2160, 15.6" | Eurocom Q5 ID: LGD04D4, Name: LG Philips LP156UD1-SPB1, 3840x2160, 15.6" | |
|---|---|---|---|---|---|
| Display | 7% | 3% | 7% | 5% | |
| Display P3 Coverage (%) | 64.3 | 66 3% | 62.5 -3% | 65.3 2% | 63 -2% |
| sRGB Coverage (%) | 82.9 | 90.5 9% | 88.7 7% | 91.9 11% | 92.7 12% |
| AdobeRGB 1998 Coverage (%) | 60.6 | 66.2 9% | 63.5 5% | 66.3 9% | 64.4 6% |
| Response Times | 47% | -9% | -2% | 8% | |
| Response Time Grey 50% / Grey 80% * (ms) | 40 ? | 25 ? 37% | 44.8 ? -12% | 44 ? -10% | 32.4 ? 19% |
| Response Time Black / White * (ms) | 28 ? | 12 ? 57% | 29.6 ? -6% | 26.4 ? 6% | 28.8 ? -3% |
| PWM Frequency (Hz) | 21100 ? | ||||
| Screen | -26% | -1% | 4% | -16% | |
| Brightness middle (cd/m²) | 306 | 386 26% | 291 -5% | 307 0% | 287.5 -6% |
| Brightness (cd/m²) | 297 | 382 29% | 277 -7% | 297 0% | 279 -6% |
| Brightness Distribution (%) | 89 | 93 4% | 84 -6% | 92 3% | 87 -2% |
| Black Level * (cd/m²) | 0.28 | 0.39 -39% | 0.22 21% | 0.3 -7% | 0.65 -132% |
| Contrast (:1) | 1093 | 990 -9% | 1323 21% | 1023 -6% | 442 -60% |
| Colorchecker dE 2000 * | 5.45 | 10.2 -87% | 5.52 -1% | 4.72 13% | 4.5 17% |
| Colorchecker dE 2000 max. * | 9.45 | 15.81 -67% | 10.72 -13% | 8.07 15% | 8.9 6% |
| Greyscale dE 2000 * | 4.9 | 11.28 -130% | 6.59 -34% | 4.79 2% | 4.6 6% |
| Gamma | 2.49 88% | 2.23 99% | 2.44 90% | 2.42 91% | 2.39 92% |
| CCT | 7062 92% | 11383 57% | 7816 83% | 7690 85% | 7393 88% |
| Color Space (Percent of AdobeRGB 1998) (%) | 54 | 59 9% | 58 7% | 60 11% | 59 9% |
| Color Space (Percent of sRGB) (%) | 83 | 90 8% | 89 7% | 92 11% | 92.3 11% |
| Total Average (Program / Settings) | 9% /
-9% | -2% /
-1% | 3% /
4% | -1% /
-8% |
* ... smaller is better
Screen Flickering / PWM (Pulse-Width Modulation)
| Screen flickering / PWM detected | 21100 Hz | ≤ 95 % brightness setting | 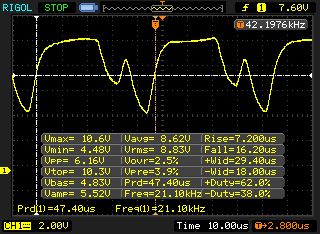 |
The display backlight flickers at 21100 Hz (worst case, e.g., utilizing PWM) Flickering detected at a brightness setting of 95 % and below. There should be no flickering or PWM above this brightness setting. The frequency of 21100 Hz is quite high, so most users sensitive to PWM should not notice any flickering. In comparison: 52 % of all tested devices do not use PWM to dim the display. If PWM was detected, an average of 7798 (minimum: 5 - maximum: 343500) Hz was measured. | |||
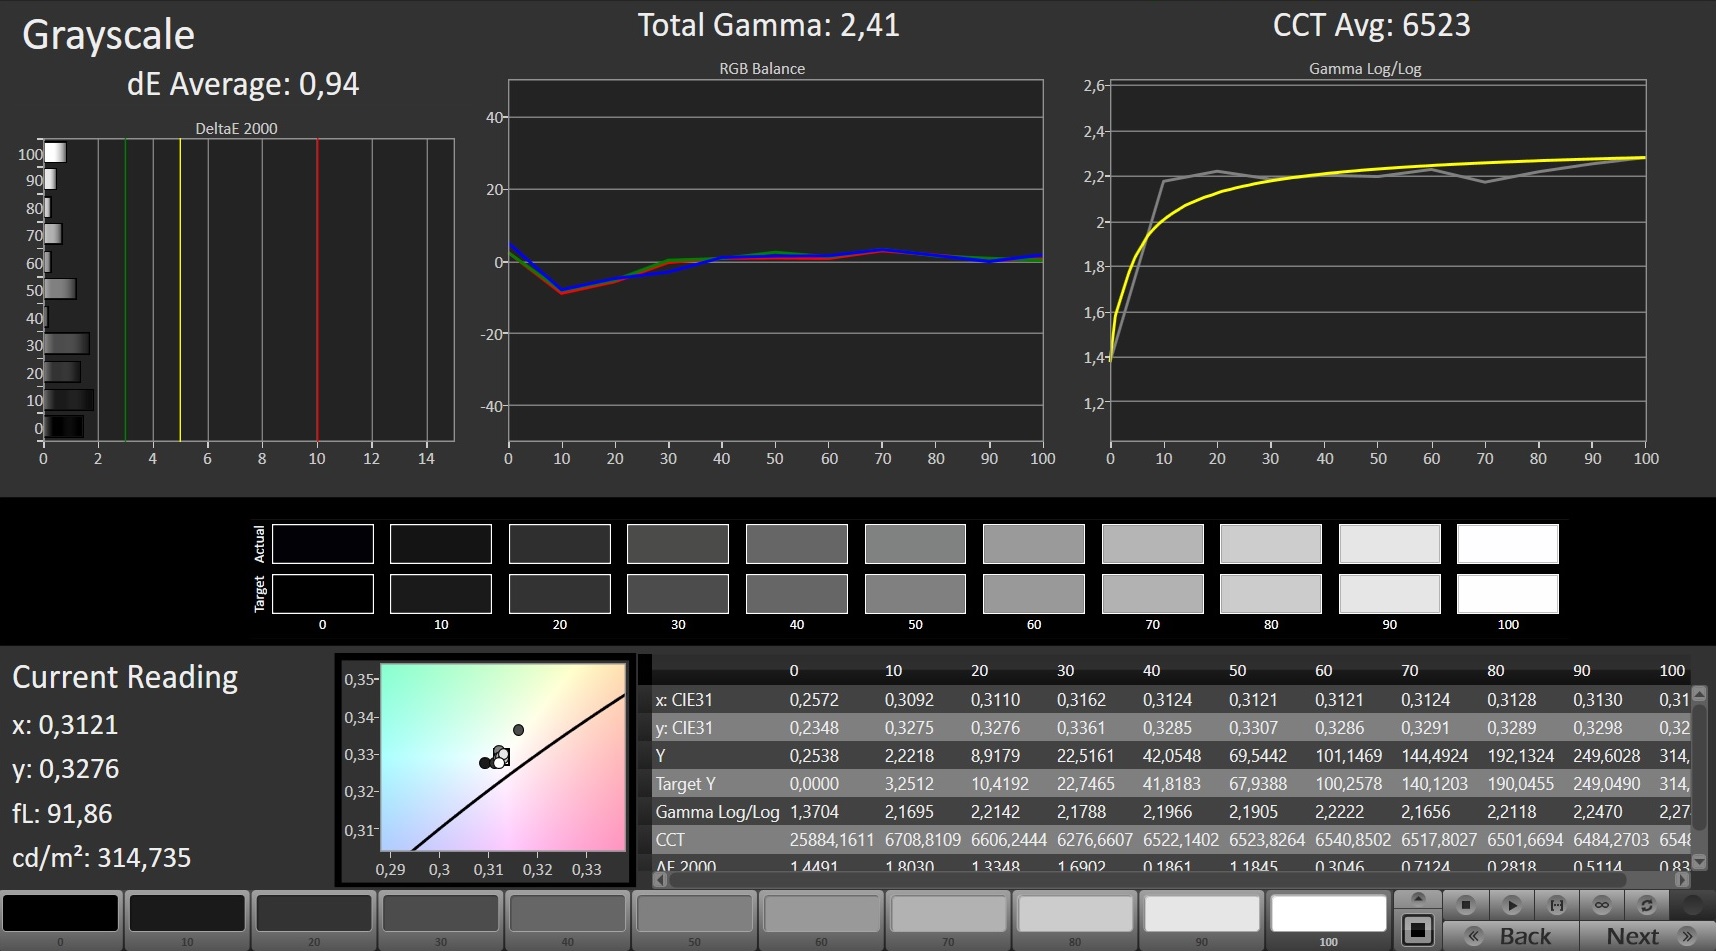
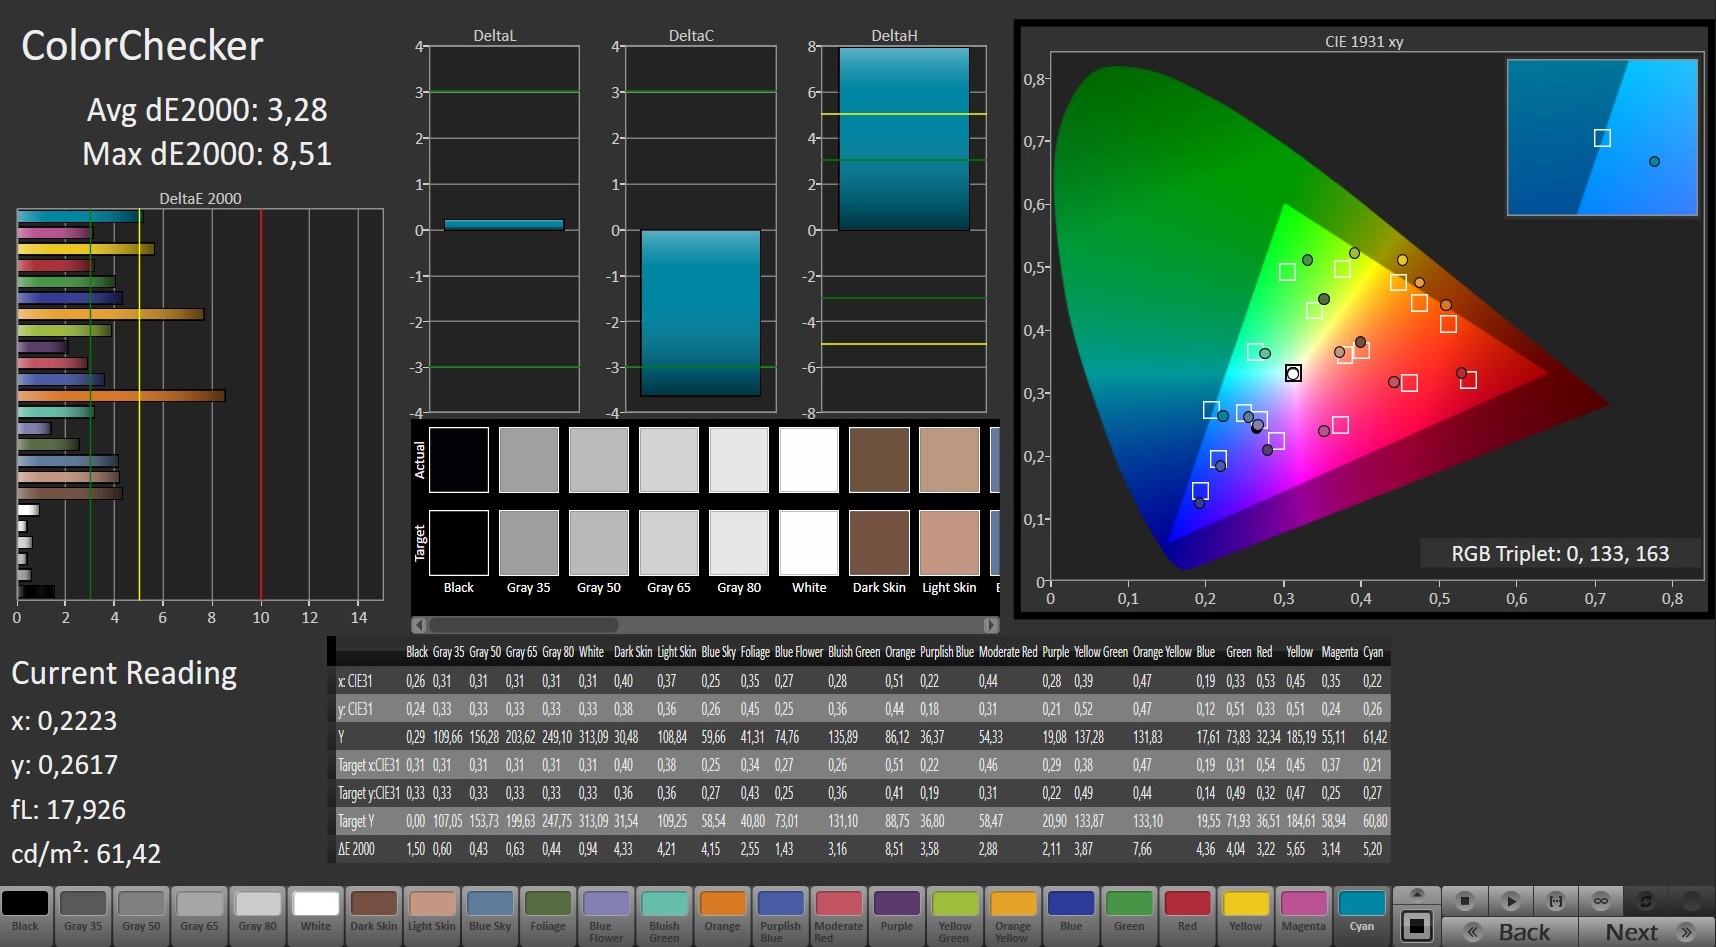
The display has a decent color display out of the box. With a DeltaE-2000 color deviation of 5.45, it is not too far from the ideal DeltaE value (below 3) and the screen does not have a blue cast. Still, calibrating brought slight improvements. The color deviation dropped to 3.28 and gray scales were displayed more evenly. The display cannot display the color spaces AdobeRGB and sRGB with rates of 54% (AdobeRGB) and 83% (sRGB).
Buyers can use the color profile from our calibration (available for download above) to improve the screen's color display. Please make sure that your device is equipped with the same display model (manufacturer + model number) as our test unit before using our color profile. Otherwise, the colors could worsen. It often happens that screens from different manufacturers are used for one notebook model.

Display Response Times
| ↔ Response Time Black to White | ||
|---|---|---|
| 28 ms ... rise ↗ and fall ↘ combined | ↗ 16 ms rise | 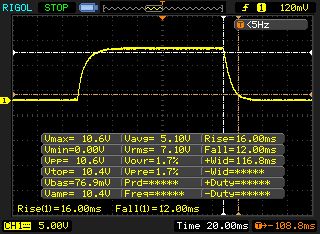 |
| ↘ 12 ms fall | ||
| The screen shows relatively slow response rates in our tests and may be too slow for gamers. In comparison, all tested devices range from 0.1 (minimum) to 240 (maximum) ms. » 71 % of all devices are better. This means that the measured response time is worse than the average of all tested devices (19.9 ms). | ||
| ↔ Response Time 50% Grey to 80% Grey | ||
| 40 ms ... rise ↗ and fall ↘ combined | ↗ 19.6 ms rise | 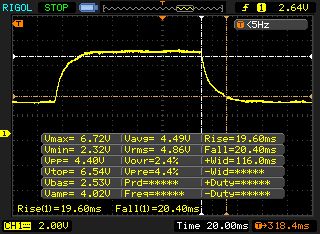 |
| ↘ 20.4 ms fall | ||
| The screen shows slow response rates in our tests and will be unsatisfactory for gamers. In comparison, all tested devices range from 0.165 (minimum) to 636 (maximum) ms. » 61 % of all devices are better. This means that the measured response time is worse than the average of all tested devices (31.1 ms). | ||
Alienware has equipped this device with an IPS panel with stable viewing angles. This means that the screen can be read from any position. The notebook can be used outdoors, but only if the sun is not shining too bright.

Performance
Alienware's 15 R3 is a 15.6-inch gaming notebook that can display all current games smoothly. Our test unit is available for $2500 according to Dell. Other configurations are available from $1200.
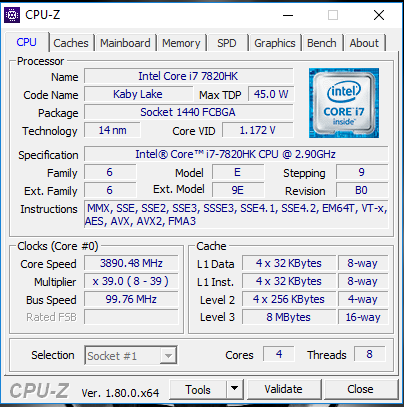
Processor
The device is powered by a Core i7-7820HK (Kaby Lake) quad-core processor. The CPU has a TDP of 45 watts and is a common mobile processor. The quad-core processor has a base clock rate of 2.9 GHz. This can be increased to 3.5 GHz (four cores), 3.7 GHz (two cores) and 3.9 GHz (one core) via the turbo. The CPU ran our single thread tests at 3.5 to 3.7 GHz and the Cinebench Multithread tests at a rate of 3.5 GHz. Only towards the end of the benchmark did the clock rate drop to 3.2 to 3.3 GHz.
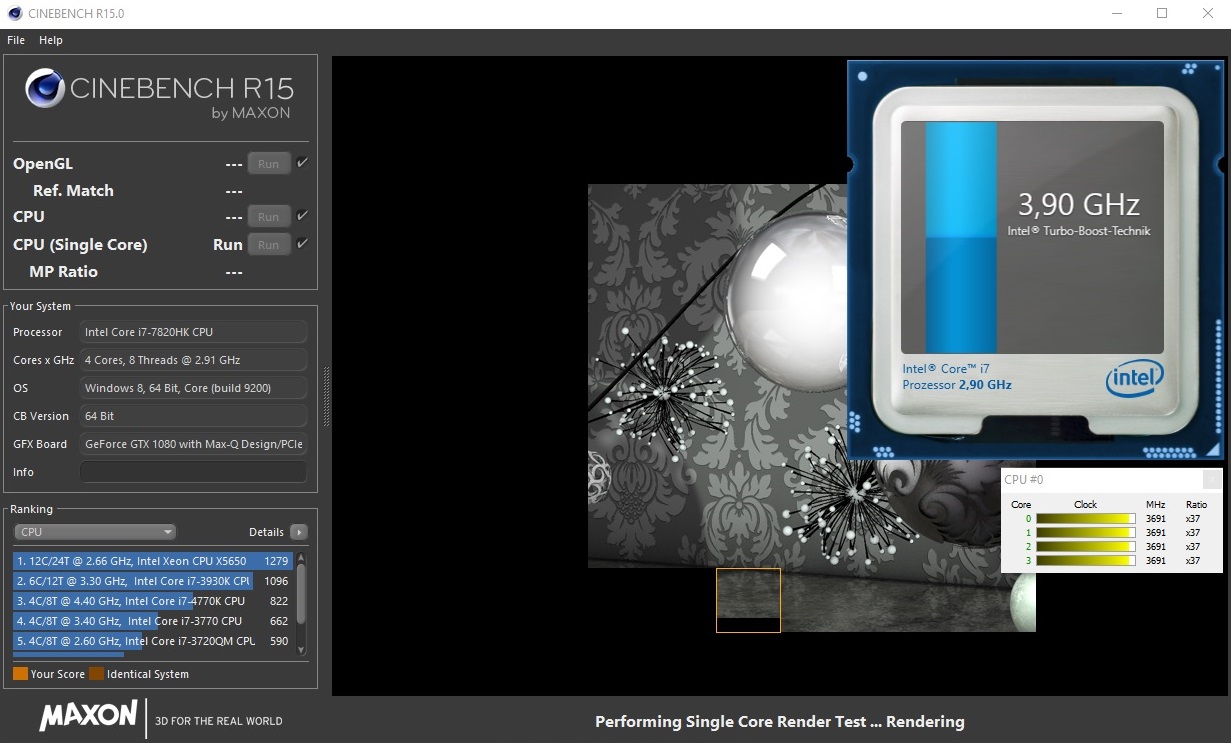
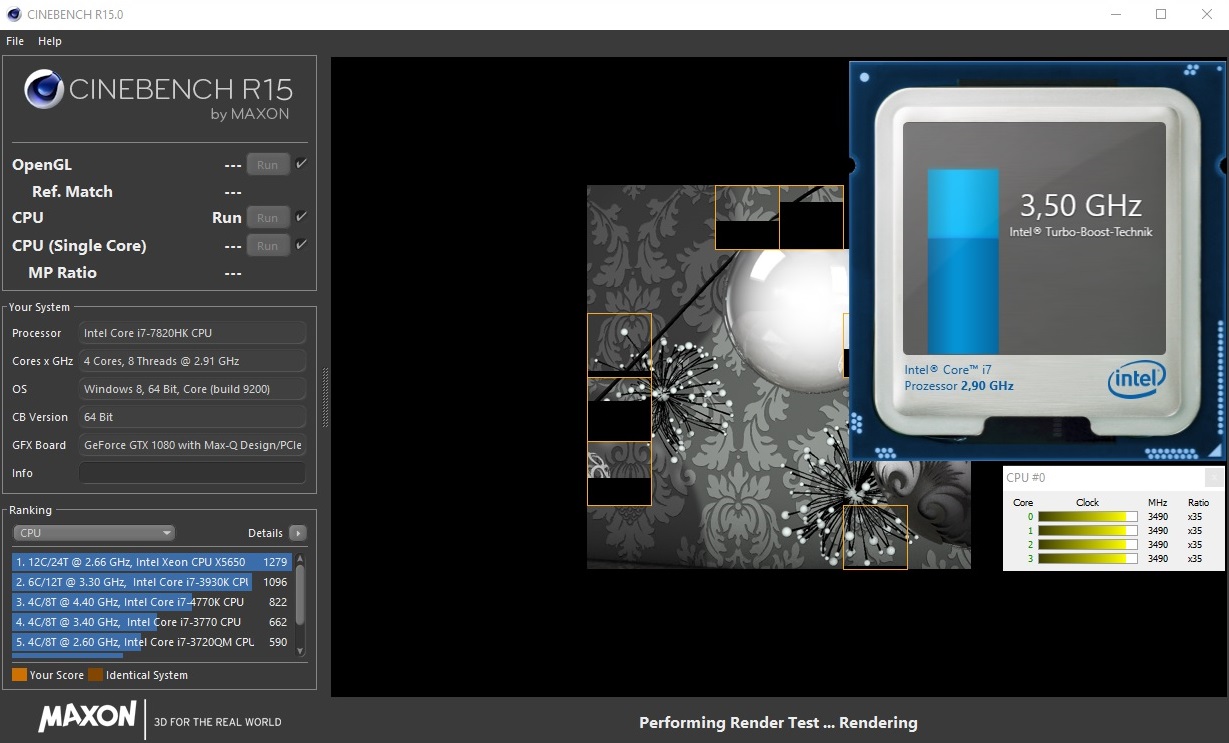
We test whether the turbo runs constantly by running the Cinebench R15 benchmark in a loop for 30 minutes. The results dropped slightly to about 730 points after the second round, but then remained at that level. So performance does drop slightly and the turbo then runs continuously between 3.2 and 3.3 GHz.
The results of our CPU tests are average for this specific processor. A look at the comparison table shows that the Aorus X5 v7, equipped with the same CPU, does a little better. This is because the notebook allows overclocking the CPU.
| Cinebench R15 | |
| CPU Single 64Bit | |
| Aorus X5 v7 | |
| Alienware 15 R3 Max-Q | |
| Alienware 15 R3 | |
| Acer Predator Triton 700 | |
| Eurocom Q5 | |
| CPU Multi 64Bit | |
| Aorus X5 v7 | |
| Alienware 15 R3 Max-Q | |
| Eurocom Q5 | |
| Alienware 15 R3 | |
| Acer Predator Triton 700 | |
| Cinebench R10 | |
| Rendering Single 32Bit | |
| Alienware 15 R3 Max-Q | |
| Eurocom Q5 | |
| Rendering Multiple CPUs 32Bit | |
| Alienware 15 R3 Max-Q | |
| Eurocom Q5 | |
| Geekbench 3 | |
| 32 Bit Multi-Core Score | |
| Alienware 15 R3 Max-Q | |
| 32 Bit Single-Core Score | |
| Alienware 15 R3 Max-Q | |
| Geekbench 4.0 | |
| 64 Bit Multi-Core Score | |
| Alienware 15 R3 Max-Q | |
| 64 Bit Single-Core Score | |
| Alienware 15 R3 Max-Q | |
| Geekbench 4.4 | |
| 64 Bit Multi-Core Score | |
| Alienware 15 R3 Max-Q | |
| 64 Bit Single-Core Score | |
| Alienware 15 R3 Max-Q | |
| JetStream 1.1 - 1.1 Total | |
| Alienware 15 R3 Max-Q | |
| Eurocom Q5 | |
System Performance
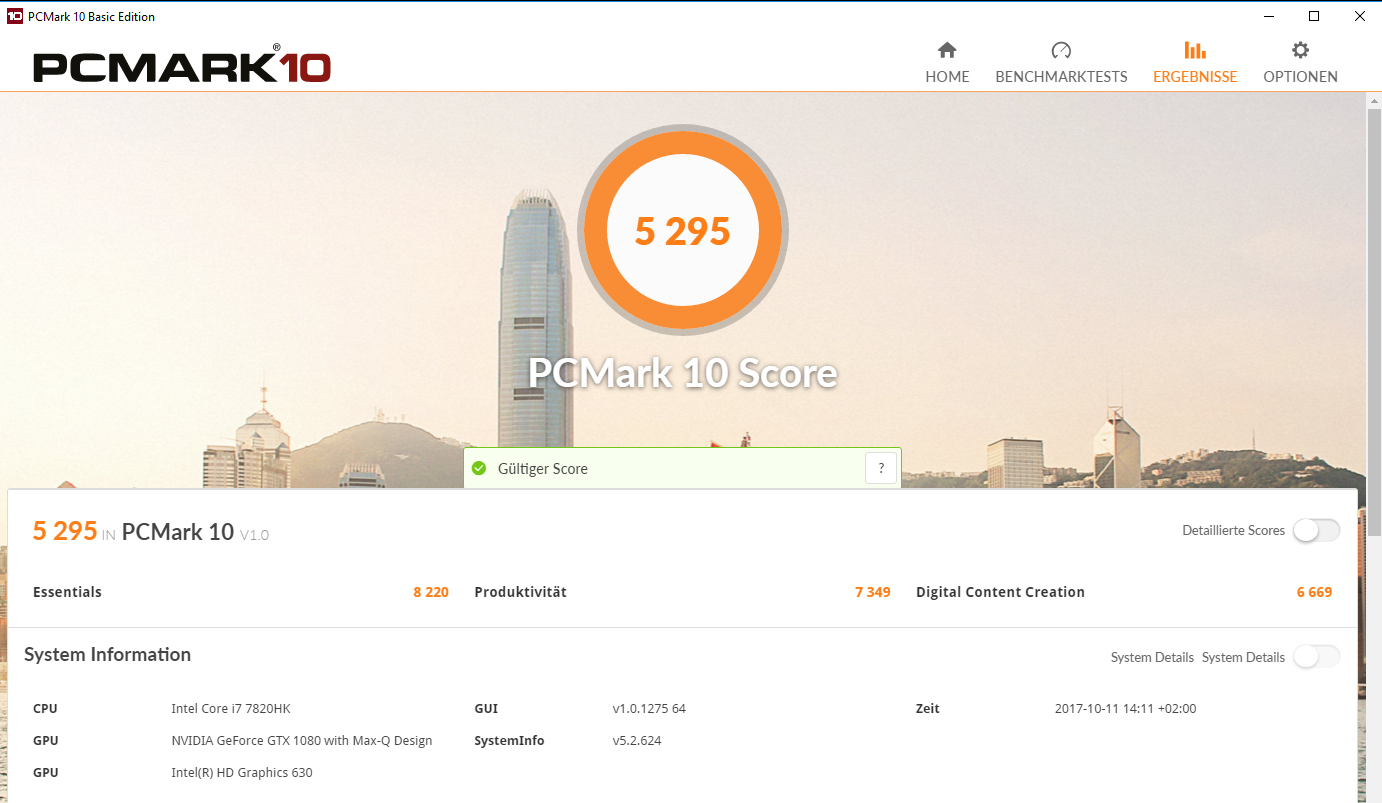
We have nothing to complain about the device's system performance. It runs smoothly and quickly and we encountered no difficulties. The very good results in the PCMark benchmarks show, that the device offers more than enough performance for all usual areas of usage. This includes gaming, image processing and video editing. It is not possible to increase the system performance as Alienware has already made full use of all the device's components.
| PCMark 7 Score | 6972 points | |
| PCMark 8 Home Score Accelerated v2 | 5121 points | |
| PCMark 8 Creative Score Accelerated v2 | 7892 points | |
| PCMark 8 Work Score Accelerated v2 | 5305 points | |
| PCMark 10 Score | 5295 points | |
Help | ||
| PCMark 8 | |
| Home Score Accelerated v2 | |
| Acer Predator Triton 700 | |
| Alienware 15 R3 Max-Q | |
| Alienware 15 R3 | |
| Aorus X5 v7 | |
| Eurocom Q5 | |
| Work Score Accelerated v2 | |
| Alienware 15 R3 Max-Q | |
| Alienware 15 R3 | |
| Acer Predator Triton 700 | |
| Eurocom Q5 | |
Storage Devices
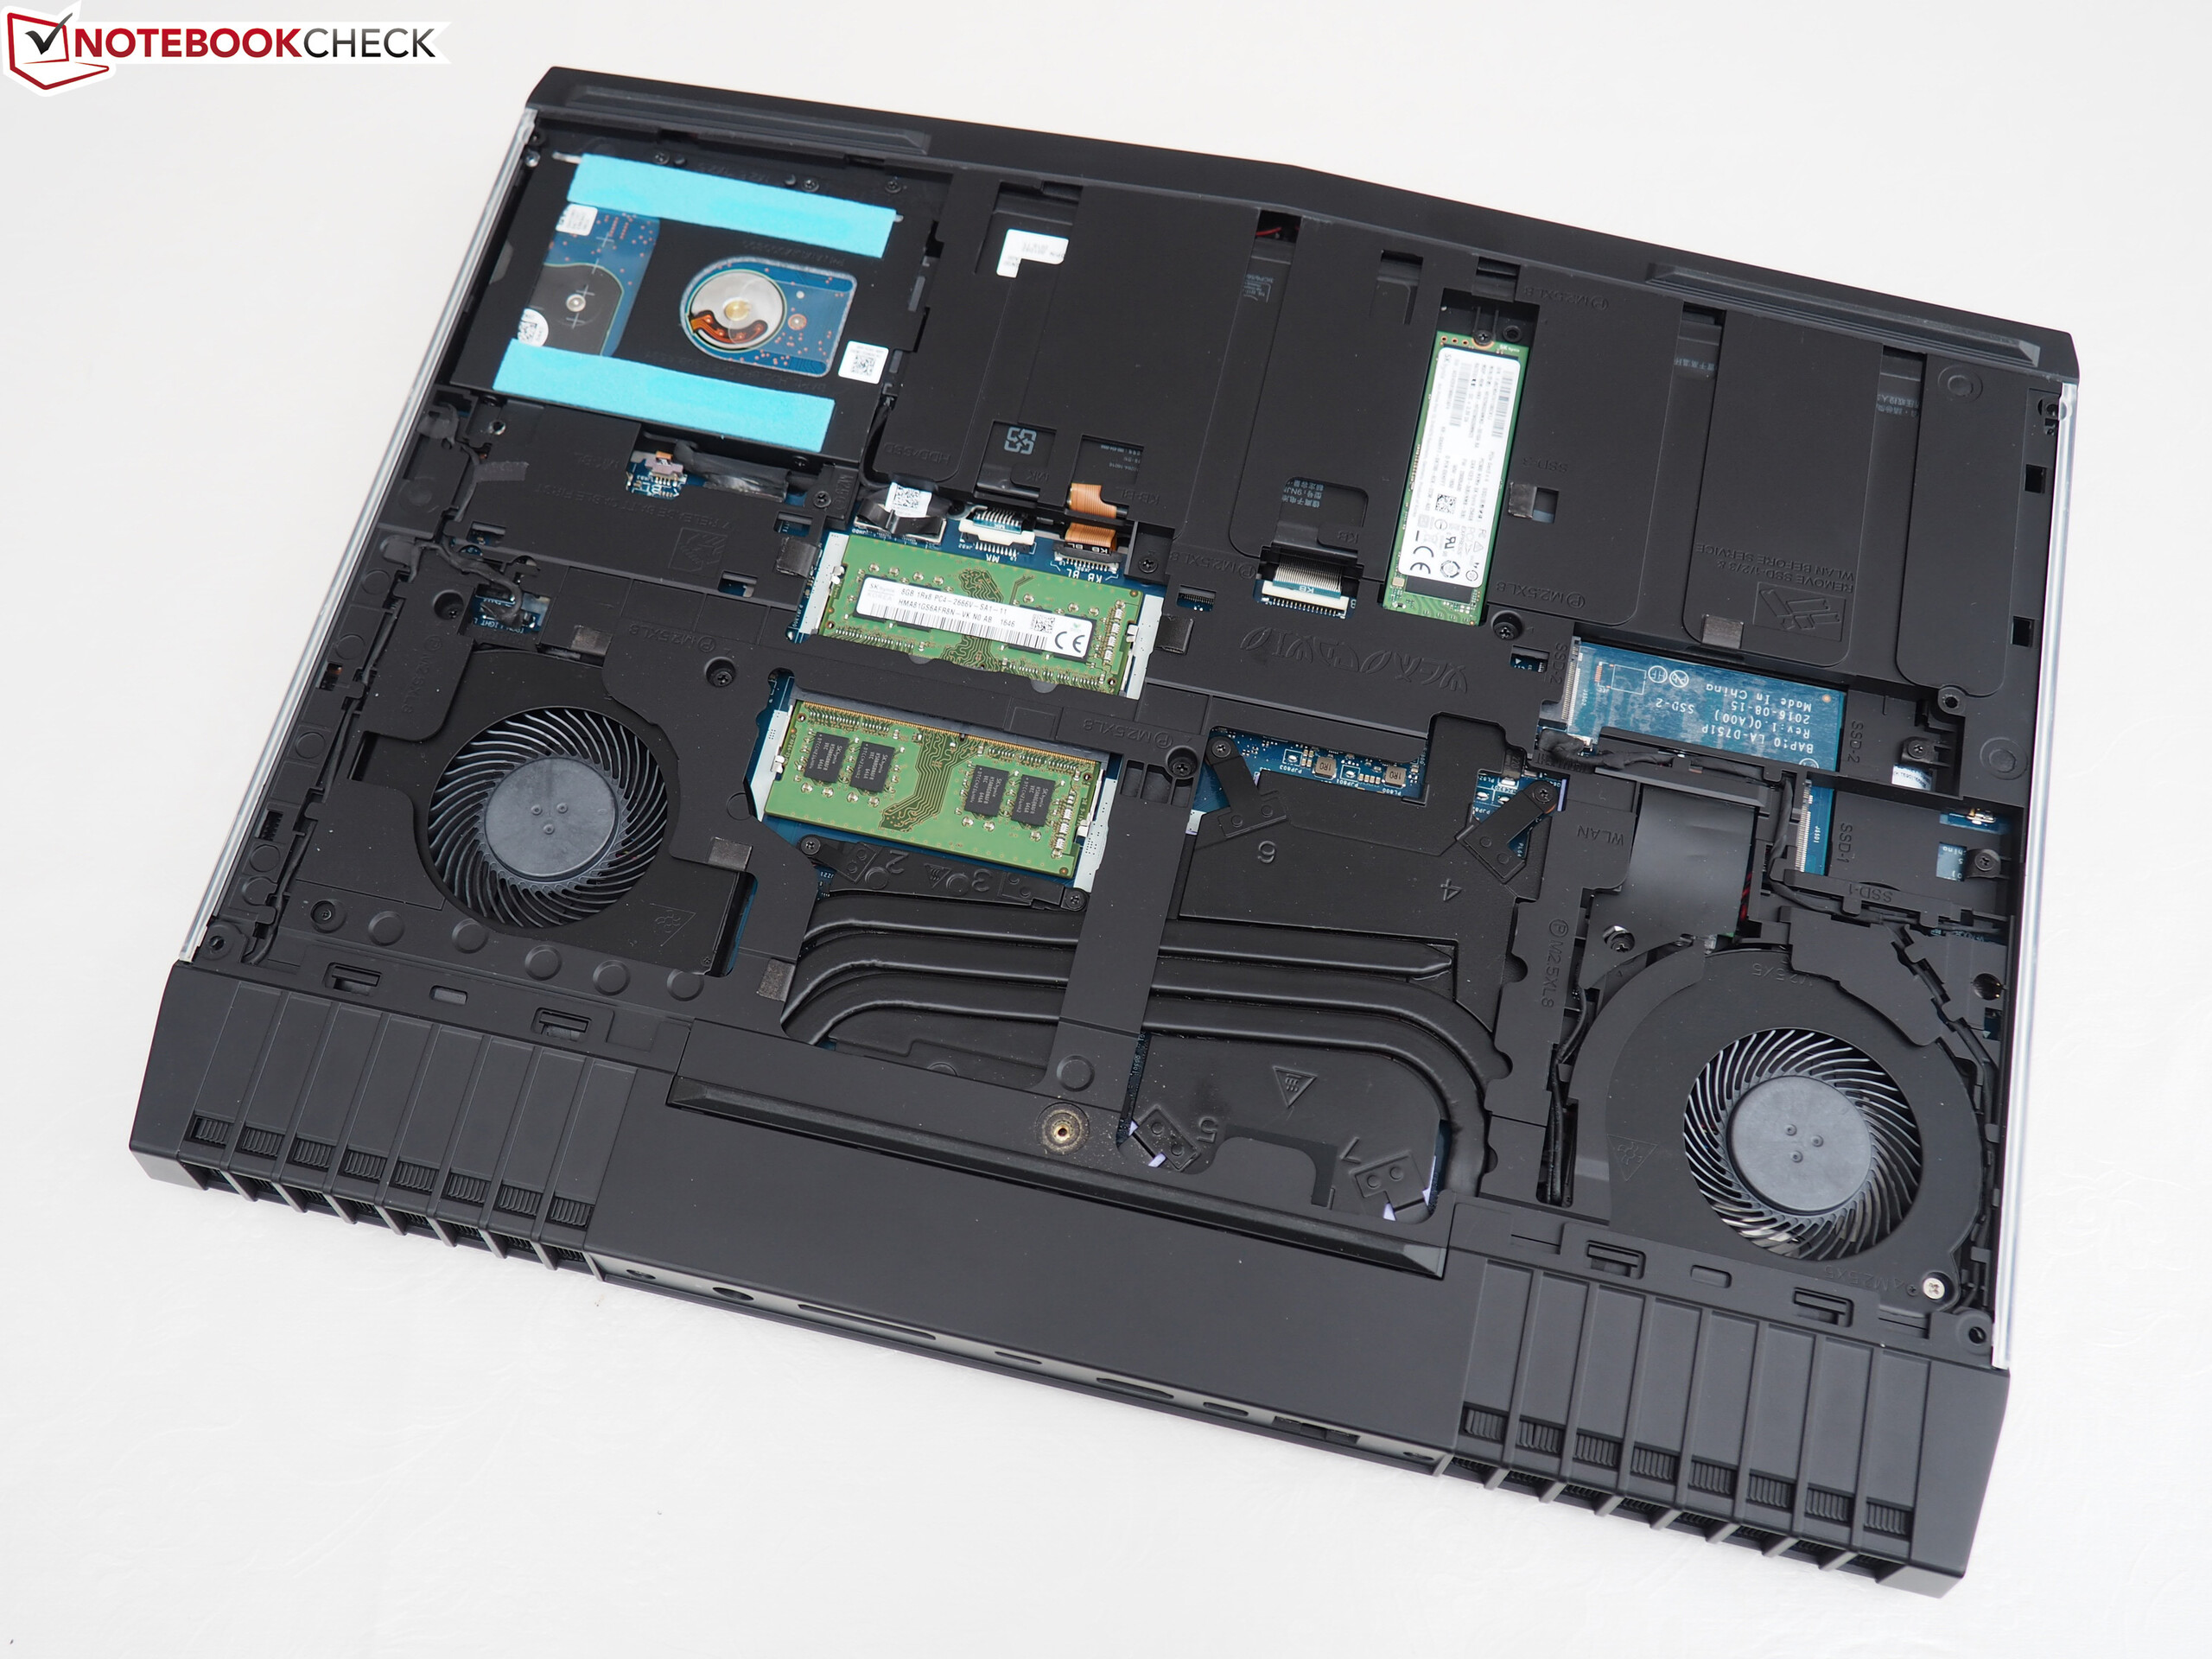
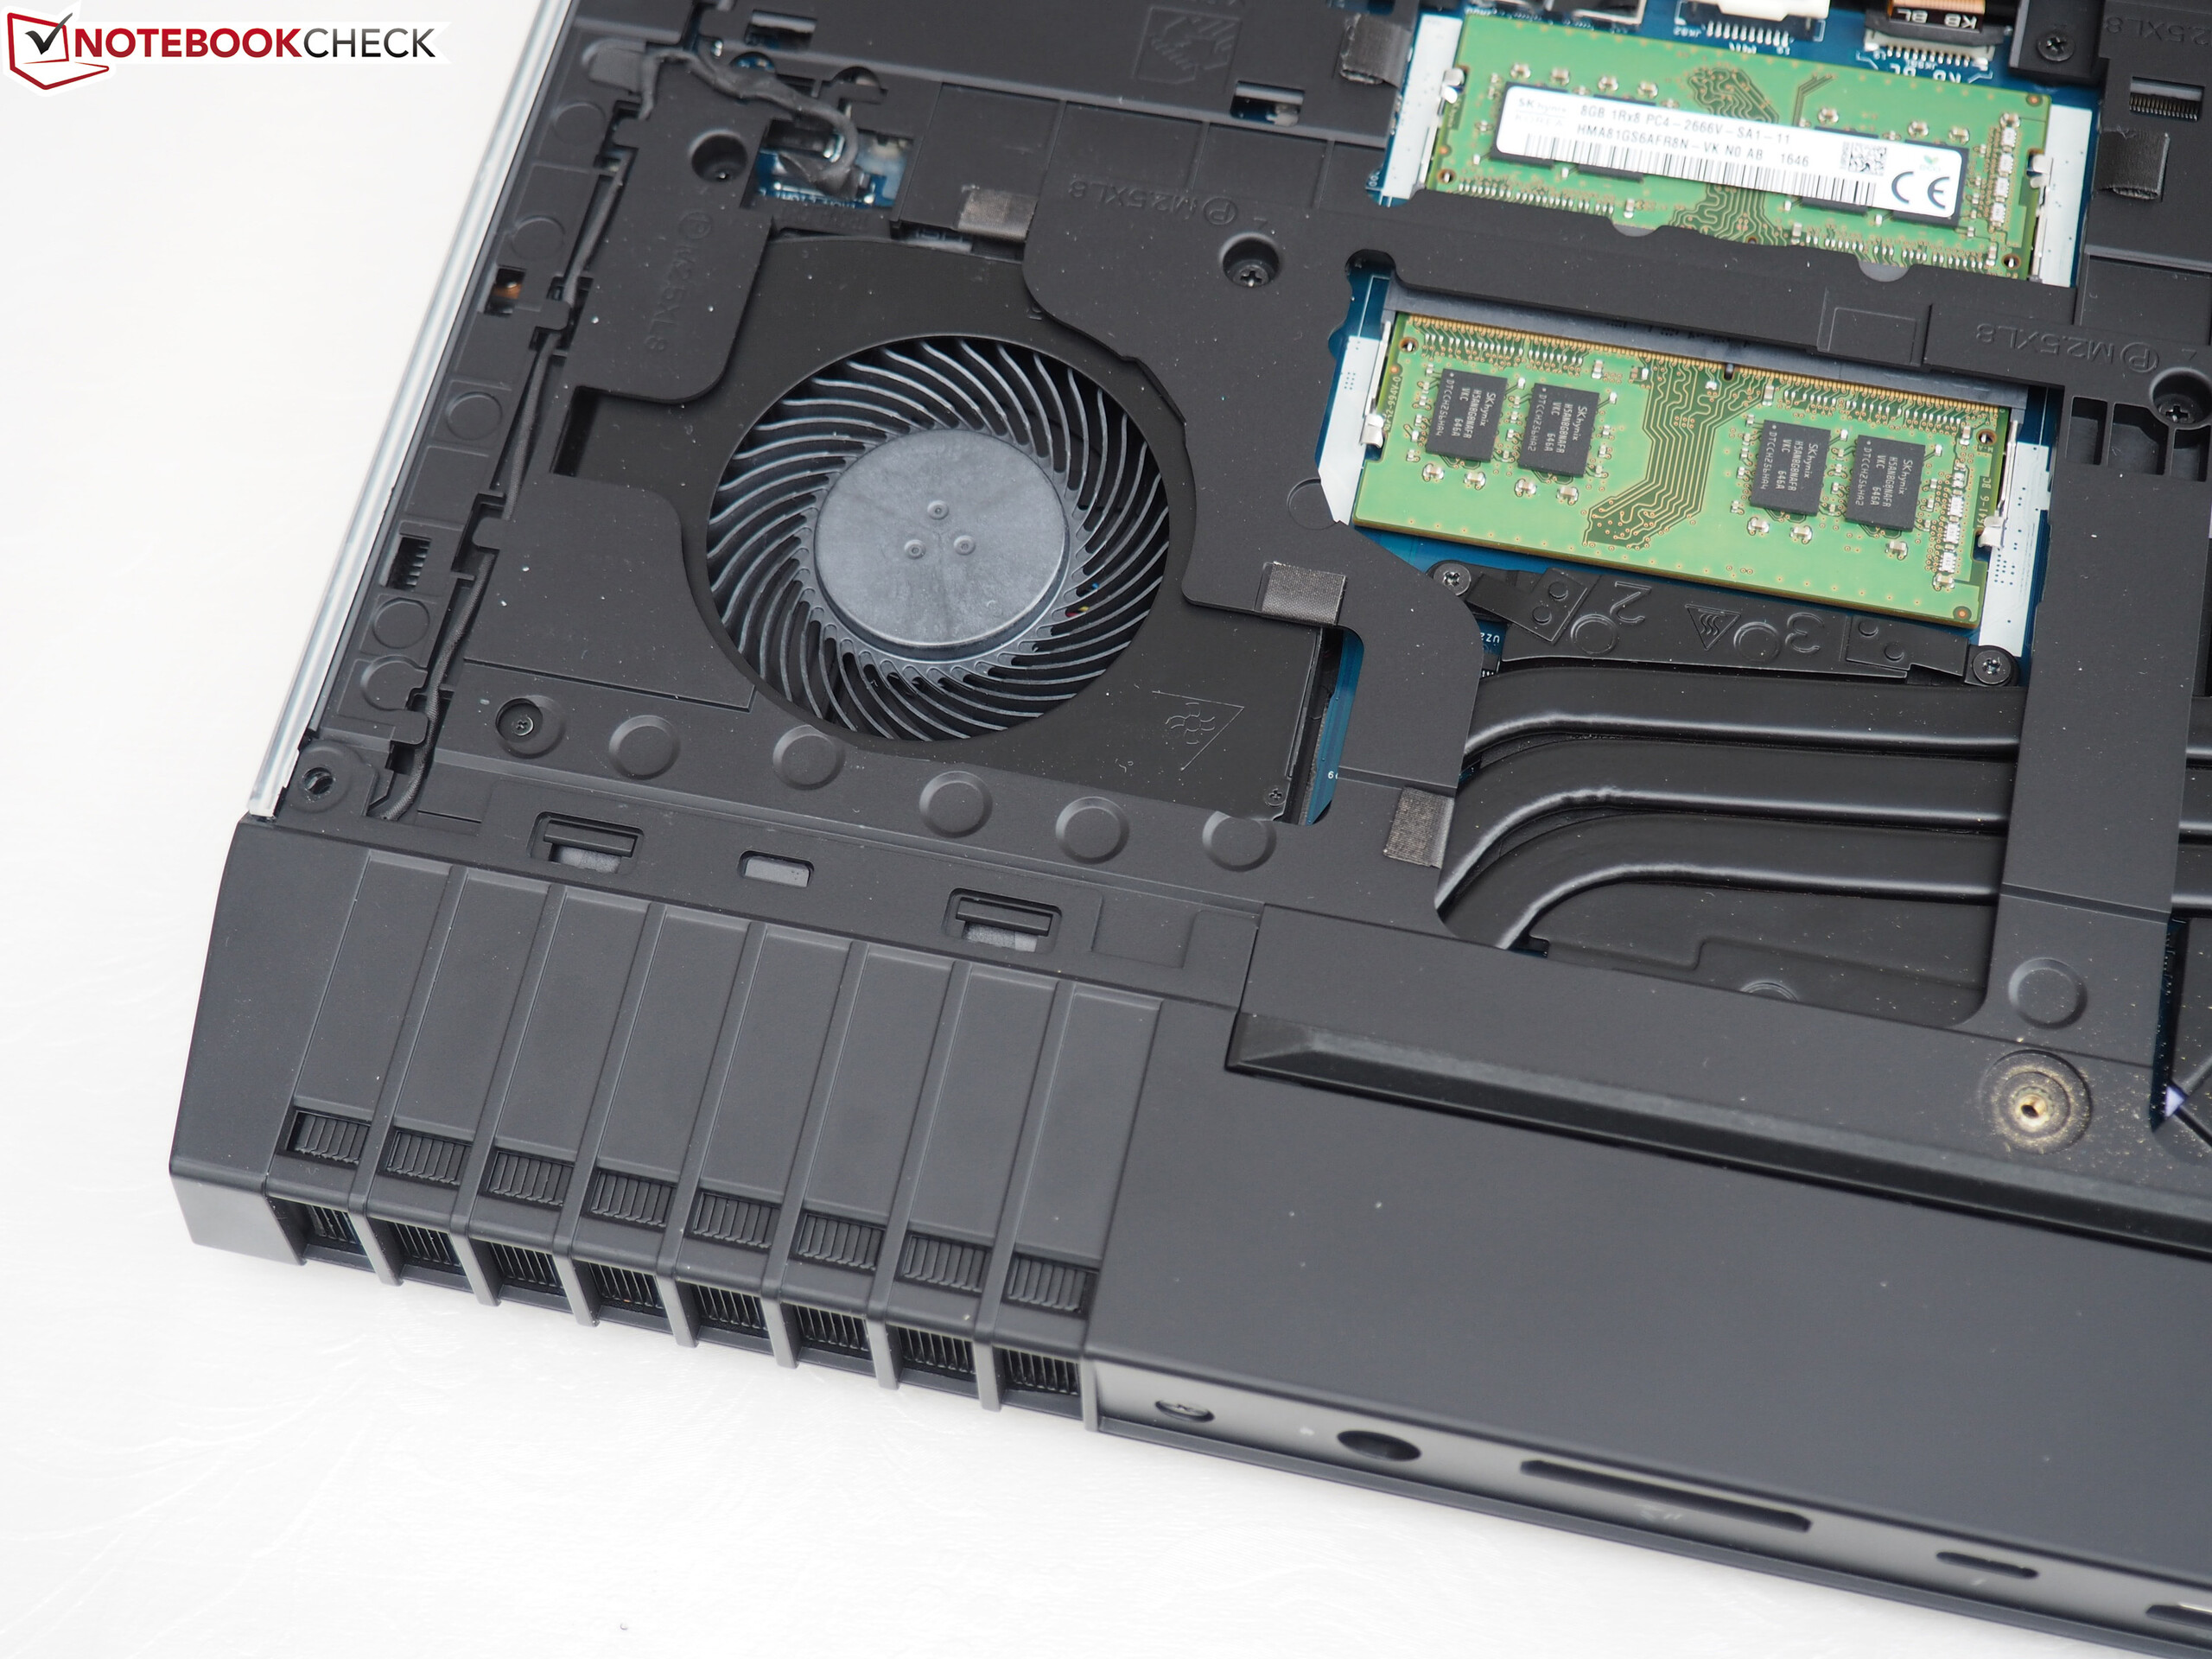
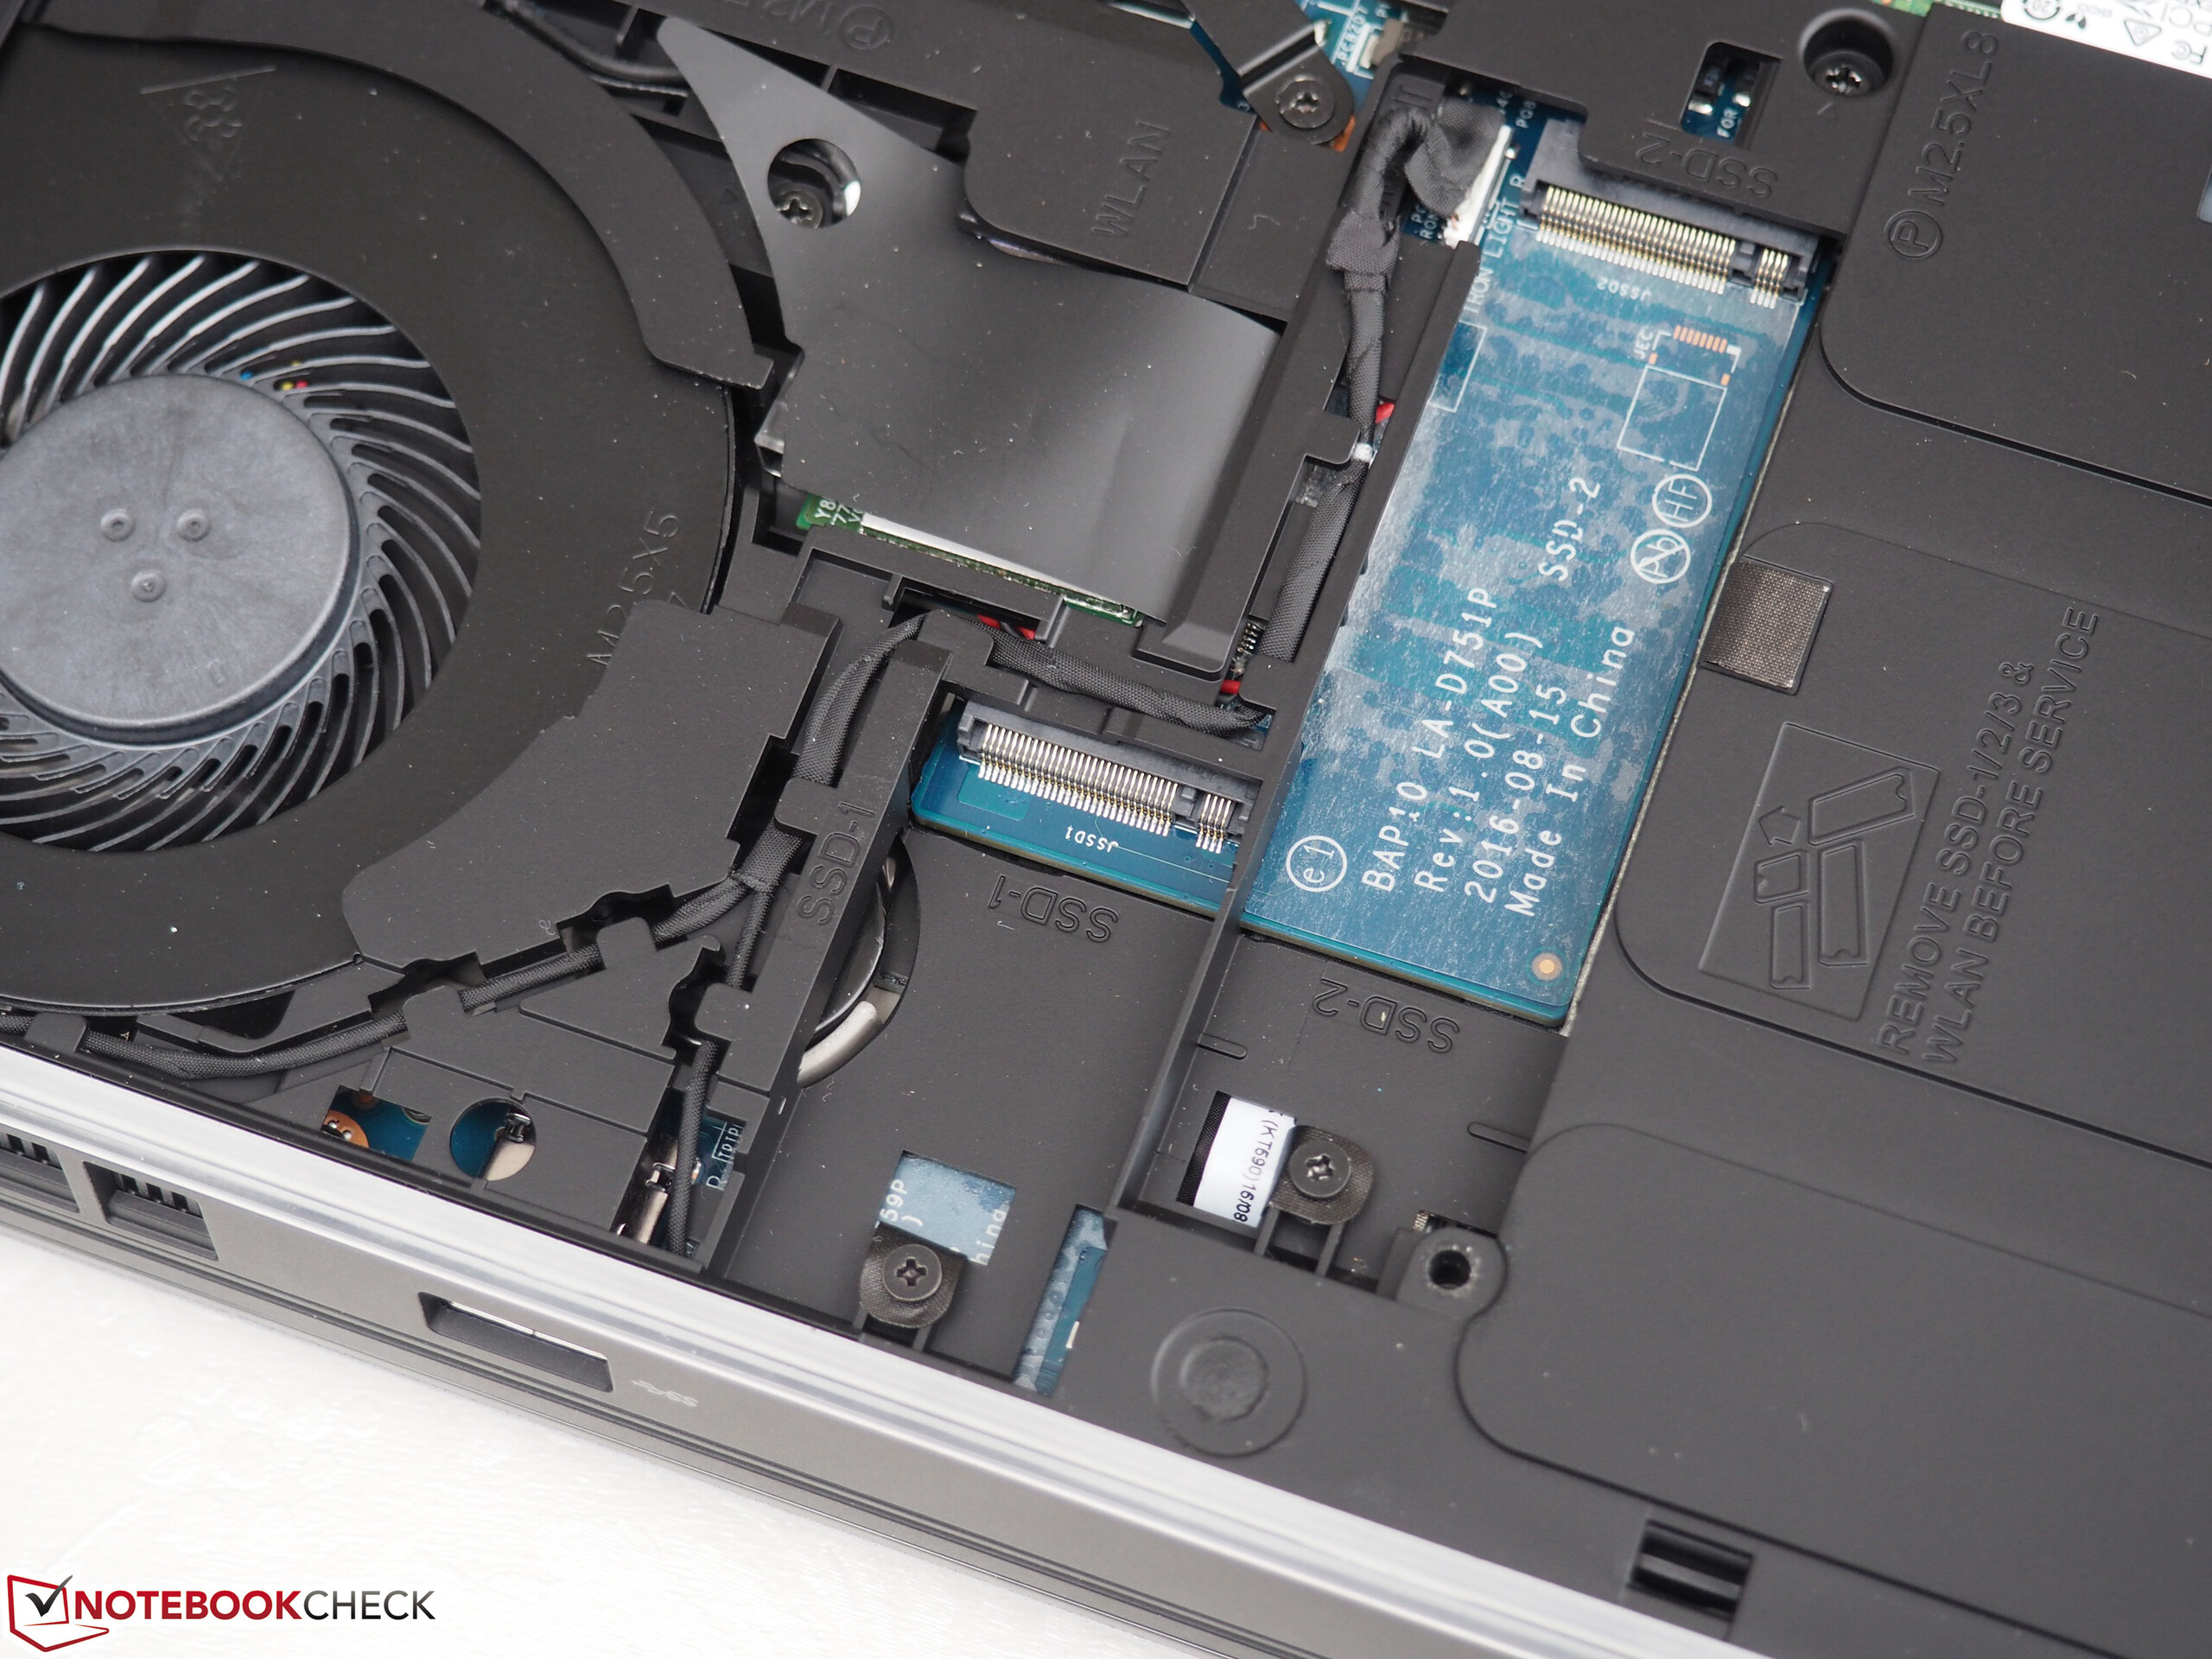
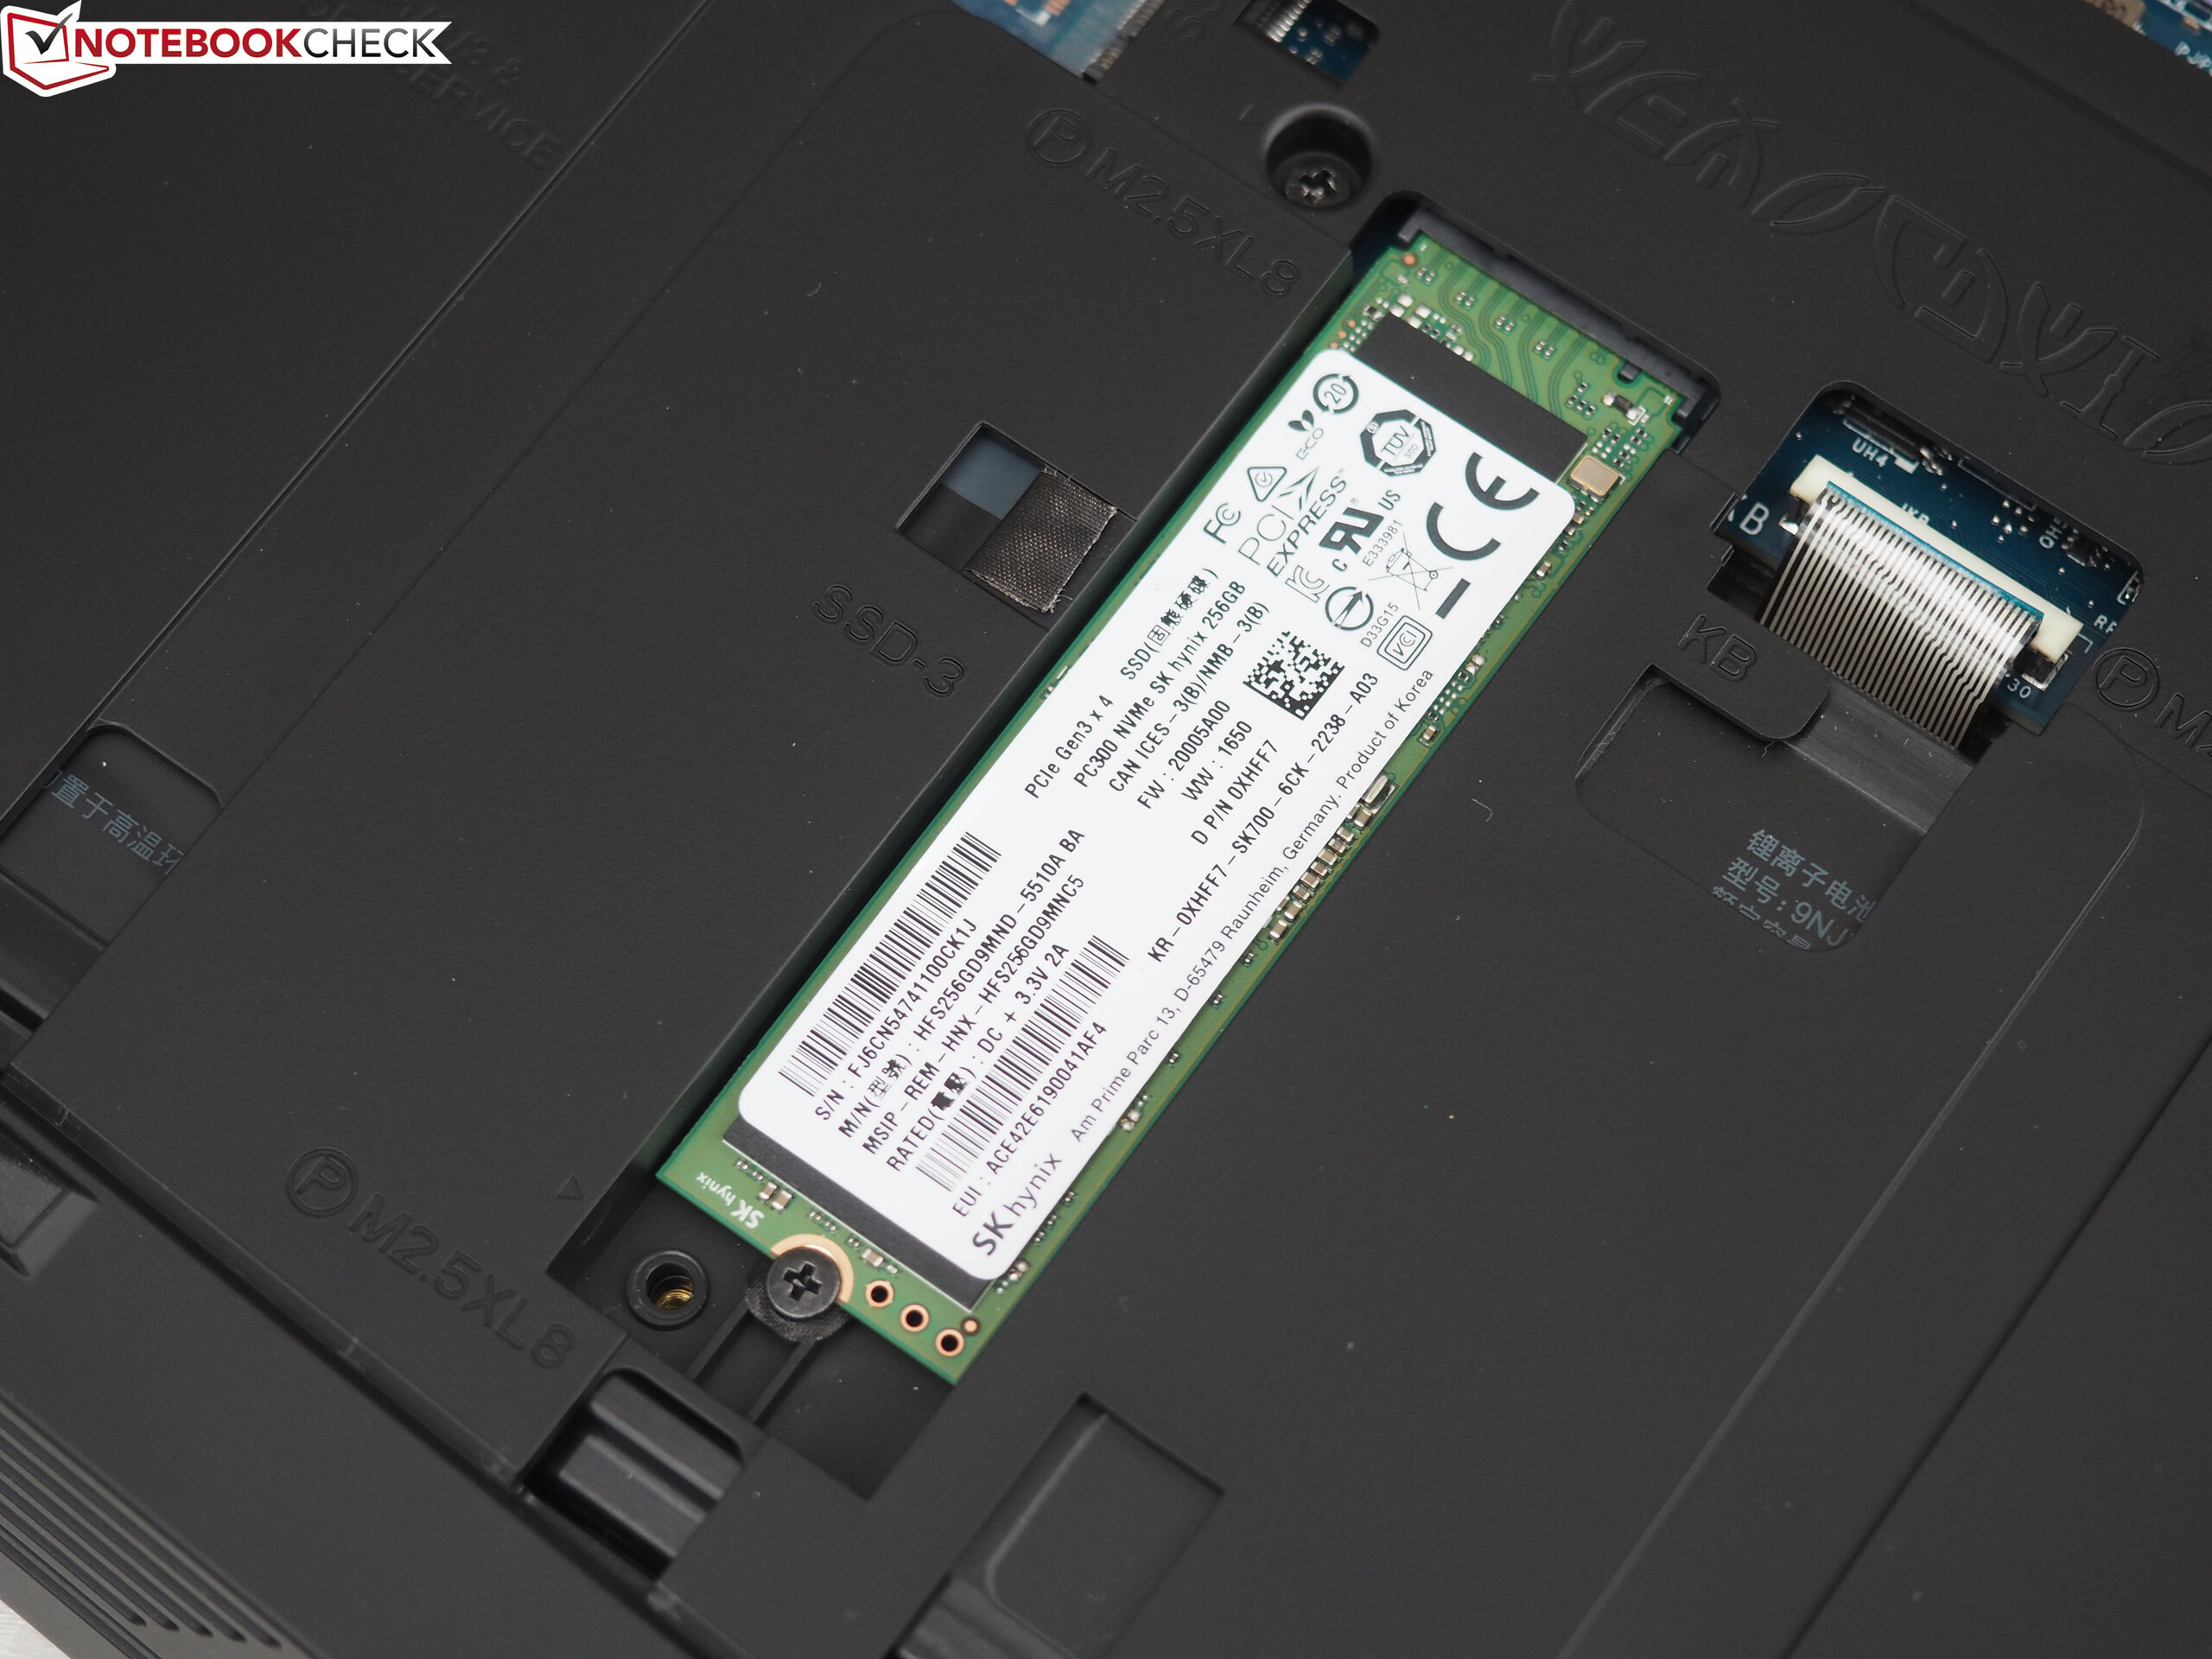
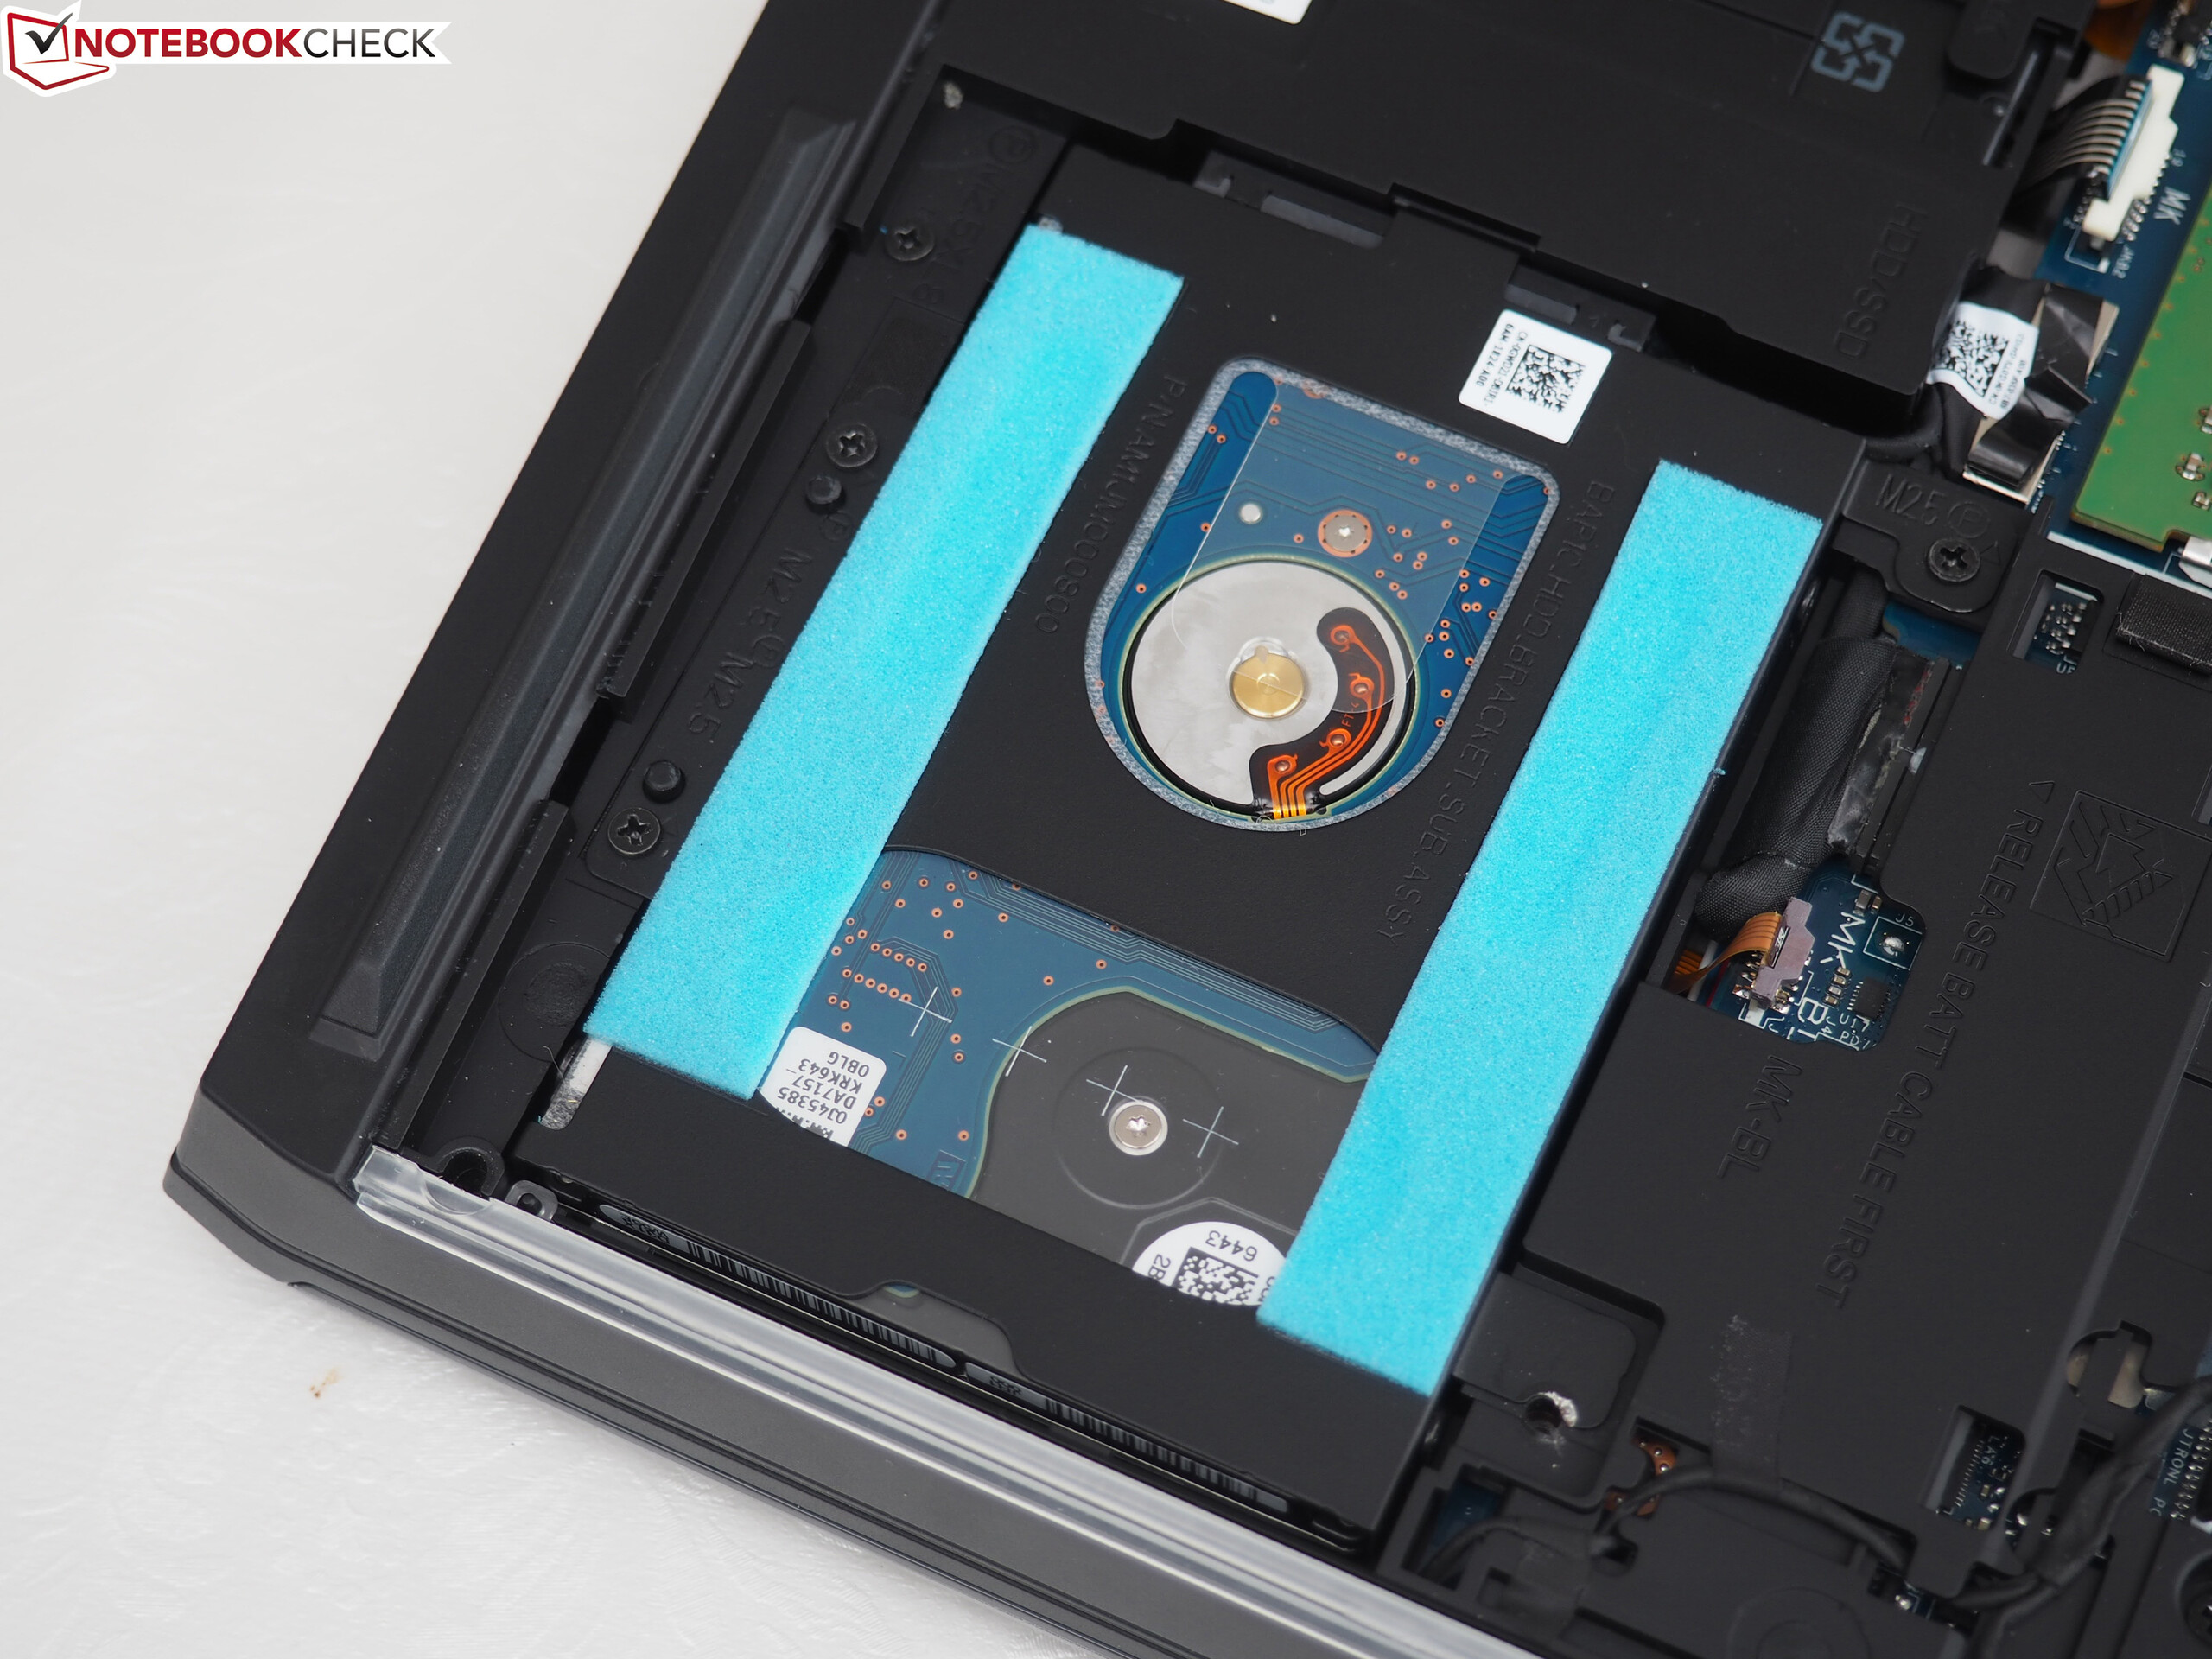
Alienware has equipped this notebook with a 256-GB NVMe SSD from LiteOn. The SSD is connected via a PCI Express 3.0 x4, which enables significantly higher transfer rates than a SATA III interface would. Apart from the SSD, the device also has a conventional 2.5-inch hard drive. This runs at 7200 RPM and offers 1 TB of storage.
The notebook has a second M.2-2280 drive bay where users have the option of installing a second SSD.

| Alienware 15 R3 Max-Q LiteOn CX2-8B256 | Aorus X5 v7 Toshiba NVMe THNSN5256GPU7 | Alienware 15 R3 | |
|---|---|---|---|
| CrystalDiskMark 3.0 | 19% | -20% | |
| Read Seq (MB/s) | 1840 | 1479 -20% | 1123 -39% |
| Write Seq (MB/s) | 802 | 1076 34% | 429.2 -46% |
| Read 512 (MB/s) | 944 | 1086 15% | 833 -12% |
| Write 512 (MB/s) | 671 | 1101 64% | 428.1 -36% |
| Read 4k (MB/s) | 43.03 | 44 2% | 37.8 -12% |
| Write 4k (MB/s) | 141 | 137.8 -2% | 122.9 -13% |
| Read 4k QD32 (MB/s) | 595 | 697 17% | 542 -9% |
| Write 4k QD32 (MB/s) | 403.6 | 556 38% | 429.8 6% |
Graphics
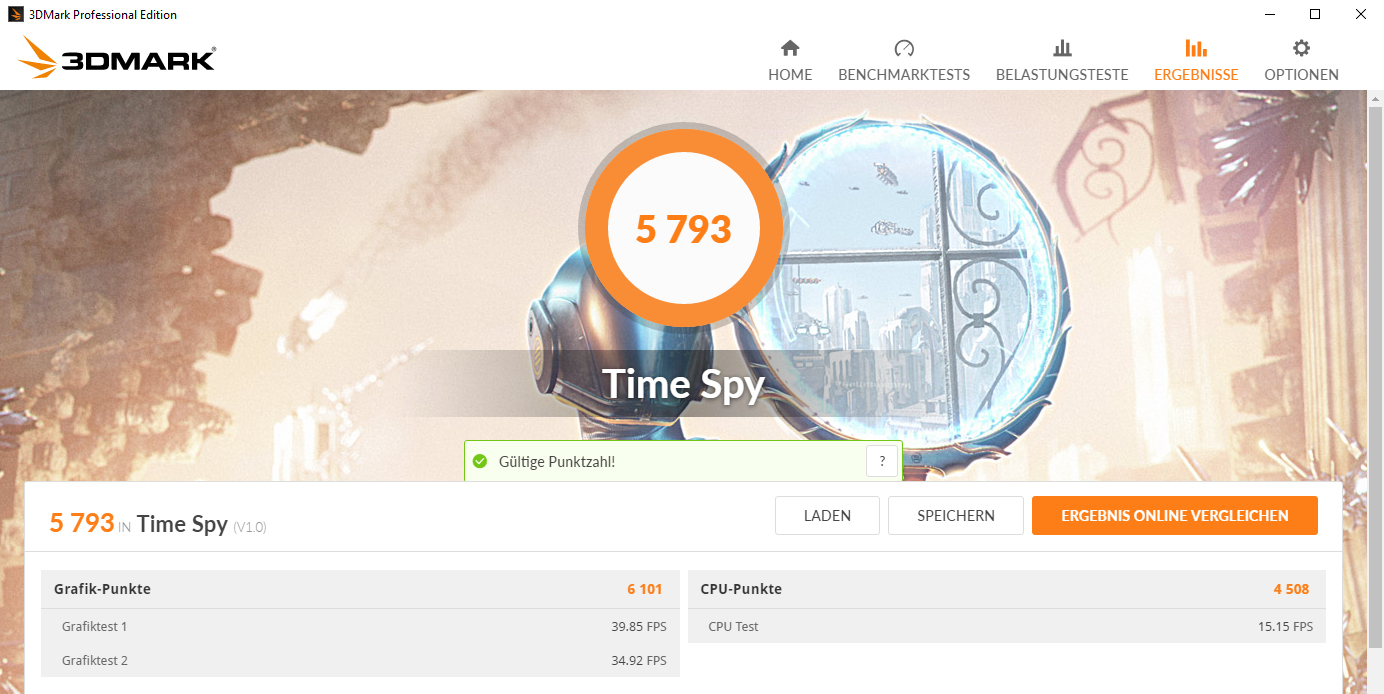
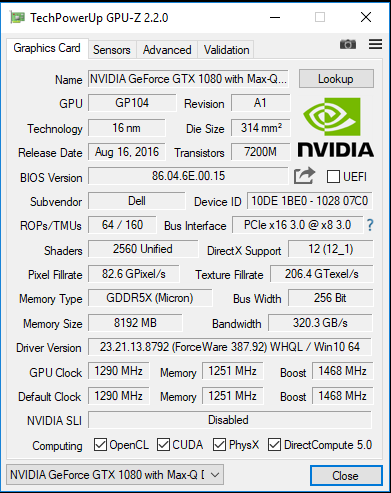
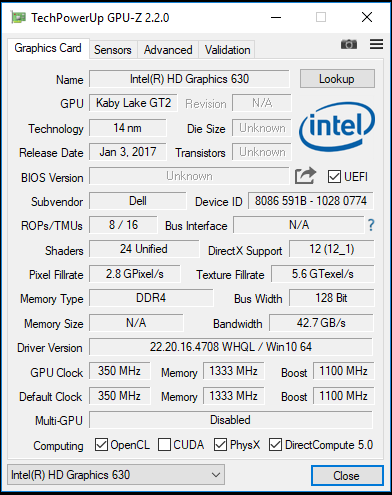
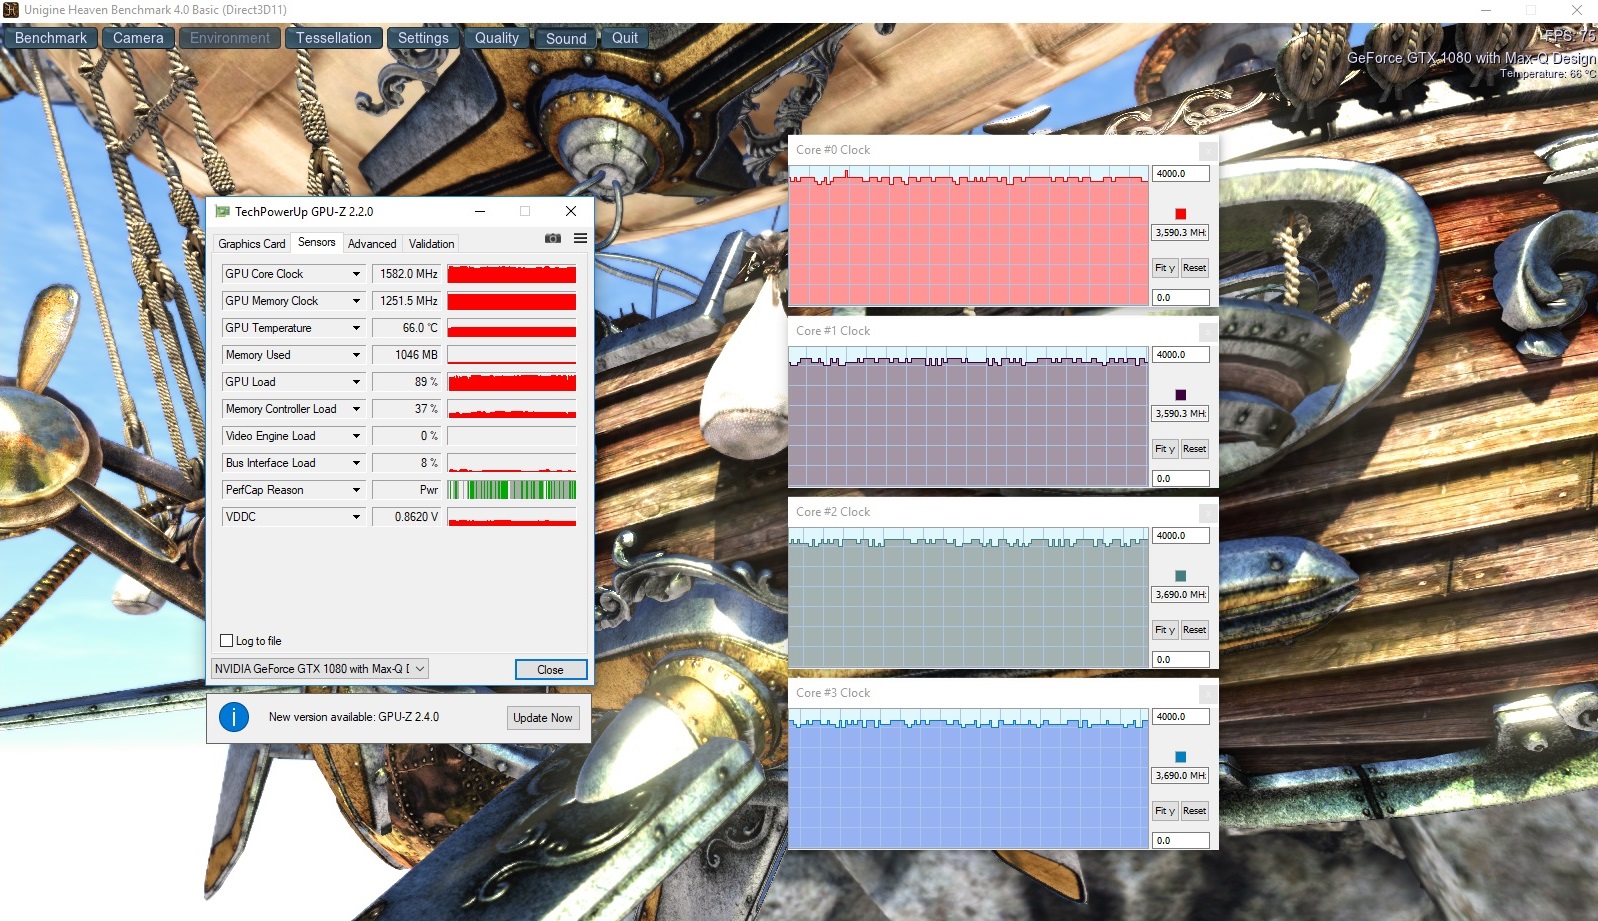
The Alienware 15 R3 is equipped with Nvidia's GeForce-GTX-1080-Max-Q GPU. This is a trimmed down version of the normal GTX 1080, which should be more efficient and is designed for slim and light notebooks. As a result, the Max-Q version has slightly less processing power. The model in our test unit has a base frequency of 1290 MHz. This can be increased to up to 1709 MHz via the turbo, although this clock rate cannot be kept up for long. We measured an average working speed of 1580 MHz. The GPU can access 8192 MB of GDDR5X memory. The integrated Intel HD Graphics 630 is not turned off and can be seen in the Device Manager. But the device does not support graphics switching (Optimus) and therefore the integrated GPU cannot be used.
| 3DMark 06 Standard Score | 31555 points | |
| 3DMark 11 Performance | 17829 points | |
| 3DMark Ice Storm Standard Score | 134673 points | |
| 3DMark Cloud Gate Standard Score | 28375 points | |
| 3DMark Fire Strike Score | 14631 points | |
| 3DMark Fire Strike Extreme Score | 7998 points | |
| 3DMark Time Spy Score | 5793 points | |
Help | ||
| 3DMark 11 - 1280x720 Performance GPU | |
| Guru Mars K | |
| MSI GT75VR 7RF-012 Titan Pro | |
| Alienware 15 R3 Max-Q | |
| Acer Predator Triton 700 | |
| Alienware 15 R3 | |
| Aorus X5 v7 | |
| Eurocom Q5 | |
| 3DMark - 1920x1080 Fire Strike Graphics | |
| Guru Mars K | |
| MSI GT75VR 7RF-012 Titan Pro | |
| Alienware 15 R3 Max-Q | |
| Acer Predator Triton 700 | |
| Alienware 15 R3 | |
| Aorus X5 v7 | |
| Eurocom Q5 | |
Gaming Performance
The CPU-GPU combination can display all the games in our database smoothly in Full HD resolution and maximum quality settings. If you choose a resolution of above FHD, some games might have difficulties keeping up - but this would require connecting an external screen anyway.
We run the game "The Witcher 3" for 60 minutes at 1920x1080 pixels and maximum settings in order to check whether the frame rates remain constant over a prolonged period of time. The character does not move around at all during the entire period of testing. In our case, the frame rates sunk from 62 to 65 FPS at first to 57 to 60 FPS. This is not really a drop in performance.
The frame rates are on par with those of the comparison devices. Notebooks that are equipped with a "normal" GTX 1080 GPU offer up to 20% higher frame rates. The exact values vary from game to game, as you can see if you take a look at our comparison table.
| The Witcher 3 - 1920x1080 Ultra Graphics & Postprocessing (HBAO+) | |
| MSI GT75VR 7RF-012 Titan Pro | |
| Guru Mars K | |
| Razer Blade Pro 2017 | |
| Alienware 15 R3 Max-Q | |
| Acer Predator Triton 700 | |
| Aorus X5 v7 | |
| Eurocom Q5 | |
| Prey - 1920x1080 Very High Preset AA:2TX SM AF:16x | |
| Alienware 15 R3 Max-Q | |
| Guru Mars K | |
| Eurocom Q5 | |
| MSI GT75VR 7RF-012 Titan Pro | |
| Acer Predator Triton 700 | |
| Razer Blade Pro 2017 | |
| BioShock Infinite - 1920x1080 Ultra Preset, DX11 (DDOF) | |
| Alienware 15 R3 Max-Q | |
| Eurocom Q5 | |
| Ghost Recon Wildlands - 1920x1080 Ultra Preset AA:T AF:16x | |
| Guru Mars K | |
| MSI GT75VR 7RF-012 Titan Pro | |
| Razer Blade Pro 2017 | |
| Alienware 15 R3 Max-Q | |
| Acer Predator Triton 700 | |
| low | med. | high | ultra | |
|---|---|---|---|---|
| Tomb Raider (2013) | 486.5 | 461.9 | 419.2 | 230.4 |
| BioShock Infinite (2013) | 272.3 | 243.6 | 232 | 151.7 |
| The Witcher 3 (2015) | 278.6 | 201.6 | 122.4 | 64.2 |
| For Honor (2017) | 229.6 | 161.2 | 152.9 | 121.3 |
| Ghost Recon Wildlands (2017) | 131.7 | 101.4 | 94.9 | 54.6 |
| Prey (2017) | 141.7 | 142 | 139.8 | 140.8 |
| Middle-earth: Shadow of War (2017) | 146 | 132 | 111 | 88 |
| The Evil Within 2 (2017) | 90.1 | 66.6 | 64 | 62.6 |
Emissions
System Noise
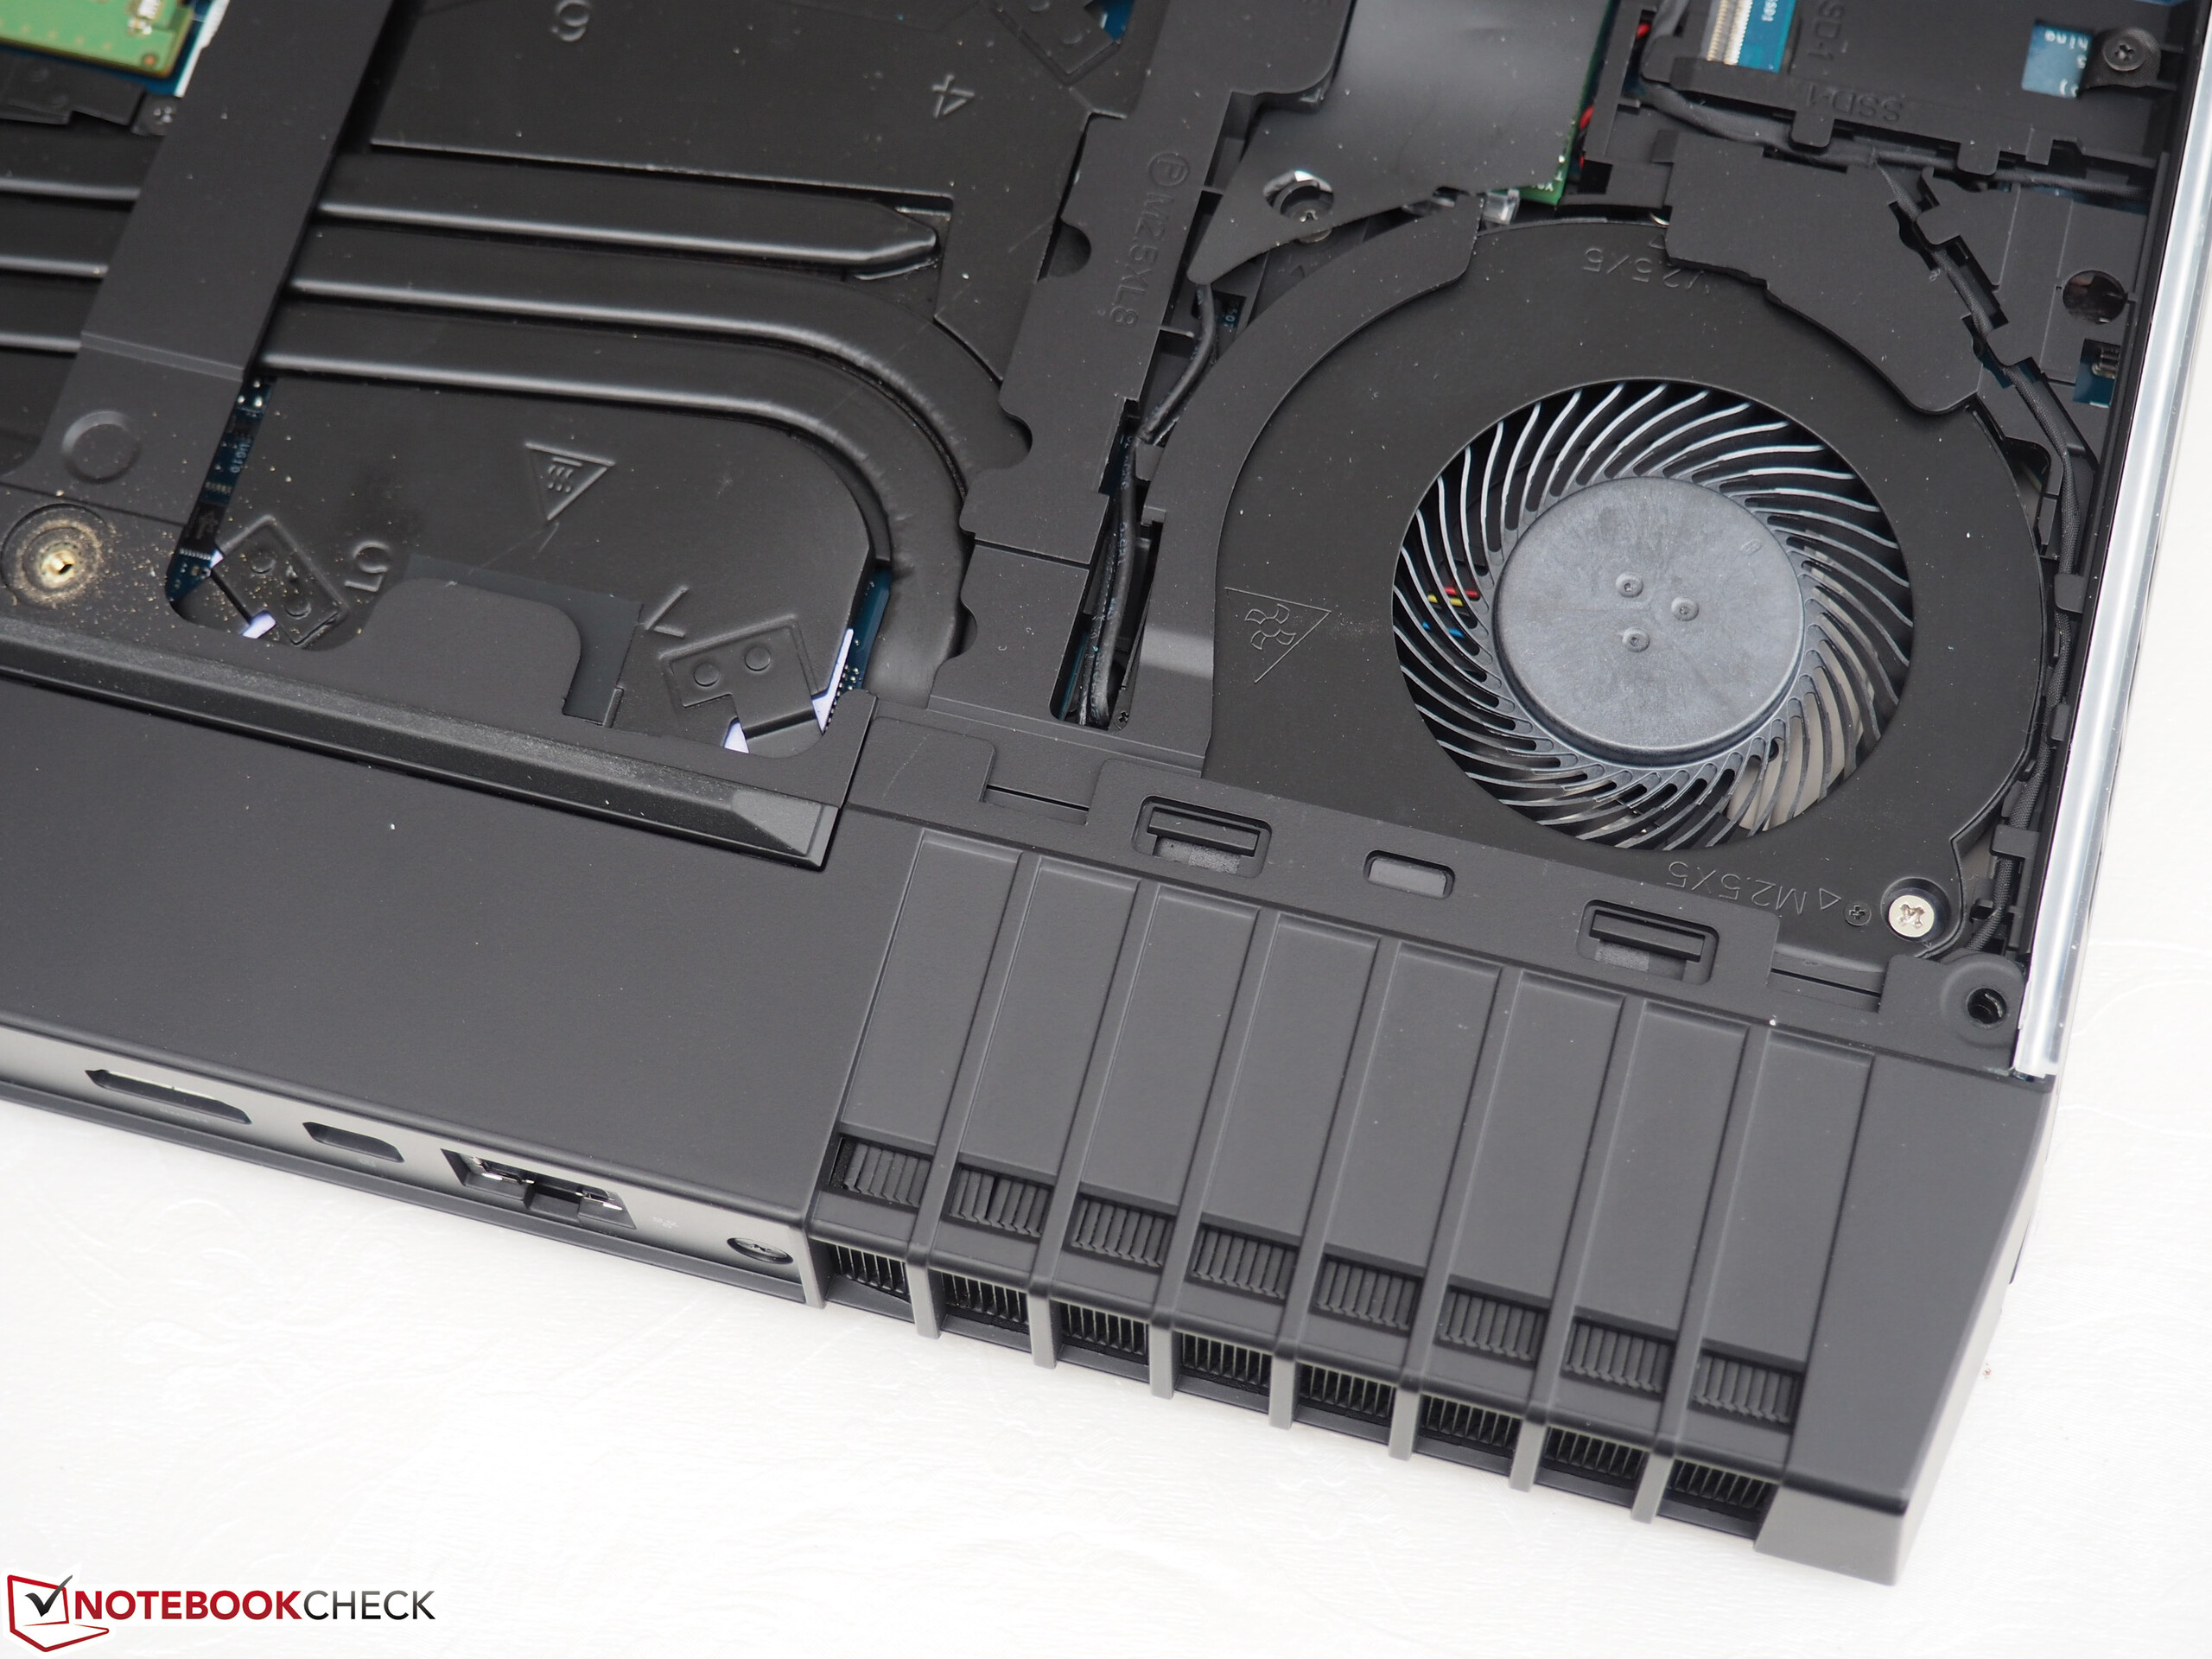
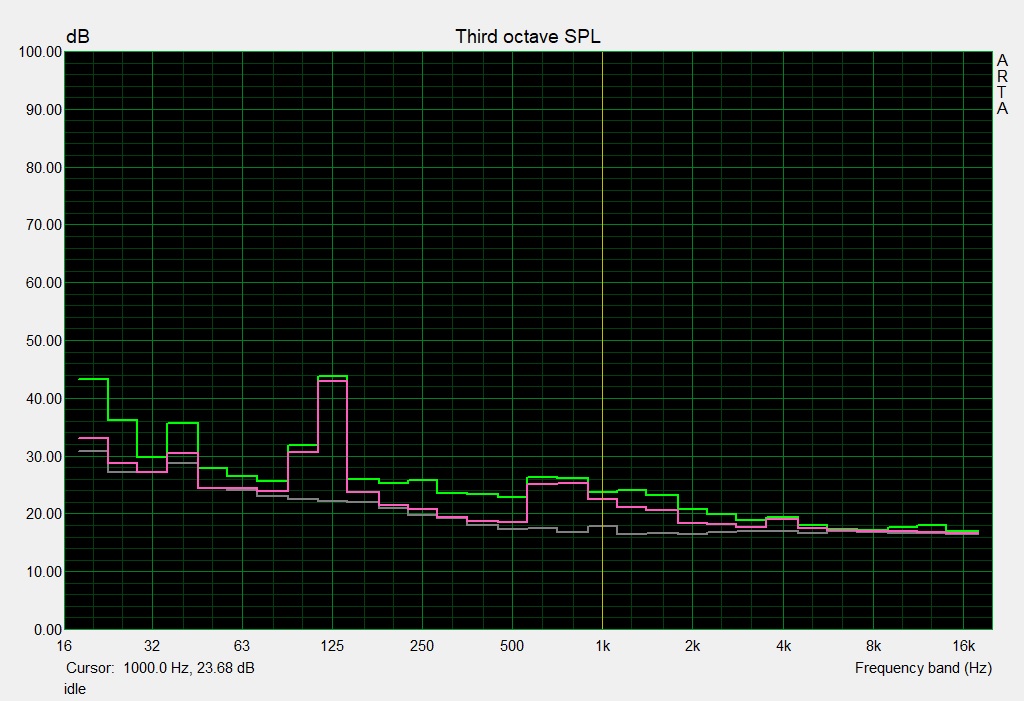
The notebook's cooling fans can sometimes stand still while idling, but usually they run at low speed. Normally, all you can hear is the noise from the 2.5-inch hard drive. The 15 R3 model that we have tested recently was very annoying as its cooling fans kept turning up while idling. This is a lot better in our current test unit, and the problem hardly ever occurred during our testing period.
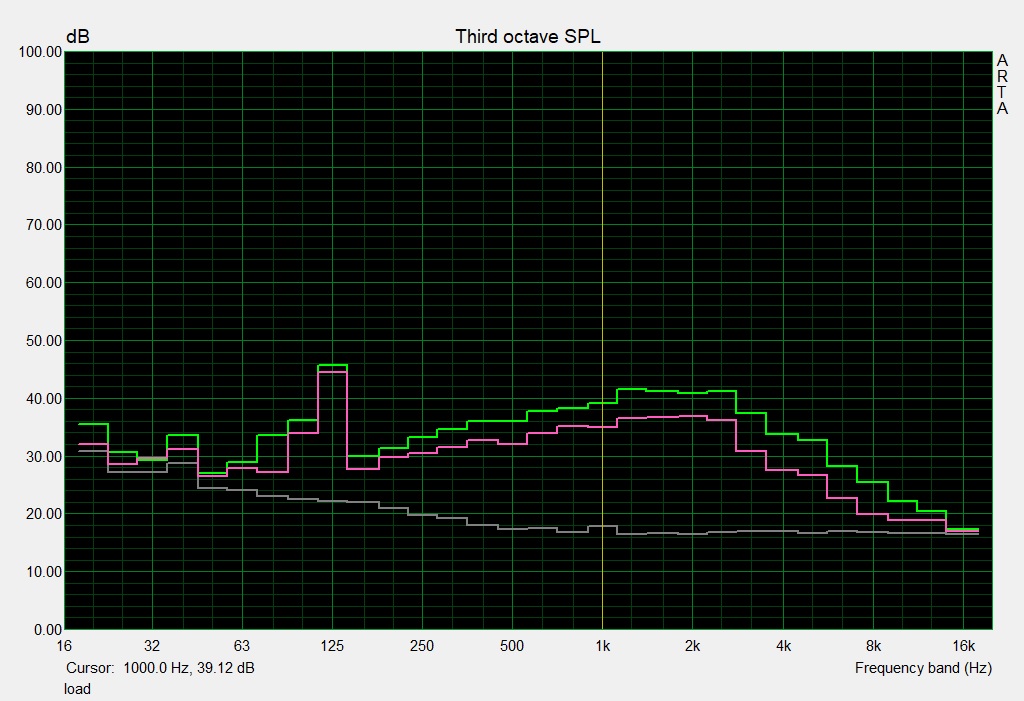
Naturally, the cooling fans turn up under load. We measured 50 dB(A) during our stress test. The fans are a little quieter while gaming: between 42 and 50 dB(A) (average:46 dB(A)). If you look at the CPU and GPU temperatures, the results are lower than necessary. In other words: the cooling fans could run at lower speeds and would still offer sufficient cooling. This could be readjusted in a BIOS update.
We did not hear any additional noises such as whining or whistling from inside the test unit.
Noise level
| Idle |
| 32 / 33 / 35 dB(A) |
| HDD |
| 33 dB(A) |
| Load |
| 46 / 50 dB(A) |
 | ||
30 dB silent 40 dB(A) audible 50 dB(A) loud |
||
min: | ||
| Alienware 15 R3 Max-Q i7-7820HK, GeForce GTX 1080 Max-Q | Acer Predator Triton 700 i7-7700HQ, GeForce GTX 1080 Max-Q | Aorus X5 v7 i7-7820HK, GeForce GTX 1070 Mobile | Eurocom Q5 i7-7700HQ, GeForce GTX 1070 Max-Q | Alienware 15 R3 i7-7700HQ, GeForce GTX 1070 Mobile | Guru Mars K i7-7700, GeForce GTX 1080 Mobile | MSI GT75VR 7RF-012 Titan Pro i7-7820HK, GeForce GTX 1080 Mobile | |
|---|---|---|---|---|---|---|---|
| Noise | -0% | -6% | 2% | -4% | -7% | -8% | |
| off / environment * (dB) | 29 | 31 -7% | 30 -3% | 29 -0% | 30 -3% | 29 -0% | 30 -3% |
| Idle Minimum * (dB) | 32 | 33 -3% | 35 -9% | 31.5 2% | 31 3% | 36 -13% | 33 -3% |
| Idle Average * (dB) | 33 | 34 -3% | 36 -9% | 33.8 -2% | 32 3% | 37 -12% | 34 -3% |
| Idle Maximum * (dB) | 35 | 40 -14% | 40 -14% | 33.8 3% | 42 -20% | 40 -14% | 38 -9% |
| Load Average * (dB) | 46 | 41 11% | 43 7% | 41.7 9% | 49 -7% | 45 2% | 44 4% |
| Witcher 3 ultra * (dB) | 48 | 43 10% | 49 -2% | 41.7 13% | 50 -4% | 56 -17% | |
| Load Maximum * (dB) | 50 | 48 4% | 55 -10% | 54.2 -8% | 50 -0% | 55 -10% | 62 -24% |
* ... smaller is better
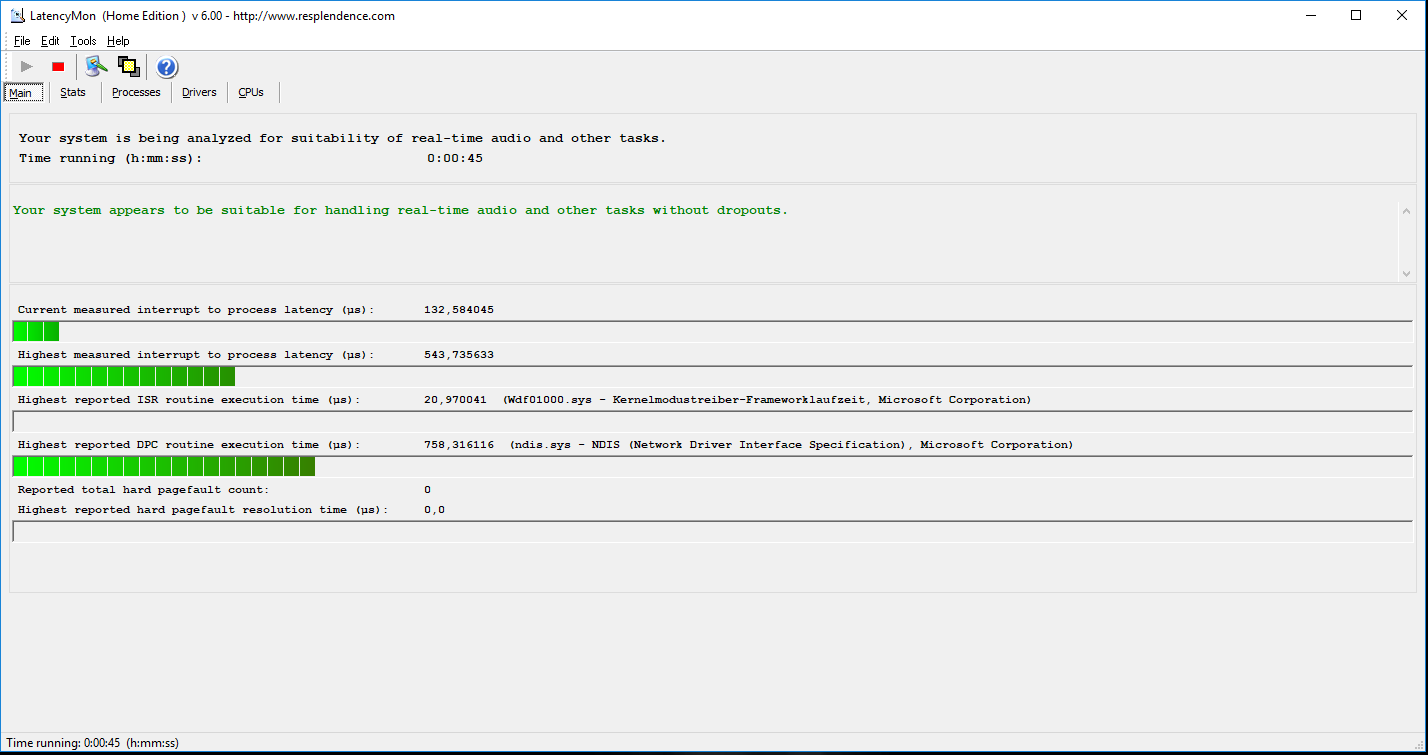
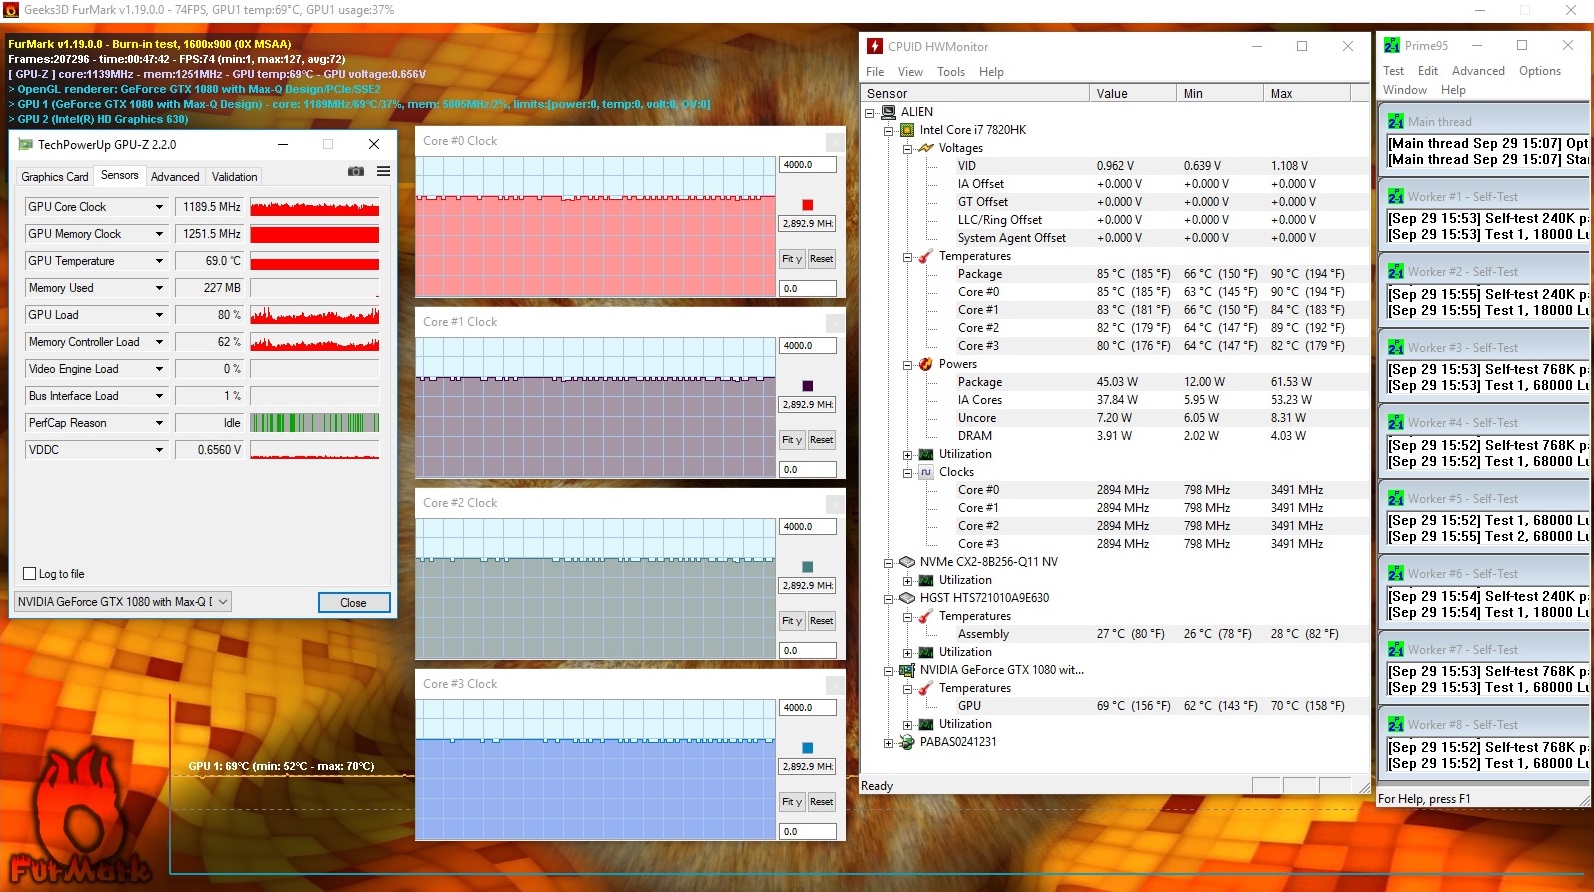
Temperature
The results of our stress test (Prime95 and FurMark running for at least one hour) were different depending on whether the device was running on power supply or on battery. When connected to power, the processor worked at 2.8 2.9 GHz. The speed of the GPU lay between 1000 and 1200 MHz. On battery, the Alienware 15 R3 is a lot more relaxed. The processor had a constant clock rate of 2.4 GHz, the GPU ran between 300 and 400 MHz.
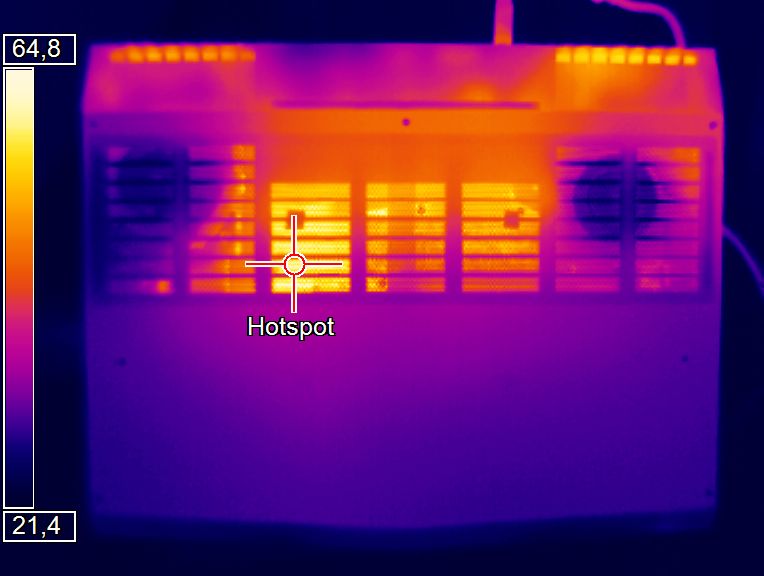
Considering the high-performing hardware that the device is equipped with, the heat development of the case is not too bad. During the stress test, we measured temperatures of over 50 °C (~122 °F) at several points. The device heated up a little less during the Witcher 3 test (the game runs for 1 hour at Full HD resolution and maximum quality settings).
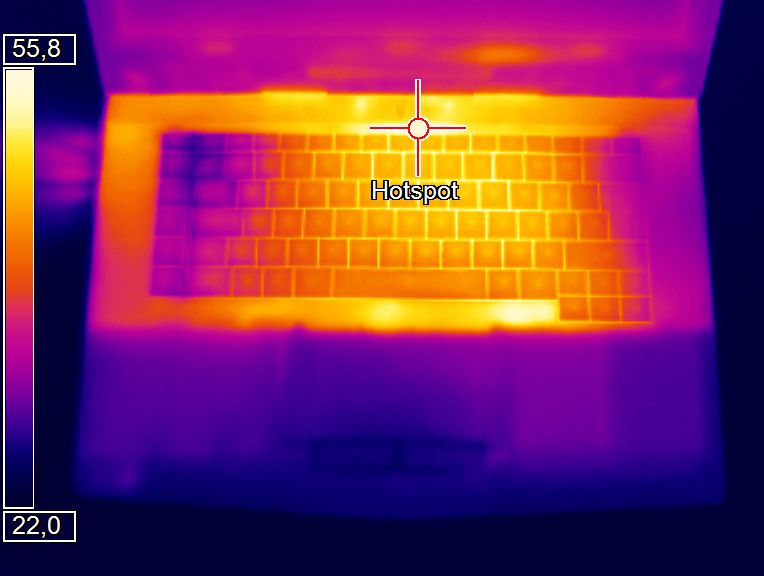
(-) The maximum temperature on the upper side is 47 °C / 117 F, compared to the average of 40.4 °C / 105 F, ranging from 21.2 to 68.8 °C for the class Gaming.
(-) The bottom heats up to a maximum of 55 °C / 131 F, compared to the average of 43.2 °C / 110 F
(+) In idle usage, the average temperature for the upper side is 31.7 °C / 89 F, compared to the device average of 33.9 °C / 93 F.
(-) Playing The Witcher 3, the average temperature for the upper side is 38.2 °C / 101 F, compared to the device average of 33.9 °C / 93 F.
(+) The palmrests and touchpad are cooler than skin temperature with a maximum of 27 °C / 80.6 F and are therefore cool to the touch.
(±) The average temperature of the palmrest area of similar devices was 28.8 °C / 83.8 F (+1.8 °C / 3.2 F).
| Alienware 15 R3 Max-Q i7-7820HK, GeForce GTX 1080 Max-Q | Acer Predator Triton 700 i7-7700HQ, GeForce GTX 1080 Max-Q | Aorus X5 v7 i7-7820HK, GeForce GTX 1070 Mobile | Eurocom Q5 i7-7700HQ, GeForce GTX 1070 Max-Q | Alienware 15 R3 i7-7700HQ, GeForce GTX 1070 Mobile | Guru Mars K i7-7700, GeForce GTX 1080 Mobile | MSI GT75VR 7RF-012 Titan Pro i7-7820HK, GeForce GTX 1080 Mobile | |
|---|---|---|---|---|---|---|---|
| Heat | -5% | 1% | 4% | 2% | 12% | 3% | |
| Maximum Upper Side * (°C) | 47 | 61 -30% | 64 -36% | 56.2 -20% | 46 2% | 46 2% | 46 2% |
| Maximum Bottom * (°C) | 55 | 69 -25% | 56 -2% | 61.2 -11% | 51.8 6% | 46 16% | 57 -4% |
| Idle Upper Side * (°C) | 36 | 29 19% | 29 19% | 27.8 23% | 36.5 -1% | 32 11% | 34 6% |
| Idle Bottom * (°C) | 38 | 32 16% | 30 21% | 29.6 22% | 38.2 -1% | 31 18% | 35 8% |
* ... smaller is better
Speakers
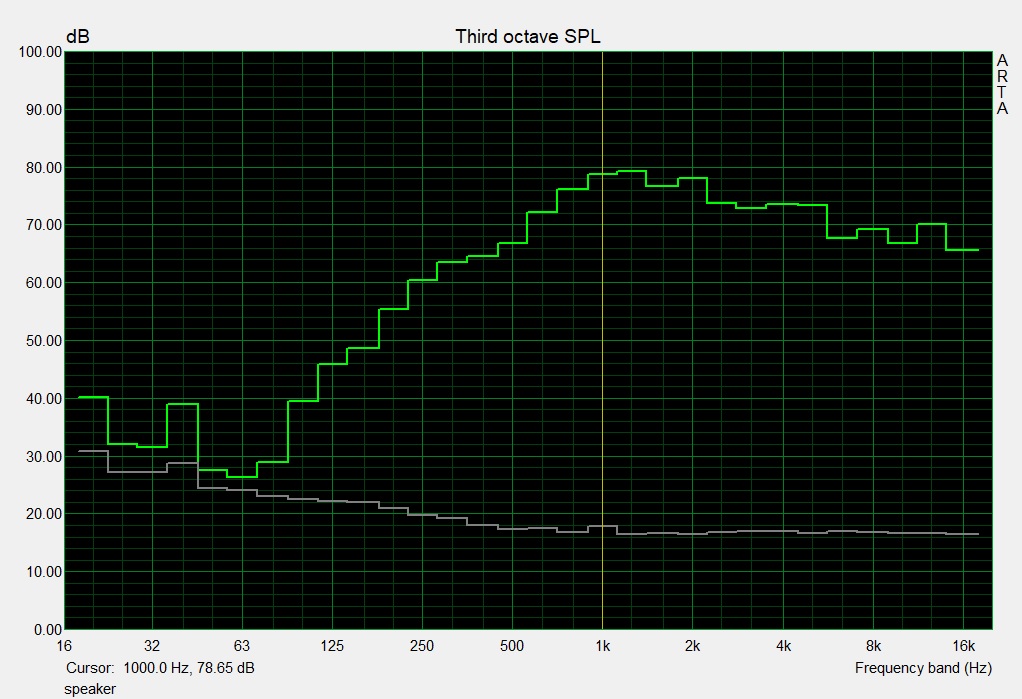
Alienware 15 R3 Max-Q audio analysis
(+) | speakers can play relatively loud (87 dB)
Bass 100 - 315 Hz
(-) | nearly no bass - on average 17.1% lower than median
(±) | linearity of bass is average (11% delta to prev. frequency)
Mids 400 - 2000 Hz
(±) | higher mids - on average 6.6% higher than median
(+) | mids are linear (4.7% delta to prev. frequency)
Highs 2 - 16 kHz
(+) | balanced highs - only 3% away from median
(+) | highs are linear (4.3% delta to prev. frequency)
Overall 100 - 16.000 Hz
(±) | linearity of overall sound is average (15.2% difference to median)
Compared to same class
» 33% of all tested devices in this class were better, 6% similar, 61% worse
» The best had a delta of 6%, average was 18%, worst was 132%
Compared to all devices tested
» 21% of all tested devices were better, 4% similar, 74% worse
» The best had a delta of 4%, average was 24%, worst was 134%
Aorus X5 v7 audio analysis
(±) | speaker loudness is average but good (78 dB)
Bass 100 - 315 Hz
(-) | nearly no bass - on average 19% lower than median
(±) | linearity of bass is average (10.6% delta to prev. frequency)
Mids 400 - 2000 Hz
(+) | balanced mids - only 4.2% away from median
(+) | mids are linear (5.8% delta to prev. frequency)
Highs 2 - 16 kHz
(+) | balanced highs - only 2.1% away from median
(+) | highs are linear (5.4% delta to prev. frequency)
Overall 100 - 16.000 Hz
(±) | linearity of overall sound is average (18.7% difference to median)
Compared to same class
» 61% of all tested devices in this class were better, 8% similar, 31% worse
» The best had a delta of 6%, average was 18%, worst was 132%
Compared to all devices tested
» 43% of all tested devices were better, 8% similar, 50% worse
» The best had a delta of 4%, average was 24%, worst was 134%
Frequency diagram in comparison (checkboxes can be turned on/off!)
Energy Management
Power Consumption
There were no anomalies in the device's power consumption. For a notebook with deactivated graphics switching solution, it has average consumption rates while idling. Consumption increased to 215 watts during our stress test, but the 240-watt power supply is large enough for this device. Power consumption is lower while gaming and the notebook required 159 watts during our Witcher 3 test.
A look at the comparison table confirms the difference between the power consumption of GTX 1080 Max-Q notebooks and notebooks that are equipped with the "normal" GTX 1080 GPU. While the normal GTX 1080 GPUs can offer up to 20% higher frame rates, its power consumption is 40% higher.
| Off / Standby | |
| Idle | |
| Load |
|
Key:
min: | |
| Alienware 15 R3 Max-Q i7-7820HK, GeForce GTX 1080 Max-Q | Acer Predator Triton 700 i7-7700HQ, GeForce GTX 1080 Max-Q | Aorus X5 v7 i7-7820HK, GeForce GTX 1070 Mobile | Eurocom Q5 i7-7700HQ, GeForce GTX 1070 Max-Q | Alienware 15 R3 i7-7700HQ, GeForce GTX 1070 Mobile | Guru Mars K i7-7700, GeForce GTX 1080 Mobile | MSI GT75VR 7RF-012 Titan Pro i7-7820HK, GeForce GTX 1080 Mobile | |
|---|---|---|---|---|---|---|---|
| Power Consumption | -15% | -13% | 35% | 10% | -43% | -50% | |
| Idle Minimum * (Watt) | 22 | 28 -27% | 26 -18% | 9 59% | 19 14% | 31 -41% | 34 -55% |
| Idle Average * (Watt) | 26 | 33 -27% | 31 -19% | 13.5 48% | 23 12% | 37 -42% | 41 -58% |
| Idle Maximum * (Watt) | 33 | 41 -24% | 36 -9% | 13.7 58% | 29 12% | 44 -33% | 50 -52% |
| Load Average * (Watt) | 86 | 94 -9% | 93 -8% | 87.8 -2% | 85 1% | 116 -35% | 106 -23% |
| Witcher 3 ultra * (Watt) | 159 | 160 -1% | 176 -11% | 129 19% | 259 -63% | 257 -62% | |
| Load Maximum * (Watt) | 215 | 222 -3% | 240 -12% | 158.6 26% | 192 11% | 312 -45% | 320 -49% |
* ... smaller is better
Battery Runtime
Despite having higher processing power and the same battery size, our current device appears to have more stamina than the model that we have already tested.
The Alienware 15 R3 ran for 5:21h during our practical Wi-Fi test. For this, we simulated the load of accessing websites using a script with the power profile set to "balanced", energy saving turned off and screen brightness set to 150 cd/m². The 15.6-inch device ran our video test for 5:01h. For this, we run the short film Big Buck Bunny (H.264 coding, 1920x1080pixels) in a loop. The communication module and energy-saving mode are turned off and display brightness set to 150 cd/m².
| Alienware 15 R3 Max-Q i7-7820HK, GeForce GTX 1080 Max-Q, 99 Wh | Alienware 15 R3 i7-7700HQ, GeForce GTX 1070 Mobile, 99 Wh | Acer Predator Triton 700 i7-7700HQ, GeForce GTX 1080 Max-Q, 54 Wh | Aorus X5 v7 i7-7820HK, GeForce GTX 1070 Mobile, 94 Wh | Eurocom Q5 i7-7700HQ, GeForce GTX 1070 Max-Q, 55 Wh | |
|---|---|---|---|---|---|
| Battery runtime | -13% | -56% | -44% | -23% | |
| Reader / Idle (h) | 7.1 | 6.4 -10% | 2.5 -65% | 3.5 -51% | 7.8 10% |
| H.264 (h) | 5 | 4.4 -12% | 1.8 -64% | 2.7 -46% | |
| WiFi v1.3 (h) | 5.4 | 4.4 -19% | 2.4 -56% | 2.5 -54% | 4.3 -20% |
| Load (h) | 1.9 | 1.7 -11% | 1.2 -37% | 1.4 -26% | 0.8 -58% |
Verdict
Pros
Cons
The Alienware 15 R3 displays all current computer games smoothly on its matte FHD screen.
No compromises: Every game runs smoothly at the maximum quality settings.
Should the GPU become too weak someday, you can connect an external GPU via the Thunderbolt 3 port or Graphics Amplifier.
The NVMe SSD is fast as the wind and enables a smooth and fast-running system. The device is also equipped with a 1-TB hard drive. Both storage devices can be exchanged. The battery runtimes are very decent for a device with this level of performance.
The display also offers significant changes compared to the already-tested 15 R3 model. While the sister model is equipped with a 120-Hz TN panel, our current test unit offers a 60-Hz IPS panel. The matte 15.6-inch display has stable viewing angles, a good contrast ratio and sufficient brightness. Only the response time is higher than that of the TN panel.
The Alienware 15 R3 model that we have already tested had a big problem with temperatures and system noise, which was connected to the CPU heating up irregularly. This did not occur in our current test unit and the cores heated up evenly.
Alienware 15 R3 Max-Q
- 10/27/2017 v6 (old)
Sascha Mölck
Price comparison
