Eurocom Q5 (Clevo P957HR, i7-7700HQ, GTX 1070 Max-Q) Laptop Review
The Eurocom Q5 is one of the first Clevo notebooks designed with Max-Q graphics in mind. It, along with the Asus Zephyrus GX501, HP Omen 15, Alienware 15, and MSI GS63VR 7RG, are now all available with Max-Q options ranging from the GTX 1060 Max-Q up to the 1080 Max-Q depending on the model.
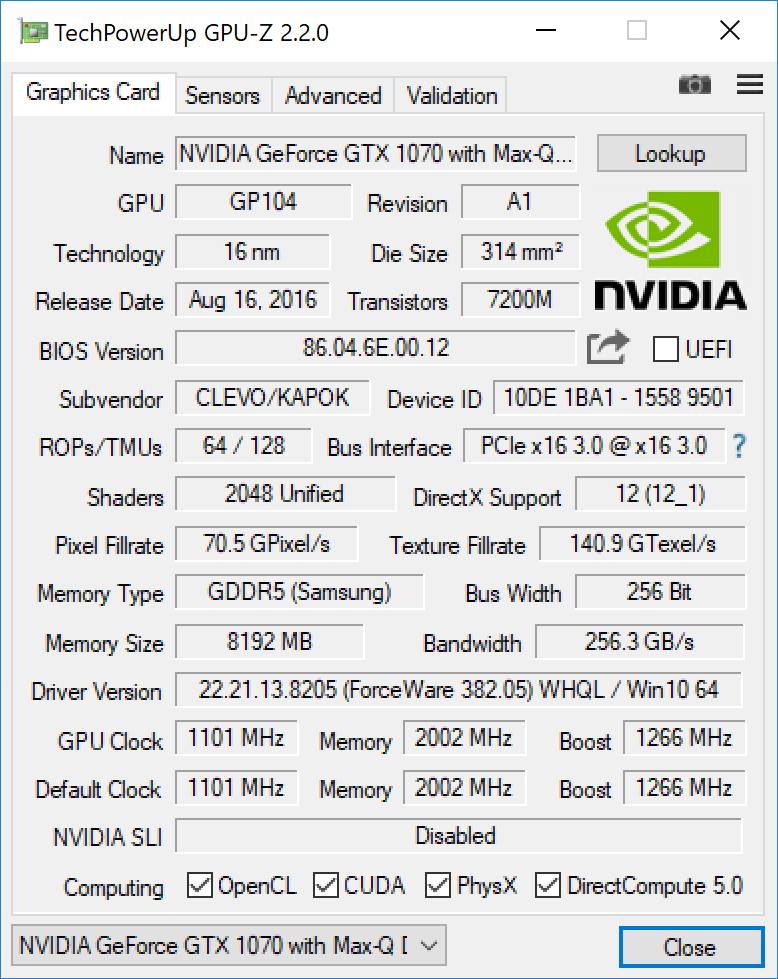
The Q5 (and the Clevo P957HR by extension) are currently fixed with the i7-7700HQ CPU and GTX 1070 Max-Q GPU for a starting price of about $1600 USD or 1400 Euros if shipping to Europe. In comparison, the GX501VS and GS63VR 7RG each retail for $2400 USD with the same CPU and GPU. Once configured with 16 GB of RAM, a 256 GB SSD, and a 5 ms/120 Hz 1080p display, the Q5 will still come in noticeably cheaper at around $2000 USD or even less if buyers qualify for Eurocom's 10 percent student discount. We'll analyze our specific 4K UHD configuration provided by the reseller to see how it stacks up against other currently available Max-Q notebooks in the market.
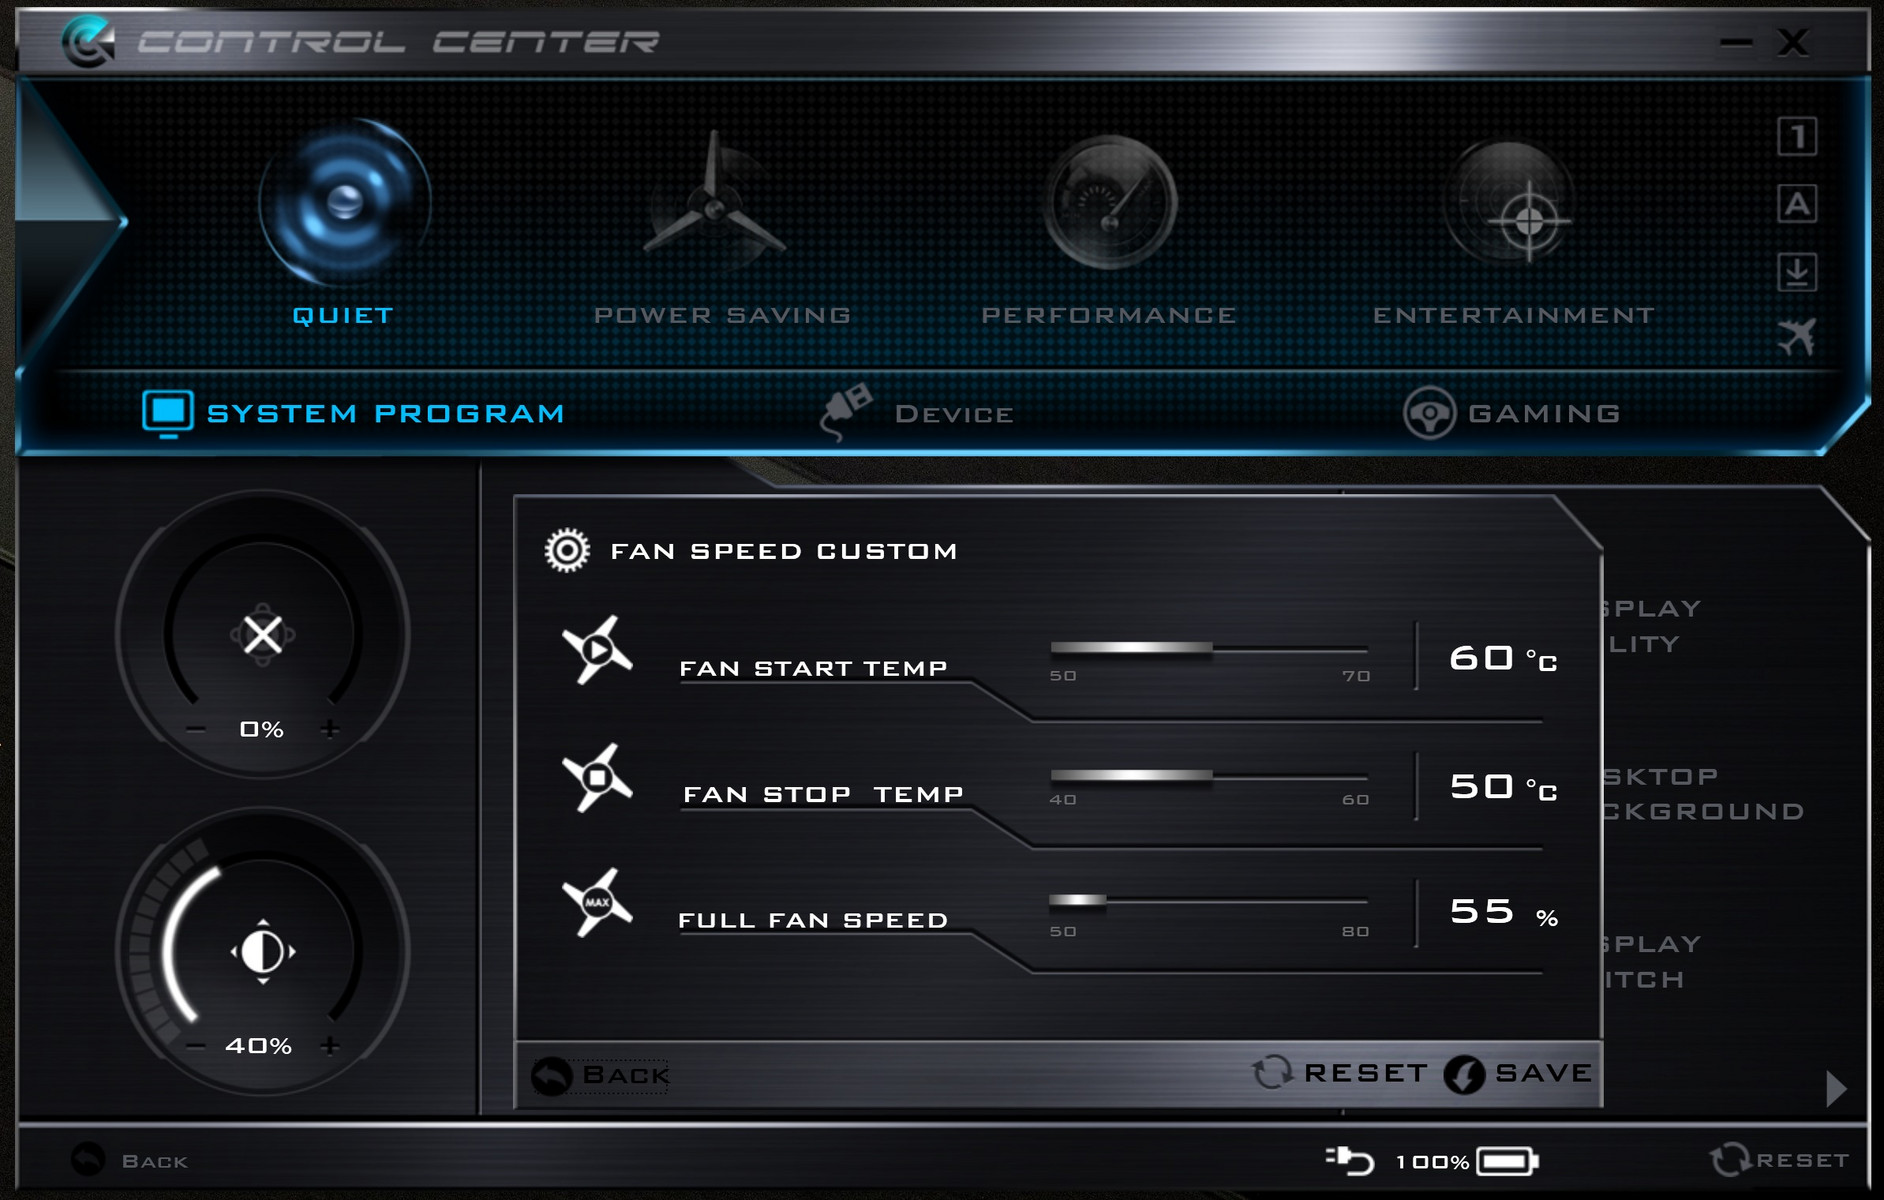
(September 6, 2017 Update: Eurocom will update the firmware for faster GPU performance whilst addressing fan noise concerns in the next few days. The 55 percent fan speed mode is expected to be the new Automatic default fan mode)
Case
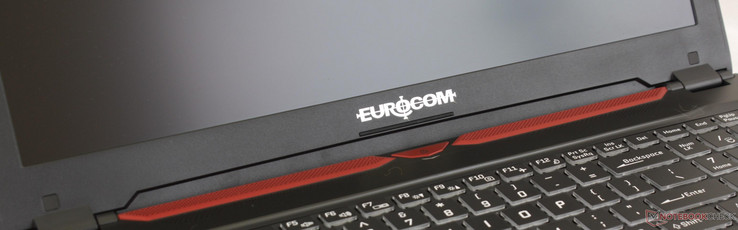
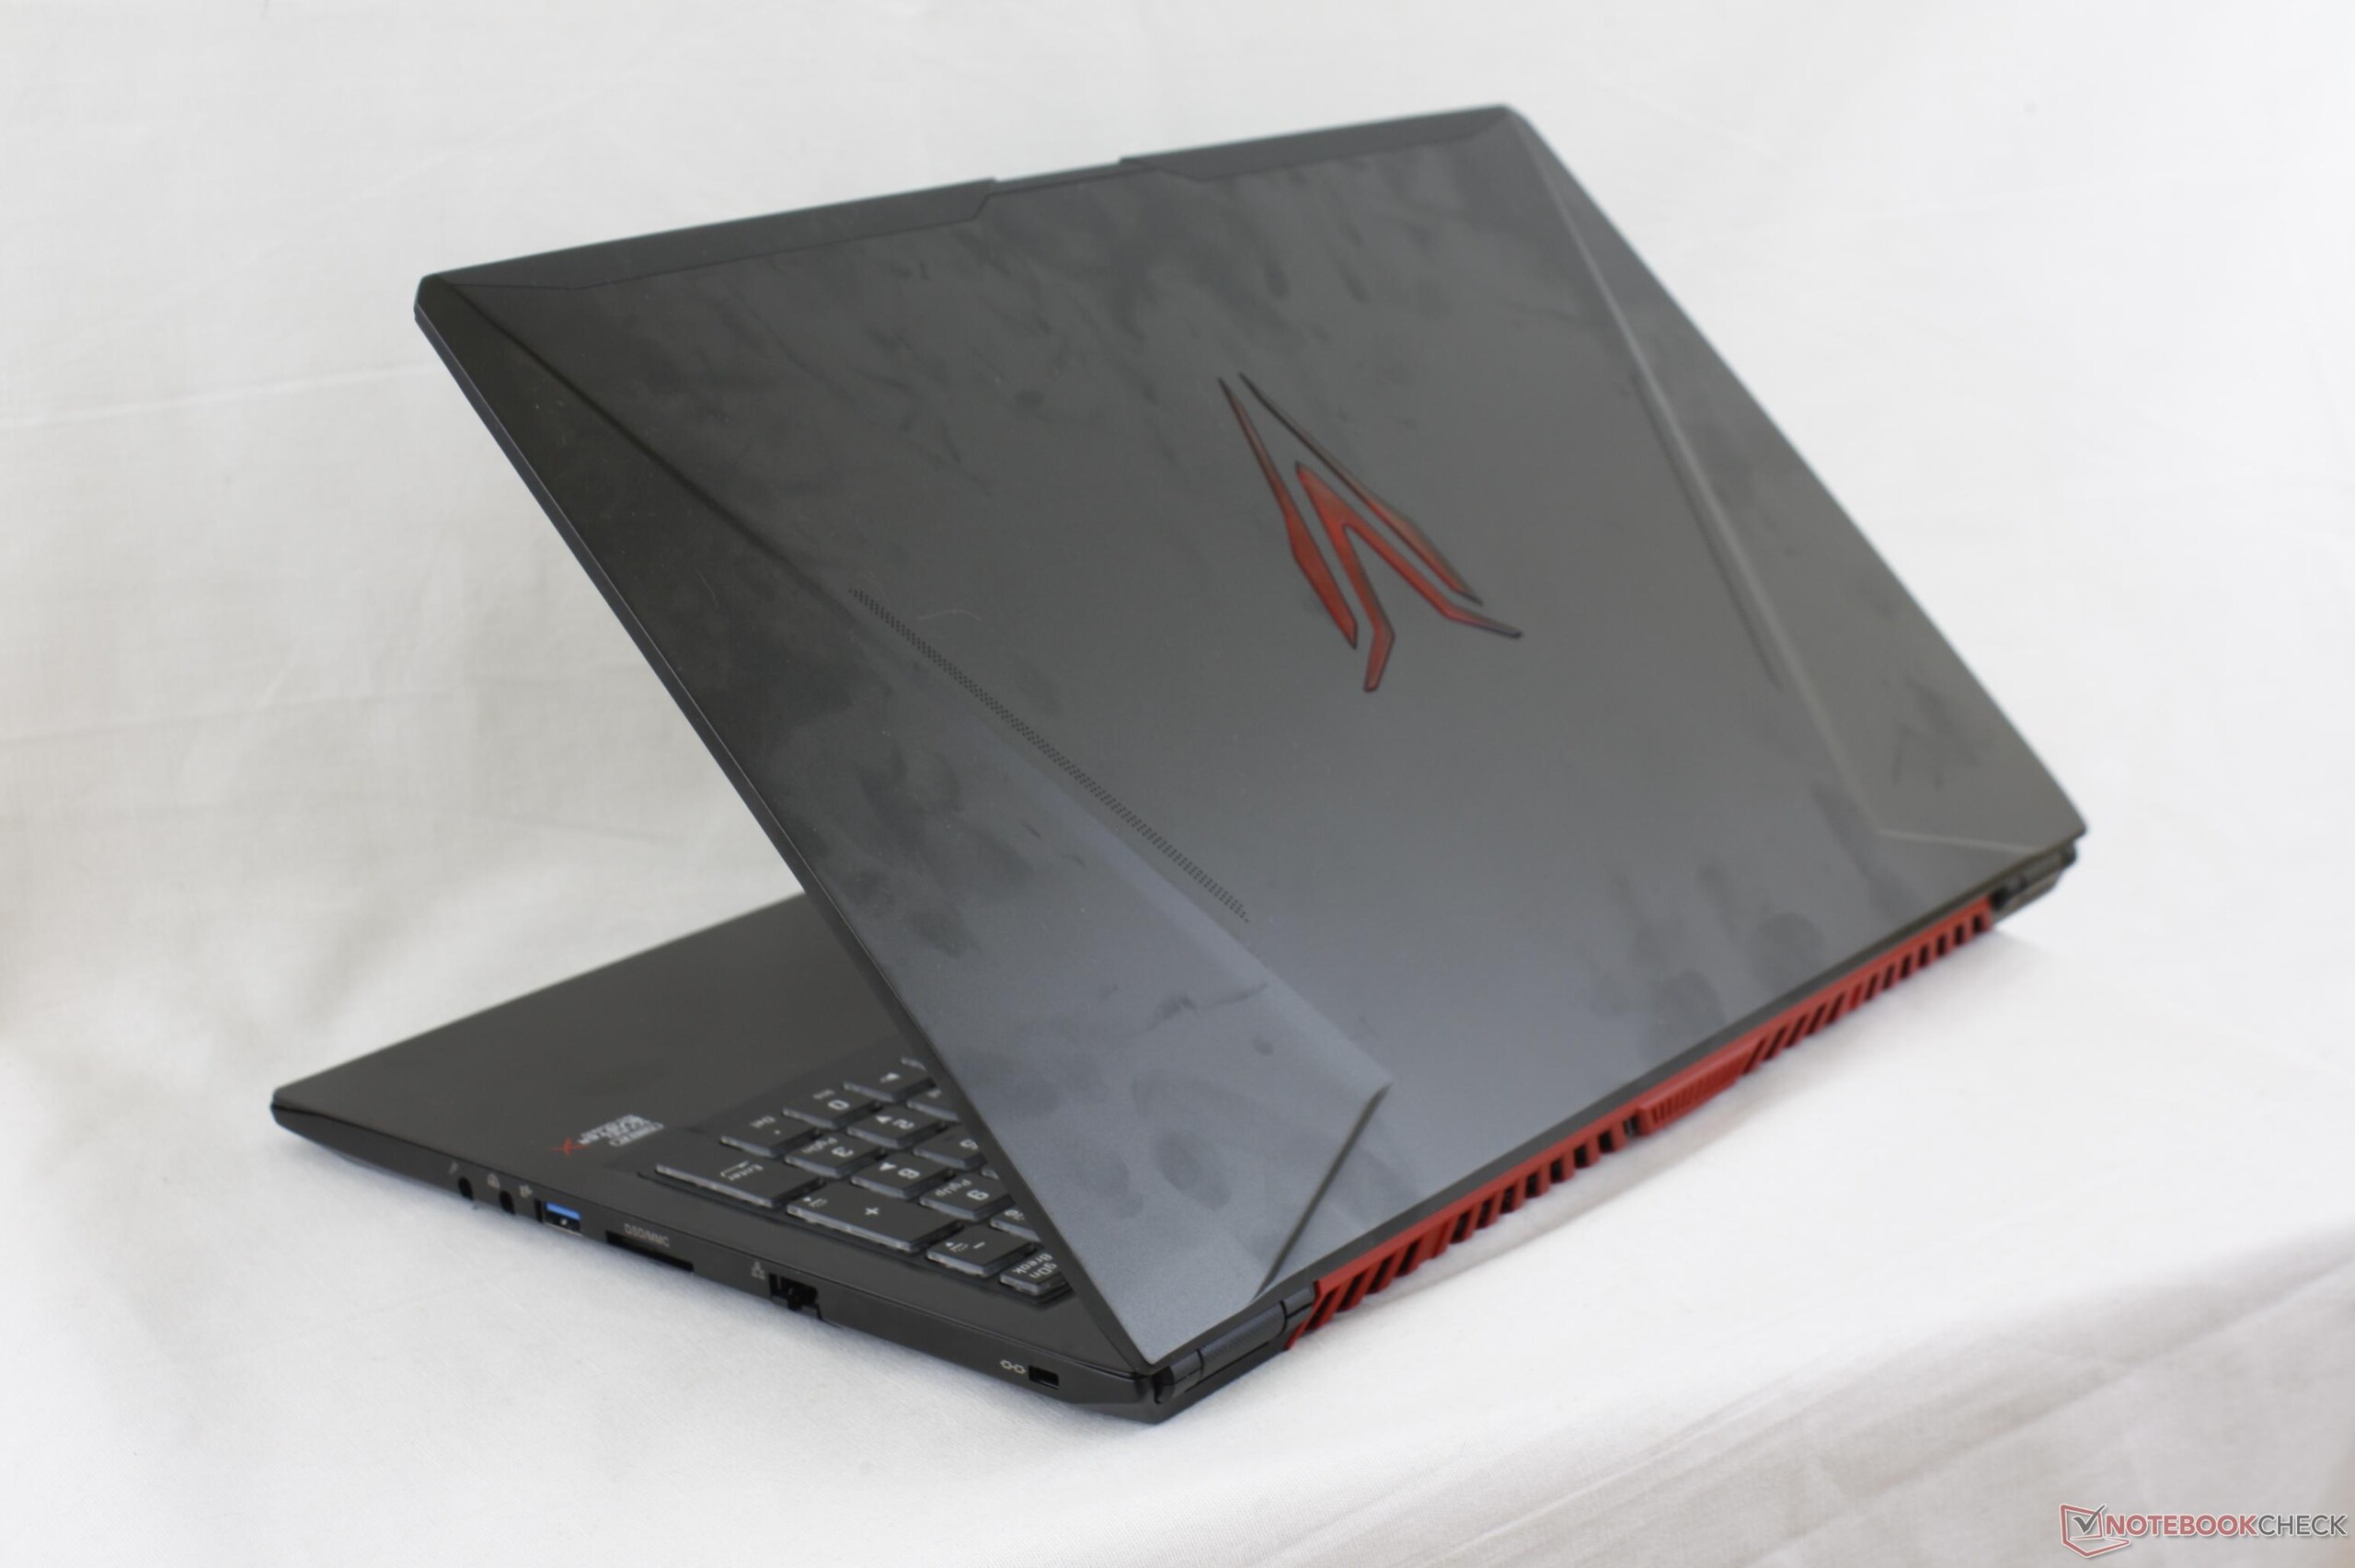
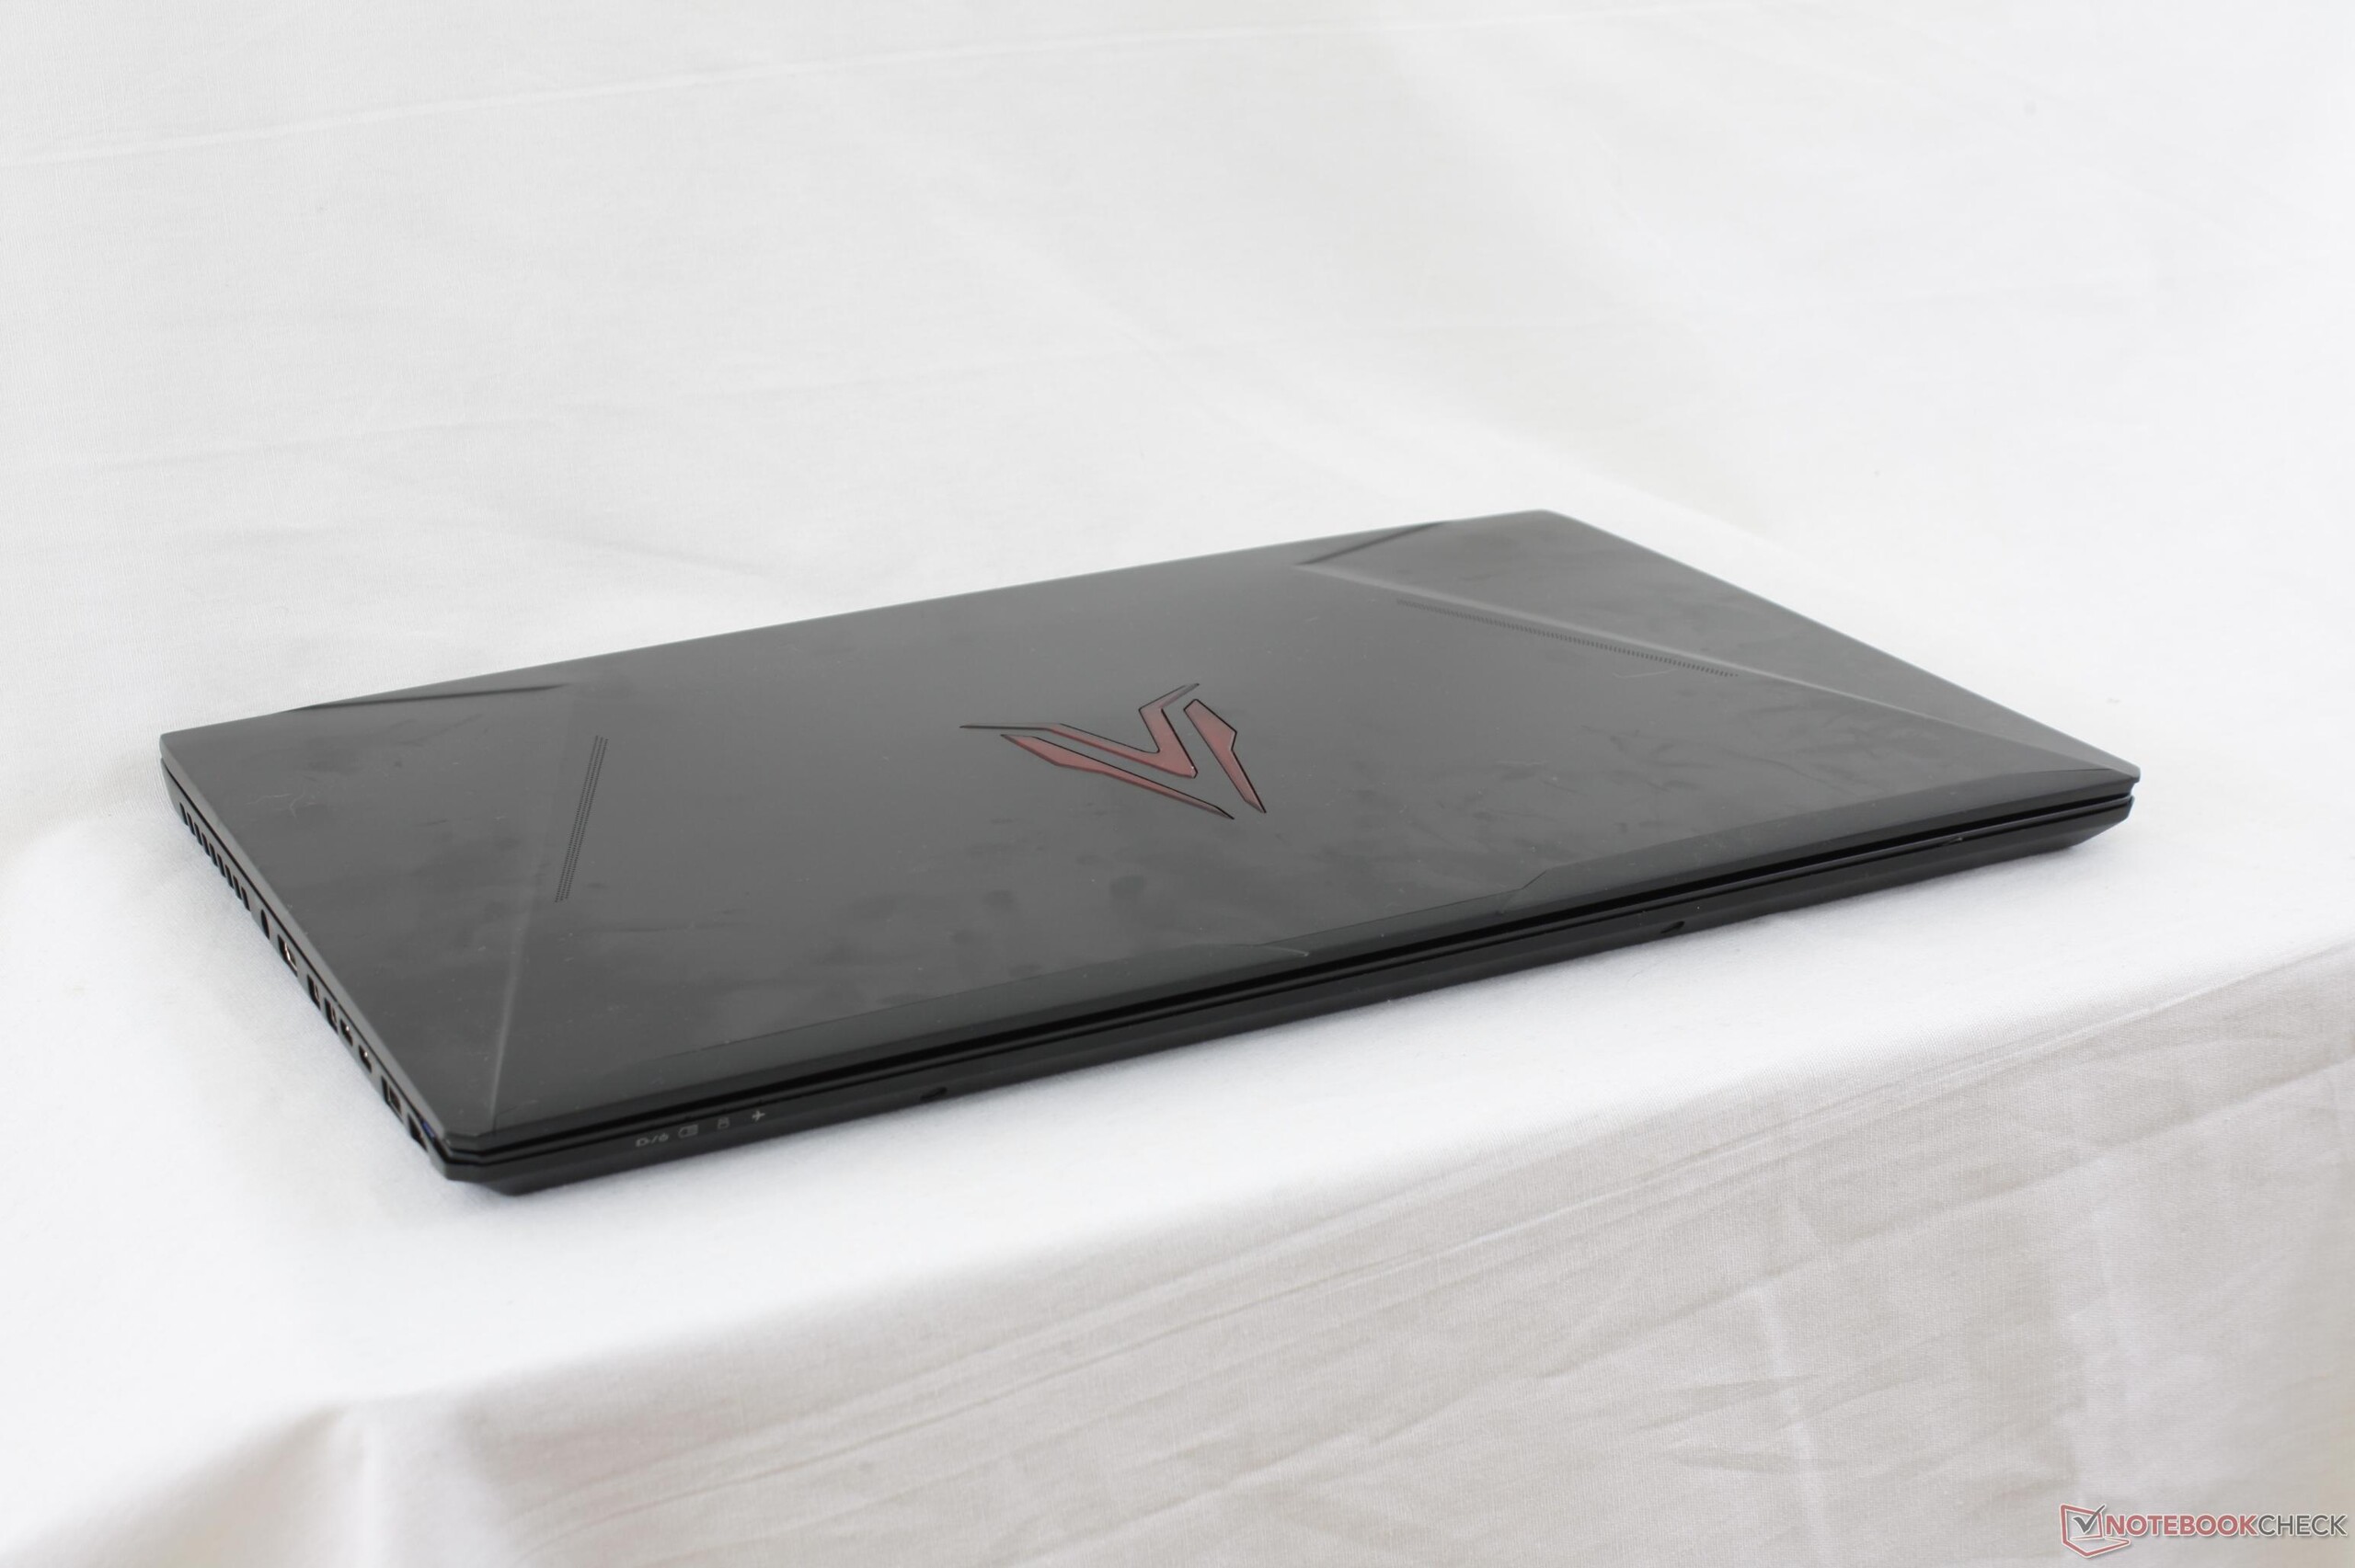
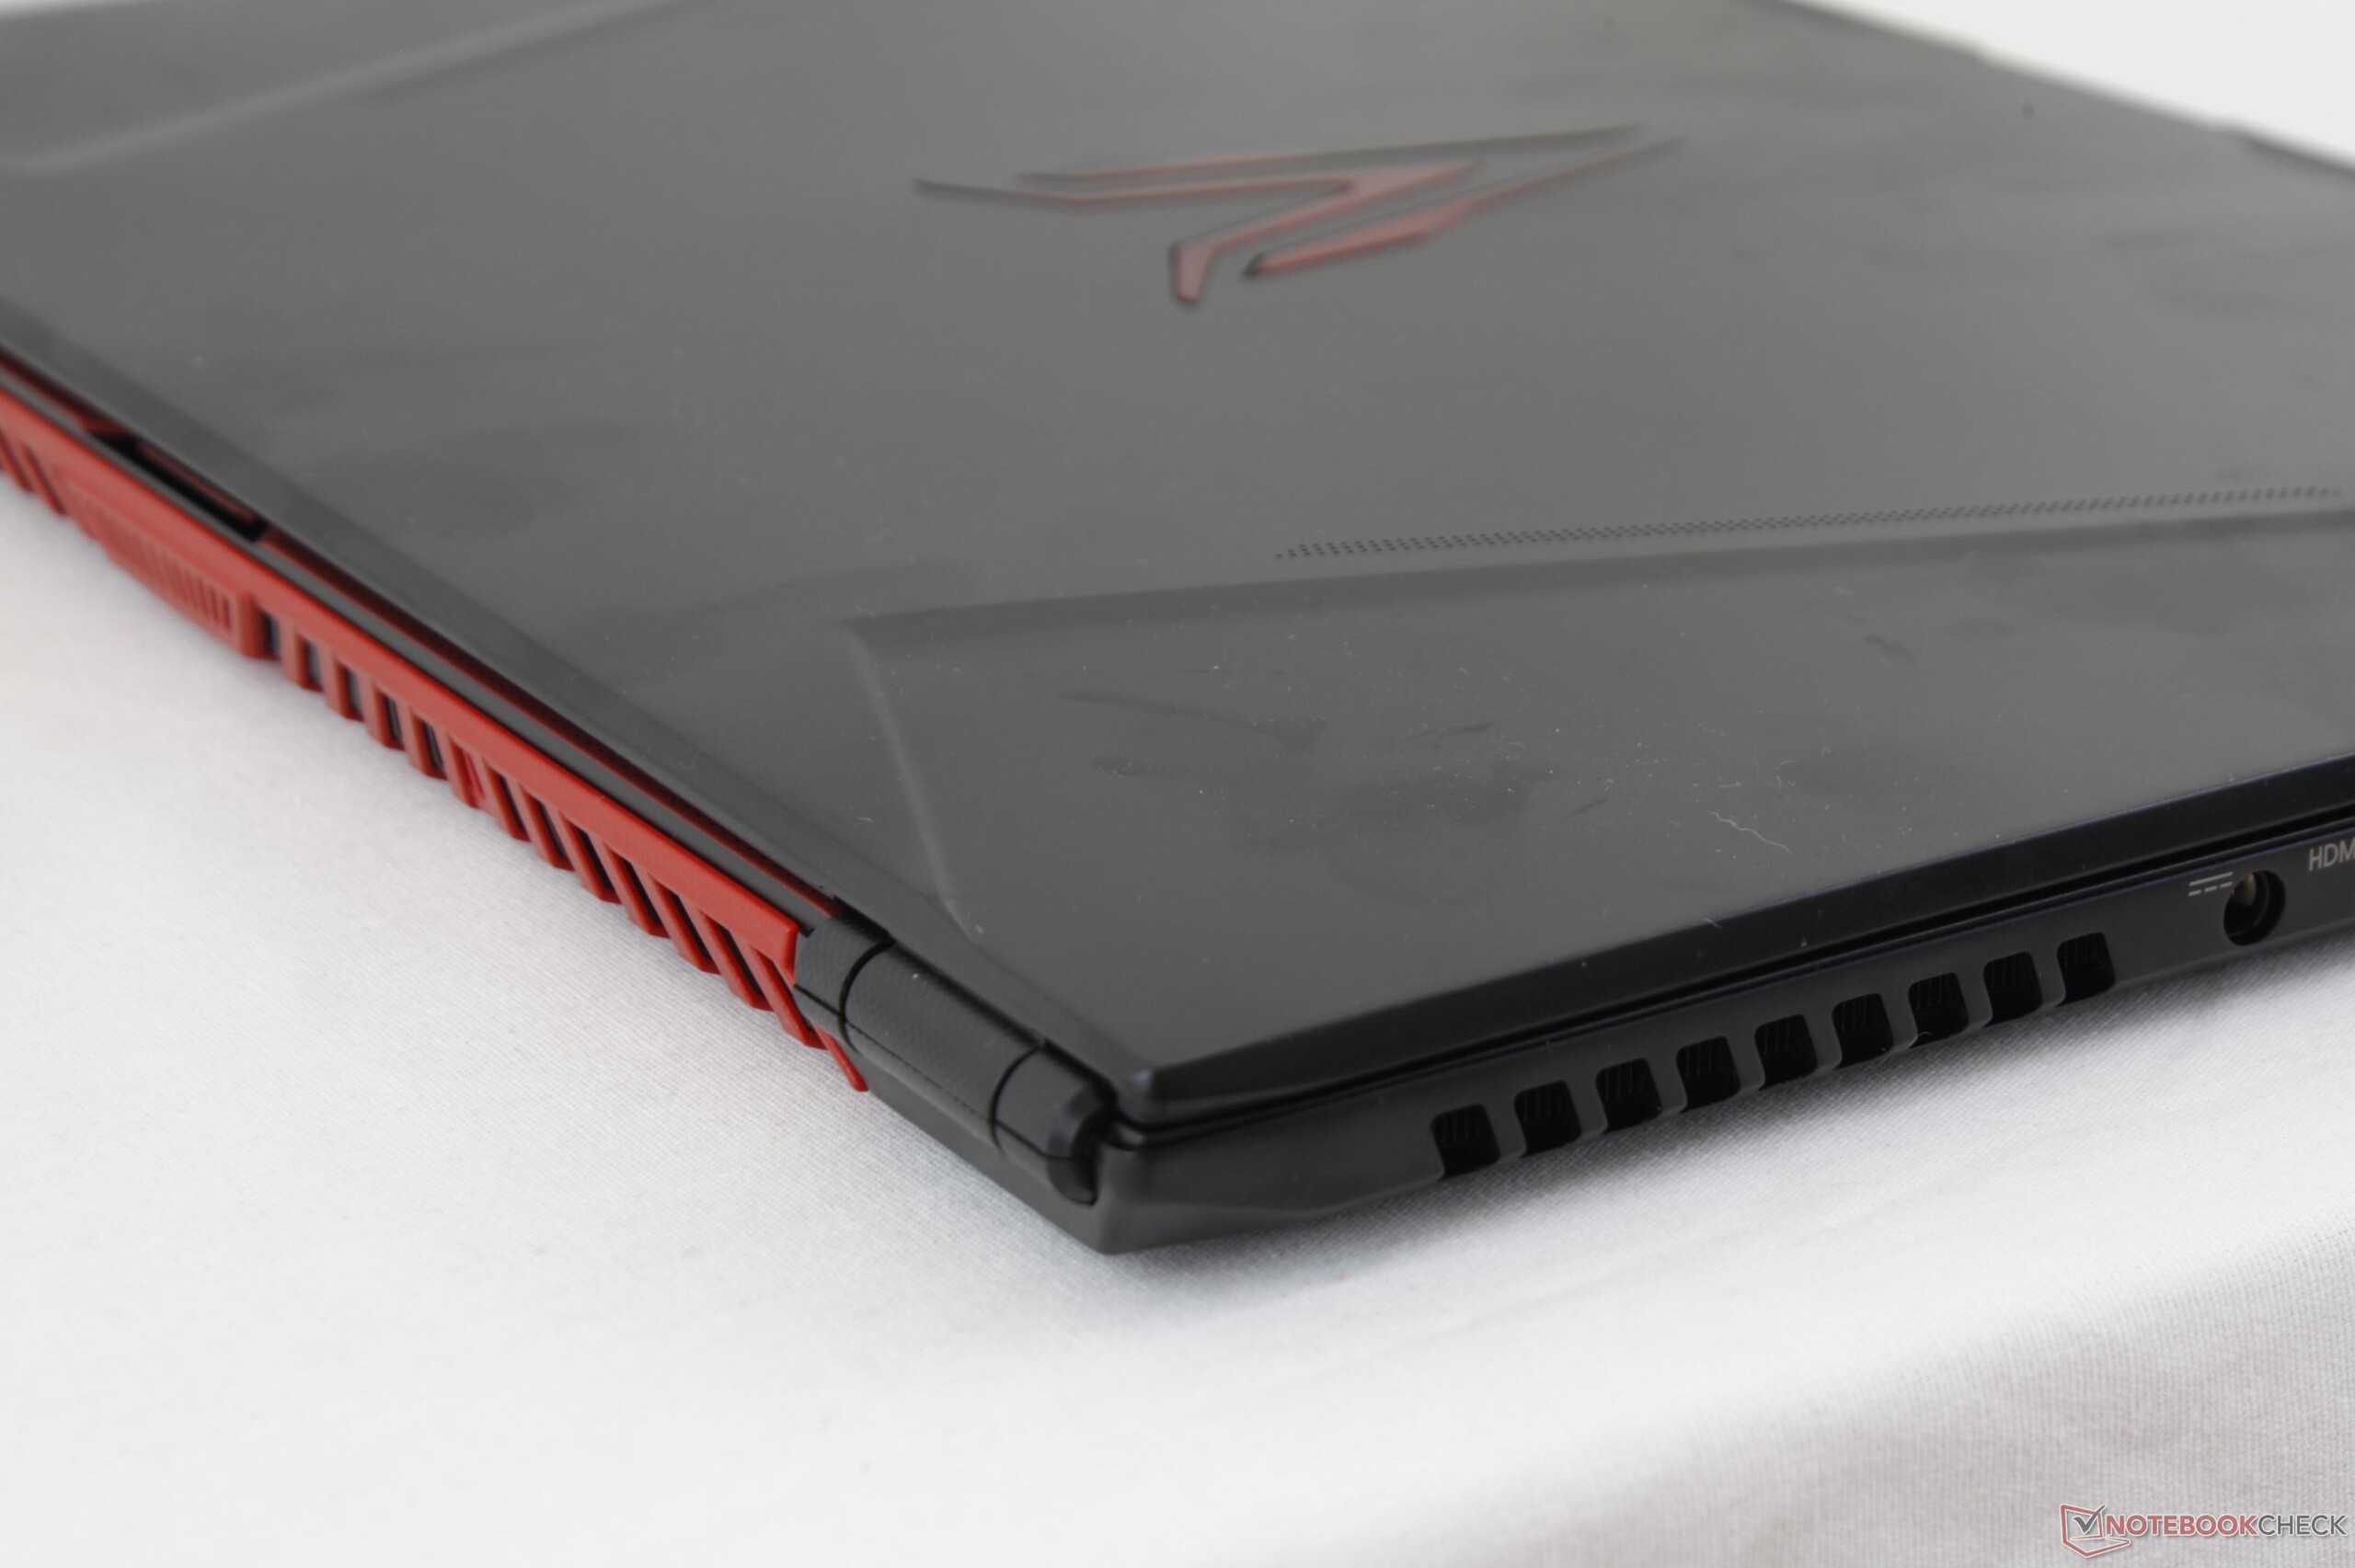
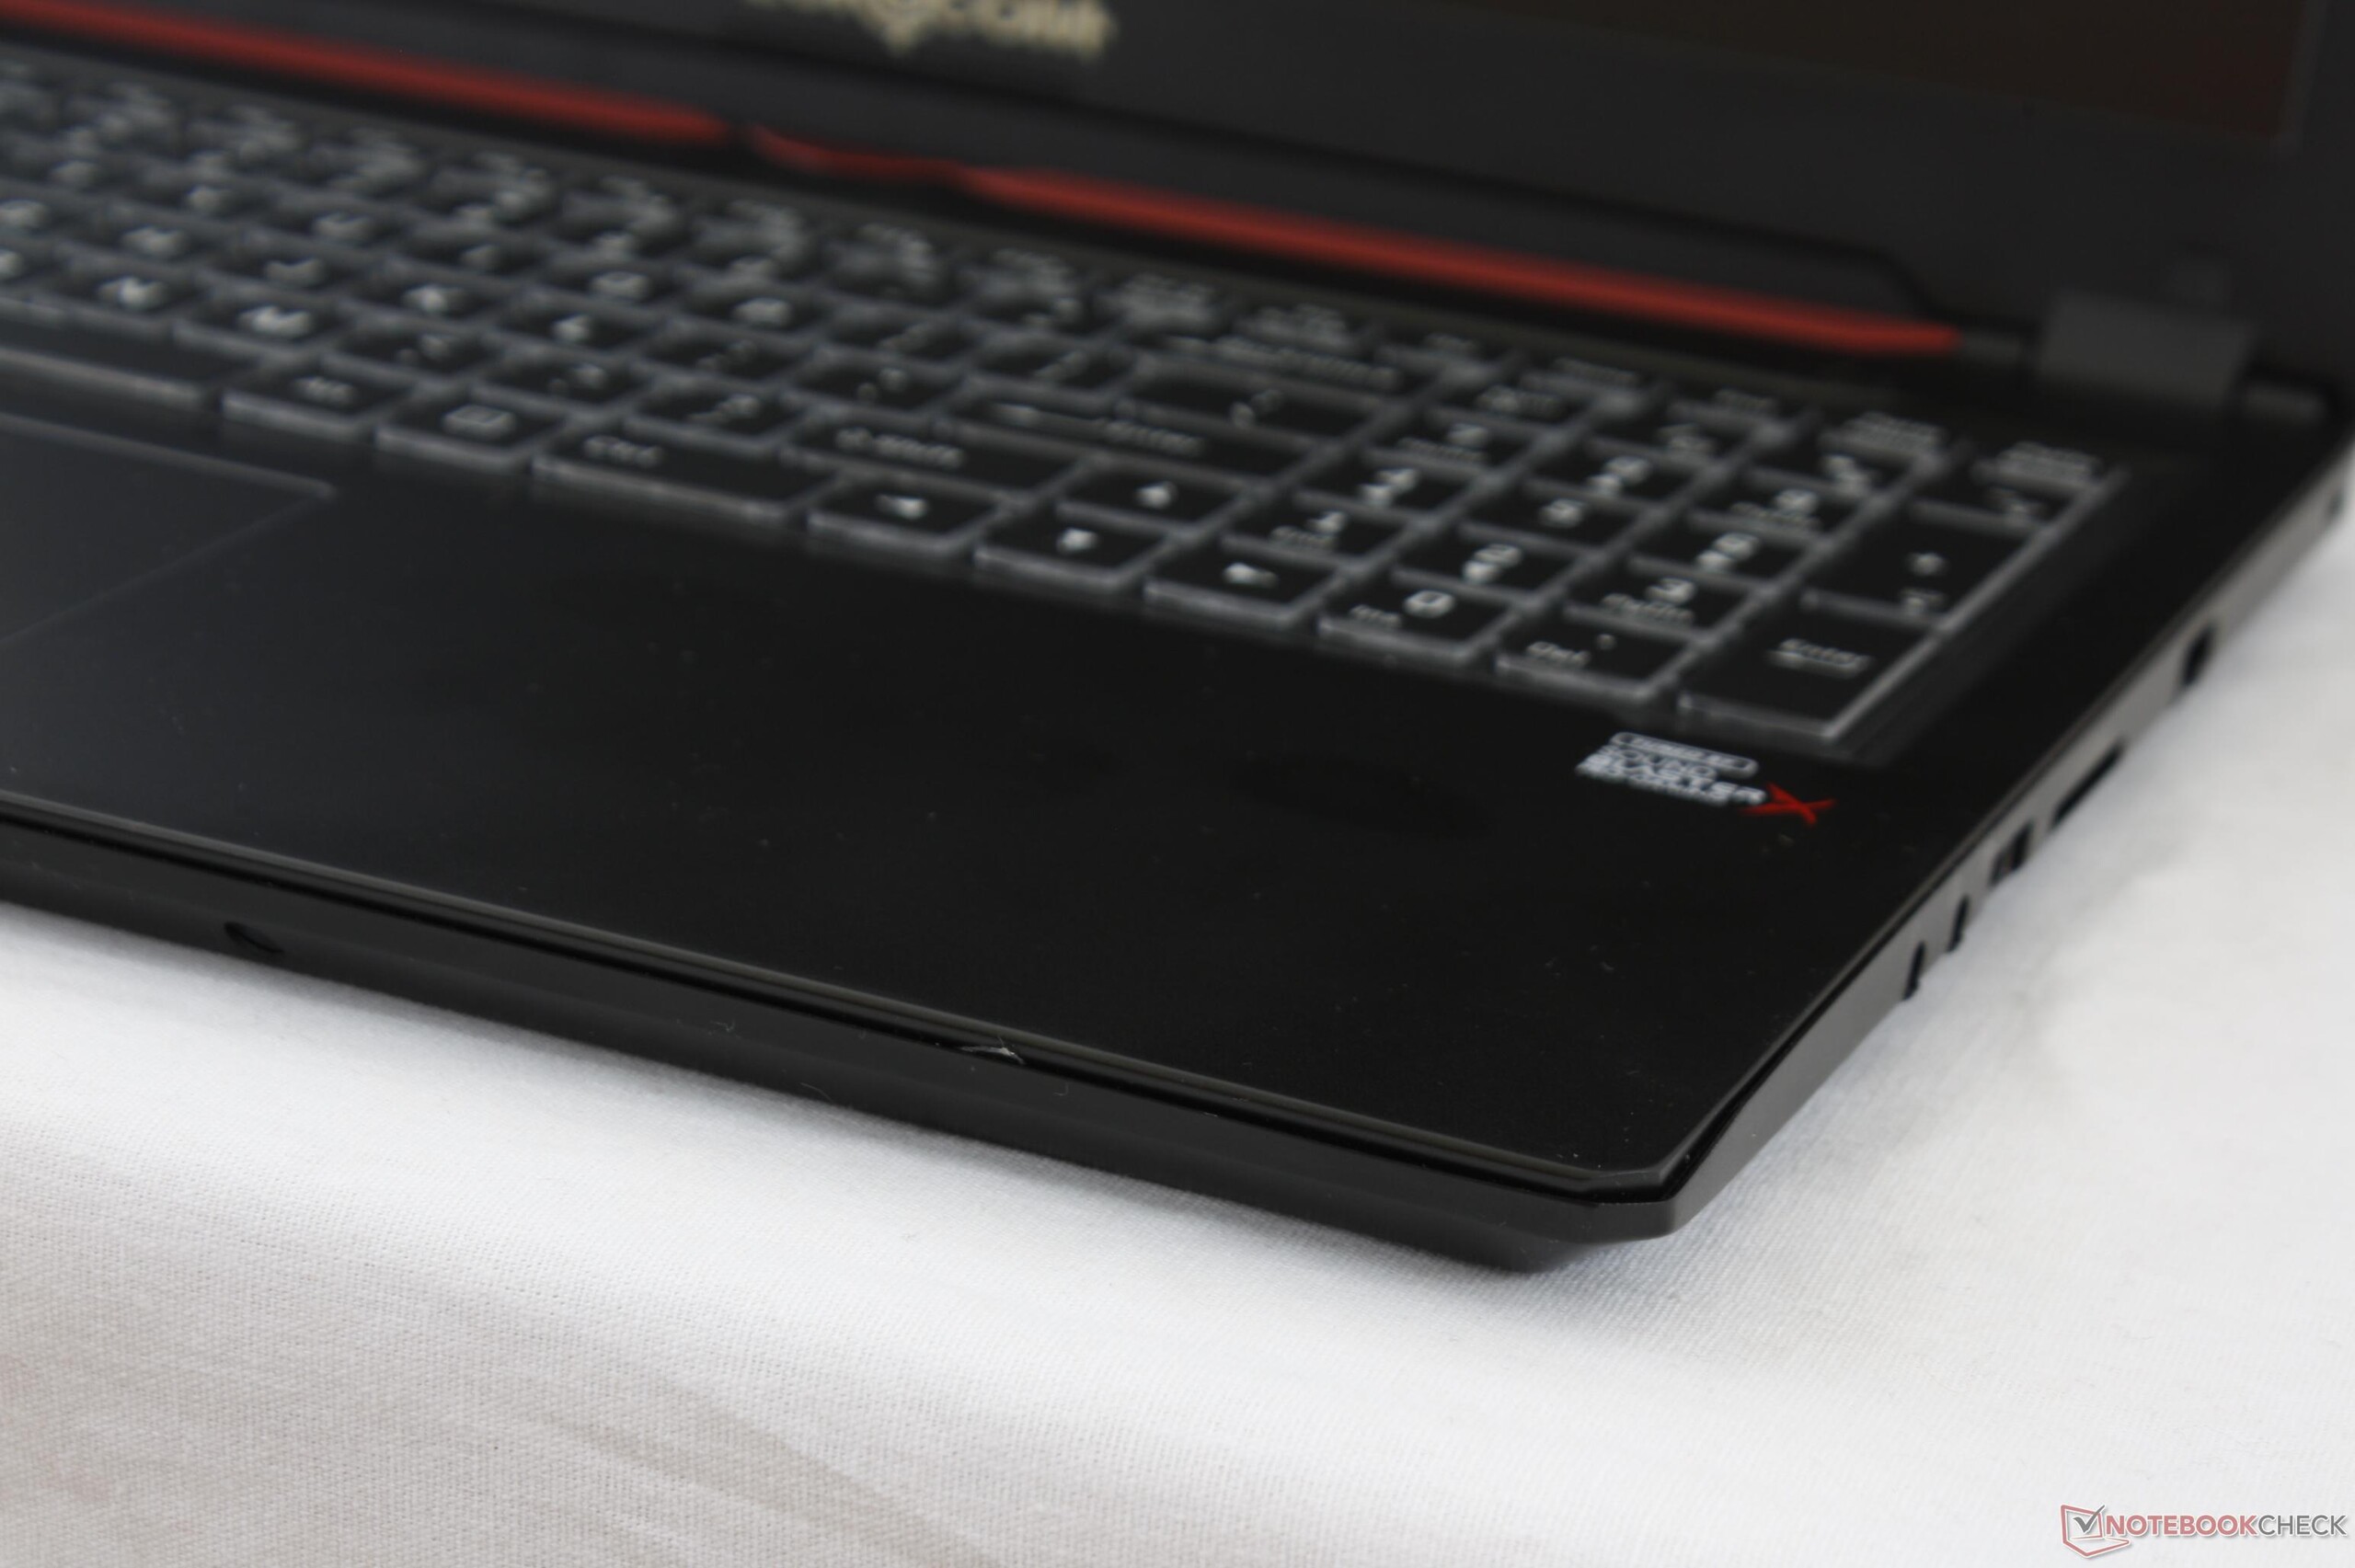
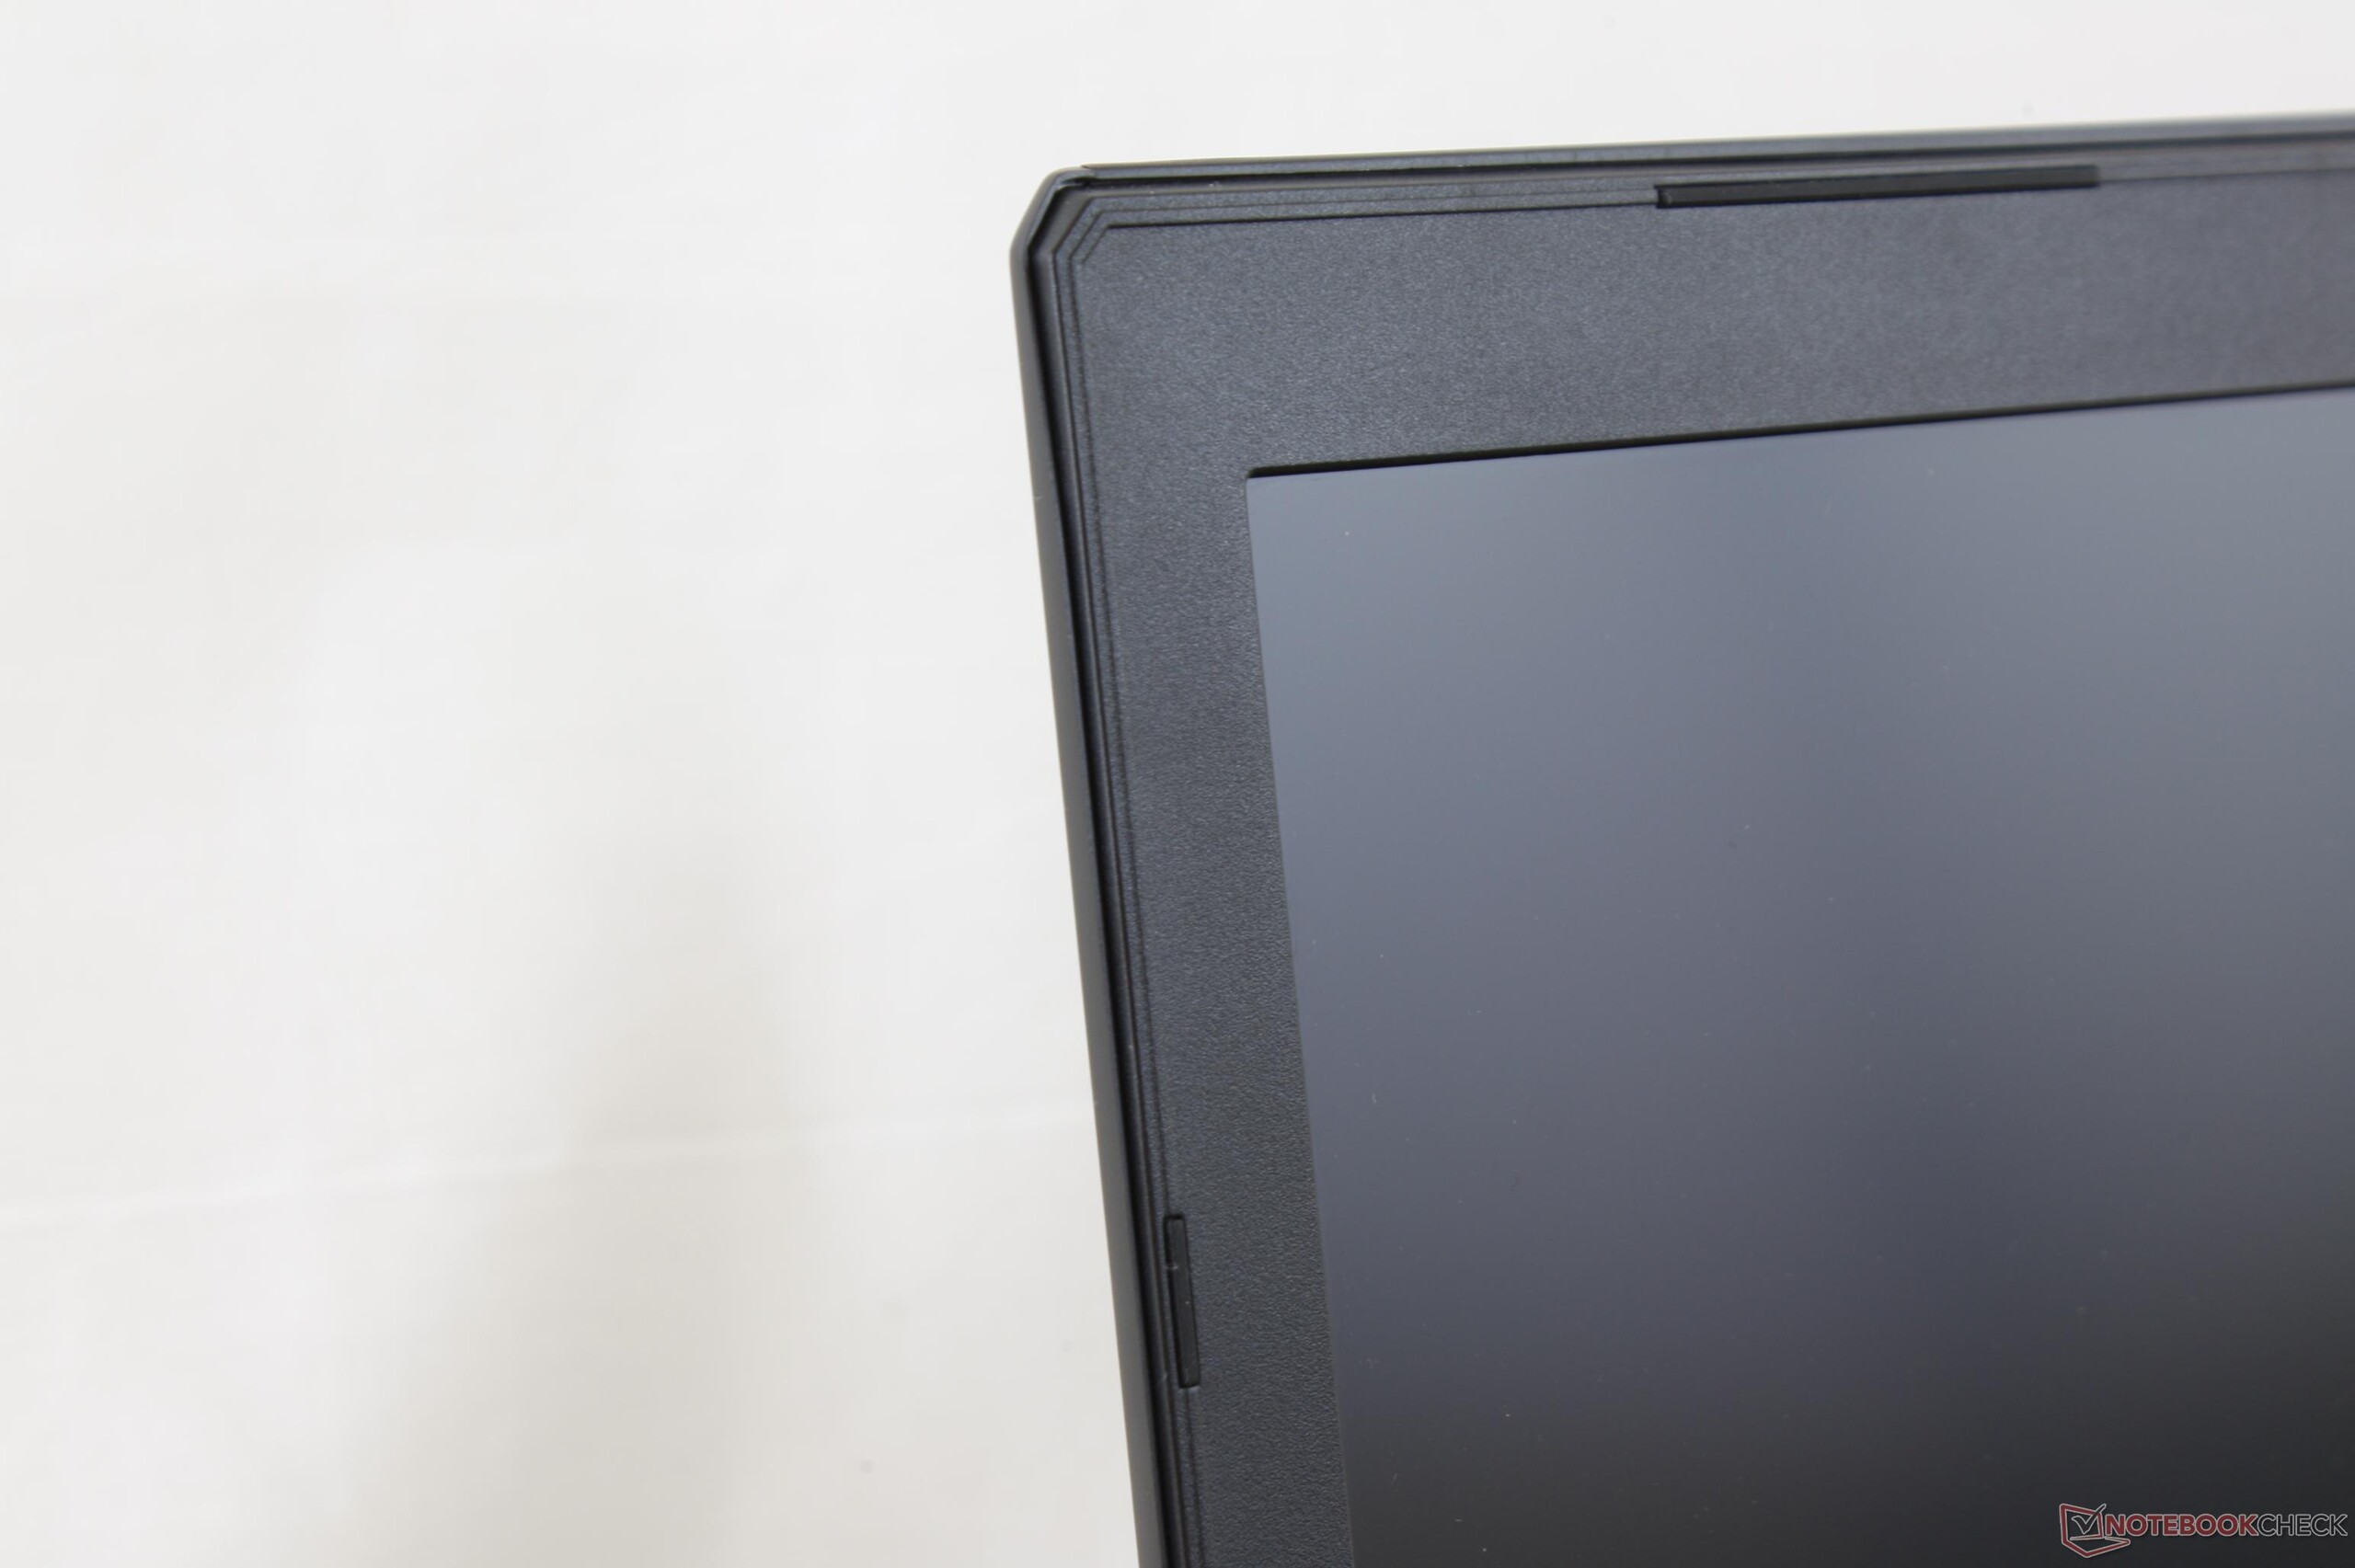
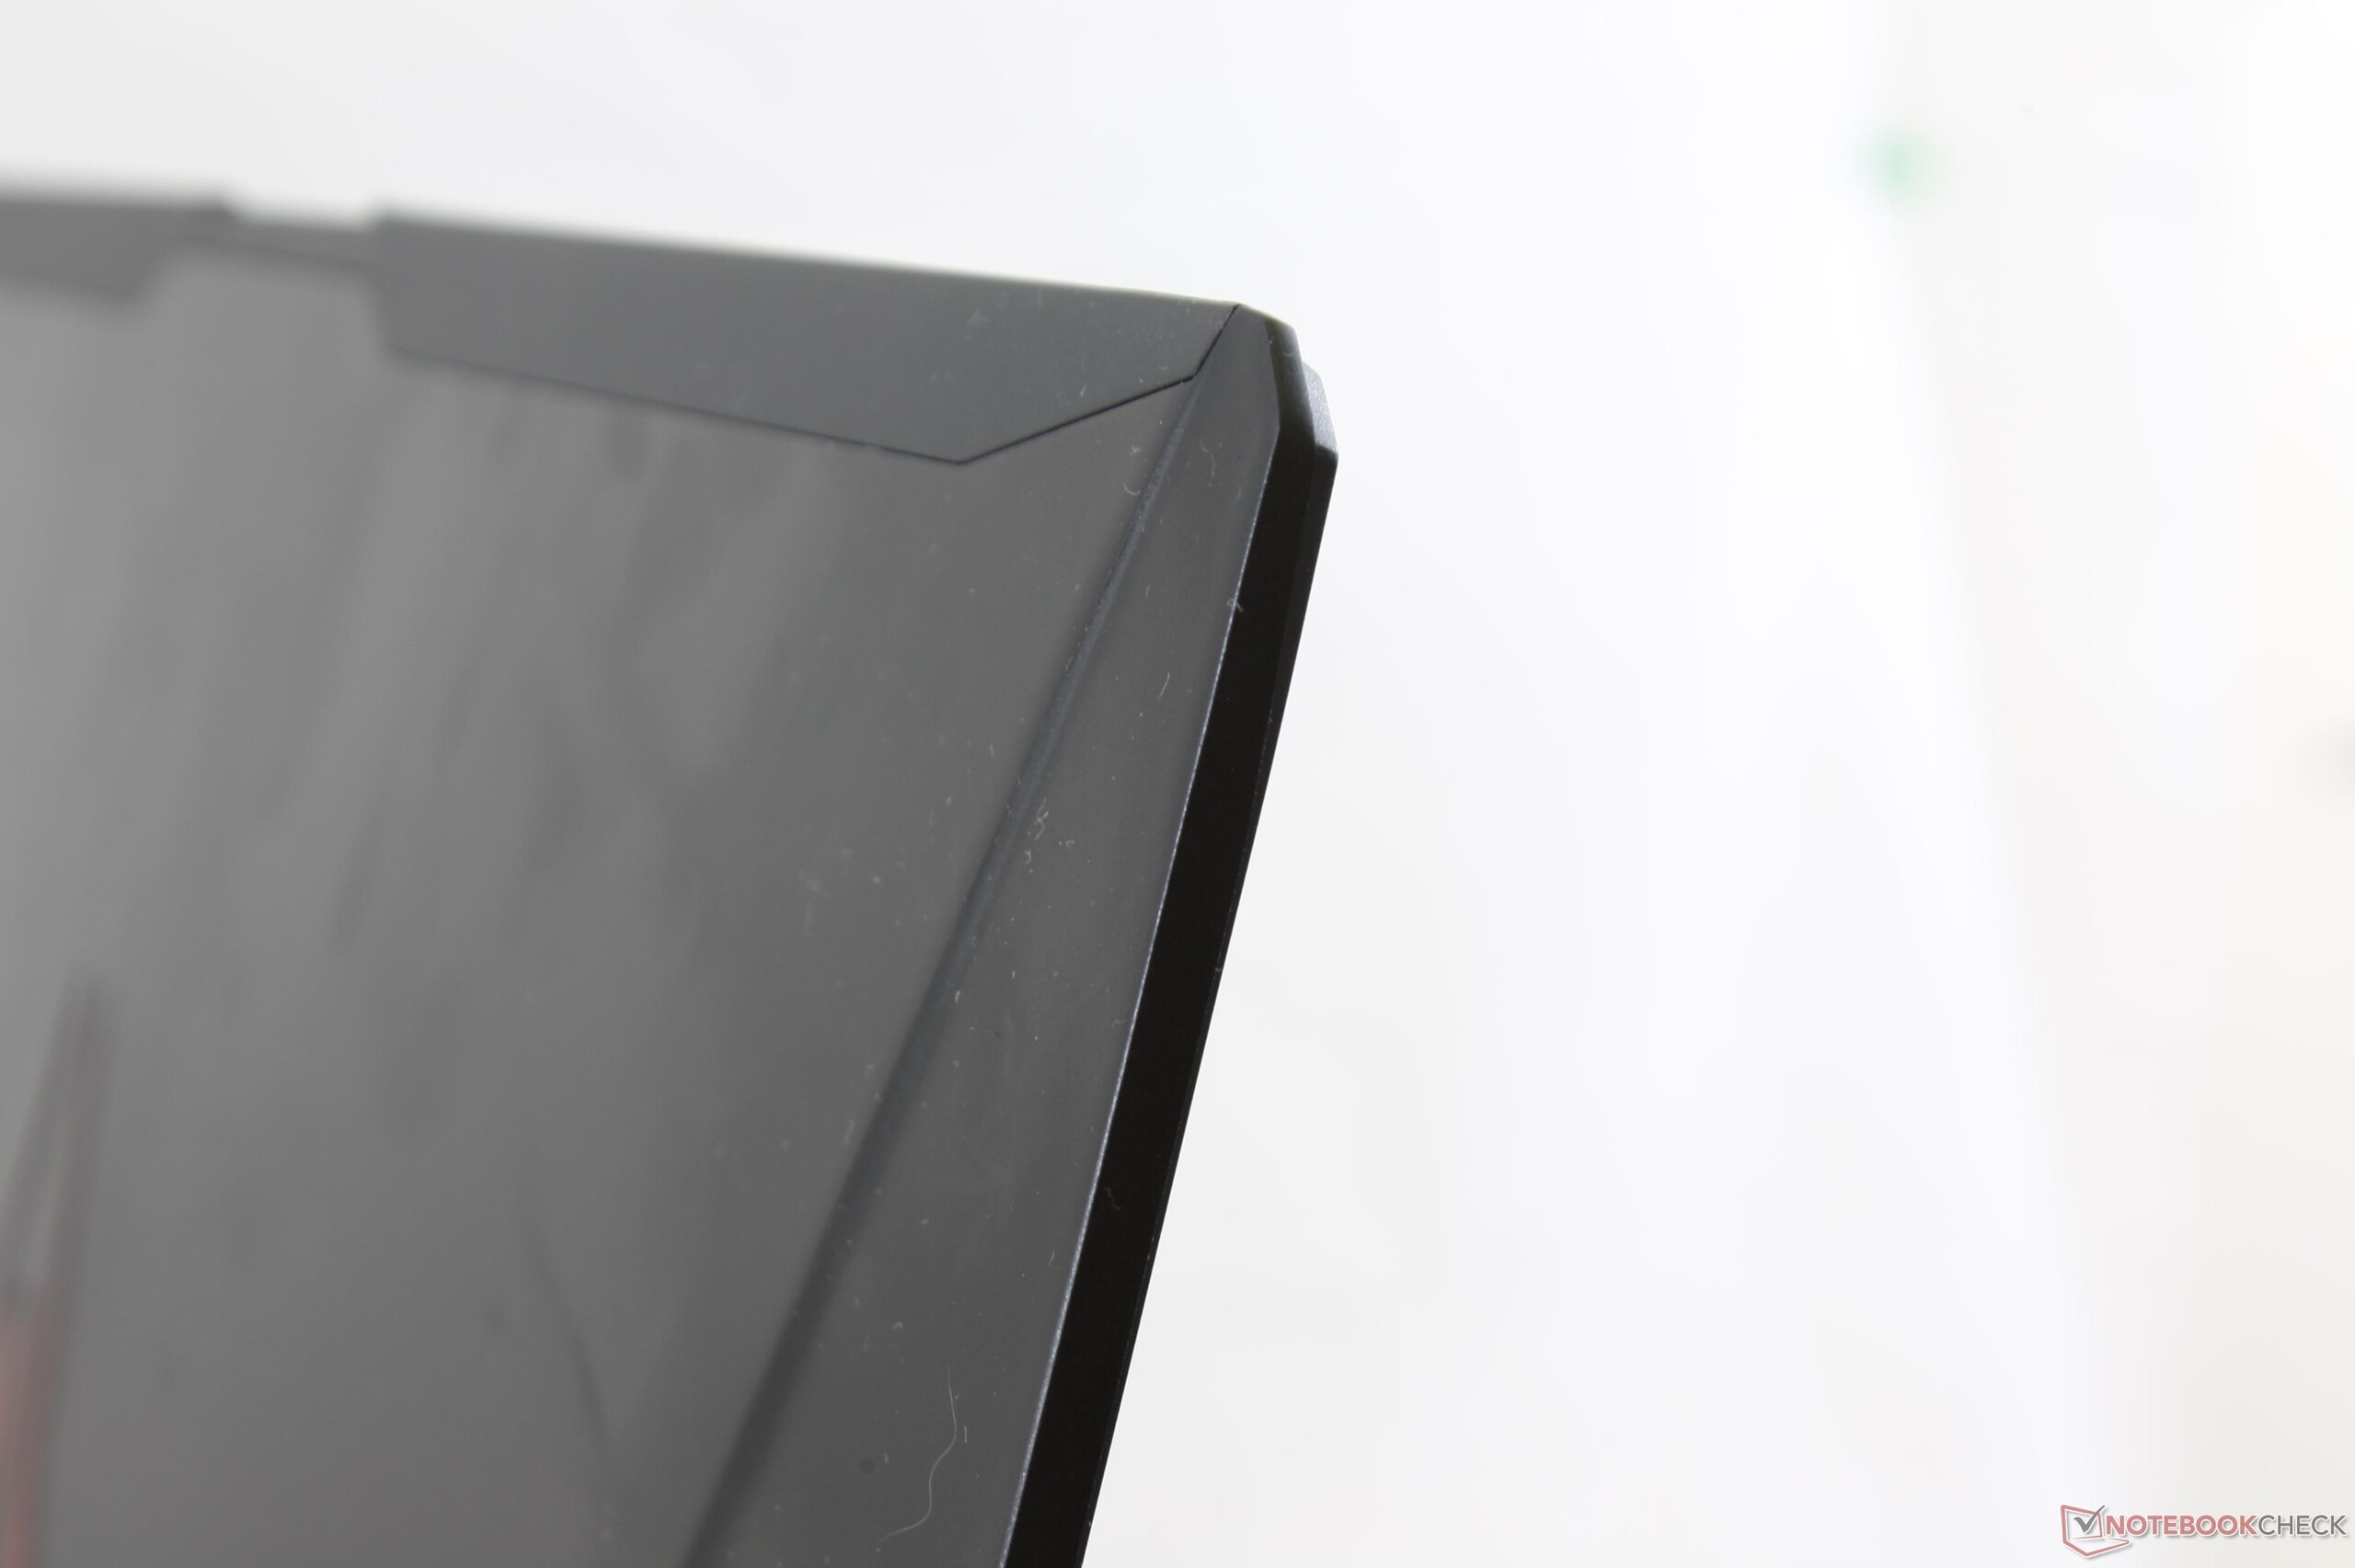
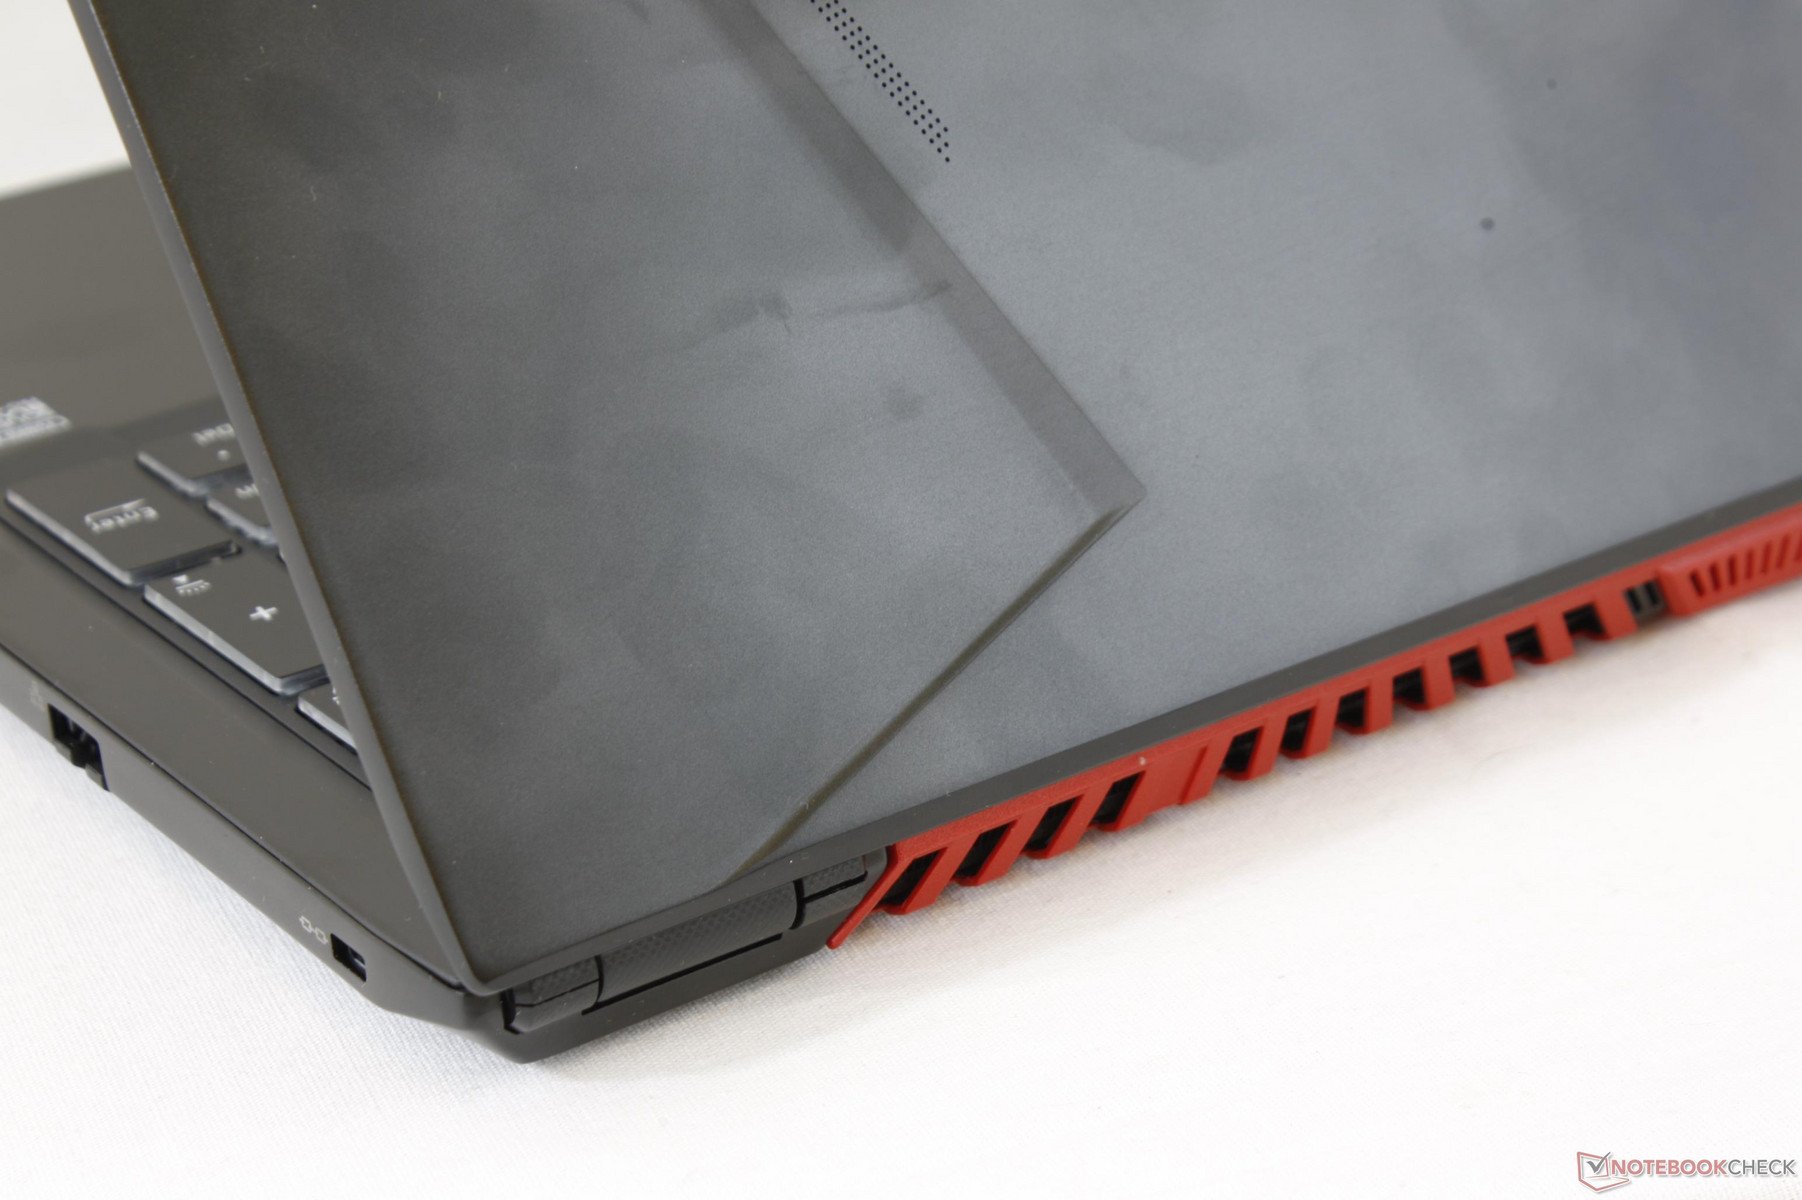
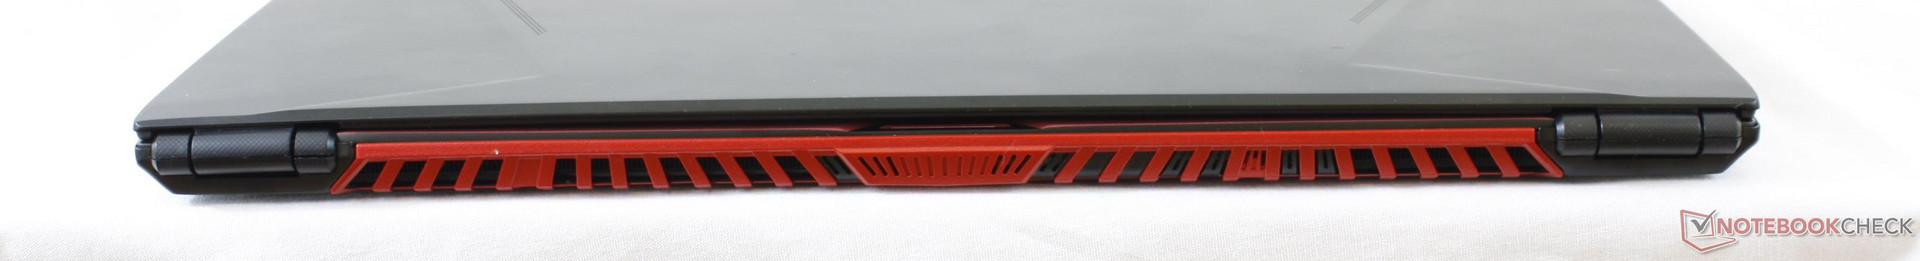
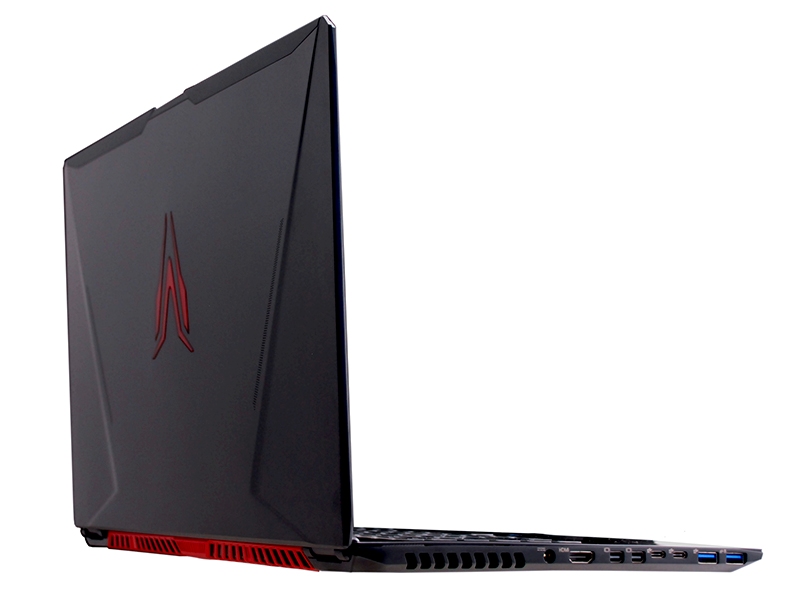
Chassis design is sharper and less boxy than what we're used to from Clevo. The smooth metal surfaces are flat from top to bottom with accent marks on the outer lid and front corners thrown in for good measure. The red logo, speakers, and ventilation grilles add flare to an otherwise matte and jet black look. We find the aesthetics to be a good balance between minimalism and eccentricity as some gaming notebooks tend to go overboard with stylized brushed surfaces and LED colors.
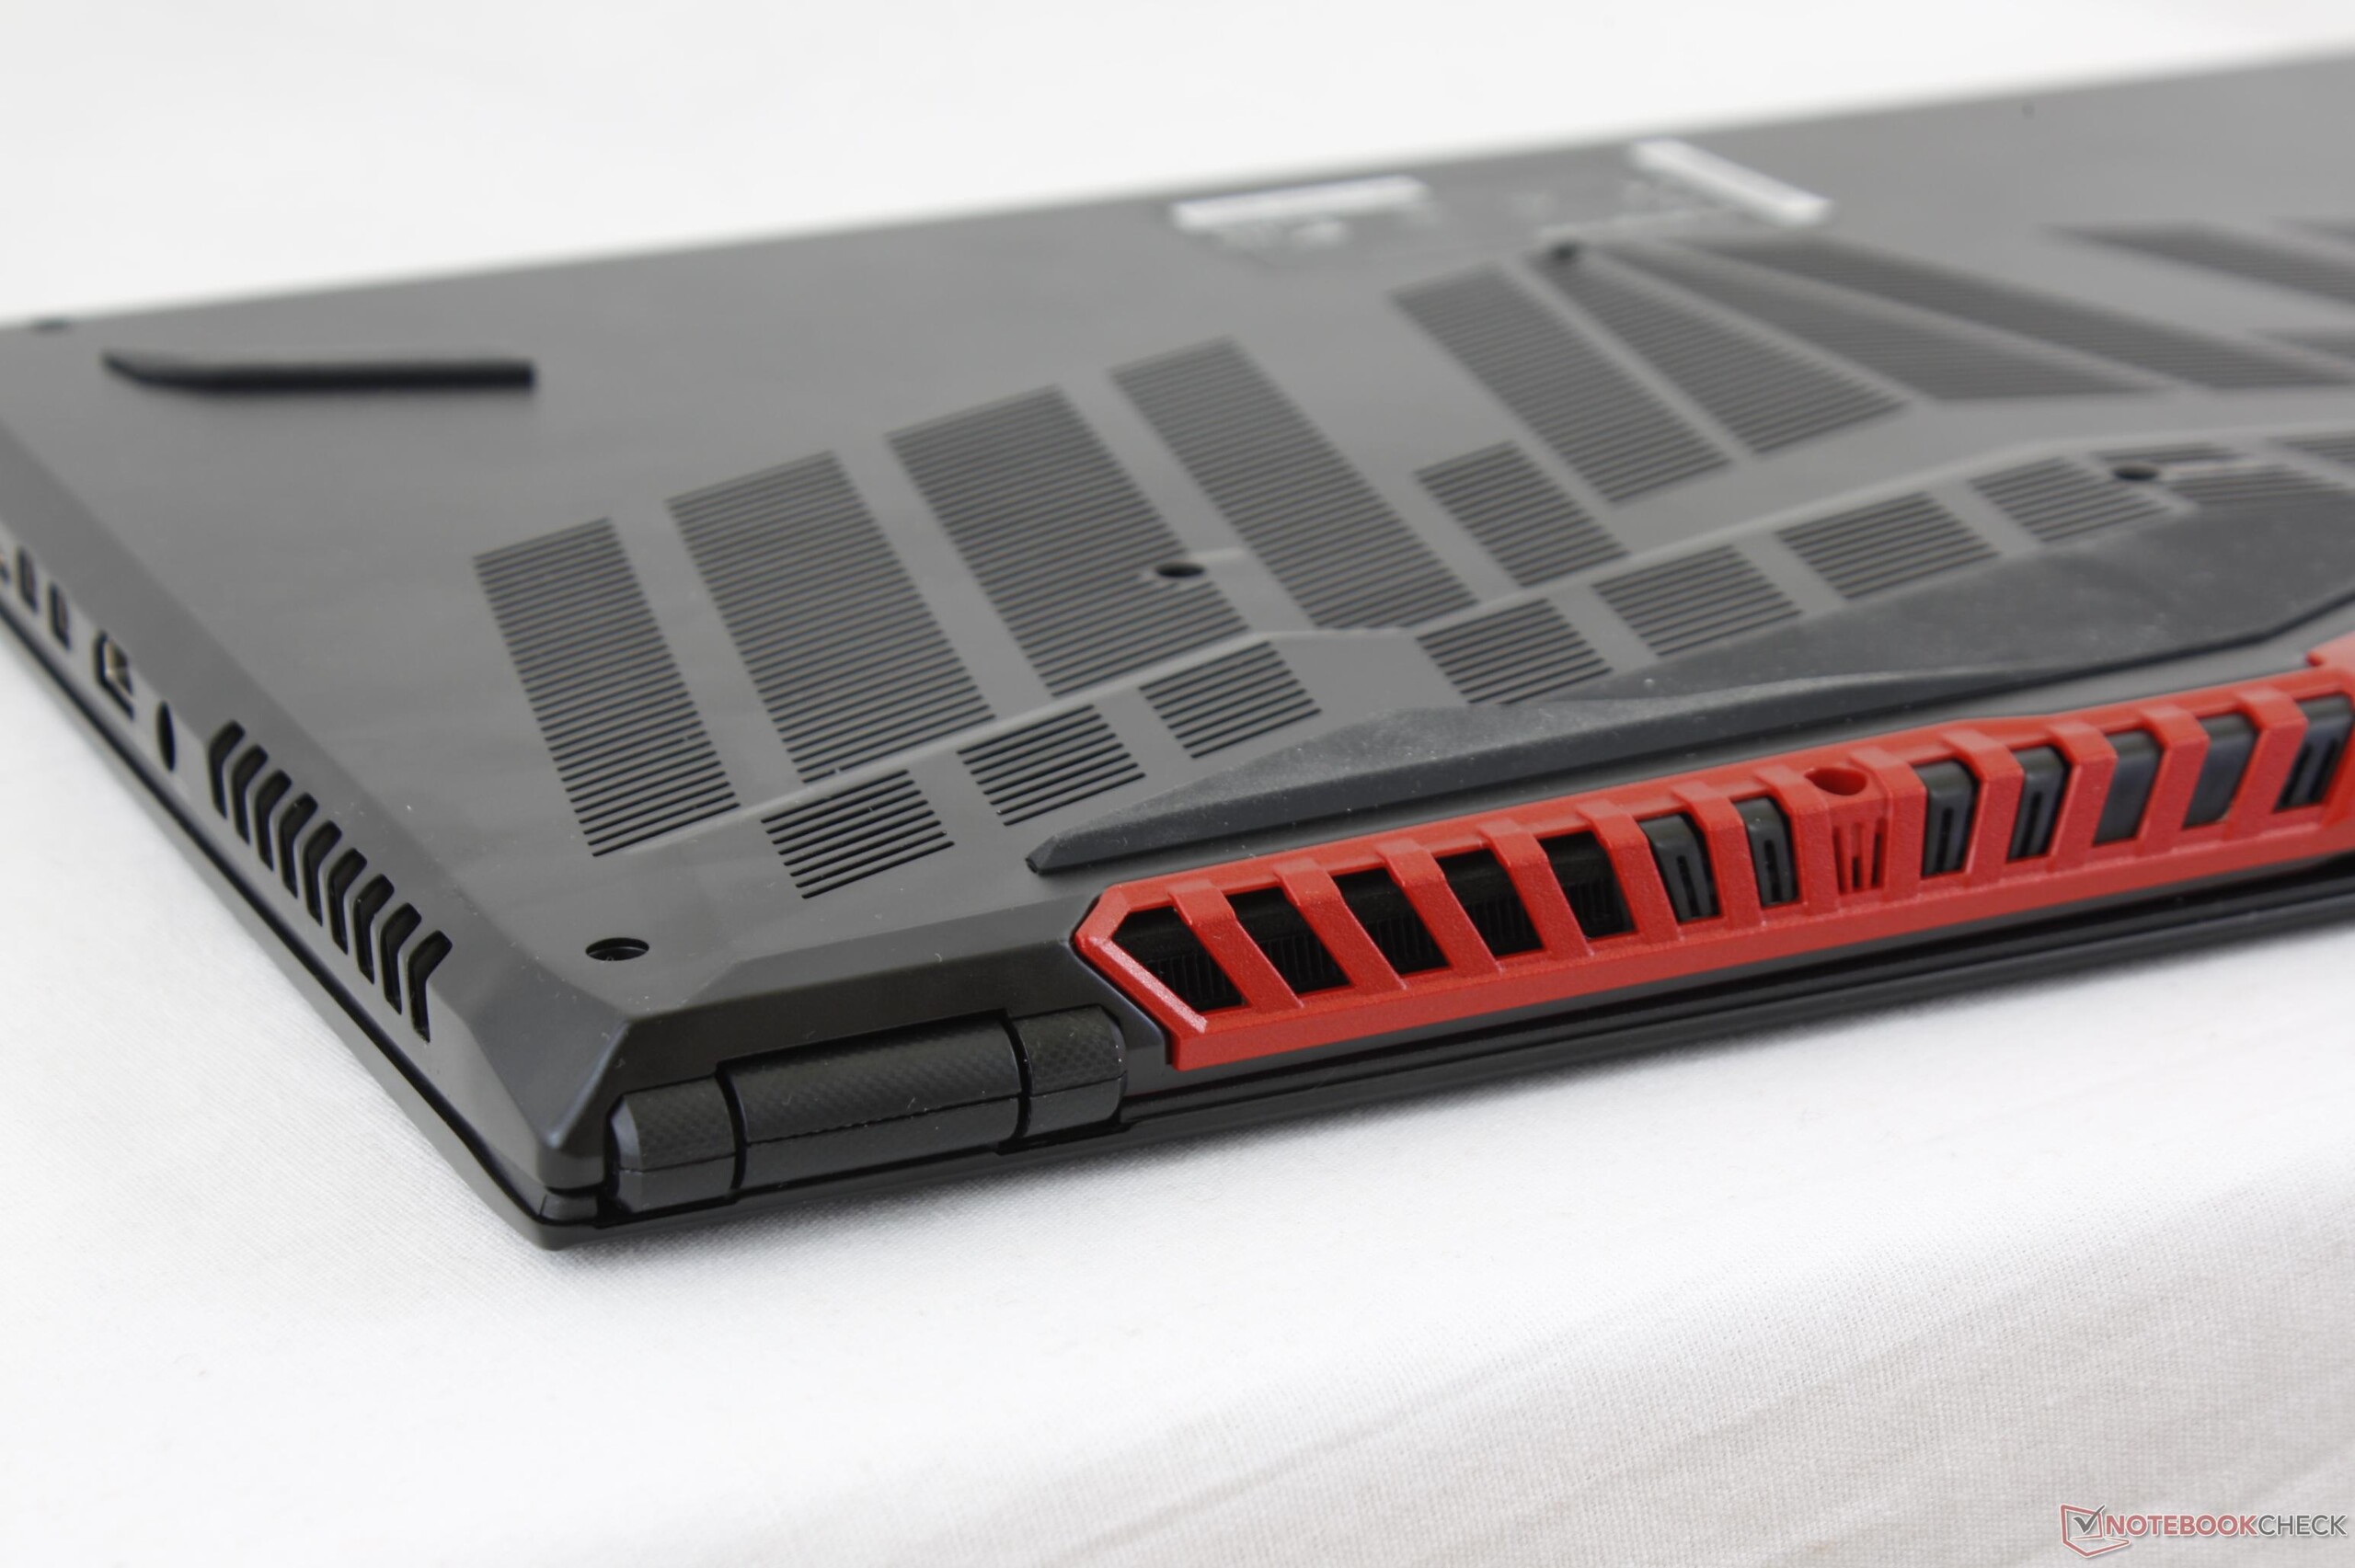
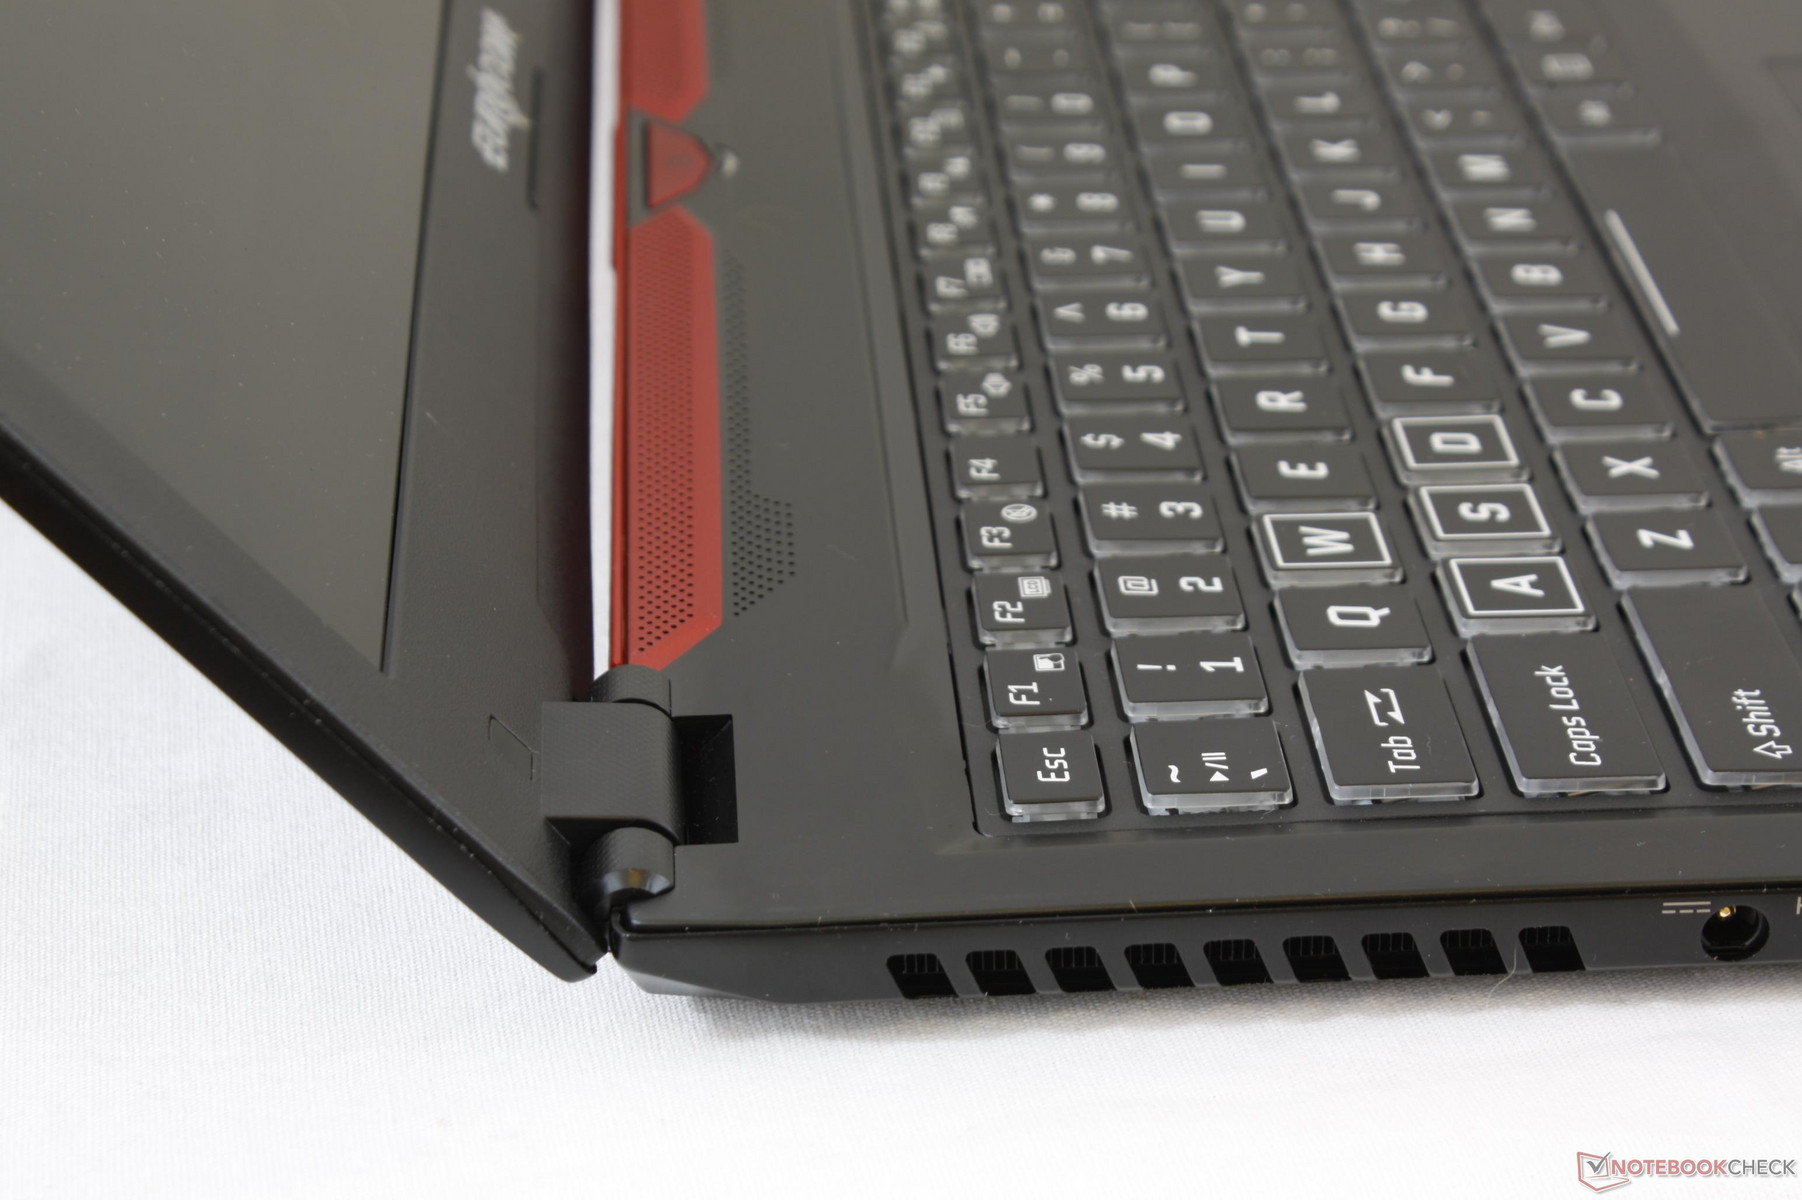
Chassis rigidity is overall better than on the GS63VR but worse than a Razer Blade Pro or MacBook Pro 15. While the base is very resistant to side-to-side twisting, its palm rests and center of the keyboard will still exhibit visible depressions when applying pressure. The center of the outer lid will also warp by a fair amount with slight audible creaking. There is definitely room for improvement to create a more inflexible and stronger chassis. Fortunately, the two small hinges are sufficiently rigid at every angle and suffer from no teetering issues.
Construction quality is not perfect due in part to the non-unibody design. Since the skeleton is made up of smaller individual pieces instead of a single unibody frame, there is a higher chance of uneven gaps and crevices between materials. We can observe this on our specific unit as the front corner and rear plastic hinge cover appear slightly uneven and do not sit perfectly against the rest of the chassis. These minor imperfections don't have any bearing on chassis rigidity, but they are still superficial flaws that have no place on a notebook worth over two grand.

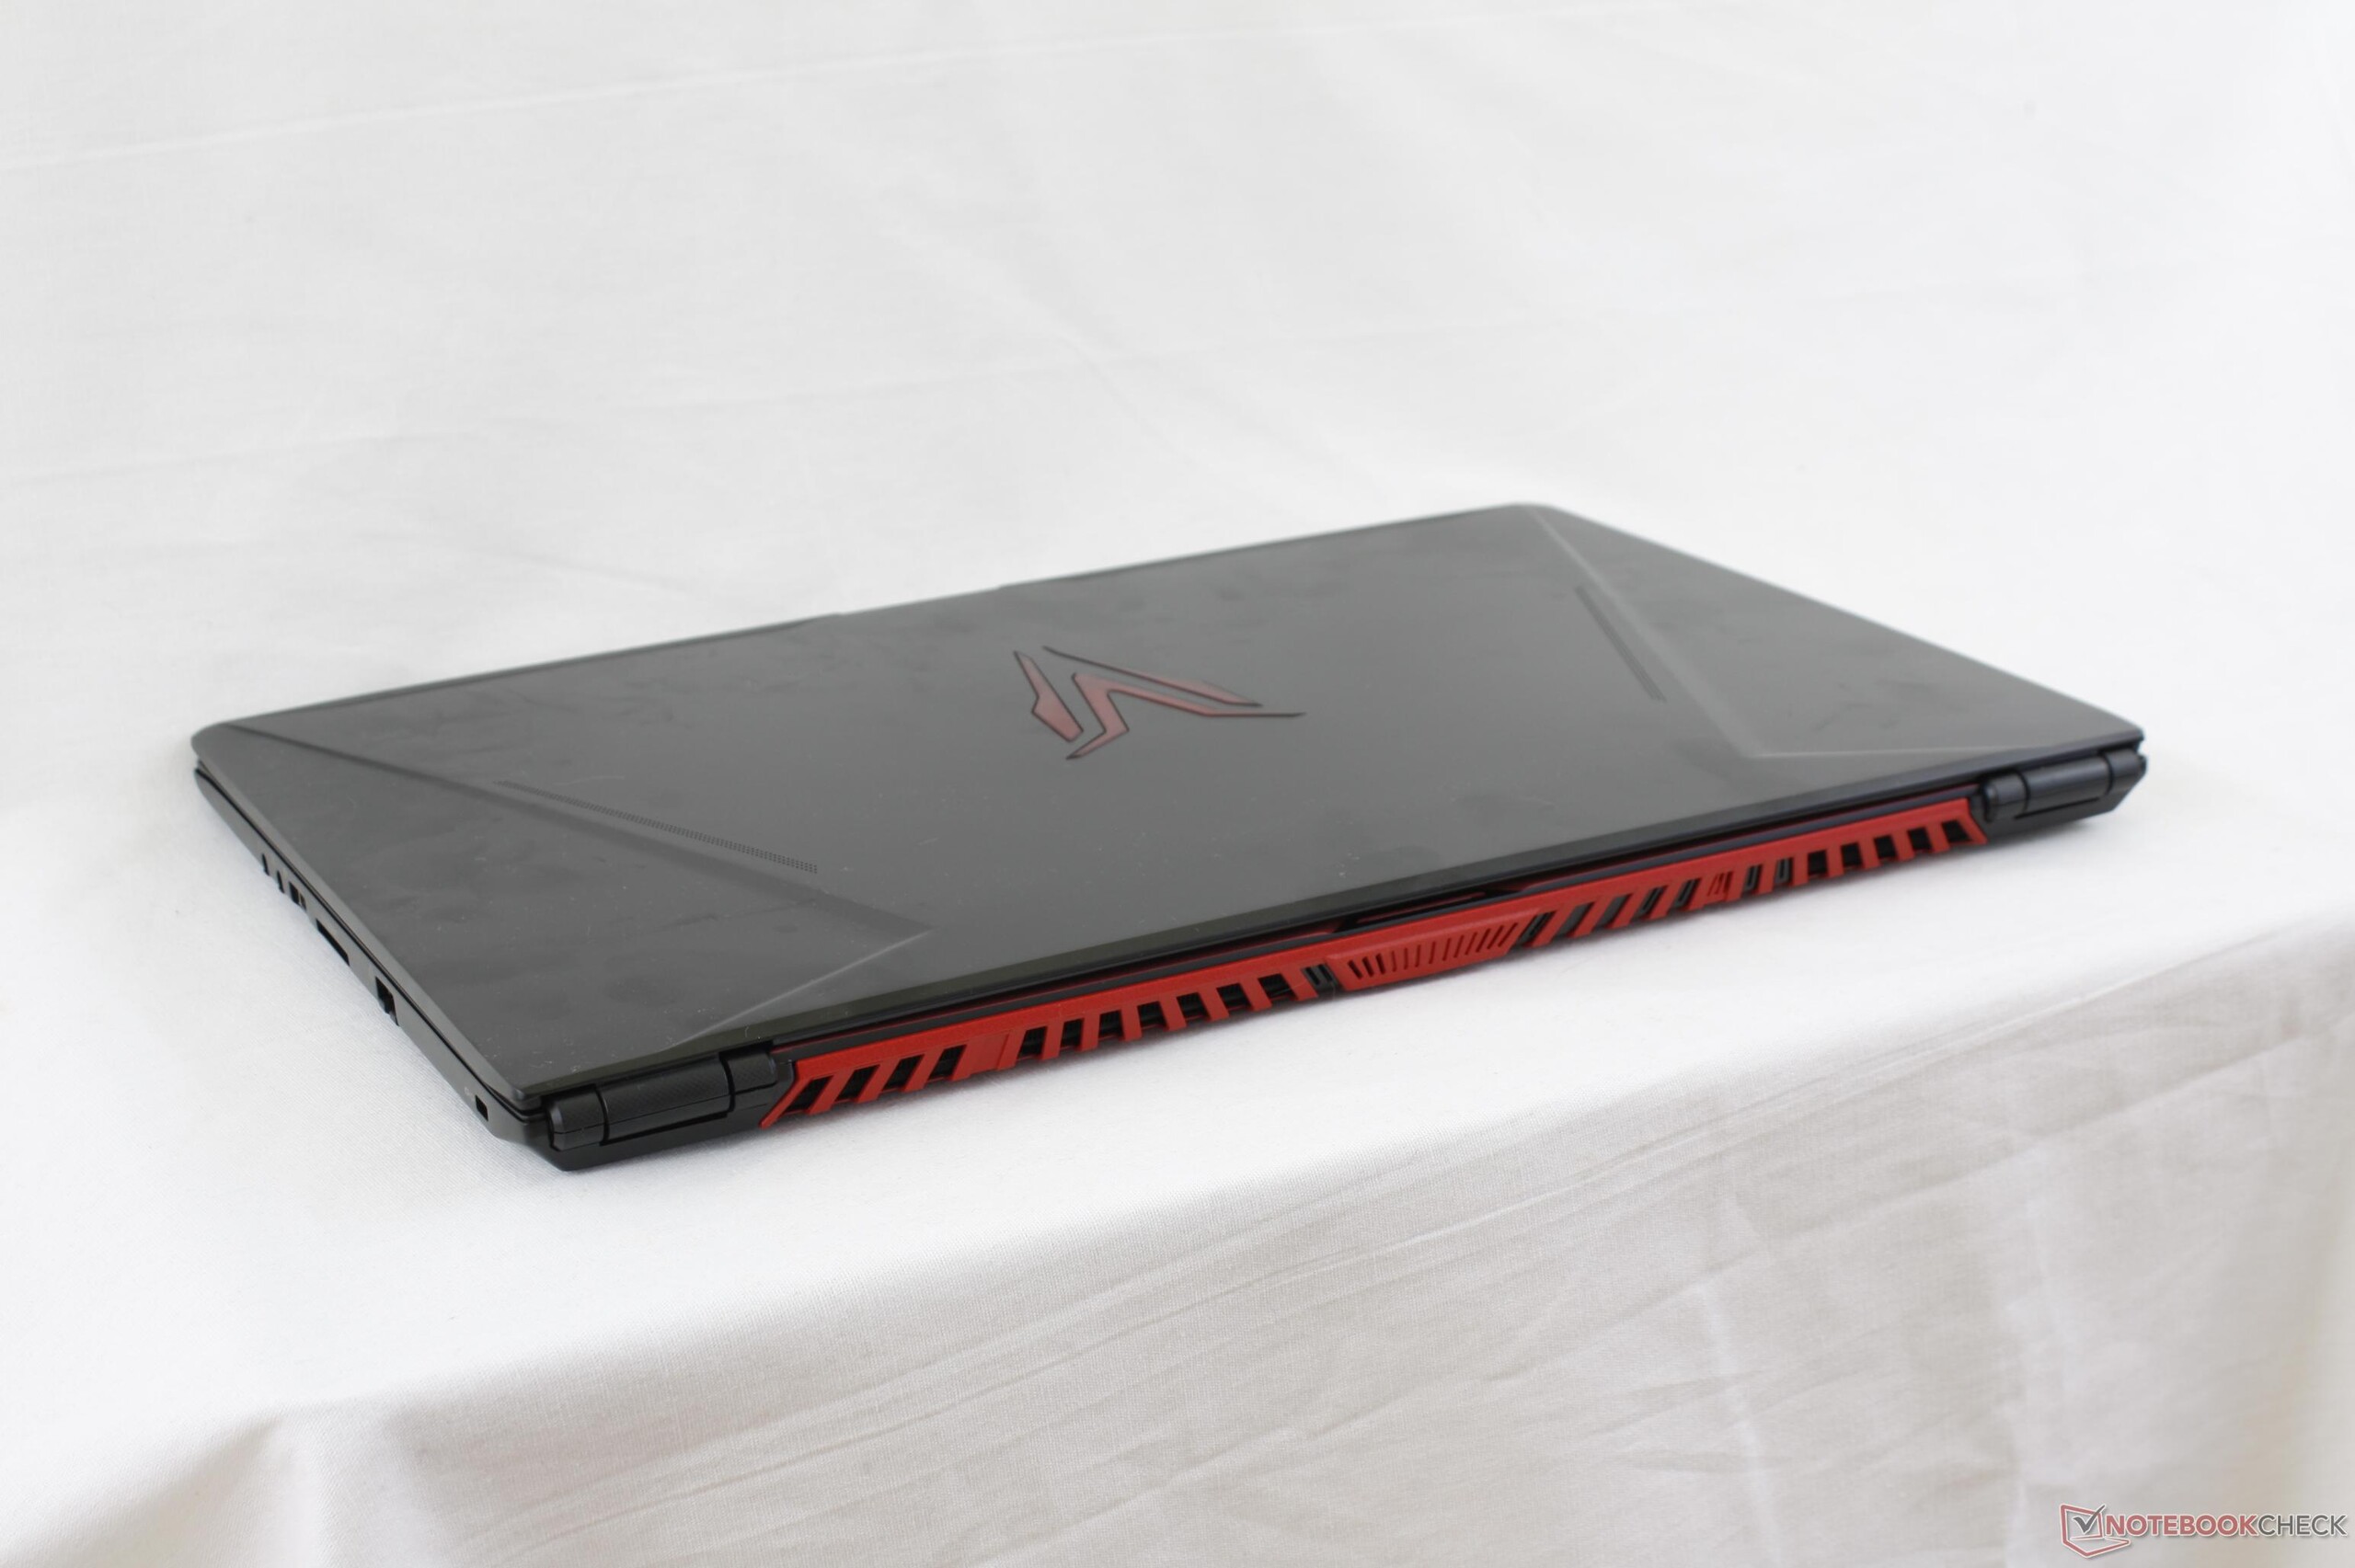
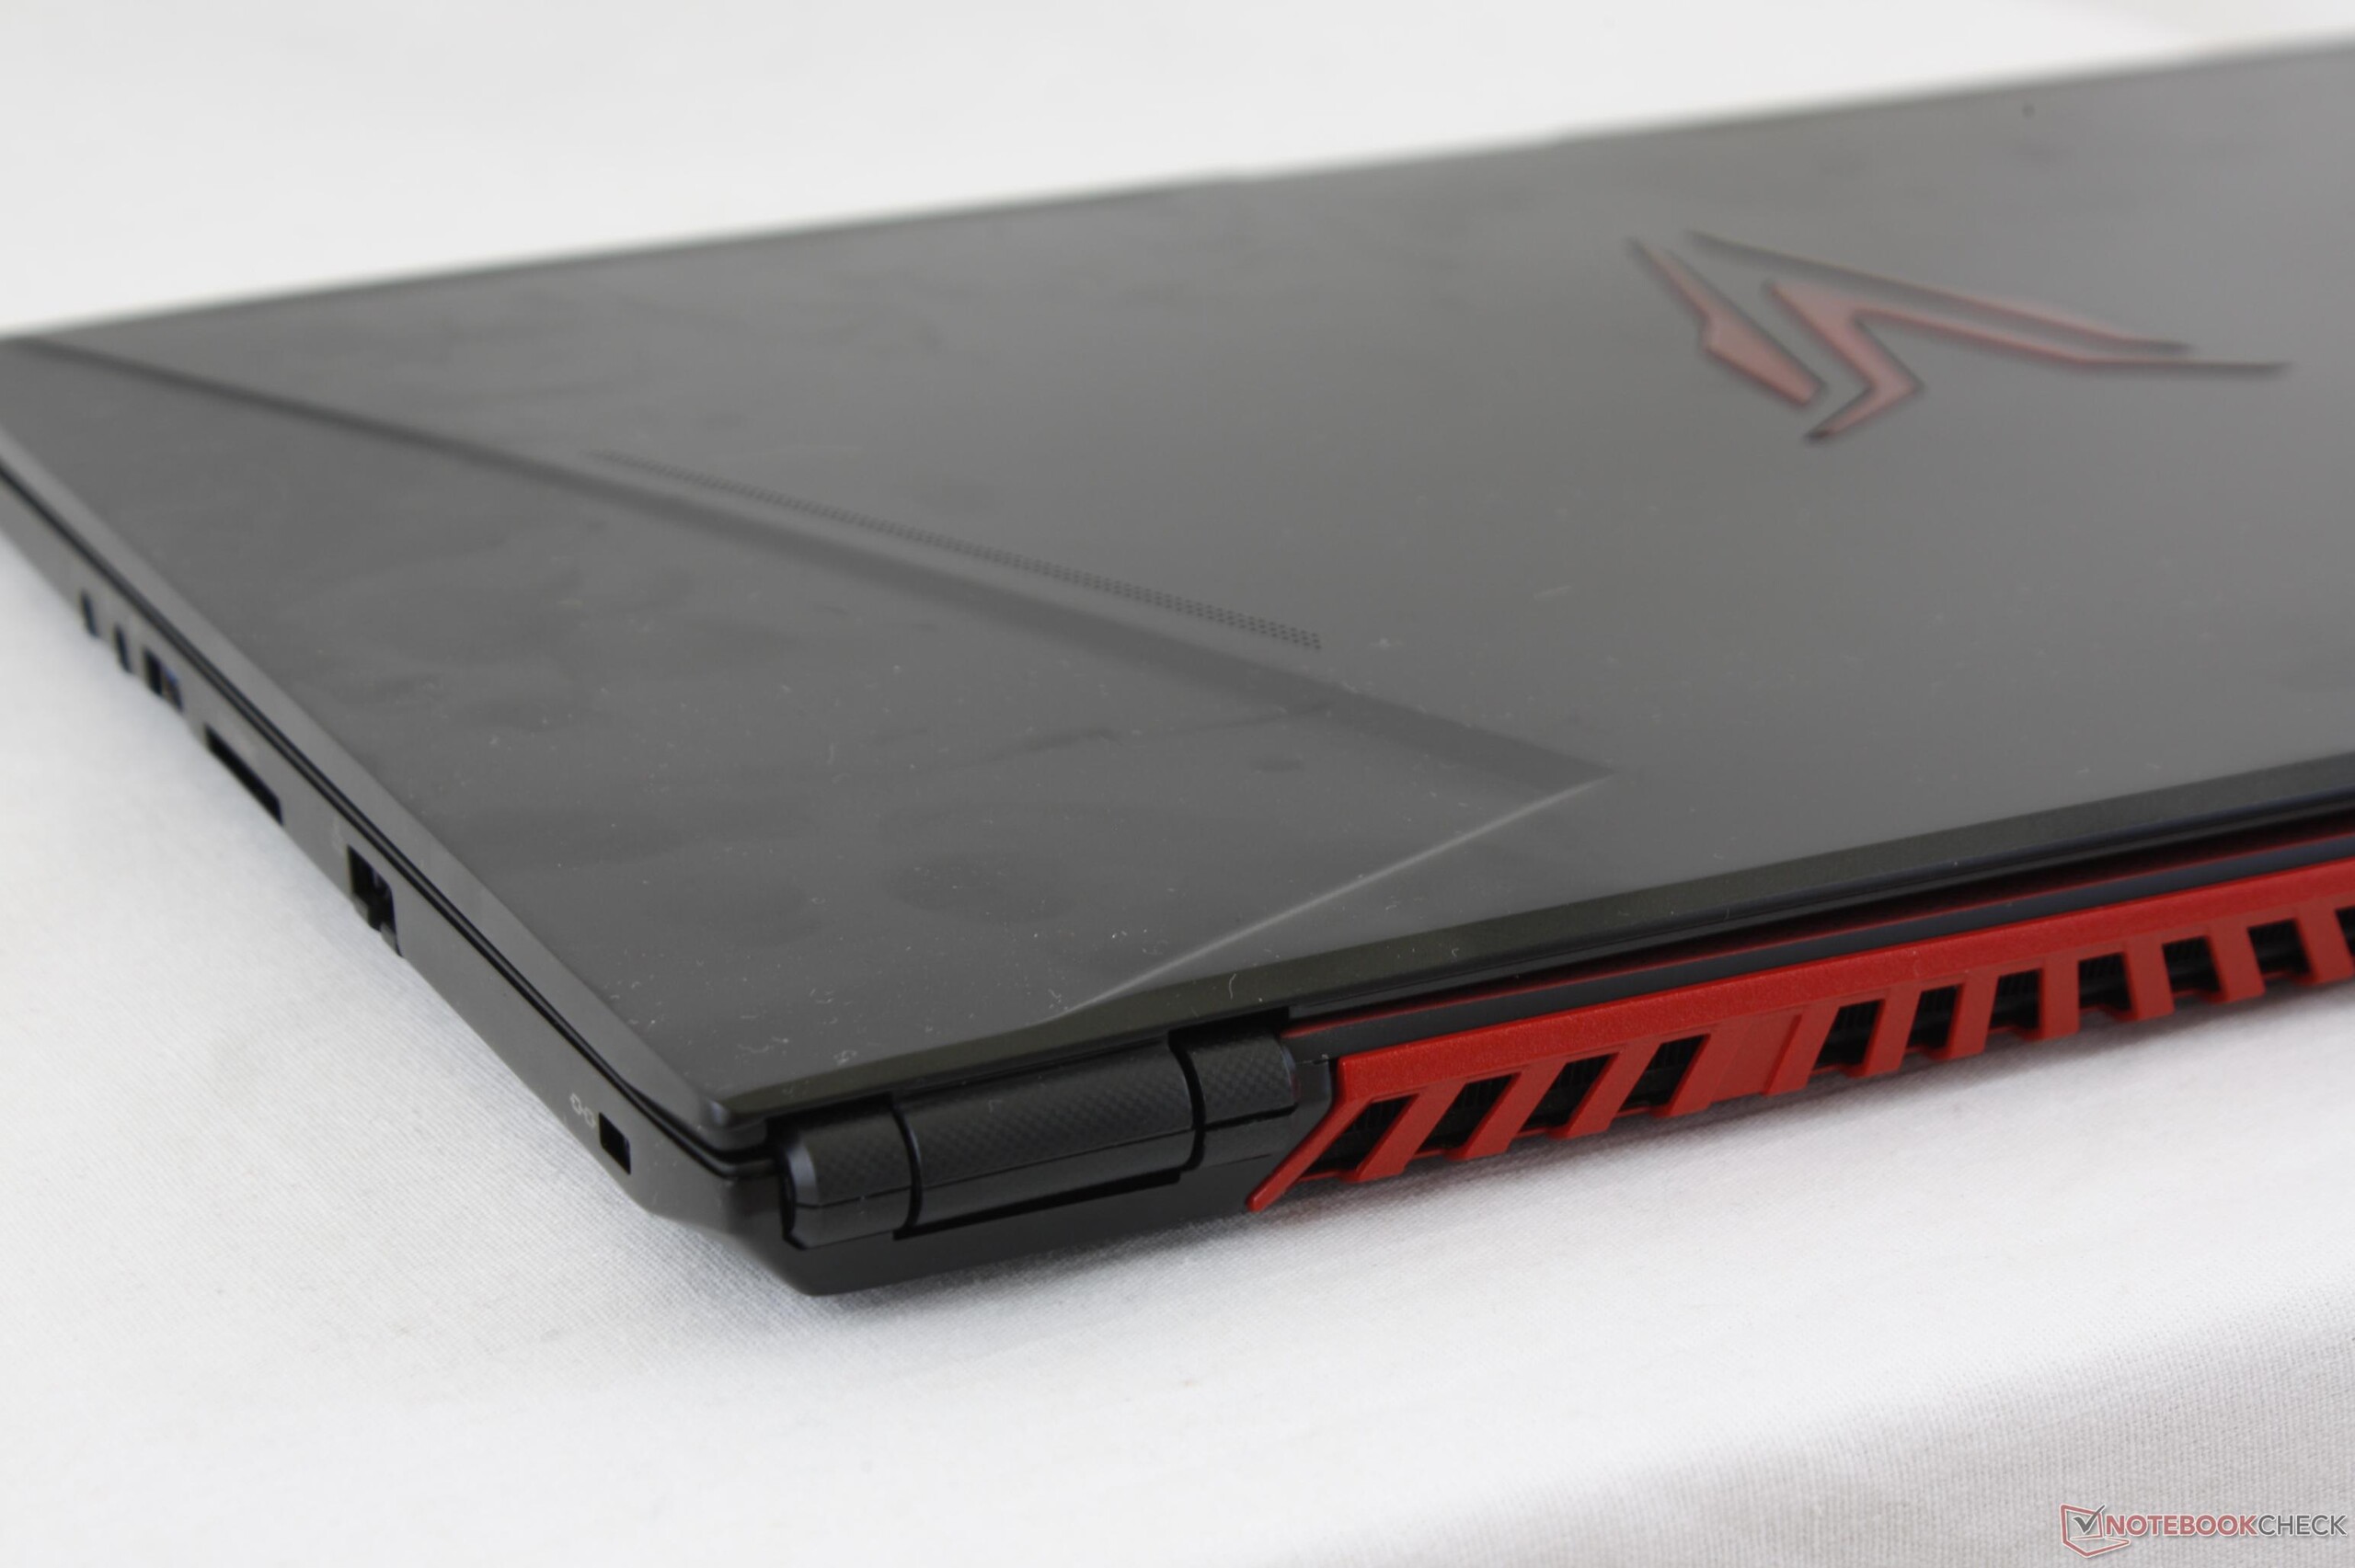
The chassis is nearly identical to the GS63VR in size and is subsequently one of the thinnest 15-inch gaming notebooks available with Pascal graphics. Demand for thinner and lighter gaming notebooks has been on the rise according to Eurocom and the Q5 is a direct response to these user requests. In particular, the size differences between the Q5 and other "standard" Clevo systems are night and day. It's still heavier than the GS63VR and Zephyrus, however, and so the Q5 can feel quite dense as a result. Most other gaming notebooks with GTX 1060 graphics or better are still significantly larger and thicker than the Eurocom including the Omen 15, Gigabyte P56XT, and especially the Alienware 15. Certain systems like the XPS 15 and Aero 15 can be noticeably smaller because of their thinner bezel designs.
Connectivity
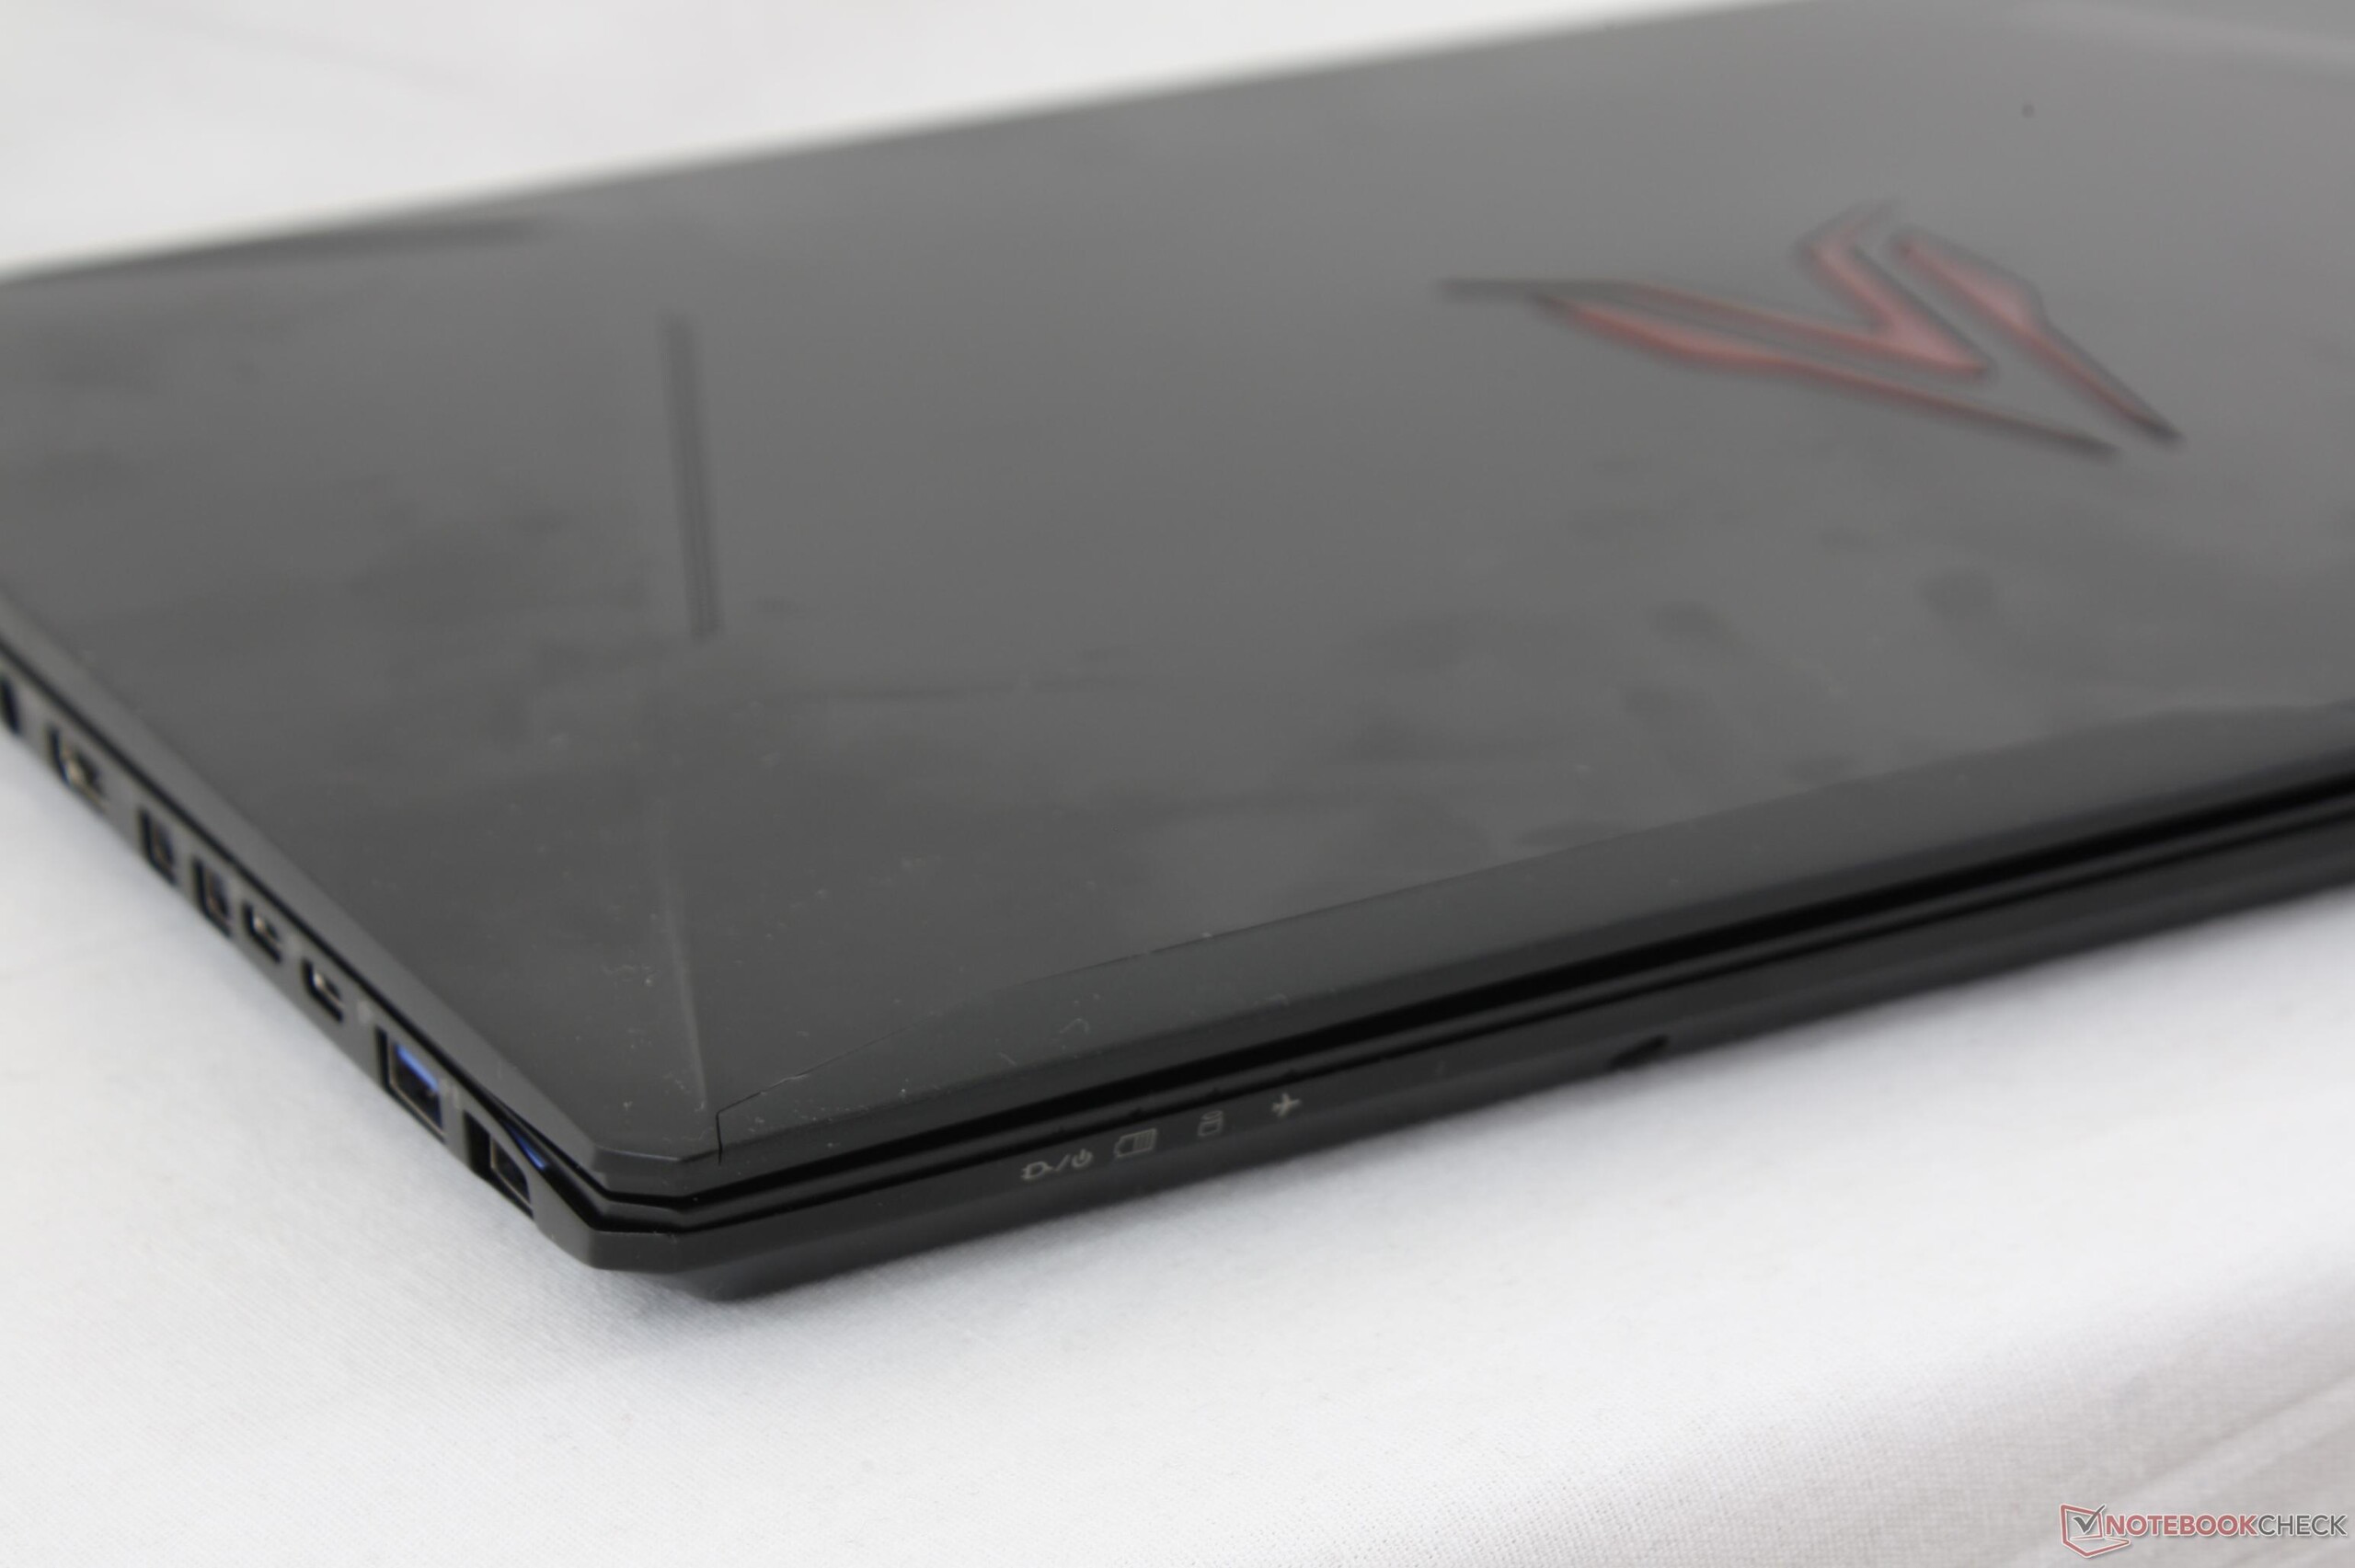
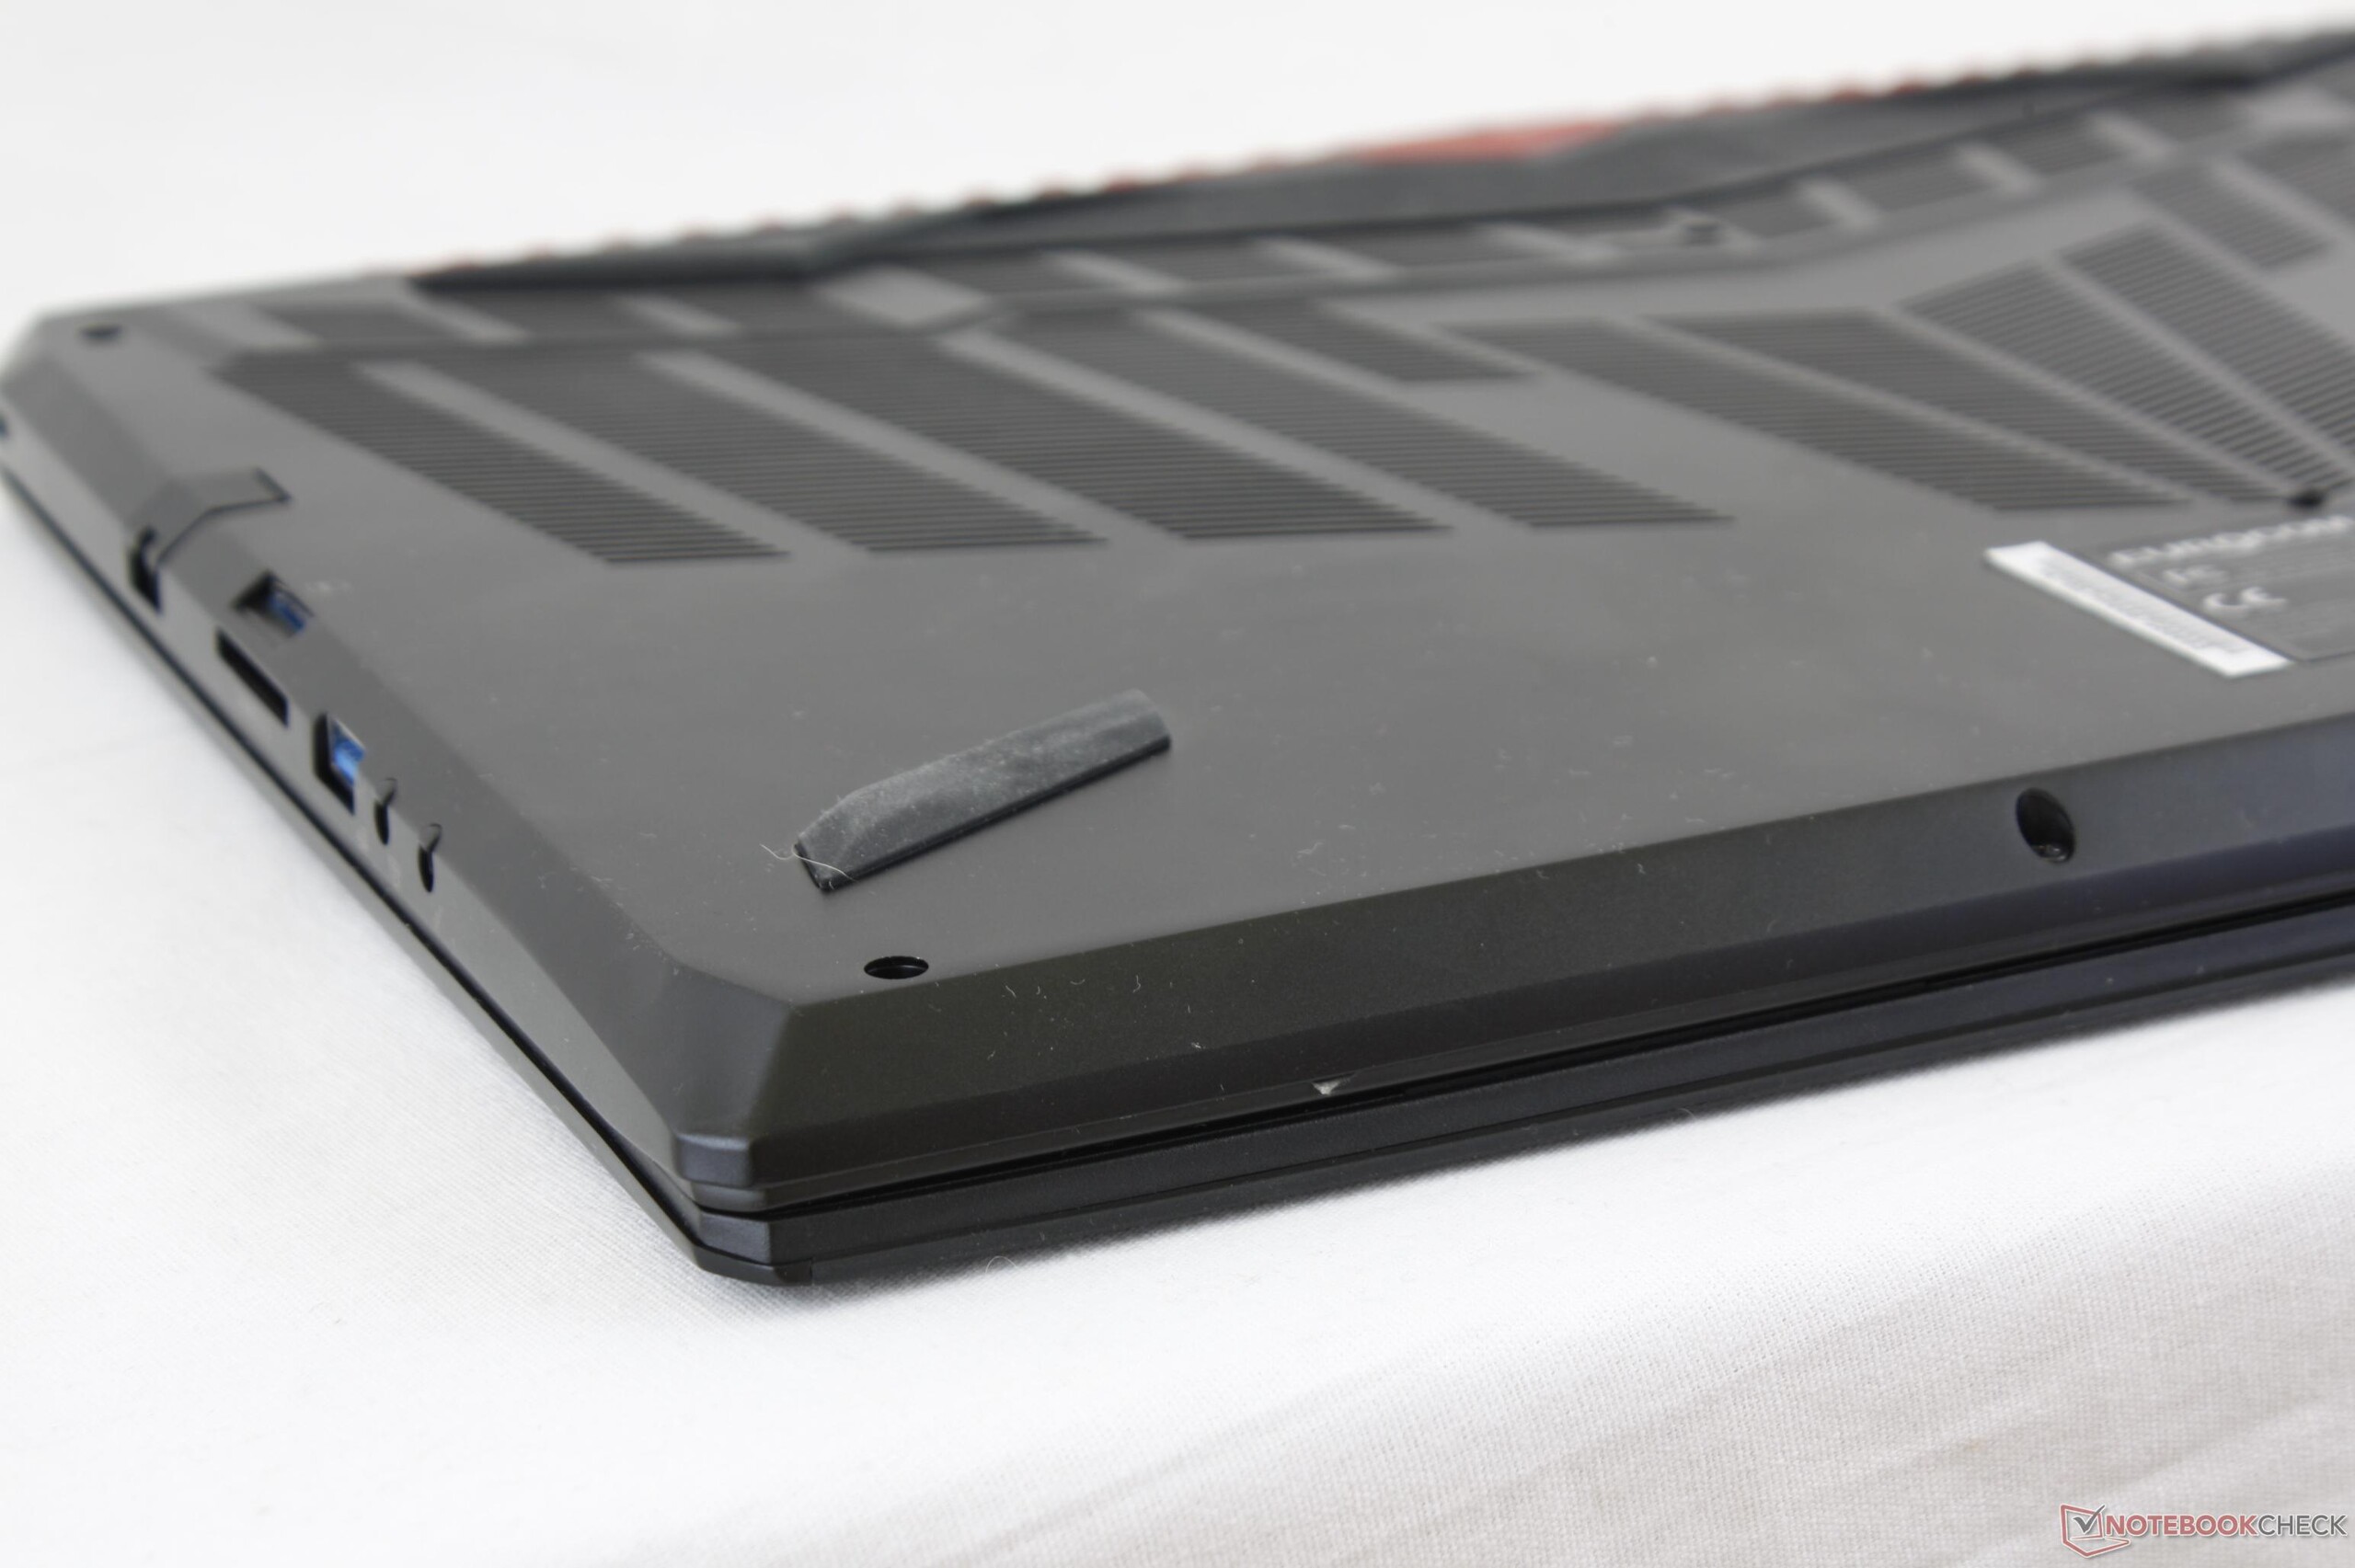
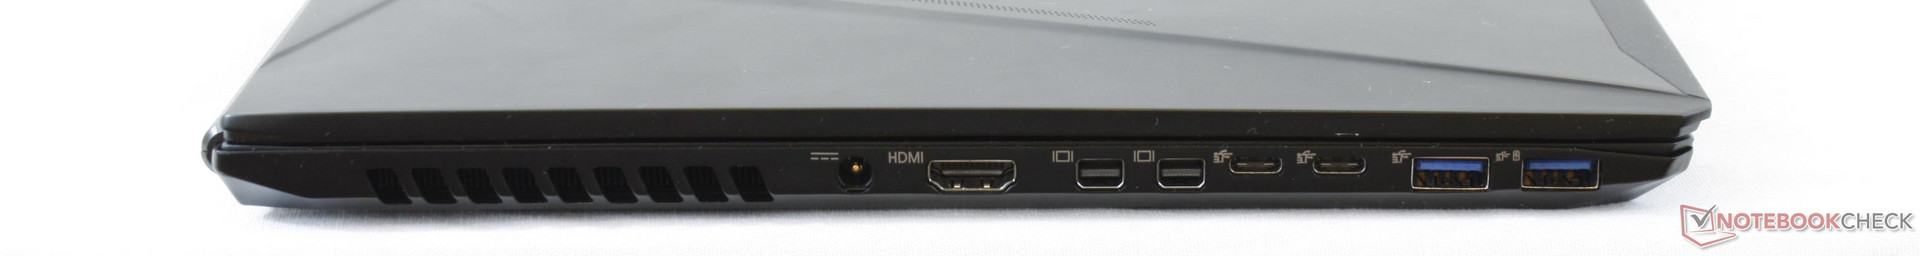
Plenty of ports are available as is common for a Clevo notebook. The triple video-out ports (up to 4K60 each) and double USB Type-C ports are more than what the GS63VR or GX501 have to offer and should prove useful for external monitor setups. The overt lack of Thunderbolt 3 is a bummer especially considering the high starting price.
Port positioning favors right-handed users as all the ports on the left edge are tightly packed up front. Expect thicker cables to occupy more desk space not unlike on the MSI GS equivalent since none are located on the rear of the notebook.
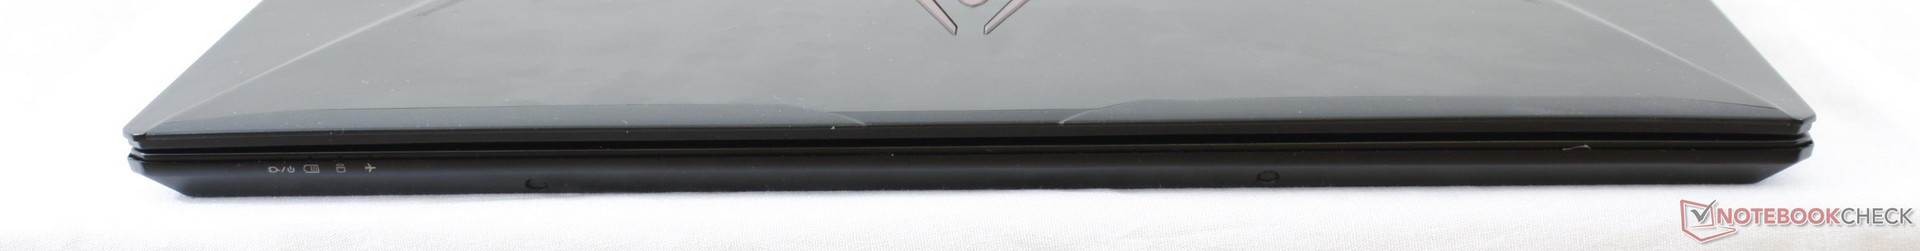

SD Card Reader
Performance from the spring-loaded card reader is faster than on most other gaming notebooks. Some competing ultra-slim models like the Zephyrus or 14-inch Razer blade lack card readers completely. We recorded a transfer rate of 212 MB/s with our Toshiba Exceria UHS-II SDXC card to be several times faster than the card readers on the GS63VR or Omen 15. Copying 1 GB worth of photos from card to desktop takes less than 6 seconds.
A fully inserted SD card will protrude by about 1 to 2 mm for safe handling and easy ejection.
| SD Card Reader | |
| average JPG Copy Test (av. of 3 runs) | |
| Eurocom Q5 | |
| HP Omen 15-ce002ng | |
| MSI GS63VR-6RF16H22 Stealth Pro | |
| maximum AS SSD Seq Read Test (1GB) | |
| Eurocom Q5 | |
| HP Omen 15-ce002ng | |
| MSI GS63VR-6RF16H22 Stealth Pro | |
Communication
WLAN and Bluetooth 4.2 are provided by an Intel 8265 M.2 2230 module with an option to upgrade to the Killer 1535. We recorded a real-world transfer rate of 669 Mbps when standing one meter away from our Linksys EA8500 test router with no notable connection issues or drops. The Killer alternative isn't necessarily faster, but its special software carries features that some gamers may find practical.
Unique to the Q5 is its mini SIM slot underneath the SD card reader. While our test configuration lacks the required M.2 WWAN module, the antennae are already in place for end-users to install Qualcomm Gobi cards. If 3G/4G/LTE/HSPA and GPS connectivity are important, then this can be considered a key advantage over most other gaming notebooks.
| Networking | |
| iperf3 transmit AX12 | |
| Alienware 15 R3 | |
| Eurocom Q5 | |
| Asus Zephyrus GX501VS | |
| iperf3 receive AX12 | |
| Alienware 15 R3 | |
| Eurocom Q5 | |
| Asus Zephyrus GX501VS | |
Accessories
There are no included extras outside of the AC adapter. Clevo and Eurocom systems have traditionally shipped with detailed disassembly manuals and extra screws, so it's a bit disappointing to see them missing here for the Q5.
Maintenance
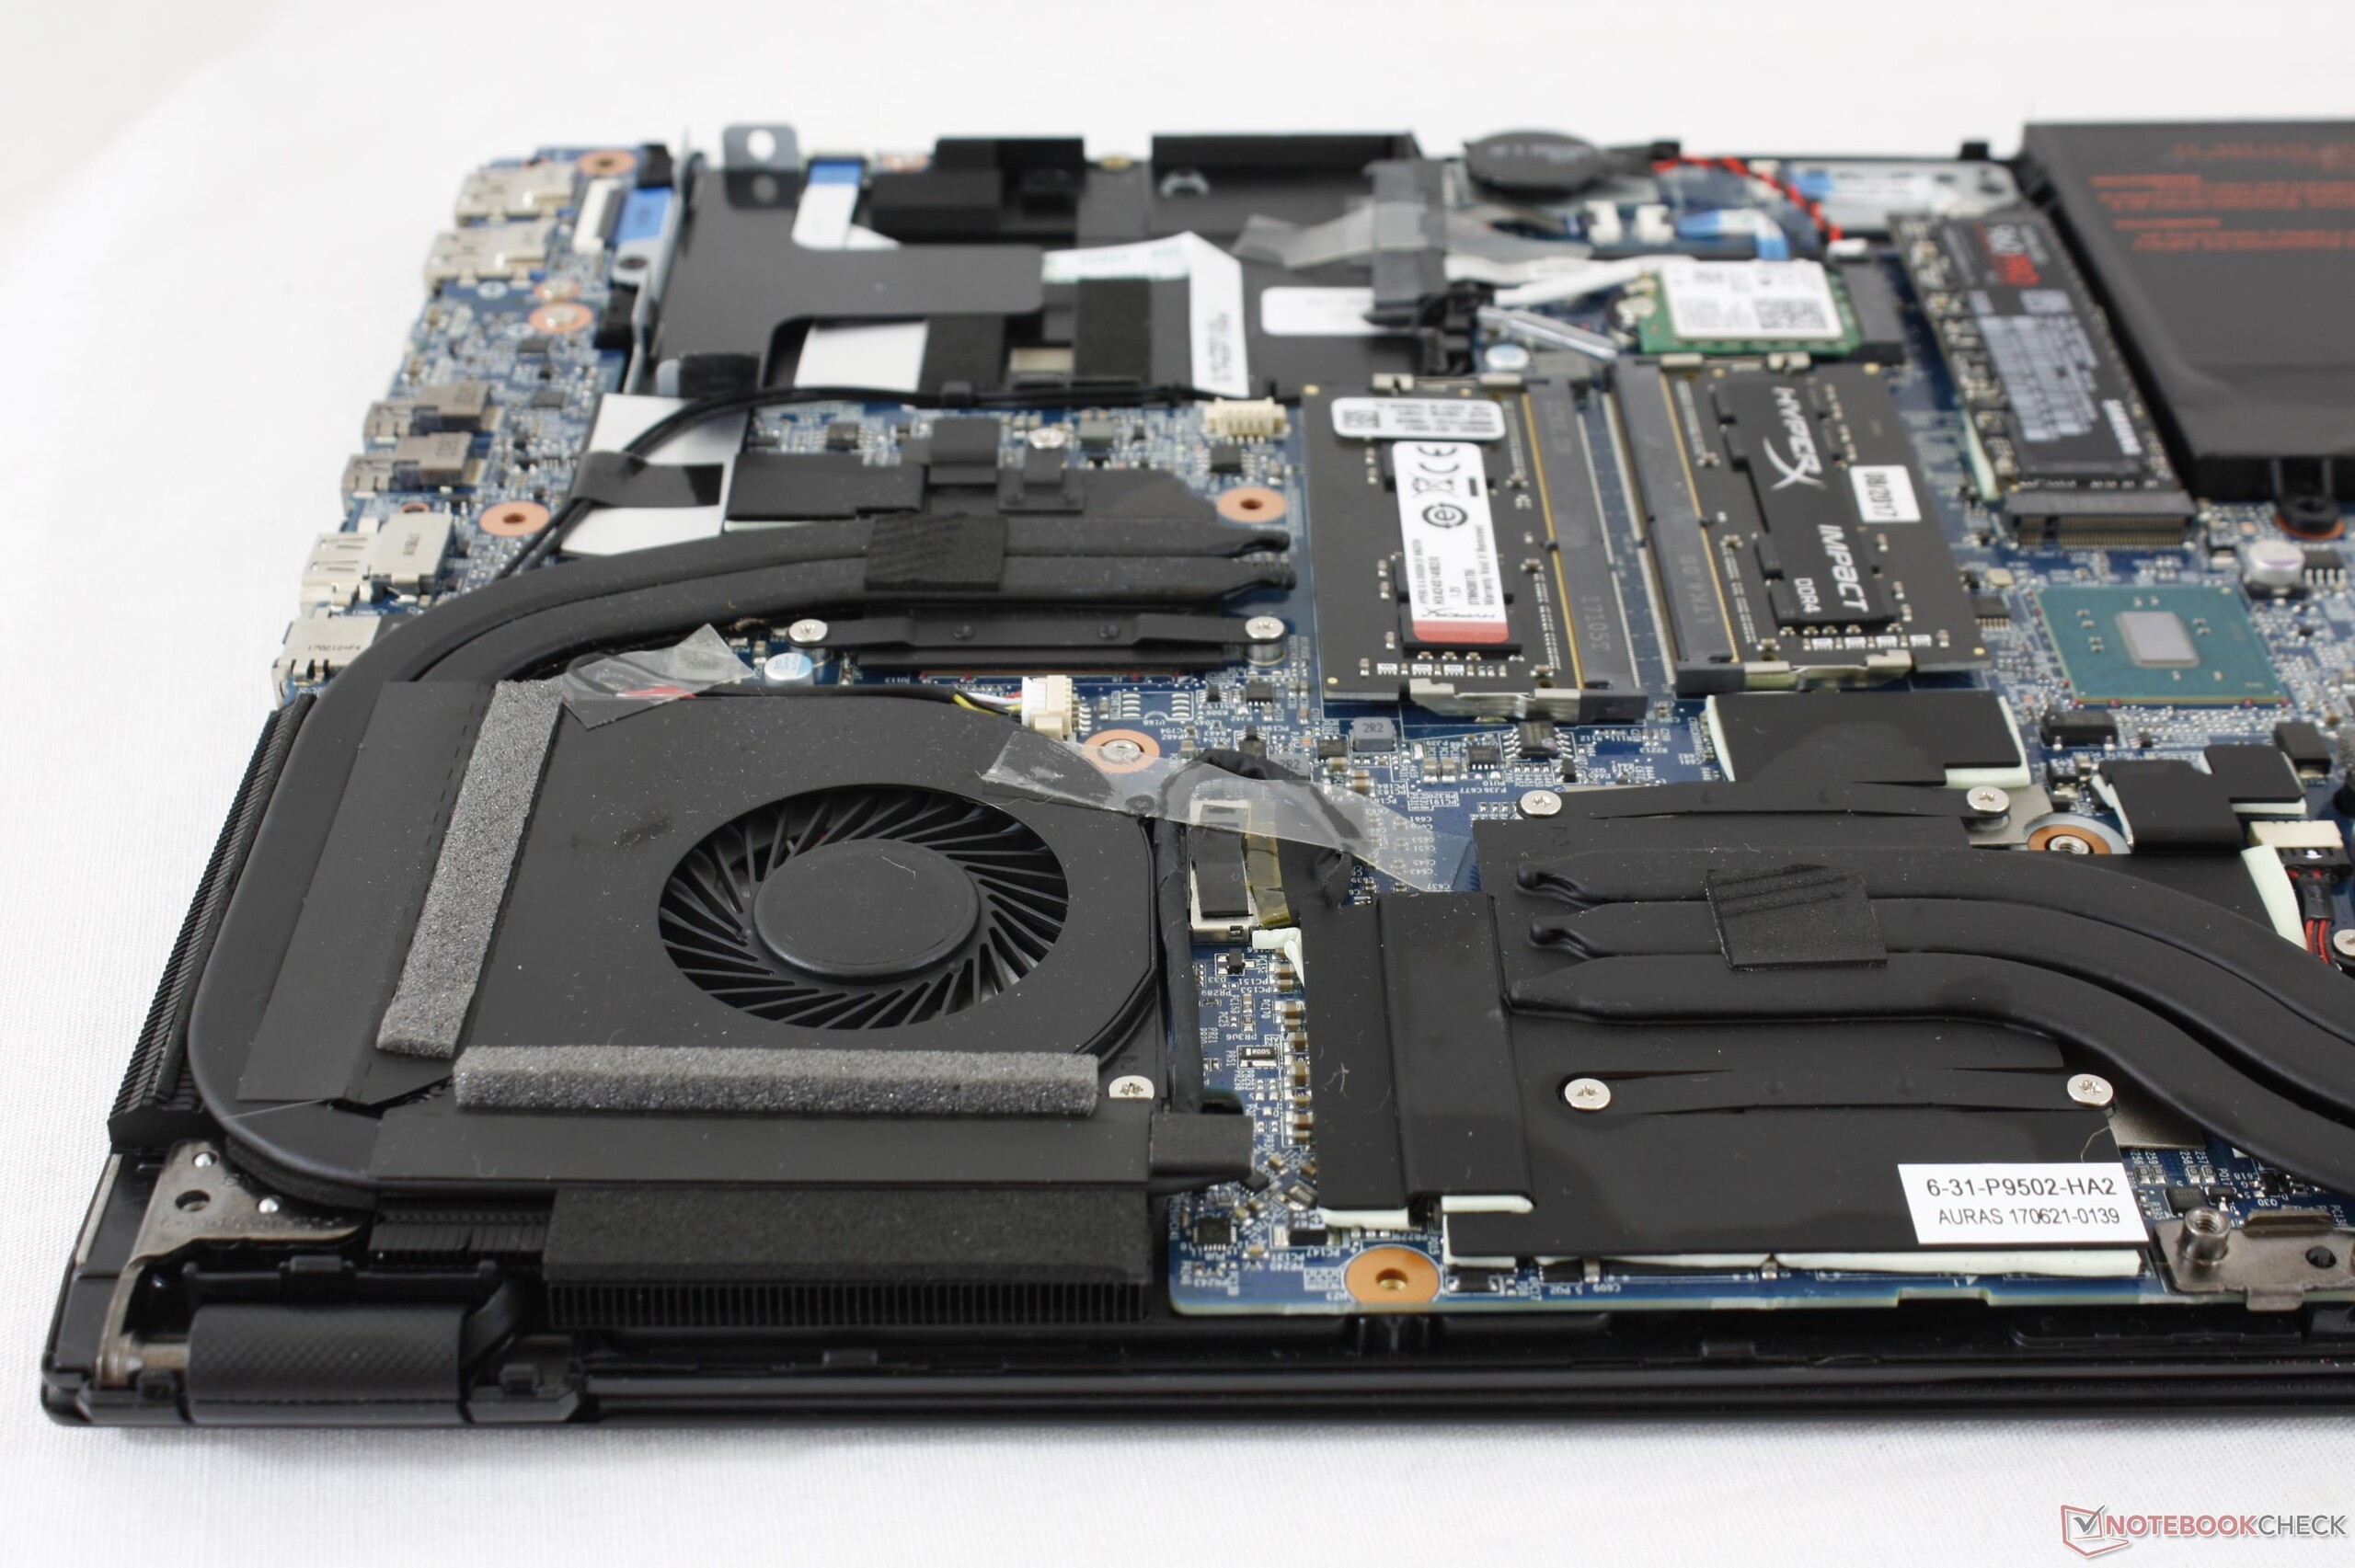
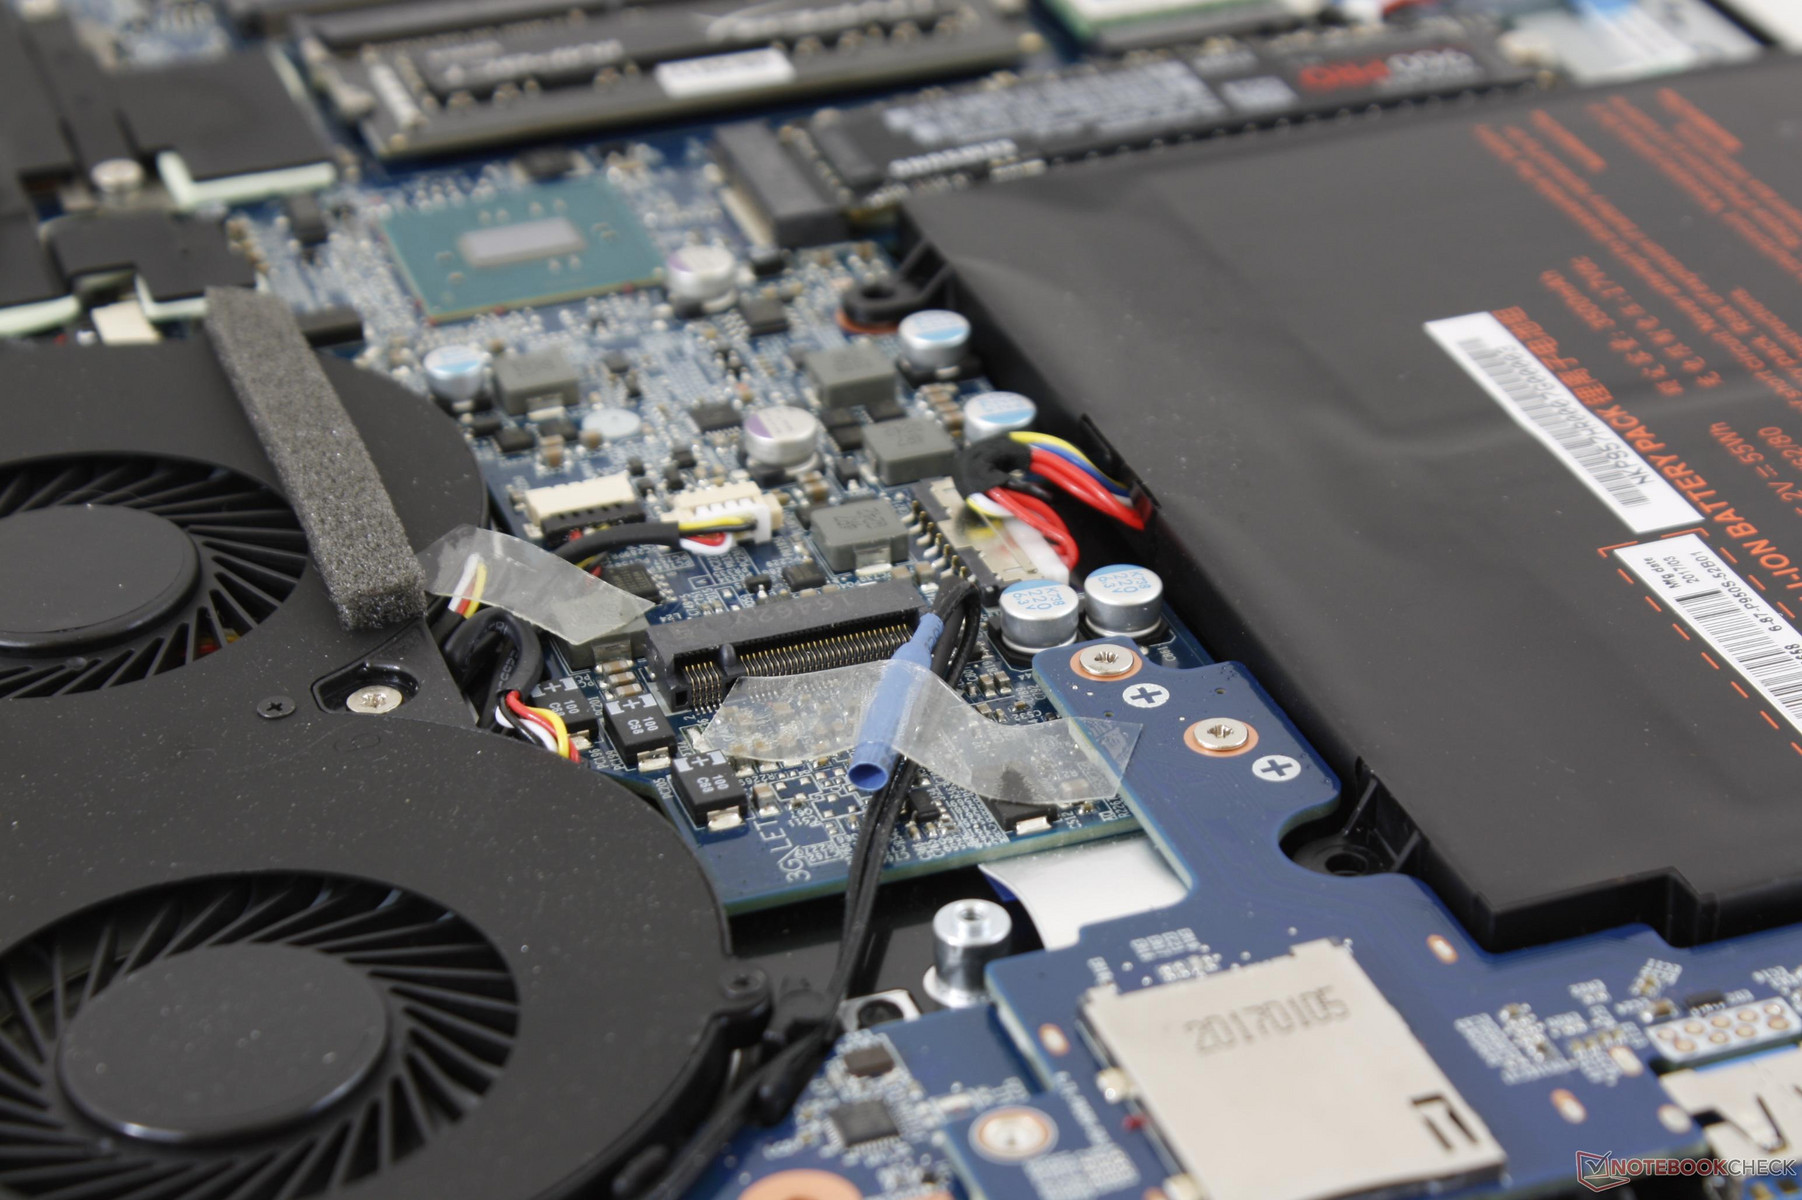
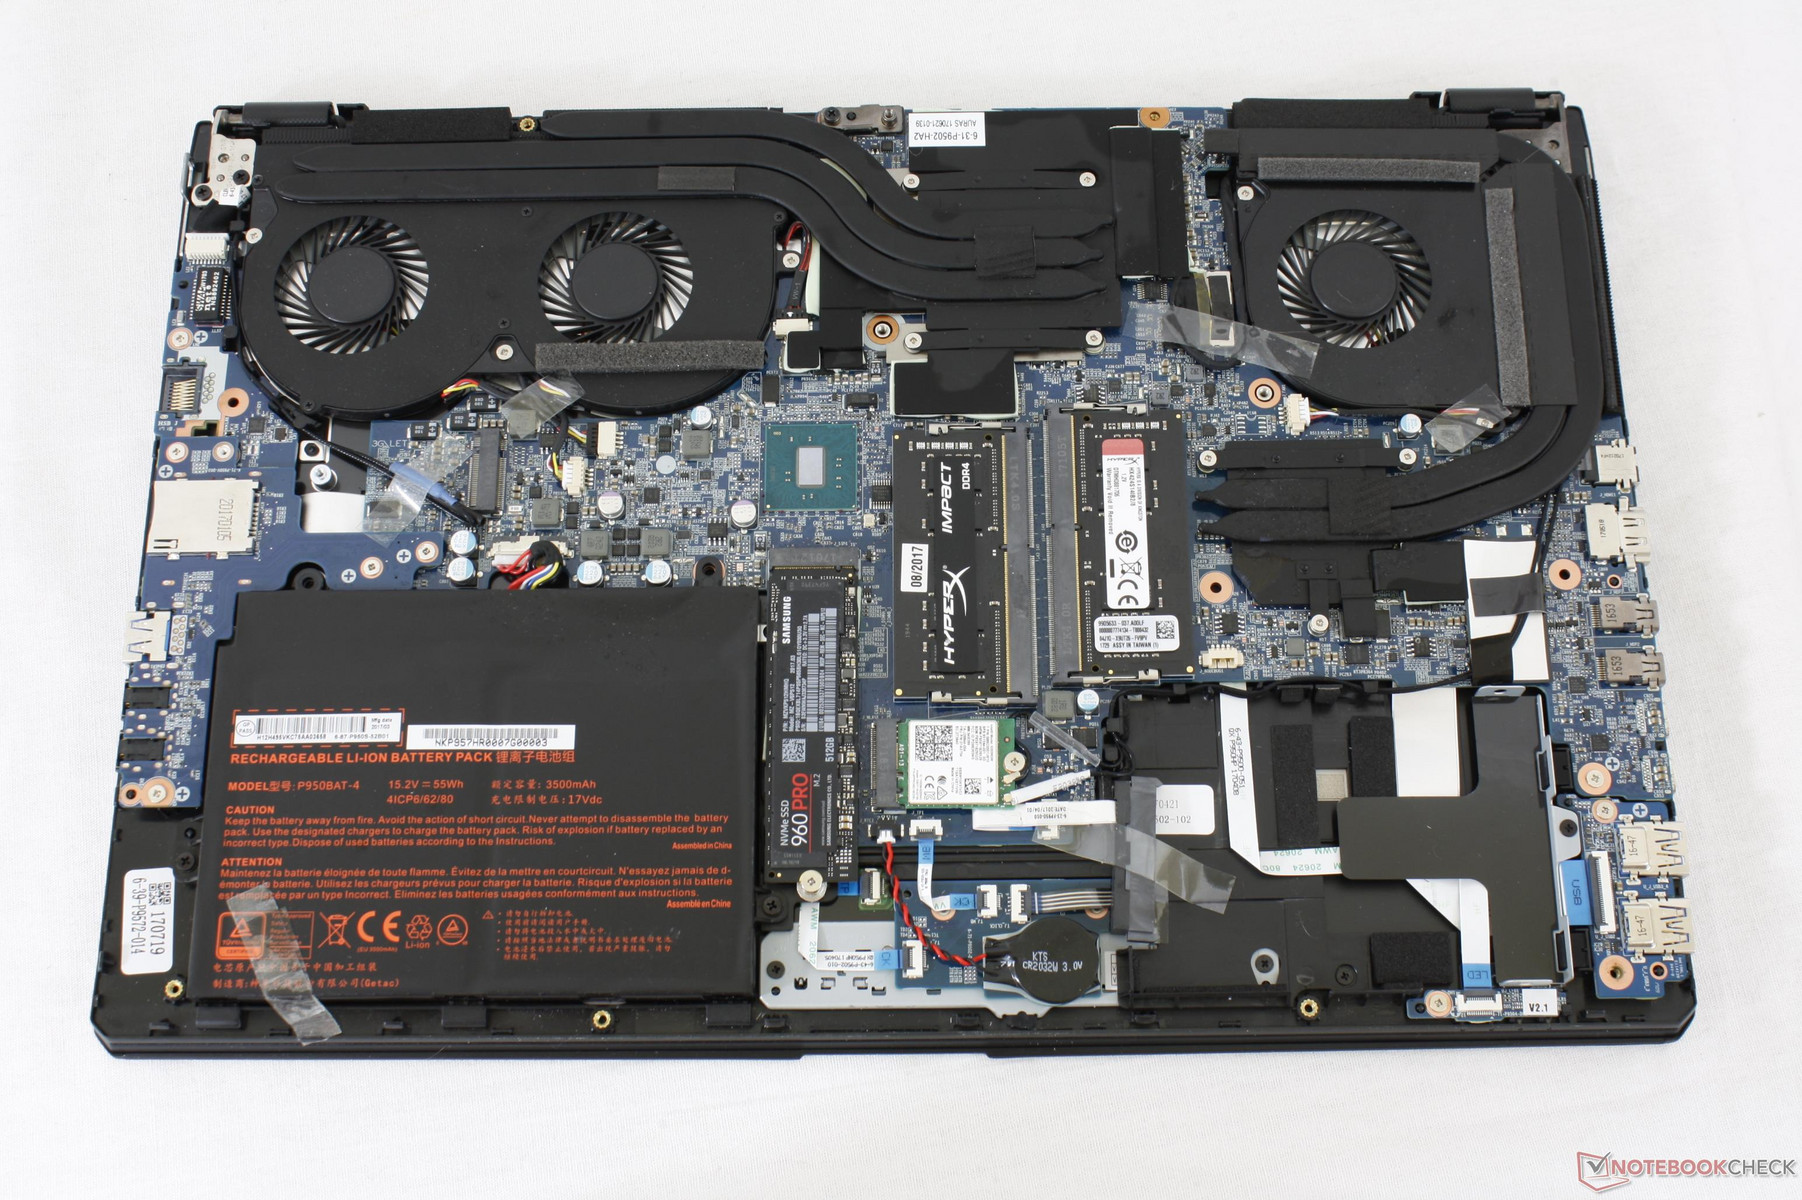
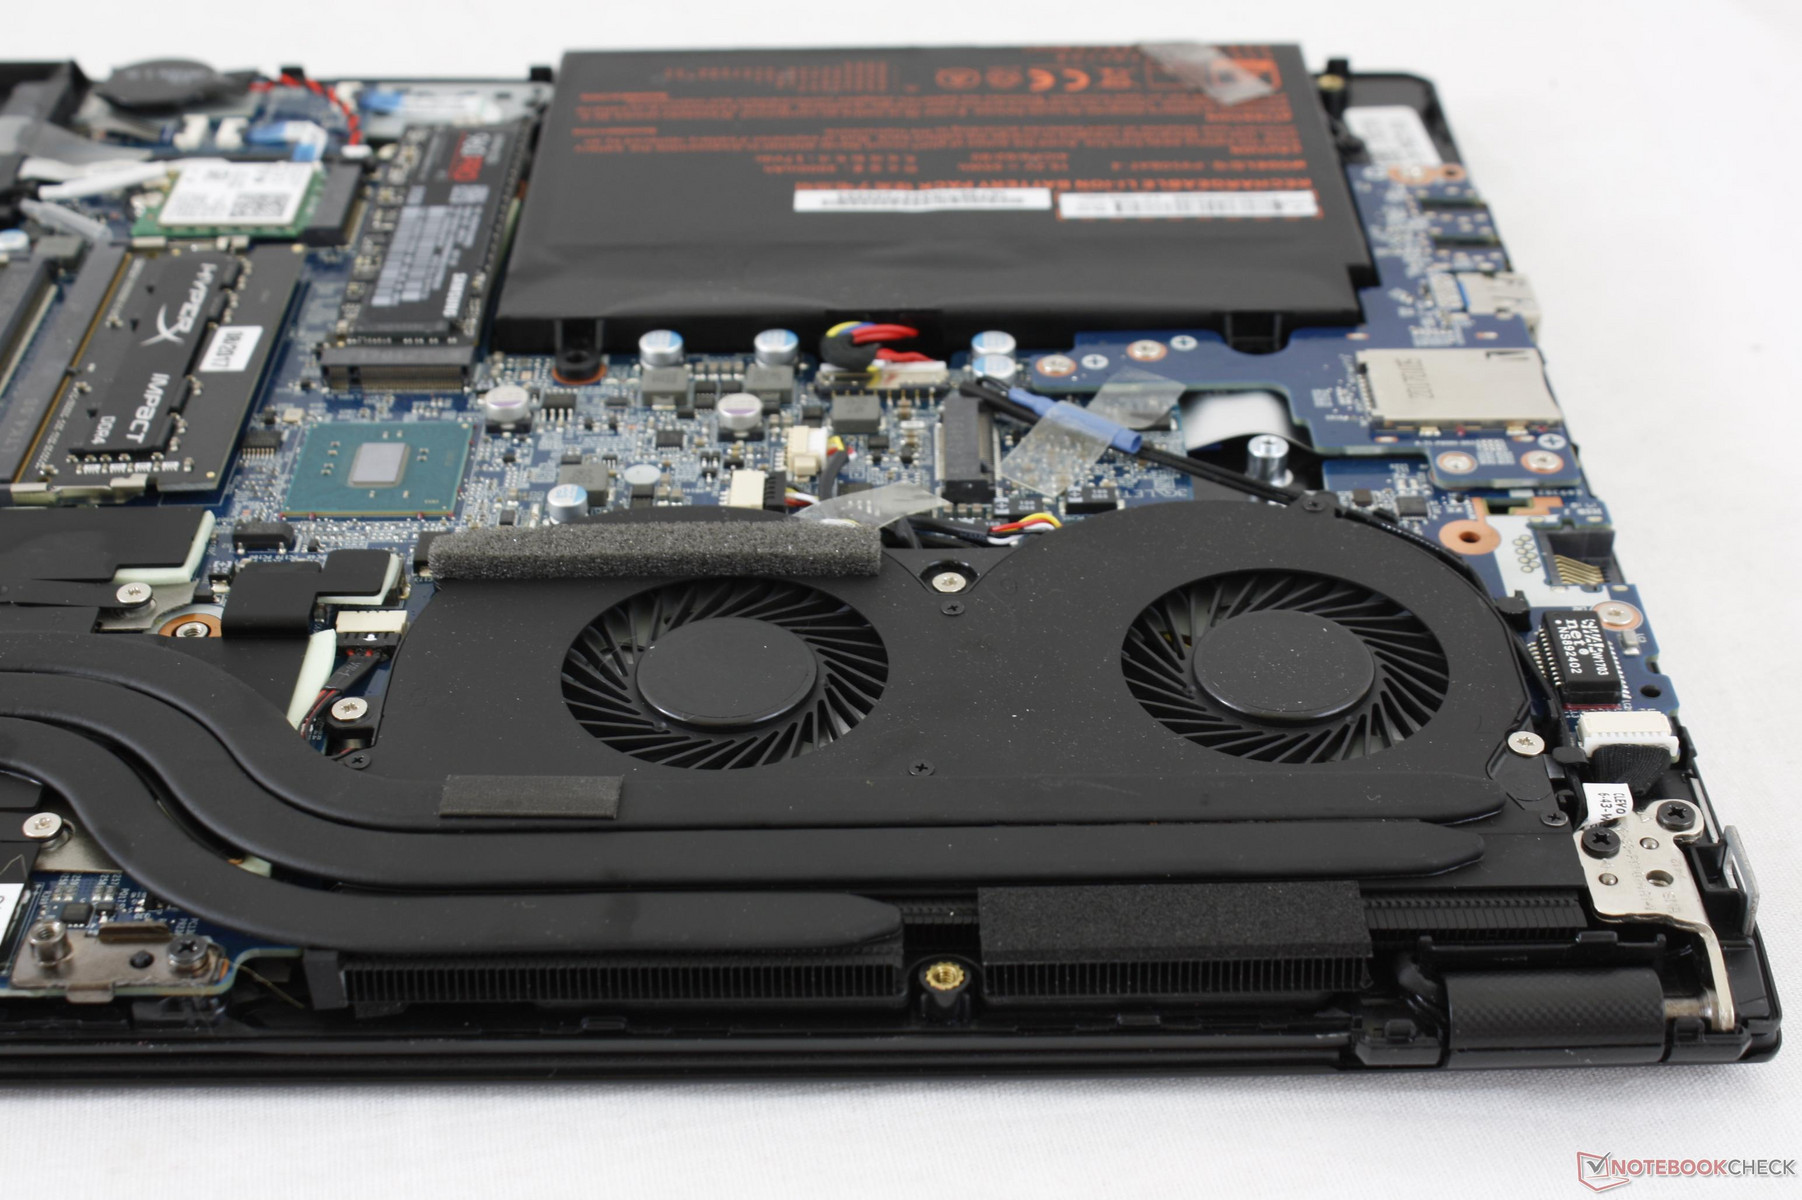
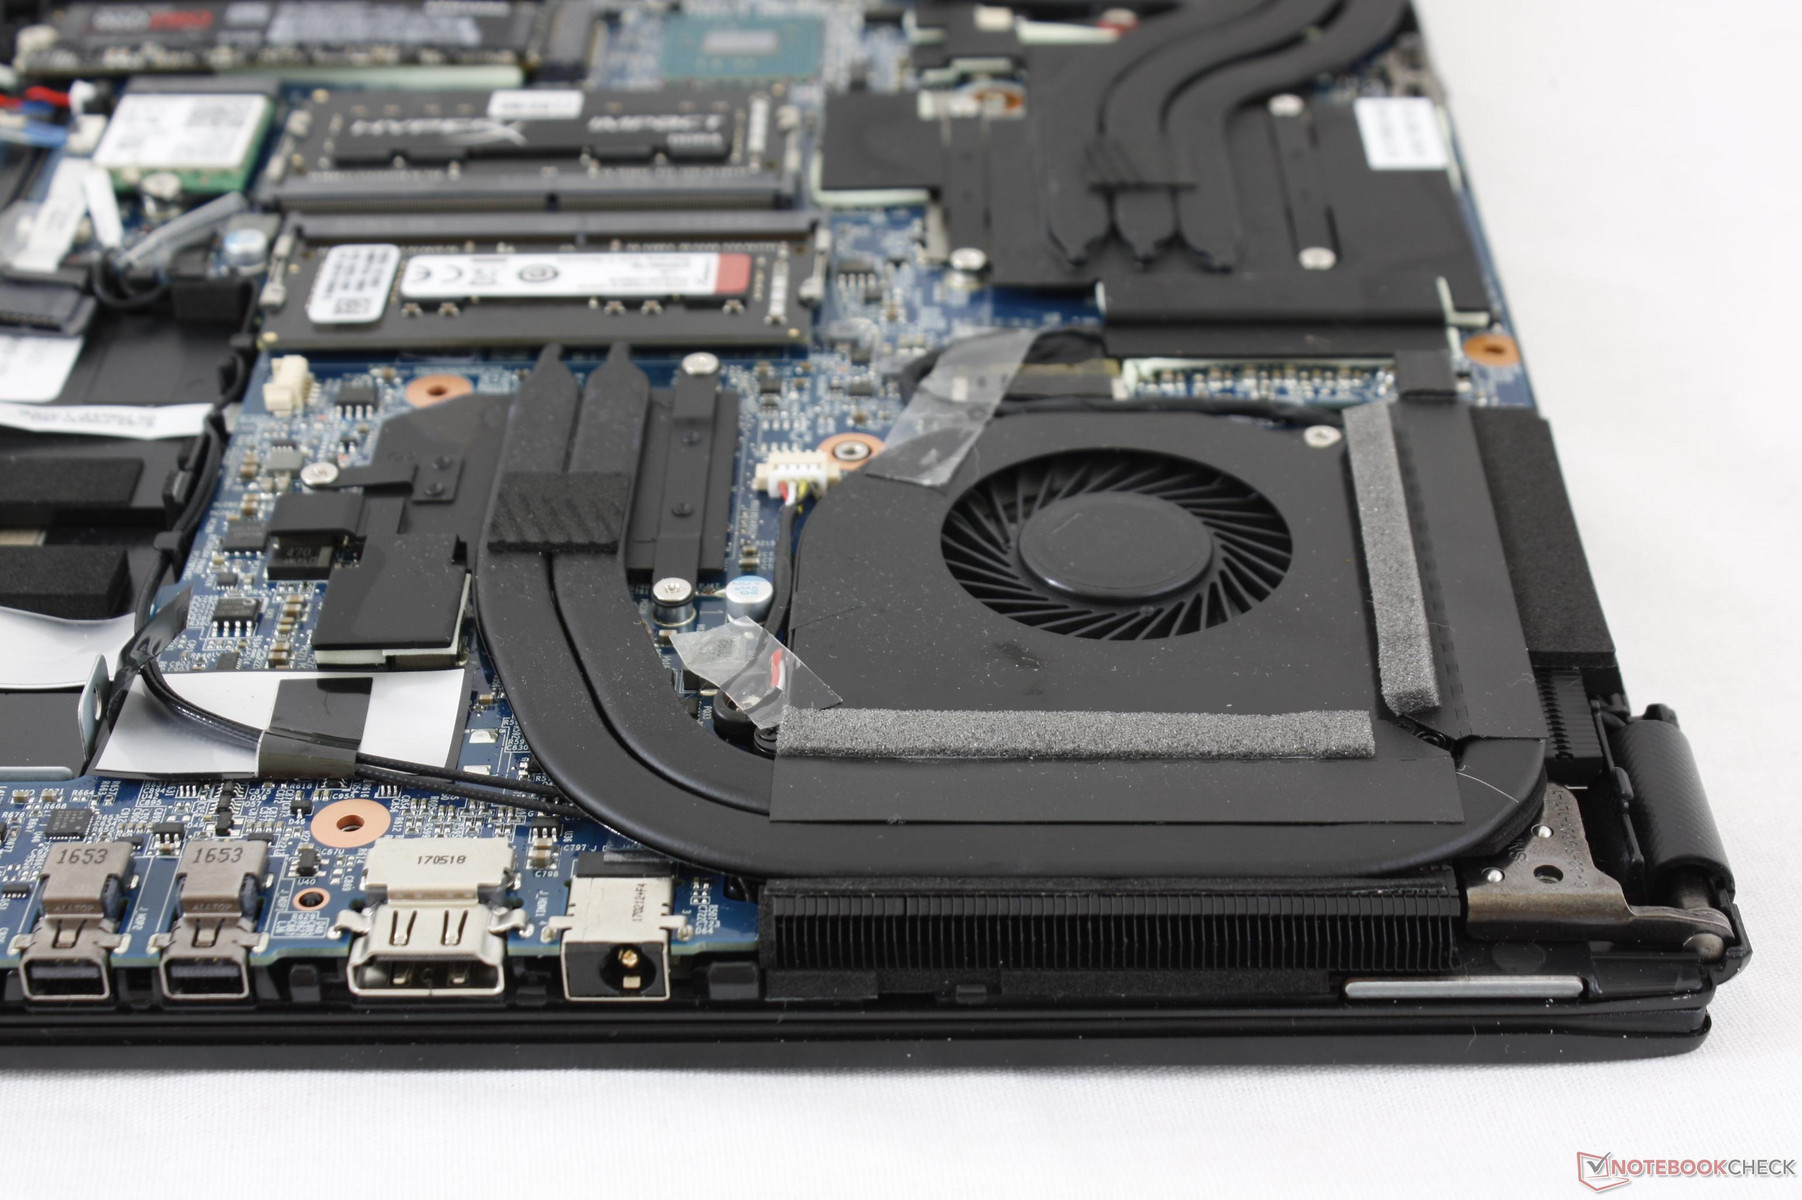
Serviceability is easy and requires only a Philips screwdriver to remove the 11 screws and entire bottom panel. Users have direct access to all core components including the heat sinks, fans, storage bays, M.2 modules, battery, and both SODIMM slots without additional disassembly.
Warranty
The standard one-year limited warranty applies with two-year and three-year optional extensions. Gigabyte offers two-year global warranty as standard for some of its higher-end gaming notebooks compared to what Eurocom is offering. Please see our Guarantees, Return policies and Warranties FAQ for country-specific information.
Input Devices
Keyboard
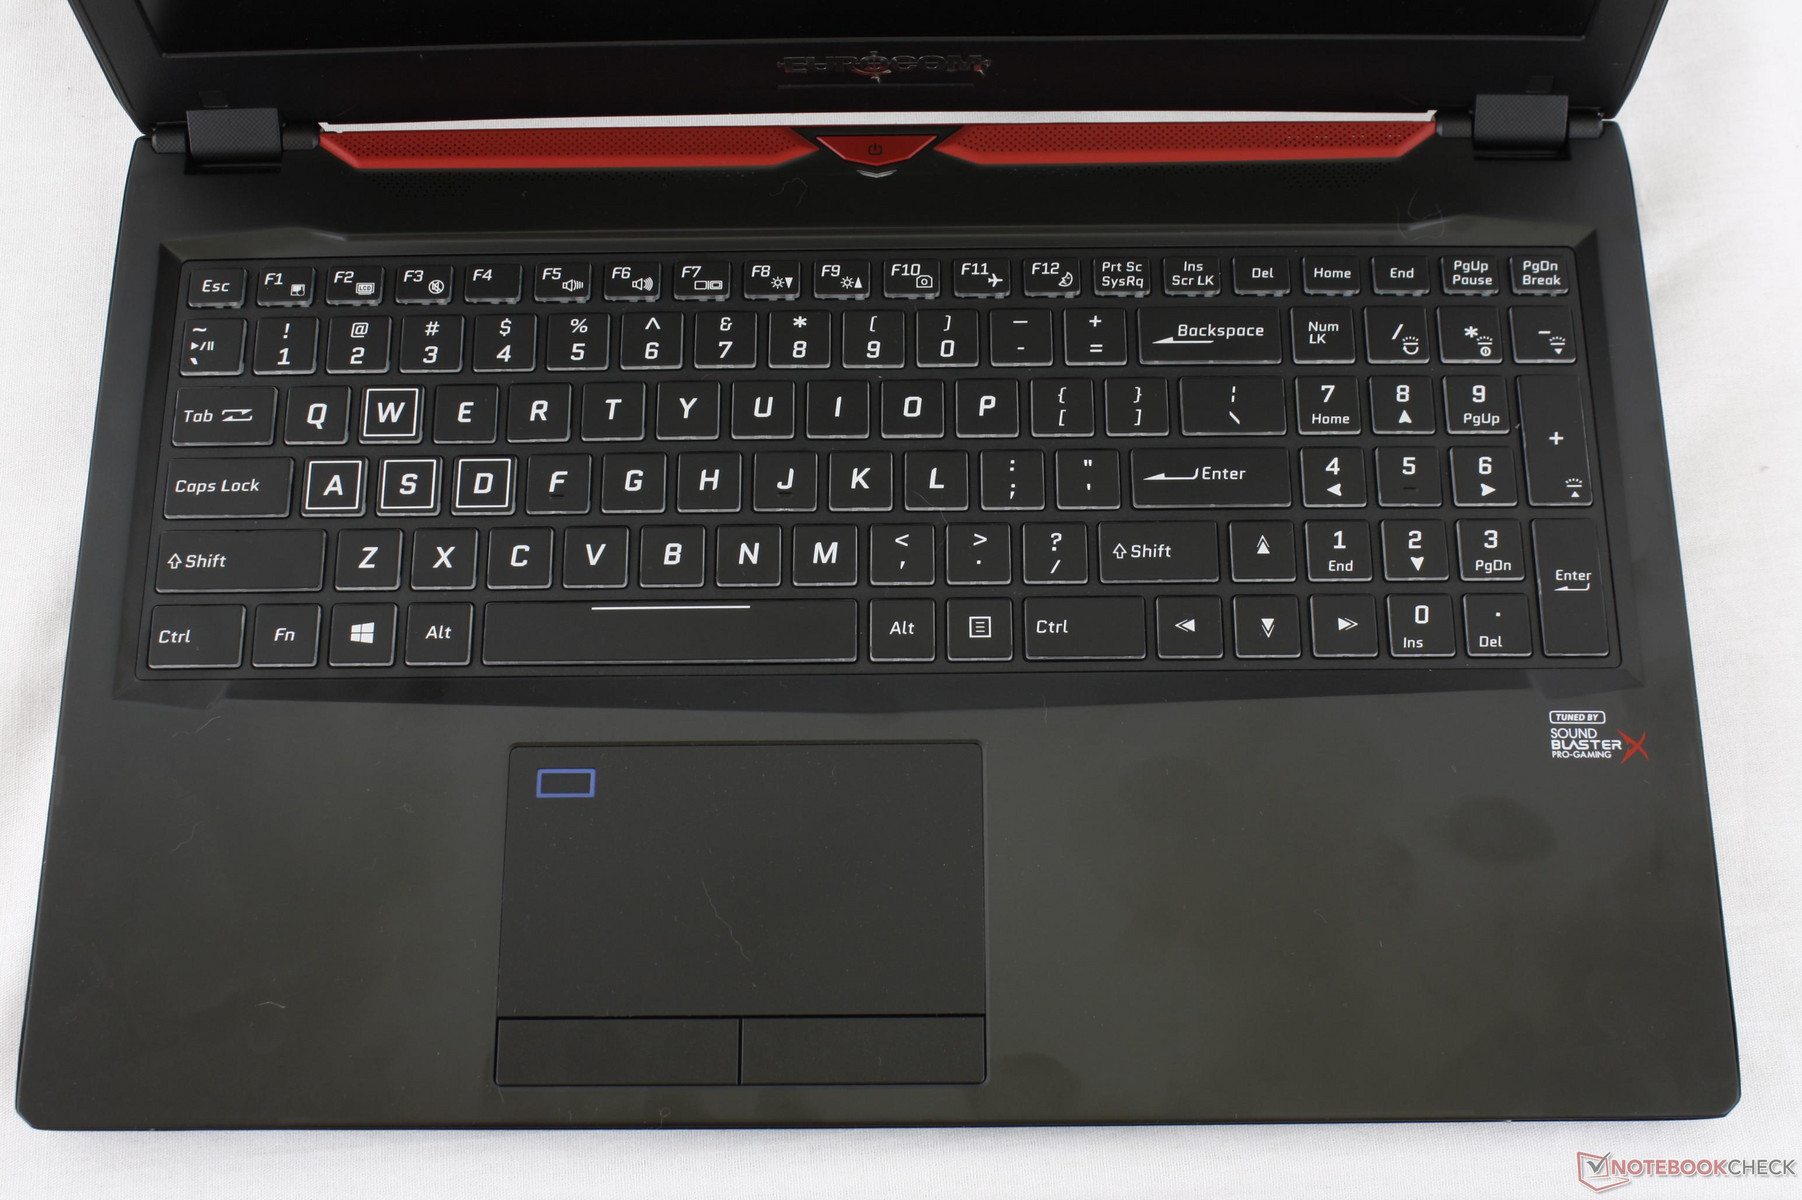
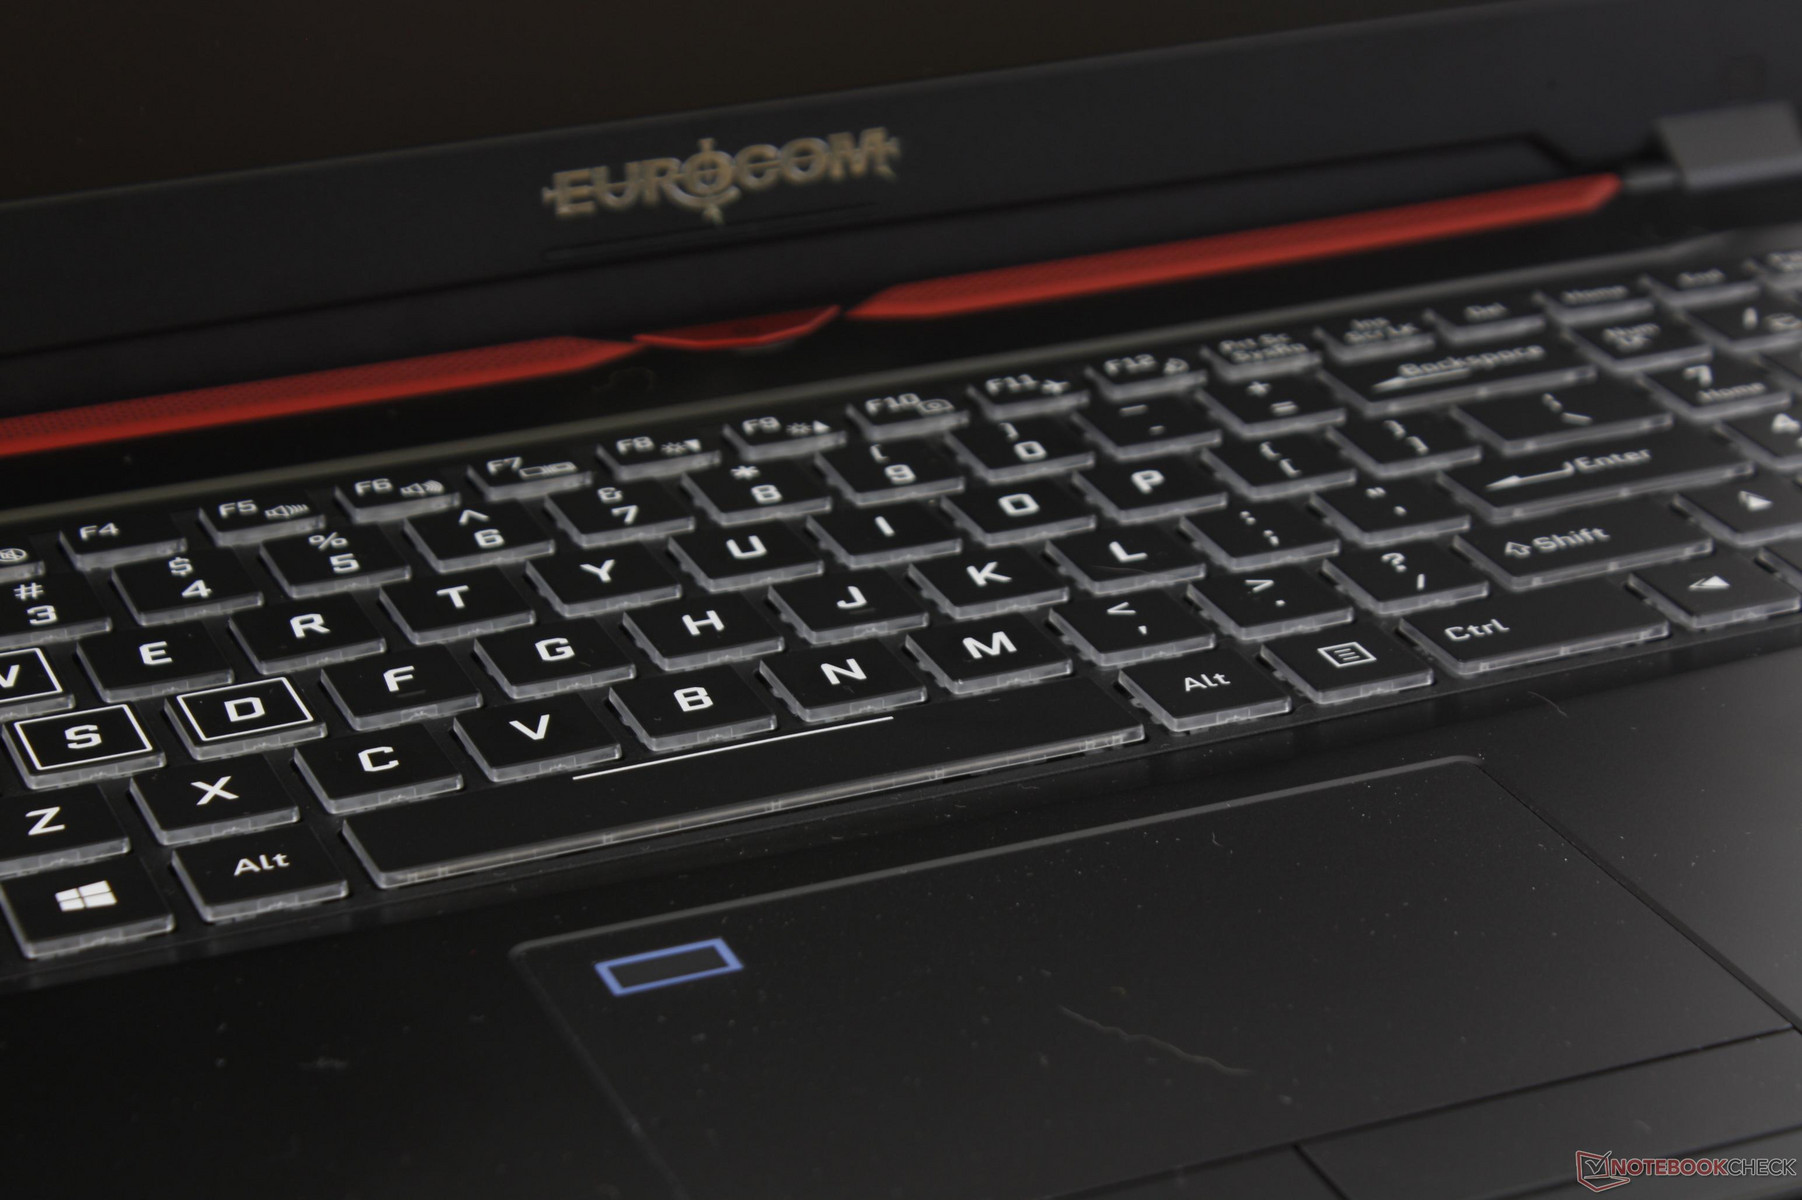
Aside from the different font type, the Q5 keyboard (~ 34.0 x 10.5 cm) looks almost identical to the SteelSeries keyboard on the MSI GS series down to the translucent edges and corners of each individual key. Tactile feedback is on the soft side with low-medium clatter. Typing is spacious and comfortable for word processing and emailing, but firmer keys would have been more appropriate for gaming purposes.
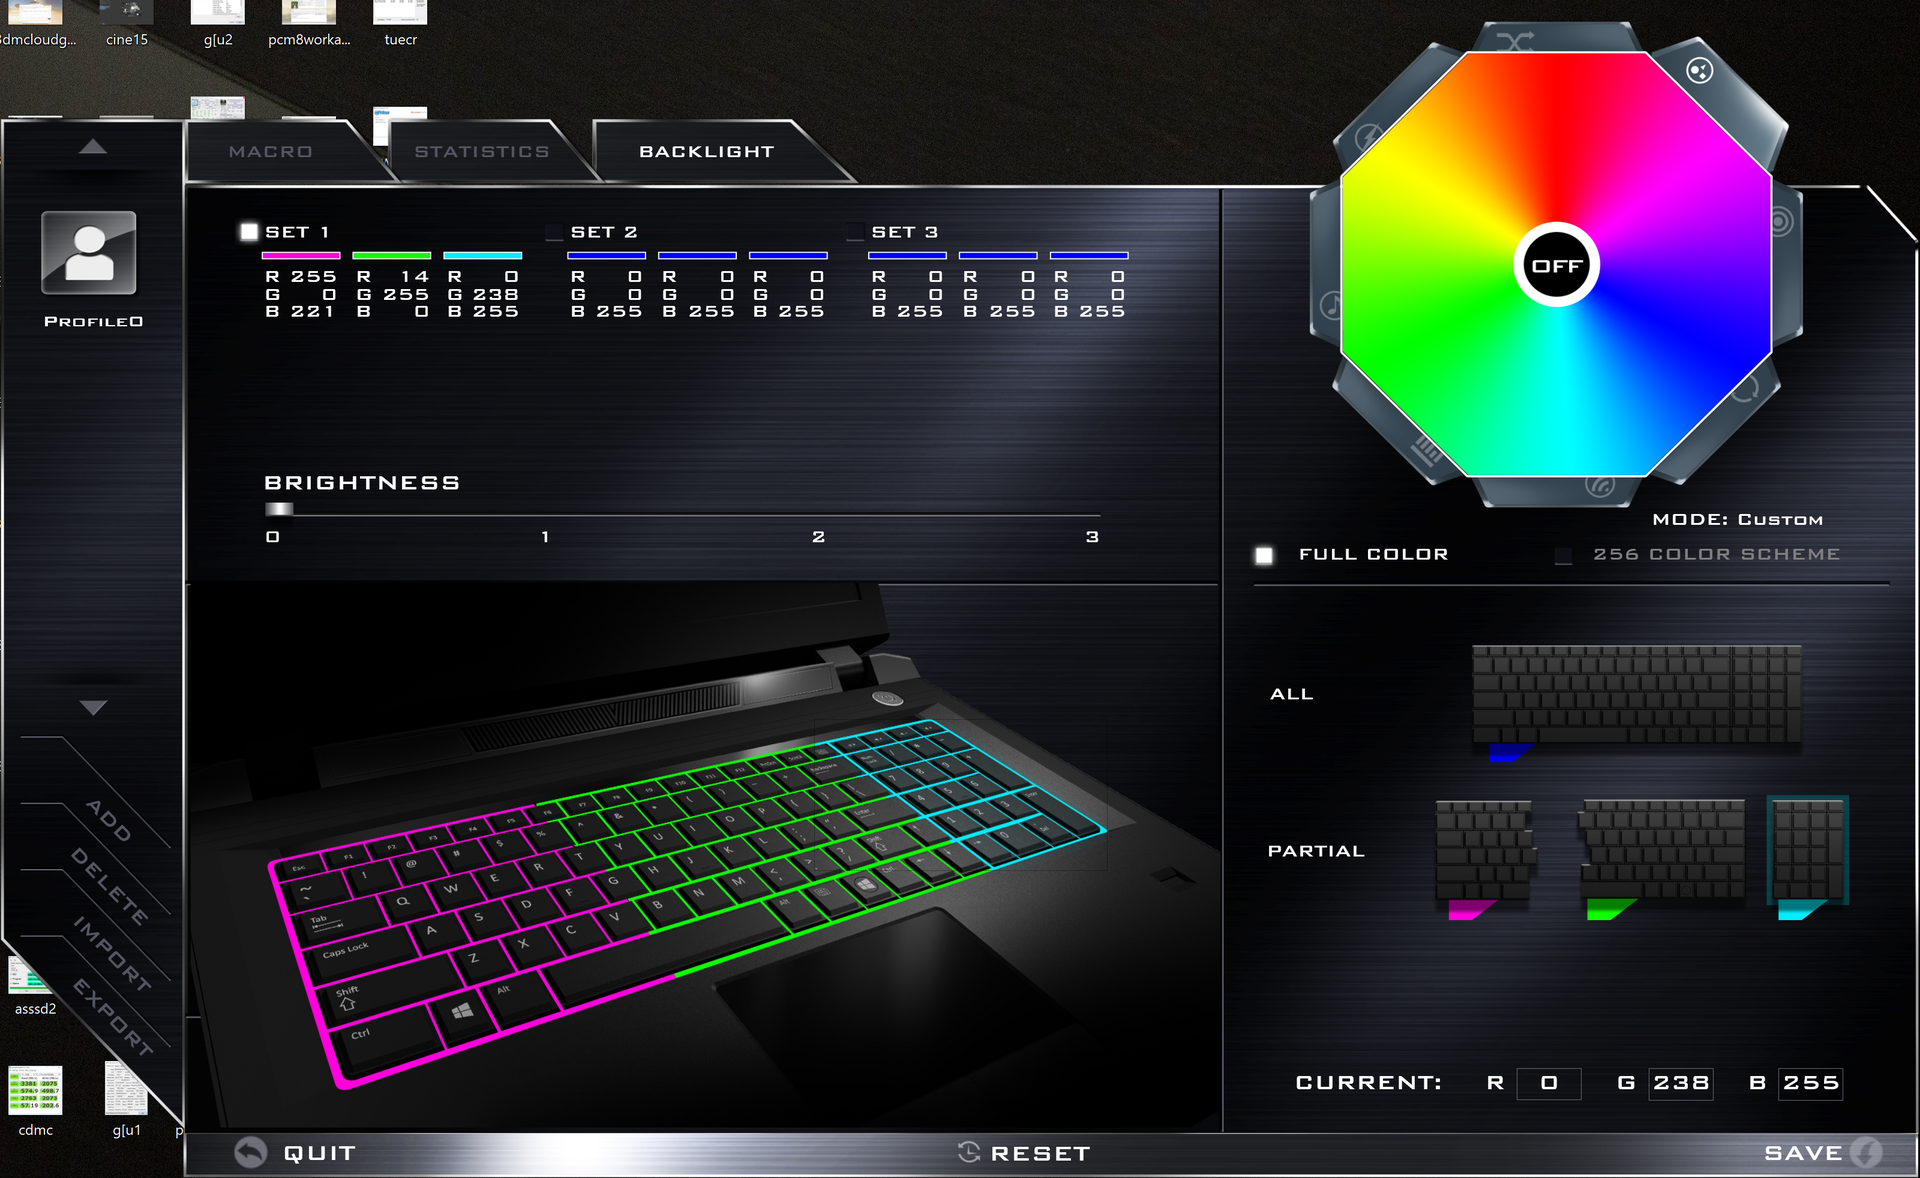
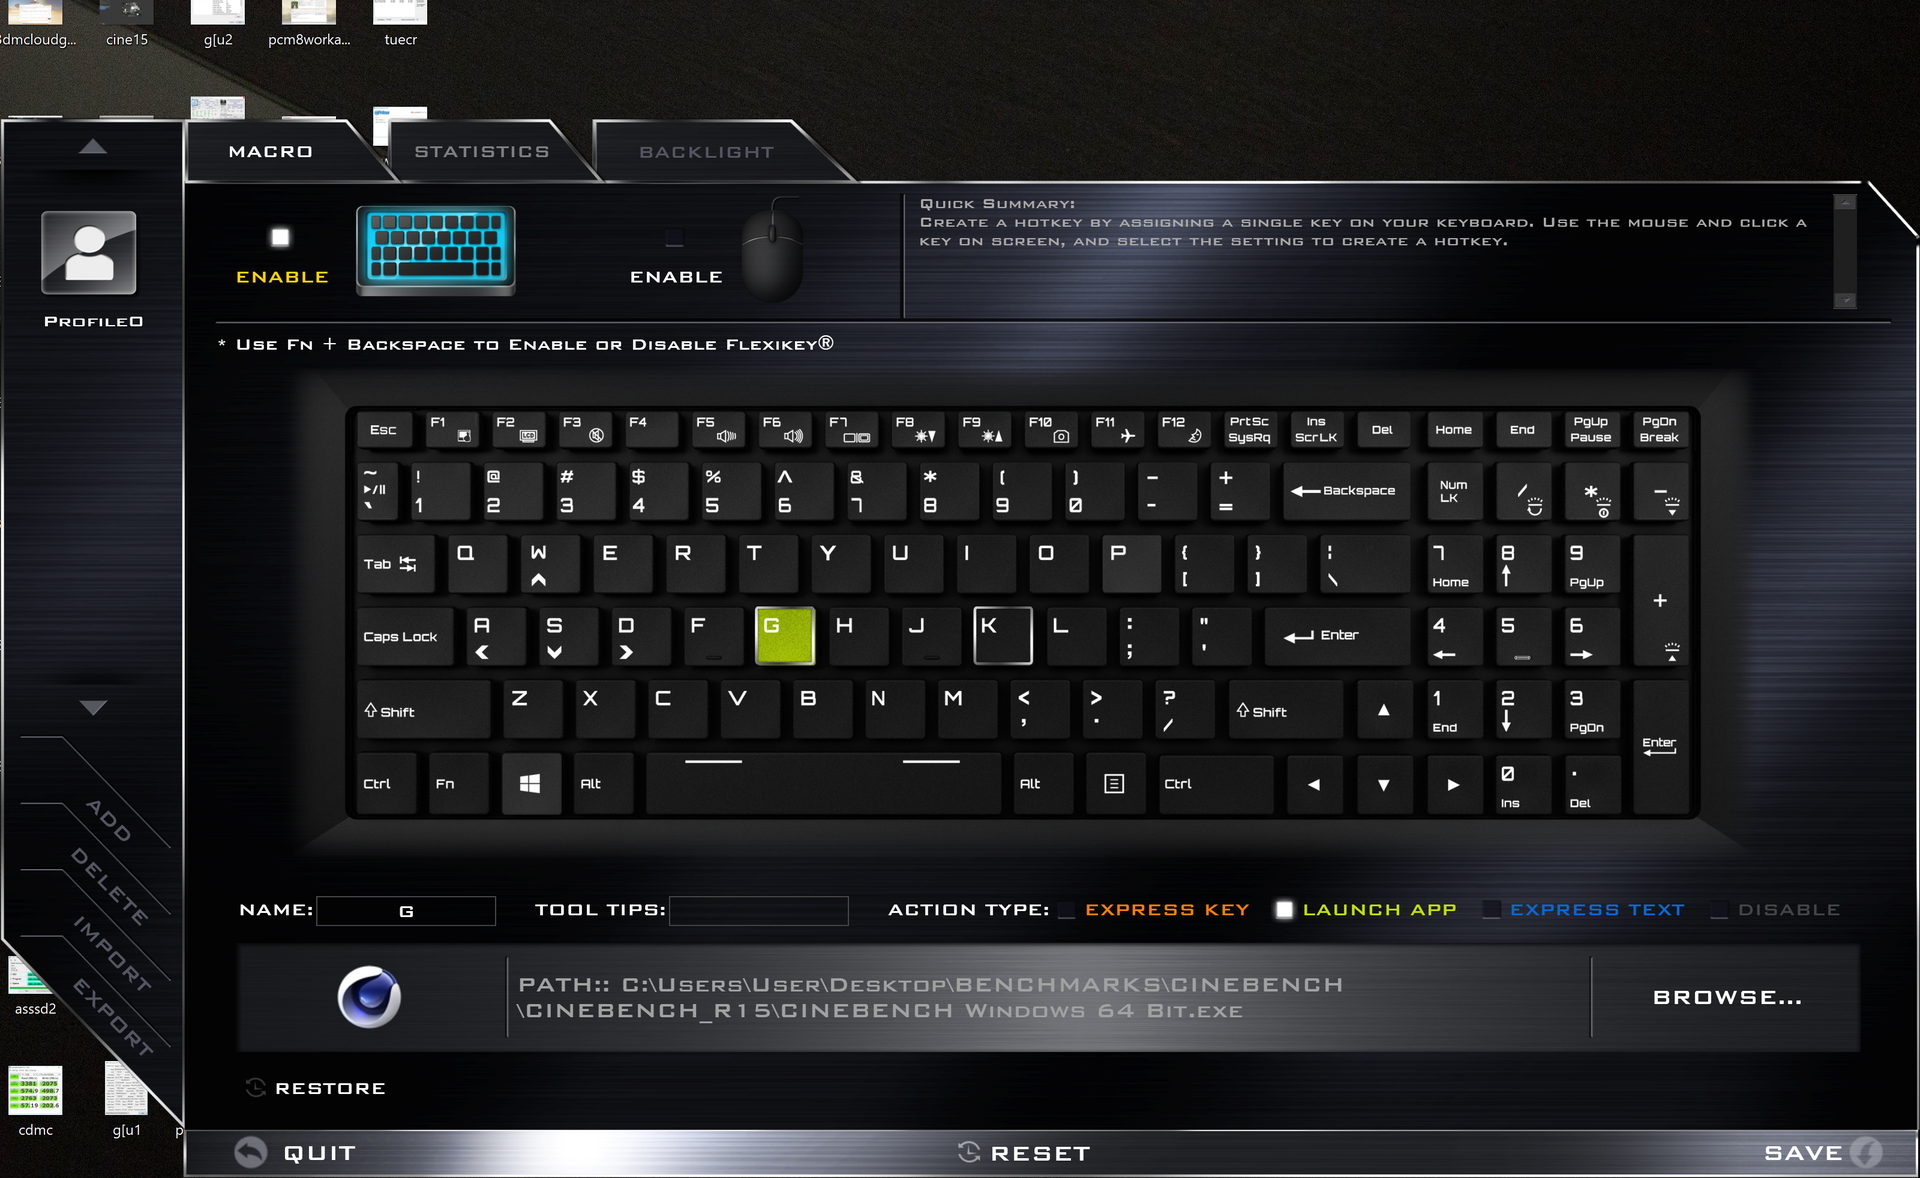
The easy-to-use FlexiKey software provides customizable macros, keyboard recording options, and tri-zone RGB backlighting. Competing gaming notebooks in this price range are beginning to incorporate per-key RGB lighting and we're hoping to see the same from Clevo in the future. The lack of any LED indicators for the Caps Lock key is also a bit of an annoyance.
Touchpad
The surface of the trackpad (~10.8 x 6.2 cm) is slightly roughened in texture to distinguish it from the surrounding smooth palm rests. Glide is otherwise even and responsive with no cursor jumping or other notable issues after installing the Synaptics software. Pushing down on the trackpad center will flex its surface only very slightly for a firmer feel than the integrated clickpad on the GS63VR.
The dedicated mouse keys are spongy with narrow travel and weak tactile feedback. They're subsequently very quiet when pressed and certainly less "clicky" than the mouse keys on a MSI GT notebook. We still prefer dedicated keys over integrated clickpads if an external mouse is not available.
Display
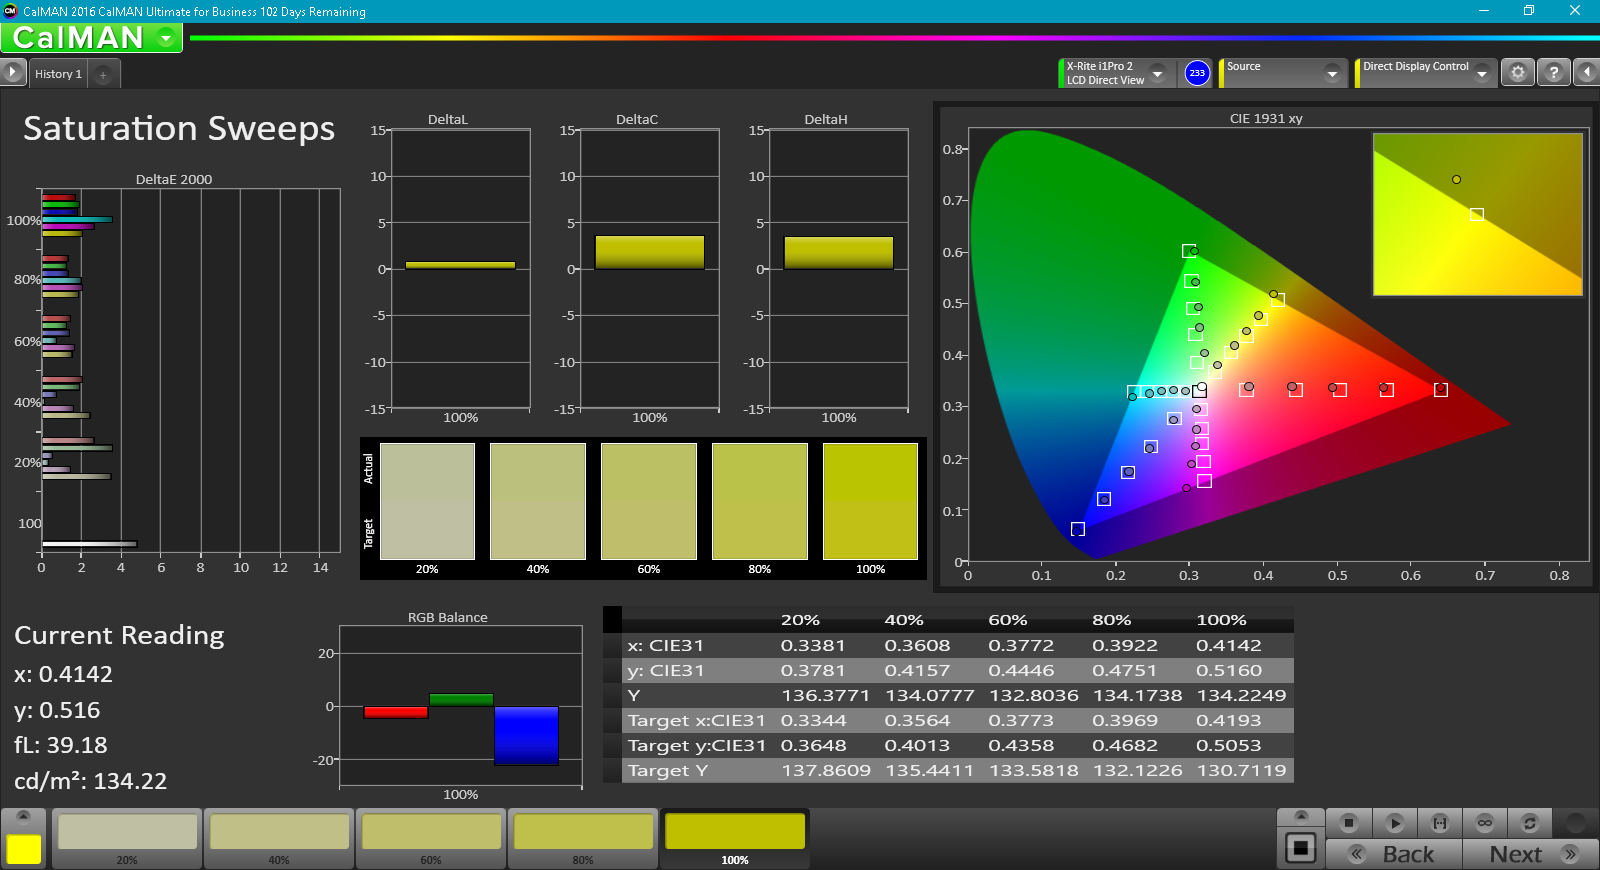
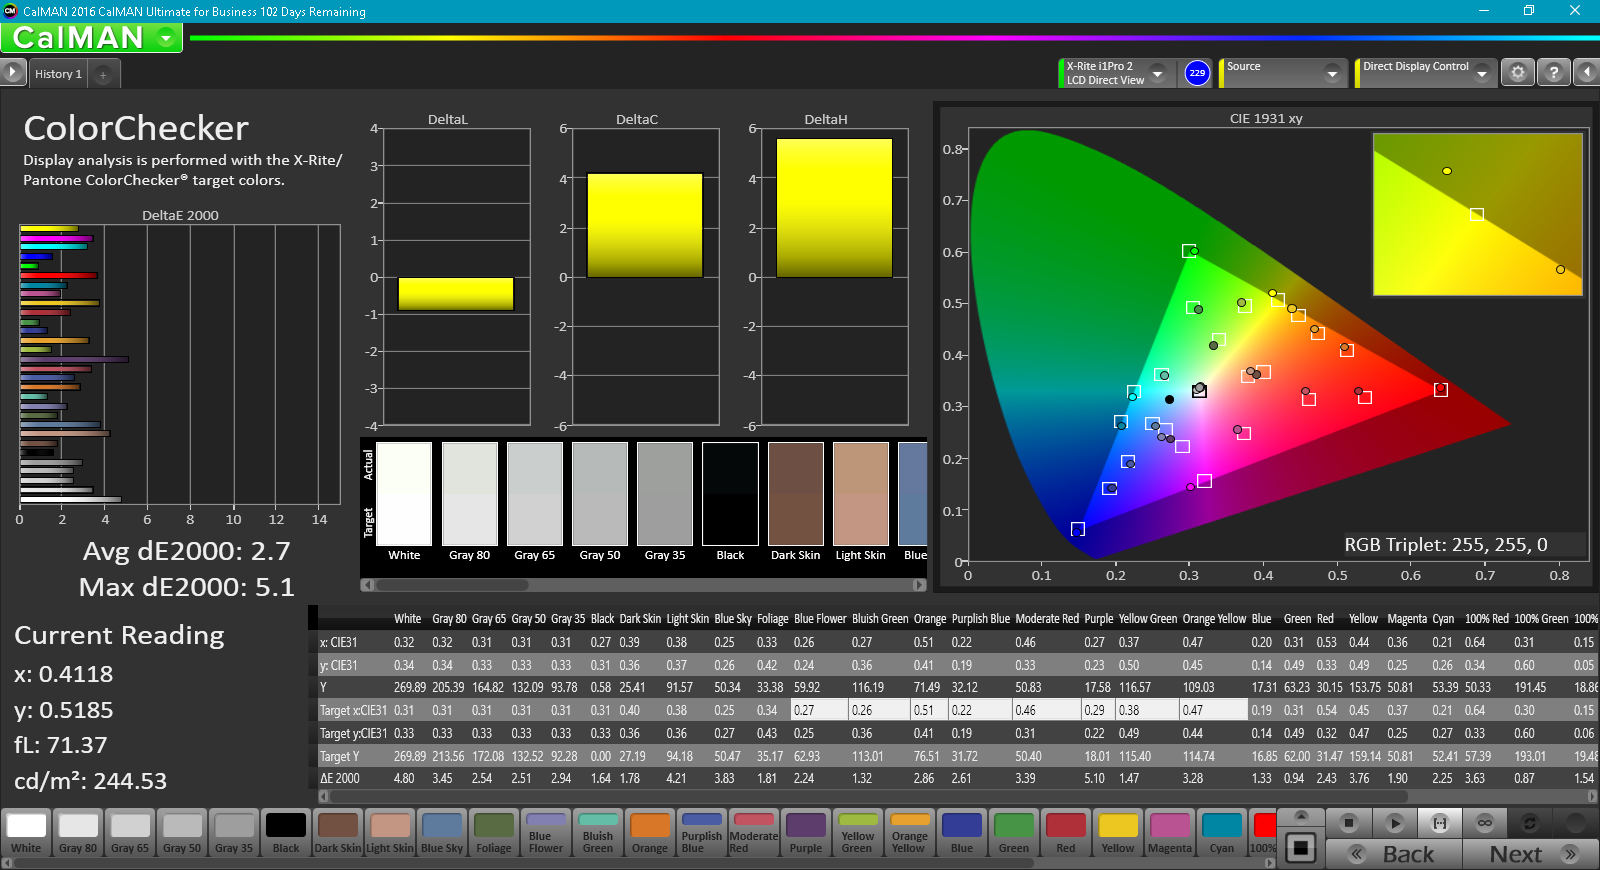
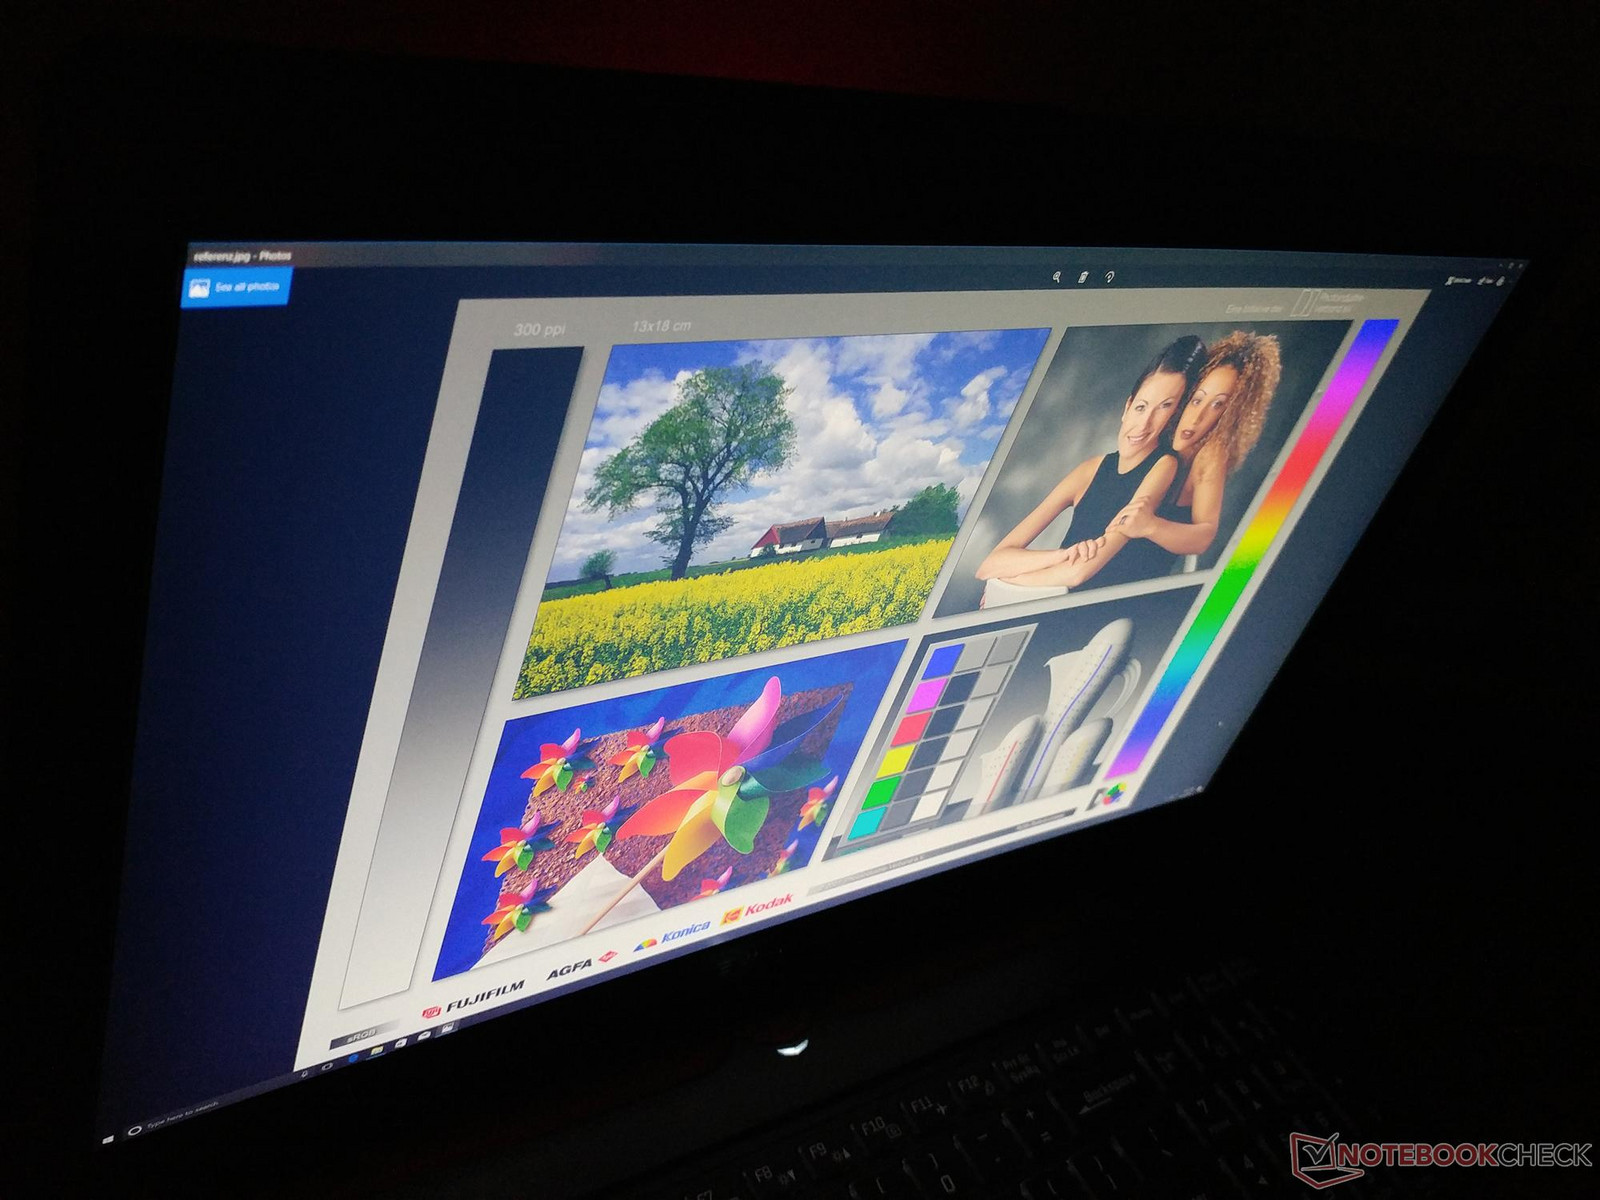
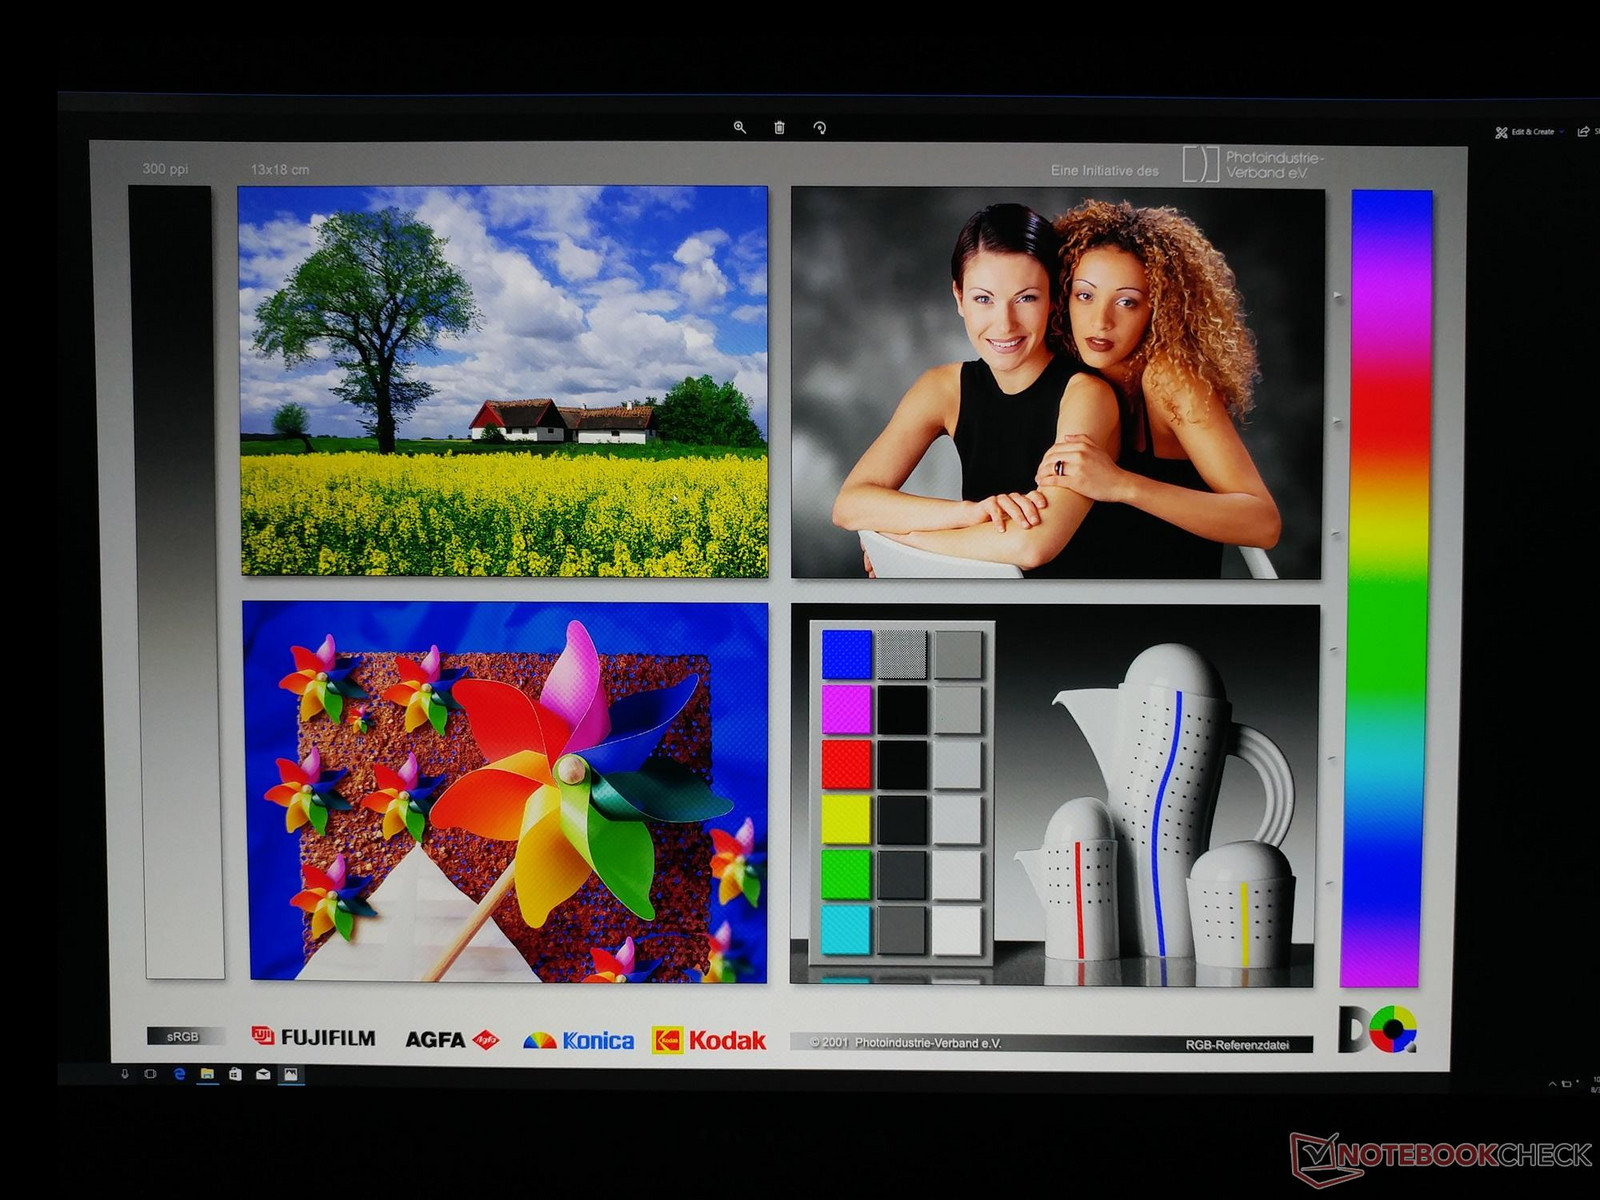
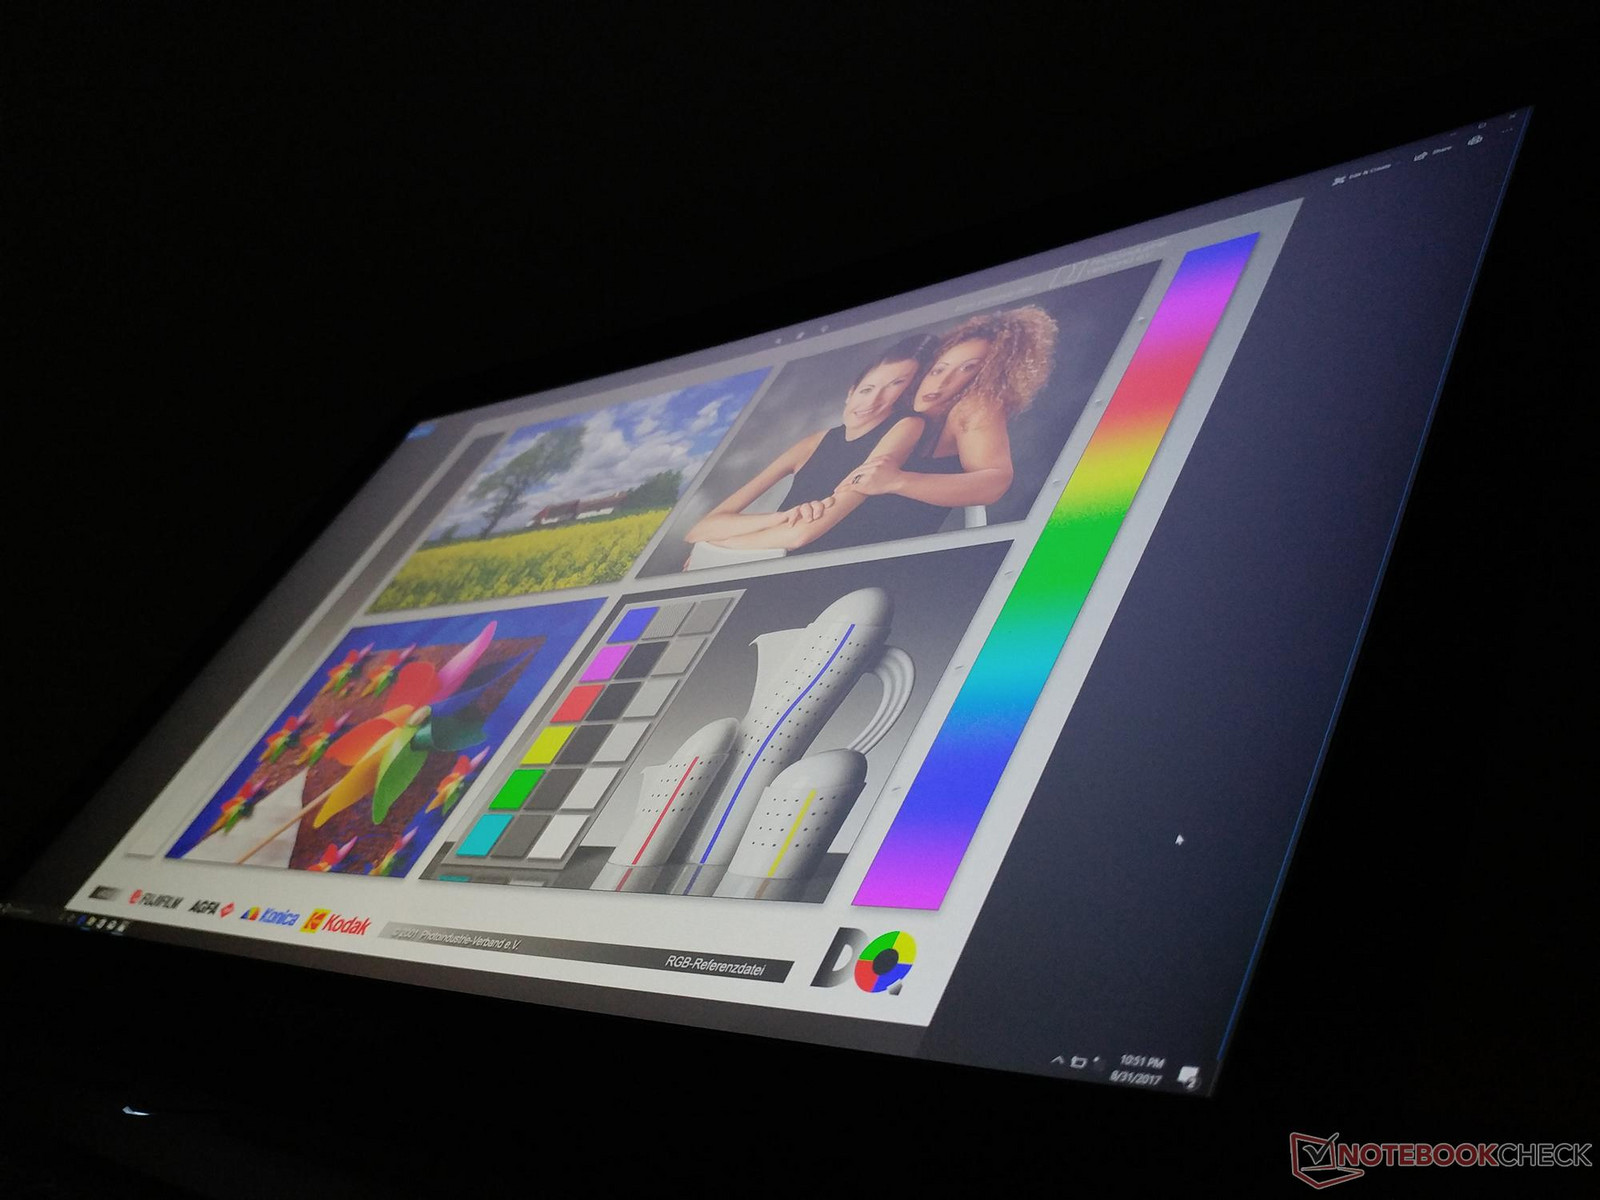
Current display options for the Q5 include a 60 Hz 1080p IPS panel, 120 Hz/5 ms 1080p TN panel, and a 60 Hz 4K UHD IPS panel. Eurocom is planning a 4K UHD IGZO panel on future Q5 configurations for an even wider color gamut similar to the XPS 15 series.
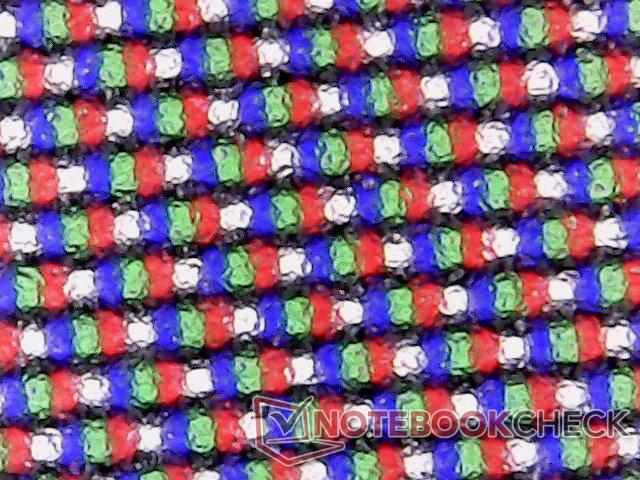
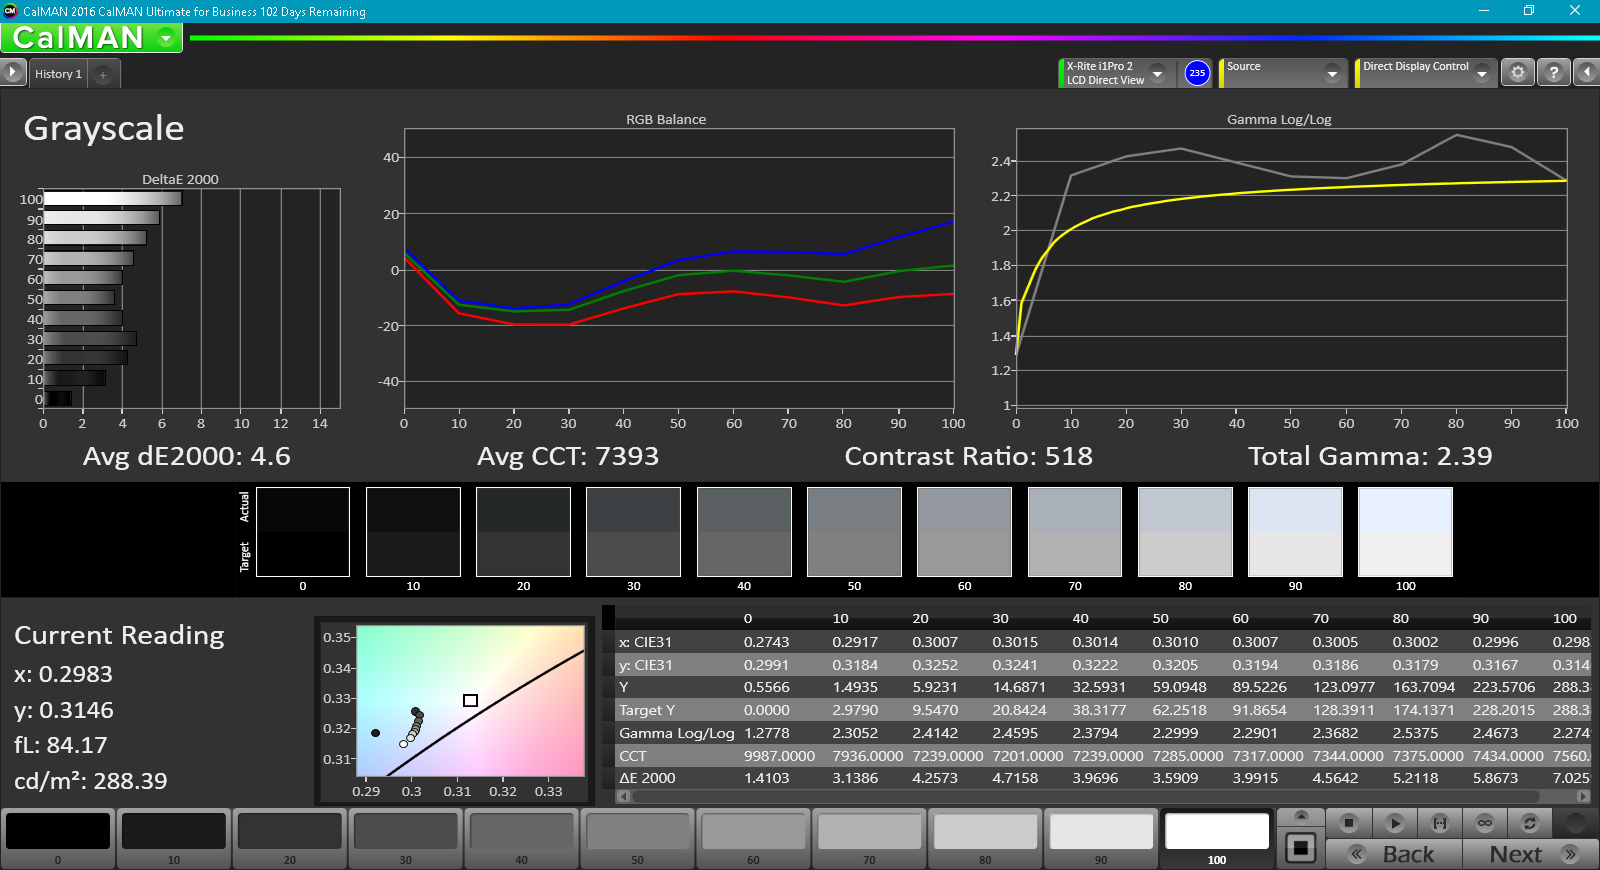
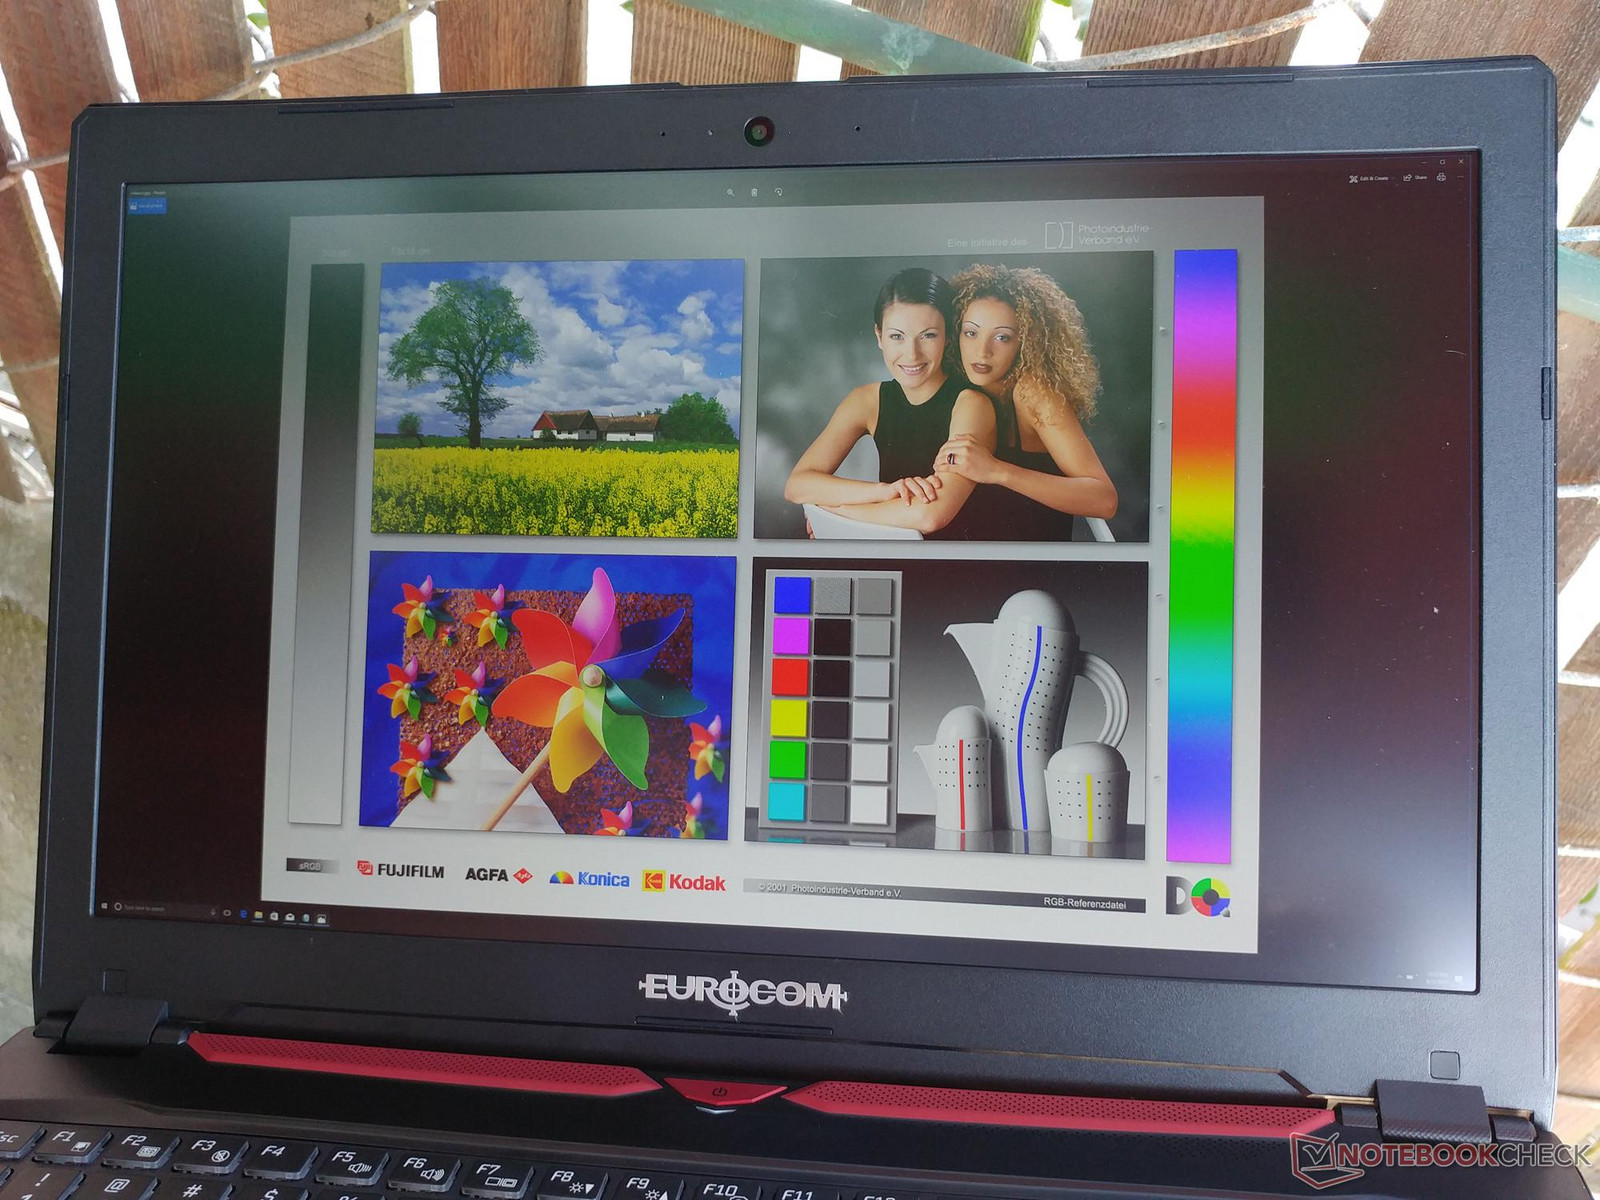
Our test unit today is equipped with the matte 4K UHD IPS panel from LG Philips. Note that this exact same LP156UD1-SPB1 panel can also be found on the glossy Asus Zenbook Pro UX501VW and so colors and contrast levels are very similar between these two notebooks. Unfortunately, the RGBW subpixel array naturally lends itself to poorer contrast levels and is not considered "true 4K" when compared to traditional RGB panels. Manufacturers like HP have already begun moving away from 4K RGBW panels as newer 4K RGB panels can offer deeper blacks without sacrificing colors. Competing gaming notebooks like the Zephyrus or Omen 15 offer contrast levels over twice that of our Eurocom.
Subjectively, texts and images still appear crisp with a moderate amount of graininess that is common on matte panels. Onscreen content will be far too small if scaling is disabled and so the practicality of 4K UHD on this screen size should be carefully considered before purchasing. Scaling issues can be especially annoying for games and applications that are not yet optimized for such dense resolutions. Uneven backlight bleeding is present but otherwise kept to a minimum around the edges and corners.
It's worth noting that our data below reflects only the 4K UHD IPS panel. Other panel options for the Q5 will very likely exhibit different characteristics than what we've recorded here.
| |||||||||||||||||||||||||
Brightness Distribution: 87 %
Center on Battery: 287.5 cd/m²
Contrast: 442:1 (Black: 0.65 cd/m²)
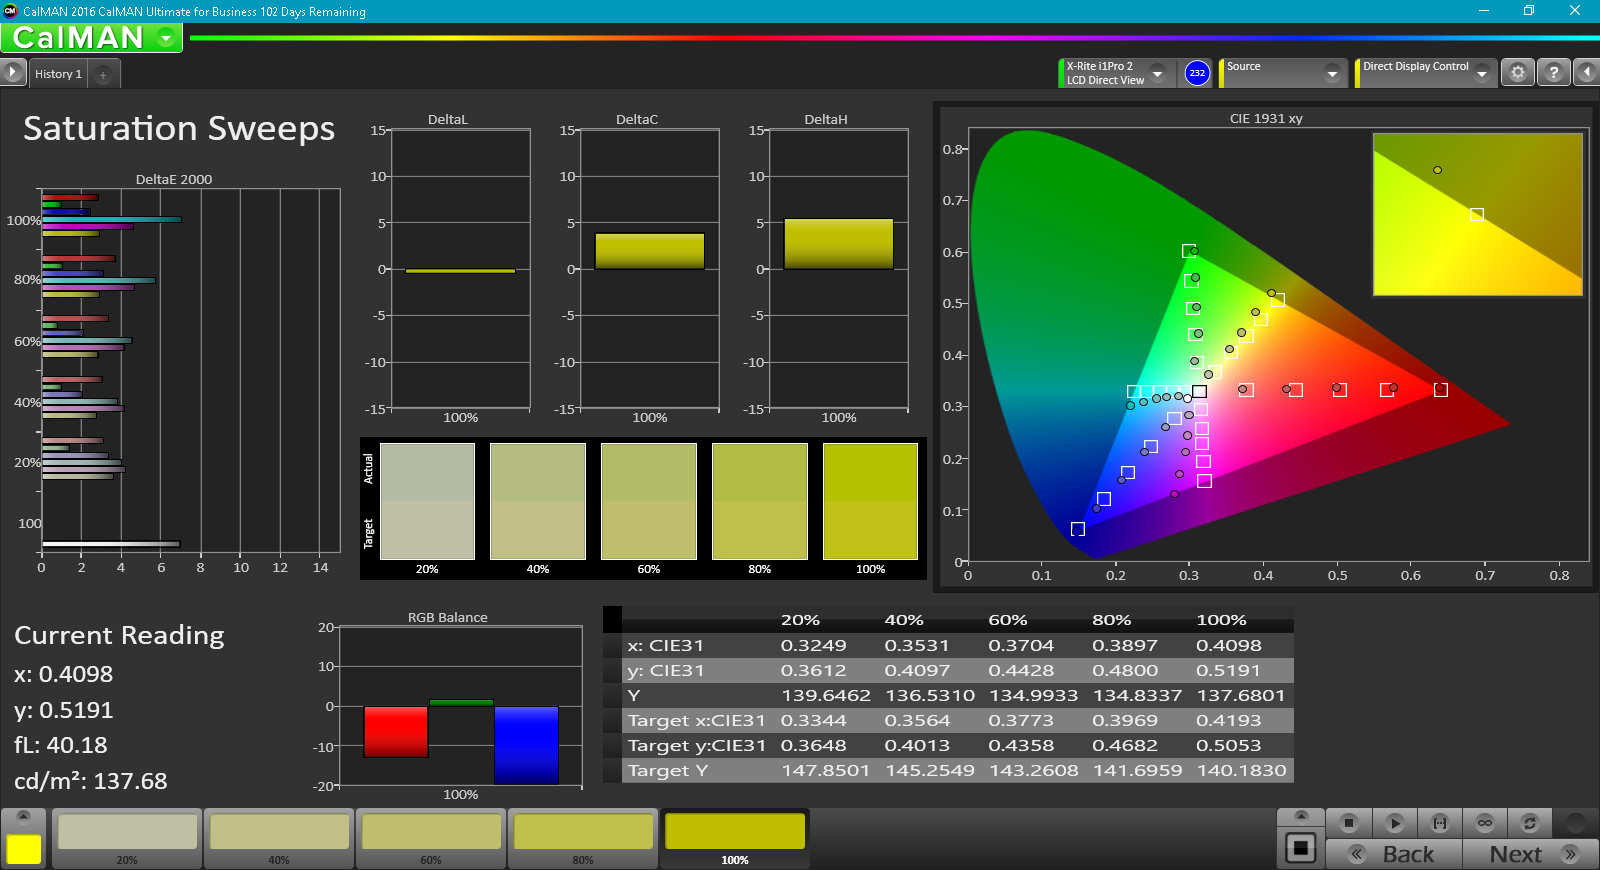
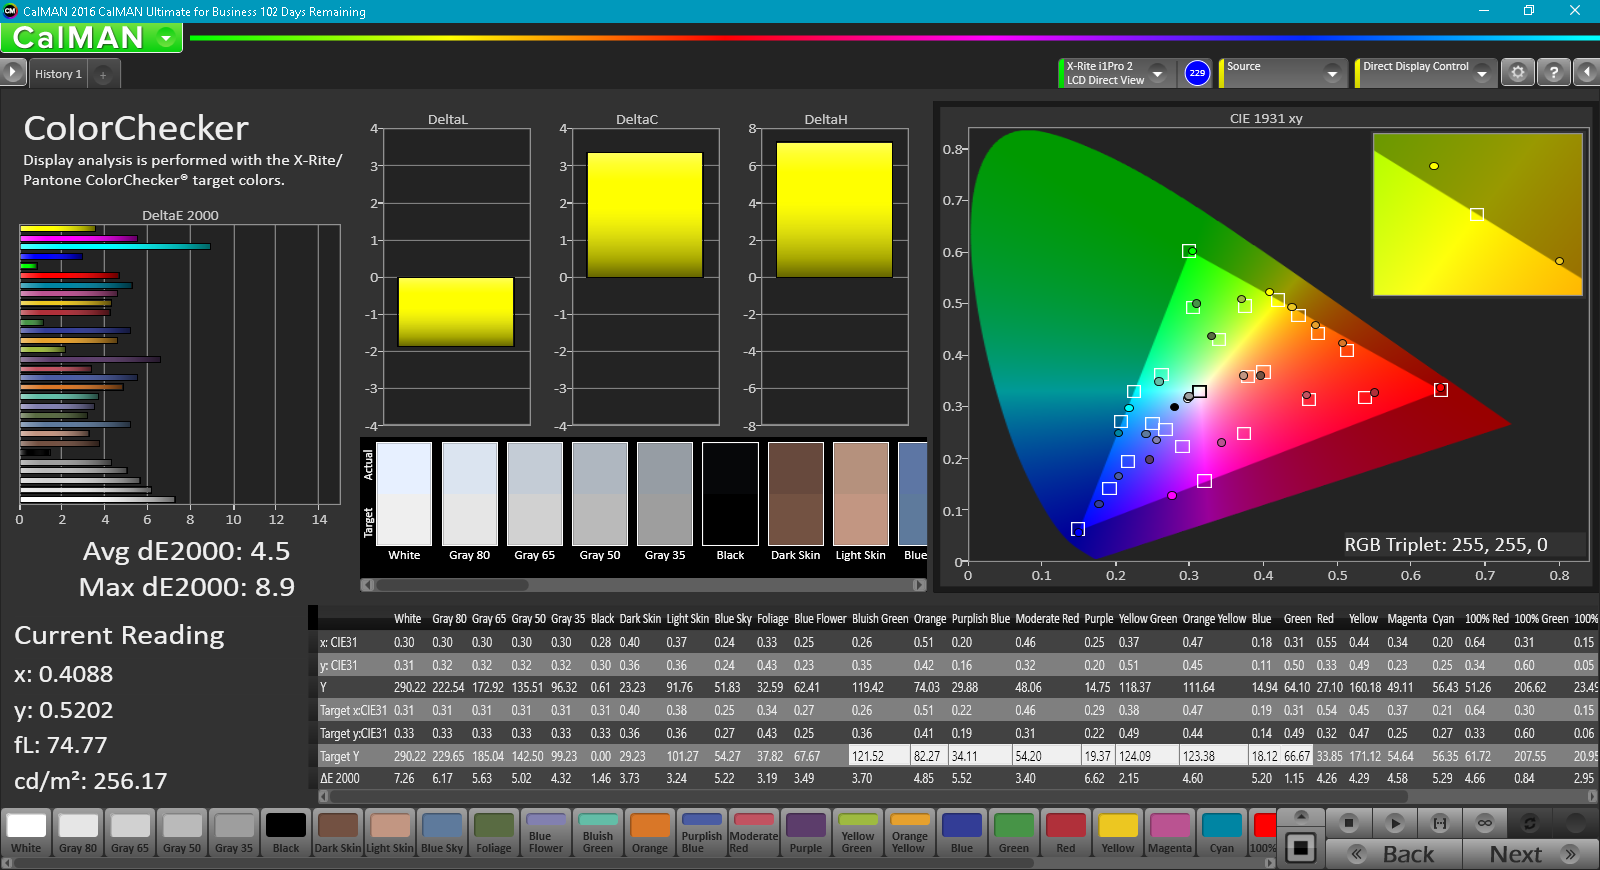
ΔE ColorChecker Calman: 4.5 | ∀{0.5-29.43 Ø4.71}
ΔE Greyscale Calman: 4.6 | ∀{0.09-98 Ø4.96}
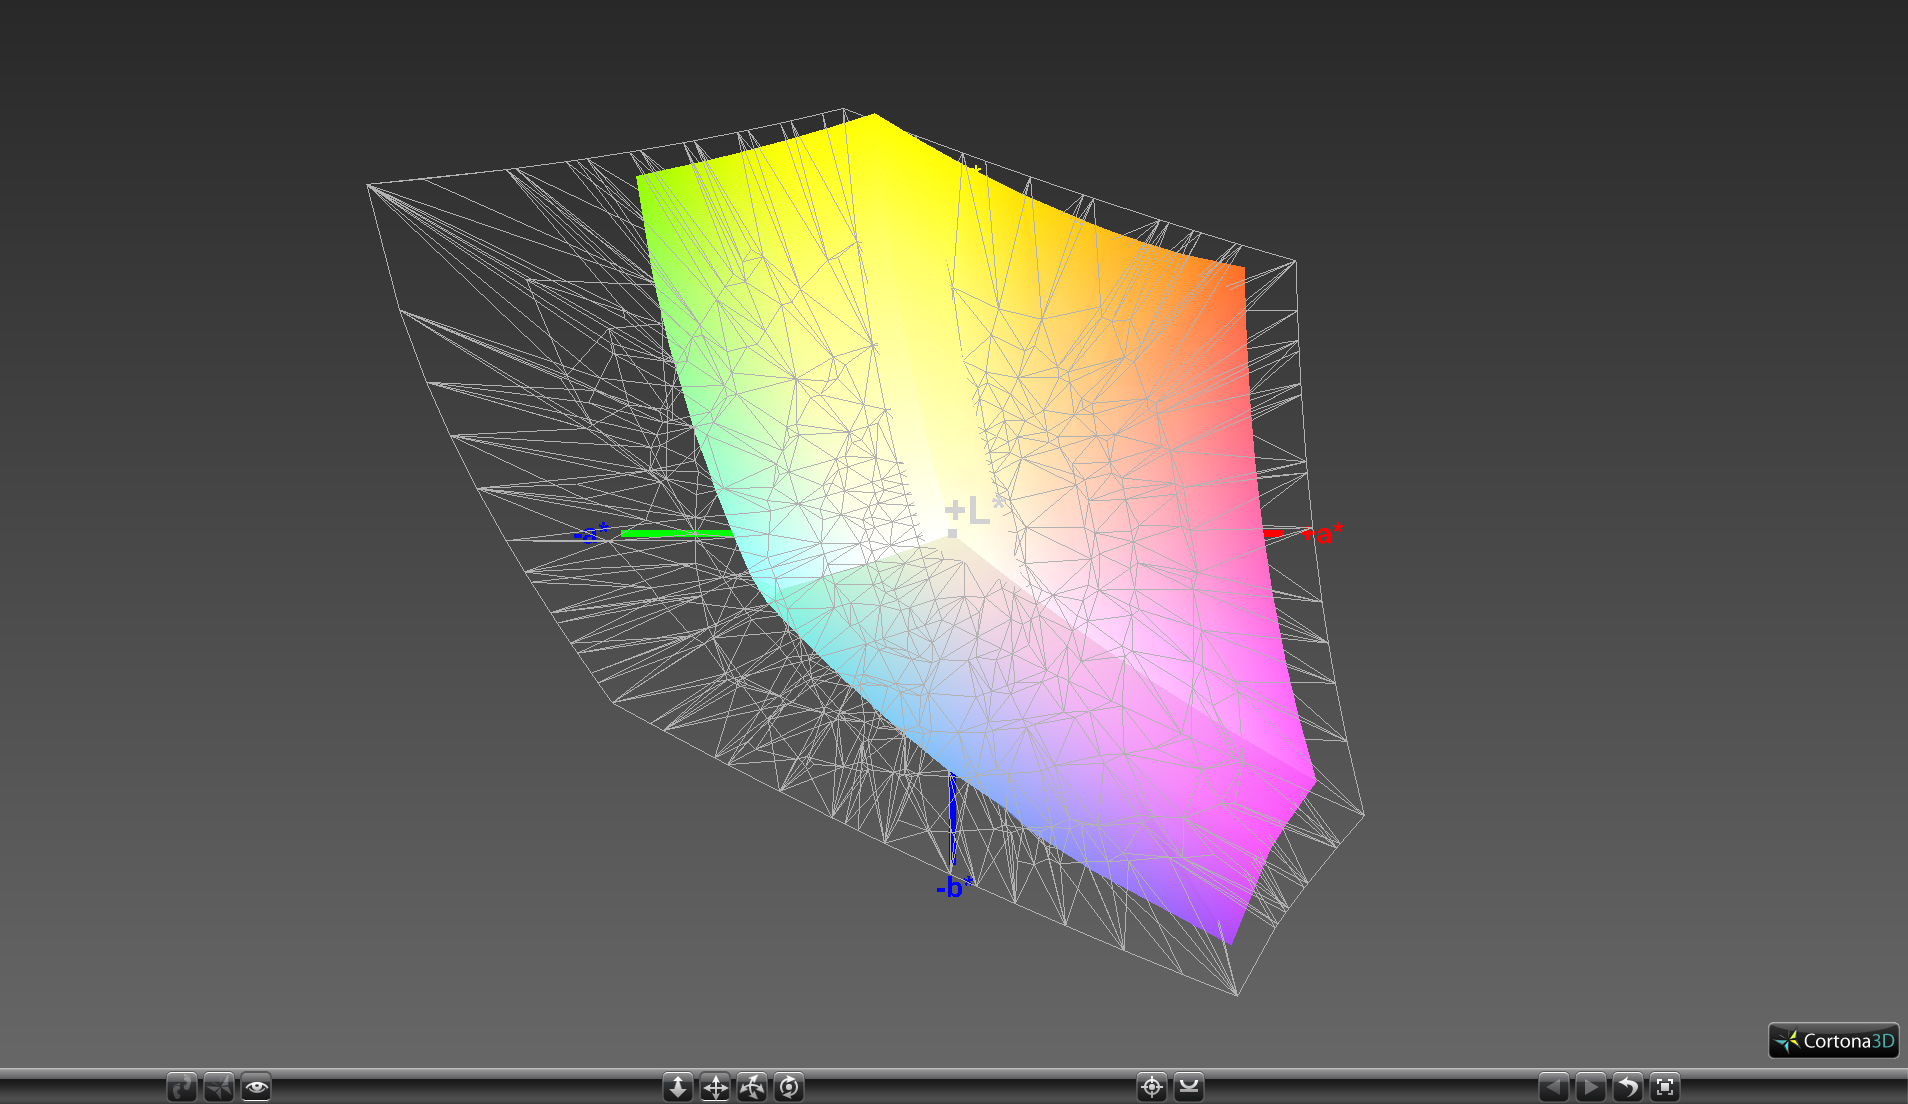
92.3% sRGB (Argyll 1.6.3 3D)
59% AdobeRGB 1998 (Argyll 1.6.3 3D)
64.4% AdobeRGB 1998 (Argyll 3D)
92.7% sRGB (Argyll 3D)
63% Display P3 (Argyll 3D)
Gamma: 2.39
CCT: 7393 K
| Eurocom Q5 ID: LGD04D4, Name: LG Philips LP156UD1-SPB1, IPS, 15.6", 3840x2160 | Asus Zephyrus GX501VS ID: AUO42ED, Name: AU Optronics B156HAN04.2, IPS, 15.6", 1920x1080 | HP Omen 15-ce002ng AUO42ED, IPS, 15.6", 1920x1080 | MSI GS63VR-6RF16H22 Stealth Pro Samsung 156HL01-104 (SDC324C) , IPS, 15.6", 1920x1080 | Gigabyte P56XT LG Philips LP156WF6 (LGD046F), IPS, 15.6", 1920x1080 | Alienware 15 R3 HPJGK_B156HTN (AUO51ED), TN, 15.6", 1920x1080 | |
|---|---|---|---|---|---|---|
| Display | -4% | 2% | 7% | -3% | 2% | |
| Display P3 Coverage (%) | 63 | 62.1 -1% | 65.8 4% | 67.8 8% | 64.8 3% | 66 5% |
| sRGB Coverage (%) | 92.7 | 85.6 -8% | 90.9 -2% | 97.4 5% | 84.6 -9% | 90.5 -2% |
| AdobeRGB 1998 Coverage (%) | 64.4 | 62.4 -3% | 66.5 3% | 69.7 8% | 61.8 -4% | 66.2 3% |
| Response Times | 1% | -21% | 10% | -1% | 41% | |
| Response Time Grey 50% / Grey 80% * (ms) | 32.4 ? | 33.2 ? -2% | 43.2 ? -33% | 37.2 ? -15% | 25 ? 23% | |
| Response Time Black / White * (ms) | 28.8 ? | 28 ? 3% | 31.2 ? -8% | 26 ? 10% | 24.8 ? 14% | 12 ? 58% |
| PWM Frequency (Hz) | 202 ? | 20000 ? | ||||
| Screen | 25% | 32% | 23% | 6% | -11% | |
| Brightness middle (cd/m²) | 287.5 | 307.1 7% | 304 6% | 293 2% | 301 5% | 386 34% |
| Brightness (cd/m²) | 279 | 309 11% | 289 4% | 279 0% | 280 0% | 382 37% |
| Brightness Distribution (%) | 87 | 86 -1% | 86 -1% | 84 -3% | 87 0% | 93 7% |
| Black Level * (cd/m²) | 0.65 | 0.35 46% | 0.26 60% | 0.33 49% | 0.32 51% | 0.39 40% |
| Contrast (:1) | 442 | 877 98% | 1169 164% | 888 101% | 941 113% | 990 124% |
| Colorchecker dE 2000 * | 4.5 | 3.4 24% | 3.46 23% | 3.59 20% | 6.21 -38% | 10.2 -127% |
| Colorchecker dE 2000 max. * | 8.9 | 8.2 8% | 7.72 13% | 5.79 35% | 10.78 -21% | 15.81 -78% |
| Greyscale dE 2000 * | 4.6 | 1.4 70% | 2.46 47% | 3.86 16% | 6.08 -32% | 11.28 -145% |
| Gamma | 2.39 92% | 2.19 100% | 2.38 92% | 2.53 87% | 2.31 95% | 2.23 99% |
| CCT | 7393 88% | 6558 99% | 6915 94% | 7229 90% | 7375 88% | 11383 57% |
| Color Space (Percent of AdobeRGB 1998) (%) | 59 | 55.6 -6% | 59 0% | 63 7% | 55 -7% | 59 0% |
| Color Space (Percent of sRGB) (%) | 92.3 | 85 -8% | 91 -1% | 97 5% | 84 -9% | 90 -2% |
| Total Average (Program / Settings) | 7% /
16% | 4% /
19% | 13% /
19% | 1% /
3% | 11% /
-2% |
* ... smaller is better
Color space is approximately 59 percent and 92 percent of the AdobeRGB and sRGB standards, respectively. This is typical of high-end gaming notebooks and Ultrabooks and should prove useful for digital artists. In comparison, the 4K UHD RGBW Samsung panel on the GS63VR covers just 72 percent of sRGB. Notebooks sporting Sharp IGZO panels can cover the entire sRGB spectrum and more of AdobeRGB if color accuracy is of utmost concern. For gaming purposes, however, the color space on our LG Philips panel here is more than sufficient.


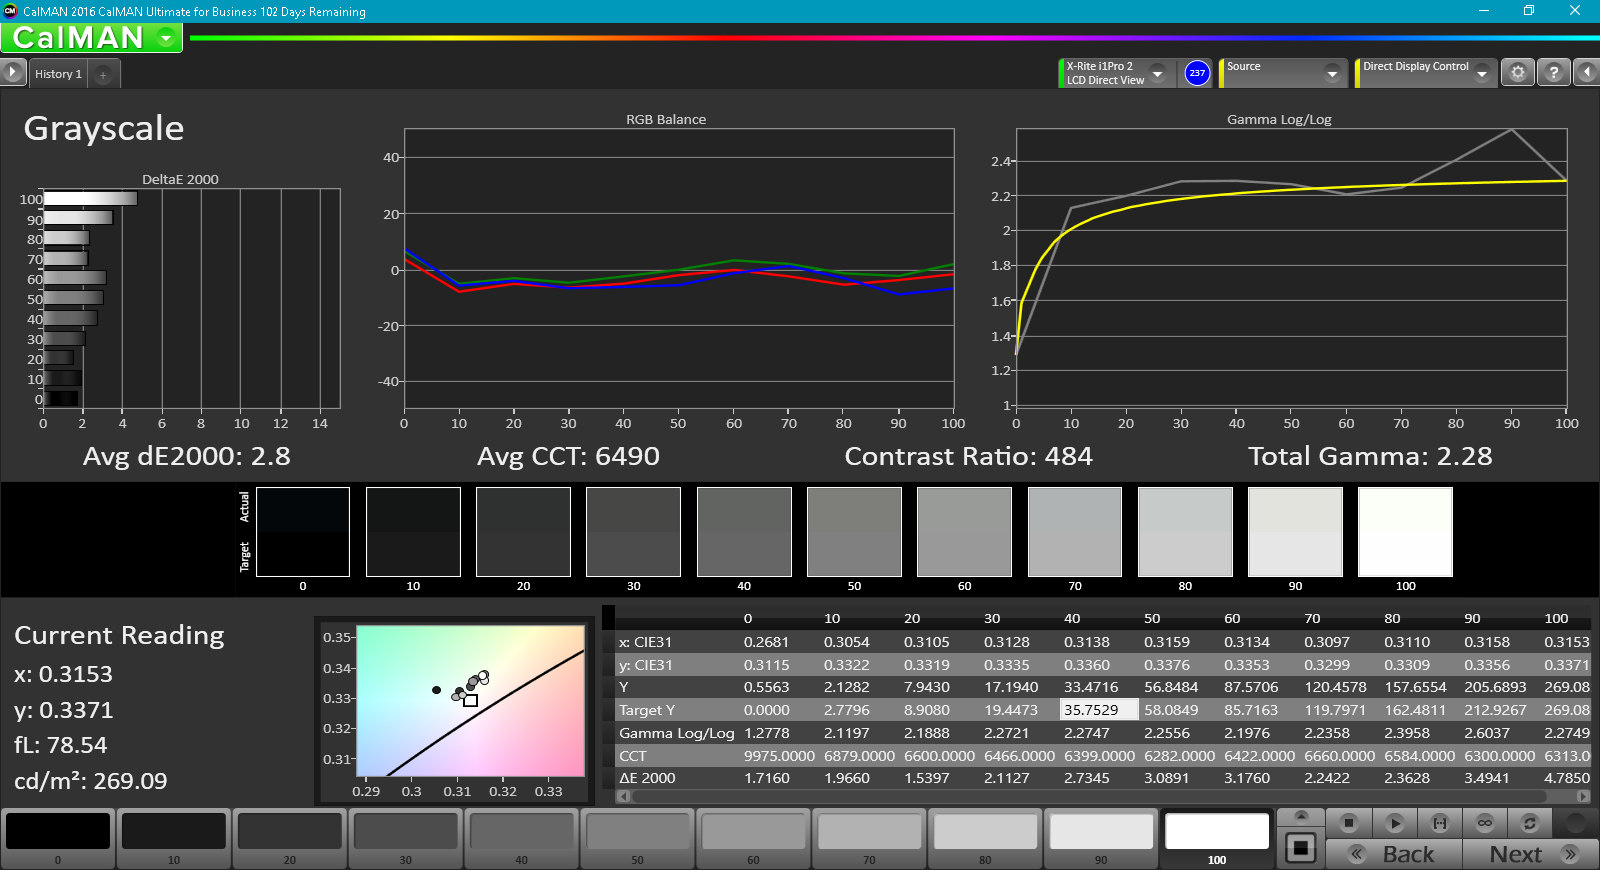
Further measurements with an X-Rite spectrophotometer reveal average grayscale and colors out of the box and a slightly cool color temperature. Our calibration efforts improve nearly all aspects of the display and is recommended to get the most out of the wide color gamut of the 4K UHD panel. Strangely, Yellow, Green, and Red colors are slightly less accurate at lower saturation levels which is somewhat uncommon on notebook panels and could be due to the RGBW subpixel array.
Display Response Times
| ↔ Response Time Black to White | ||
|---|---|---|
| 28.8 ms ... rise ↗ and fall ↘ combined | ↗ 18.8 ms rise | 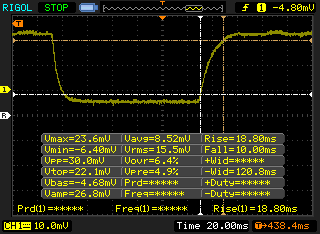 |
| ↘ 10 ms fall | ||
| The screen shows relatively slow response rates in our tests and may be too slow for gamers. In comparison, all tested devices range from 0.1 (minimum) to 240 (maximum) ms. » 76 % of all devices are better. This means that the measured response time is worse than the average of all tested devices (19.8 ms). | ||
| ↔ Response Time 50% Grey to 80% Grey | ||
| 32.4 ms ... rise ↗ and fall ↘ combined | ↗ 16 ms rise | 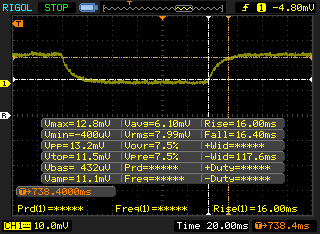 |
| ↘ 16.4 ms fall | ||
| The screen shows slow response rates in our tests and will be unsatisfactory for gamers. In comparison, all tested devices range from 0.165 (minimum) to 636 (maximum) ms. » 44 % of all devices are better. This means that the measured response time is similar to the average of all tested devices (31 ms). | ||
Screen Flickering / PWM (Pulse-Width Modulation)
| Screen flickering / PWM not detected | 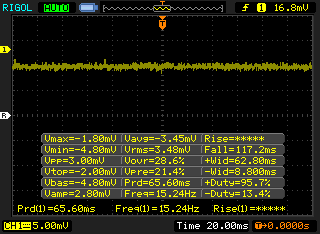 | ||
In comparison: 52 % of all tested devices do not use PWM to dim the display. If PWM was detected, an average of 7754 (minimum: 5 - maximum: 343500) Hz was measured. | |||
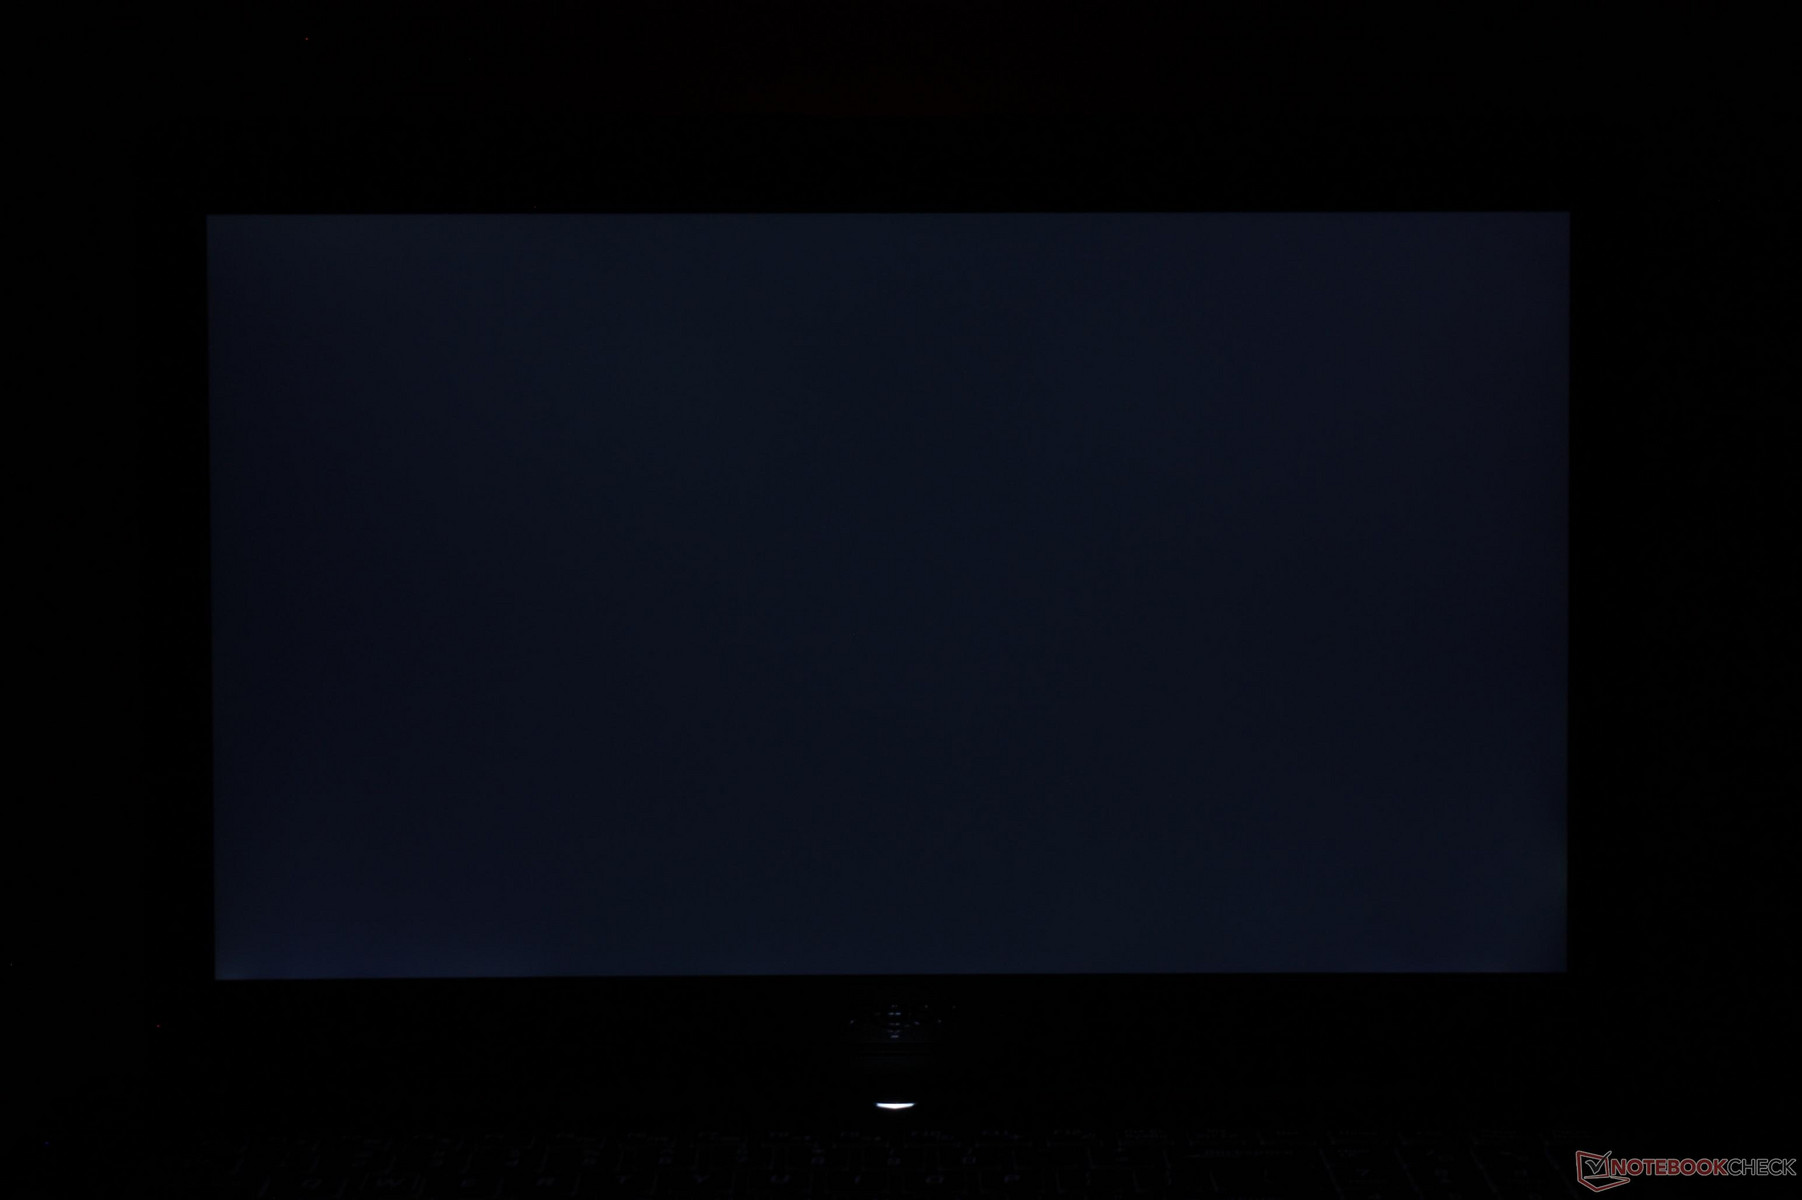
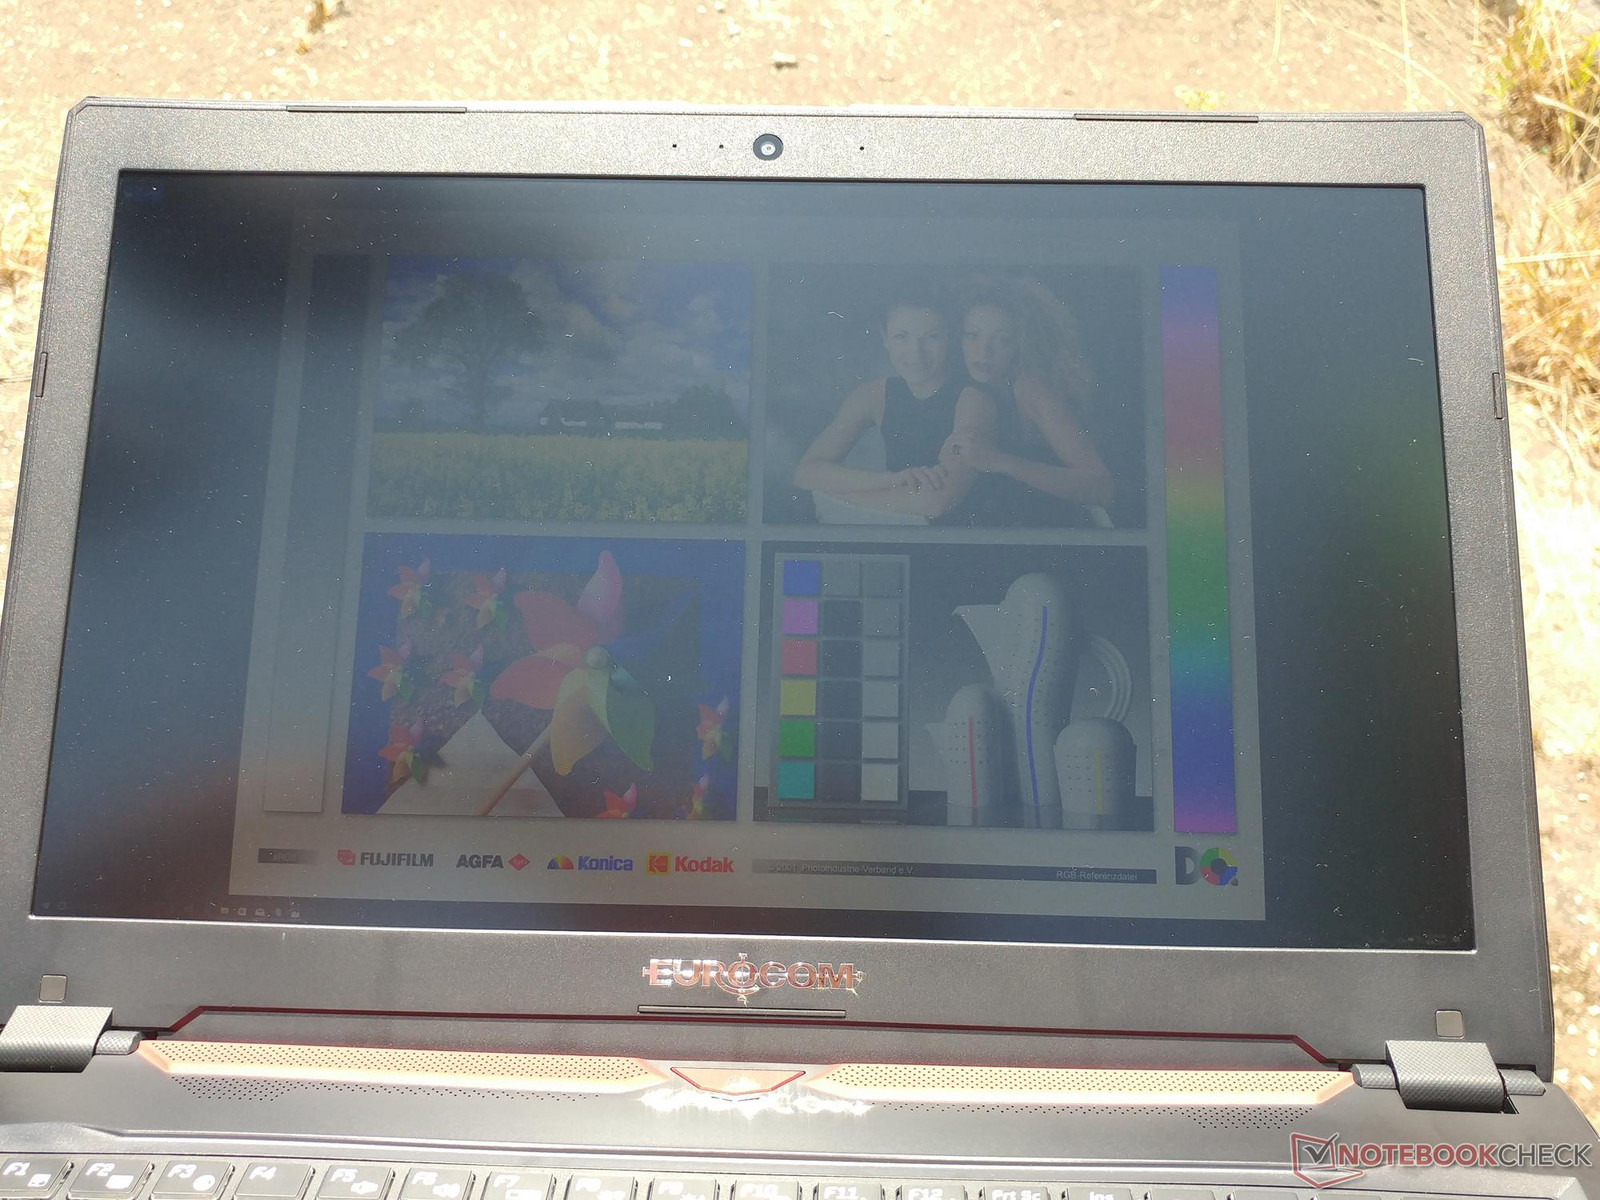
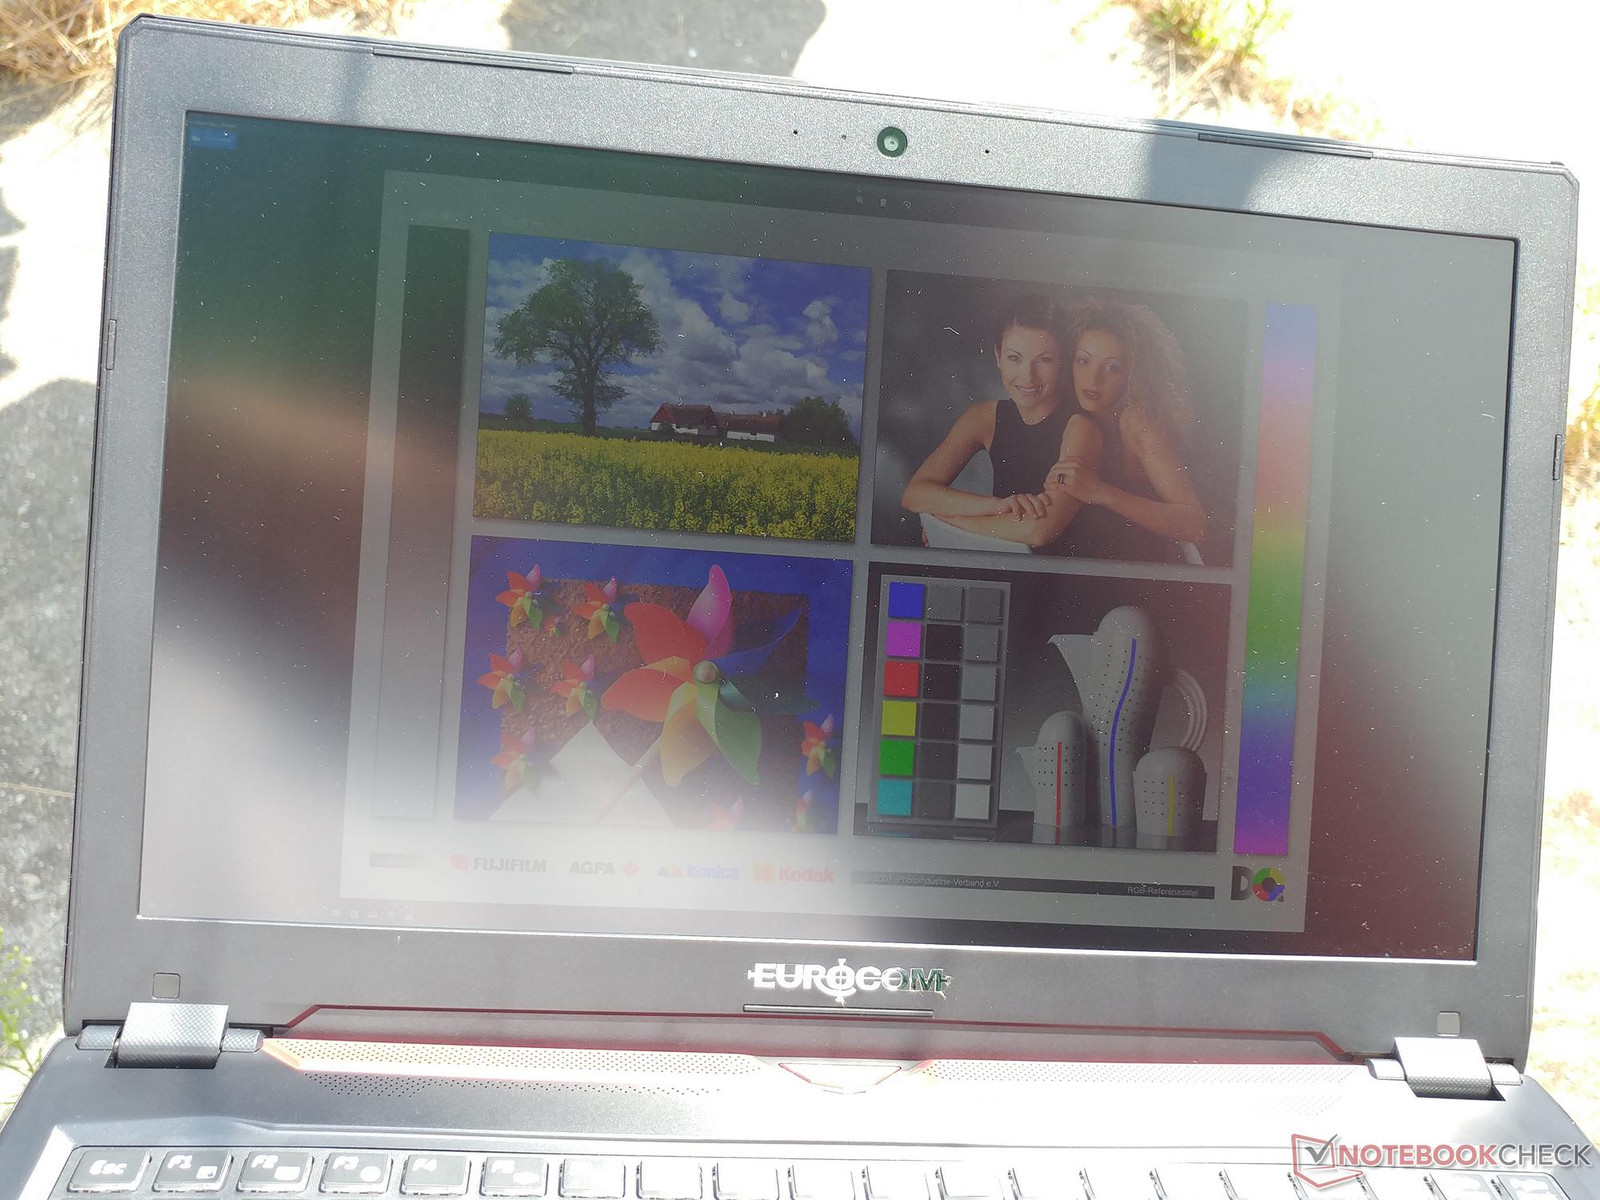
Like most gaming notebooks, outdoor visibility is average at best. The wide IPS angles and matte panel help in minimizing glare, but the backlight is not sufficiently bright enough to overcome outdoor ambient lighting. Onscreen content will look washed out as a result even if on the maximum brightness setting. The heavier Alienware 15 carries a much brighter display backlight if outdoor visibility is a priority.
Performance
Current Q5 configurations are limited to the Core i7-7700HQ CPU and GTX 1070 Max-Q GPU as both are soldered onto the motherboard. Other gaming notebooks may have unlocked HK-class processor options, but the performance gains over the i7-7700HQ are minimal and anything faster would be an even greater strain on the thin Q5 design. Besides, the Q5 chassis has enough trouble as is with the i7-7700HQ as we will show in the following sections.
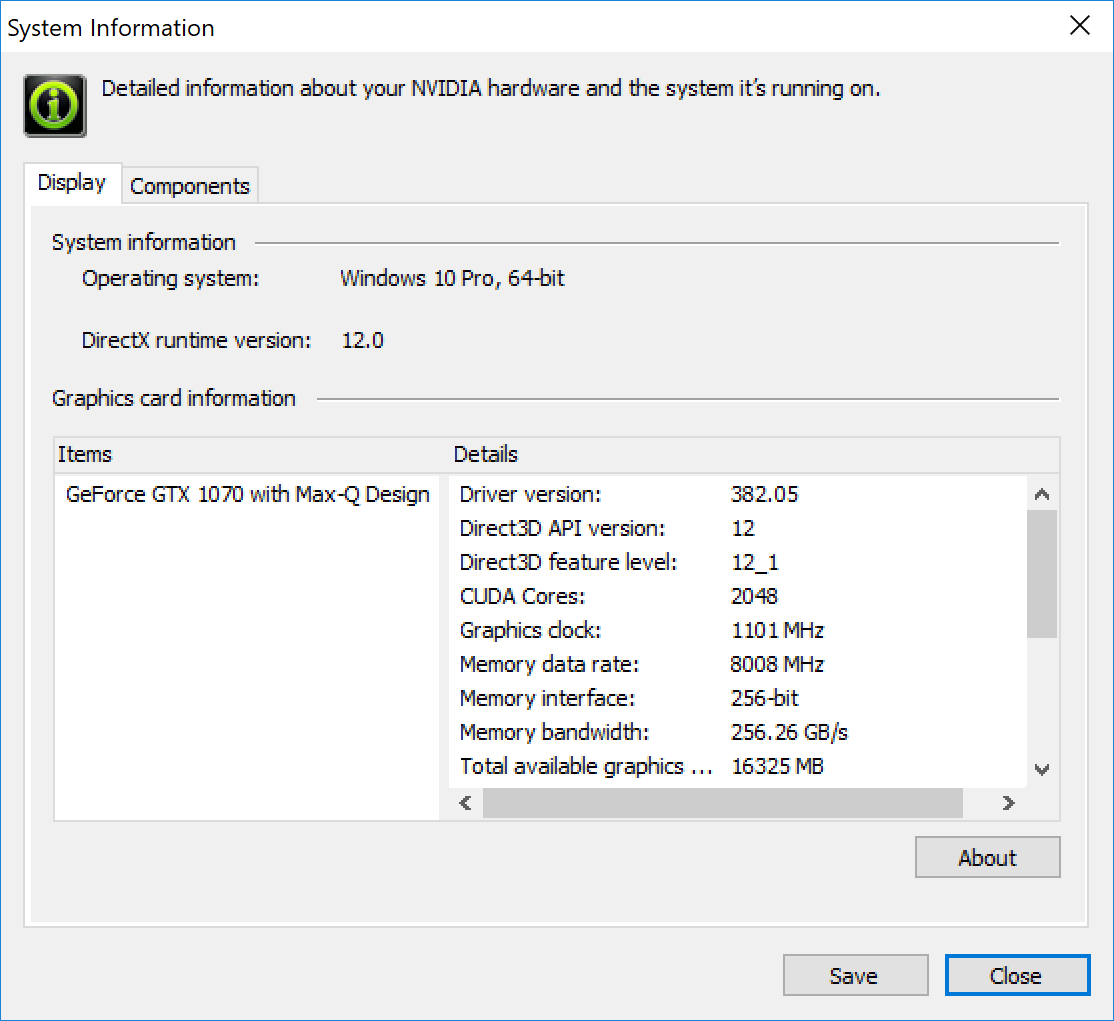
Optimus is mandatory for additional power-saving features at the cost of G-Sync support.
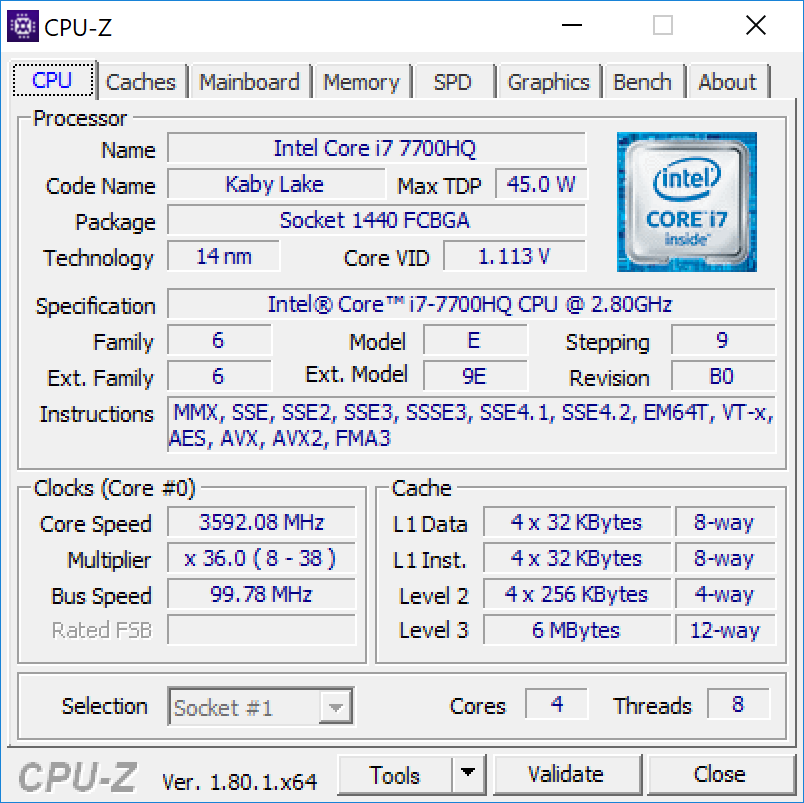
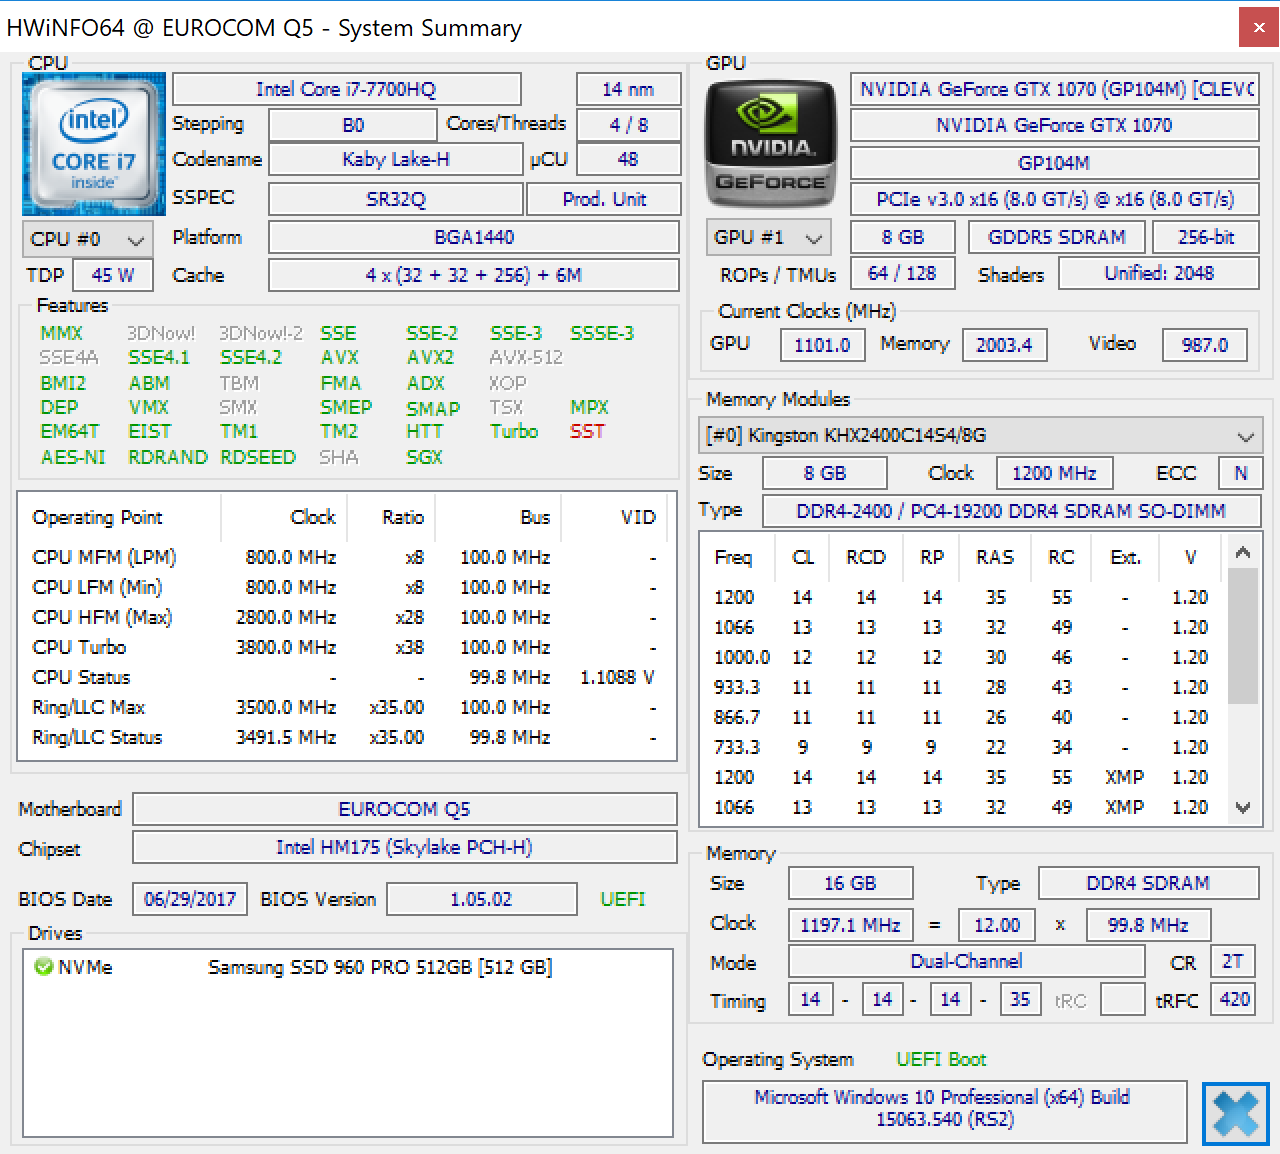
Processor
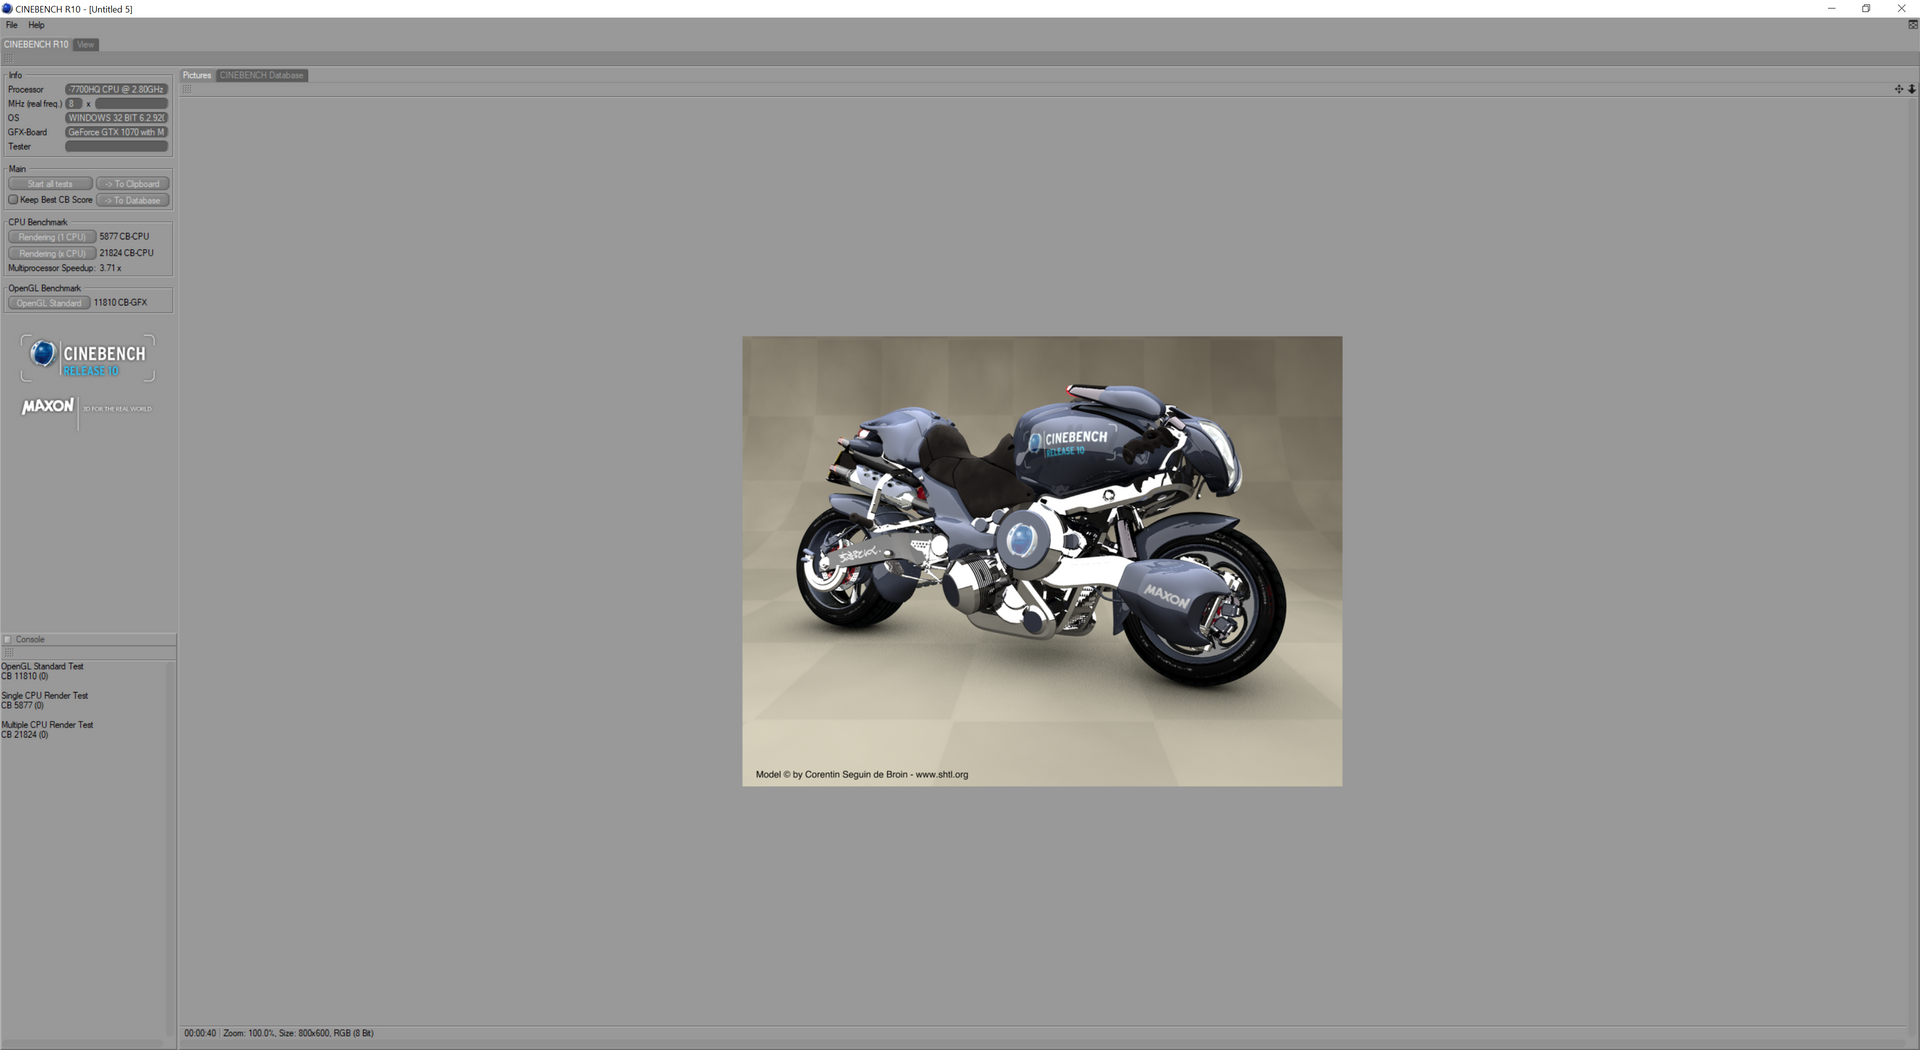
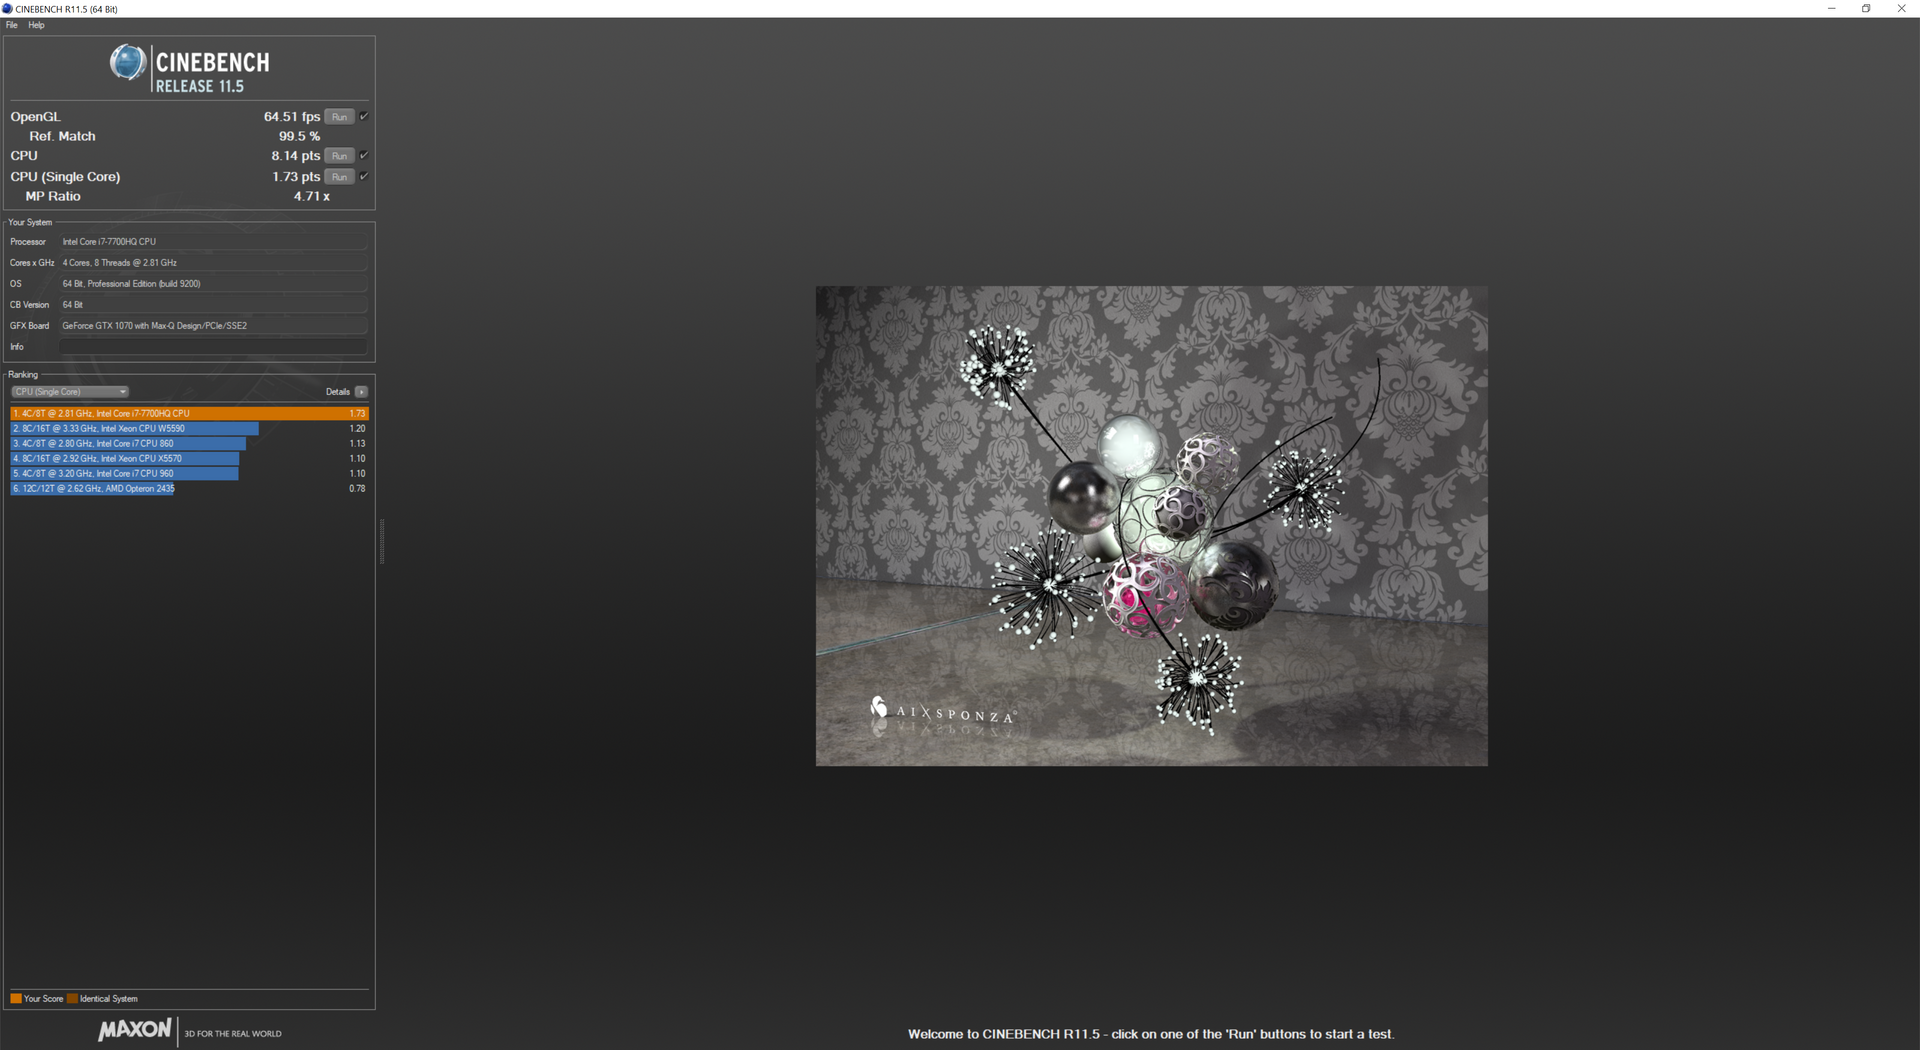
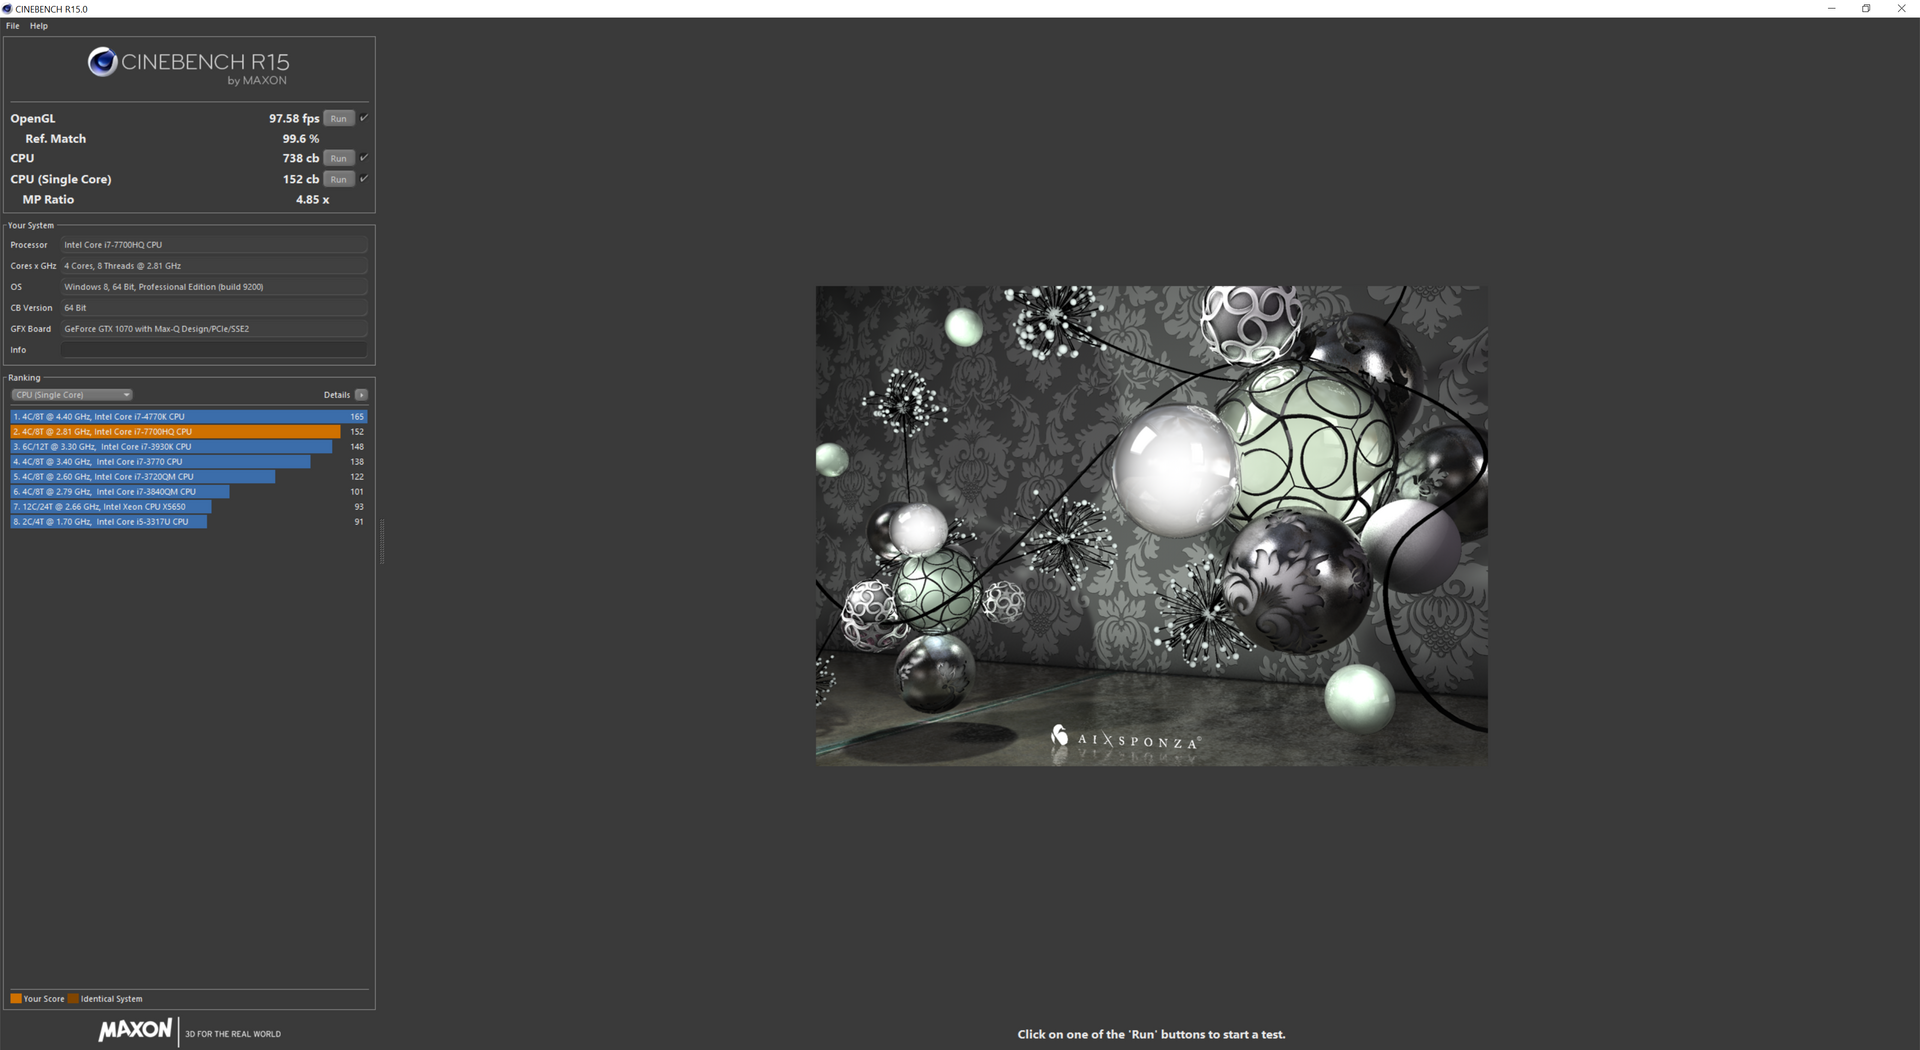
CPU performance is where we expect it to be for an i7-7700HQ. CineBench benchmarks are nearly identical to the Zephyrus GX501VS and just a few percentage points faster than the outgoing Skylake i7-6700HQ and Broadwell i7-5700HQ. Users will not see significant performance gains unless if upgrading from the older Haswell i7-4700HQ or slower dual-core i5-7300HQ.
Turbo Boost sustainability is unfortunately poorer than on the equivalent Asus Zephyrus. Running CineBench R15 Multi-Thread in a loop results in a good initial score of 738 points, but this immediately drops to around 705 points after the first loop to represent a decrease of about 5 percent. Activating Maximum fan speed mode does not appear to affect CineBench R15 scores, either. In contrast, the Zephyrus is able to maintain a steady score in the 730 to 740 range. Even so, most users are unlikely to notice any significant performance drops on the Q5 when running real-world applications.
See our dedicated page on the Core i7-7700HQ for more technical information and benchmarks.
| wPrime 2.10 - 1024m | |
| Lenovo IdeaPad Y50 | |
| Eurocom Q5 | |
| EVGA SC17 GTX 1070 | |
| Asus Zephyrus GX501VS | |
| Gigabyte P55 V4 | |
| Eurocom Tornado F5 | |
* ... smaller is better
System Performance
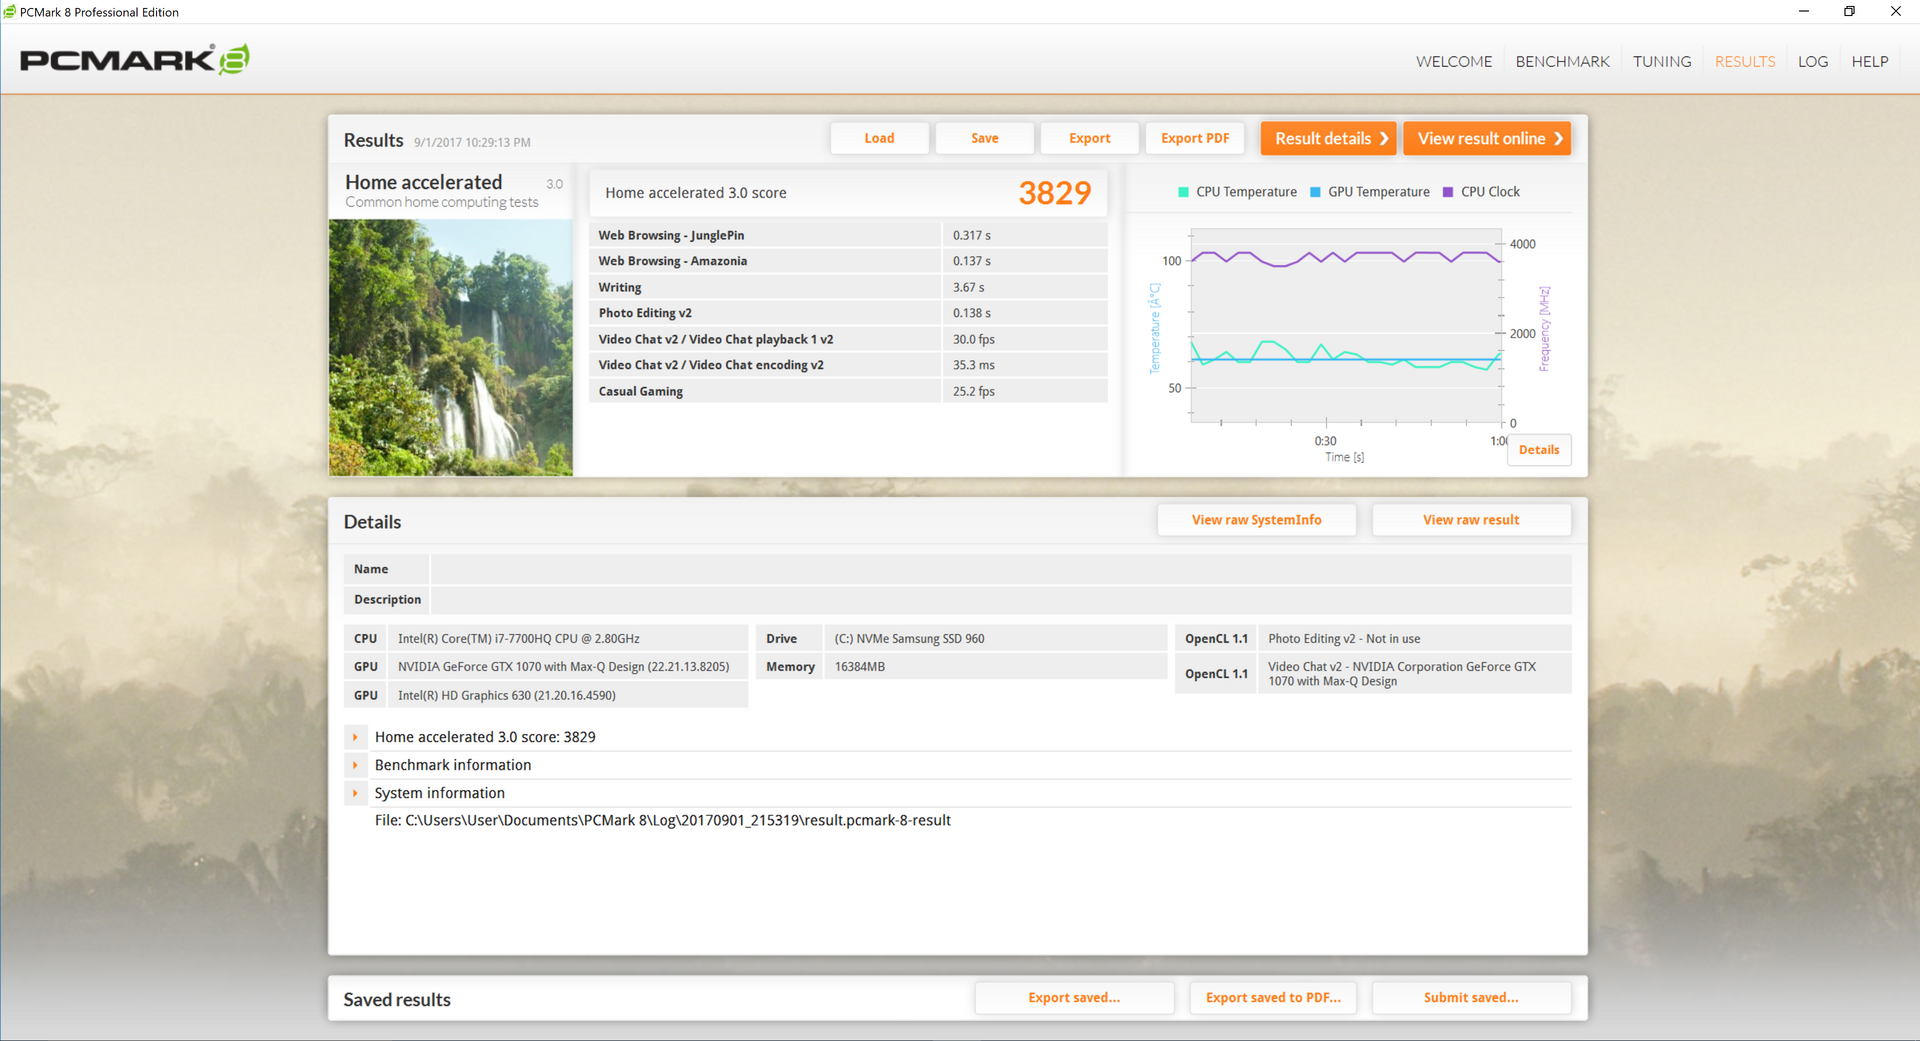
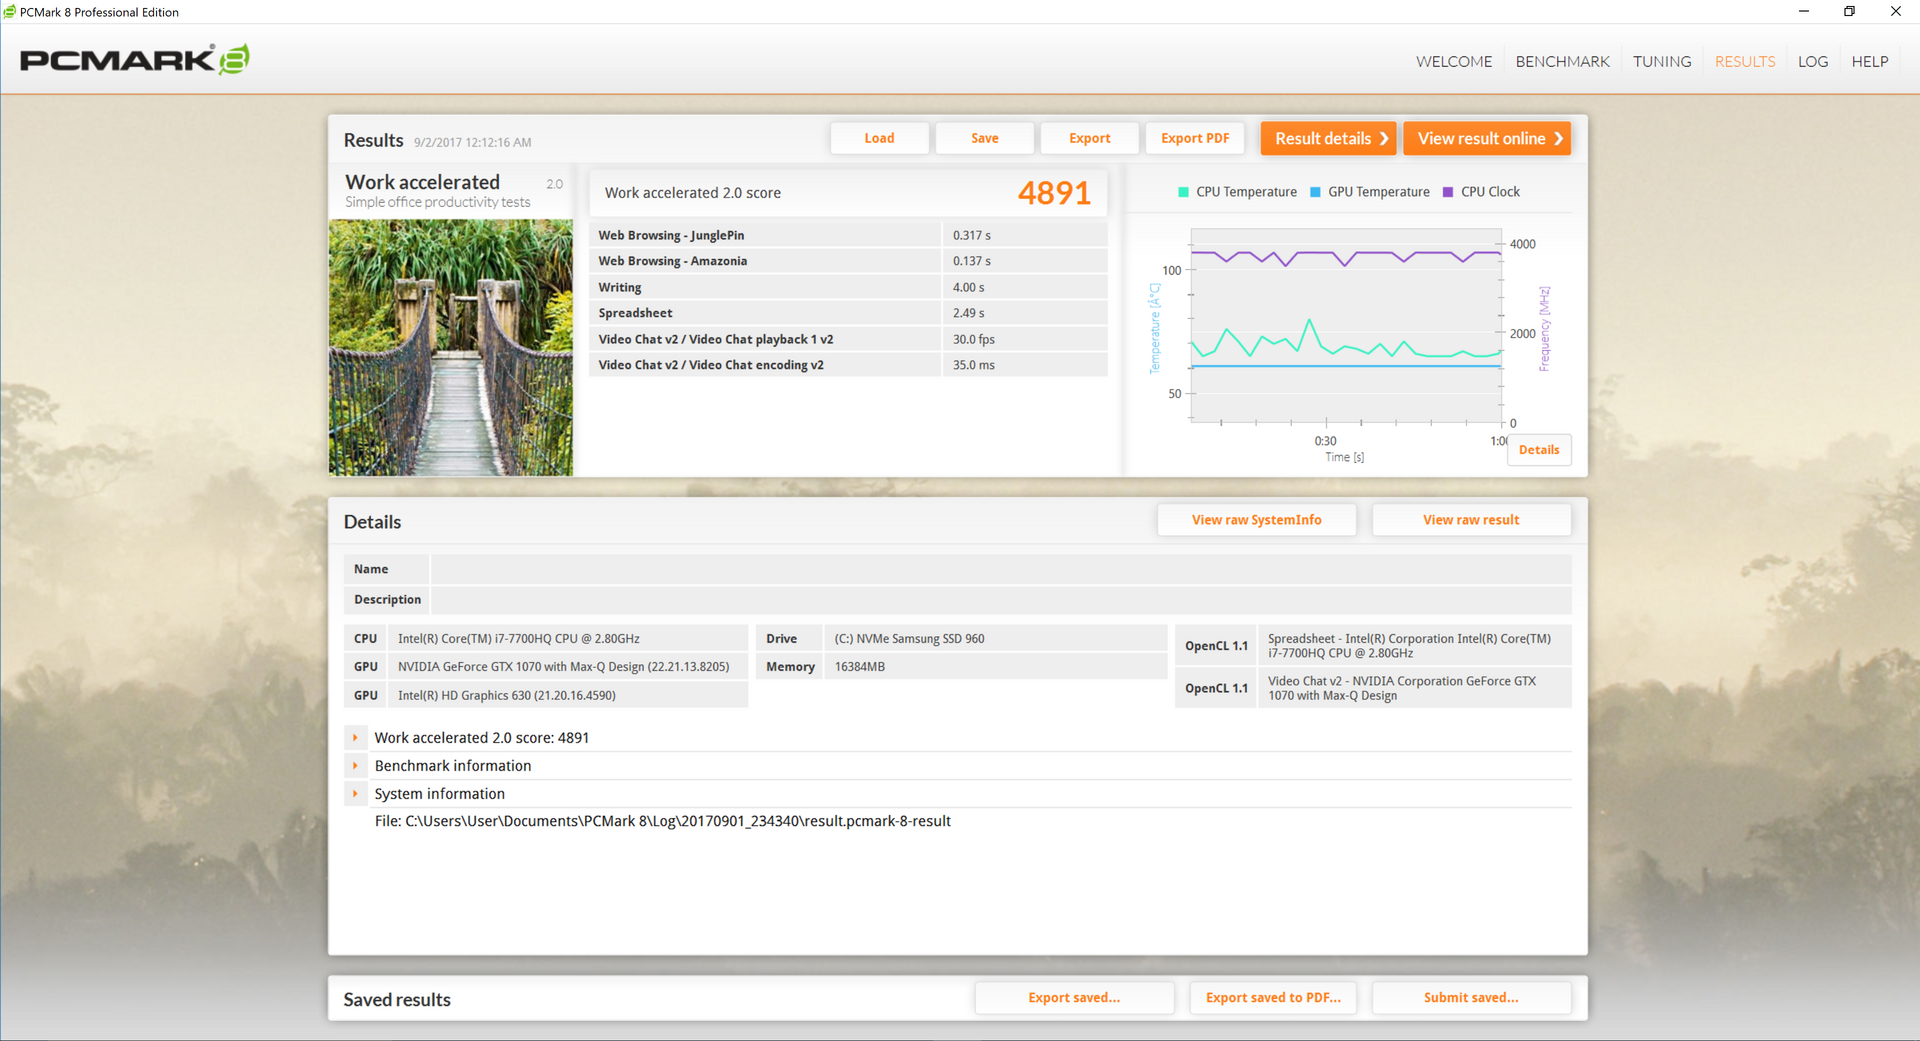
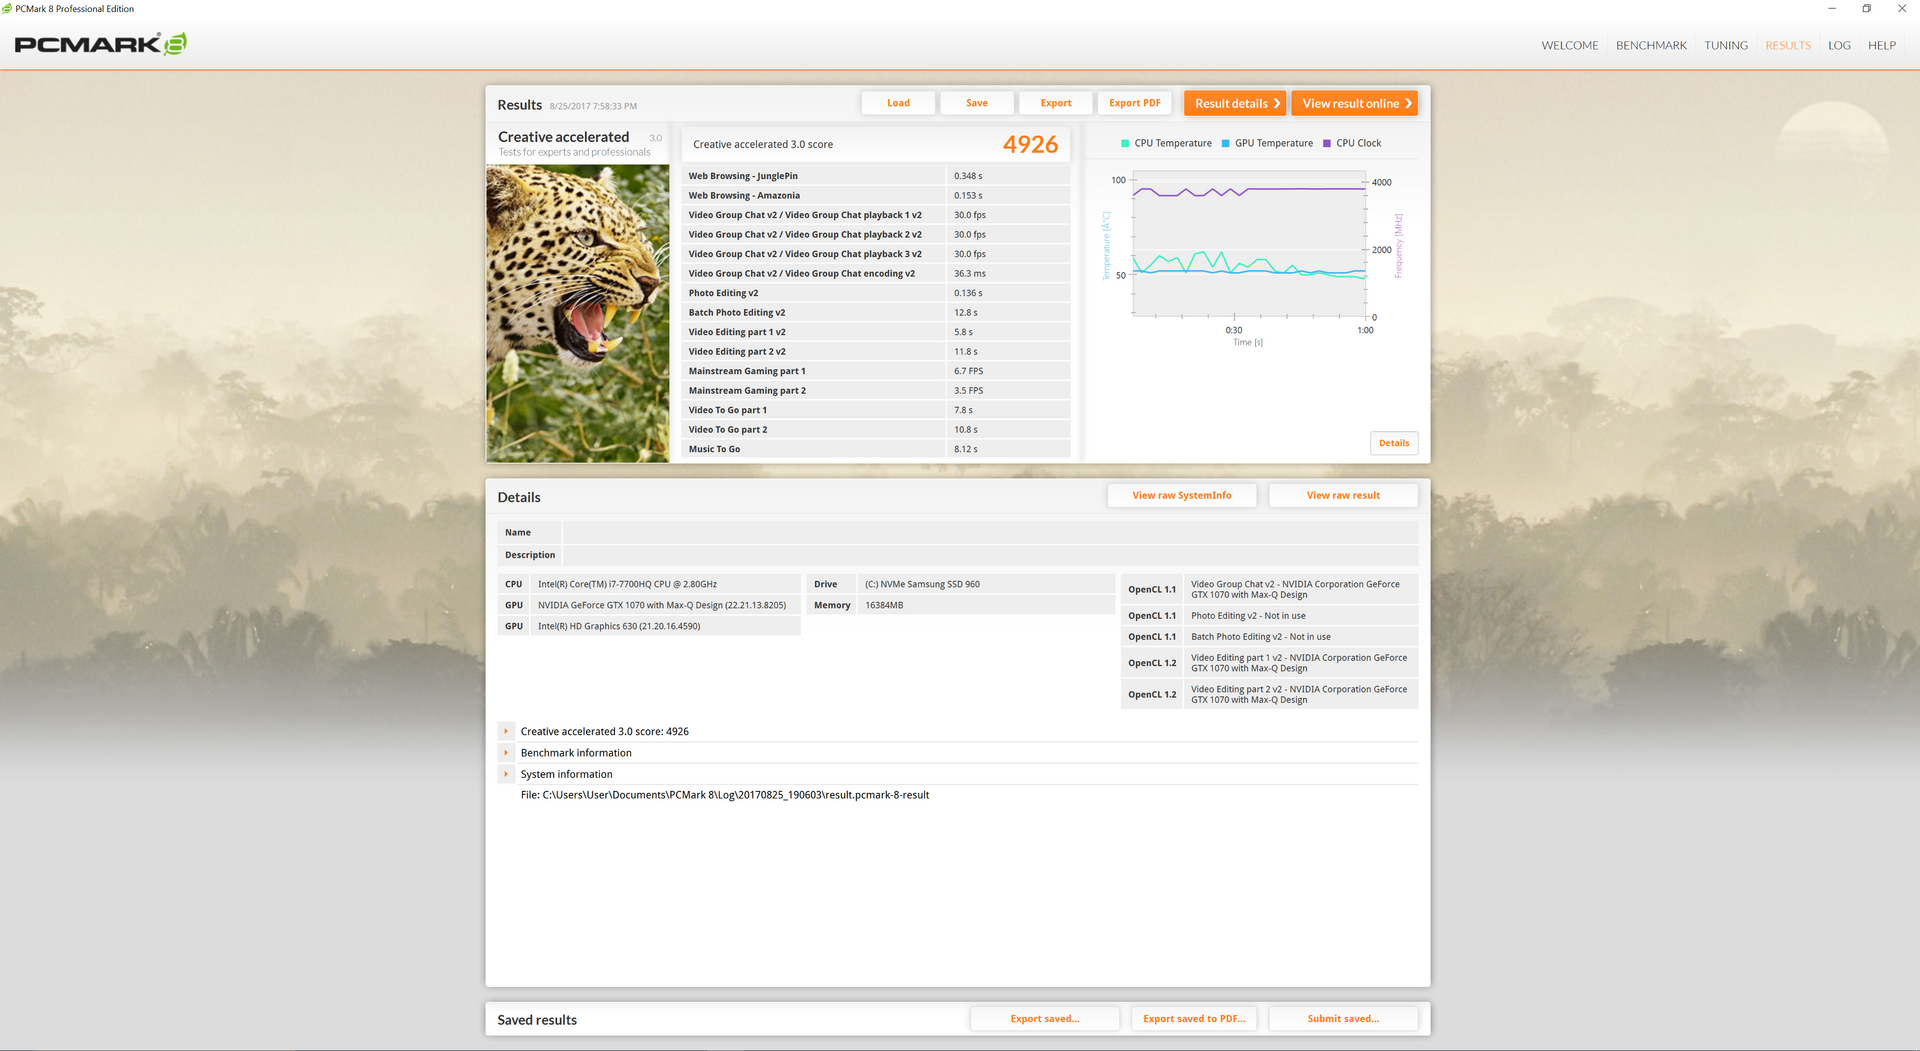
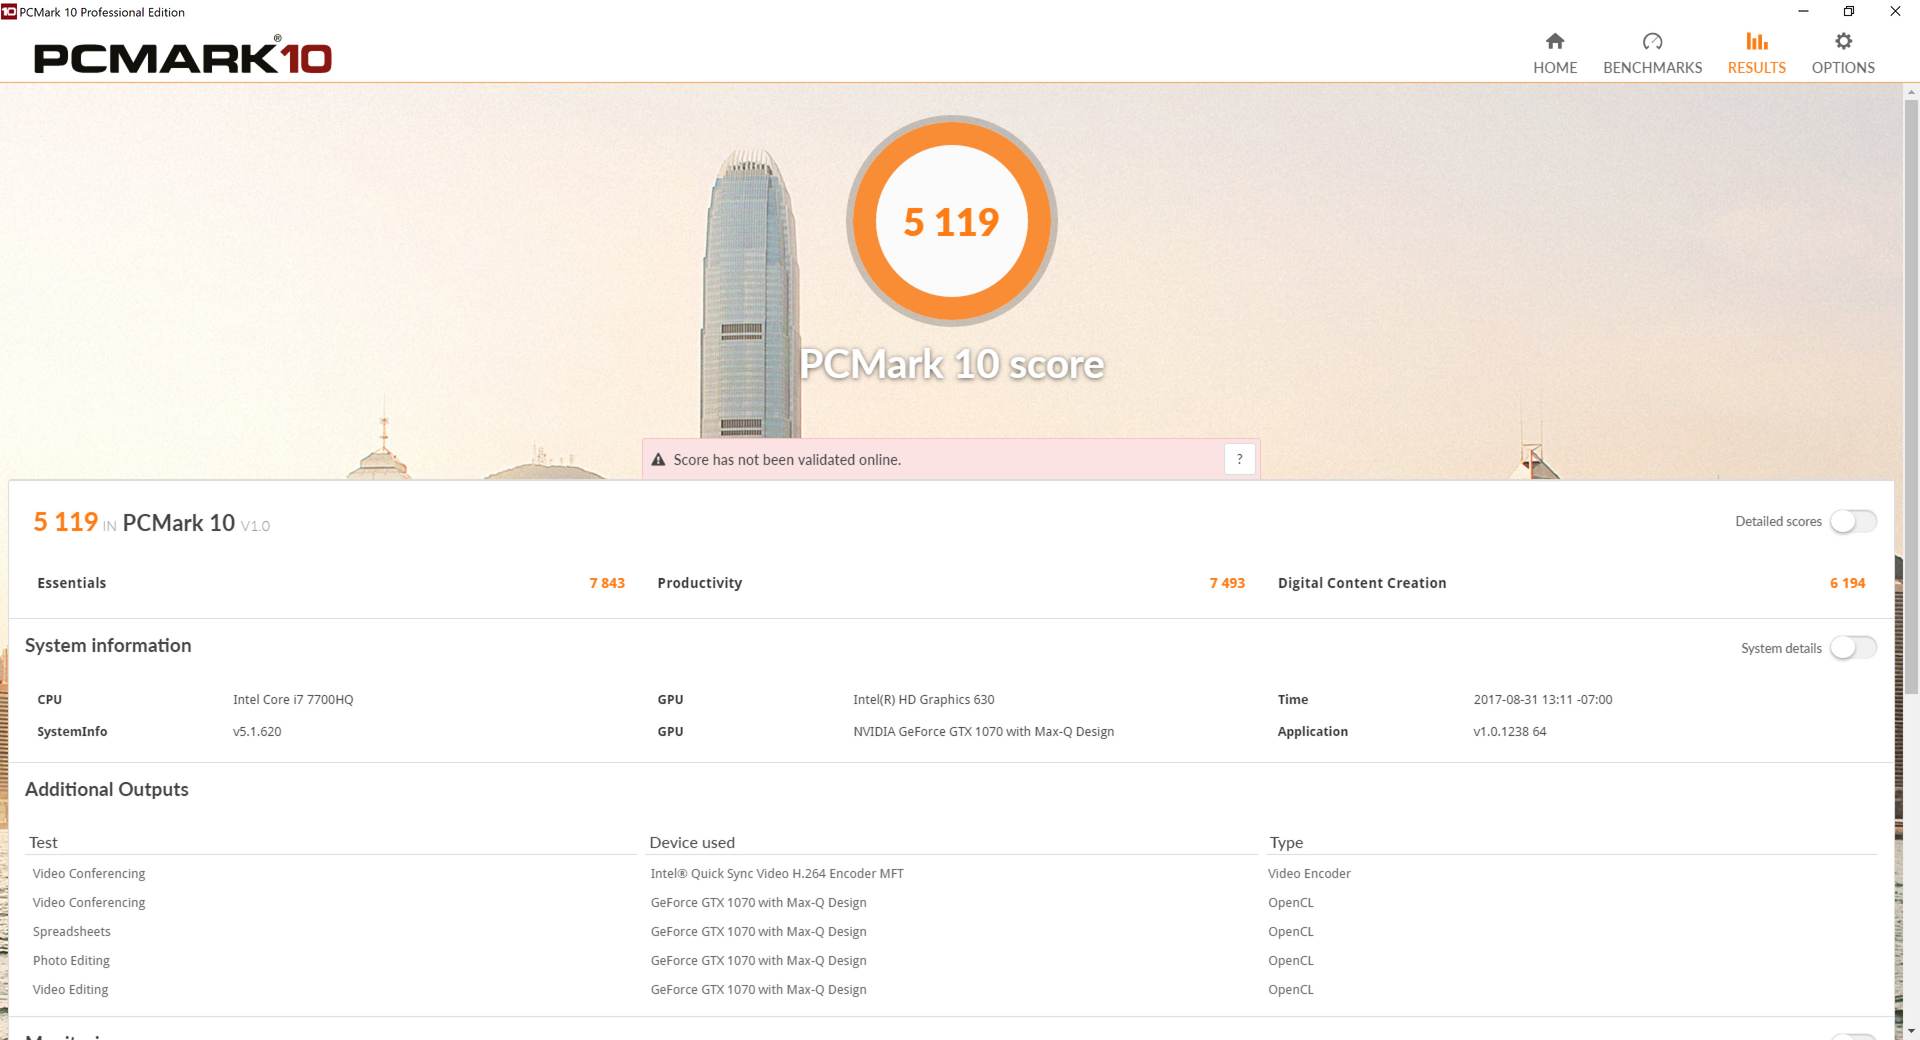
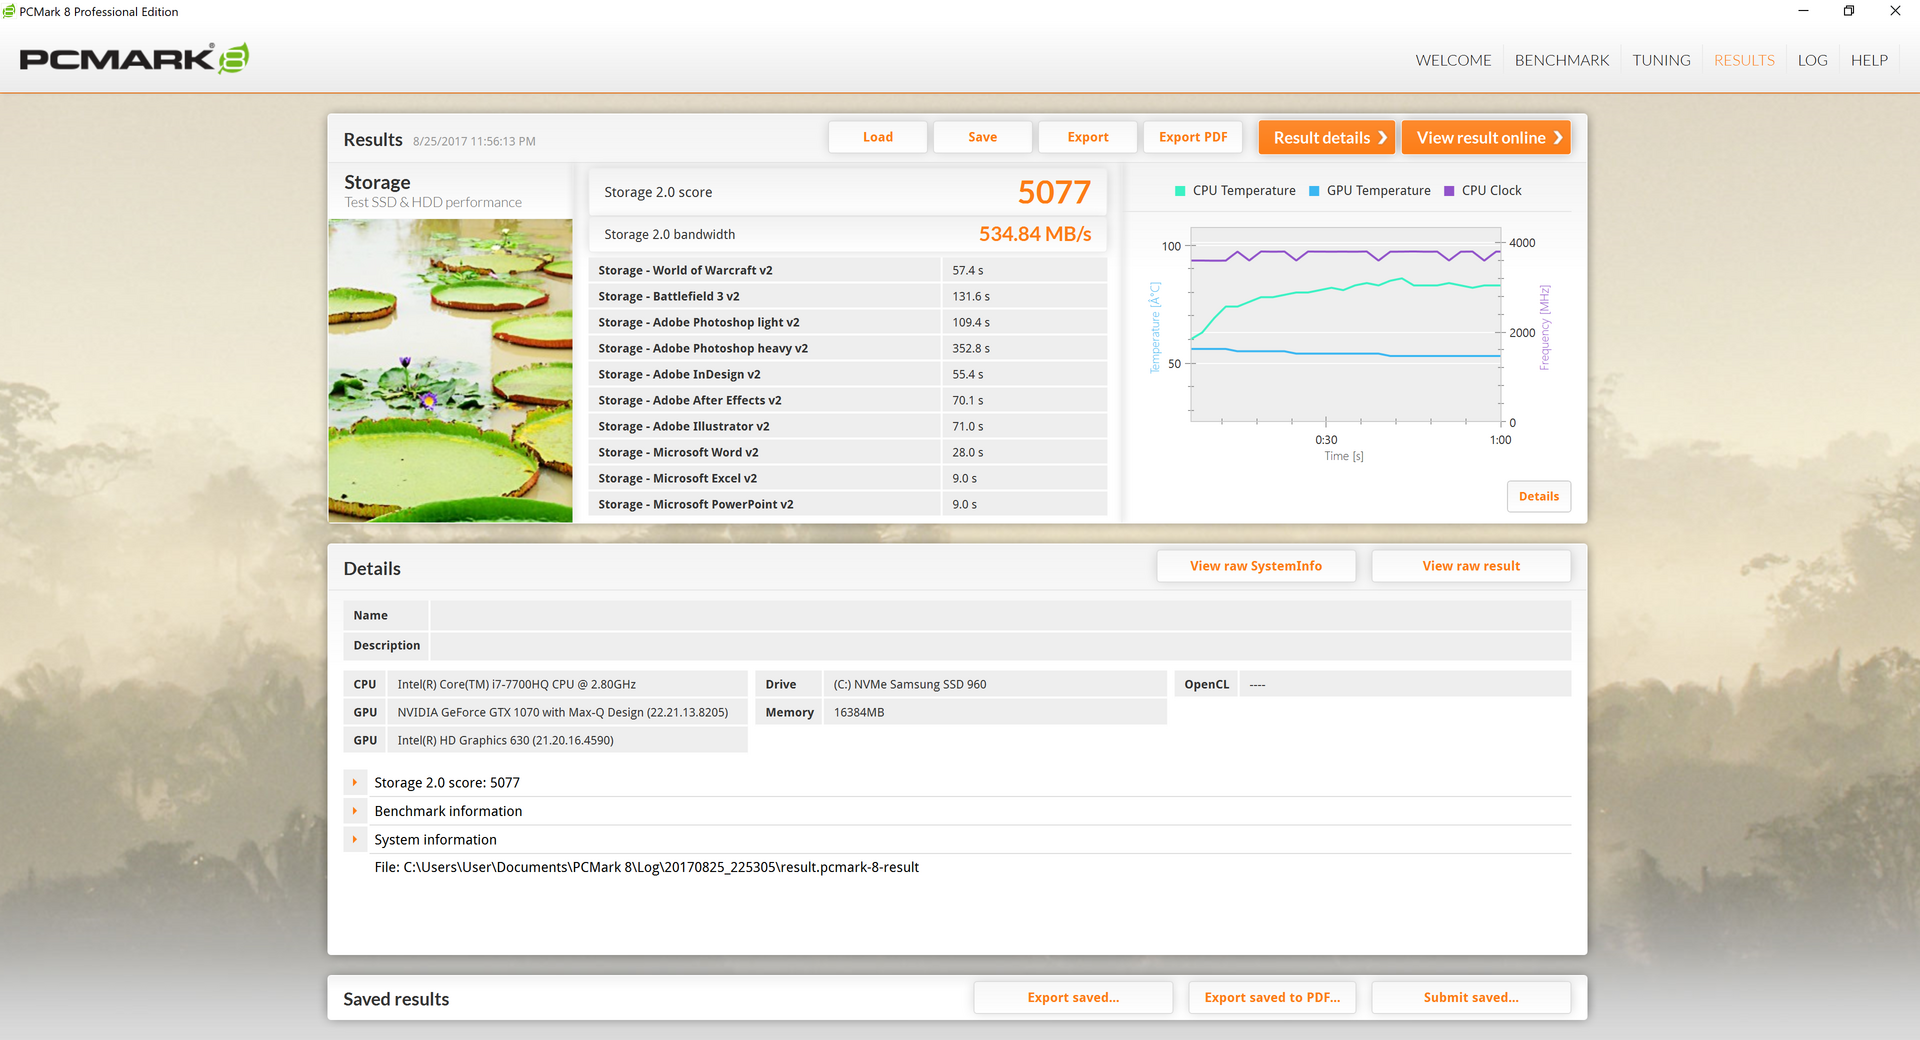
PCMark benchmarks rank the Q5 very similarly to the GS63VR with GTX 1060 graphics. The GX501VS is well ahead possibly due to its faster CPU and GPU clock rates and lower resolution panel even though its core processor specifications are similar to our Q5. Subjectively, we experienced no notable slowdowns on our Eurocom unit during testing and regular use.
| PCMark 8 | |
| Home Score Accelerated v2 | |
| Eurocom Tornado F5 | |
| Asus Zephyrus GX501VS | |
| MSI GS63VR-6RF16H22 Stealth Pro | |
| Eurocom Q5 | |
| Work Score Accelerated v2 | |
| Eurocom Tornado F5 | |
| Asus Zephyrus GX501VS | |
| Eurocom Q5 | |
| MSI GS63VR-6RF16H22 Stealth Pro | |
| Creative Score Accelerated v2 | |
| Eurocom Tornado F5 | |
| Asus Zephyrus GX501VS | |
| MSI GS63VR-6RF16H22 Stealth Pro | |
| Eurocom Q5 | |
| PCMark 8 Home Score Accelerated v2 | 3829 points | |
| PCMark 8 Creative Score Accelerated v2 | 4926 points | |
| PCMark 8 Work Score Accelerated v2 | 4891 points | |
| PCMark 10 Score | 5119 points | |
Help | ||
Storage Devices
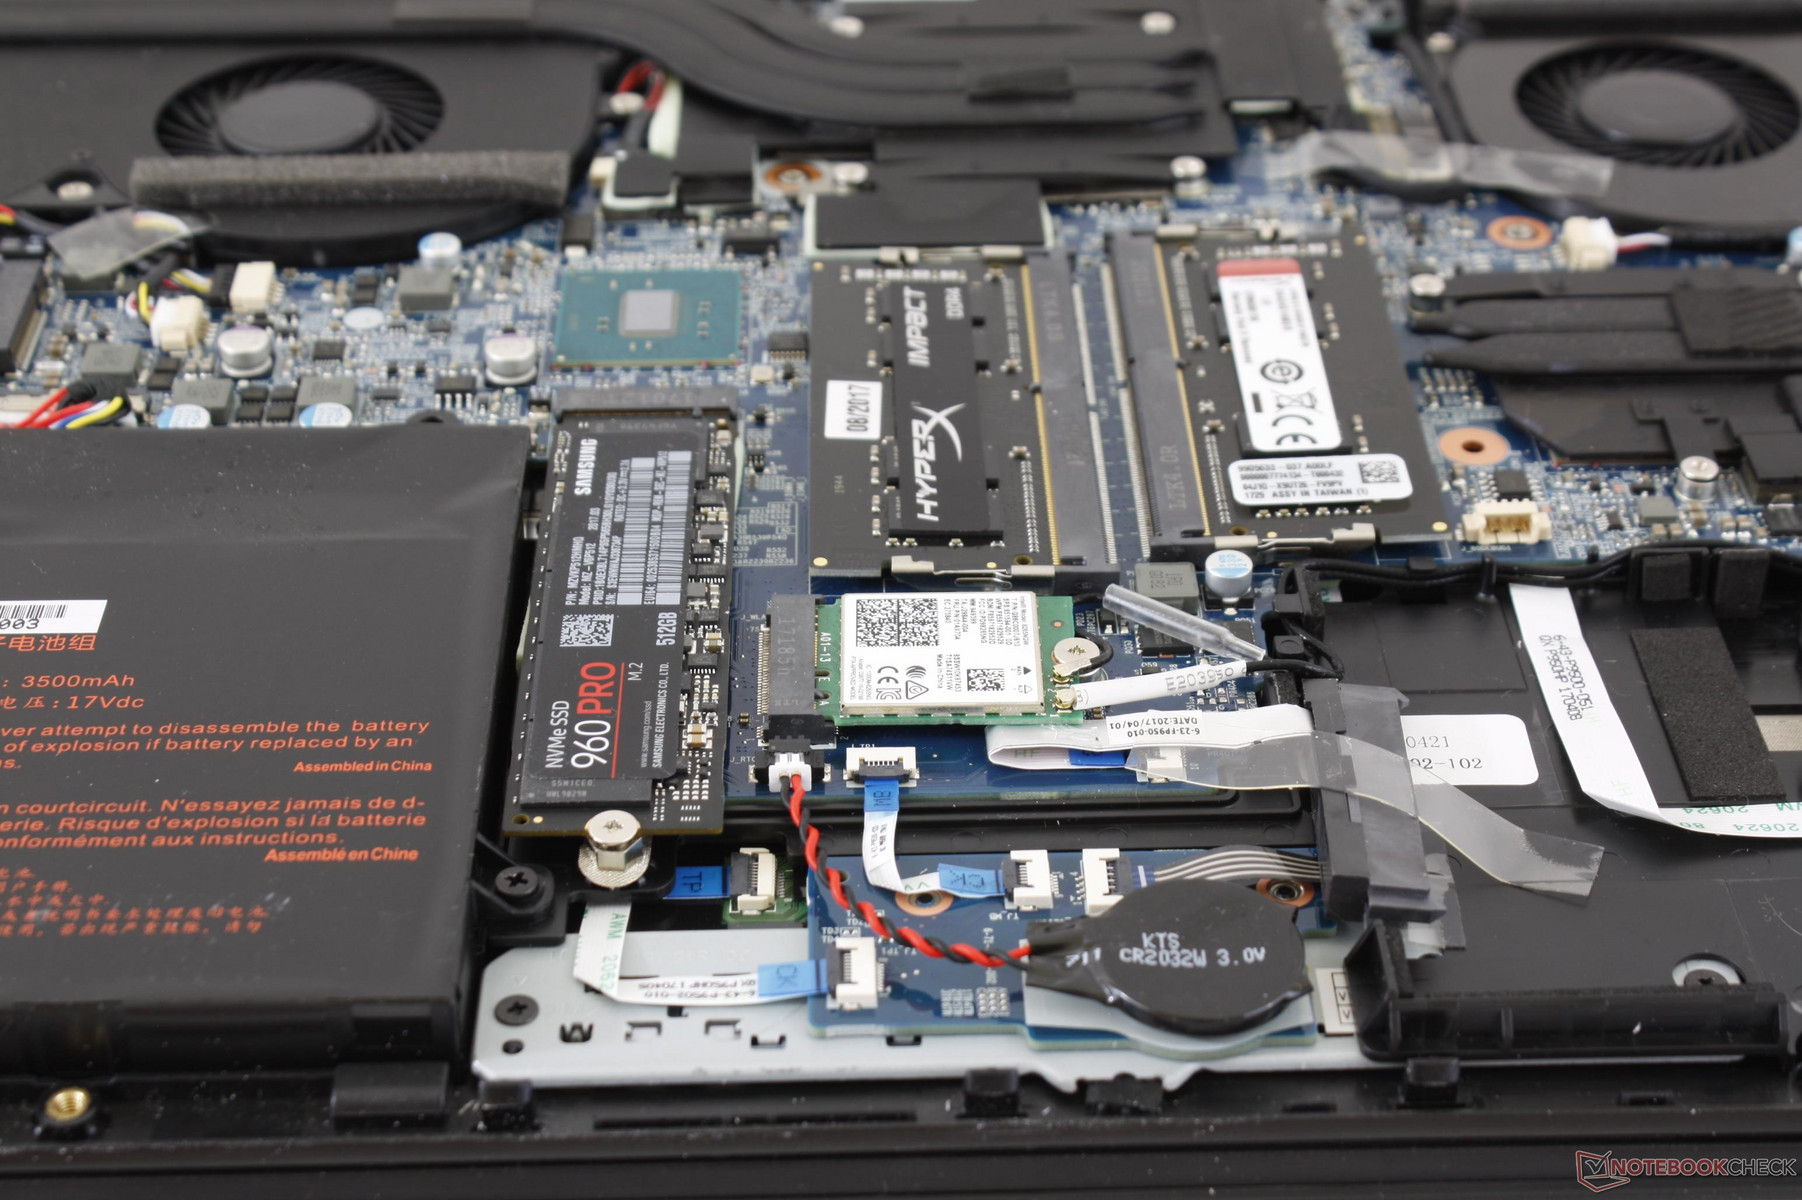
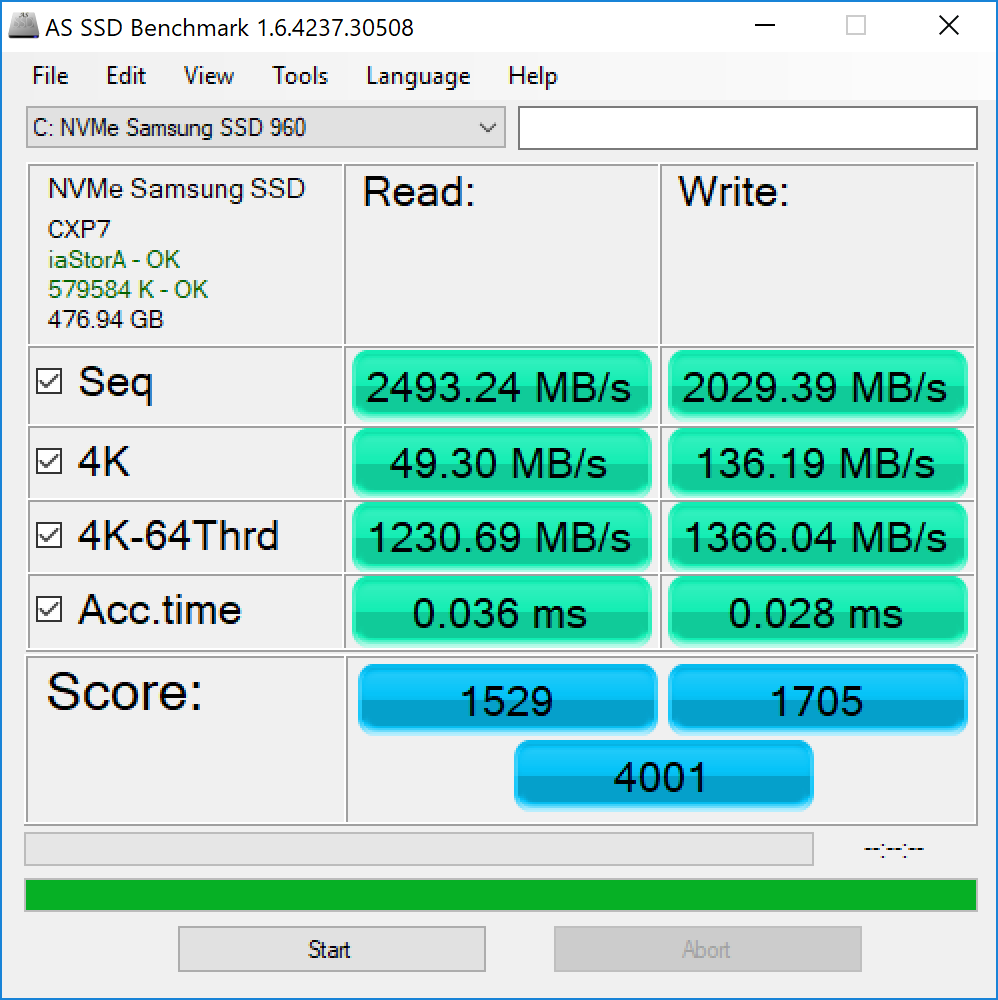
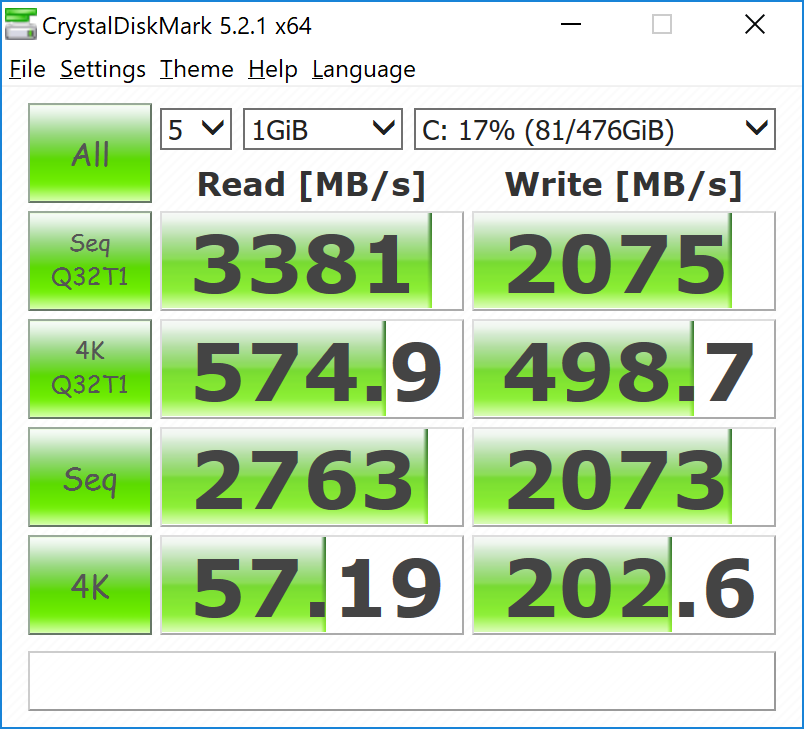
Two internal storage bays are available in the form of M.2 2280 and 2.5-inch SATA III. The M.2 slot supports NVMe while the 2.5-inch bay will only accept 7 mm thick drives due to space limitations. Our test model is equipped with the same primary 512 GB Samsung SSD 960 Pro as on our previous Eurocom Tornado F5. Sequential read and write rates are incredibly fast at about 2500 MB/s and 2000 MB/s, respectively, compared to 1400 MB/s and 735 MB/s write on the Samsung SM961 and SK Hynix PC300. Eurocom will configure up to 2 TB M.2 drives if desired for even more storage space.
See our table of HDDs and SSDs for more benchmark comparisons.
| Eurocom Q5 Samsung SSD 960 Pro 512 GB m.2 | Asus Zephyrus GX501VS Samsung SM961 MZVPW256HEGL | EVGA SC17 GTX 1070 Samsung SM951 MZVPV256 m.2 | Eurocom Tornado F5 Samsung SSD 960 Pro 512 GB m.2 | Alienware 17 R4 SK Hynix PC300 NVMe 512 GB | |
|---|---|---|---|---|---|
| AS SSD | -5% | -22% | 17% | -53% | |
| Copy Game MB/s (MB/s) | 682 | 719 5% | 1034 52% | 1310 92% | 574 -16% |
| Copy Program MB/s (MB/s) | 301.5 | 383.3 27% | 470 56% | 635 111% | 446.1 48% |
| Copy ISO MB/s (MB/s) | 1967 | 1795 -9% | 1337 -32% | 1614 -18% | 1227 -38% |
| Score Total (Points) | 4001 | 3995 0% | 2328 -42% | 3943 -1% | 2072 -48% |
| Score Write (Points) | 1705 | 1293 -24% | 487 -71% | 1689 -1% | 858 -50% |
| Score Read (Points) | 1529 | 1818 19% | 1238 -19% | 1512 -1% | 831 -46% |
| Access Time Write * (ms) | 0.028 | 0.032 -14% | 0.033 -18% | 0.024 14% | 0.123 -339% |
| Access Time Read * (ms) | 0.036 | 0.047 -31% | 0.049 -36% | 0.03 17% | 0.042 -17% |
| 4K-64 Write (MB/s) | 1366 | 1035 -24% | 260.9 -81% | 1334 -2% | 671 -51% |
| 4K-64 Read (MB/s) | 1231 | 1527 24% | 999 -19% | 1179 -4% | 620 -50% |
| 4K Write (MB/s) | 136.2 | 117.3 -14% | 112.1 -18% | 150.5 10% | 113.4 -17% |
| 4K Read (MB/s) | 49.3 | 50.2 2% | 45.64 -7% | 51 3% | 35.61 -28% |
| Seq Write (MB/s) | 2029 | 1409 -31% | 1144 -44% | 2046 1% | 735 -64% |
| Seq Read (MB/s) | 2493 | 2412 -3% | 1934 -22% | 2819 13% | 1752 -30% |
* ... smaller is better

GPU Performance
The GTX 1070 Max-Q in our Eurocom is consistently slower than the similarly equipped Zephyrus GX501VS by about 10 percent in all tested 3DMark benchmarks. This is due to a number of factors including the higher native resolution of the Q5, the presence of Optimus, and the fact that the GPU clock rate is slower than on the GX501VS when under similar gaming loads (1291 MHz vs. 1443 MHz). Raw performance is still greater than a desktop GTX 1060 and GTX 1060 Max-Q by about 10 percent and 40 percent, respectively, albeit these margins are narrower than expected. A "proper" GTX 1070 like the one on the Eurocom MX5 will provide a performance benefit of about 25 percent over our Q5.
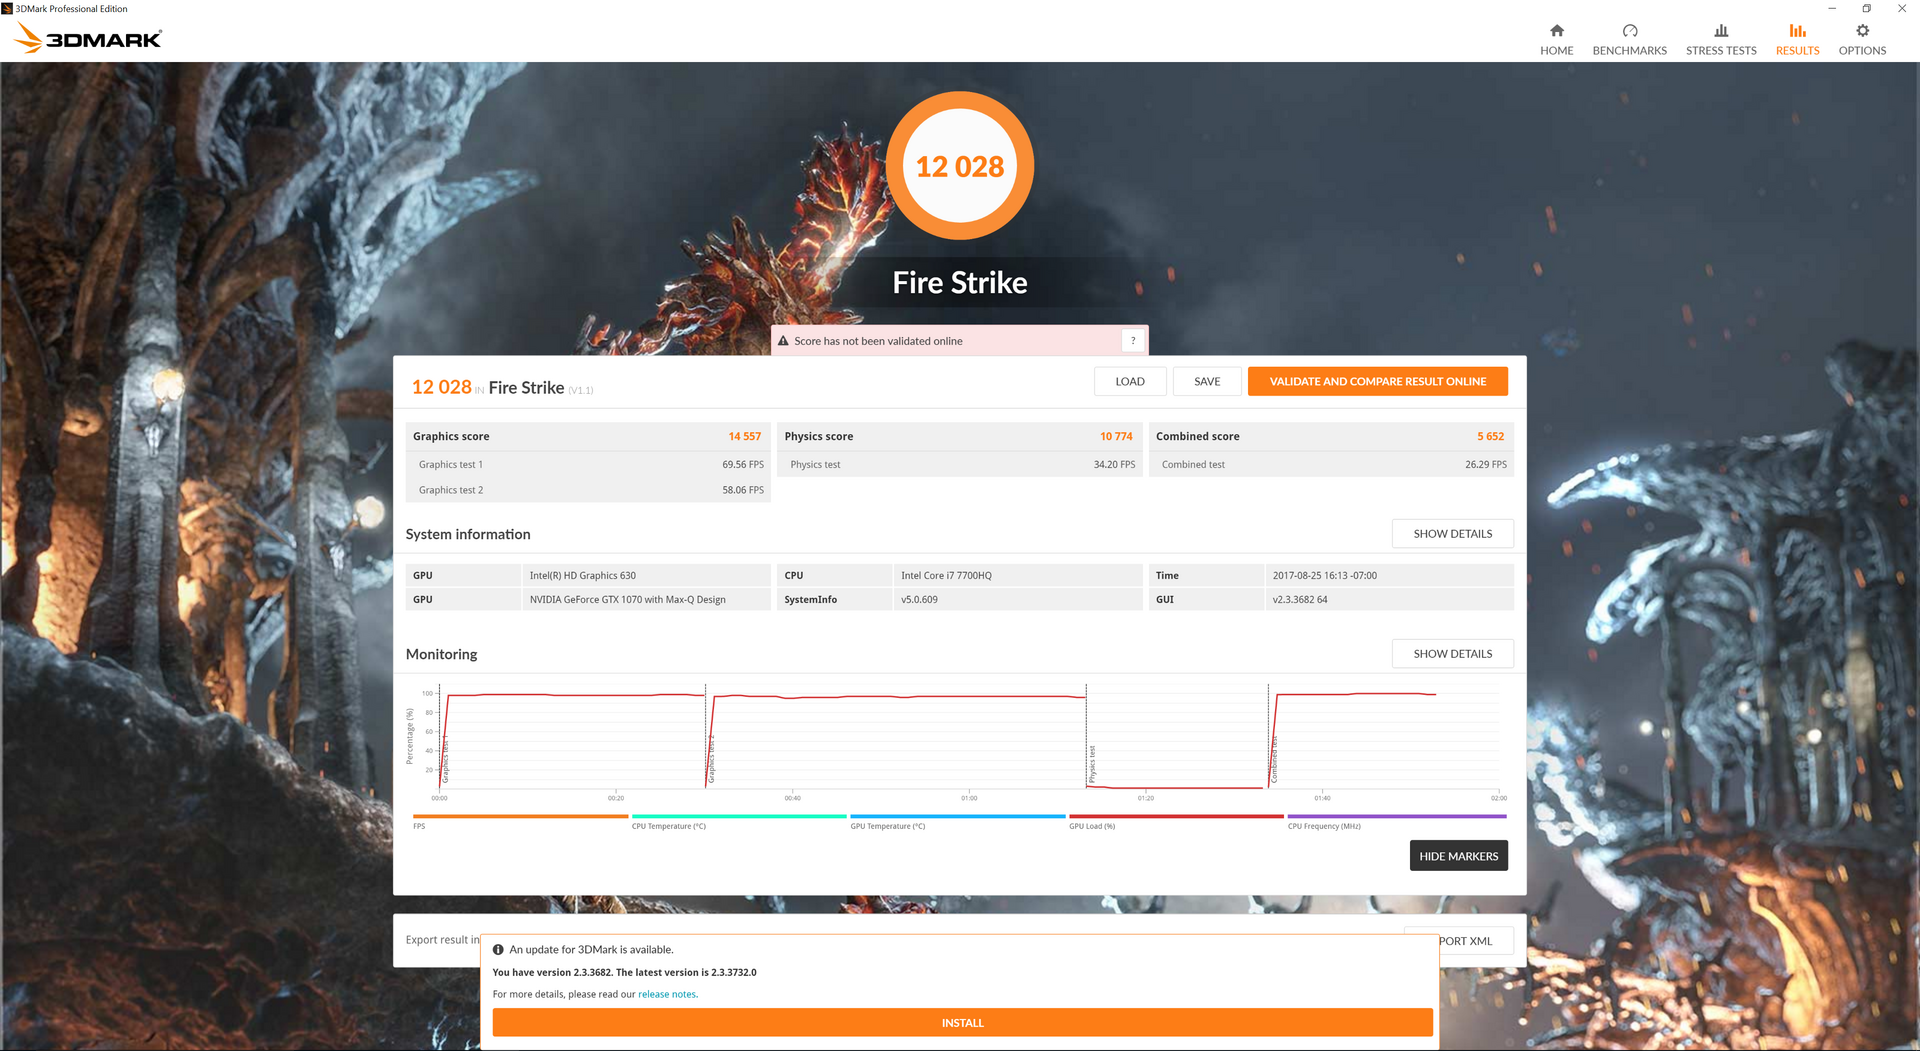
Note that 3DMark scores do NOT improve on different fan modes. Setting the fan speed to Maximum and Automatic will result in 3DMark Fire Strike Graphics scores of 14660 and 14576 points, respectively, compared to 14557 points on our manual 55 percent fan mode setting.
See our overview of Nvidia Max-Q for more technical information on the series.
| 3DMark | |
| 1920x1080 Fire Strike Graphics | |
| MSI GT75VR 7RF-012 Titan Pro | |
| Asus Zephyrus GX501 | |
| Asus Zephyrus GX501VS | |
| Eurocom Q5 | |
| Nvidia GeForce GTX 1060 Founders Edition 6 GB | |
| HP Omen 15-ce002ng | |
| Eurocom P5 Pro Extreme | |
| MSI GP62 7REX-1045US | |
| Dell Inspiron 15 7000 7567 Gaming (Core i5-7300HQ, GTX 1050) | |
| 3840x2160 Fire Strike Ultra Graphics | |
| Asus Zephyrus GX501 | |
| Asus Zephyrus GX501VS | |
| Eurocom Q5 | |
| Nvidia GeForce GTX 1060 Founders Edition 6 GB | |
| MSI GP62 7REX-1045US | |
| Dell Inspiron 15 7000 7567 Gaming (Core i5-7300HQ, GTX 1050) | |
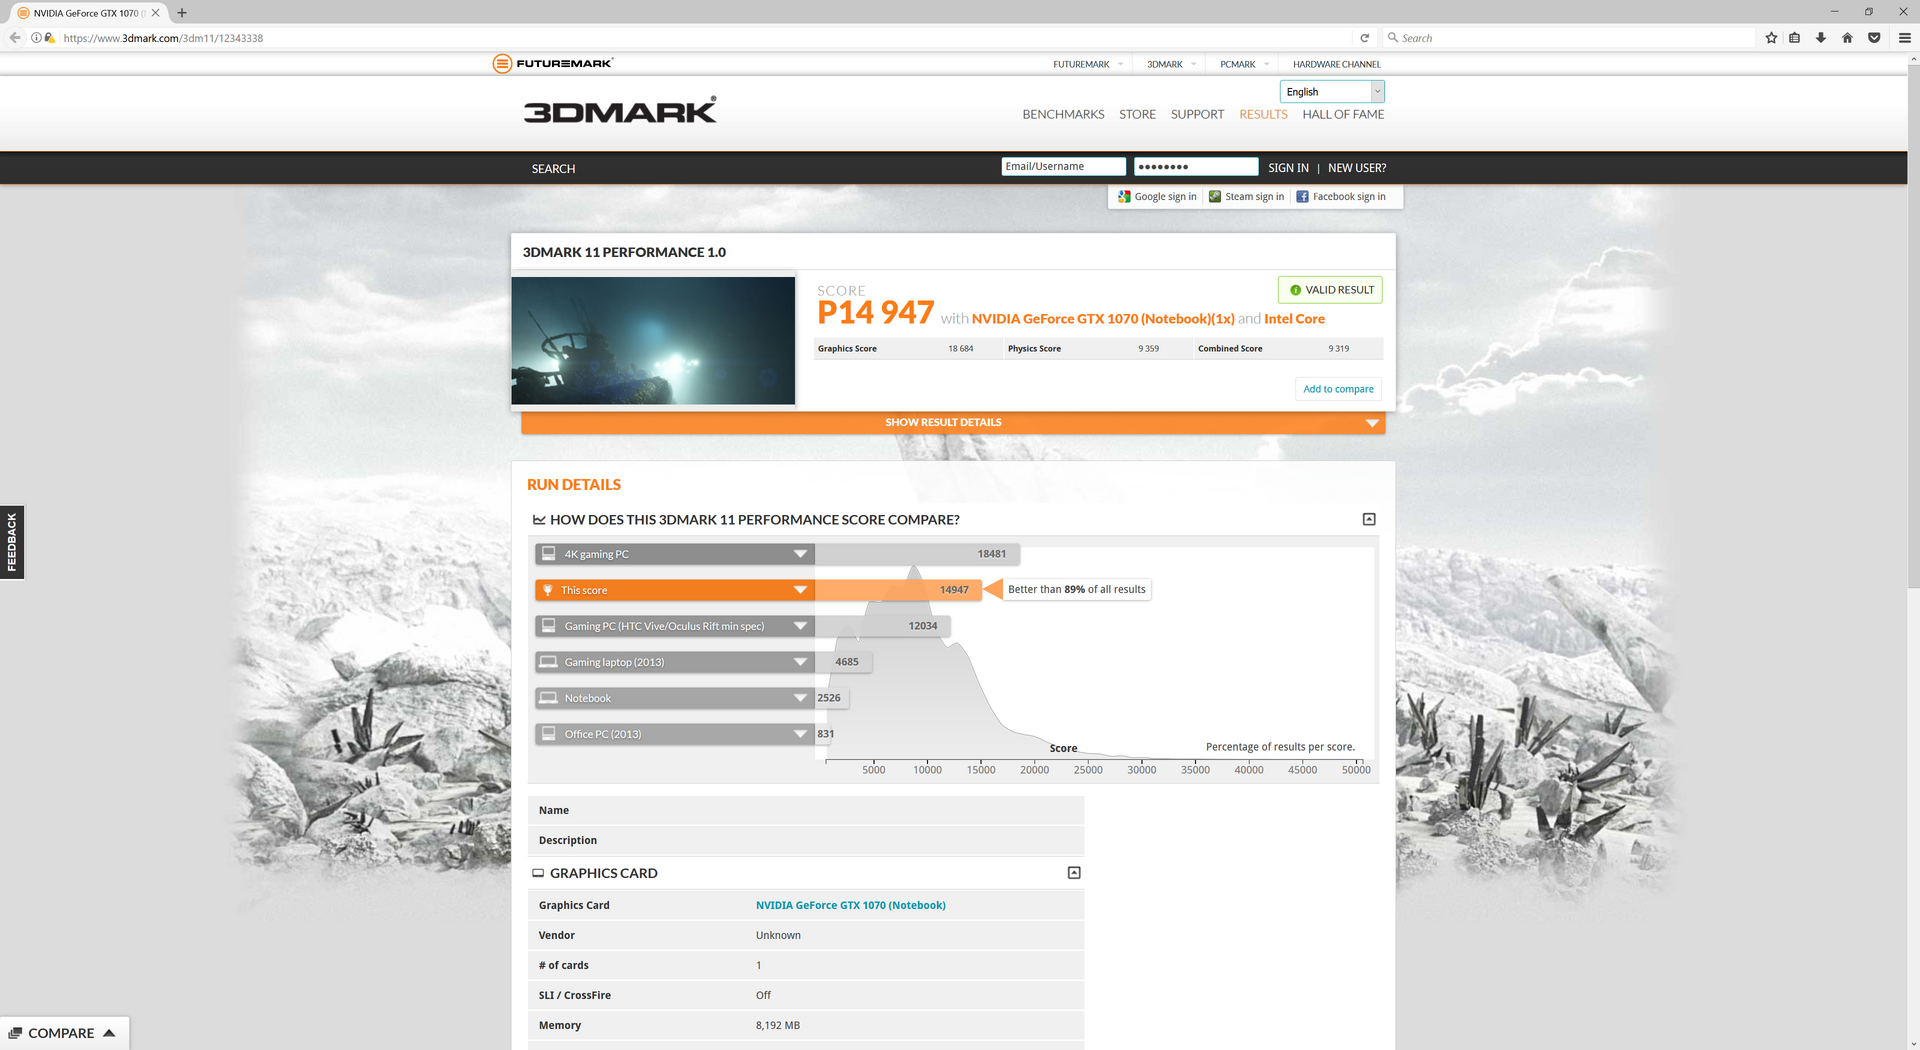
| 3DMark 11 Performance | 14947 points | |
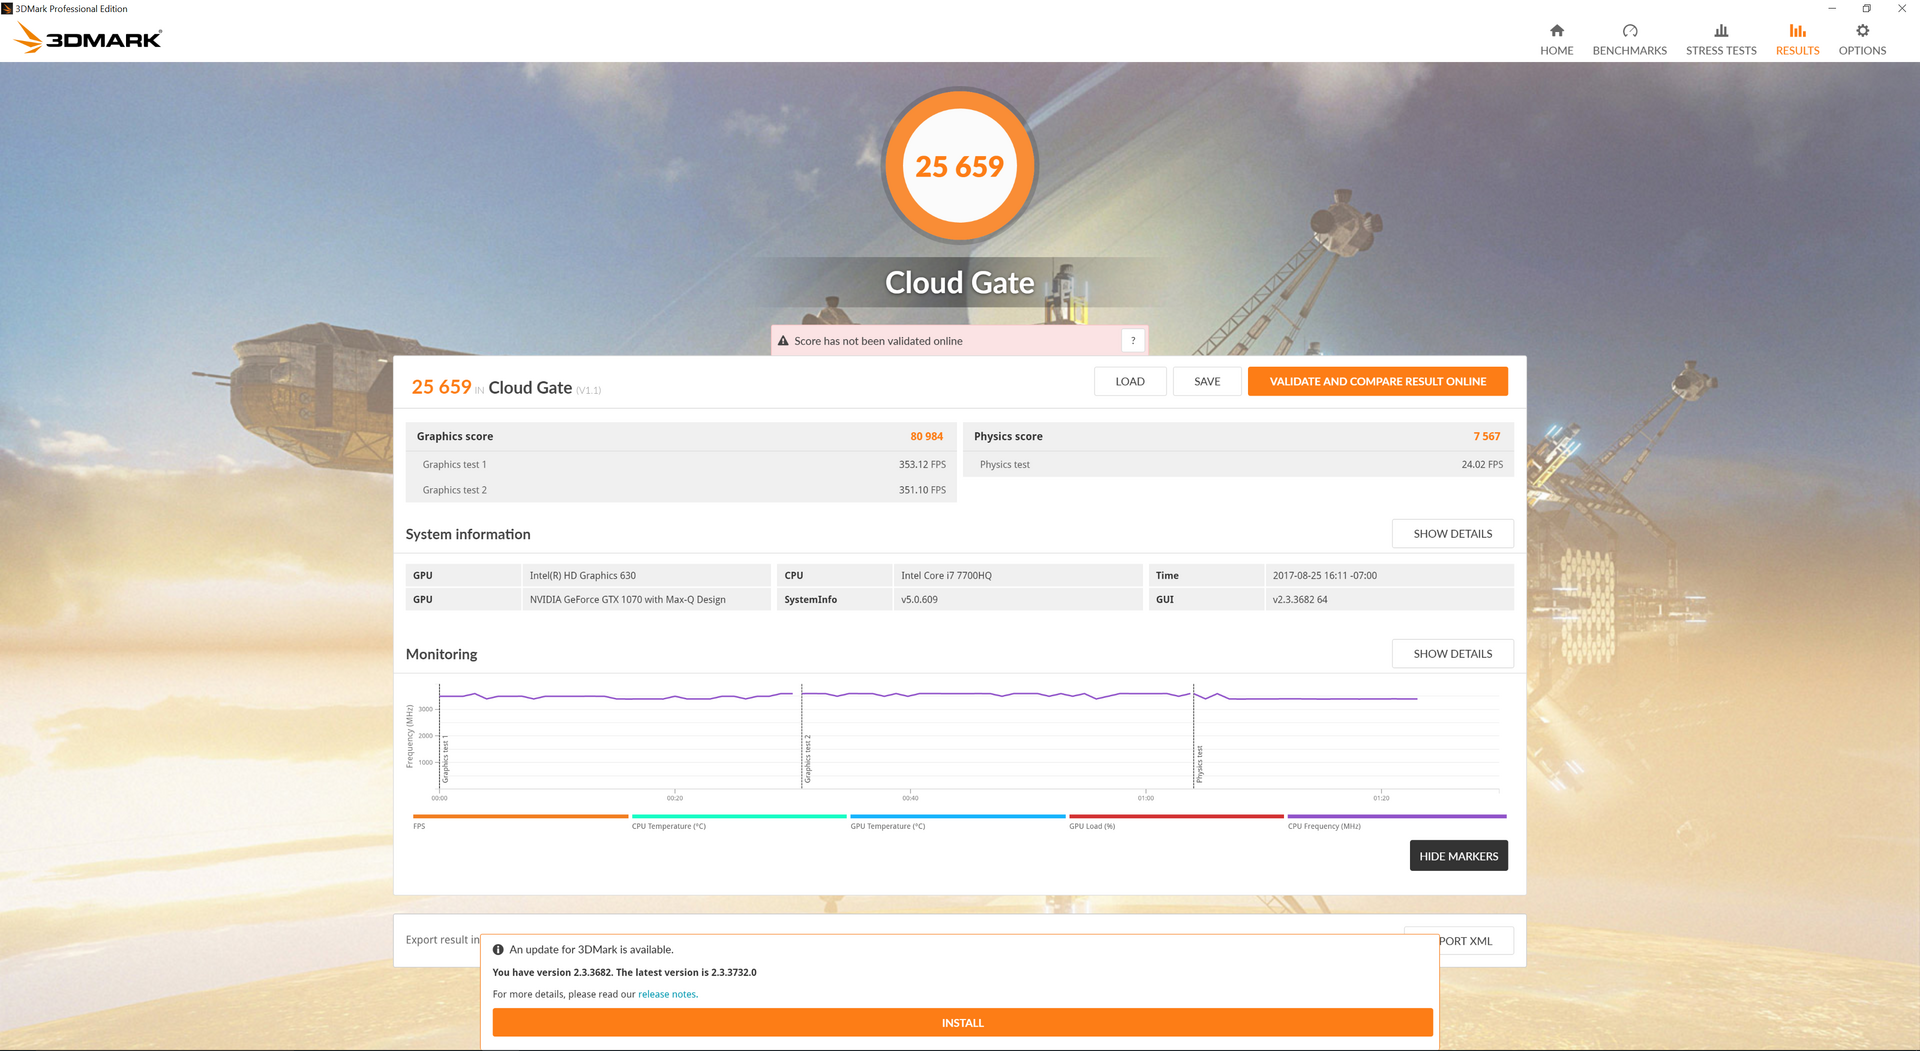
| 3DMark Cloud Gate Standard Score | 25659 points | |
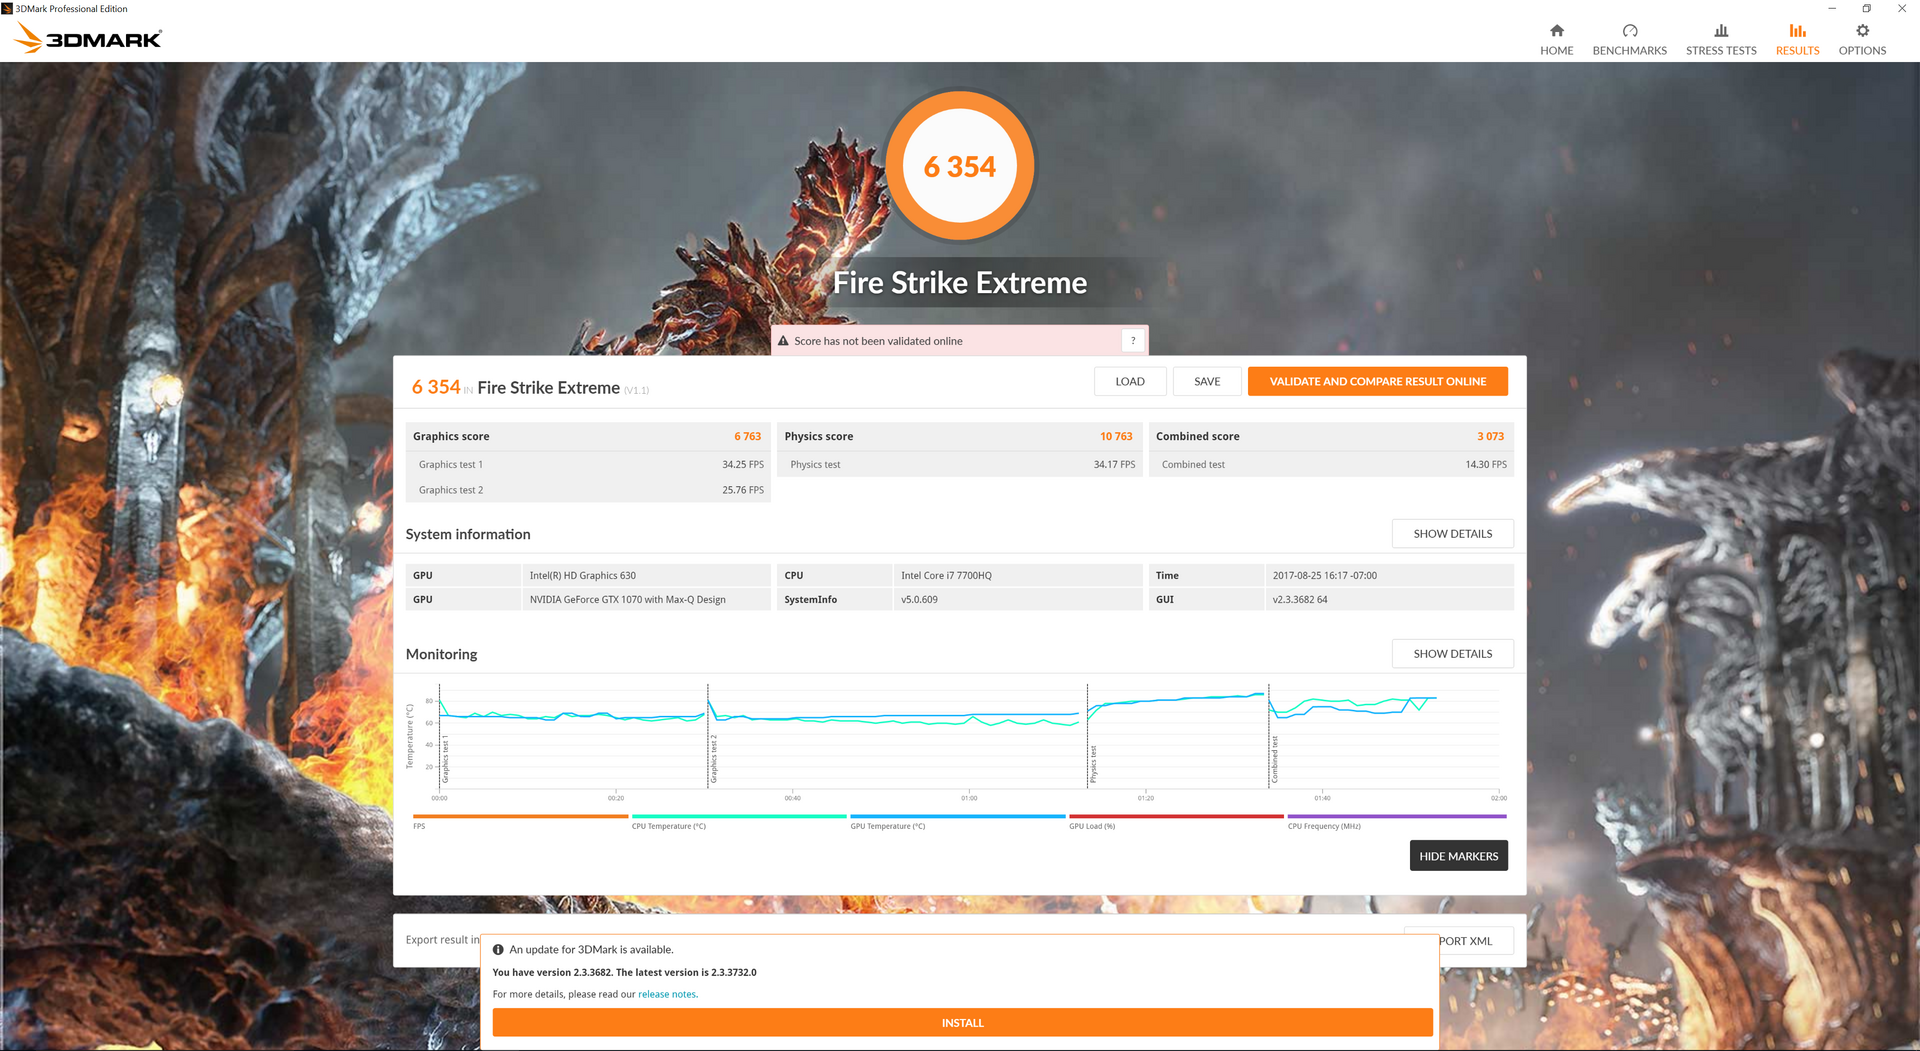
| 3DMark Fire Strike Score | 12028 points | |
| 3DMark Fire Strike Extreme Score | 6354 points | |
Help | ||
Gaming Performance
The Q5 is again comfortably between a standard GTX 1060 and the GTX 1070 Max-Q in the Zephyrus during real-world gaming loads. If 1080p60 at maximum settings is the goal, then the Q5 will be more than sufficient for nearly all modern titles even if the GPU is running a bit slower than anticipated. If 120 FPS is preferred, then this particular GPU can be considered underpowered for most titles.
Native 4K gaming is possible albeit in the unfavorable 30 to 45 FPS range. Since G-Sync is unavailable, users will have to lock frame rates to 30 FPS or reduce in-game settings for 60 FPS in order to get a more consistent experience.
See our dedicated page on the GTX 1070 Max-Q for more benchmark comparisons.
| Rise of the Tomb Raider - 1920x1080 Very High Preset AA:FX AF:16x | |
| Aorus X7 DT v6 | |
| Asus Zephyrus GX501 | |
| MSI Gaming Z GeForce GTX 1070 OC Bios Desktop PC | |
| Eurocom Sky MX5 R3 | |
| Asus Zephyrus GX501VS | |
| Eurocom Q5 | |
| MSI GS43VR 7RE-069US | |
| Asus Strix GL502VY-DS71 | |
| HP Omen 15-ce002ng | |
| Asus Strix GL502VT-DS74 | |
| BioShock Infinite - 1920x1080 Ultra Preset, DX11 (DDOF) | |
| Aorus X7 DT v6 | |
| MSI Gaming Z GeForce GTX 1070 OC Bios Desktop PC | |
| Aorus X7 v7 | |
| Eurocom Sky MX5 R3 | |
| Asus Zephyrus GX501VS | |
| Eurocom Q5 | |
| MSI GS43VR 7RE-069US | |
| Asus Strix GL502VY-DS71 | |
| Asus Strix GL502VT-DS74 | |
| Fallout 4 - 1920x1080 Ultra Preset AA:T AF:16x | |
| Aorus X7 DT v6 | |
| MSI Gaming Z GeForce GTX 1070 OC Bios Desktop PC | |
| Eurocom Sky MX5 R3 | |
| Asus Zephyrus GX501VS | |
| Eurocom Q5 | |
| MSI GS43VR 7RE-069US | |
| Asus Strix GL502VY-DS71 | |
| Asus Strix GL502VT-DS74 | |
| low | med. | high | ultra | 4K | |
|---|---|---|---|---|---|
| Guild Wars 2 (2012) | 62.2 | ||||
| BioShock Infinite (2013) | 130.5 | ||||
| Metro: Last Light (2013) | 96.5 | ||||
| Thief (2014) | 95.1 | ||||
| The Witcher 3 (2015) | 46 | ||||
| Batman: Arkham Knight (2015) | 73 | 37 | |||
| Metal Gear Solid V (2015) | 60 | 59 | |||
| Fallout 4 (2015) | 88.4 | 34.3 | |||
| Rise of the Tomb Raider (2016) | 79.7 | 33.6 | |||
| Ashes of the Singularity (2016) | 67 | 65.2 | |||
| Overwatch (2016) | 136.2 | 70.1 | |||
| Mafia 3 (2016) | 51.6 | 20.6 | |||
| Prey (2017) | 138.7 | 48.1 | |||
| Dirt 4 (2017) | 71.8 | 40.5 | |||
| F1 2017 (2017) | 80 | 36 |
Stress Test
We stress the system with Prime95 and FurMark in order to identify for any stability or throttling issues. With only Prime95 active, the CPU can be observed running stably at 300 MHz above its base clock rate and a very warm core temperature of 92 C. In comparison, the Zephyrus will be steady at 3.4 GHz with an average CPU temperature of just 81 C. Running both Prime95 and FurMark simultaneously will strip the CPU of any Turbo Boost benefits in order to keep core temperatures below 90 C. CPU clock rate, however, does not appear to ever throttle any slower than its base value. Note that the GPU in the Q5 will also be running significantly warmer than the same GPU in the GX501VS by about 15 C when under load.
Enabling Maximum fan mode has some interesting effects on the Q5. When running Witcher 3, the CPU becomes locked in the 3.7 to 3.8 GHz range while the GPU will run slightly faster at a steady 1316 MHz. GPU temperature also drops considerably to the 68 C mark compared to 84 C if on the 55 percent fan setting. The performance boost is otherwise imperceptible when gaming as the major benefit of Maximum fan mode is for the cooler GPU temperature.
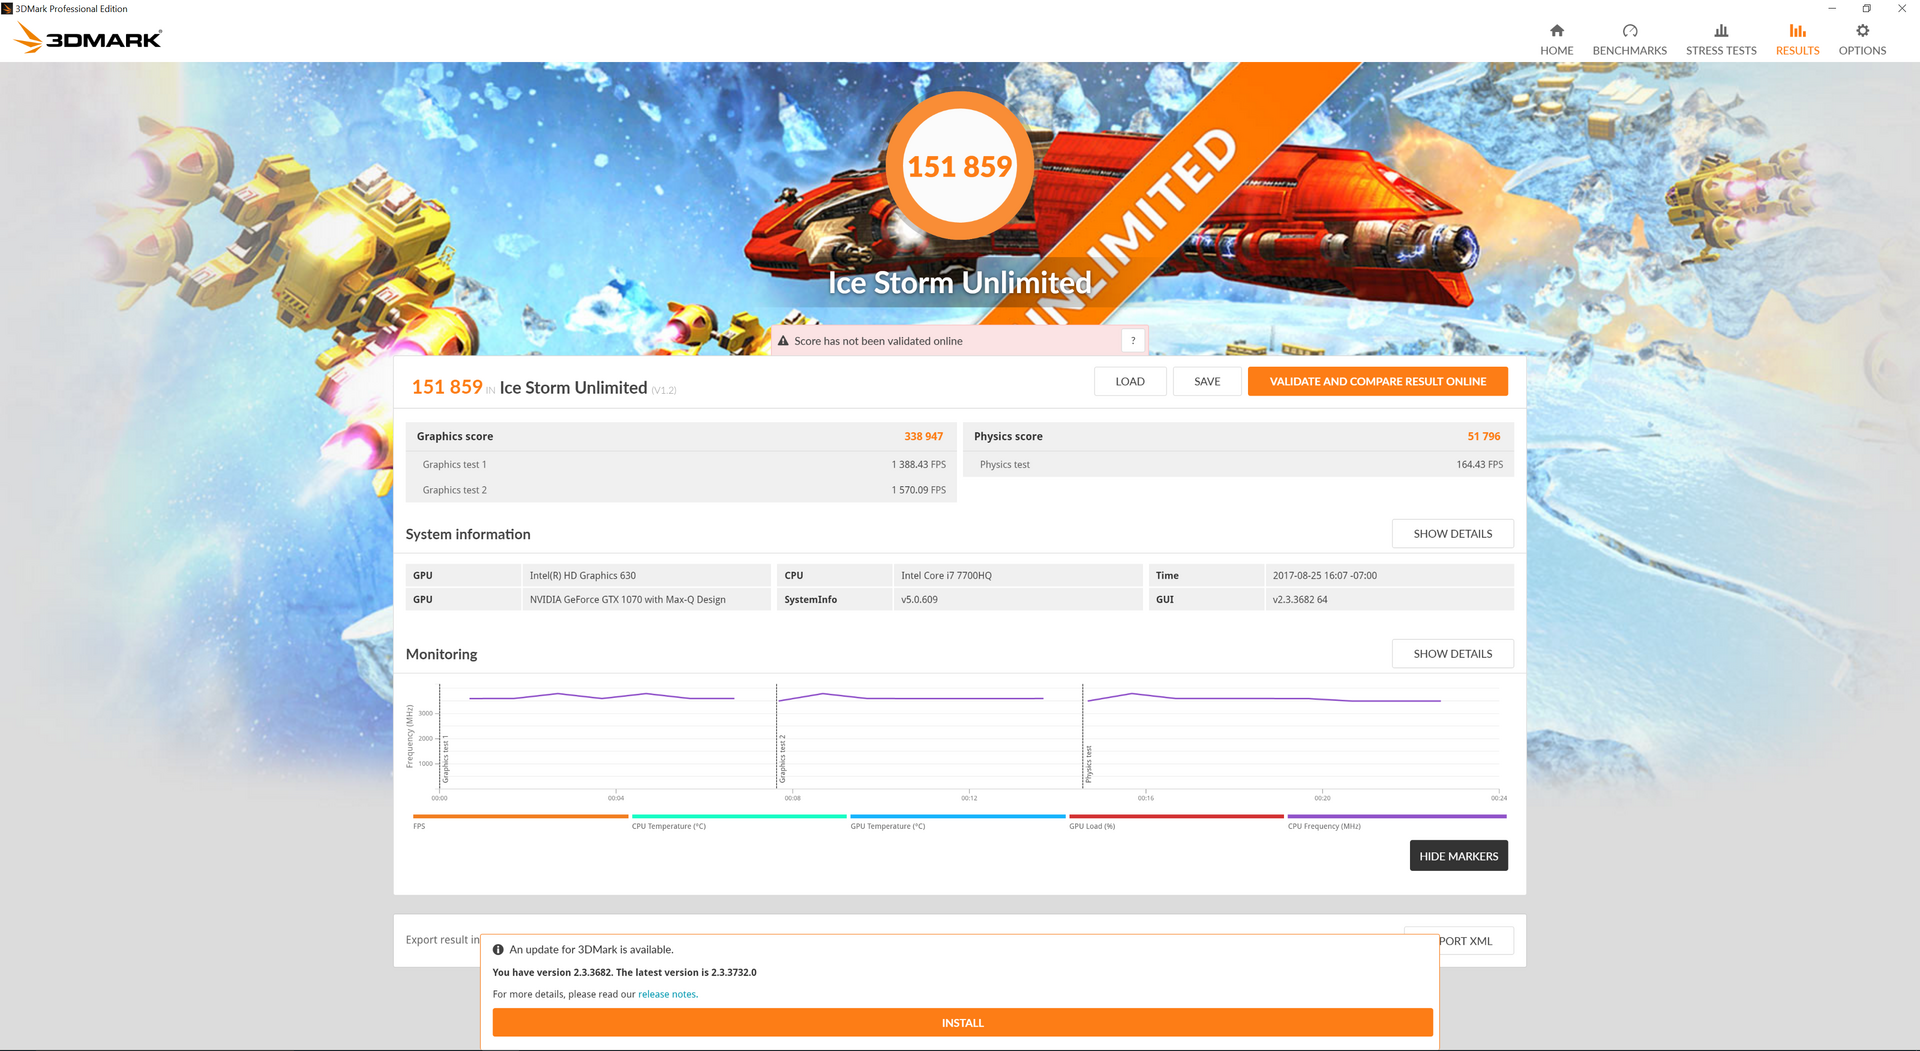
Running on battery power will impact both CPU and GPU performances. A 3DMark Fire Strike test on batteries returns 5394 and 6764 points for Physics and Graphics, respectively, compared to 10856 and 16165 points when on mains.
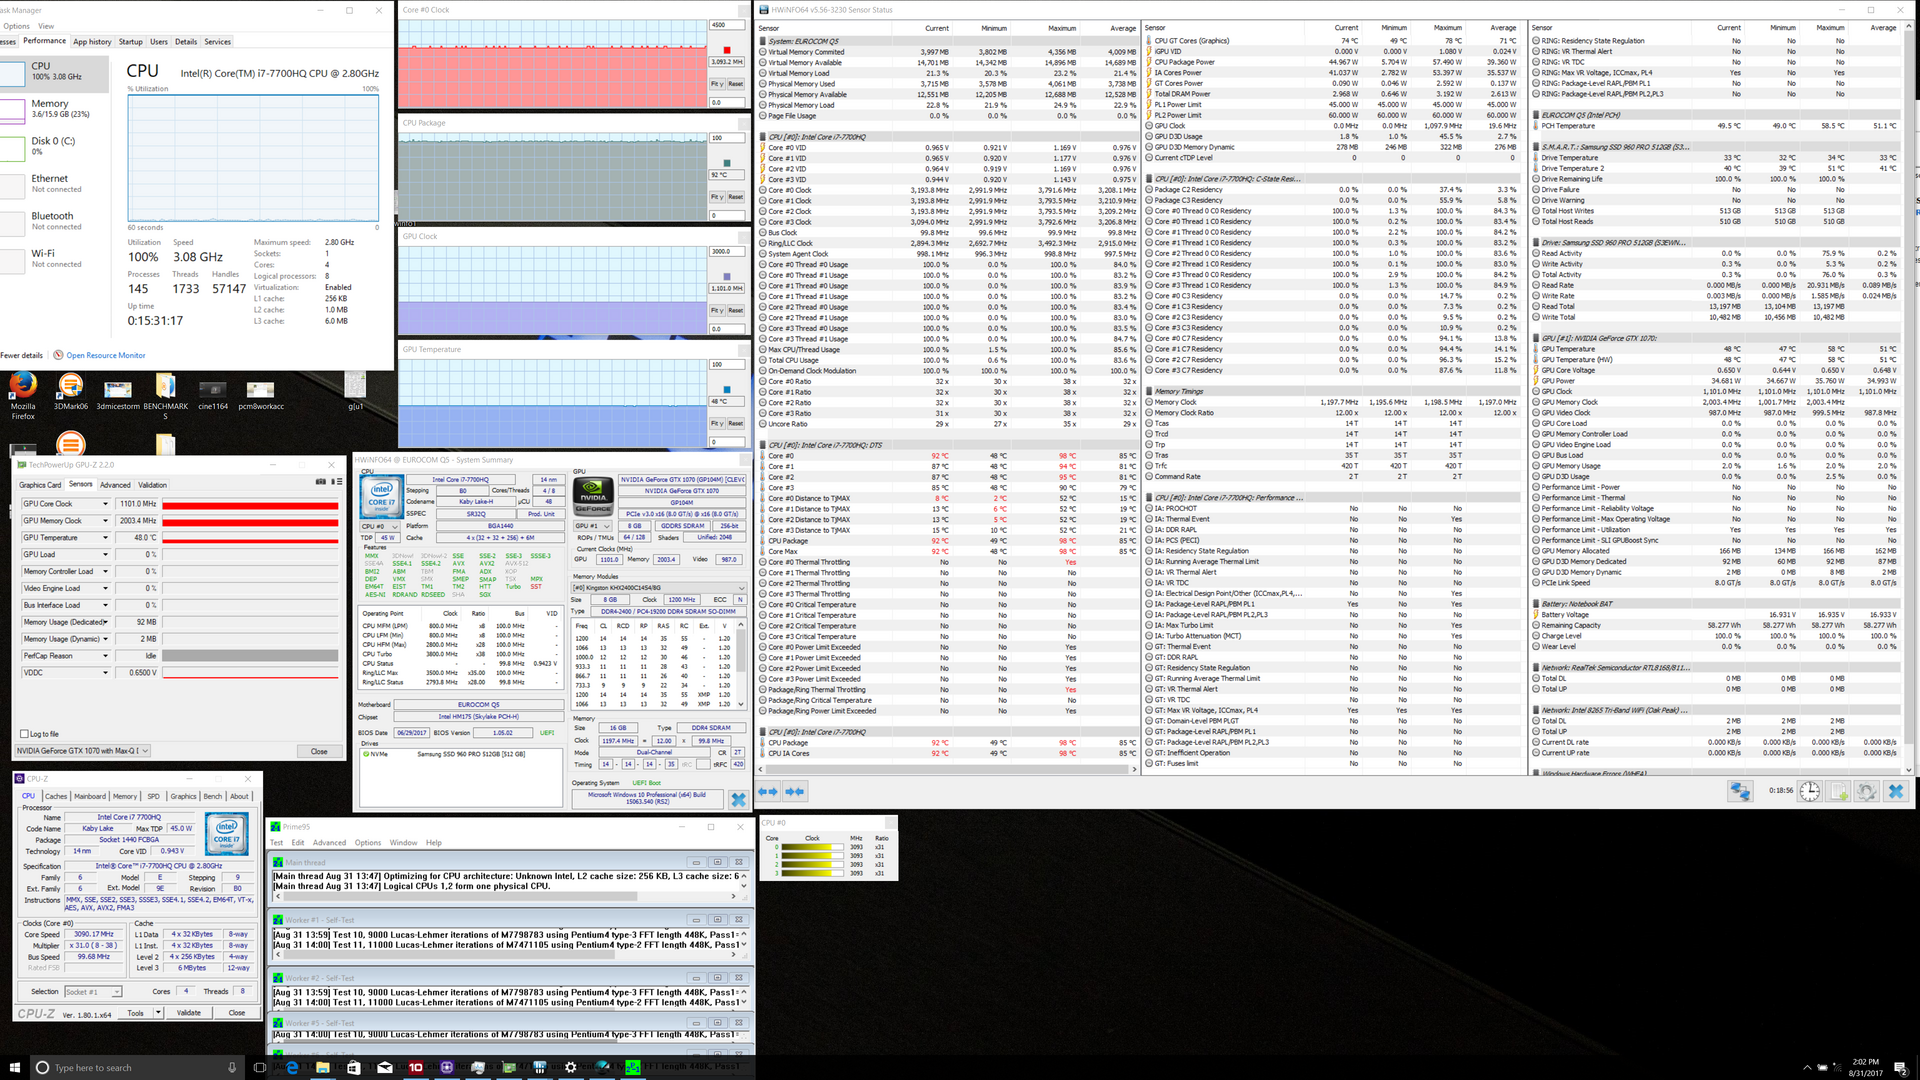
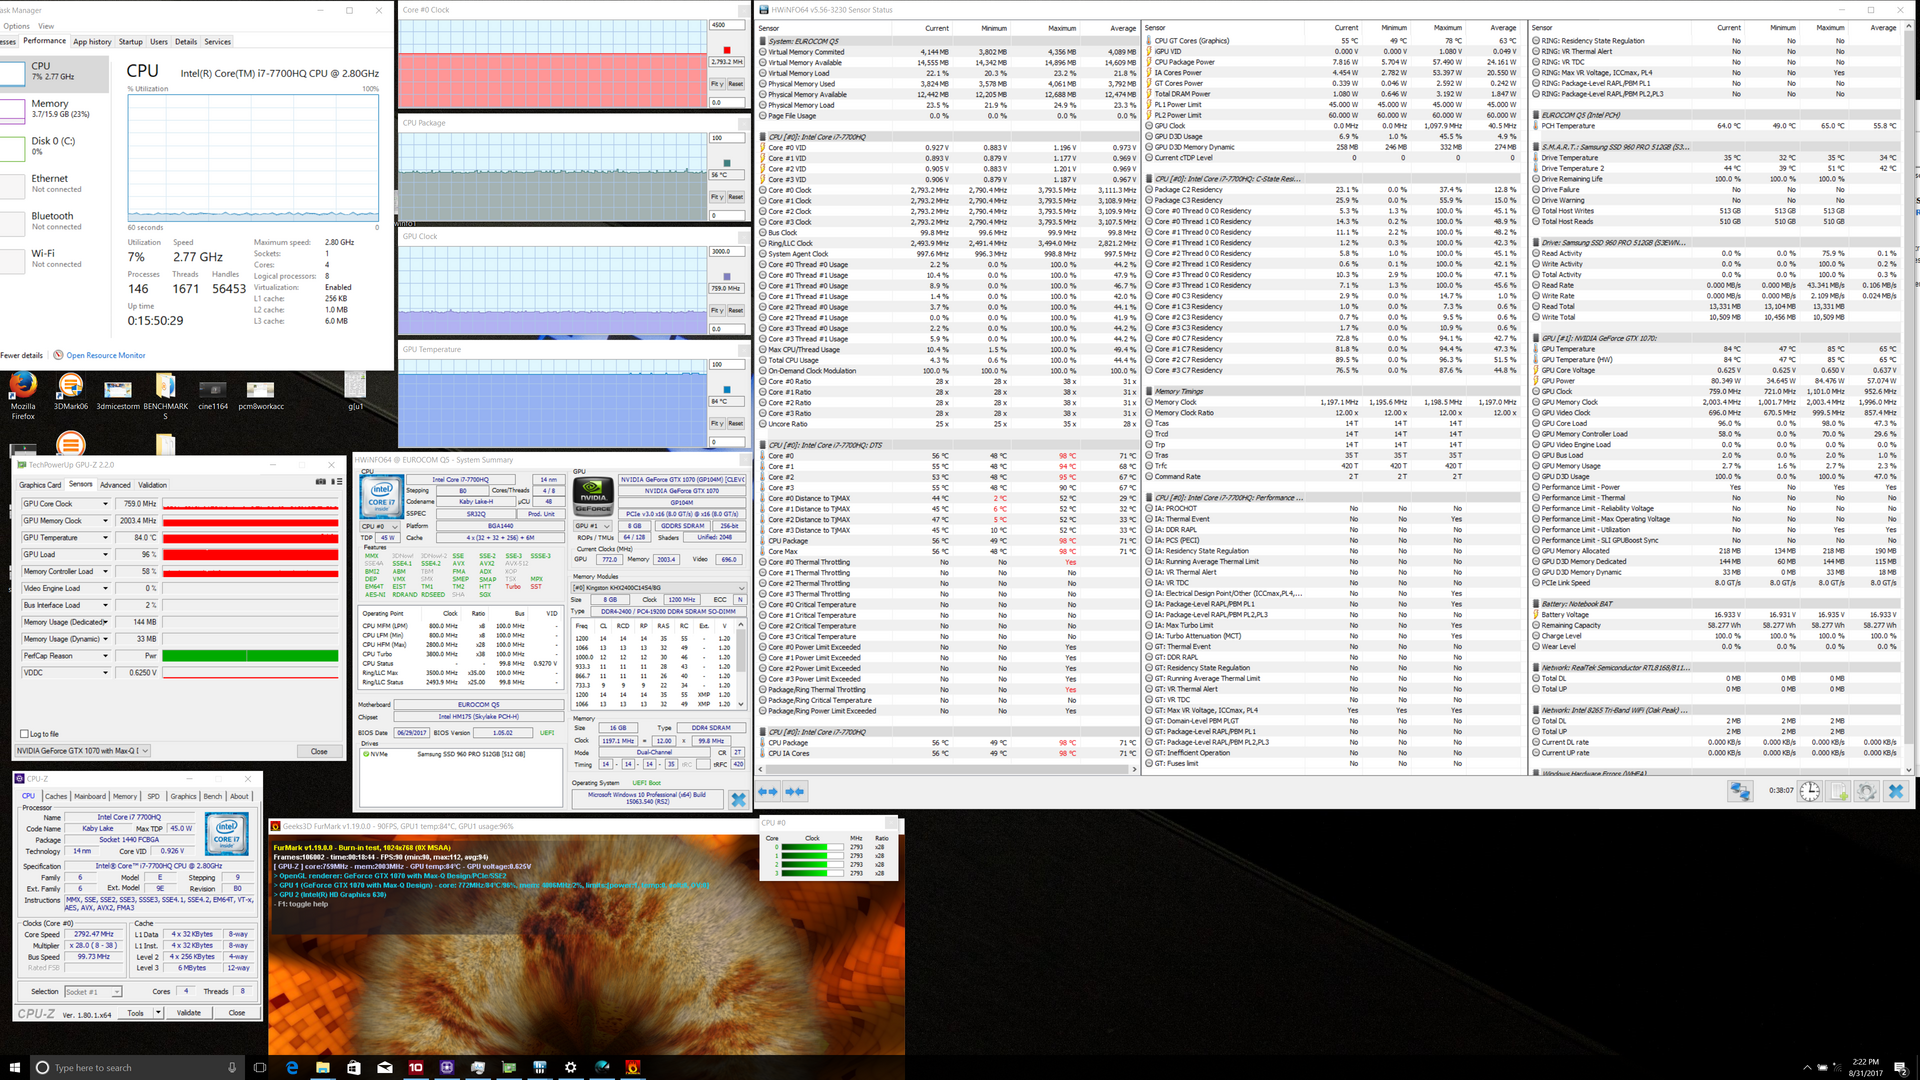
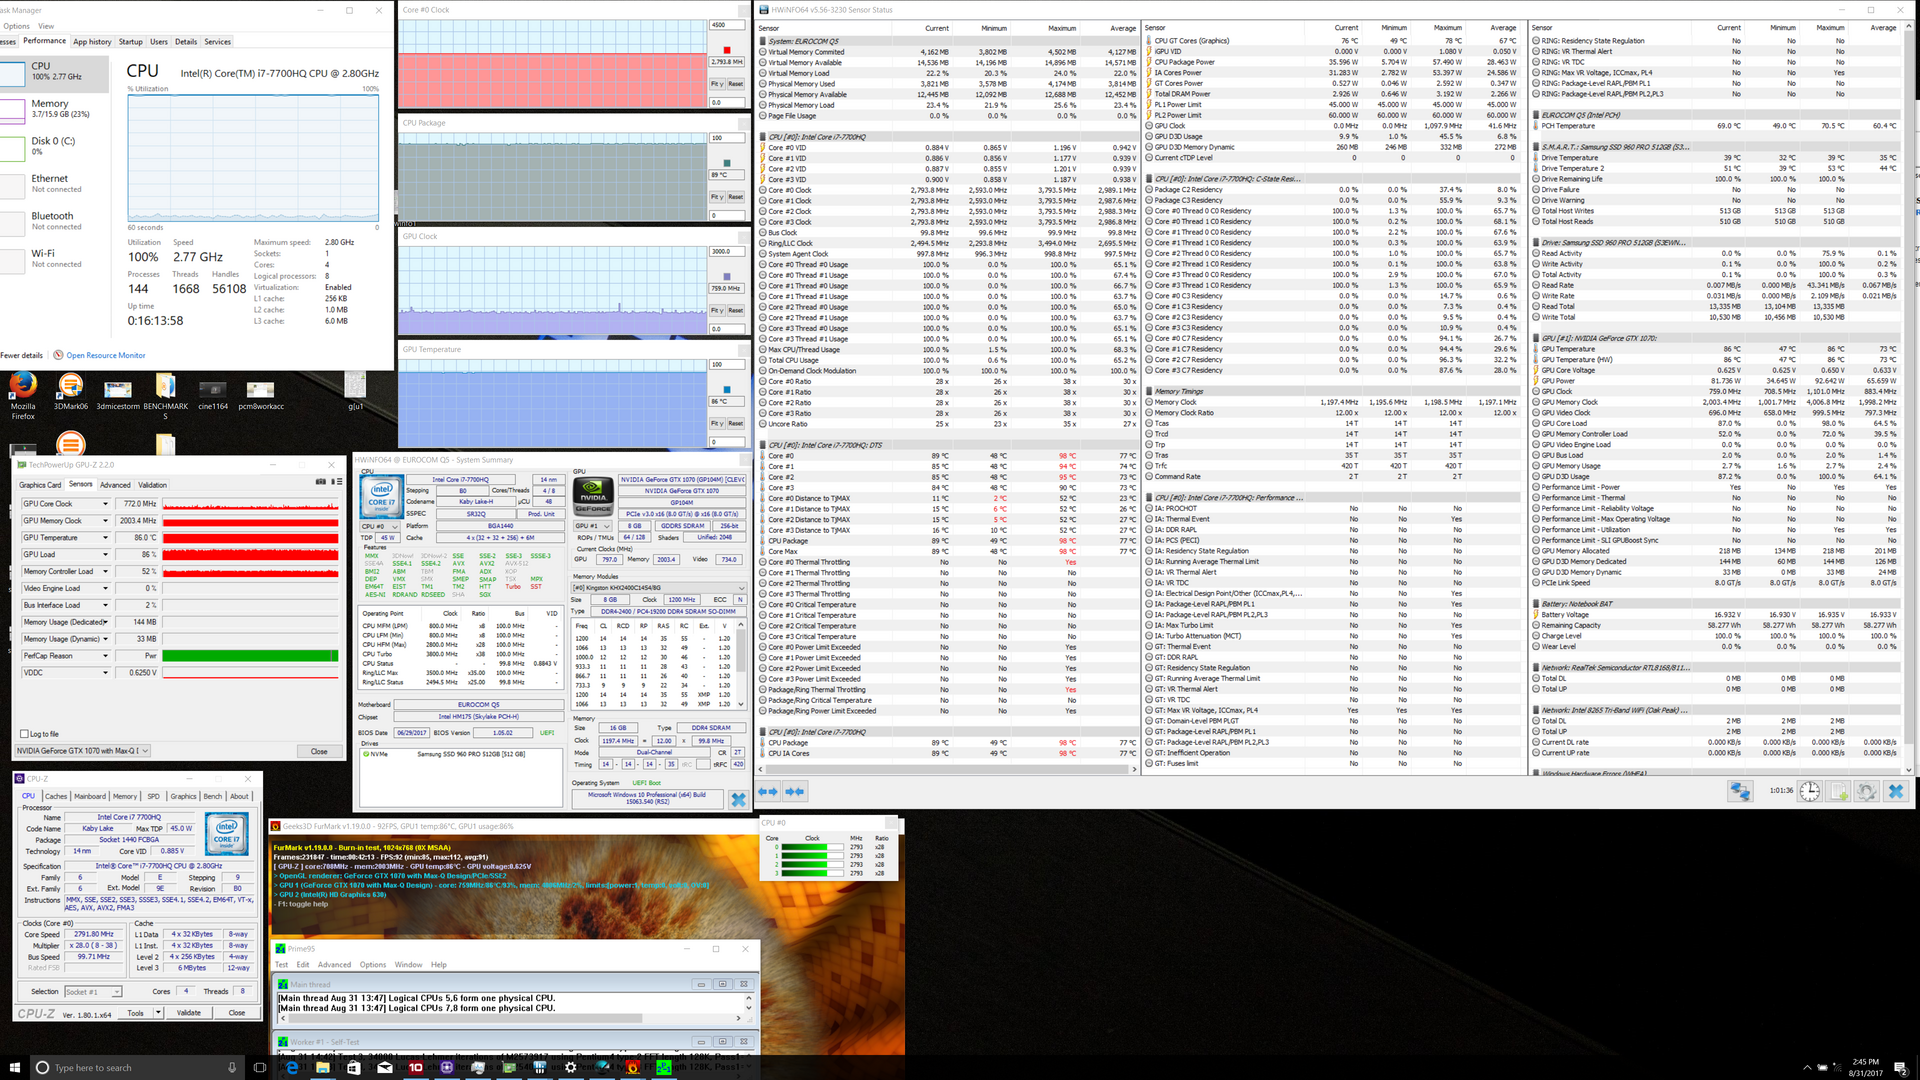
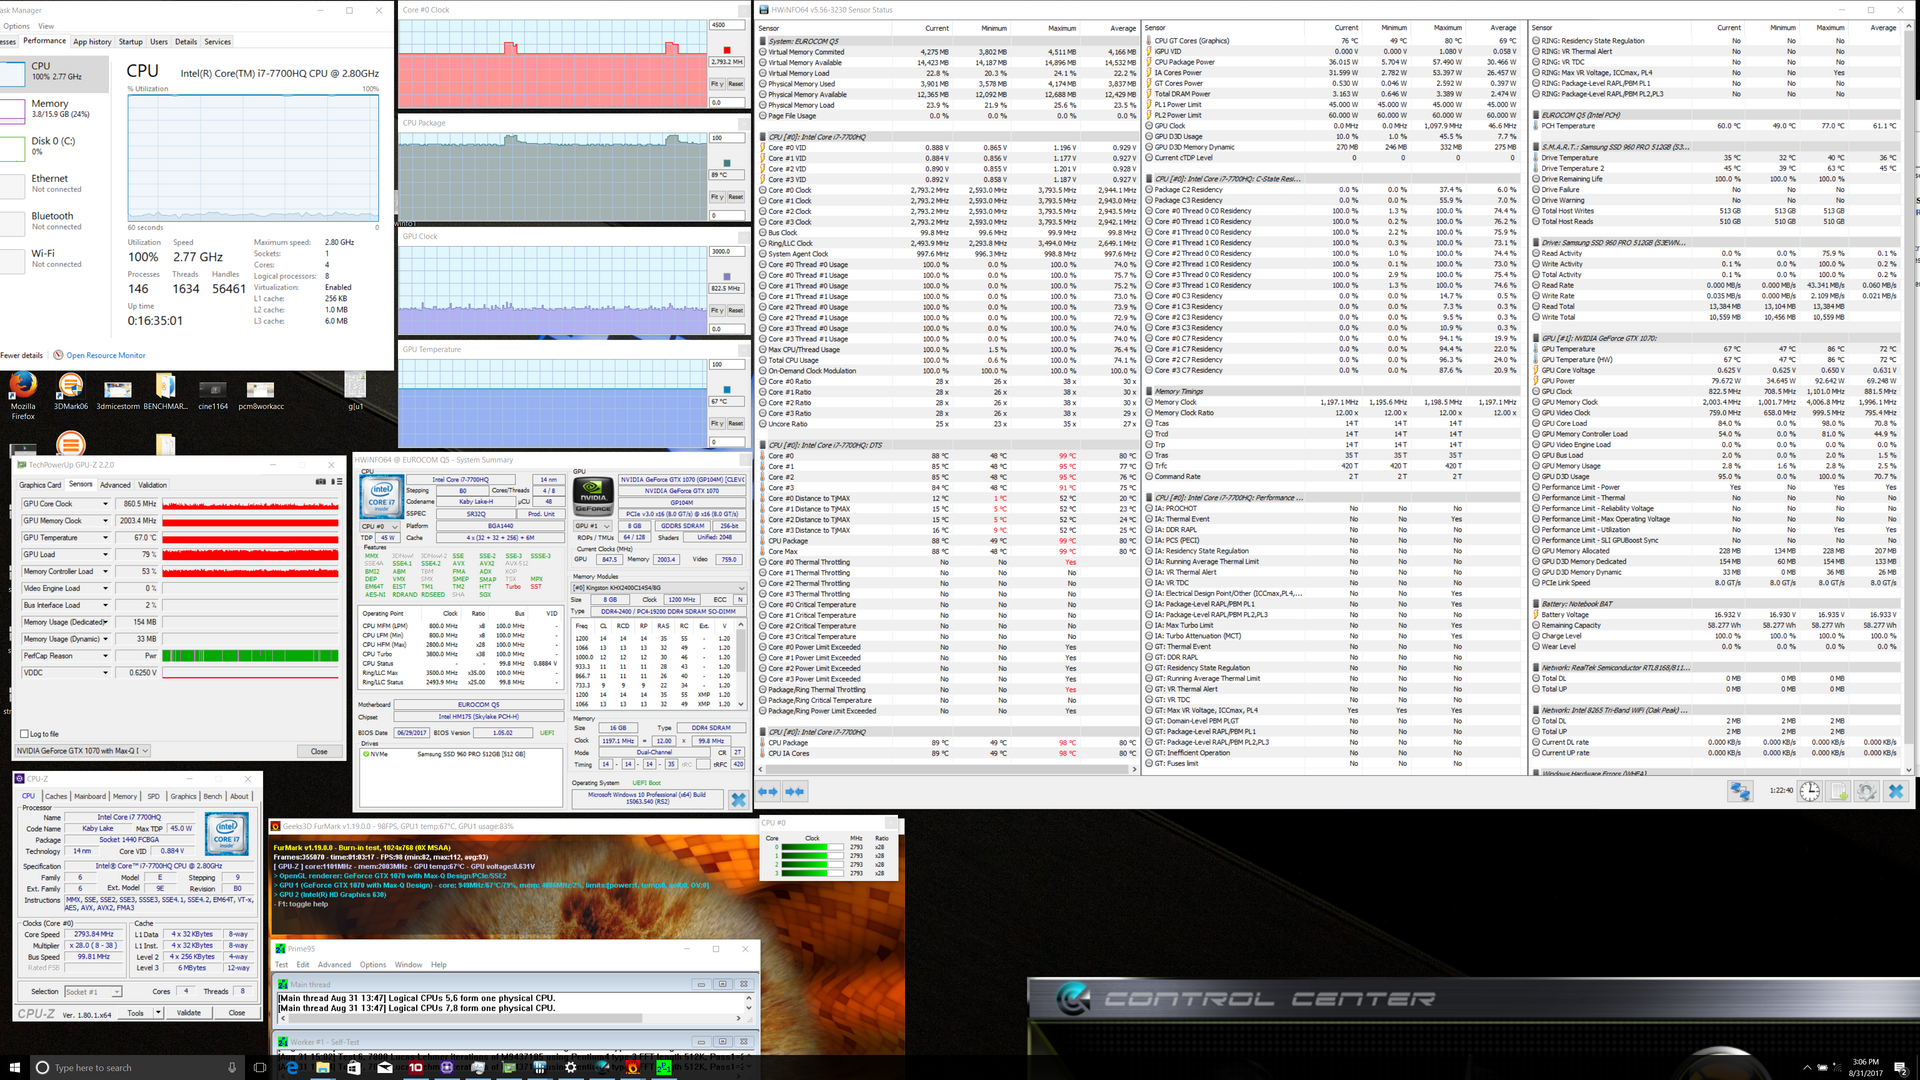
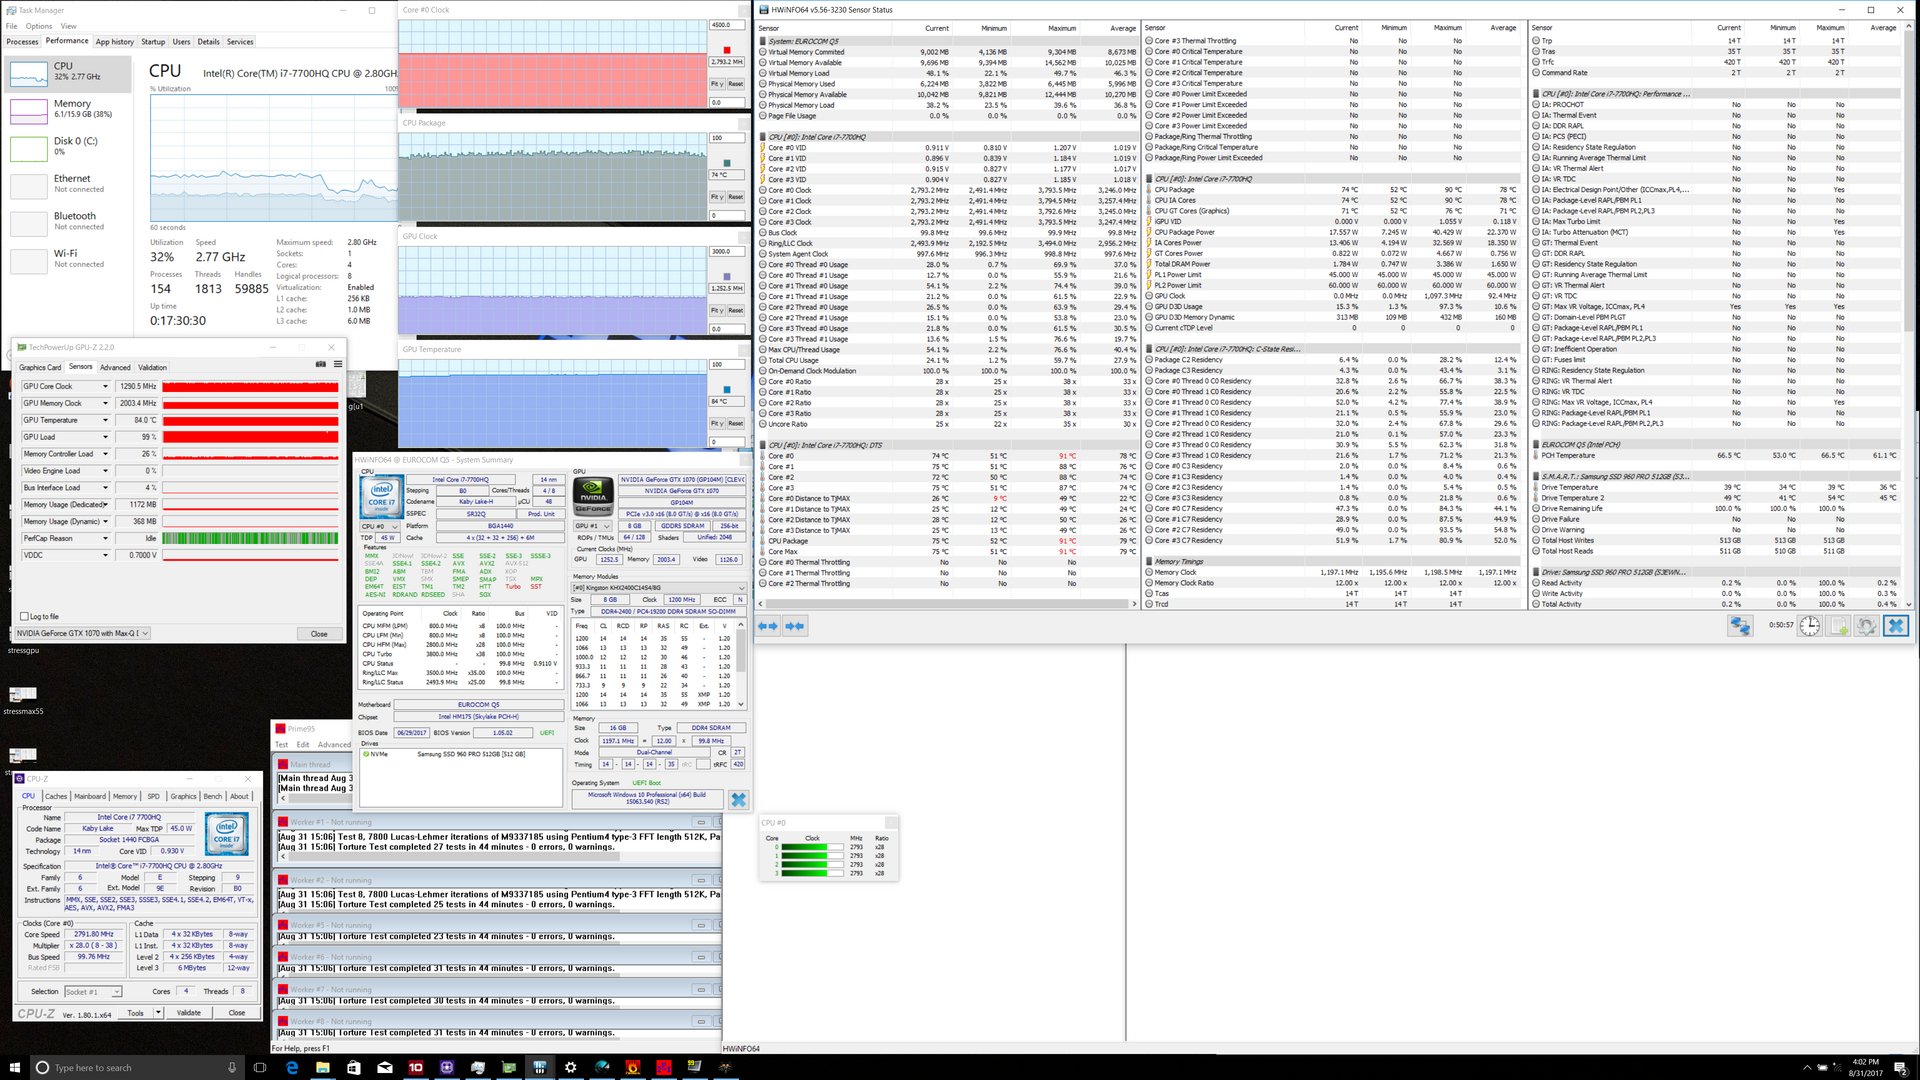
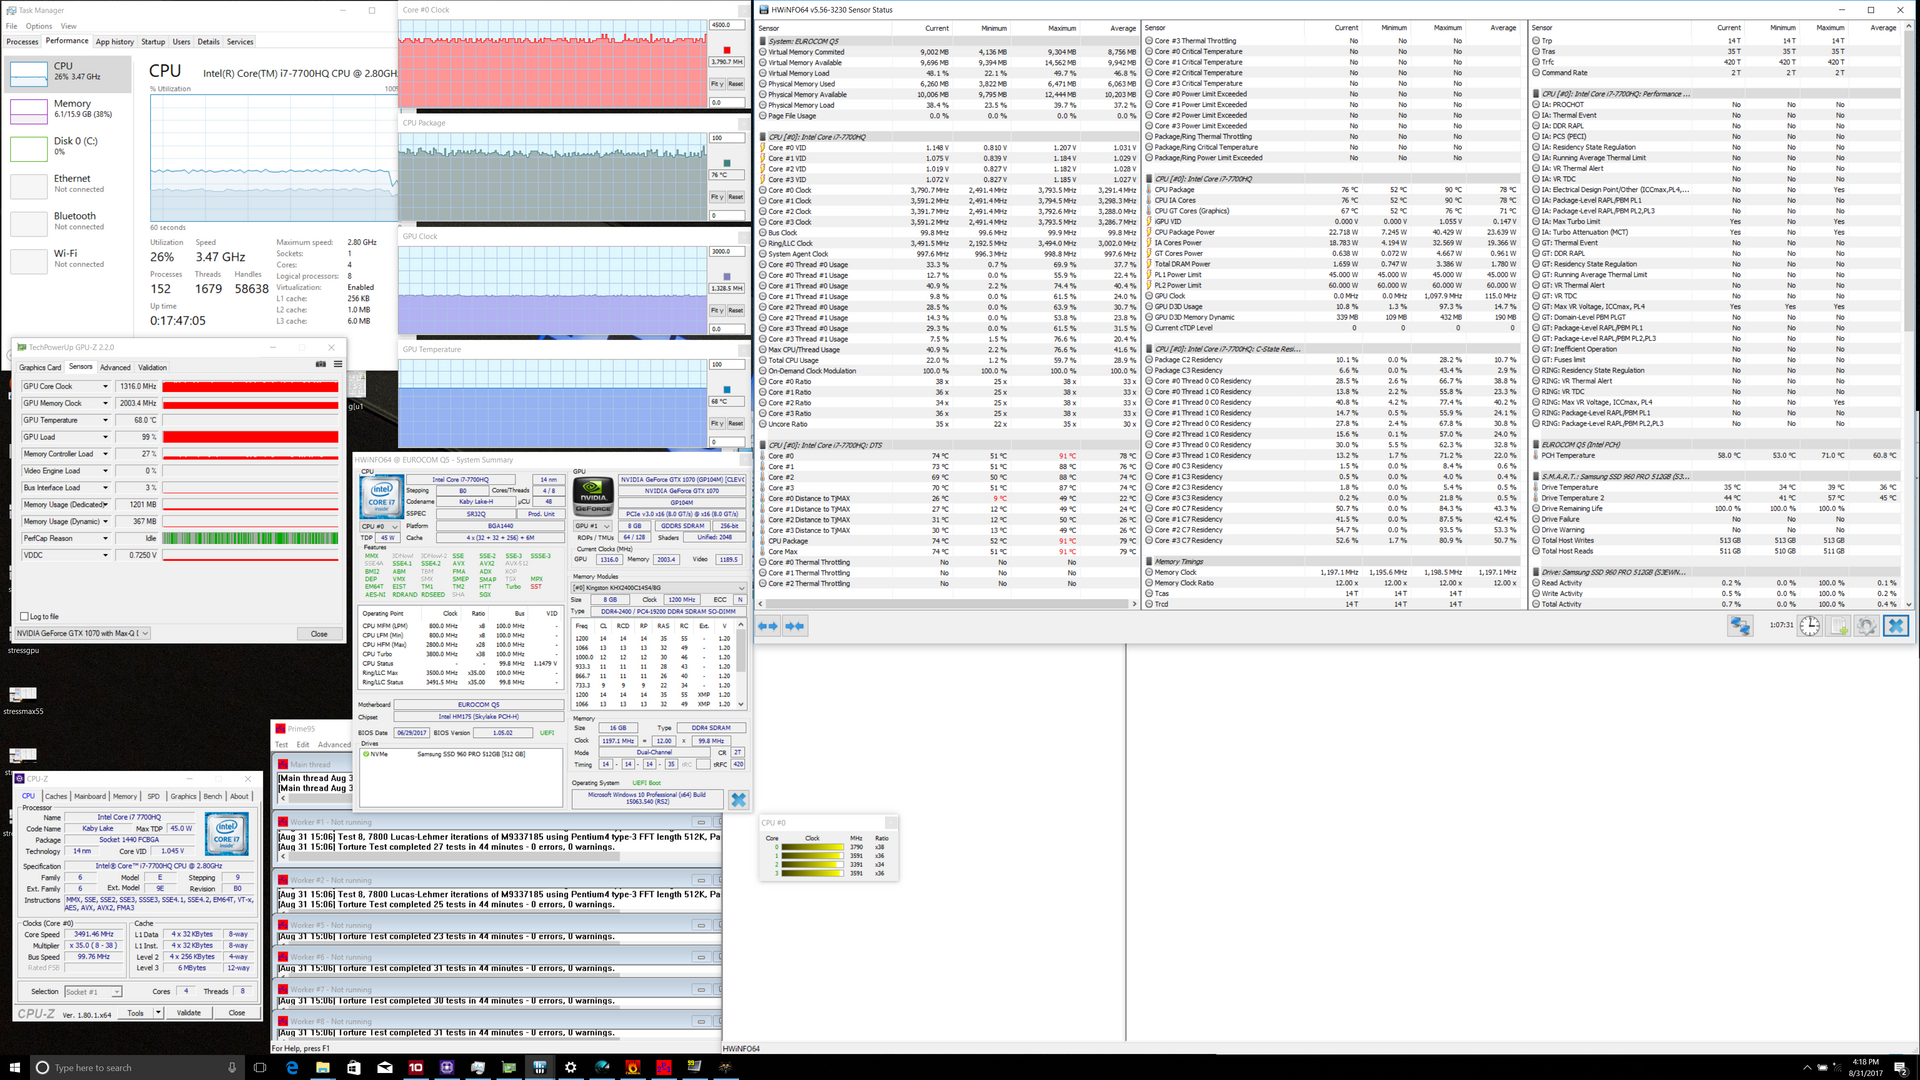
| CPU Clock (GHz) | GPU Clock (MHz) | Average CPU Temperature (°C) | Average GPU Temperature (°C) | |
| Prime95 Stress | 3.1 | -- | 92 | 48 |
| FurMark Stress | -- | 759 | 56 | 84 |
| Prime95 + FurMark Stress | 2.8 | 772 | 89 | 86 |
| Prime95 + FurMark Stress (Maximum fan mode) | 2.8 | 861 | 89 | 67 |
| Witcher 3 Stress | 2.8 | 1291 | 74 | 84 |
| Witcher 3 Stress (Maximum fan mode) | 3.7 - 3.8 | 1316 | 76 | 68 |
Emissions
System Noise
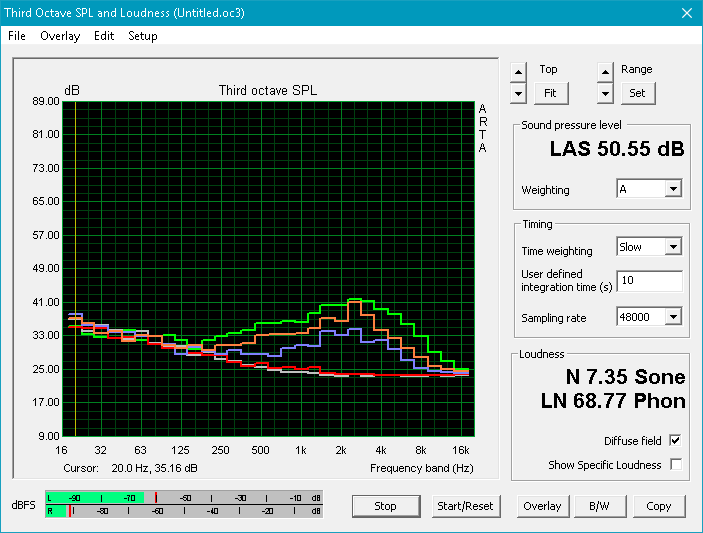
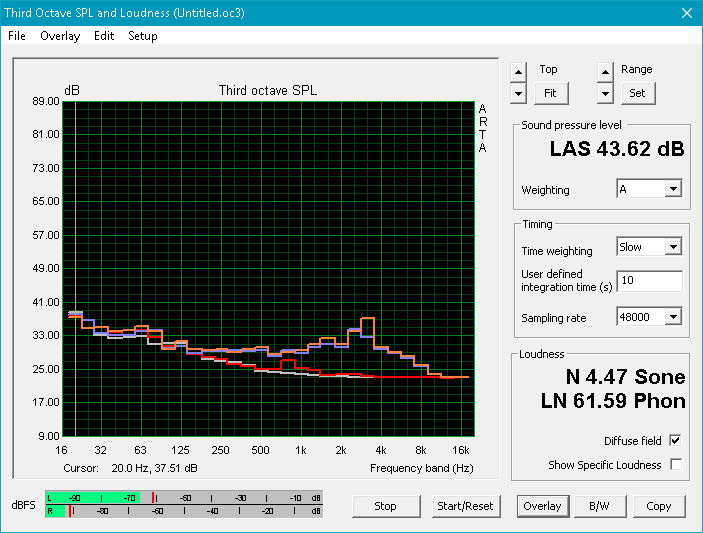
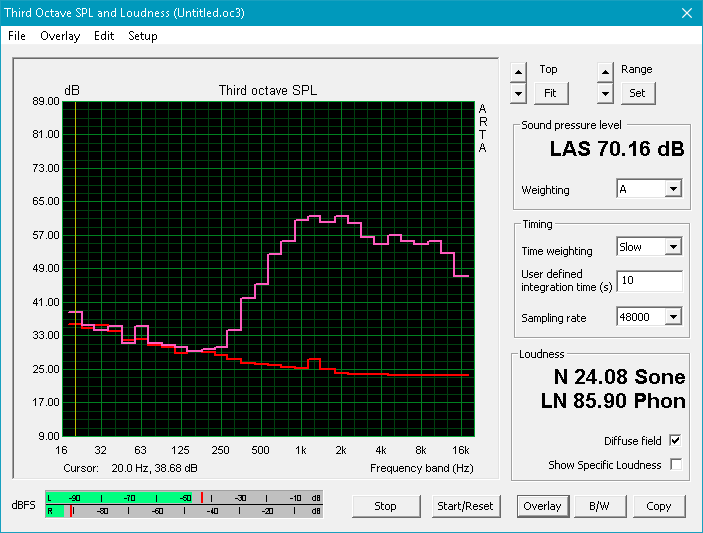
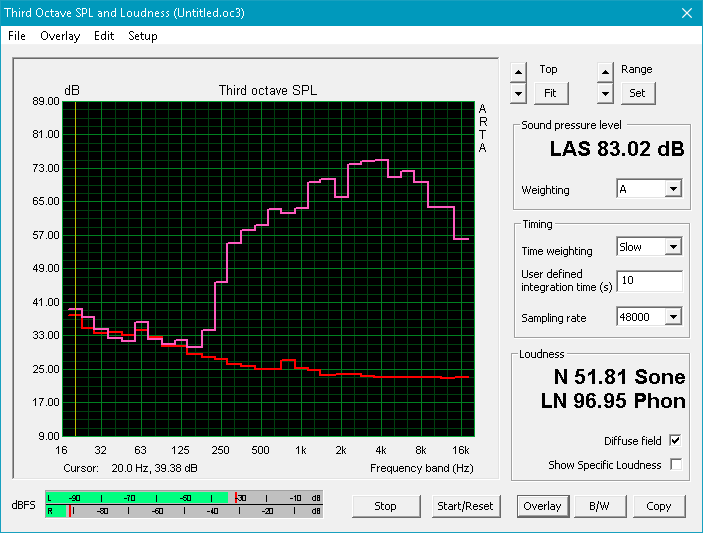
Max-Q targets a fan noise of 40 dB(A) when sitting 25 cm away from the front of the notebook. Both our tested Zephyrus and Omen 15 units have been shown to meet this very specific standard. The Q5, however, can be as loud as 50 dB(A) when running Witcher 3 on the preset Automatic fan mode. In order to benchmark the Q5 more fairly against other Max-Q notebooks, we've dialed back the fan to a manual 55 percent speed setting that we've recorded to be about the same as a Zephyrus when subjected to similar gaming loads. Thus, all our benchmarks and data on this page reflect the 55 percent speed setting unless noted otherwise.
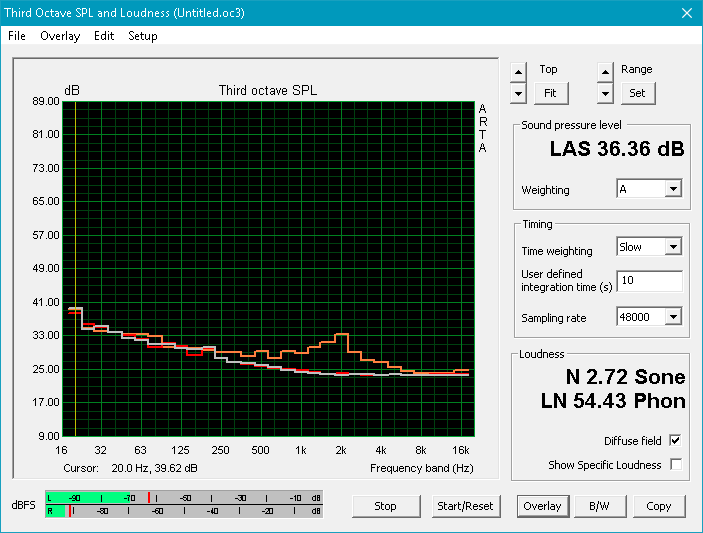
The triple fans of the Q5 are identical in diameter at about 45 cm each as opposed to the the asymmetric fans of the GS63VR. The fans are always active no matter the onscreen load and will be audible in a quiet workspace like a classroom or library at a recorded 33.8 dB(A). Connecting to an external monitor for day-to-day browsing will not alter fan behavior. Fan RPMs fortunately do not pulsate, but a true "silent mode" option for video streaming or very low processing loads would have made the Q5 more appropriate in noise-sensitive environments. Bewilderingly, the fans remain active even if set to the preset Quiet fan mode.
Note that the manual 55 percent fan speed setting will be overridden once core temperature approaches 96 C. Gaming loads will fortunately not reach anywhere above 90 C, so owners can game comfortably in the 55 percent fan speed setting. Benchmark loads like Prime95 will reach 96 C very quickly and therefore automatically initiate faster fan speeds as necessary.
Noise level
| Idle |
| 31.5 / 33.8 / 33.8 dB(A) |
| Load |
| 41.7 / 54.2 dB(A) |
 | ||
30 dB silent 40 dB(A) audible 50 dB(A) loud |
||
min: | ||
| Eurocom Q5 GeForce GTX 1070 Max-Q, i7-7700HQ, Samsung SSD 960 Pro 512 GB m.2 | Asus Zephyrus GX501VS GeForce GTX 1070 Max-Q, i7-7700HQ, Samsung SM961 MZVPW256HEGL | Gigabyte P56XT GeForce GTX 1070 Mobile, i7-7700HQ, LiteOn CX2-8B256 | Alienware 15 R3 GeForce GTX 1070 Mobile, i7-7700HQ | EVGA SC15 GeForce GTX 1060 Mobile, i7-7700HQ, Toshiba NVMe THNSN5256GPU7 | HP Omen 15-ce002ng GeForce GTX 1060 Max-Q, i7-7700HQ, Samsung PM961 MZVLW256HEHP | |
|---|---|---|---|---|---|---|
| Noise | 9% | -4% | -5% | 4% | 1% | |
| off / environment * (dB) | 29 | 28.5 2% | 30 -3% | 30 -3% | 28 3% | 30 -3% |
| Idle Minimum * (dB) | 31.5 | 28.5 10% | 34 -8% | 31 2% | 31.9 -1% | 30 5% |
| Idle Average * (dB) | 33.8 | 28.5 16% | 35 -4% | 32 5% | 32 5% | 33 2% |
| Idle Maximum * (dB) | 33.8 | 30.1 11% | 39 -15% | 42 -24% | 32 5% | 37 -9% |
| Load Average * (dB) | 41.7 | 35.2 16% | 39 6% | 49 -18% | 36.5 12% | 41 2% |
| Witcher 3 ultra * (dB) | 41.7 | 41.7 -0% | 48 -15% | 40.3 3% | 42 -1% | |
| Load Maximum * (dB) | 54.2 | 48.8 10% | 49 10% | 50 8% | 53.4 1% | 50 8% |
* ... smaller is better
| Automatic fan mode dB(A) | |
| 3DMark06 | 45 |
| Witcher 3 | 50.2 |
| Prime95+FurMark | 53 |
Temperature
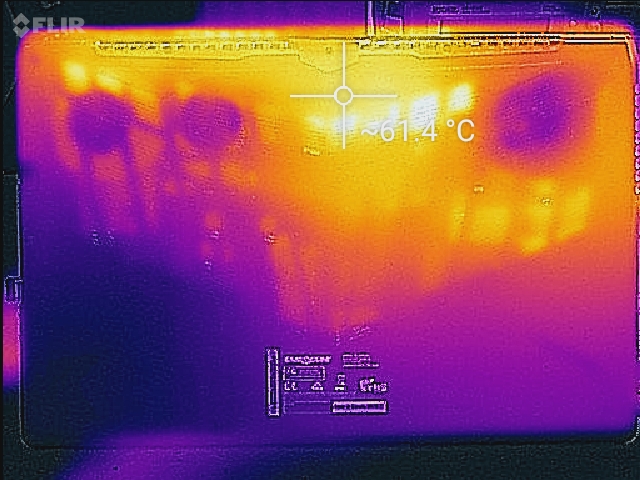
Surface temperatures are flat when idling and will grow very warm when under extreme loads. The center of the keyboard can be as warm as 56 C as shown by our temperature maps below or about 51 C when gaming. The left half of the notebook will be warmer than the right half whereas the opposite is true for the GS63VR. This is generally unfavorable for gaming since the WASD keys are used more often than the NumPad keys. Additionally, the average surface temperature of the Eurocom is higher than on the GS63VR 6RF which already runs very warm.
Will running the Eurocom at Maximum fan speed mode bring down surface temperatures? It certainly will, albeit by just a few degrees. The hot spot when running Witcher 3 on 55 percent fan speed, for example, is about 51 C near the top center of the keyboard whereas this same spot will be just over 46 C when on Maximum fan speed mode.
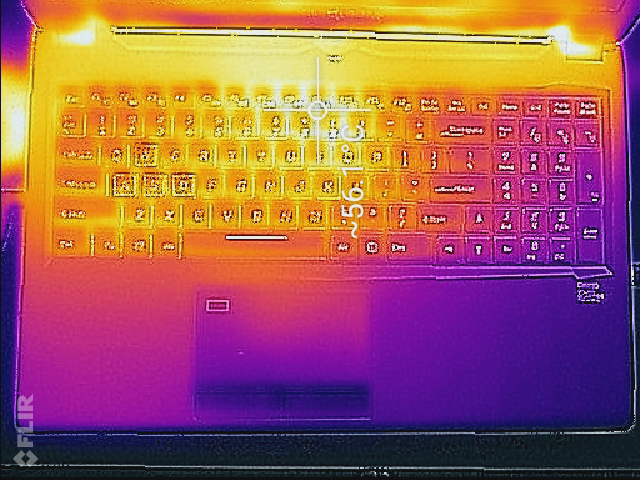
(-) The maximum temperature on the upper side is 56.2 °C / 133 F, compared to the average of 40.4 °C / 105 F, ranging from 21.2 to 68.8 °C for the class Gaming.
(-) The bottom heats up to a maximum of 61.2 °C / 142 F, compared to the average of 43.2 °C / 110 F
(+) In idle usage, the average temperature for the upper side is 27.1 °C / 81 F, compared to the device average of 33.9 °C / 93 F.
(-) Playing The Witcher 3, the average temperature for the upper side is 41.9 °C / 107 F, compared to the device average of 33.9 °C / 93 F.
(±) The palmrests and touchpad can get very hot to the touch with a maximum of 38.6 °C / 101.5 F.
(-) The average temperature of the palmrest area of similar devices was 28.8 °C / 83.8 F (-9.8 °C / -17.7 F).
Speakers
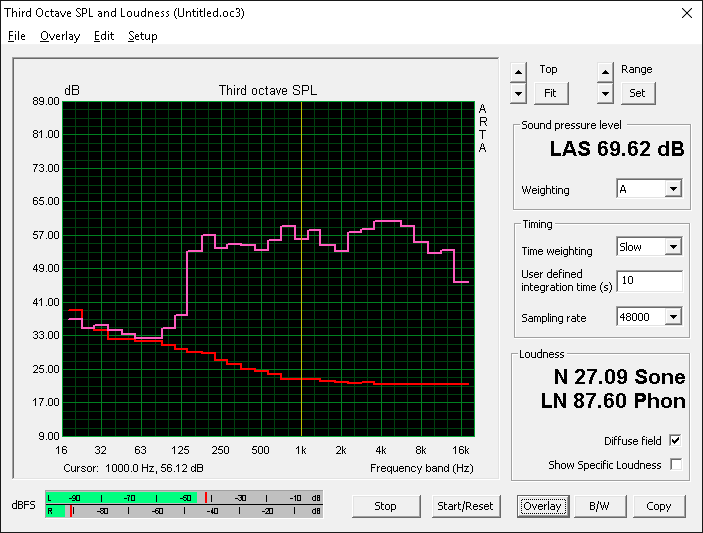
The integrated stereo speakers have a narrow range of reproducible frequencies. As shown by our pink noise measurements below, bass frequencies are poorly represented when compared to the GS63VR. The much larger Eurocom X7E2 exhibits a broader and more even noise curve for a better sound experience. Maximum volume will not reverberate the chassis or introduce any static to the speakers, but treble frequencies will still be far too strong.
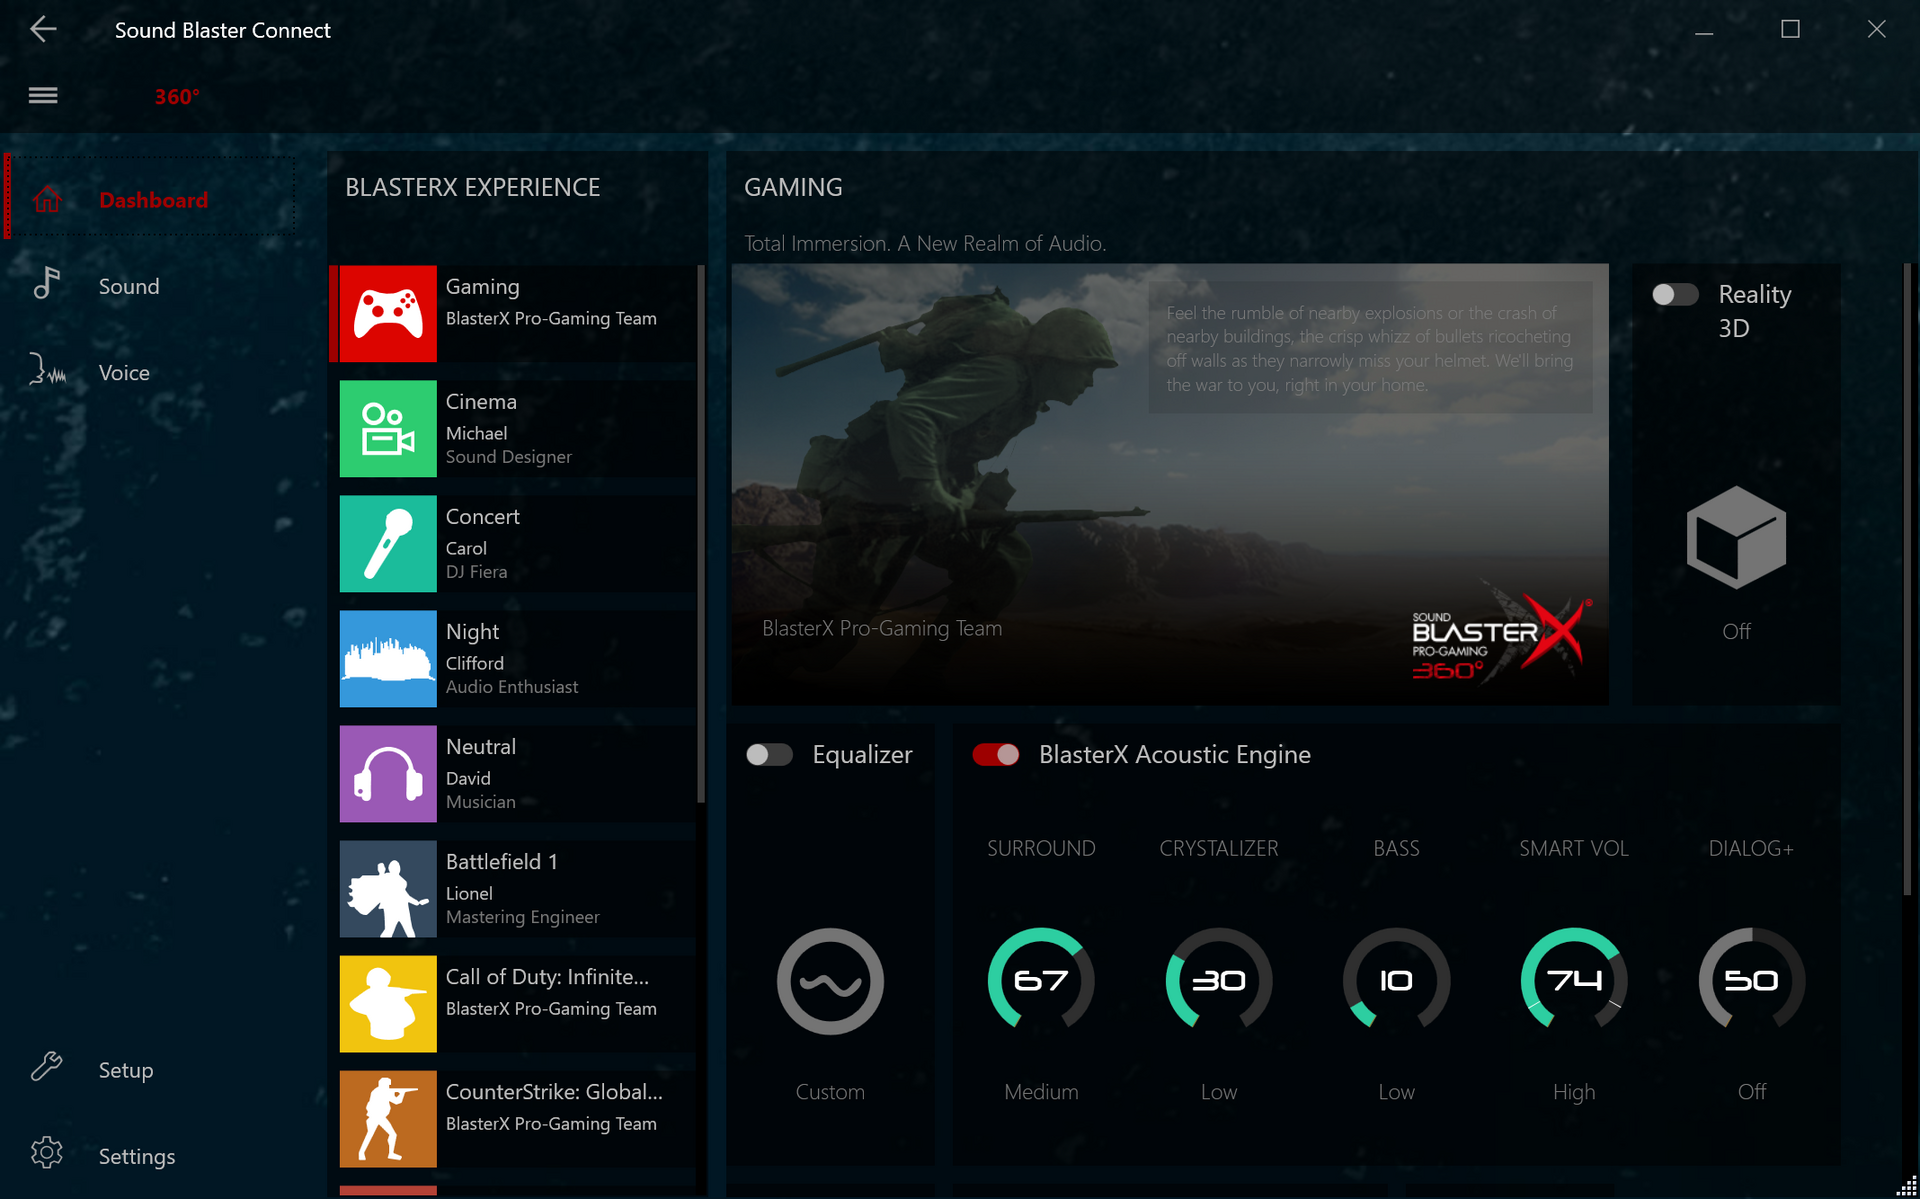
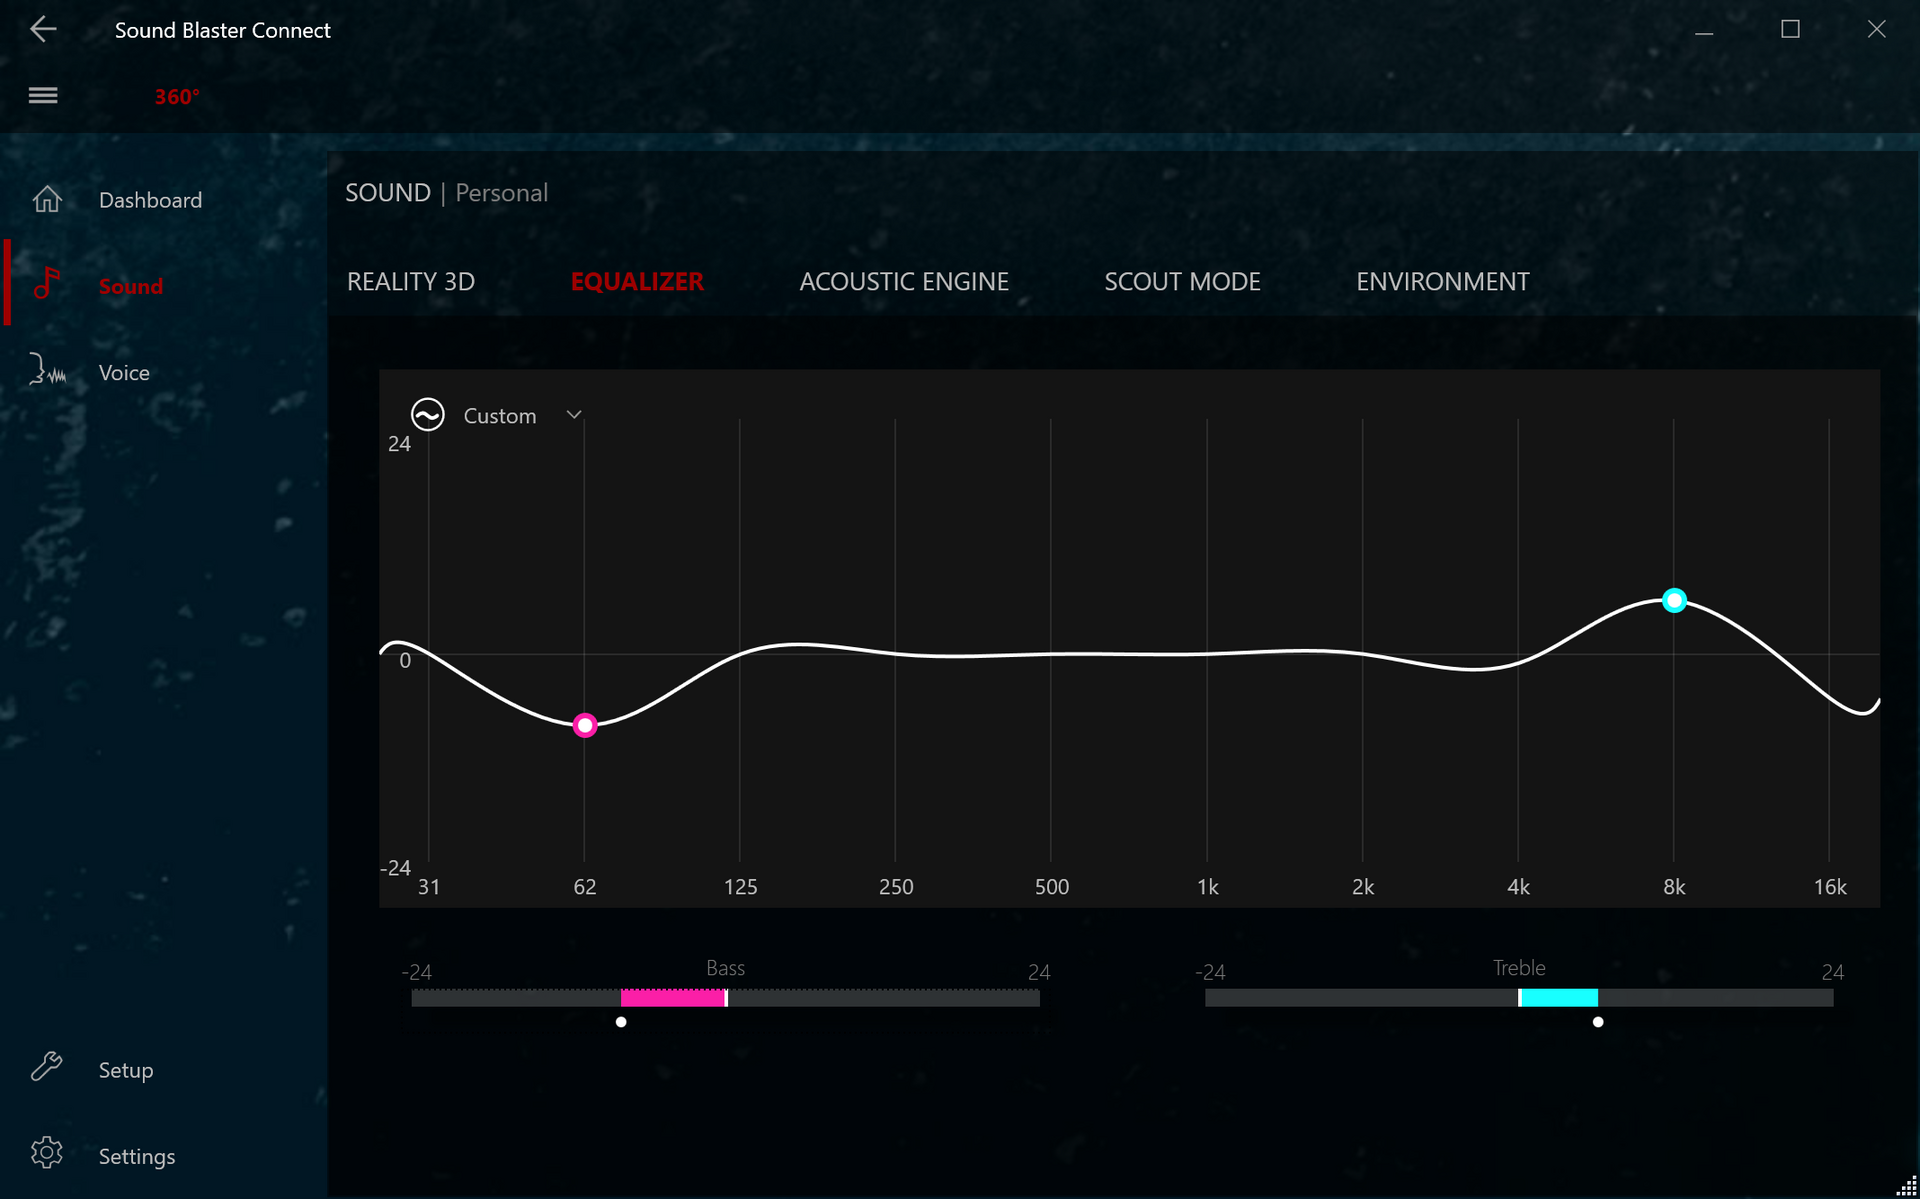
The Sound Blaster Connect 2 software is actually quite versatile with preset audio settings individually optimized for games like Overwatch, DOTA 2, and Battlefield 1. Nonetheless, headphones are still recommended for longer gaming or video playback sessions as software settings can only do so much for small internal speakers. ESS Sabre DAC is not present unlike on certain MSI systems and other notebooks from Eurocom.
Eurocom Q5 audio analysis
(-) | not very loud speakers (61.7 dB)
Bass 100 - 315 Hz
(-) | nearly no bass - on average 24% lower than median
(+) | bass is linear (3.8% delta to prev. frequency)
Mids 400 - 2000 Hz
(±) | higher mids - on average 6.2% higher than median
(±) | linearity of mids is average (12.9% delta to prev. frequency)
Highs 2 - 16 kHz
(+) | balanced highs - only 1.5% away from median
(+) | highs are linear (5.7% delta to prev. frequency)
Overall 100 - 16.000 Hz
(-) | overall sound is not linear (35.3% difference to median)
Compared to same class
» 99% of all tested devices in this class were better, 0% similar, 1% worse
» The best had a delta of 6%, average was 18%, worst was 132%
Compared to all devices tested
» 94% of all tested devices were better, 1% similar, 6% worse
» The best had a delta of 4%, average was 23%, worst was 134%
Apple MacBook 12 (Early 2016) 1.1 GHz audio analysis
(+) | speakers can play relatively loud (83.6 dB)
Bass 100 - 315 Hz
(±) | reduced bass - on average 11.3% lower than median
(±) | linearity of bass is average (14.2% delta to prev. frequency)
Mids 400 - 2000 Hz
(+) | balanced mids - only 2.4% away from median
(+) | mids are linear (5.5% delta to prev. frequency)
Highs 2 - 16 kHz
(+) | balanced highs - only 2% away from median
(+) | highs are linear (4.5% delta to prev. frequency)
Overall 100 - 16.000 Hz
(+) | overall sound is linear (10.2% difference to median)
Compared to same class
» 7% of all tested devices in this class were better, 2% similar, 90% worse
» The best had a delta of 5%, average was 18%, worst was 53%
Compared to all devices tested
» 5% of all tested devices were better, 1% similar, 94% worse
» The best had a delta of 4%, average was 23%, worst was 134%
Frequency Comparison (Checkbox selectable!)
Graph 1: Pink Noise 100% Vol.; Graph 2: Audio off
Energy Management
Power Consumption
The Q5 is noticeably more power efficient than its closest competitors when idling on desktop. We recorded a consumption of just 9 W to 13 W compared to 19 W to 22 W on the Zephyrus or 18 W to 30 W on the new HP Omen 15 under similar conditions. Running Witcher 3 will see the Q5 drawing almost exactly the same as the Zephyrus at about 130 W. When compared to the EVGA SC15 and its GTX 1060 GPU, the Eurocom is drawing about 6 percent more power for a rough 10 percent increase in Fire Strike Graphics performance.
Maximum load with both Prime95 and FurMark will demand about 159 W from a medium-sized AC adapter (~17 x 8 x 2.5 cm) rated for up to 180 W. This is a narrow but acceptable overhead of just over 10 percent, though this also suggests that there are likely no short term plans for a Q5 with GTX 1080 Max-Q graphics as a more capable PSU would be required.
| Off / Standby | |
| Idle | |
| Load |
|
Key:
min: | |
| Eurocom Q5 i7-7700HQ, GeForce GTX 1070 Max-Q, Samsung SSD 960 Pro 512 GB m.2, IPS, 3840x2160, 15.6" | Asus Zephyrus GX501VS i7-7700HQ, GeForce GTX 1070 Max-Q, Samsung SM961 MZVPW256HEGL, IPS, 1920x1080, 15.6" | Asus Zephyrus GX501 i7-7700HQ, GeForce GTX 1080 Max-Q, Samsung SSD SM961 1TB M.2 MZVKW1T0HMLH, IPS, 1920x1080, 15.6" | EVGA SC15 i7-7700HQ, GeForce GTX 1060 Mobile, Toshiba NVMe THNSN5256GPU7, , 1920x1080, 15.6" | Gigabyte P56XT i7-7700HQ, GeForce GTX 1070 Mobile, LiteOn CX2-8B256, IPS, 1920x1080, 15.6" | HP Omen 15-ce002ng i7-7700HQ, GeForce GTX 1060 Max-Q, Samsung PM961 MZVLW256HEHP, IPS, 1920x1080, 15.6" | |
|---|---|---|---|---|---|---|
| Power Consumption | -37% | -54% | -61% | -30% | -43% | |
| Idle Minimum * (Watt) | 9 | 19.1 -112% | 18 -100% | 25.8 -187% | 13 -44% | 18 -100% |
| Idle Average * (Watt) | 13.5 | 20.8 -54% | 23 -70% | 26.6 -97% | 17 -26% | 23 -70% |
| Idle Maximum * (Watt) | 13.7 | 21.8 -59% | 31 -126% | 26.7 -95% | 22 -61% | 30 -119% |
| Load Average * (Watt) | 87.8 | 73.7 16% | 79 10% | 80.3 9% | 85 3% | 85 3% |
| Witcher 3 ultra * (Watt) | 129 | 130.2 -1% | 148 -15% | 121.2 6% | 154 -19% | 96 26% |
| Load Maximum * (Watt) | 158.6 | 173.1 -9% | 196 -24% | 159.3 -0% | 208 -31% | 158 -0% |
* ... smaller is better
Battery Life
Runtimes are average for a gaming notebook at just over four hours of real-world WLAN use to be nearly two hours longer than on the Zephyrus GX501VS. The advantage can be attributed to the larger battery capacity in the Q5 compared to the Asus (60 Wh vs. 50 Wh) and the inclusion of Optimus. Charging from near empty to full capacity will take just under two hours.
| Eurocom Q5 i7-7700HQ, GeForce GTX 1070 Max-Q, 55 Wh | Asus Zephyrus GX501VS i7-7700HQ, GeForce GTX 1070 Max-Q, 50 Wh | HP Omen 15-ce002ng i7-7700HQ, GeForce GTX 1060 Max-Q, 70 Wh | Gigabyte P56XT i7-7700HQ, GeForce GTX 1070 Mobile, 91.2 Wh | EVGA SC15 i7-7700HQ, GeForce GTX 1060 Mobile, 62 Wh | Alienware 15 R3 i7-7700HQ, GeForce GTX 1070 Mobile, 99 Wh | |
|---|---|---|---|---|---|---|
| Battery runtime | -31% | -2% | 74% | -4% | 32% | |
| Reader / Idle (h) | 7.8 | 3.8 -51% | 4.3 -45% | 9.5 22% | 3.7 -53% | 6.4 -18% |
| WiFi v1.3 (h) | 4.3 | 2.5 -42% | 3.3 -23% | 6.4 49% | 2.8 -35% | 4.4 2% |
| Load (h) | 0.8 | 0.8 0% | 1.3 63% | 2 150% | 1.4 75% | 1.7 113% |
Pros
Cons
Verdict
At face value, the Q5 is almost everything we'd want out of a Max-Q gaming notebook. Easy serviceability, thin and attractive profile, multiple display options, two internal storage bays, plenty of ports, Optimus, and even SIM support. Dig a bit deeper into the details, however, and the system has a long way to go against competing Max-Q models like the Zephyrus.
For one, the preset Automatic fan mode ought to be changed to meet Max-Q fan noise standards. As of this writing, users will have to set the fan speed manually to 55 percent for a "true" Max-Q experience. Failure to do so will have the Q5 running just as loudly as non Max-Q gaming notebooks that may be equipped with GTX 1070 or better graphics. After all, why purchase a Max-Q notebook if it won't run any quieter than a more powerful ultrathin alternative?
Secondly, core temperatures are warmer than on the Zephyrus when set to the 55 percent fan speed setting. Thus, when subjected to the same gaming loads and at identical fan noise readings, the Asus notebook will still run cooler.
Lastly, the GTX 1070 Max-Q in the Q5 is consistently slower than the same GPU in the Asus alternative. Its slower clock rate in combination with higher core temperatures could be a nail in the coffin to the eyes of hardcore gamers. If you want the best that the GTX 1070 Max-Q has to offer, then the Q5 is not the notebook to get. If the wide auxiliary features and connectivity options are of importance over the barebone Zephyrus, however, then the less expensive Q5 could still be a compelling Max-Q notebook.
It's clear that the Q5 and its cooling solution are not yet fully optimized for Max-Q as clock rates and temperatures are unfavorable against the competition. Future SKUs equipped with the less demanding GTX 1060 Max-Q would theoretically be a better fit for this particular chassis. Beyond that, auxiliary features and configurable options outside of the CPU and GPU are the most plentiful yet for a superthin Max-Q notebook.
Eurocom Q5
- 09/07/2017 v6 (old)
Allen Ngo
Price comparison
