Asus ROG Zephyrus GX501 Laptop Review

For the original German review, see here.
How slim should gaming laptops be? The answer seems to be simple: As slim as possible. Who wants to carry around a bulky machine? But: How slim can gaming notebooks be? Obviously less than 18 millimeters (~0.7 in) right now, despite high-end components with i7-7700HQ CPU and GTX 1080 graphics card. Great, top-notch performance in an attractive super-slim chassis. As it is so often the case, however, there is a catch, and maybe even more than one...
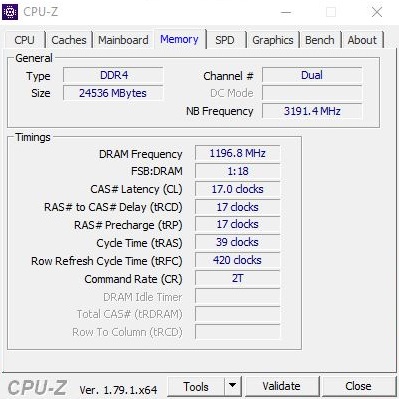
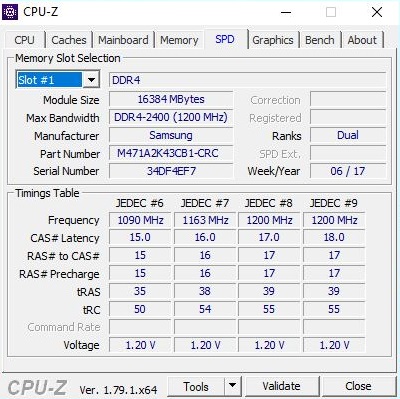
The specifications of the 15-inch device are excellent. Besides the previously mentioned high-end hardware, our test model of the Zephyrus GX501VI is equipped with 24 GB of DDR4 RAM and a 1 TB PCIe SSD (German retail model comes with only a 500 GB drive). You also get a matte 120 Hz panel with the Full HD resolution and G-Sync support. The package is obviously not cheap: 3000 Euros (~$3405) is a steep price, even for a powerful gaming laptop.
Update 07/15/17: The manufacturer asked us to review another test model provided by them because they measured better results in their lab (primarily for temperature and system noise). Our additional tests actually showed lower emissions, so the temperature rating is increased by 5% and the noise rating by 4%. The effect on the final rating is one percent more from 84 to 85%. All corresponding values, screenshots, and text passages were adjusted.
Case
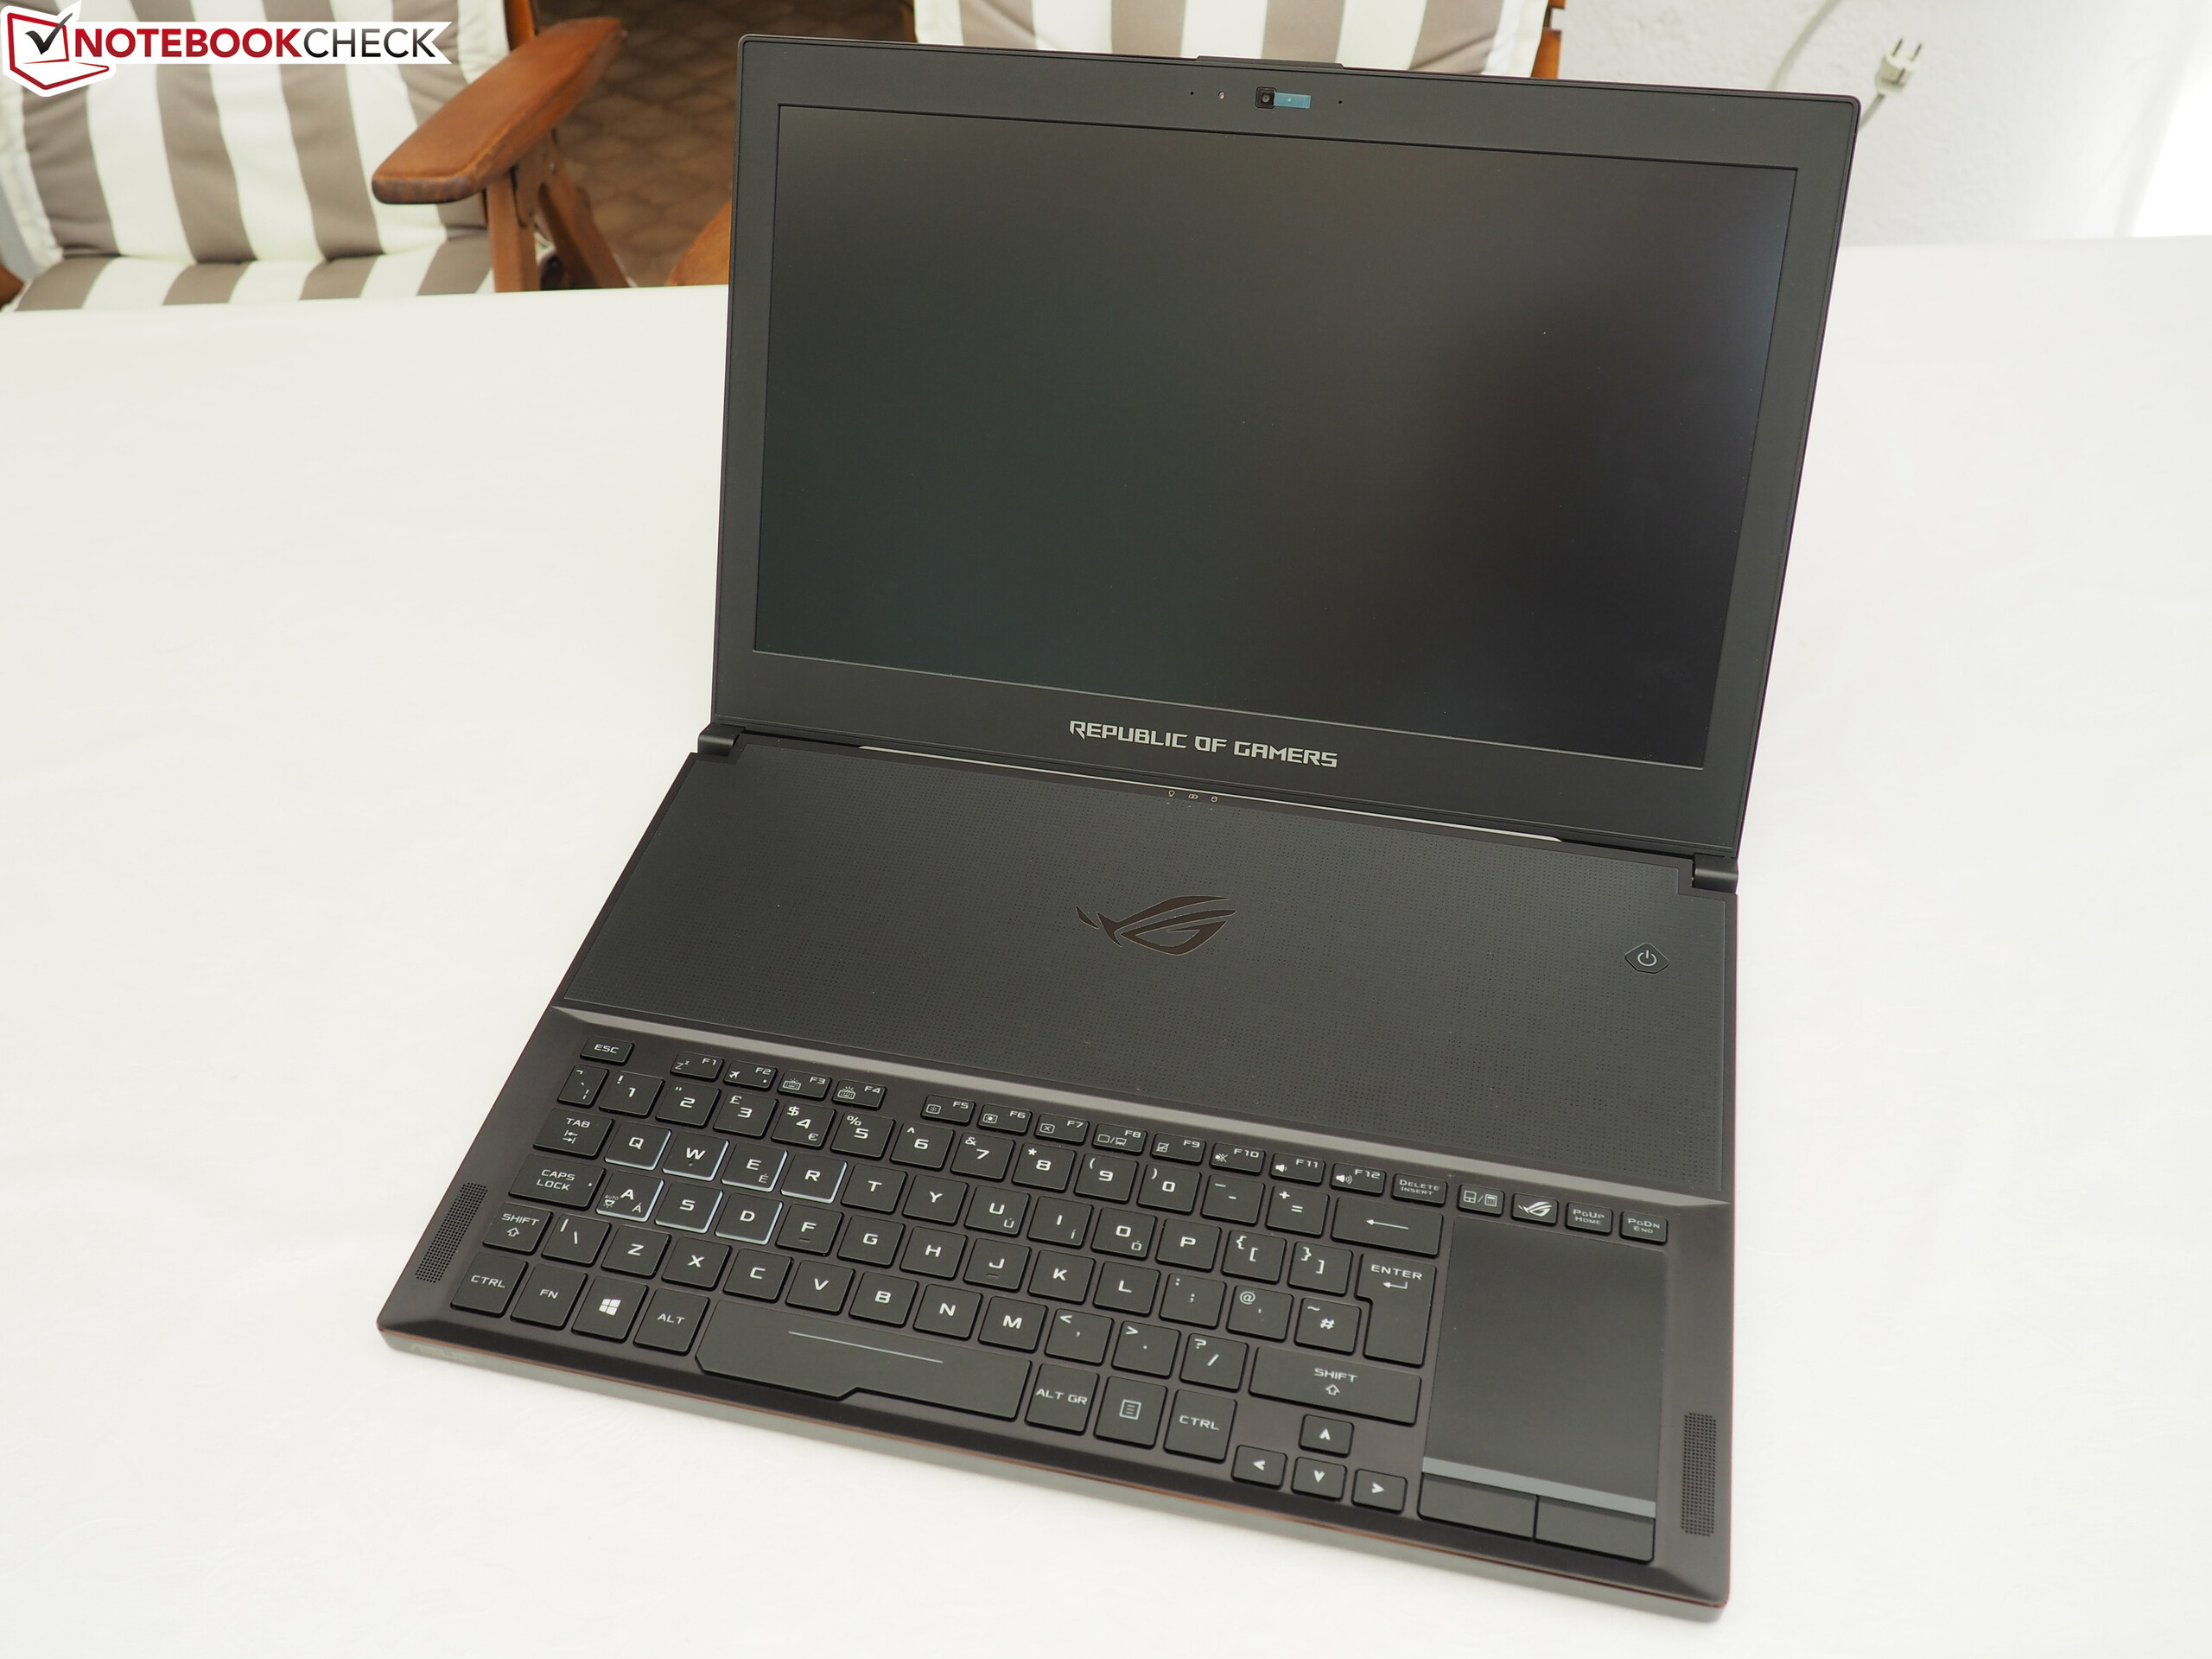
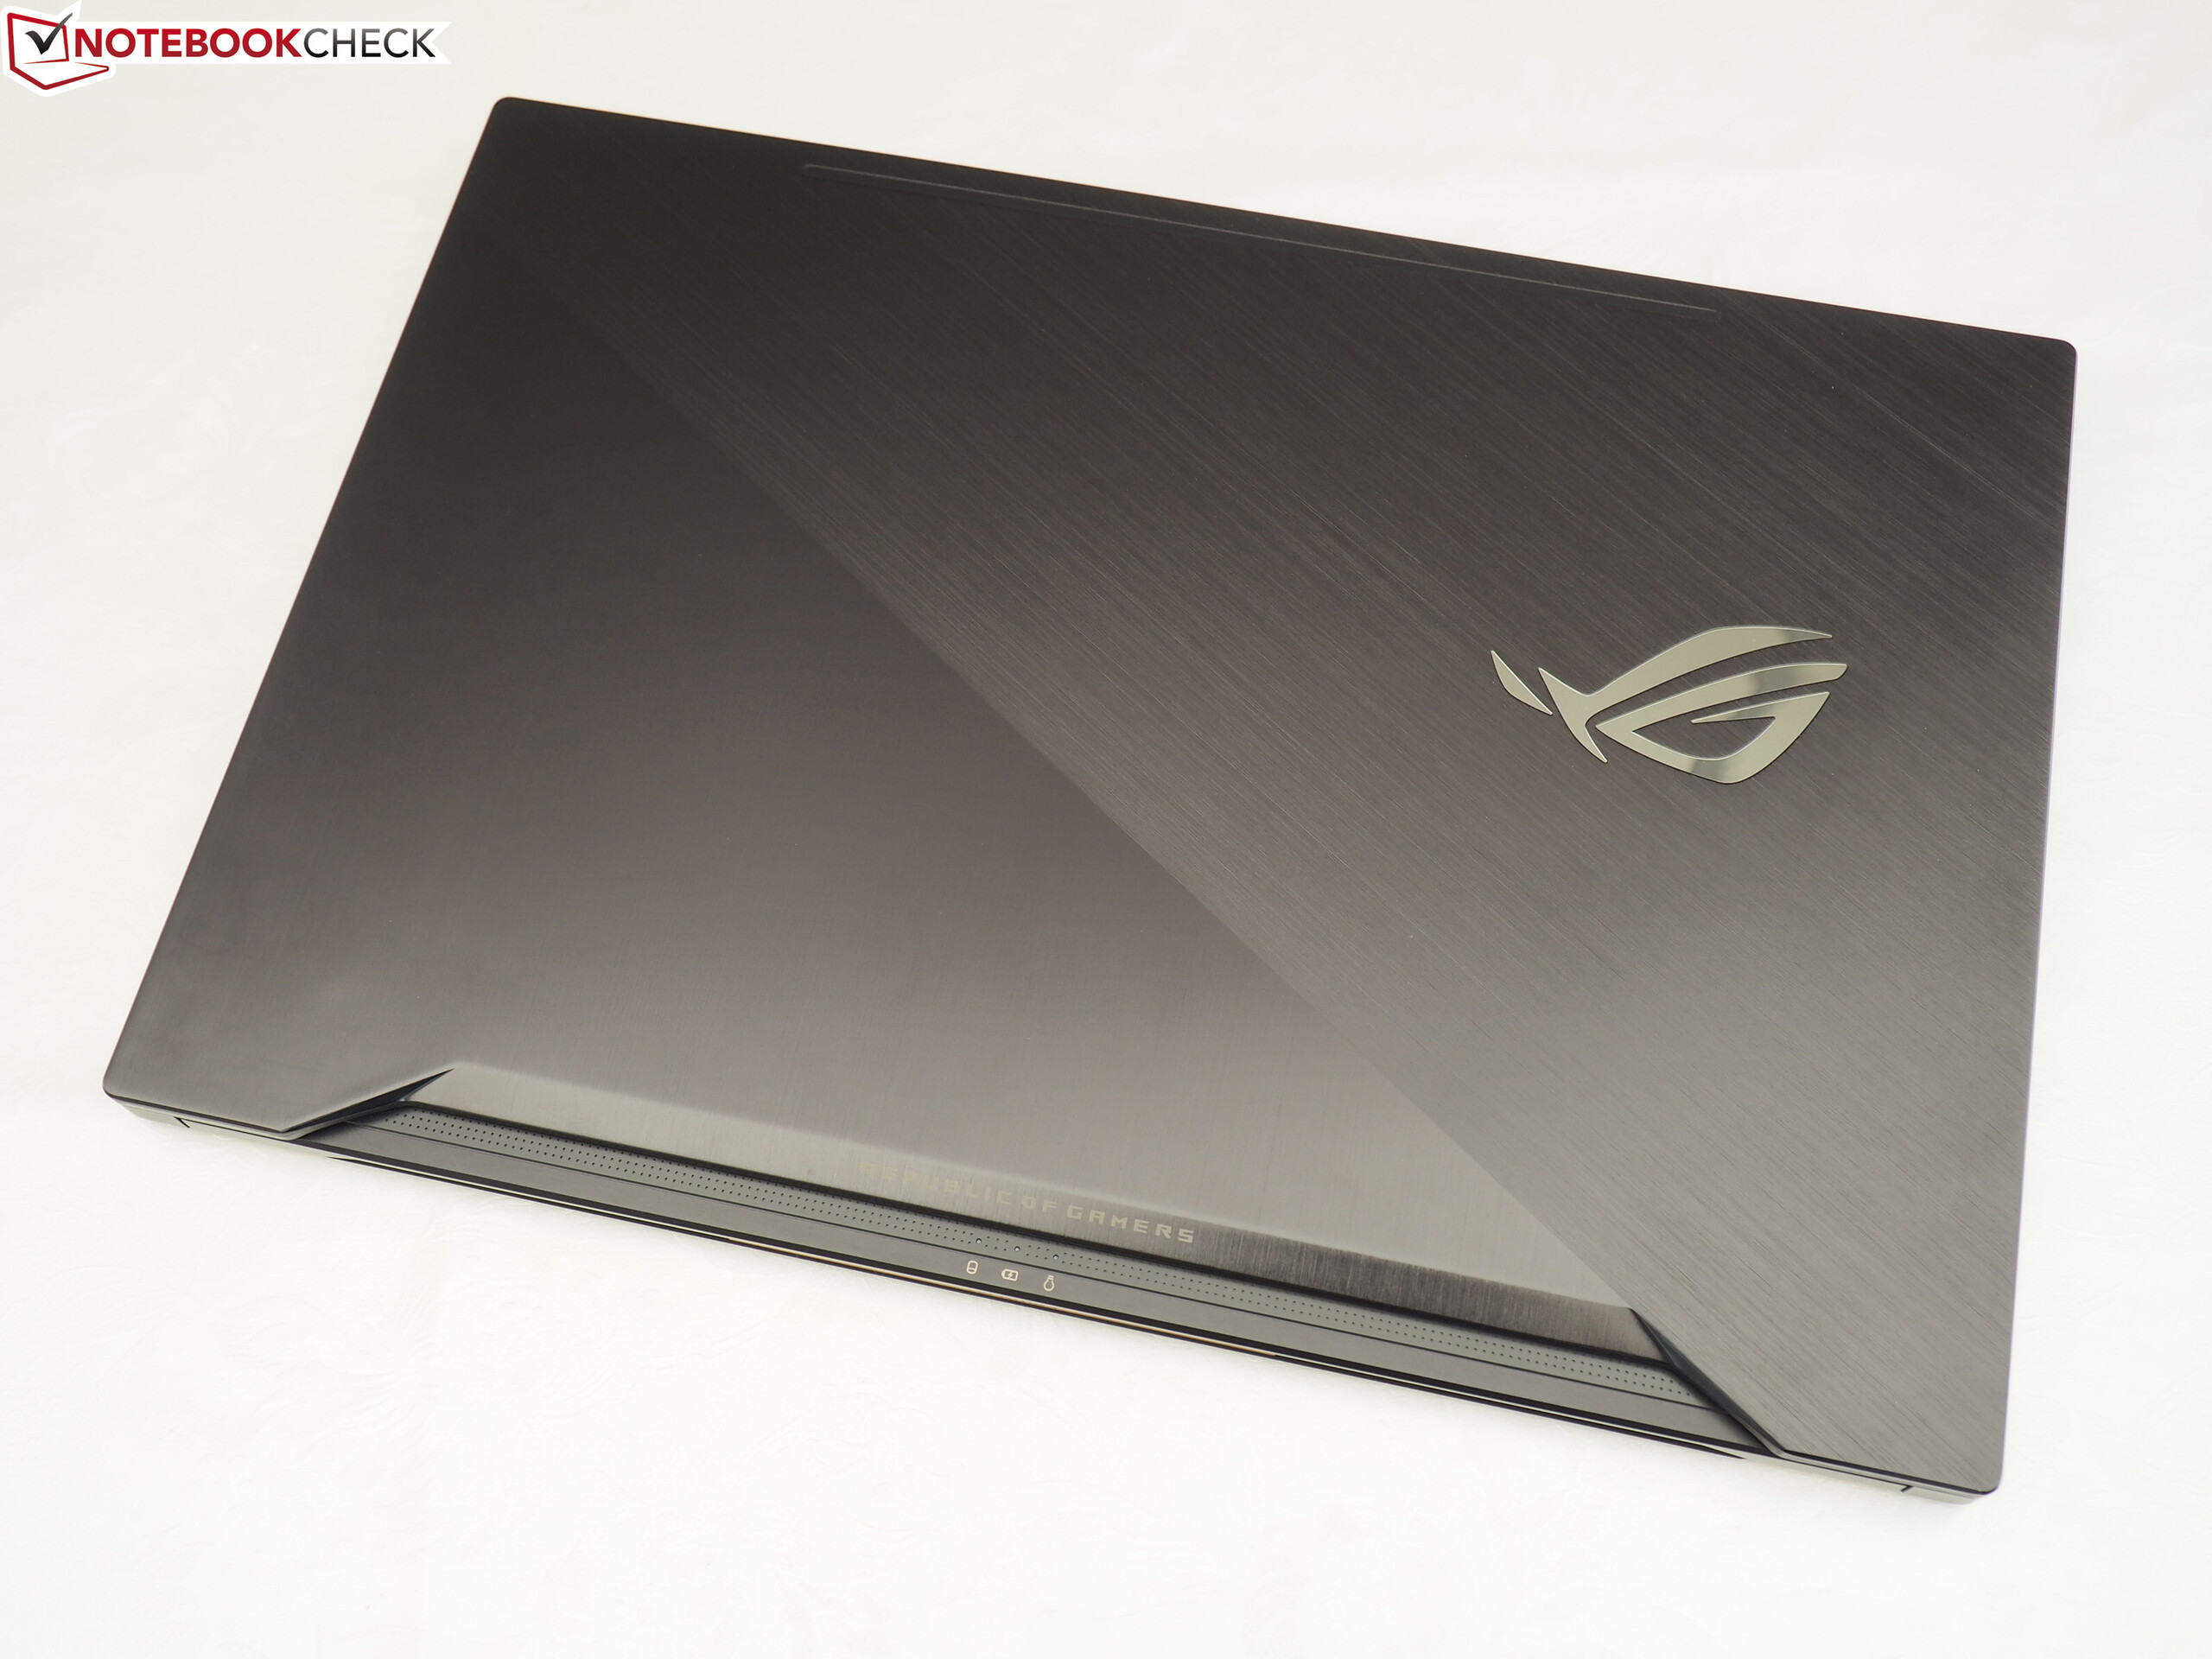
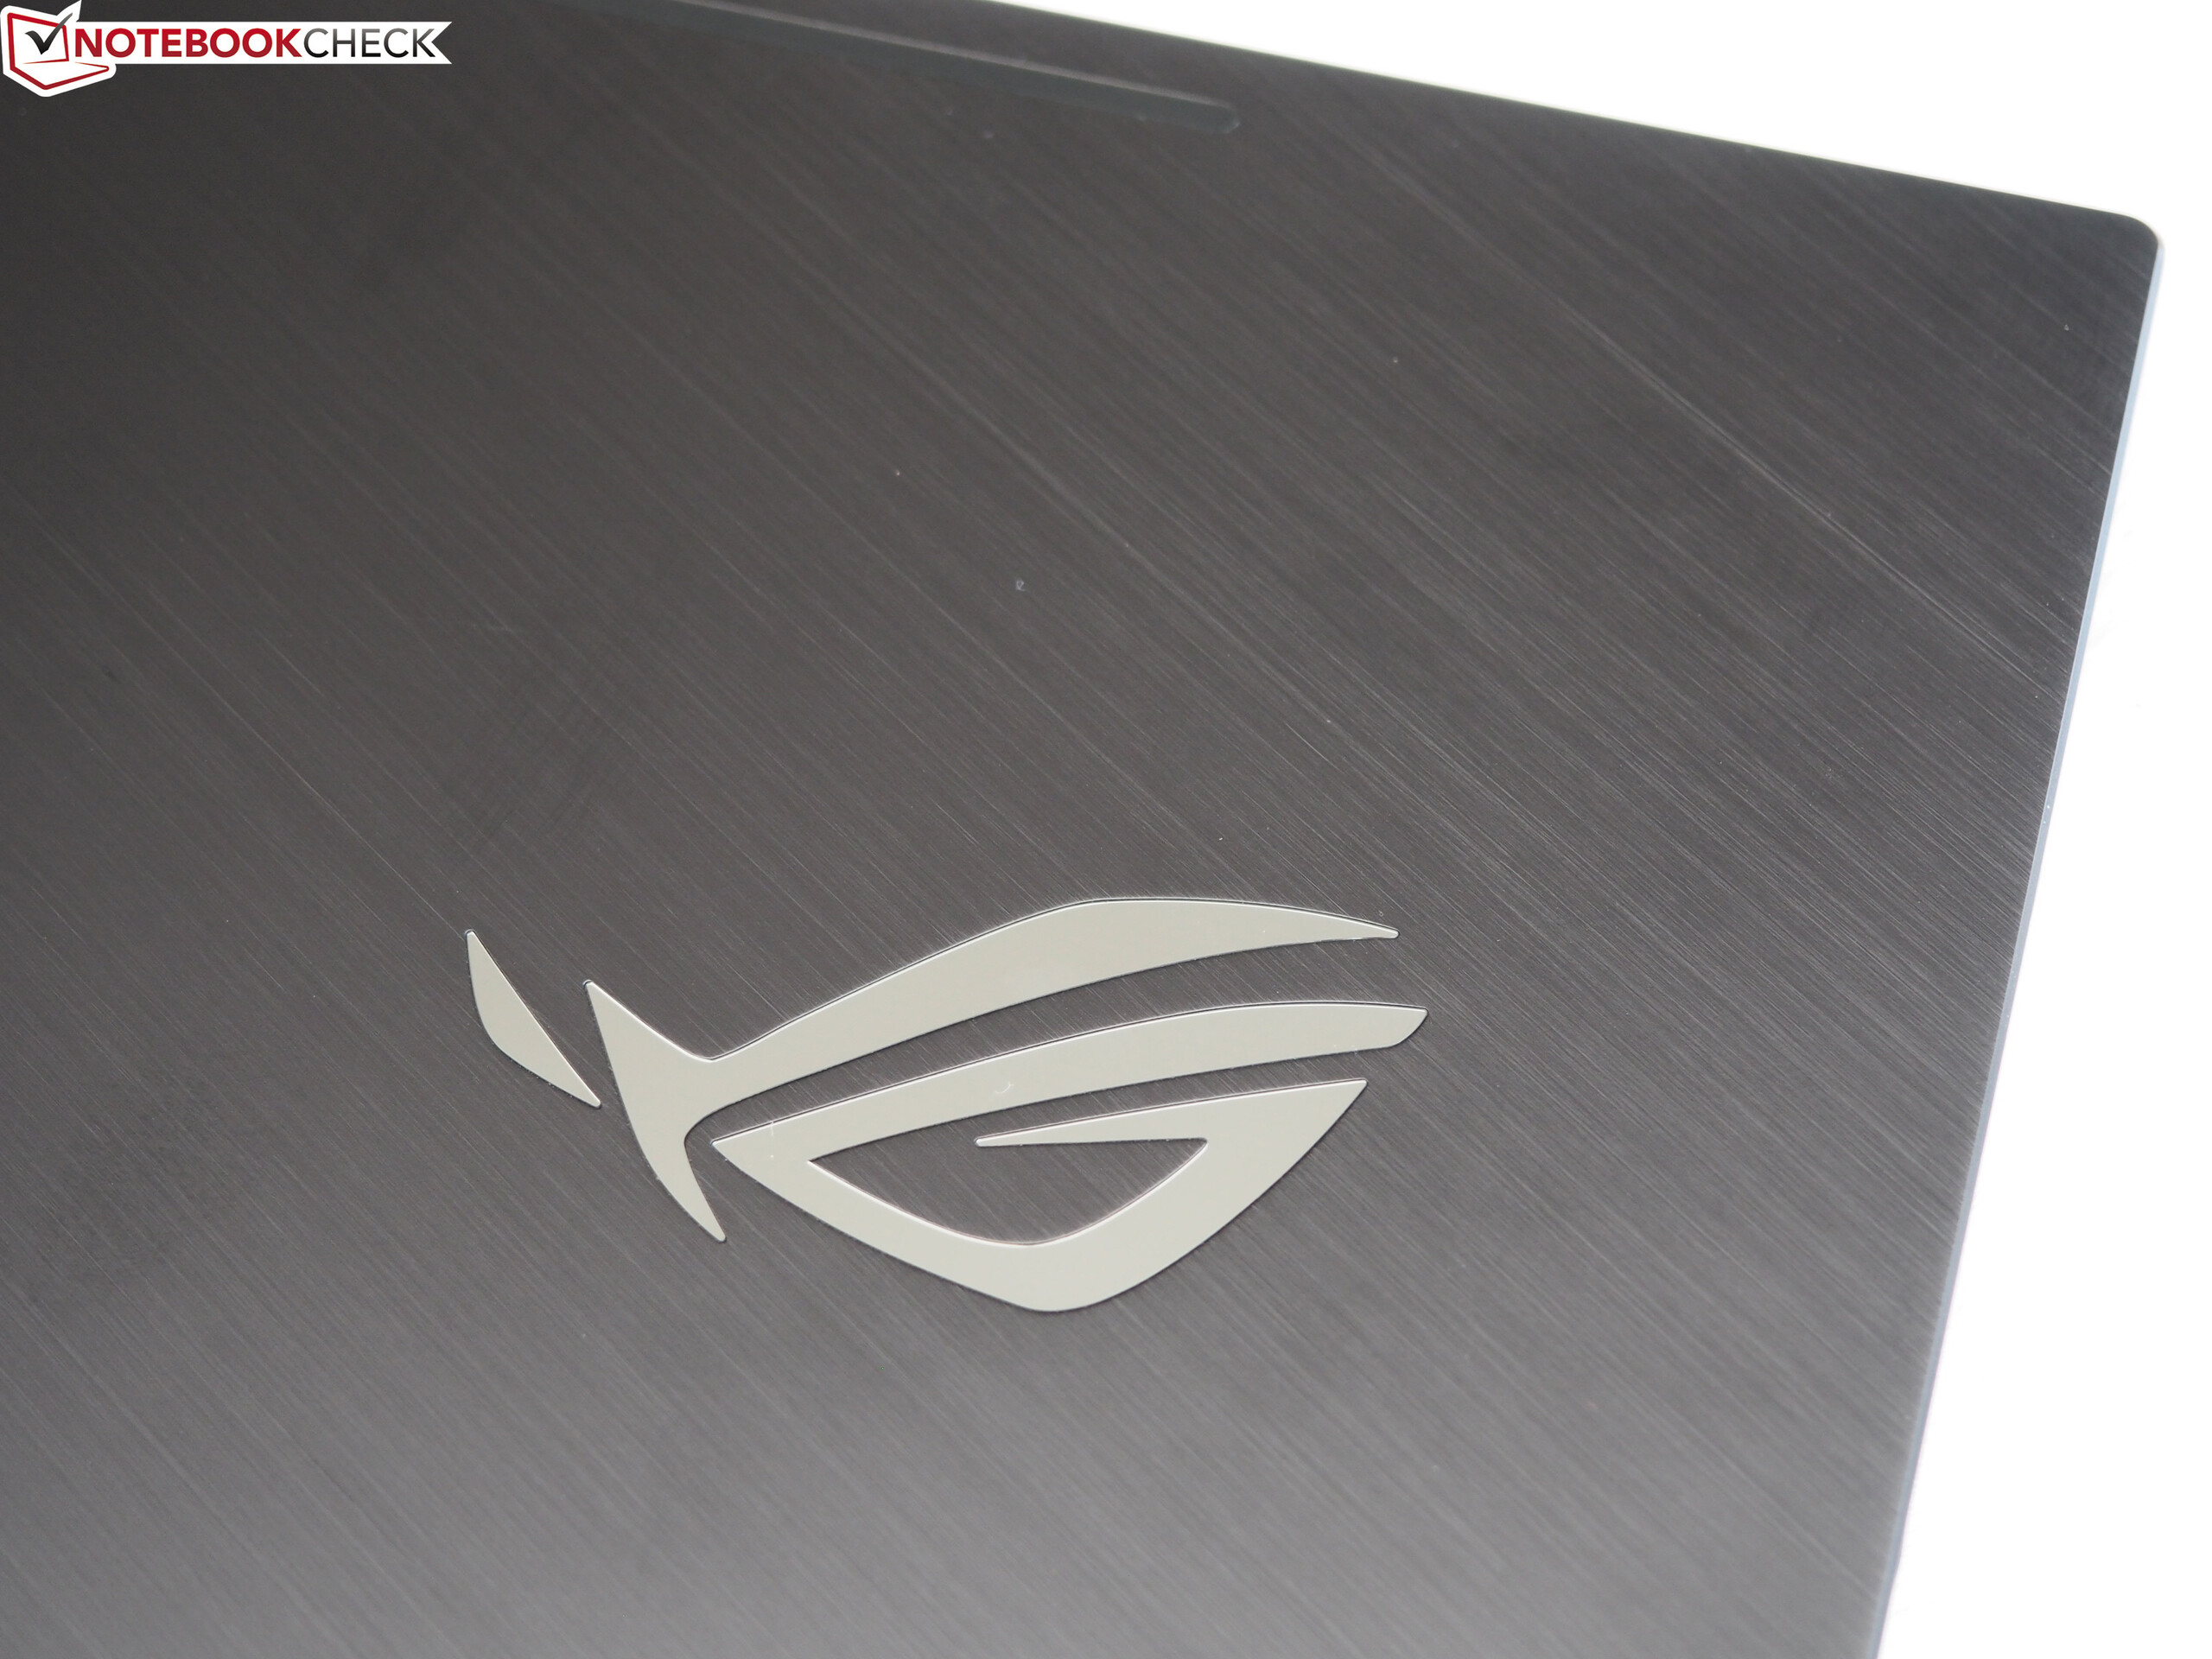
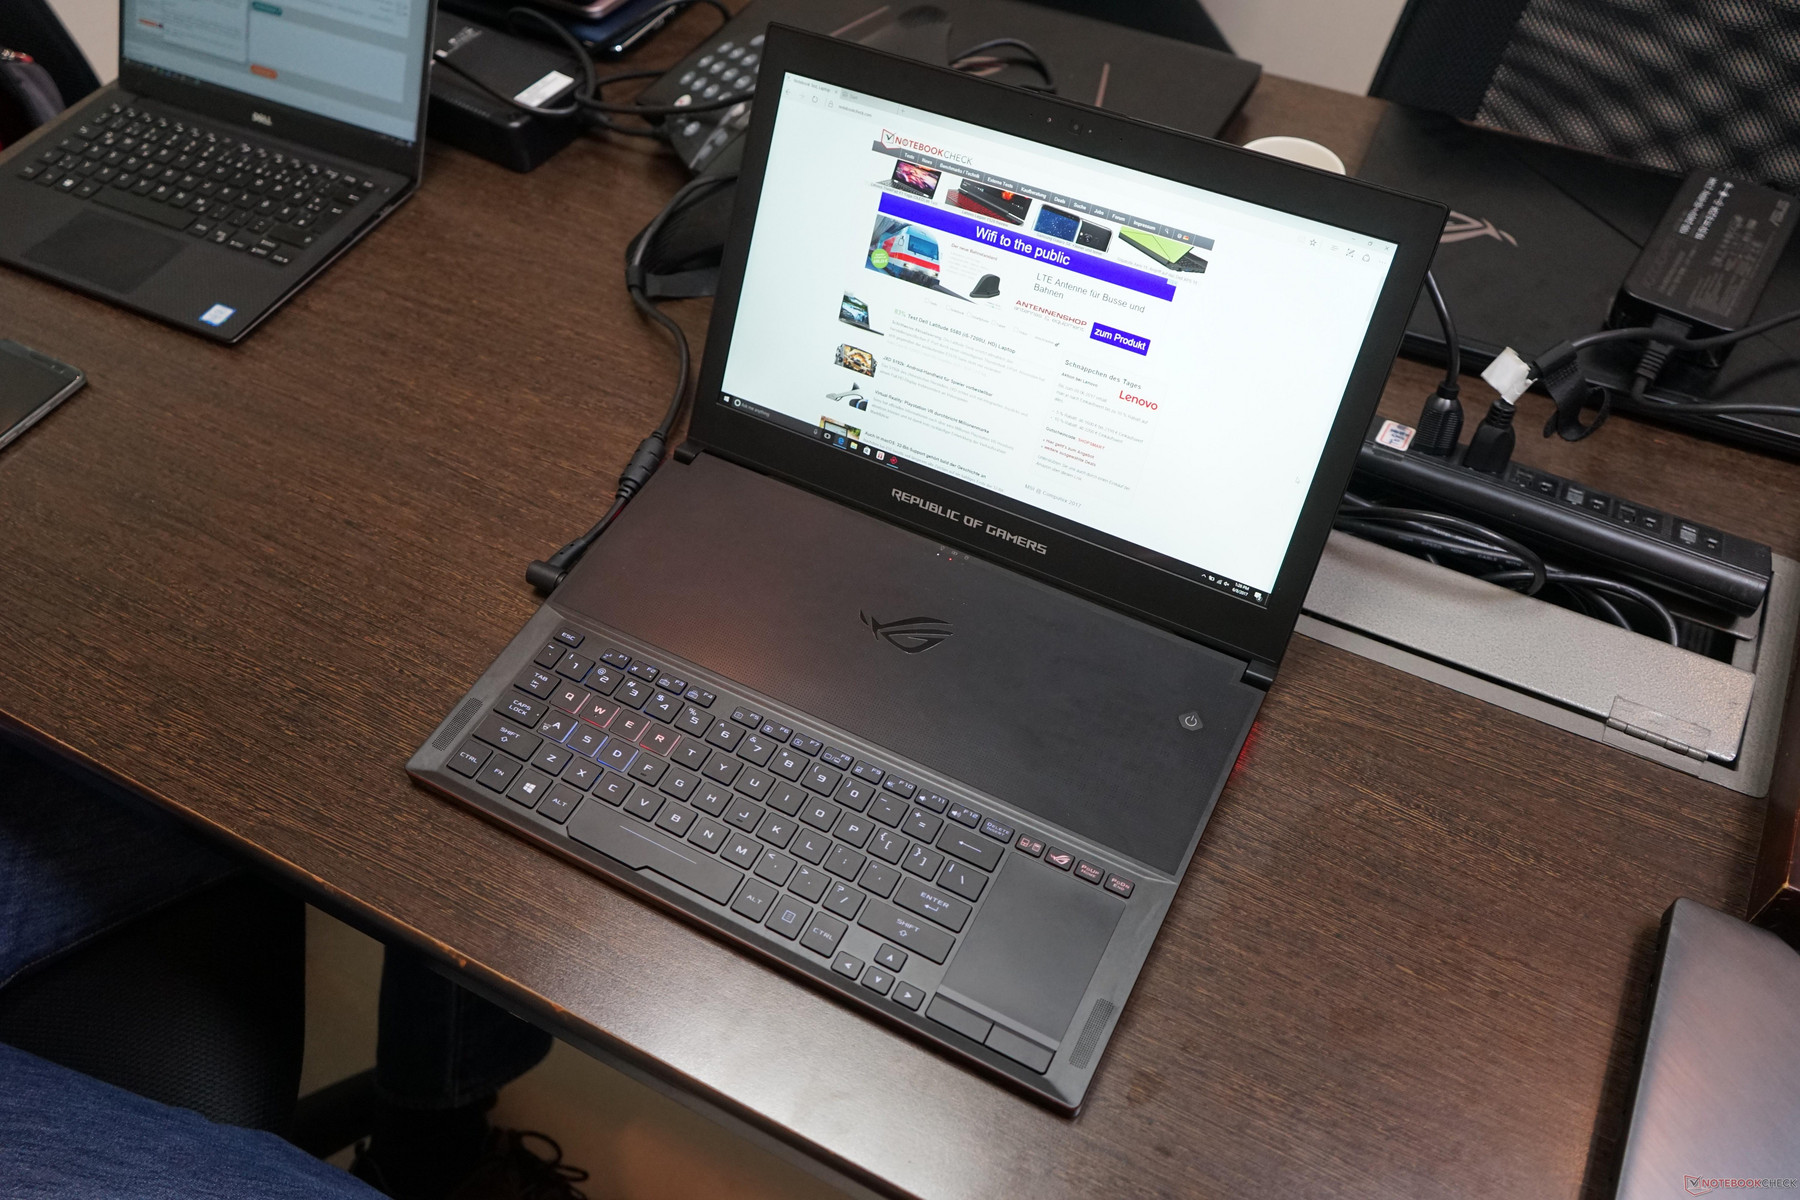
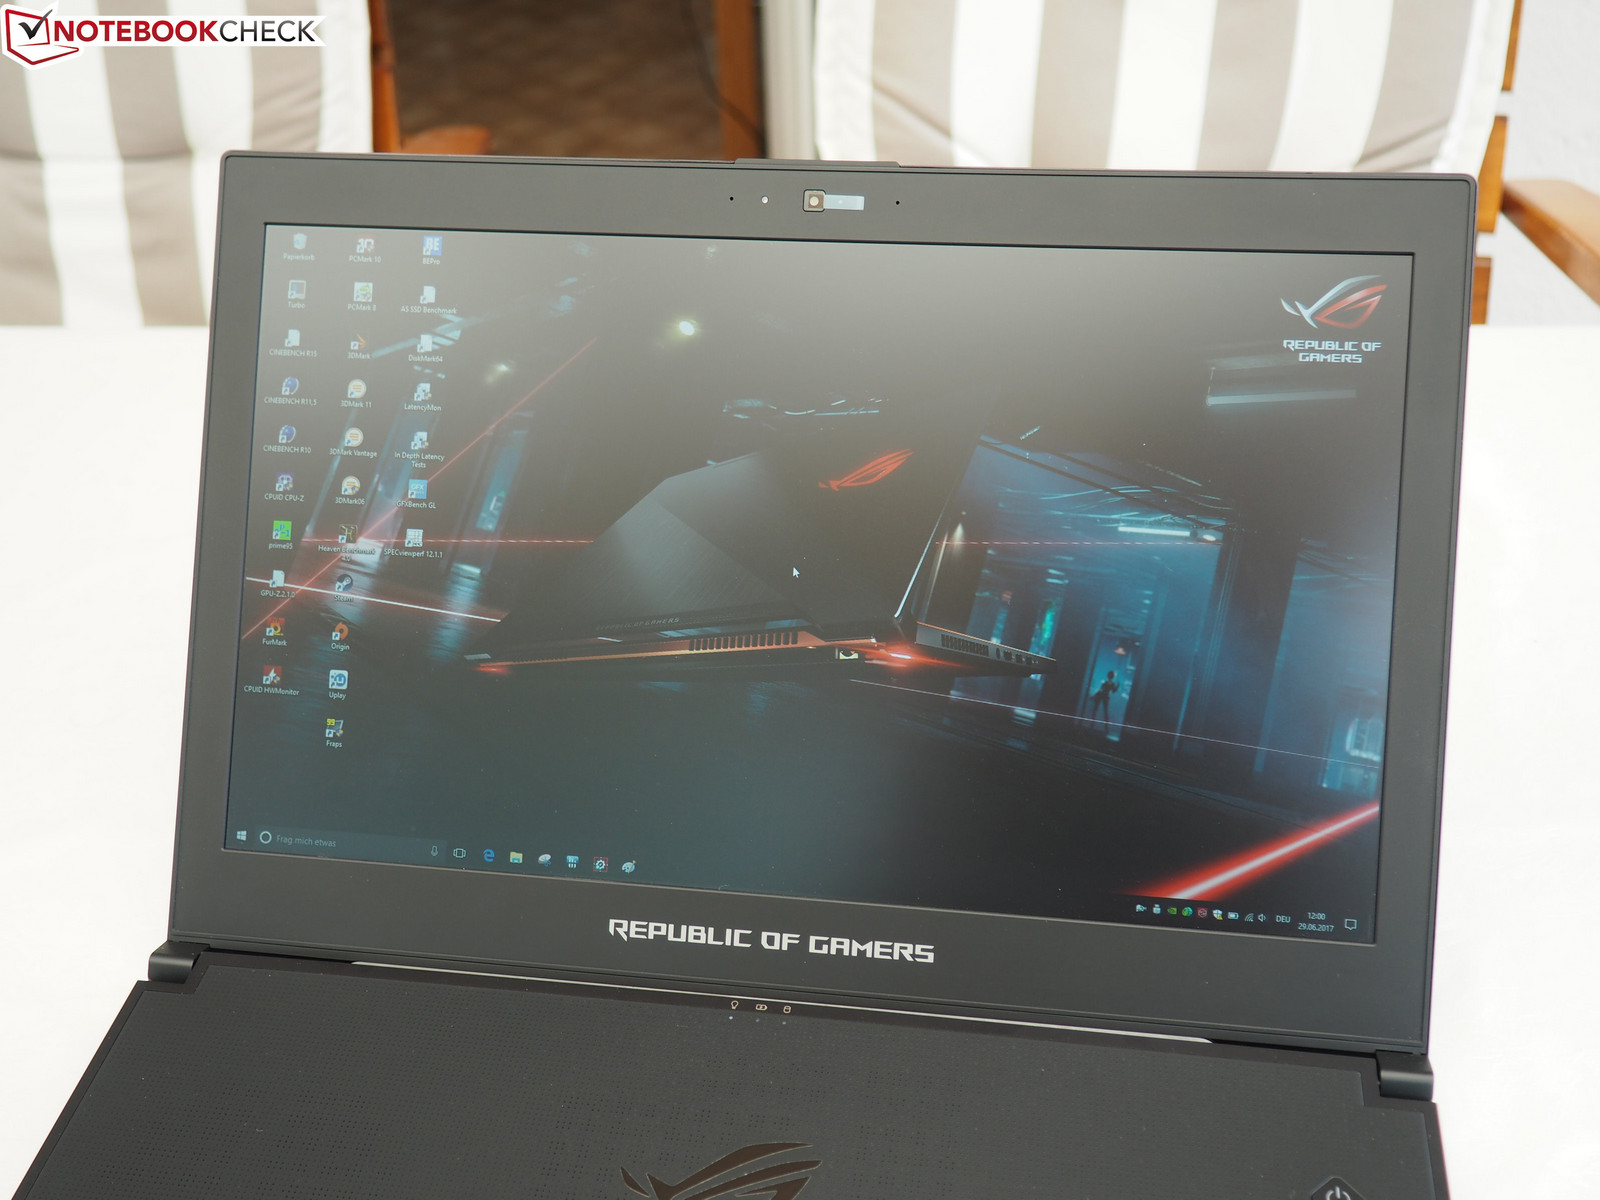
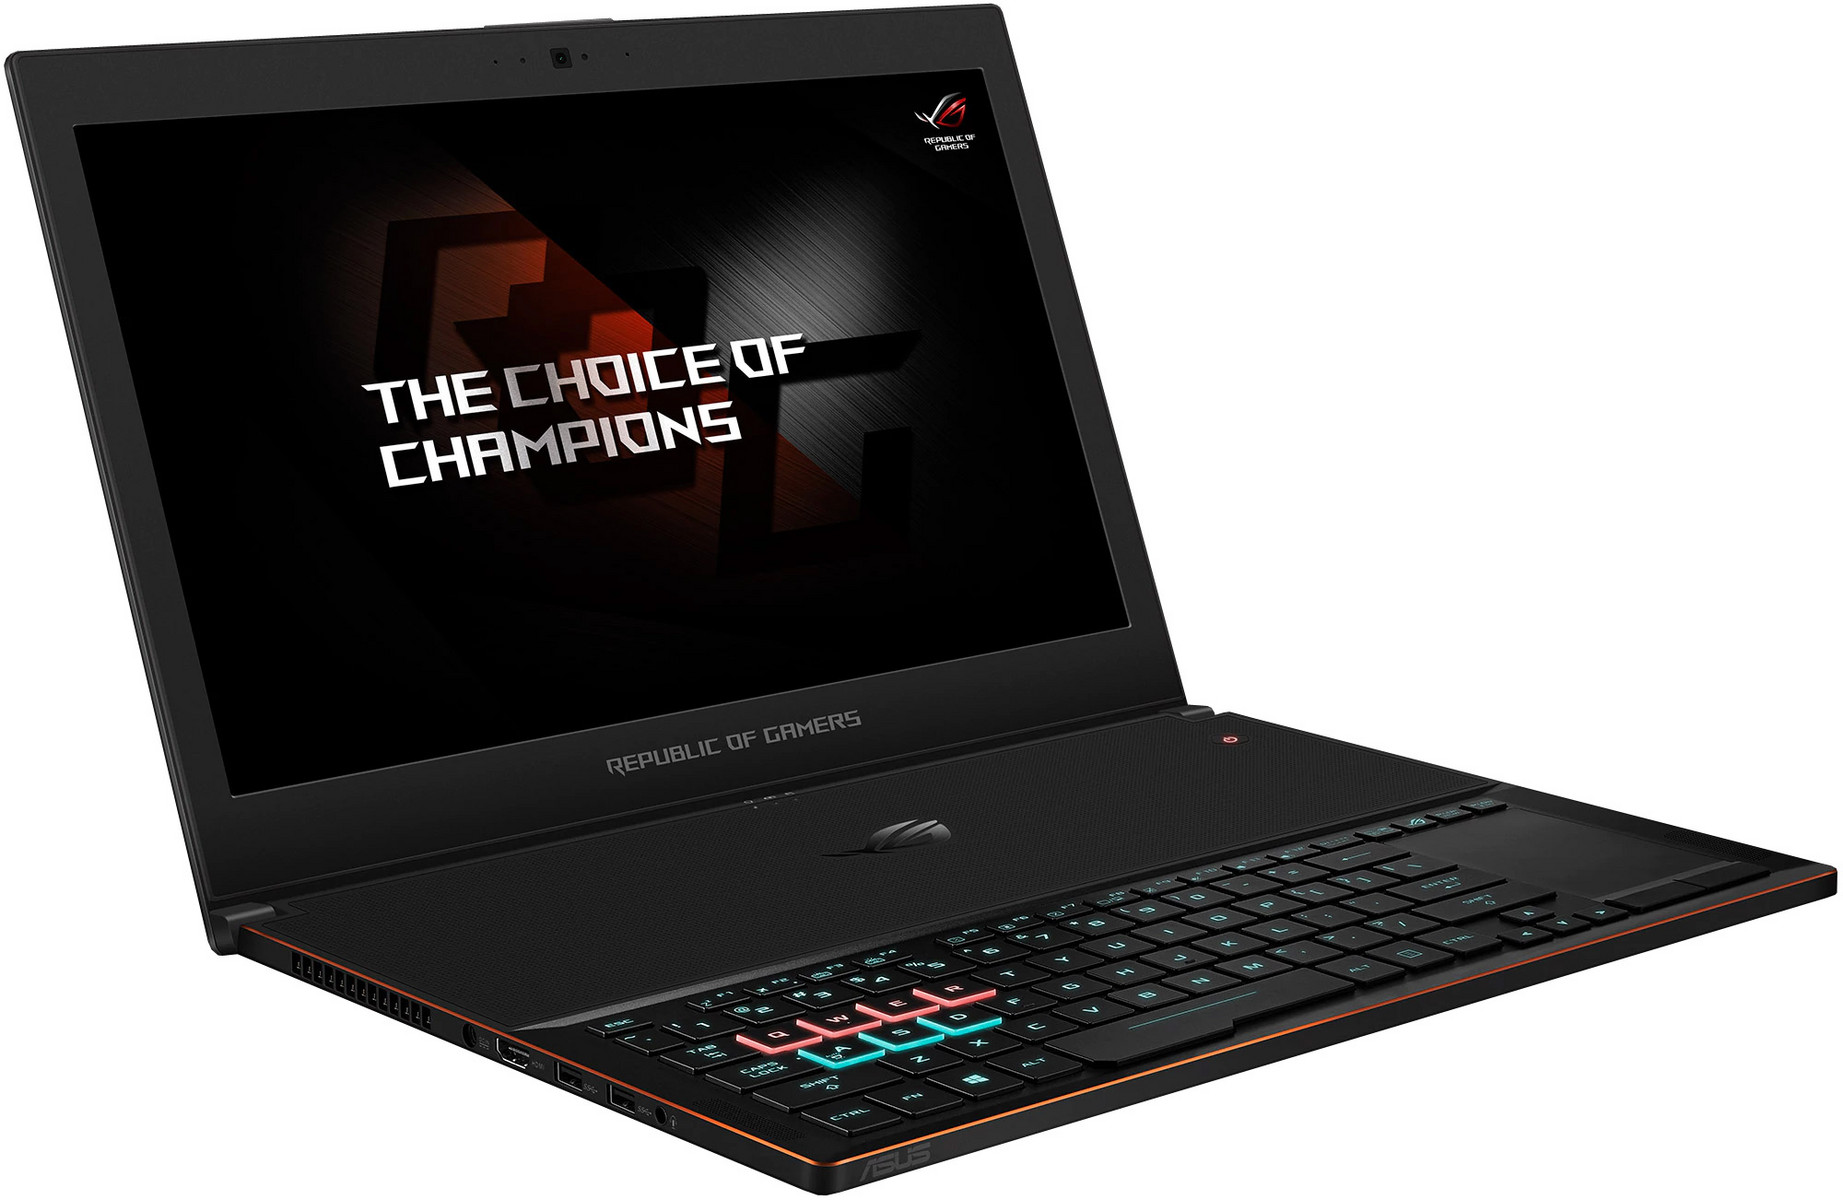
The gaming laptop is placed within the high-end segment and its casing is correspondingly made of aluminum and magnesium. The C-cover basically bends around the corners towards the bottom, which creates a surrounding polished edge. The GX501 design is very subtle except for the copper colored rear edge, the subtly lit ROG logo on the lid and the two red LEDs on the inside around the fans. It almost looks like everything had to submit to the goal of creating a slim chassis.
The torsion resistance of the base unit is generally very good on our pre-production sample, we can only slightly dent the center area above the keyboard with concentrated pressure. This part of the chase is partially perforated and supports the fresh air delivery for the components inside the case. The display unit can be twisted with some force, but there are no picture distortions.
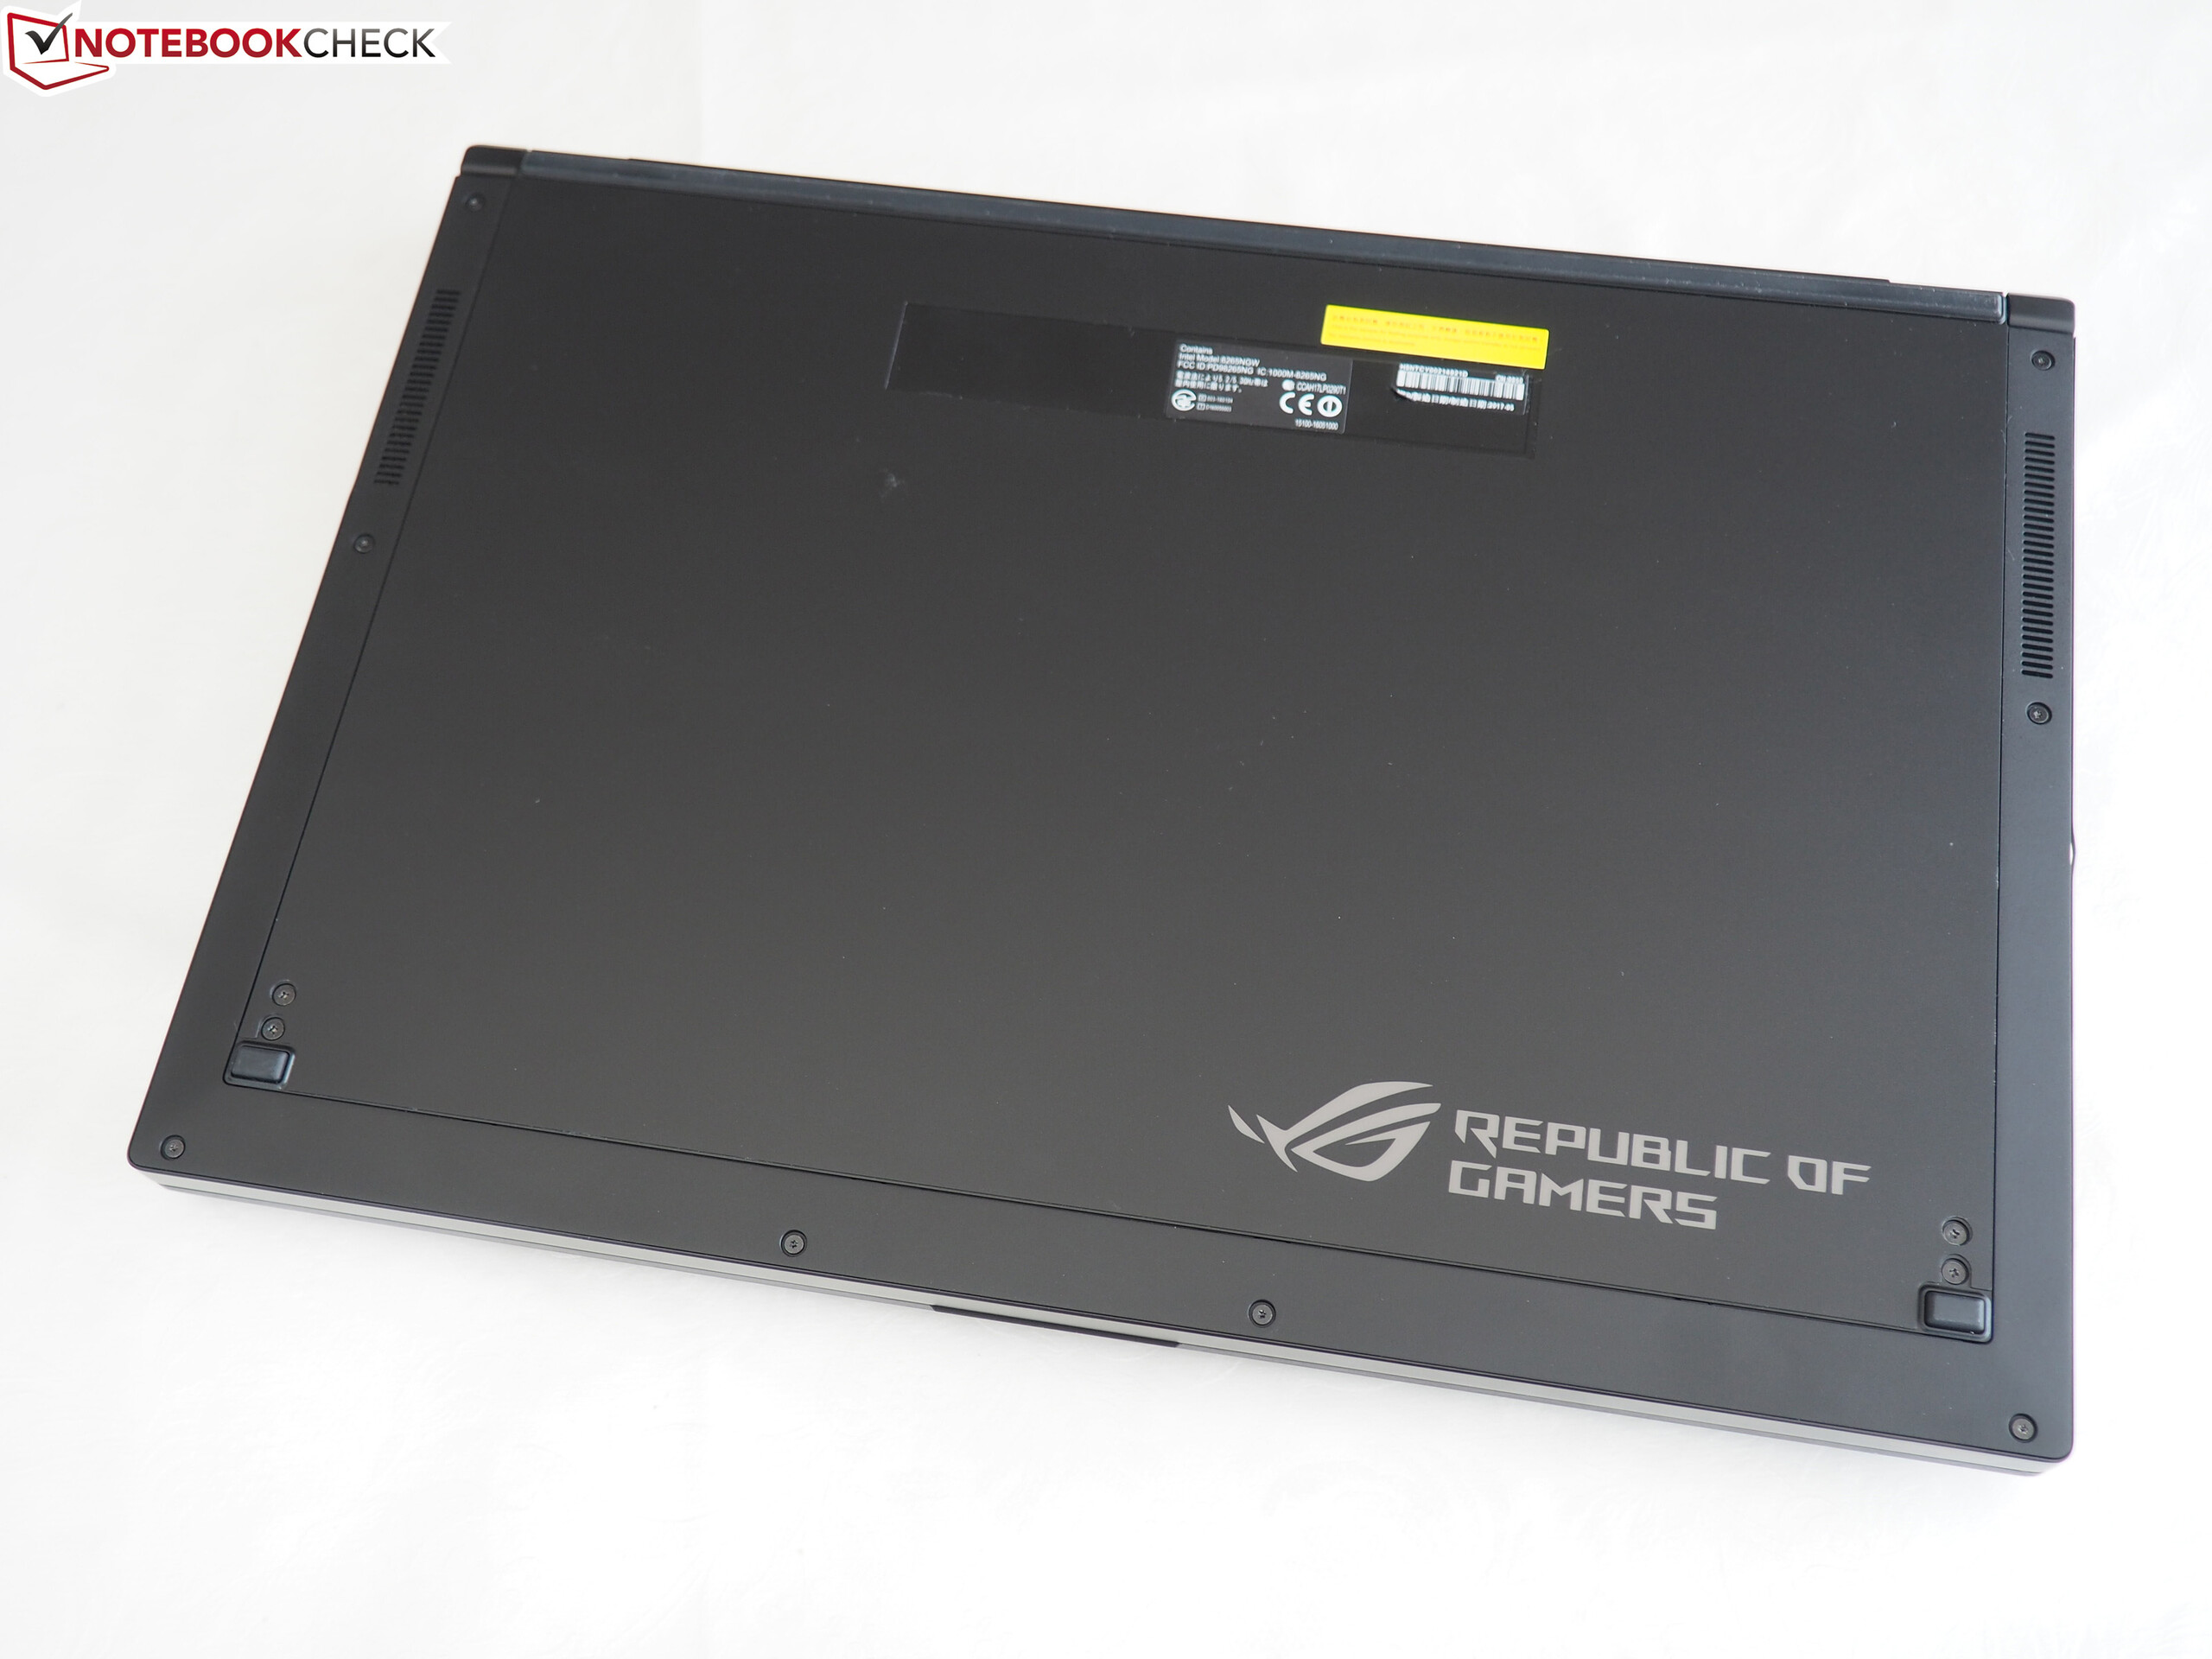
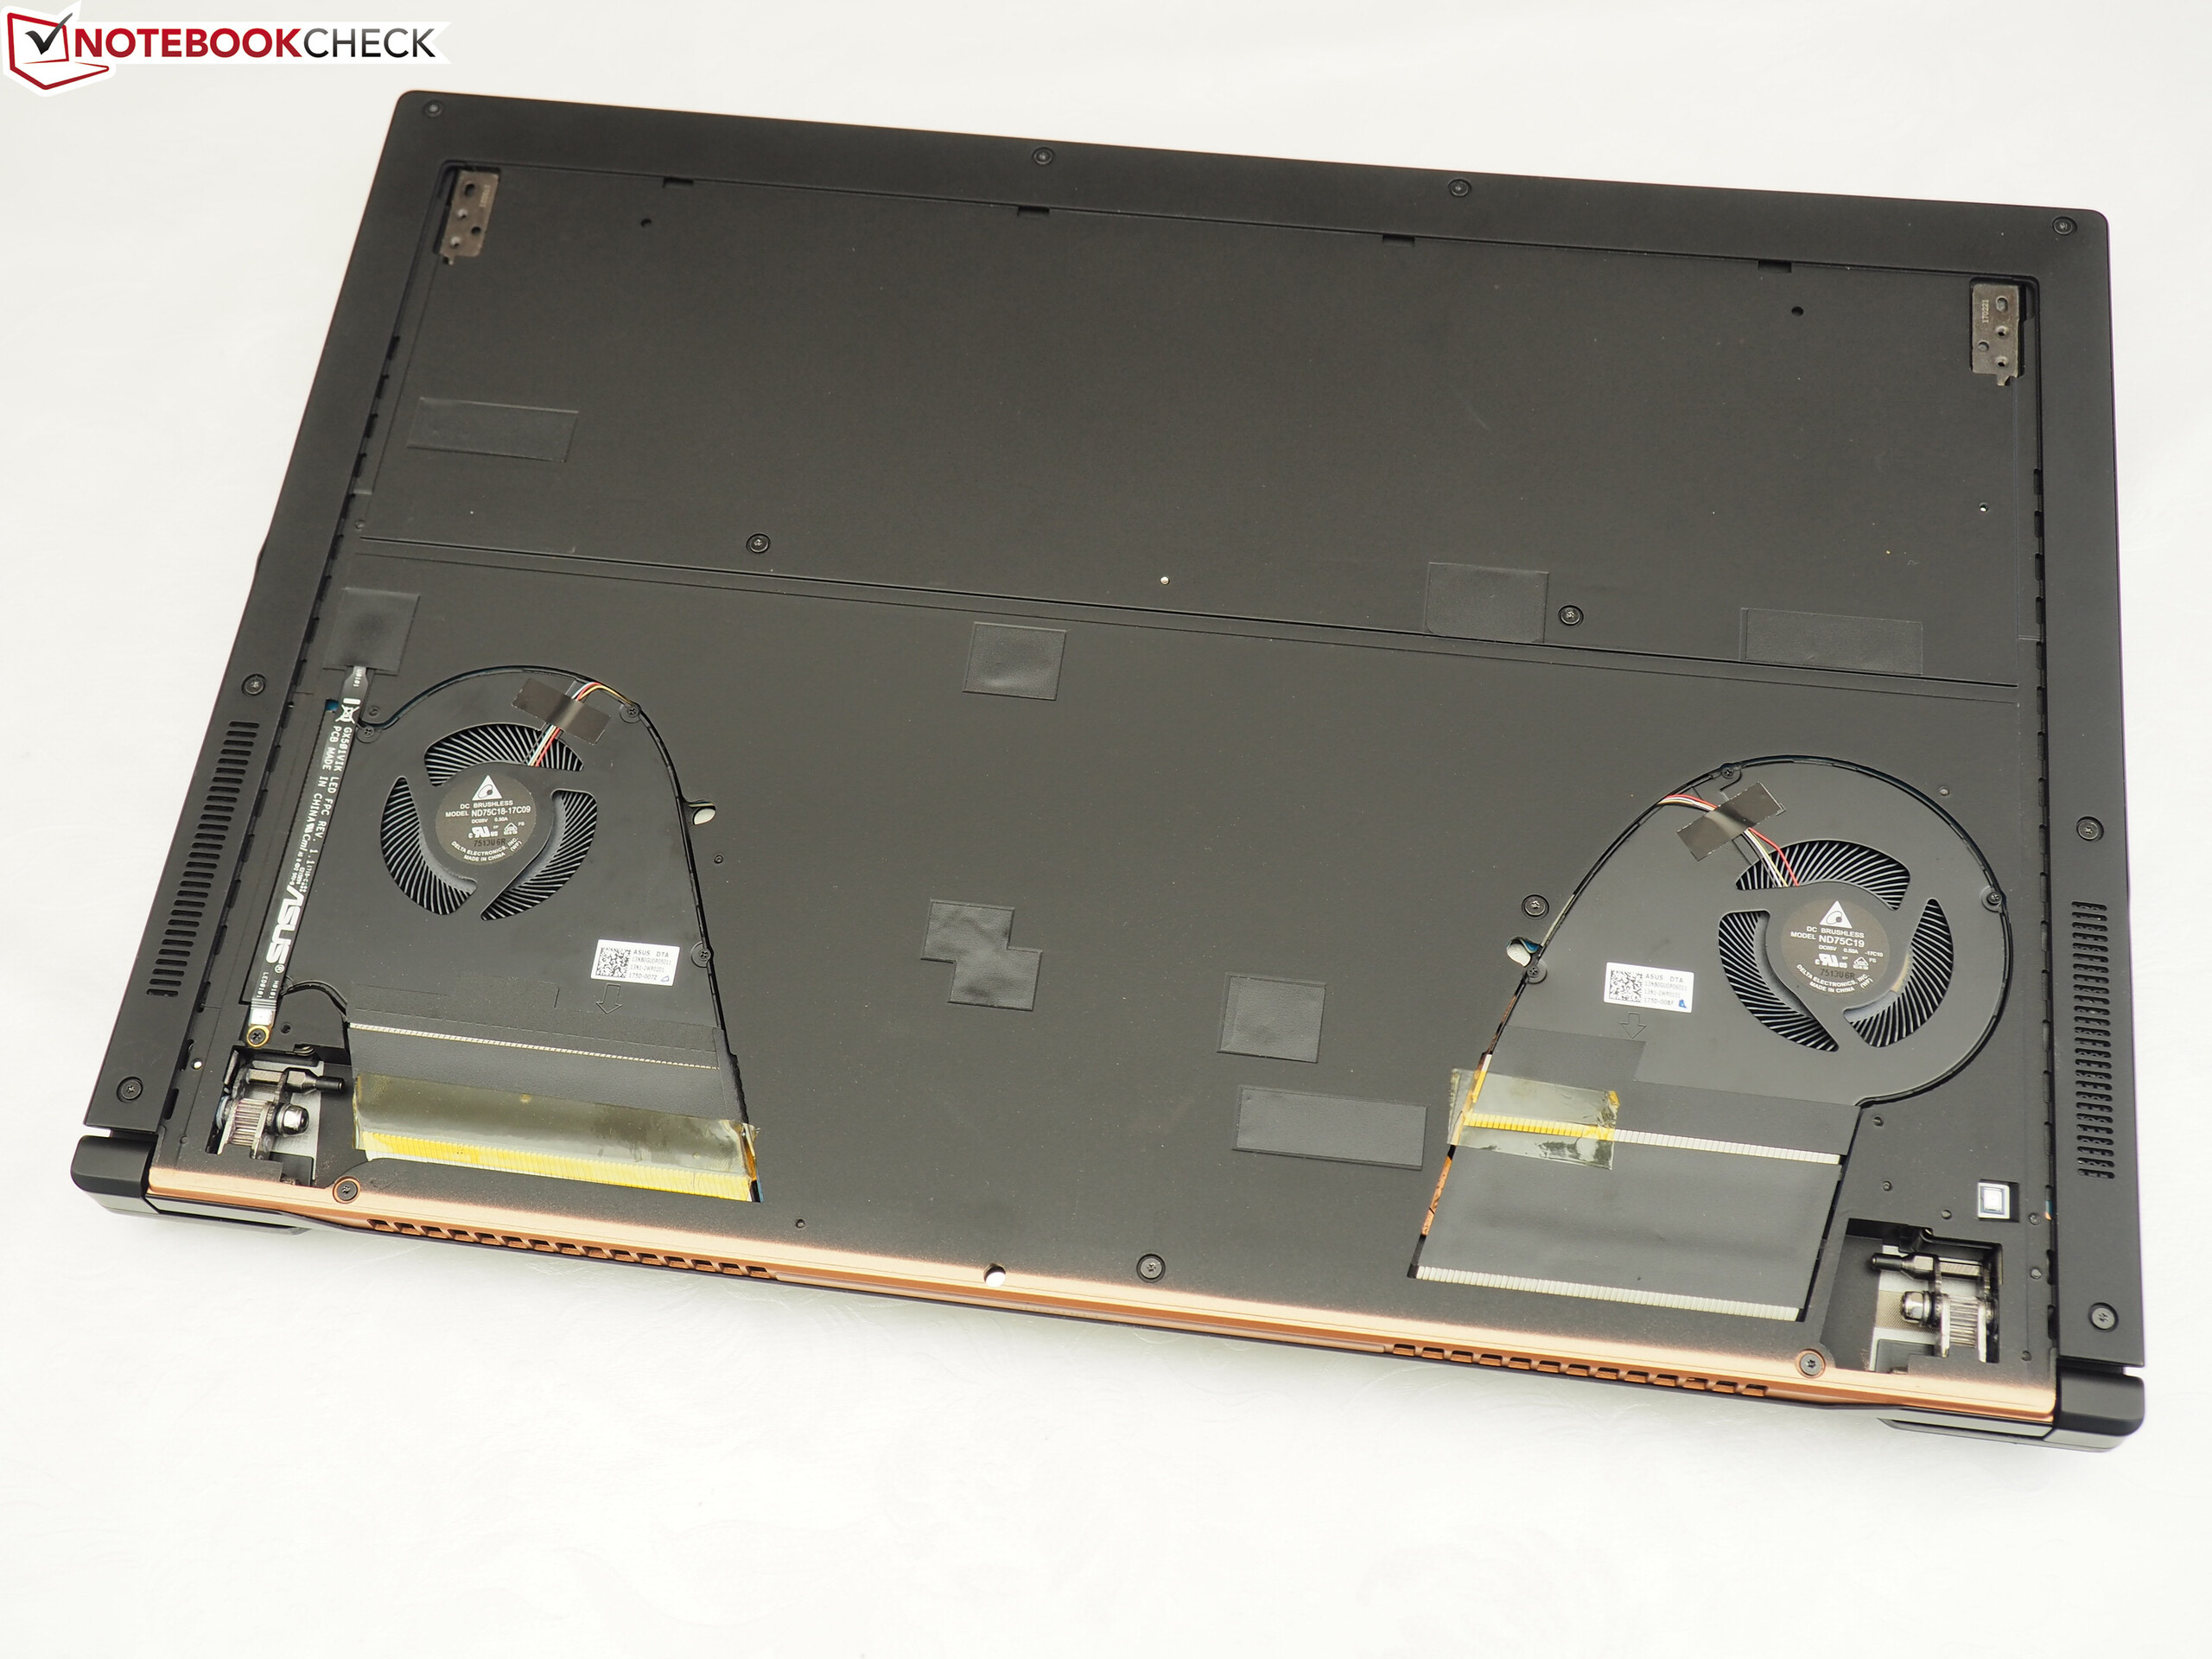
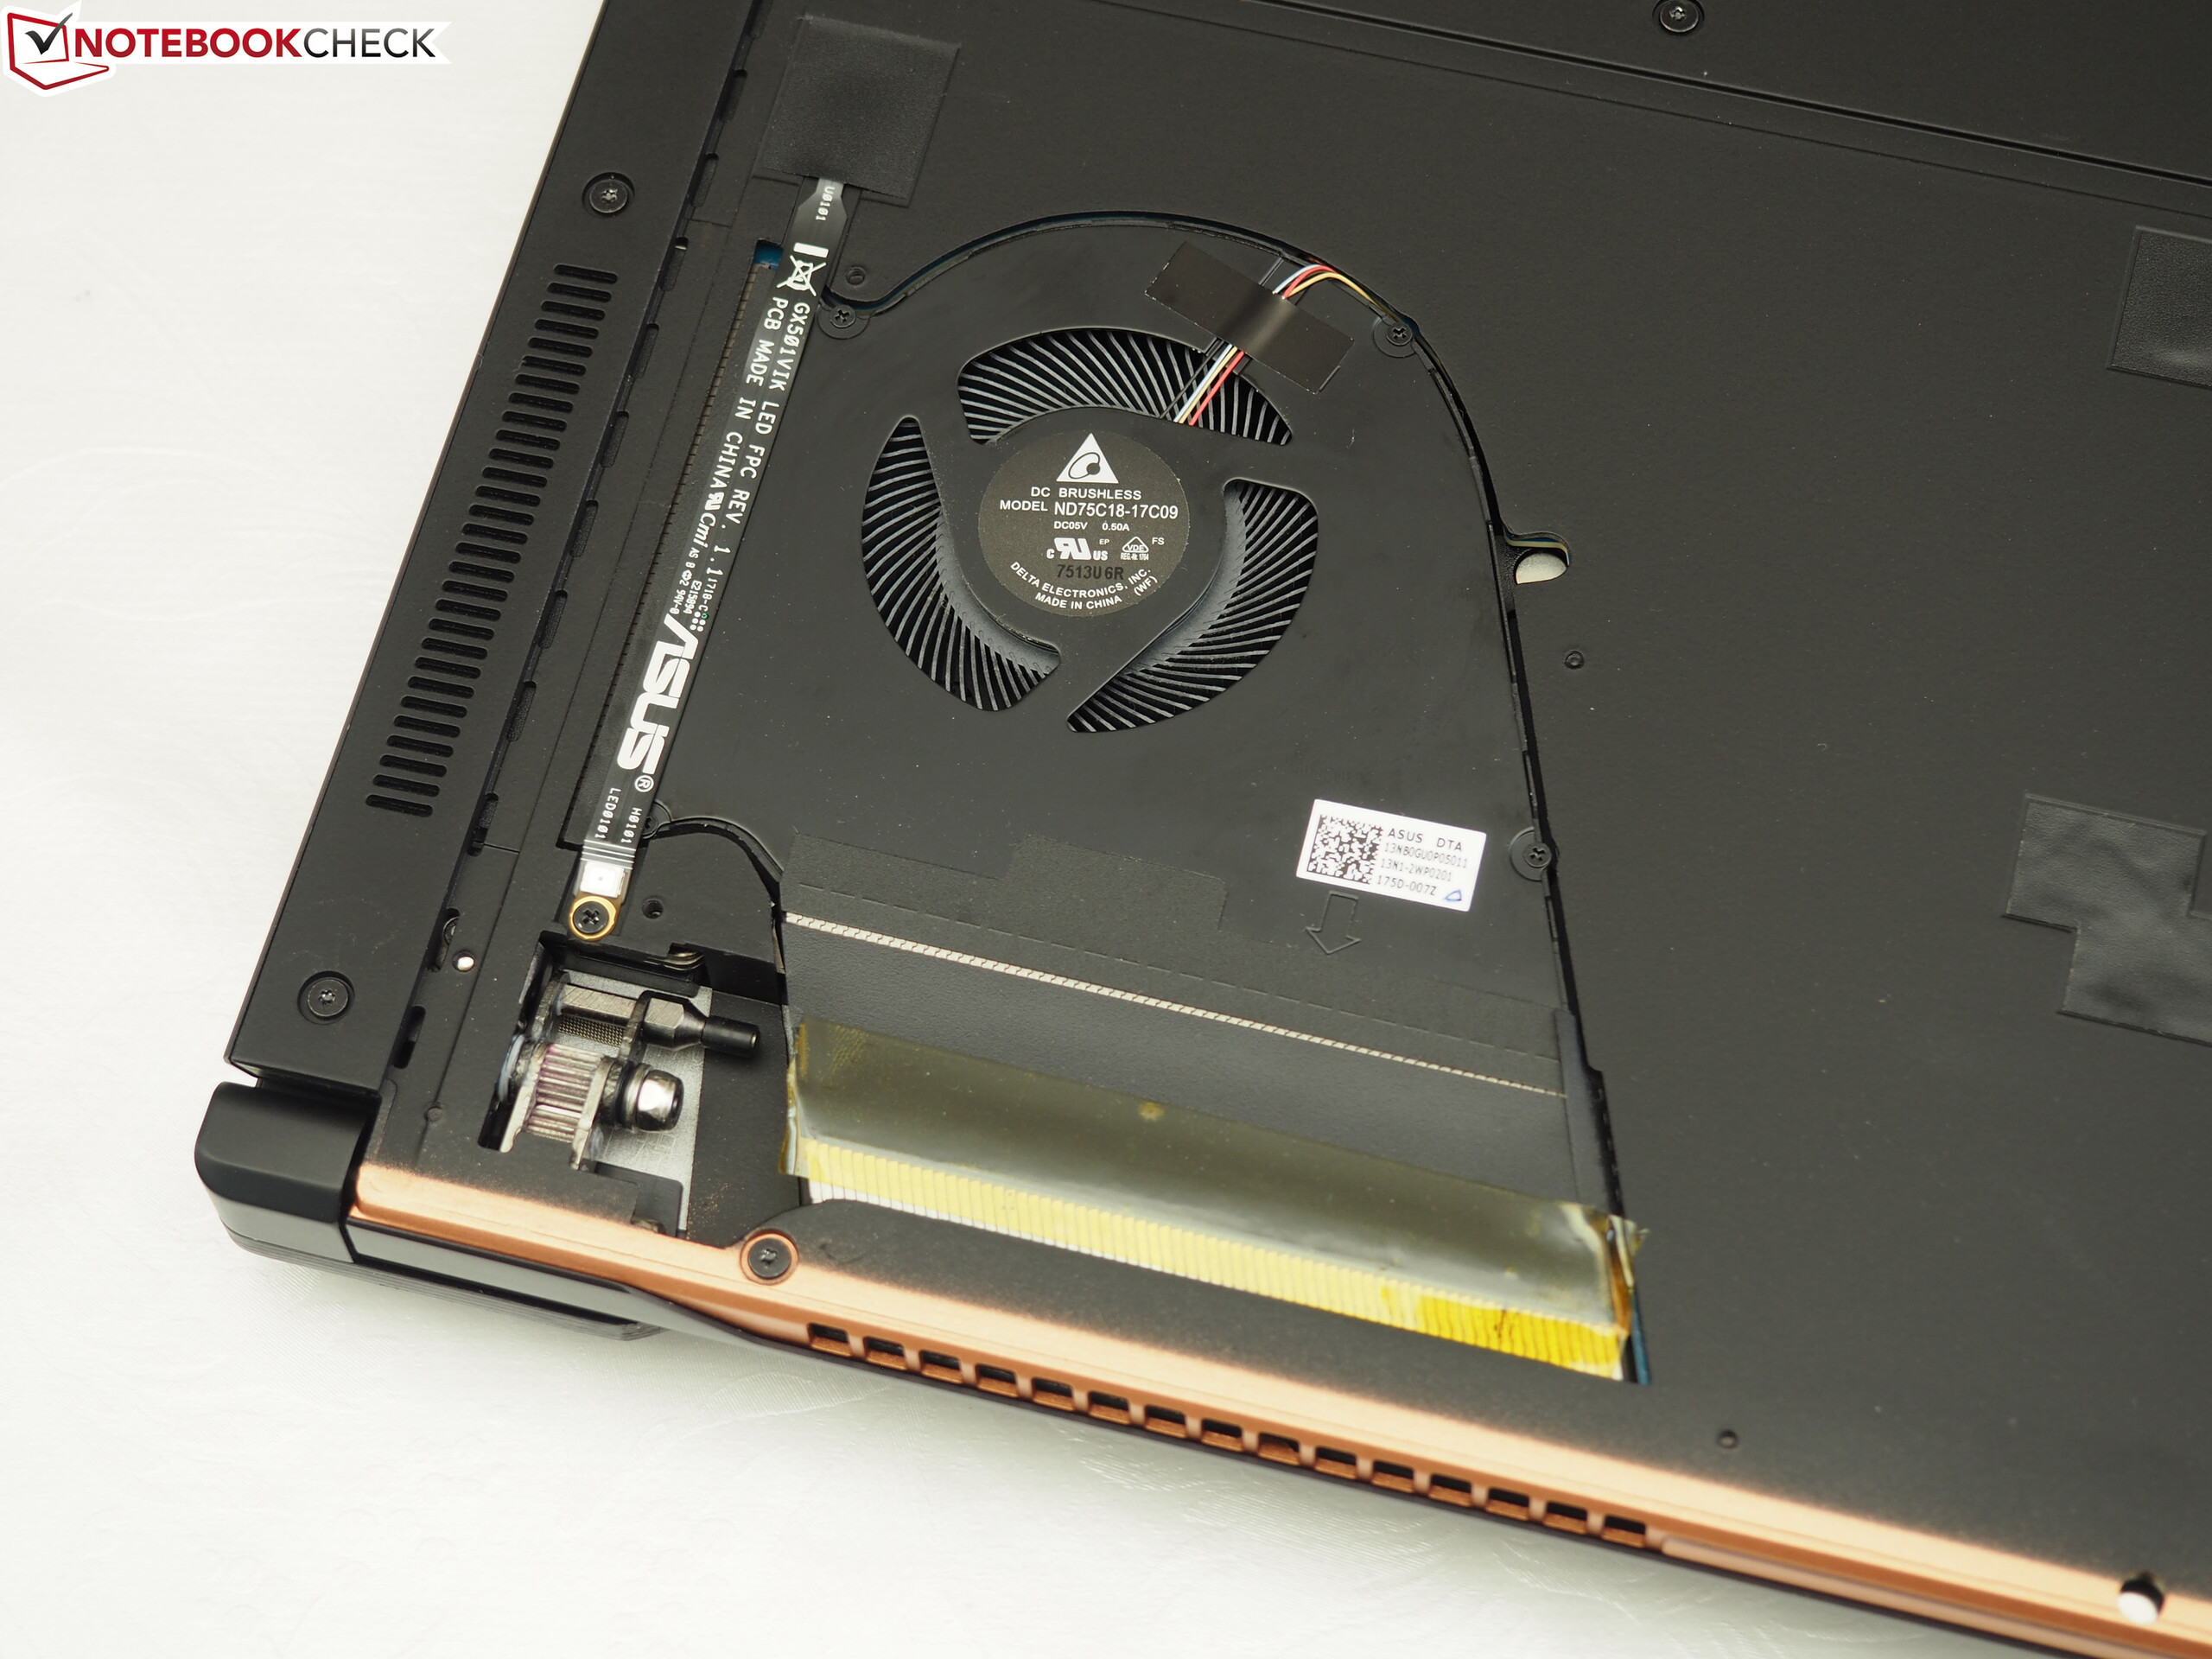
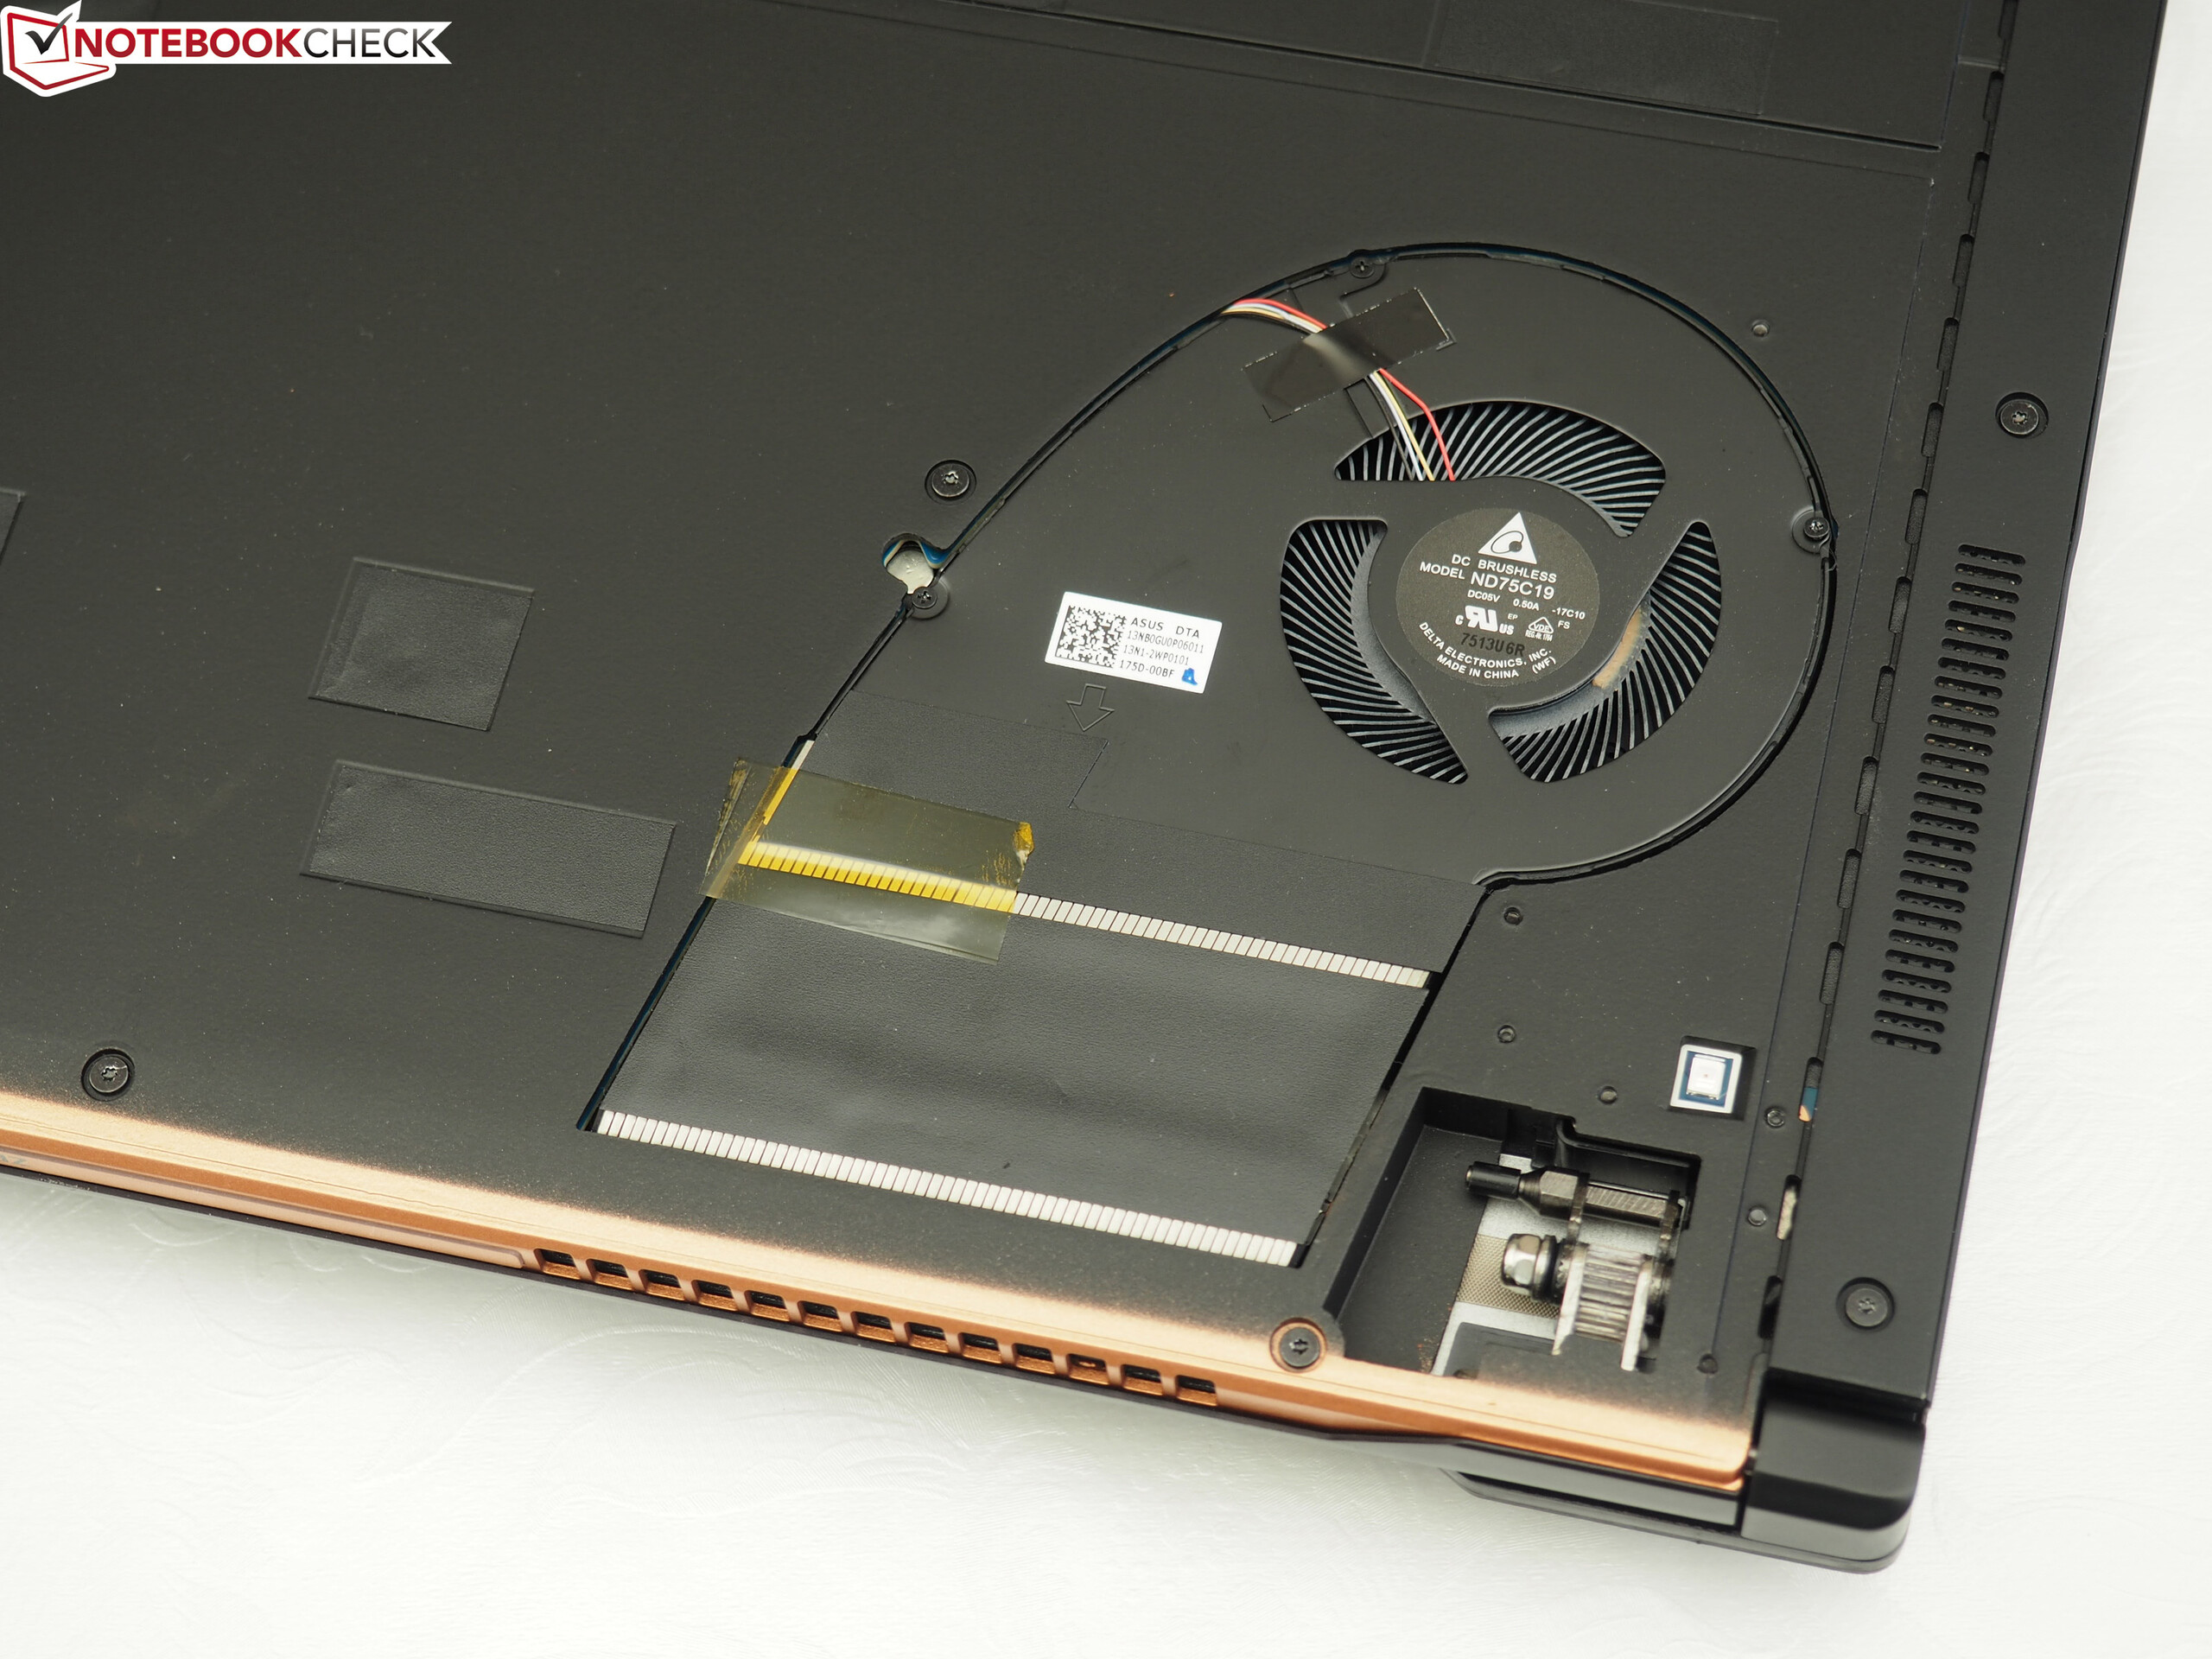
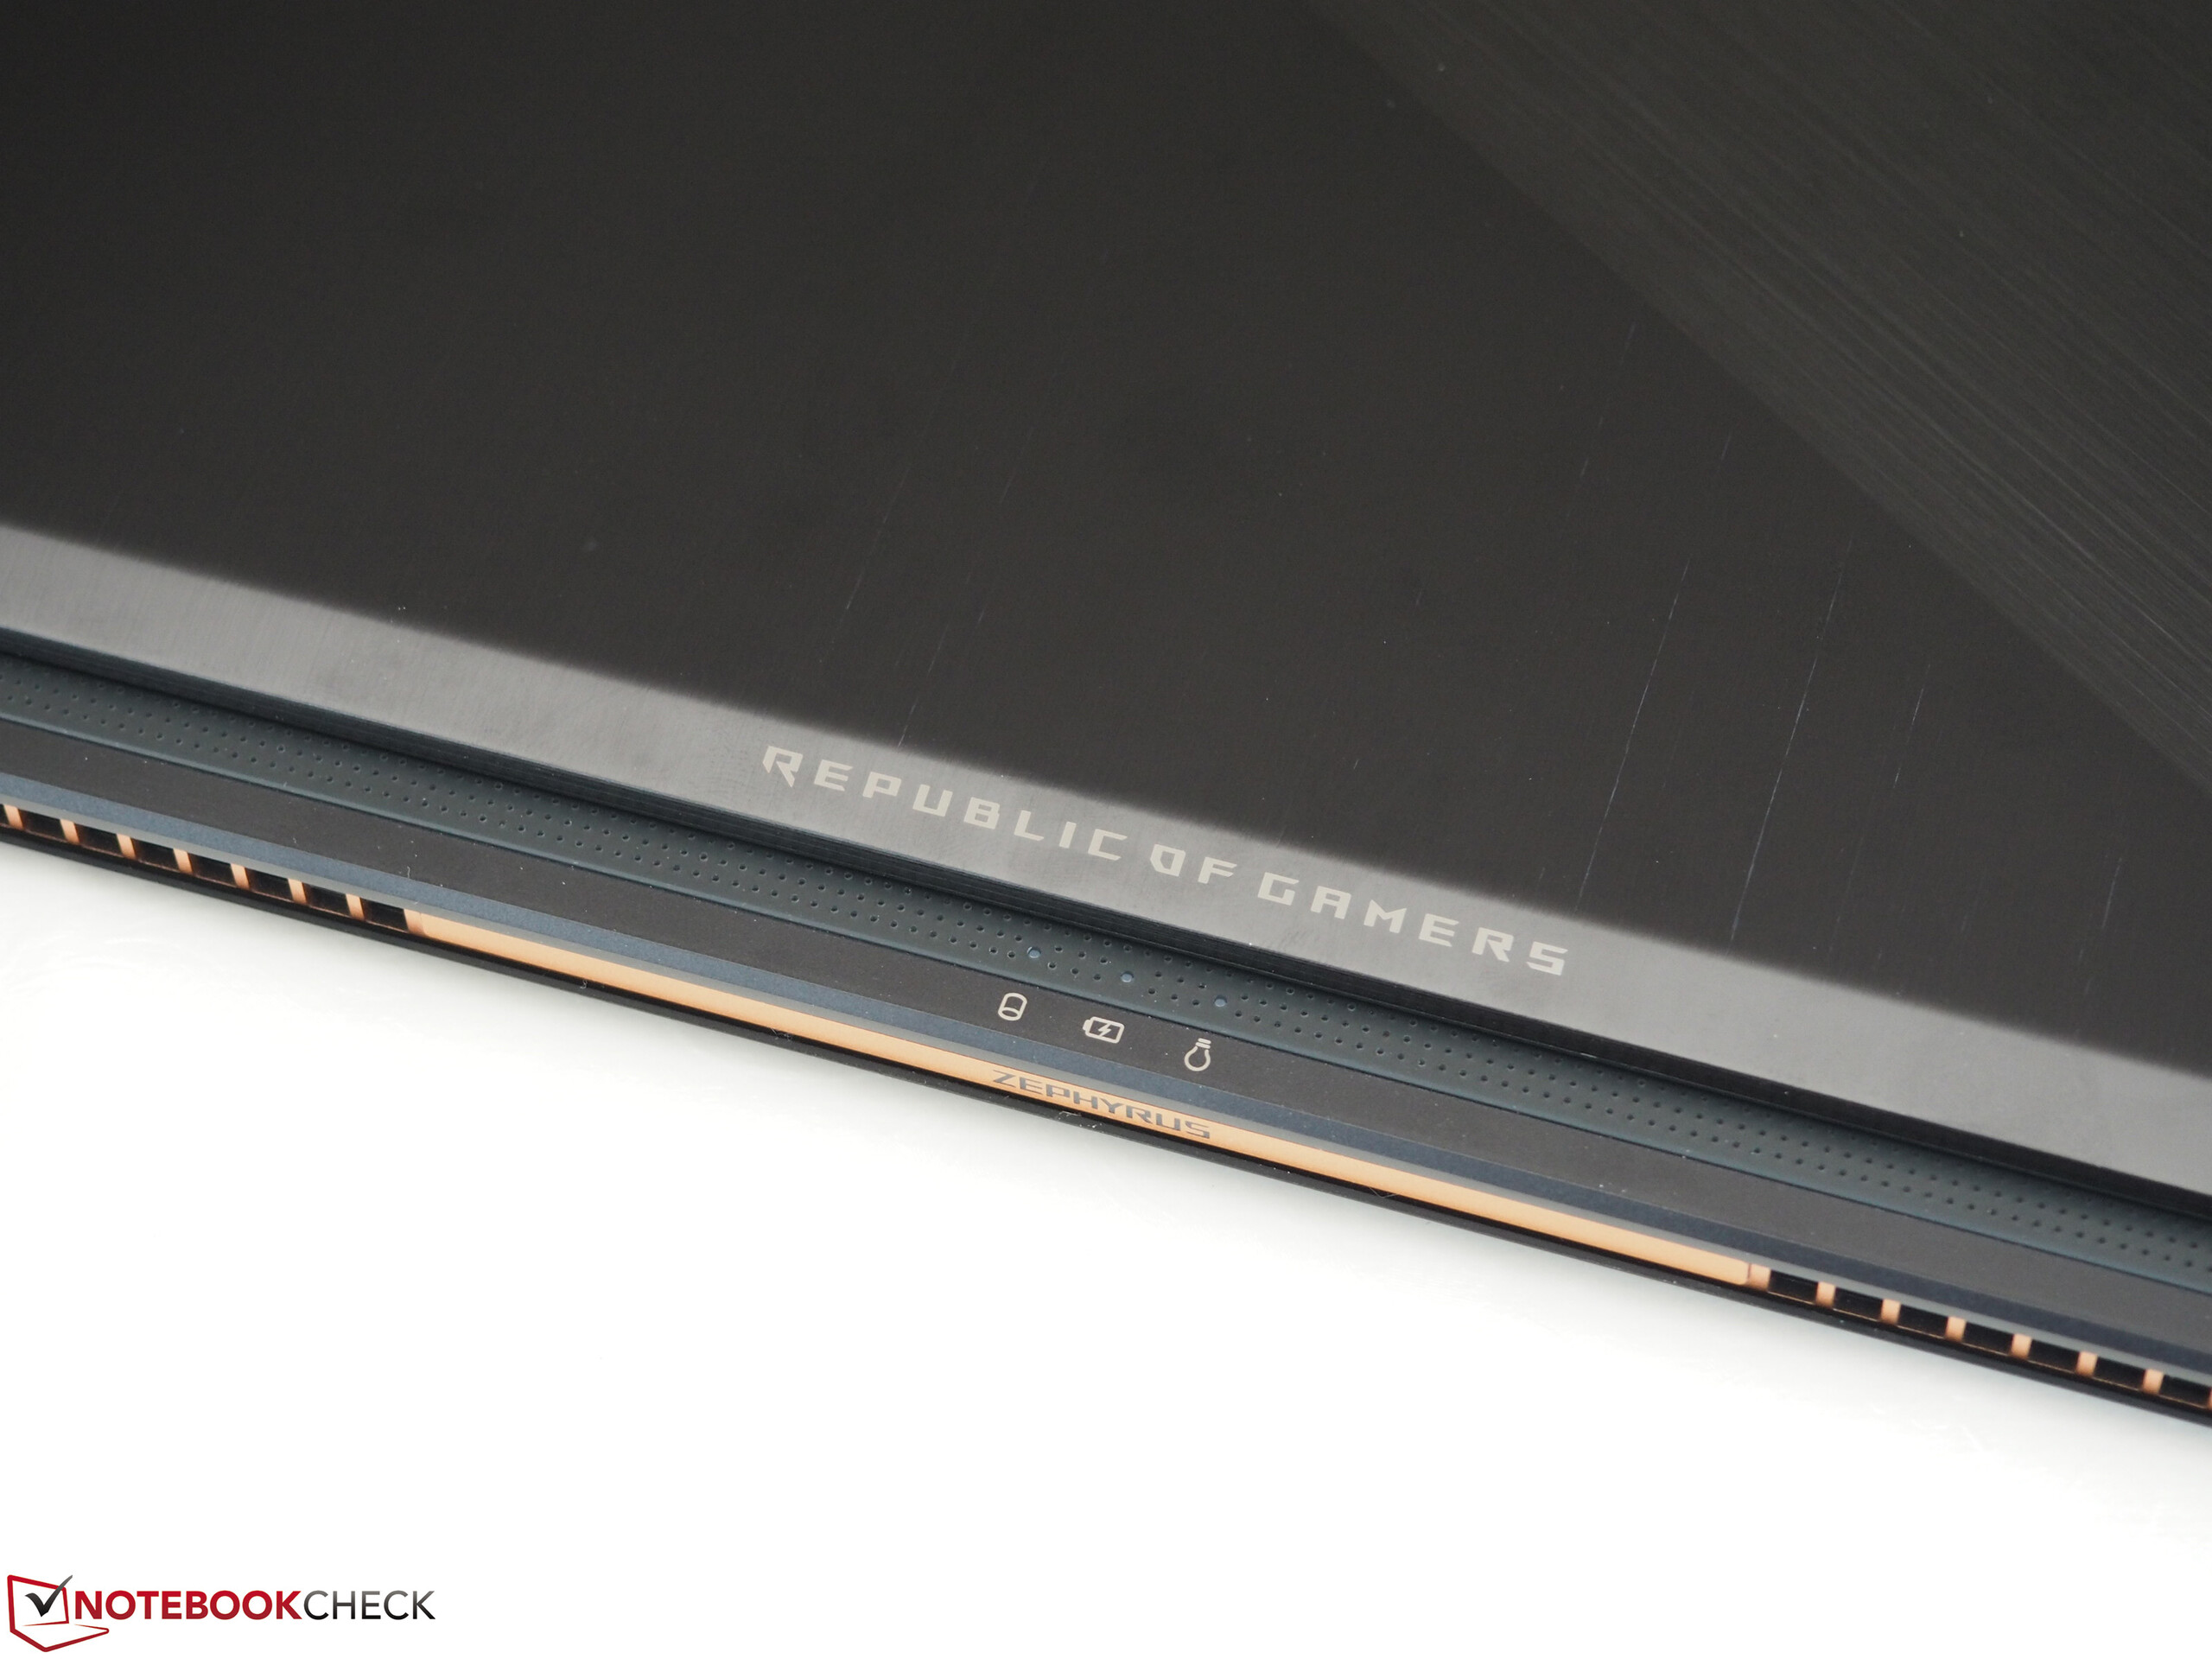
The real highlight of the Asus GX501 is visible when you open the lid. An integrated mechanism lifts the magnesium bottom plate from the base unit at the rear, so the notebook is sitting at a small angle. This brings important additional millimeters for the cooling by creating a generous surrounding opening for fresh air. The principle appears to be logical and functional, but you might accuse Asus of some cheating here since the ROG GX501 is only super-slim as long as the lid is closed.
It is comparatively easy to remove this plate, which is secured by four screws. Asus has even provided the corresponding screw driver in the box. Once the plate is removed, you can access both fans and also clean them if necessary. It is obviously possible to remove all foreign objects that might be inside. It is important that you make sure there are no objects in the gap before you close the lid, otherwise you could damage the laptop. The upgrade options are very limited since the access to all the other components requires a complicated dismantling and should not be performed by users.

You can see a big difference compared to typical desktop replacements with the GTX 1080 (like the Asus G701VIK). Considering the chassis height of almost 1.8 cm (~0.7 in) and a weight of around 2.25 kg (~4.9 lb), you can find suitable rivals in our Multimedia Top 10 and the mobile Gaming Top 10 lists. These include models such as the Gigabyte Aero 15 or the MSI GS63VR, which are also slimmer than 2 cm (~0.8 in). We will also use the Asus FX502VM, the Alienware 15 R3 and the Schenker XMG P507 as comparison devices. They are between 2 and 3 cm (~0.8 to ~1.2 in) high, but are limited to the GeForce GTX 1060 or GTX 1070.
Note: We spotted some build quality defect on our test model. The front edge of the bottom panel is not perfectly even, and the bottom edge of the HDMI port was bent or slightly cracked, respectively.
Connectivity
Ports
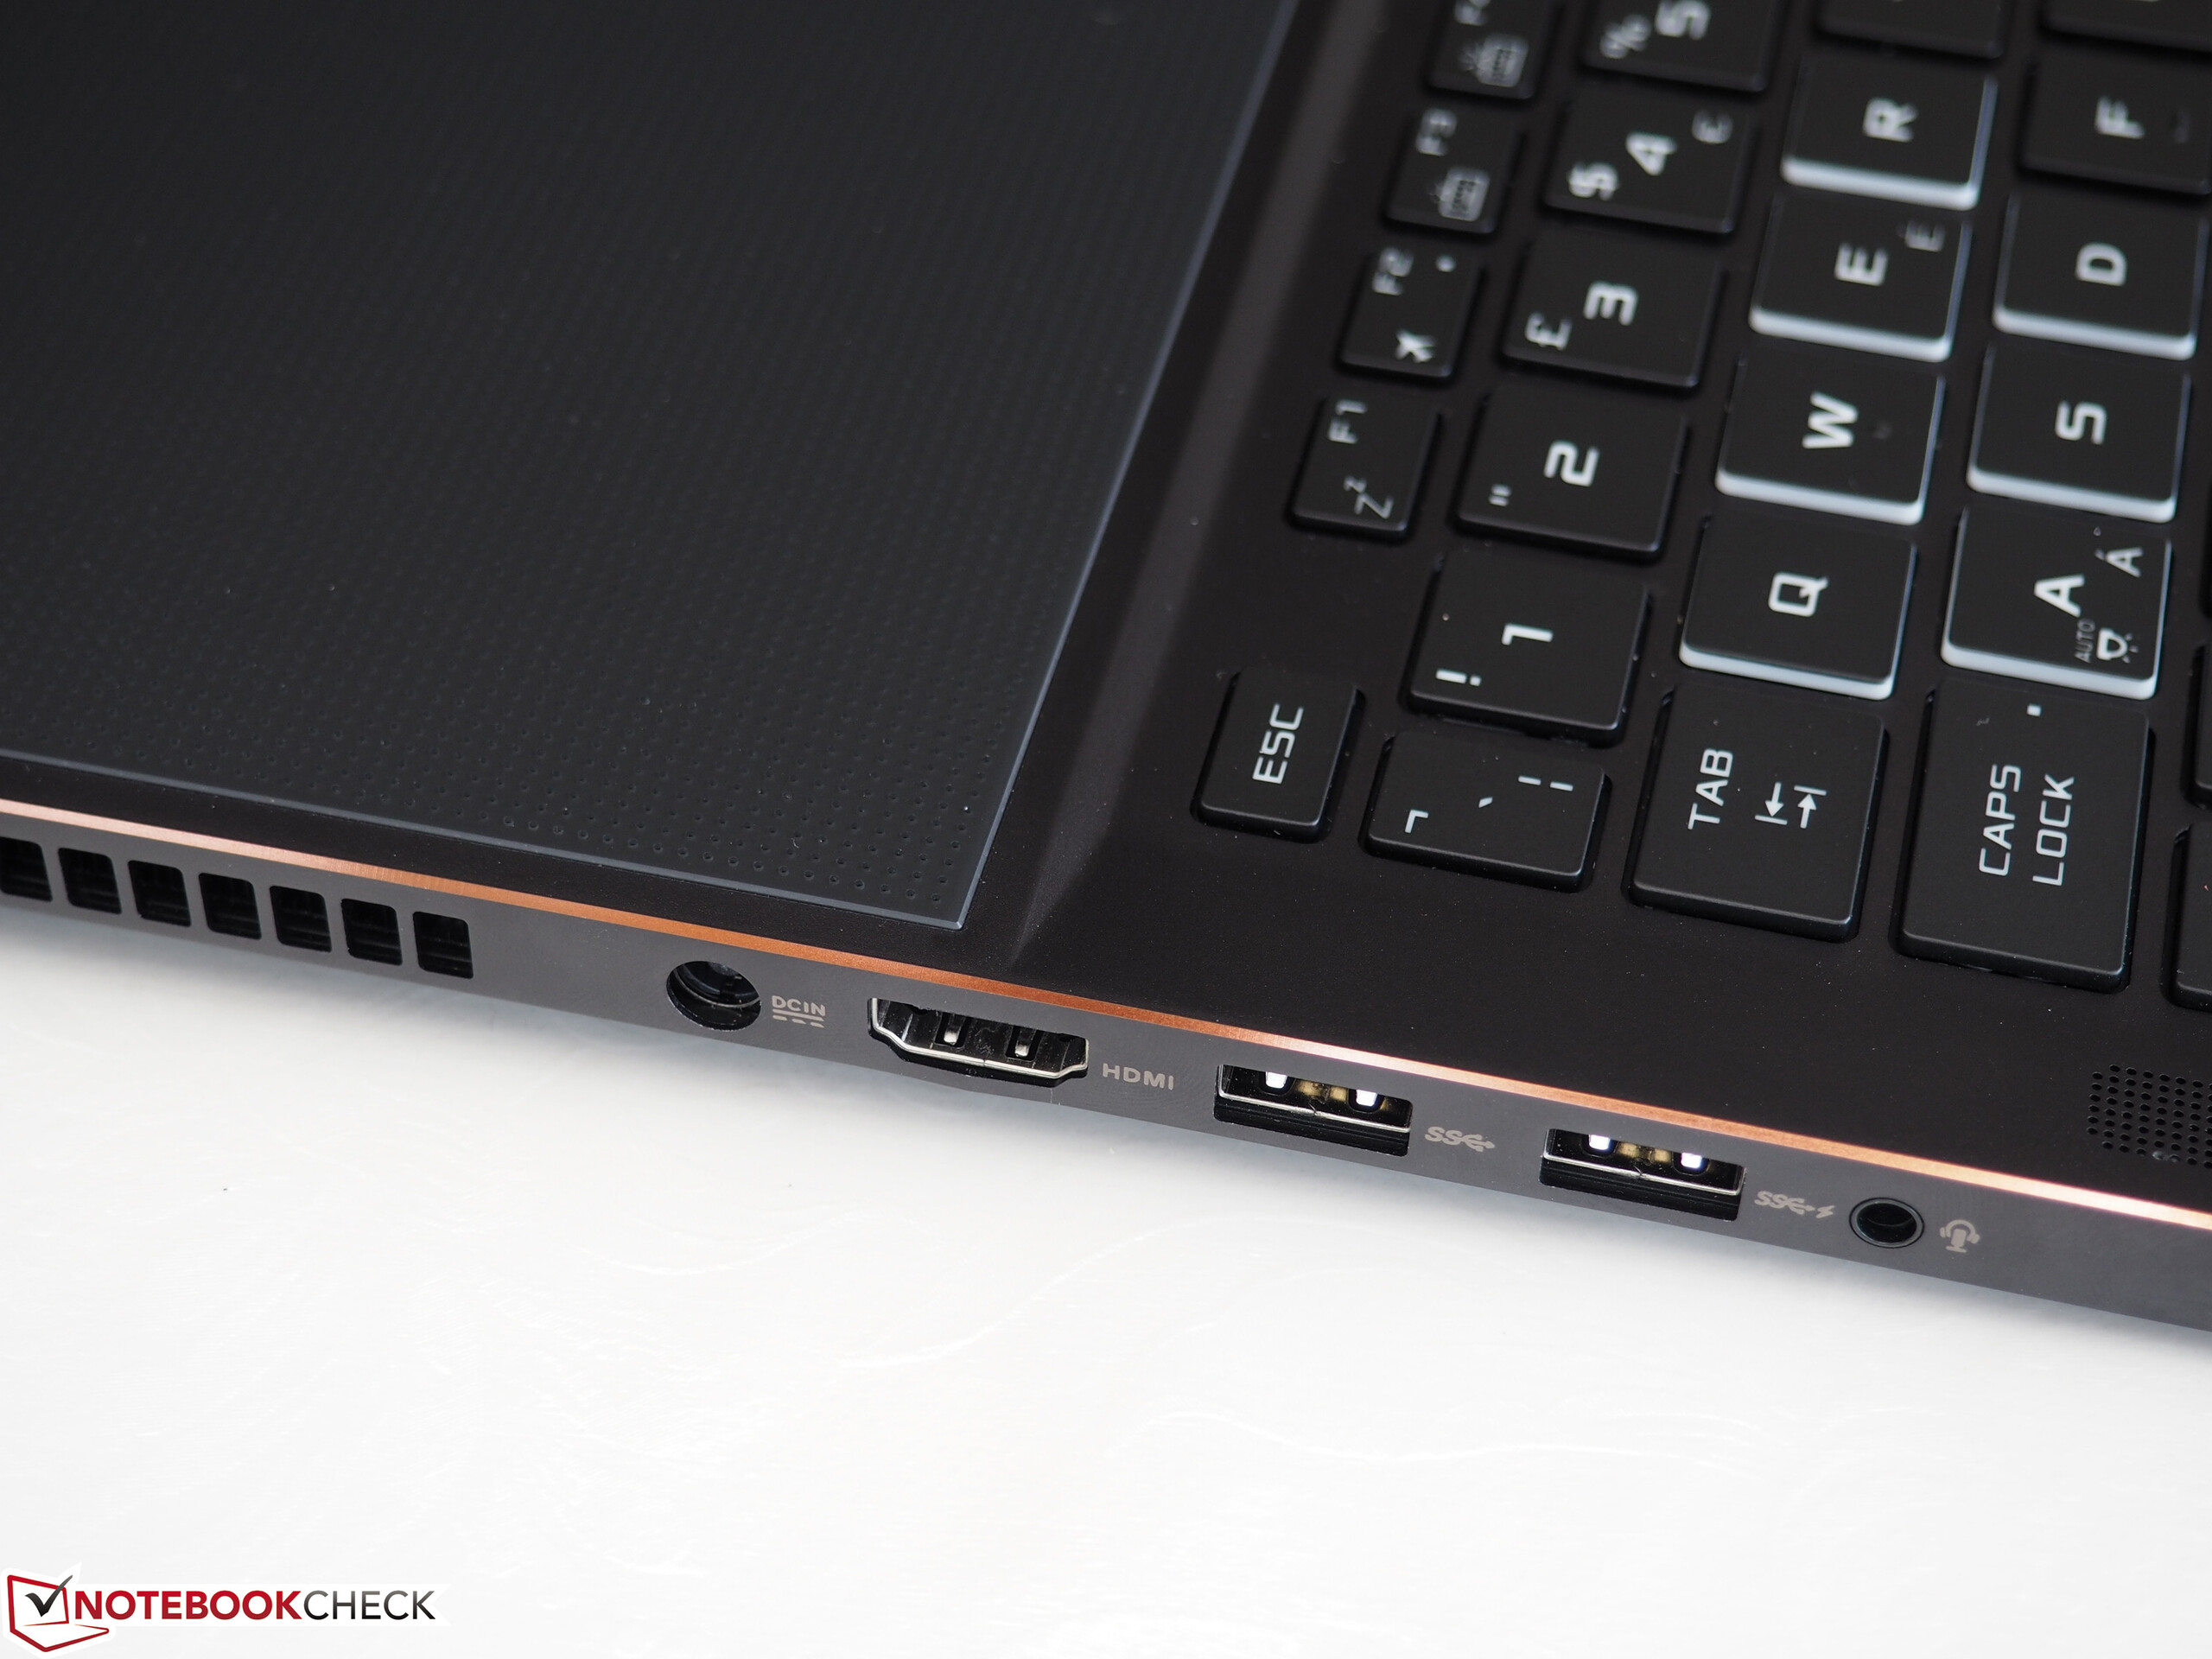
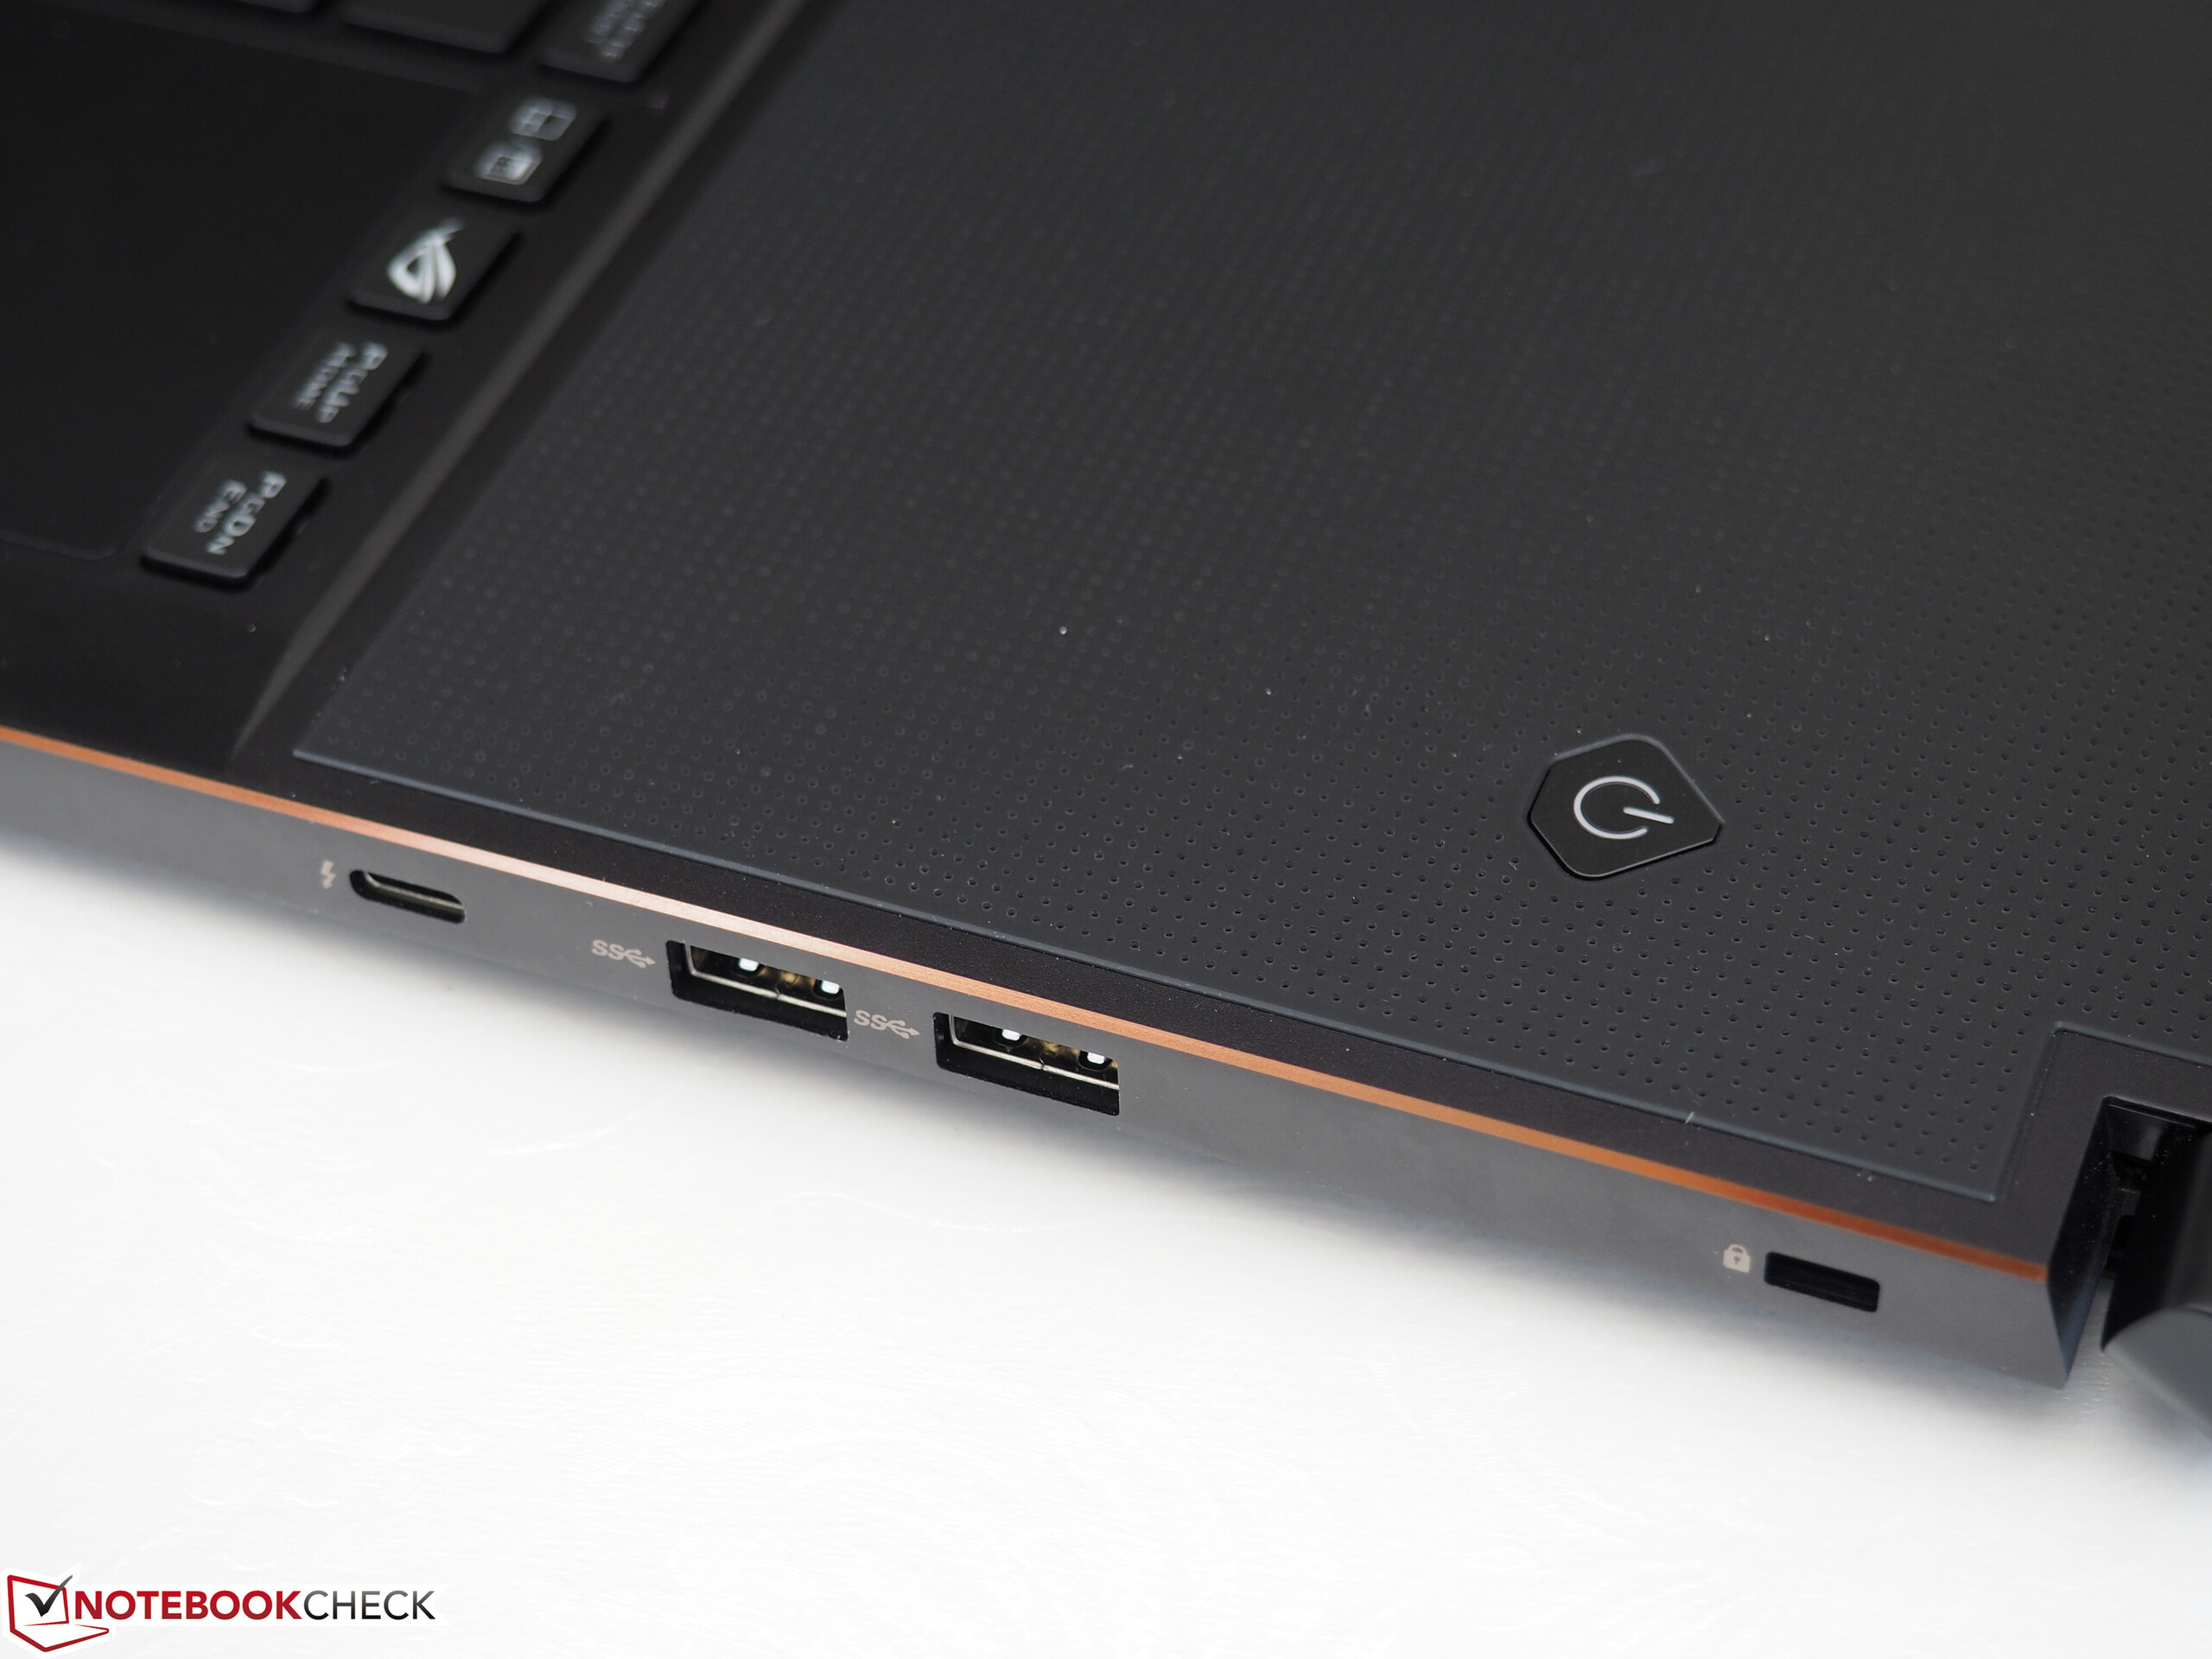
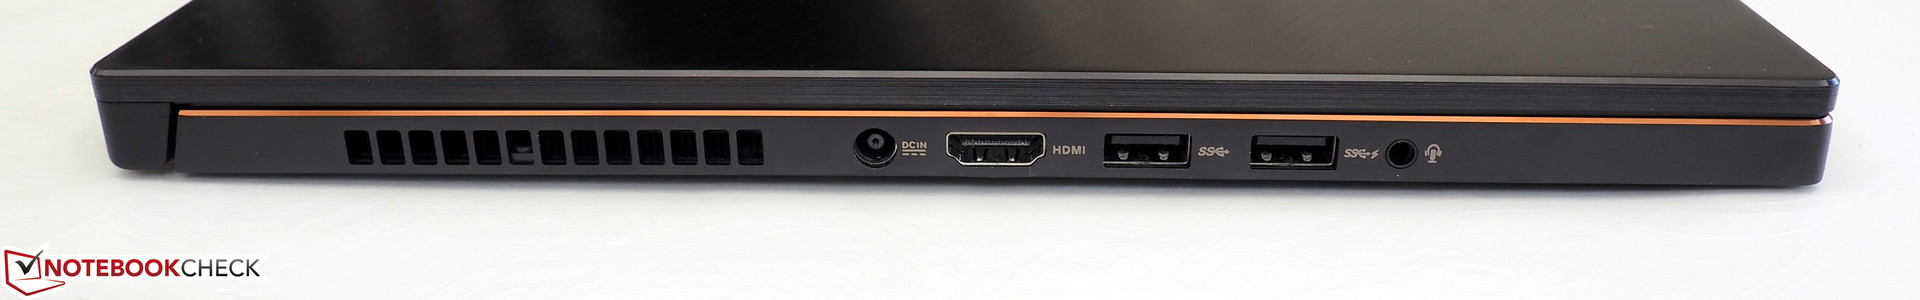
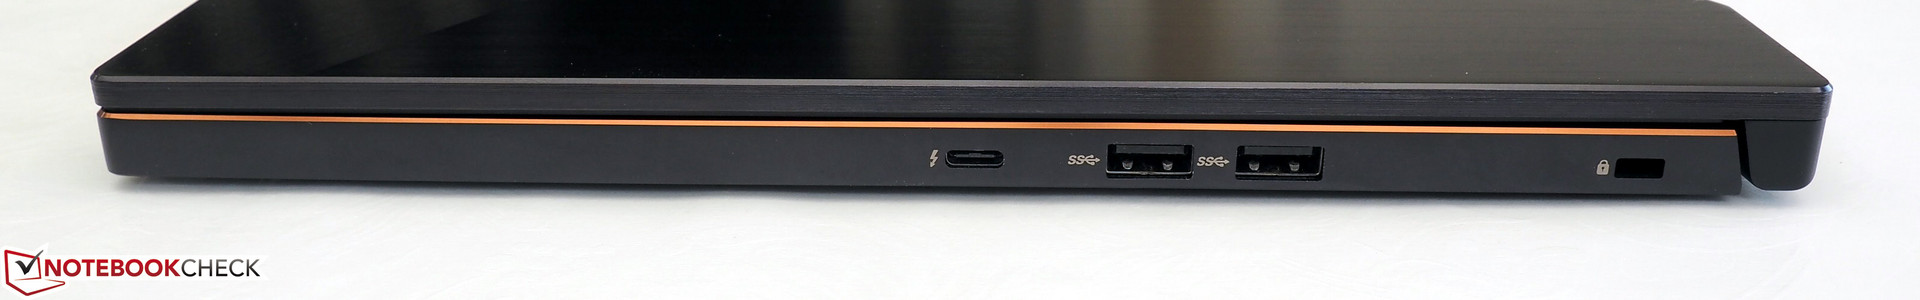
The port variety is decent considering the slim form factor. While we get a fan exhaust, the power input, HDMI 2.0, two USB 3.0 ports and one combined stereo jack for headphone sand microphones (we would have preferred separate connectors) on the left side, there is one Thunderbolt 3 ports (also supports DisplayPort and USB 3.1 Gen. 2), two more USB 3.0 ports and a slot for a Kensington Lock on the right. Potential buyers will have to do without a card reader, an RJ45-LAN port as well as a conventional Mini-DisplayPort.
The port layout is convenient for right handers in particular, but the ports should be further towards the rear for left handers with an external mouse.
Communication
Wireless communications are handled by an Intel chip. The Dual-Band Wireless-AC 8265, which supports the standards 802.11 a/b/g/n/ac and Bluetooth 4.1, can compete with the popular gaming modules Killer Wireless-n/a/ac 1435 and 1535, respectively, in terms of receiving data, but they are faster when they transmit (compare table). Our test is performed at a distance of 1 meter (~3 ft) to the router. There were no problems during the review period and we had no problem accessing the Internet, even through several walls (around 180 to 300 Mbps @10 meters/~33 ft).
Accessories
The box content is rather generous for a notebook. Not only do you get the aforementioned screw driver, but also a quick-start guide, warranty manual as well as an adapter for USB 3.0 to RJ45, which is a good solution considering the lack of a dedicated Ethernet port. Our test model is also shipped with a nice gaming mouse called Strix Impact, as well as a rubberized external palm rest. The latter makes the typing experience much more comfortable since the keyboard (similar to the MSI GT83VR) is sitting right at the front. This was probably necessary to keep the GTX 1080 Max-Q cool in such a slim construction.
Warranty
The warranty period in Germany and Austria is 24 months (pick-up & return service). Please see our Guarantees, Return policies and Warranties FAQ for country-specific information.
Software
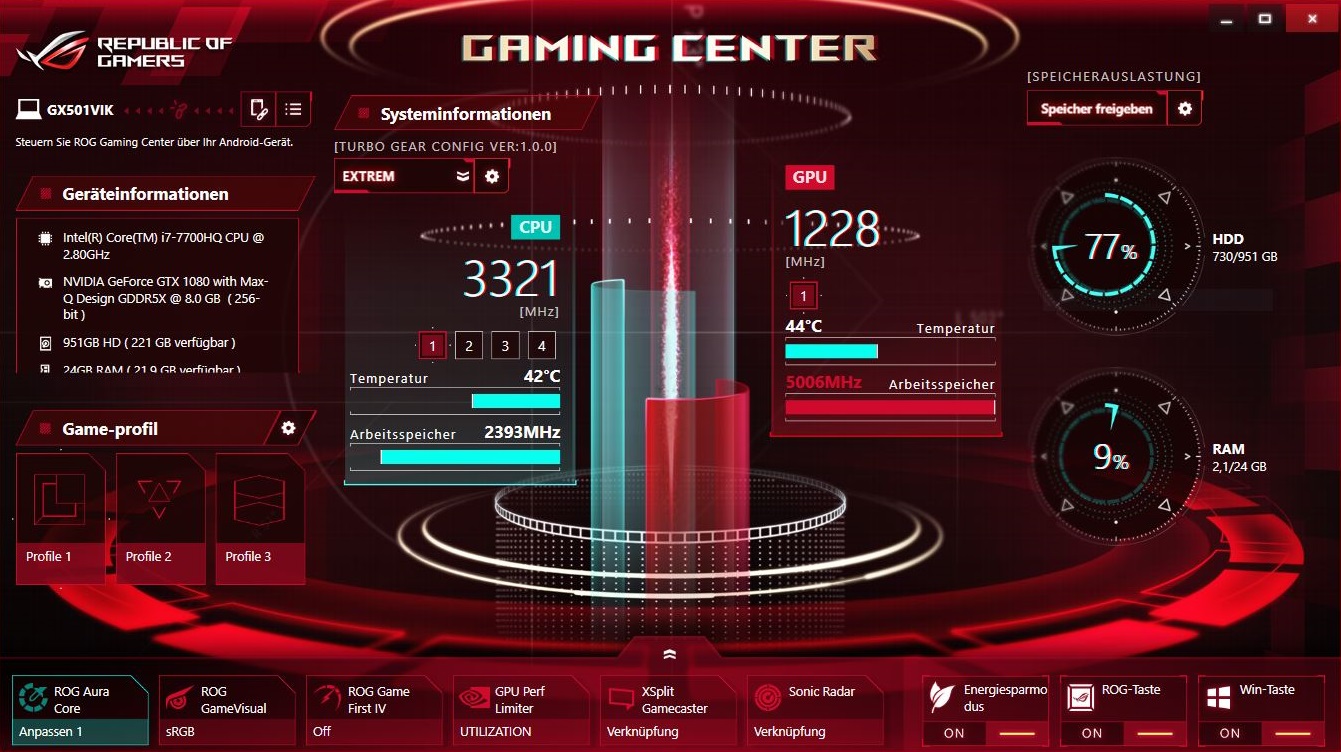
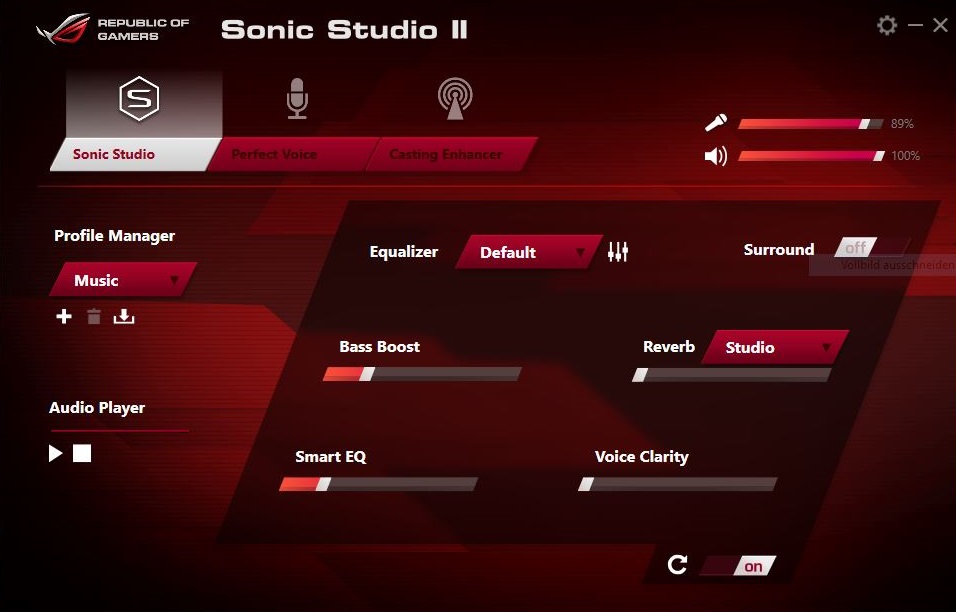
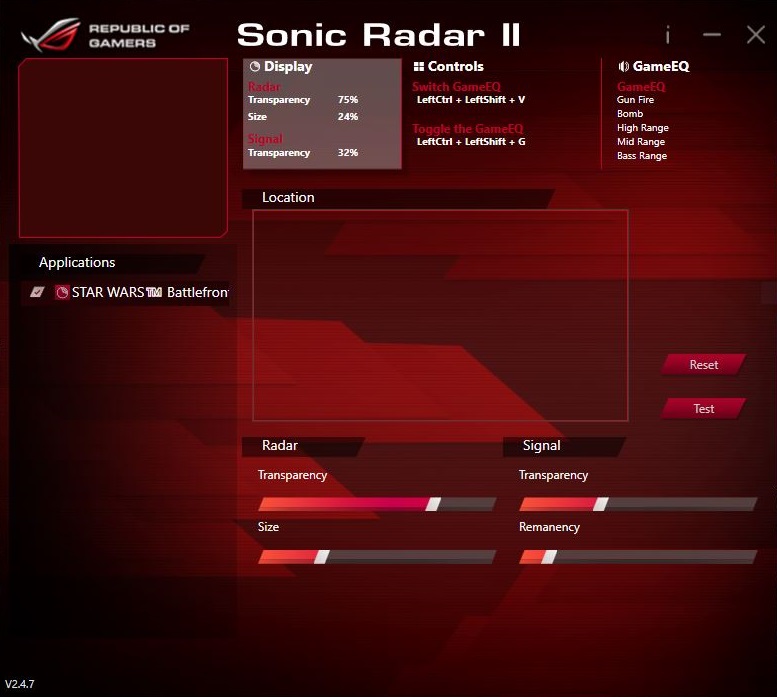
The main software addition is the powerful Gaming Center, which combines several sub applications and tools such as ROG Aura (configuration of the keyboard illumination), Sonic Studio II (Sound adjustment) and Sonic Radar II (better tracking of enemies in games).
The most important element is called Turbo Gear. It is a tool for optional overclocking. While the Standard mode of the GX501 (which we use for our tests) uses the default clocks, the clock of the GeForce GTX 1080 Max-Q is overclocked by around 5% from 1227-1336 to 1297-1436 MHz in the Extreme mode. This is not a huge bump and the effect on the system noise as well as the performance is also limited. The 3DMark 11 GPU score is only 3% higher (24169 vs. 23540 points).

Input Devices
Keyboard
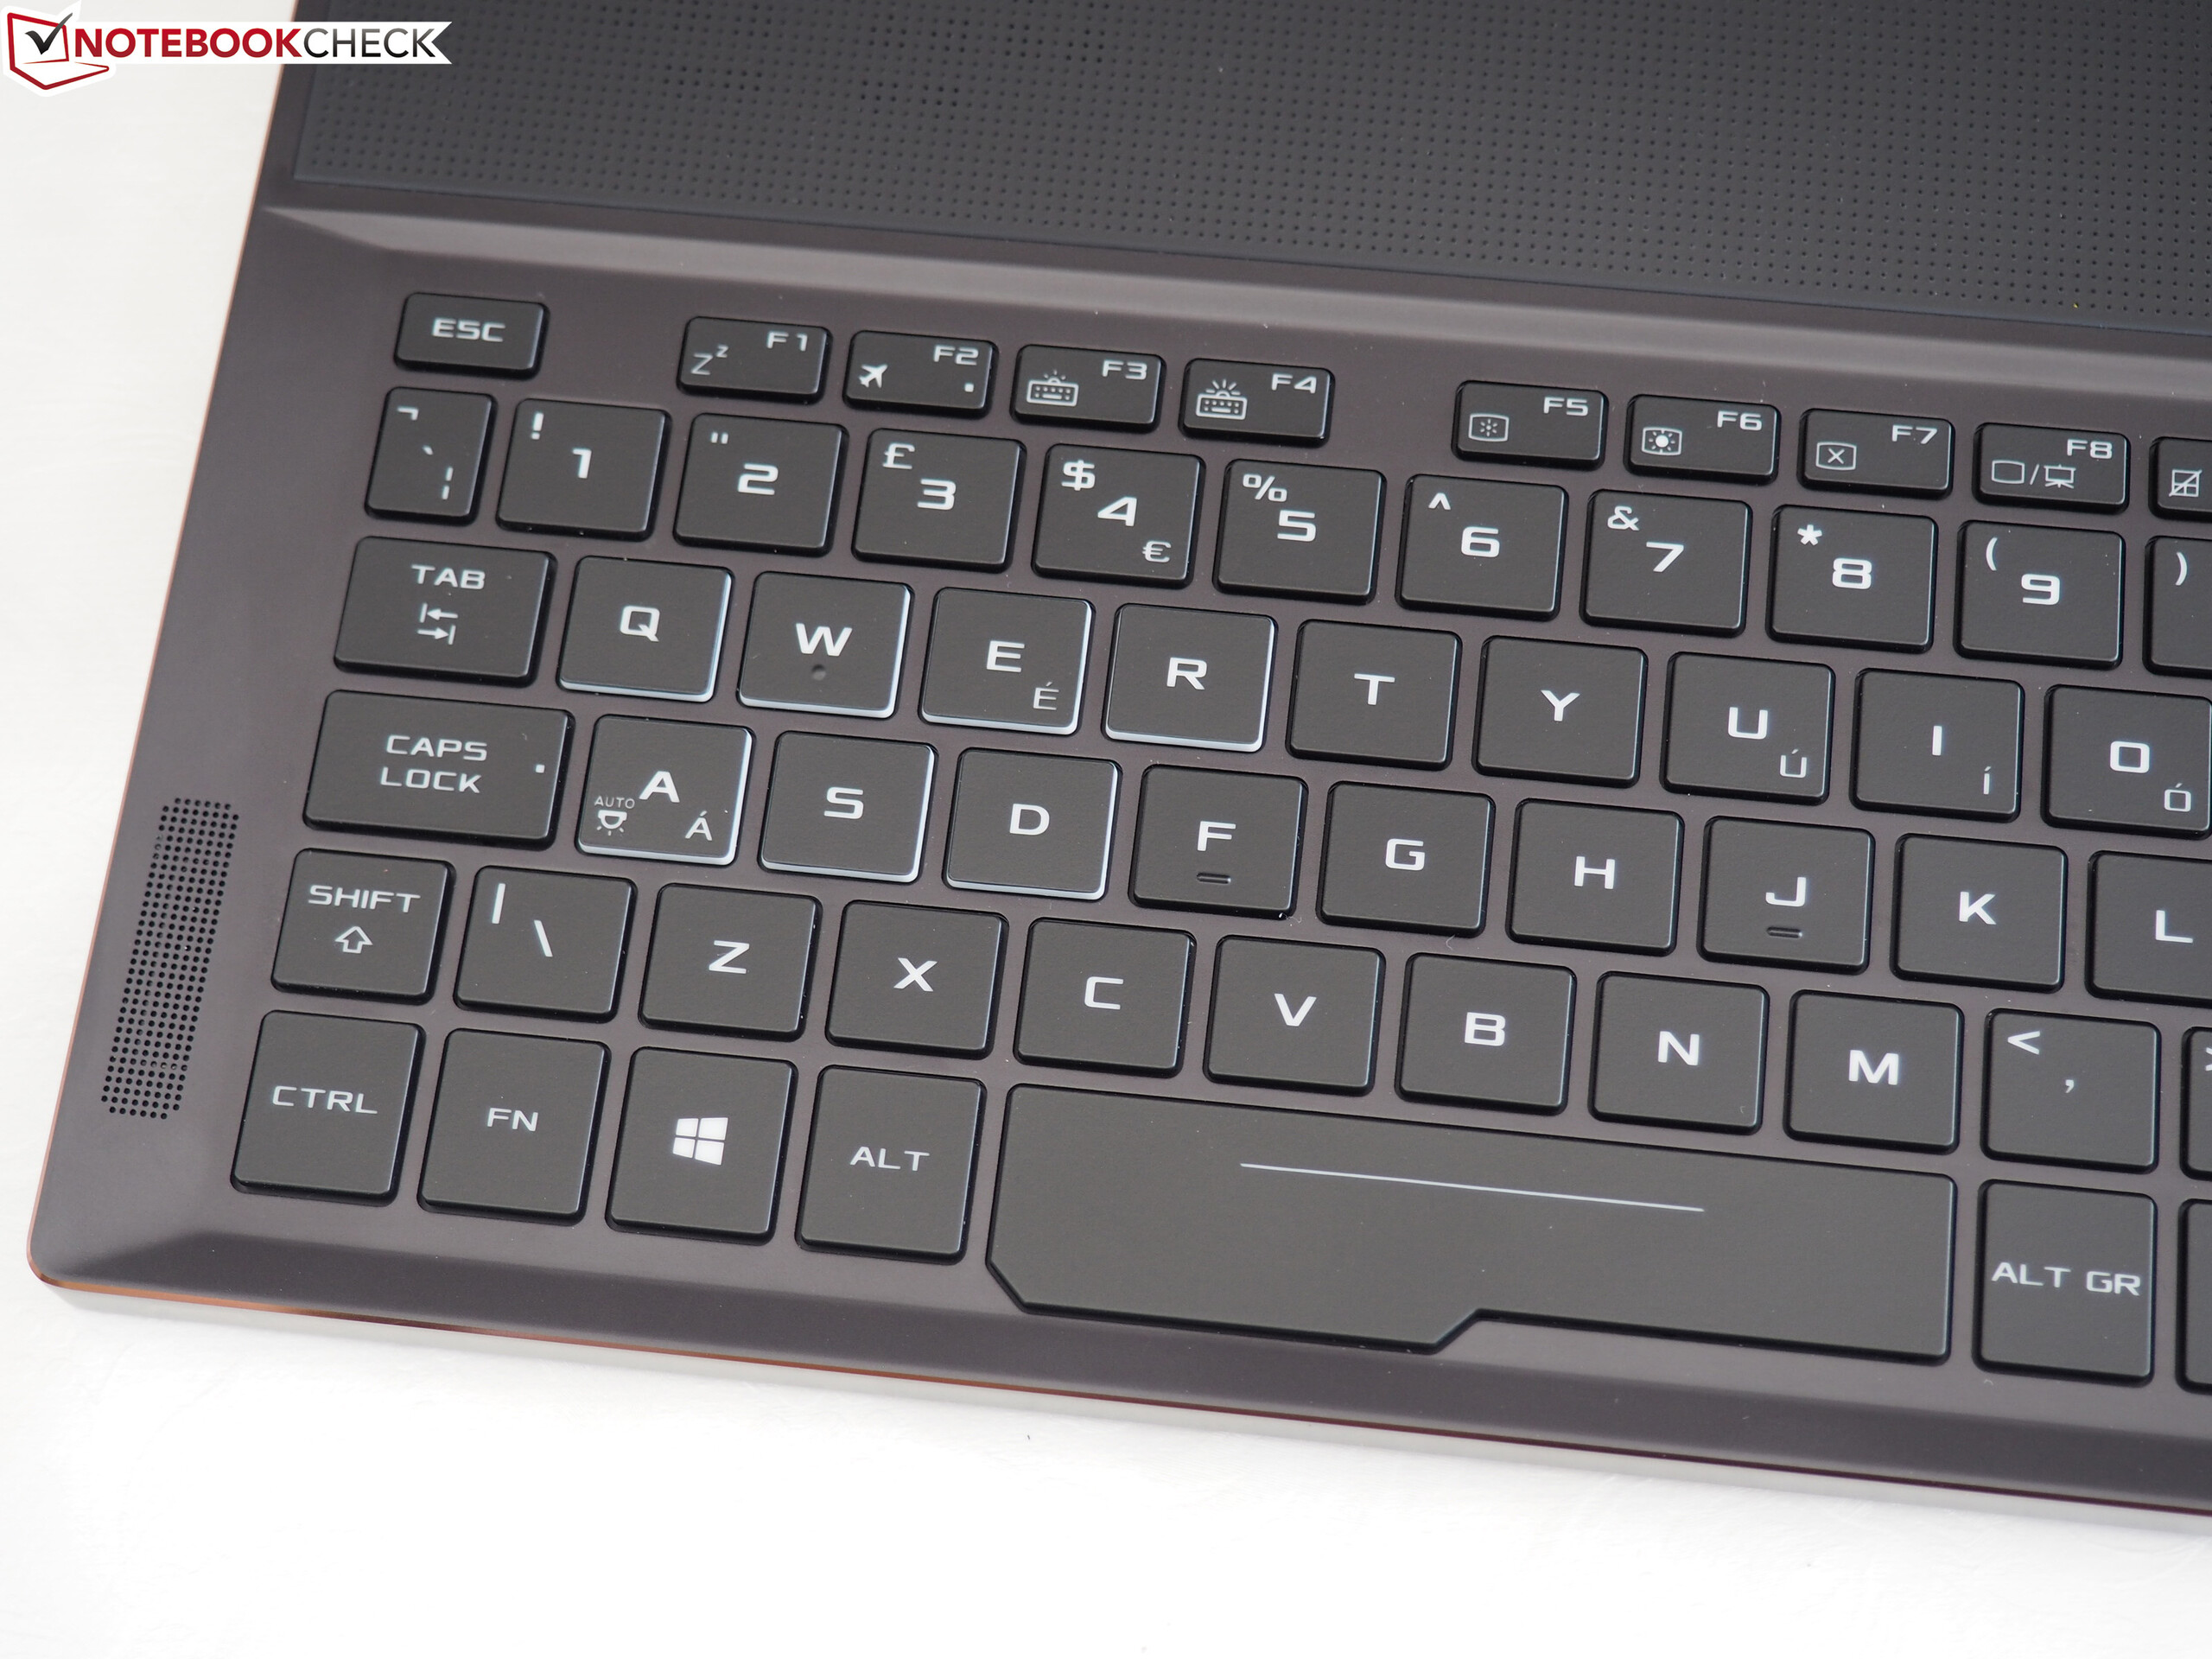
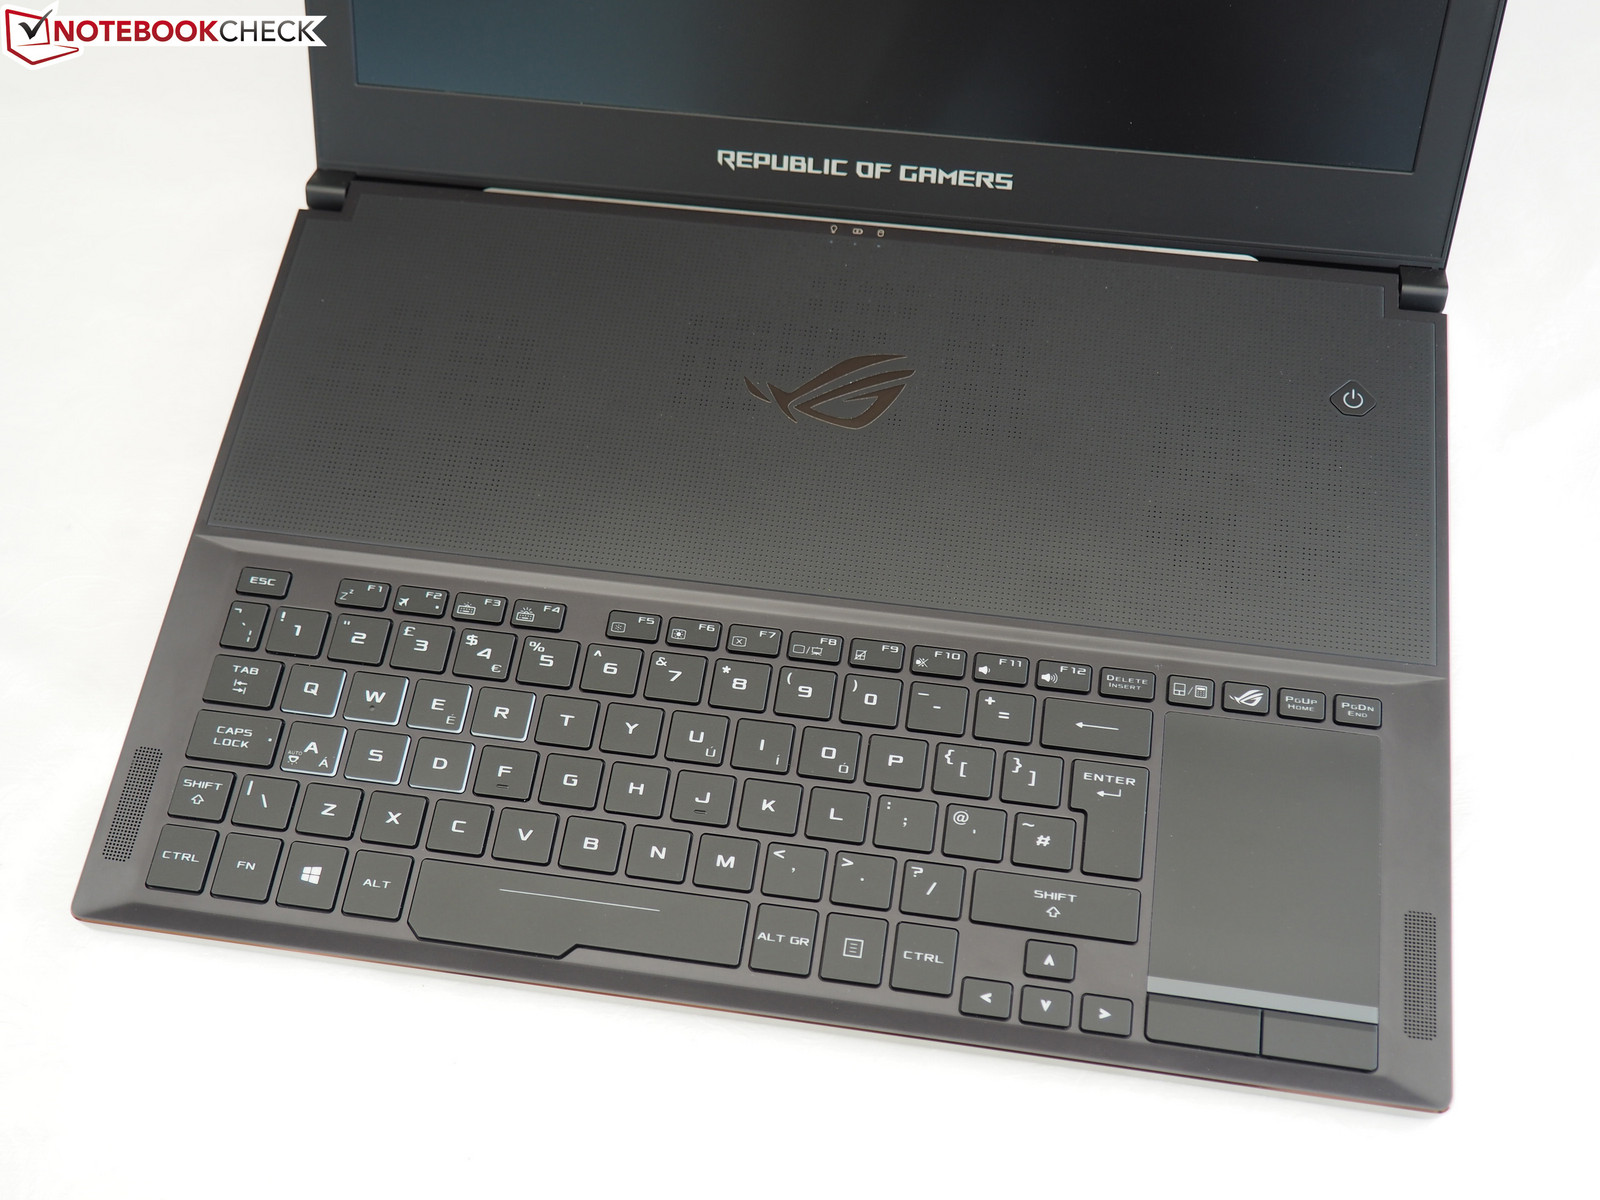
The keyboard is one area where you definitely notice the slim construction. The key travel is very shallow and the layout is a matter of taste as well. The strange grouping of the F-keys (F1 to F4 are separated, the rest are not) was a bit annoying, just like the combined Ins/Del and the lack of a Print key. Our final test model was equipped with a U.K layout (picture on the right), while the model on the preview event featured the U.S. layout (picture on the left).
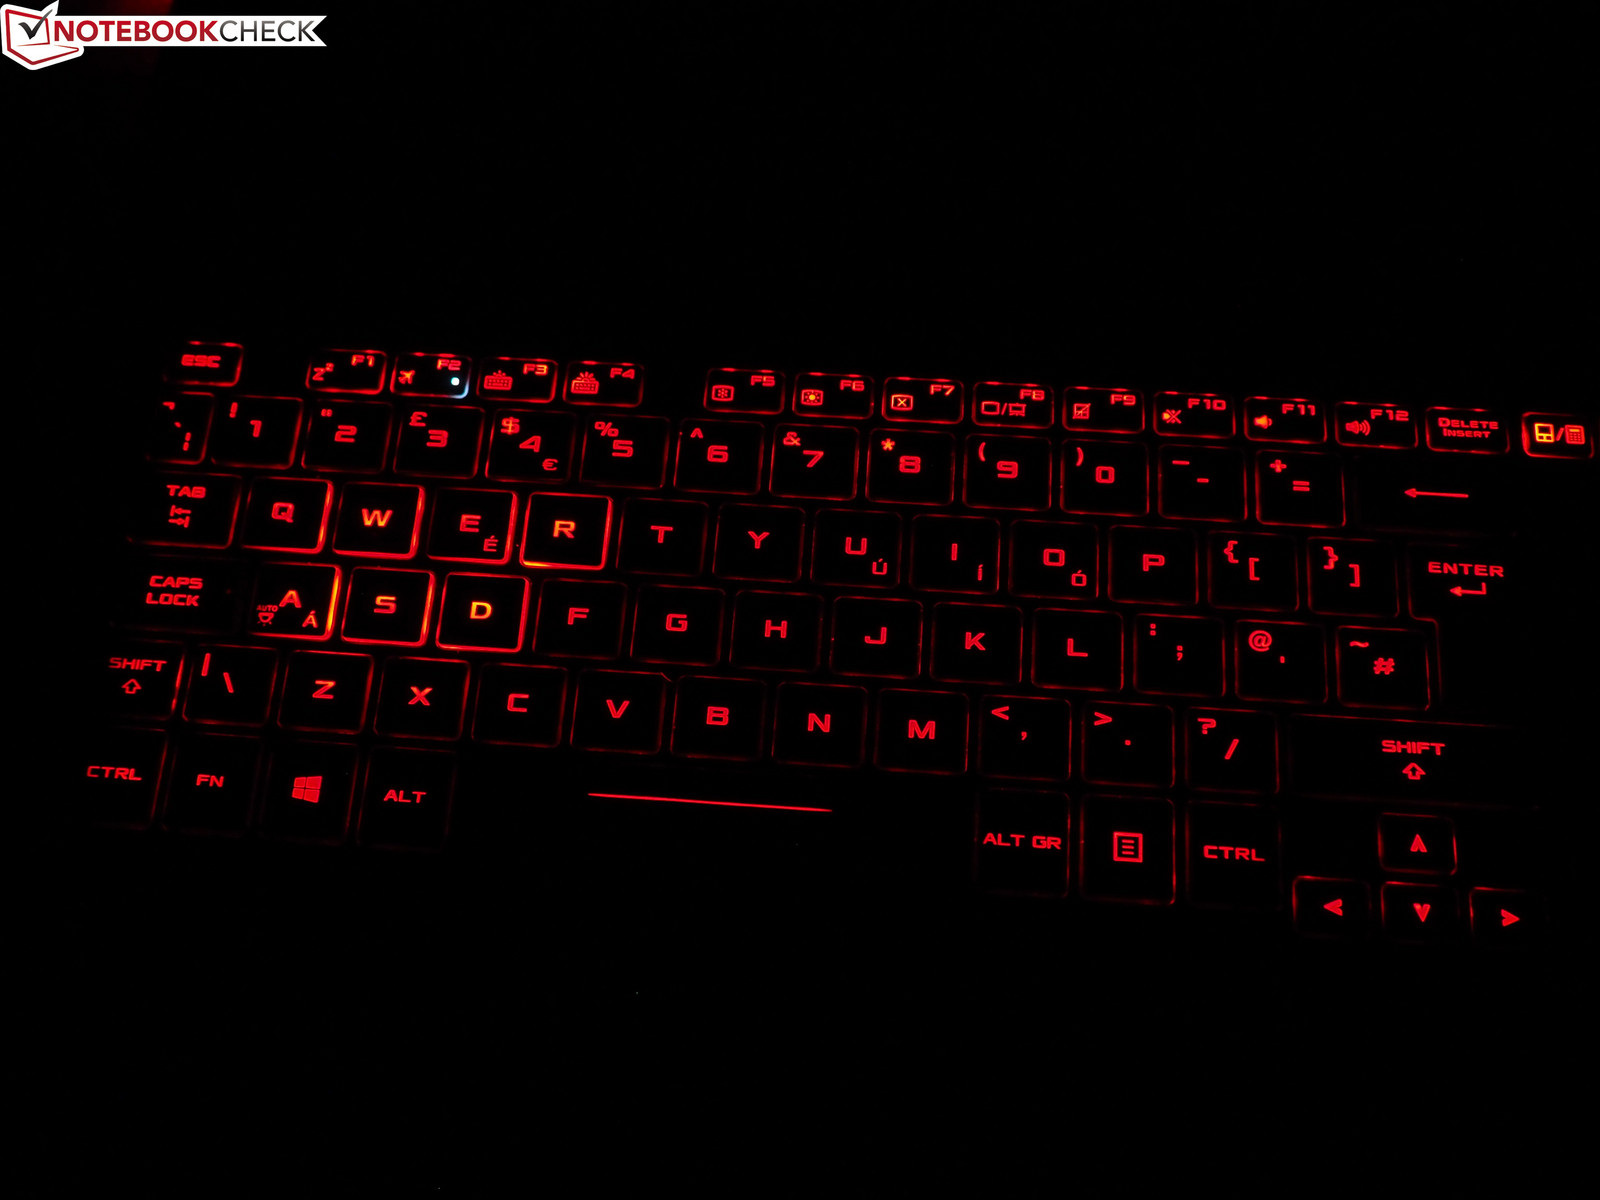
The Zephyrus also features an RGB background illumination, which – as mentioned before – can be adjusted via software (special marking of the WASD or QWER areas possible) and there are also some effects (static, pulsating & color changes). We are not completely happy with the feedback and the typing experience. The stability is not perfect, so the keystroke is not particularly precise and a bit spongy. One advantage is the moderate typing noise, which is quieter than on many other keyboards. The size of most keys is decent as well (letters & numbers: 16 x 14 mm/~0.63 x 0.55 in); only the directional keys are too small for gaming.
Touchpad
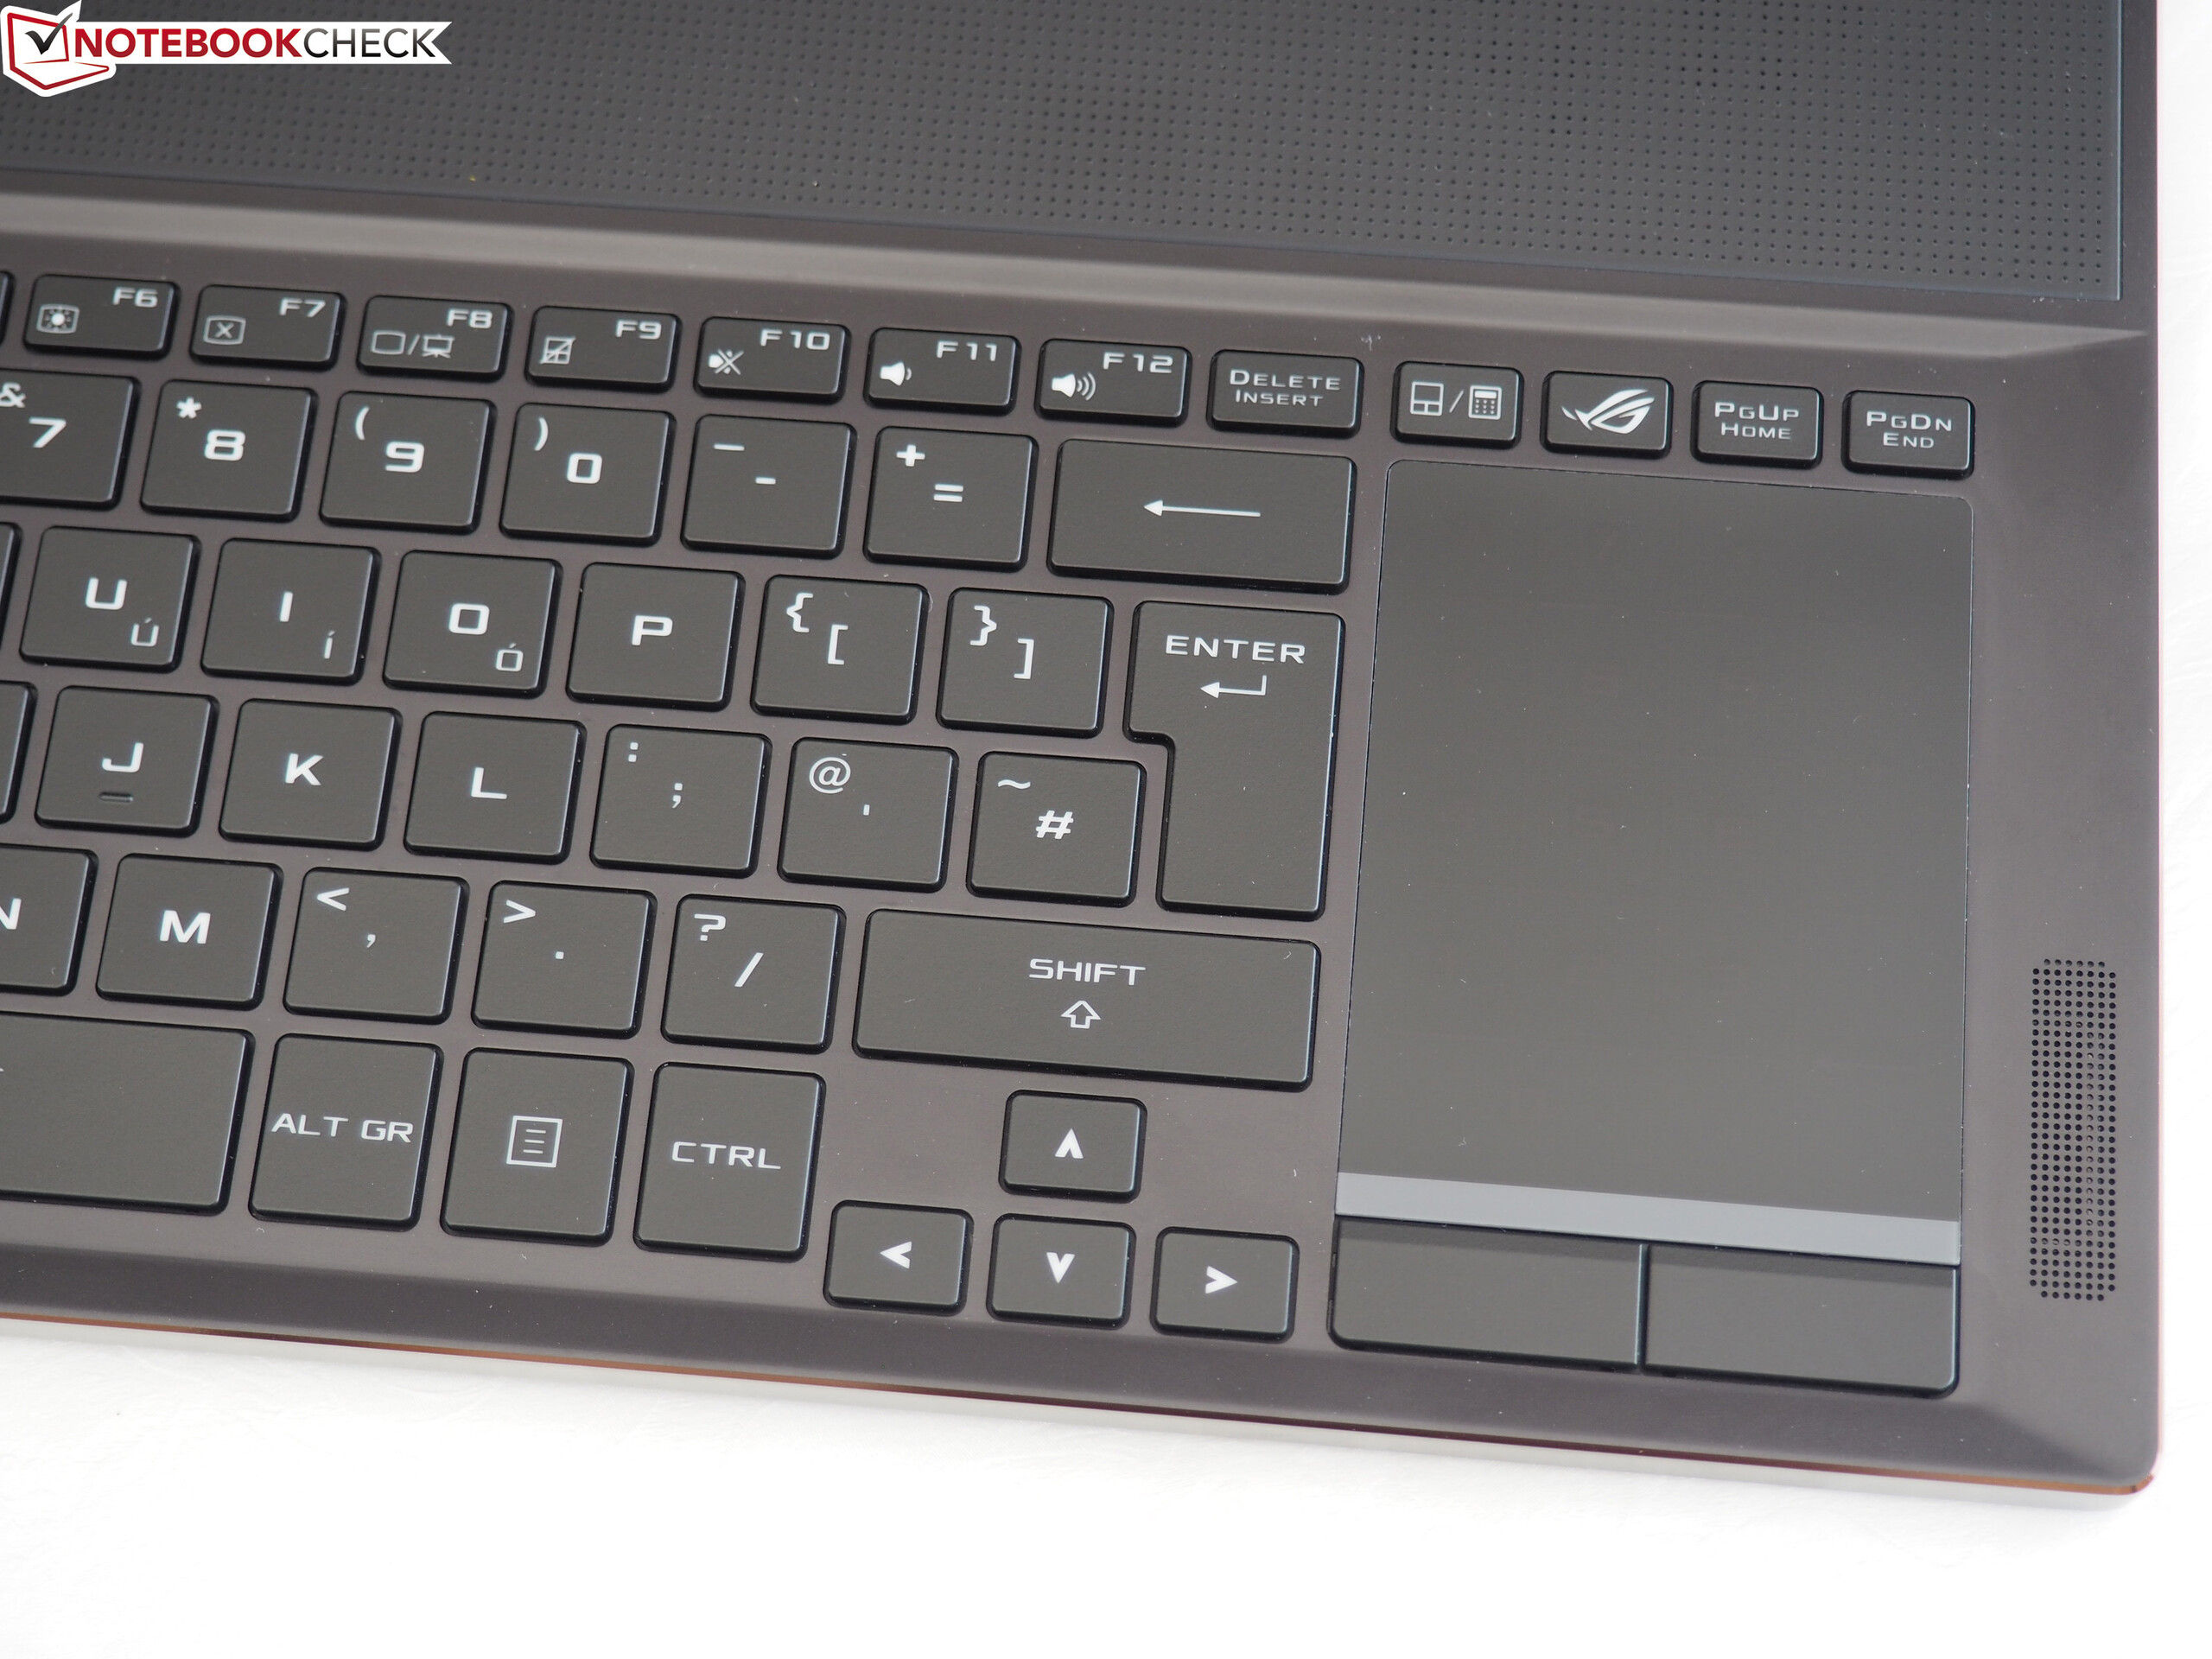
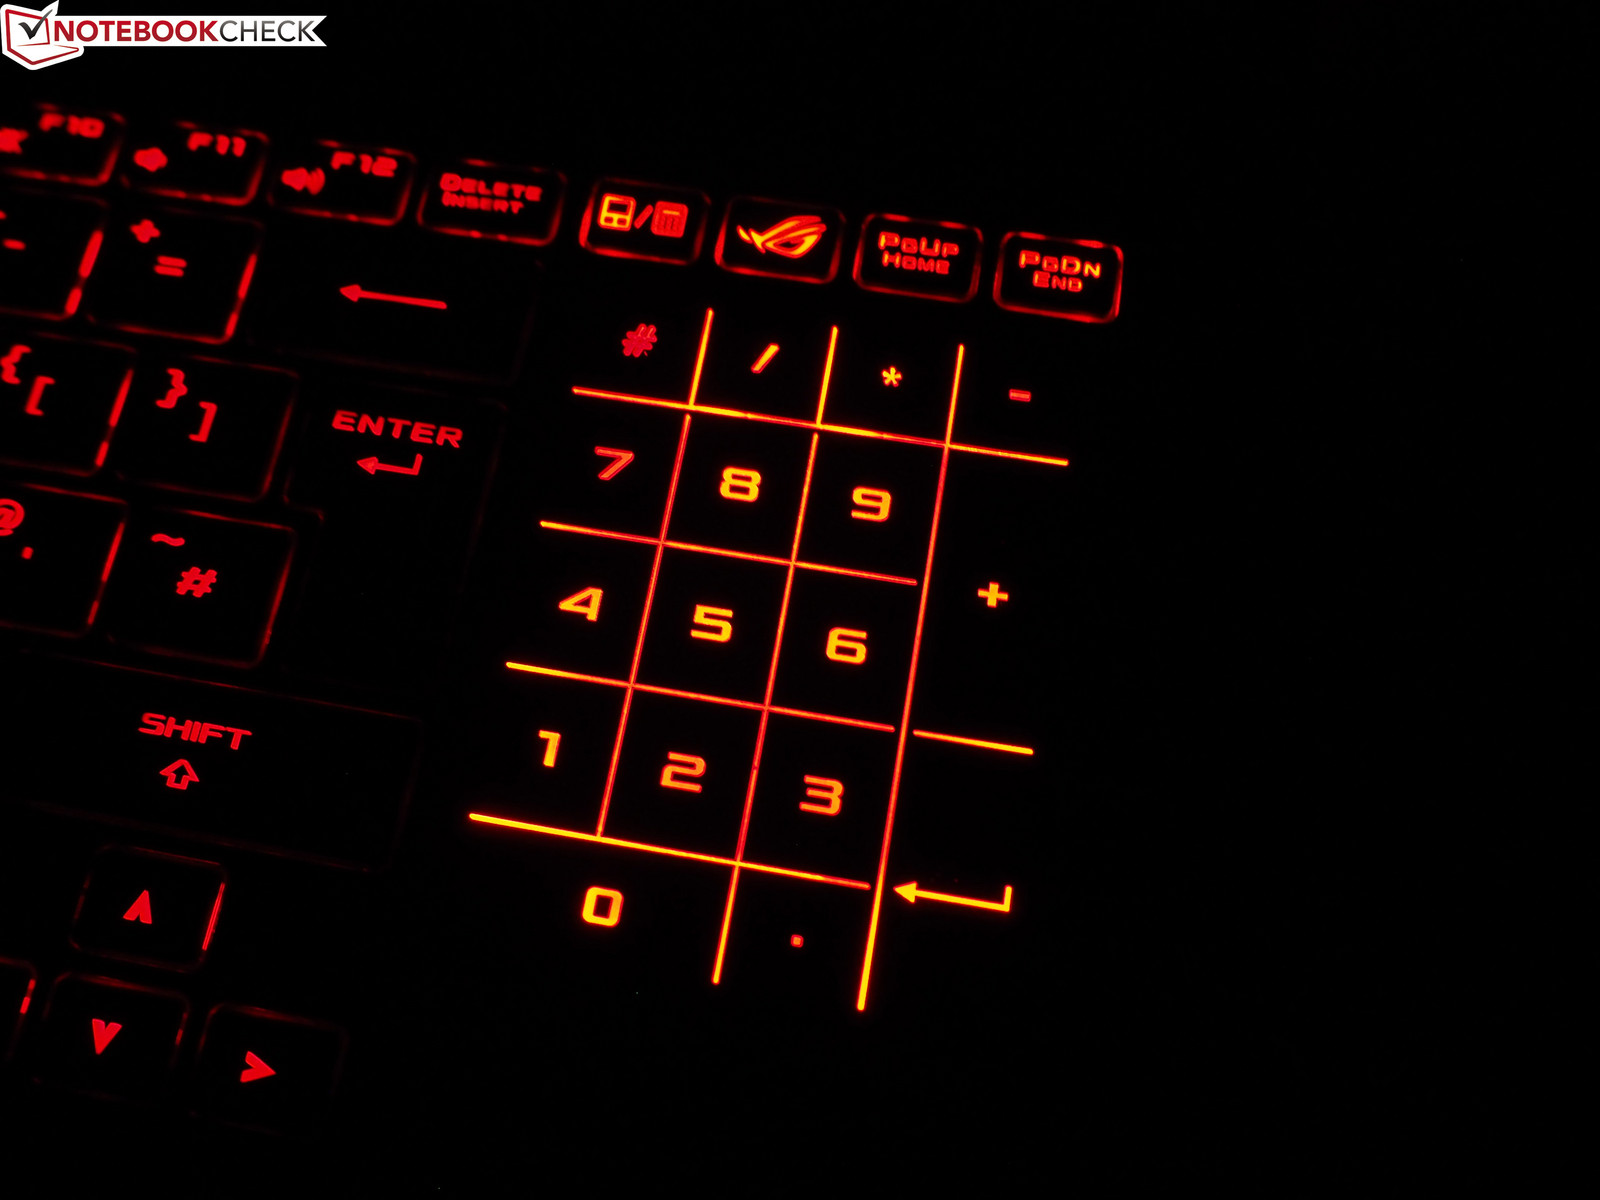
The touchpad with the dedicated mouse buttons is sitting right next to the keyboard to make room for the cooling. This is not impractical for games, but we are pretty sure most gamers will use external keyboards anyway. However, this is often not possible on a train or a plane so the unusual layout is an advantage. The size is not perfect for Windows applications (Office, web, ...). You have to reposition the finger quite often for longer cursor movements due to the narrow width of just 6 cm (~2.4 in). The height of 7.5 cm (~3 in) on the other hand is sufficient.
Precision and tactile impression are good and the smooth surface provides decent gliding capabilities. Gestures are obviously supported as well, so you can zoom, scroll or rotate elements. Clever: As with the MSI GT83VR, you can transform the touchpad into a numeric keypad via a button (see pictures).

Display
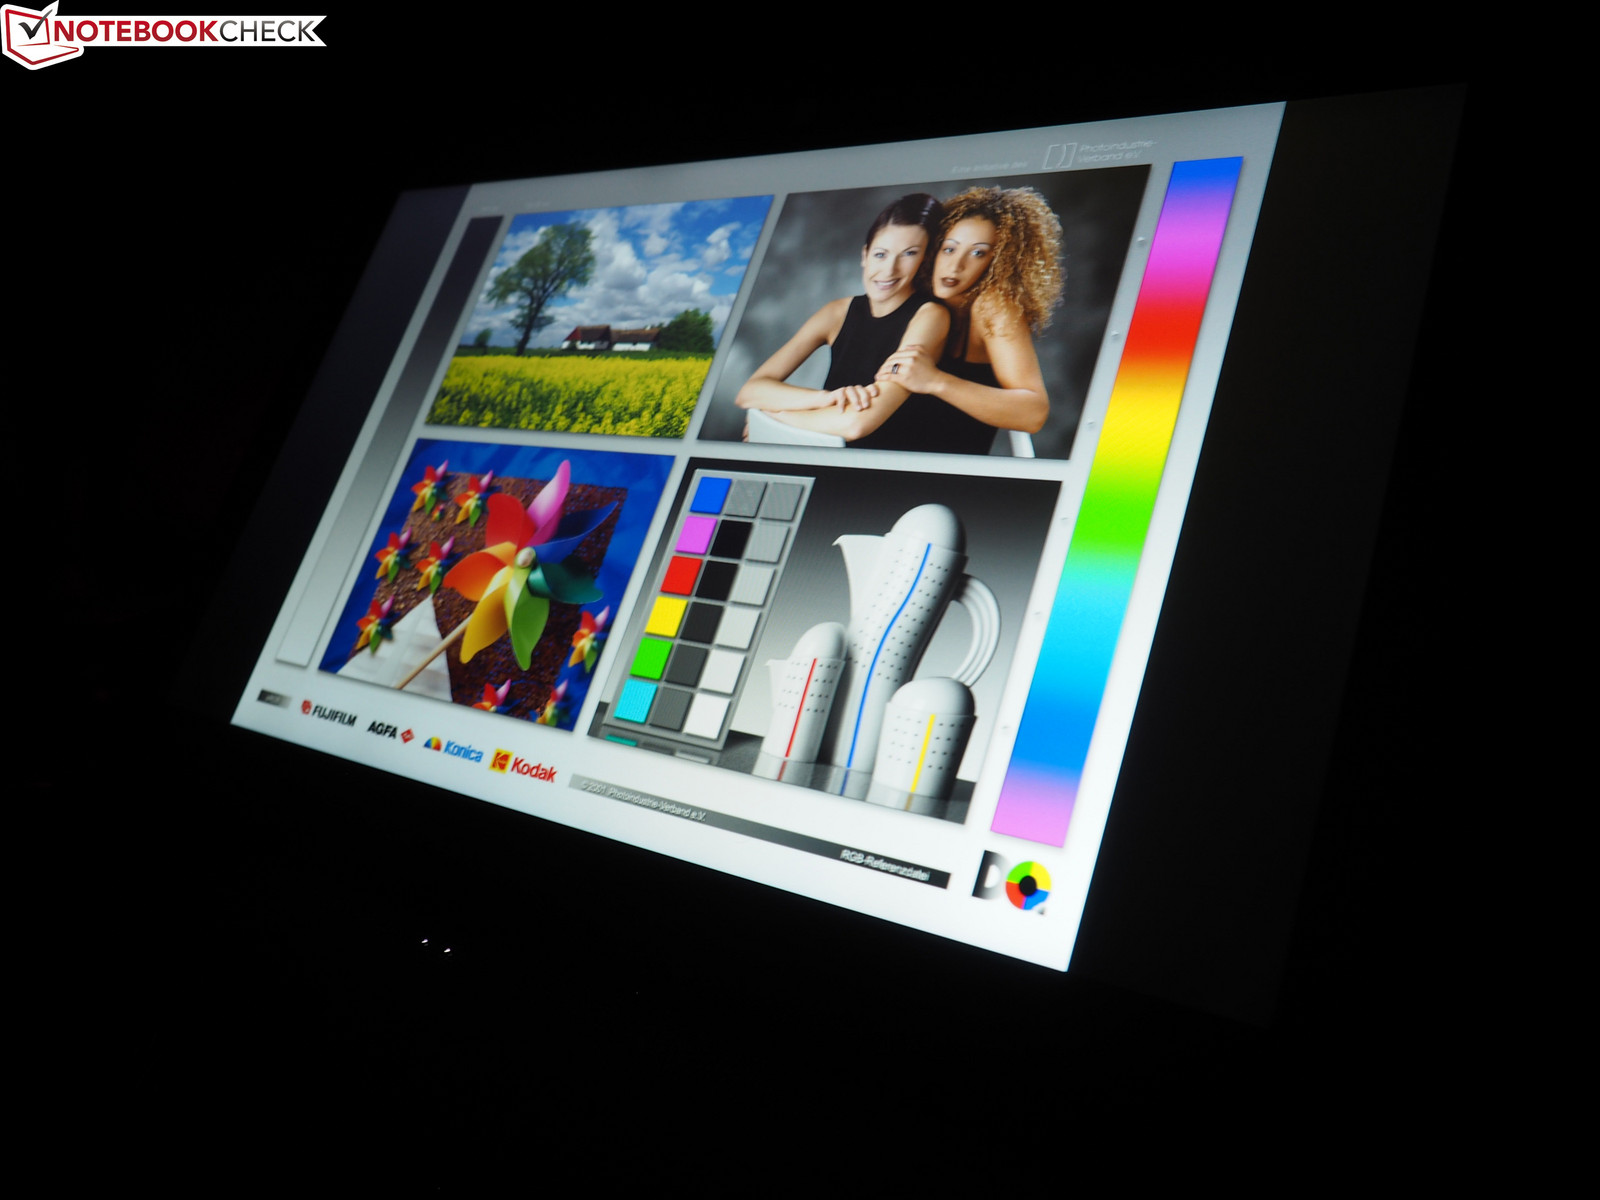
Unlike many other rivals, Asus does not use the TN, but modern IPS technology for its 120 Hz panel. This results in some advantages and disadvantages. One positive aspect is the viewing angle stability. A TN panel quickly tends to picture distortions, while IPS panels provide stable pictures from wider angles. Colors also appear richer, which enhances games, videos, and photos.
| |||||||||||||||||||||||||
Brightness Distribution: 83 %
Center on Battery: 328 cd/m²
Contrast: 1312:1 (Black: 0.25 cd/m²)
ΔE ColorChecker Calman: 6.02 | ∀{0.5-29.43 Ø4.71}
ΔE Greyscale Calman: 6.32 | ∀{0.09-98 Ø4.96}
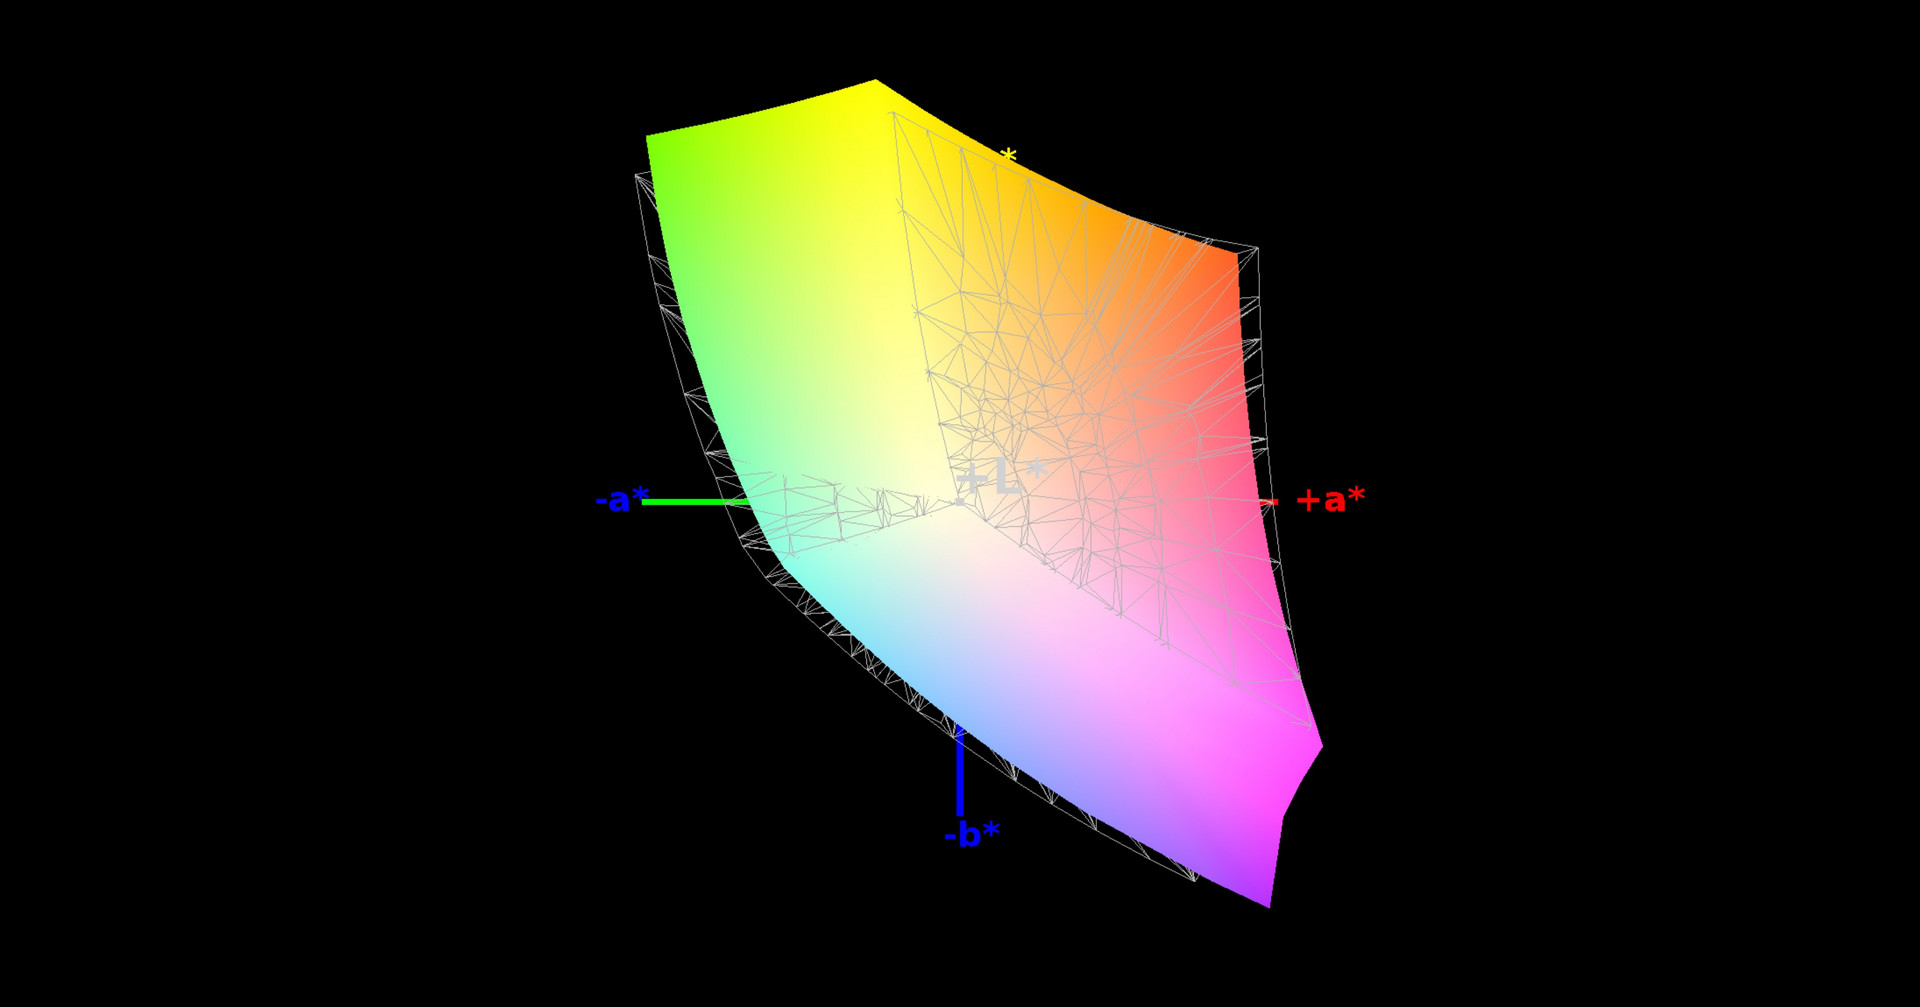
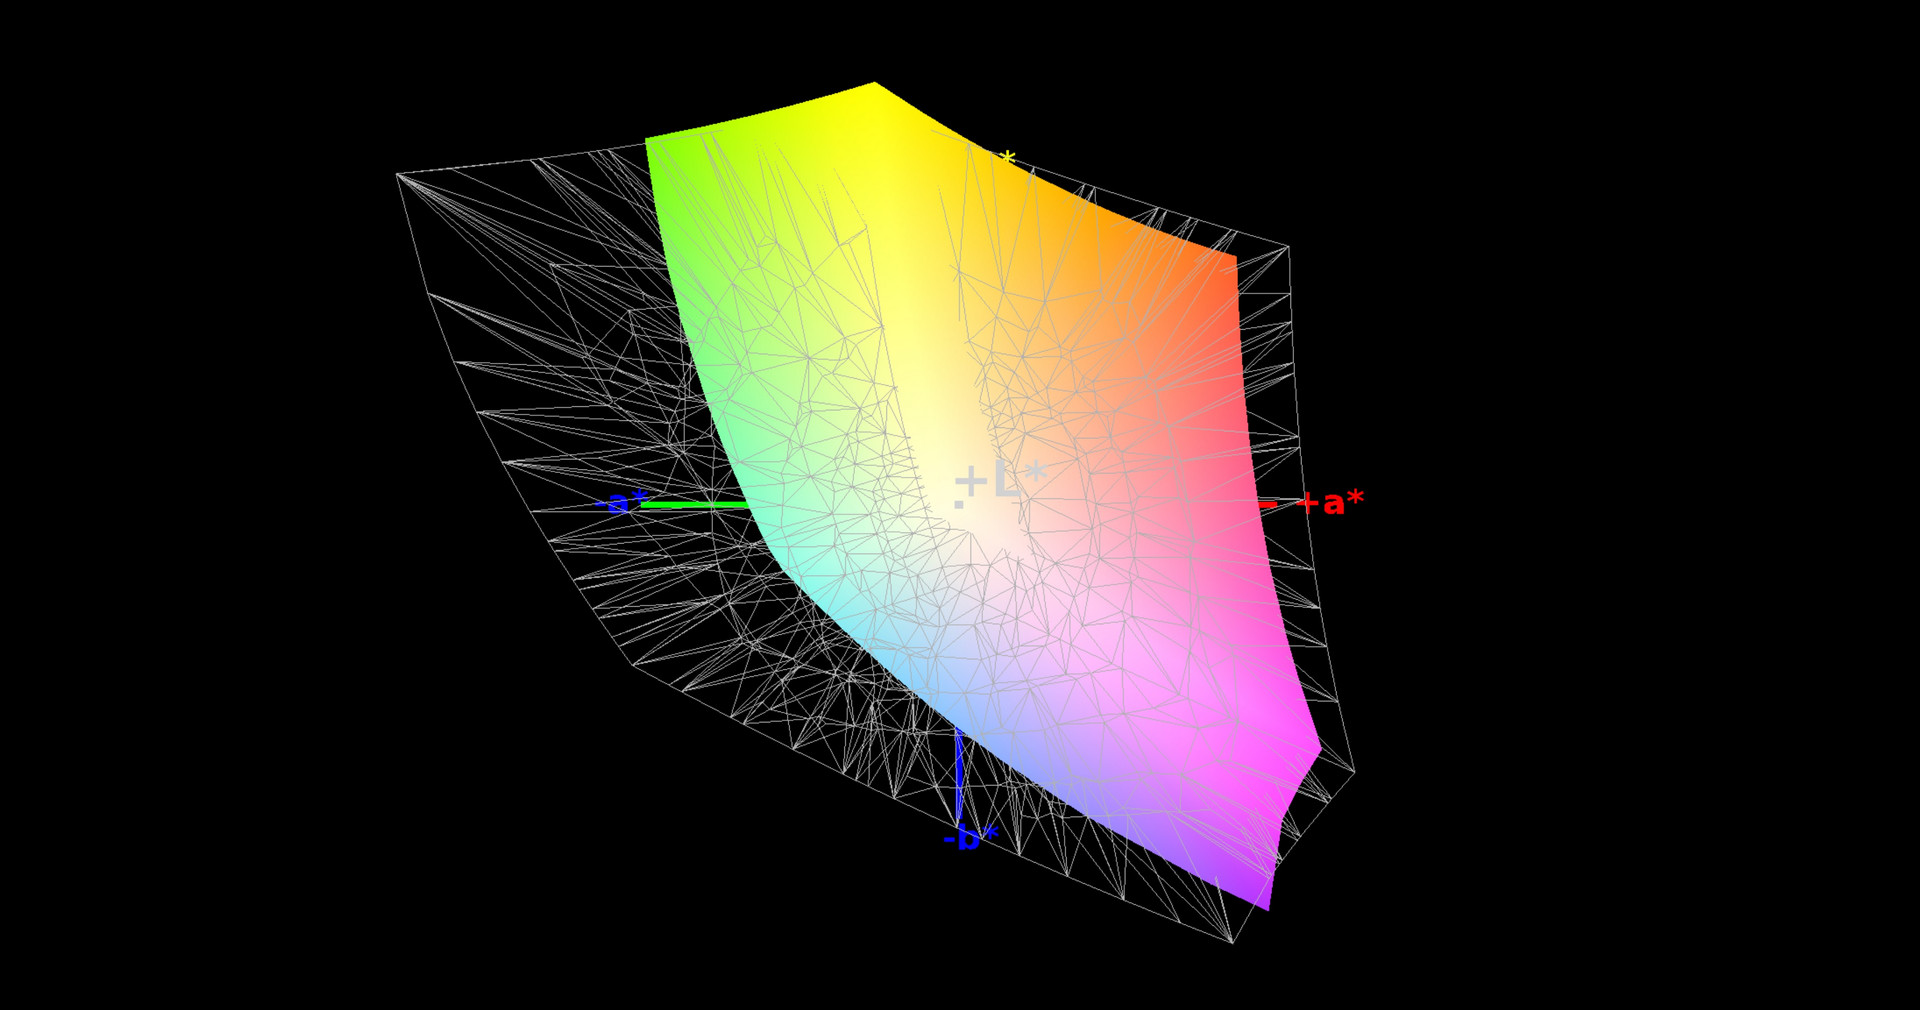
92% sRGB (Argyll 1.6.3 3D)
60% AdobeRGB 1998 (Argyll 1.6.3 3D)
65.9% AdobeRGB 1998 (Argyll 3D)
91.8% sRGB (Argyll 3D)
64.8% Display P3 (Argyll 3D)
Gamma: 2.28
CCT: 8194 K
| Asus Zephyrus GX501 AUO B156HAN04.2 (AUO42ED), 1920x1080 | Alienware 15 R3 HPJGK_B156HTN (AUO51ED), 1920x1080 | Schenker XMG P507 PRO AUO B156HTN05.2 (AUO52ED), 1920x1080 | Asus FX502VM-AS73 1920x1080 | Gigabyte Aero 15 N156HCA-EA1 (CMN15D7), 1920x1080 | MSI GS63VR 7RF-228US 3840x2160 | |
|---|---|---|---|---|---|---|
| Display | 0% | -1% | -40% | 1% | -24% | |
| Display P3 Coverage (%) | 64.8 | 66 2% | 66.4 2% | 38.28 -41% | 65.2 1% | 48.21 -26% |
| sRGB Coverage (%) | 91.8 | 90.5 -1% | 88.9 -3% | 56.9 -38% | 92.5 1% | 72.6 -21% |
| AdobeRGB 1998 Coverage (%) | 65.9 | 66.2 0% | 65.1 -1% | 39.47 -40% | 66.5 1% | 49.81 -24% |
| Response Times | 44% | 46% | 19% | -20% | 17% | |
| Response Time Grey 50% / Grey 80% * (ms) | 40.4 ? | 25 ? 38% | 24 ? 41% | 28.4 ? 30% | 42.8 ? -6% | 28 ? 31% |
| Response Time Black / White * (ms) | 24 ? | 12 ? 50% | 12 ? 50% | 22.4 ? 7% | 32 ? -33% | 23.6 ? 2% |
| PWM Frequency (Hz) | 26000 ? | 1351 ? | ||||
| Screen | -23% | -30% | -39% | -3% | -32% | |
| Brightness middle (cd/m²) | 328 | 386 18% | 357 9% | 209.5 -36% | 320 -2% | 274.2 -16% |
| Brightness (cd/m²) | 305 | 382 25% | 365 20% | 205 -33% | 316 4% | 263 -14% |
| Brightness Distribution (%) | 83 | 93 12% | 85 2% | 92 11% | 90 8% | 92 11% |
| Black Level * (cd/m²) | 0.25 | 0.39 -56% | 0.5 -100% | 0.69 -176% | 0.36 -44% | 0.44 -76% |
| Contrast (:1) | 1312 | 990 -25% | 714 -46% | 304 -77% | 889 -32% | 623 -53% |
| Colorchecker dE 2000 * | 6.02 | 10.2 -69% | 9.93 -65% | 4.7 22% | 4.62 23% | 8 -33% |
| Colorchecker dE 2000 max. * | 10.14 | 15.81 -56% | 14.87 -47% | 19.7 -94% | 9.75 4% | 14.6 -44% |
| Greyscale dE 2000 * | 6.32 | 11.28 -78% | 10.32 -63% | 1.8 72% | 6 5% | 9.1 -44% |
| Gamma | 2.28 96% | 2.23 99% | 2.11 104% | 2.23 99% | 2.46 89% | 2.24 98% |
| CCT | 8194 79% | 11383 57% | 10096 64% | 6975 93% | 6761 96% | 5020 129% |
| Color Space (Percent of AdobeRGB 1998) (%) | 60 | 59 -2% | 58 -3% | 36.2 -40% | 60 0% | 45.7 -24% |
| Color Space (Percent of sRGB) (%) | 92 | 90 -2% | 89 -3% | 56.6 -38% | 92 0% | 72.1 -22% |
| Total Average (Program / Settings) | 7% /
-10% | 5% /
-14% | -20% /
-31% | -7% /
-5% | -13% /
-24% |
* ... smaller is better
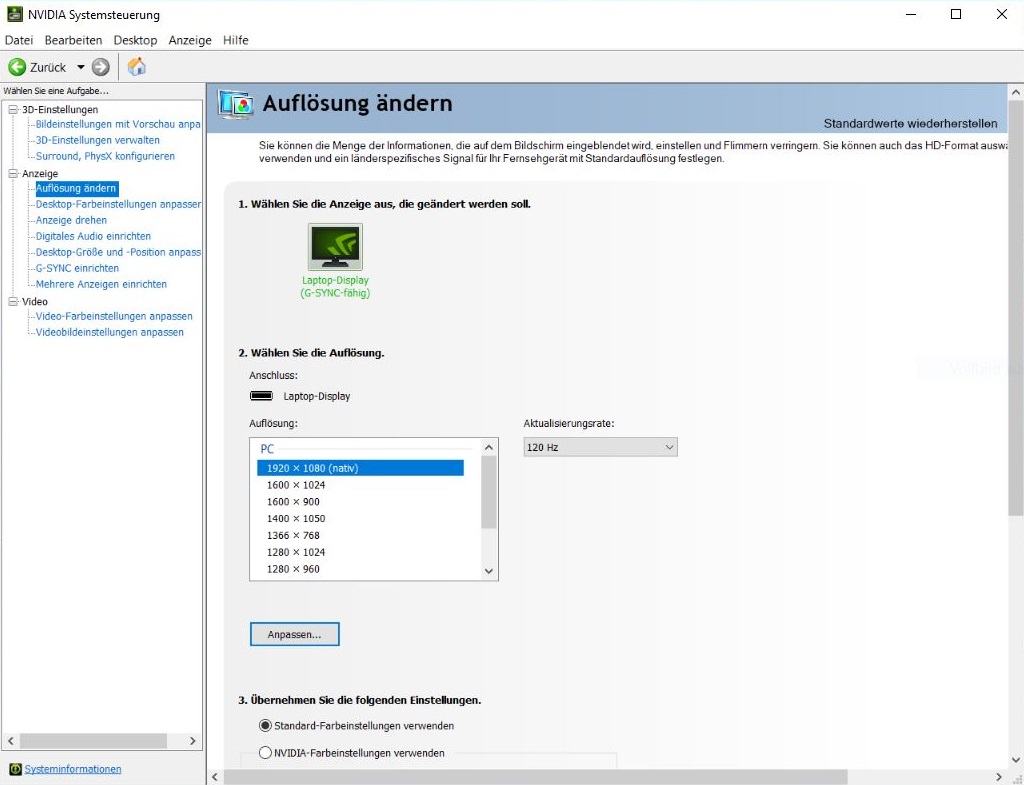
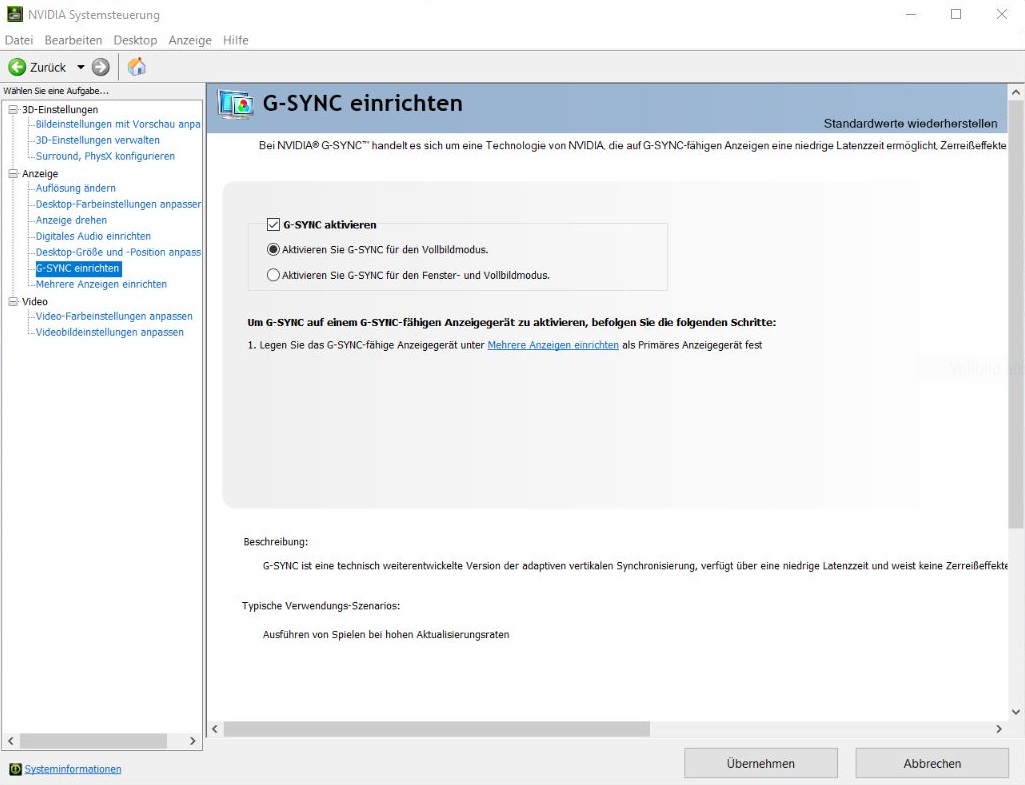
The IPS display falls behind TN panels in terms of response times. 24 ms black-to-white and 40 ms grey-to grey for the AUO panel (B156HAN04.2) of the Zephyrus is much slower than MSI's 120 Hz panels (7 or 26 ms @MSI GT73VR). That the picture still looks smoother compared to a typical 60 HZ screen is a result of Nvidia's G-Sync technology, which is used by more and more gaming laptops. It synchronizes the frame rate of the graphics card with the panel refresh rate. G-Sync was deactivated for the benchmarks and the other measurements, just like the automatic brightness control. The picture mode, which can be adjusted via ROG GameVisual in the Gaming Center, was set to the default sRGB setting.

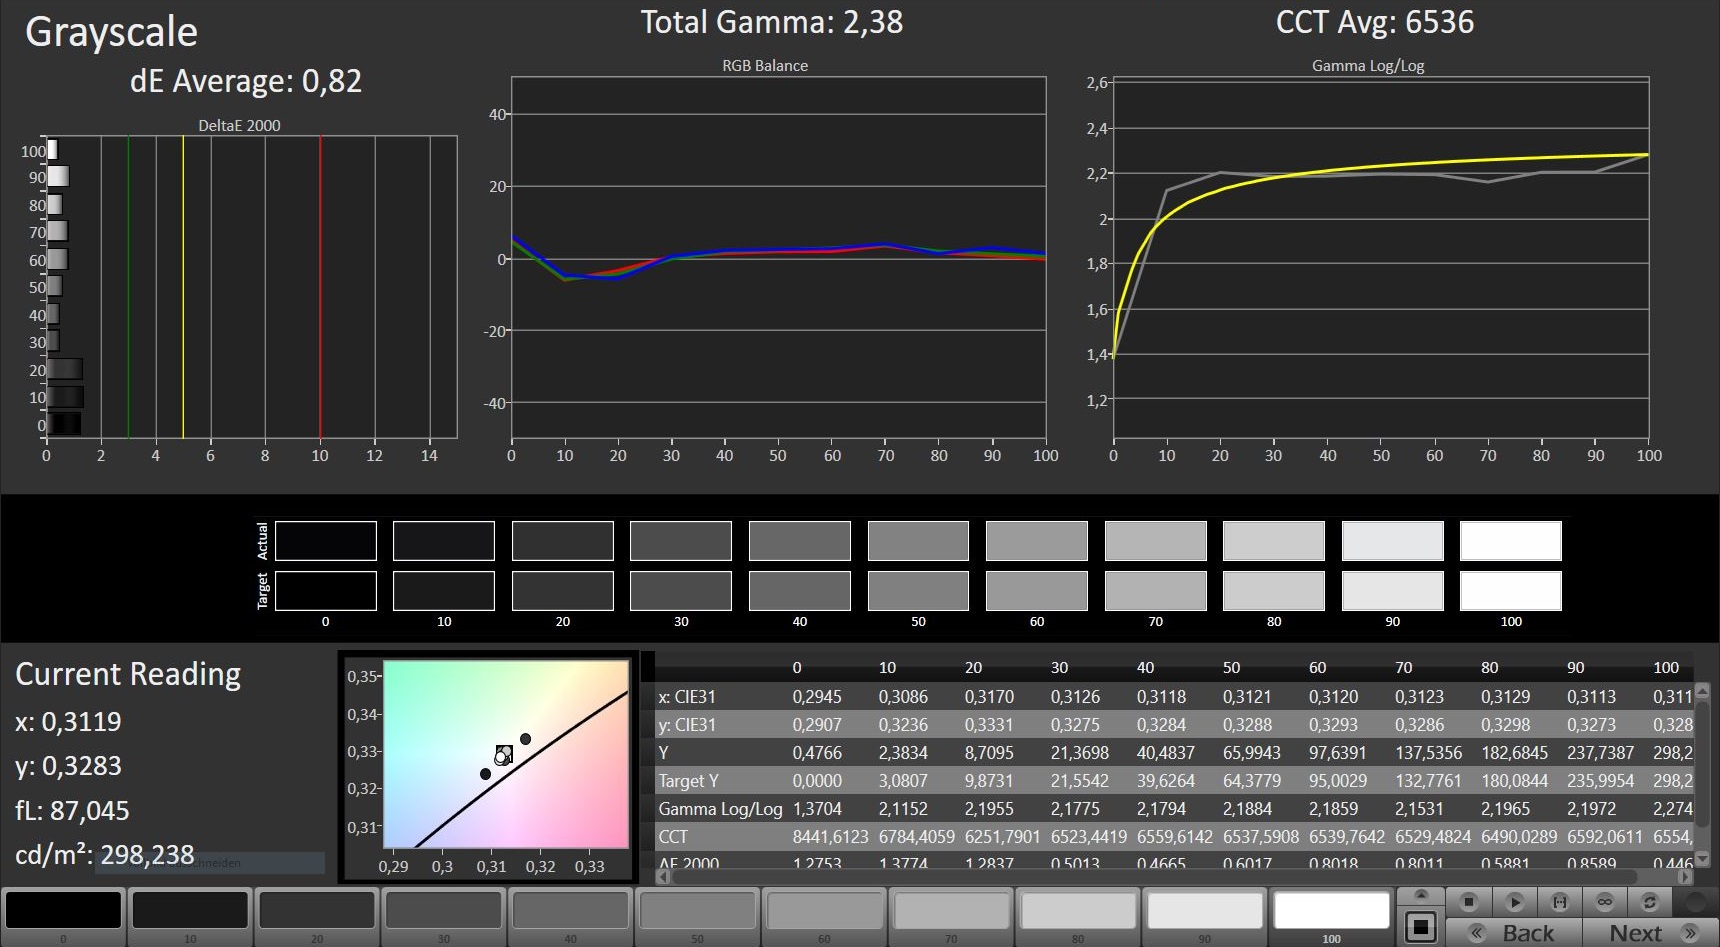

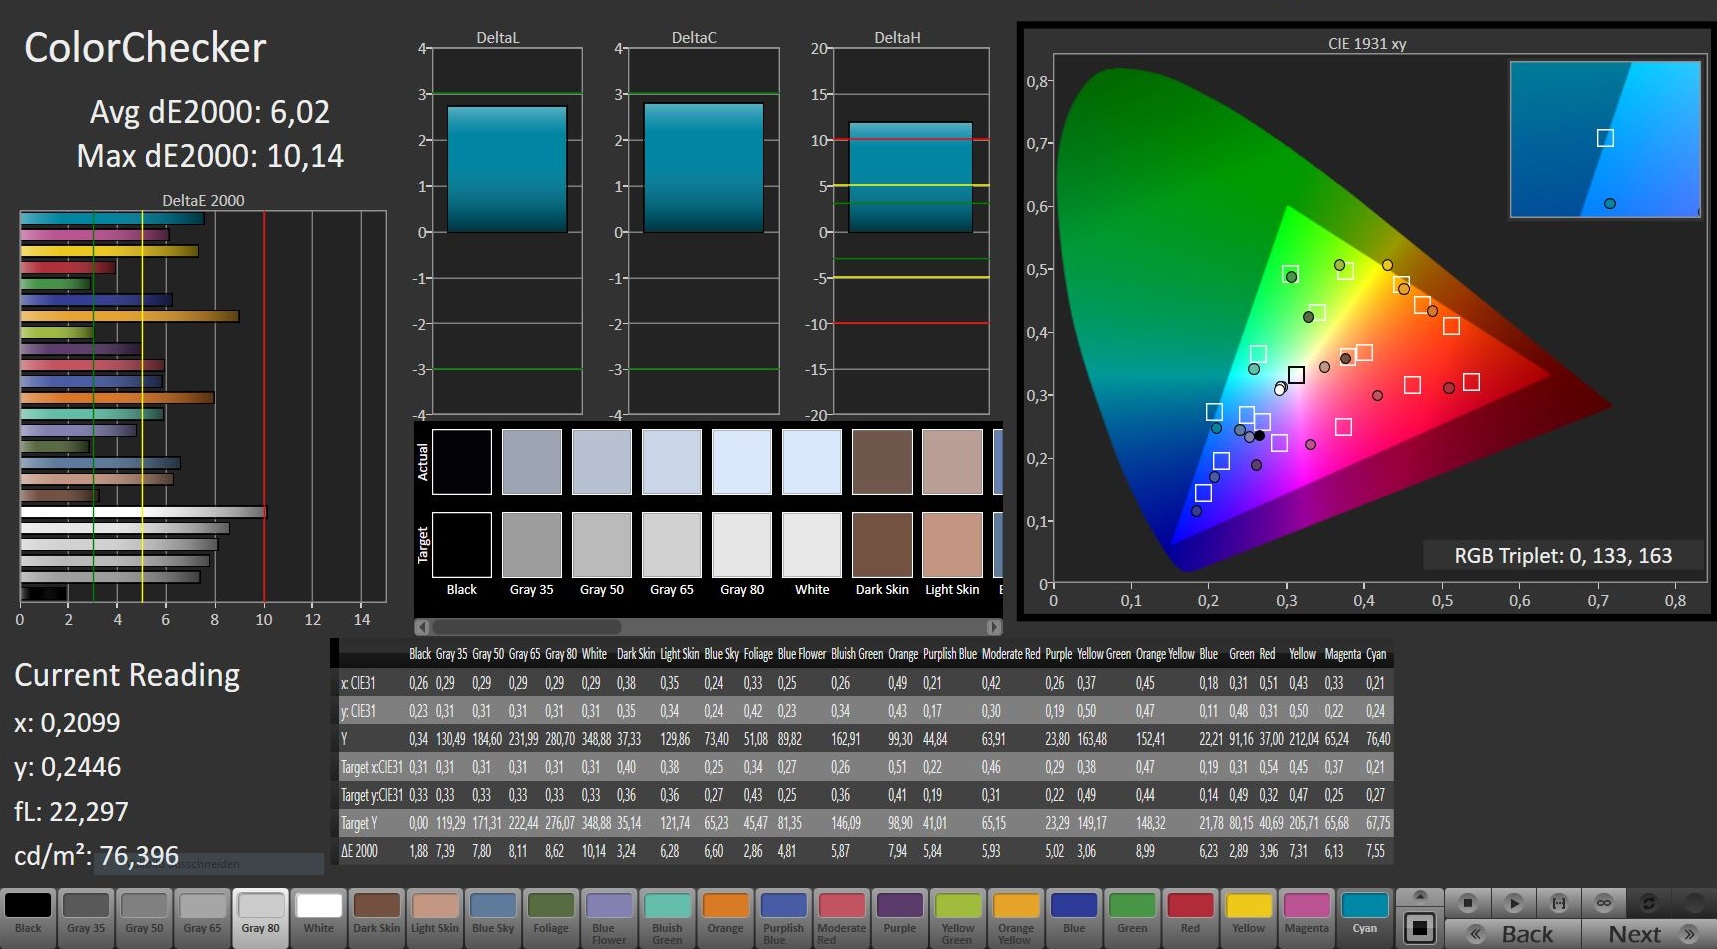
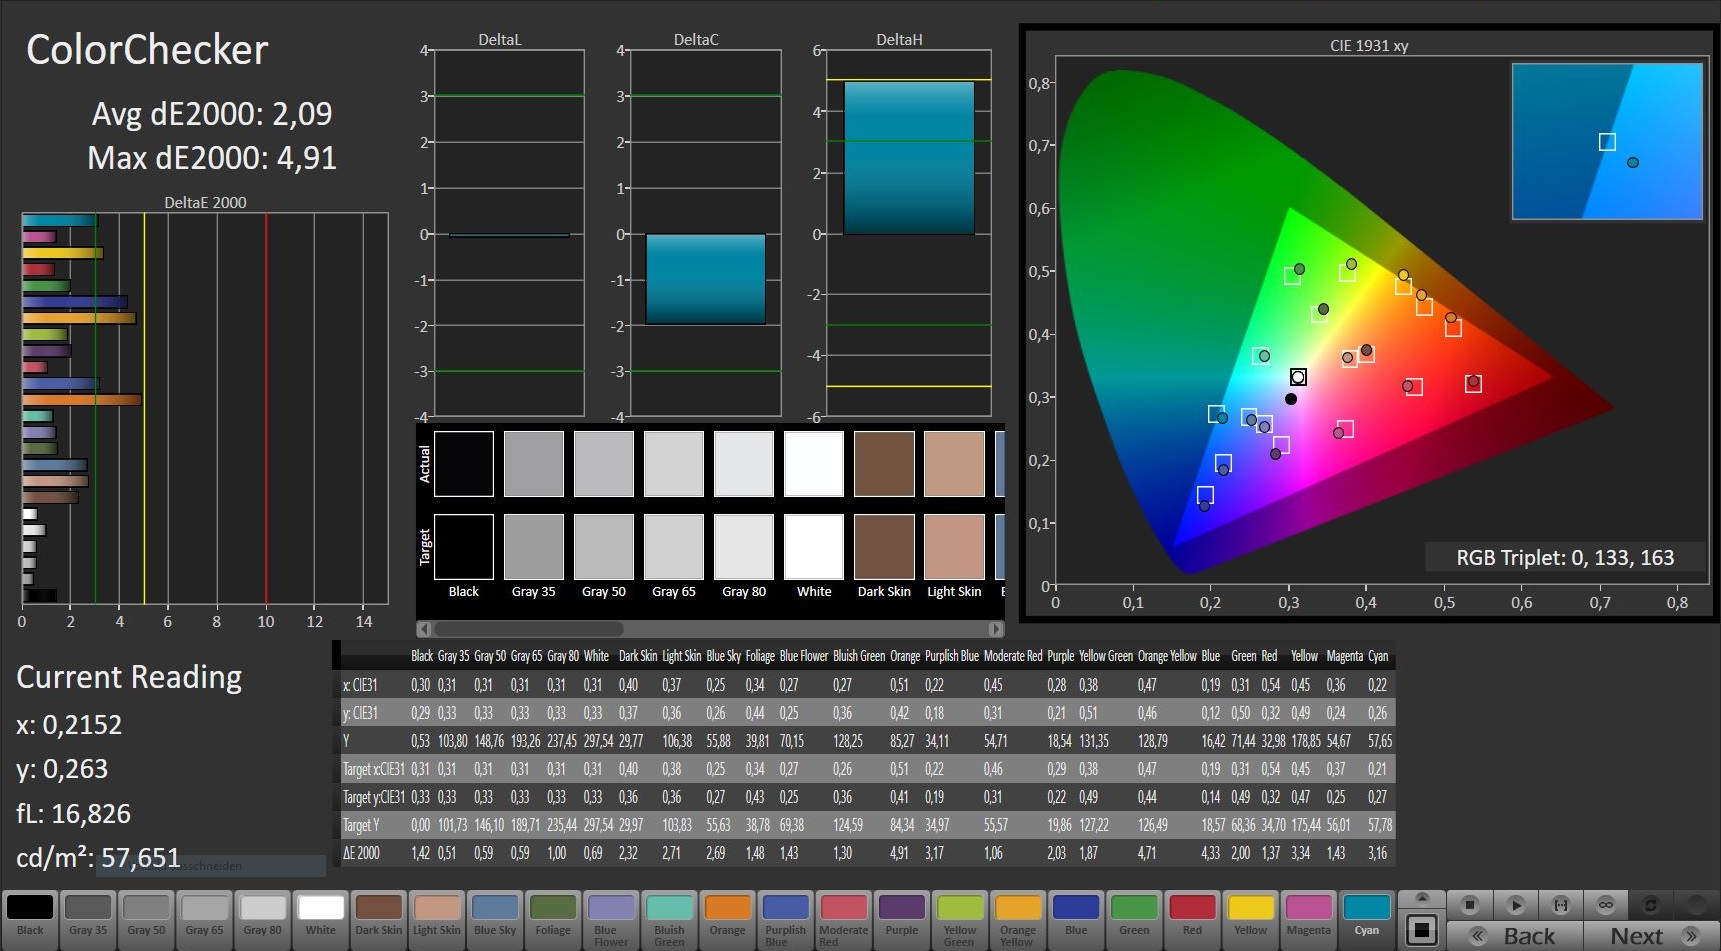
The display measurements are generally good or even very good. A luminance of around 300 nits is also sufficient for outdoor usage as long as you avoid direct sunlight. Both the black value (0.25 cd/m²) and contrast (~1300:1) are also great. The color accuracy on the other hand is not perfect. CalMAN reveals a distinct blue cast, but it can be removed with a calibration (our icc file is linked in the display box above). We can reduce the DeltaE-2000 values for the grayscale and the colors from almost 6 to less than 3.
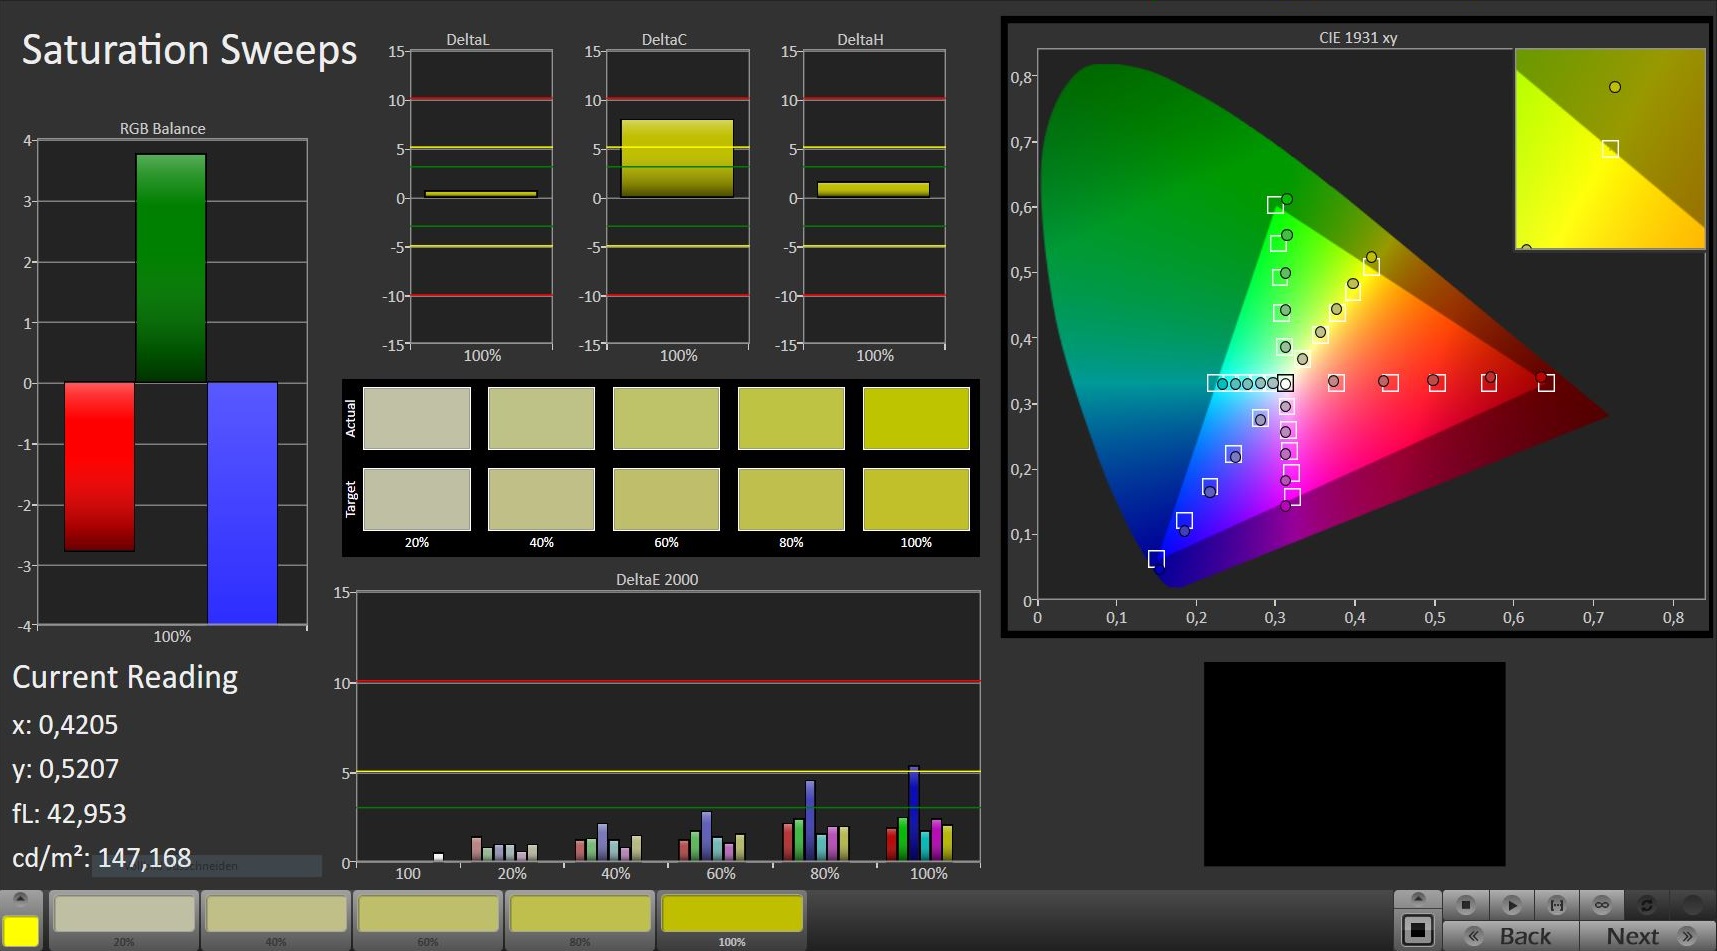
The color gamut of 92% sRGB is respectable for gaming and multimedia users. Professional users, who pay attention to the wider AdobeRGB standard, get a coverage of only 60%. Annoying: Our test model showed significant backlight bleeding in the upper right corner. It was only visible on dark pictures, but this should not occur in such an expensive machine. The somewhat wobbly lid construction is probably the reason for the backlight bleeding (Update: The second test model did not suffer from backlight bleeding!). Every buyer has to decide for himself whether 1920x1080 pixels are sufficient for a 15-inch laptop. The performance of the GTX 1080 Max-Q is at least suitable for the 120 Hz panel; the Pascal chip would rarely manage more than 60 FPS in combination with 3K or 4K screens.
Display Response Times
| ↔ Response Time Black to White | ||
|---|---|---|
| 24 ms ... rise ↗ and fall ↘ combined | ↗ 11.6 ms rise | 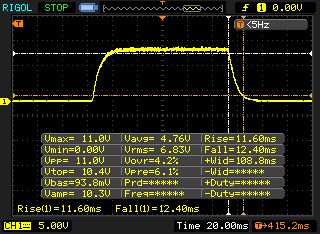 |
| ↘ 12.4 ms fall | ||
| The screen shows good response rates in our tests, but may be too slow for competitive gamers. In comparison, all tested devices range from 0.1 (minimum) to 240 (maximum) ms. » 54 % of all devices are better. This means that the measured response time is worse than the average of all tested devices (19.8 ms). | ||
| ↔ Response Time 50% Grey to 80% Grey | ||
| 40.4 ms ... rise ↗ and fall ↘ combined | ↗ 23.2 ms rise | 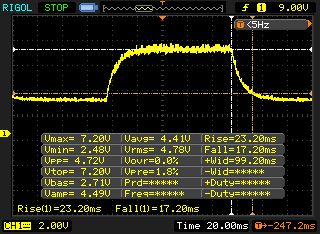 |
| ↘ 17.2 ms fall | ||
| The screen shows slow response rates in our tests and will be unsatisfactory for gamers. In comparison, all tested devices range from 0.165 (minimum) to 636 (maximum) ms. » 64 % of all devices are better. This means that the measured response time is worse than the average of all tested devices (30.9 ms). | ||
Screen Flickering / PWM (Pulse-Width Modulation)
| Screen flickering / PWM not detected | 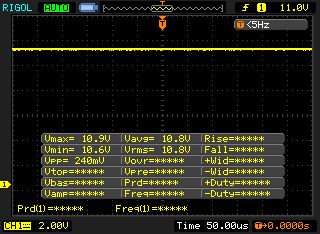 | ||
In comparison: 52 % of all tested devices do not use PWM to dim the display. If PWM was detected, an average of 7748 (minimum: 5 - maximum: 343500) Hz was measured. | |||
Performance
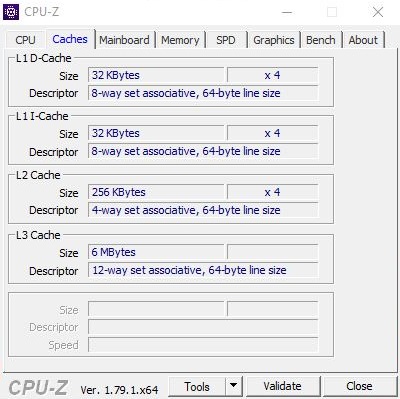
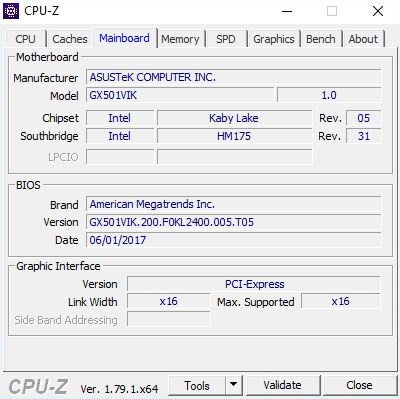
We start the performance section with some system screenshots of the GX501.
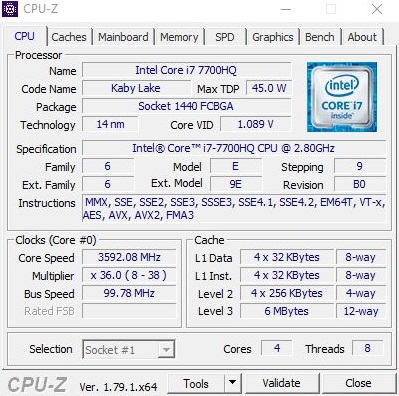

Processor
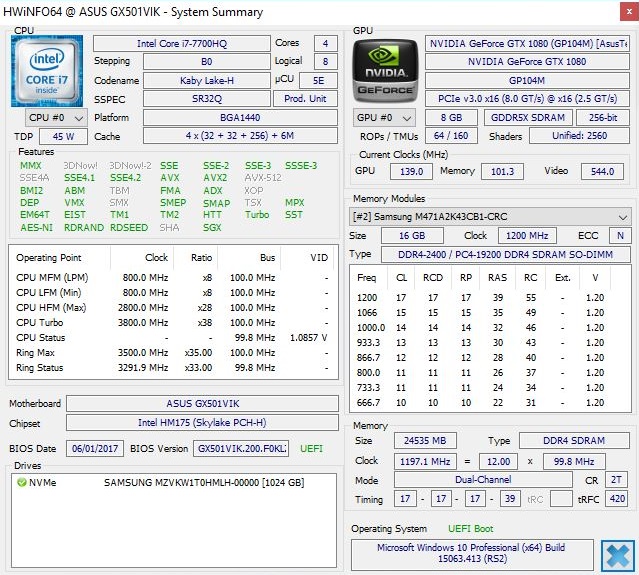
CPU calculations are handled by one of the most successful quad-core models from Intel's Kaby Lake generation. The Core i7-7700HQ is currently the choice for many high-end notebooks, so the implementation here is not surprising. The Turbo Boost feature, which can raise the core clock above the base frequency, works perfectly on the Zephyrus. We determined between 3.4 and 3.8 GHz in the Cinebench R15 benchmark, which is the maximum value for multi and single-core load, respectively.
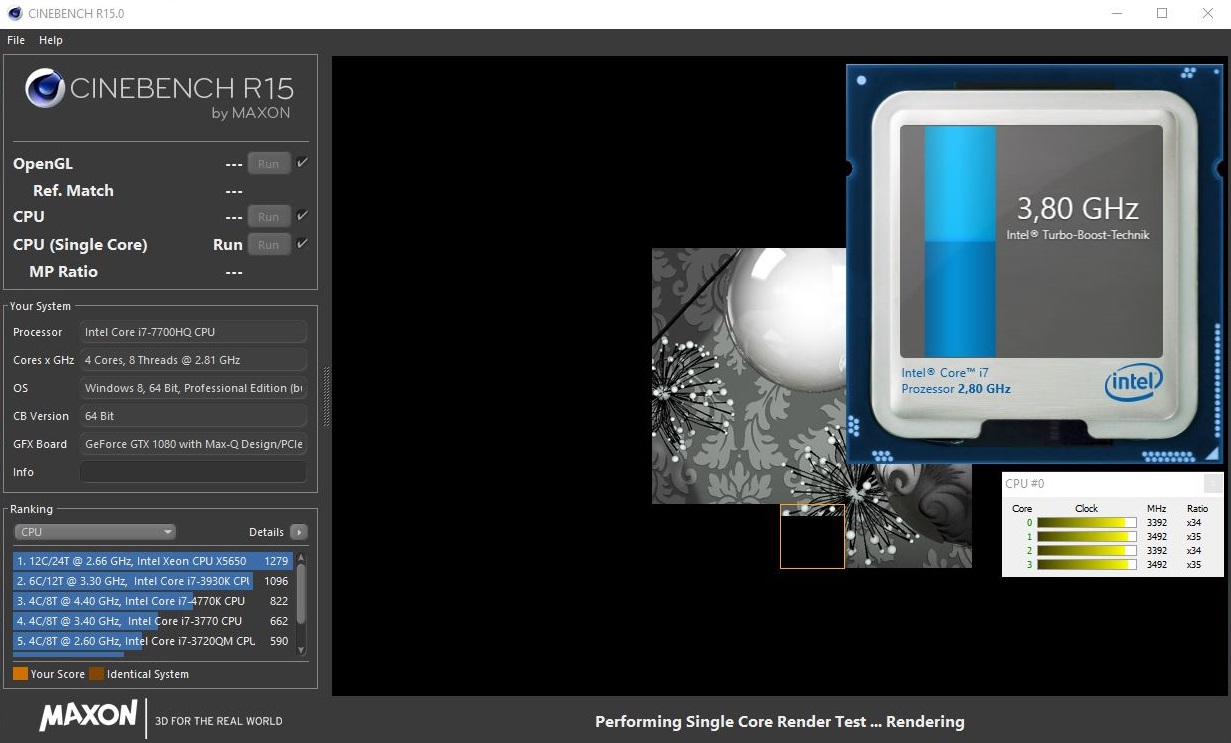
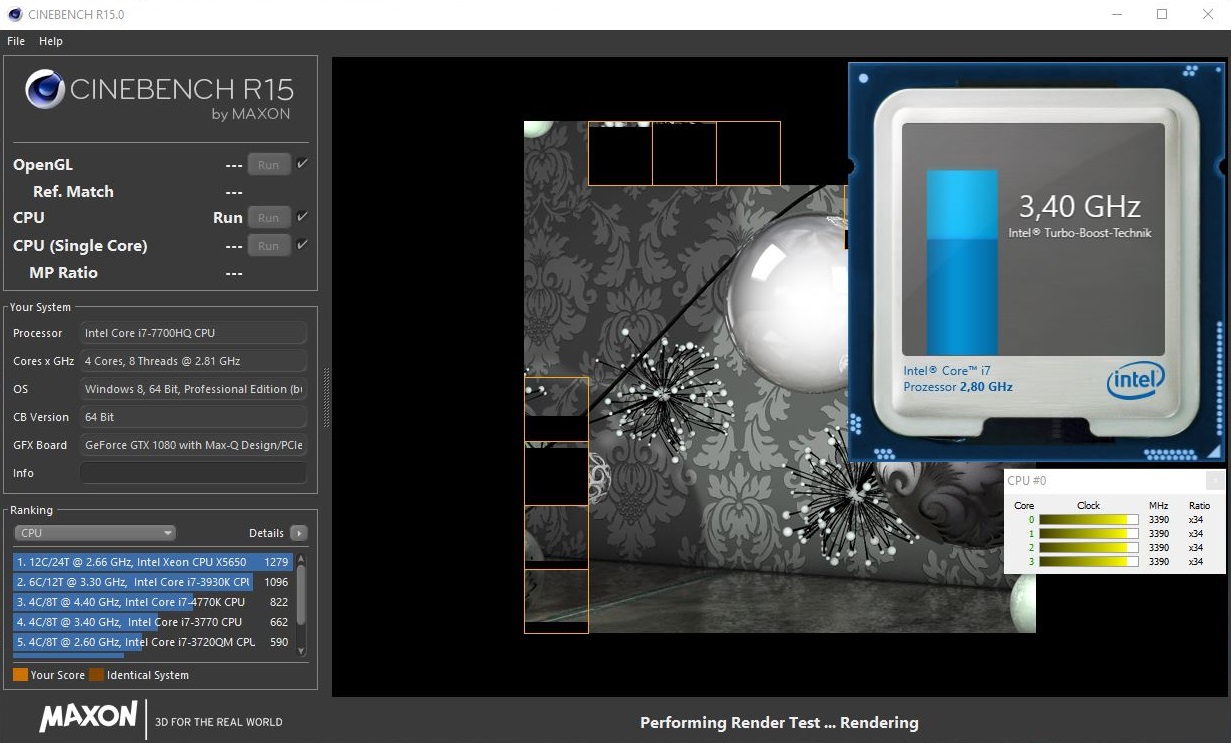
The high clock can also be sustained for long periods. Our 30-minute Cinebench loop delivers steady scores for the 15-inch laptop. The CPU benchmarks also determine excellent scores for the GX501 in general, which is on par with other 7700HQ notebooks both in Cinebench R15 as well as Cinebench R11.5.
The processor also supports the Hyperthreading technology, which means that it can execute 8 threads simultaneously. We never encountered CPU throttling, but the Turbo Boost is deactivated under maximum load due to the temperature. The integrated processor GPU HD Graphics 630 cannot be used because of the missing switchable graphics (Nvidia Optimus).
System Performance
The Zephyrus also performs very well in the system benchmarks. The 15-inch laptop ranks either first (Home Score) or third (Work Score) among the competition, but the advantage of the Alienware 15 R3 and Gigabyte Aero 15 is extremely small, so they are basically on par. Subjectively, the system is very responsive, including boot times, data transfers, application launches or loading times. This is, however, not surprising thanks to the fast SSD.
| PCMark 8 | |
| Home Score Accelerated v2 | |
| Asus Zephyrus GX501 | |
| Alienware 15 R3 | |
| Asus FX502VM-AS73 | |
| Schenker XMG P507 PRO | |
| Gigabyte Aero 15 | |
| MSI GS63VR 7RF-228US | |
| Work Score Accelerated v2 | |
| Alienware 15 R3 | |
| Gigabyte Aero 15 | |
| Asus Zephyrus GX501 | |
| MSI GS63VR 7RF-228US | |
| Schenker XMG P507 PRO | |
| Asus FX502VM-AS73 | |
| PCMark 10 - Score | |
| Asus Zephyrus GX501 | |
| PCMark 8 Home Score Accelerated v2 | 5057 points | |
| PCMark 8 Work Score Accelerated v2 | 5289 points | |
| PCMark 10 Score | 5125 points | |
Help | ||
Storage Devices
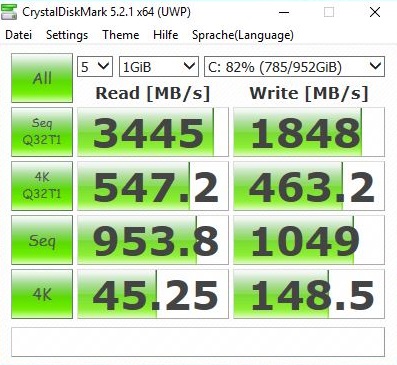
In order to keep the case as compact as possible, Asus has not included a 2.5-inch drive and has only implemented the M.2 technology. The manufacturer ships the laptop with a PCIe drive to utilize the full potential of the technology. Unlike the conventional SATA-III SSDs (e.g. Asus FX553VD), PCIe drives are not limited at 550 MB/s. Our test model is equipped with the 1 TB version of the Samsung SM961. The performance is excellent. CrystalDiskMark 5.2 determines sequential transfer rates of up to 3445 (read) and 1848 MB/s (write), respectively. The latter is reminiscent of the Samsung 960 Evo in the Schenker XMG A517.
| Asus Zephyrus GX501 Samsung SSD SM961 1TB M.2 MZVKW1T0HMLH | Schenker XMG A517 Samsung SSD 960 Evo 500GB m.2 NVMe | Asus FX553VD-DM249T Hynix HFS128G39TND | |
|---|---|---|---|
| CrystalDiskMark 5.2 / 6 | 28% | -65% | |
| Read Seq Q32T1 (MB/s) | 3445 | 3389 -2% | 549 -84% |
| Write Seq Q32T1 (MB/s) | 1848 | 1706 -8% | 136.4 -93% |
| Read 4K Q32T1 (MB/s) | 547 | 627 15% | 288.6 -47% |
| Write 4K Q32T1 (MB/s) | 463 | 591 28% | 136.1 -71% |
| Read Seq (MB/s) | 954 | 1856 95% | 507 -47% |
| Write Seq (MB/s) | 1049 | 1652 57% | 135.9 -87% |
| Read 4K (MB/s) | 45 | 49 9% | 28.6 -36% |
| Write 4K (MB/s) | 149 | 196 32% | 71.2 -52% |
GPU Performance
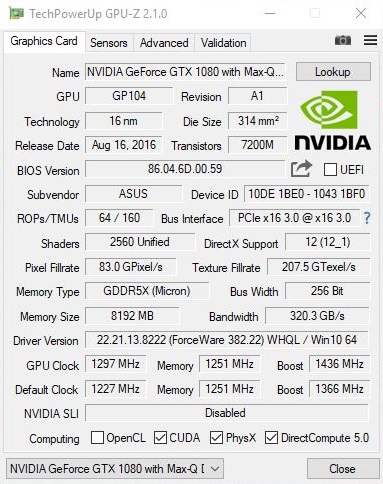
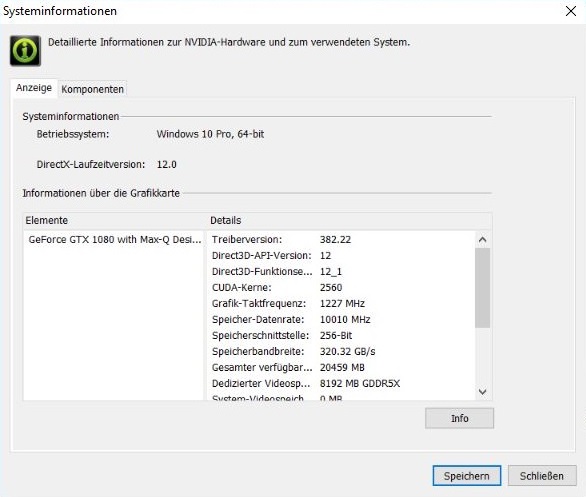
With the Max-Q design, Nvidia wants to bring the performance of the GeForce GTX 1080 and GeForce GTX 1070 into ultra-slim notebooks. So far, slim notebooks were limited to a GeForce GTX 1050 (Ti) or GeForce GTX 1060. The two top models from the Pascal generation offer sufficient performance for smooth gameplay in all modern games at the highest settings. We want to check whether this is also the case for the Max-Q versions, but we start with some specifications. According to Nvidia, the new models have been optimized for efficiency both in terms of hardware as well as software via drivers.

Most of the basic specifications remind us of the standard versions from 2016. The tuned GTX 1080 also gets 250 shaders and 8 GB GDDR5X video memory (256-bit interface) clocked at 2500 MHz. However, there are differences in the core clocks. Instead of 1582 to 1771 MHz, the Max-Q version only runs at 1227 to 1366 MHz.
The GPU Boost is very high at up to 1709 MHz (Turbo Gear Standard) or 1772 MHz (Turbo Gear Extreme), respectively, but the regular GTX 1080 is still faster in synthetic benchmarks. MSI's GT73VR is 15% faster in the 3DMark 13 Fire Strike Test; 22% in 3DMark 11.
| 3DMark - 1920x1080 Fire Strike Graphics | |
| MSI GT73VR 7RF-296 | |
| Asus Zephyrus GX501 | |
| Alienware 15 R3 | |
| Schenker XMG P507 PRO | |
| Asus FX502VM-AS73 | |
| MSI GS63VR 7RF-228US | |
| Gigabyte Aero 15 | |
| 3DMark 11 - 1280x720 Performance GPU | |
| MSI GT73VR 7RF-296 | |
| Asus Zephyrus GX501 | |
| Alienware 15 R3 | |
| Schenker XMG P507 PRO | |
| Asus FX502VM-AS73 | |
| MSI GS63VR 7RF-228US | |
| Gigabyte Aero 15 | |
| Unigine Heaven 4.0 - Extreme Preset DX11 | |
| MSI GT73VR 7RF-296 | |
| Asus Zephyrus GX501 | |
| Alienware 15 R3 | |
| Schenker XMG P507 PRO | |
| Gigabyte Aero 15 | |
This means that the GTX 1080 Max-Q is actually more comparable to the GeForce GTX 1070, which is only a few percent slower in the Alienware 15 R3 and Schenker XMG P507, but costs significantly less. Notebooks with the GTX 1060 (Asus FX502VM, Gigabyte Aero 15, MSI GS63VR, ...) are beaten by around 60%. More information about Nvidia's Max-Q design is available in our dedicated article.
| 3DMark Vantage P Result | 39562 points | |
| 3DMark 11 Performance | 16821 points | |
| 3DMark Ice Storm Standard Score | 140964 points | |
| 3DMark Cloud Gate Standard Score | 27935 points | |
| 3DMark Fire Strike Score | 14260 points | |
| 3DMark Time Spy Score | 5390 points | |
Help | ||
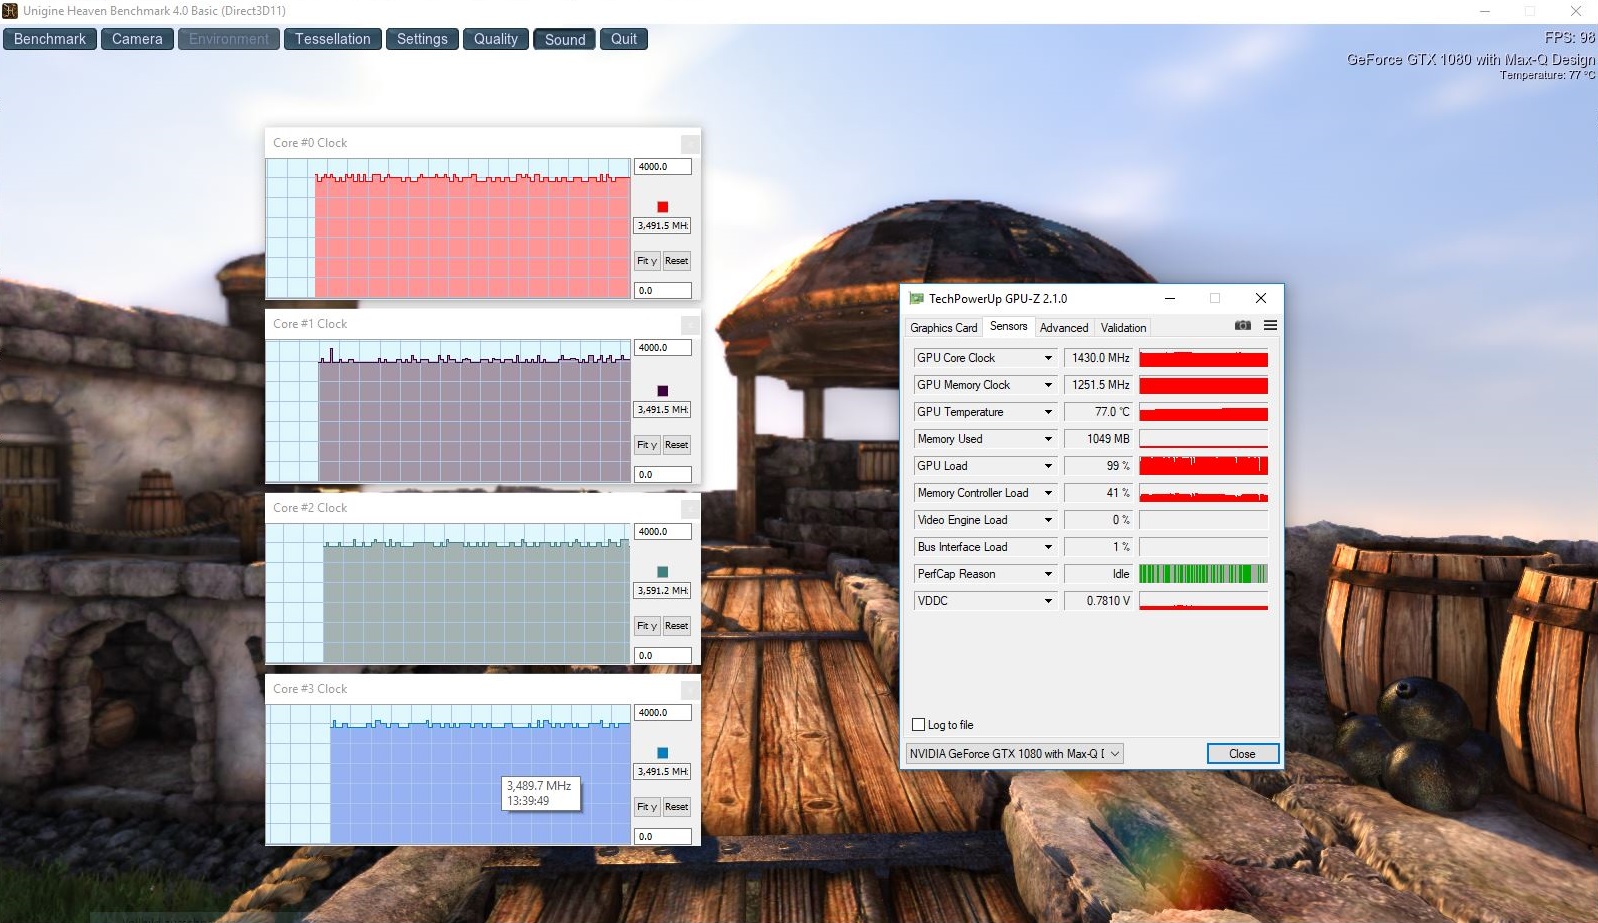
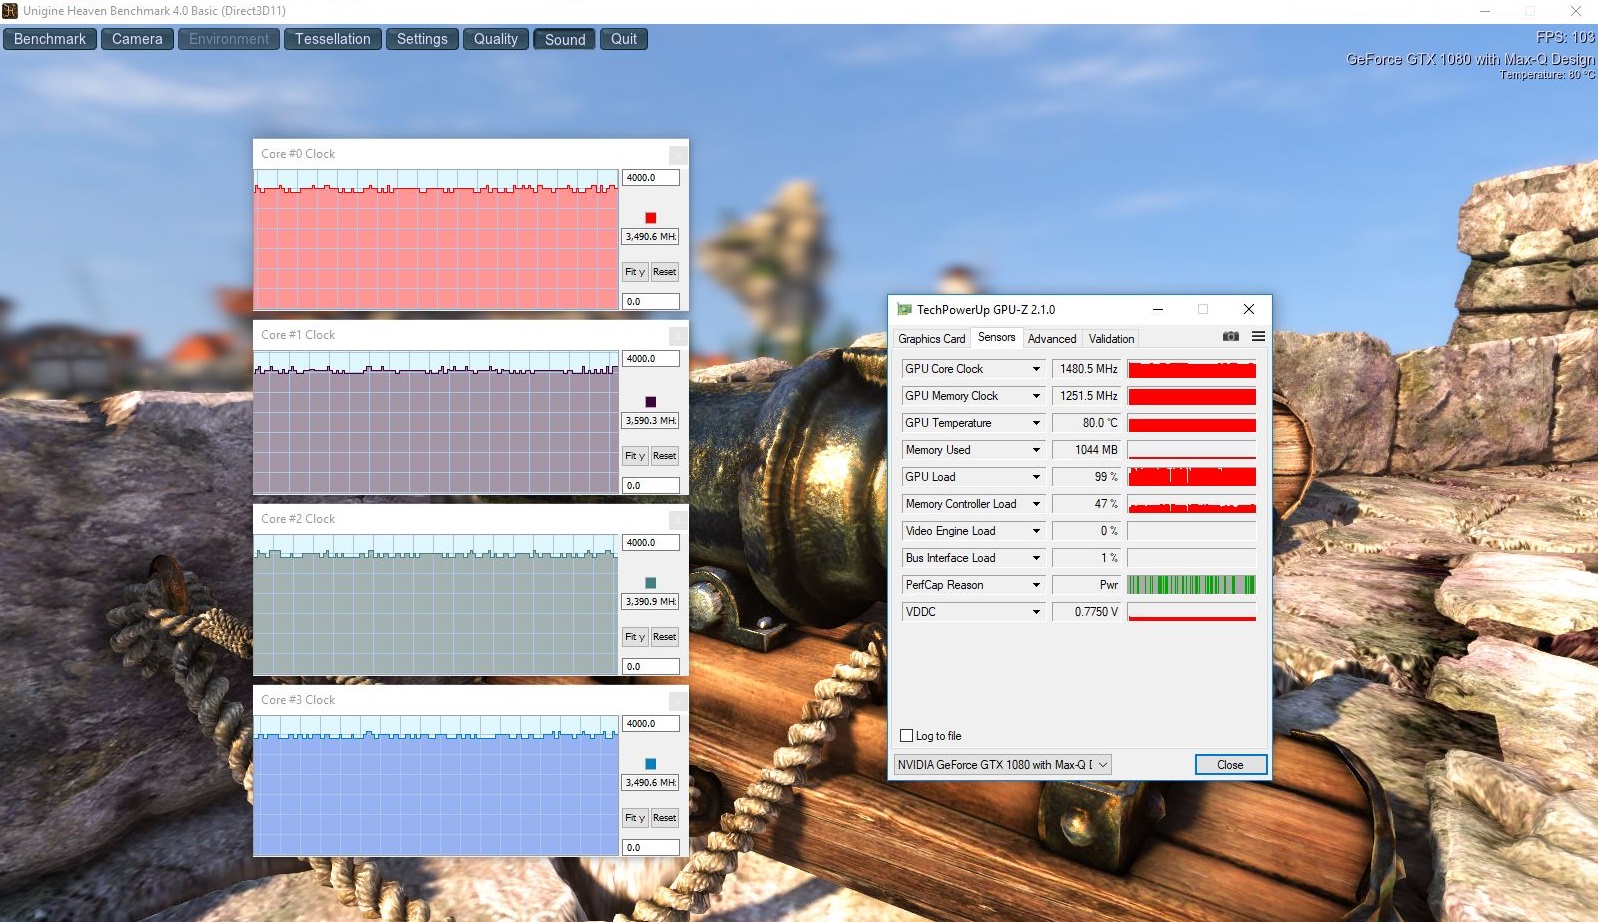
As with the CPU, the GPU can also maintain its performance for long periods. Our 60-minute test with “The Witcher 3” showed a steady clock of 1430 MHz for the GTX 1080 (~1480 MHz @Extreme Mode). The Full HD frame rate (ultra-settings) was always between 56 and 63 FPS.
Gaming Performance
Our gaming benchmarks confirm the synthetic results. The GeForce GTX 1080 Max-Q is once again closer to the GeForce GTX 1070 than the GTX 1080. The average performance ranking for all 24 tested titles is shown in the following table:
| Graphics card | Performance (Full HD/Ultra & UHD/High) |
|---|---|
| GeForce GTX 1080 | +17% |
| GeForce GTX 1080 Max-Q | Base |
| GeForce GTX 1070 | -9% |
| GeForce GTX 1060 | -35% |
Every gamer has to decide whether the combination of a portable chassis and 10% additional performance is worth the high additional charge over a GTX 1070 notebook. Thanks to the Max-Q design, however, you can now get serious GPU performance in laptops slimmer than 2 cm (~0.8 in), which were so far limited to mainstream chips or entry-level high-end GPUs. The advantage over the GTX 1060 is more than considerable at around 50%.
| The Witcher 3 | |
| 3840x2160 High Graphics & Postprocessing (Nvidia HairWorks Off) | |
| Asus G800VI Prototype | |
| Asus Zephyrus GX501 | |
| MSI GT62VR-6RE16H21 | |
| Schenker XMG P507 | |
| 1920x1080 Ultra Graphics & Postprocessing (HBAO+) | |
| Asus G800VI Prototype | |
| Asus Zephyrus GX501 | |
| MSI GT62VR-6RE16H21 | |
| Schenker XMG P507 | |
| Batman: Arkham Knight | |
| 3840x2160 High / On (Interactive Smoke & Paper Debris Off) AA:SM AF:8x | |
| Asus G800VI Prototype | |
| Asus Zephyrus GX501 | |
| MSI GT62VR-6RE16H21 | |
| Schenker XMG P507 | |
| 1920x1080 High / On AA:SM AF:16x | |
| Asus G800VI Prototype | |
| Asus Zephyrus GX501 | |
| MSI GT62VR-6RE16H21 | |
| Schenker XMG P507 | |
| Star Wars Battlefront | |
| 3840x2160 High Preset AA:FX | |
| Asus G800VI Prototype | |
| Asus Zephyrus GX501 | |
| MSI GT62VR-6RE16H21 | |
| Schenker XMG P507 | |
| 1920x1080 Ultra Preset AA:FX | |
| Asus G800VI Prototype | |
| Asus Zephyrus GX501 | |
| MSI GT62VR-6RE16H21 | |
| Schenker XMG P507 | |
| Assassin's Creed Syndicate | |
| 3840x2160 High Preset AA:FX | |
| Asus G800VI Prototype | |
| Asus Zephyrus GX501 | |
| MSI GT62VR-6RE16H21 | |
| Schenker XMG P507 | |
| 1920x1080 Ultra High Preset AA:4x MSAA + FX | |
| Asus G800VI Prototype | |
| Asus Zephyrus GX501 | |
| MSI GT62VR-6RE16H21 | |
| Schenker XMG P507 | |
| Rainbow Six Siege | |
| 3840x2160 High Preset AA:T AF:4x | |
| Asus G800VI Prototype | |
| Asus Zephyrus GX501 | |
| MSI GT62VR-6RE16H21 | |
| Schenker XMG P507 | |
| 1920x1080 Ultra Preset AA:T AF:16x | |
| Asus G800VI Prototype | |
| Asus Zephyrus GX501 | |
| MSI GT62VR-6RE16H21 | |
| Schenker XMG P507 | |
| Rise of the Tomb Raider | |
| 3840x2160 High Preset AA:FX AF:4x | |
| Asus G800VI Prototype | |
| Asus Zephyrus GX501 | |
| MSI GT62VR-6RE16H21 | |
| Schenker XMG P507 | |
| 1920x1080 Very High Preset AA:FX AF:16x | |
| Asus G800VI Prototype | |
| Asus Zephyrus GX501 | |
| MSI GT62VR-6RE16H21 | |
| Schenker XMG P507 | |
| Far Cry Primal | |
| 3840x2160 High Preset AA:SM | |
| Asus G800VI Prototype | |
| Asus Zephyrus GX501 | |
| MSI GT62VR-6RE16H21 | |
| Schenker XMG P507 | |
| 1920x1080 Ultra Preset AA:SM | |
| Asus G800VI Prototype | |
| Asus Zephyrus GX501 | |
| MSI GT62VR-6RE16H21 | |
| Schenker XMG P507 | |
| The Division | |
| 3840x2160 High Preset AF:8x | |
| Asus G800VI Prototype | |
| Asus Zephyrus GX501 | |
| MSI GT62VR-6RE16H21 | |
| Schenker XMG P507 | |
| 1920x1080 Ultra Preset AF:16x | |
| Asus G800VI Prototype | |
| Asus Zephyrus GX501 | |
| MSI GT62VR-6RE16H21 | |
| Schenker XMG P507 | |
| Doom | |
| 3840x2160 High Preset AA:FX | |
| Asus G800VI Prototype | |
| Asus Zephyrus GX501 | |
| MSI GT62VR-6RE16H21 | |
| Schenker XMG P507 | |
| 1920x1080 Ultra Preset AA:SM | |
| Asus G800VI Prototype | |
| Asus Zephyrus GX501 | |
| MSI GT62VR-6RE16H21 | |
| Schenker XMG P507 | |
| Mirror's Edge Catalyst | |
| 3840x2160 High Preset AF:16x | |
| Asus G800VI Prototype | |
| Asus Zephyrus GX501 | |
| MSI GT62VR-6RE16H21 | |
| Schenker XMG P507 | |
| 1920x1080 Ultra Preset AF:16x | |
| Asus G800VI Prototype | |
| Asus Zephyrus GX501 | |
| MSI GT62VR-6RE16H21 | |
| Schenker XMG P507 | |
| Deus Ex Mankind Divided | |
| 3840x2160 High Preset AF:4x | |
| MSI GT73VR 7RF-296 | |
| Asus Zephyrus GX501 | |
| Asus G752VS | |
| 1920x1080 Ultra Preset AA:2xMS AF:8x | |
| MSI GT73VR 7RF-296 | |
| Asus Zephyrus GX501 | |
| Asus G752VS | |
| Battlefield 1 | |
| 3840x2160 High Preset AA:T | |
| MSI GT73VR 7RF-296 | |
| Asus G752VS | |
| Asus Zephyrus GX501 | |
| 1920x1080 Ultra Preset AA:T | |
| MSI GT73VR 7RF-296 | |
| Asus G752VS | |
| Asus Zephyrus GX501 | |
| Titanfall 2 | |
| 3840x2160 High / Enabled AA:TS AF:8x | |
| MSI GT73VR 7RF-296 | |
| Asus Zephyrus GX501 | |
| Asus G752VS | |
| 1920x1080 Very High (Insane Texture Quality) / Enabled AA:TS AF:16x | |
| MSI GT73VR 7RF-296 | |
| Asus Zephyrus GX501 | |
| Asus G752VS | |
| Call of Duty Infinite Warfare | |
| 3840x2160 High / On AA:FX | |
| MSI GT73VR 7RF-296 | |
| Asus Zephyrus GX501 | |
| Asus G752VS | |
| MSI GT62VR | |
| 1920x1080 Ultra / On AA:T2X SM | |
| MSI GT73VR 7RF-296 | |
| Asus Zephyrus GX501 | |
| Asus G752VS | |
| MSI GT62VR | |
| Dishonored 2 | |
| 3840x2160 High Preset AA:TX | |
| MSI GT73VR 7RF-296 | |
| Asus Zephyrus GX501 | |
| Asus G752VS | |
| MSI GT62VR | |
| 1920x1080 Ultra Preset AA:TX | |
| MSI GT73VR 7RF-296 | |
| Asus Zephyrus GX501 | |
| Asus G752VS | |
| MSI GT62VR | |
| Watch Dogs 2 | |
| 3840x2160 High Preset | |
| MSI GT73VR 7RF-296 | |
| Asus Zephyrus GX501 | |
| Asus G752VS | |
| MSI GT62VR | |
| 1920x1080 Ultra Preset | |
| MSI GT73VR 7RF-296 | |
| Asus Zephyrus GX501 | |
| Asus G752VS | |
| MSI GT62VR | |
| Resident Evil 7 | |
| 3840x2160 High / On AA:FXAA+T | |
| Asus Zephyrus GX501 | |
| Asus G752VS | |
| MSI GT62VR | |
| 1920x1080 Very High / On AA:FXAA+T | |
| Asus Zephyrus GX501 | |
| Asus G752VS | |
| MSI GT62VR | |
| For Honor | |
| 3840x2160 High Preset AA:T AF:8x | |
| Asus Zephyrus GX501 | |
| Asus G752VS | |
| MSI GT62VR | |
| 1920x1080 Extreme Preset AA:T AF:16x | |
| Asus Zephyrus GX501 | |
| Asus G752VS | |
| MSI GT62VR | |
| Ghost Recon Wildlands | |
| 3840x2160 Very High Preset AA:T AF:8x | |
| Asus Zephyrus GX501 | |
| Asus G752VS | |
| MSI GT62VR | |
| 1920x1080 Ultra Preset AA:T AF:16x | |
| Asus Zephyrus GX501 | |
| Asus G752VS | |
| MSI GT62VR | |
| Mass Effect Andromeda | |
| 3840x2160 High Preset (Resolution Scale Mode off) AA:T | |
| Asus Zephyrus GX501 | |
| Asus G752VS | |
| MSI GT62VR | |
| 1920x1080 Ultra Preset (Resolution Scale Mode off) AA:T | |
| Asus G752VS | |
| Asus Zephyrus GX501 | |
| MSI GT62VR | |
| Prey | |
| 3840x2160 High Preset AA:2TX SM AF:8x | |
| Asus G752VS | |
| Asus Zephyrus GX501 | |
| MSI GT62VR | |
| 1920x1080 Very High Preset AA:2TX SM AF:16x | |
| Asus G752VS | |
| Asus Zephyrus GX501 | |
| MSI GT62VR | |
| Rocket League | |
| 3840x2160 High Quality AA:High FX | |
| Asus Zephyrus GX501 | |
| Asus G752VS | |
| MSI GT62VR | |
| 1920x1080 High Quality AA:High FX | |
| Asus Zephyrus GX501 | |
| Asus G752VS | |
| MSI GT62VR | |
| Dirt 4 - 1920x1080 Ultra Preset AA:4xMS AF:16x | |
| Asus Zephyrus GX501 | |
| Asus G752VS | |
| MSI GT62VR | |
The Zephyrus can generally handle every game smoothly in the native Full HD resolution (1920x1080 pixels); even the 120 Hz panel is maxed out in some cases. The GTX 1080 Max-Q will only struggle in poorly optimized titles like “Deus Ex Mankind Divided” or resolutions higher than Full HD. External 120 Hz panel would not make much sense here – at least in high or maximum settings. However, the GX501 usually never drops below 30 FPS, even at 3840x2160 pixels.
Also great: The driver (we use the preloaded ForceWar 382.22) already seems to be very sophisticated. We never encountered graphics errors, crashes or blue screens during the gaming benchmarks. Only the shader preload in “Call of Duty Infinite Warfare”, which is running at the initial game launch or when the hardware changes, took very long at almost 5 minutes.
| low | med. | high | ultra | QHD | 4K | |
|---|---|---|---|---|---|---|
| The Witcher 3 (2015) | 118 | 61.9 | 43.7 | |||
| Batman: Arkham Knight (2015) | 124 | 88 | 48 | |||
| Star Wars Battlefront (2015) | 164 | 144 | 55.6 | |||
| Assassin's Creed Syndicate (2015) | 74.4 | 50.3 | 40 | |||
| Rainbow Six Siege (2015) | 197 | 172 | 65.7 | |||
| Rise of the Tomb Raider (2016) | 125 | 105 | 43.6 | |||
| Far Cry Primal (2016) | 92 | 87 | 41 | |||
| The Division (2016) | 107 | 83.8 | 40.8 | |||
| Doom (2016) | 134 | 128 | 53.9 | |||
| Mirror's Edge Catalyst (2016) | 106 | 97.8 | 38.8 | |||
| Deus Ex Mankind Divided (2016) | 87.3 | 47.9 | 29.6 | |||
| Battlefield 1 (2016) | 130 | 113 | 49 | |||
| Titanfall 2 (2016) | 131 | 113 | 46.6 | |||
| Call of Duty Infinite Warfare (2016) | 123 | 118 | 63.7 | |||
| Dishonored 2 (2016) | 78.2 | 66.5 | 43.4 | |||
| Watch Dogs 2 (2016) | 86.7 | 66.7 | 34.9 | |||
| Resident Evil 7 (2017) | 166 | 140 | 47.4 | |||
| For Honor (2017) | 155 | 115 | 47.9 | |||
| Ghost Recon Wildlands (2017) | 86.7 | 51.9 | 34.1 | |||
| Mass Effect Andromeda (2017) | 81.4 | 73.2 | 35.1 | |||
| Warhammer 40.000: Dawn of War III (2017) | 88 | 86 | 41.9 | |||
| Prey (2017) | 135 | 131 | 50.5 | |||
| Rocket League (2017) | 235 | 103 | ||||
| Dirt 4 (2017) | 136 | 88.4 | ||||
| Team Fortress 2 (2017) | 124 | 125 | ||||
| Playerunknown's Battlegrounds (PUBG) (2017) | 125 | 111 | 104 | 79 | 27.1 | |
| Final Fantasy XV Benchmark (2018) | 130 | 86 | 64 | 27.2 | ||
| Far Cry New Dawn (2019) | 66 | 38 | ||||
| Dirt Rally 2.0 (2019) | 75 | 55.9 | 33.7 | |||
| The Division 2 (2019) | 74 | 51.5 | 27.8 | |||
| League of Legends (2019) | 145 | 144 |
Emissions
System Noise
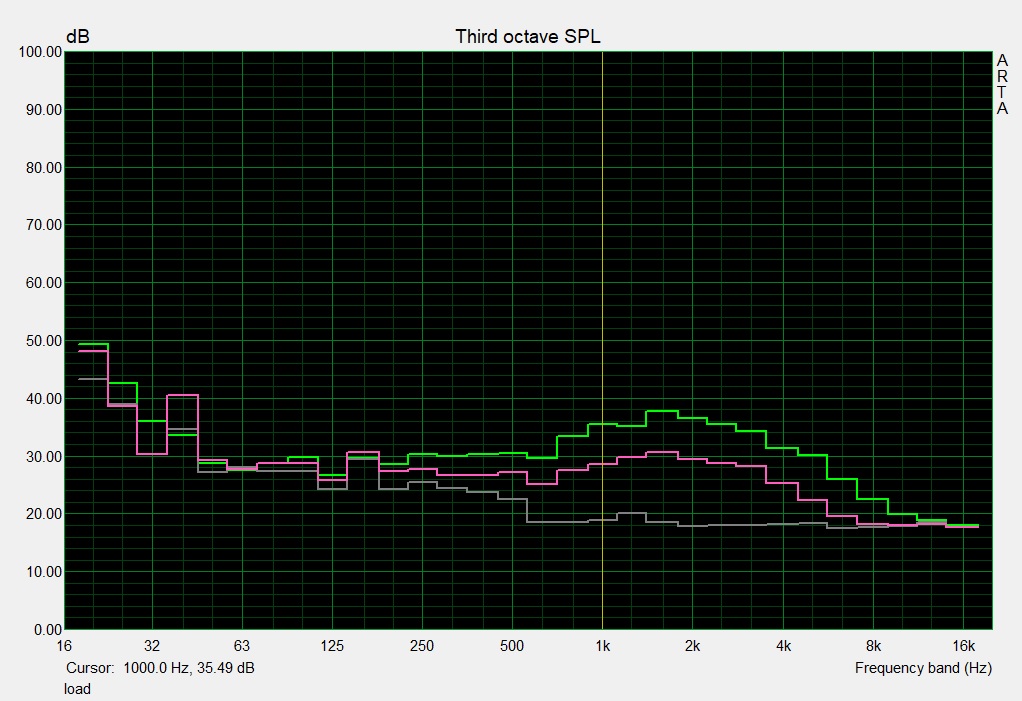
One of the most interesting aspects of Nvidia's Max-Q design is the noise limit. The GeForce GTX 1080 is supposed to reach no more than 40 dB(A), a level many gaming laptops (also less powerful) clearly exceed. We can more or less confirm this target range as long as you run "standard" 3D applications. 35 to 40 dB(A) in 3DMark 06 (average 39 dB(A)) and 42 dB(A) on average after 60 minutes of “The Witcher 3” is a good result for such a slim high-end notebook. The GX501 is only very loud under maximum load with the tools FurMark and Prime95. Our measurement device shows up to 46 dB(A) in this impractical scenario.
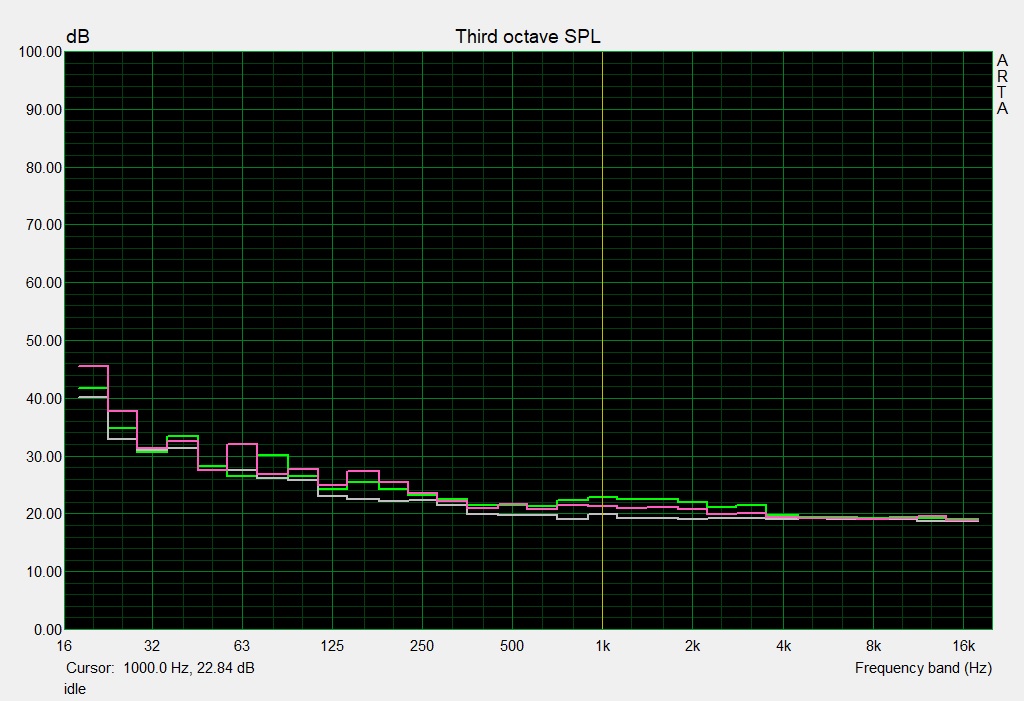
The 15-inch system handles idle periods at a very subtle noise level between 32 and 34 dB(A), even though the fans cover higher frequencies, so they are subjectively louder compared to other gaming notebooks and could be annoying for sensitive users. The cooling solution is never silent, but there is at least no unnecessary pulsating while idling.
Noise level
| Idle |
| 32 / 33 / 34 dB(A) |
| Load |
| 39 / 46 dB(A) |
 | ||
30 dB silent 40 dB(A) audible 50 dB(A) loud |
||
min: | ||
| Asus Zephyrus GX501 GeForce GTX 1080 Max-Q, i7-7700HQ | Alienware 15 R3 GeForce GTX 1070 Mobile, i7-7700HQ | Schenker XMG P507 PRO GeForce GTX 1070 Mobile, i7-7700HQ | Asus FX502VM-AS73 GeForce GTX 1060 Mobile, i7-7700HQ | Gigabyte Aero 15 GeForce GTX 1060 Mobile, i7-7700HQ | MSI GS63VR 7RF-228US GeForce GTX 1060 Mobile, i7-7700HQ | |
|---|---|---|---|---|---|---|
| Noise | -8% | -11% | -1% | -2% | -0% | |
| off / environment * (dB) | 31 | 30 3% | 31 -0% | 28.7 7% | 31 -0% | 28.8 7% |
| Idle Minimum * (dB) | 32 | 31 3% | 33 -3% | 30.6 4% | 32 -0% | 33.1 -3% |
| Idle Average * (dB) | 33 | 32 3% | 34 -3% | 30.6 7% | 33 -0% | 33.1 -0% |
| Idle Maximum * (dB) | 34 | 42 -24% | 44 -29% | 31 9% | 34 -0% | 34 -0% |
| Load Average * (dB) | 39 | 49 -26% | 46 -18% | 46.2 -18% | 39 -0% | 37.2 5% |
| Witcher 3 ultra * (dB) | 42 | 43 -2% | 46.1 -10% | |||
| Load Maximum * (dB) | 46 | 50 -9% | 52 -13% | 52.3 -14% | 50 -9% | 47.1 -2% |
* ... smaller is better
Temperature
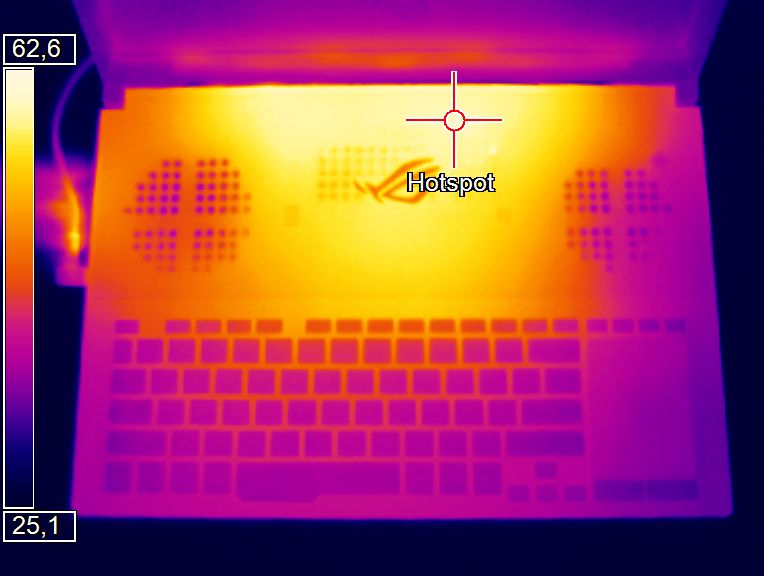
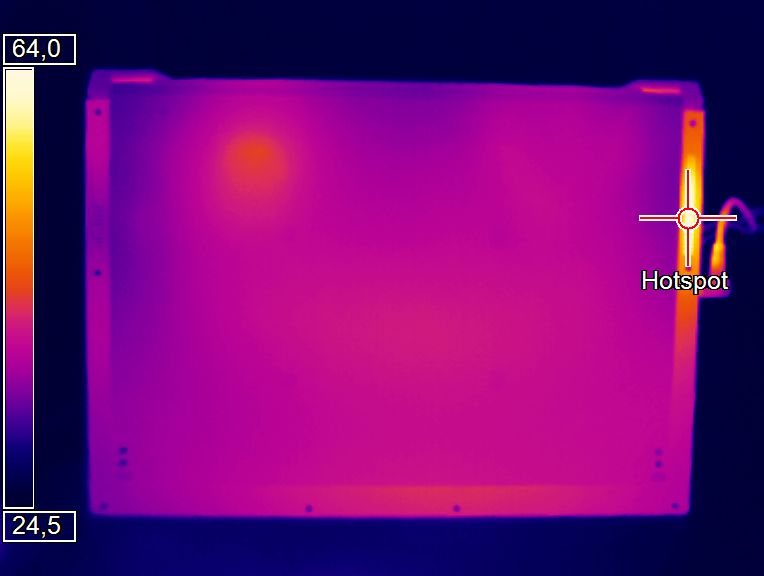
The major disadvantage of the slim construction and the limited noise level is the high temperature development of the case and the hardware. We can measure temperatures exceeding 50 °C (~122 °F) at some spots, both during the stress test as well as “The Witcher 3”. This is - as long as you do not use the GX501 on your lap – not a serious problem, but the keyboard also warms up to more than 40 °C (~104 °F) in practice, which can be uncomfortable for some users. The new Max-Q design is not a "saviour" for notebooks after all.
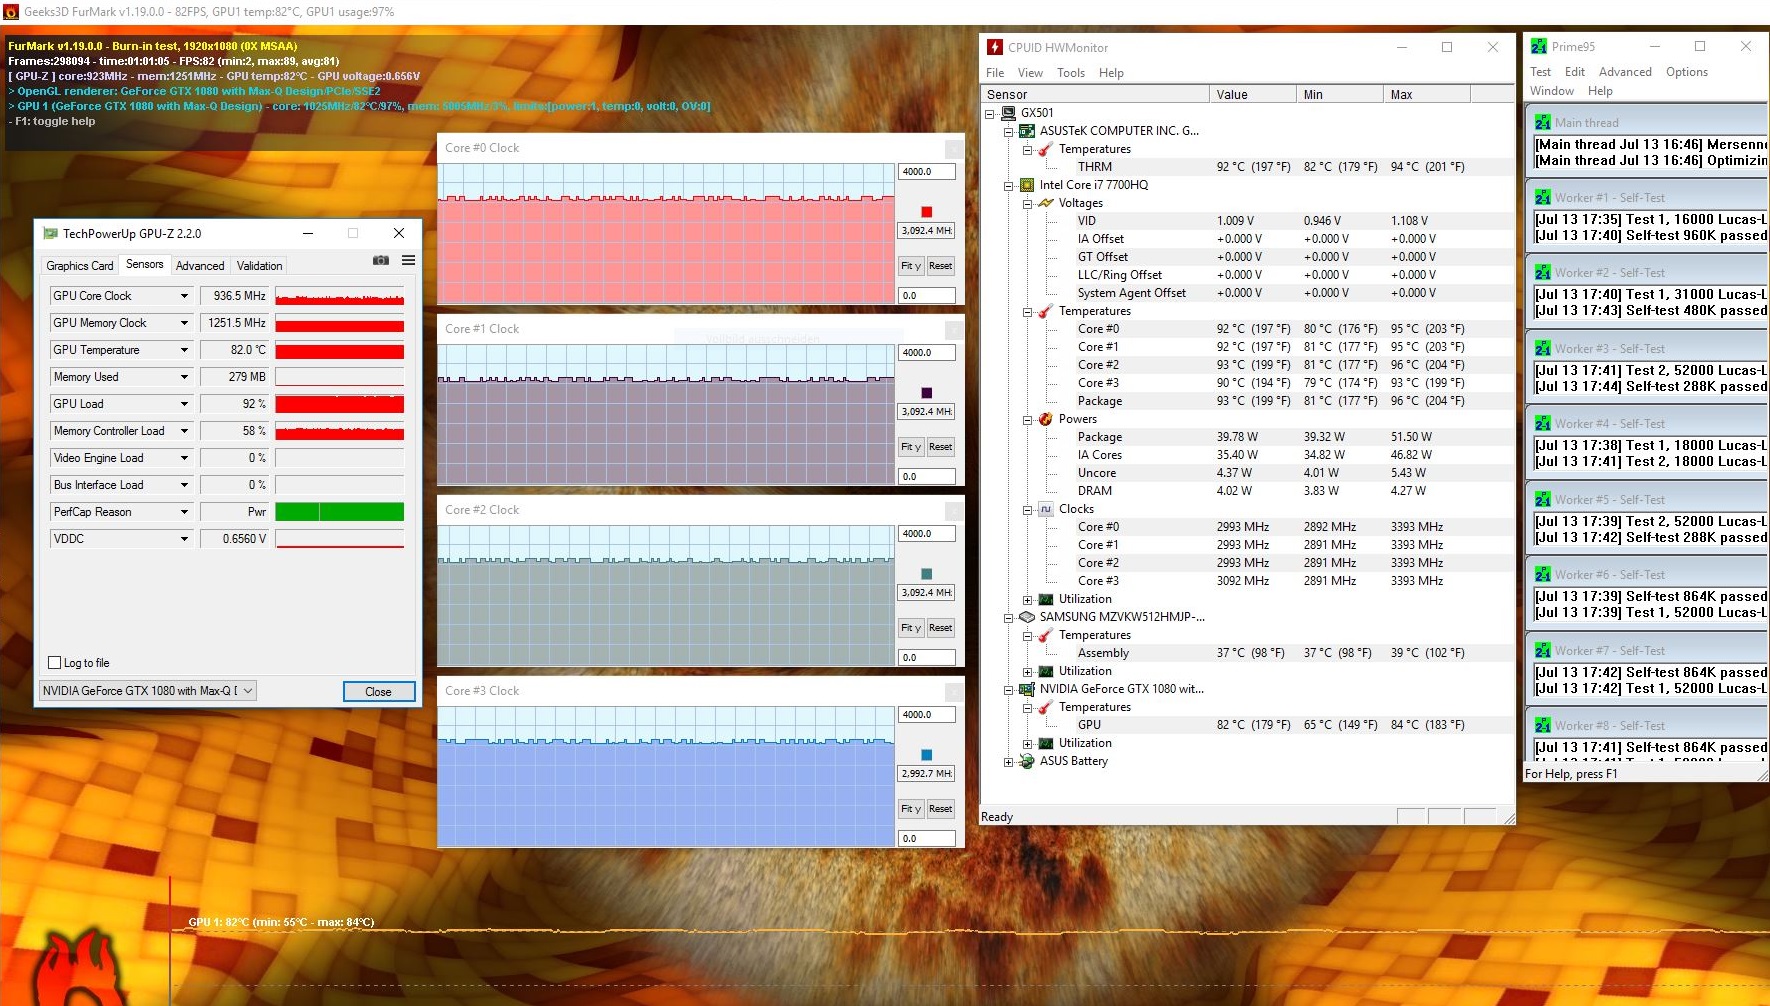
However, the main issue here should be the CPU. Intel has hardly worked on the thermal management or the efficiency, respectively, due to the lack of real competition, so the processor gets very warm in almost all gaming laptops. After a maximum load for one hour (again FurMark & Prime95), the CPU temperature climbed to more than 90 °C (~194 °F). The GeForce GTX 1080 Max-Q stayed a bit cooler at around 82 °C (~179 °F), but throttled to less than 1000 MHz. The GPU did not throttle in “The Witcher 3” at around 79 °C (~174 °F).
However, we performed the measurements on a very hot summer day, so the values should be lower in cooler environments, especially during the winter. There is no criticism for the idle results. A chassis temperature of around 30 °C (~86 °F) is not a great result, but the laptop is pretty cool while idling.
(-) The maximum temperature on the upper side is 57 °C / 135 F, compared to the average of 40.4 °C / 105 F, ranging from 21.2 to 68.8 °C for the class Gaming.
(-) The bottom heats up to a maximum of 54 °C / 129 F, compared to the average of 43.2 °C / 110 F
(+) In idle usage, the average temperature for the upper side is 30.7 °C / 87 F, compared to the device average of 33.9 °C / 93 F.
(-) Playing The Witcher 3, the average temperature for the upper side is 46.8 °C / 116 F, compared to the device average of 33.9 °C / 93 F.
(-) The palmrests and touchpad can get very hot to the touch with a maximum of 42 °C / 107.6 F.
(-) The average temperature of the palmrest area of similar devices was 28.8 °C / 83.8 F (-13.2 °C / -23.8 F).
These are the results with the second test model at lower ambient temperatures (maximum load scenario). Especially the palm rests stay cooler.
(-) The maximum temperature on the upper side is 54 °C / 129 F, compared to the average of 40.4 °C / 105 F, ranging from 21.2 to 68.8 °C for the class Gaming.
(-) The bottom heats up to a maximum of 48 °C / 118 F, compared to the average of 43.2 °C / 110 F
(-) Playing The Witcher 3, the average temperature for the upper side is 45.3 °C / 114 F, compared to the device average of 33.9 °C / 93 F.
(±) The palmrests and touchpad can get very hot to the touch with a maximum of 37 °C / 98.6 F.
(-) The average temperature of the palmrest area of similar devices was 28.8 °C / 83.8 F (-8.2 °C / -14.8 F).
| Asus Zephyrus GX501 GeForce GTX 1080 Max-Q, i7-7700HQ | Alienware 15 R3 GeForce GTX 1070 Mobile, i7-7700HQ | Schenker XMG P507 PRO GeForce GTX 1070 Mobile, i7-7700HQ | Asus FX502VM-AS73 GeForce GTX 1060 Mobile, i7-7700HQ | Gigabyte Aero 15 GeForce GTX 1060 Mobile, i7-7700HQ | MSI GS63VR 7RF-228US GeForce GTX 1060 Mobile, i7-7700HQ | |
|---|---|---|---|---|---|---|
| Heat | -4% | -2% | 3% | 9% | 8% | |
| Maximum Upper Side * (°C) | 57 | 46 19% | 49.2 14% | 53.2 7% | 56 2% | |
| Maximum Bottom * (°C) | 54 | 51.8 4% | 62 -15% | 56.8 -5% | 61 -13% | |
| Idle Upper Side * (°C) | 32 | 36.5 -14% | 32.4 -1% | 28.8 10% | 25 22% | 28.4 11% |
| Idle Bottom * (°C) | 31 | 38.2 -23% | 33 -6% | 31.4 -1% | 24 23% | 29.6 5% |
* ... smaller is better
Speakers
Asus has positioned the speakers on the left and right next to the keyboard, so none of the components can affect the cooling performance. The area should usually not be covered by the hands, so we do not expect any limitations for the sound in practice.
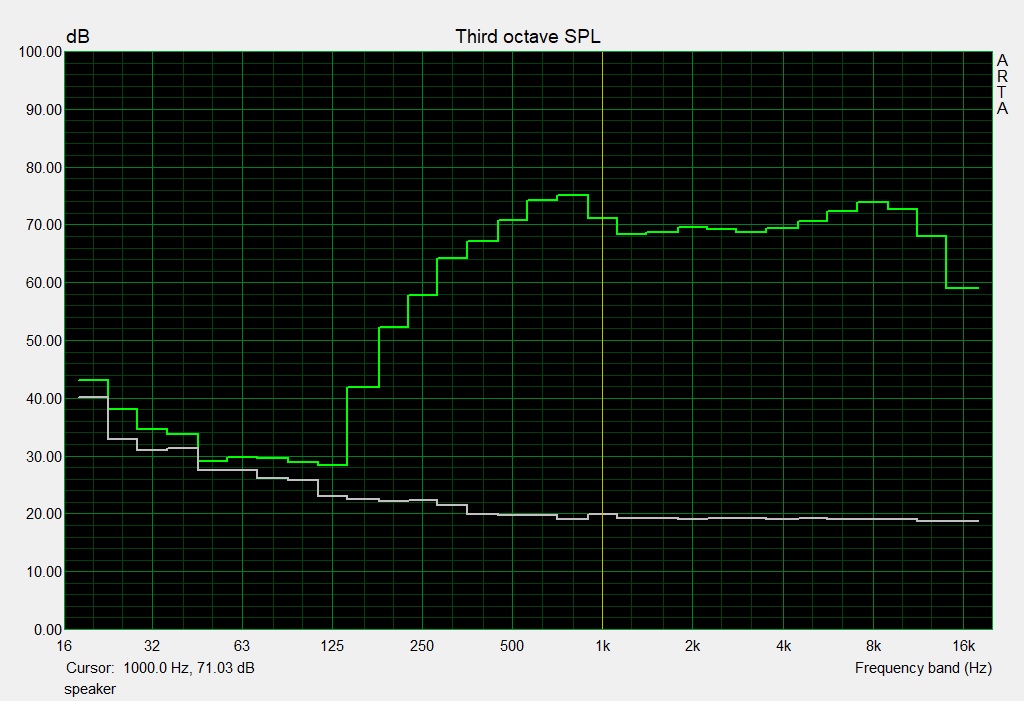
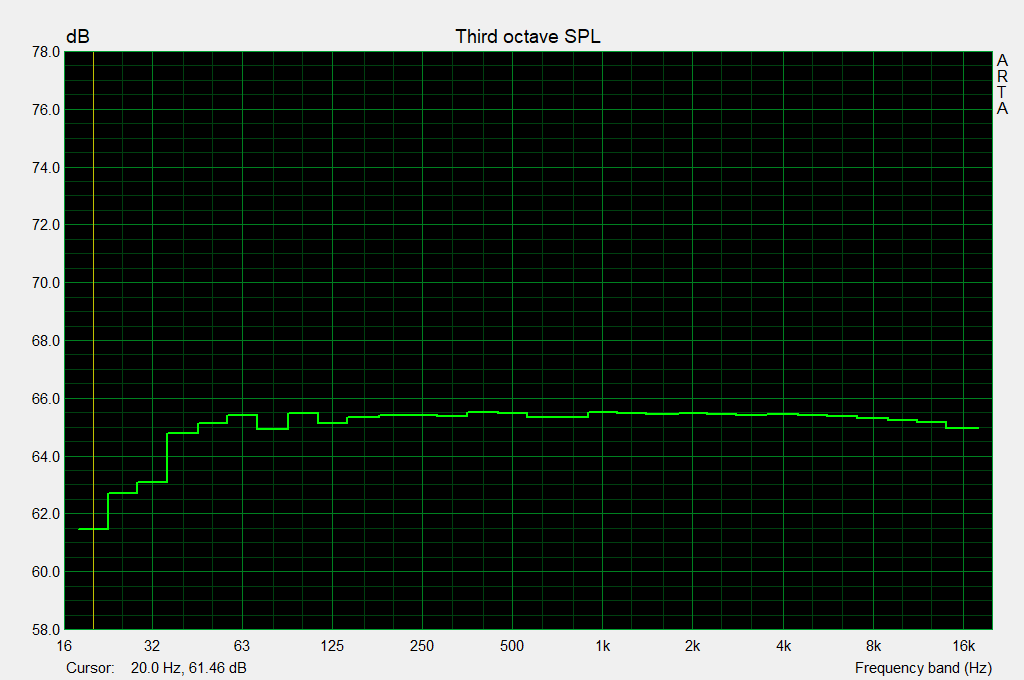
Speaking of sound: Our audio analysis shows an average performance among gaming laptops. The sound quality is similar to the Gigabyte Aero 15, which represents mids and highs quite accurately, but it has the same struggles with deep tones and bass. The maximum volume of 83 dB(A) is sufficient for small and medium-sized rooms. The performance is certainly okay for portable multimedia purposes, and Asus deserves some respect, considering the slim case.
You should still use external solutions if possible when you use the laptop stationary. We used the sound profile Music for our test. The software Sonic Studio II provides several modes and sound enhancements.
Asus Zephyrus GX501 audio analysis
(+) | speakers can play relatively loud (83 dB)
Bass 100 - 315 Hz
(-) | nearly no bass - on average 23.2% lower than median
(±) | linearity of bass is average (12.5% delta to prev. frequency)
Mids 400 - 2000 Hz
(+) | balanced mids - only 2.4% away from median
(+) | mids are linear (4.8% delta to prev. frequency)
Highs 2 - 16 kHz
(+) | balanced highs - only 2.2% away from median
(+) | highs are linear (2% delta to prev. frequency)
Overall 100 - 16.000 Hz
(±) | linearity of overall sound is average (16.8% difference to median)
Compared to same class
» 44% of all tested devices in this class were better, 11% similar, 45% worse
» The best had a delta of 6%, average was 18%, worst was 132%
Compared to all devices tested
» 30% of all tested devices were better, 7% similar, 63% worse
» The best had a delta of 4%, average was 23%, worst was 134%
Gigabyte Aero 15 audio analysis
(±) | speaker loudness is average but good (79 dB)
Bass 100 - 315 Hz
(-) | nearly no bass - on average 23.3% lower than median
(±) | linearity of bass is average (10.7% delta to prev. frequency)
Mids 400 - 2000 Hz
(+) | balanced mids - only 1.8% away from median
(+) | mids are linear (4.1% delta to prev. frequency)
Highs 2 - 16 kHz
(+) | balanced highs - only 2.6% away from median
(+) | highs are linear (5.1% delta to prev. frequency)
Overall 100 - 16.000 Hz
(±) | linearity of overall sound is average (18.3% difference to median)
Compared to same class
» 56% of all tested devices in this class were better, 7% similar, 38% worse
» The best had a delta of 5%, average was 17%, worst was 45%
Compared to all devices tested
» 40% of all tested devices were better, 8% similar, 52% worse
» The best had a delta of 4%, average was 23%, worst was 134%
Frequency Comparison (Checkboxes select/deselectable!)
Energy Management
Power Consumption
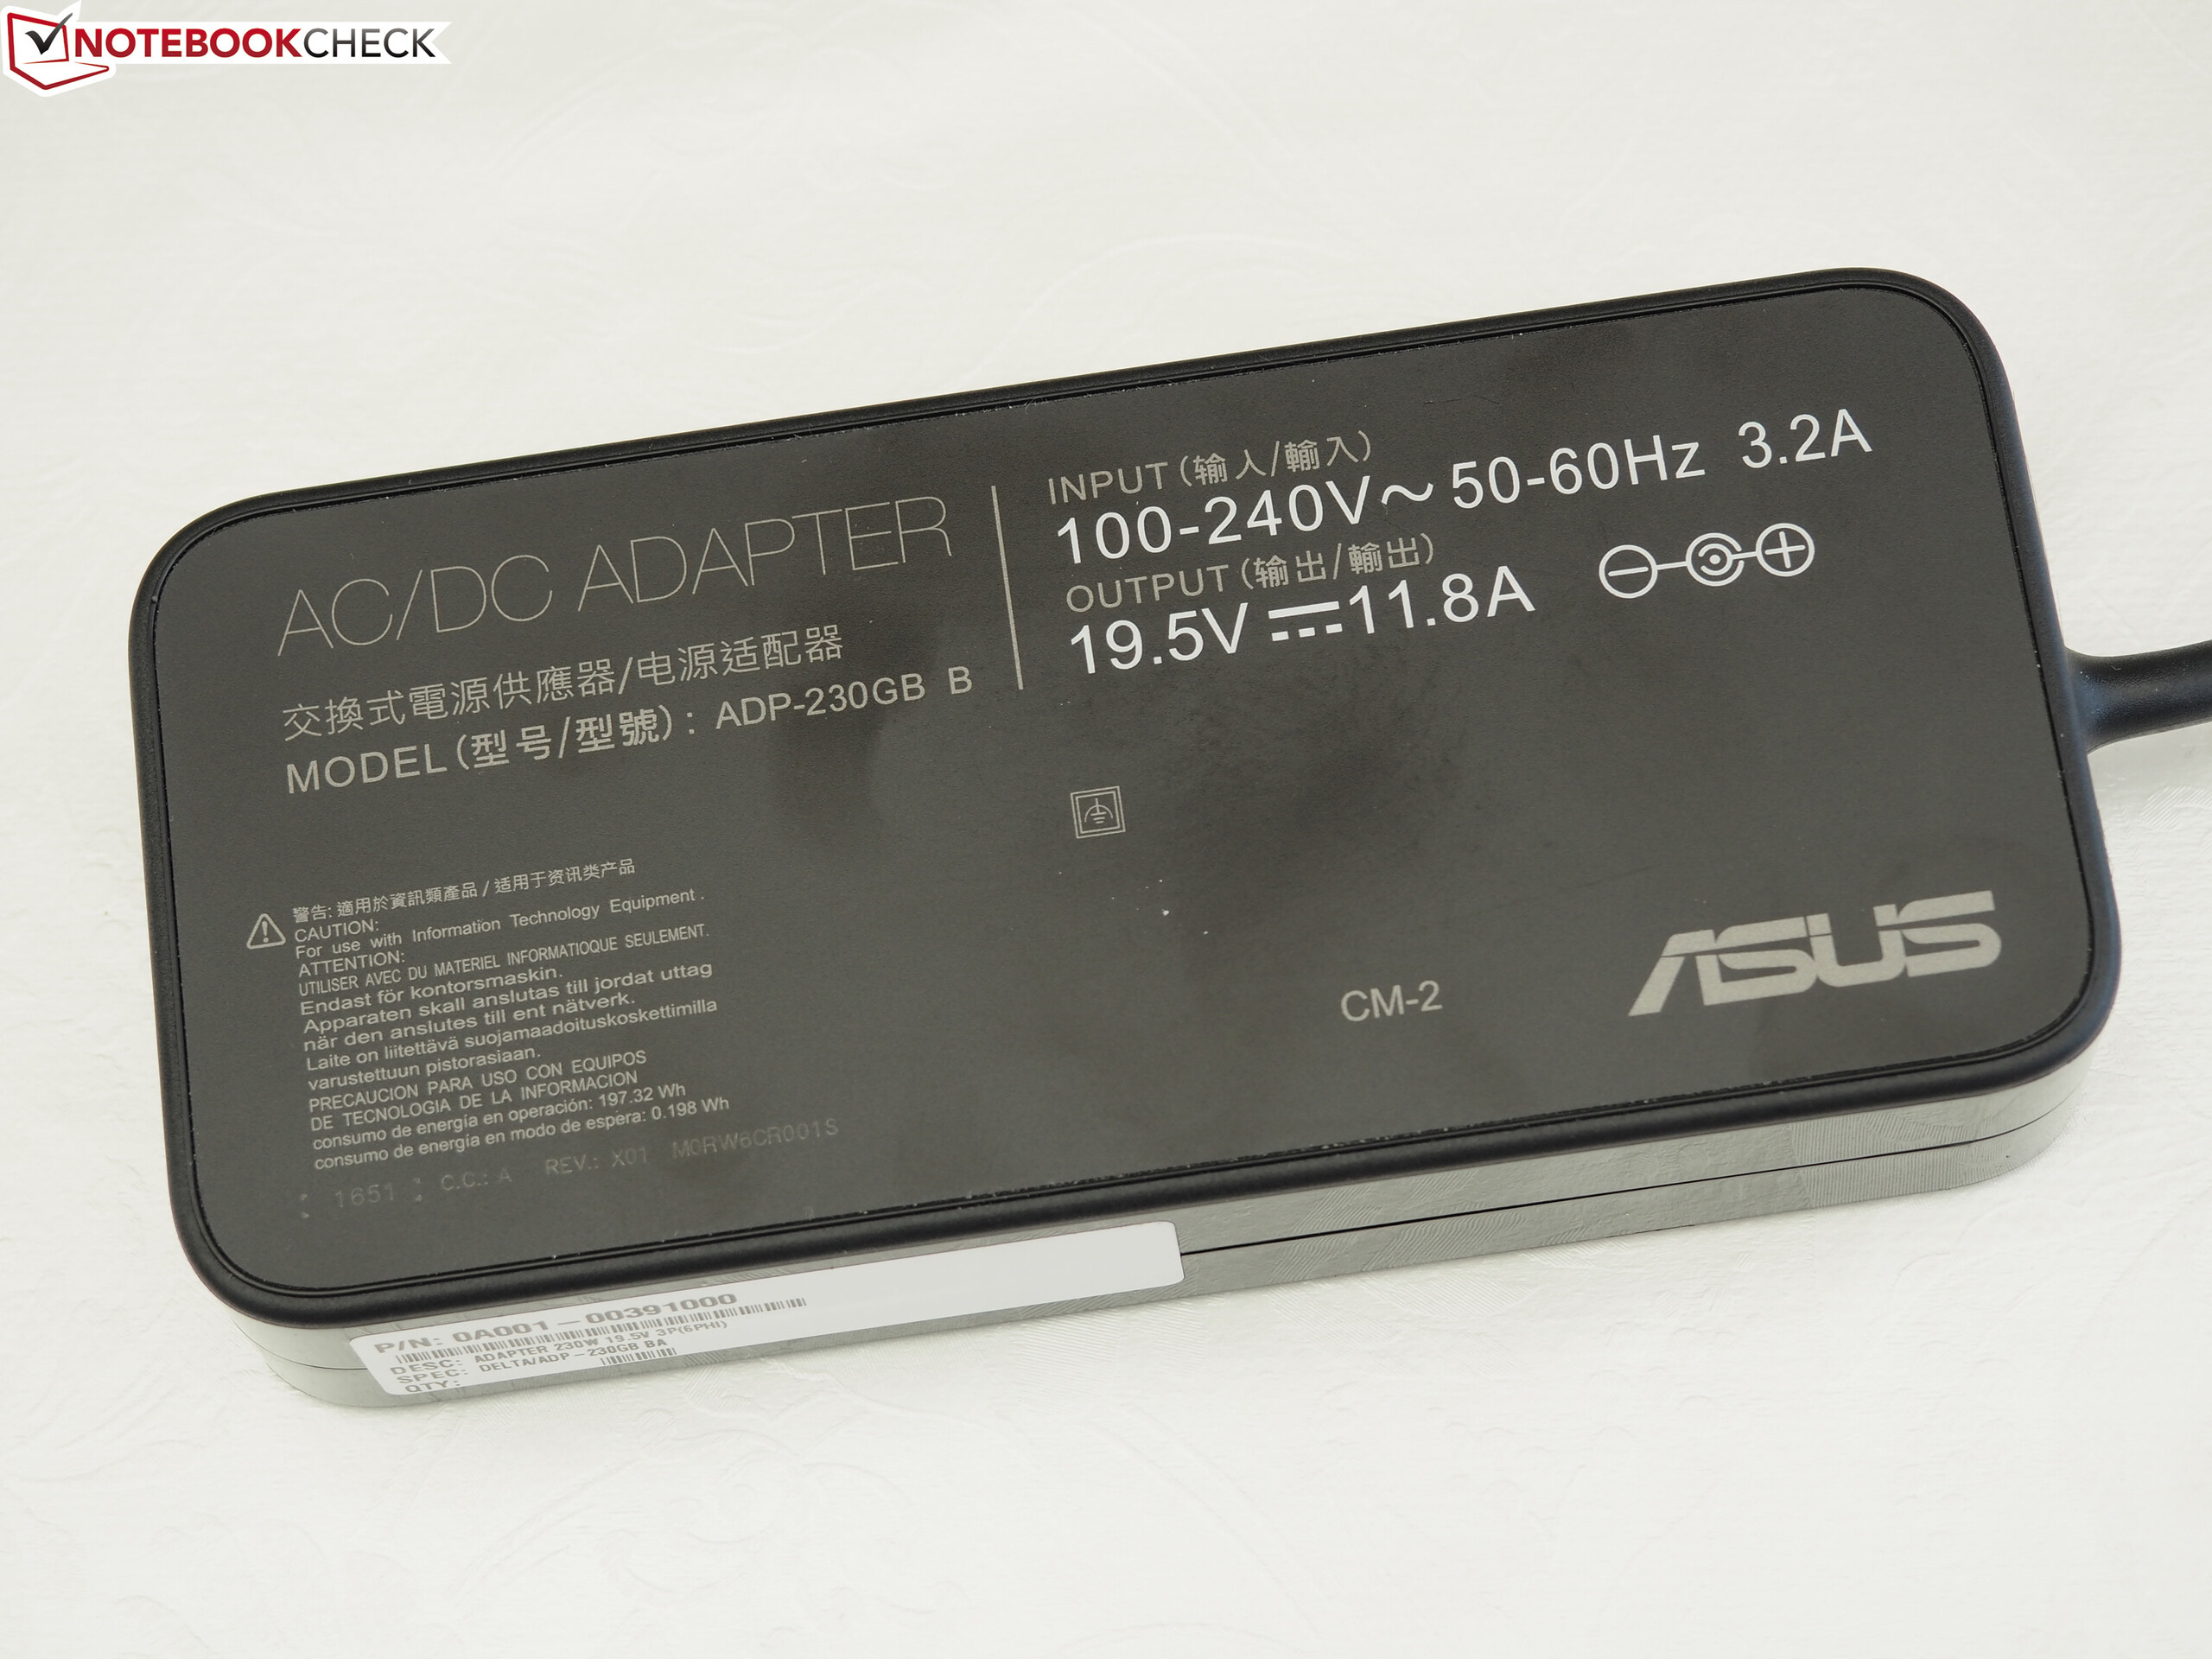
Nvidia deserves praise for the optimization of the efficiency. While regular GTX 1080 laptops require extremely bulky and heavy 330-watt power adapters, the Zephyrus requires only a 230-watt model similar to most GTX 1070 systems. The PSU measures just 16.5 x 7.5 x 3 cm (~6.5 x 3 x 1.2 in) and is even smaller compared to many rivals.
The positive impression is confirmed by our benchmarks. The 15-inch laptop consumes only 79 watts in 3DMark 06. This value could also be from a GTX 1060 notebook or it even beats these systems. The consumption moves towards the GTX 1070 only under maximum load. Asus uses G-Sync in favor of Optimus, so the idle results are just mediocre (18 to 31 watts). Gigabyte does a better job with the Aero 15 (12 to 20 watts).
| Off / Standby | |
| Idle | |
| Load |
|
Key:
min: | |
| Asus Zephyrus GX501 GeForce GTX 1080 Max-Q, i7-7700HQ | Alienware 15 R3 GeForce GTX 1070 Mobile, i7-7700HQ | Schenker XMG P507 PRO GeForce GTX 1070 Mobile, i7-7700HQ | Asus FX502VM-AS73 GeForce GTX 1060 Mobile, i7-7700HQ | Gigabyte Aero 15 GeForce GTX 1060 Mobile, i7-7700HQ | MSI GS63VR 7RF-228US GeForce GTX 1060 Mobile, i7-7700HQ | |
|---|---|---|---|---|---|---|
| Power Consumption | -1% | 11% | 18% | 24% | 17% | |
| Idle Minimum * (Watt) | 18 | 19 -6% | 14 22% | 14.9 17% | 12 33% | 14.5 19% |
| Idle Average * (Watt) | 23 | 23 -0% | 18 22% | 15.1 34% | 15 35% | 17.3 25% |
| Idle Maximum * (Watt) | 31 | 29 6% | 24 23% | 15.2 51% | 20 35% | 17.4 44% |
| Load Average * (Watt) | 79 | 85 -8% | 87 -10% | 105.8 -34% | 82 -4% | 93 -18% |
| Witcher 3 ultra * (Watt) | 148 | 111 25% | 128.8 13% | |||
| Load Maximum * (Watt) | 196 | 192 2% | 201 -3% | 148.8 24% | 161 18% |
* ... smaller is better
Battery Runtime
One of the biggest issues for many potential buyers is probably the battery runtime. Asus has equipped the GX501 with a 4-cell battery to realize the "ultra-slim and ultra-fast" concept. 50 Wh is not a lot and counteracts the mobility aspect. Why get a very slim and light chassis, when the battery is drained after a short while?
However, this is unfortunately the case with the Zephyrus. The longest runtime, even at the lowest luminance, is 3 hours. Around 2 hours web browsing and 2 hours video playback (display at 150 nits in both cases) is no highlight either. Stress the notebook harder and the battery will run out of juice after less than one hour. For comparison: The 99-Wh battery of the Alienware 15 R3 manages twice as much in all scenarios. The battery performance is at least not significantly reduced. Our test with “The Witcher 3” (Full HD/Ultra) shows a moderate frame rate drop of only 18%, which is pretty good for a high-end notebook.
| Asus Zephyrus GX501 GeForce GTX 1080 Max-Q, i7-7700HQ, 50 Wh | Alienware 15 R3 GeForce GTX 1070 Mobile, i7-7700HQ, 99 Wh | Schenker XMG P507 PRO GeForce GTX 1070 Mobile, i7-7700HQ, 60 Wh | Asus FX502VM-AS73 GeForce GTX 1060 Mobile, i7-7700HQ, 64 Wh | Gigabyte Aero 15 GeForce GTX 1060 Mobile, i7-7700HQ, 94.24 Wh | MSI GS63VR 7RF-228US GeForce GTX 1060 Mobile, i7-7700HQ, 65 Wh | |
|---|---|---|---|---|---|---|
| Battery runtime | 112% | 57% | 88% | 220% | 90% | |
| Reader / Idle (h) | 3.1 | 6.4 106% | 6.1 97% | 10.6 242% | 6.4 106% | |
| H.264 (h) | 2.2 | 4.4 100% | 3.6 64% | 7.7 250% | ||
| WiFi v1.3 (h) | 2.2 | 4.4 100% | 3.3 50% | 4.6 109% | 7 218% | 3.9 77% |
| Load (h) | 0.7 | 1.7 143% | 1.1 57% | 1.9 171% | 1.3 86% |
Verdict
Pros
Cons
The verdict about the 3000-Euro (~$3405) ROG Zephyrus GX501 mainly depends on two things: 1) Does price matter? And: 2) How important is the mobility aspect? Users willing to pay a lot for an extremely slim and powerful notebook get a very stylish and comparatively light case. It features great materials, a 120 Hz panel with G-Sync support and a level of performance that – in this class – is unrivaled so far.
However, if you are more price-conscious and do not care about every last millimeter, the GX501 suddenly appears a lot less attractive. The ultra-slim concept does not only affect the temperatures (the chassis gets very hot under load), but also the maintenance, input devices, port selection (no card reader, no RJ45-LAN) and especially the battery runtime, which is disappointingly short for a supposedly mobile laptop at up to 3 hours.
Thicker GTX 1070 laptops like the Asus Strix GL502VS do not make as many compromises and are more affordable.
All in all, the Zephyrus GX501 still gets a "good" rating and will enter the Top 10 ranking for slim and light gaming laptops in the next update.
Asus Zephyrus GX501
- 07/13/2017 v6 (old)
Florian Glaser, Klaus Hinum, J. Simon Leitner
Price comparison

