Asus FX502VM-AS73 Notebook Review
In a similar manner to how the MSI GE series is a cutdown version of the more expensive GT series with the same chassis largely intact, the FX502VM is a watered down version of the GL502VM. This is the same chassis almost verbatim save for some slight changes to the ports and color scheme. As such, we recommend checking out our existing review of the GL502VM for more information on the chassis and its features as nearly all of our comments carry over.
Has the FX502VM made any other changes under the hood to reach those lower starting prices of $1000 or $1100 USD? Asus has surgically removed a few hardware features that potential buyers should be aware of, though they fortunately all have no major impact on gaming performance. In this review, we'll go over the minute differences between the FX502VM and its pricier GL502VM twin.
Case
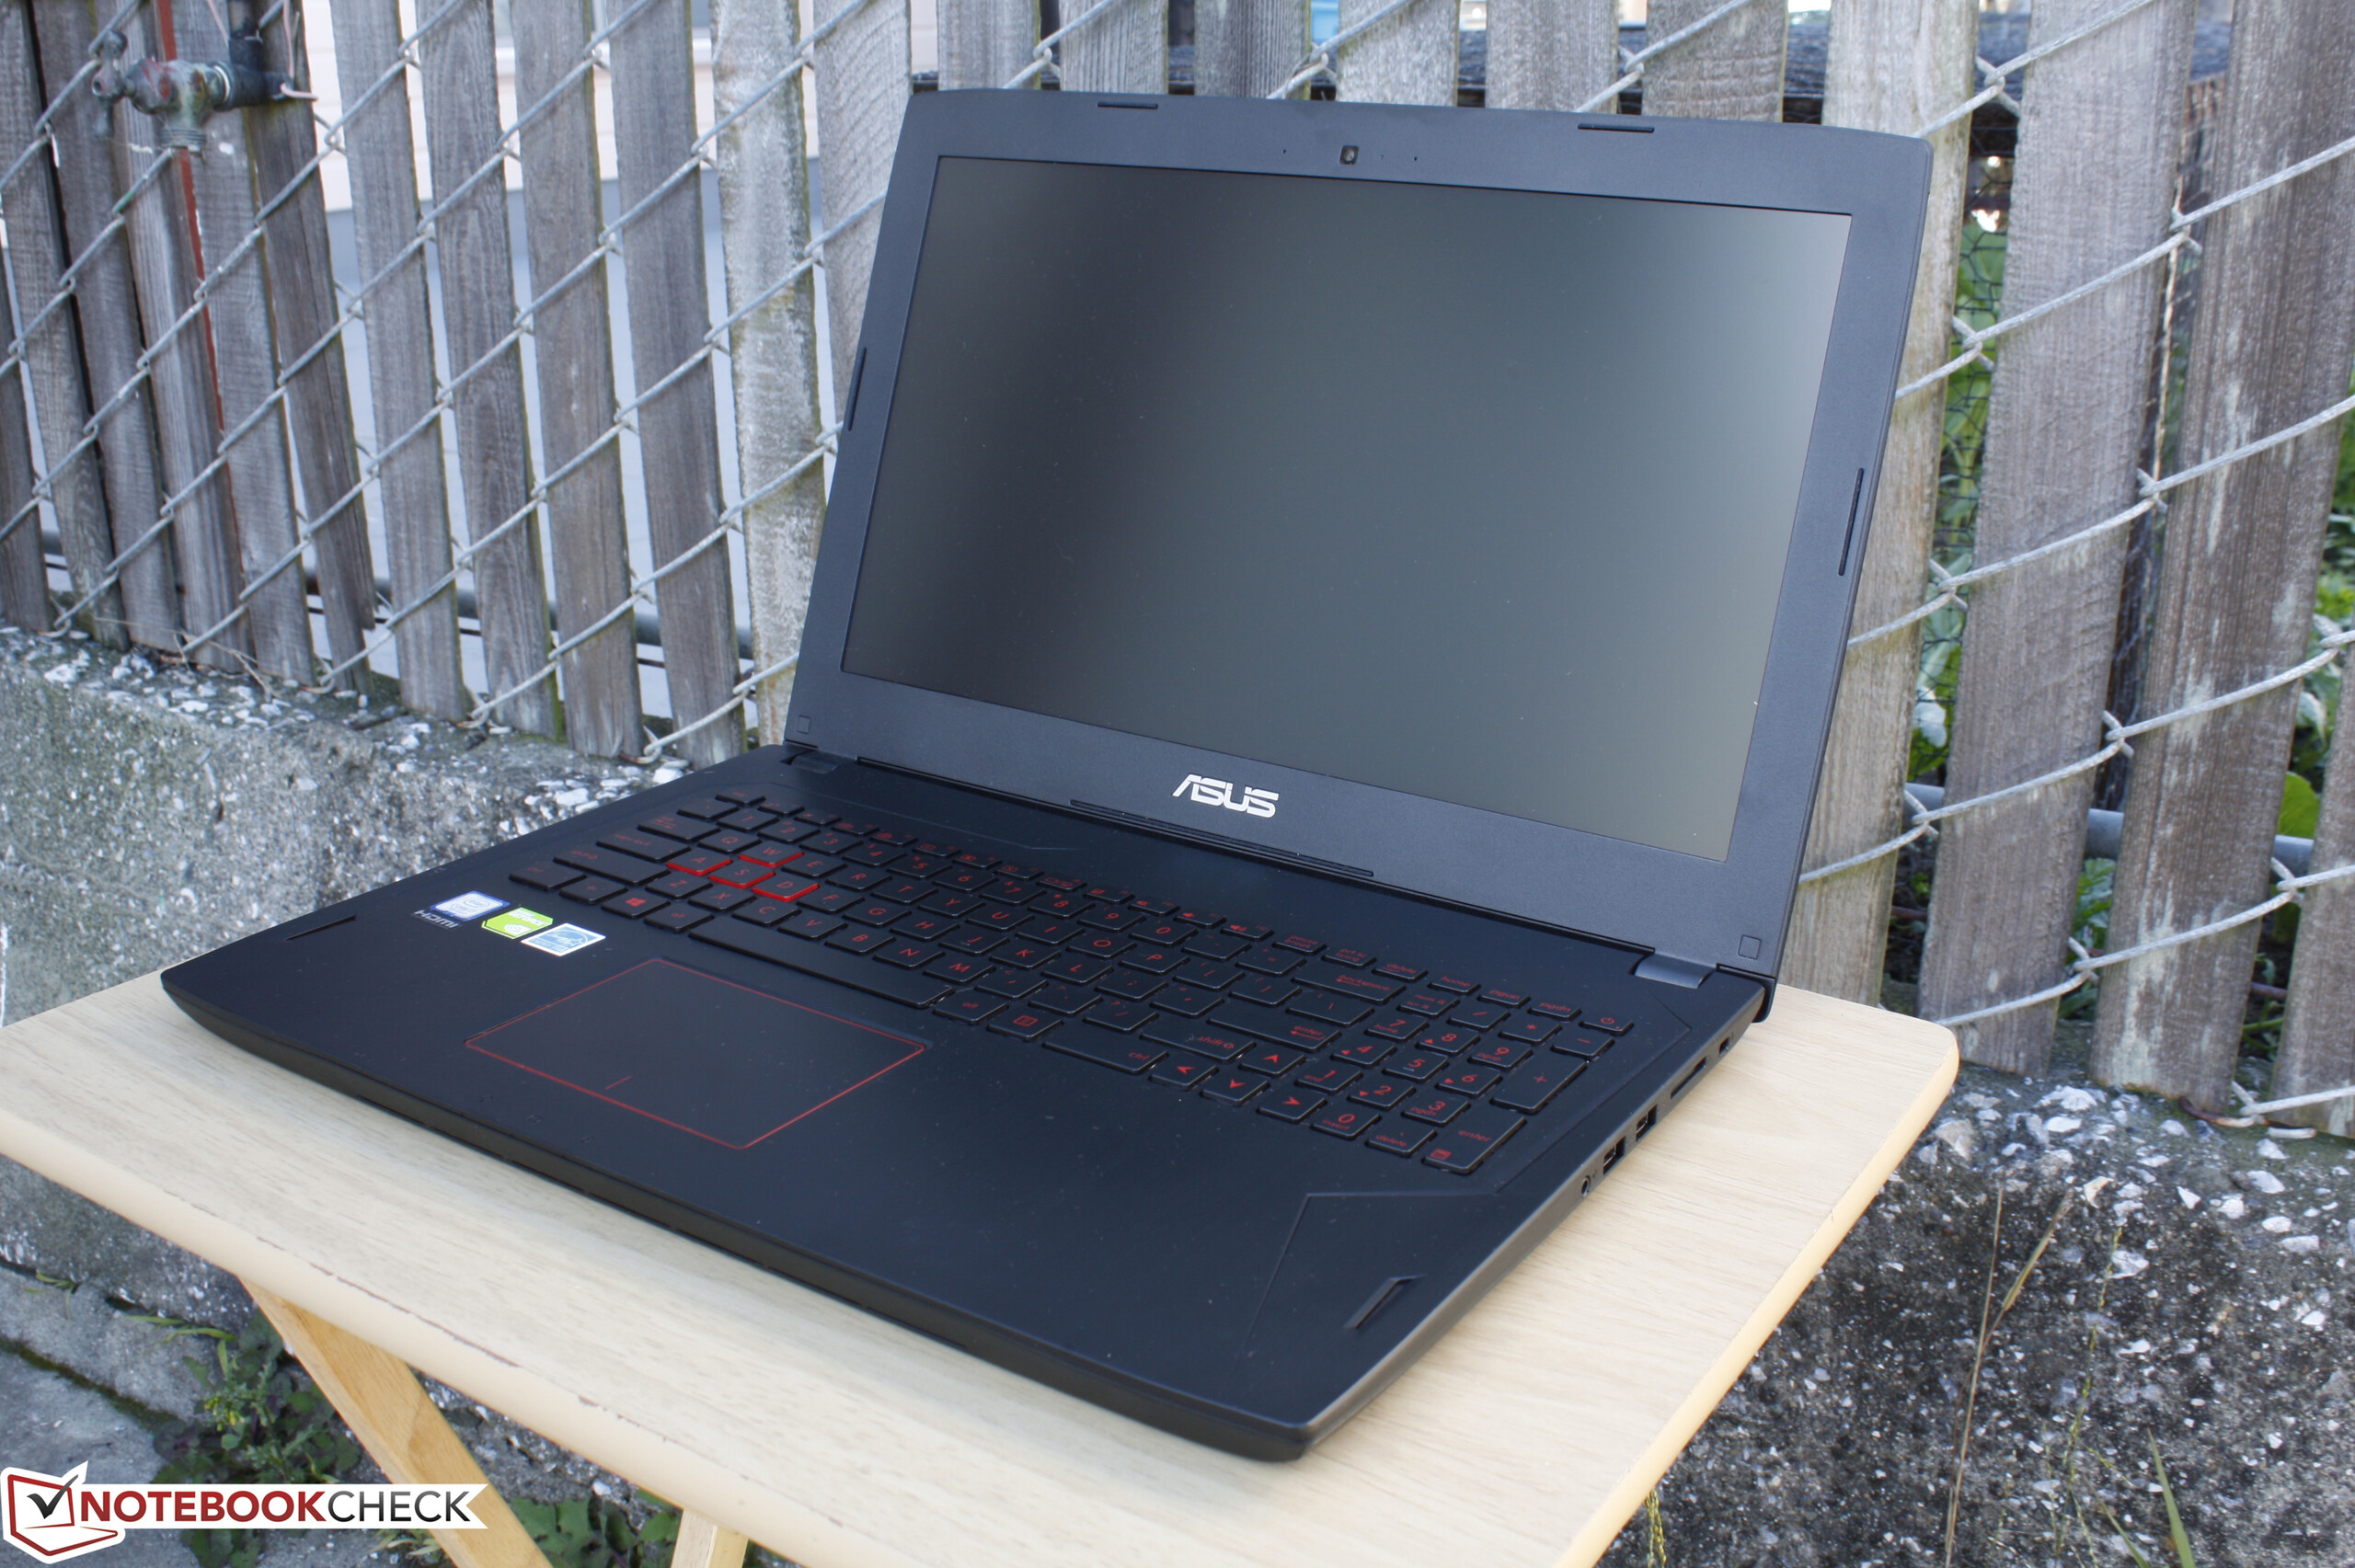
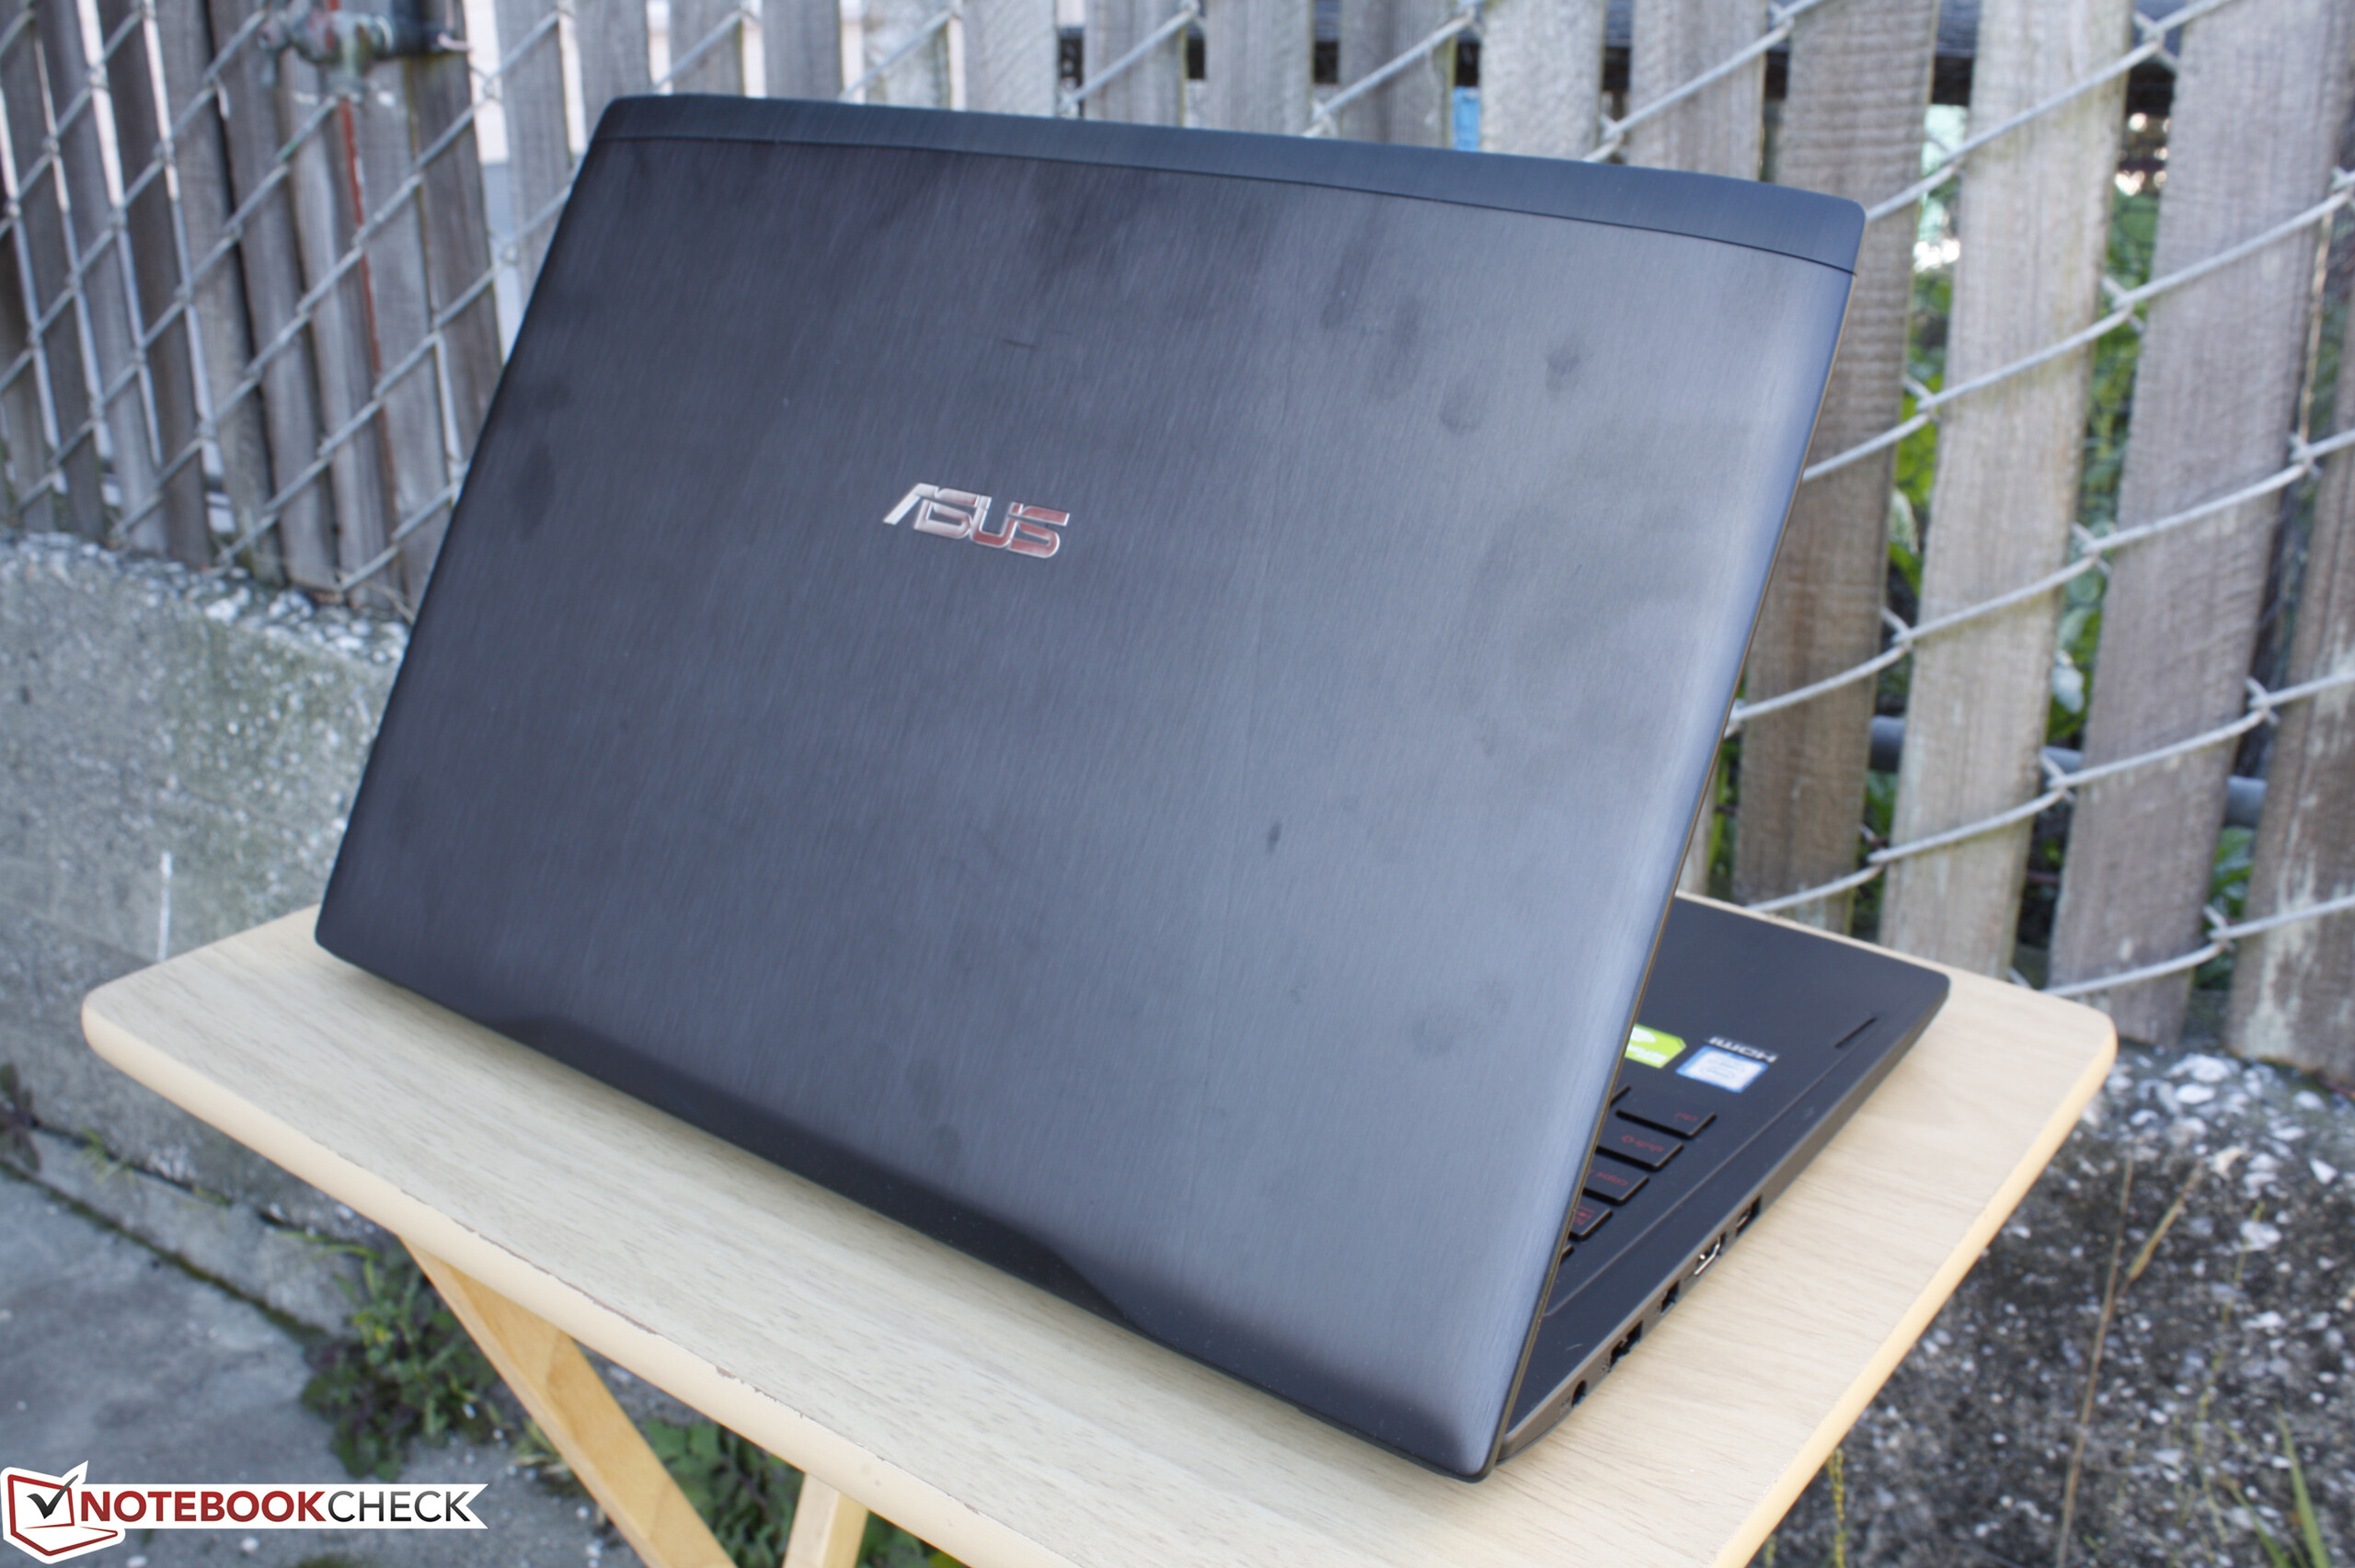
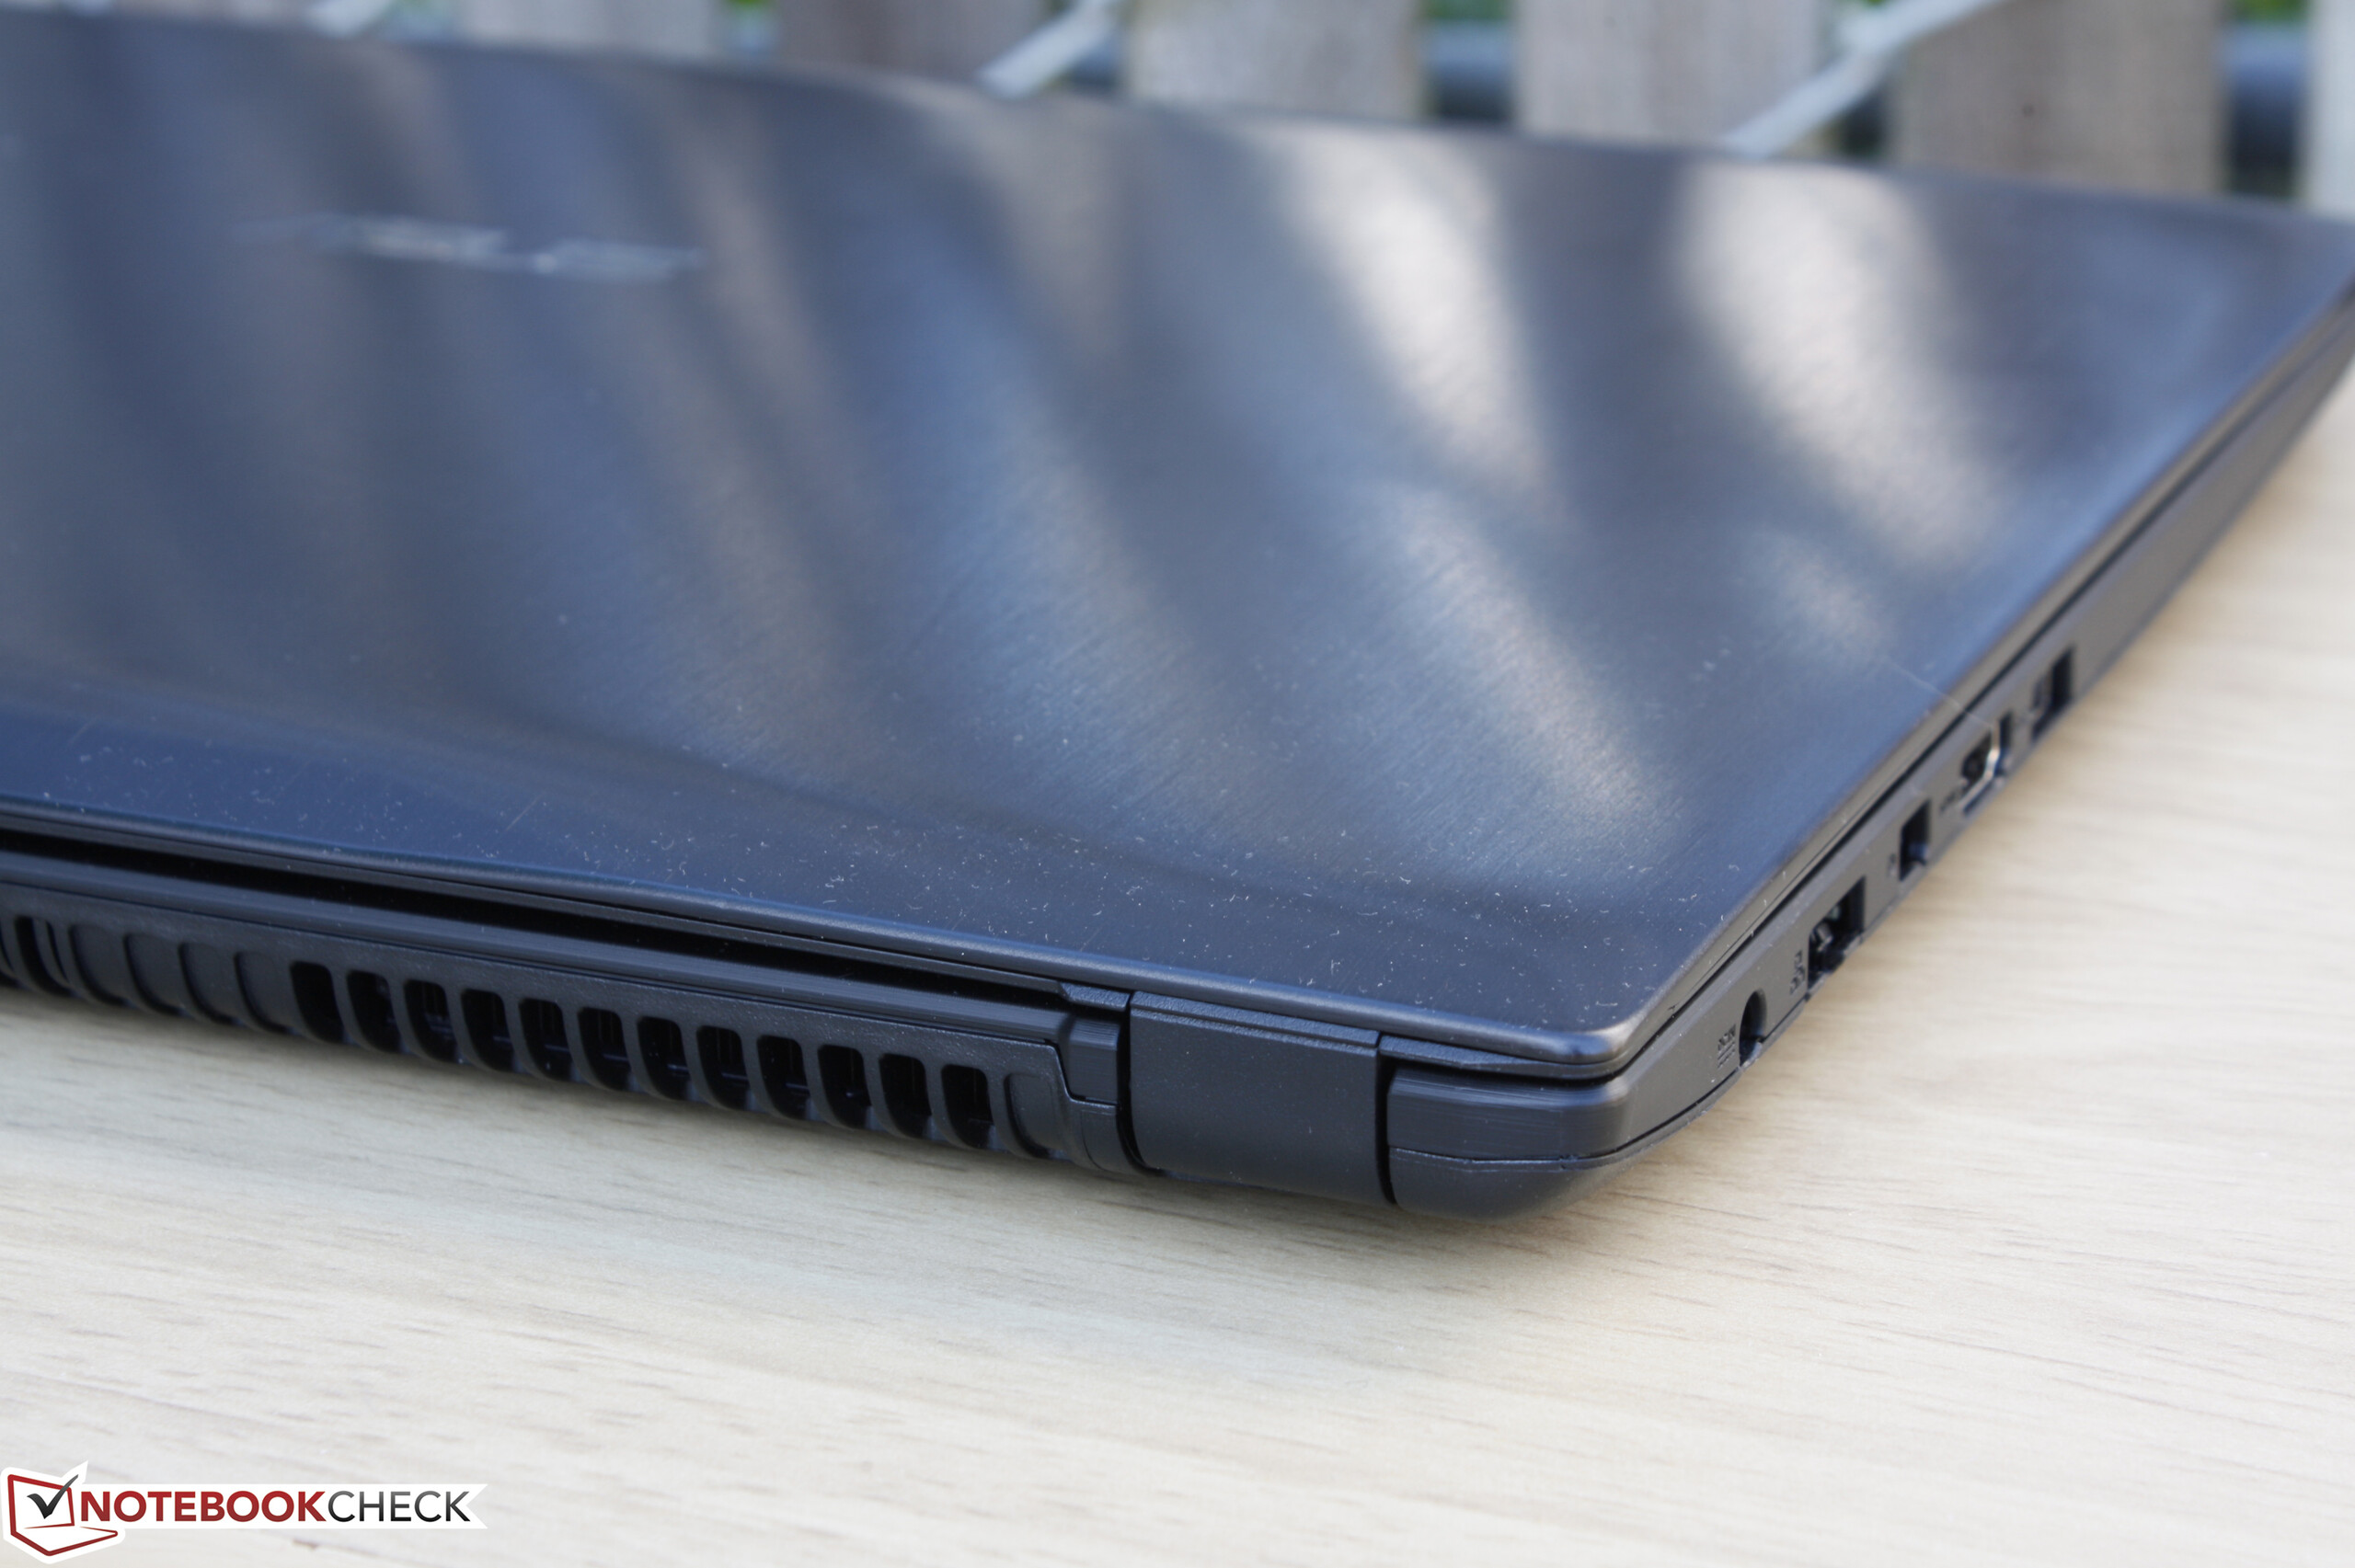
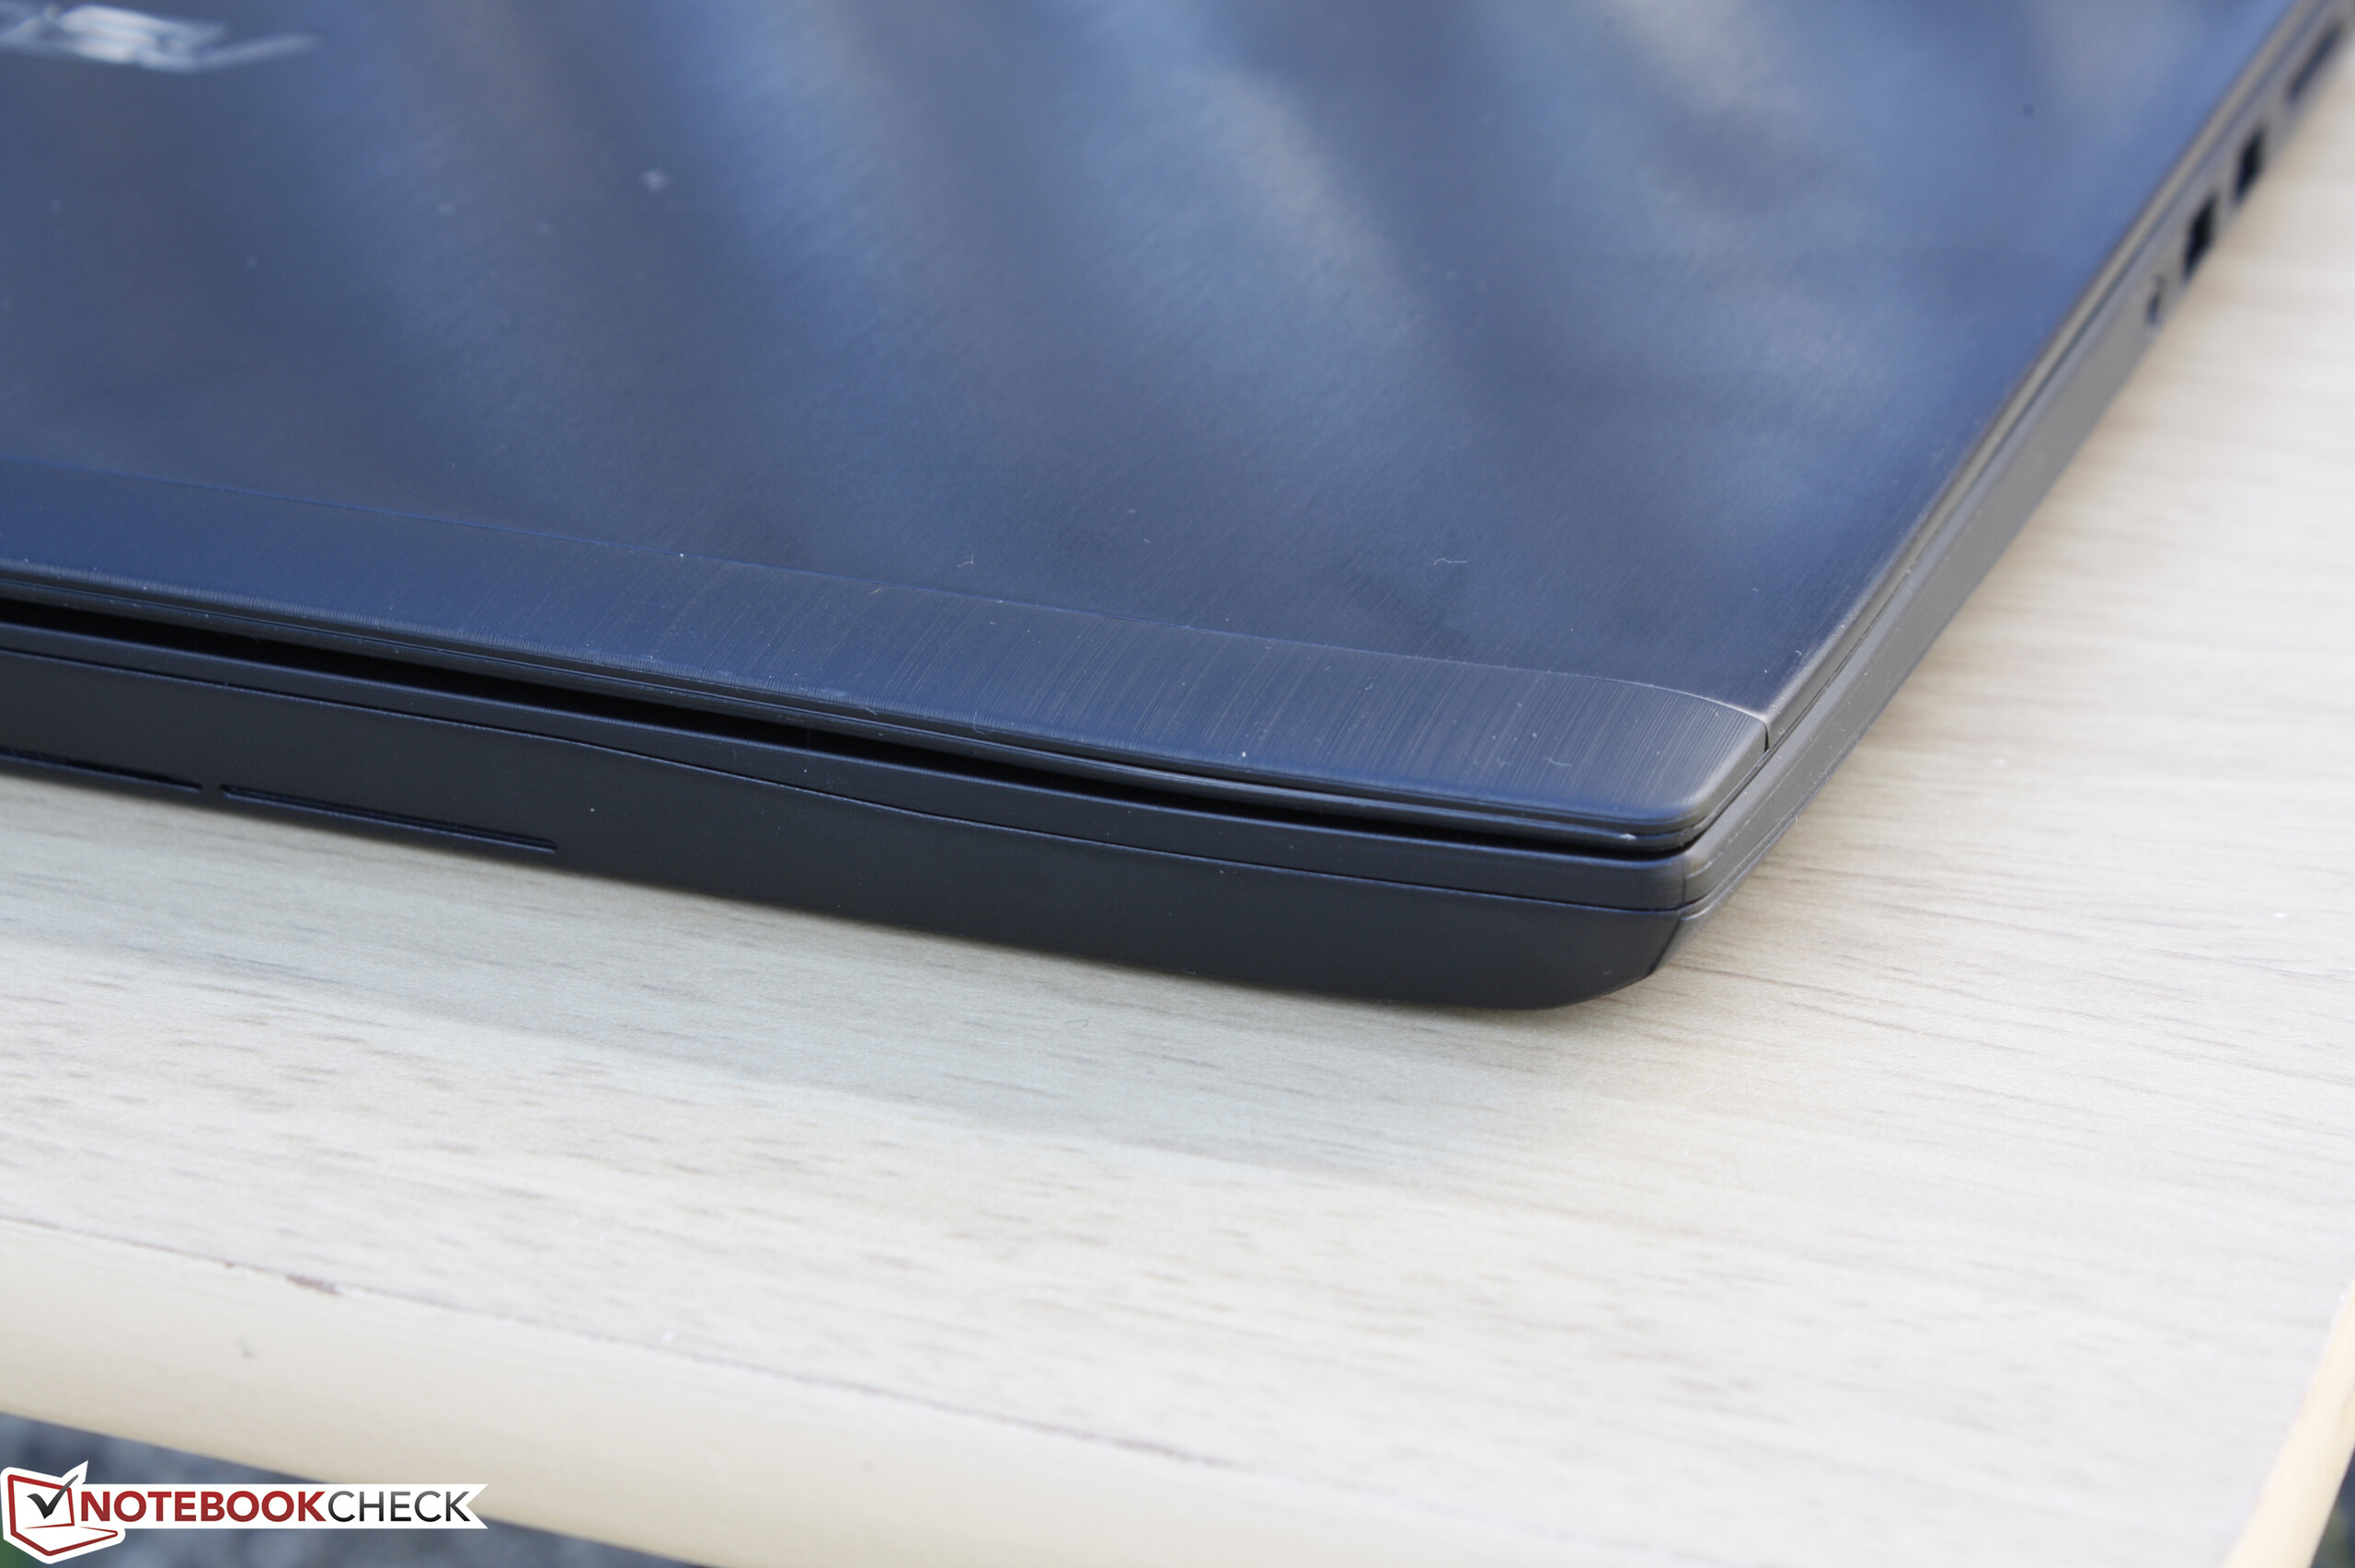
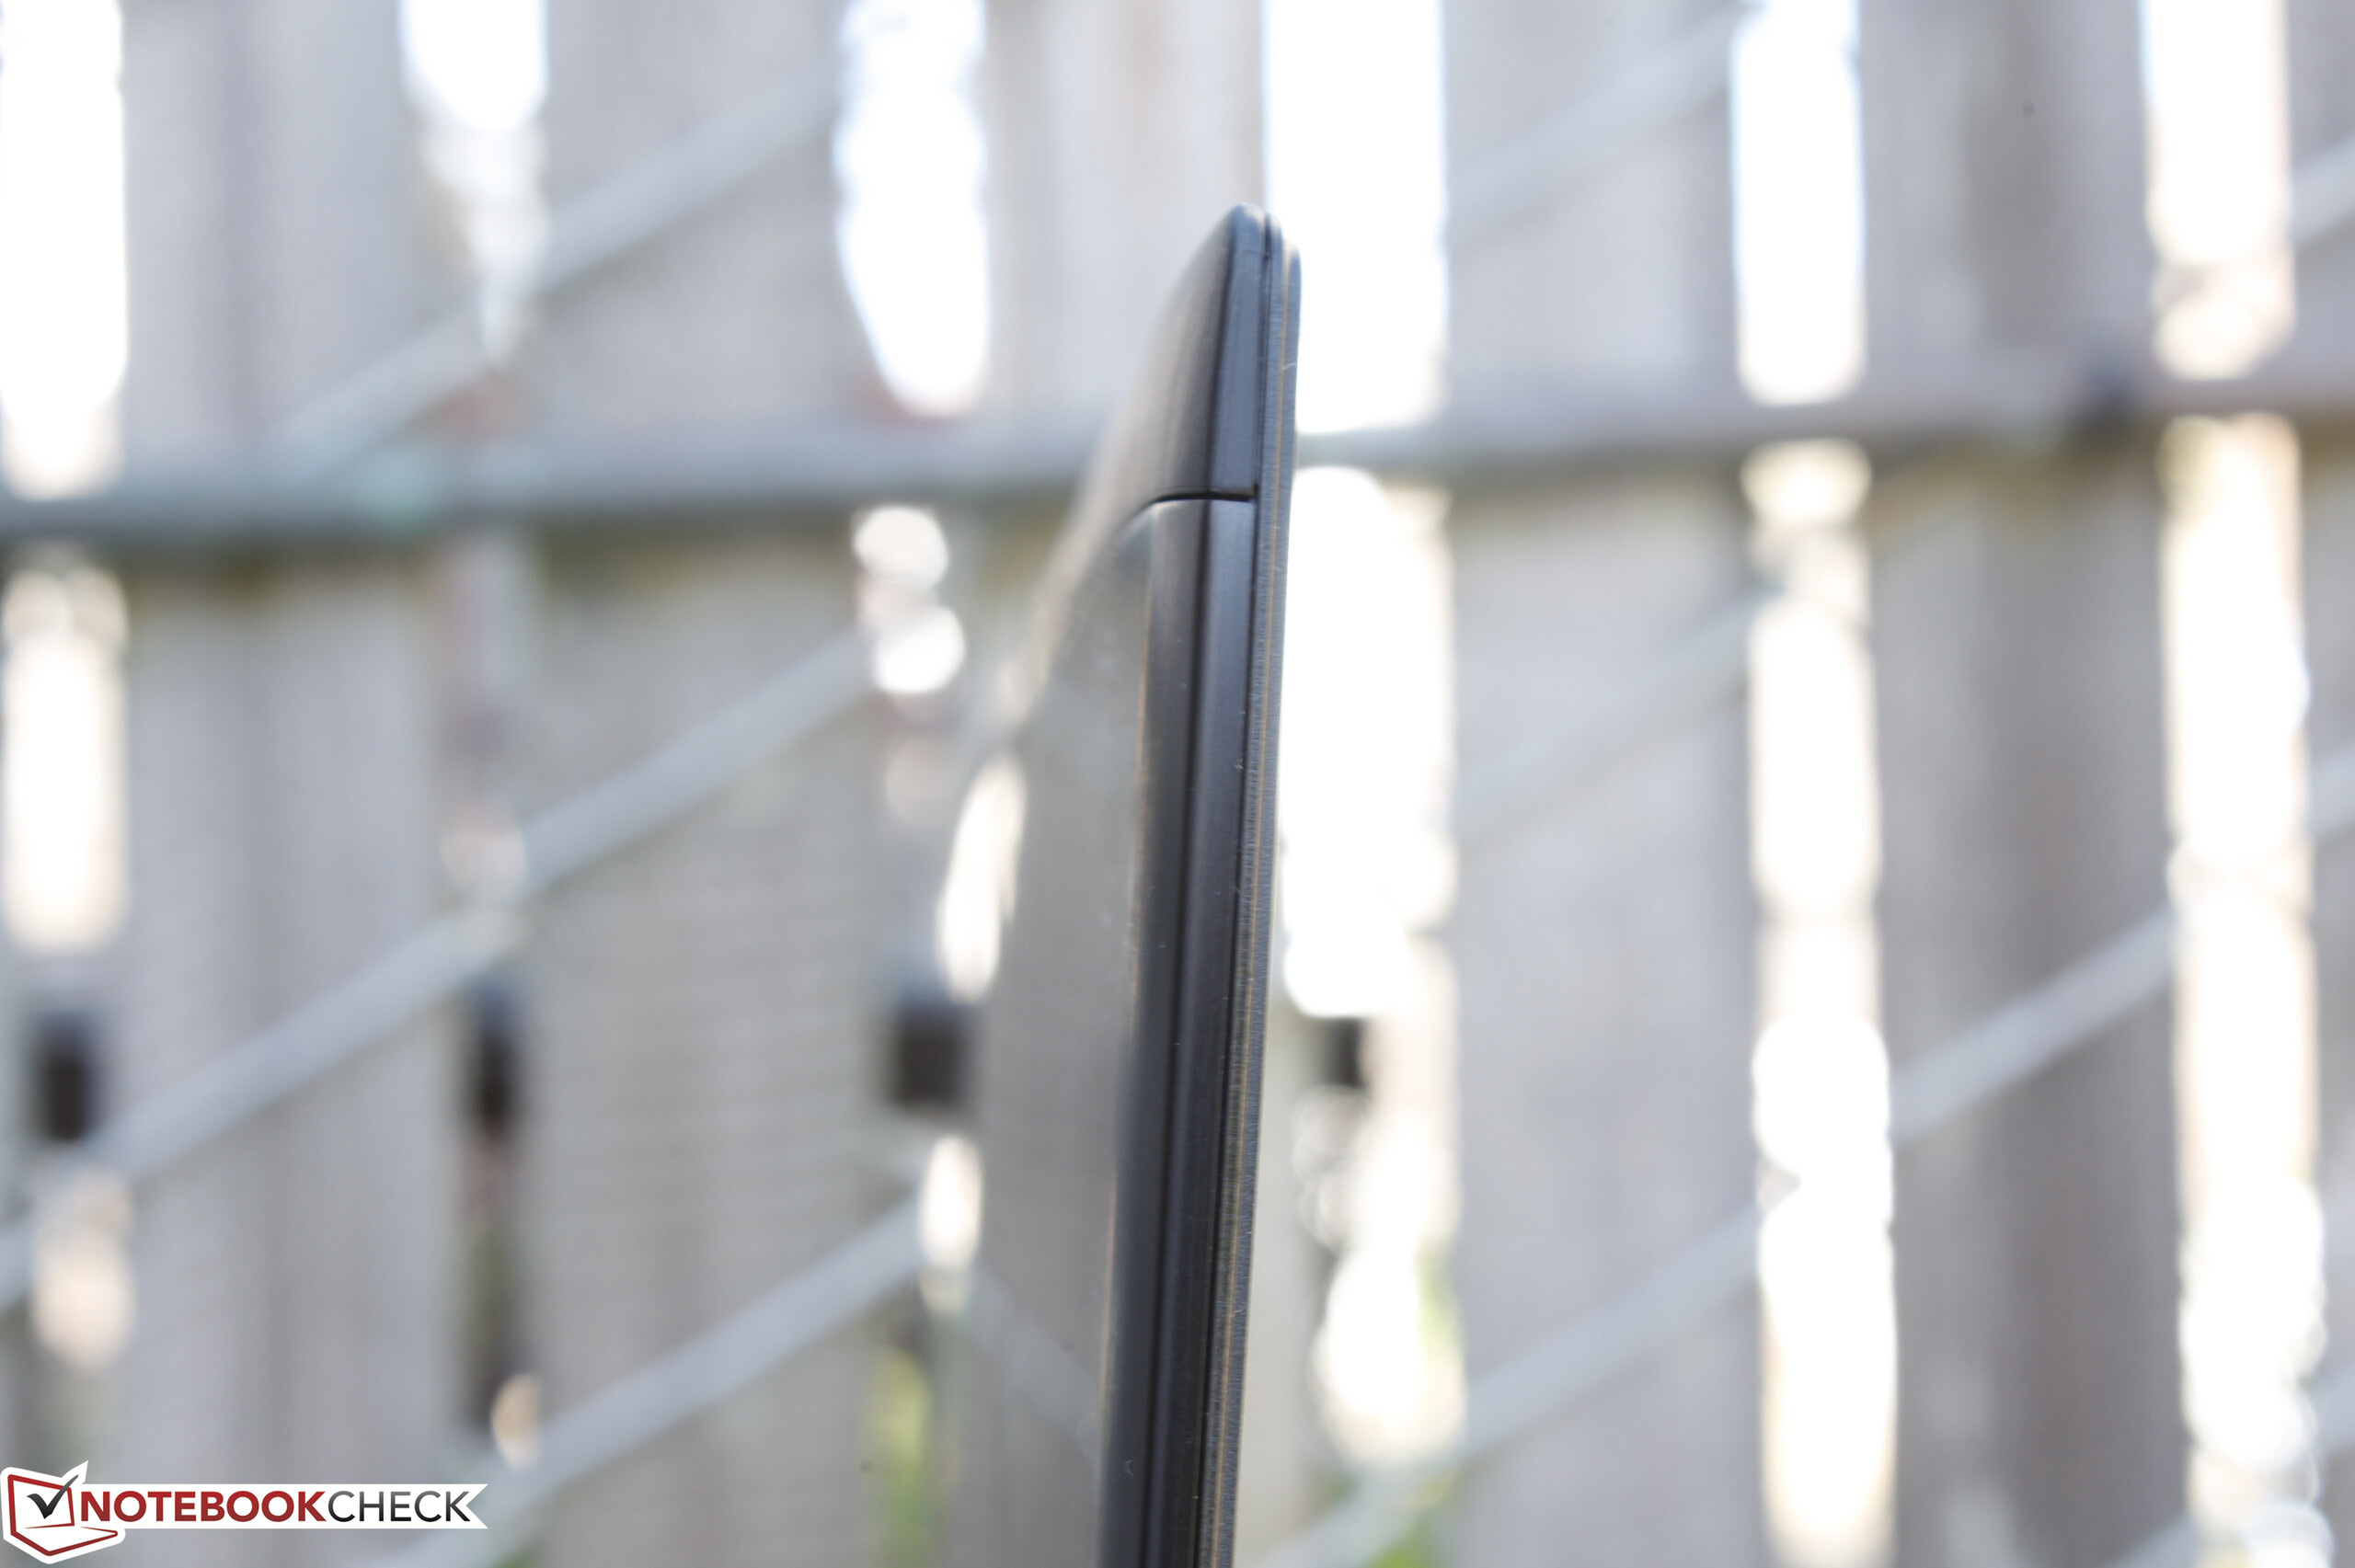
The jet black chassis of the FX502VM contrasts the silver and orange found on higher-end ROG models like the G75x or G701 series. Its build quality is otherwise identical to the GL502VM including its relatively strong base and rigid hinges. Pushing down on the palm rests or center of the keyboard will warp the surfaces just slightly and shouldn't be a cause for concern. Attempting to twist the base will result in slight creaking and visible warping as well, but this is again minimal. The lid flexes a tad too easily for our liking and we're hoping that a proper successor or redesign will alleviate the issue.
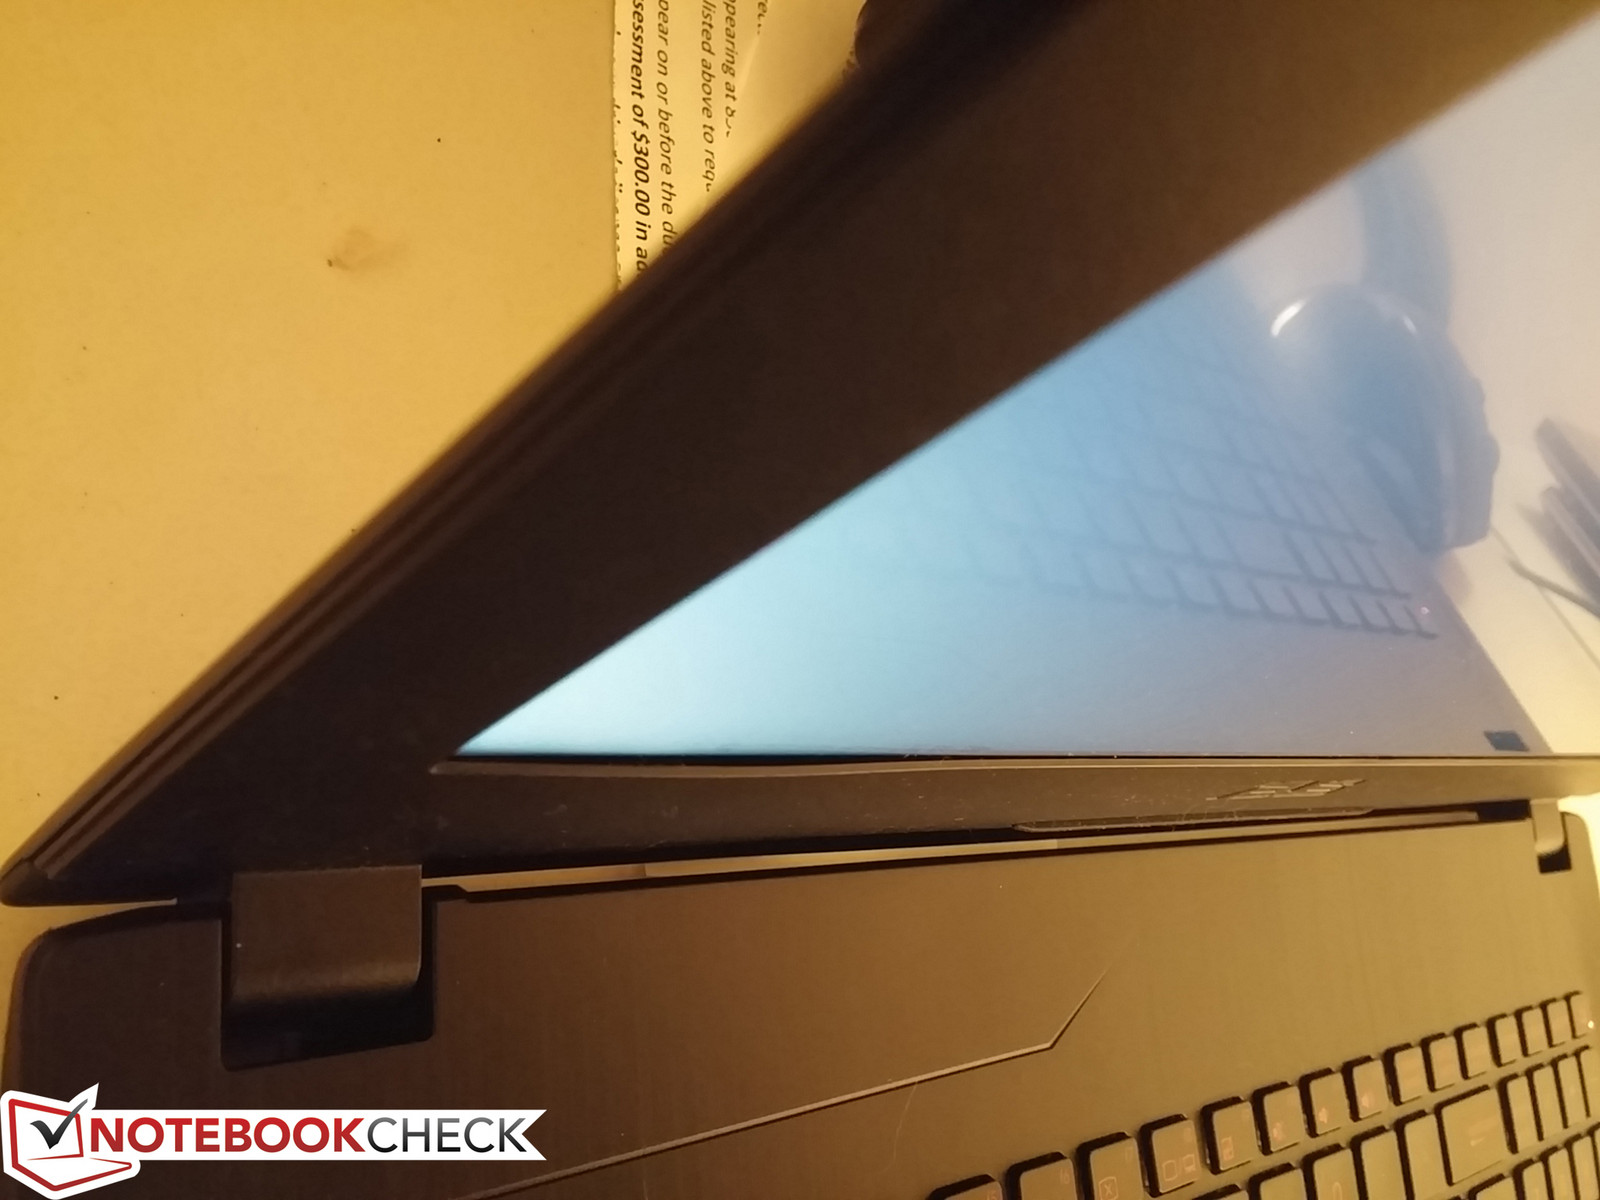
We can observe no unintended gaps or crevices between materials on our test unit with the exception of the inner display bezel as shown by the image to the right. Certain areas around the inner bezel protrude from the edges of the screen, which is something we've observed on certain MSI and Clevo units in the past as well. This doesn't impact the overall build quality of the unit, though it's a thorn on an otherwise sleek design.
The GL/FX502VM chassis sits in between the big guys like the MSI GT62VR or Alienware 15 R3 and the superthin ones like the MSI GS63VR, Razer Blade Pro, or even Asus' own G501 series in terms of size and weight. The thinner MSI option offers the same CPU and GPU as our Asus at very tangible drawbacks including noisier fans, overall warmer temperatures, and much higher prices. This makes the FX502VM a good option for those who still want a relatively portable gaming notebook without spending an arm and a leg on a Razer or Aorus.
Connectivity
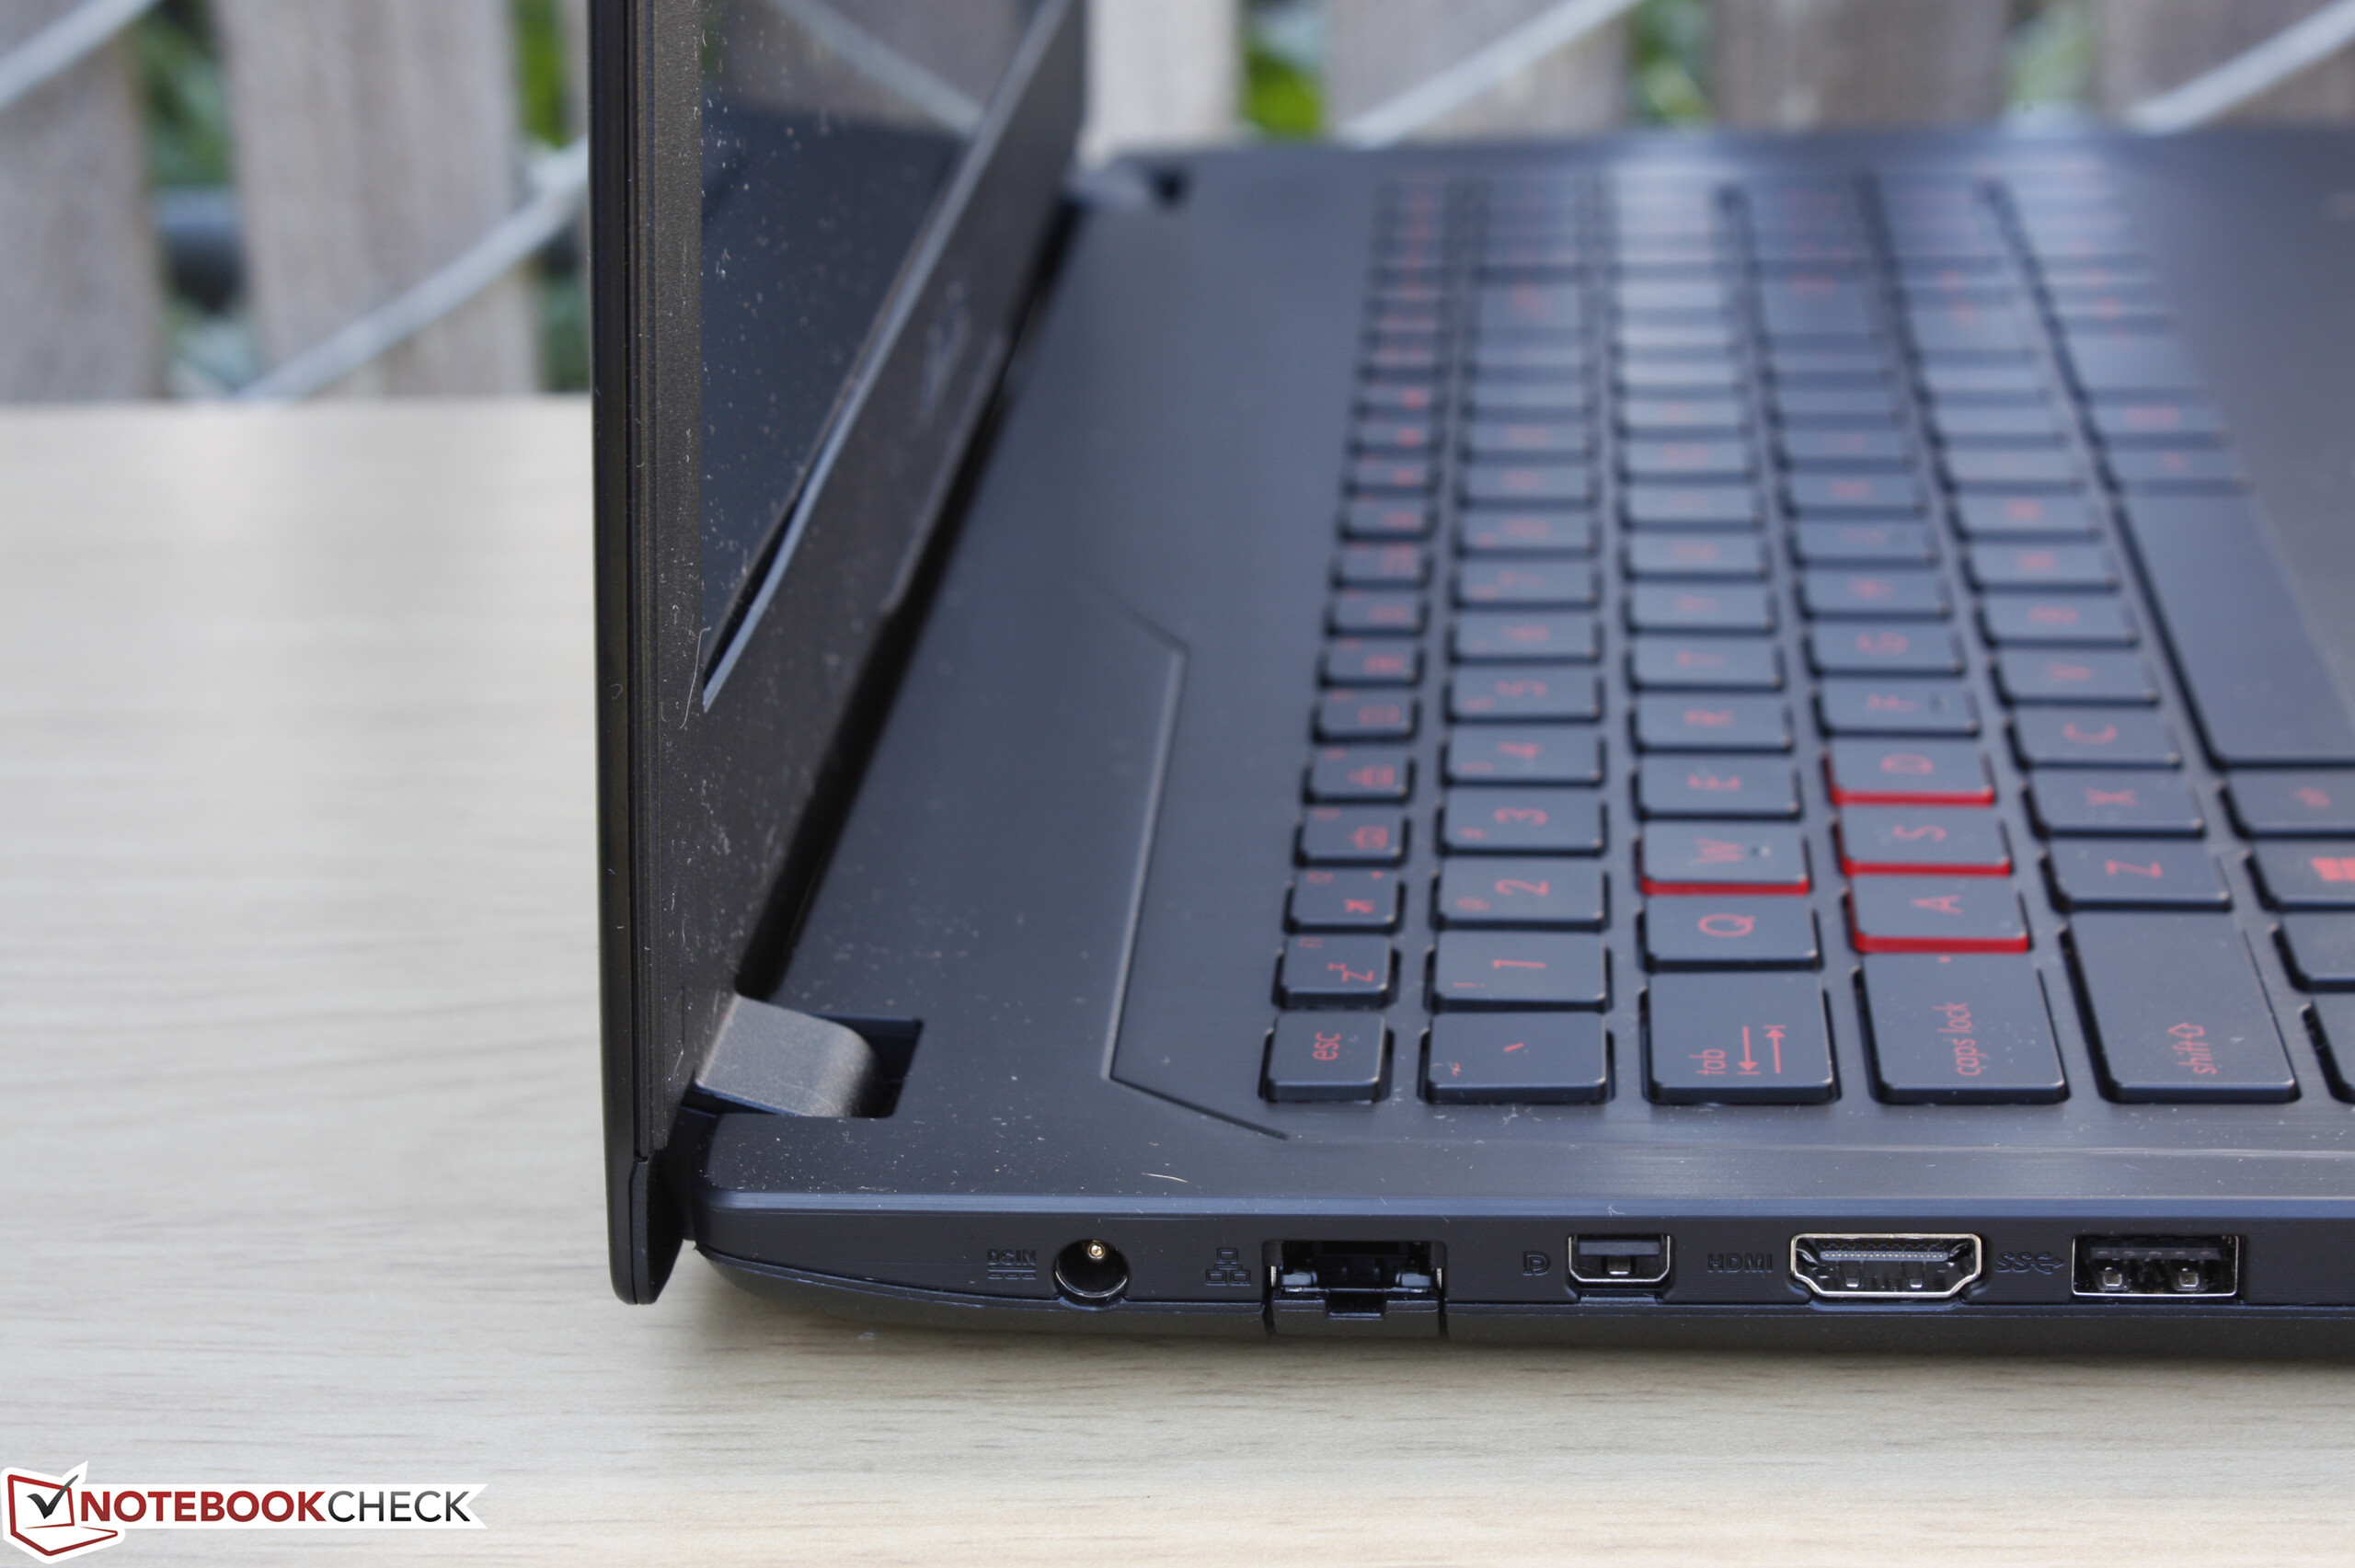
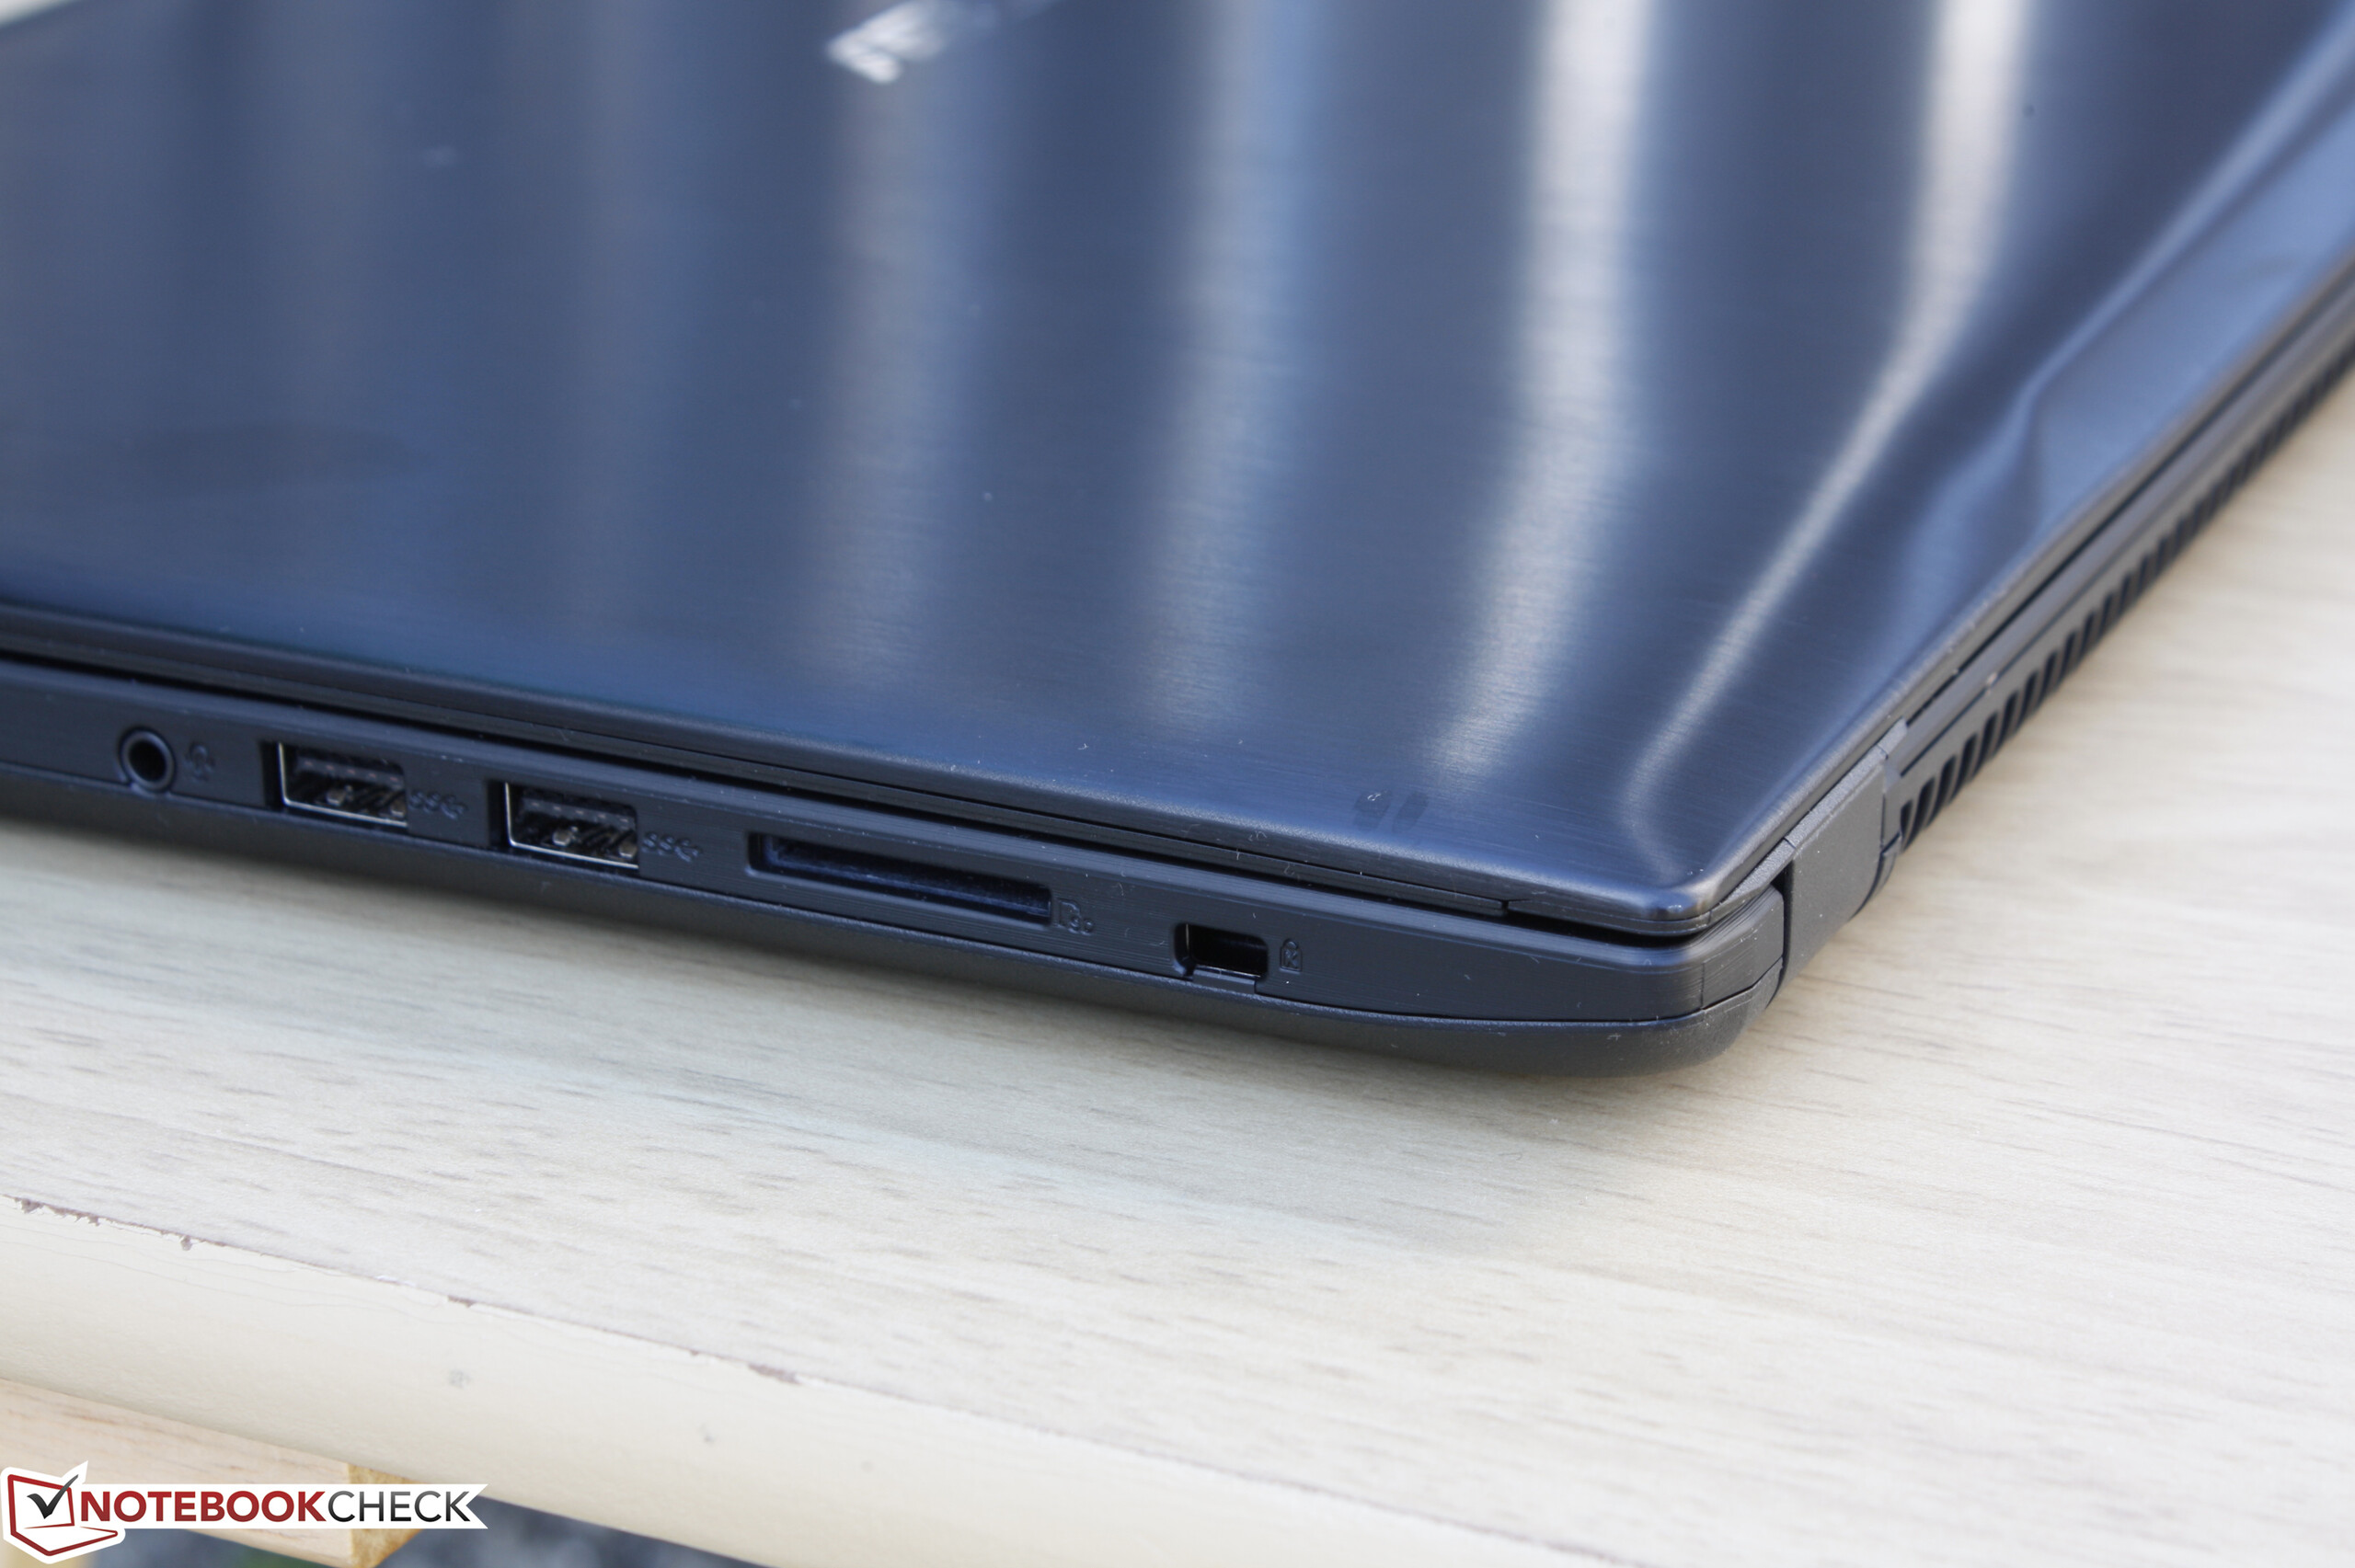
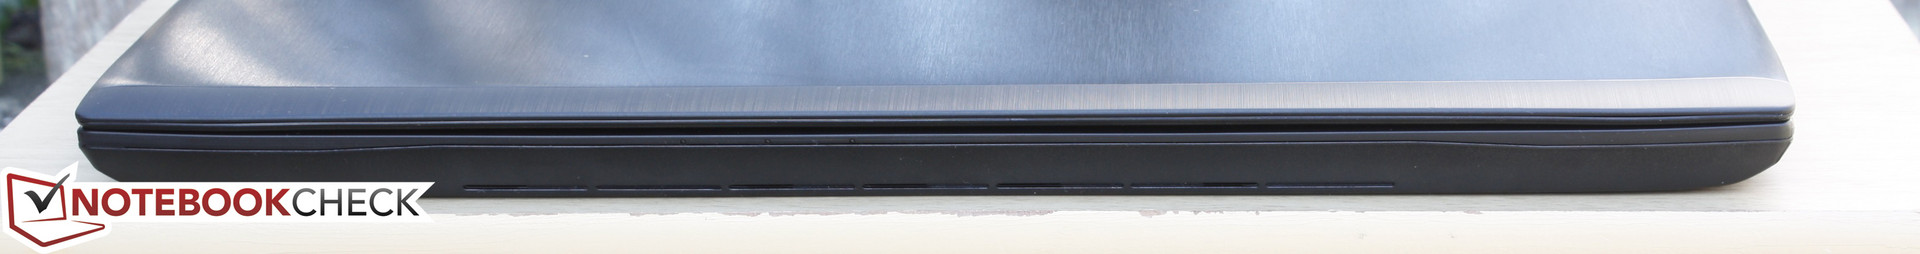
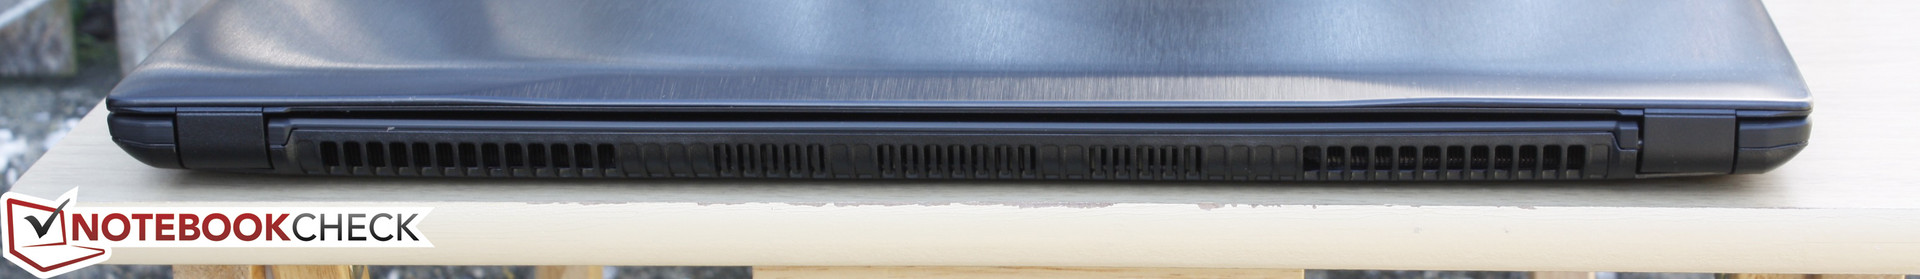
Available interfaces are identical to the GL502VM save for the omission of the USB Type-C port. This may irk some hardcore gamers, but the target mainstream audience for the FX series will more likely be indifferent about the missing port. The rest of the ports are easy to reach and are divided rather evenly between the two sides of the notebook. No ports are on the rear due to the proximity of the heat pipes along the edge and the surplus of ventilation grilles.


SD Card Reader
The integrated card reader provides a real-world transfer rate of about 80 MB/s with our Toshiba Exceria Pro UHS-II SD test card. This is compared to well over 100 MB/s on flagship machines like the XPS 15 9550 or the MSI GT series. Transferring 1 GB worth of photos to desktop will take roughly 13 seconds.
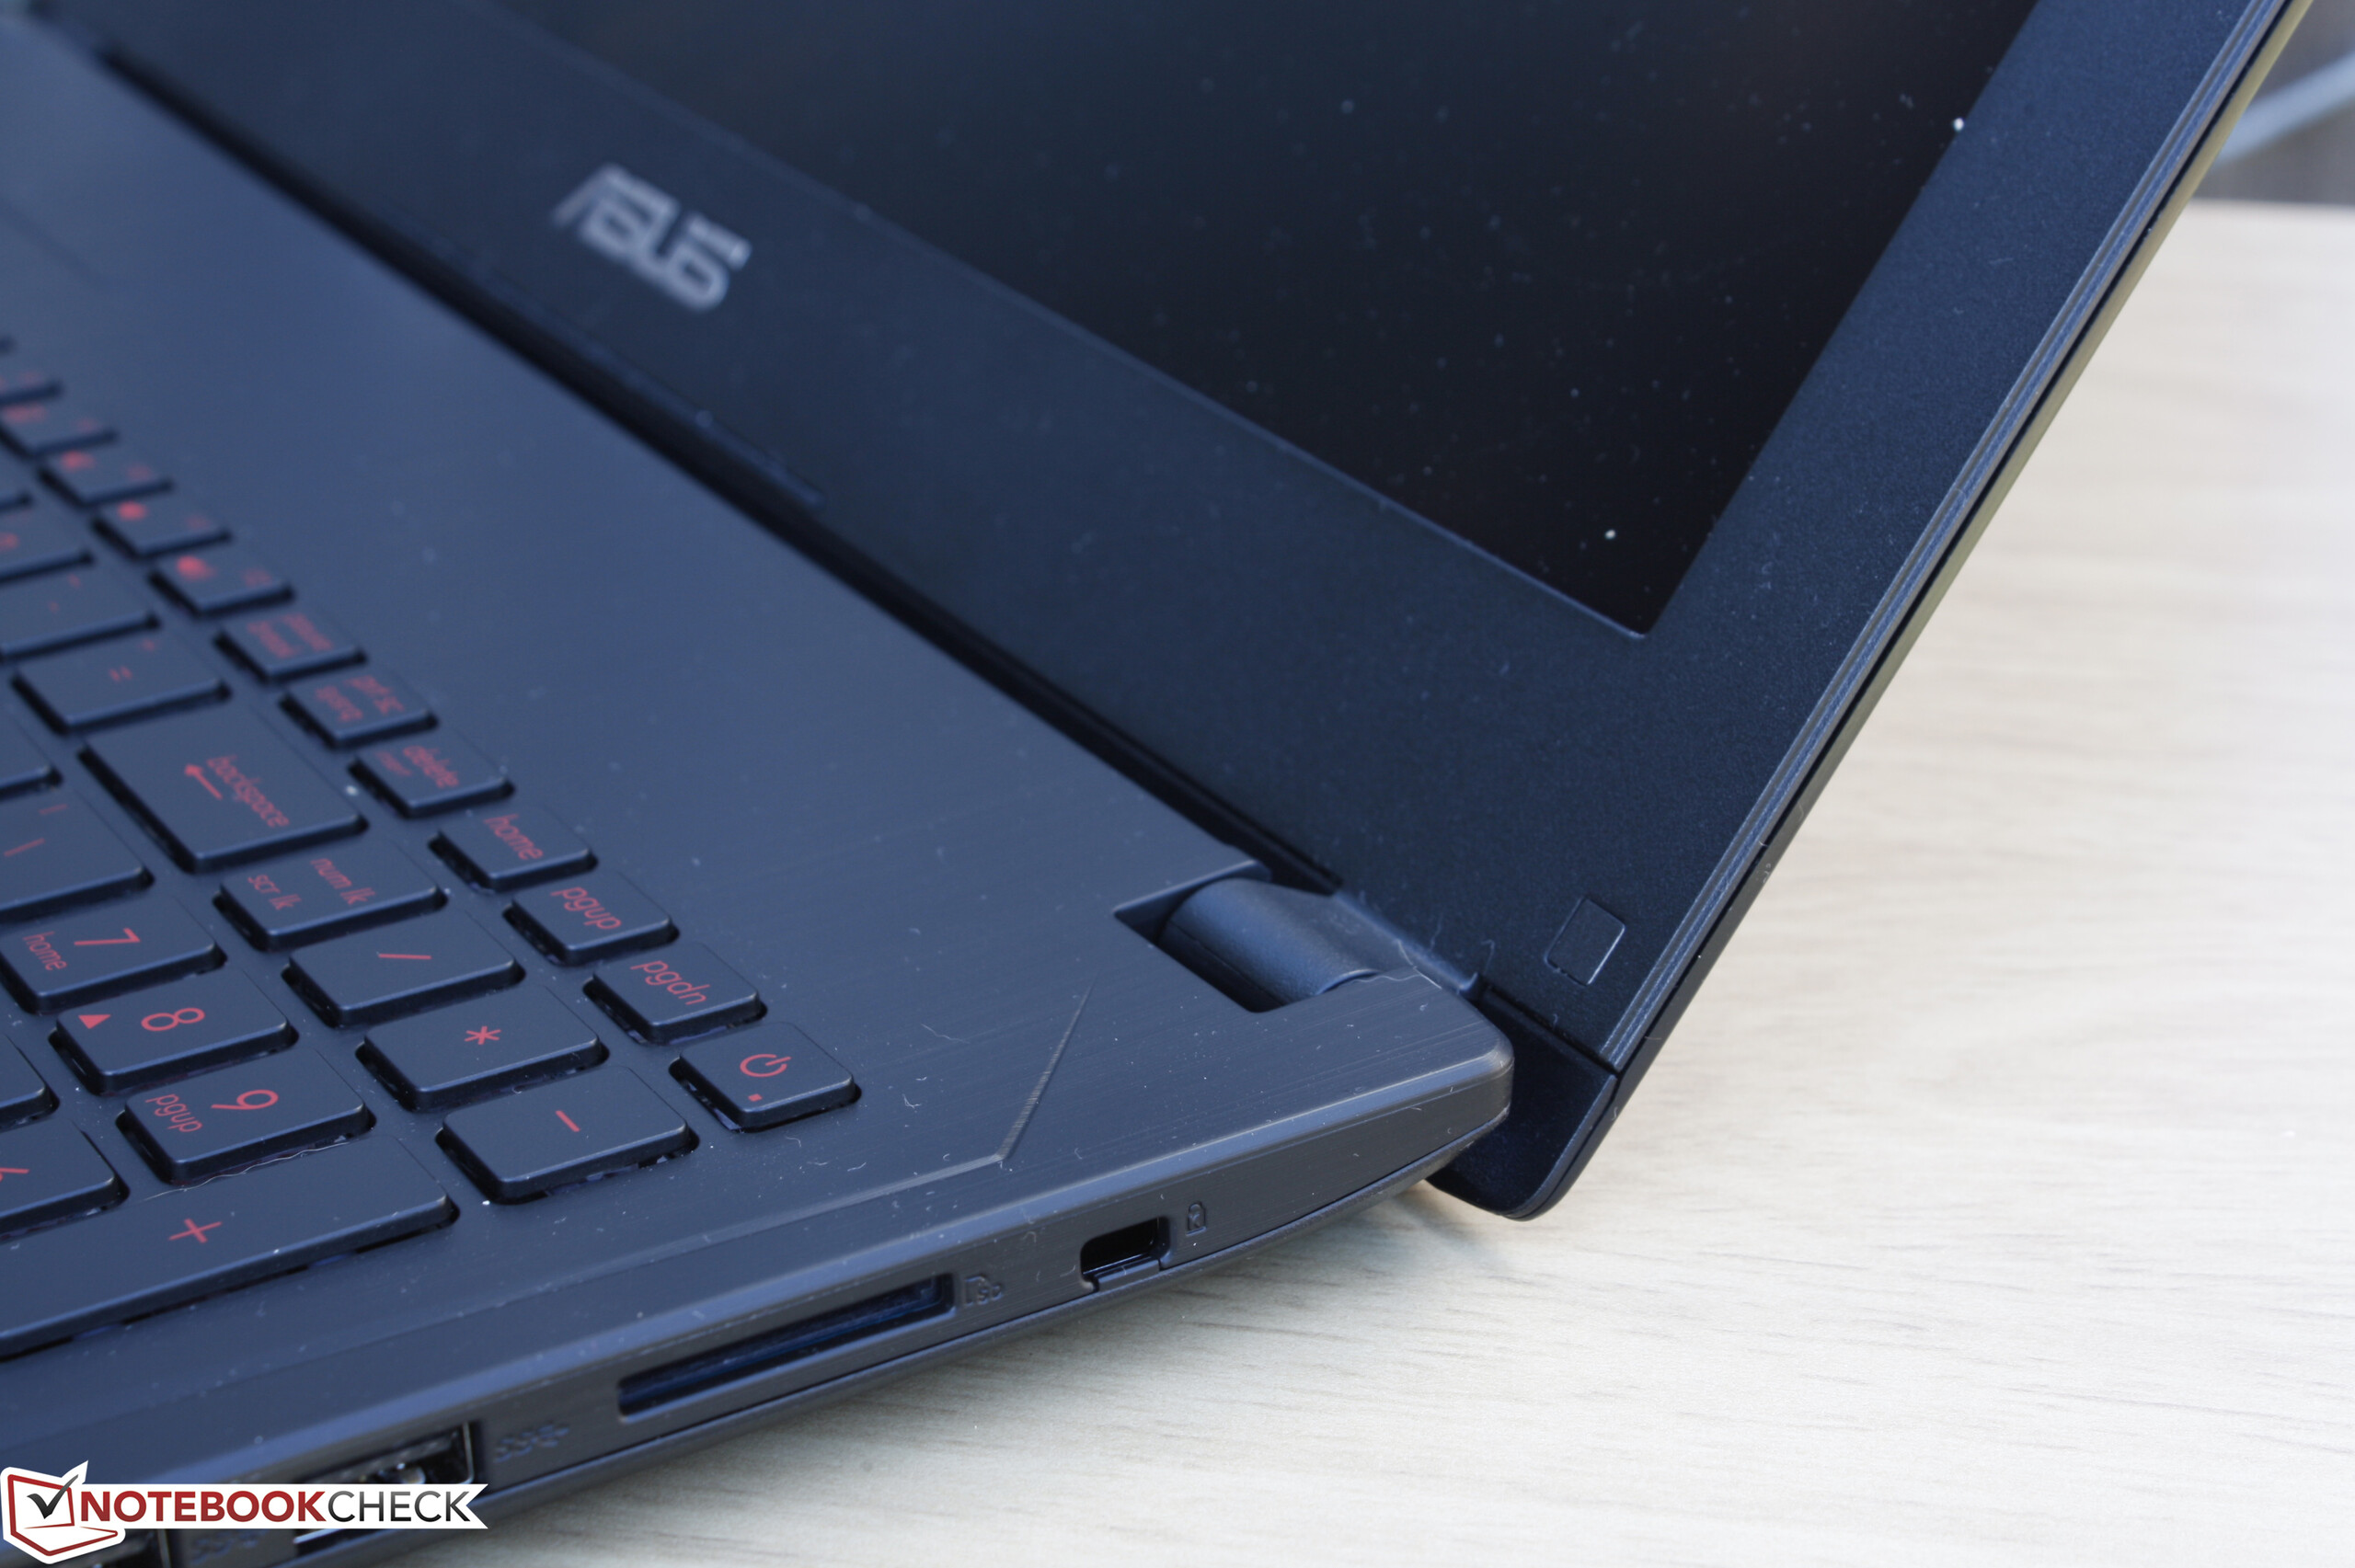
The card reader slot itself is not spring-loaded and is not very deep inside of the chassis, either. A fully inserted SD card will still protrude by more than half its length from the edge of the notebook, so care should be taken to not accidentally bend or break the card.
| SD Card Reader | |
| average JPG Copy Test (av. of 3 runs) | |
| Dell XPS 15-9550 i7 | |
| Asus Strix GL502VM-DS74 | |
| Asus FX502VM-AS73 | |
| maximum AS SSD Seq Read Test (1GB) | |
| Dell XPS 15-9550 i7 | |
| Asus Strix GL502VM-DS74 | |
| Asus FX502VM-AS73 | |
Communication
The FX502VM ships with the same Intel 8260 WLAN + Bluetooth module as the GL502VM. Our networking test results are faster than on our GL-class SKU likely due to background activity and other programs that may have been interfering at the time of testing. Regardless, we still recorded stable transfer rates with no connectivity issues during regular use.
| Networking | |
| iperf3 transmit AX12 | |
| Alienware 15 R3 | |
| Asus FX502VM-AS73 | |
| Asus Strix GL502VM-DS74 | |
| iperf3 receive AX12 | |
| Alienware 15 R3 | |
| Asus FX502VM-AS73 | |
| Asus Strix GL502VM-DS74 | |
Accessories
Included extras are a cable tie and warranty. There are no USB or HDMI adapters included with the retail box.
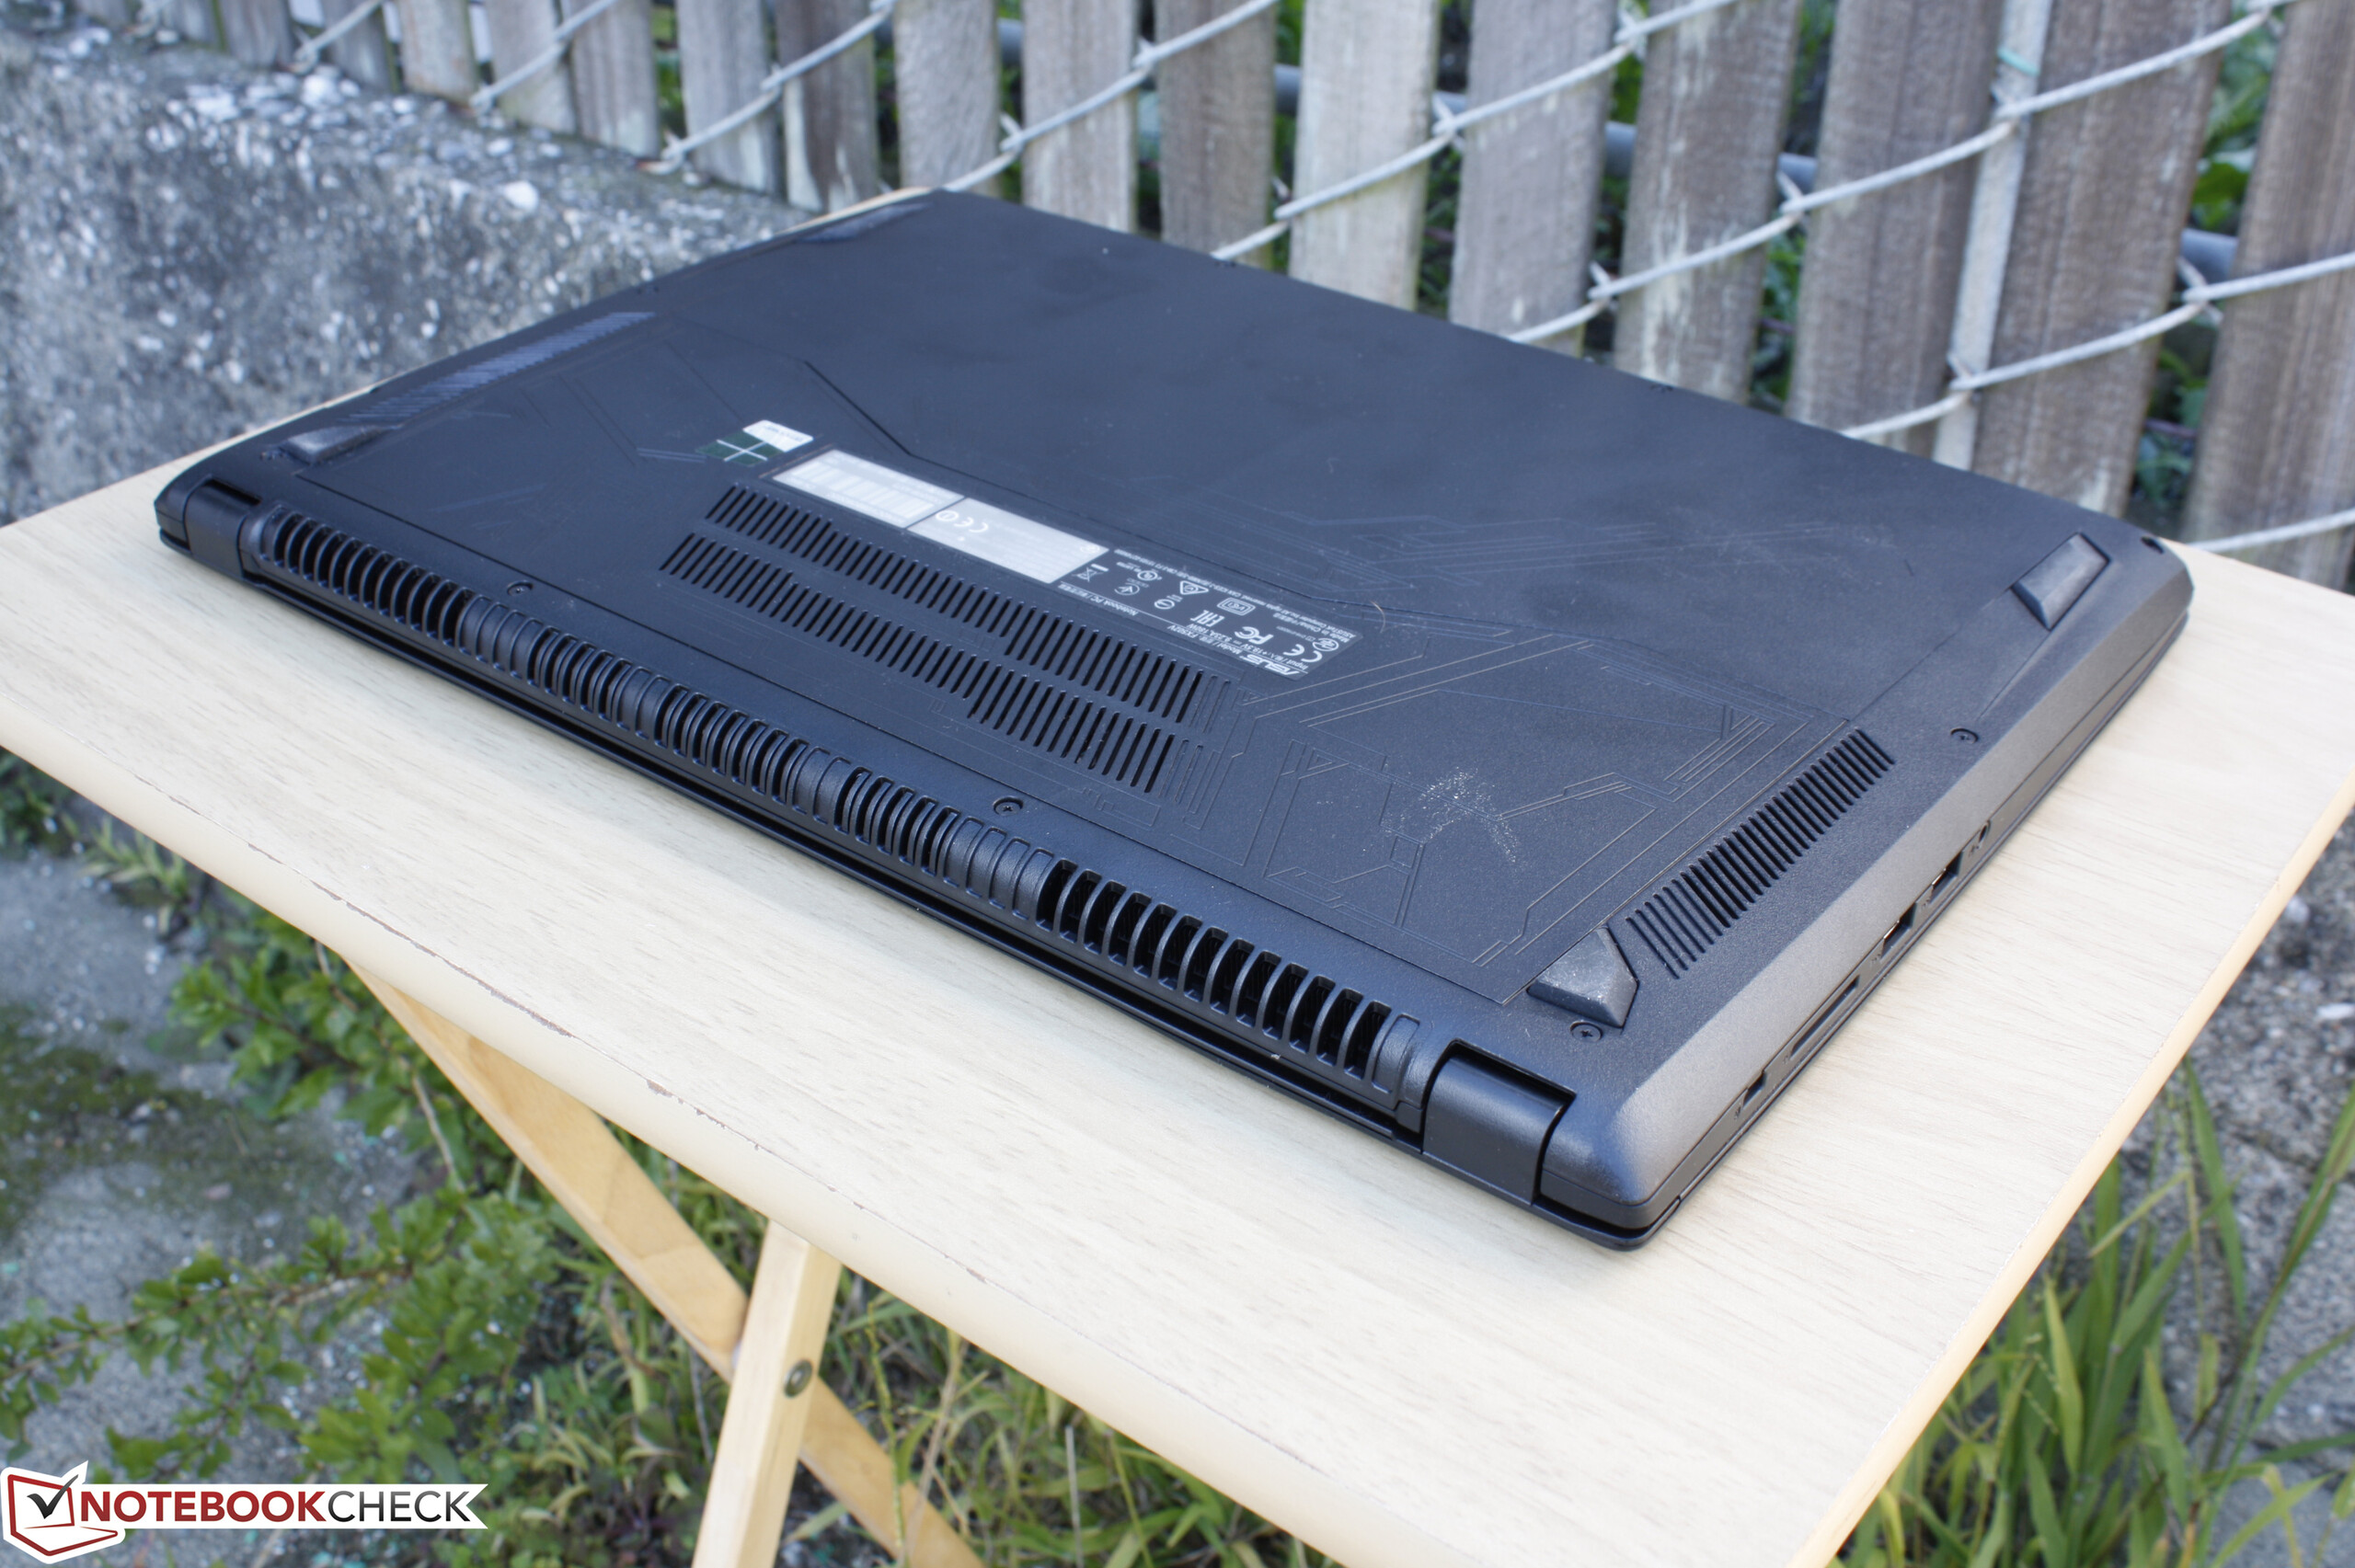
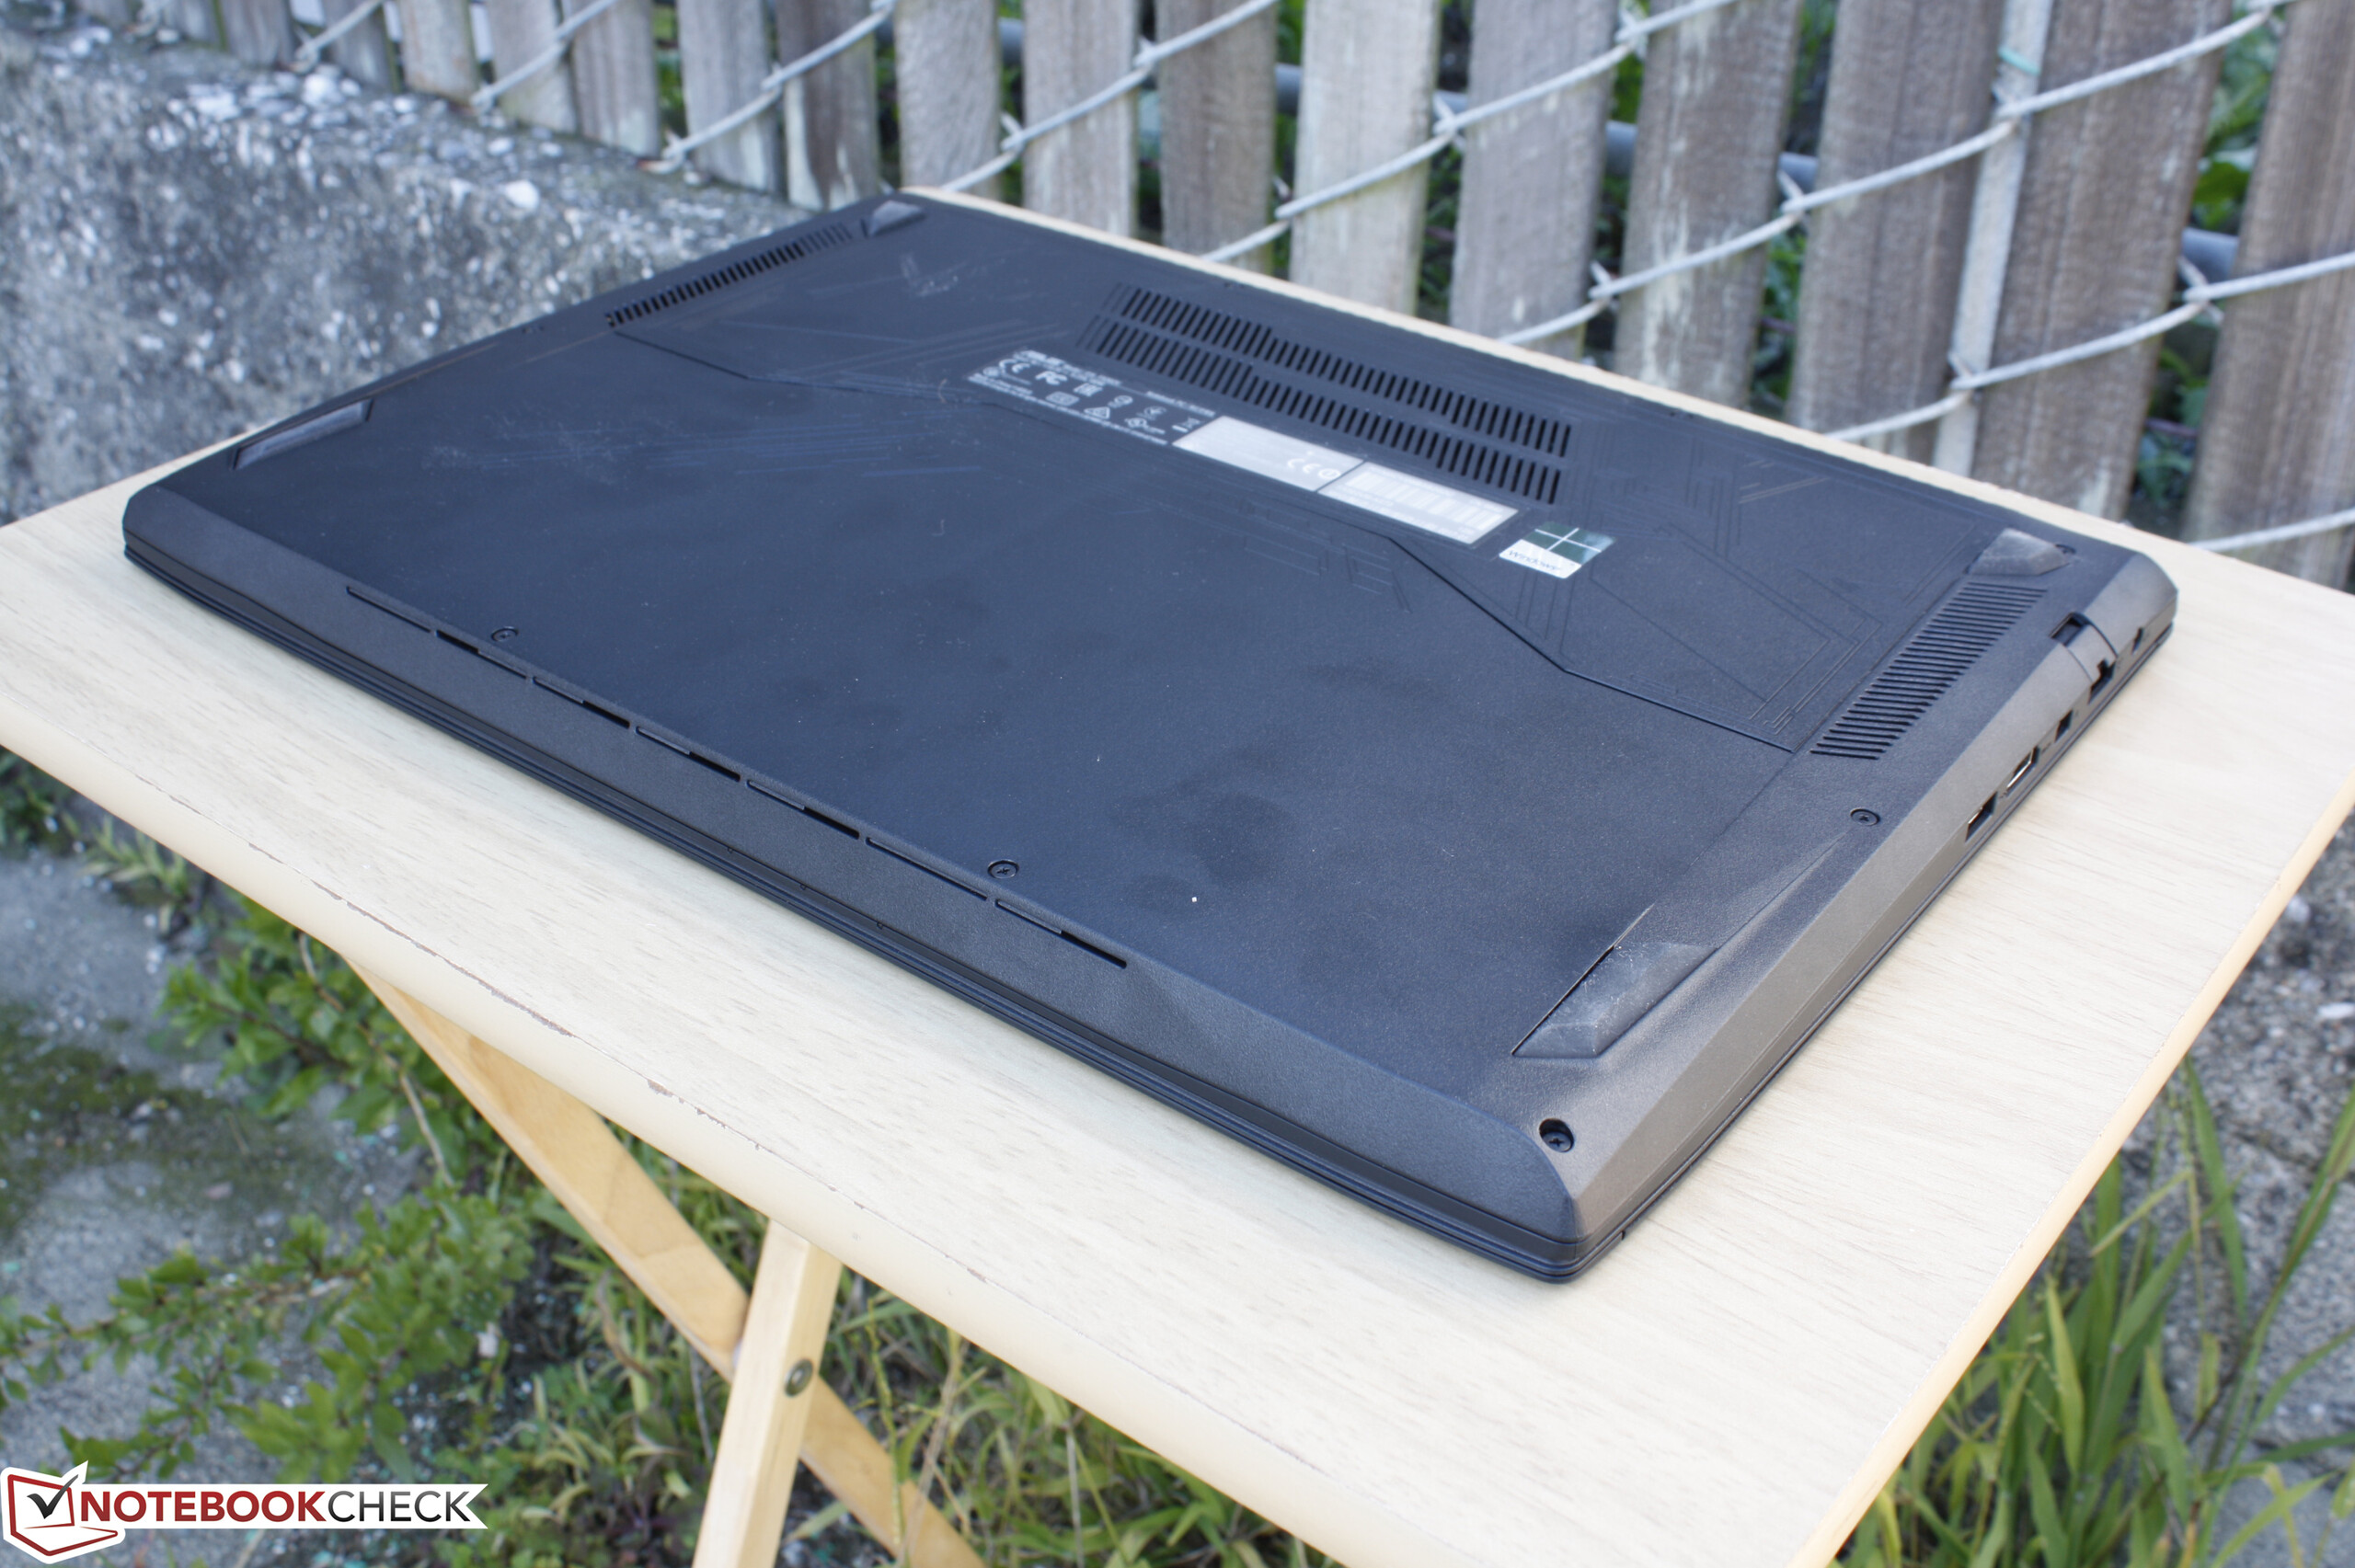
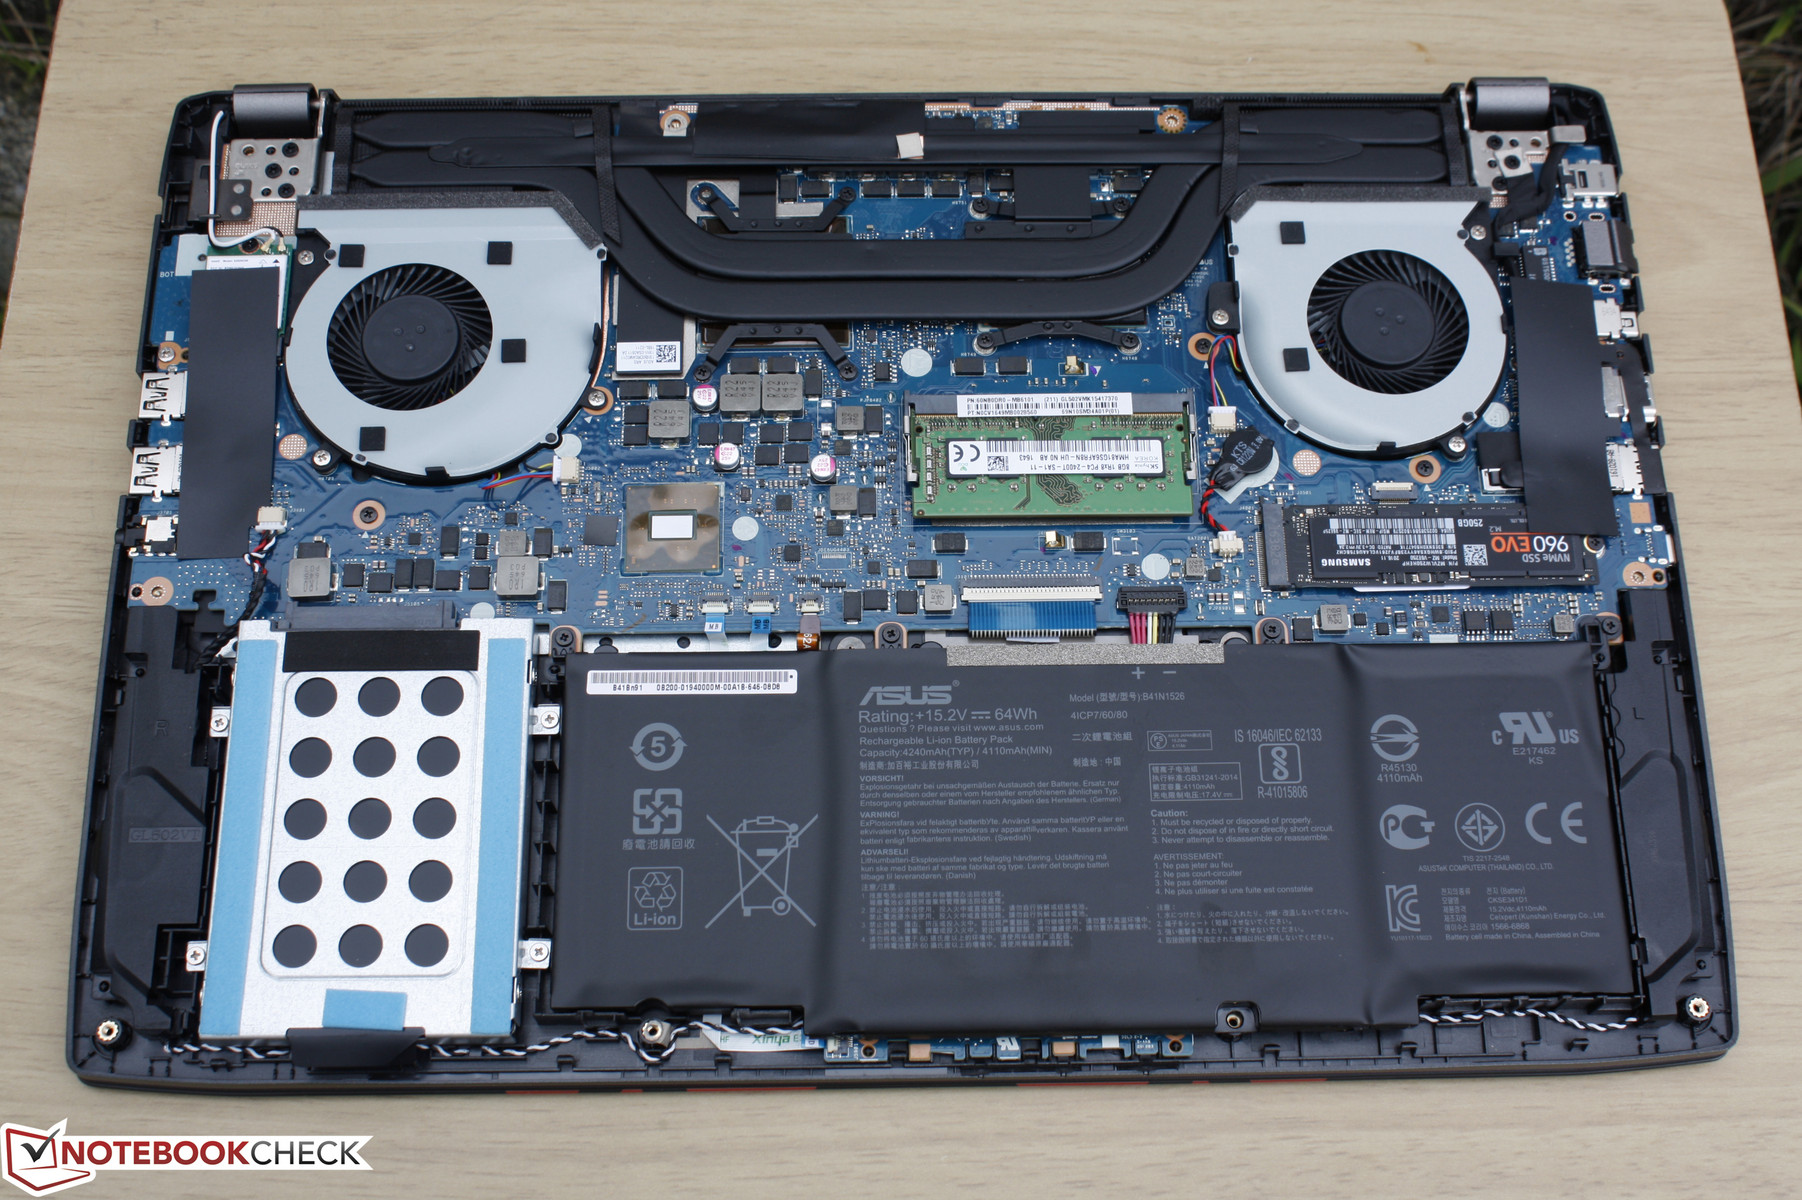
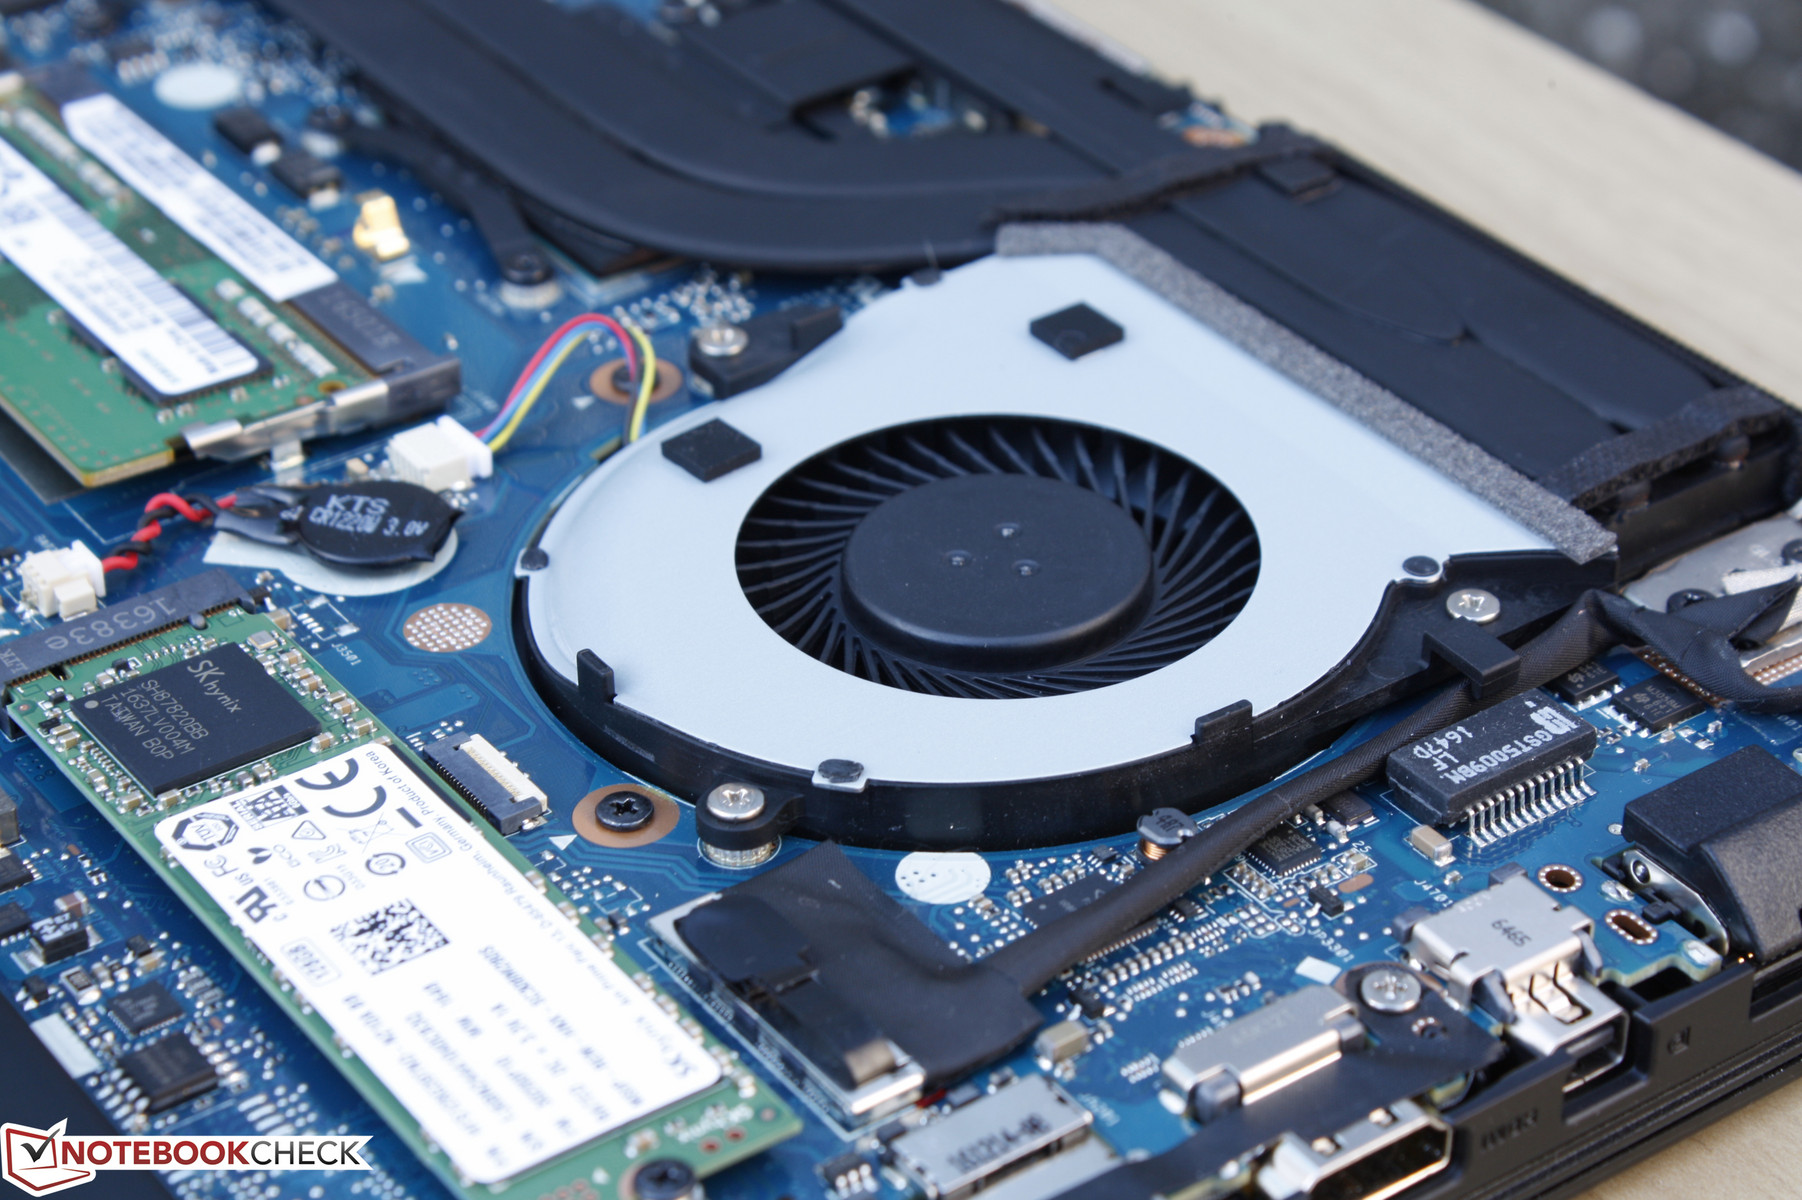
Maintenance
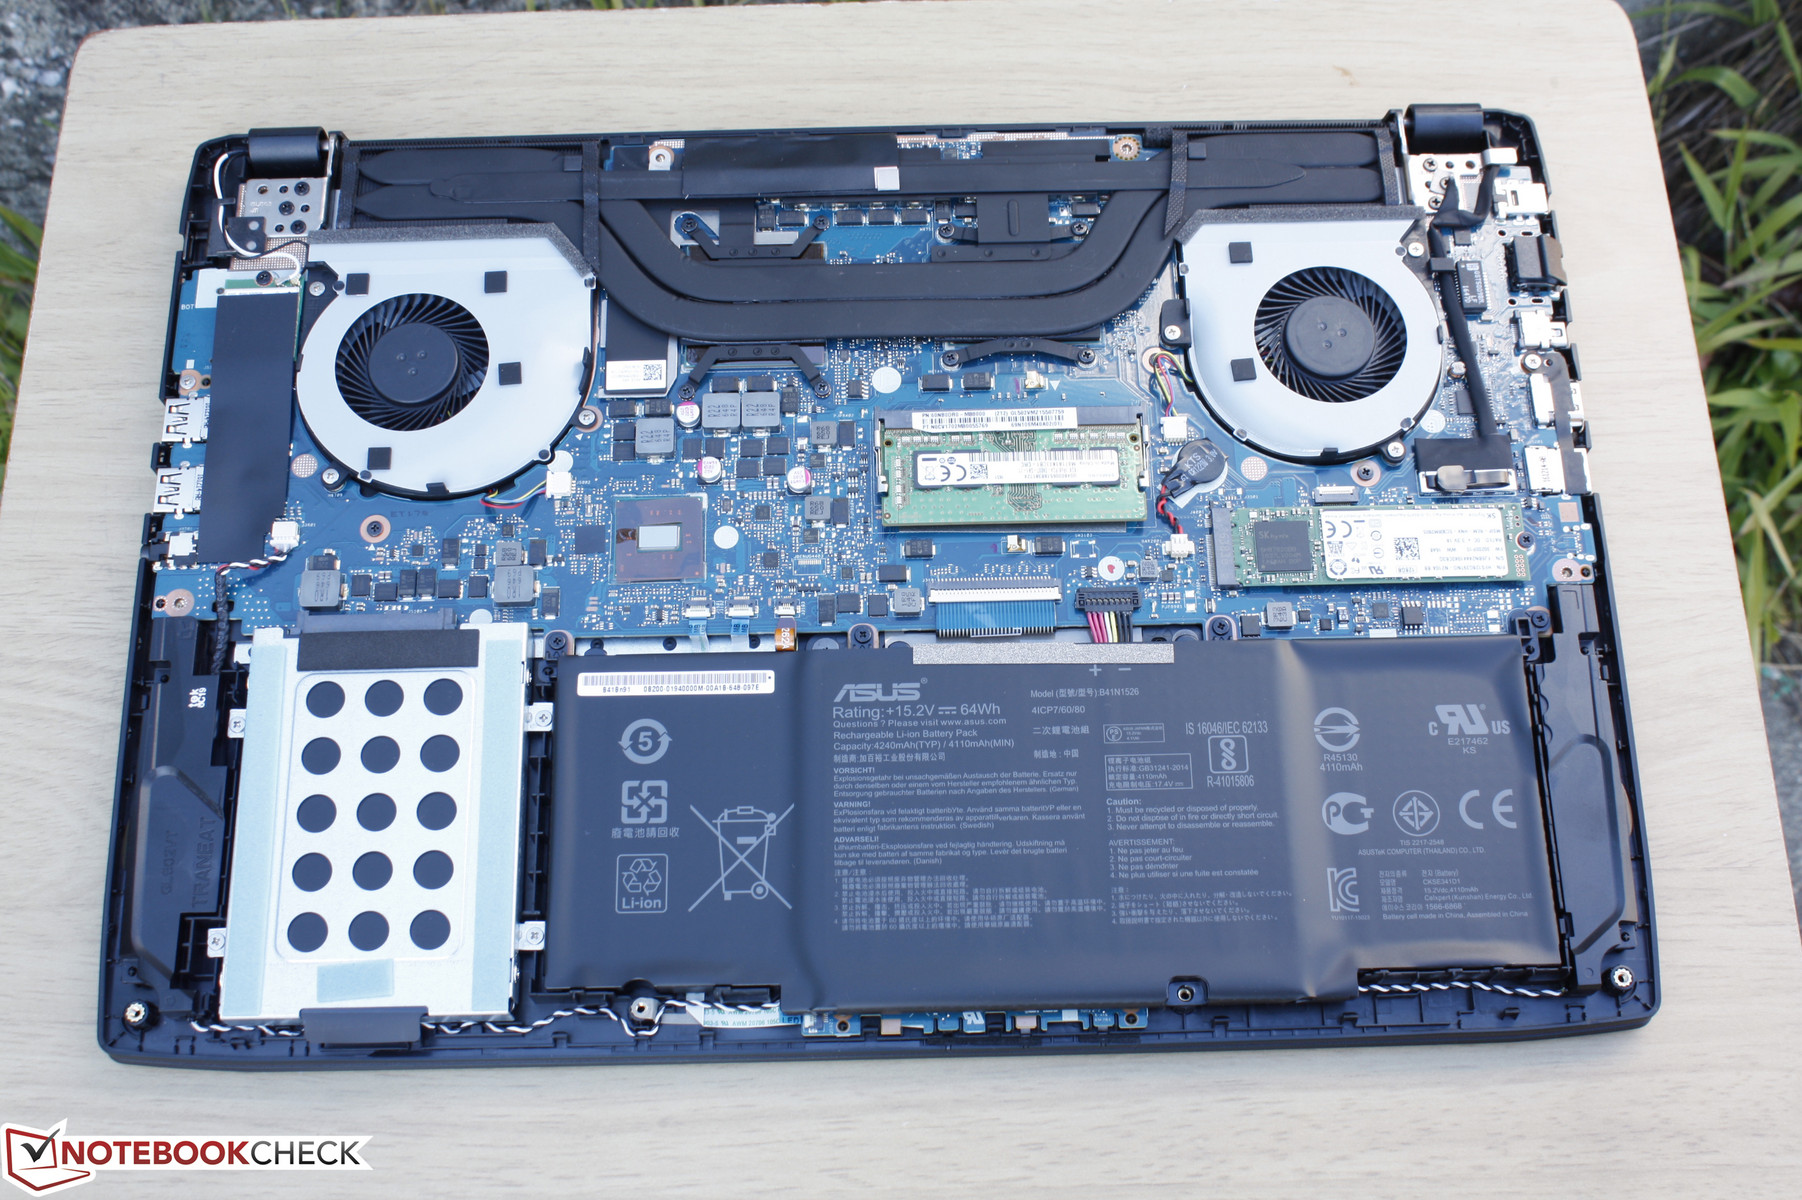
The entire bottom panel can be detached quite easily with a small Philips screwdriver and a sharp edge. Unsurprisingly, the internals are nearly identical to that of our last GL502VM test unit. Users can easily replace the M.2 SSD, 2.5-inch drive, M.2 2232 WLAN card, and the single 1x DDR4 SODIMM slot. Access to the BIOS battery may require additional disassembly.
Warranty
The standard one-year manufacturer limited warranty applies to both the notebook and battery. CUKUSA will also cover any components installed by the reseller for three years including storage drives and RAM modules.
Please see our Guarantees, Return Policies and Warranties FAQ for country-specific information.
Input Devices
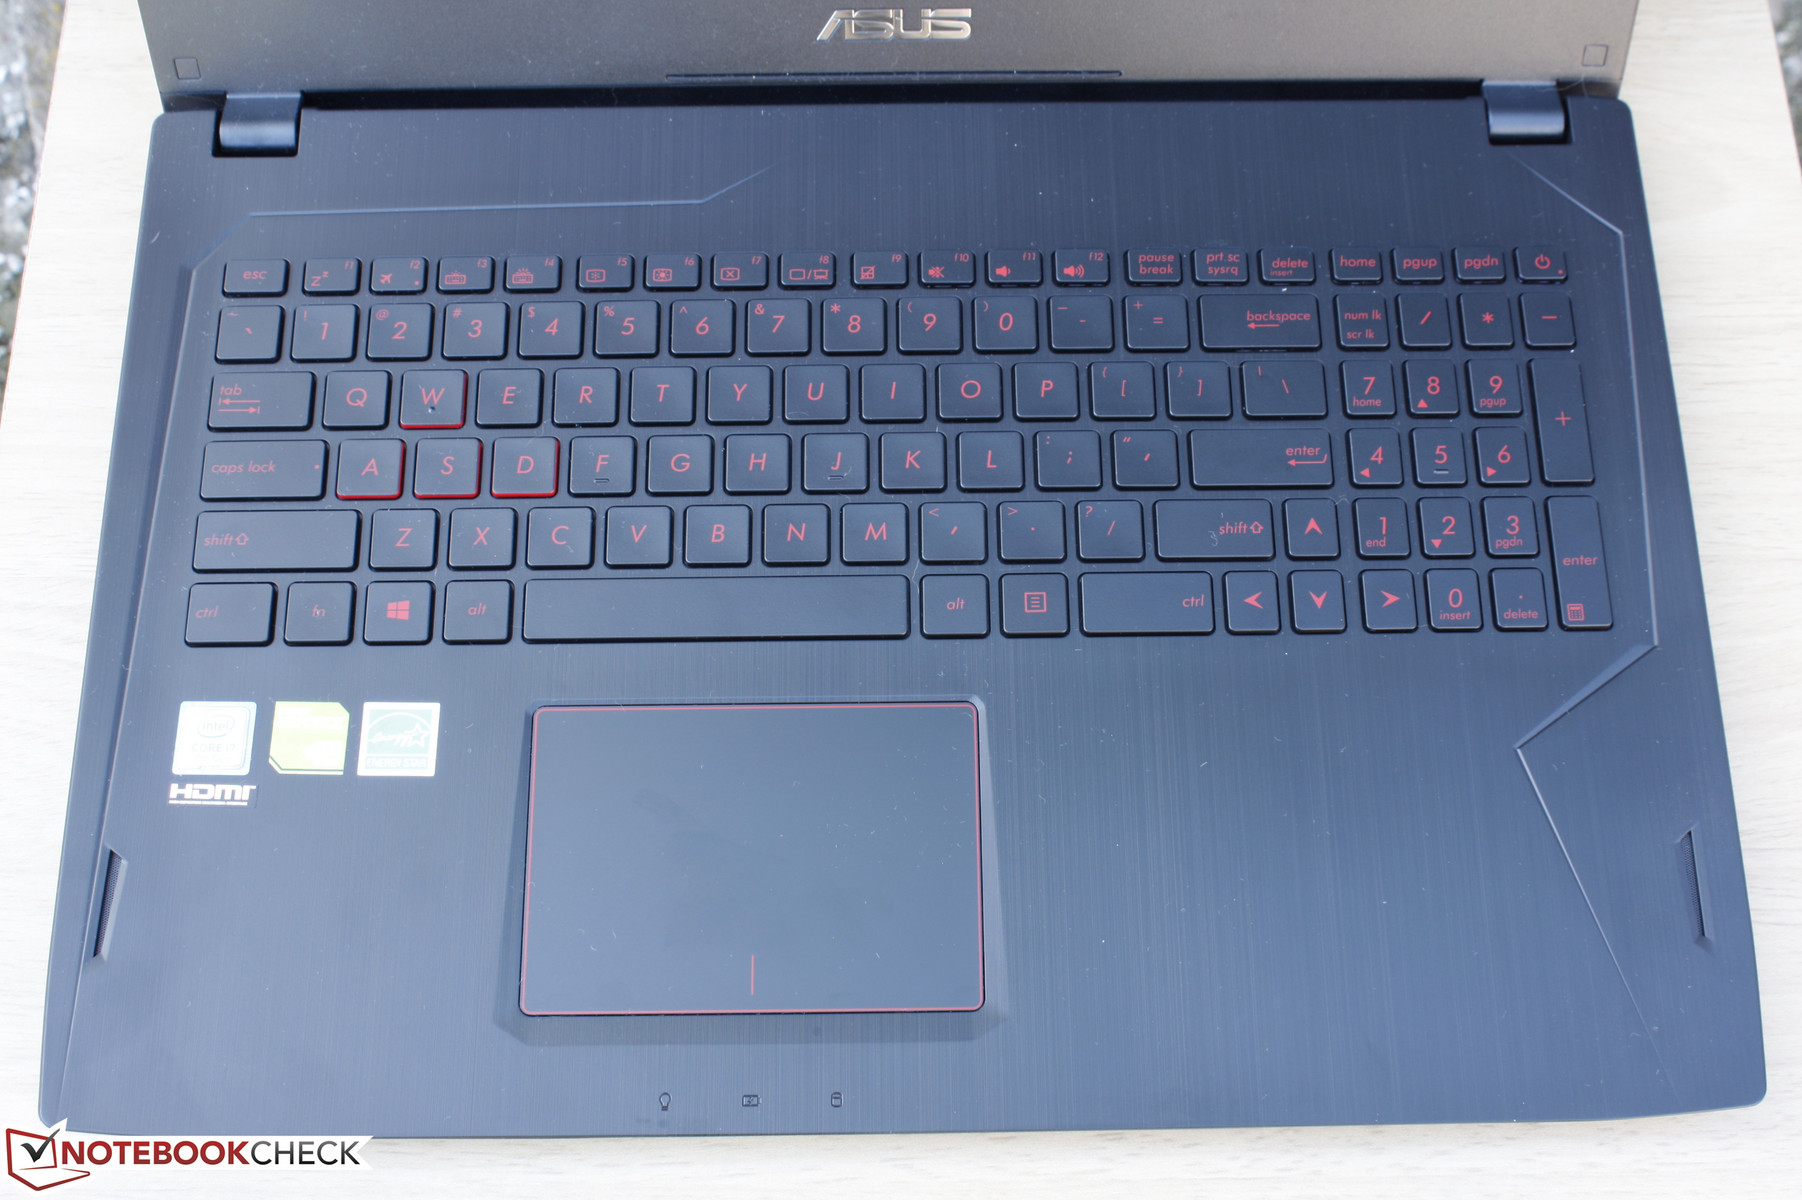
Keyboard
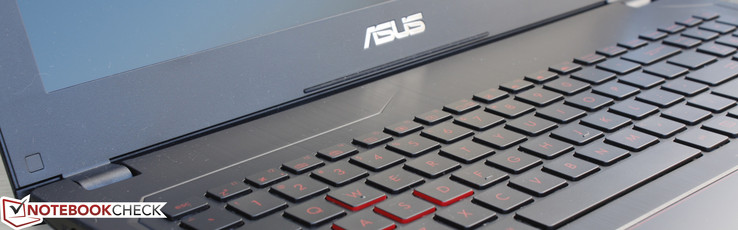
The backlit chiclet keyboard is the standard Asus ROG fare. The keys provide a travel of 1.6 mm with quiet and relatively firm feedback when pressed. When compared to our recently reviewed XPS 15 9560, the keys on the Asus clatter less and do not wiggle side-to-side as easily. Key feedback is not as firm as on the MSI GT series or the aforementioned Dell, but satisfactory nonetheless.
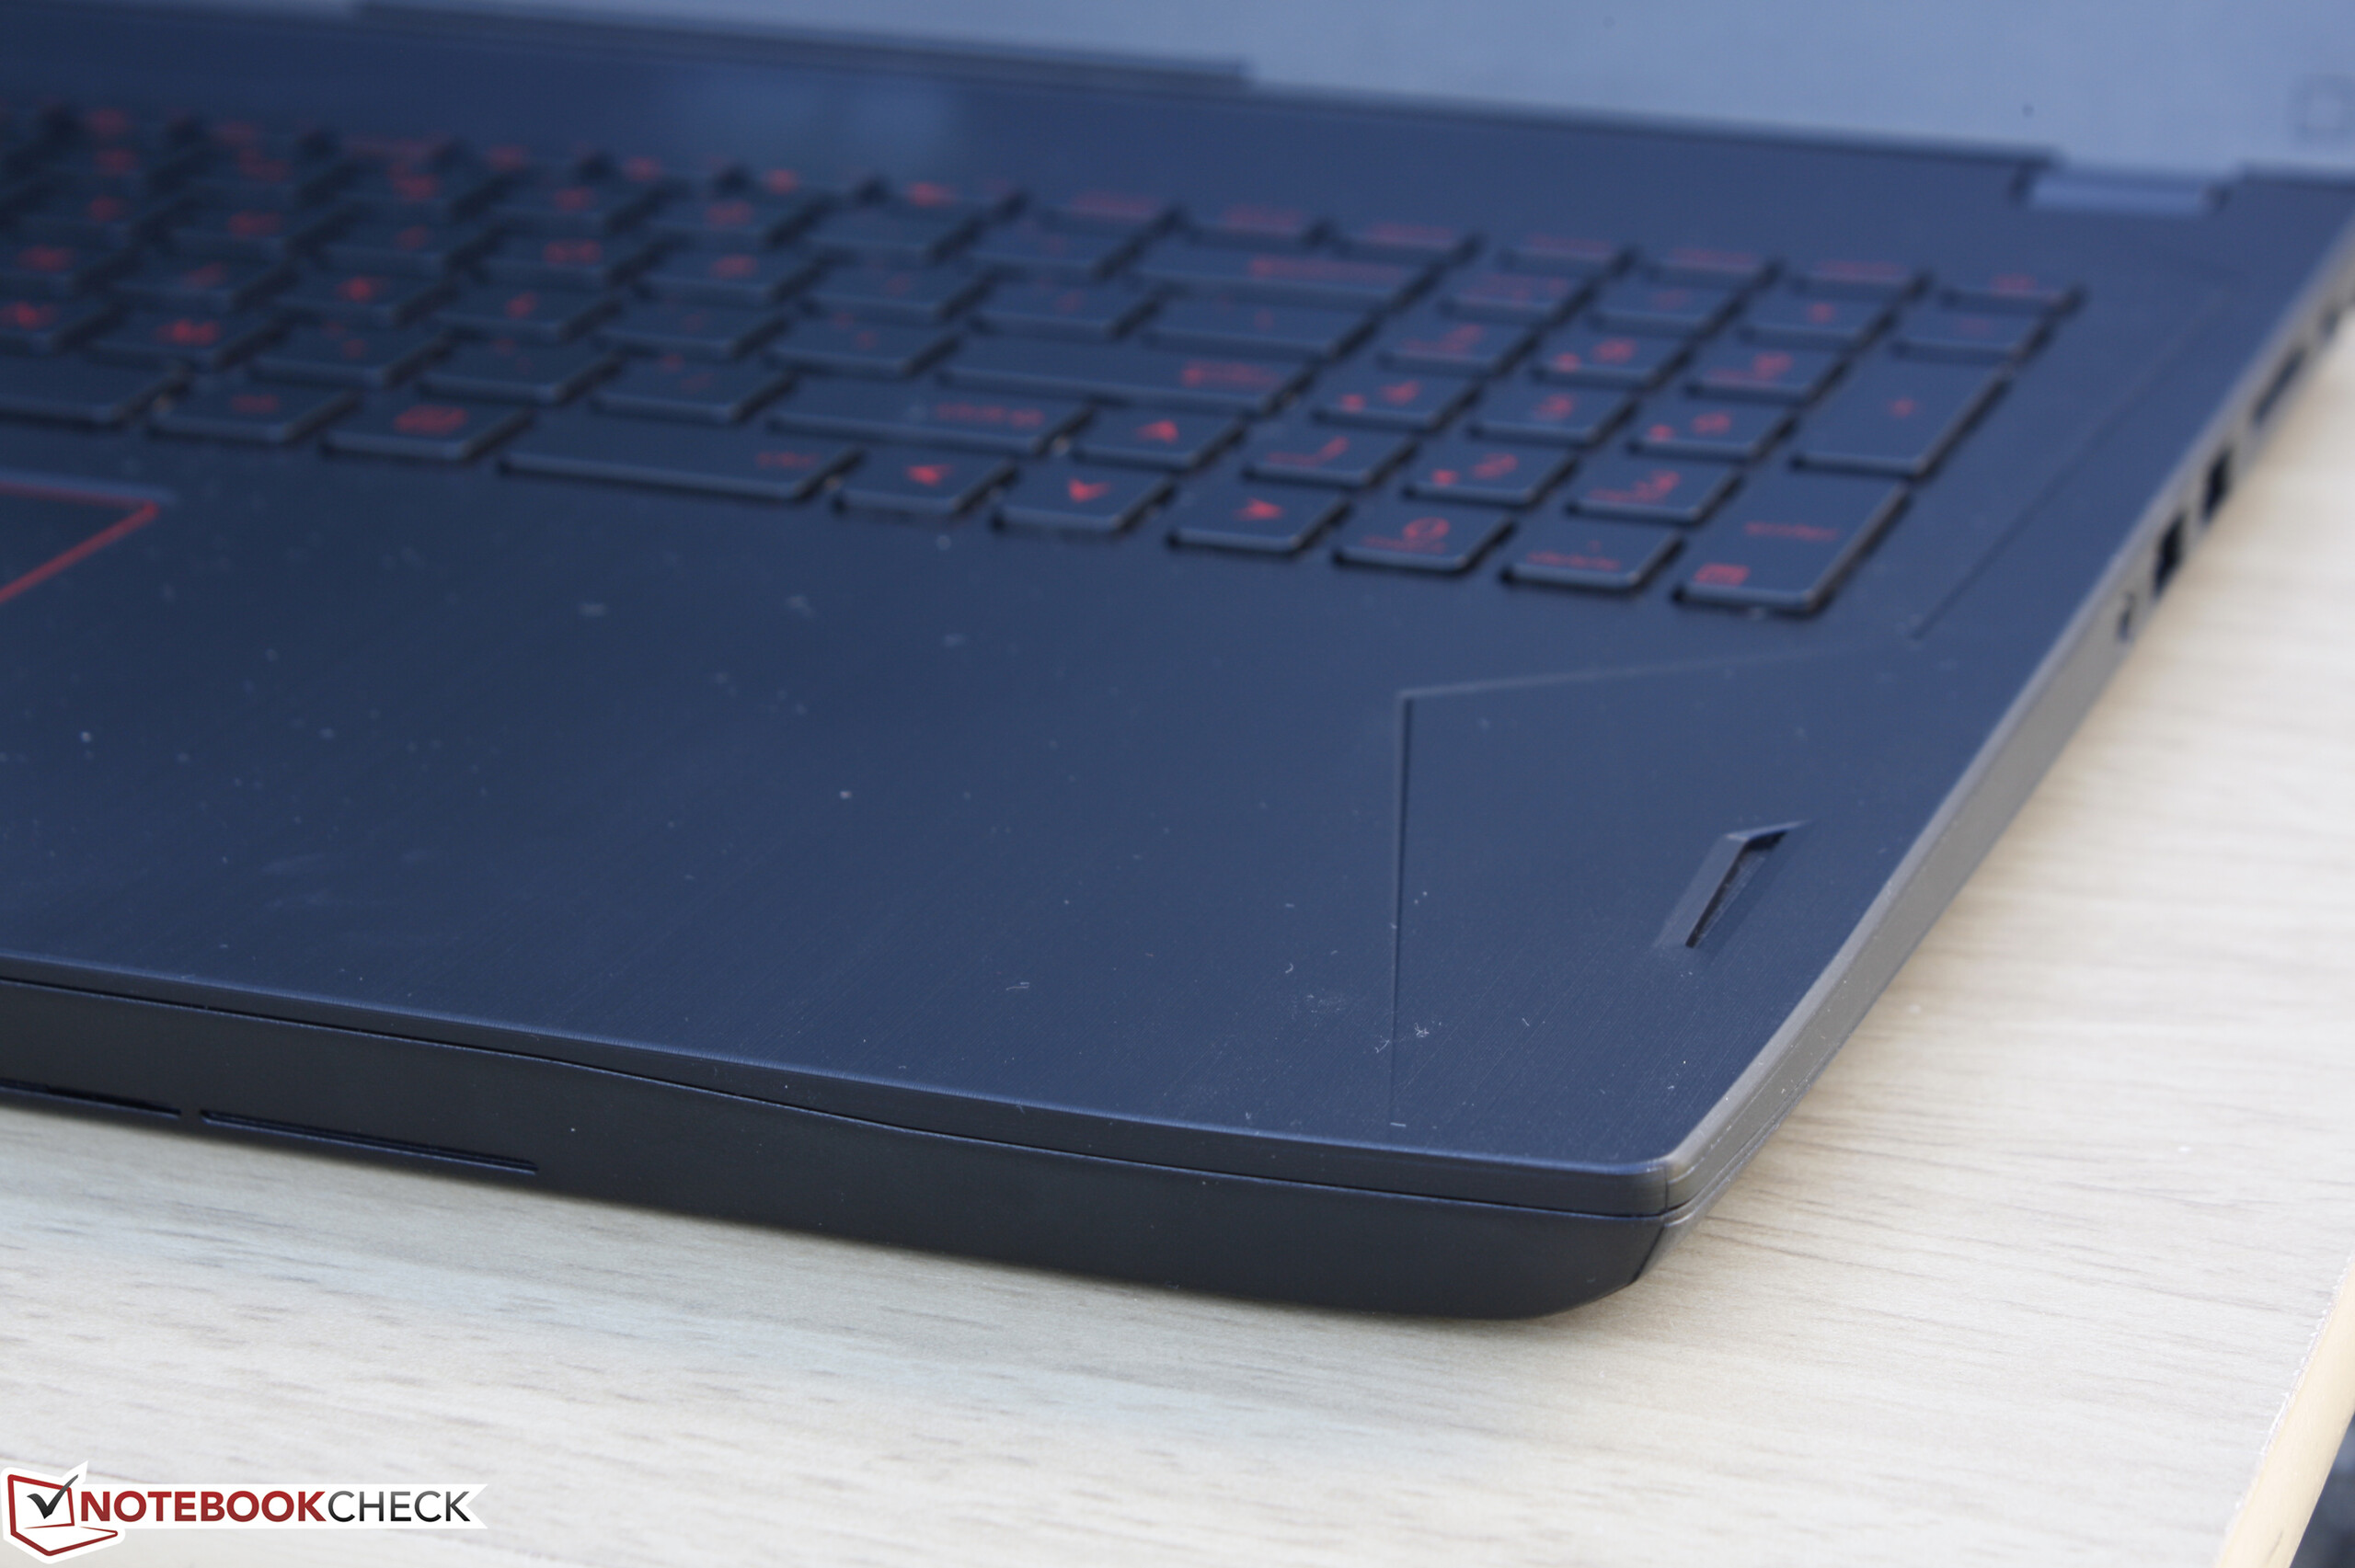
A three-level red backlight comes standard. We're still not fans of the placement of the Power button as it sits cautiously close to the commonly used "PgDn" and "-" keys. Additional macro or auxiliary keys would have also been appreciated much like on the G75x series or the MSI GT/GE series.
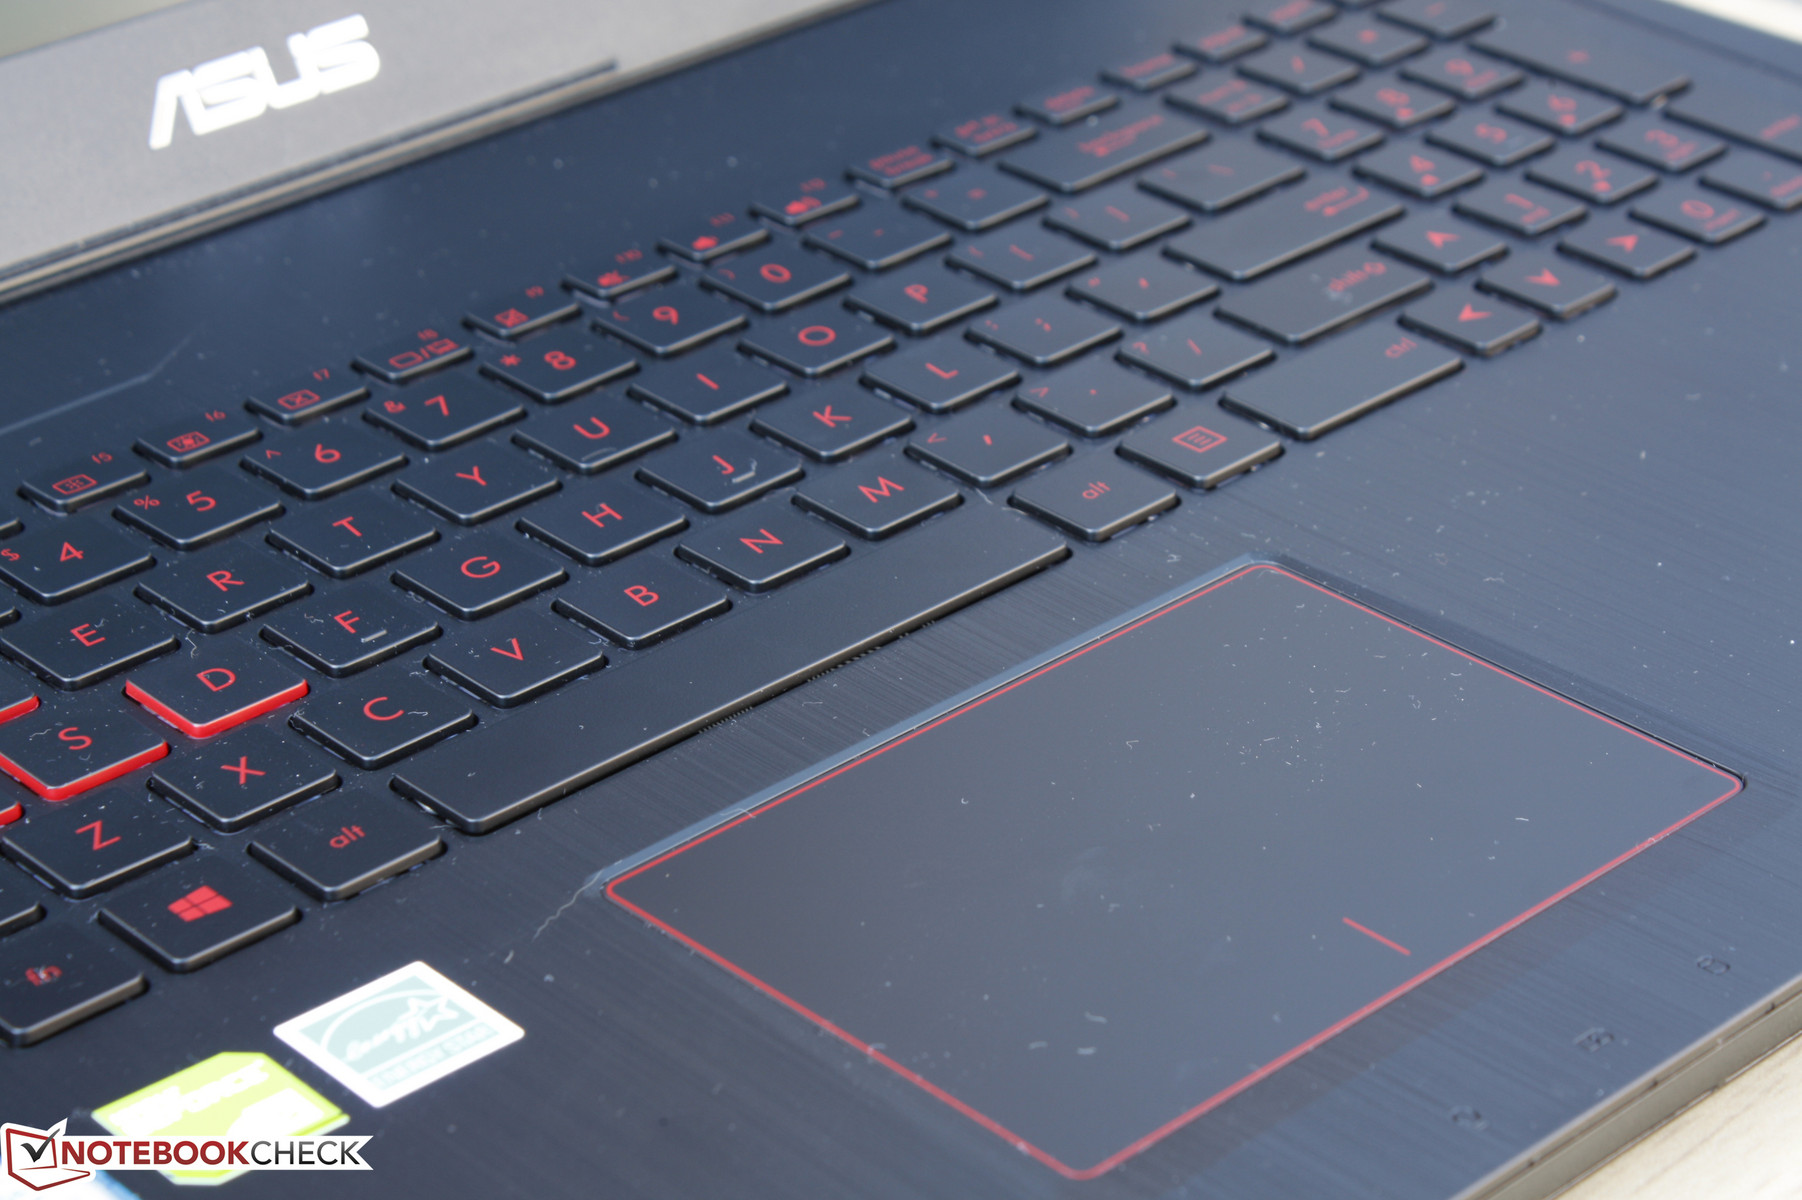
Touchpad
The reasonably sized (~10.5 x 7.5 cm) clickpad functions as intended and is equally responsive around its edges and corners as it is towards the center. While glide is smooth, the matte surface accumulates grease very quickly.
The major downside to the clickpad is that its bottom half depresses too easily and feels spongier than its top half as a result. Simply applying light pressure to the clickpad for cursor control will cause the surface to sink slightly. This squishy travel negatively impacts the otherwise firm integrated mouse keys.
Display
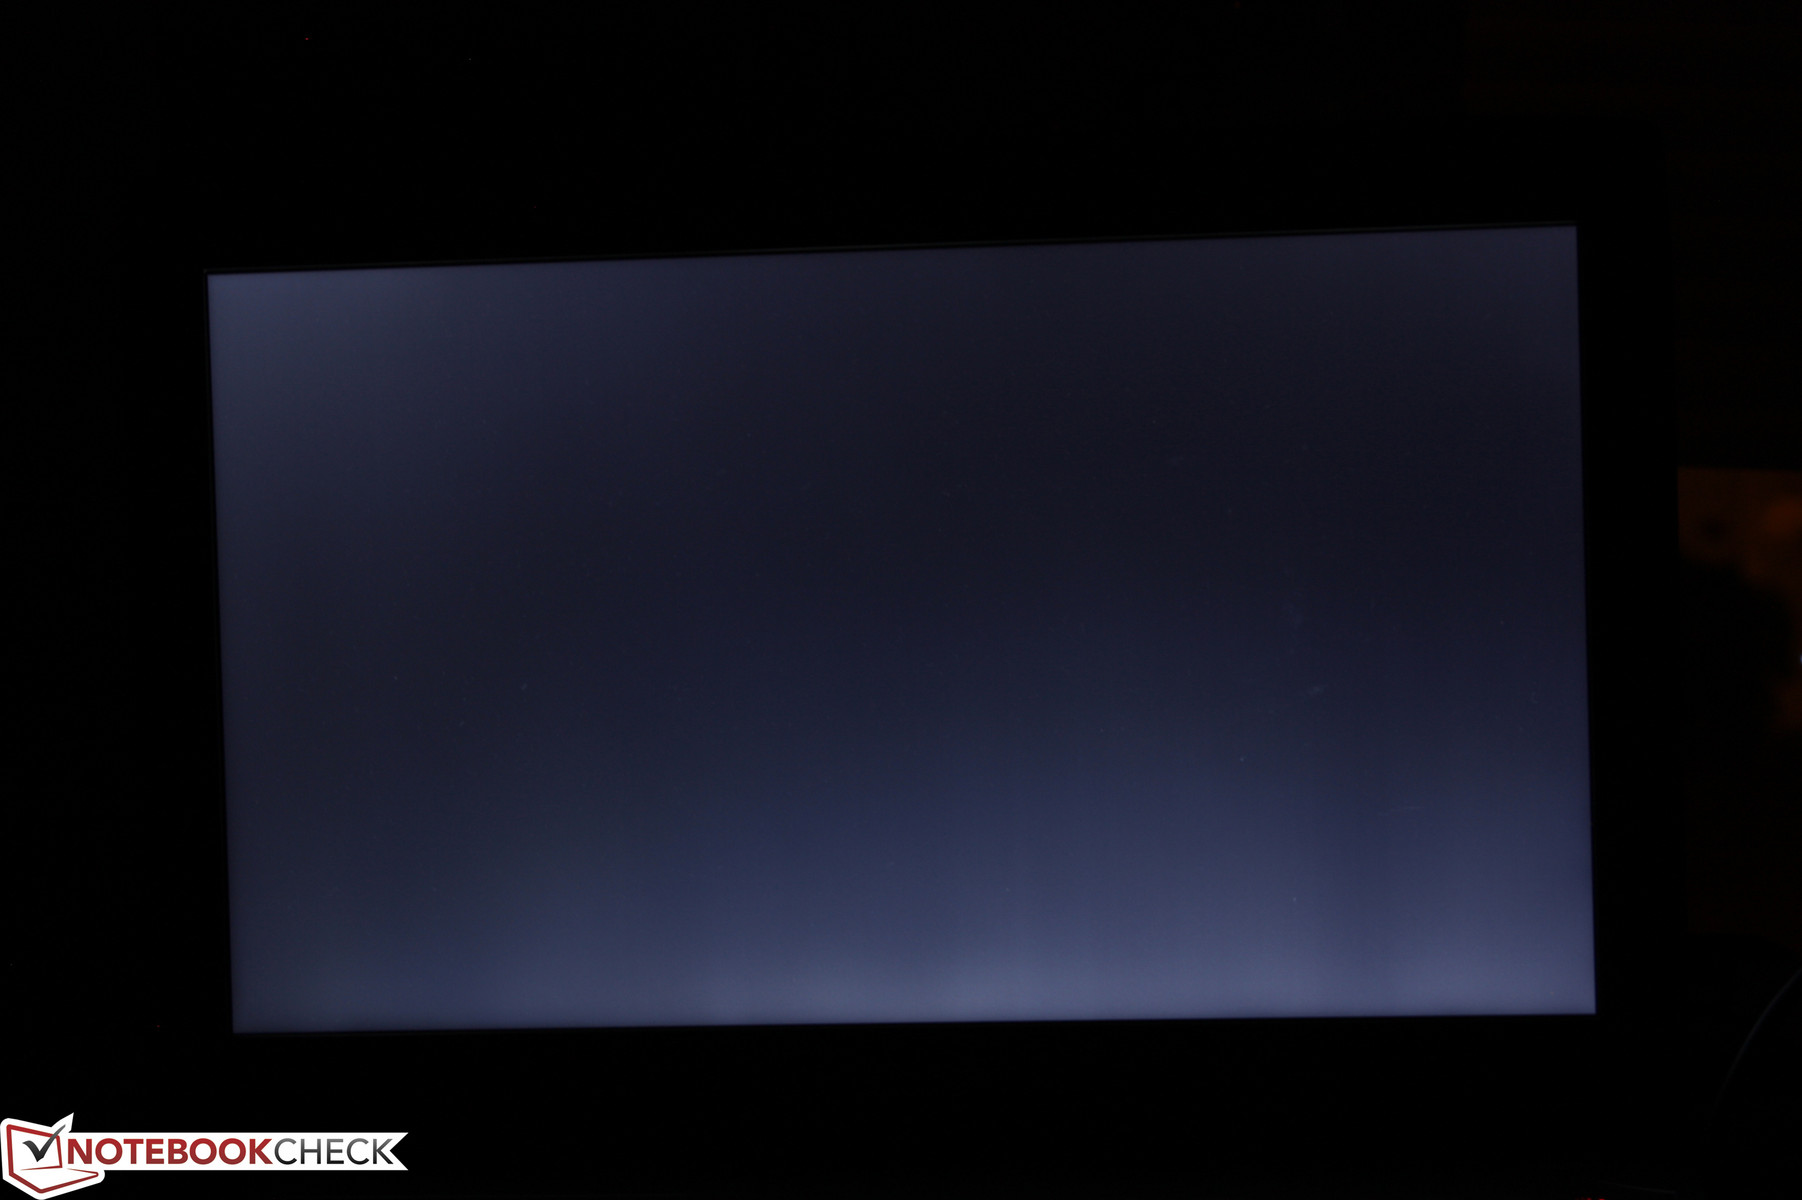
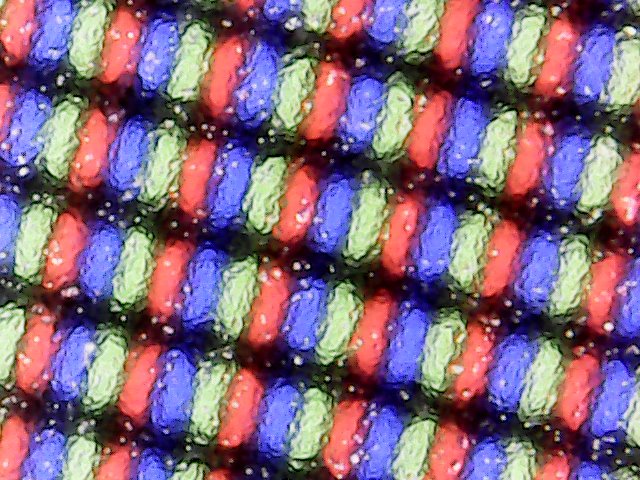
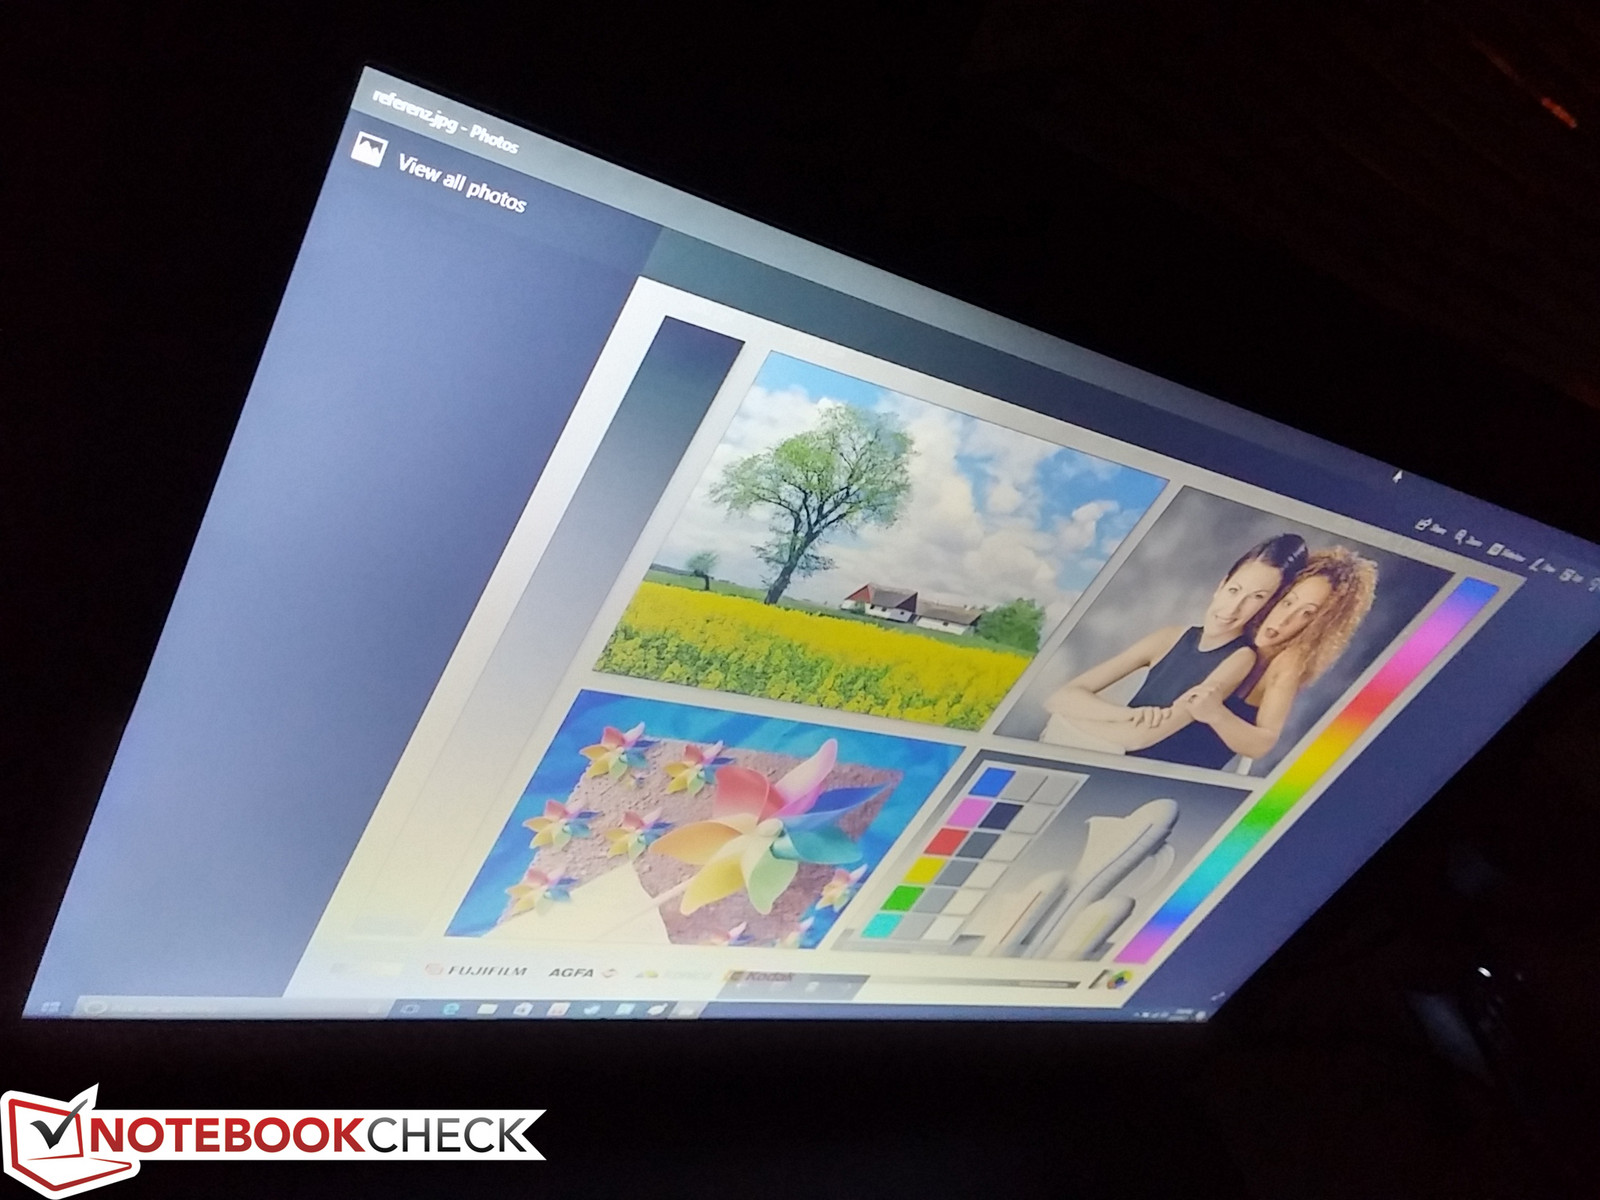
The display is the major differentiating factor between the FX502VM and the pricier GL502VM. Whereas the two FHD display options for the GL502VM are IPS with either 72 percent or 94 percent NTSC color coverage, the FX502VM scraps the 94 percent NTSC option in favor of a more inexpensive 45 percent NTSC option. This lower-end TN display is what we have here on our test unit and it is very disappointing especially for a gaming notebook. Contrast ratio is very low (300:1), the backlight brightness is subpar, and gamut is disappointingly narrow. This same BOE NT156FHM-N41 panel can also be found on the Dell Vostro 15 5568 and Acer TravelMate P449-M, both of which also exhibit poor display characteristics.
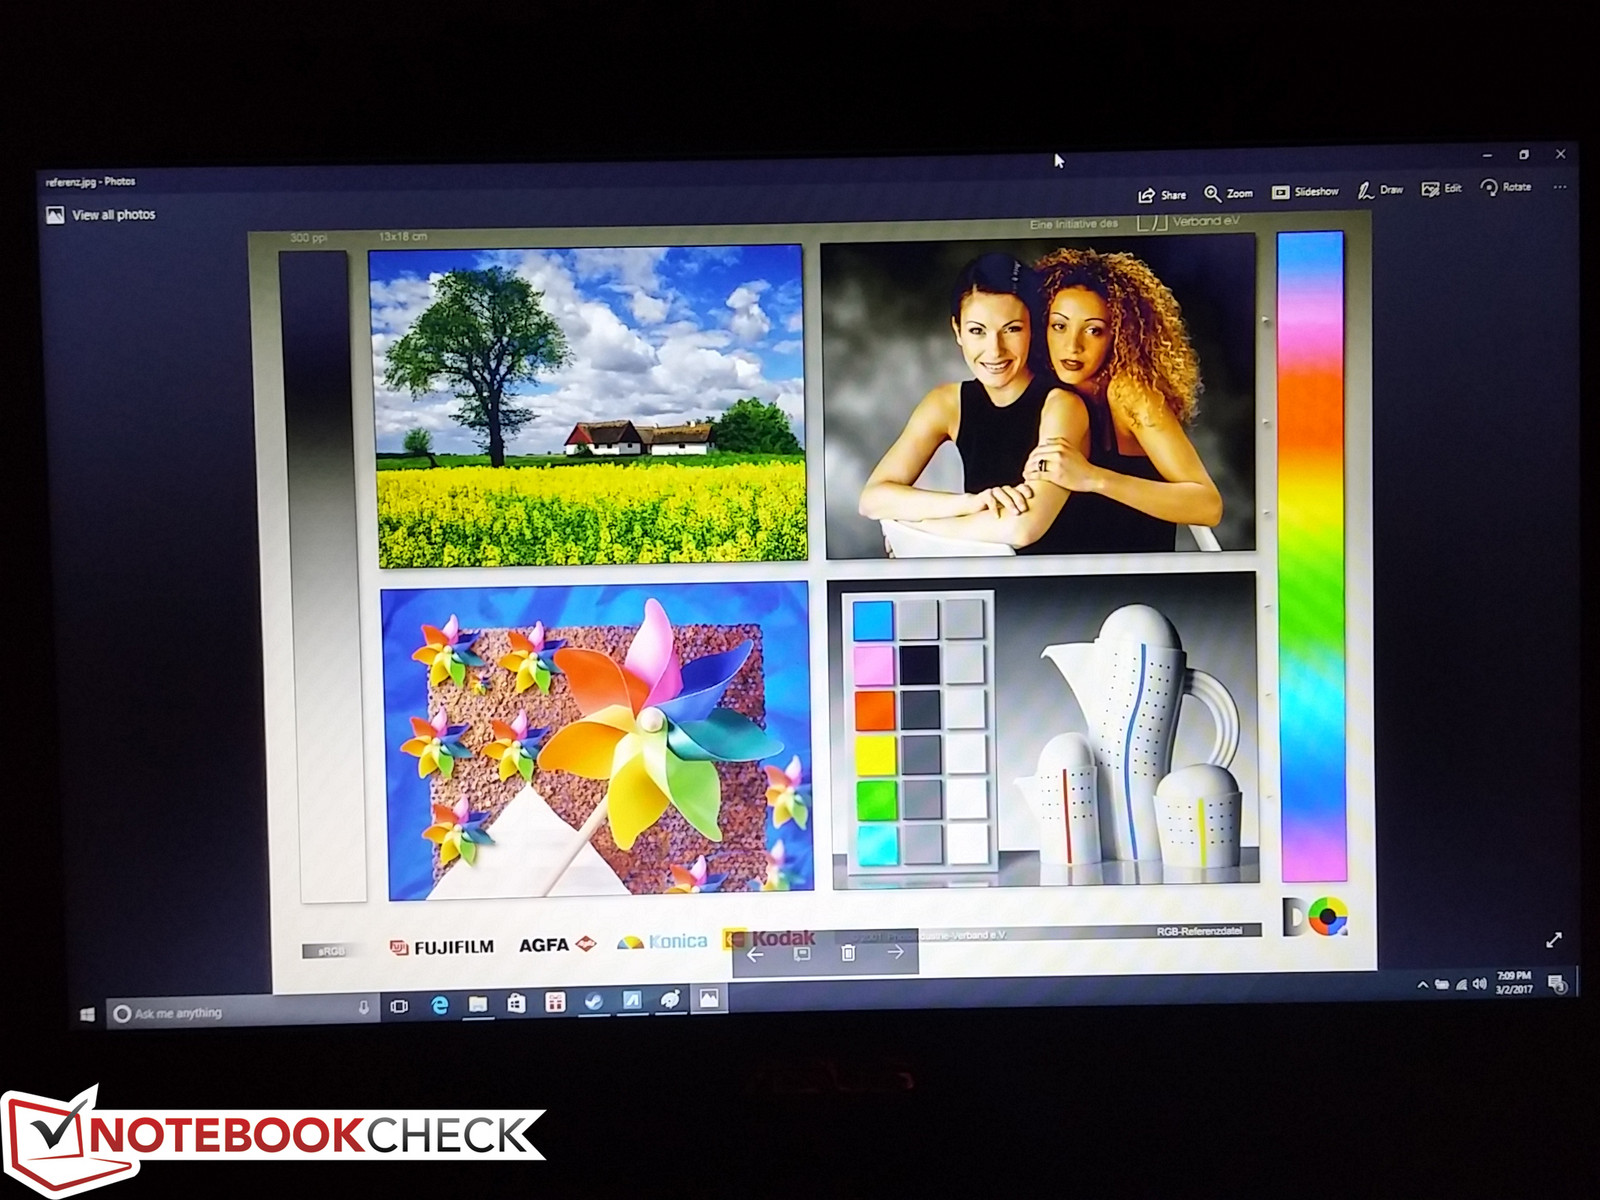
Subjectively, the combination of poor contrast levels and narrow color gamut results in blacks looking too gray and colors appearing muted. Text and images are otherwise sharp with just a slight graininess to the overall matte display. Blacklight bleeding is relatively even, but major shifts in grayscale can be observed as is common on cheap TN panels.
| |||||||||||||||||||||||||
Brightness Distribution: 92 %
Center on Battery: 209.5 cd/m²
Contrast: 304:1 (Black: 0.69 cd/m²)
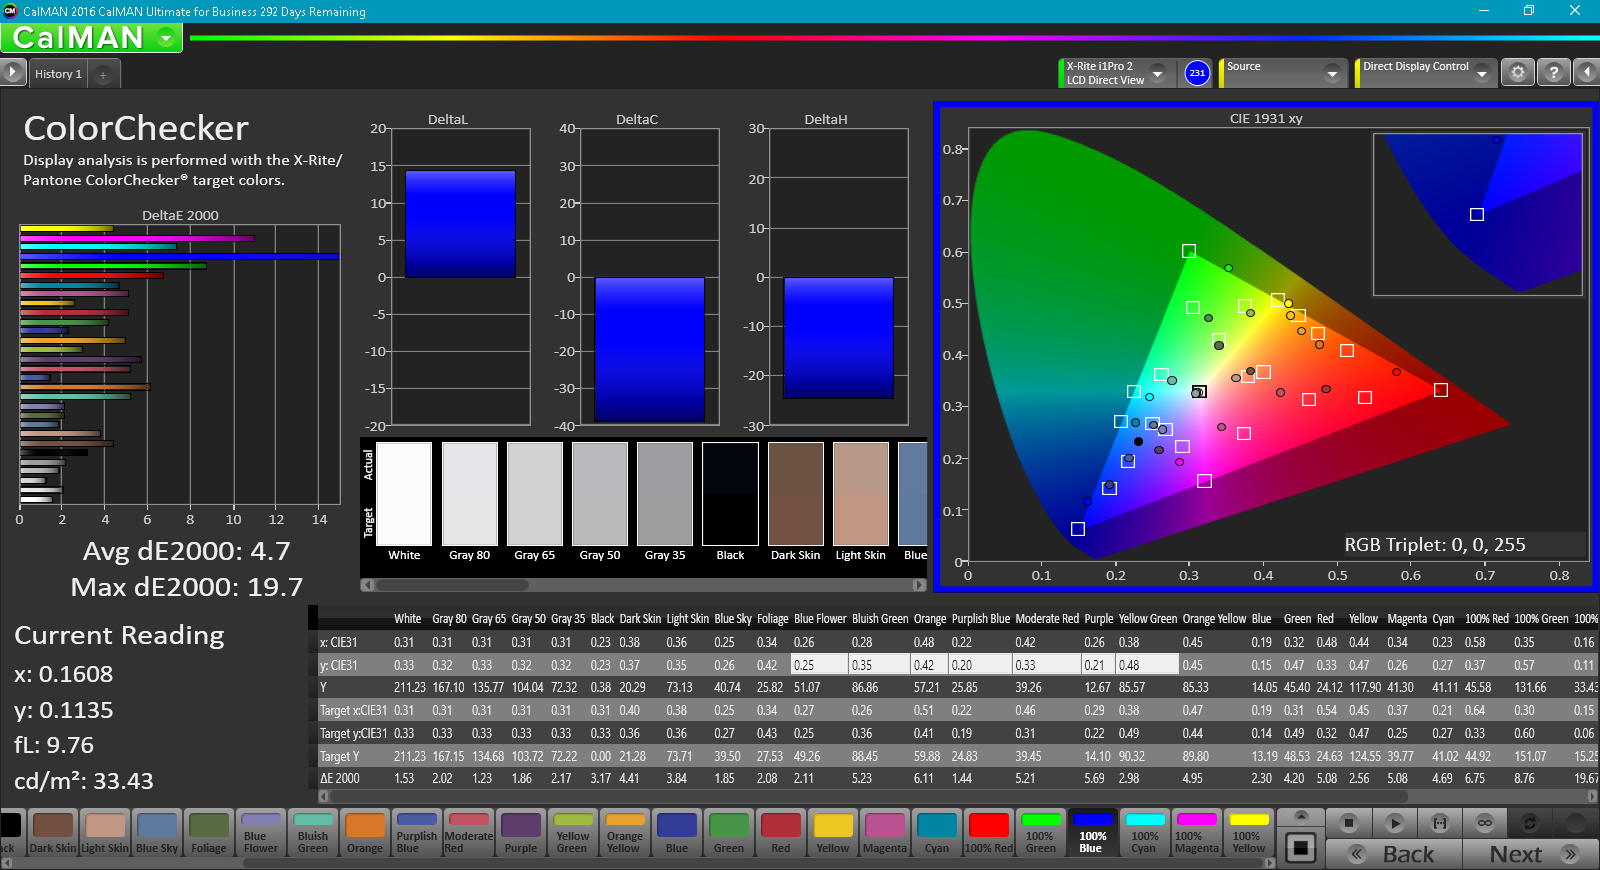
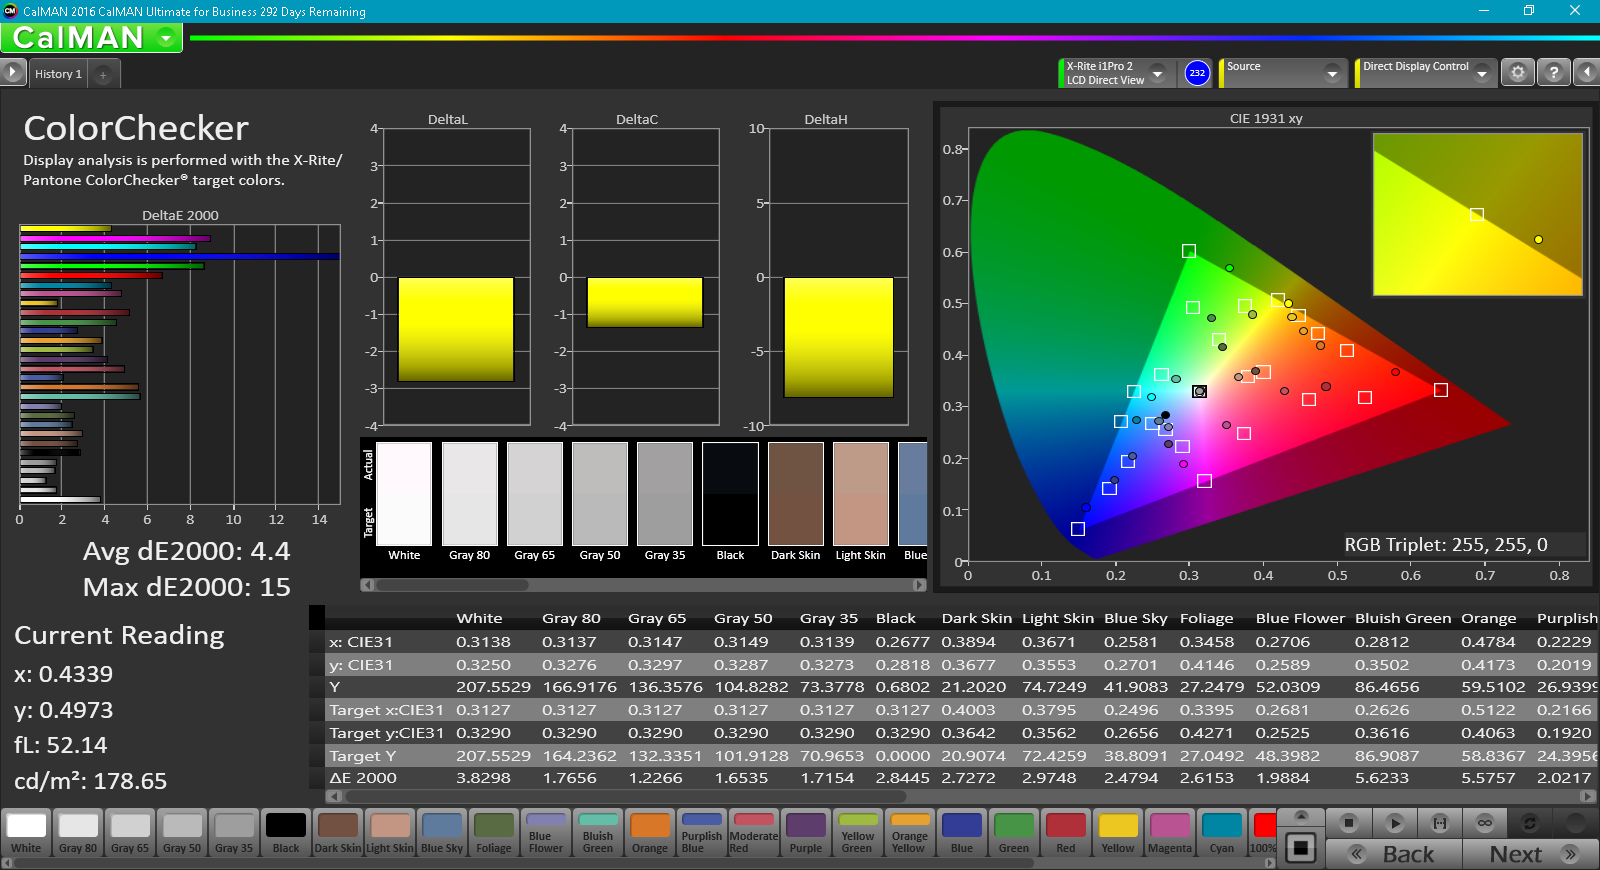
ΔE ColorChecker Calman: 4.7 | ∀{0.5-29.43 Ø4.71}
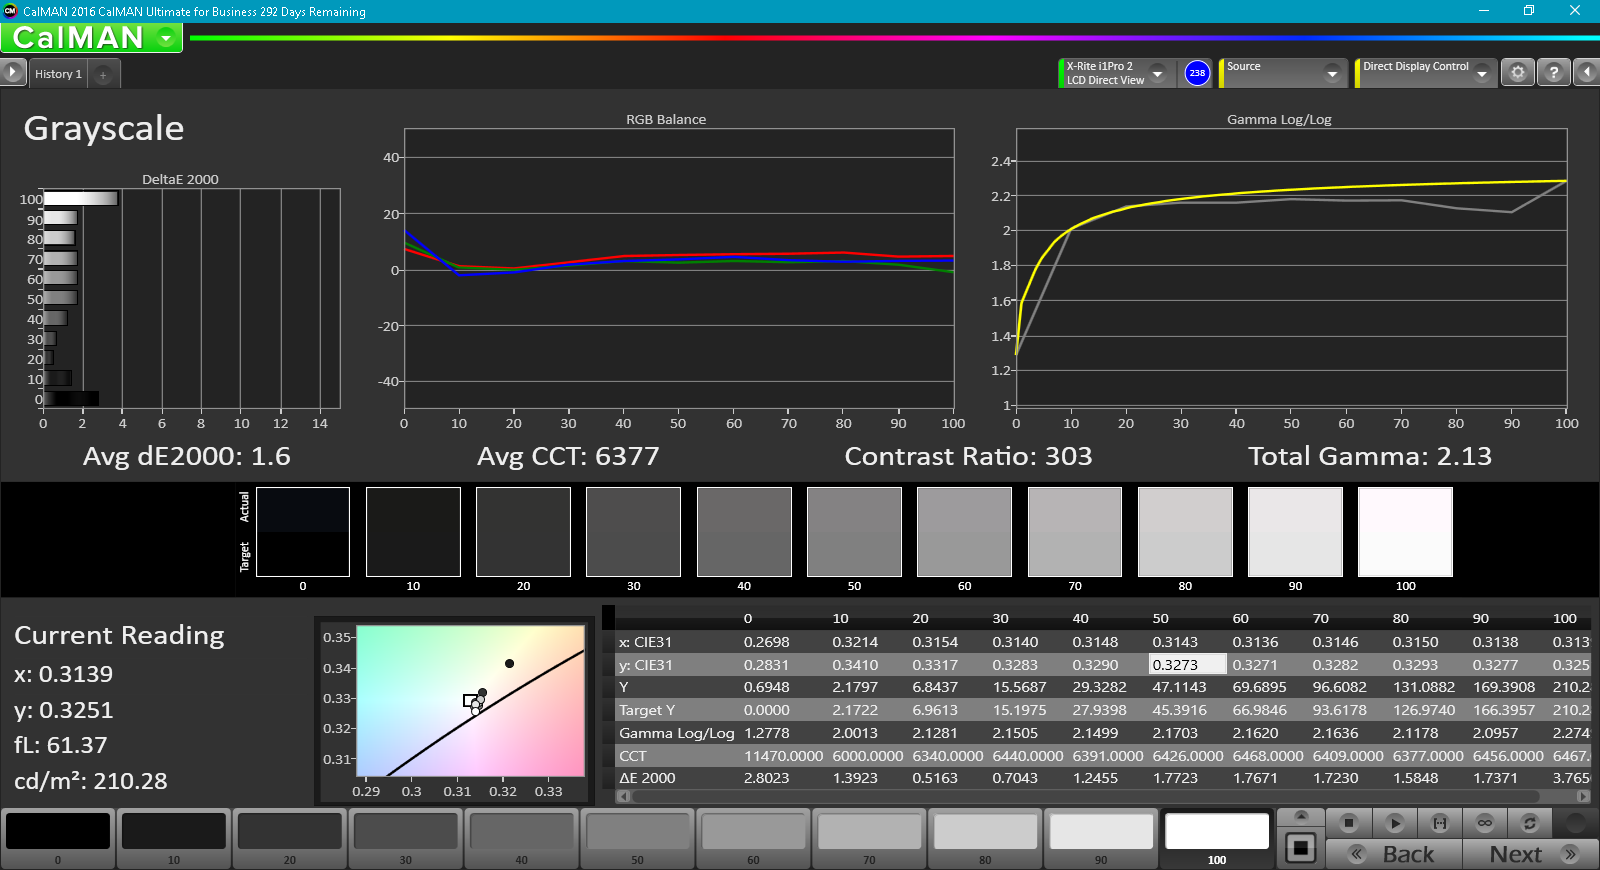
ΔE Greyscale Calman: 1.8 | ∀{0.09-98 Ø4.96}
56.6% sRGB (Argyll 1.6.3 3D)
36.2% AdobeRGB 1998 (Argyll 1.6.3 3D)
39.47% AdobeRGB 1998 (Argyll 3D)
56.9% sRGB (Argyll 3D)
38.28% Display P3 (Argyll 3D)
Gamma: 2.23
CCT: 6975 K
| Asus FX502VM-AS73 TN LED, 15.6", 1920x1080 | Alienware 15 R3 HPJGK_B156HTN (AUO51ED), TN, 15.6", 1920x1080 | MSI GT62VR 7RE-223 LG Philips LP156WF6 (LGD046F), IPS, 15.6", 1920x1080 | Dell XPS 15 2017 9560 (7300HQ, Full-HD) Sharp SHP1453 LQ156M1, LED IGZO IPS InfinityEdge, 15.6", 1920x1080 | Gigabyte P55W v7 LG Philips LP156WF6 (LGD046F), IPS, 15.6", 1920x1080 | Asus Strix GL502VM-DS74 IPS, 15.6", 1920x1080 | |
|---|---|---|---|---|---|---|
| Display | 66% | 56% | 78% | 54% | 58% | |
| Display P3 Coverage (%) | 38.28 | 66 72% | 63.9 67% | 68.9 80% | 63.5 66% | 64.8 69% |
| sRGB Coverage (%) | 56.9 | 90.5 59% | 83.1 46% | 98.9 74% | 82 44% | 84.9 49% |
| AdobeRGB 1998 Coverage (%) | 39.47 | 66.2 68% | 60.8 54% | 70.9 80% | 59.9 52% | 62 57% |
| Response Times | 29% | -21% | -112% | -21% | -47% | |
| Response Time Grey 50% / Grey 80% * (ms) | 28.4 ? | 25 ? 12% | 37 ? -30% | 54 ? -90% | 37 ? -30% | 42 ? -48% |
| Response Time Black / White * (ms) | 22.4 ? | 12 ? 46% | 25 ? -12% | 52.4 ? -134% | 25 ? -12% | 32.8 ? -46% |
| PWM Frequency (Hz) | ||||||
| Screen | -6% | 41% | 54% | 39% | 44% | |
| Brightness middle (cd/m²) | 209.5 | 386 84% | 310 48% | 400 91% | 287 37% | 307.8 47% |
| Brightness (cd/m²) | 205 | 382 86% | 311 52% | 392 91% | 289 41% | 301 47% |
| Brightness Distribution (%) | 92 | 93 1% | 85 -8% | 89 -3% | 87 -5% | 88 -4% |
| Black Level * (cd/m²) | 0.69 | 0.39 43% | 0.3 57% | 0.26 62% | 0.29 58% | 0.33 52% |
| Contrast (:1) | 304 | 990 226% | 1033 240% | 1538 406% | 990 226% | 933 207% |
| Colorchecker dE 2000 * | 4.7 | 10.2 -117% | 4.82 -3% | 4.9 -4% | 4.92 -5% | 4.5 4% |
| Colorchecker dE 2000 max. * | 19.7 | 15.81 20% | 10.14 49% | 11 44% | 11 44% | 10 49% |
| Greyscale dE 2000 * | 1.8 | 11.28 -527% | 3.94 -119% | 7.2 -300% | 3.66 -103% | 2.9 -61% |
| Gamma | 2.23 99% | 2.23 99% | 2.45 90% | 2.11 104% | 2.32 95% | 2.22 99% |
| CCT | 6975 93% | 11383 57% | 6877 95% | 6911 94% | 6482 100% | 1136 572% |
| Color Space (Percent of AdobeRGB 1998) (%) | 36.2 | 59 63% | 54 49% | 64.2 77% | 54 49% | 55.4 53% |
| Color Space (Percent of sRGB) (%) | 56.6 | 90 59% | 83 47% | 98.9 75% | 82 45% | 84.8 50% |
| Total Average (Program / Settings) | 30% /
13% | 25% /
36% | 7% /
37% | 24% /
34% | 18% /
35% |
* ... smaller is better
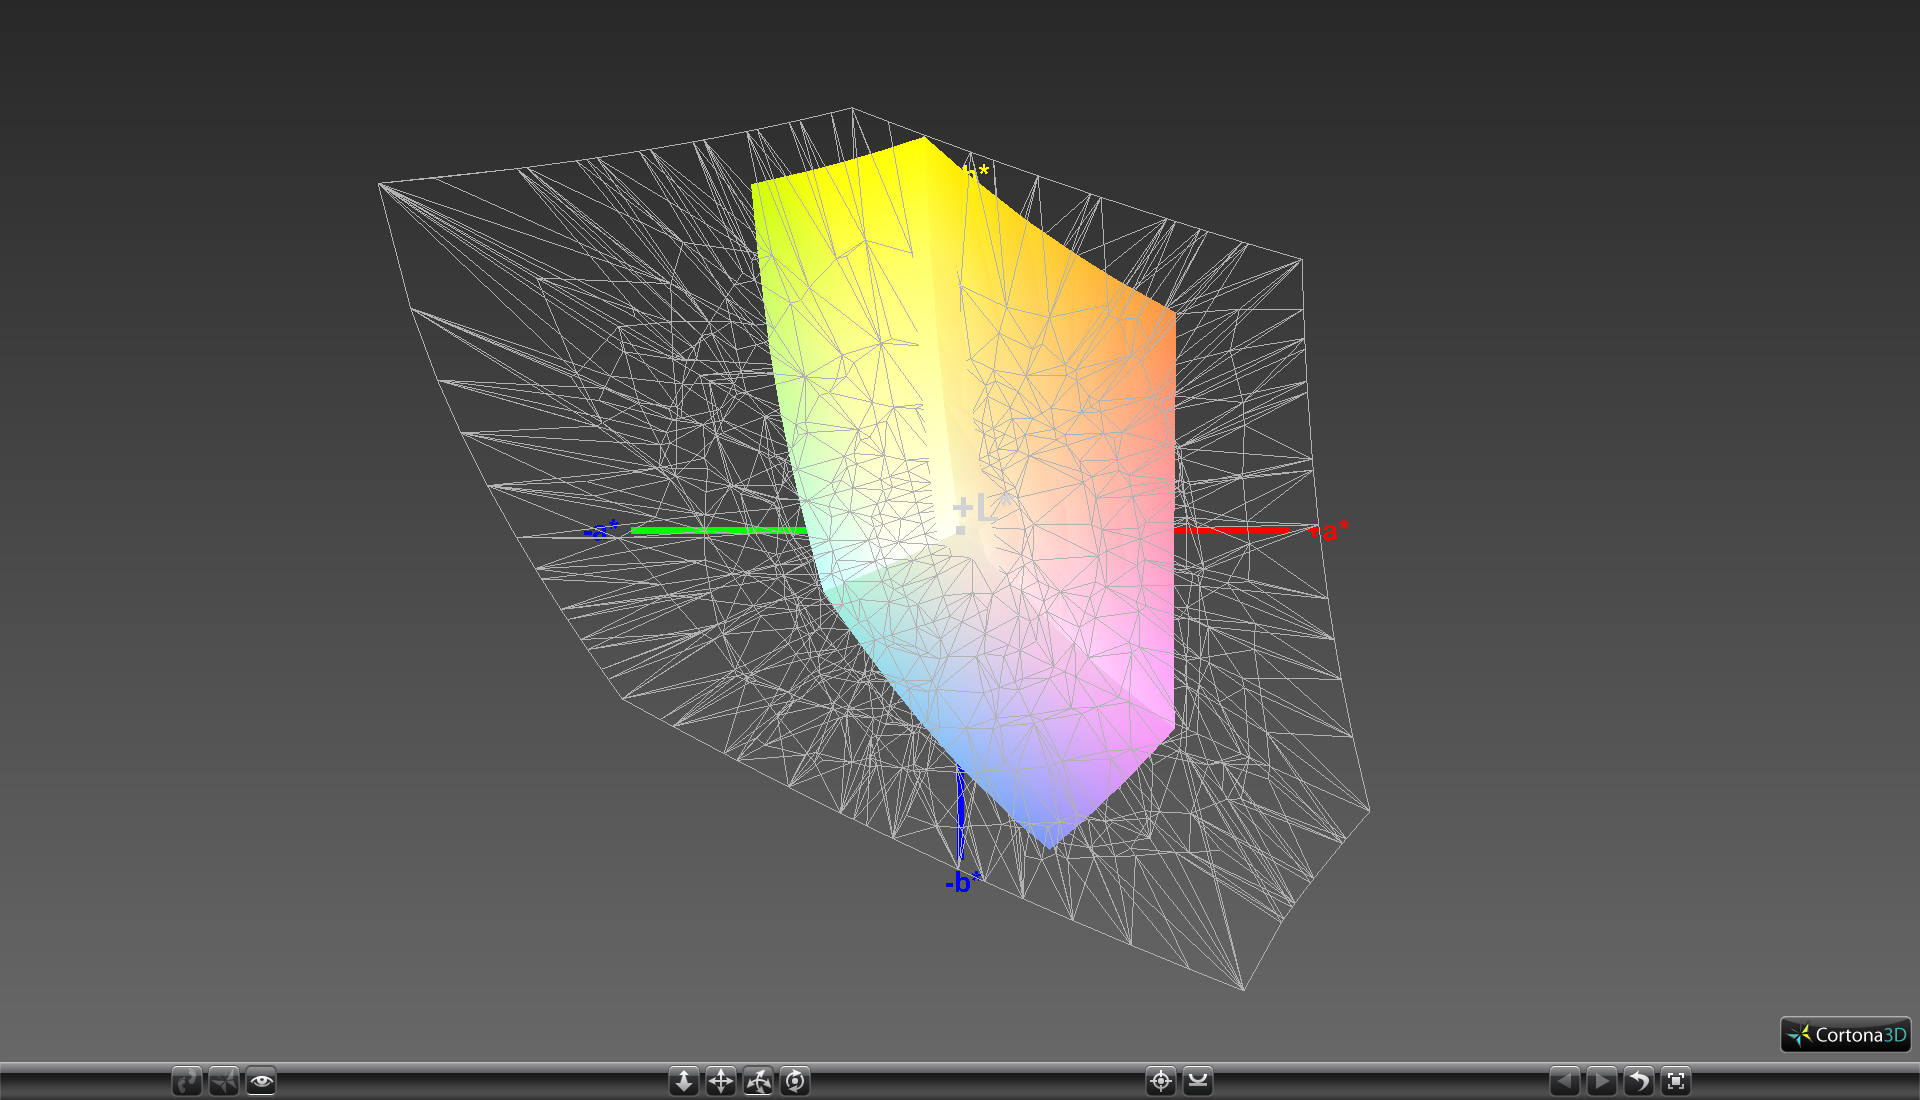
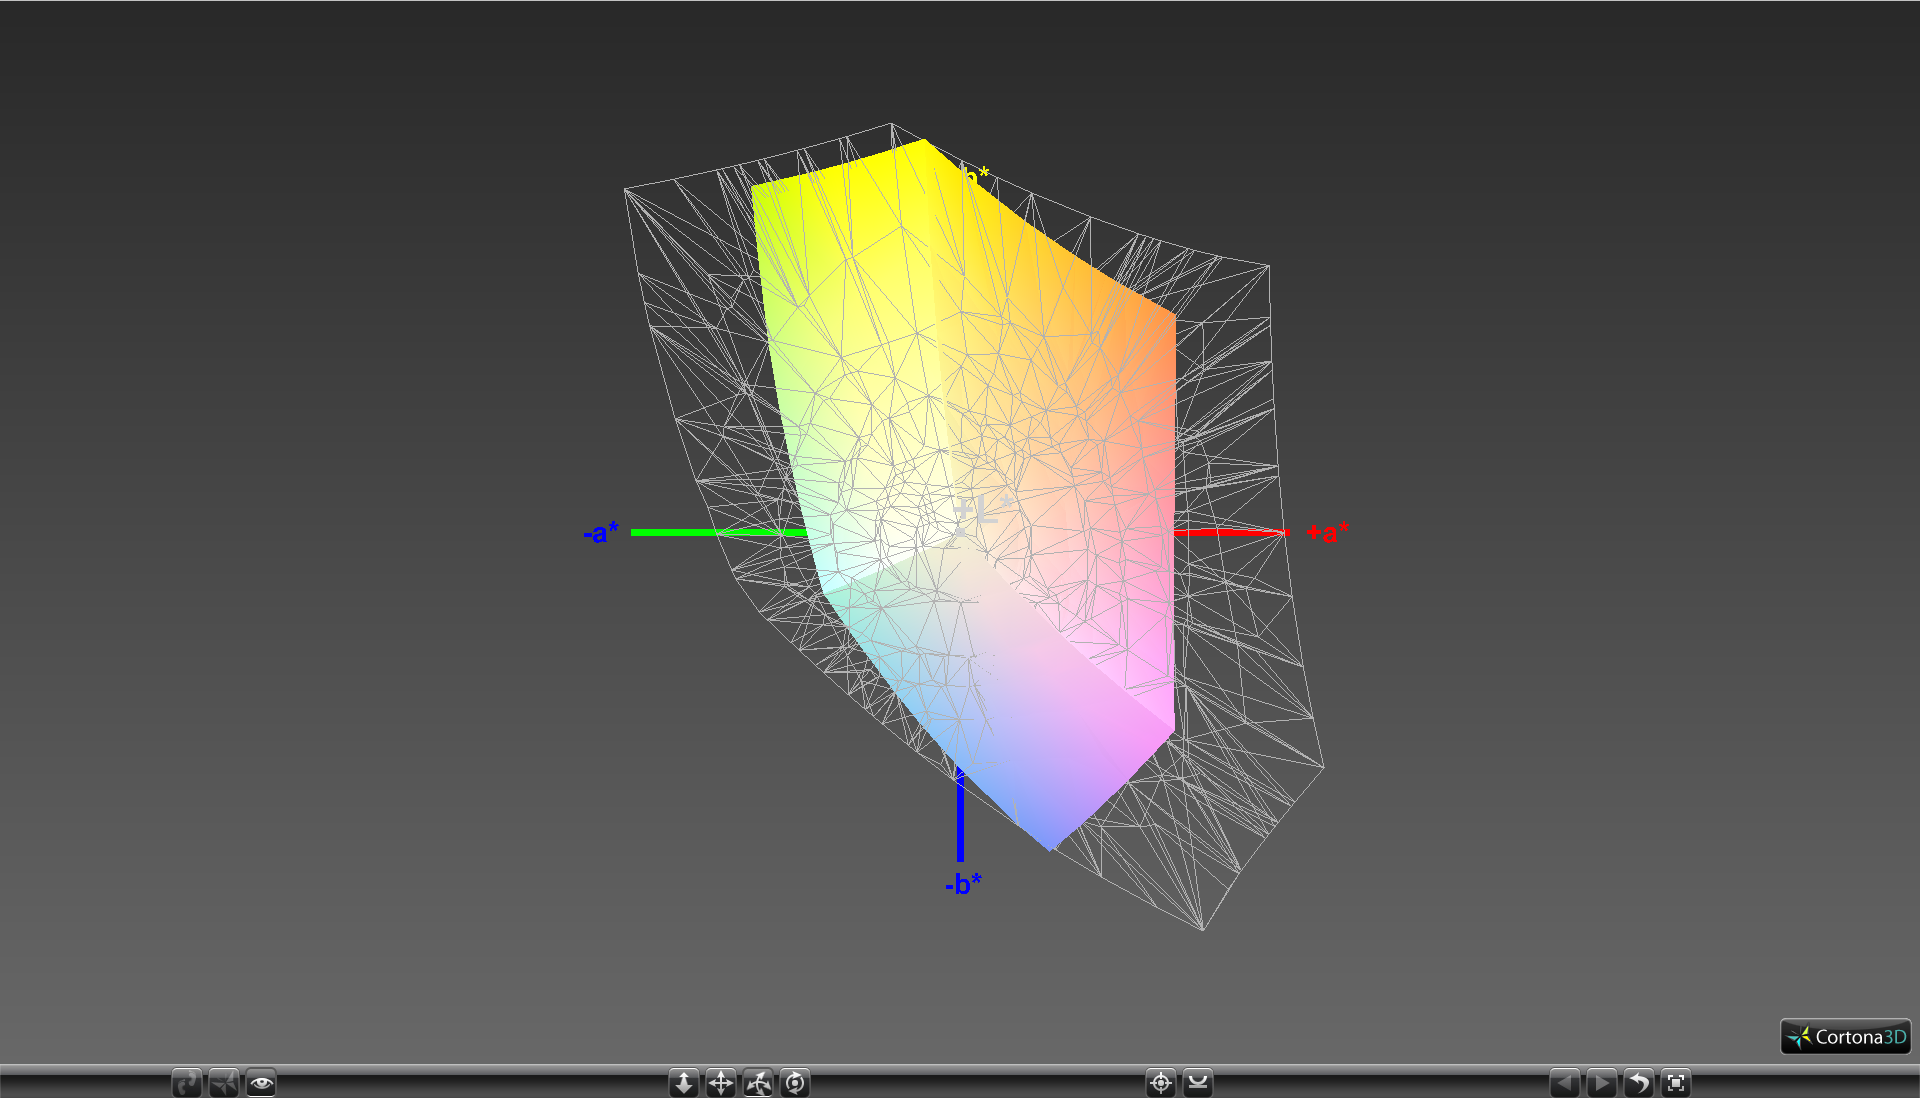
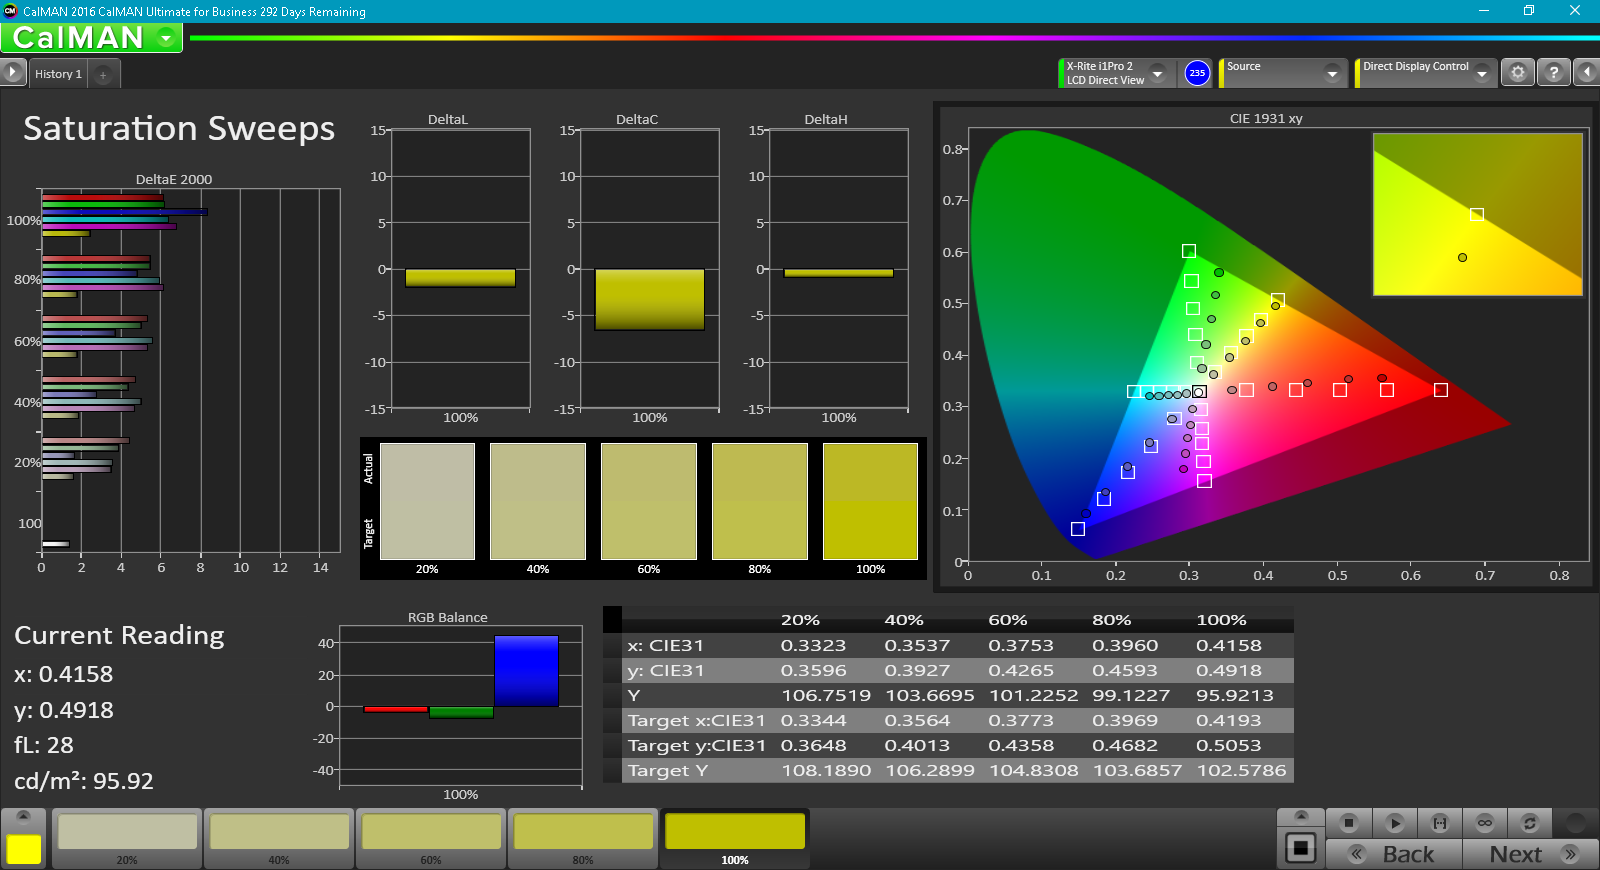
Color coverage is poor at about 57 percent of the sRGB standard or 36 percent of AdobeRGB. Cheaper TN panels typically fall in the 60 percent sRGB range compared to 80 percent or more on many IPS panels, so this is indicative of a budget panel on the FX502VM. The comparison graph below illustrates just how much narrower the color space of the FX502VM is compared to the GL502VM. While this doesn't necessarily impact gaming performance, the gaming experience could certainly be better.

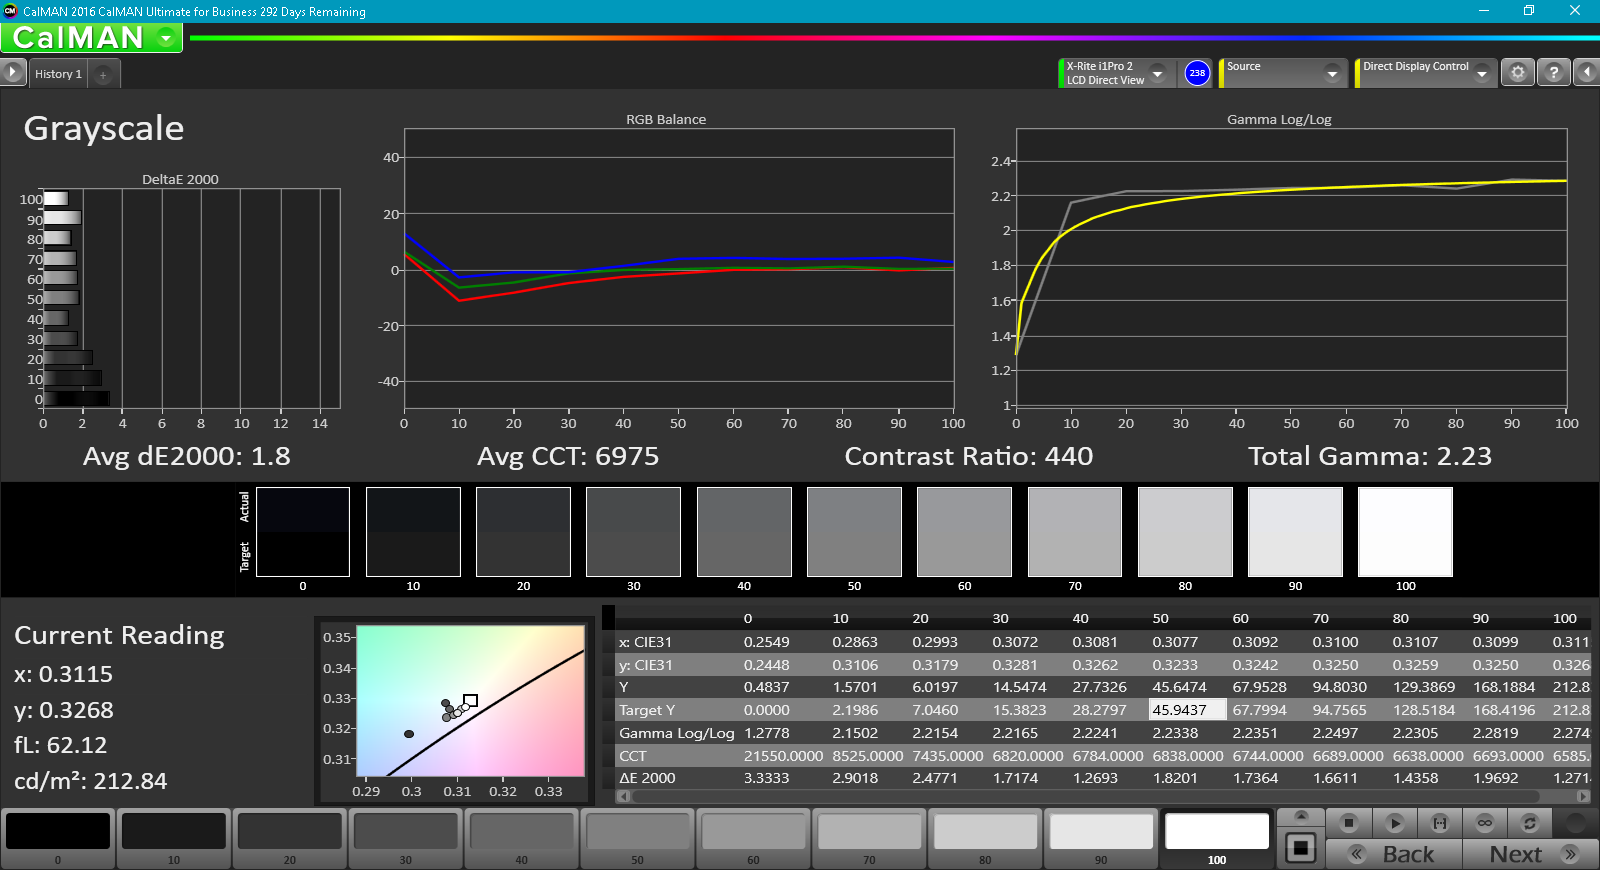
Further display measurements with a X-Rite spectrophotometer reveal good grayscale and color balance out of the box, so an end-user calibration will not dramatically improve the display any further. This is perhaps the only redeeming quality about the panel when compared to other notebooks with IPS displays. Colors still grow more inaccurate the higher the saturation level due to imperfect sRGB coverage.

Display Response Times
| ↔ Response Time Black to White | ||
|---|---|---|
| 22.4 ms ... rise ↗ and fall ↘ combined | ↗ 6 ms rise | 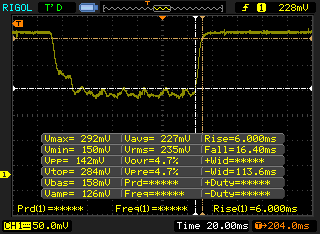 |
| ↘ 16.4 ms fall | ||
| The screen shows good response rates in our tests, but may be too slow for competitive gamers. In comparison, all tested devices range from 0.1 (minimum) to 240 (maximum) ms. » 51 % of all devices are better. This means that the measured response time is worse than the average of all tested devices (19.8 ms). | ||
| ↔ Response Time 50% Grey to 80% Grey | ||
| 28.4 ms ... rise ↗ and fall ↘ combined | ↗ 11.2 ms rise | 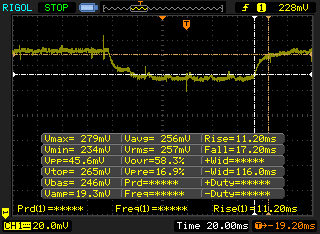 |
| ↘ 17.2 ms fall | ||
| The screen shows relatively slow response rates in our tests and may be too slow for gamers. In comparison, all tested devices range from 0.165 (minimum) to 636 (maximum) ms. » 38 % of all devices are better. This means that the measured response time is similar to the average of all tested devices (31 ms). | ||
Screen Flickering / PWM (Pulse-Width Modulation)
| Screen flickering / PWM not detected | 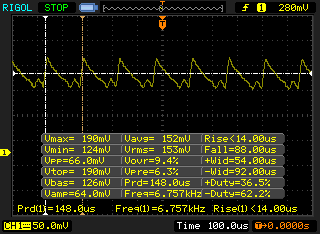 | ||
In comparison: 52 % of all tested devices do not use PWM to dim the display. If PWM was detected, an average of 7757 (minimum: 5 - maximum: 343500) Hz was measured. | |||
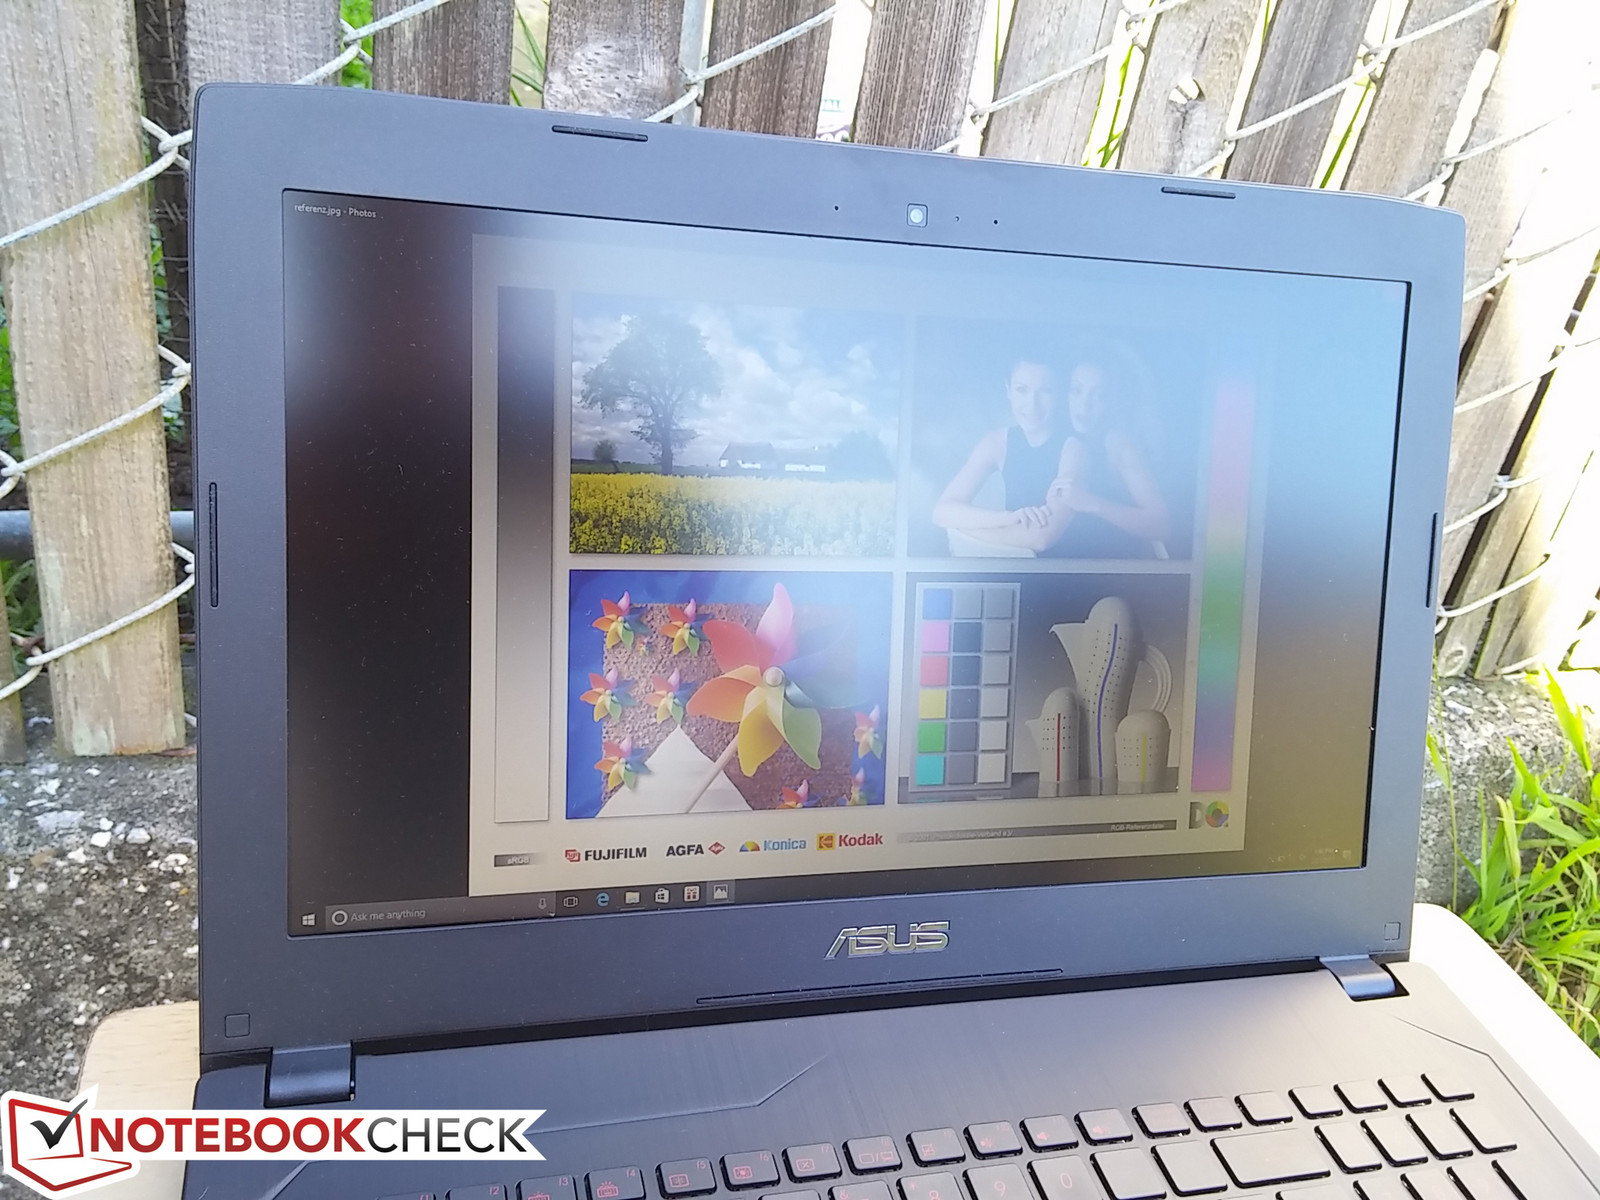
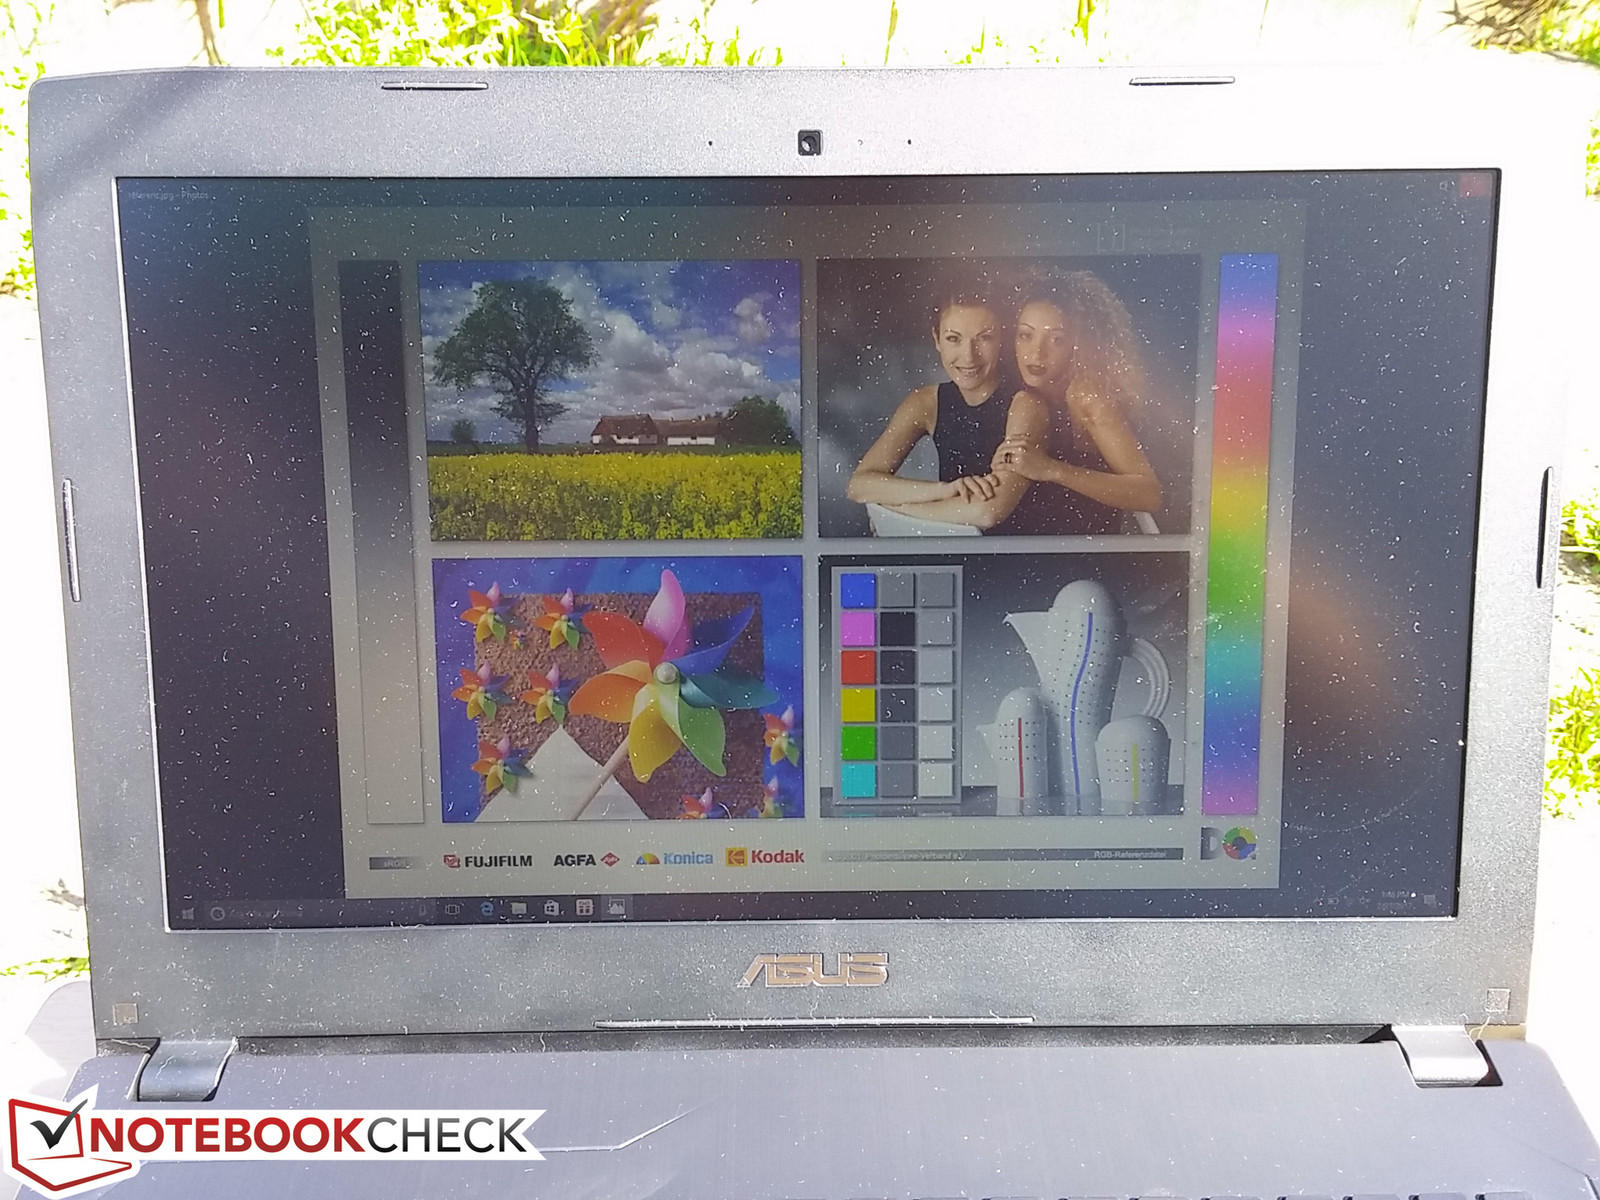
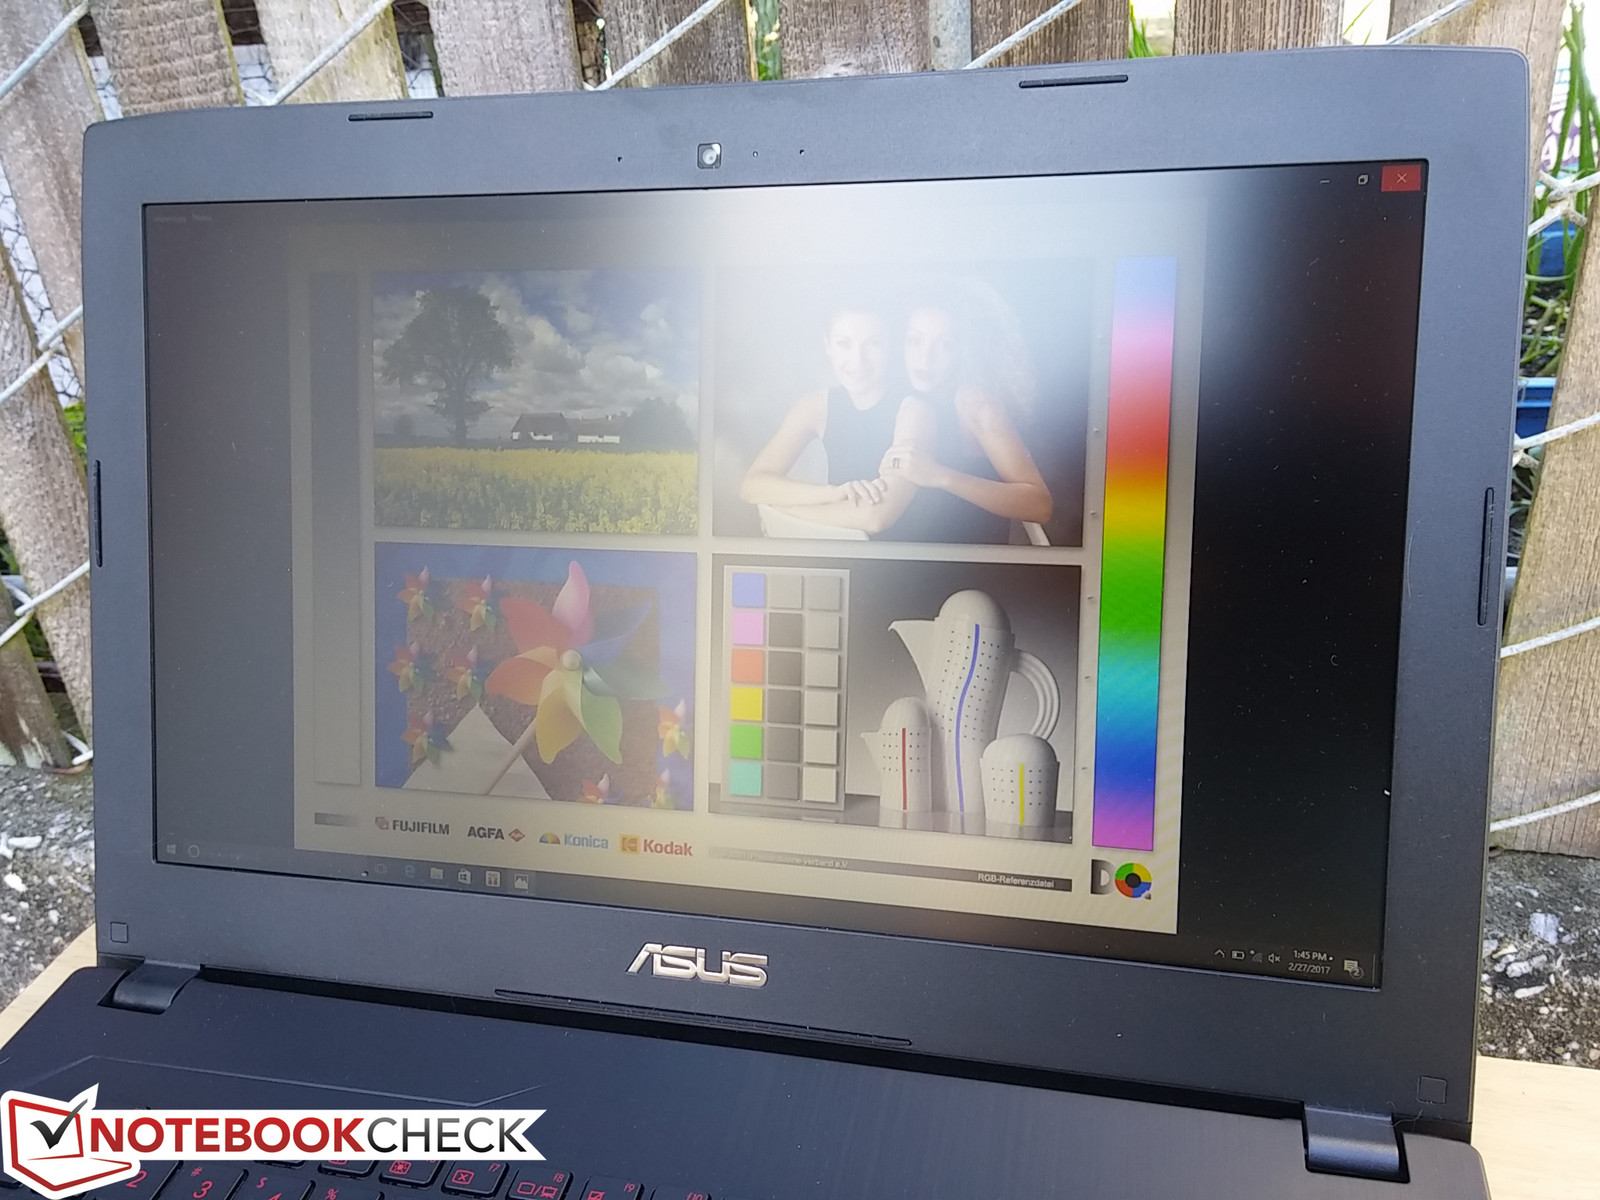
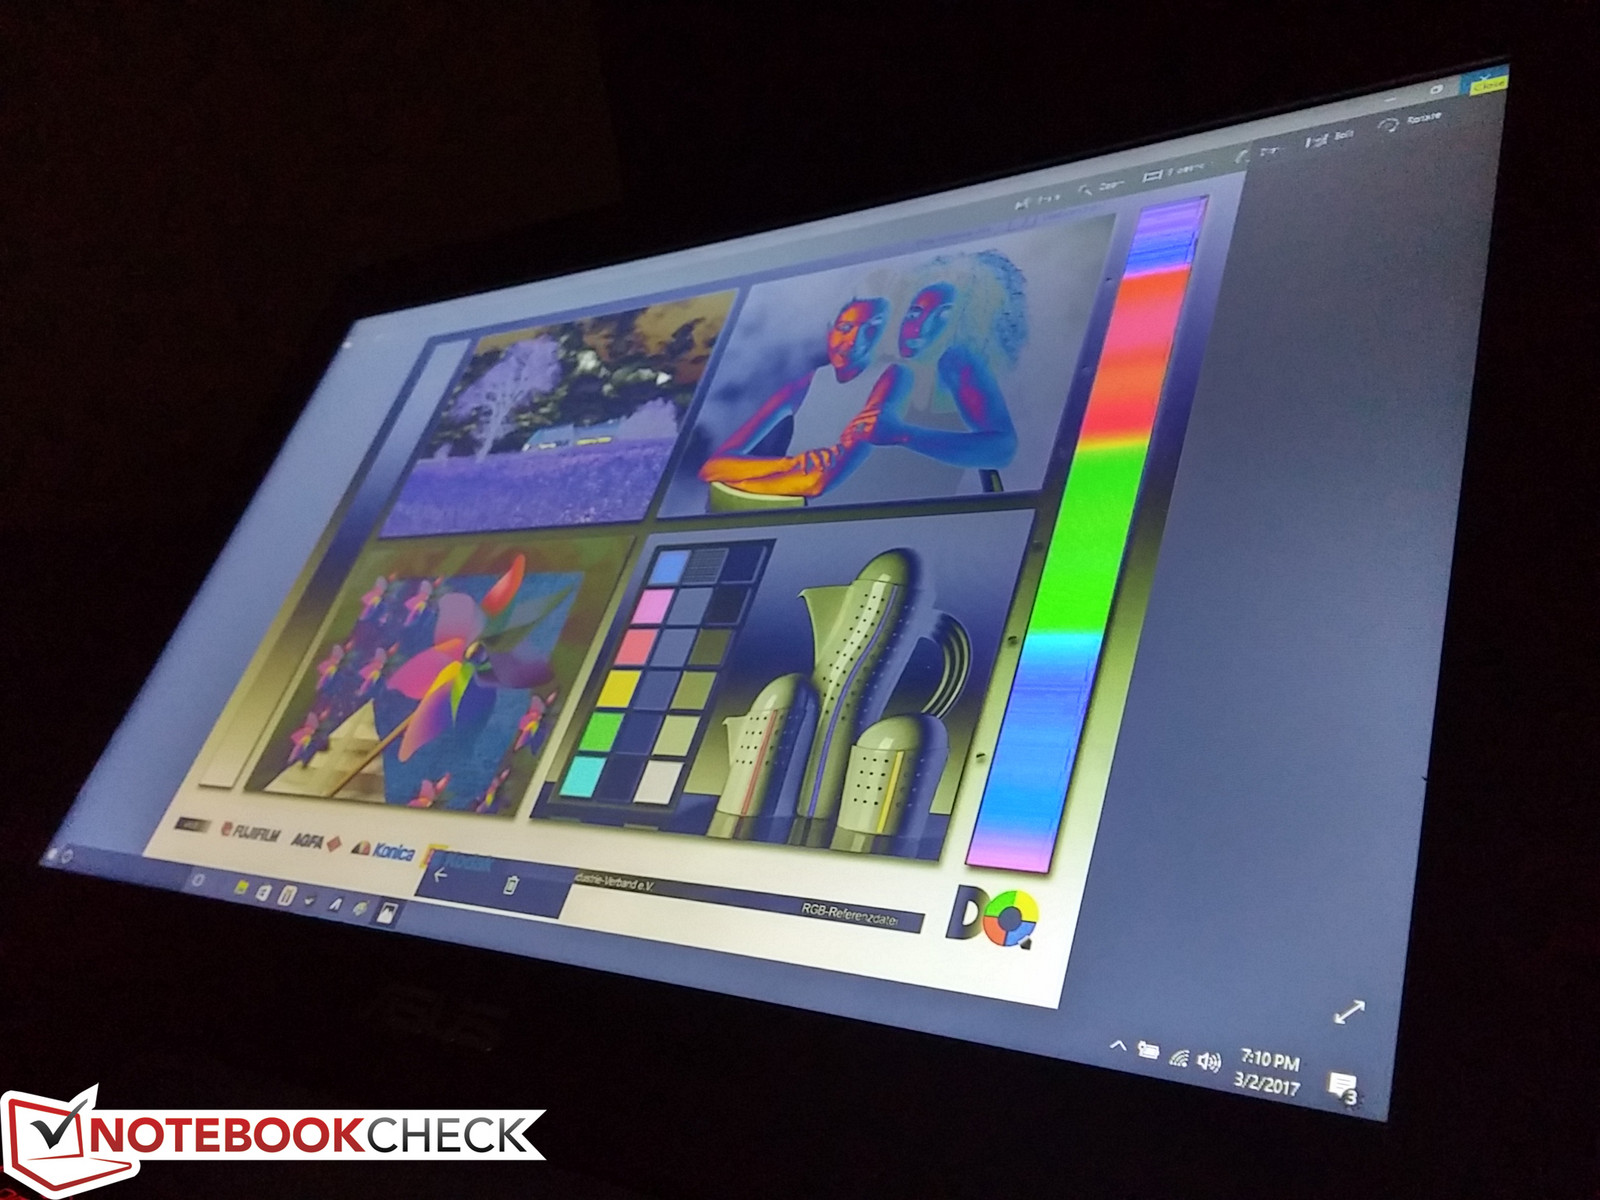
Both outdoor visibility and viewing angles are poor on our configuration. The backlight is nowhere near bright enough for comfortable use outdoors even when on its maximum brightness setting and when sitting under shade. The poor viewing angles hinder it further with noticeable color shifting if not viewing almost directly at the screen.
Performance
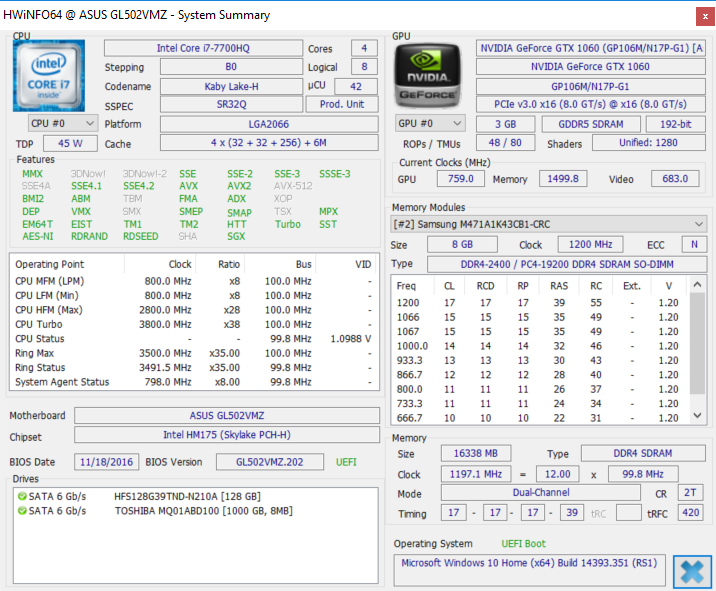
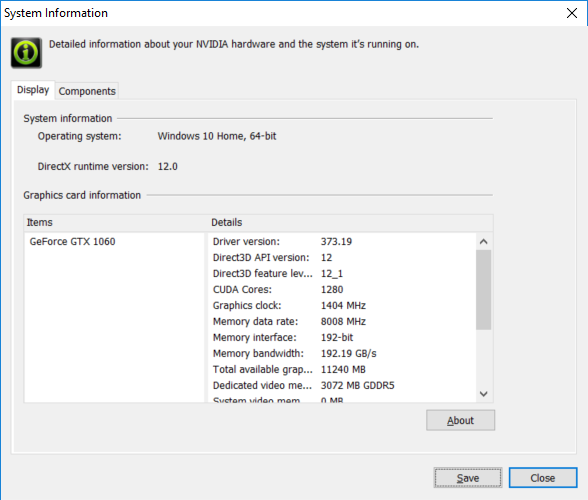
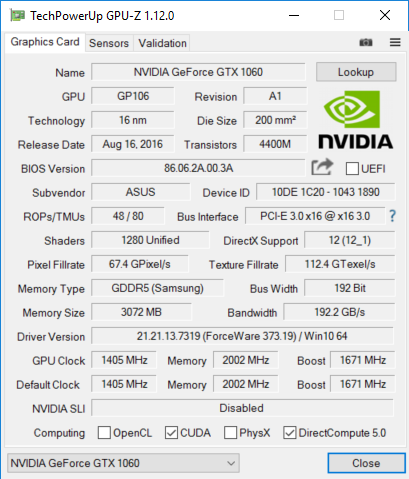
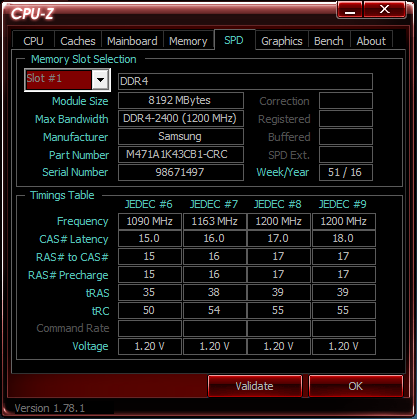
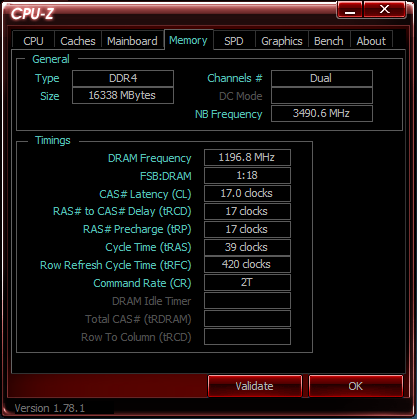
Core CPU options are again identical to the GL502VM with a choice of either the Core i5-7300HQ or the i7-7700HQ and with DDR4 RAM up to 24 GB. Both of the 45 W quad-core processors are sufficient for mainstream gaming and make for a good balance with the GPU. Speaking of the GPU, the GTX 1060 is the only option thus far on the notebook, though we wouldn't be surprised to see GTX 1050 Ti and GTX 1050 options on the FX series further down the line.
It's worth noting that the GTX 1060 in the FX502VM comes with half the VRAM of the GTX 1060 in the GX502VM (3 GB GDDR5 vs. 6 GB GDDR5). Fortunately, our graphics benchmarks in the next few sections show this to be largely inconsequential to average frame rates when gaming at 1080p.
Processor
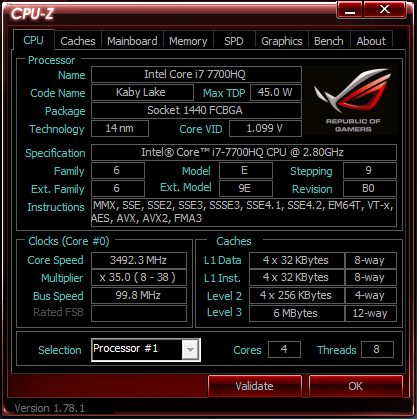
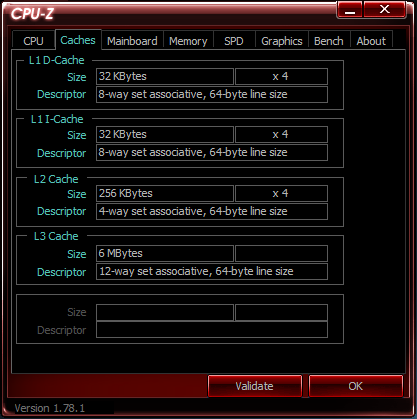
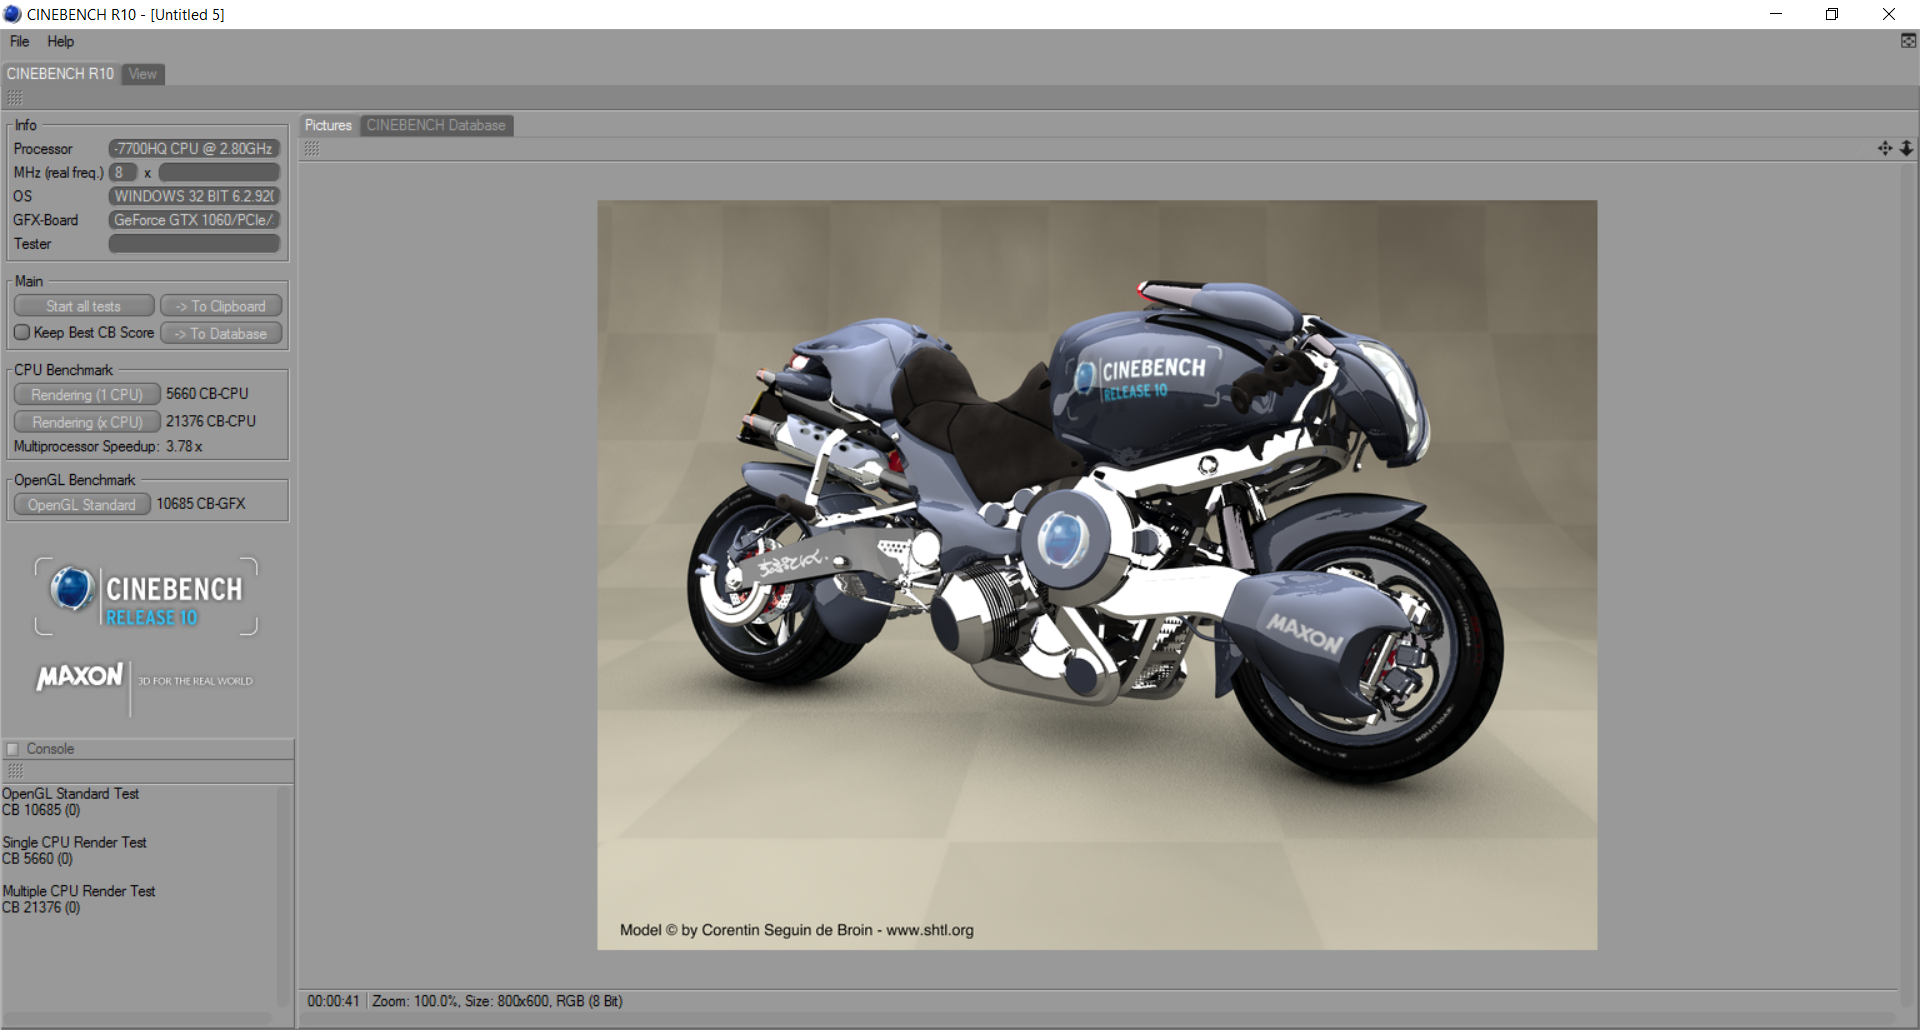
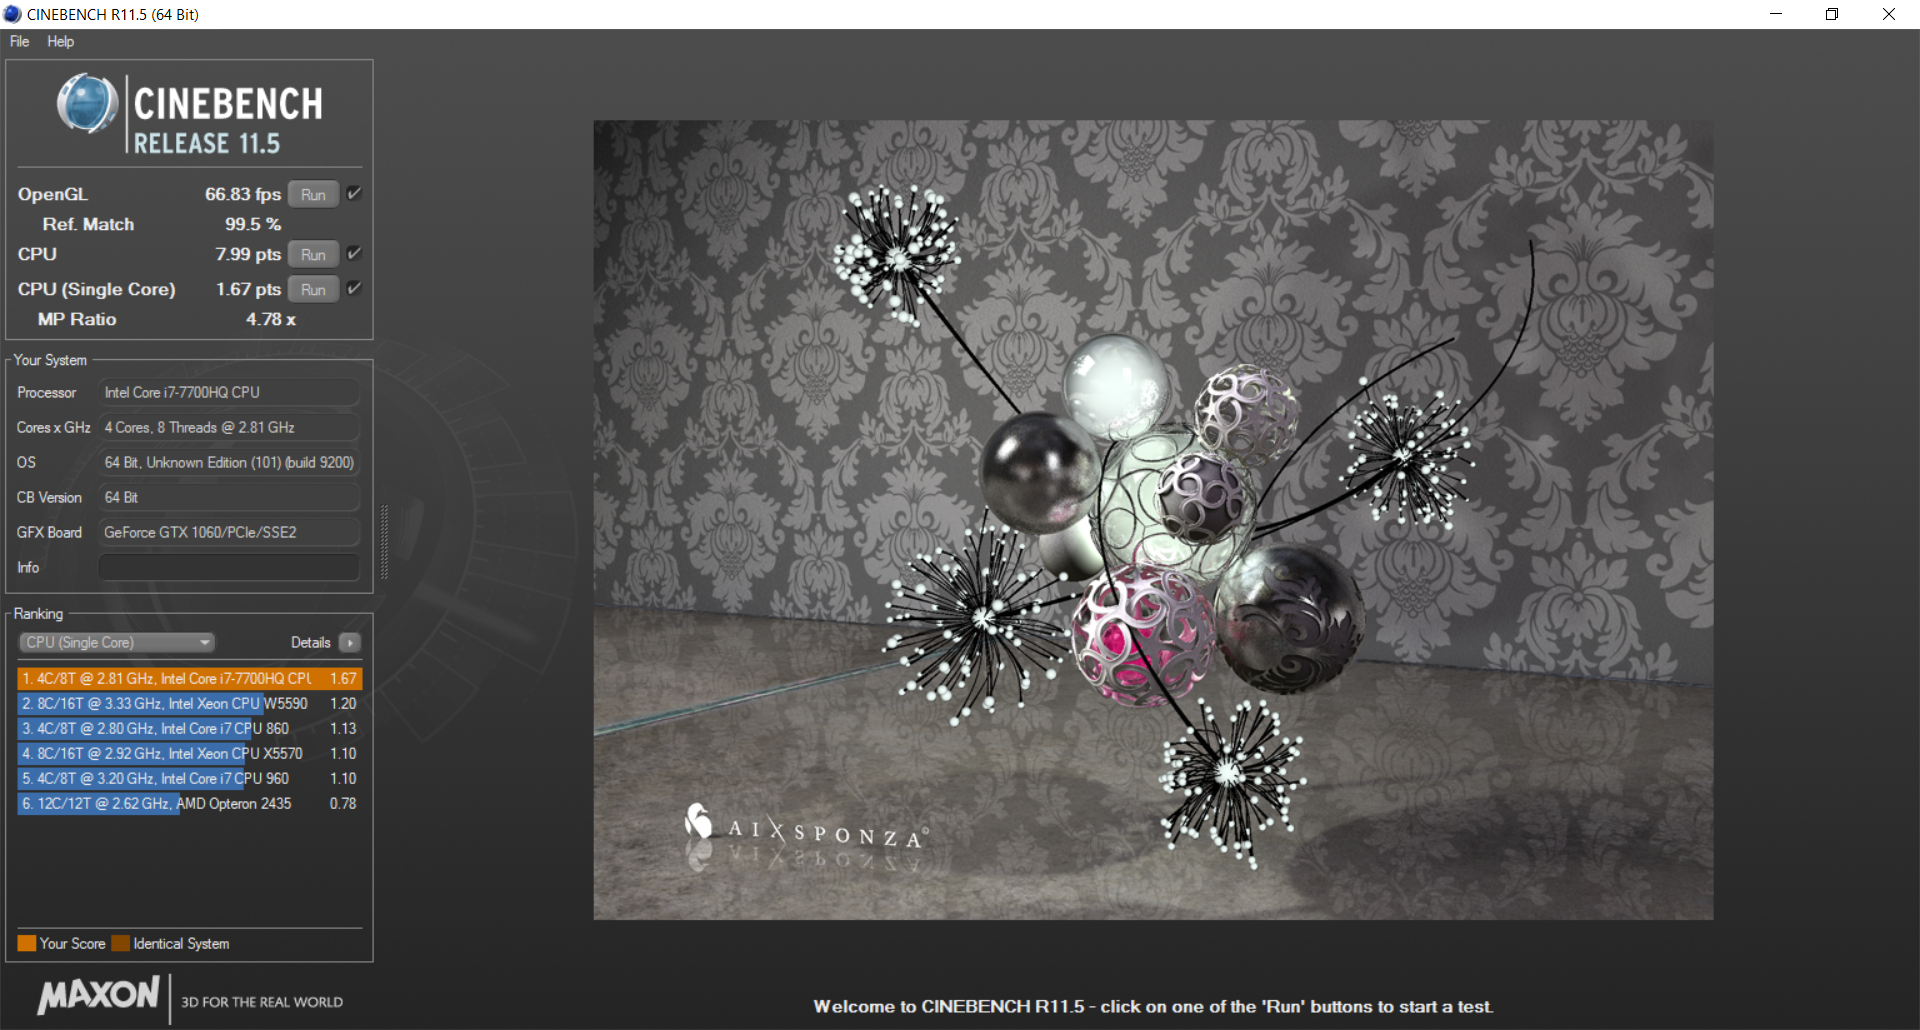
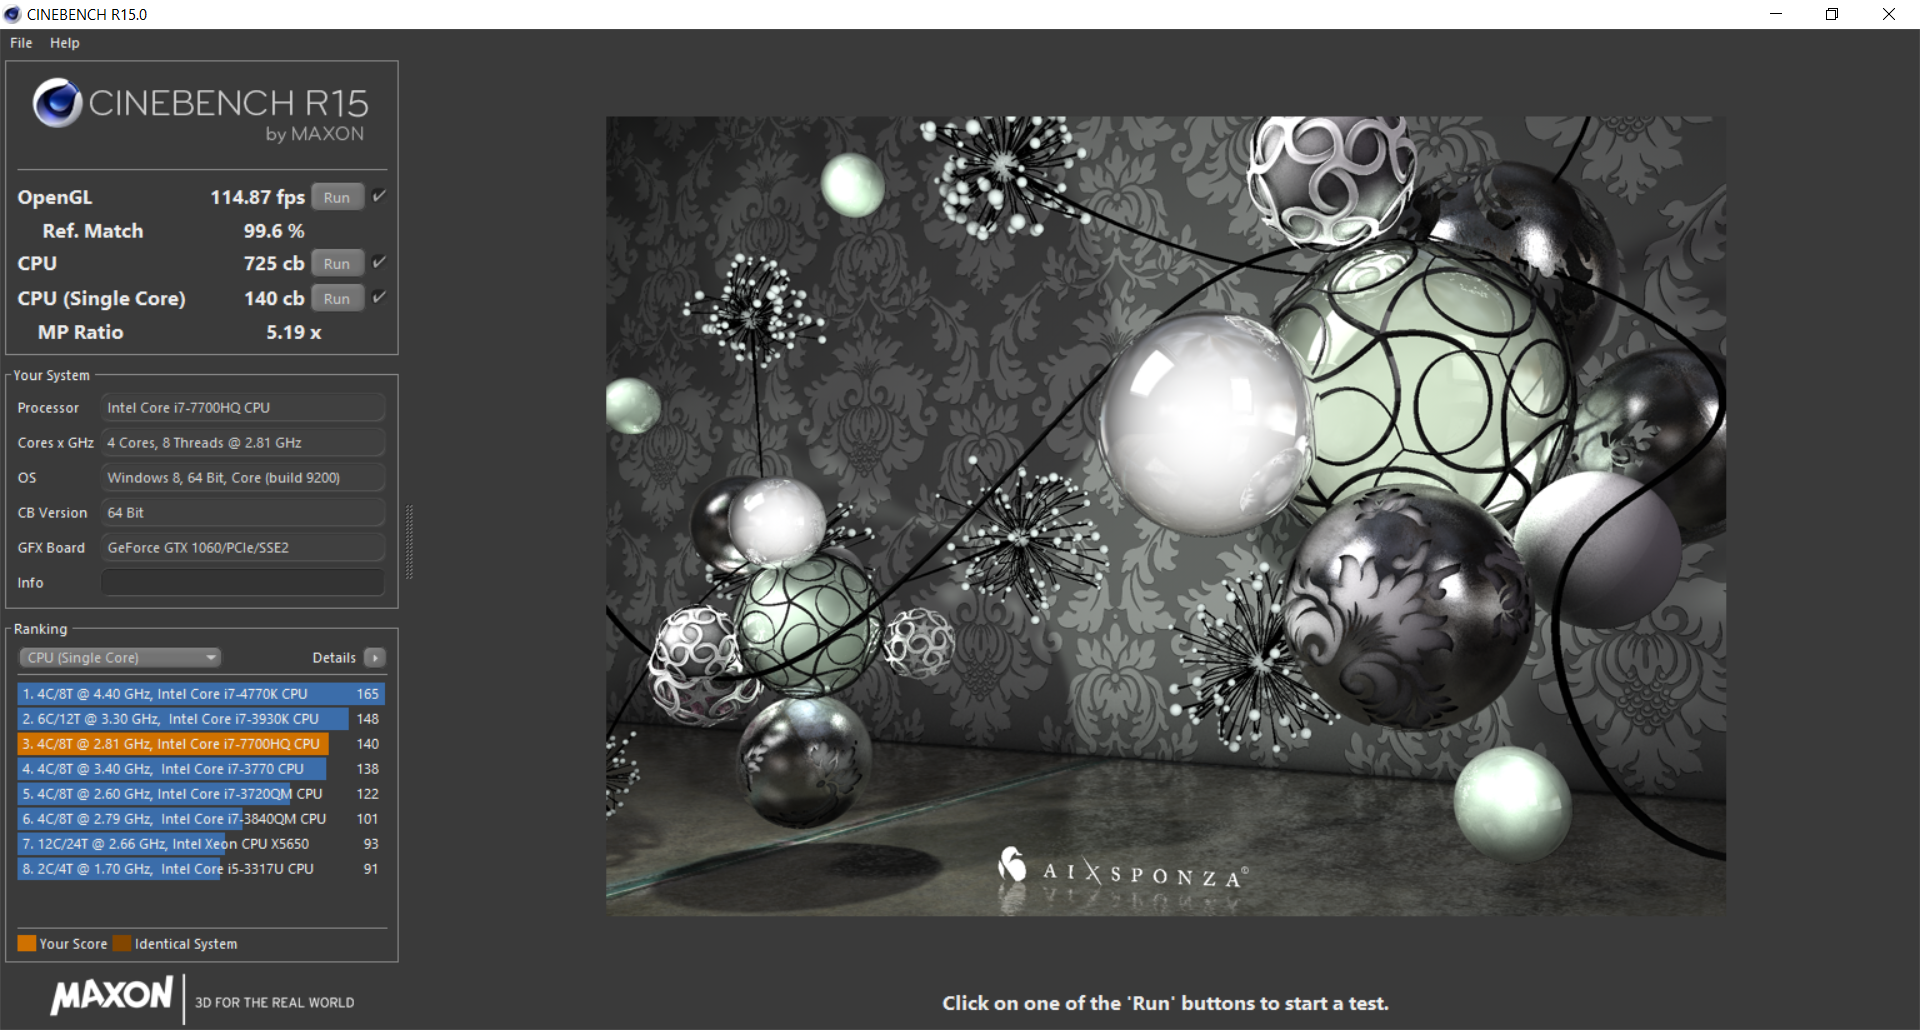
CPU performance from the Kaby Lake i7-7700HQ is not significantly faster than the Skylake i7-6700HQ or even the Broadwell i7-5700HQ. CineBench benchmarks show the Kaby Lake processor to be within just single-digit percentage points of the aforementioned Skylake and Broadwell CPUs in both single- and multi-threaded workloads. Users can expect a sizable jump in raw CPU power of about 15 to 30 percent if moving up to the mobile i7-7820HK or desktop i7-6700K. If deciding between the i5-7300HQ or the i7-7700HQ, however, the latter CPU will be faster by about 40 percent in multi-threaded workloads.
See our dedicated page on the Core i7-7700HQ for more technical information and benchmark comparisons.
| Cinebench R11.5 | |
| CPU Single 64Bit | |
| Asus G701VIK-BA049T | |
| Eurocom Sky X7E2 | |
| MSI GE62 2QC-468XPL | |
| Asus FX502VM-AS73 | |
| MSI GE72VR-6RF16H21 | |
| Toshiba Satellite S70-B-106 | |
| CPU Multi 64Bit | |
| Asus G701VIK-BA049T | |
| Eurocom Sky X7E2 | |
| Asus FX502VM-AS73 | |
| MSI GE62 2QC-468XPL | |
| MSI GE72VR-6RF16H21 | |
| Toshiba Satellite S70-B-106 | |
| Cinebench R10 | |
| Rendering Multiple CPUs 32Bit | |
| Eurocom Sky X7E2 | |
| MSI GE62 2QC-468XPL | |
| Asus FX502VM-AS73 | |
| Apple MacBook Pro 15 2016 (2.7 GHz, 455) | |
| MSI GE72VR-6RF16H21 | |
| Rendering Single 32Bit | |
| Eurocom Sky X7E2 | |
| Asus FX502VM-AS73 | |
| Apple MacBook Pro 15 2016 (2.7 GHz, 455) | |
| MSI GE62 2QC-468XPL | |
| MSI GE72VR-6RF16H21 | |
| wPrime 2.10 - 1024m | |
| Apple MacBook Pro 15 2016 (2.7 GHz, 455) | |
| Asus FX502VM-AS73 | |
| MSI GE62 2QC-468XPL | |
| Eurocom Sky X7E2 | |
* ... smaller is better
System Performance
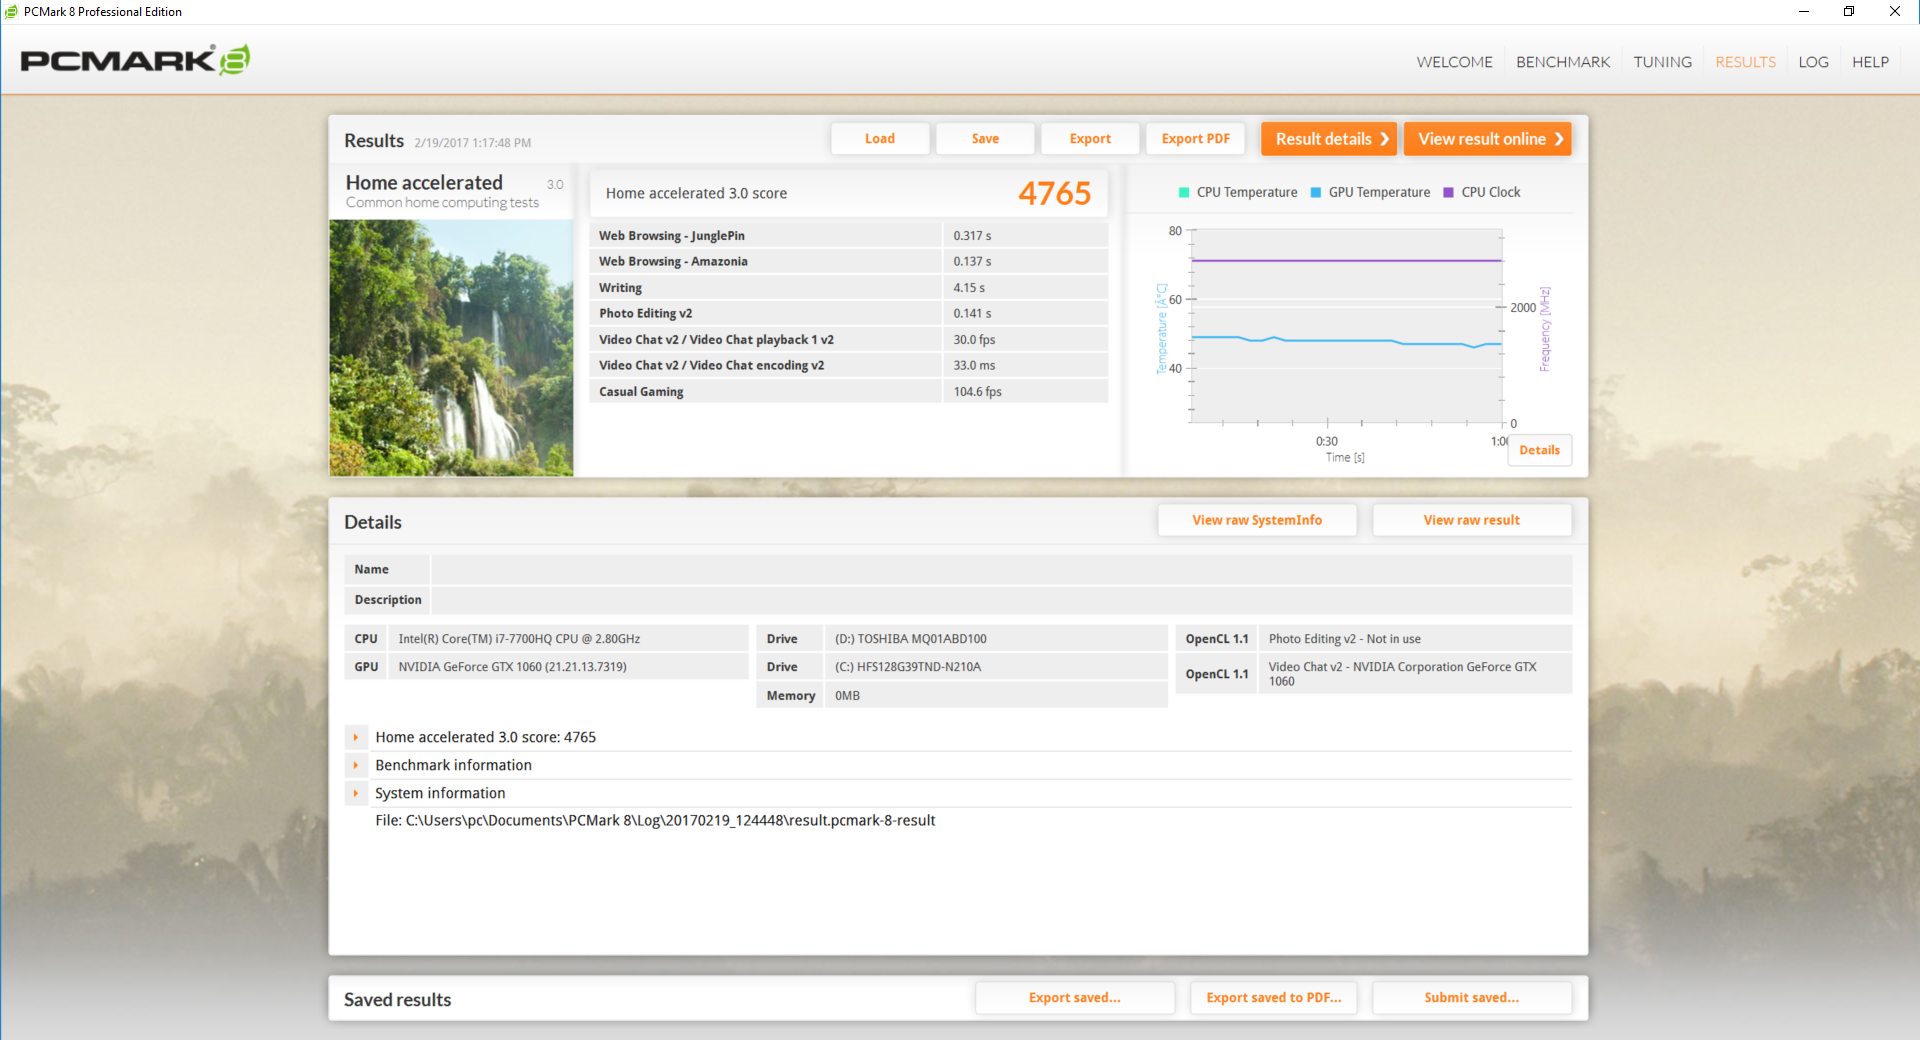
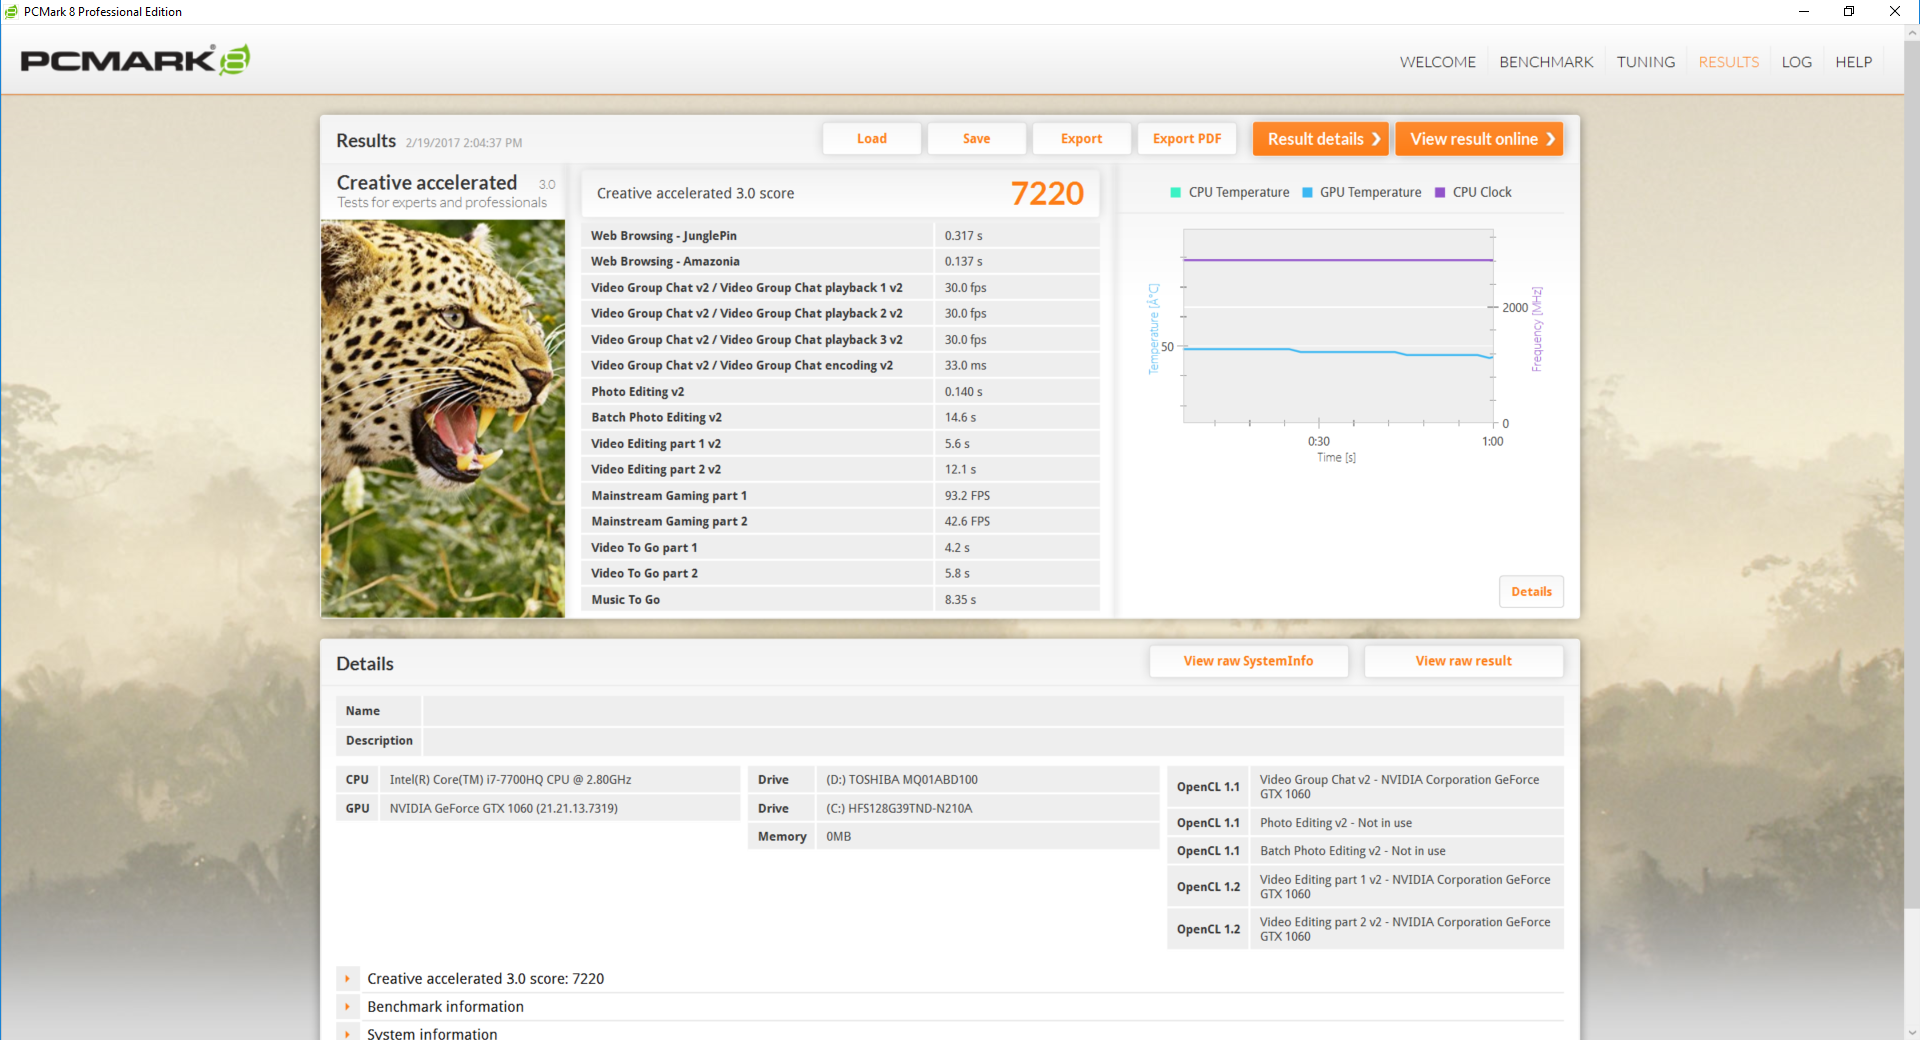
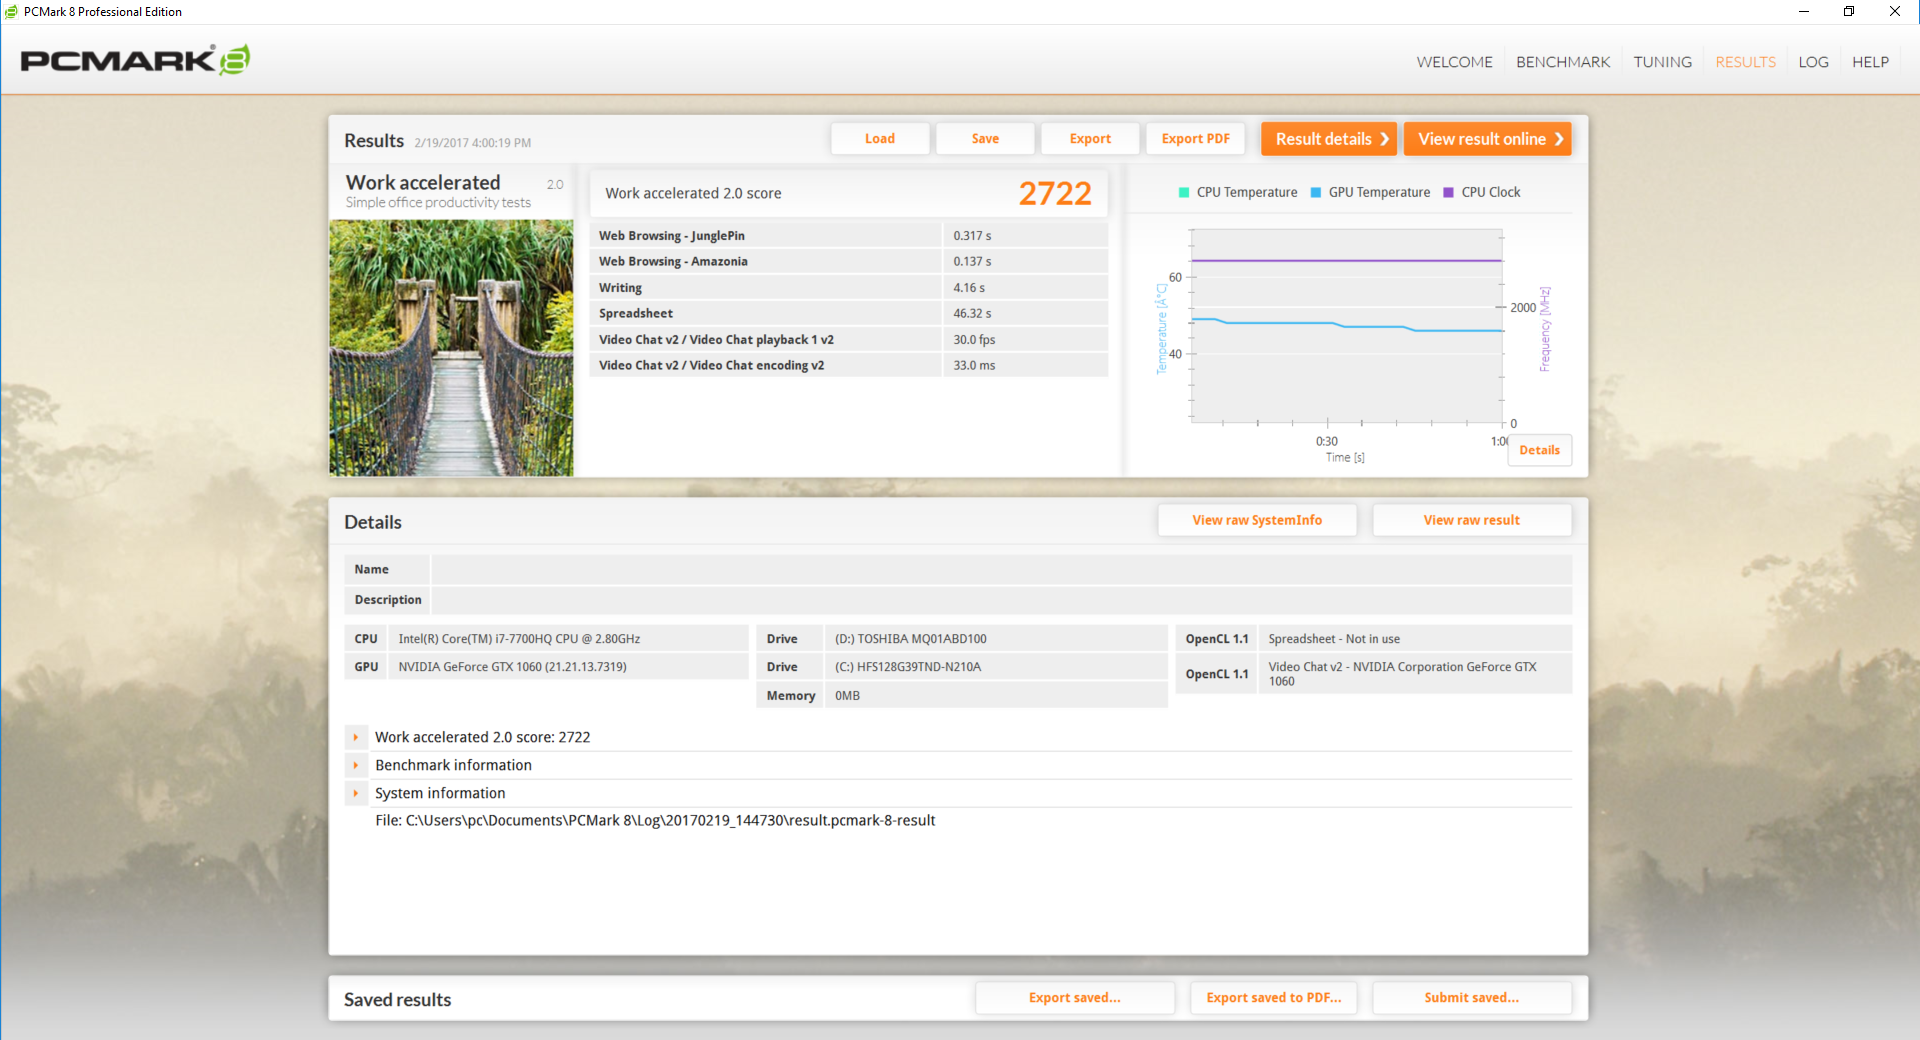
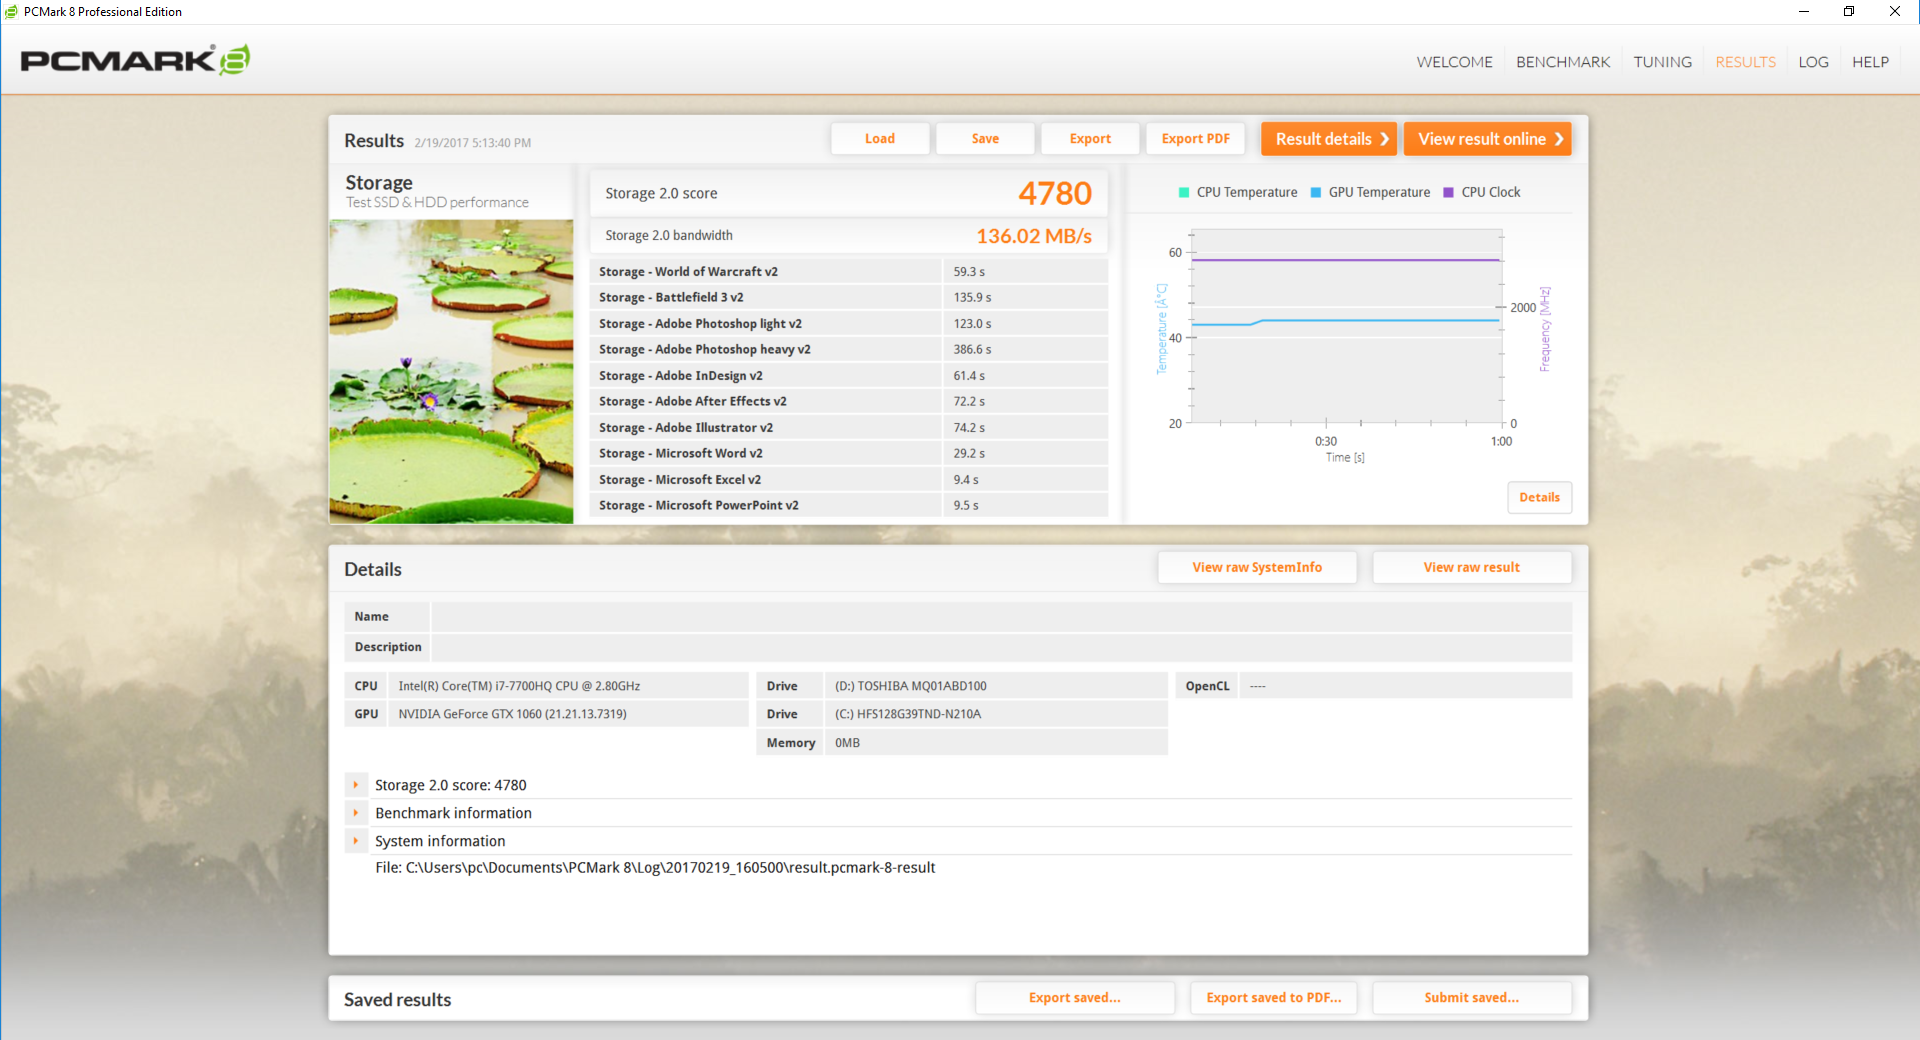
PCMark 8 scores are similar to competitors with the odd exception of a low Work score of just 2722 points even after retesting. This could potentially be due to the slower-than-expected write speeds of the primary SSD as described in the next section. Nonetheless, we experienced no unusual system slowdowns as navigation and general performance are quick and nearly instant. Our test unit suffered from no notable hardware or software issues, either.
| PCMark 8 | |
| Home Score Accelerated v2 | |
| MSI GT62VR 7RE-223 | |
| Asus Strix GL502VM-DS74 | |
| Alienware 15 R3 | |
| Asus FX502VM-AS73 | |
| Gigabyte P55W v7 | |
| Dell XPS 15 2017 9560 (7300HQ, Full-HD) | |
| Work Score Accelerated v2 | |
| Asus Strix GL502VM-DS74 | |
| MSI GT62VR 7RE-223 | |
| Gigabyte P55W v7 | |
| Alienware 15 R3 | |
| Dell XPS 15 2017 9560 (7300HQ, Full-HD) | |
| Asus FX502VM-AS73 | |
| Creative Score Accelerated v2 | |
| MSI GT62VR 7RE-223 | |
| Alienware 15 R3 | |
| Asus Strix GL502VM-DS74 | |
| Asus FX502VM-AS73 | |
| PCMark 8 Home Score Accelerated v2 | 4765 points | |
| PCMark 8 Creative Score Accelerated v2 | 7220 points | |
| PCMark 8 Work Score Accelerated v2 | 2722 points | |
Help | ||
Storage Devices
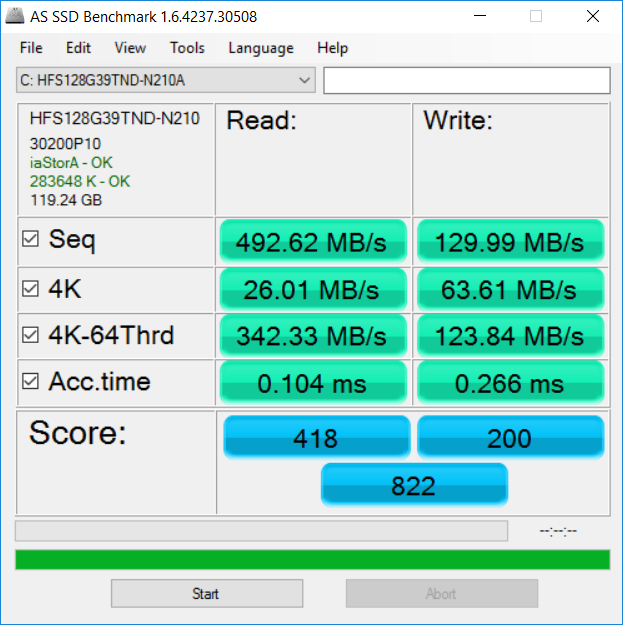
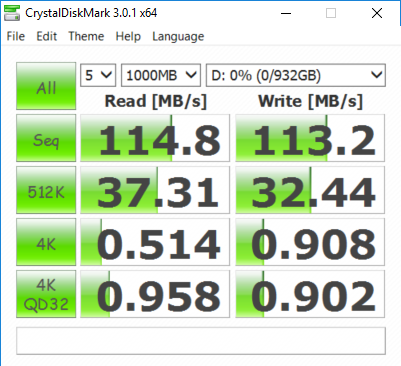
Internal storage options include a M.2 2280 slot and a 2.5-inch SATA III bay that can accept both 7 mm and 8.5 mm drives. Our test unit is equipped with a primary 128 GB SK Hynix M.2 SATA III SSD and a secondary 1 TB Toshiba MQ01ABD100 HDD. NVMe speeds are supported here just like on the GL502VM should buyers decide on costlier configurations.
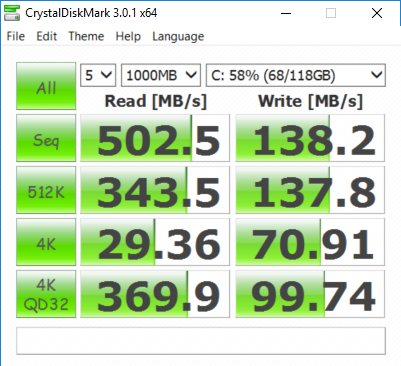
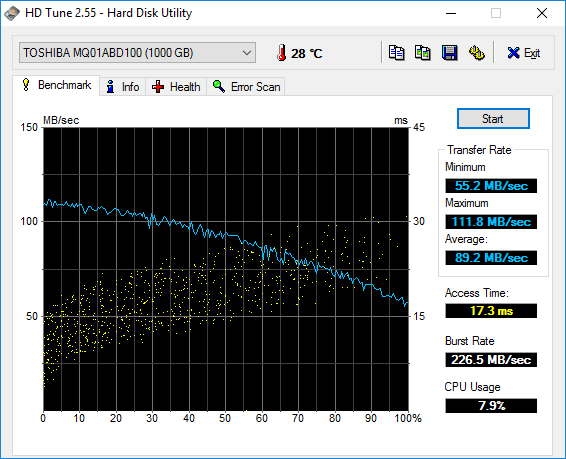
The primary drive returns excellent sequential read rates of about 500 MB/s to be in line with most SATA III SSDs. Its write rates, however, are relatively slow at just 138 MB/s compared to almost twice that of the SATA III Lite-On SSD on our recent Gigabyte P55W v7. Meanwhile, average transfer rate from the Toshiba HDD is just over 89 MB/s according to HD Tune as expected from a 5400 RPM drive.
See our growing list of HDDs and SSDs for more benchmark comparisons.
| Asus FX502VM-AS73 SK Hynix HFS256G39TND-N210A | Alienware 15 R3 | Dell XPS 15 2017 9560 (7300HQ, Full-HD) WDC WD10SPCX-75KHST0 + SanDisk Z400s M.2 2242 32 GB Cache | Gigabyte P55W v7 Liteonit CV3-8D256 | Asus Strix GL502VM-DS74 Samsung SSD 960 Evo 250GB m.2 NVMe | |
|---|---|---|---|---|---|
| CrystalDiskMark 3.0 | 146% | -75% | 31% | 351% | |
| Read Seq (MB/s) | 503 | 1123 123% | 123 -76% | 466.2 -7% | 1747 247% |
| Write Seq (MB/s) | 138.2 | 429.2 211% | 74.2 -46% | 261.9 90% | 1477 969% |
| Read 512 (MB/s) | 343.5 | 833 143% | 101.7 -70% | 252.5 -26% | 863 151% |
| Write 512 (MB/s) | 137.8 | 428.1 211% | 42.51 -69% | 254.8 85% | 1115 709% |
| Read 4k (MB/s) | 29.36 | 37.8 29% | 10.84 -63% | 25.4 -13% | 56.8 93% |
| Write 4k (MB/s) | 70.9 | 122.9 73% | 1.021 -99% | 55 -22% | 152.4 115% |
| Read 4k QD32 (MB/s) | 369.9 | 542 47% | 69.8 -81% | 358.5 -3% | 652 76% |
| Write 4k QD32 (MB/s) | 99.7 | 429.8 331% | 1.057 -99% | 240.1 141% | 542 444% |

GPU Performance
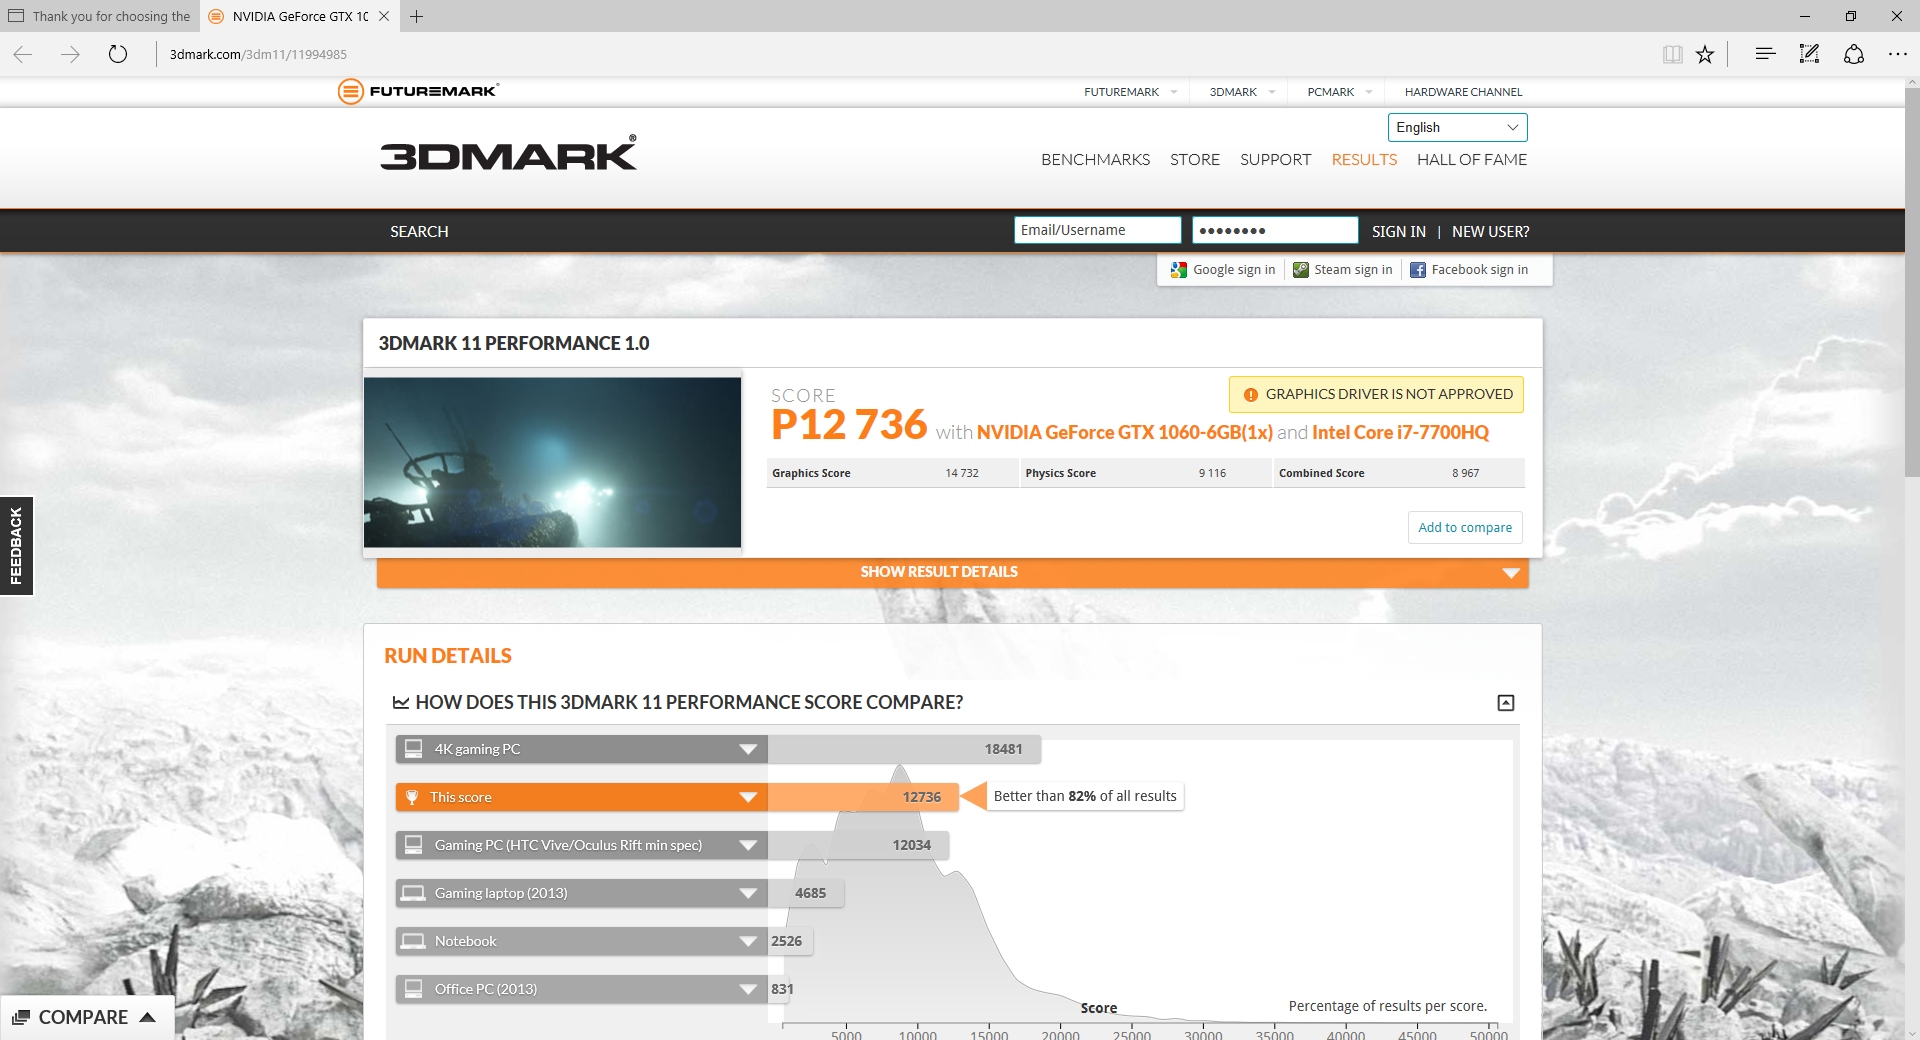
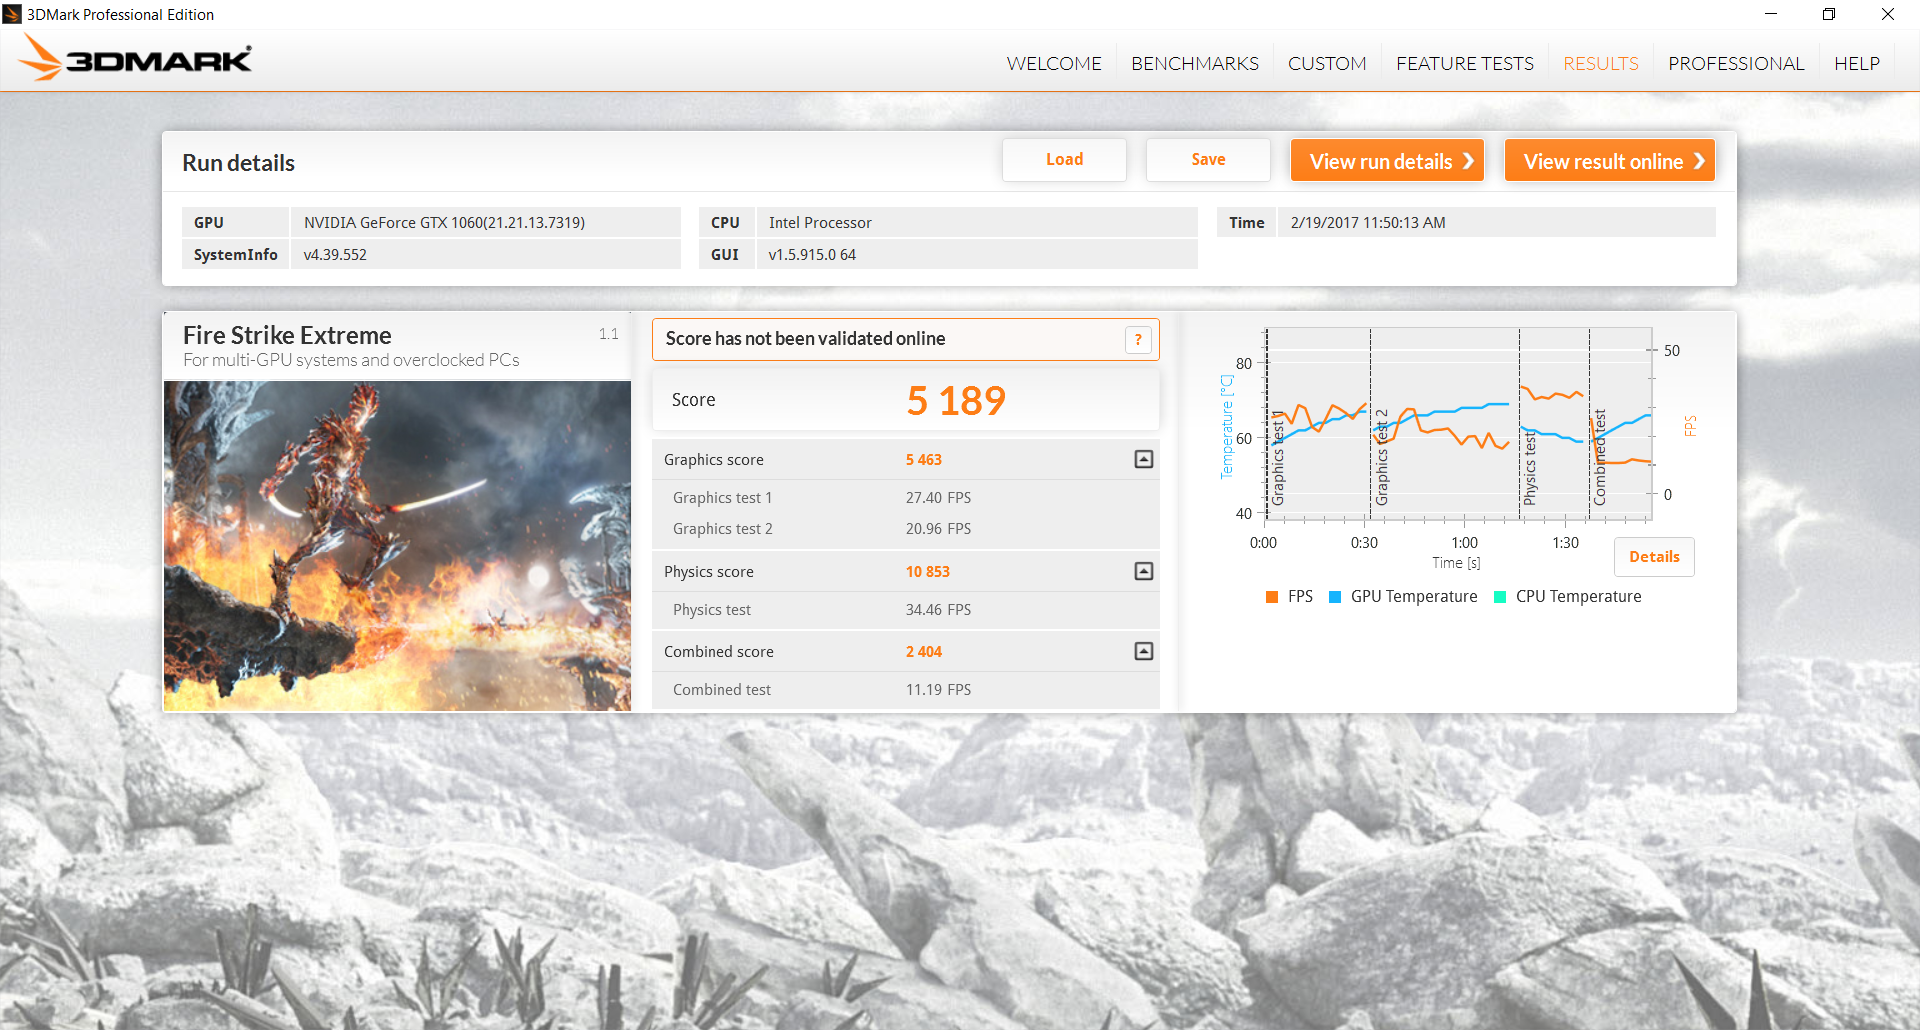
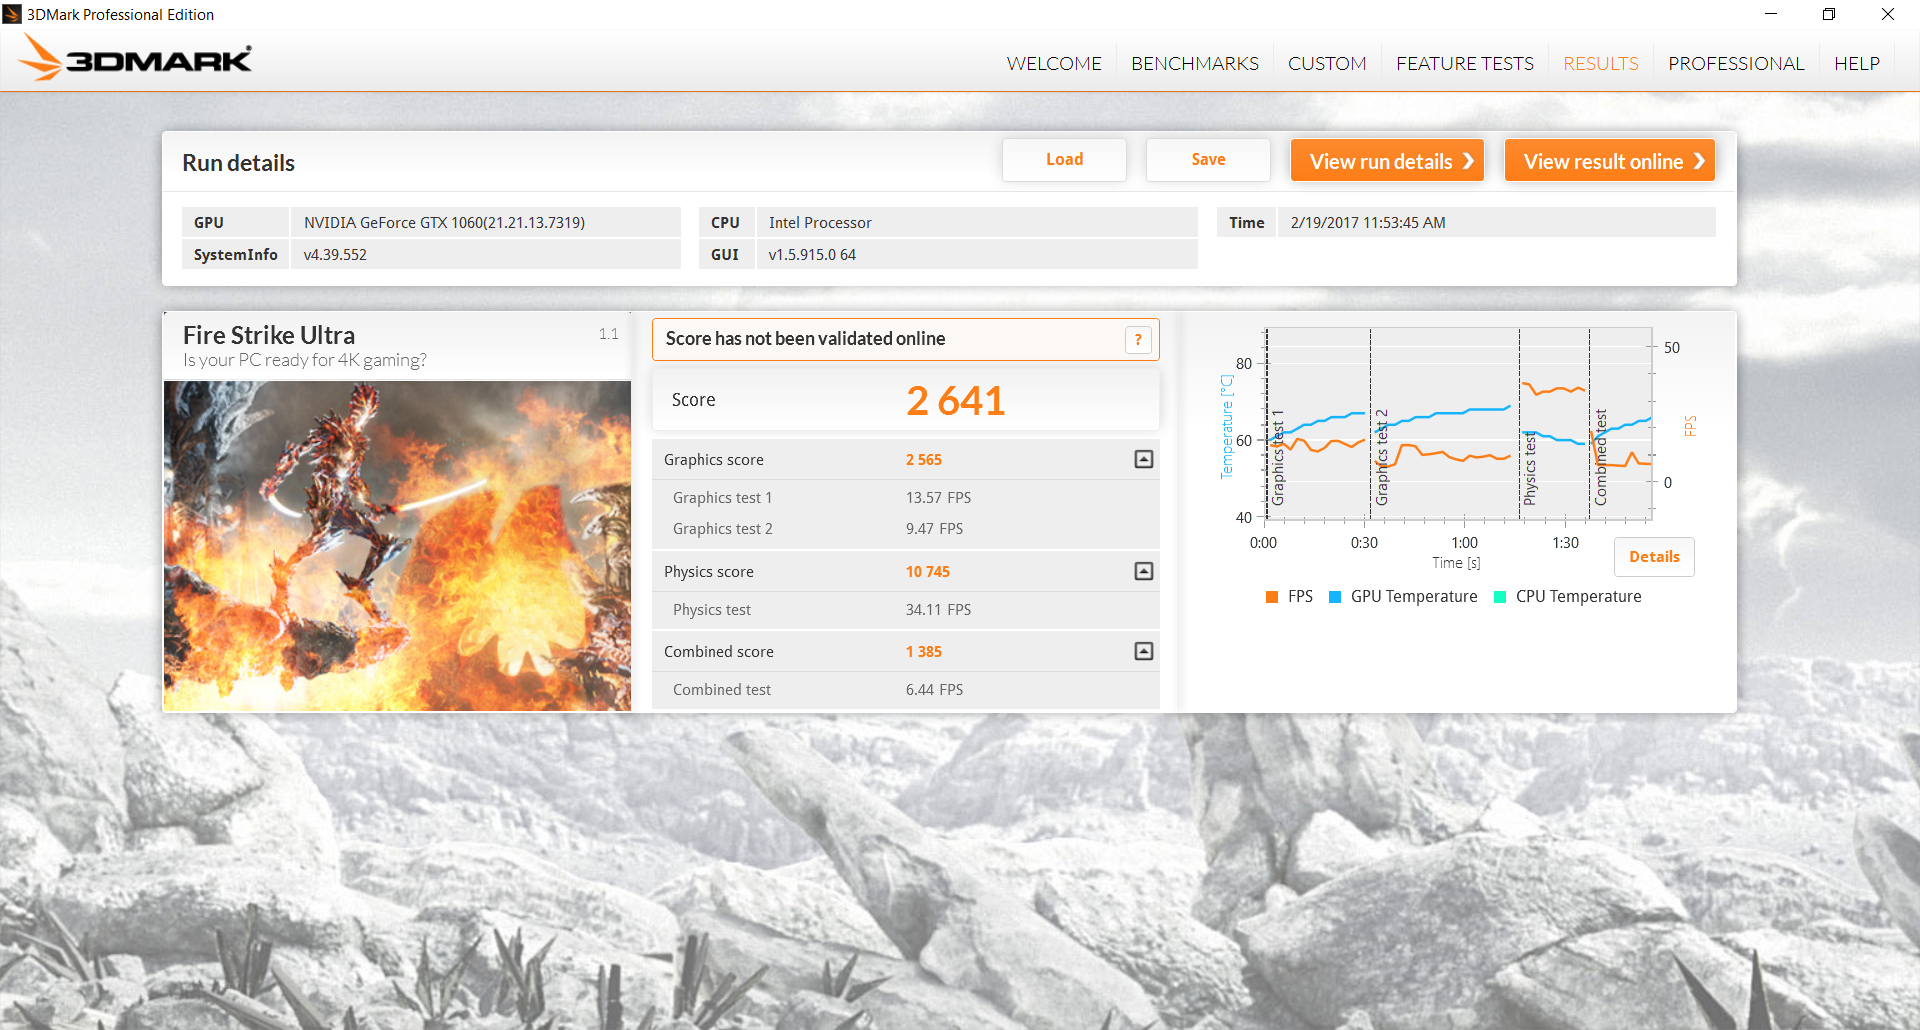
3DMark benchmarks rank the GeForce GTX 1060 in the FX502VM to be about 40 to 45 percent faster than the GTX 1050 Ti and almost twice as fast as the GTX 1050. Perhaps more importantly, its raw graphics performance is essentially on par with the GTX 1060 in the pricier GL502VM, so users need not worry about inferior or throttled GPU performance from the more affordable FX502VM. The desktop GTX 1060 is still about 10 to 15 percent faster than the mobile GTX 1060 according to Fire Strike benchmarks while the mobile GTX 1070 can provide a 50 to 55 percent gain over the mobile GTX 1060.
See our review on the GTX 1060 for more benchmarks and comparisons.
| 3DMark | |
| 1920x1080 Fire Strike Graphics | |
| Acer Predator 17 X GX-792-76DL | |
| Gigabyte P57X v7 | |
| Nvidia GeForce GTX 1060 Founders Edition 6 GB | |
| Asus FX502VM-AS73 | |
| Asus Strix GL502VM-DS74 | |
| MSI GE72 7RE-046 | |
| HP Pavilion 17t-ab200 | |
| Fire Strike Extreme Graphics | |
| Acer Predator 17 X GX-792-76DL | |
| Gigabyte P57X v7 | |
| Asus FX502VM-AS73 | |
| Asus Strix GL502VM-DS74 | |
| HP Pavilion 17t-ab200 | |
| 3840x2160 Fire Strike Ultra Graphics | |
| Acer Predator 17 X GX-792-76DL | |
| Gigabyte P57X v7 | |
| Nvidia GeForce GTX 1060 Founders Edition 6 GB | |
| Asus FX502VM-AS73 | |
| Asus Strix GL502VM-DS74 | |
| 3DMark 11 Performance | 12736 points | |
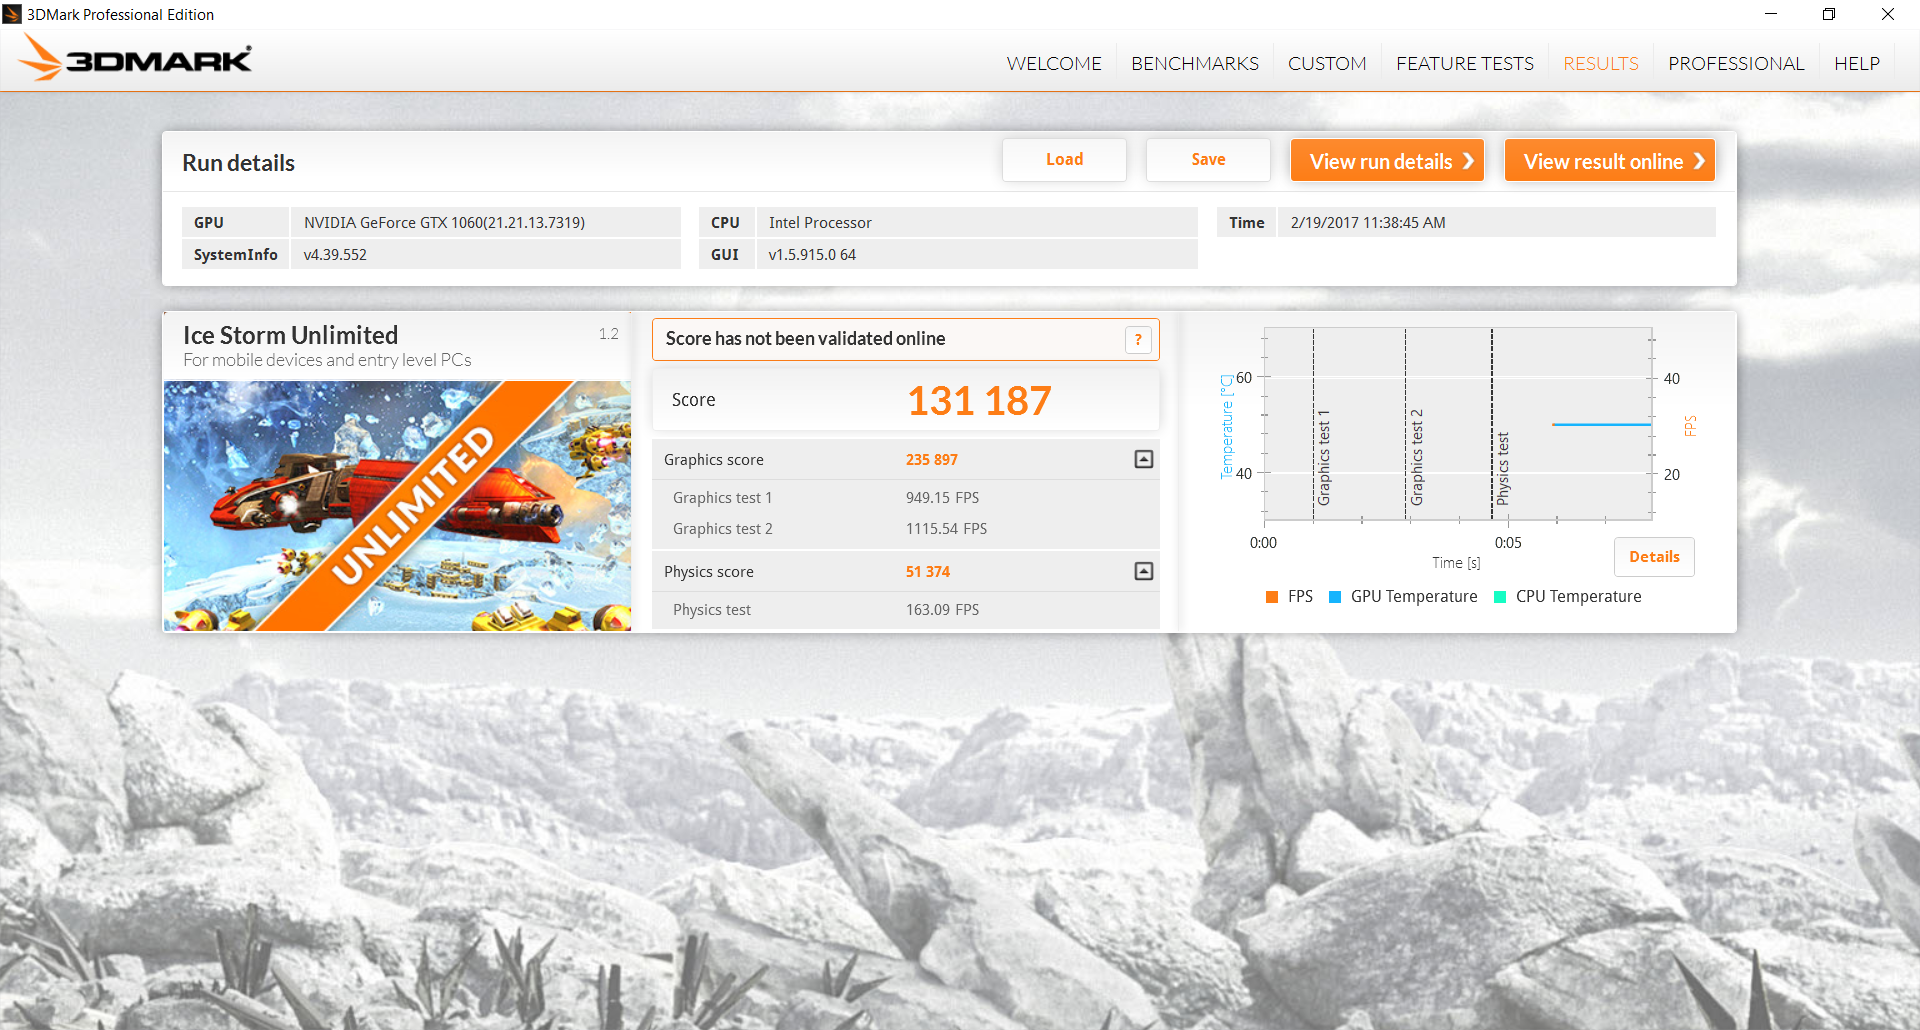
| 3DMark Ice Storm Standard Score | 125692 points | |
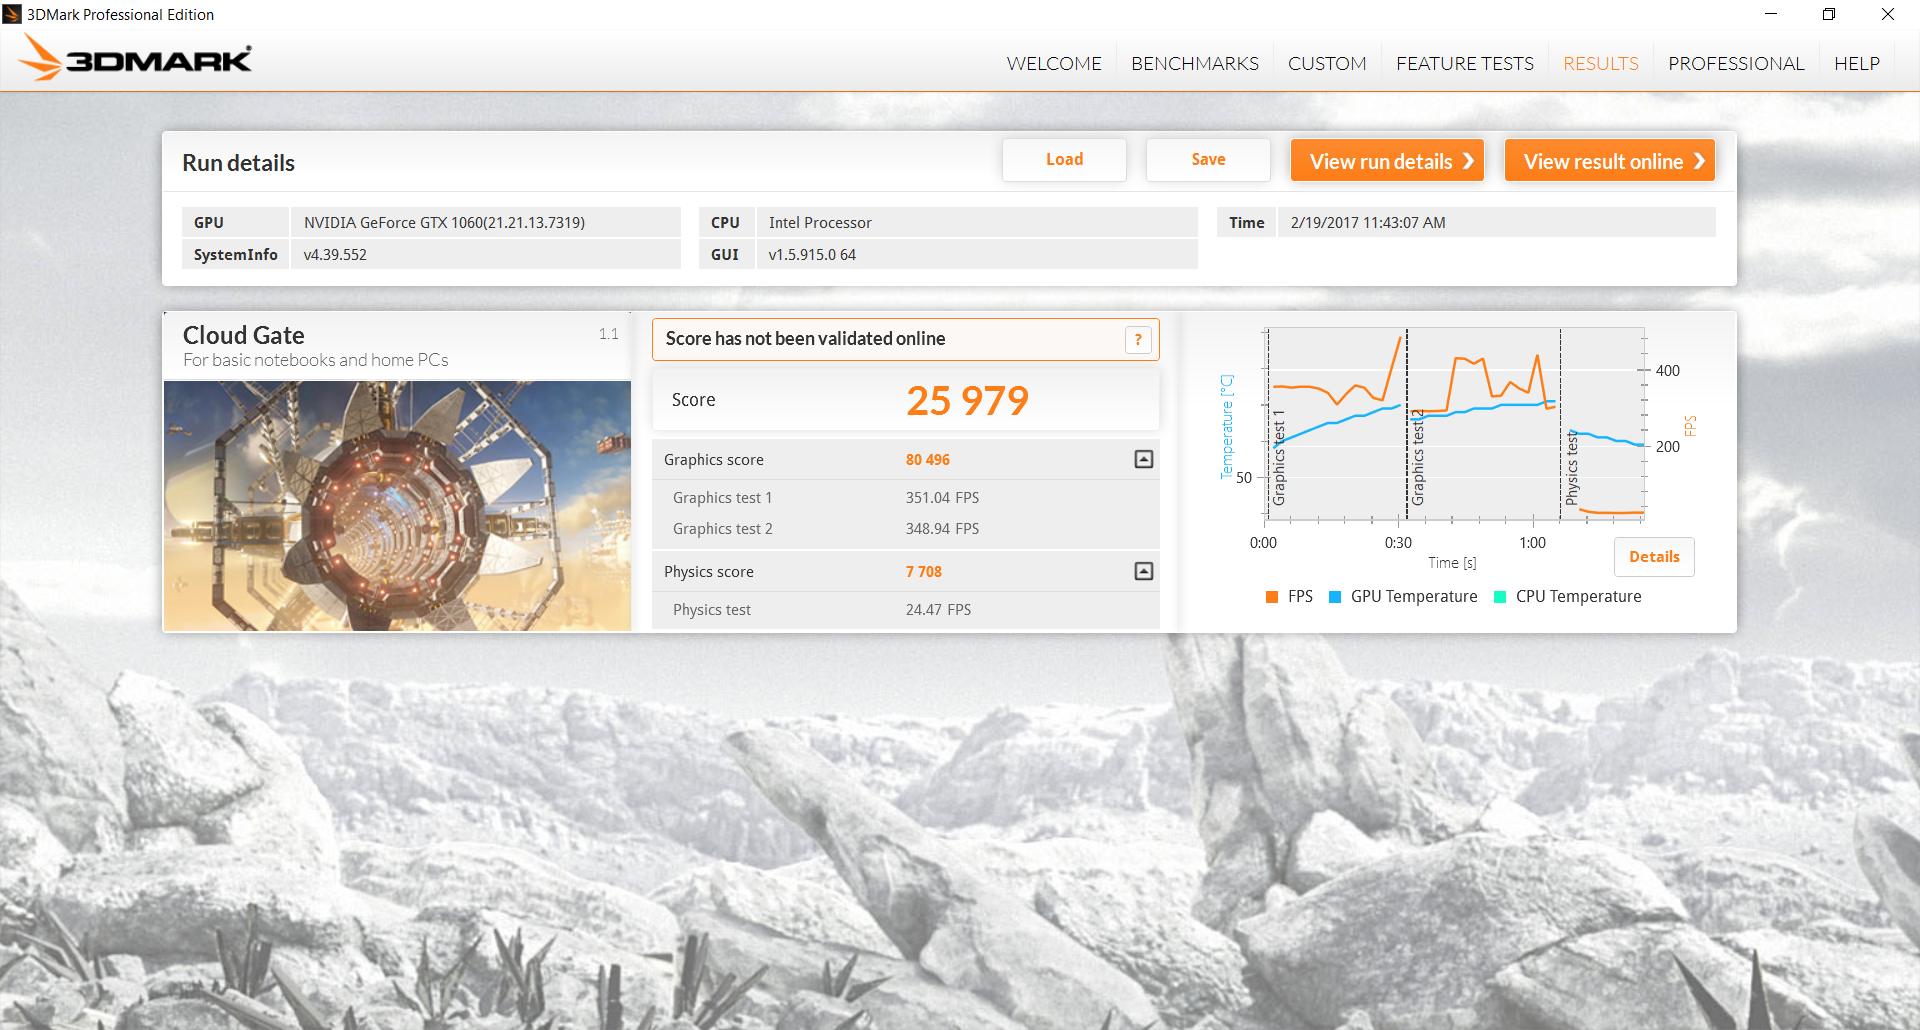
| 3DMark Cloud Gate Standard Score | 25979 points | |
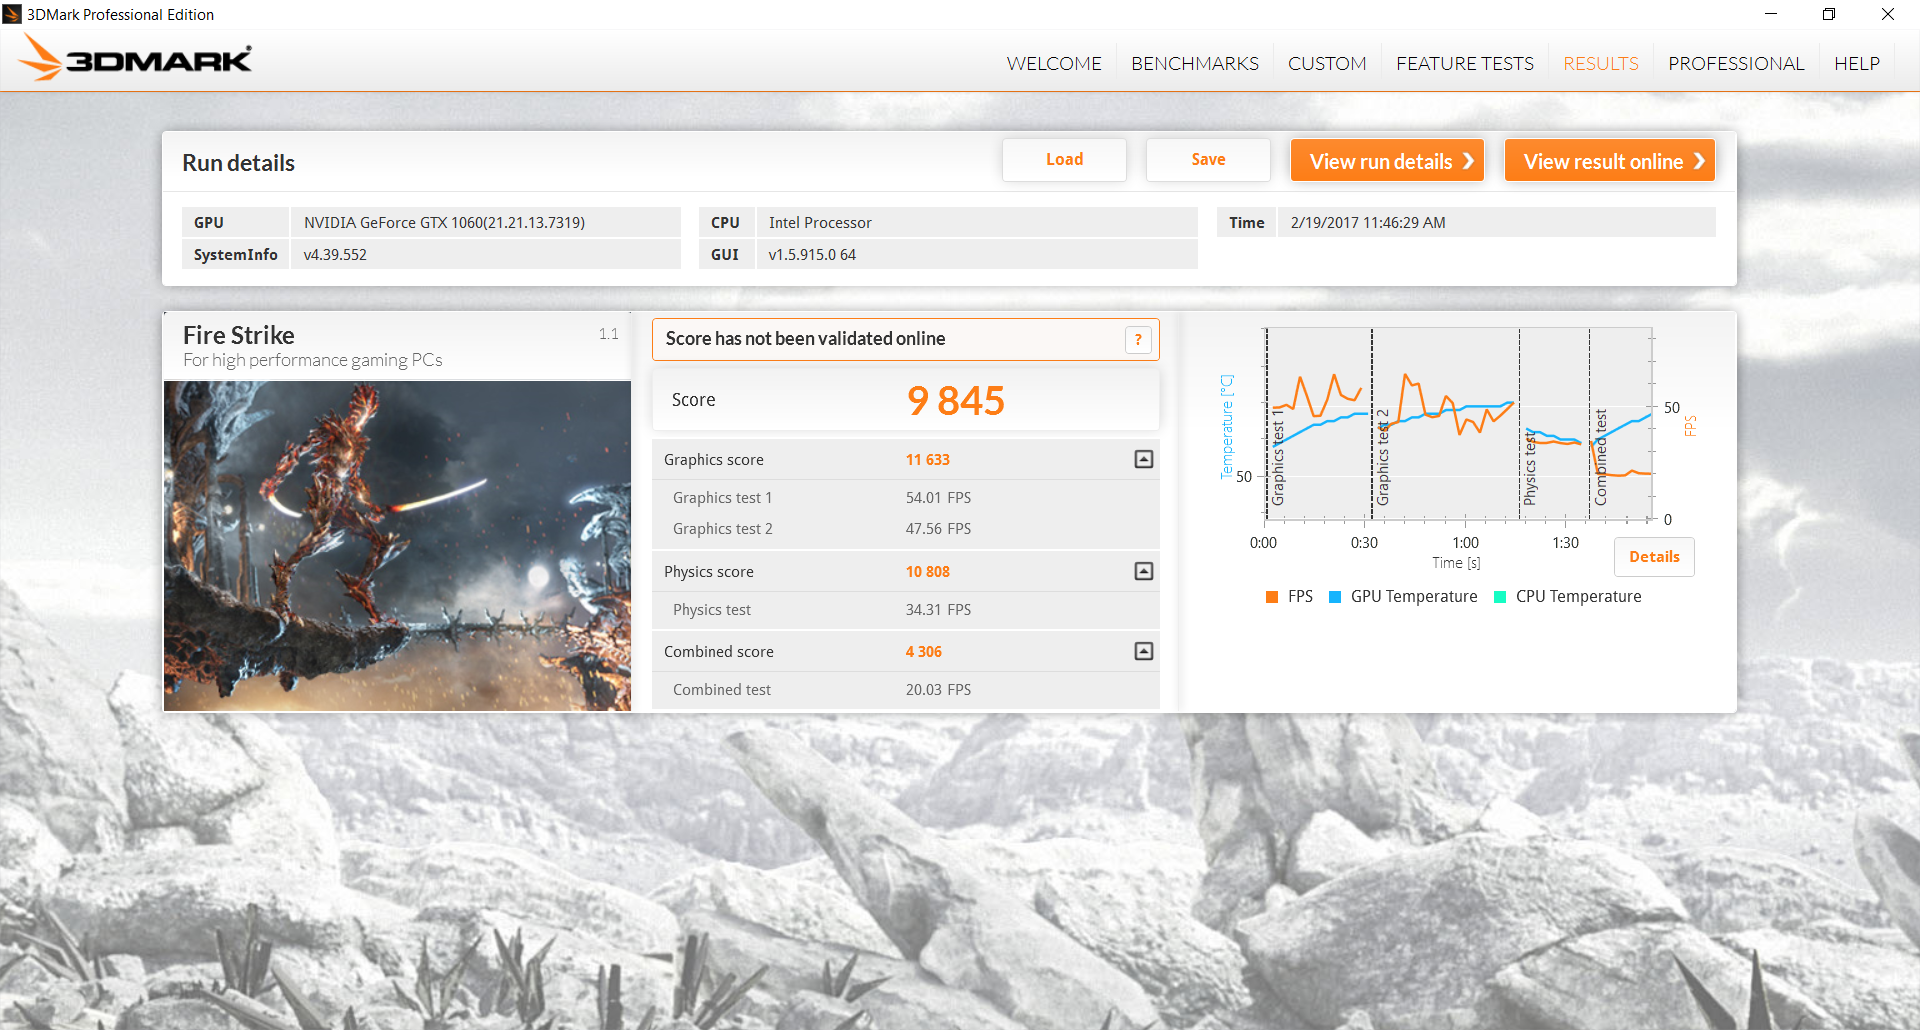
| 3DMark Fire Strike Score | 9845 points | |
| 3DMark Fire Strike Extreme Score | 5189 points | |
Help | ||
Gaming Performance
Real-world gaming performance at 1080p shows an average of 60 FPS for most titles at High to Maximum settings. Titles like Rise of the Tomb Raider may frequently dip below the 60 FPS mark while more intensive titles like Mafia 3 will require further graphics tuning. Performance results are even faster than the older GTX 980M in the GL502VY across the board for all tested games while the GTX 1060 Founder's Edition for desktop still inches out ahead of our mobile GTX 1060.
See our dedicated GPU page on the GTX 1060 for more technical information and benchmark comparisons.
| BioShock Infinite - 1920x1080 Ultra Preset, DX11 (DDOF) | |
| Aorus X7 DT v6 | |
| Gigabyte P57X v7 | |
| Asus FX502VM-AS73 | |
| Asus Strix GL502VY-DS71 | |
| MSI GL62M 7RD-077 | |
| Metro: Last Light - 1920x1080 Very High (DX11) AF:16x | |
| Aorus X7 DT v6 | |
| Asus FX502VM-AS73 | |
| Sleeping Dogs - 1920x1080 Extreme Preset AA:Extreme | |
| Aorus X7 DT v6 | |
| Gigabyte P57X v7 | |
| Asus FX502VM-AS73 | |
| Asus Strix GL502VY-DS71 | |
| Thief - 1920x1080 Very High Preset AA:FXAA & High SS AF:8x | |
| Aorus X7 DT v6 | |
| Asus FX502VM-AS73 | |
| Asus Strix GL502VY-DS71 | |
| MSI GL62M 7RD-077 | |
| Fallout 4 - 1920x1080 Ultra Preset AA:T AF:16x | |
| Aorus X7 DT v6 | |
| Nvidia GeForce GTX 1060 Founders Edition 6 GB | |
| Asus FX502VM-AS73 | |
| Asus Strix GL502VY-DS71 | |
| MSI GE72 7RE-046 | |
| Rise of the Tomb Raider - 1920x1080 Very High Preset AA:FX AF:16x | |
| Aorus X7 DT v6 | |
| Nvidia GeForce GTX 1060 Founders Edition 6 GB | |
| Nvidia GeForce GTX 1060 Founders Edition 6 GB | |
| Asus FX502VM-AS73 | |
| Asus Strix GL502VY-DS71 | |
| MSI GE72 7RE-046 | |
| MSI GL62M 7RD-077 | |
| Ashes of the Singularity - 1920x1080 high | |
| Asus FX502VM-AS73 | |
| MSI GL62M 7RD-077 | |
| Doom - 1920x1080 Ultra Preset AA:SM | |
| Aorus X7 DT v6 | |
| Nvidia GeForce GTX 1060 Founders Edition 6 GB | |
| Asus FX502VM-AS73 | |
| MSI GE72 7RE-046 | |
| Asus Strix GL502VY-DS71 | |
| Overwatch - 1920x1080 Epic (Render Scale 100 %) AA:SM AF:16x | |
| Nvidia GeForce GTX 1060 Founders Edition 6 GB | |
| Asus FX502VM-AS73 | |
| Asus Strix GL502VY-DS71 | |
| MSI GE72 7RE-046 | |
| MSI GL62M 7RD-077 | |
| Mafia 3 - 1920x1080 High Preset | |
| Asus FX502VM-AS73 | |
| MSI GE72 7RE-046 | |
| low | med. | high | ultra | |
|---|---|---|---|---|
| Sleeping Dogs (2012) | 77.5 | |||
| BioShock Infinite (2013) | 103.1 | |||
| Metro: Last Light (2013) | 79.3 | |||
| Thief (2014) | 77.3 | |||
| Metal Gear Solid V (2015) | 60 | |||
| Fallout 4 (2015) | 73.7 | |||
| Rise of the Tomb Raider (2016) | 61.3 | |||
| Ashes of the Singularity (2016) | 54.8 | |||
| Doom (2016) | 95.1 | |||
| Overwatch (2016) | 107.3 | |||
| Mafia 3 (2016) | 46.7 |
Stress Test
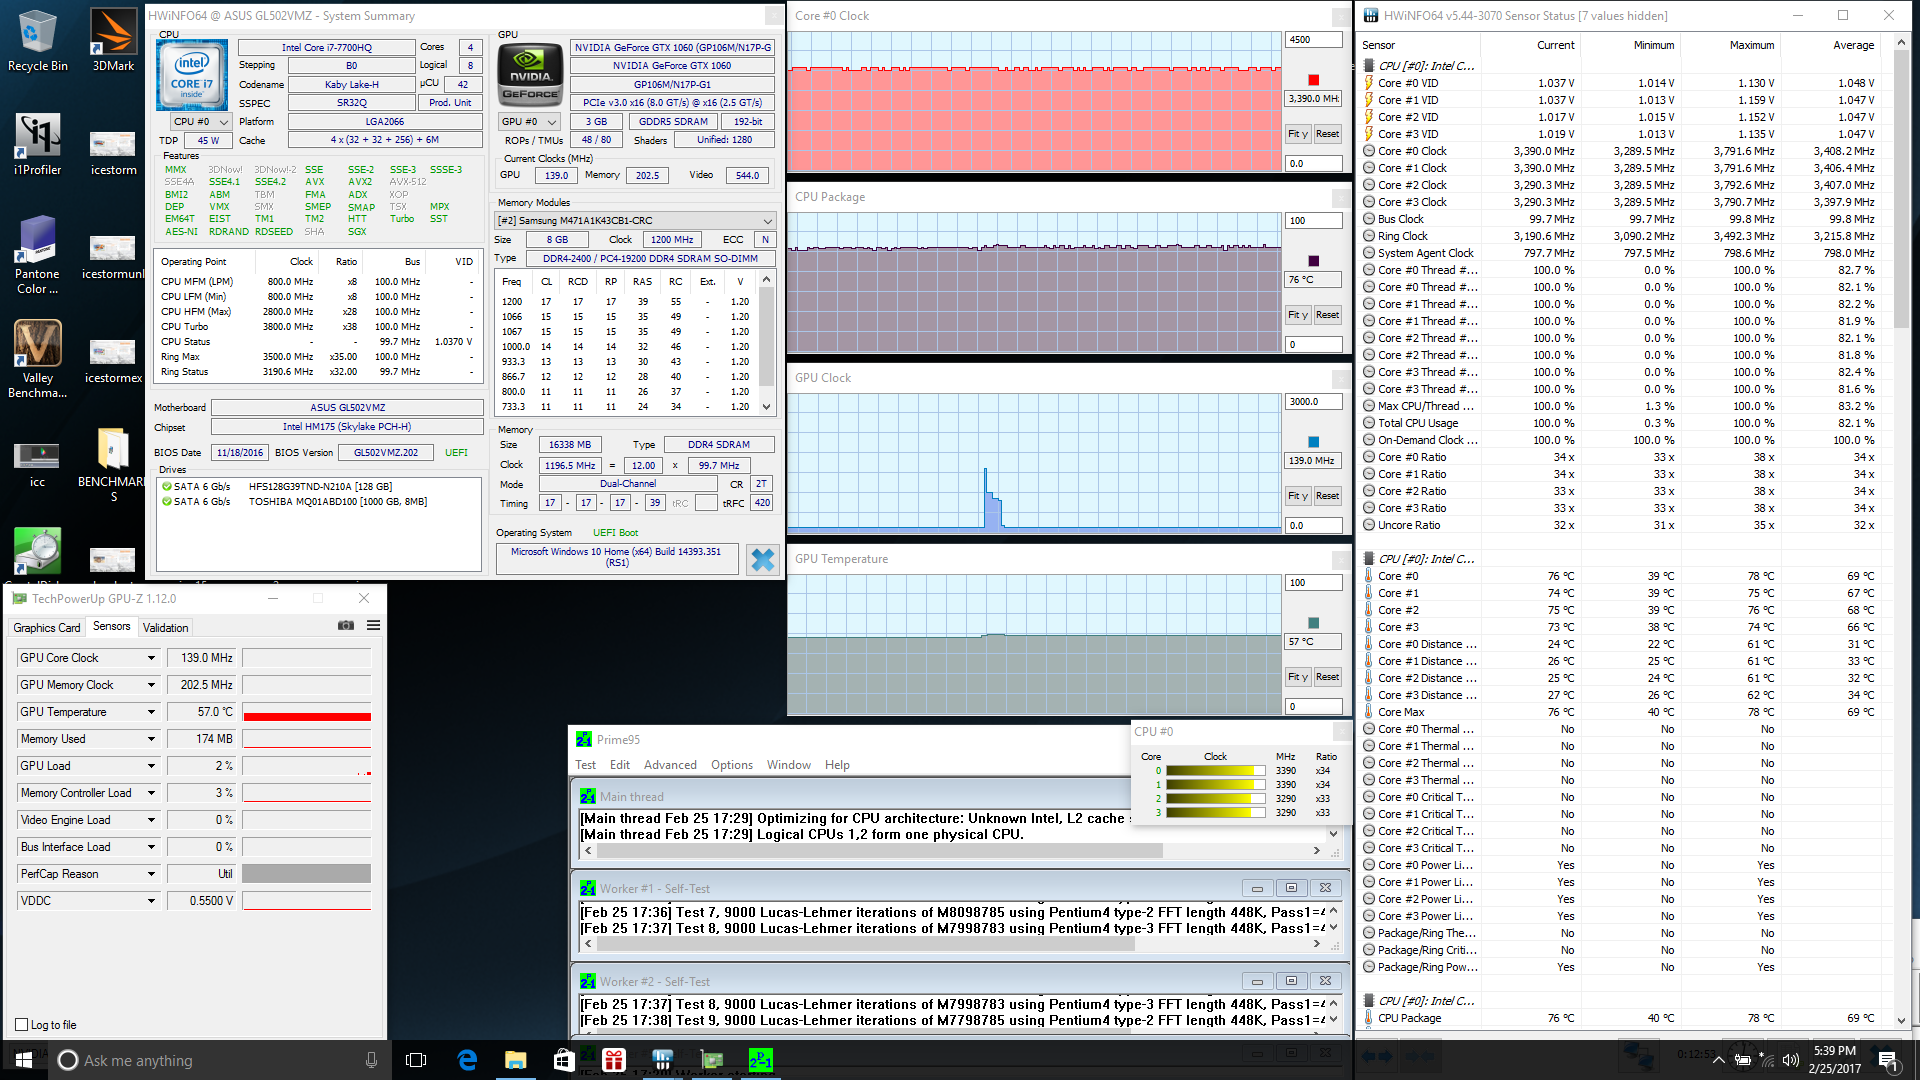
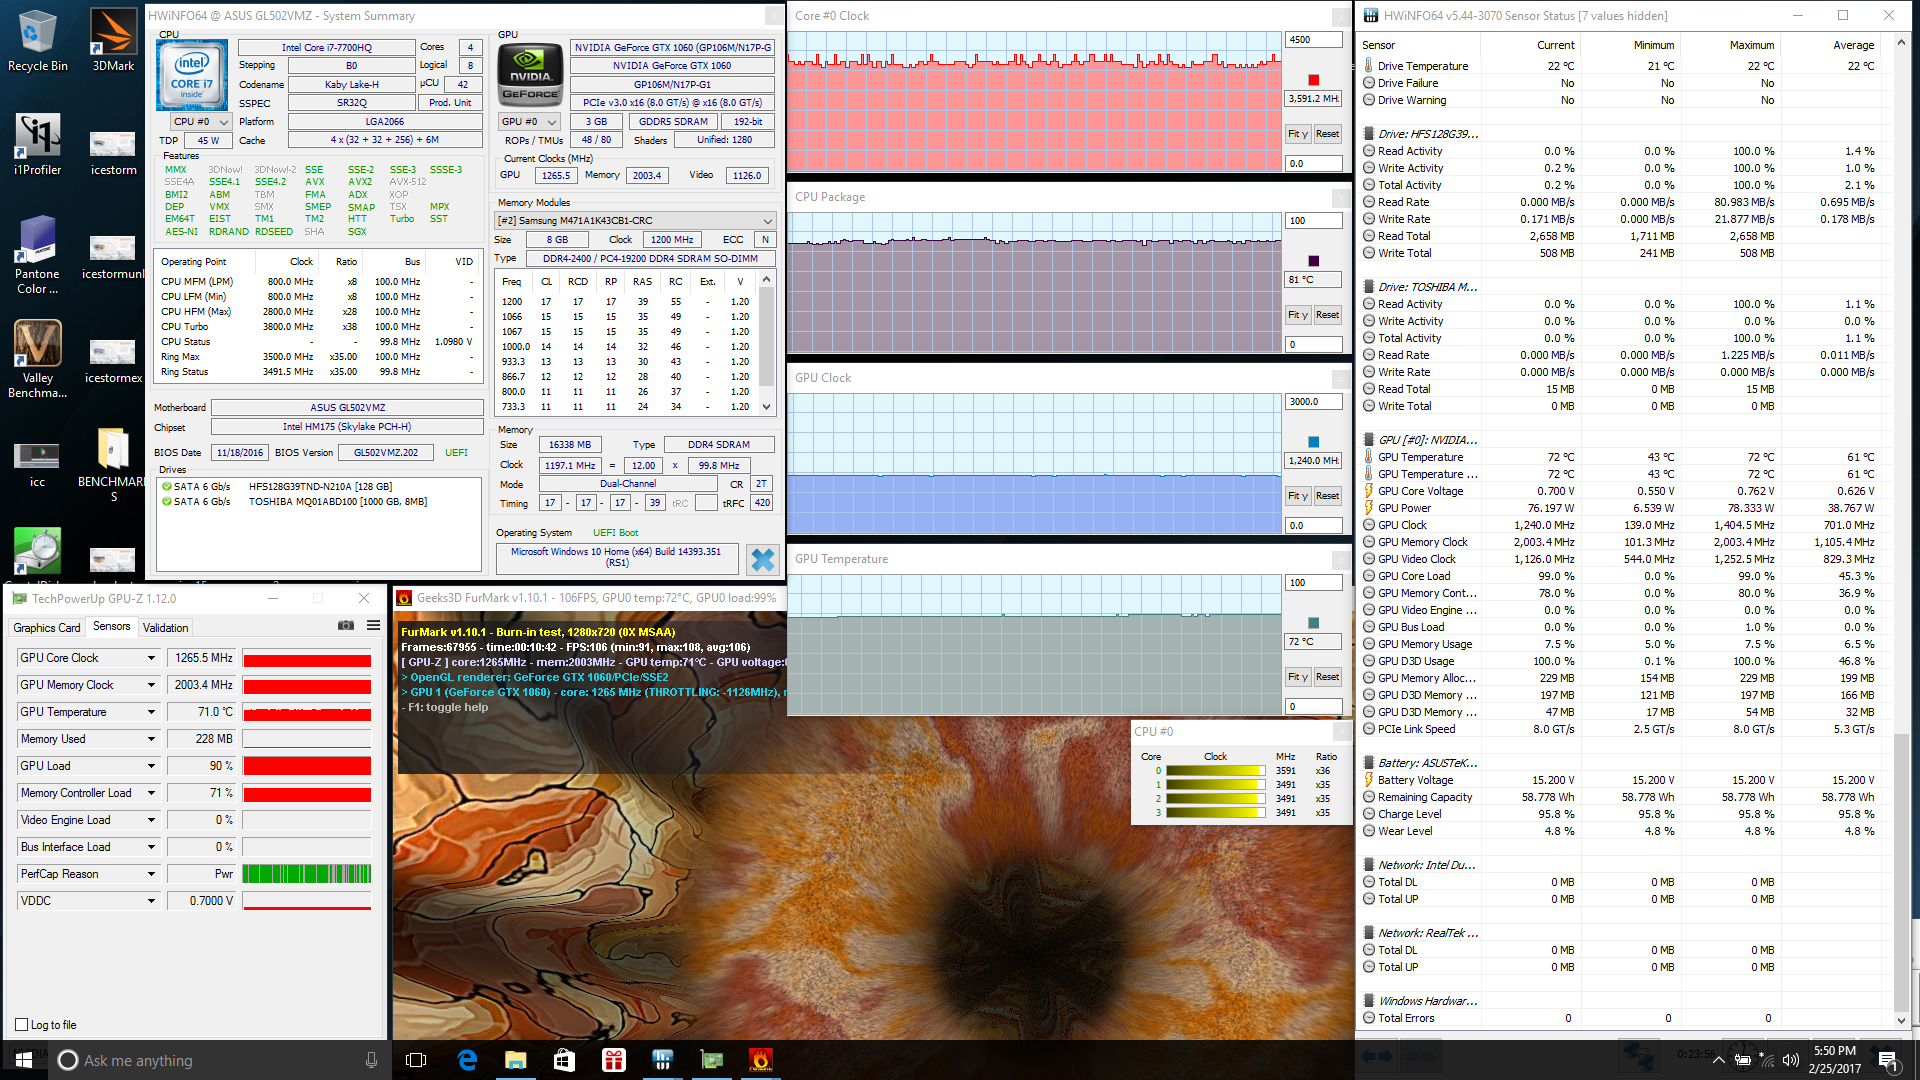
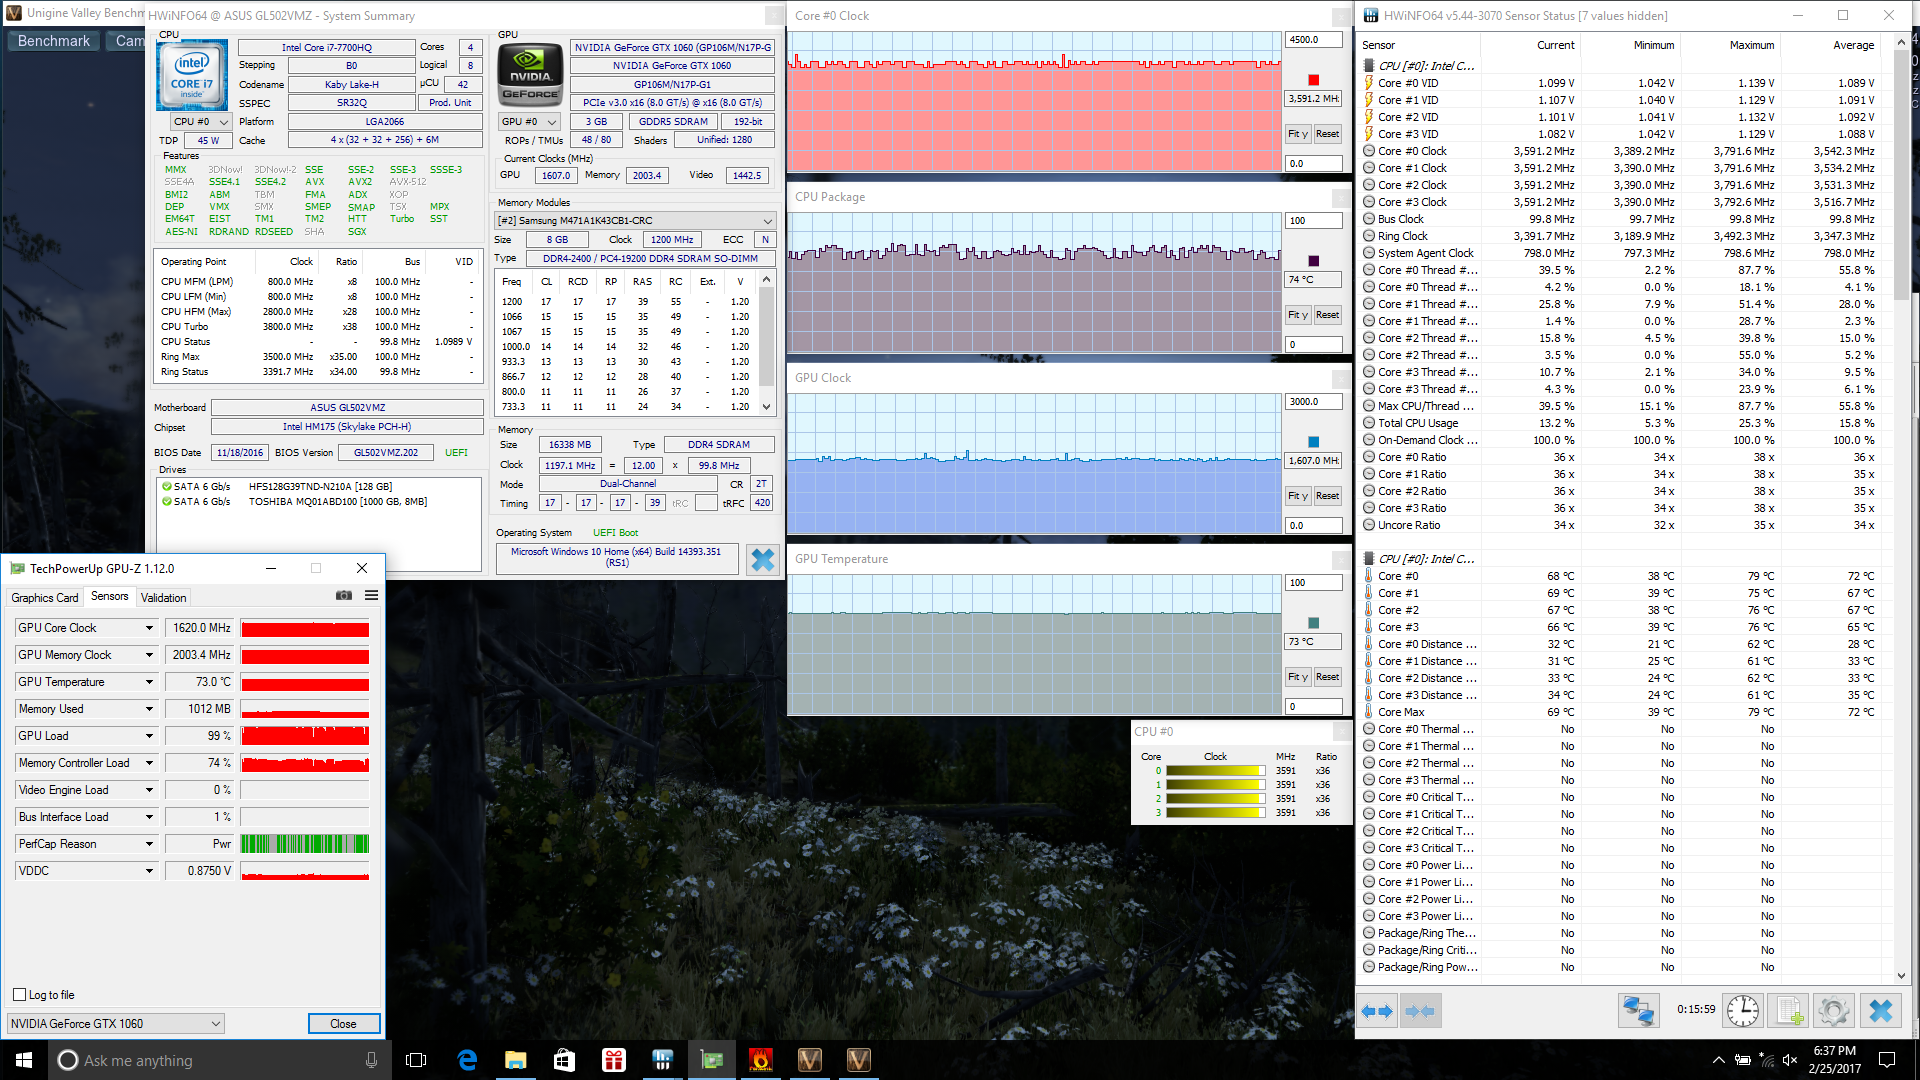
We stress the notebook with synthetic benchmarks to identify for any throttling or stability issues. Results are nearly identical to the GL502VM with relatively steady CPU Turbo Boost and no throttling even when under Prime95 stress. Anything less would have been disappointing especially for a gaming notebook. The CPU and GPU will settle at the 90 C and 80 C ranges when under extreme stress, respectively, while gaming loads will have both processors in the 70 C range.
Running on batteries will not significantly impact CPU performance, but GPU performance will be throttled. A 3DMark 11 run on battery power returns Physics and Graphics scores of 9237 and 7306 points, respectively, compared to 9116 and 14732 points when connected to mains. This test was performed under High Performance mode and after disabling Nvidia BatteryBoost.
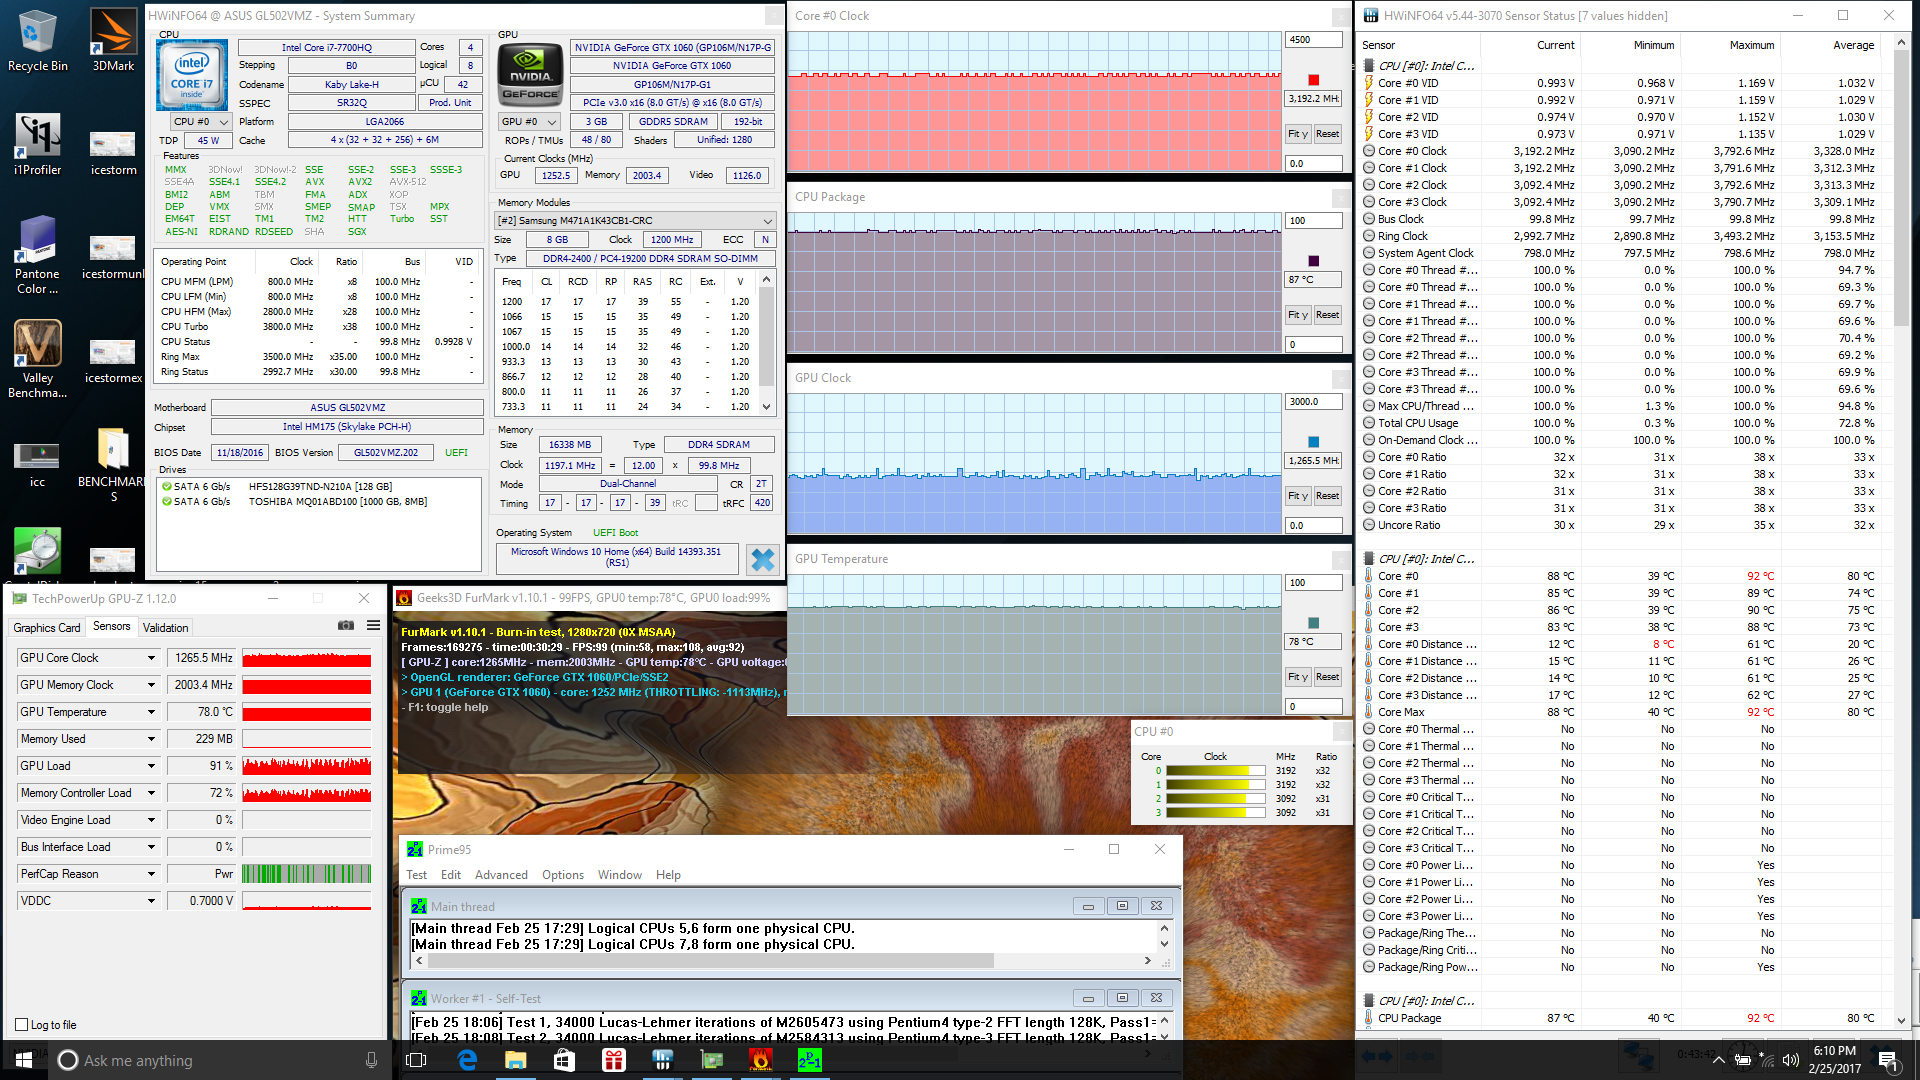
| CPU Clock (GHz) | GPU Clock (MHz) | Average CPU Temperature (°C) | Average GPU Temperature (°C) | |
| Prime95 Stress | 3.3 | -- | 76 | 57 |
| FurMark Stress | -- | 1266 | 81 | 71 |
| Prime95 + FurMark Stress | 3.1 | 1266 | 87 | 78 |
| Unigine Valley Stress | 3.5+ | 1620 | 74 | 73 |
Emissions
System Noise
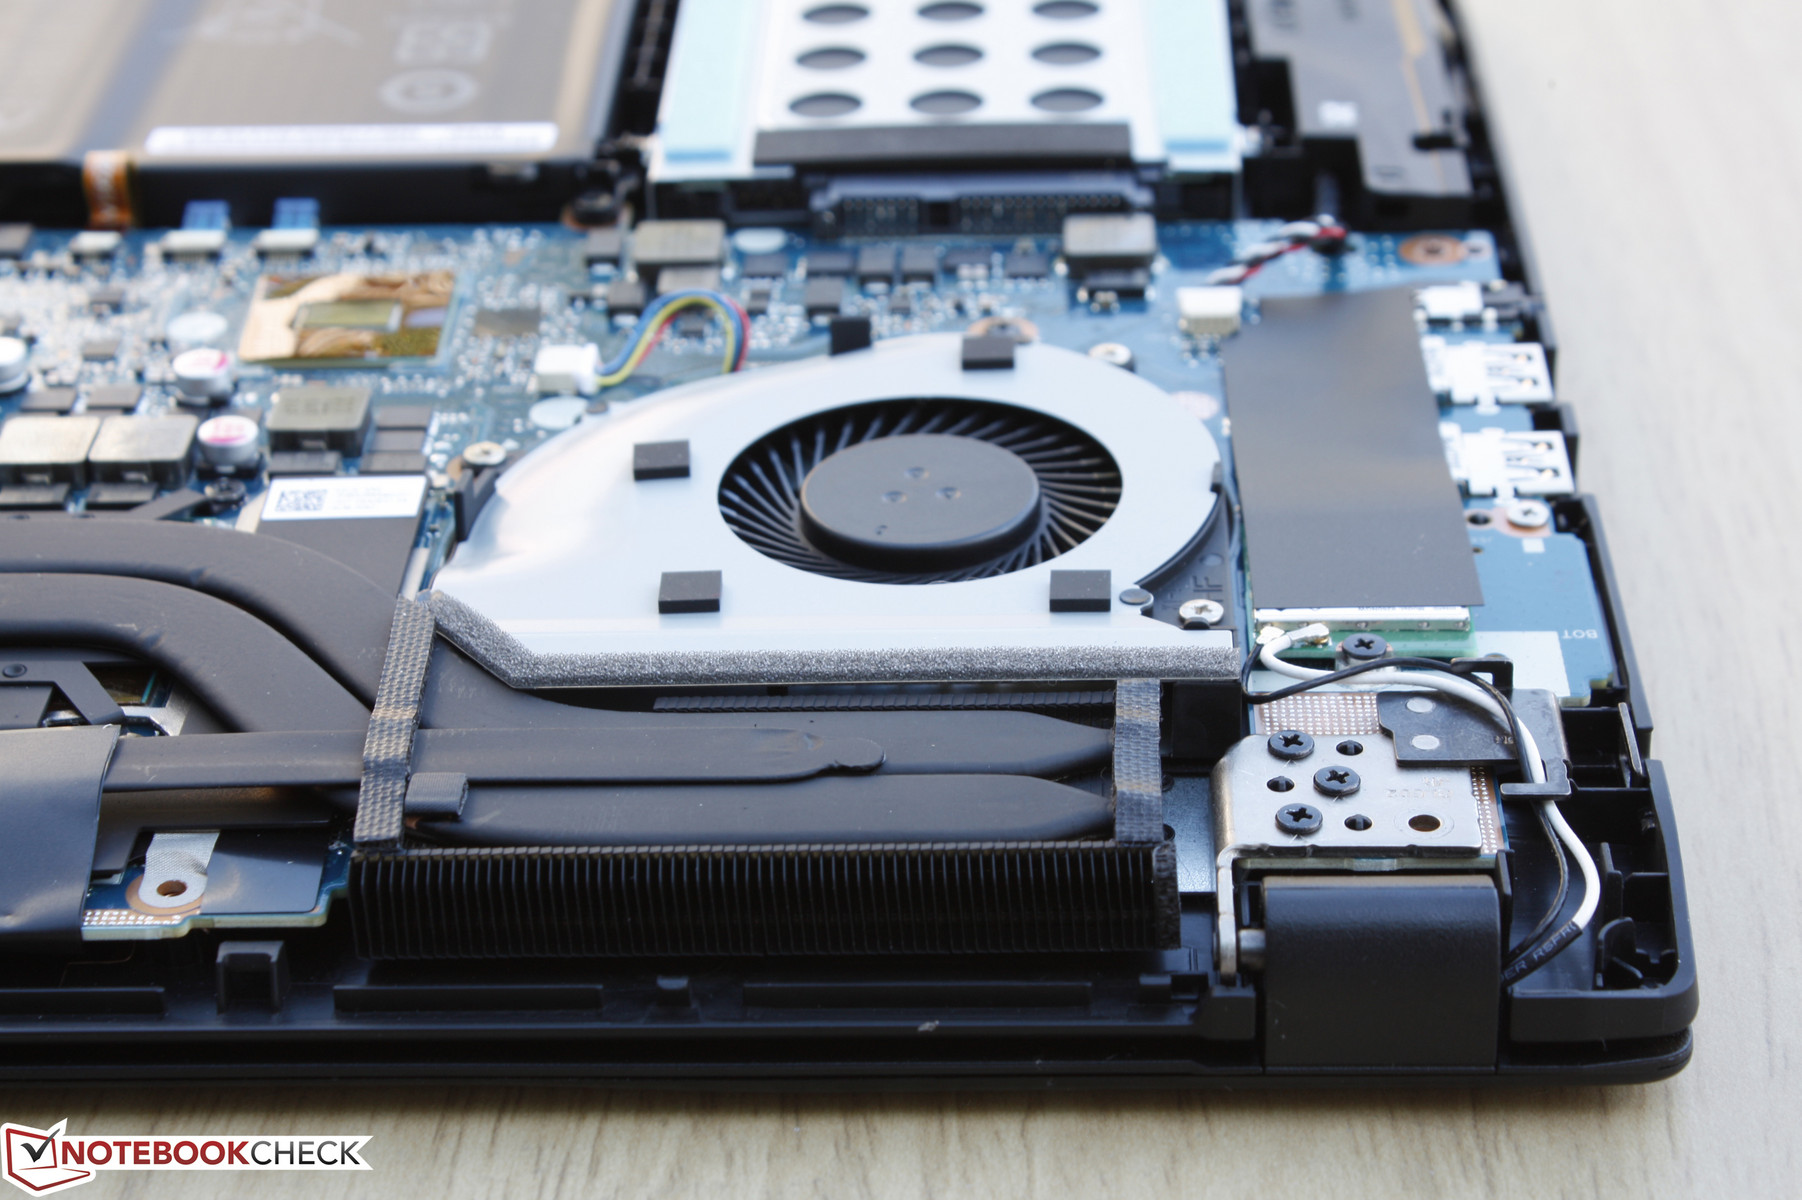
The cooling solution consists of twin fans and two heat pipes between them in a symmetrical formation. The fans are always active no matter the onscreen load, so we were able to record a quiet but consistent humming noise of about 31 dB(A) even when idling on desktop. Gaming loads will bump fan noise to significantly louder levels of about 46 dB(A). This is loud enough to be potentially distracting when playing quieter games like MGS V. The fans remain consistent in speed with no annoying pulsing behavior when gaming. The more powerful Alienware 15 R3 is louder when under similar gaming loads while the new XPS 15 9560 is even louder despite its weaker GTX 1050 GPU. Maximum load with both Prime95 and FurMark will induce a fan noise in the low 50 dB(A) range similar to most gaming notebooks when under extreme stress.
Noise level
| Idle |
| 30.6 / 30.6 / 31 dB(A) |
| Load |
| 46.2 / 52.3 dB(A) |
 | ||
30 dB silent 40 dB(A) audible 50 dB(A) loud |
||
min: | ||
| Asus FX502VM-AS73 GeForce GTX 1060 Mobile, i7-7700HQ, SK Hynix HFS256G39TND-N210A | Alienware 15 R3 GeForce GTX 1070 Mobile, i7-7700HQ | Dell XPS 15 2017 9560 (7300HQ, Full-HD) GeForce GTX 1050 Mobile, i5-7300HQ, WDC WD10SPCX-75KHST0 + SanDisk Z400s M.2 2242 32 GB Cache | Gigabyte P55W v7 GeForce GTX 1060 Mobile, i7-7700HQ, Liteonit CV3-8D256 | Asus Strix GL502VM-DS74 GeForce GTX 1060 Mobile, i7-7700HQ, Samsung SSD 960 Evo 250GB m.2 NVMe | |
|---|---|---|---|---|---|
| Noise | -8% | -2% | -3% | -4% | |
| off / environment * (dB) | 28.7 | 30 -5% | 30.3 -6% | 30 -5% | 30.8 -7% |
| Idle Minimum * (dB) | 30.6 | 31 -1% | 31.6 -3% | 33 -8% | 32 -5% |
| Idle Average * (dB) | 30.6 | 32 -5% | 31.6 -3% | 34 -11% | 32 -5% |
| Idle Maximum * (dB) | 31 | 42 -35% | 33.4 -8% | 35 -13% | 32 -3% |
| Load Average * (dB) | 46.2 | 49 -6% | 47.8 -3% | 39 16% | 48.3 -5% |
| Load Maximum * (dB) | 52.3 | 50 4% | 47.8 9% | 50 4% | 51.2 2% |
* ... smaller is better
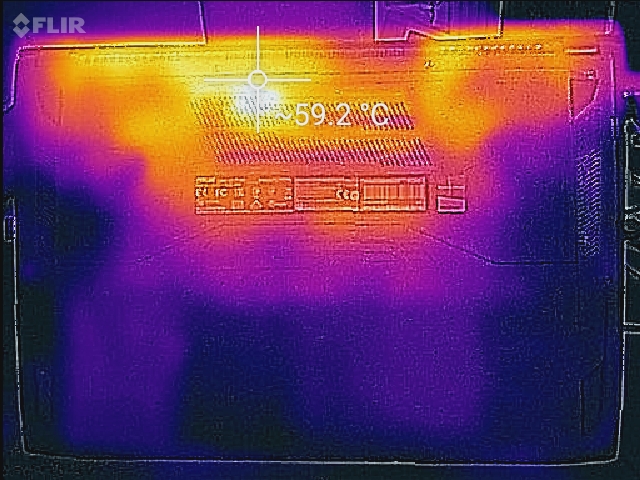
Temperature
Surface temperatures are cool when idling with warm spots up to the low 30 C range on the rear of the notebook. These quadrants can become very warm up to the 50 C range when the system is under extreme stress, but these areas are thankfully away from the palm rests and keyboard. The WASD keys, for example, remain cool for comfortable use no matter the processing load. When compared to the thicker MSI GT62VR, the Asus actually runs cooler on average but with warmer hot spots and a steeper temperature gradient.
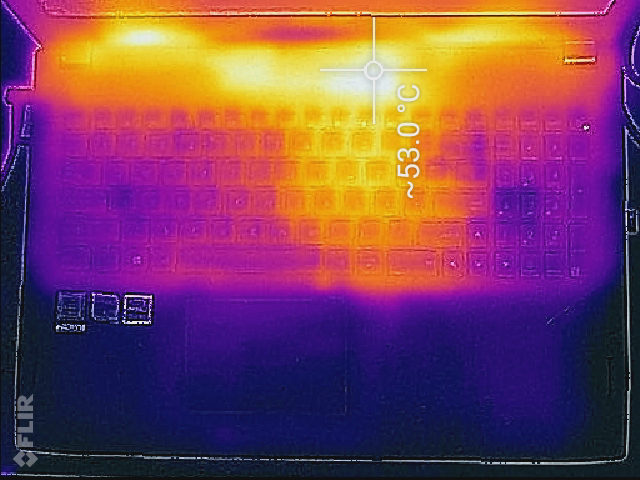
(-) The maximum temperature on the upper side is 53.2 °C / 128 F, compared to the average of 40.4 °C / 105 F, ranging from 21.2 to 68.8 °C for the class Gaming.
(-) The bottom heats up to a maximum of 56.8 °C / 134 F, compared to the average of 43.2 °C / 110 F
(+) In idle usage, the average temperature for the upper side is 25.5 °C / 78 F, compared to the device average of 33.9 °C / 93 F.
(+) The palmrests and touchpad are cooler than skin temperature with a maximum of 23.4 °C / 74.1 F and are therefore cool to the touch.
(+) The average temperature of the palmrest area of similar devices was 28.8 °C / 83.8 F (+5.4 °C / 9.7 F).
Speakers
Microphone measurements show poor bass reproduction at around 200 Hz and below when on default settings, which is typical of most notebooks. Treble is overpowering and range feels limited. Maximum volume is sufficiently loud for a small room, though not as loud as some multimedia notebooks like the HP Spectre x360 15. High volume settings will not introduce static and will reverberate the chassis just slightly. Dedicated headphones or earphones are still recommended.


Asus FX502VM-AS73 audio analysis
(-) | not very loud speakers (67.7 dB)
Bass 100 - 315 Hz
(±) | reduced bass - on average 14% lower than median
(±) | linearity of bass is average (12.6% delta to prev. frequency)
Mids 400 - 2000 Hz
(+) | balanced mids - only 2.7% away from median
(±) | linearity of mids is average (11.5% delta to prev. frequency)
Highs 2 - 16 kHz
(+) | balanced highs - only 4.9% away from median
(±) | linearity of highs is average (11.4% delta to prev. frequency)
Overall 100 - 16.000 Hz
(±) | linearity of overall sound is average (29.9% difference to median)
Compared to same class
» 95% of all tested devices in this class were better, 2% similar, 3% worse
» The best had a delta of 6%, average was 18%, worst was 132%
Compared to all devices tested
» 88% of all tested devices were better, 3% similar, 9% worse
» The best had a delta of 4%, average was 23%, worst was 134%
Apple MacBook 12 (Early 2016) 1.1 GHz audio analysis
(+) | speakers can play relatively loud (83.6 dB)
Bass 100 - 315 Hz
(±) | reduced bass - on average 11.3% lower than median
(±) | linearity of bass is average (14.2% delta to prev. frequency)
Mids 400 - 2000 Hz
(+) | balanced mids - only 2.4% away from median
(+) | mids are linear (5.5% delta to prev. frequency)
Highs 2 - 16 kHz
(+) | balanced highs - only 2% away from median
(+) | highs are linear (4.5% delta to prev. frequency)
Overall 100 - 16.000 Hz
(+) | overall sound is linear (10.2% difference to median)
Compared to same class
» 7% of all tested devices in this class were better, 2% similar, 90% worse
» The best had a delta of 5%, average was 18%, worst was 53%
Compared to all devices tested
» 5% of all tested devices were better, 1% similar, 94% worse
» The best had a delta of 4%, average was 23%, worst was 134%
Frequency Comparison (Checkbox selectable!)
Graph 1: Pink Noise 100% Vol.; Graph 2: Audio off
Energy Management
Power Consumption
The Asus consumes about 15 W when idling on desktop and jumps to just over 100 W when under 3DMark load. This is very similar to the GL502VM but significantly more than both the XPS 15 9560 and Gigabyte P55W v7. The strangely high idling power consumption of our Xotic PC GL502VM unit is likely responsible for its very short battery runtimes compared to our FX502VM.
Running both Prime95 and FurMark will demand about 149 W from the small 180 W AC adapter.
| Off / Standby | |
| Idle | |
| Load |
|
Key:
min: | |
| Asus FX502VM-AS73 | Alienware 15 R3 | Dell XPS 15 2017 9560 (7300HQ, Full-HD) | Gigabyte P55W v7 | Asus Strix GL502VM-DS74 | |
|---|---|---|---|---|---|
| Power Consumption | -36% | 33% | 15% | -102% | |
| Idle Minimum * (Watt) | 14.9 | 19 -28% | 6.6 56% | 8 46% | 38.3 -157% |
| Idle Average * (Watt) | 15.1 | 23 -52% | 9 40% | 13 14% | 40.5 -168% |
| Idle Maximum * (Watt) | 15.2 | 29 -91% | 10.7 30% | 18 -18% | 42.2 -178% |
| Load Average * (Watt) | 105.8 | 85 20% | 77.5 27% | 76 28% | 110.4 -4% |
| Load Maximum * (Watt) | 148.8 | 192 -29% | 130 13% | 143 4% | 155.7 -5% |
* ... smaller is better
Battery Life
The 64 Wh internal battery pack provides respectable runtimes on par with the new Alienware 15 R3. The lack of Optimus, however, is obvious as the Gigabyte P55W v7 with the same CPU, GPU, and battery capacity can outlast our FX502VM by about an hour when under similar WLAN testing conditions. Users can expect 4.5 hours of real-world browsing use out of the Asus. Note that our Xotic PC GL502VM runtime results below are extremely short in comparison likely due to software or performance tweaks by the reseller.
Charging from near empty to full capacity will take about 2 to 2.5 hours with the included AC adapter.
| Asus FX502VM-AS73 i7-7700HQ, GeForce GTX 1060 Mobile, 64 Wh | Alienware 15 R3 i7-7700HQ, GeForce GTX 1070 Mobile, 99 Wh | Dell XPS 15 2017 9560 (7300HQ, Full-HD) i5-7300HQ, GeForce GTX 1050 Mobile, 56 Wh | Gigabyte P55W v7 i7-7700HQ, GeForce GTX 1060 Mobile, 63 Wh | Asus Strix GL502VM-DS74 i7-7700HQ, GeForce GTX 1060 Mobile, 64 Wh | |
|---|---|---|---|---|---|
| Battery runtime | 19% | 34% | 62% | -49% | |
| Reader / Idle (h) | 6.1 | 6.4 5% | 9.4 54% | 13.2 116% | 1.7 -72% |
| WiFi v1.3 (h) | 4.6 | 4.4 -4% | 5.6 22% | 5.8 26% | 1.5 -67% |
| Load (h) | 1.1 | 1.7 55% | 1.4 27% | 1.6 45% | 1 -9% |
Pros
Cons
Verdict

The FX502VM retails for a few hundred Dollars less than the GL502VM even after assuming identical CPU and storage configurations. It makes sacrifices along the way, of course, including the lack of a USB Type-C port and a GTX 1060 with just half the VRAM. The system is still a very balanced gaming machine even after considering the cut corners as these drawbacks have almost no tangible effect on 1080p gaming. Beyond this, the pros and cons of the GL502VM apply here including the relatively loud fan noise, flexible lid, and lack of Thunderbolt 3. The GL502VM is already a good gaming notebook and the FX502VM is just a tiny step down for a more affordable price. The chassis is notably thinner than the MSI GE/GL series and is arguably more attractive than the HP Omen series while being more affordable than the current Gigabyte lineup.
While we can give the actual system a solid recommendation for gamers on a budget, buyers should absolutely avoid SKUs with the lower-end TN model like the one we have here and should instead invest in the higher-end IPS option. The TN panel has no place in this category as its brightness, colors, and contrast are poor even by budget notebook standards let alone on a $1000 USD gaming machine.
Asus FX502VM-AS73
- 03/04/2017 v6 (old)
Allen Ngo
Price comparison
