Notebook reviews with NVIDIA GeForce GTX 980M graphics card
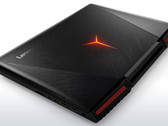
Lenovo IdeaPad Y900 17ISK Notebook Review
A souped-up Y700. The higher-end Y900 feels unique with more features and better craftsmanship than its immediately Y700 predecessor. Unfortunately, its chiclet mechanical keyboard, loud pulsating fans, and high starting price leave a lot to be desired.
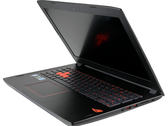
Intel Core i7-6820HK, NVIDIA GeForce GTX 980M, 17.3", 4.4 kgAsus ROG Strix GL502VY-DS71 Notebook Review
GTX 980M update. The higher-end SKU adds G-Sync, a GTX 980M, and one more SODIMM slot over the lower-end GL502VT. Its lack of both an 8 GB GDDR5 option and external G-Sync support can be a bit of a bummer. Is this the 15-inch gaming notebook to get for $1700 USD?
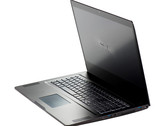
Intel Core i7-6700HQ, NVIDIA GeForce GTX 980M, 15.6", 2.6 kgEVGA SC17 Xotic PC Edition Notebook Review
New contender. EVGA shows the gaming notebook market how it's done with the excellent SC17. If first impressions are everything, then the SC17 is already hitting the ground running at full speed.
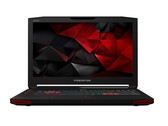
Intel Core i7-6820HK, NVIDIA GeForce GTX 980M, 17.3", 4 kgAcer Predator 17 (i7-6700HQ, GTX 980M) Notebook Review
4K rocket. In 2015, Acer created unique looking gaming notebooks with the Predator series. In order to not fall behind the competition, the manufacturer launches a refresh now, which is better than the old model in many aspects. We have reviewed an especially high configuration of the 17-incher.
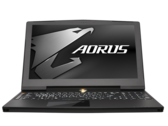
Intel Core i7-6700HQ, NVIDIA GeForce GTX 980M, 17.3", 4.1 kgAorus X5S v5 Notebook Review
One is better than two. The refreshed X5 shows that a single more powerful GPU is the better choice against two weaker GPUs in SLI.
Intel Core i7-6700HQ, NVIDIA GeForce GTX 980M, 15.6", 2.5 kgSchenker XMG P506 PRO: Intel Core i7-6820HK, 15.60", 2.8 kg
Review » Schenker XMG P506 PRO (Clevo P651RG) Notebook Review
DogHouse Systems Mobius SS: Intel Core i7-6700K, 17.30", 3.8 kg
Review » DogHouse Systems Mobius SS (Clevo P770DM) Notebook Review
Gigabyte P37X v5: Intel Core i7-6700HQ, 17.30", 2.9 kg
Review » Gigabyte P37X v5 Notebook Review
Alienware 17 R3 (A17-9935): Intel Core i7-6700HQ, 17.30", 3.7 kg
Review » Alienware 17 R3 Notebook Review
Gigabyte P35X v5: Intel Core i7-6700HQ, 15.60", 2.6 kg
Review » Gigabyte P35X v5 Notebook Review
Asus G752VY-RH71: Intel Core i7-6700HQ, 17.30", 4.5 kg
Review » Xotic PC Asus G752VY Notebook Review
Acer Predator 15 G9-591-74ZV: Intel Core i7-6700HQ, 15.60", 3.6 kg
Review » Acer Predator 15 Notebook Review
Alienware 15 R2 (Skylake): Intel Core i7-6700HQ, 15.60", 3.1 kg
Review » Alienware 15 R2 Notebook Review
Schenker XMG P706: Intel Core i7-6820HK, 17.30", 3.3 kg
Review » Schenker XMG P706 (Clevo P671RG) Notebook Review
MSI GT72S-6QEG16SR421BW: Intel Core i7-6820HK, 17.30", 3.8 kg
Review » MSI GT72S 6QE Dominator Pro G Notebook Review
Schenker XMG U506: Intel Core i5-6600K, 15.60", 3.5 kg
Review » Schenker XMG U506 (Clevo P751DM) Notebook Review
Schenker XMG U706: Intel Core i7-6700K, 17.30", 3.9 kg
Review » Schenker XMG U706 (Clevo P771DM) Notebook Review
Asus G751JY: Intel Core i7-4720HQ, 17.30", 4.2 kg
Review » Asus G751JY G-Sync Notebook Review
MSI GT72-2QE16SR21BW: Intel Core i7-5700HQ, 17.30", 3.7 kg
Review » MSI GT72 (Broadwell) Notebook Review
Eurocom P7 Pro: Intel Core i7-5775C, 17.30", 3.9 kg
Review » Eurocom P7 Pro (Clevo P770ZM) Notebook Review
Alienware 17 R2: Intel Core i7-4980HQ, 17.30", 3.7 kg
Review » Alienware 17 R2 Notebook Review
Gigabyte P37X: Intel Core i7-4720HQ, 17.30", 3 kg
Review » Gigabyte P37X Notebook Review
Eurocom P5 Pro Extreme: Intel Core i7-4790K, 15.60", 3.4 kg
Review » Eurocom P5 Pro Extreme (Clevo P750ZM) Notebook Review
One K73-5N: Intel Core i7-4790K, 17.30", 3.9 kg
Review » One K73-5N (Clevo P771ZM) Notebook Review
Asus G751JY-T7009H: Intel Core i7-4710HQ, 17.30", 4.2 kg
Review » Asus G751JY-T7009H Notebook Review
Schenker XMG P505 PRO: Intel Core i7-4710HQ, 15.60", 2.7 kg
Review » Schenker XMG P505 PRO (Clevo P651SG) Notebook Review
Ibuypower GT72 Dominator: Intel Core i7-4710HQ, 17.30", 3.8 kg
Review » iBuyPower GT72 Dominator Notebook Review Update
Gigabyte P35X v3: Intel Core i7-4710HQ, 15.60", 2.5 kg
Review » Gigabyte P35X v3 Notebook Review
MSI GT72-2QE32SR311BW: Intel Core i7-4710HQ, 17.30", 3.8 kg
Review » MSI GT72 (GTX 980M) Notebook Review Update
MSI GT72S-6QF-012BE: Intel Core i7-6820HK, 17.30", 3.8 kg
External Review » MSI GT72S-6QF-012BE
Acer Predator 15 G9-591-72L8: Intel Core i7-6700HQ, 15.60", 3.4 kg
External Review » Acer Predator 15 G9-591-72L8
Asus G752VY-GC174T: Intel Core i7-6700HQ, 17.30", 4.3 kg
External Review » Asus G752VY-GC174T
Microsoft Surface Studio 45U-00005: Intel Core i7-6820HQ, 28.00", 9.6 kg
External Review » Microsoft Surface Studio 45U-00005
MSI GT72S 6QE-827RU Dominator Pro G: Intel Core i7-6820HK, 17.30", 3.8 kg
External Review » MSI GT72S 6QE-827RU Dominator Pro G
Lenovo IdeaPad Y900-17ISK- 80Q1006GRA: Intel Core i7-6820HK, 17.30", 4.6 kg
External Review » Lenovo IdeaPad Y900-17ISK- 80Q1006GRA
MSI GT72S 6QE-1012N: Intel Core i7-6820HK, 17.30", 3.8 kg
External Review » MSI GT72S 6QE-1012N
Lenovo IdeaPad Y900-17ISK-80Q1004QGE: Intel Core i7-6820HQ, 17.30", 4.6 kg
External Review » Lenovo IdeaPad Y900-17ISK-80Q1004QGE
Asus G752VY-T7003T: Intel Core i7-6700HQ, 17.30", 4.3 kg
External Review » Asus G752VY-T7003T
Medion Erazer X7843-MD99997: Intel Core i7-6820HK, 17.30", 3.5 kg
External Review » Medion Erazer X7843-MD99997
Lenovo IdeaPad Y900-17ISK-80Q1000BGE: Intel Core i7-6700HQ, 17.30", 4.4 kg
External Review » Lenovo IdeaPad Y900-17ISK-80Q1000BGE
Asus G752VY-GC087T: Intel Core i7-6700HQ, 17.30", 4.5 kg
External Review » Asus G752VY-GC087T
Acer Predator 17 G9-792-74TT: Intel Core i7-6700HQ, 17.30", 4.1 kg
External Review » Acer Predator 17 G9-792-74TT
Acer Predator 17 G9-792-736Q: Intel Core i7-6700HQ, 17.30", 4.1 kg
External Review » Acer Predator 17 G9-792-736Q
Acer Predator 15 G9-591-713C: Intel Core i7-6700HQ, 15.60", 3.6 kg
External Review » Acer Predator 15 G9-591-713C
Acer Predator 15 G9-592-77ZU: Intel Core i7-6700HQ, 15.60", 3.5 kg
External Review » Acer Predator 15 G9-592-77ZU
Alienware 17 R3 (A17-9935): Intel Core i7-6700HQ, 17.30", 3.7 kg
External Review » Alienware 17 R3 (A17-9935)
Acer Predator 17 G9-791-718D: Intel Core i7-6700HQ, 17.30", 4.1 kg
External Review » Acer Predator 17 G9-791-718D
Asus Strix GL502VY-DS71: Intel Core i7-6700HQ, 15.60", 2.6 kg
External Review » Asus Strix GL502VY-DS71
Acer Predator 17X GX-791-750T: Intel Core i7-6820HK, 17.30", 4.2 kg
External Review » Acer Predator 17X GX-791-750T
MSI GT72S 6QE-858FR : Intel Core i7-6820HK, 17.30", 3.8 kg
External Review » MSI GT72S 6QE-858FR
MSI GT72S-6QE32SR42BW Tobii: Intel Core i7-6820HK, 17.30", 3.8 kg
External Review » MSI GT72S-6QE32SR42BW Tobii
Aorus X5S v5 Camo: Intel Core i7-6700HQ, 15.60", 2.5 kg
External Review » Aorus X5S v5 Camo
Asus G752VY-GC304T: Intel Core i7-6700HQ, 17.30", 4.4 kg
External Review » Asus G752VY-GC304T
Acer Predator 17 G9-791-730K: Intel Core i7-6700HQ, 17.30", 4.1 kg
External Review » Acer Predator 17 G9-791-730K
Alienware 17 R3 A17-9942: Intel Core i7-6820HK, 17.30", 3.8 kg
External Review » Alienware 17 R3 A17-9942
MSI GT72S 6QE-208CZ: Intel Core i7-6820HK, 17.30", 3.8 kg
External Review » MSI GT72S 6QE-208CZ
MSI GT72S-6QE-084FR : Intel Core i7-6700HQ, 17.30", 3.9 kg
External Review » MSI GT72S-6QE-084FR
Asus G752VY-RH71: Intel Core i7-6700HQ, 17.30", 4.5 kg
External Review » Asus G752VY-RH71
Asus GX700VO-GC009T: Intel Core i7-6820HK, 17.30", 3.6 kg
External Review » Asus GX700VO-GC009T
Acer Predator 15 G9-591-70F6: Intel Core i7-6700HQ, 15.60", 5.5 kg
External Review » Acer Predator 15 G9-591-70F6
EVGA SC17: Intel Core i7-6820HK, 17.30", 4 kg
External Review » EVGA SC17
Aorus X5S v5: Intel Core i7-6700HQ, 15.60", 2.5 kg
External Review » Aorus X5S v5
Acer Predator 15 G9-591-74KN: Intel Core i7-6700HQ, 15.60", 3.6 kg
External Review » Acer Predator 15 G9-591-74KN
Asus G752VY-DH78K: Intel Core i7-6820HK, 17.30", 4 kg
External Review » Asus G752VY-DH78K
AVADirect Avant P870DM-G: Intel Core i7-6700K, 17.30", 4.8 kg
External Review » AVADirect Avant P870DM-G
Alienware 17-A17-9942: Intel Core i7-6820HK, 17.30", 3.8 kg
External Review » Alienware 17-A17-9942
Acer Predator 17 G9-791-73EX: Intel Core i7-6700HQ, 17.30", 4 kg
External Review » Acer Predator 17 G9-791-73EX
Sager NP9870-S: Intel Core i7-6700K, 17.30", 4.8 kg
External Review » Sager NP9870-S
Gigabyte P37X v5: Intel Core i7-6700HQ, 17.30", 2.9 kg
External Review » Gigabyte P37X v5
Acer Predator 15 G9-591-71L2: Intel Core i7-6700HQ, 15.60", 3.6 kg
External Review » Acer Predator 15 G9-591-71L2
Asus G752VY-GC263T: Intel Core i7-6700HQ, 17.30", 4.3 kg
External Review » Asus G752VY-GC263T
Lenovo IdeaPad Y900: Intel Core i7-6820HK, 17.30", 4.4 kg
External Review » Lenovo IdeaPad Y900
Gigabyte P35X v5: Intel Core i7-6700HQ, 15.60", 2.6 kg
External Review » Gigabyte P35X v5
MSI GT72S 6QF-036FR: Intel Core i7-6820HK, 17.30", 3.9 kg
External Review » MSI GT72S 6QF-036FR
Acer Predator 15 G9-591-74ZV: Intel Core i7-6700HQ, 15.60", 3.6 kg
External Review » Acer Predator 15 G9-591-74ZV
MSI GT72S-6QE-265UK: Intel Core i7-6820HK, 17.30", 3.8 kg
External Review » MSI GT72S-6QE-265UK
Alienware 15 R2 (Skylake): Intel Core i7-6700HQ, 15.60", 3.1 kg
External Review » Alienware 15 R2 (Skylake)
Medion Erazer X7843-MD9957: Intel Core i7-6700HQ, 17.30", 3.5 kg
External Review » Medion Erazer X7843-MD9957
MSI GT72S 6QE-072RU: Intel Core i7-6820HK, 17.30", 3.8 kg
External Review » MSI GT72S 6QE-072RU
Gigabyte P37x v4: Intel Core i7-5700HQ, 17.30", 2.8 kg
External Review » Gigabyte P37x v4
Acer Predator 17 G9-791-72VU: Intel Core i7-6700HQ, 17.30", 4 kg
External Review » Acer Predator 17 G9-791-72VU
Schenker XMG U706: Intel Core i7-6700K, 17.30", 3.9 kg
External Review » Schenker XMG U706
Schenker XMG P706, Intel Core i7-6700HQ: Intel Core i7-6700HQ, 17.30", 3.2 kg
External Review » Schenker XMG P706, Intel Core i7-6700HQ
MSI GT72S-6QEG16SR421BW: Intel Core i7-6820HK, 17.30", 3.8 kg
External Review » MSI GT72S-6QEG16SR421BW
Asus G751J-DH71: Intel Core i7-4710HQ, 17.30", 4.8 kg
External Review » Asus G751J-DH71
Asus G751JY-T7303H: Intel Core i7-4870HQ, 17.30", 4.8 kg
External Review » Asus G751JY-T7303H
Gigabyte P35X v4: Intel Core i7-5700HQ, 15.60", 2.3 kg
External Review » Gigabyte P35X v4
Asus G751JY-DB72: Intel Core i7-4720HQ, 17.30", 4.8 kg
External Review » Asus G751JY-DB72
MSI GT60 2QE-1223UK: Intel Core i7-4710MQ, 15.60", 3.5 kg
External Review » MSI GT60 2QE-1223UK
Asus G751JY-T7378H: Intel Core i7-4720HQ, 17.30", 4.2 kg
External Review » Asus G751JY-T7378H
MSI GT72-2QE8M16SR21BW: Intel Core i7-5700HQ, 17.30", 3.8 kg
External Review » MSI GT72-2QE8M16SR21BW
Origin PC EON15-S 2015: Intel Core i7-4720HQ, 15.60", 2.5 kg
External Review » Origin PC EON15-S 2015
MSI GT72-2QE16SR21BW: Intel Core i7-5700HQ, 17.30", 3.7 kg
External Review » MSI GT72-2QE16SR21BW
Eurocom P7 Pro: Intel Core i7-5775C, 17.30", 3.9 kg
External Review » Eurocom P7 Pro
Asus G751JY: Intel Core i7-4720HQ, 17.30", 4.2 kg
External Review » Asus G751JY
Eurocom P5 Pro Extreme: Intel Core i7-4790K, 15.60", 3.4 kg
External Review » Eurocom P5 Pro Extreme
AVADirect Menace 17: Intel Core i7-4790K, 17.30", 3.9 kg
External Review » AVADirect Menace 17
Origin PC EON15-X: Intel Core i7-4790K, 15.60", 3.2 kg
External Review » Origin PC EON15-X
Alienware 17 R2: Intel Core i7-4980HQ, 17.30", 3.7 kg
External Review » Alienware 17 R2
Falcon Northwest TLX: Intel Core i7-4910MQ, 15.60", 3.2 kg
External Review » Falcon Northwest TLX
Asus G751JY-DH72X: Intel Core i7-4860HQ, 17.30", 3.8 kg
External Review » Asus G751JY-DH72X
Gigabyte P37X: Intel Core i7-4720HQ, 17.30", 3 kg
External Review » Gigabyte P37X
MSI GT72 2QE-259FR DOMINATOR PRO: Intel Core i7-4710HQ, 17.30", 3.8 kg
External Review » MSI GT72 2QE-259FR DOMINATOR PRO
Asus G751JY-T7009H: Intel Core i7-4710HQ, 17.30", 4.2 kg
External Review » Asus G751JY-T7009H
Schenker XMG P505 PRO: Intel Core i7-4710HQ, 15.60", 2.7 kg
External Review » Schenker XMG P505 PRO
Asus G751JY-T7058H: Intel Core i7-4710HQ, 17.30", 4.5 kg
External Review » Asus G751JY-T7058H
Schenker XMG U505, GTX 980: Intel Core i7-4790S, 15.60", 3.4 kg
External Review » Schenker XMG U505, GTX 980
Asus G751JT-T7033H: Intel Core i7-4710HQ, 17.30", 4.8 kg
External Review » Asus G751JT-T7033H
Asus G751JY-T7012H: Intel Core i7-4860HQ, 17.30", 4.8 kg
External Review » Asus G751JY-T7012H
MSI GT72 2QE-258Fr: Intel Core i7-4710HQ, 17.30", 3.8 kg
External Review » MSI GT72 2QE-258Fr
Clevo P375Sm: Intel Core i7-4910MQ, 17.30", 4.3 kg
External Review » Clevo P375Sm
Gigabyte P35X v3: Intel Core i7-4710HQ, 15.60", 2.5 kg
External Review » Gigabyte P35X v3
Origin PC EON17-S, GTX 980M: Intel Core i7-4910MQ, 17.30", 3.9 kg
External Review » Origin PC EON17-S, GTX 980M
MSI GT72-2QE32SR311BW: Intel Core i7-4710HQ, 17.30", 3.8 kg
External Review » MSI GT72-2QE32SR311BW
Asus G751JY-T7065D: Intel Core i7-4710HQ, 17.30", 4.8 kg
External Review » Asus G751JY-T7065D
MSI GT72 2QE-207UK: Intel Core i7-4710HQ, 17.30", 3.8 kg
External Review » MSI GT72 2QE-207UK
Asus G751JY-DH71: Intel Core i7-4710HQ, 17.30", 3.8 kg
External Review » Asus G751JY-DH71