Notebook reviews with NVIDIA GeForce RTX 2070 Max-Q graphics card
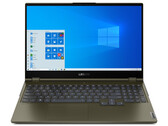
Lenovo Legion C7 15IMH05 Review: All-rounder for gamers and creators with three years of warranty
The Legion C7 can run all current titles smoothly at 1080p. It comes with the Core i7-10875H, RTX 2070 Max-Q, 32 GB of dual-channel RAM, 1 TB NVMe SSD, and a Thunderbolt 3 port. It gets neither too loud nor too hot.
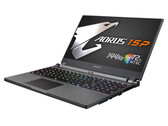
Intel Core i7-10875H, NVIDIA GeForce RTX 2070 Max-Q, 15.6", 2.3 kgAorus 15P WB in review: Compact gaming powerhouse offers very good battery life
The Aorus 15P WB brings all modern computer games smoothly onto the screen (Full HD, IPS, 144 Hz). In addition, there's an NVMe SSD, 16 GB of RAM (dual-channel mode), and battery runtimes that many office laptops can't reach.
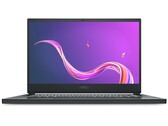
Intel Core i7-10750H, NVIDIA GeForce RTX 2070 Max-Q, 15.6", 2.1 kgMSI Creator 15 Laptop Review: A bright 4K display for Content Creators
The MSI Creator 15 is directed at creative users but might also be interesting for gamers. The RTX GPU plus two RAID SSDs provide sufficient speed and graphics performance for it. Find out what kind of performance you can expect from this combination with Intel's Core i7-10875H and 16 GB of RAM in our review.
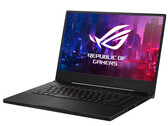
Intel Core i7-10875H, NVIDIA GeForce RTX 2070 Max-Q, 15.6", 1.9 kgAsus ROG Zephyrus M15 GU502L in review: Compact gaming notebook with Turbo reserves
The Zephyrus M15's main components bring all the latest computer games smoothly to the 15.6-inch matte screen (4k, IPS, Pantone certified). The rest of the interior is equally good: 2x NVMe-SSD (RAID 0), 16 GB RAM (dual channel), Thunderbolt 3.
Intel Core i7-10750H, NVIDIA GeForce RTX 2070 Max-Q, 15.6", 2 kgMSI GS75 Stealth 10SF Laptop Review: Great Core i7-10875H Performance
It may be stealthy by name, but it's anything but when gaming due to its loud fans. MSI has refreshed its premier ultra-thin 17.3-inch gaming laptop with both 10th gen Intel Core CPU and GeForce Super options for slightly faster performance than last year's Coffee Lake-H SKUs.
Intel Core i7-10875H, NVIDIA GeForce RTX 2070 Max-Q, 17.3", 2.3 kgRazer Blade Pro 17 RTX 2070 Max-Q 300 Hz: Intel Core i7-10875H, 17.30", 2.7 kg
Review » 2020 Razer Blade Pro 17 Review: Do you Really Need a 300 Hz Laptop?
Razer Blade 15 RZ09-0328: Intel Core i7-10750H, 15.60", 2.1 kg
Review » 2020 Razer Blade 15 Base Model Laptop Review: The 10th Gen Intel Comet Lake-H Update
Schenker XMG Neo 15 XNE15M19: Intel Core i7-9750H, 15.60", 2.1 kg
Review » Schenker XMG Neo 15 (Tongfang GK5CQ7Z) Laptop Review: A gaming laptop with slim bezels
Dell G5 15 5590-P8RVW: Intel Core i7-9750H, 15.60", 2.8 kg
Review » Dell G5 15 5590 Laptop Review: 15-inch gaming notebook with a Max-Q GPU
Lenovo Legion Y740-15ICHg: Intel Core i7-9750H, 15.60", 2.3 kg
Review » Lenovo Legion Y740 Laptop Review: Only a small CPU upgrade
Schenker XMG Fusion 15 XFU15L19: Intel Core i7-9750H, 15.60", 1.9 kg
Review » Schenker XMG Fusion 15 in Review: Intel's reference design challenges the competition
HP Omen X 2S 15-dg0075cl: Intel Core i7-9750H, 15.60", 2.4 kg
Review » Double Trouble: HP Omen X 2S 15 Laptop Review
Gigabyte Aero 17 XA RP77: Intel Core i9-9980HK, 17.30", 2.5 kg
Review » Gigabyte Aero 17 XA HDR Laptop Review: This is a *Really* Good 17-inch Laptop
Acer Predator Triton 500 PT515-51-71PZ: Intel Core i7-9750H, 15.60", 2.1 kg
Review » Acer Predator Triton 500 Laptop Review: A Lot of Gaming Performance Despite the Slim Case
Gigabyte Aero 15 OLED XA: Intel Core i7-9750H, 15.60", 2.2 kg
Review » Gigabyte Aero 15 XA Laptop Review: With OLED panel and 4K in a new design
HP Omen 15-dc1303ng: Intel Core i7-8750H, 15.60", 2.4 kg
Review » HP Omen 15 Laptop Review: GeForce RTX 2070 Max-Q and 144 Hz gaming
Dell G7 17 7790: Intel Core i7-8750H, 17.30", 3.2 kg
Review » Dell G7 17 7790 (i7-8750H, RTX 2070 Max-Q) Laptop Review
Alienware m15 P79F: Intel Core i7-8750H, 15.60", 2.2 kg
Review » Alienware m15 P79F (i7-8750H, RTX 2070 Max-Q, OLED) Review
CUK Model Z GK5CQ7Z: Intel Core i7-9750H, 15.60", 2.2 kg
Review » CUK Model Z (i7 9750H, RTX 2070 Max-Q) Tongfang GK5CQ7Z Laptop Review
MSI P65 Creator 9SF-657: Intel Core i9-9880H, 15.60", 1.9 kg
Review » MSI P65 Creator 9SF (i9-9880H, RTX2070 Max-Q) Laptop Review
Gigabyte Aero 15 Classic-XA: Intel Core i7-9750H, 15.60", 2.1 kg
Review » Gigabyte Aero 15 Classic-XA (i7-9750H, RTX 2070 Max-Q) Laptop Review
Schenker XMG Neo 15 Turing: Intel Core i7-8750H, 15.60", 2 kg
Review » Schenker XMG Neo 15 (i7-8750H, RTX 2070 Max-Q) Tongfang GK5CQ7Z Laptop Review
Lenovo Legion Y740-15ICHg: Intel Core i7-8750H, 15.60", 2.3 kg
Review » Lenovo Legion Y740-15ICH (i7-8750H, RTX 2070 Max-Q) Laptop Review
Gigabyte Aero 15-X9: Intel Core i7-8750H, 15.60", 2.1 kg
Review » Gigabyte Aero 15-X9 (Core i7-8750H, RTX 2070 Max-Q) Laptop Review
Razer Blade 15 RTX 2070 Max-Q: Intel Core i7-8750H, 15.60", 2.1 kg
Review » Razer Blade 15 Advanced Model (RTX 2070 Max-Q, FHD) Laptop Review
Acer ConceptD 7 Ezel CC715-71-789C: Intel Core i7-10875H, 15.60", 2.5 kg
External Review » Acer ConceptD 7 Ezel CC715-71-789C
Dell G5 15 5500-ND60C: Intel Core i7-10750H, 15.60", 2.4 kg
External Review » Dell G5 15 5500-ND60C
HP Omen 15-ek0039ur: Intel Core i7-10750H, 15.60", 2.5 kg
External Review » HP Omen 15-ek0039ur
Gigabyte Aero 15 WB-7ES1130SH: Intel Core i7-10750H, 15.60", 2 kg
External Review » Gigabyte Aero 15 WB-7ES1130SH
Lenovo Legion C7 15IMH05 82EH0030GE: Intel Core i7-10875H, 15.60", 2.3 kg
External Review » Lenovo Legion C7 15IMH05 82EH0030GE
HP Omen 15-ek0009nw: Intel Core i7-10750H, 15.60", 2.4 kg
External Review » HP Omen 15-ek0009nw
Gigabyte Aero 15 OLED WB-8NL5130SP: Intel Core i7-10875H, 15.60", 2 kg
External Review » Gigabyte Aero 15 OLED WB-8NL5130SP
HP Omen 15-ek0003np: Intel Core i7-10750H, 15.60", 2.4 kg
External Review » HP Omen 15-ek0003np
HP Omen 15-ek0001nc: Intel Core i7-10750H, 15.60", 2.5 kg
External Review » HP Omen 15-ek0001nc
Asus ROG Zephyrus M15 GU502LW-HC201T: Intel Core i7-10875H, 15.60", 2 kg
External Review » Asus ROG Zephyrus M15 GU502LW-HC201T
Acer Predator Helios 300 PH315-53-77M4: Intel Core i7-10750H, 15.60", 2.5 kg
External Review » Acer Predator Helios 300 PH315-53-77M4
HP ZBook Create G7, Core i9 RTX 2070 Max-Q: Intel Core i9-10885H, 15.60", 1.9 kg
External Review » HP ZBook Create G7, Core i9 RTX 2070 Max-Q
HP ZBook Create G7, Core i7 RTX 2070 Max-Q: Intel Core i7-10750H, 15.60", 1.9 kg
External Review » HP ZBook Create G7, Core i7 RTX 2070 Max-Q
Aorus 15P WB: Intel Core i7-10750H, 15.60", 2.1 kg
External Review » Aorus 15P WB
Lenovo Legion 7 15IMH05-81YT000SGE: Intel Core i7-10750H, 15.60", 2.3 kg
External Review » Lenovo Legion 7 15IMH05-81YT000SGE
MSI Creator 15 A10SF-008: Intel Core i7-10875H, 15.60", 2.1 kg
External Review » MSI Creator 15 A10SF-008
Medion Erazer X17805: Intel Core i7-9750H, 17.30", 2.6 kg
External Review » Medion Erazer X17805
HP Omen 15-ek0277ng: Intel Core i7-10750H, 15.60", 2.4 kg
External Review » HP Omen 15-ek0277ng
Acer Predator Helios 300 PH315-53-70HR: Intel Core i7-10750H, 15.60", 2.2 kg
External Review » Acer Predator Helios 300 PH315-53-70HR
Asus ROG Zephyrus M15 GU502LWS: Intel Core i7-10750H, 15.60", 2 kg
External Review » Asus Zephyrus M15 GU502LWS
MSI Creator 17 A10SF-270: Intel Core i7-10875H, 17.30", 2.5 kg
External Review » MSI Creator 17 A10SF-270
Razer Blade 15 Base Model 2020, i7-10750H, RTX 2070 Max-Q: Intel Core i7-10750H, 15.60", 2.1 kg
External Review » Razer Blade 15 Base Model 2020, i7-10750H, RTX 2070 Max-Q
MSI GS66 Stealth 10SF-067: Intel Core i7-10750H, 15.60", 2.1 kg
External Review » MSI GS66 Stealth 10SF-067
Acer Predator Triton 300 PT315-52: Intel Core i7-10750H, 15.60", 2.3 kg
External Review » Acer Predator Triton 300 PT315-52
Razer Blade Pro 17 RTX 2070 Max-Q 300 Hz: Intel Core i7-10875H, 17.30", 2.7 kg
External Review » Razer Blade Pro 17 RTX 2070 Max-Q 300 Hz
MSI GS66 10SF-067 Stealth: Intel Core i7-10750H, 15.60", 2.1 kg
External Review » MSI GS66 10SF-067 Stealth
Gigabyte Aero 17 HDR XA-9UK4130SQ: Intel Core i9-9980HK, 17.30", 2.5 kg
External Review » Gigabyte Aero 17 HDR XA-9UK4130SQ
Aorus 15G WB-8DE2130MD: Intel Core i7-10875H, 15.60", 2.2 kg
External Review » Aorus 15G WB-8DE2130MD
Alienware m17 R2-C1DGG: Intel Core i7-9750H, 17.30", 2.6 kg
External Review » Alienware m17 R2-C1DGG
MSI GS75 Stealth-243: Intel Core i7-9750H, 17.30", 2.3 kg
External Review » MSI GS75 Stealth-243
Acer Predator Triton 500 PT515-51-72QK: Intel Core i7-9750H, 15.60", 2 kg
External Review » Acer Predator Triton 500 PT515-51-72QK
Gigabyte Aero 15 XB-7DE1130SH: Intel Core i7-10750H, 15.60", 2 kg
External Review » Gigabyte Aero 15 XB-7DE1130SH
Gigabyte Aero 17 XA-7DE4130SP: Intel Core i7-9750H, 17.30", 2.5 kg
External Review » Gigabyte Aero 17 XA-7DE4130SP
Dell G5 15 5590-P8RVW: Intel Core i7-9750H, 15.60", 2.8 kg
External Review » Dell G5 15 5590-P8RVW
Schenker XMG Neo 15 XNE15M19: Intel Core i7-9750H, 15.60", 2.1 kg
External Review » Schenker XMG Neo 15 XNE15M19
HP Omen 15-dh0011ng: Intel Core i7-9750H, 15.60", 2.6 kg
External Review » HP Omen 15-dh0011ng
Alienware m15 R2-390W9: Intel Core i7-9750H, 15.60", 2.2 kg
External Review » Alienware m15 R2-390W9
Razer Blade 15 RTX 2070 Max-Q, i7-9750H: Intel Core i7-9750H, 15.60", 2.2 kg
External Review » Razer Blade 15 RTX 2070 Max-Q, i7-9750H
Schenker XMG Fusion 15 XFU15L19: Intel Core i7-9750H, 15.60", 1.9 kg
External Review » Schenker XMG Fusion 15 XFU15L19
Gigabyte Aero 17 XA RP77: Intel Core i9-9980HK, 17.30", 2.5 kg
External Review » Gigabyte Aero 17 XA RP77
MSI GS65 9SF-445: Intel Core i7-9750H, 15.60", 1.9 kg
External Review » MSI GS65 9SF-445
Lenovo Legion Y740-17ICHg-81UJ001UGE: Intel Core i7-9750H, 17.30", 2.9 kg
External Review » Lenovo Legion Y740-17ICHg-81UJ001UGE
HP Omen X 2S 15-dg0075cl: Intel Core i7-9750H, 15.60", 2.4 kg
External Review » HP Omen X 2S 15-dg0075cl
HP Omen 15-dc1303ng: Intel Core i7-8750H, 15.60", 2.4 kg
External Review » HP Omen 15-dc1303ng
Acer Predator Triton 500 PT515-51-71PZ: Intel Core i7-9750H, 15.60", 2.1 kg
External Review » Acer Predator Triton 500 PT515-51-71PZ
Gigabyte Aero 15 OLED XA: Intel Core i7-9750H, 15.60", 2.2 kg
External Review » Gigabyte Aero 15 OLED XA
MSI P65 Creator 9SF-657: Intel Core i9-9880H, 15.60", 1.9 kg
External Review » MSI P65 Creator 9SF-657
Razer Blade Pro 17 RTX 2070 Max-Q : Intel Core i7-9750H, 17.30", 2.8 kg
External Review » Razer Blade Pro 17 RTX 2070 Max-Q
Acer Predator Triton 500 PT515-51-70GK: Intel Core i7-9750H, 15.60", 2.1 kg
External Review » Acer Predator Triton 500 PT515-51-70GK
Medion Erazer X15805: Intel Core i9-8950HK, 15.60", 2.1 kg
External Review » Medion Erazer X15805
Lenovo Legion Y740-15ICHg: Intel Core i7-8750H, 15.60", 2.3 kg
External Review » Lenovo Legion Y740-15ICHg
MSI GS65 8SF-057: Intel Core i7-8750H, 15.60", 1.9 kg
External Review » MSI GS65 8SF-057
Dell G7 17 7790: Intel Core i7-8750H, 17.30", 3.2 kg
External Review » Dell G7 17 7790
Schenker XMG Neo 15 Turing: Intel Core i7-8750H, 15.60", 2 kg
External Review » Schenker XMG Neo 15 Turing
Alienware m15 P79F: Intel Core i7-8750H, 15.60", 2.2 kg
External Review » Alienware m15 P79F
Lenovo Legion Y740-15CHg-81HE0041GE: Intel Core i7-8750H, 15.60", 2.2 kg
External Review » Lenovo Legion Y740-15CHg-81HE0041GE
Medion Erazer X15805: Intel Core i7-8750H, 15.60", 2.2 kg
External Review » Medion Erazer X15805
Lenovo Legion Y740-15ICHg-81HE0044GE: Intel Core i7-8750H, 15.60", 2.2 kg
External Review » Lenovo Legion Y740-15ICHg-81HE0044GE
Lenovo Legion Y740-15ICHg-81HE0004US: Intel Core i7-8750H, 15.60", 2.2 kg
External Review » Lenovo Legion Y740-15ICHg-81HE0004US
Gigabyte Aero 15 Classic-XA: Intel Core i7-9750H, 15.60", 2.1 kg
External Review » Gigabyte Aero 15 Classic-XA
MSI GS75 8SF-071: Intel Core i7-8750H, 17.30", 2.3 kg
External Review » MSI GS75 8SF-071
Alienware m15-KV74W: Intel Core i7-8750H, 15.60", 2.2 kg
External Review » Alienware m15-KV74W
MSI GS75 8SF-005NL: Intel Core i7-8750H, 17.30", 2.3 kg
External Review » MSI GS75 8SF-005NL
Asus Zephyrus S GX531GW-ES035R: Intel Core i7-8750H, 15.60", 2.1 kg
External Review » Asus Zephyrus S GX531GW-ES035R
Lenovo Legion Y740-17ICHG-81HH0012GE: Intel Core i7-8750H, 17.30", 2.9 kg
External Review » Lenovo Legion Y740-17ICHG-81HH0012GE
MSI GS65 Stealth 8SF-051FR: Intel Core i7-8750H, 15.60", 1.9 kg
External Review » MSI GS65 Stealth 8SF-051FR
Lenovo Legion Y740-15CHg-81HE000RCK: Intel Core i7-8750H, 15.60", 2.2 kg
External Review » Lenovo Legion Y740-15CHg-81HE000RCK
Alienware m17-XW6MJ: Intel Core i7-8750H, 17.30", 2.6 kg
External Review » Alienware m17-XW6MJ
Gigabyte Aero 15-X9: Intel Core i7-8750H, 15.60", 2.1 kg
External Review » Gigabyte Aero 15-X9
Razer Blade 15 RTX 2070 Max-Q: Intel Core i7-8750H, 15.60", 2.1 kg
External Review » Razer Blade 15 RTX 2070 Max-Q
MSI GS75 10SF-609US: Intel Core i7-10875H, 17.30", 2.3 kg
Article » Staying secure in the new normal: How AMD Ryzen Pro processors ensure 24x7 protection for your critical data
Article » MSI laptops are the ideal Holiday season gifts for the avid gamer or content producer in your life
Alienware m15 P79F: Intel Core i7-8750H, 15.60", 2.2 kg
Article » Looking to buy an OLED laptop this year? Here's what you need to know
Gigabyte Aero 15 WB-7ES1130SH: Intel Core i7-10750H, 15.60", 2 kg
» Gigabyte Aero 15 OLED XD: Flagship for creators and gamers
Lenovo Legion C7 15IMH05 82EH0030GE: Intel Core i7-10875H, 15.60", 2.3 kg
» The Lenovo Legion C7 15IMH05 stays quiet and cool
Aorus 15P WB: Intel Core i7-10750H, 15.60", 2.1 kg
» Gigabyte focuses on the essentials with the Aorus 15P WB gaming laptop.
MSI Creator 15: Intel Core i7-10875H, 15.60", 1.9 kg
» MSI Creator 15: Good system performance meets bright UHD panel
Asus ROG Zephyrus M15 GU502L: Intel Core i7-10750H, 15.60", 2 kg
» The slim Asus ROG Zephyrus M15 GU502L features a convincing 4k screen
MSI GS75 10SF-609US: Intel Core i7-10875H, 17.30", 2.3 kg
» The biggest strength of the MSI GS75 is also responsible for its biggest weakness
Razer Blade Pro 17 RTX 2070 Max-Q 300 Hz: Intel Core i7-10875H, 17.30", 2.7 kg
» After testing over two dozen gaming laptops with the GeForce RTX 2070 Max-Q, the 2020 Razer Blade Pro 17 comes out to be the fastest of them all
» In an embarrassment for Nvidia, the cheaper GeForce RTX 2070 Max-Q can outperform some GeForce RTX 2080 Super Max-Q laptops
Razer Blade 15 RZ09-0328: Intel Core i7-10750H, 15.60", 2.1 kg
» Here are all the differences between the 2019 and 2020 Razer Blade 15 models in one table