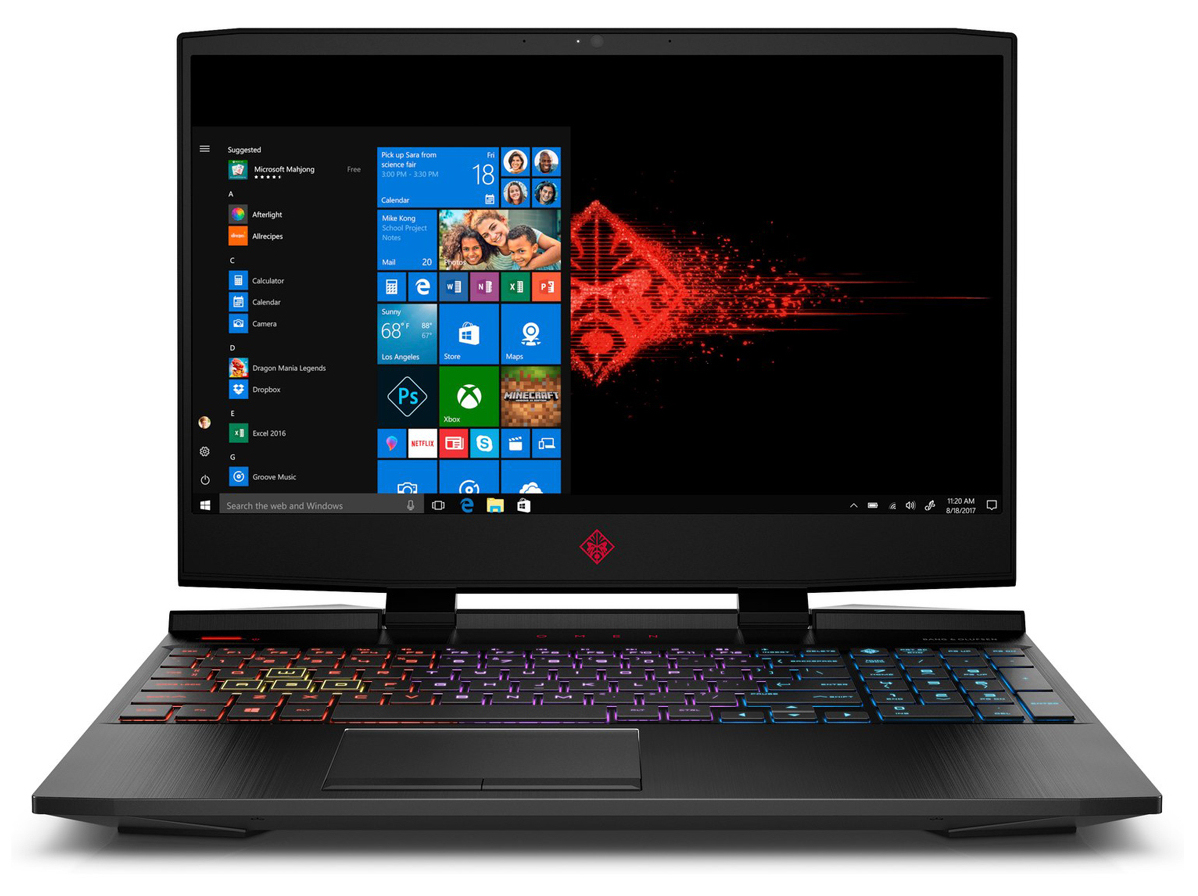
HP Omen 15 Laptop Review: GeForce RTX 2070 Max-Q and 144 Hz gaming

HP last redesigned the Omen 15 almost a year ago. Since then we have reviewed the Omen 15-dc0001ng, a laptop powered by an Intel Core i5-8300H processor and an NVIDIA GeForce GTX 1050 Ti GPU, and the Omen 15-dc0015ng, its more-powerful sibling. The latter has the more powerful combination of the Core i7-8750H and GeForce GTX 1070 Max-Q GPU, but neither device was great value for money.
Now is the turn of the dc1303ng, a 2,000-Euro (~US$2,279) variant equipped with the same display as its siblings and the same CPU as the dc0015ng, but with a GeForce RTX 2070 Max-Q GPU instead. HP rounds off the system with 16 GB of DDR4 RAM, a 256 GB SSD and a 1 TB HDD.
We will compare our review unit against its Omen 15 siblings and other comparably priced 15.6-inch gaming laptops. Our comparison devices will include the Alienware m15 P79F, Aorus 15 X9, and Dell G5 15 5590. You can add other devices to our comparison tables too.
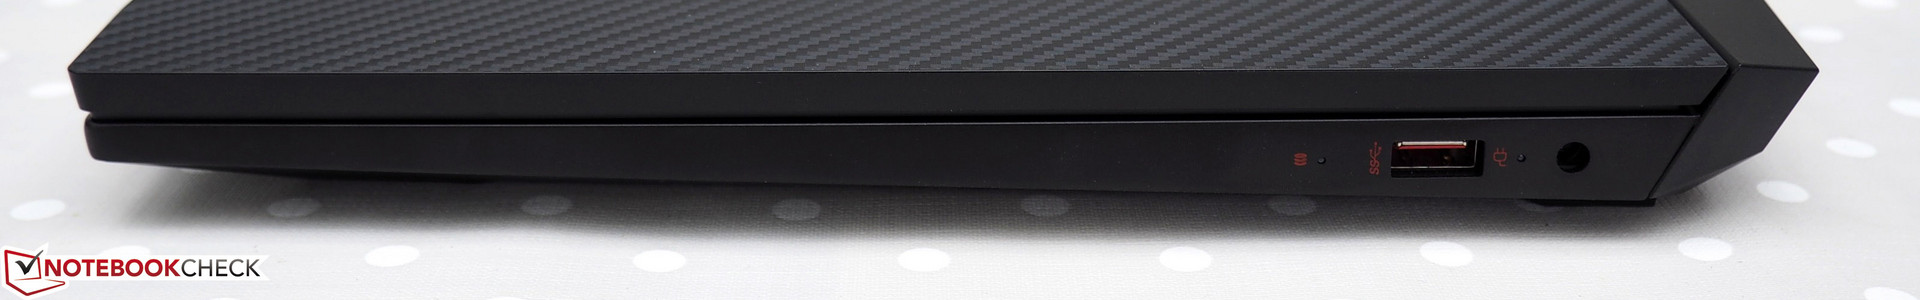
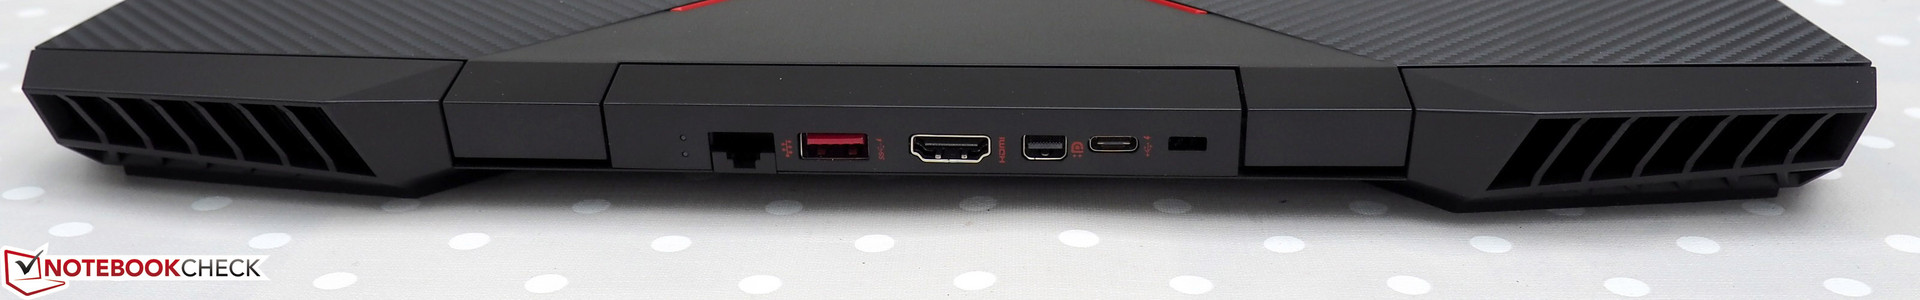
Case & Connectivity
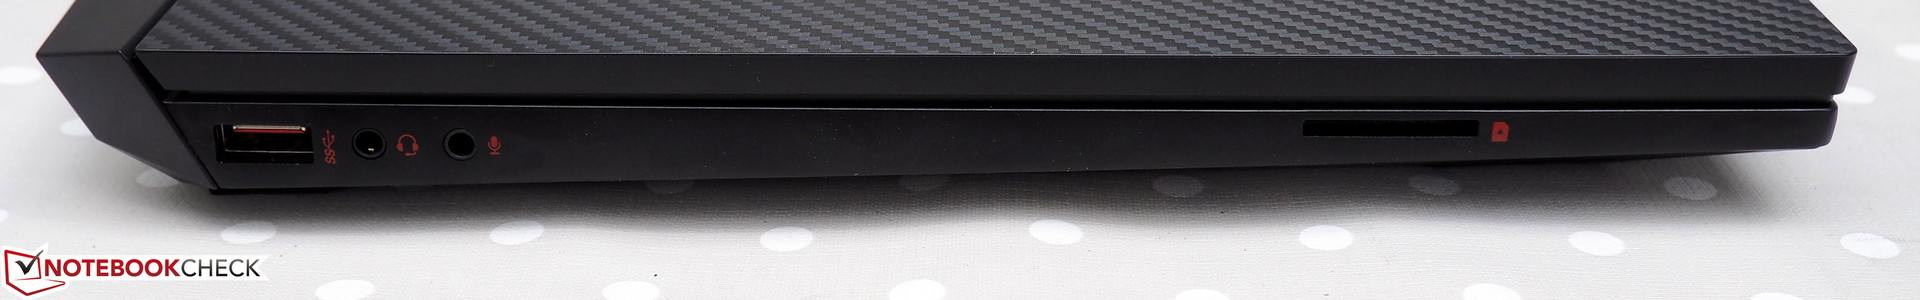
| SD Card Reader | |
| average JPG Copy Test (av. of 3 runs) | |
| Average of class Gaming (20.9 - 210, n=55, last 2 years) | |
| Aorus 15 X9 (Toshiba Exceria Pro M501 64 GB UHS-II) | |
| HP Omen 15-dc0015ng (Toshiba Exceria Pro SDXC 64 GB UHS-II) | |
| HP Omen 15-dc1303ng (Toshiba Exceria Pro SDXC 64 GB UHS-II) | |
| Dell G5 15 5590 (Toshiba Exceria Pro SDXC 64 GB UHS-II) | |
| maximum AS SSD Seq Read Test (1GB) | |
| Average of class Gaming (25.5 - 261, n=52, last 2 years) | |
| Aorus 15 X9 (Toshiba Exceria Pro M501 64 GB UHS-II) | |
| HP Omen 15-dc0015ng (Toshiba Exceria Pro SDXC 64 GB UHS-II) | |
| HP Omen 15-dc1303ng (Toshiba Exceria Pro SDXC 64 GB UHS-II) | |
| Dell G5 15 5590 (Toshiba Exceria Pro SDXC 64 GB UHS-II) | |
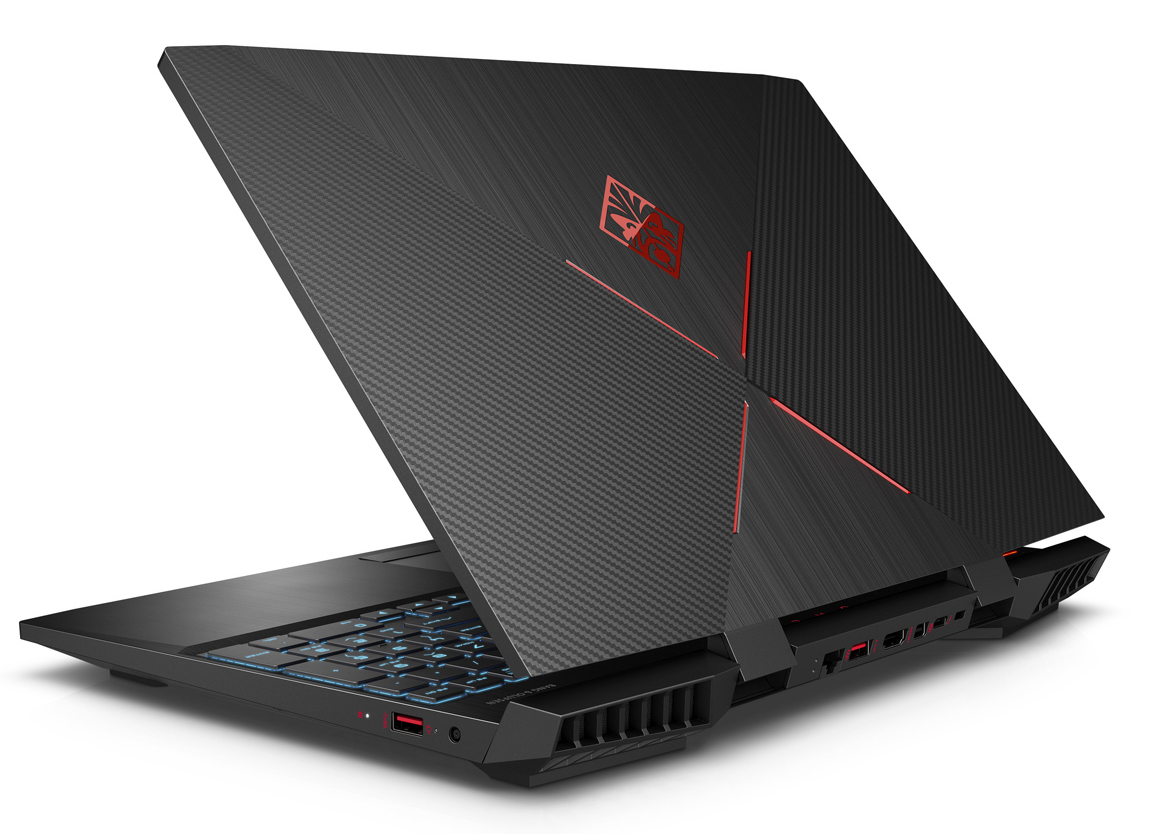
Communication
The dc1303ng supports Gigabit LAN and modern Wi-Fi standards up to IEEE 802.11ac. HP equips it with a 2x2 MIMO antenna, which helped our review unit average over 600 Mb/s in the iperf3 Client Wi-Fi tests to which we subjected it. In short, the Wi-Fi card will not bottleneck online gaming sessions.
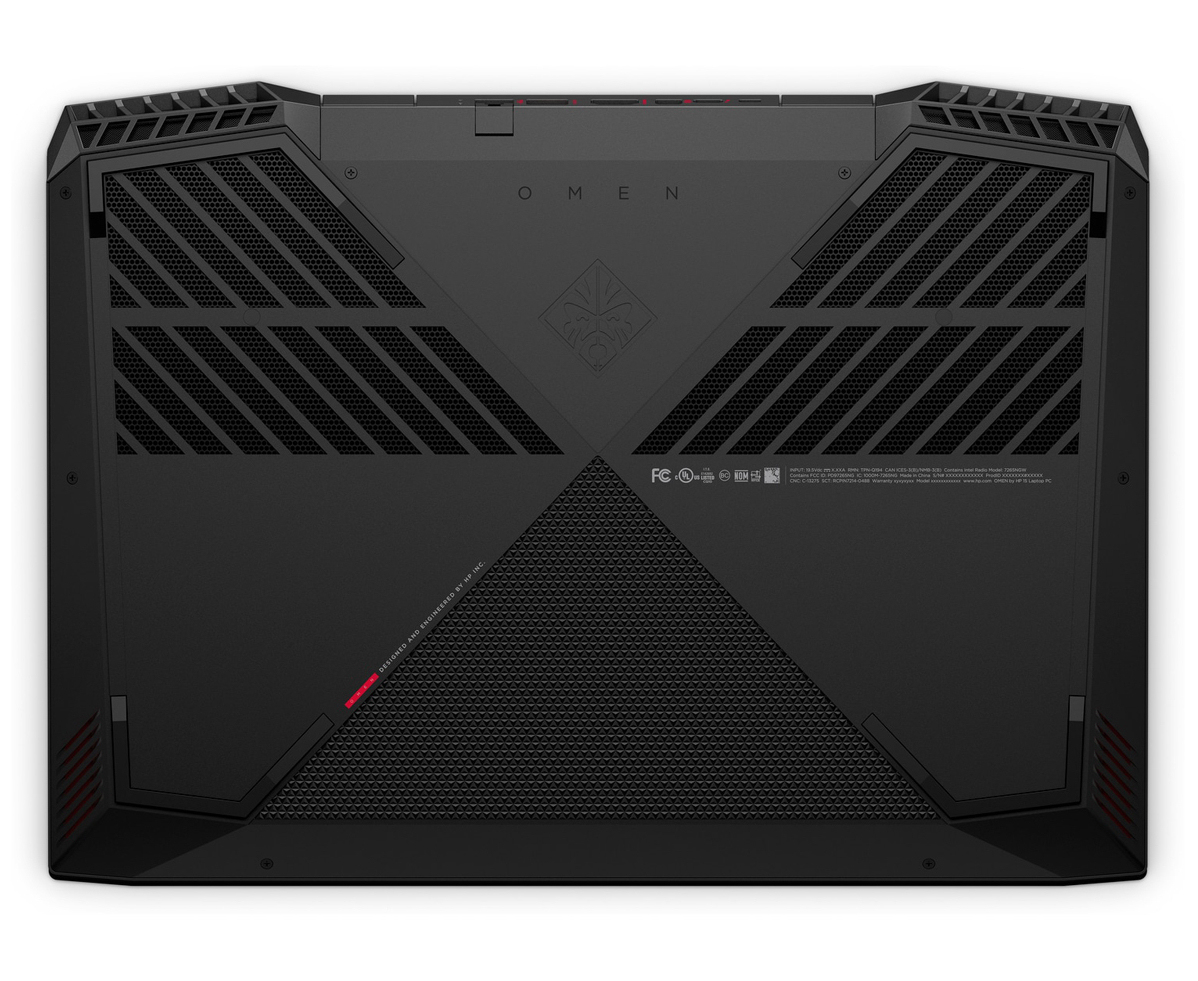
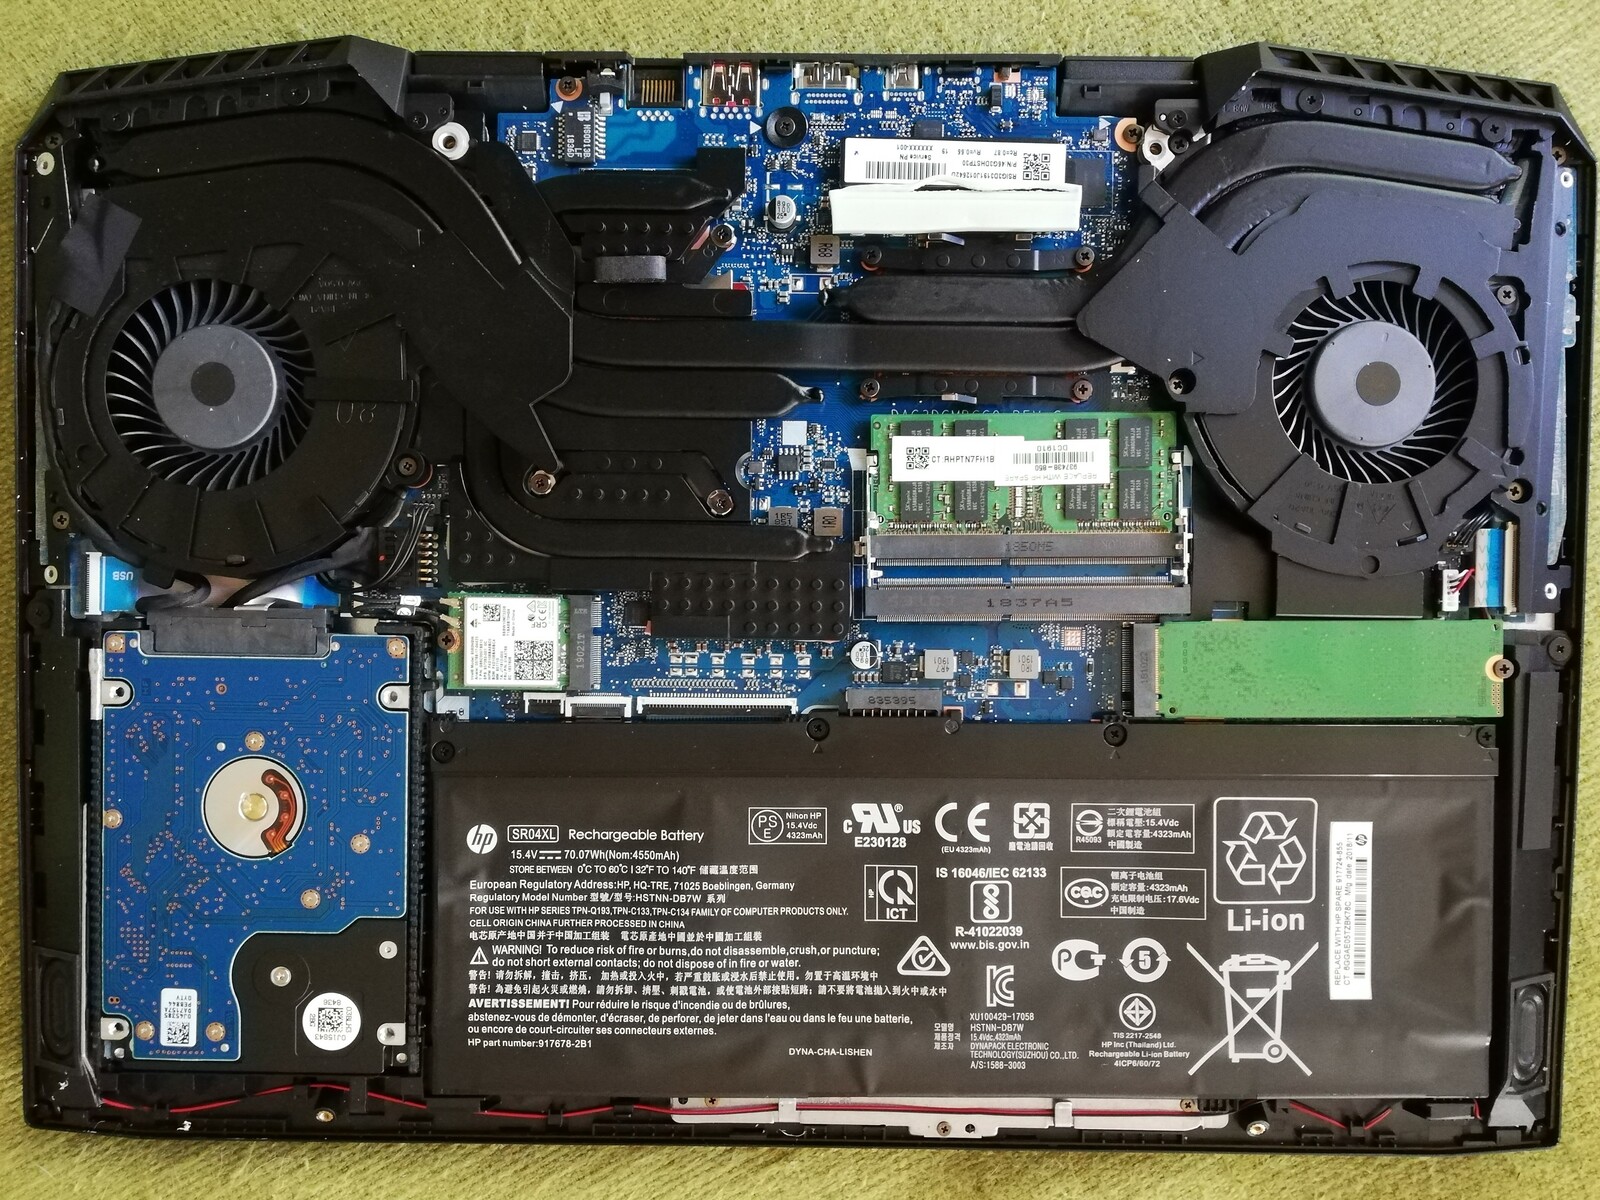
Maintenance
The Omen 15 does not have a maintenance cover for accessing the RAM or SSD like some business laptops do, but you can still access its internal components. Doing so requires some skill though, as it can prove tricky to pry the bottom plate from the rest of the device once the screws holding them together are removed. You can switch the HDD, SSD, RAM and Wi-Fi card when you do though.
Warranty
All Omen 15 variants come with a 24-month limited manufacturer’s warranty. Please see our Guarantees, Return Policies and Warranties FAQ for country-specific information.
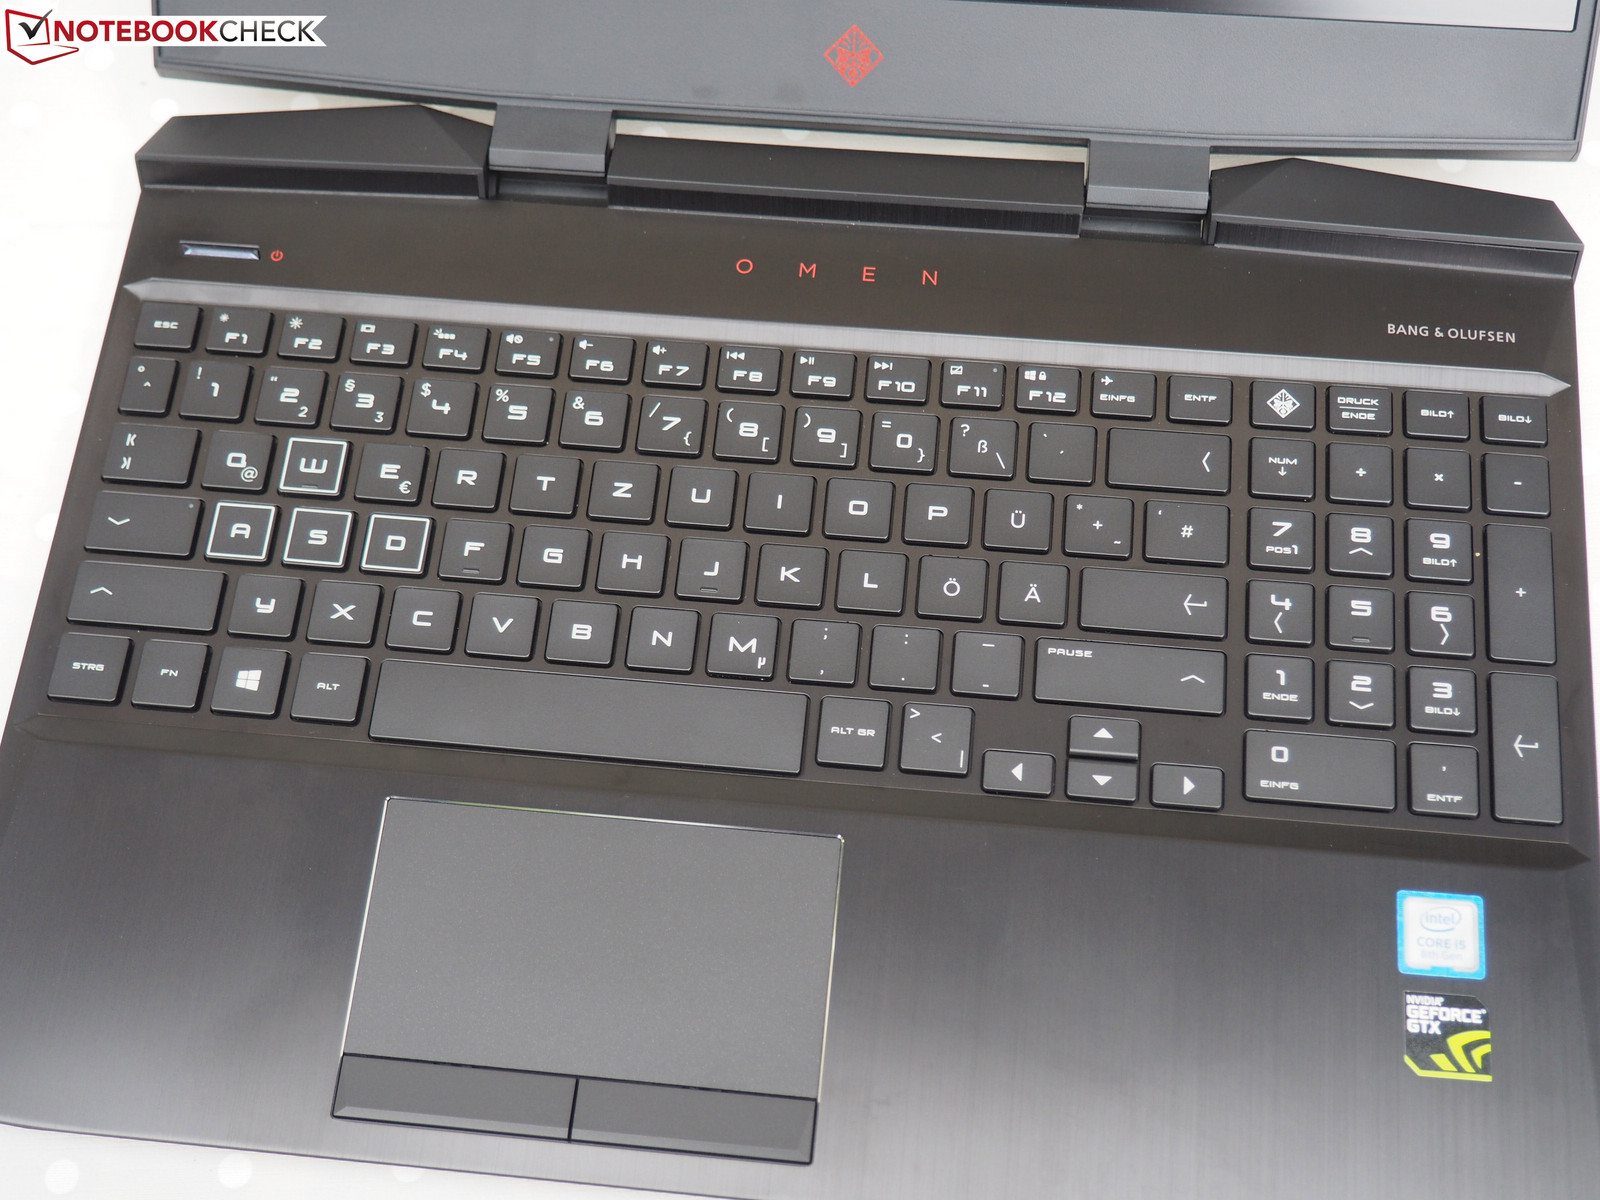
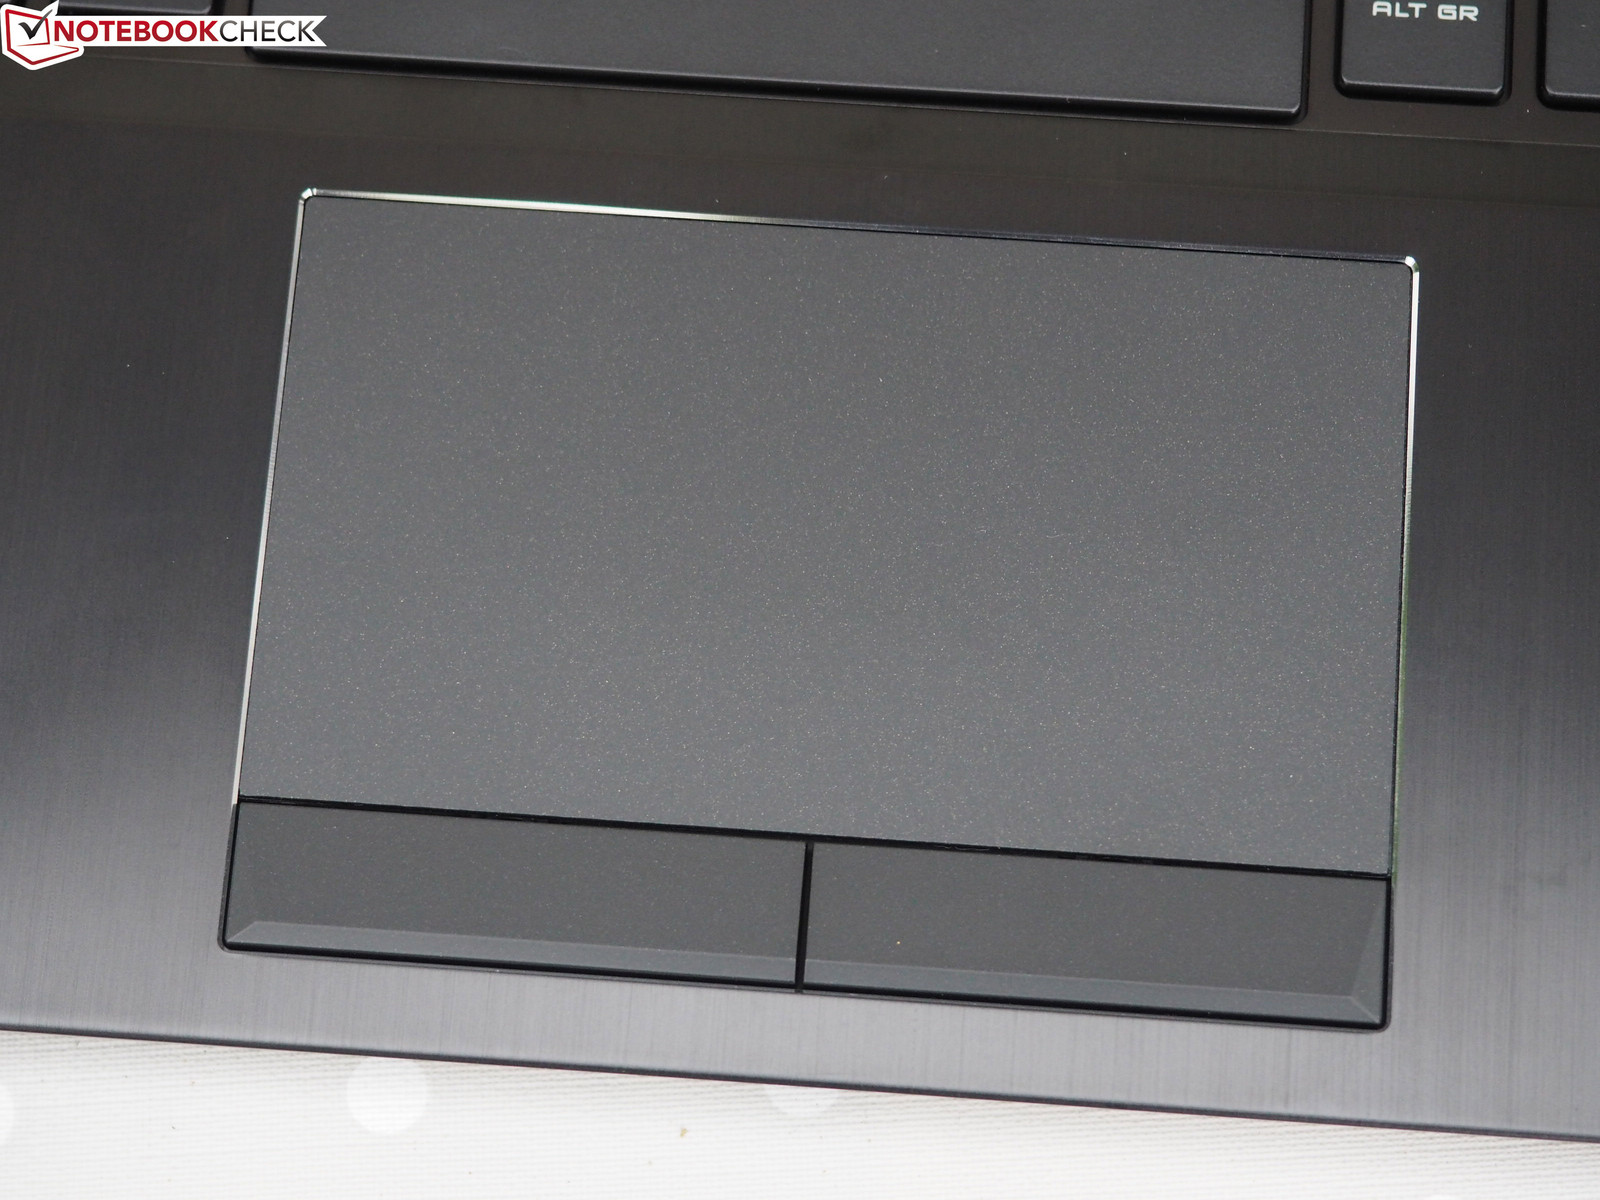
Input Devices
The dc1303ng also has the same keyboard and trackpad as its Omen 15 siblings. Please see our dc0001ng review for our thoughts on these areas.
Display

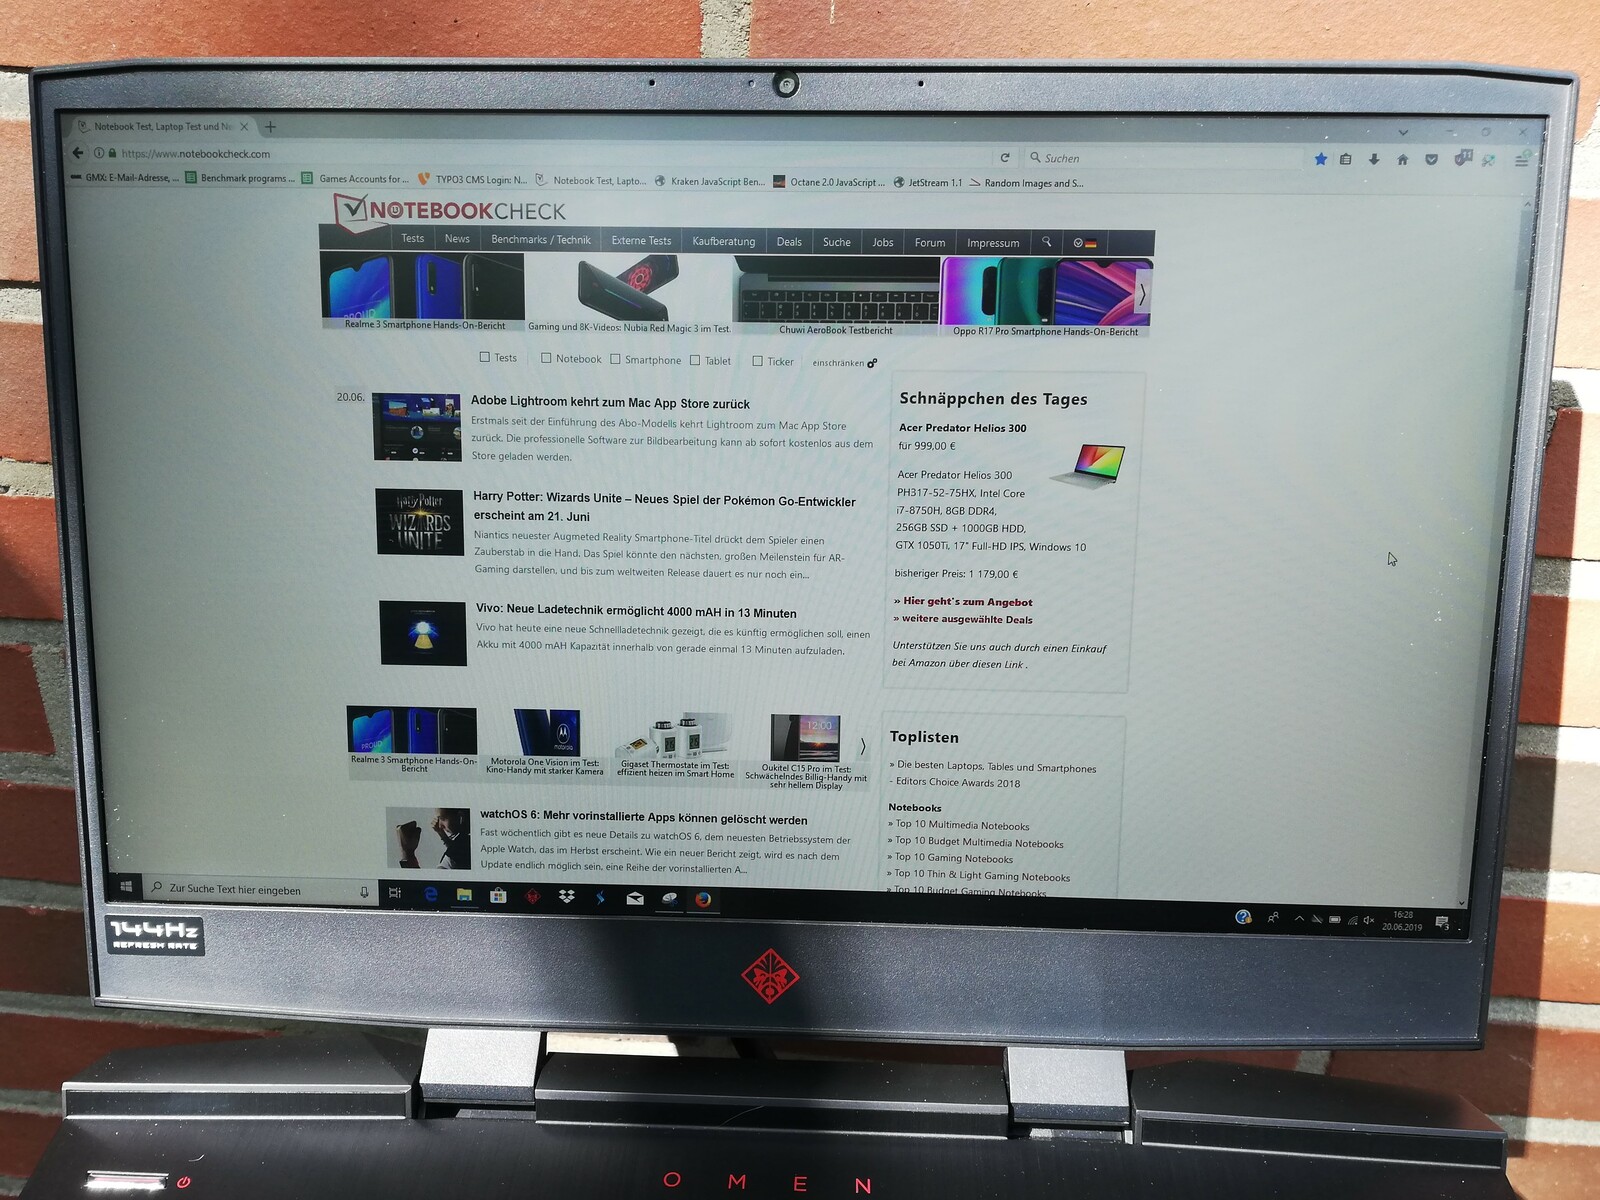
HP equips the dc1303ng with the same 15.6-inch IPS panel as in the dc0015ng. The LG Philips LGD05C0 runs natively at 1920x1080 with a 144 Hz refresh rate and achieved an average maximum brightness of 295 cd/m² according to X-Rite i1Pro 2. The panel falls just short of our 300 cd/m² threshold that we think all modern displays should achieve, but it is noticeably more evenly lit than the panel in the dc0015ng.
Please keep in mind that all displays are unique, so your dc1303ng may not get as bright or be as evenly lit as our review unit is. Positively, no LGD05C0 uses pulse-width modulation (PWM) to regulate brightness, so you should not experience eye strain or headaches when gaming for prolonged periods.
| |||||||||||||||||||||||||
Brightness Distribution: 84 %
Center on Battery: 324 cd/m²
Contrast: 752:1 (Black: 0.42 cd/m²)
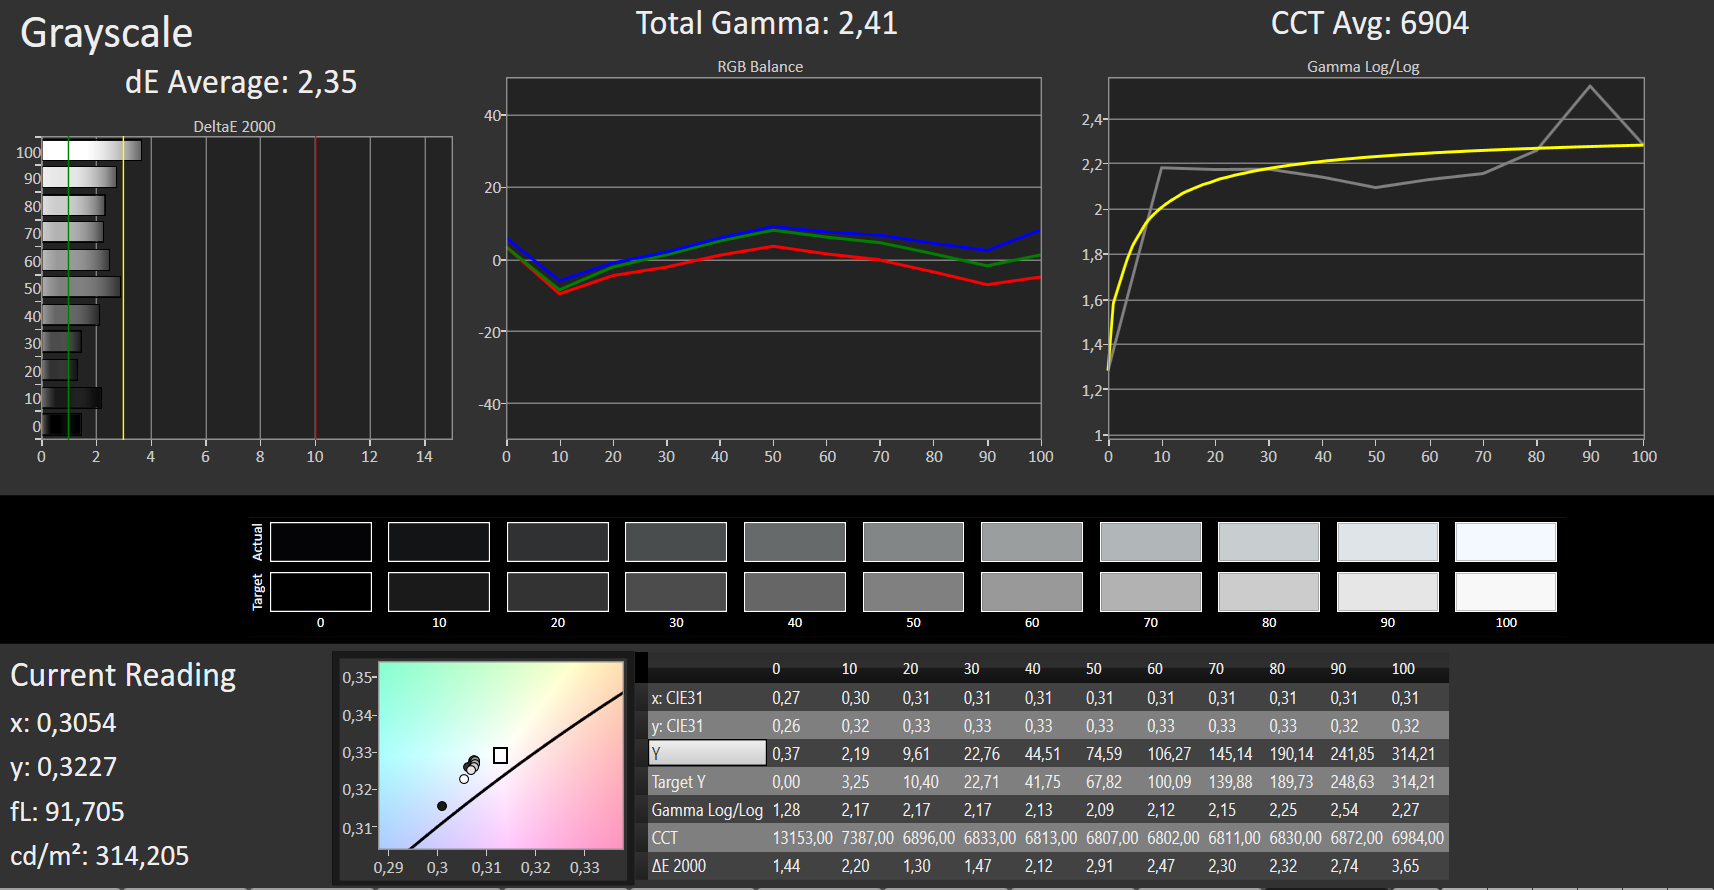
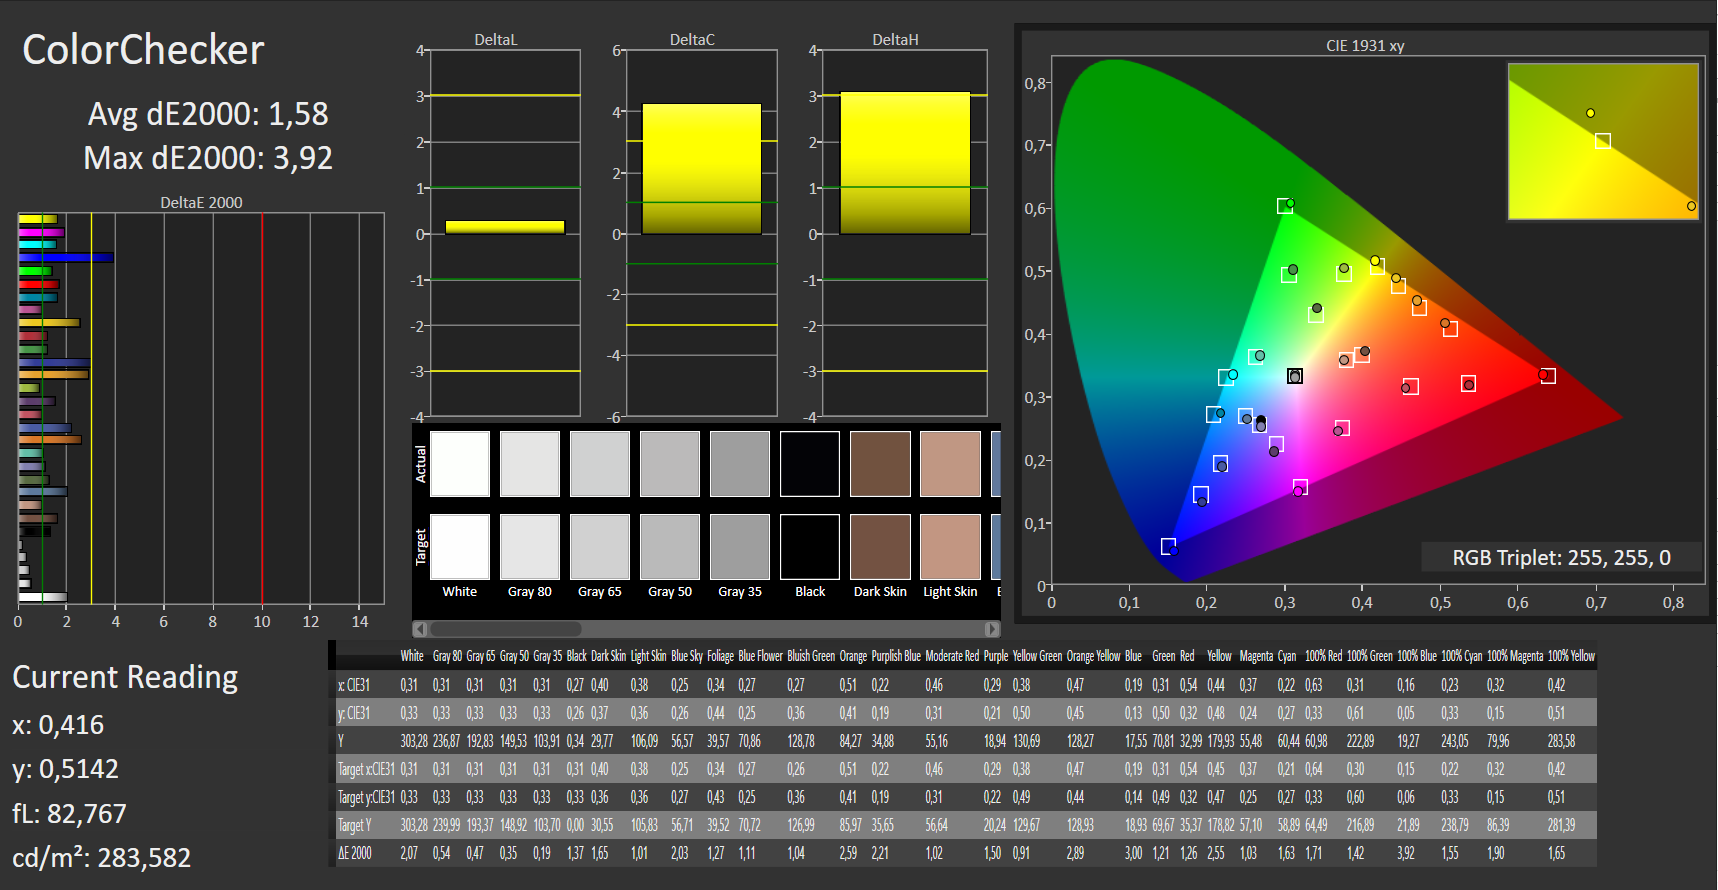
ΔE ColorChecker Calman: 2.7 | ∀{0.5-29.43 Ø4.73}
calibrated: 1.58
ΔE Greyscale Calman: 2.35 | ∀{0.09-98 Ø4.97}
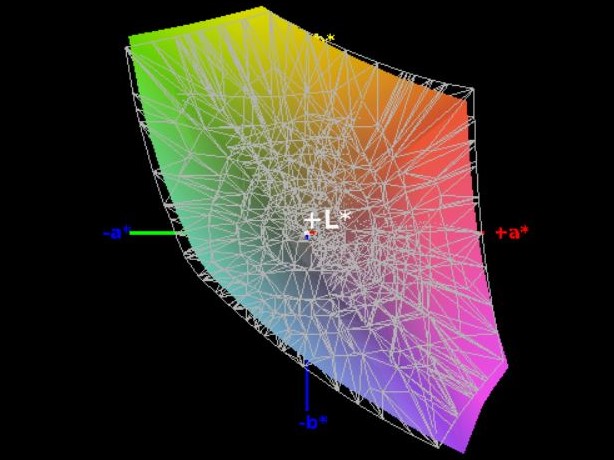
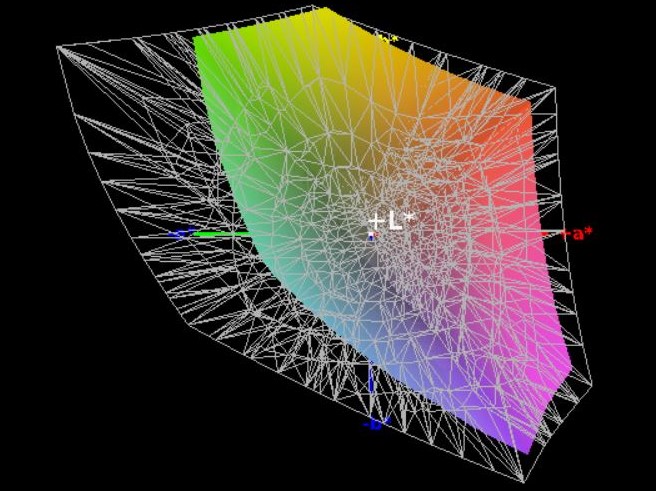
93% sRGB (Argyll 1.6.3 3D)
60% AdobeRGB 1998 (Argyll 1.6.3 3D)
65% AdobeRGB 1998 (Argyll 3D)
93.4% sRGB (Argyll 3D)
63.8% Display P3 (Argyll 3D)
Gamma: 2.41
CCT: 6904 K
| HP Omen 15-dc1303ng LG Philips LGD05C0, , 1920x1080, 15.6" | Aorus 15 X9 LG Philips LP156WFG-SPB2, , 1920x1080, 15.6" | Alienware m15 P79F Samsung SDCA029, 156WR04, , 3840x2160, 15.6" | Dell G5 15 5590 AU Optronics B156HAN, , 1920x1080, 15.6" | HP Omen 15-dc0015ng LG Philips LGD05C0, , 1920x1080, 15.6" | |
|---|---|---|---|---|---|
| Display | 2% | 39% | -38% | 0% | |
| Display P3 Coverage (%) | 63.8 | 64.9 2% | 99.9 57% | 39.26 -38% | 64.2 1% |
| sRGB Coverage (%) | 93.4 | 95.6 2% | 100 7% | 59.1 -37% | 93.4 0% |
| AdobeRGB 1998 Coverage (%) | 65 | 66.3 2% | 100 54% | 40.56 -38% | 65.1 0% |
| Response Times | -11% | 80% | -197% | -11% | |
| Response Time Grey 50% / Grey 80% * (ms) | 14 ? | 15.2 ? -9% | 2.6 ? 81% | 45 ? -221% | 17 ? -21% |
| Response Time Black / White * (ms) | 11 ? | 12.4 ? -13% | 2.3 ? 79% | 30 ? -173% | 11 ? -0% |
| PWM Frequency (Hz) | 60.2 ? | ||||
| Screen | 3% | -15% | -76% | -9% | |
| Brightness middle (cd/m²) | 316 | 305.1 -3% | 452.1 43% | 234 -26% | 317 0% |
| Brightness (cd/m²) | 295 | 295 0% | 452 53% | 219 -26% | 283 -4% |
| Brightness Distribution (%) | 84 | 78 -7% | 90 7% | 82 -2% | 76 -10% |
| Black Level * (cd/m²) | 0.42 | 0.33 21% | 0.17 60% | 0.62 -48% | |
| Contrast (:1) | 752 | 925 23% | 1376 83% | 511 -32% | |
| Colorchecker dE 2000 * | 2.7 | 2.58 4% | 6.34 -135% | 8.6 -219% | 2.83 -5% |
| Colorchecker dE 2000 max. * | 5.65 | 4.32 24% | 12.97 -130% | 17.49 -210% | 5.78 -2% |
| Colorchecker dE 2000 calibrated * | 1.58 | 1.33 16% | 4.06 -157% | ||
| Greyscale dE 2000 * | 2.35 | 3.4 -45% | 2.8 -19% | 8.55 -264% | 2 15% |
| Gamma | 2.41 91% | 2.28 96% | 2.21 100% | 3.02 73% | 2.28 96% |
| CCT | 6904 94% | 6374 102% | 6114 106% | 7802 83% | 6493 100% |
| Color Space (Percent of AdobeRGB 1998) (%) | 60 | 60.7 1% | 91 52% | 37 -38% | 60 0% |
| Color Space (Percent of sRGB) (%) | 93 | 95.2 2% | 100 8% | 59 -37% | 93 0% |
| Total Average (Program / Settings) | -2% /
1% | 35% /
12% | -104% /
-84% | -7% /
-7% |
* ... smaller is better
The panel in our review unit has a lower black value than the display in the dc0015ng, but it is still unacceptably high at 0.42 cd/m². This helps yield an underwhelming 752:1 contrast ratio and gives dark areas a grey tint. Colours generally look washed-out compared to the displays in the Aorus 15 X9, G5 15 5590 and m15.
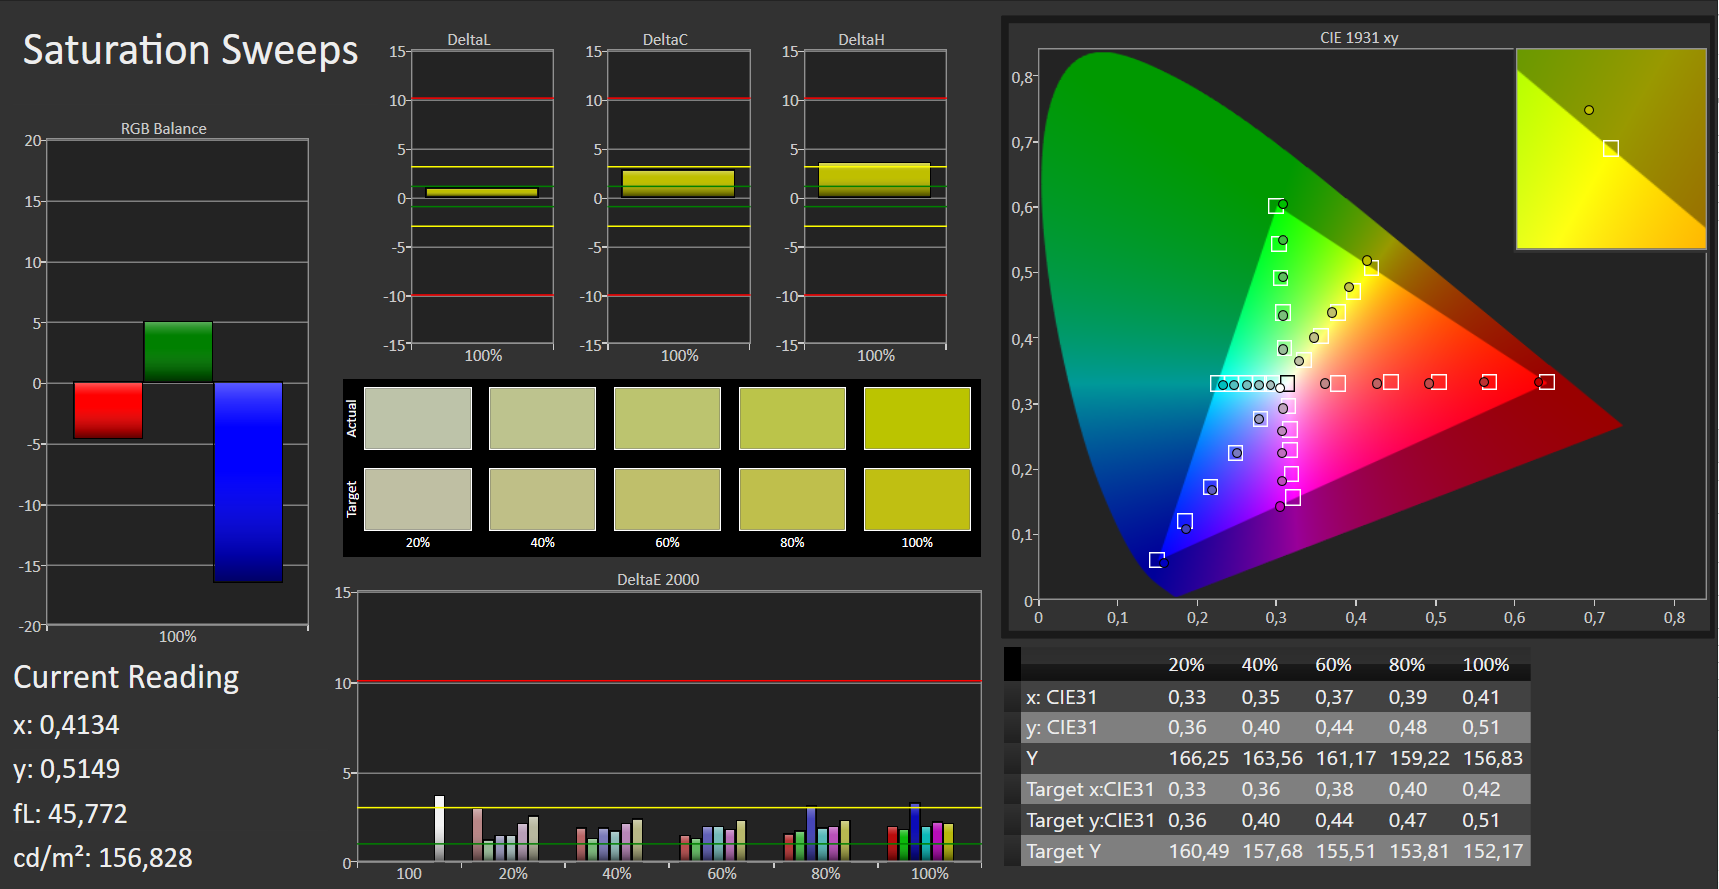
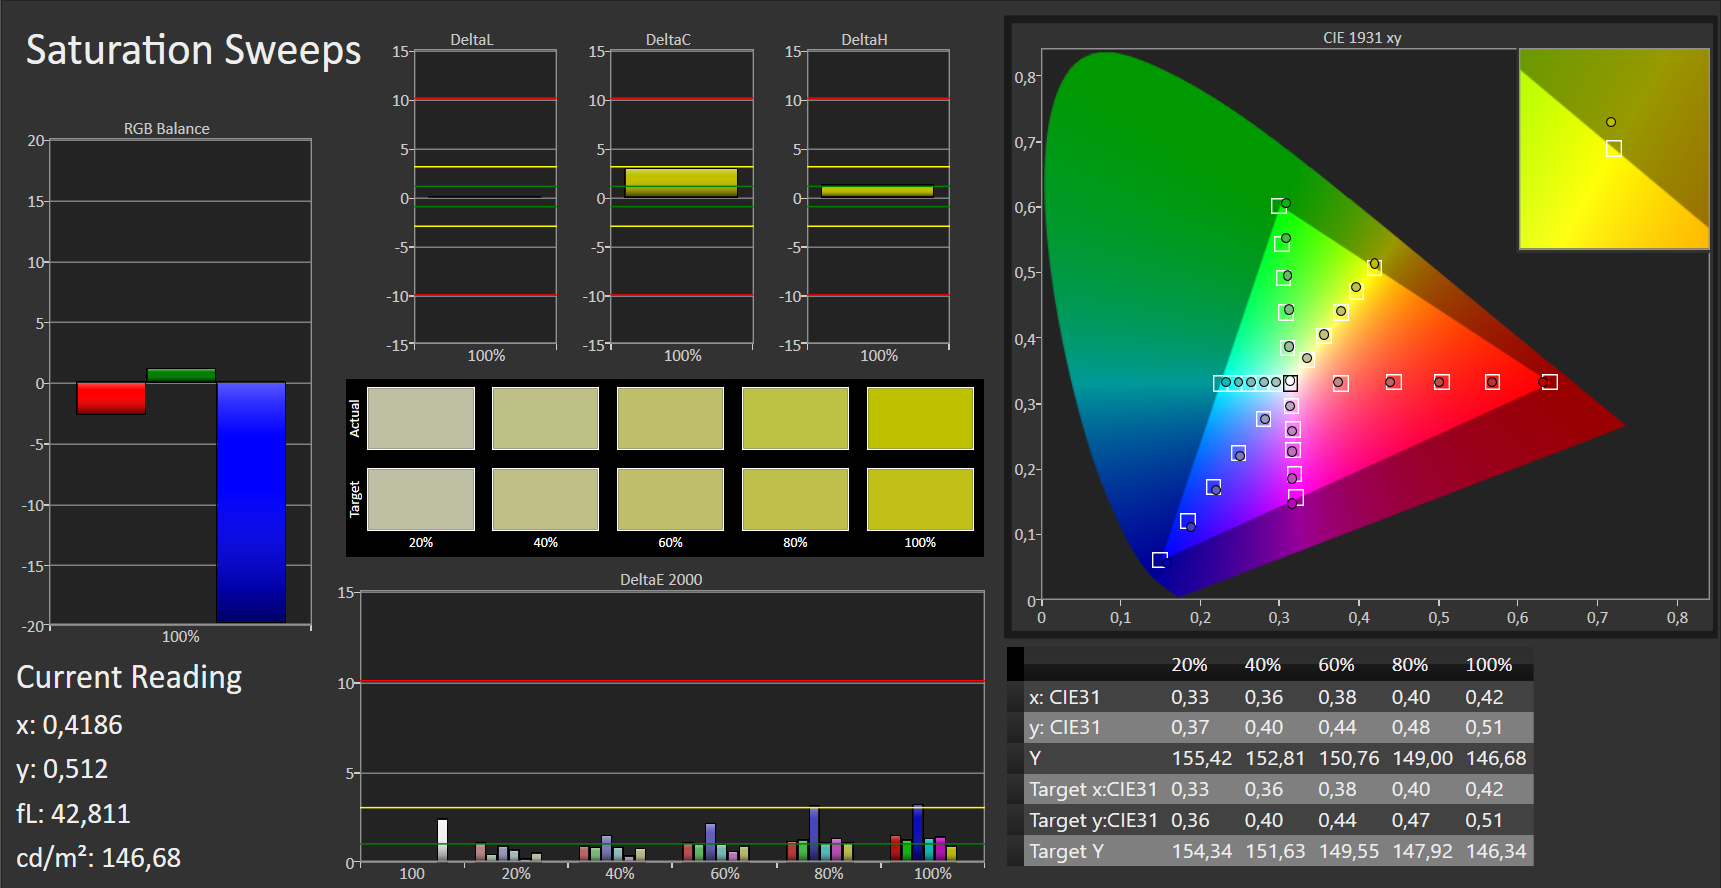
The main saving grace for the display in the dc1303ng is its colour accuracy. The panel has decent colour-space coverage and low DeltaE deviations out of the box. We improved these with additional calibration though, the ICC profile for which you can find in the box above our comparison table.


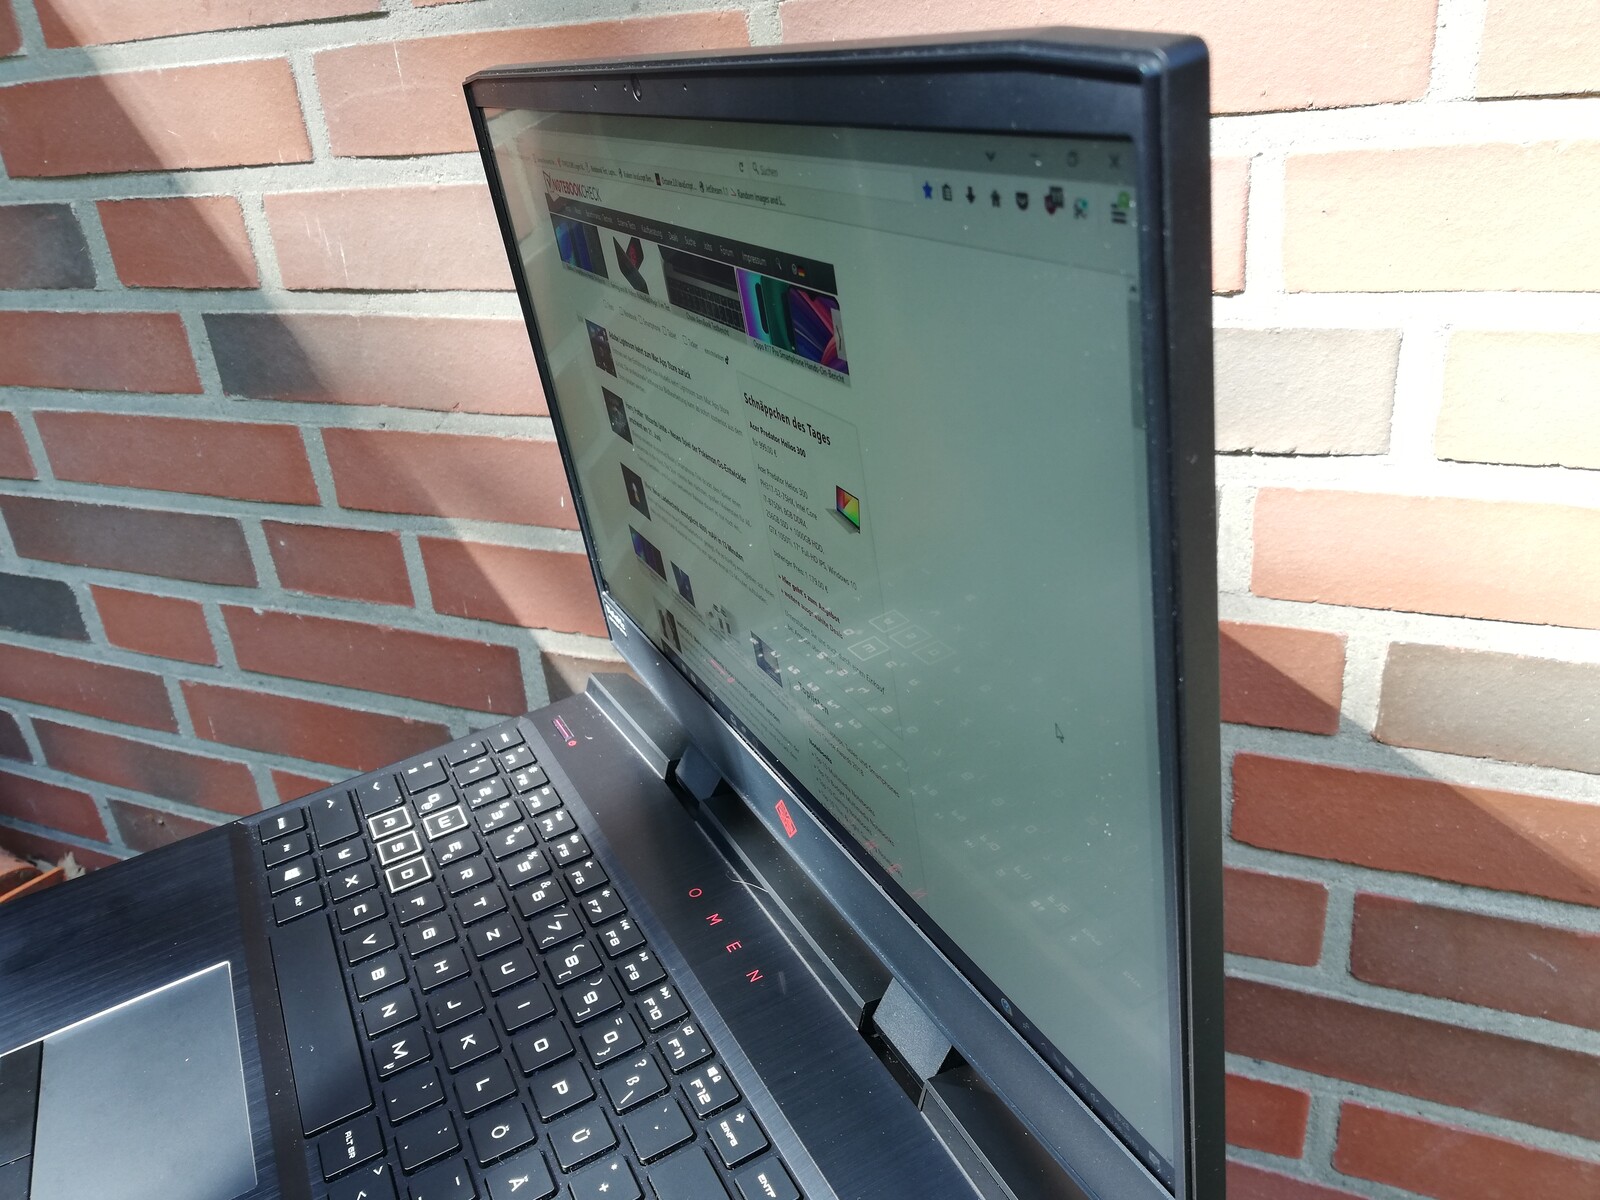
The dc1303ng is not always easy to use outdoors. The display’s matte finish diffuses reflections well, but it looks washed-out in bright sunlight. Hence, we would recommend finding a shady spot if you must use the device outdoors.

Display Response Times
| ↔ Response Time Black to White | ||
|---|---|---|
| 11 ms ... rise ↗ and fall ↘ combined | ↗ 7 ms rise | 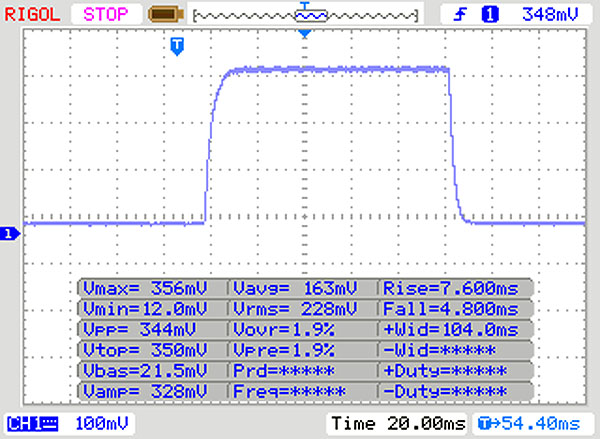 |
| ↘ 4 ms fall | ||
| The screen shows good response rates in our tests, but may be too slow for competitive gamers. In comparison, all tested devices range from 0.1 (minimum) to 240 (maximum) ms. » 29 % of all devices are better. This means that the measured response time is better than the average of all tested devices (19.9 ms). | ||
| ↔ Response Time 50% Grey to 80% Grey | ||
| 14 ms ... rise ↗ and fall ↘ combined | ↗ 7 ms rise | 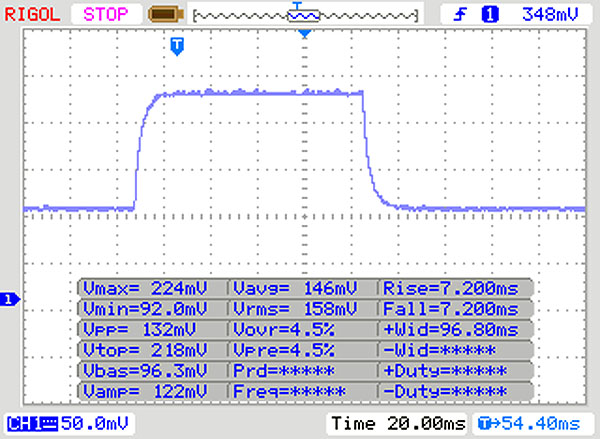 |
| ↘ 7 ms fall | ||
| The screen shows good response rates in our tests, but may be too slow for competitive gamers. In comparison, all tested devices range from 0.165 (minimum) to 636 (maximum) ms. » 28 % of all devices are better. This means that the measured response time is better than the average of all tested devices (31.1 ms). | ||
Screen Flickering / PWM (Pulse-Width Modulation)
| Screen flickering / PWM not detected |  | ||
In comparison: 52 % of all tested devices do not use PWM to dim the display. If PWM was detected, an average of 7798 (minimum: 5 - maximum: 343500) Hz was measured. | |||
The dc1303ng has stable viewing angles thanks to its IPS panel. We noticed no brightness or colour distortions even at acute viewing angles, as demonstrated by the montage of photos below. Hence, you should have no issues with reading the display from practically any angle, unless it is outside.

Performance
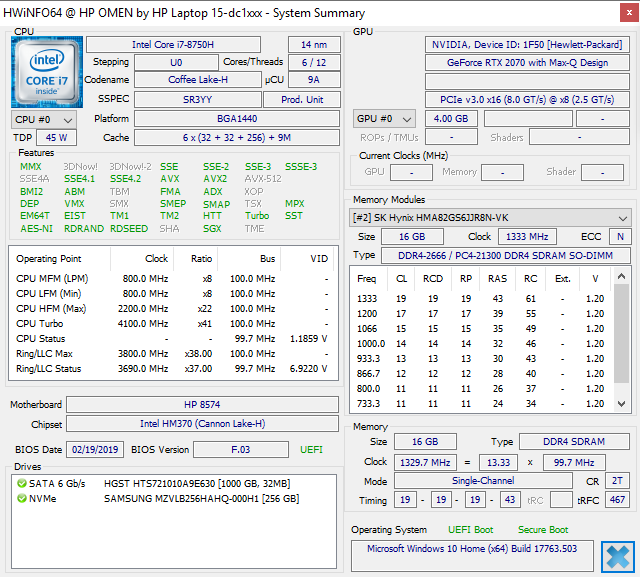
HP has equipped our test device with a Core i7-8750H CPU, GeForce RTX 2070 Max-Q GPU and 16 GB of RAM. The device also comes with a 256 GB SSD and a 1 TB HDD. This configuration currently retails for around 2,000 Euros (~US$2,279), but HP sells cheaper options if your budget does not stretch that far. Please see our dc0001ng and dc0015ng reviews for our thoughts on cheaper models.


Processor
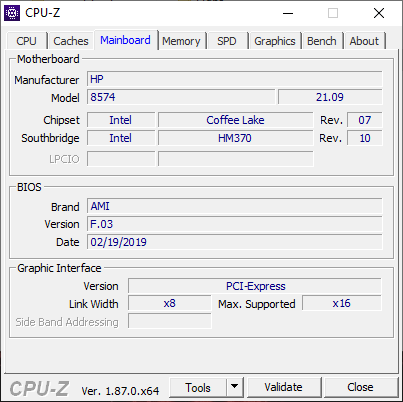
The Core i7-8750H may have been replaced by the nominally more powerful Core i7-9750H, but it is still a potent companion for the GeForce RTX 2070 Max-Q. The hexa-core CPU is based on Intel’s Coffee Lake architecture and can execute up to 12 threads simultaneously thanks to Intel Hyper-Threading. The Core i7-8750H has a 2.2 GHz base clock, but it can use Intel Turbo Boost to reach 3.9 GHz across all cores or 4.1 GHz on a single core. The 45 W chip can only temporarily maintain its turbo clock speeds though. The length of time that it can remain at 3.9 GHz or 4.1 GHz depends heavily on the effectiveness of the cooling system with which it is paired.
We ran the Cinebench R15 Multi 64bit benchmark on a loop to test how well our review unit maintains its peak performance. Perhaps unsurprisingly, the dc1303ng mimics the behaviour of its Omen 15 sibling. Both have Core i7-8750H processors and both throttle just as heavily following the first CB R15 Multi 64Bit pass-through. The dc1303ng stabilises at 1,004 points though, having initially scored 1,086 points, with benchmark scores fluctuating between 997 and 1,012 points for the remainder of the looped test.
Interestingly, our review unit consistently scores around 20 points more than the dc0015ng, for some reason. However, the dc1303ng falls well short of the G5 15 5590 and m15, with both maintaining about 10% better multi-core performance even at the end of our CB R15 loop. Overall, the Omen 15 simply cannot get as much from its CPU as its competitors can.
Please see our CPU benchmarks page for more information on the Core i7-8750H and how it compares against other processors.
System Performance
Our review unit outperforms the G5 15 5590 and m15 in system performance benchmarks like PCMark, albeit it still finishes in the midfield of our comparison tables. Oddly, the dc1303ng scores about 2% less than its Core i7-8750H-powered sibling in PCMark 10, despite having a more powerful GPU.
Overall, you should experience no performance issues with the dc1303ng in daily use. Our review unit handled all the tasks we threw at it with ease with no lags or stutters even during heavy multitasking.
| PCMark 8 Home Score Accelerated v2 | 5077 points | |
| PCMark 8 Work Score Accelerated v2 | 5857 points | |
| PCMark 10 Score | 5609 points | |
Help | ||
Storage Devices
As we mentioned earlier, HP has equipped our review unit with a 256 GB SSD and a 1 TB HDD. The former is a Samsung PM981, an NVMe drive that has graced many high-end laptops since its release in 2017. The one in our review unit finished about 12% below our expectations in AS SSD and CrystalDiskMark, but it still achieved 21% faster transfer speeds than the Toshiba XG5 in the last Omen 15 that we reviewed.
The PM981 also finished in the midfield of our comparison table and had around 200 GB free upon delivery. You can always use the 1 TB HGST SATA HDD for storing data and programs if you need more than 200 GB. Alternatively, you could replace the 256 GB SSD with a larger one. We would not recommend installing the OS on the HDD though, as its slow transfer speeds will bog down the system.
Please see our HDD/SSD benchmarks page for more information about the Samsung PM981 and other drives.
| HP Omen 15-dc1303ng Samsung SSD PM981 MZVLB256HAHQ | Aorus 15 X9 Intel SSD 760p SSDPEKKW512G8 | Alienware m15 P79F Toshiba XG5 KXG50ZNV512G | Dell G5 15 5590 KBG30ZMS128G | HP Omen 15-dc0015ng Toshiba XG5 KXG50ZNV512G | Average Samsung SSD PM981 MZVLB256HAHQ | |
|---|---|---|---|---|---|---|
| CrystalDiskMark 5.2 / 6 | 53% | 35% | -53% | -21% | 70% | |
| Write 4K (MB/s) | 50.2 | 147.2 193% | 148.4 196% | 64.3 28% | 87.5 74% | 116.1 ? 131% |
| Read 4K (MB/s) | 35.32 | 63.7 80% | 49.65 41% | 29.3 -17% | 16.08 -54% | 189.5 ? 437% |
| Write Seq (MB/s) | 991 | 1573 59% | 1139 15% | 131.1 -87% | 614 -38% | 1409 ? 42% |
| Read Seq (MB/s) | 1526 | 2602 71% | 2353 54% | 776 -49% | 1341 -12% | 1624 ? 6% |
| Write 4K Q32T1 (MB/s) | 445.1 | 531 19% | 484.7 9% | 96.8 -78% | 307.9 -31% | 360 ? -19% |
| Read 4K Q32T1 (MB/s) | 526 | 598 14% | 542 3% | 198.6 -62% | 358.4 -32% | 396 ? -25% |
| Write Seq Q32T1 (MB/s) | 1647 | 1592 -3% | 1139 -31% | 127.8 -92% | 525 -68% | 1492 ? -9% |
| Read Seq Q32T1 (MB/s) | 3427 | 2981 -13% | 3108 -9% | 1044 -70% | 3077 -10% | 3313 ? -3% |
| AS SSD | -8% | -9% | -347% | -45% | -17% | |
| Seq Read (MB/s) | 2485 | 1912 -23% | 1937 -22% | 1036 -58% | 2432 -2% | 2032 ? -18% |
| Seq Write (MB/s) | 1575 | 1553 -1% | 1066 -32% | 115.1 -93% | 843 -46% | 1339 ? -15% |
| 4K Read (MB/s) | 53.4 | 56.5 6% | 31.76 -41% | 29.6 -45% | 21.24 -60% | 46.1 ? -14% |
| 4K Write (MB/s) | 113.5 | 119.6 5% | 102.6 -10% | 67.8 -40% | 99.3 -13% | 107.4 ? -5% |
| 4K-64 Read (MB/s) | 725 | 869 20% | 1140 57% | 184.5 -75% | 730 1% | 712 ? -2% |
| 4K-64 Write (MB/s) | 1371 | 584 -57% | 938 -32% | 95.2 -93% | 484.4 -65% | 999 ? -27% |
| Access Time Read * (ms) | 0.059 | 0.049 17% | 0.058 2% | 1.519 -2475% | 0.126 -114% | 0.07076 ? -20% |
| Access Time Write * (ms) | 0.032 | 0.031 3% | 0.04 -25% | 0.255 -697% | 0.063 -97% | 0.04352 ? -36% |
| Score Read (Points) | 1027 | 1116 9% | 1366 33% | 318 -69% | 994 -3% | 961 ? -6% |
| Score Write (Points) | 1642 | 859 -48% | 1147 -30% | 174 -89% | 668 -59% | 1240 ? -24% |
| Score Total (Points) | 3163 | 2544 -20% | 3168 0% | 620 -80% | 2091 -34% | 2671 ? -16% |
| Copy ISO MB/s (MB/s) | 1329 | 946 | 159.2 | 1632 | 1297 ? | |
| Copy Program MB/s (MB/s) | 404.3 | 452.8 | 94.4 | 30.89 | 409 ? | |
| Copy Game MB/s (MB/s) | 1071 | 1013 | 106.3 | 980 | 786 ? | |
| Total Average (Program / Settings) | 23% /
17% | 13% /
9% | -200% /
-223% | -33% /
-35% | 27% /
20% |
* ... smaller is better

Graphics Card
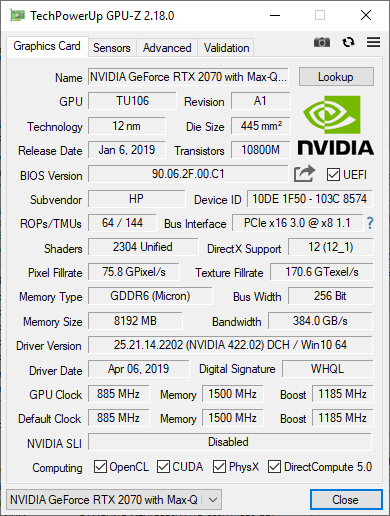
The GeForce RTX 2070 Max-Q is one of NVIDIA’s Turing cards and is a more power-efficient version of the GeForce RTX 2070. Correspondingly, the Max-Q variant runs more economically than its bigger sibling, but we will cover this in the Power Management section of this review. The GeForce RTX 2070 Max-Q has an 80 W TDP and an 885 MHz base clock that it can boost to 1,185 MHz when required.
Our review unit falls well short of expectations in synthetic benchmarks like 3DMark. The dc1303ng scores 23% less than its GeForce GTX 1070 Max-Q-powered sibling and a whopping 38% less than the comparably equipped m15. Single-channel mode may be the cause of this discrepancy. Adding a second 16 GB SO-DIMM module would enable dual-channel mode and should close the performance gap between the dc1303ng and the m15.
Please see our GPU benchmarks page for more information about the GeForce RTX 2070 Max-Q and how it compares against other cards.
| 3DMark 11 Performance | 13166 points | |
| 3DMark Cloud Gate Standard Score | 31932 points | |
| 3DMark Fire Strike Score | 10797 points | |
Help | ||
Gaming Performance
The GeForce RTX 2070 Max-Q makes good use of the 144 Hz 1080p panel in our review unit. Single-channel mode holds performance back though, with the dc1303ng averaging 20% lower frame rates than its sibling in BioShock Infinite at maximum graphics, despite having a more powerful GPU. In short, the dc1303ng is powerful enough to play modern triple-A titles at high graphics in 1080p. Adding a second SO-DIMM module would significantly improve performance though.
Please see our gaming benchmarks page for more information on the GeForce RTX 2070 Max-Q and how it compares against other GPUs.
| BioShock Infinite | |
| 1920x1080 Ultra Preset, DX11 (DDOF) | |
| Aorus 15 X9 | |
| Alienware m15 P79F | |
| Average NVIDIA GeForce RTX 2070 Max-Q (115.8 - 211, n=15) | |
| HP Omen 15-dc0015ng | |
| Dell G5 15 5590 | |
| HP Omen 15-dc1303ng | |
| 1366x768 High Preset | |
| HP Omen 15-dc0015ng | |
| Average NVIDIA GeForce RTX 2070 Max-Q (203 - 297, n=14) | |
| HP Omen 15-dc1303ng | |
| Alienware m15 P79F | |
| Dell G5 15 5590 | |
| Aorus 15 X9 | |
| Dota 2 Reborn | |
| 1920x1080 ultra (3/3) best looking | |
| Average of class Gaming (84.8 - 248, n=113, last 2 years) | |
| Average NVIDIA GeForce RTX 2070 Max-Q (105.8 - 126, n=13) | |
| HP Omen 15-dc0015ng | |
| HP Omen 15-dc1303ng | |
| 1920x1080 high (2/3) | |
| Average of class Gaming (82.8 - 275, n=112, last 2 years) | |
| Average NVIDIA GeForce RTX 2070 Max-Q (111.4 - 135, n=13) | |
| HP Omen 15-dc0015ng | |
| HP Omen 15-dc1303ng | |
| Anno 1800 | |
| 1920x1080 Ultra Graphics Quality (DX11) | |
| Average of class Gaming (n=1last 2 years) | |
| Dell G5 15 5590 | |
| Average NVIDIA GeForce RTX 2070 Max-Q (28.5 - 40, n=5) | |
| HP Omen 15-dc1303ng | |
| 1920x1080 High Graphics Quality (DX11) | |
| Average of class Gaming (n=1last 2 years) | |
| Average NVIDIA GeForce RTX 2070 Max-Q (58.5 - 70.6, n=4) | |
| Dell G5 15 5590 | |
| HP Omen 15-dc1303ng | |
| low | med. | high | ultra | |
|---|---|---|---|---|
| BioShock Infinite (2013) | 308.7 | 264.3 | 244.6 | 115.8 |
| Dota 2 Reborn (2015) | 126.5 | 117.4 | 111.4 | 105.8 |
| Anno 1800 (2019) | 58.5 | 28.45 |
Emissions
Fan Noise
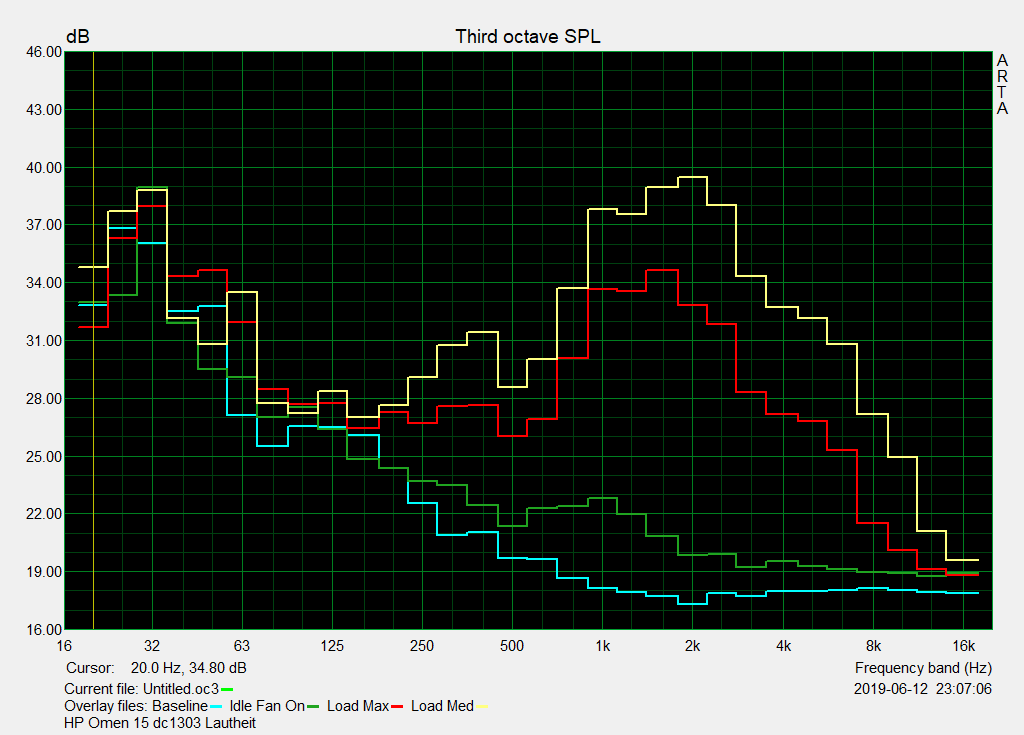
The two fans in our review unit run constantly, peaking at 32.8 dB(A) when the system is idling. Most people should only be able to hear the fans in a quiet room, although they reached 47.5 dB(A) during our stress tests. While we would recommend using headphones when gaming, the dc1303ng does not run as loudly as the m15 does, for example.
Noise level
| Idle |
| 32.8 / 32.8 / 32.8 dB(A) |
| Load |
| 42.5 / 47.5 dB(A) |
 | ||
30 dB silent 40 dB(A) audible 50 dB(A) loud |
||
min: | ||
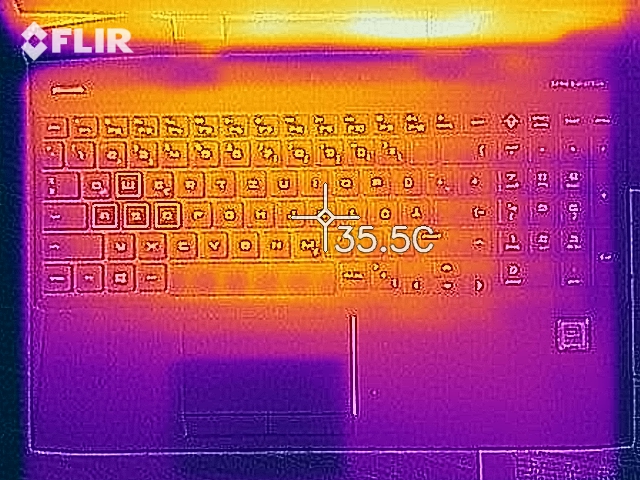
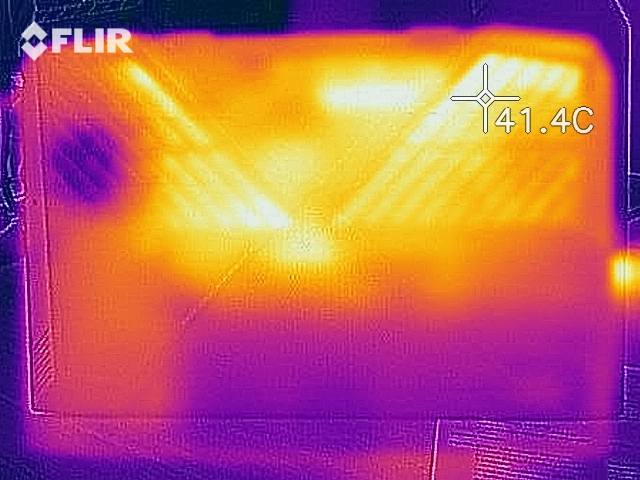
Temperature
The dc1303ng does not manage its surface temperatures well. This is even true at idle, with all but the palm rest of our review unit exceeding 30 °C. Some parts of the top case reach around 36 °C too, which will feel warm to the touch.
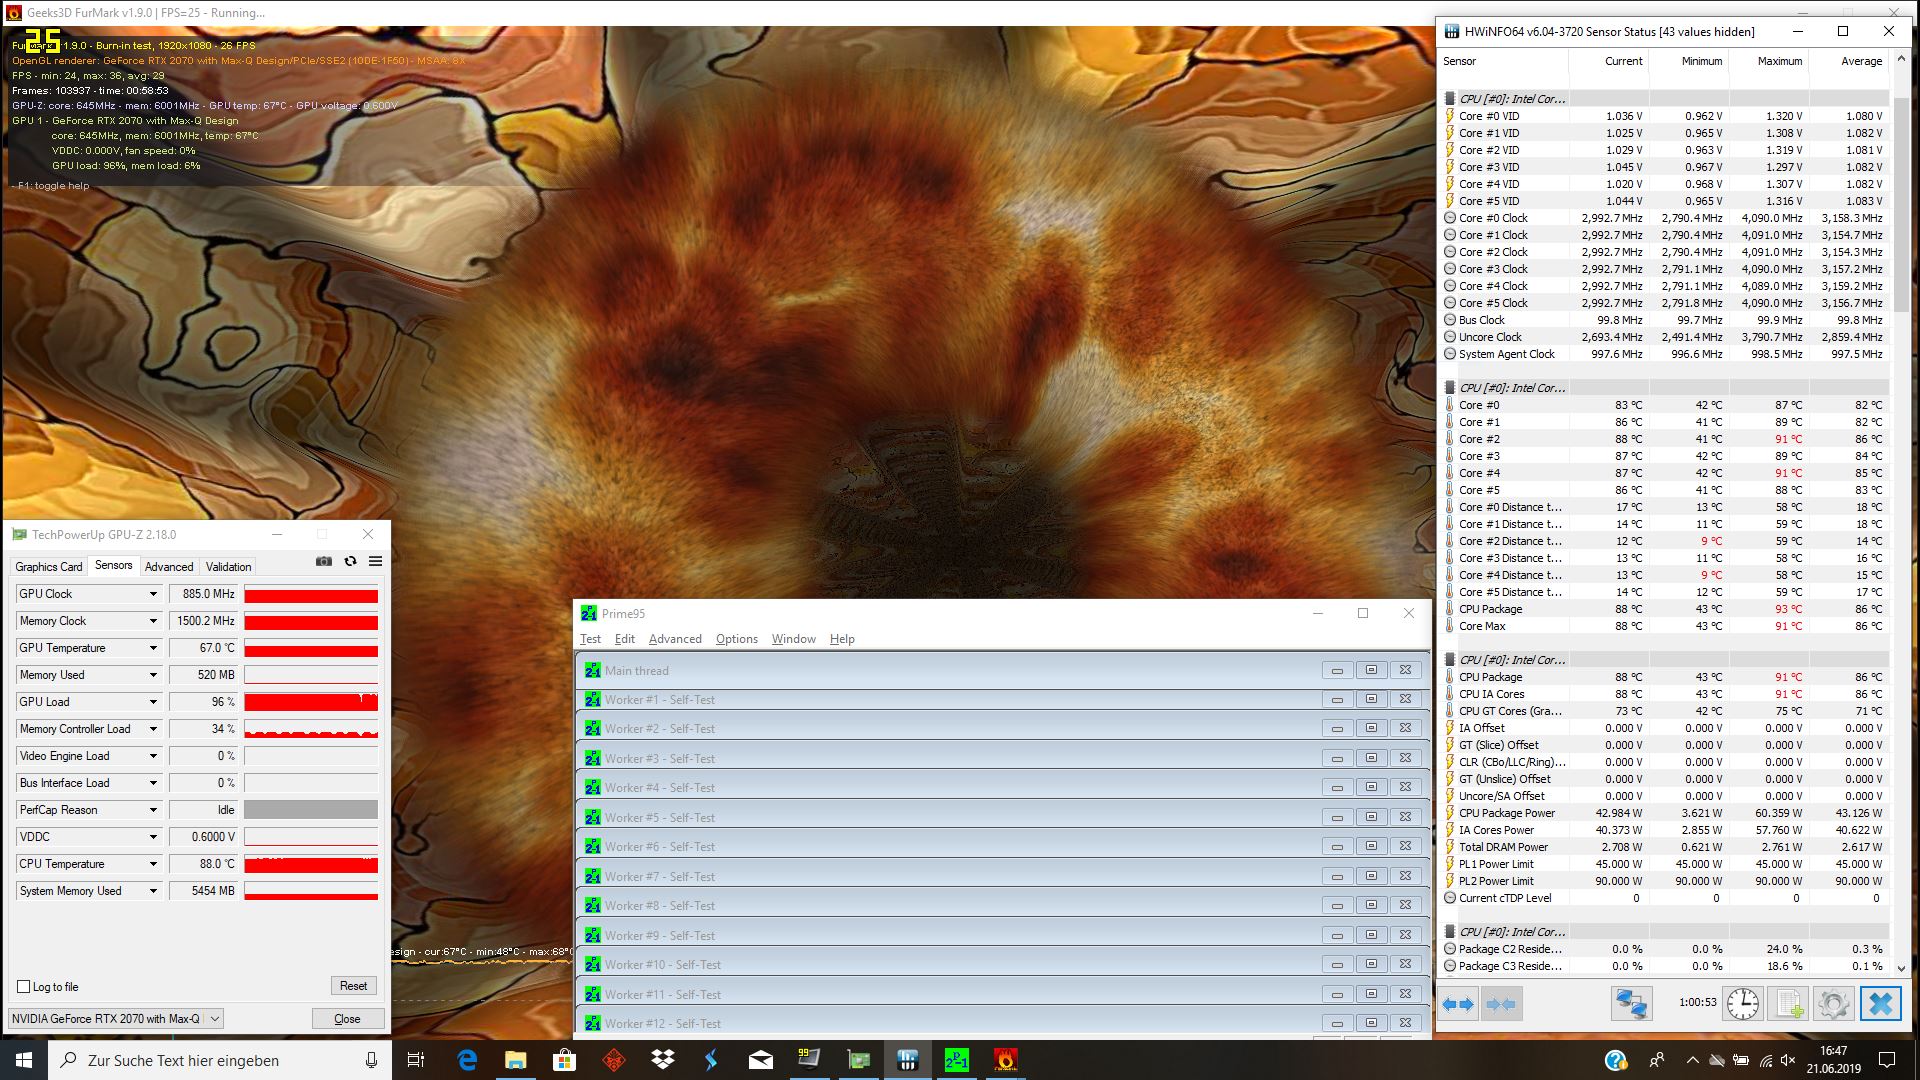
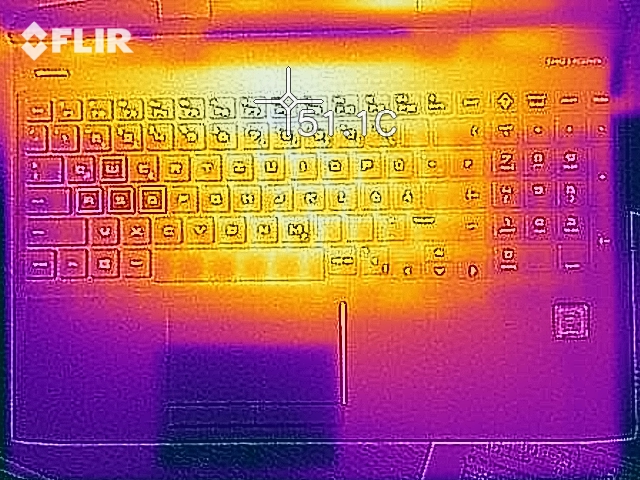
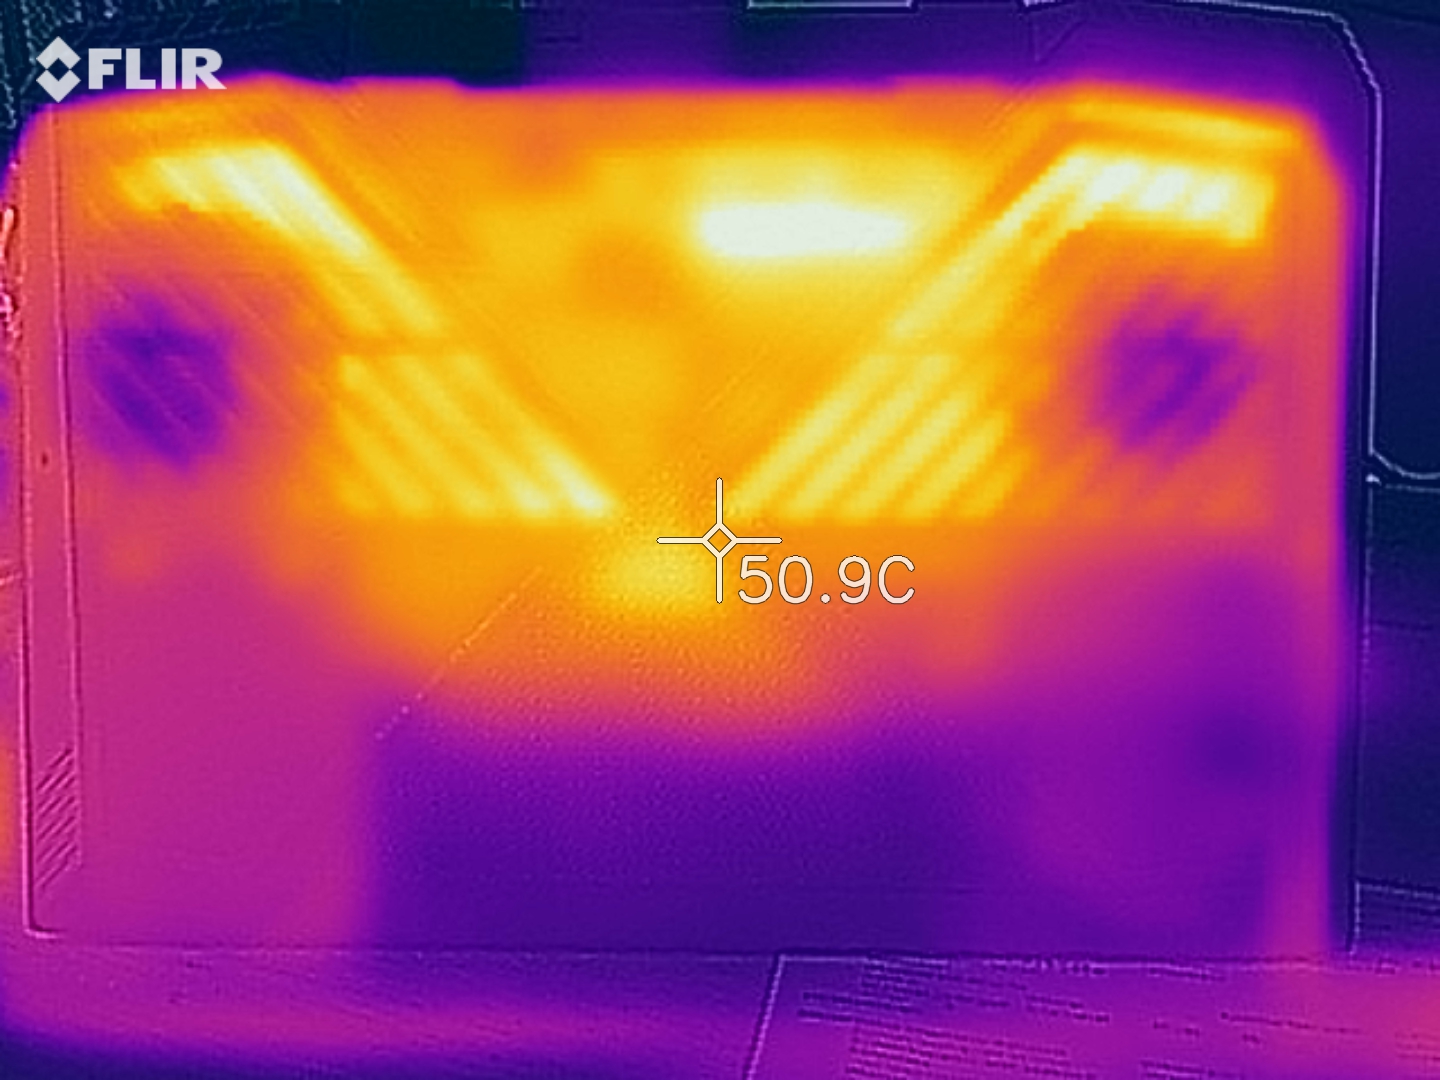
Surface temperatures rise dramatically under load, with one area of the bottom case reaching 59.6 °C during our stress tests. While the palm rest area stays at around 30 °C, several areas of the bottom case may burn your thighs if you are gaming on your lap. In short, make sure to place the dc1303ng on a table or a flat surface if you are pushing the machine hard.
Internal temperatures are not much better, either. CPU core temperatures quickly peaked at 90 °C during our combined FurMark and Prime95 stress test, which caused it to downclock to 2.7 GHz to stop it from overheating. Core temperatures then stabilise at around 85 °C, and the CPU never drops below its 2.2 GHz base clock. In short, you should never see huge performance drops when pushing the dc1303ng hard.
(-) The maximum temperature on the upper side is 47.6 °C / 118 F, compared to the average of 40.4 °C / 105 F, ranging from 21.2 to 68.8 °C for the class Gaming.
(-) The bottom heats up to a maximum of 59.6 °C / 139 F, compared to the average of 43.2 °C / 110 F
(+) In idle usage, the average temperature for the upper side is 31.6 °C / 89 F, compared to the device average of 33.9 °C / 93 F.
(+) The palmrests and touchpad are reaching skin temperature as a maximum (33 °C / 91.4 F) and are therefore not hot.
(-) The average temperature of the palmrest area of similar devices was 28.8 °C / 83.8 F (-4.2 °C / -7.6 F).
Speakers
The speakers in our review unit are rather quiet. They only reach 73.7 dB(A), restricting their use to just quiet environments. The fans will drown out most audio when gaming too, so we recommend using headphones where possible. Any audio that we can hear has a distinct lack of bass with an overrepresentation of mid and high-frequency tones.
We had no issues with connecting external audio equipment to the dc1303ng during our tests. The headphone jack grips cables firmly, but you could use Bluetooth if you prefer.
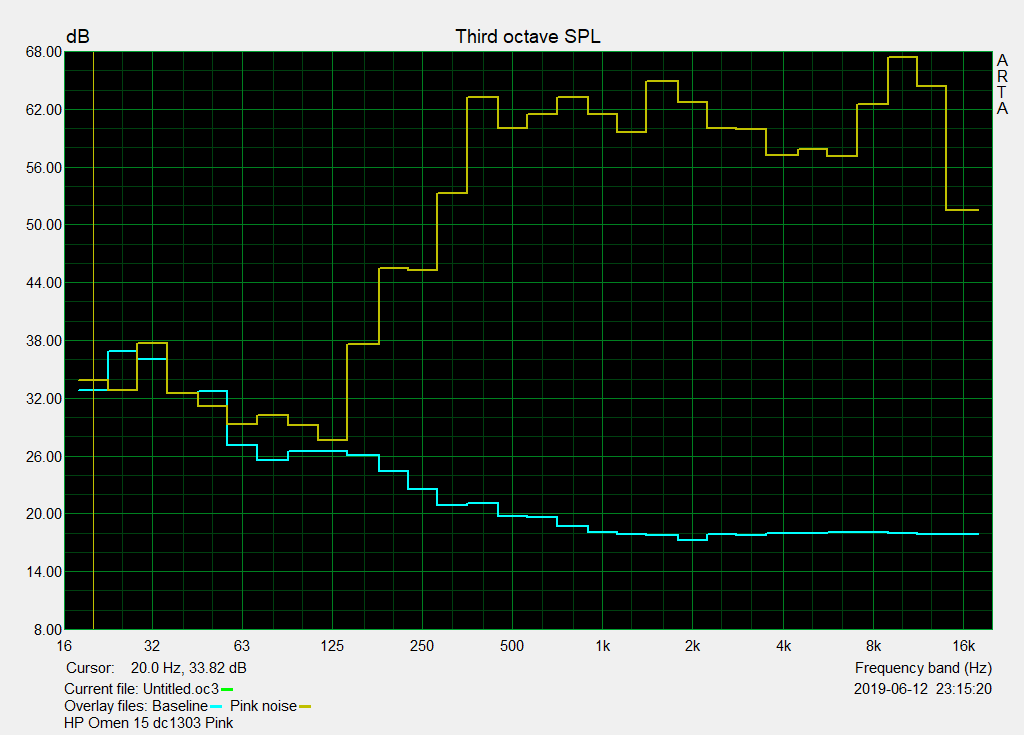
HP Omen 15-dc1303ng audio analysis
(-) | not very loud speakers (67.3 dB)
Bass 100 - 315 Hz
(-) | nearly no bass - on average 20.2% lower than median
(±) | linearity of bass is average (11.4% delta to prev. frequency)
Mids 400 - 2000 Hz
(+) | balanced mids - only 2.2% away from median
(±) | linearity of mids is average (8.2% delta to prev. frequency)
Highs 2 - 16 kHz
(+) | balanced highs - only 2.5% away from median
(+) | highs are linear (5.9% delta to prev. frequency)
Overall 100 - 16.000 Hz
(±) | linearity of overall sound is average (20.3% difference to median)
Compared to same class
» 72% of all tested devices in this class were better, 6% similar, 23% worse
» The best had a delta of 6%, average was 18%, worst was 132%
Compared to all devices tested
» 53% of all tested devices were better, 8% similar, 39% worse
» The best had a delta of 4%, average was 24%, worst was 134%
Apple MacBook 12 (Early 2016) 1.1 GHz audio analysis
(+) | speakers can play relatively loud (83.6 dB)
Bass 100 - 315 Hz
(±) | reduced bass - on average 11.3% lower than median
(±) | linearity of bass is average (14.2% delta to prev. frequency)
Mids 400 - 2000 Hz
(+) | balanced mids - only 2.4% away from median
(+) | mids are linear (5.5% delta to prev. frequency)
Highs 2 - 16 kHz
(+) | balanced highs - only 2% away from median
(+) | highs are linear (4.5% delta to prev. frequency)
Overall 100 - 16.000 Hz
(+) | overall sound is linear (10.2% difference to median)
Compared to same class
» 7% of all tested devices in this class were better, 2% similar, 91% worse
» The best had a delta of 5%, average was 18%, worst was 53%
Compared to all devices tested
» 5% of all tested devices were better, 1% similar, 94% worse
» The best had a delta of 4%, average was 24%, worst was 134%
Power Management
Power Consumption
Our tests certify that the dc1303ng consumes a minimum of 14.7 W when idling and up to 120 W under full load. This makes the device comparatively economic, with it averaging a 4% lower power draw than the m15. Interestingly, our review unit consumes almost what the m15 does under sustained load. The G5 15 5590 is our only comparison device that consumes less than the dc1303ng overall, although this is unsurprising considering that the former has a weaker CPU than the latter.
HP includes a 200 W charger with the dc1303ng. Our tests demonstrate that the charger is powerful enough to keep the laptop charging even when it is being pushed to its limits.
| Off / Standby | |
| Idle | |
| Load |
|
Key:
min: | |
| HP Omen 15-dc1303ng i7-8750H, GeForce RTX 2070 Max-Q, Samsung SSD PM981 MZVLB256HAHQ, IPS, 1920x1080, 15.6" | Aorus 15 X9 i7-8750H, GeForce RTX 2070 Mobile, Intel SSD 760p SSDPEKKW512G8, IPS, 1920x1080, 15.6" | Alienware m15 P79F i7-8750H, GeForce RTX 2070 Max-Q, Toshiba XG5 KXG50ZNV512G, OLED, 3840x2160, 15.6" | Dell G5 15 5590 i7-8750H, GeForce RTX 2060 Mobile, KBG30ZMS128G, IPS, 1920x1080, 15.6" | HP Omen 15-dc0015ng i7-8750H, GeForce GTX 1070 Max-Q, Toshiba XG5 KXG50ZNV512G, IPS, 1920x1080, 15.6" | Average NVIDIA GeForce RTX 2070 Max-Q | Average of class Gaming | |
|---|---|---|---|---|---|---|---|
| Power Consumption | -60% | -4% | 22% | -23% | -23% | -26% | |
| Idle Minimum * (Watt) | 14.7 | 26 -77% | 10.9 26% | 3.5 76% | 14 5% | 15.4 ? -5% | 13.3 ? 10% |
| Idle Average * (Watt) | 18.6 | 30.8 -66% | 12.3 34% | 6.9 63% | 18.2 2% | 20 ? -8% | 19 ? -2% |
| Idle Maximum * (Watt) | 22.6 | 34.9 -54% | 19 16% | 8.5 62% | 24 -6% | 26.7 ? -18% | 24.5 ? -8% |
| Load Average * (Watt) | 90 | 90.7 -1% | 96 -7% | 127 -41% | 143 -59% | 105.2 ? -17% | 108.1 ? -20% |
| Load Maximum * (Watt) | 120 | 241.2 -101% | 229.1 -91% | 179 -49% | 190 -58% | 201 ? -68% | 254 ? -112% |
| Witcher 3 ultra * (Watt) | 175 | 161.7 | 126 |
* ... smaller is better
Battery Life
HP equips the dc1303ng with a 70 Wh battery. Incidentally, this is the same capacity as the one it includes in the GeForce GTX 1070 Max-Q variant of the Omen 15. In short, our review unit has dreadful battery life, especially considering the capacity of its battery. The device lasted for just 3:17 hours in our Wi-Fi battery life test before it needed recharging, putting it well below-average and far behind most of our comparison devices. Only the Aorus 15 X9 and its 62 Wh battery achieved a worse runtime in this test than the dc1303ng.
| HP Omen 15-dc1303ng i7-8750H, GeForce RTX 2070 Max-Q, 70 Wh | Aorus 15 X9 i7-8750H, GeForce RTX 2070 Mobile, 62 Wh | Alienware m15 P79F i7-8750H, GeForce RTX 2070 Max-Q, 90 Wh | Dell G5 15 5590 i7-8750H, GeForce RTX 2060 Mobile, 60 Wh | HP Omen 15-dc0015ng i7-8750H, GeForce GTX 1070 Max-Q, 70.07 Wh | Average of class Gaming | |
|---|---|---|---|---|---|---|
| Battery runtime | -44% | 58% | 154% | 53% | 70% | |
| Reader / Idle (h) | 5 | 1.8 -64% | 14.8 196% | 7.7 54% | 8.71 ? 74% | |
| WiFi v1.3 (h) | 3.3 | 1.6 -52% | 5.2 58% | 7.7 133% | 4.6 39% | 7.01 ? 112% |
| Load (h) | 1.2 | 1 -17% | 2.8 133% | 2 67% | 1.47 ? 23% |
Pros
Cons
Verdict
The HP Omen 15 remains a solid gaming laptop. The dc1303ng retains the strengths of its predecessor while having considerably more power under the hood. The device also runs comparatively quietly under load, which we always like to see. It is relatively simple to upgrade or repair, with it being possible to change the RAM, storage or Wi-Fi card among other components. However, some people may find removing the bottom plate a tad tricky.
The HP Omen 15-dc1303ng is good value for money, with its powerful hardware making good use of its 144 Hz 1080p display. A poor contrast ratio and weak battery life take the shine off this gaming laptop though.
The Omen 15 has surprisingly poor battery life, especially considering that HP has included a 70 Wh battery. Moreover, while we like that the manufacturer has included a PWM-free 144 Hz panel, its low contrast ratio and high black value are disappointing.
Overall, the HP Omen 15-dc1303ng is a gaming laptop designed for those who only plan to game with a power outlet nearby or with the device connected to an external monitor. RTX 2070 Max-Q and hexa-core gaming for 2,000 Euros (~US$2,279) is still good value for money though.
HP Omen 15-dc1303ng
- 06/24/2019 v6 (old)
Mike Wobker
Price comparison

