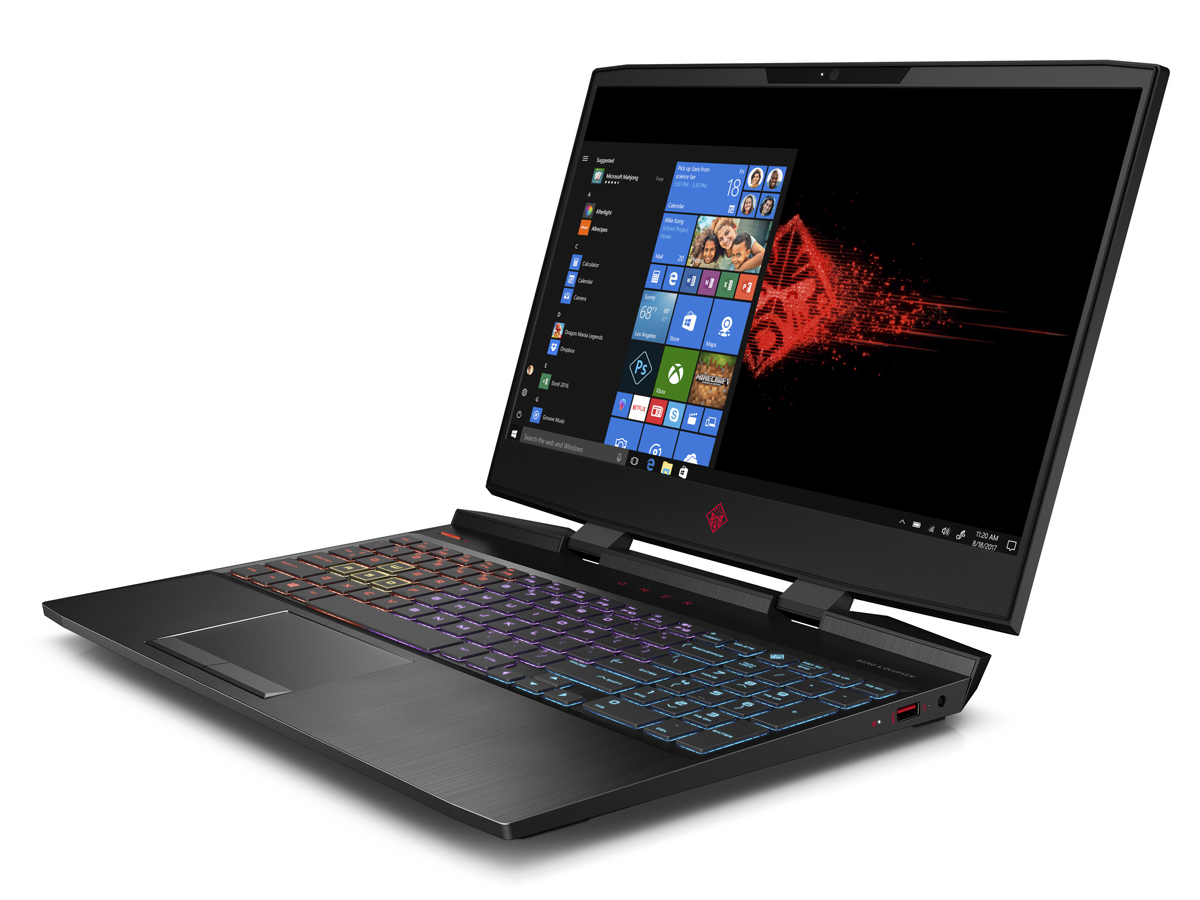
HP Omen 15 (i7-8750H, GTX 1070 Max-Q, SSD, FHD) Laptop Review

The Omen 15 is not unknown to us. A few months ago we tested an entry-level model of the series with the Omen 15-dc0001ng, which is currently available for about 950 Euros (~$1084). With the Omen 15-dc0015ng, we now have the current top model of the Omen-15 series. You have to pay almost 2100 Euros (~$2396; for example ~$1600 in the US without the HDD) for this laptop, but the computer is correspondingly well-equipped with a Core i7-8750H processor, GeForce GTX 1070 Max-Q GPU, 32 GB of working memory, NVMe SSD, HDD, and Thunderbolt 3. The competitors include devices like the MSI P65 8RF-451 - Creator, the Asus Zephyrus S GX531GS, the Schenker XMG Neo 15, the Razer Blade 15, and the MSI GE63 Raider RGB 8RF-008.
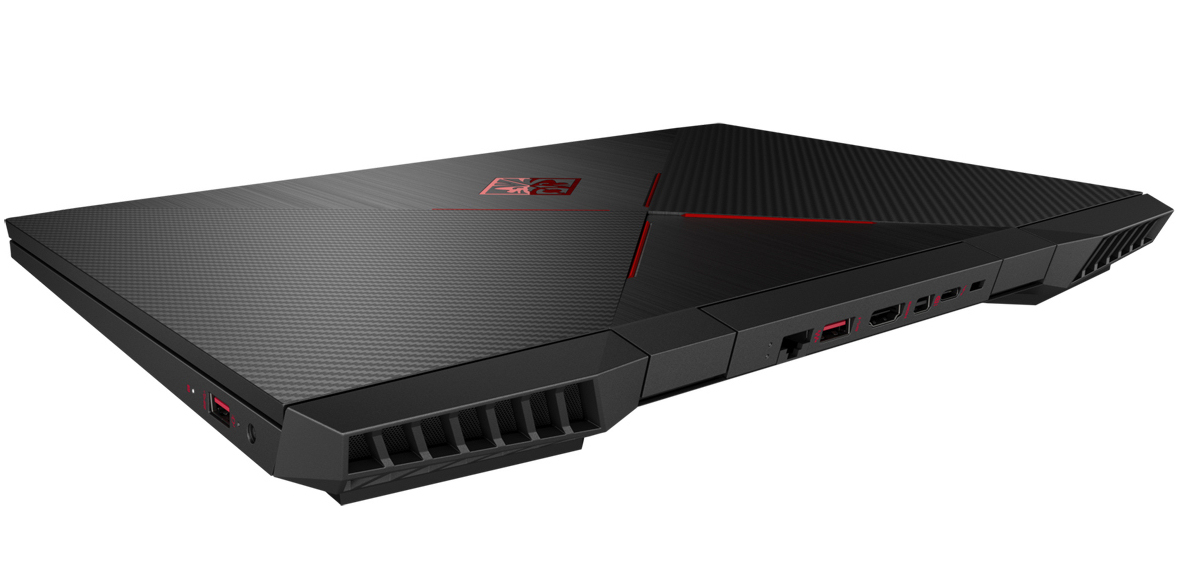
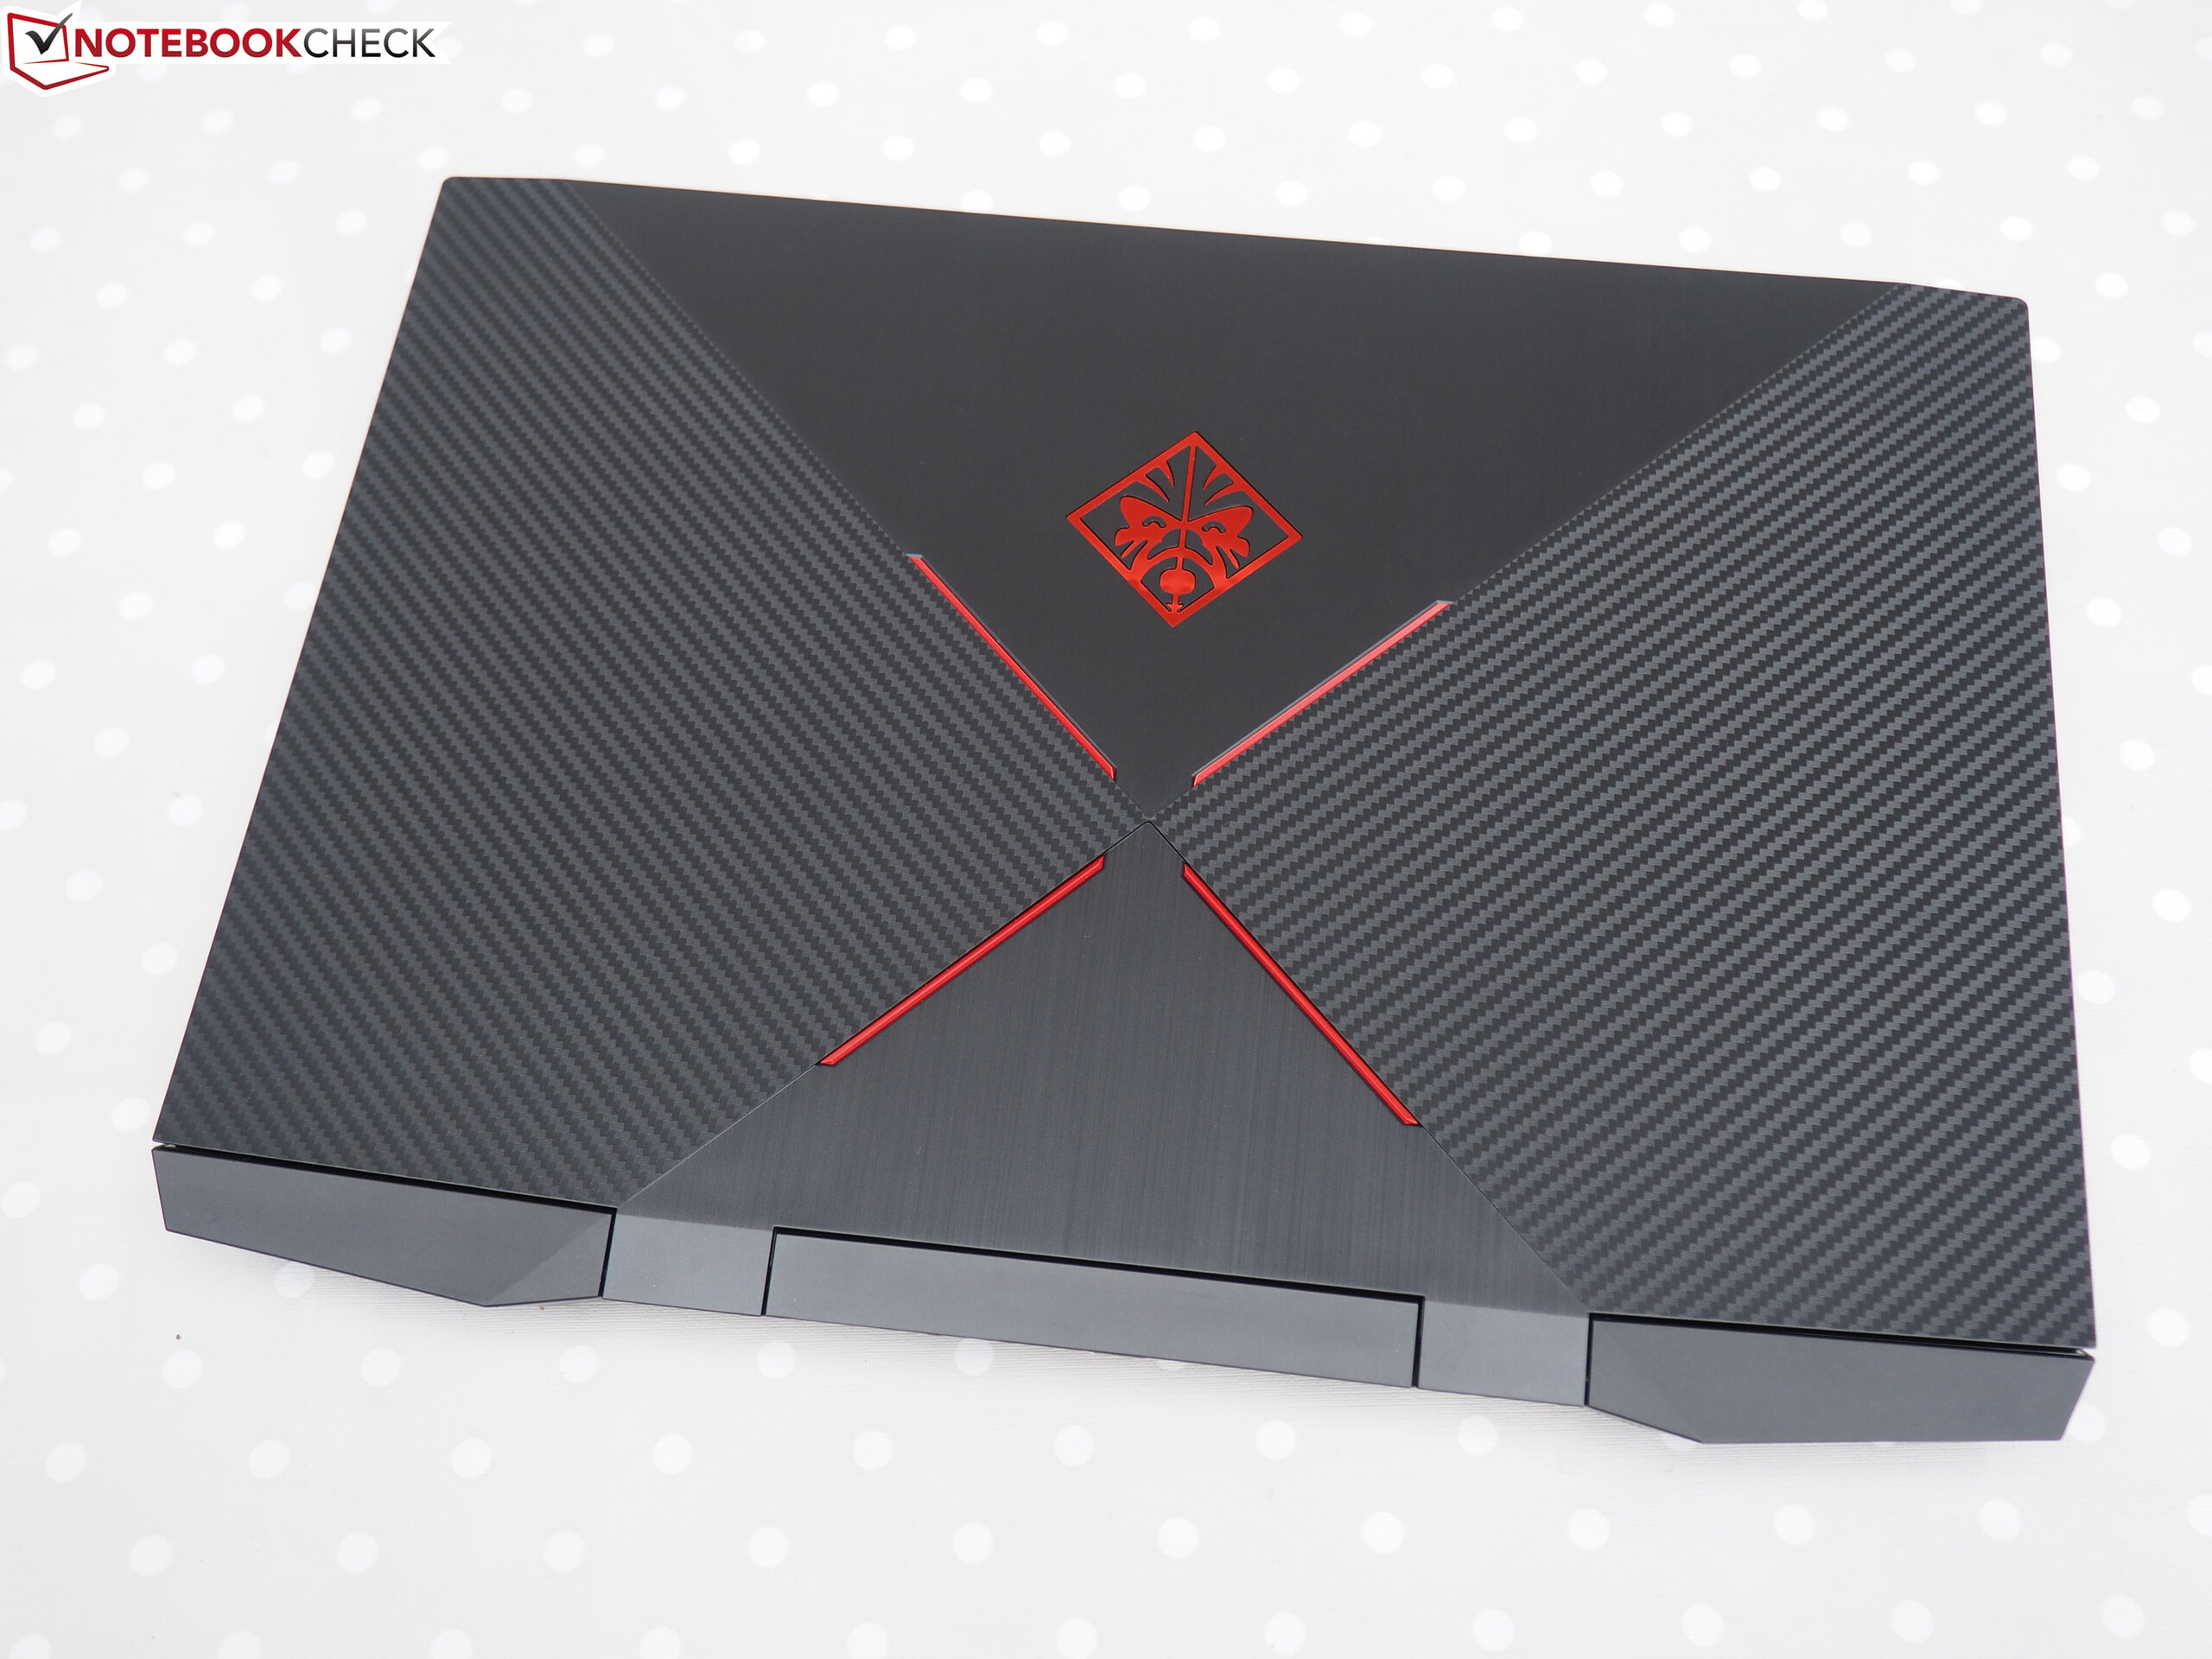
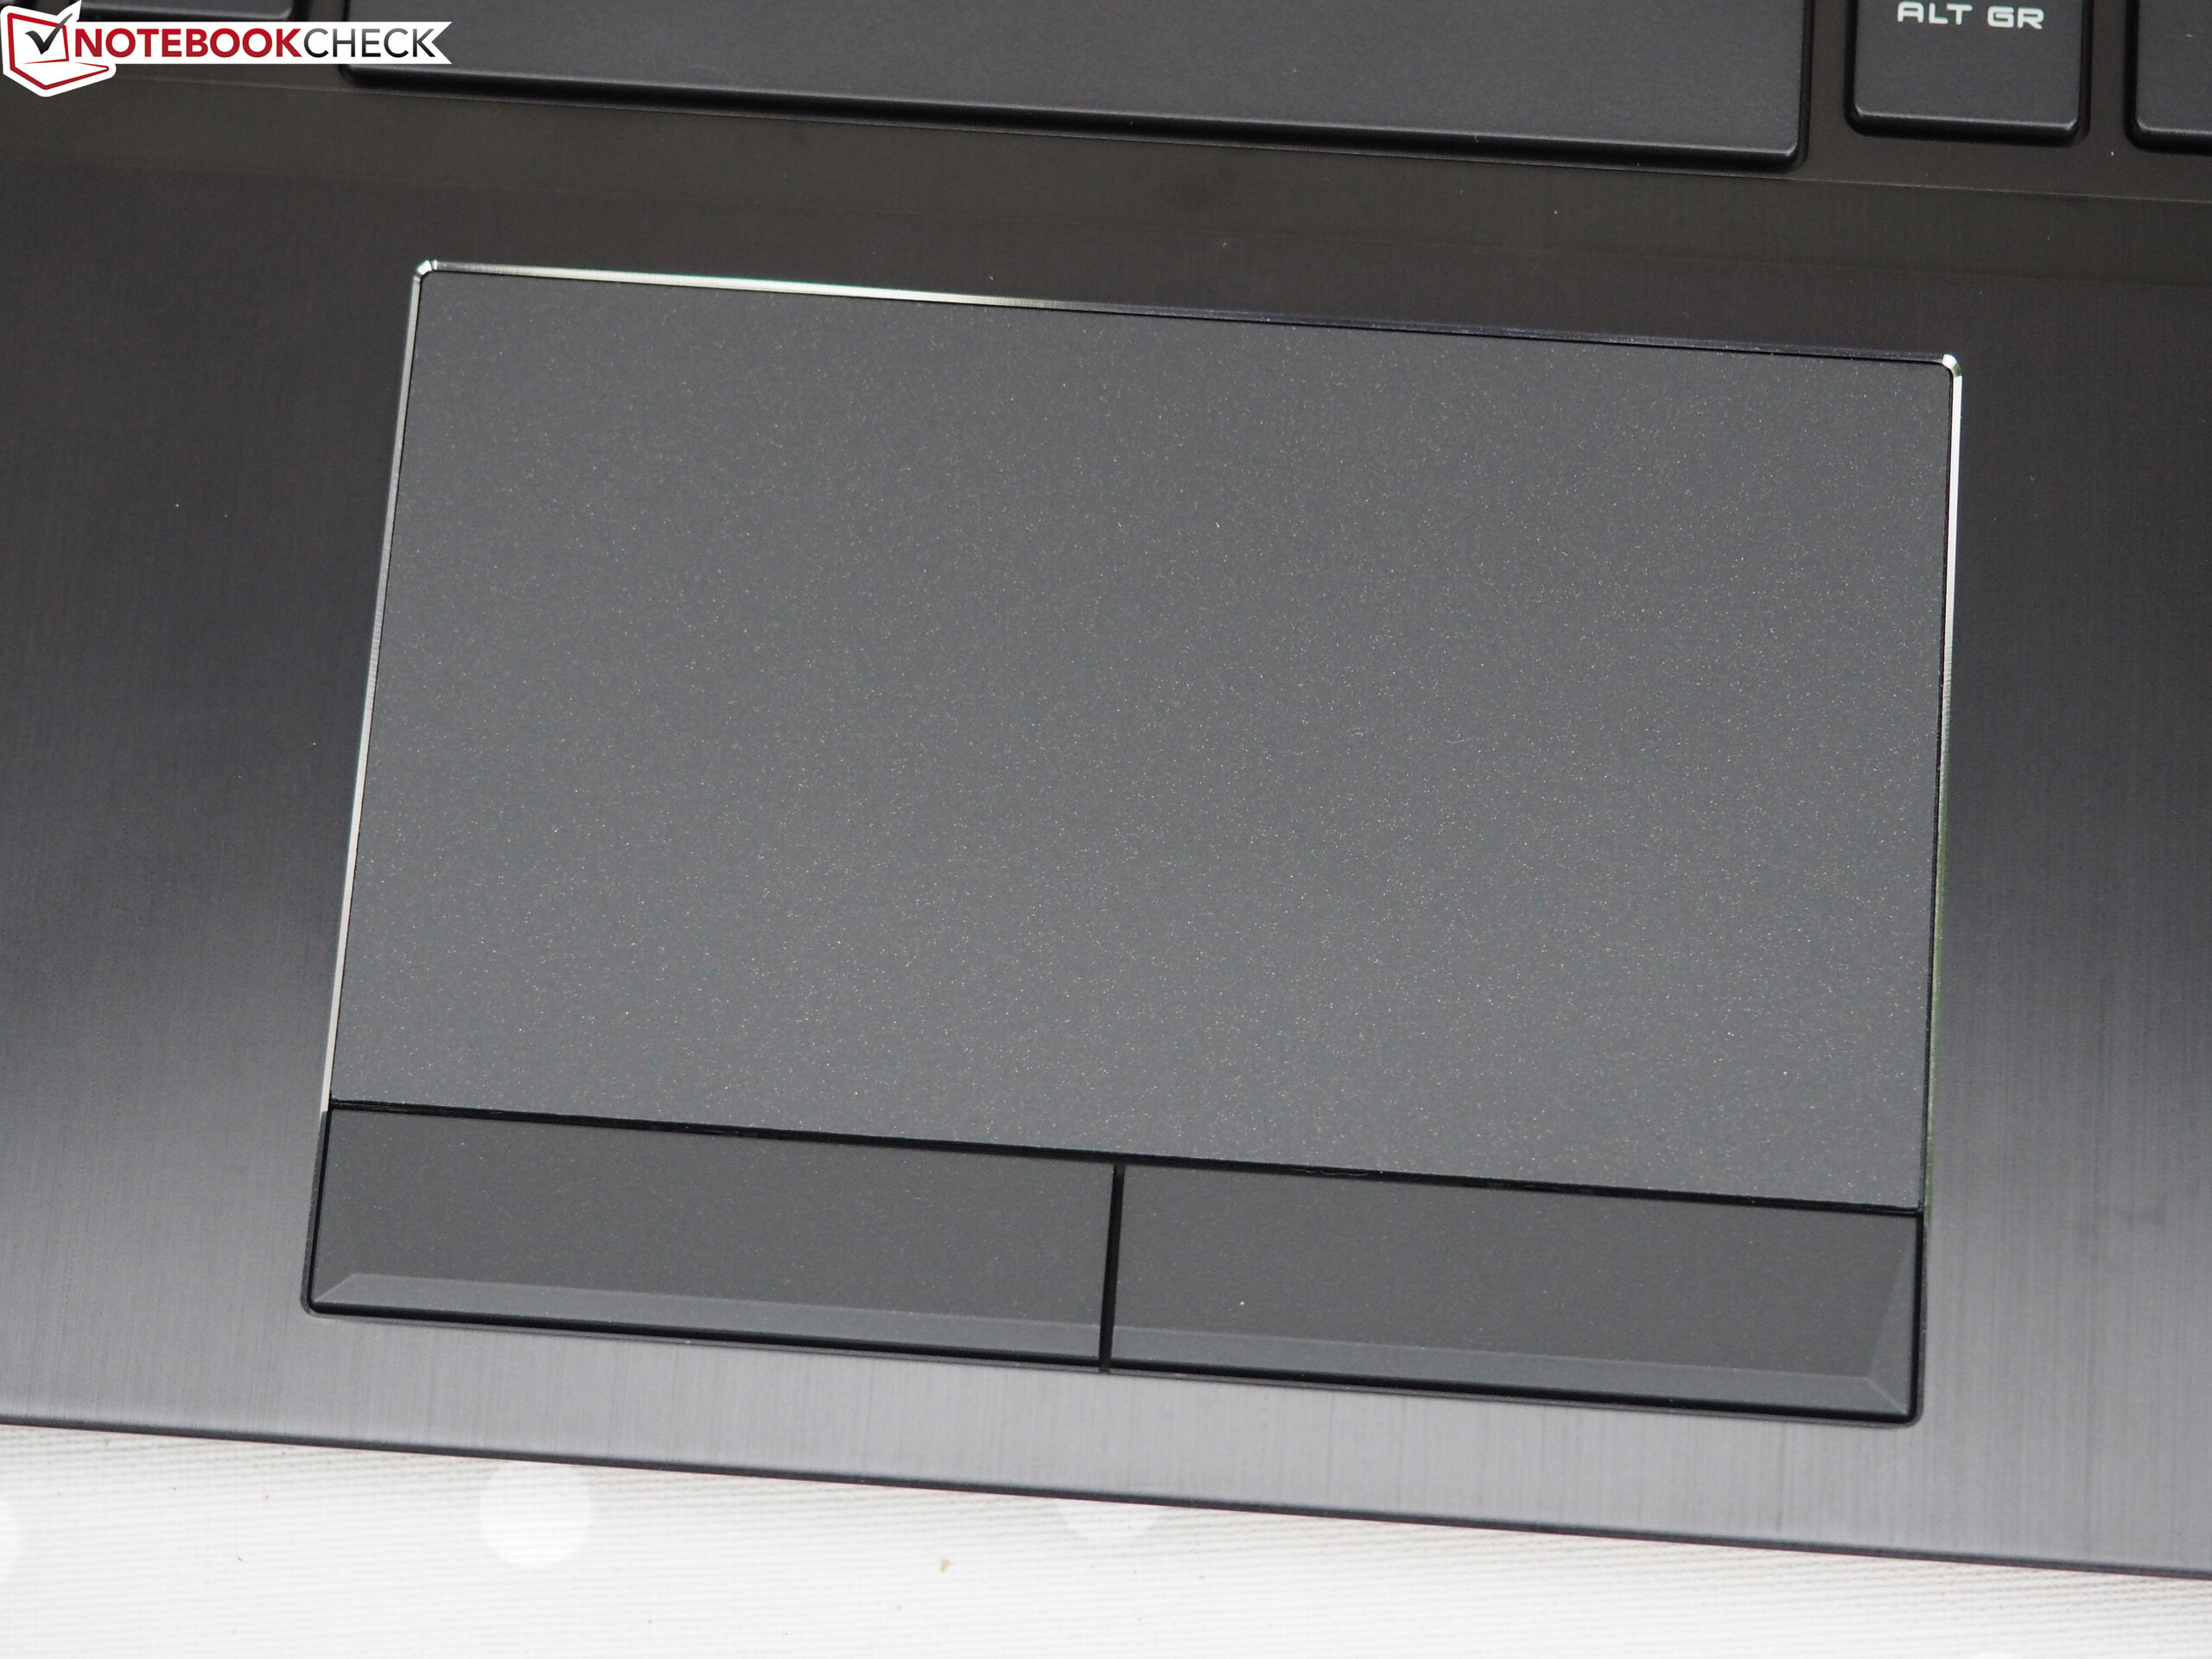
Since both Omen models have an identical build, we will not discuss the case, equipment, input-devices, and speakers again, but you can find the corresponding information in the Omen 15-dc0001ng review.
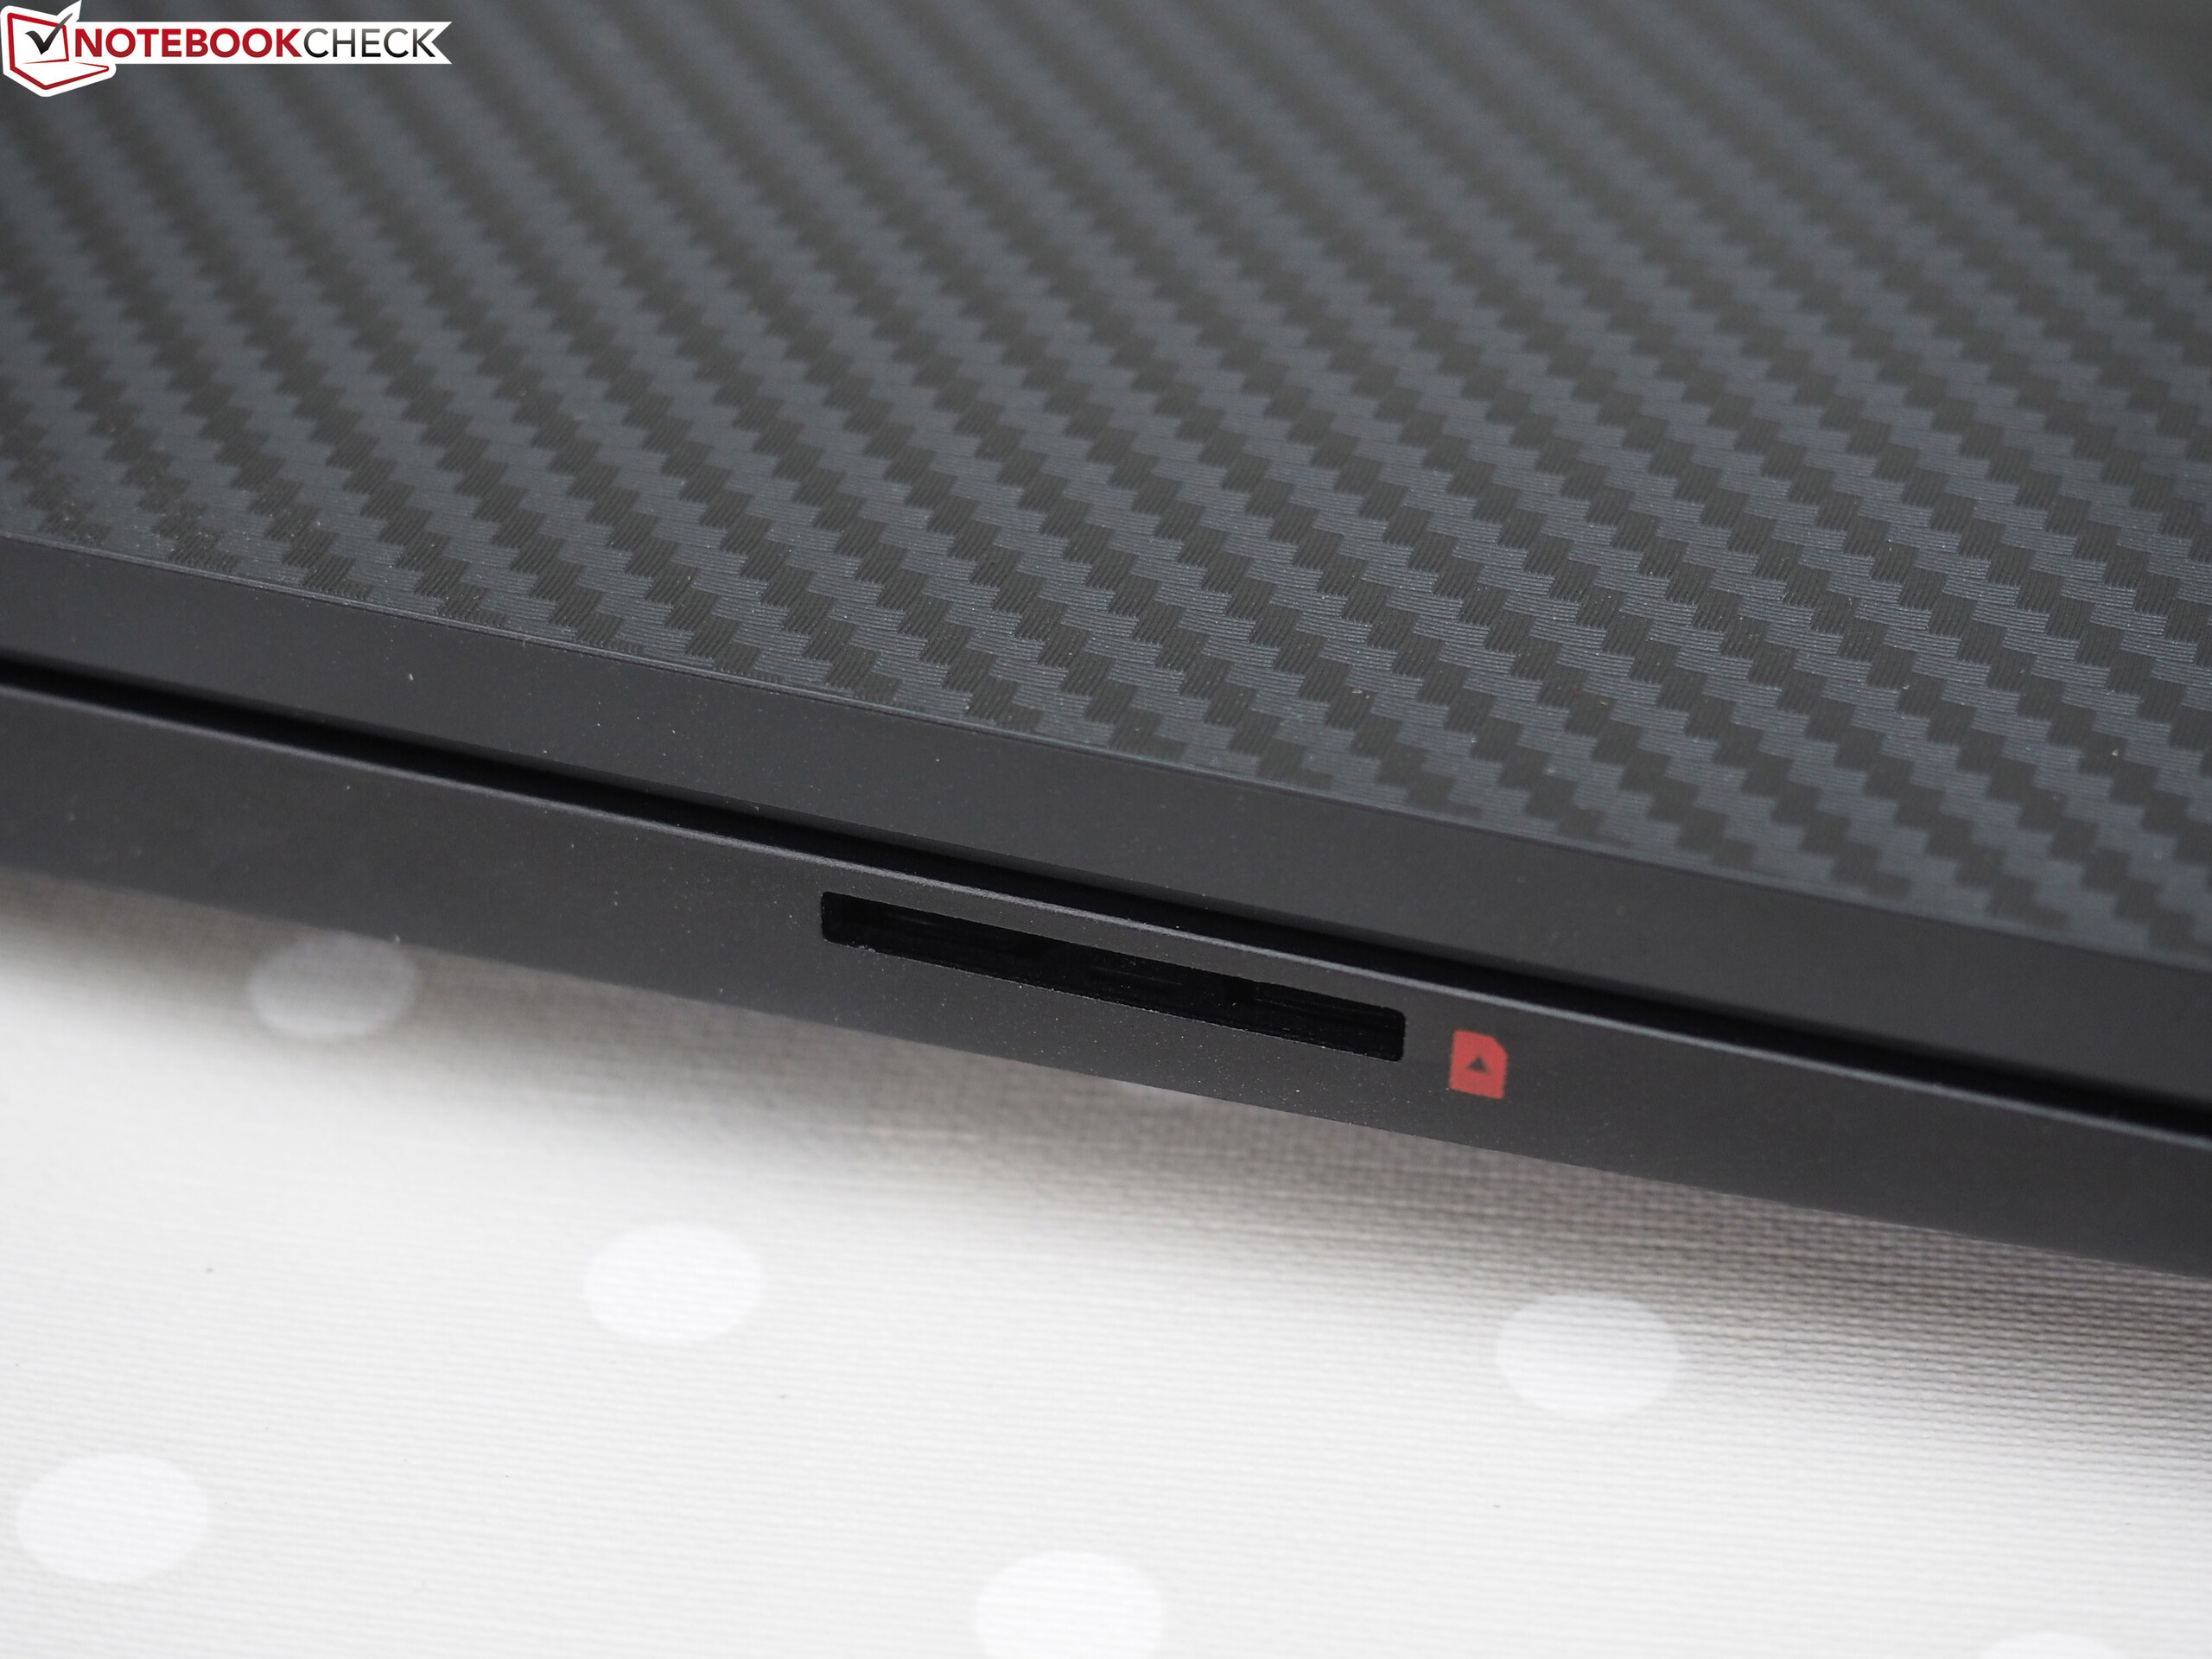
| SD Card Reader | |
| average JPG Copy Test (av. of 3 runs) | |
| Average of class Gaming (20.9 - 210, n=54, last 2 years) | |
| HP Omen 15-dc0015ng (Toshiba Exceria Pro SDXC 64 GB UHS-II) | |
| HP Omen 15-dc0001ng (Toshiba Exceria Pro SDXC 64 GB UHS-II) | |
| MSI GE63 Raider RGB 8RF-008 (Toshiba Exceria Pro SDXC 64 GB UHS-II) | |
| Schenker XMG Neo 15 (Toshiba Exceria Pro SDXC 64 GB UHS-II) | |
| maximum AS SSD Seq Read Test (1GB) | |
| Average of class Gaming (25.5 - 261, n=51, last 2 years) | |
| HP Omen 15-dc0001ng (Toshiba Exceria Pro SDXC 64 GB UHS-II) | |
| HP Omen 15-dc0015ng (Toshiba Exceria Pro SDXC 64 GB UHS-II) | |
| MSI GE63 Raider RGB 8RF-008 (Toshiba Exceria Pro SDXC 64 GB UHS-II) | |
| Schenker XMG Neo 15 (Toshiba Exceria Pro SDXC 64 GB UHS-II) | |
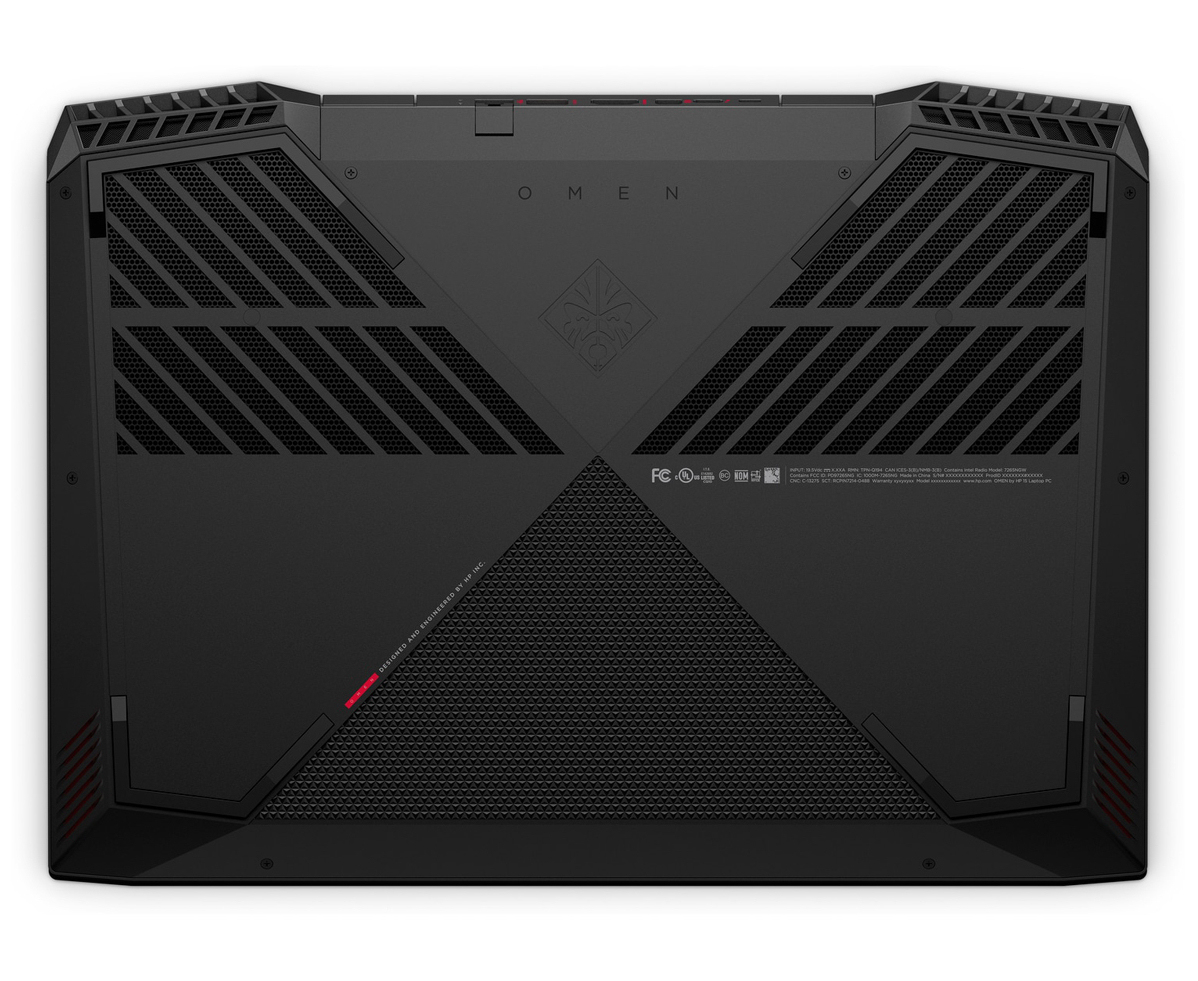
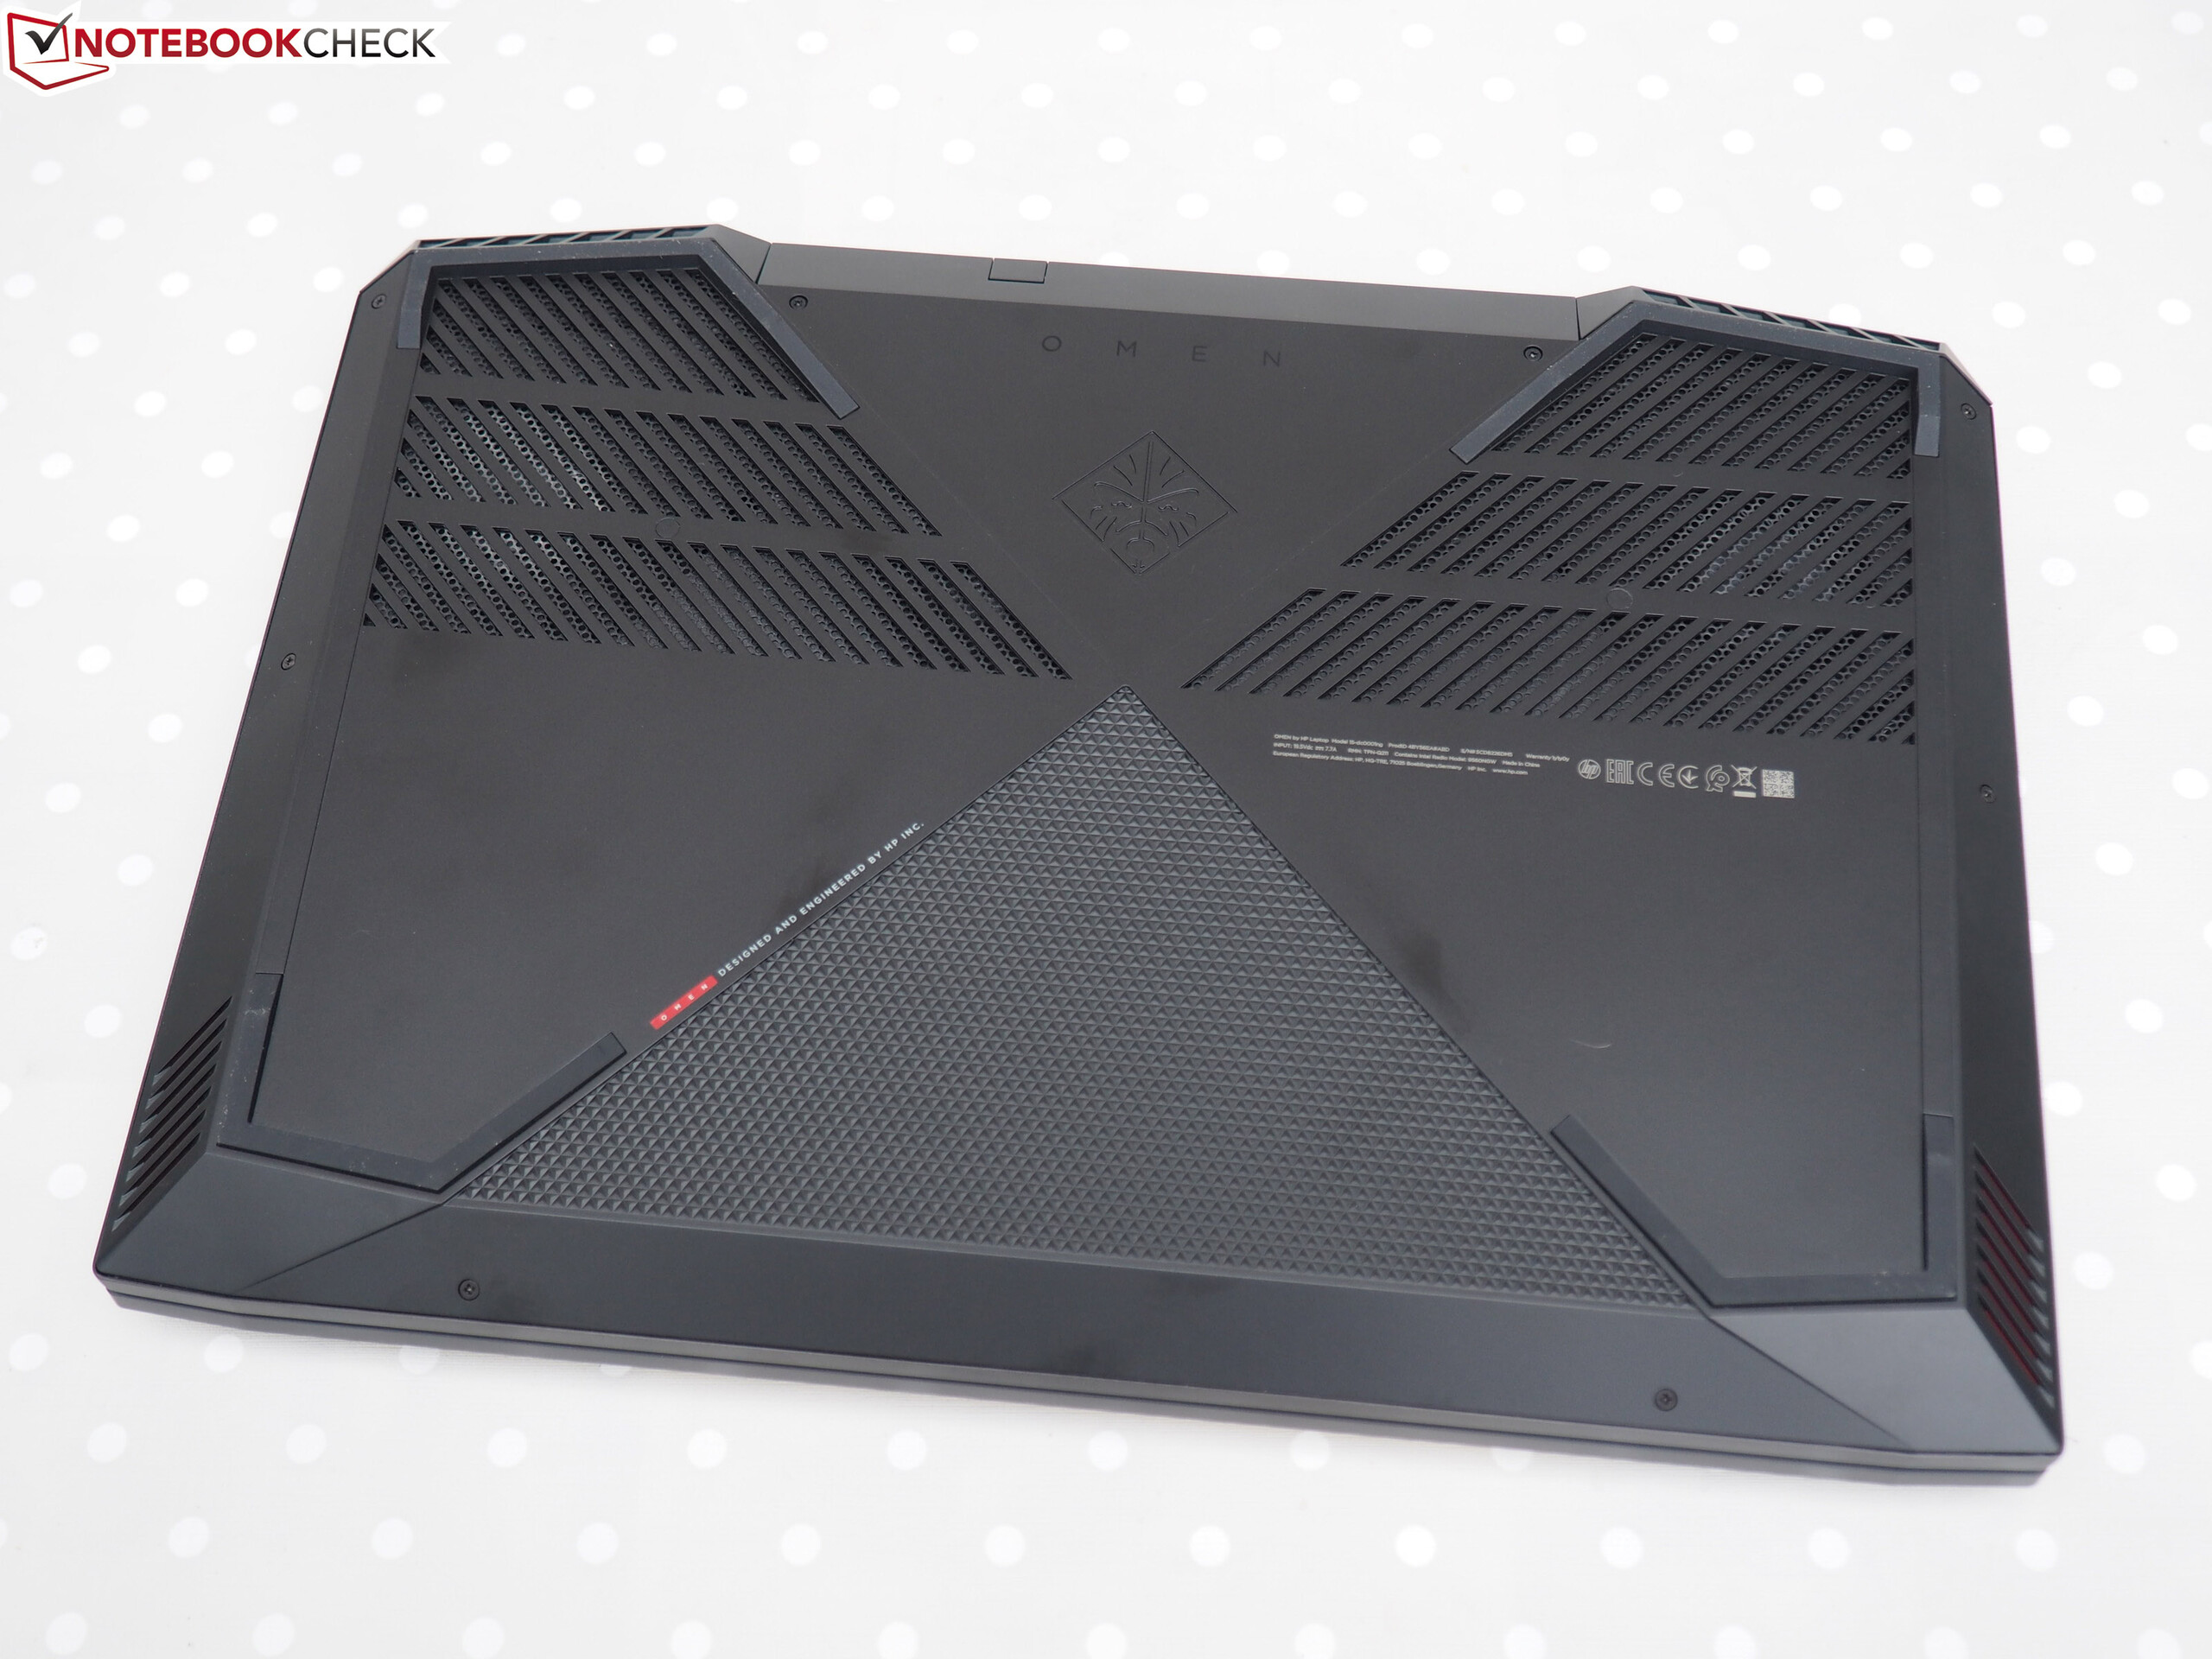
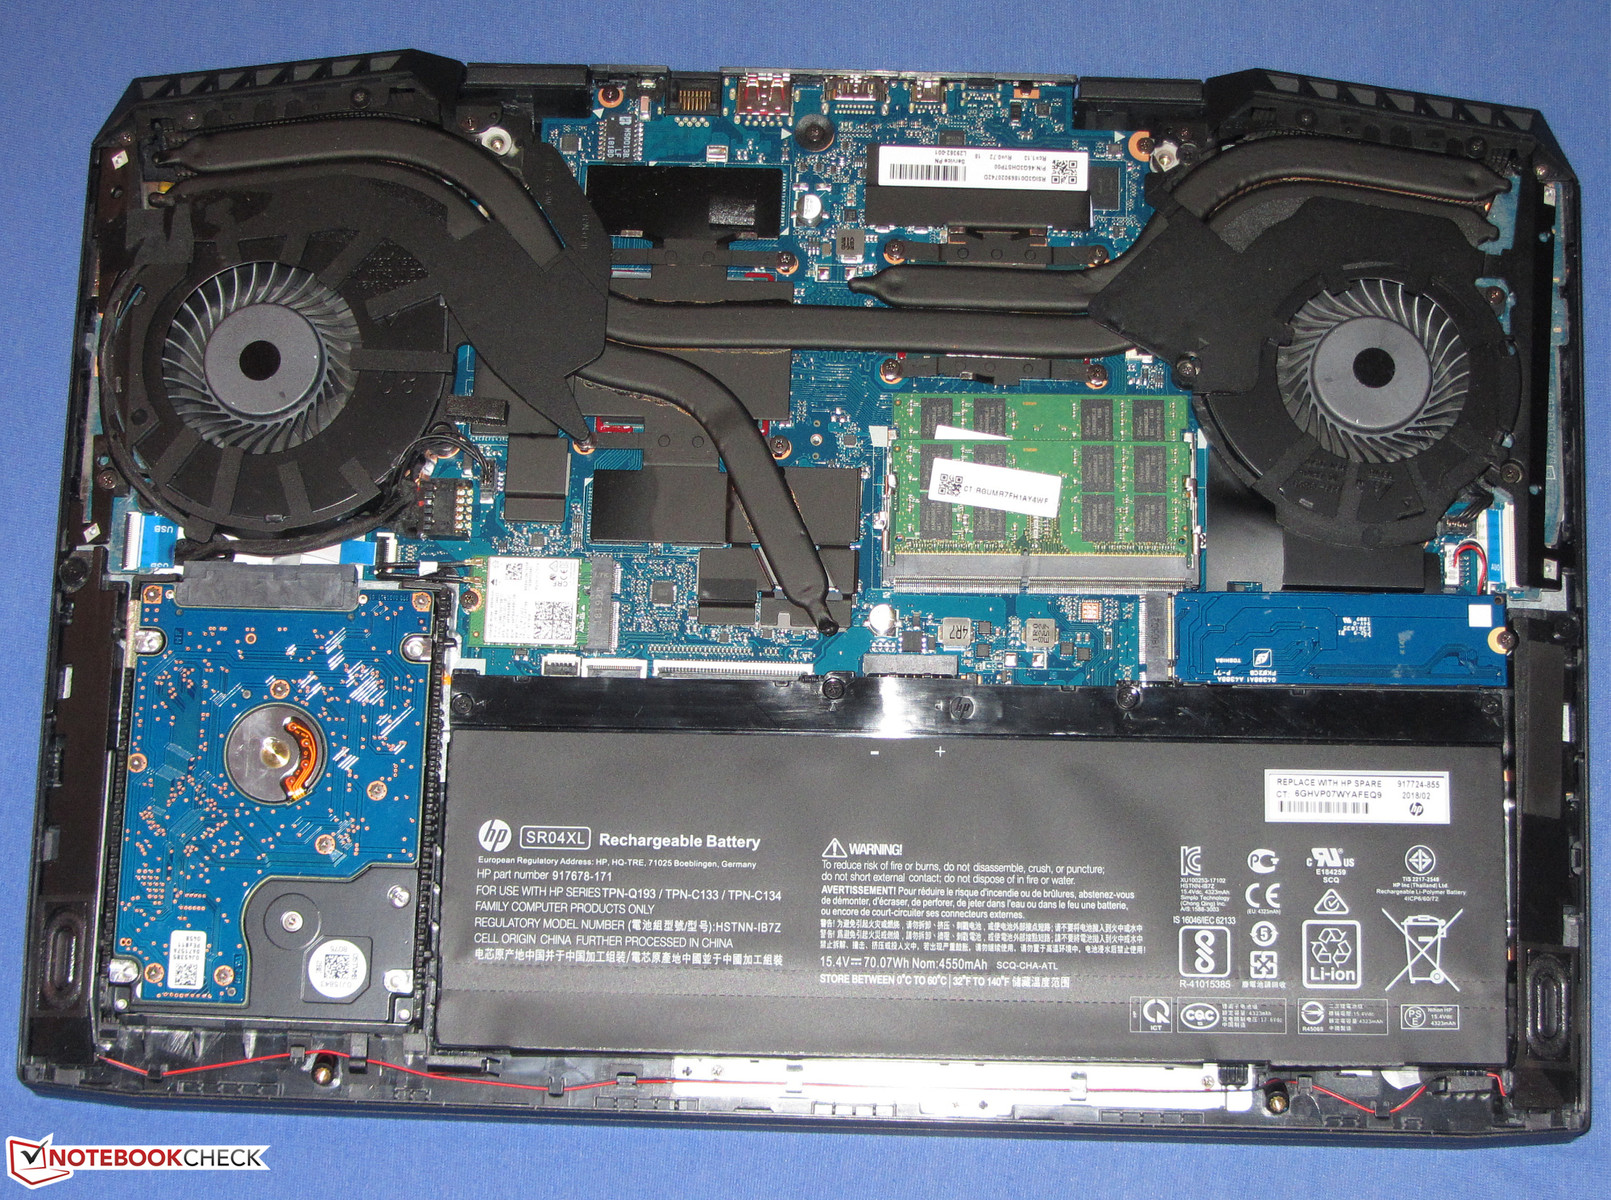
Maintenance
The Omen does not offer a maintenance cover. In order to access the insides, you have to remove the bottom of the case. While the case bottom of the sibling model we tested previously was so incredibly tight that we were unable to take it off, our current test unit shows some significant improvement. After we removed all the screws from bottom of the case, we were able to take off the case cover. To do this, we recommend starting at the level of the touchpad, where the plastic clips are not too tight and can be loosened by slightly bending the top of the base unit. The rest of the clips can then be unclipped using a prying tool such as a spatula.
Display - Responsive IPS model
The Omen is equipped with a matte 15.6-inch display that has a native resolution of 1920x1080 pixels. The brightness (283.4 cd/m²) and the contrast (511:1) turn out too low for a notebook of this price class. While the displays of many competitors in our comparison field have a maximum brightness that is even lower, they all offer a higher contrast. In general, we consider values above 300 cd/m² and 1000:1 to be good. It is positive that the display does not show PWM flickering at any time.
The 144-Hz panel supports Nvidia's G-Sync technology. This dynamically adjusts the frame rates of the display and GPU, which is supposed to create a smooth viewing experience particularly in computer games. According to the maintenance manual, G-Sync is also available for external monitors.


| |||||||||||||||||||||||||
Brightness Distribution: 76 %
Center on Battery: 317 cd/m²
Contrast: 511:1 (Black: 0.62 cd/m²)
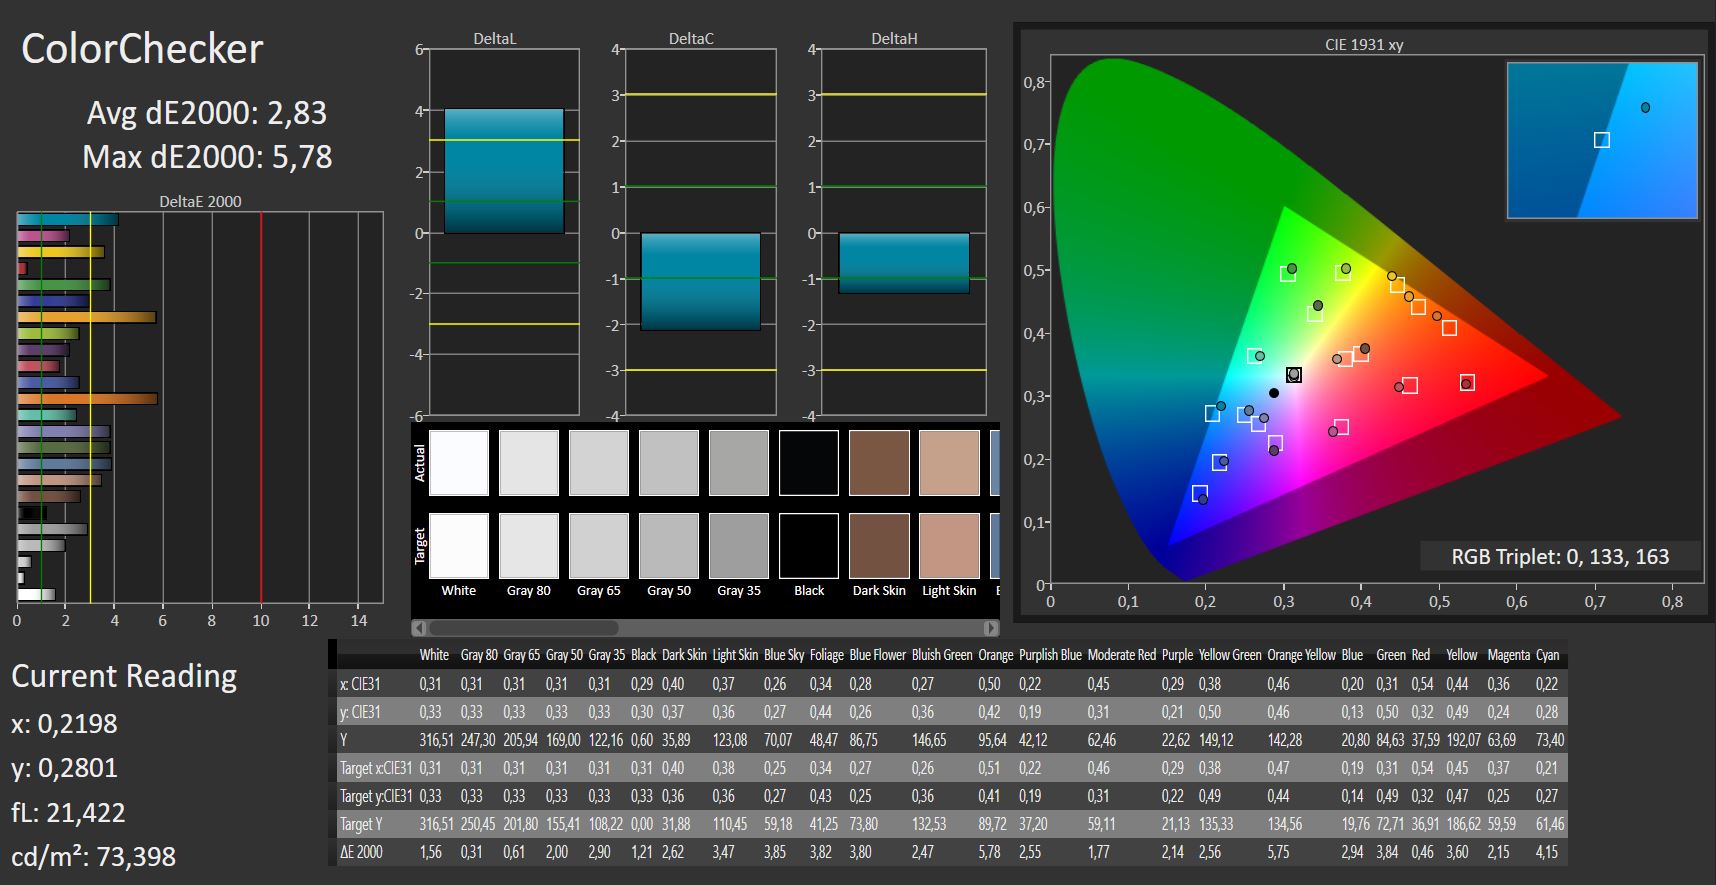
ΔE ColorChecker Calman: 2.83 | ∀{0.5-29.43 Ø4.73}
ΔE Greyscale Calman: 2 | ∀{0.09-98 Ø4.97}
93% sRGB (Argyll 1.6.3 3D)
60% AdobeRGB 1998 (Argyll 1.6.3 3D)
65.1% AdobeRGB 1998 (Argyll 3D)
93.4% sRGB (Argyll 3D)
64.2% Display P3 (Argyll 3D)
Gamma: 2.28
CCT: 6493 K
| HP Omen 15-dc0015ng IPS, 1920x1080, 15.6" | HP Omen 15-dc0001ng IPS, 1920x1080, 15.6" | MSI P65 8RF-451 - Creator IPS, 1920x1080, 15.6" | Asus Zephyrus S GX531GS IPS, 1920x1080, 15.6" | Razer Blade 15 GTX 1060 IPS, 1920x1080, 15.6" | Schenker XMG Neo 15 IPS, 1920x1080, 15.6" | MSI GE63 Raider RGB 8RF-008 TN, 1920x1080, 15.6" | |
|---|---|---|---|---|---|---|---|
| Display | -37% | 0% | 1% | 0% | 0% | 26% | |
| Display P3 Coverage (%) | 64.2 | 39.64 -38% | 65.1 1% | 66.7 4% | 64.4 0% | 64.3 0% | 90 40% |
| sRGB Coverage (%) | 93.4 | 59 -37% | 91.1 -2% | 91.2 -2% | 93.4 0% | 94.1 1% | 100 7% |
| AdobeRGB 1998 Coverage (%) | 65.1 | 40.95 -37% | 65.9 1% | 66.7 2% | 65.5 1% | 65.3 0% | 86 32% |
| Response Times | -187% | 3% | 33% | 6% | 10% | -44% | |
| Response Time Grey 50% / Grey 80% * (ms) | 17 ? | 47.2 ? -178% | 16 ? 6% | 7.4 ? 56% | 13.6 ? 20% | 16 ? 6% | 24.4 ? -44% |
| Response Time Black / White * (ms) | 11 ? | 32.4 ? -195% | 11 ? -0% | 10 ? 9% | 12 ? -9% | 9.6 ? 13% | 15.8 ? -44% |
| PWM Frequency (Hz) | 200 ? | 25510 ? | |||||
| Screen | -14% | 14% | 20% | 22% | 17% | -6% | |
| Brightness middle (cd/m²) | 317 | 275 -13% | 235 -26% | 294 -7% | 304.3 -4% | 325 3% | 292 -8% |
| Brightness (cd/m²) | 283 | 254 -10% | 235 -17% | 275 -3% | 293 4% | 303 7% | 258 -9% |
| Brightness Distribution (%) | 76 | 90 18% | 85 12% | 84 11% | 80 5% | 90 18% | 81 7% |
| Black Level * (cd/m²) | 0.62 | 0.27 56% | 0.22 65% | 0.24 61% | 0.38 39% | 0.33 47% | 0.23 63% |
| Contrast (:1) | 511 | 1019 99% | 1068 109% | 1225 140% | 801 57% | 985 93% | 1270 149% |
| Colorchecker dE 2000 * | 2.83 | 4.62 -63% | 2.82 -0% | 2.57 9% | 1.79 37% | 2.69 5% | 5.82 -106% |
| Colorchecker dE 2000 max. * | 5.78 | 8.05 -39% | 4.82 17% | 4.88 16% | 3.69 36% | 4.91 15% | 9.05 -57% |
| Greyscale dE 2000 * | 2 | 4.31 -115% | 2.32 -16% | 2.41 -21% | 1.1 45% | 2.34 -17% | 4.61 -131% |
| Gamma | 2.28 96% | 2.49 88% | 2.49 88% | 2.5 88% | 2.27 97% | 2.38 92% | 2.65 83% |
| CCT | 6493 100% | 7000 93% | 6310 103% | 6370 102% | 6665 98% | 6872 95% | 6950 94% |
| Color Space (Percent of AdobeRGB 1998) (%) | 60 | 38 -37% | 59 -2% | 59 -2% | 59.8 0% | 60 0% | 76 27% |
| Color Space (Percent of sRGB) (%) | 93 | 59 -37% | 92 -1% | 91 -2% | 92.8 0% | 94 1% | 100 8% |
| Colorchecker dE 2000 calibrated * | 3.59 | 4.88 | 2.14 | 1.27 | 2.82 | ||
| Total Average (Program / Settings) | -79% /
-42% | 6% /
10% | 18% /
18% | 9% /
15% | 9% /
13% | -8% /
-4% |
* ... smaller is better
Screen Flickering / PWM (Pulse-Width Modulation)
| Screen flickering / PWM not detected | 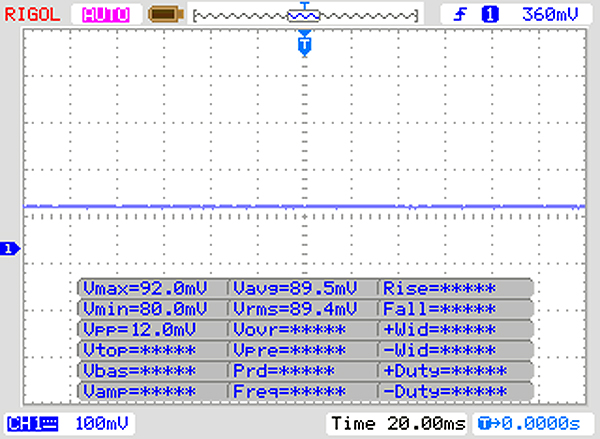 | ||
In comparison: 52 % of all tested devices do not use PWM to dim the display. If PWM was detected, an average of 7794 (minimum: 5 - maximum: 343500) Hz was measured. | |||
The display offers a fairly good color reproduction already in the state of delivery. With a DeltaE-2000 color deviation of 2.83, the display is within the ideal range (DeltaE smaller than 3). It does not suffer from a blue tint. The display is unable to reproduce the AdobeRGB and sRGB color spaces, with the coverage rates lying at 60% (AdobeRGB) and 93% (sRGB).
The color reproduction of the display can be improved with the provided color profile. However, you have to make sure that you have the same display model (manufacturer and model number) as our test unit, otherwise the color reproduction can become worse instead of improving. Often displays from different manufacturers can be used within the same notebook model series.


Display Response Times
| ↔ Response Time Black to White | ||
|---|---|---|
| 11 ms ... rise ↗ and fall ↘ combined | ↗ 7 ms rise | 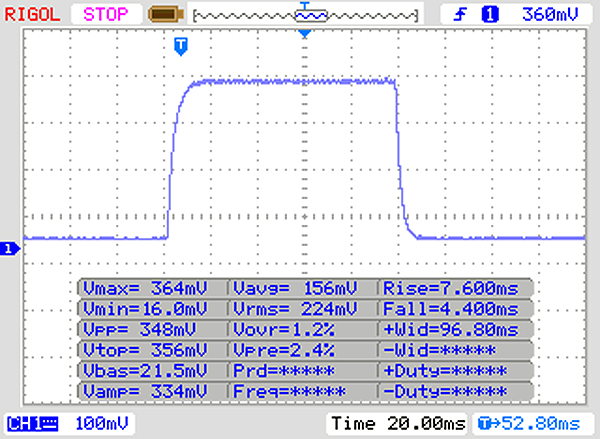 |
| ↘ 4 ms fall | ||
| The screen shows good response rates in our tests, but may be too slow for competitive gamers. In comparison, all tested devices range from 0.1 (minimum) to 240 (maximum) ms. » 29 % of all devices are better. This means that the measured response time is better than the average of all tested devices (19.9 ms). | ||
| ↔ Response Time 50% Grey to 80% Grey | ||
| 17 ms ... rise ↗ and fall ↘ combined | ↗ 9 ms rise | 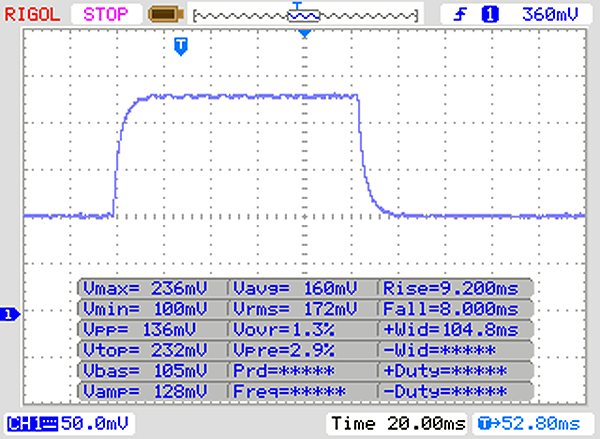 |
| ↘ 8 ms fall | ||
| The screen shows good response rates in our tests, but may be too slow for competitive gamers. In comparison, all tested devices range from 0.165 (minimum) to 636 (maximum) ms. » 31 % of all devices are better. This means that the measured response time is better than the average of all tested devices (31.1 ms). | ||
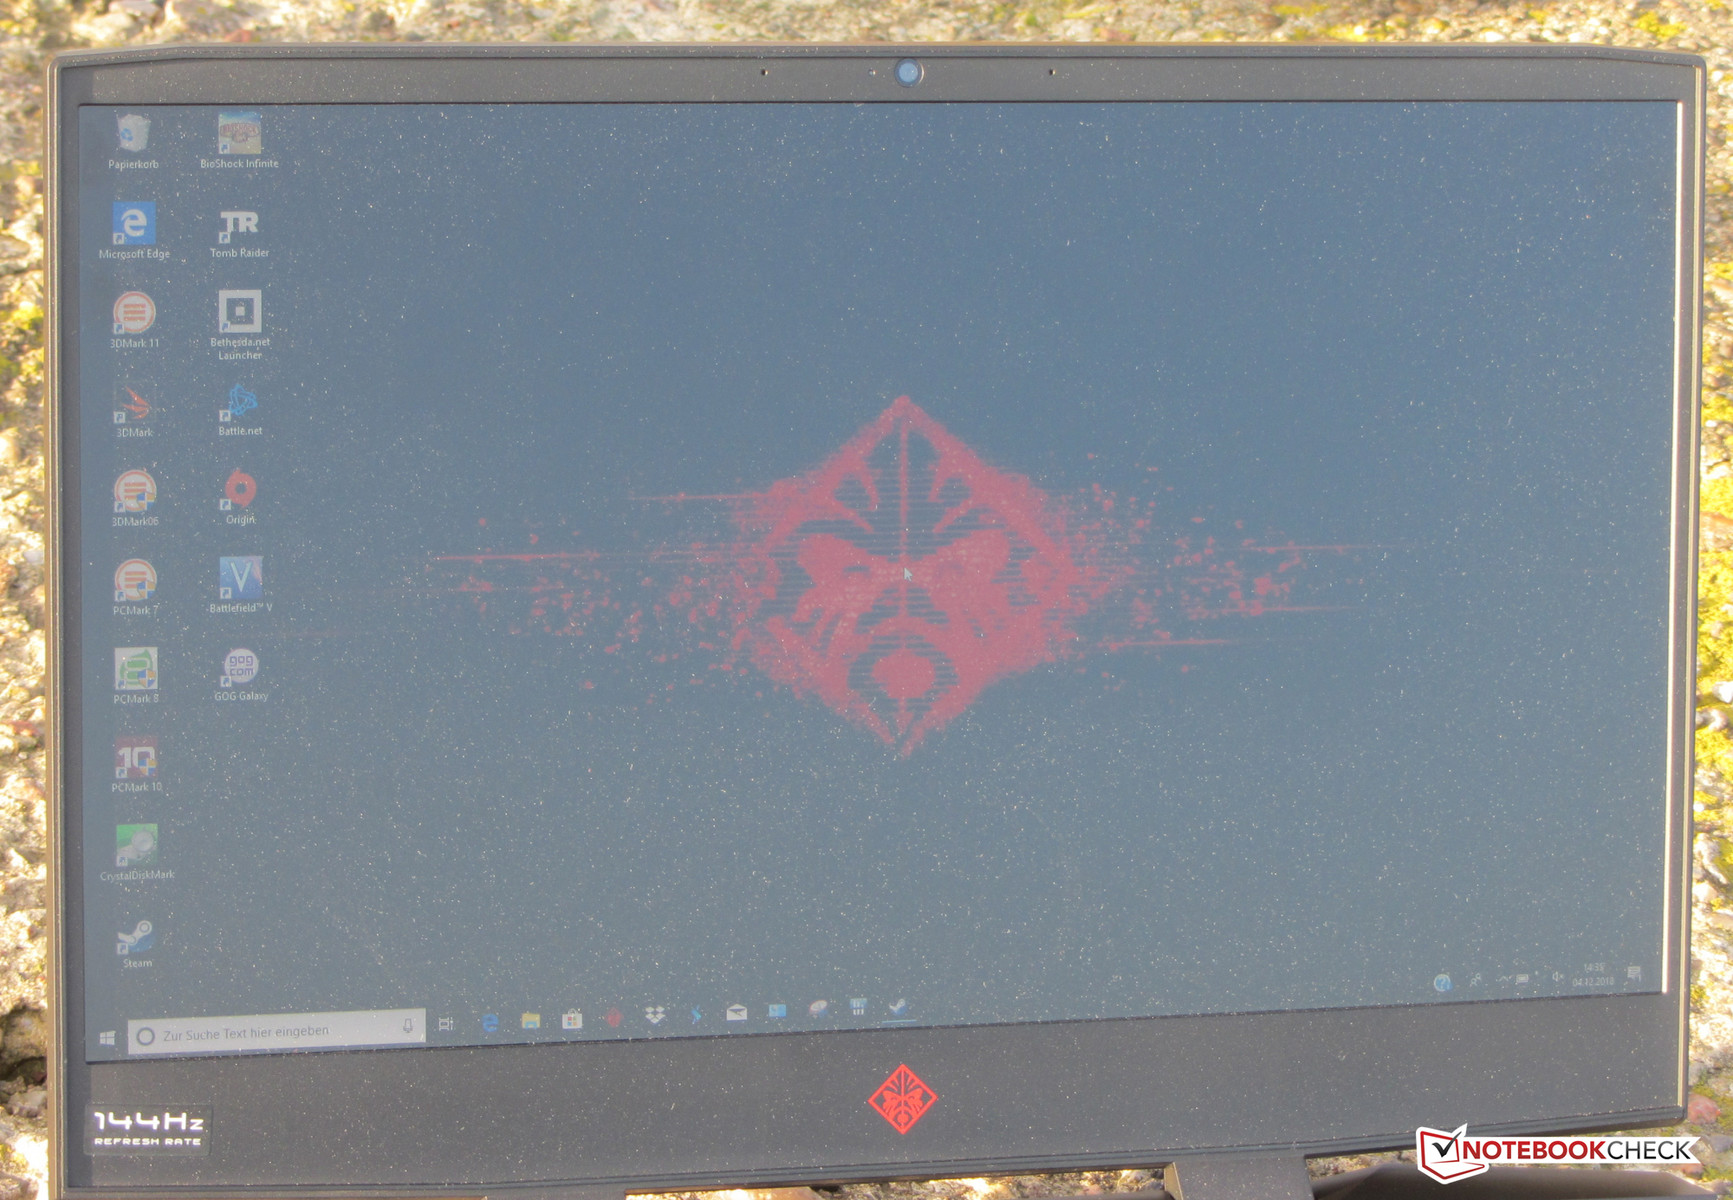
HP has equipped the Omen with an IPS panel with stable viewing angles, so that the display can be read from any position. The display brightness is sufficient for indoor usage. Outdoors, you can only read the display if the sun is not too bright.

Performance - Sufficient for the next few years
With the Omen 15, HP offers a gaming notebook in the 15.6-inch format that can bring all the current computer games to the screen smoothly. While you have to pay about 2100 Euros (~$2396) for our test unit, other equipment configurations are available, with the prices starting at about 900 Euros (~$1027).

Processor
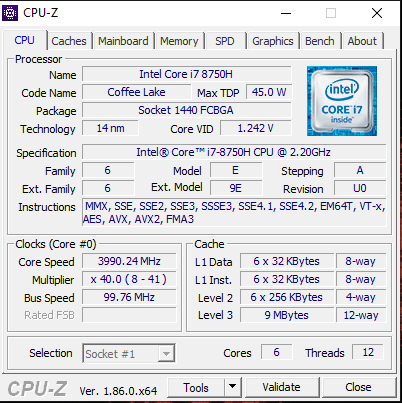
HP has equipped the Omen with an Intel Core i7-8750H hexa-core processor, which is a model based on the Coffee Lake architecture. Since the performance per MHz remained unchanged compared to Kaby Lake, the additional cores and the higher clock speeds are responsible for the additional performance.
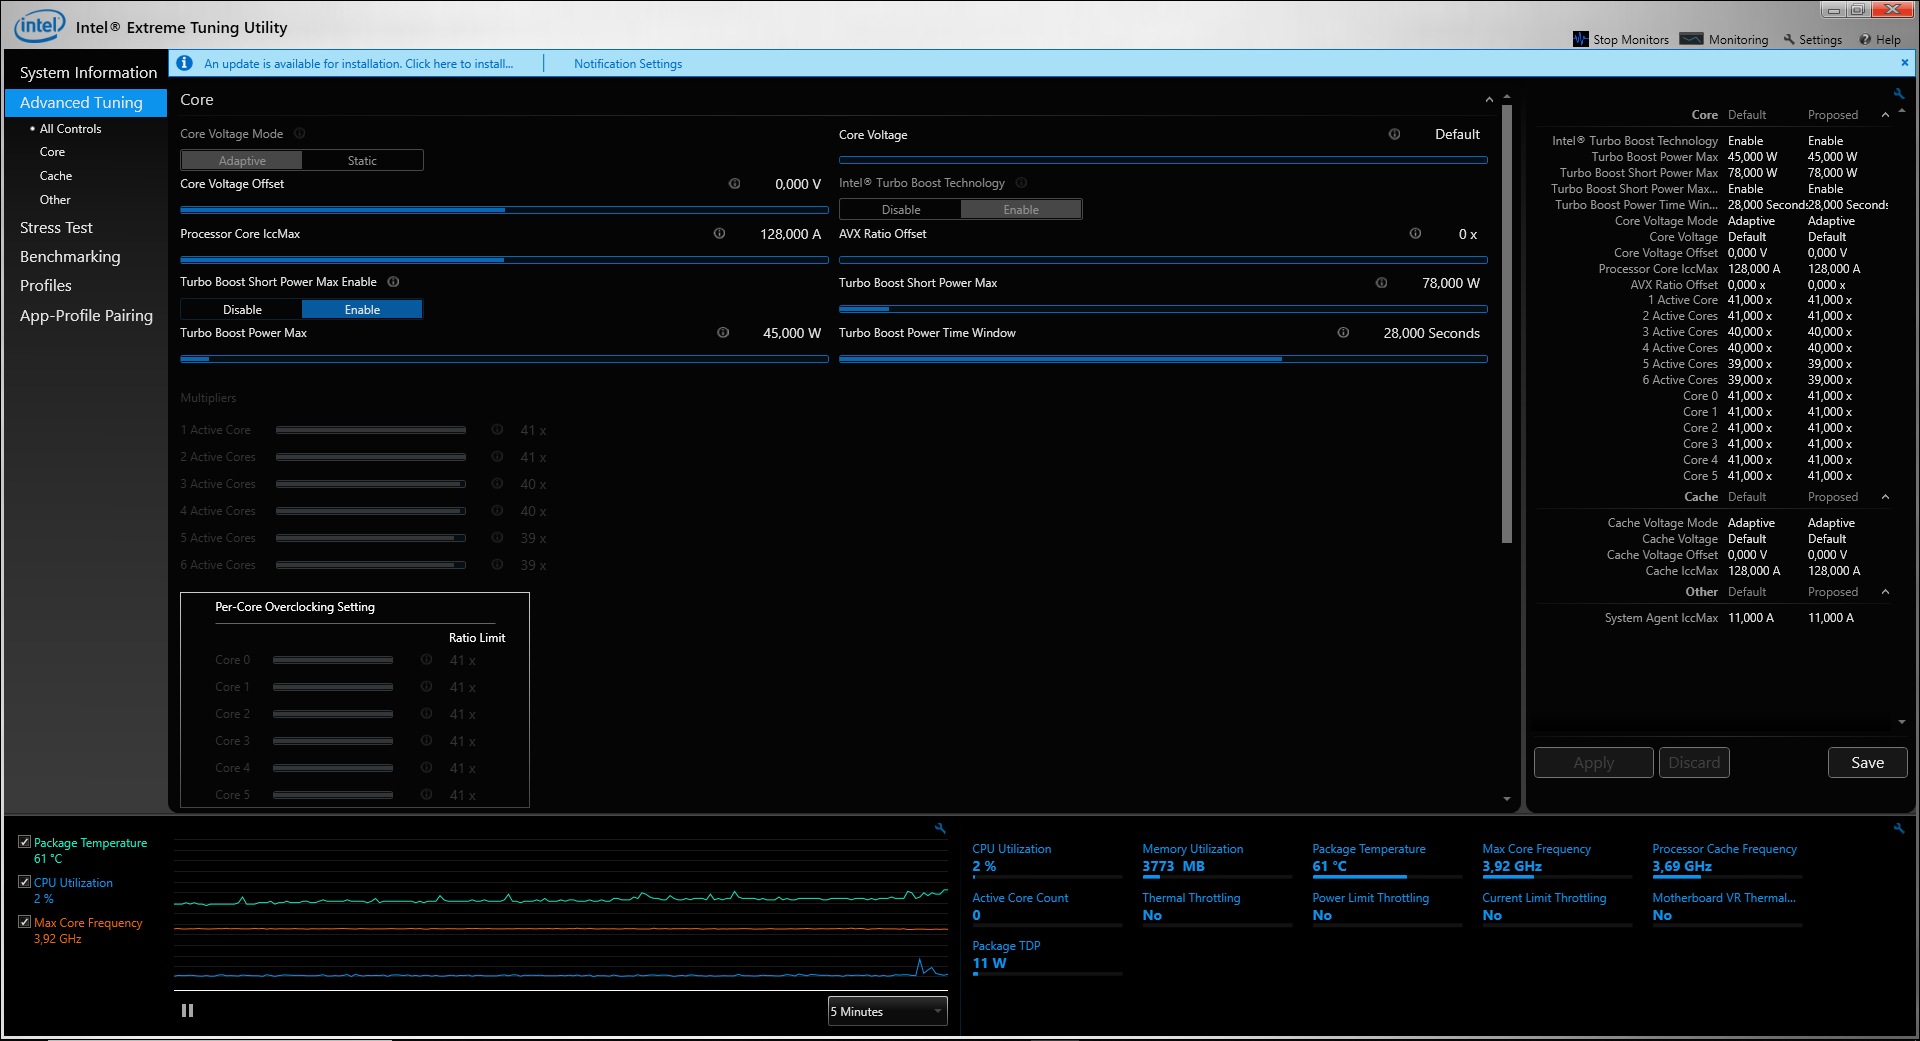
The processor operates at a basic clock speed of 2.2 GHz, which can be increased via Turbo to 3.9 GHz (six cores), 4 GHz (four cores), and 4.1 GHz (one/two cores), respectively. The Core i7 has a TDP of 45 watts. Hewlett-Packard allows a short-term increase of the TDP up to 78 watts.
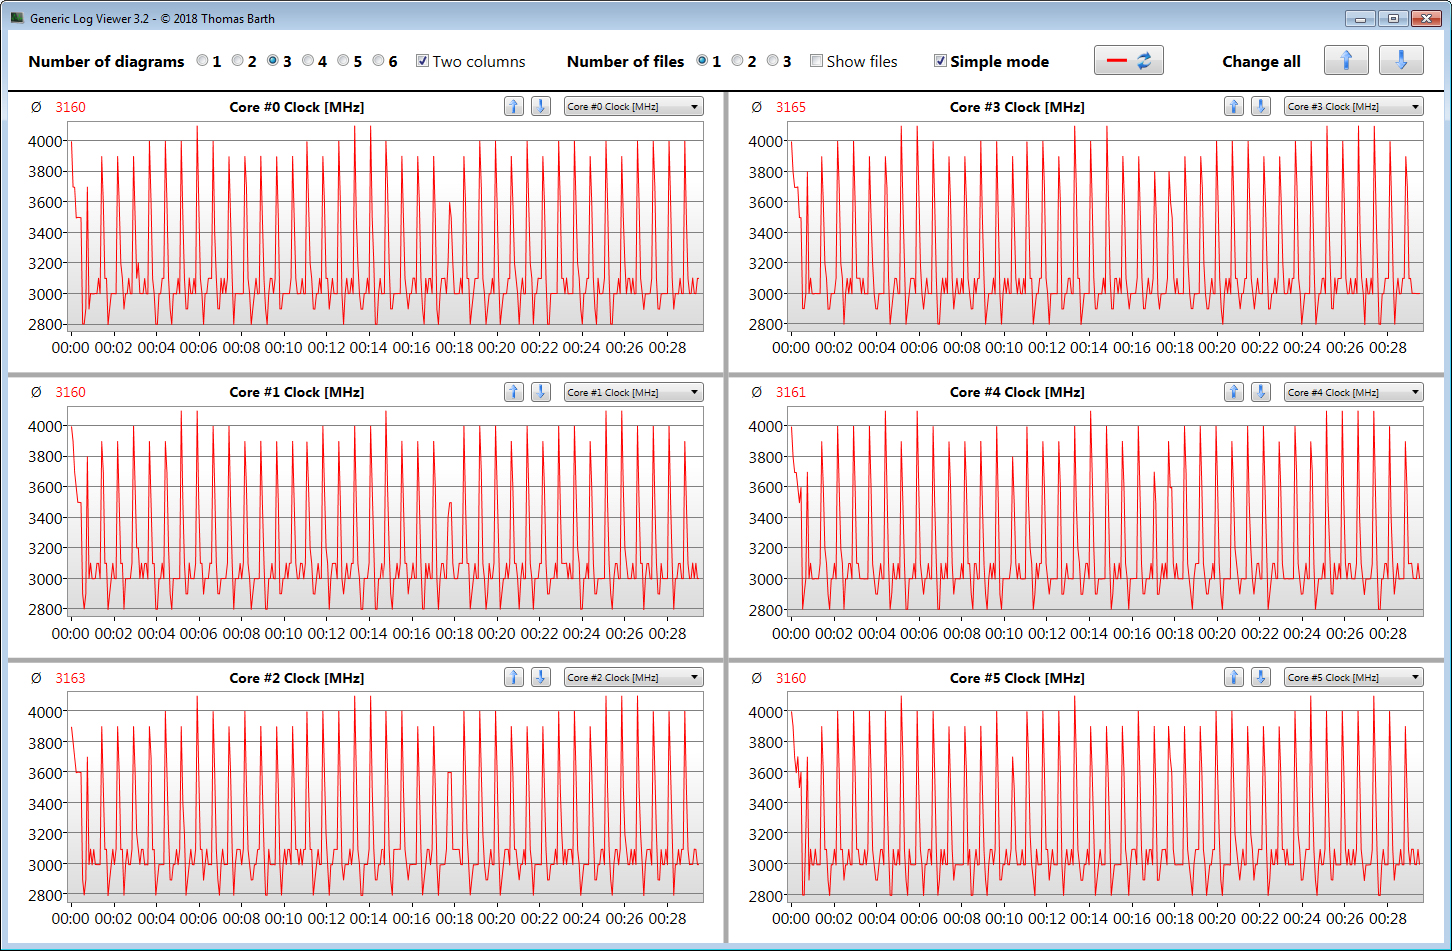
In the multithread tests of the Cinebench benchmarks, the processor runs for a few seconds at 3.5 to 4.1 GHz, but then the clock speed drops to 2.8 - 2.9 GHz. It runs through the single-thread tests at 3.9 - 4.1 GHz in mains operation. During battery operation, the CPU runs at 2.2 GHz (multithread) and 2.2 - 2.9 GHz (single-thread).

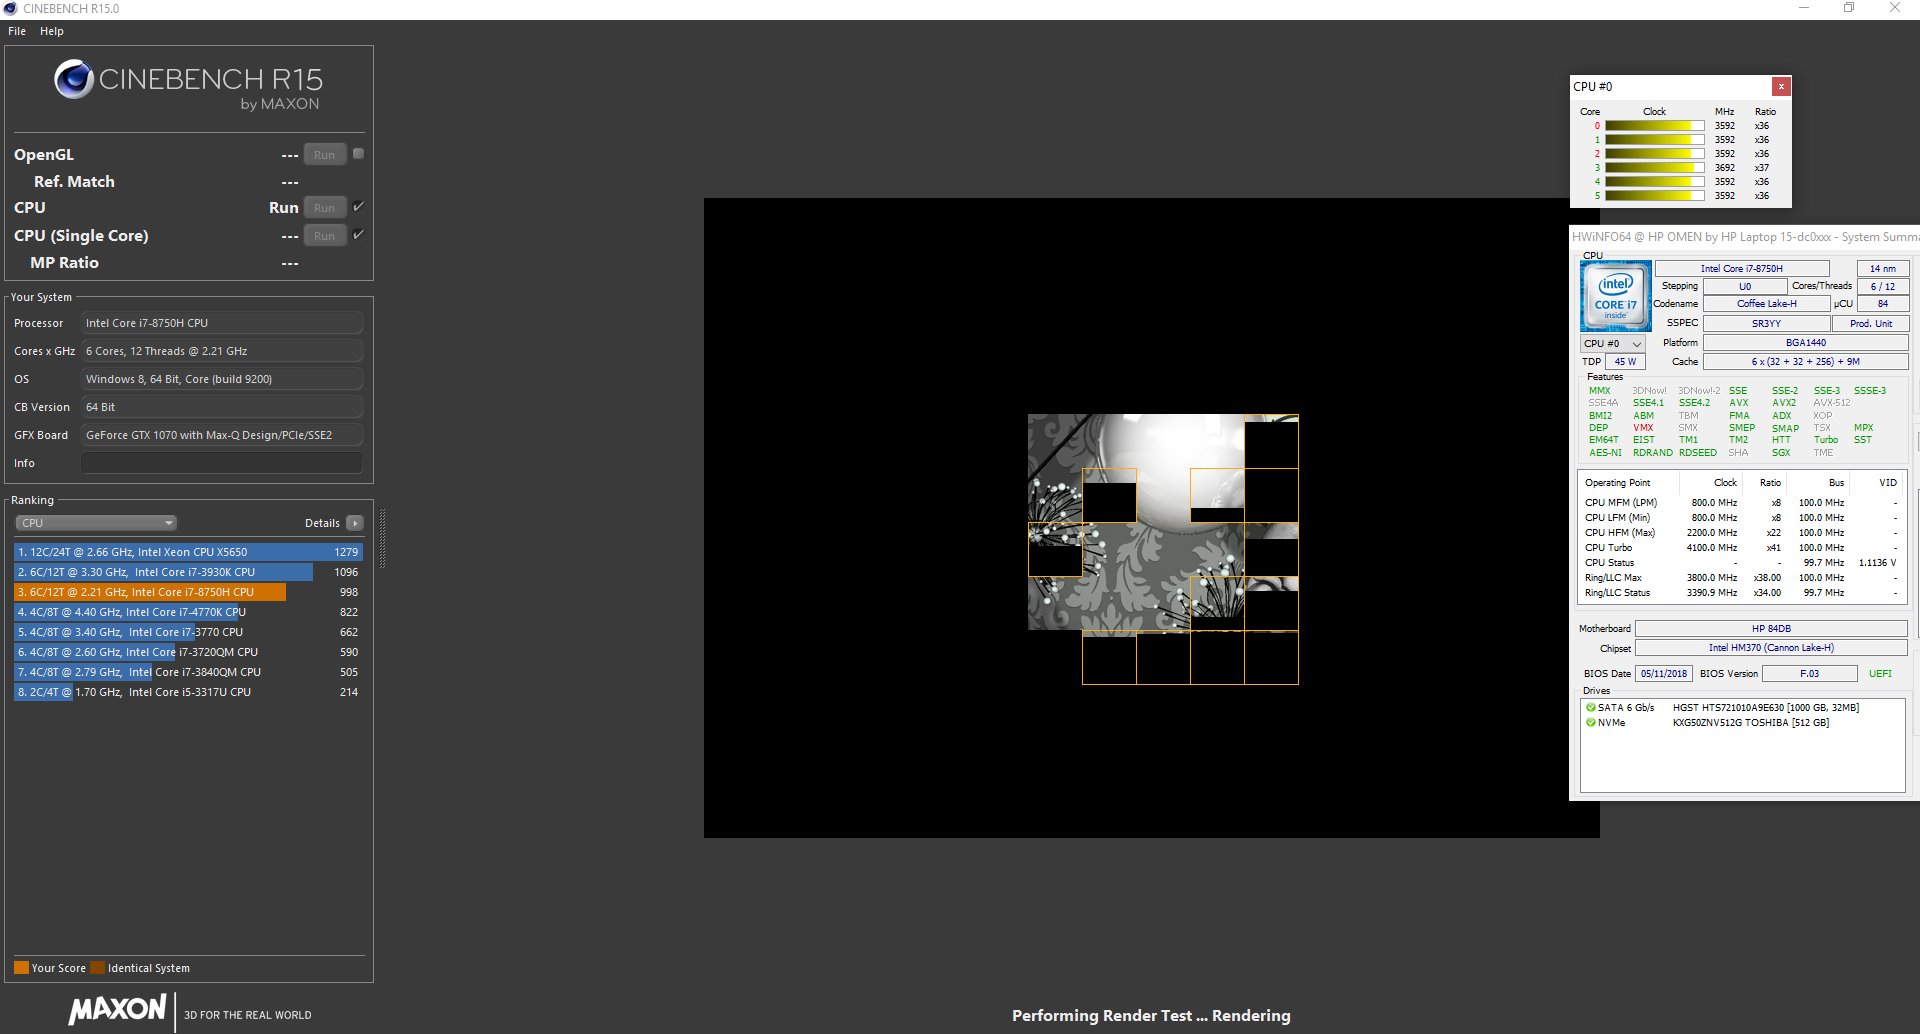
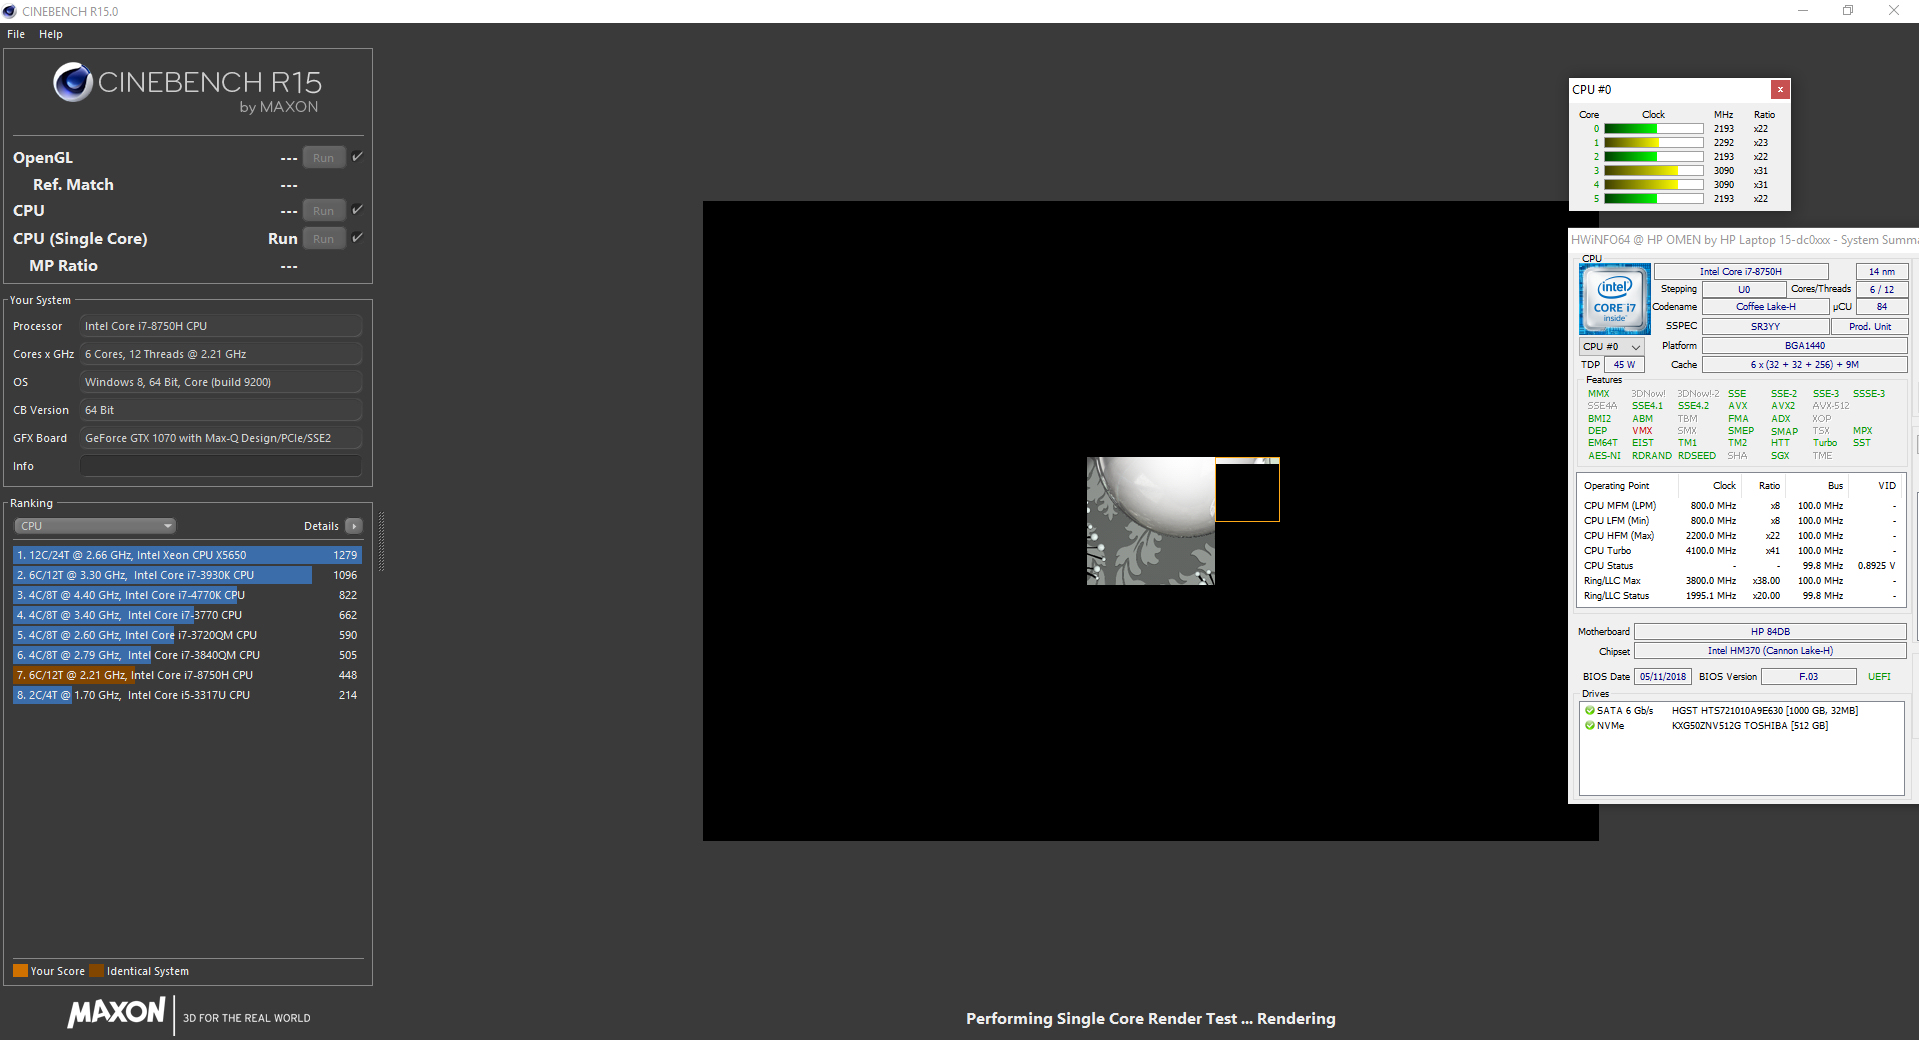
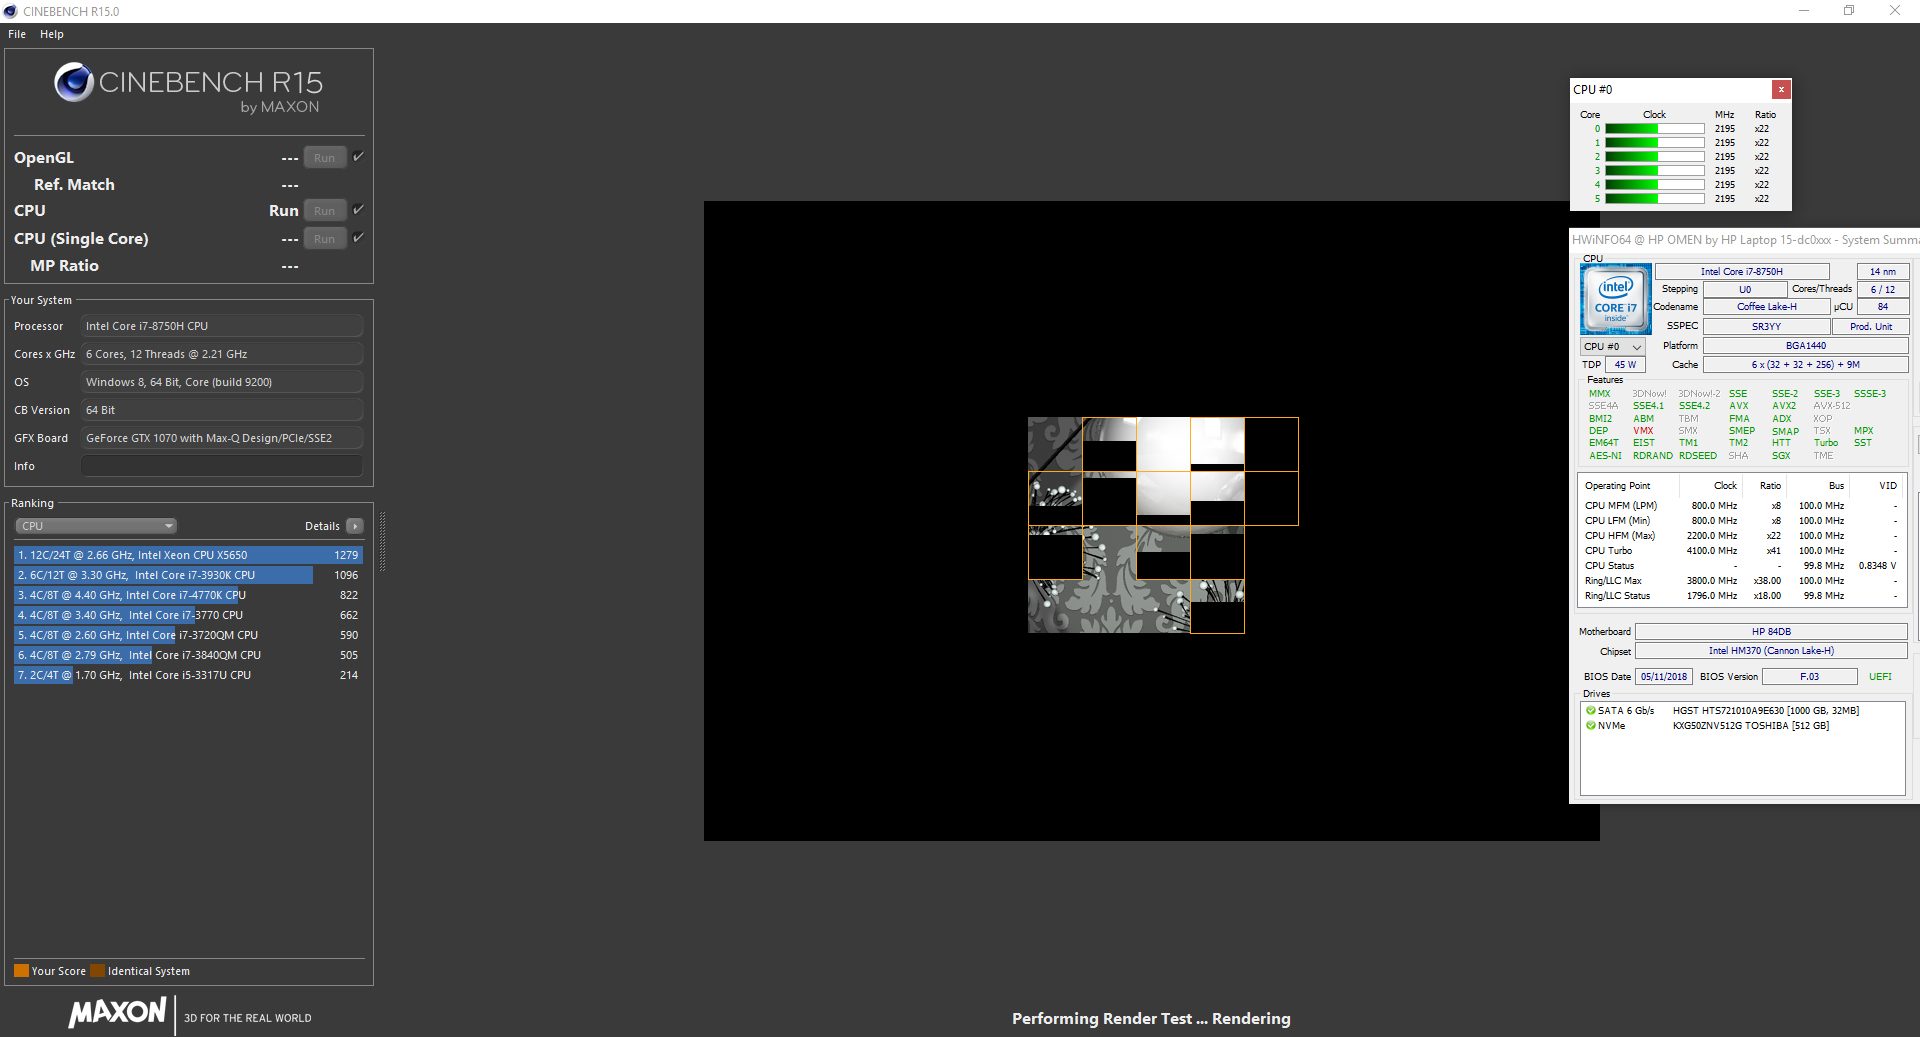
We check whether Turbo is used continuously during mains operation by running the multithread test of Cinebench R15 in a continuous loop for about 30 minutes. Between the first and second run, the results drop slightly and then remain on a constant level. The Turbo is used.
| Cinebench R10 | |
| Rendering Multiple CPUs 32Bit | |
| Average of class Gaming (42932 - 81339, n=8, last 2 years) | |
| Average Intel Core i7-8750H (29664 - 35307, n=25) | |
| HP Omen 15-dc0015ng | |
| MSI P65 8RF-451 - Creator | |
| Rendering Single 32Bit | |
| Average of class Gaming (7457 - 11779, n=8, last 2 years) | |
| Average Intel Core i7-8750H (6236 - 6645, n=25) | |
| HP Omen 15-dc0015ng | |
| MSI P65 8RF-451 - Creator | |
| Geekbench 3 | |
| 32 Bit Multi-Core Score | |
| HP Omen 15-dc0015ng | |
| Average Intel Core i7-8750H (20725 - 22665, n=13) | |
| 32 Bit Single-Core Score | |
| HP Omen 15-dc0015ng | |
| Average Intel Core i7-8750H (3734 - 4163, n=13) | |
| Geekbench 4.0 | |
| 64 Bit Multi-Core Score | |
| Average of class Gaming (40469 - 76142, n=4, last 2 years) | |
| HP Omen 15-dc0015ng | |
| Average Intel Core i7-8750H (17048 - 22006, n=8) | |
| 64 Bit Single-Core Score | |
| Average of class Gaming (7589 - 9053, n=4, last 2 years) | |
| HP Omen 15-dc0015ng | |
| Average Intel Core i7-8750H (4548 - 4997, n=8) | |
| Geekbench 4.4 | |
| 64 Bit Multi-Core Score | |
| Average of class Gaming (89200 - 97490, n=2, last 2 years) | |
| HP Omen 15-dc0015ng | |
| Average Intel Core i7-8750H (17709 - 23313, n=17) | |
| MSI P65 8RF-451 - Creator | |
| 64 Bit Single-Core Score | |
| Average of class Gaming (9335 - 9492, n=2, last 2 years) | |
| HP Omen 15-dc0015ng | |
| Average Intel Core i7-8750H (4669 - 5146, n=17) | |
| MSI P65 8RF-451 - Creator | |
| Mozilla Kraken 1.1 - Total | |
| MSI P65 8RF-451 - Creator (EDGE: 42.17134.1.0) | |
| Average Intel Core i7-8750H (695 - 1272, n=50) | |
| HP Omen 15-dc0015ng (Edge 44) | |
| Razer Blade 15 GTX 1060 (Edge 42.17134.1.0) | |
| Average of class Gaming (391 - 590, n=105, last 2 years) | |
| Octane V2 - Total Score | |
| Average of class Gaming (87588 - 139447, n=30, last 2 years) | |
| HP Omen 15-dc0015ng (Edge 44) | |
| Razer Blade 15 GTX 1060 (Edge 42.17134.1.0) | |
| Average Intel Core i7-8750H (27460 - 44549, n=47) | |
| MSI P65 8RF-451 - Creator (EDGE: 42.17134.1.0) | |
| JetStream 1.1 - 1.1 Total | |
| Average of class Gaming (518 - 647, n=5, last 2 years) | |
| Razer Blade 15 GTX 1060 (Edge 42.17134.1.0) | |
| MSI P65 8RF-451 - Creator (EDGE: 42.17134.1.0) | |
| Average Intel Core i7-8750H (205 - 299, n=49) | |
| HP Omen 15-dc0015ng (Edge 44) | |
* ... smaller is better
System Performance
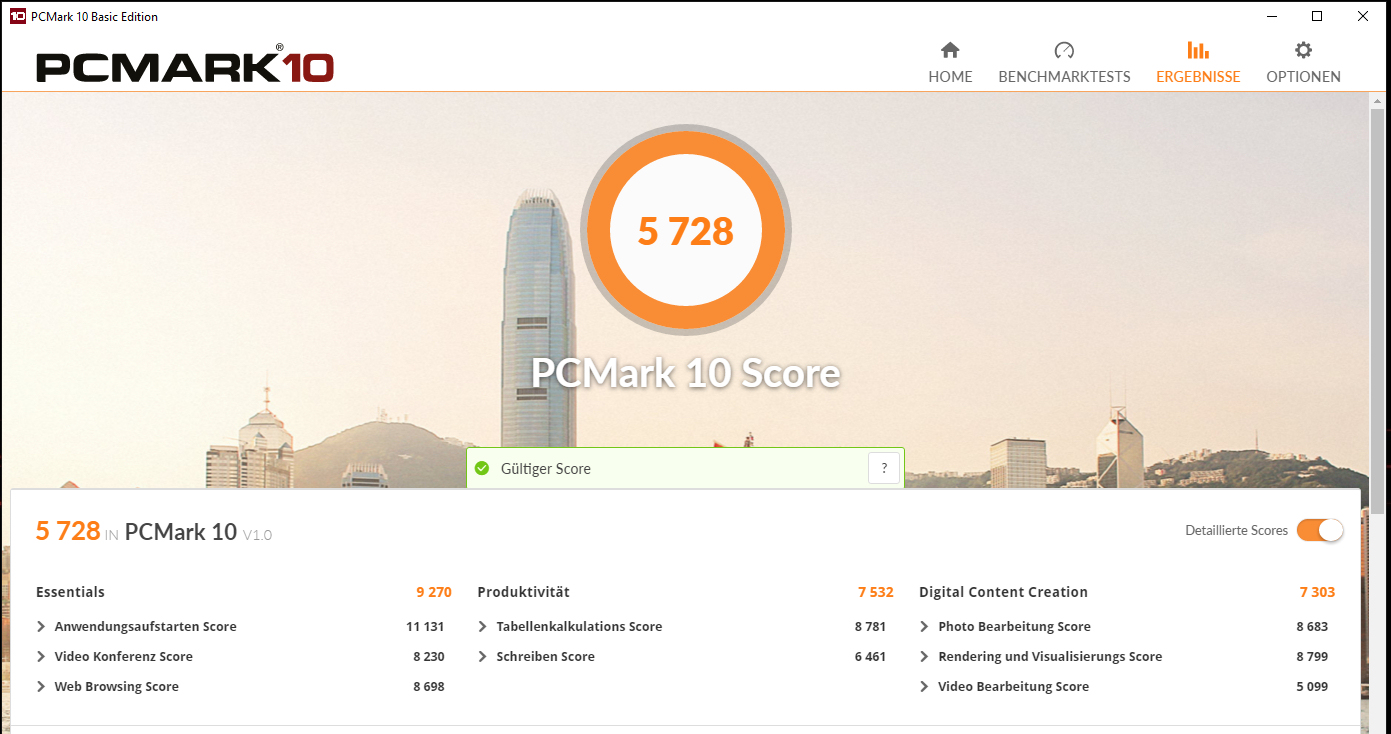
The Omen does not lack in system performance. This is confirmed by the very good results in the CPU, GPU, and PCMark benchmarks. But anything else would have been a surprise. After all, the notebook contains very powerful hardware. The hexa-core processor offers sufficient reserves for the next few years, and the dedicated graphics core enables playing computer games. We did not encounter any problems.
| PCMark 7 Score | 7168 points | |
| PCMark 8 Home Score Accelerated v2 | 5130 points | |
| PCMark 8 Creative Score Accelerated v2 | 5908 points | |
| PCMark 8 Work Score Accelerated v2 | 5818 points | |
| PCMark 10 Score | 5728 points | |
Help | ||
Storage Solution
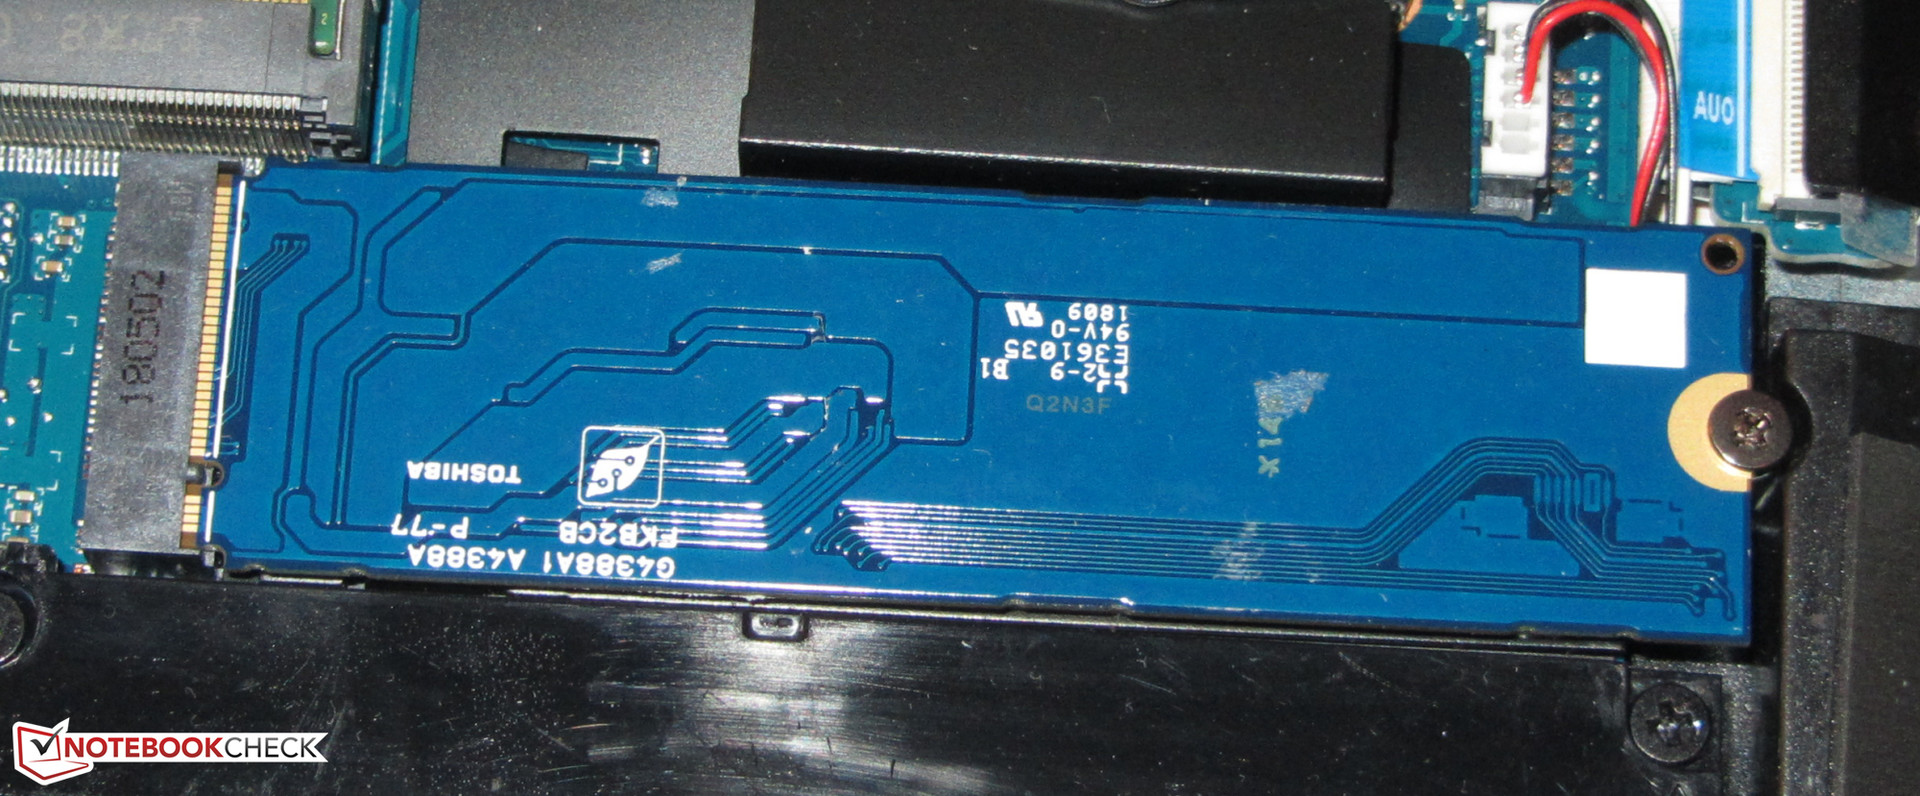
An NVMe SSD from Toshiba serves as the system drive. This is an M.2-2280 model that has a total capacity of 512 GB. In the state of delivery, about 433 GB of this is freely usable. The SSD delivers outstanding transfer rates. NVMe SSDs are connected via PCI Express 3.0 x4, which enables significantly higher transfer rates than a connection via SATA III.
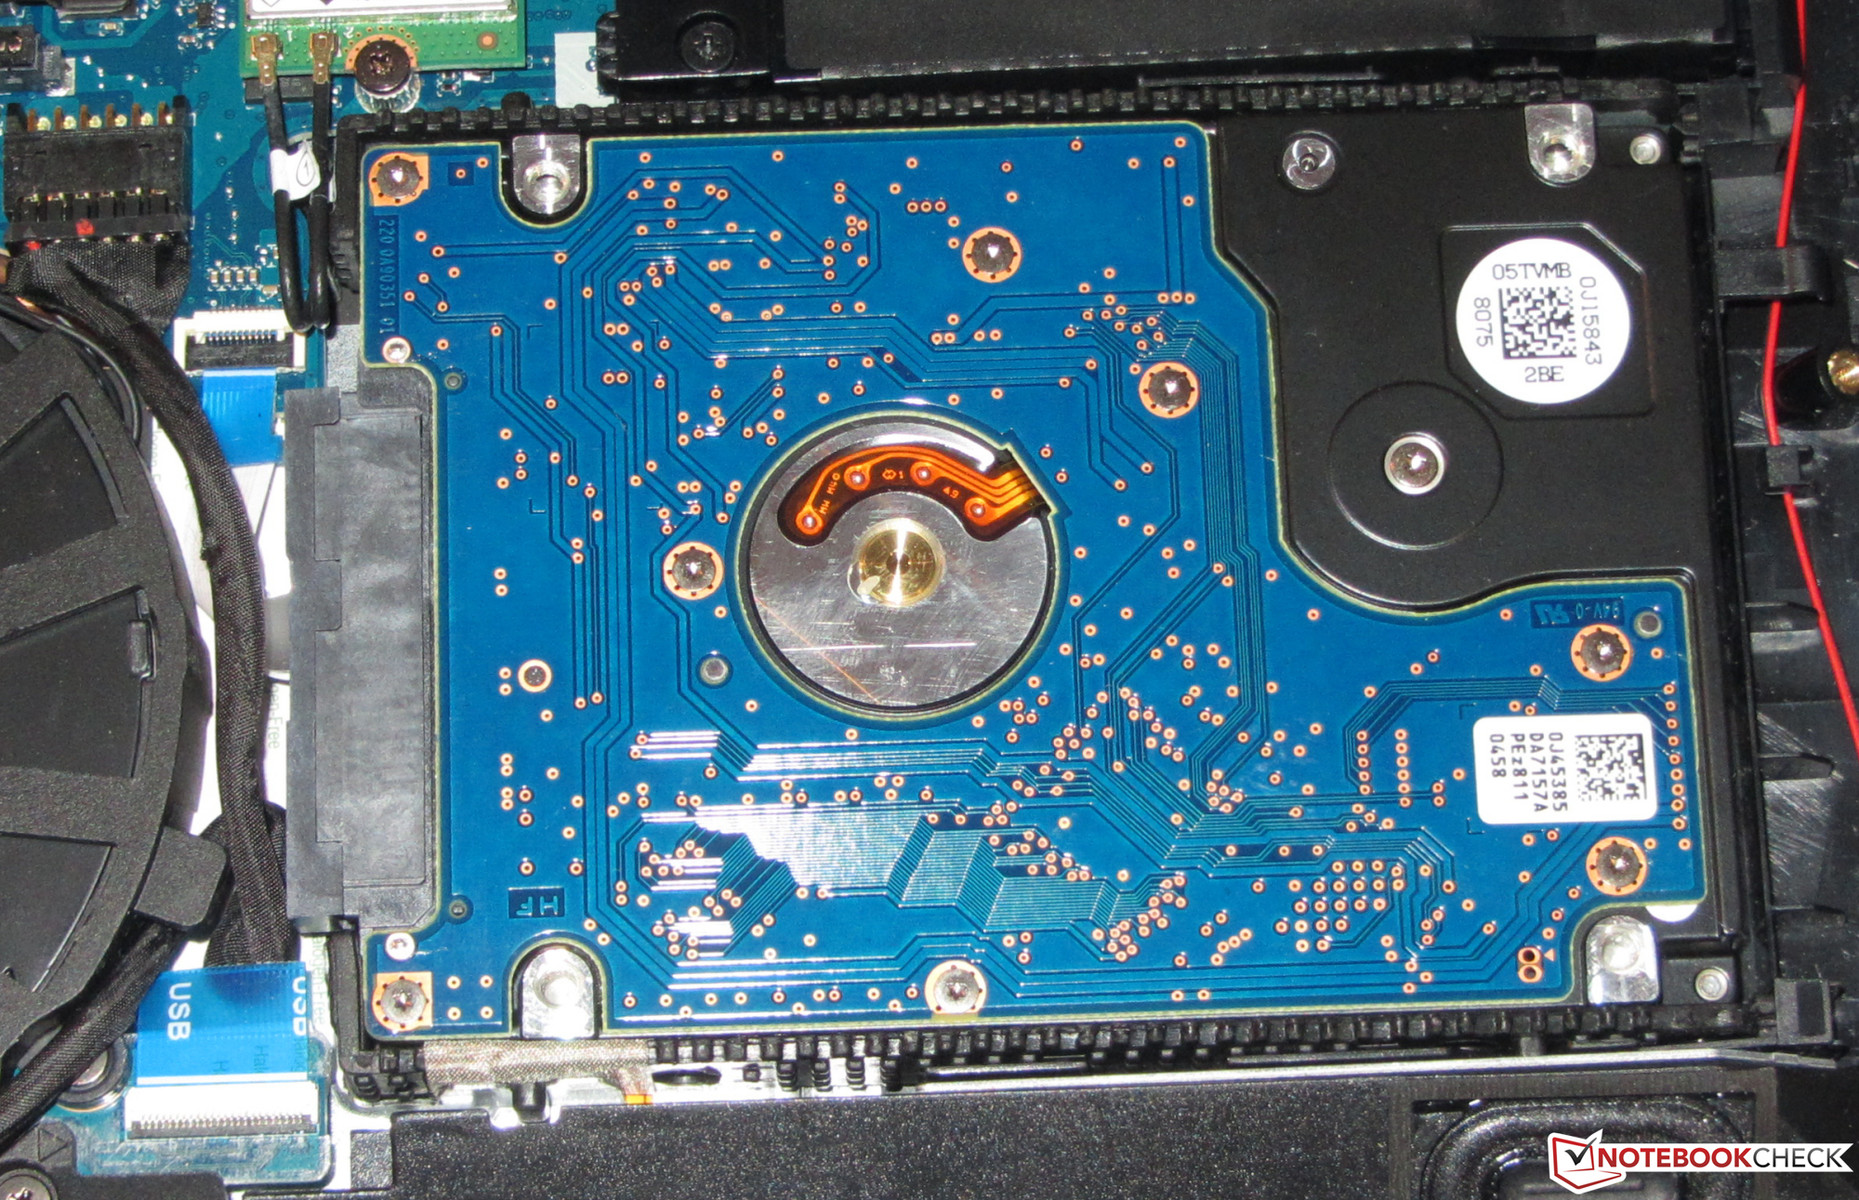
In addition to the SSD, the notebook also contains a 1-TB hard-drive (2.5-in, 7200 rpm), which serves as data storage. Please note that if you want to exchange the HDD for a higher-capacity model, you need to be aware that the recovery partition of the notebook is stored on the HDD.

| HP Omen 15-dc0015ng Toshiba XG5 KXG50ZNV512G | HP Omen 15-dc0001ng Toshiba KBG30ZMV128G | MSI P65 8RF-451 - Creator Kingston RBUSNS8154P3512GJ | Asus Zephyrus S GX531GS WDC PC SN520 SDAPNUW-512G | Razer Blade 15 GTX 1060 Samsung SSD PM981 MZVLB512HAJQ | Schenker XMG Neo 15 Samsung SSD 970 Pro 1TB | MSI GE63 Raider RGB 8RF-008 Samsung SSD PM871a MZNLN256HMHQ | Average Toshiba XG5 KXG50ZNV512G | |
|---|---|---|---|---|---|---|---|---|
| CrystalDiskMark 5.2 / 6 | -37% | 27% | 48% | 75% | 97% | -25% | 36% | |
| Write 4K (MB/s) | 87.5 | 77.1 -12% | 89.2 2% | 98.2 12% | 97.9 12% | 100.5 15% | 66.4 -24% | 114 ? 30% |
| Read 4K (MB/s) | 16.08 | 29.51 84% | 34.36 114% | 39.43 145% | 41.32 157% | 48.64 202% | 29.59 84% | 35.6 ? 121% |
| Write Seq (MB/s) | 614 | 130.9 -79% | 949 55% | 1386 126% | 1594 160% | 1456 137% | 477.9 -22% | 684 ? 11% |
| Read Seq (MB/s) | 1341 | 857 -36% | 899 -33% | 1100 -18% | 1353 1% | 1278 -5% | 515 -62% | 1612 ? 20% |
| Write 4K Q32T1 (MB/s) | 307.9 | 104.1 -66% | 371.4 21% | 270.3 -12% | 305.6 -1% | 298.1 -3% | 180.2 -41% | 401 ? 30% |
| Read 4K Q32T1 (MB/s) | 358.4 | 195.8 -45% | 399 11% | 340.3 -5% | 354.1 -1% | 348.7 -3% | 199.5 -44% | 427 ? 19% |
| Write Seq Q32T1 (MB/s) | 525 | 130.8 -75% | 1035 97% | 1454 177% | 2033 287% | 2742 422% | 497.6 -5% | 830 ? 58% |
| Read Seq Q32T1 (MB/s) | 3077 | 1096 -64% | 1603 -48% | 1681 -45% | 2543 -17% | 3389 10% | 547 -82% | 2950 ? -4% |
| Write 4K Q8T8 (MB/s) | 760 | 887 ? | ||||||
| Read 4K Q8T8 (MB/s) | 811 | 1060 ? | ||||||
| AS SSD | -69% | 65% | 48% | 146% | 123% | -27% | 69% | |
| Seq Read (MB/s) | 2432 | 1238 -49% | 850 -65% | 903 -63% | 1820 -25% | 1915 -21% | 512 -79% | 2137 ? -12% |
| Seq Write (MB/s) | 843 | 123.5 -85% | 869 3% | 1261 50% | 1917 127% | 2324 176% | 462.8 -45% | 744 ? -12% |
| 4K Read (MB/s) | 21.24 | 31.48 48% | 36.43 72% | 40.02 88% | 48.56 129% | 48.03 126% | 32.36 52% | 30.1 ? 42% |
| 4K Write (MB/s) | 99.3 | 79.3 -20% | 84.4 -15% | 103.6 4% | 99.2 0% | 106 7% | 68.6 -31% | 93.6 ? -6% |
| 4K-64 Read (MB/s) | 730 | 187.8 -74% | 839 15% | 1030 41% | 1177 61% | 1598 119% | 348.6 -52% | 784 ? 7% |
| 4K-64 Write (MB/s) | 484.4 | 103.6 -79% | 602 24% | 1285 165% | 1664 244% | 2085 330% | 294.3 -39% | 515 ? 6% |
| Access Time Read * (ms) | 0.126 | 0.177 -40% | 0.104 17% | 0.129 -2% | 0.05 60% | 0.038 70% | 0.101 20% | 0.09253 ? 27% |
| Access Time Write * (ms) | 0.063 | 0.227 -260% | 0.044 30% | 0.036 43% | 0.037 41% | 0.034 46% | 0.051 19% | 0.1653 ? -162% |
| Score Read (Points) | 994 | 343 -65% | 960 -3% | 1161 17% | 1407 42% | 1837 85% | 432 -57% | 1028 ? 3% |
| Score Write (Points) | 668 | 195 -71% | 773 16% | 1515 127% | 1955 193% | 2423 263% | 409 -39% | 683 ? 2% |
| Score Total (Points) | 2091 | 670 -68% | 2233 7% | 3294 58% | 4095 96% | 5224 150% | 1071 -49% | 2170 ? 4% |
| Copy ISO MB/s (MB/s) | 1632 | 840 -49% | 1452 -11% | 1109 ? -32% | ||||
| Copy Program MB/s (MB/s) | 30.89 | 306.9 894% | 370.7 1100% | 380 ? 1130% | ||||
| Copy Game MB/s (MB/s) | 980 | 622 -37% | 882 -10% | 738 ? -25% | ||||
| Total Average (Program / Settings) | -53% /
-56% | 46% /
51% | 48% /
48% | 111% /
120% | 110% /
112% | -26% /
-26% | 53% /
57% |
* ... smaller is better
Graphics Card
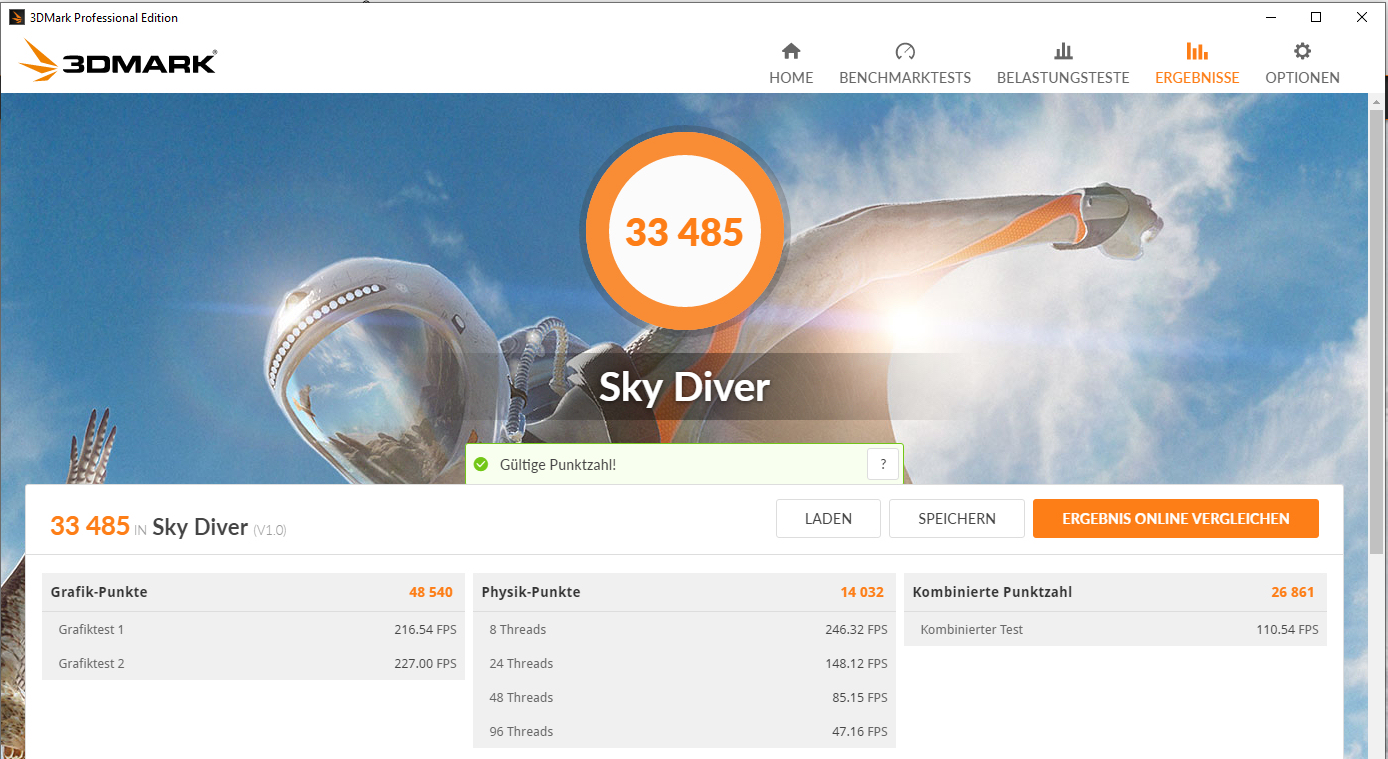
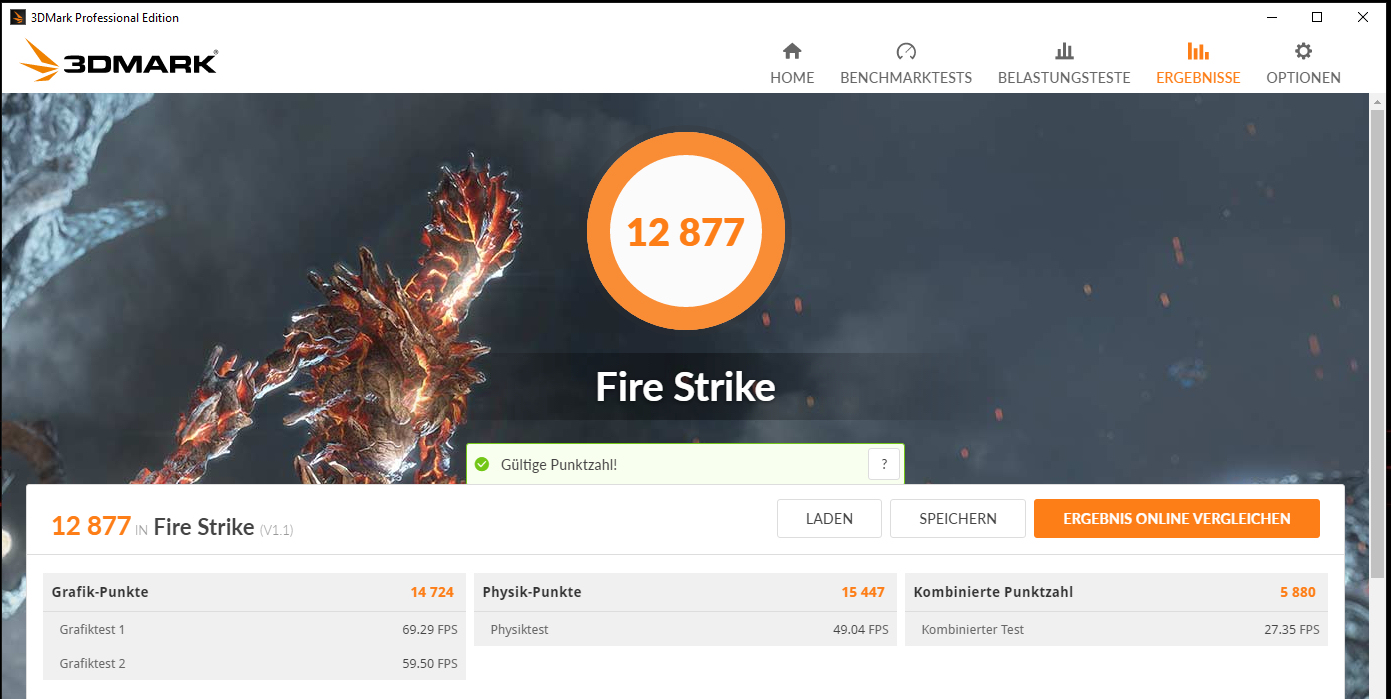
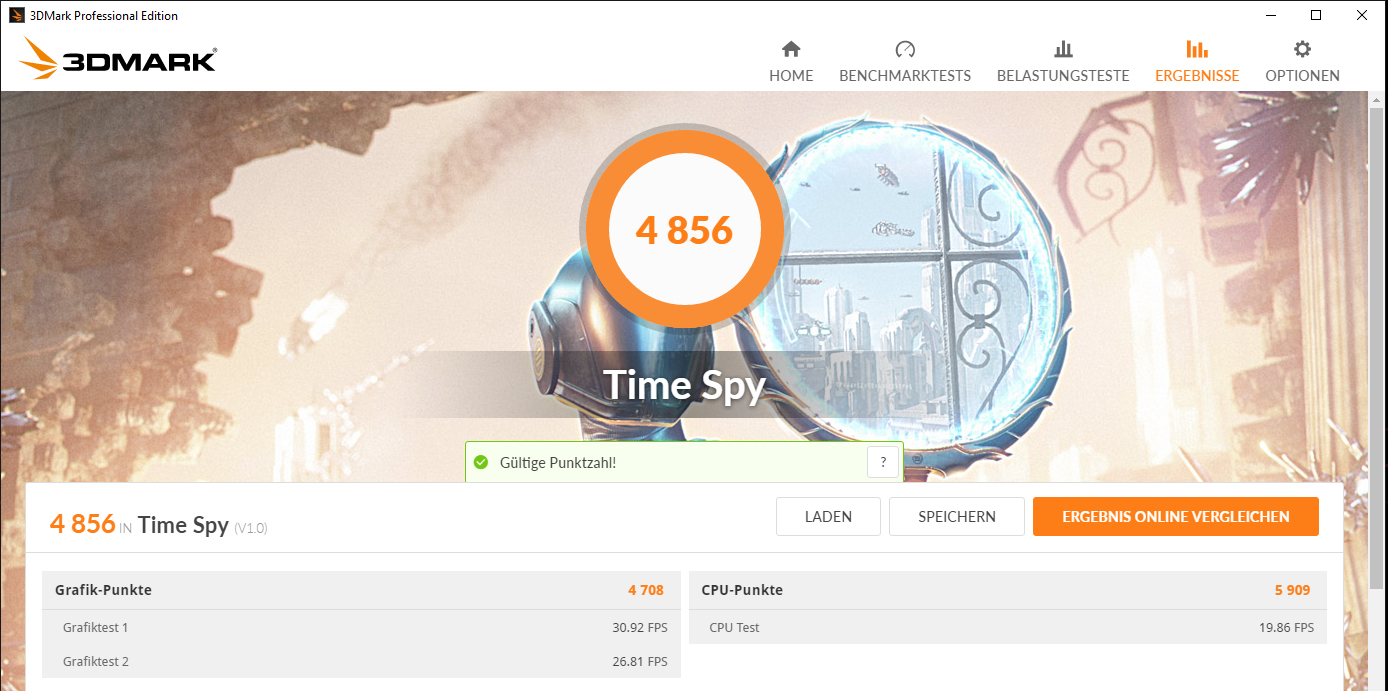
The built-in GeForce GTX 1070 Max-Q graphics core from Nvidia is a version of the regular GTX 1070 GPU that is trimmed for efficiency and designed for thin and light notebooks. The model built into our test unit runs at a basic clock speed of 1215 MHz, which can be increased up to 1379 MHz via Turbo. The GPU is accompanied by 8192 MB of fast GDDR5 memory. The results in the 3DMark benchmarks range on a normal level for the GPU.
The UHD Graphics 630 integrated into the processor has been disabled by HP, so there is no solution for switching graphics (Optimus) here, and the GeForce graphics core is always active.
| 3DMark 06 Standard Score | 35269 points | |
| 3DMark 11 Performance | 16908 points | |
| 3DMark Ice Storm Standard Score | 165902 points | |
| 3DMark Cloud Gate Standard Score | 34535 points | |
| 3DMark Fire Strike Score | 12877 points | |
| 3DMark Fire Strike Extreme Score | 6571 points | |
| 3DMark Time Spy Score | 4856 points | |
Help | ||
Gaming Performance
The Omen offers sufficient performance under the hood to bring all the current games smoothly to the screen at Full HD resolution and maximum graphics quality settings. If you connect the corresponding external monitor, you can also use resolutions beyond Full HD, but then you should not select quality settings that are too optimistic.
| low | med. | high | ultra | |
|---|---|---|---|---|
| BioShock Infinite (2013) | 313.8 | 279.9 | 256 | 139.4 |
| GTA V (2015) | 166.7 | 159.8 | 145.9 | 64.6 |
| The Witcher 3 (2015) | 251 | 170.8 | 97.7 | 55.3 |
| Dota 2 Reborn (2015) | 126.9 | 118.2 | 111.7 | 109.7 |
| World of Warships (2015) | 205.4 | 169.8 | 146.3 | 140.7 |
| Mass Effect Andromeda (2017) | 150.1 | 110.8 | 77.6 | 68.5 |
| Warhammer 40.000: Dawn of War III (2017) | 167.3 | 106.4 | 100.9 | 89.9 |
| Team Fortress 2 (2017) | 128.4 | 126.3 | 122 | 120.8 |
| Ark Survival Evolved (2017) | 158.3 | 62.7 | 45.7 | 31.9 |
| Destiny 2 (2017) | 152.6 | 137.4 | 130.8 | 111 |
| X-Plane 11.11 (2018) | 109 | 96.5 | 81.1 | |
| Monster Hunter World (2018) | 156.5 | 88.4 | 80.4 | 60.3 |
| Shadow of the Tomb Raider (2018) | 130 | 78 | 72 | 61 |
| Call of Duty Black Ops 4 (2018) | 169.8 | 105 | 98.9 | 93.3 |
| Hitman 2 (2018) | 92 | 80.5 | 74.8 | 68.8 |
| Battlefield V (2018) | 140.7 | 80.6 | 70 | 64.7 |
| Farming Simulator 19 (2018) | 214.4 | 167.6 | 110.4 | 89.6 |
| Darksiders III (2018) | 169.2 | 83.9 | 68.3 | 59.7 |
| Just Cause 4 (2018) | 126.1 | 86.1 | 78.8 | 75.7 |
| The Witcher 3 - 1920x1080 Ultra Graphics & Postprocessing (HBAO+) | |
| Average of class Gaming (95 - 240, n=8, last 2 years) | |
| MSI GE63 Raider RGB 8RF-008 | |
| HP Omen 15-dc0015ng | |
| MSI P65 8RF-451 - Creator | |
| Average NVIDIA GeForce GTX 1070 Max-Q (46 - 55.3, n=19) | |
| Asus Zephyrus S GX531GS | |
| Schenker XMG Neo 15 | |
| Razer Blade 15 GTX 1060 | |
| HP Omen 15-dc0001ng | |
| BioShock Infinite - 1920x1080 Ultra Preset, DX11 (DDOF) | |
| HP Omen 15-dc0015ng | |
| Average NVIDIA GeForce GTX 1070 Max-Q (109.6 - 139.4, n=10) | |
| MSI P65 8RF-451 - Creator | |
| Razer Blade 15 GTX 1060 | |
In order to evaluate whether the frame rates also remain constant over a longer time period, we run the game The Witcher 3 at Full HD resolution and maximum quality settings for about 60 minutes. While doing this, the in-game character is not moved during the whole time. We did not notice any drops in the frame rate.
Emissions - The fans of the Omen are clearly noticeable
Noise Emissions
While during idle, the fans of the HP notebook can be inactive at times, but this does not mean that there is silence as you can still hear the whirring of the hard drive. Under load, things become really noisy. During the stress test, we measure a sound pressure level of only 42.3 dB(A), since the CPU and GPU are not running at their full speeds. In the medium load range, the value turns out significantly higher at 47.2 dB(A).
Occasionally, we can hear some very quiet crackling noise coming from inside of the laptop. This happens, for example, when there is a lot of data being transferred to the SSD. However, the crackling noise can only be heard in very quiet surroundings.
Noise level
| Idle |
| 30.6 / 30.6 / 32.2 dB(A) |
| Load |
| 47.2 / 42.3 dB(A) |
 | ||
30 dB silent 40 dB(A) audible 50 dB(A) loud |
||
min: | ||
| HP Omen 15-dc0015ng i7-8750H, GeForce GTX 1070 Max-Q | HP Omen 15-dc0001ng i5-8300H, GeForce GTX 1050 Ti Mobile | MSI P65 8RF-451 - Creator i7-8750H, GeForce GTX 1070 Max-Q | Asus Zephyrus S GX531GS i7-8750H, GeForce GTX 1070 Max-Q | Razer Blade 15 GTX 1060 i7-8750H, GeForce GTX 1060 Max-Q | Schenker XMG Neo 15 i7-8750H, GeForce GTX 1060 Mobile | MSI GE63 Raider RGB 8RF-008 i7-8750H, GeForce GTX 1070 Mobile | Average NVIDIA GeForce GTX 1070 Max-Q | Average of class Gaming | |
|---|---|---|---|---|---|---|---|---|---|
| Noise | -7% | 2% | -12% | -0% | -14% | -10% | -2% | 6% | |
| off / environment * (dB) | 30.6 | 29 5% | 30.7 -0% | 29 5% | 28.1 8% | 29 5% | 30 2% | 29.4 ? 4% | 24.1 ? 21% |
| Idle Minimum * (dB) | 30.6 | 29 5% | 32.1 -5% | 33 -8% | 28.1 8% | 29 5% | 30 2% | 30.5 ? -0% | 25.8 ? 16% |
| Idle Average * (dB) | 30.6 | 33 -8% | 32.1 -5% | 34 -11% | 33 -8% | 35 -14% | 35 -14% | 31.8 ? -4% | 27.4 ? 10% |
| Idle Maximum * (dB) | 32.2 | 41 -27% | 32.4 -1% | 40 -24% | 33.5 -4% | 40 -24% | 36 -12% | 34.6 ? -7% | 30 ? 7% |
| Load Average * (dB) | 47.2 | 44 7% | 39 17% | 47 -0% | 42.2 11% | 50 -6% | 42 11% | 43.2 ? 8% | 43 ? 9% |
| Witcher 3 ultra * (dB) | 41.7 | 47 -13% | 51 -22% | 45.3 -9% | 53 -27% | 54 -29% | |||
| Load Maximum * (dB) | 42.3 | 49 -16% | 40.2 5% | 53 -25% | 45.7 -8% | 58 -37% | 56 -32% | 48.2 ? -14% | 54 ? -28% |
* ... smaller is better
Temperature
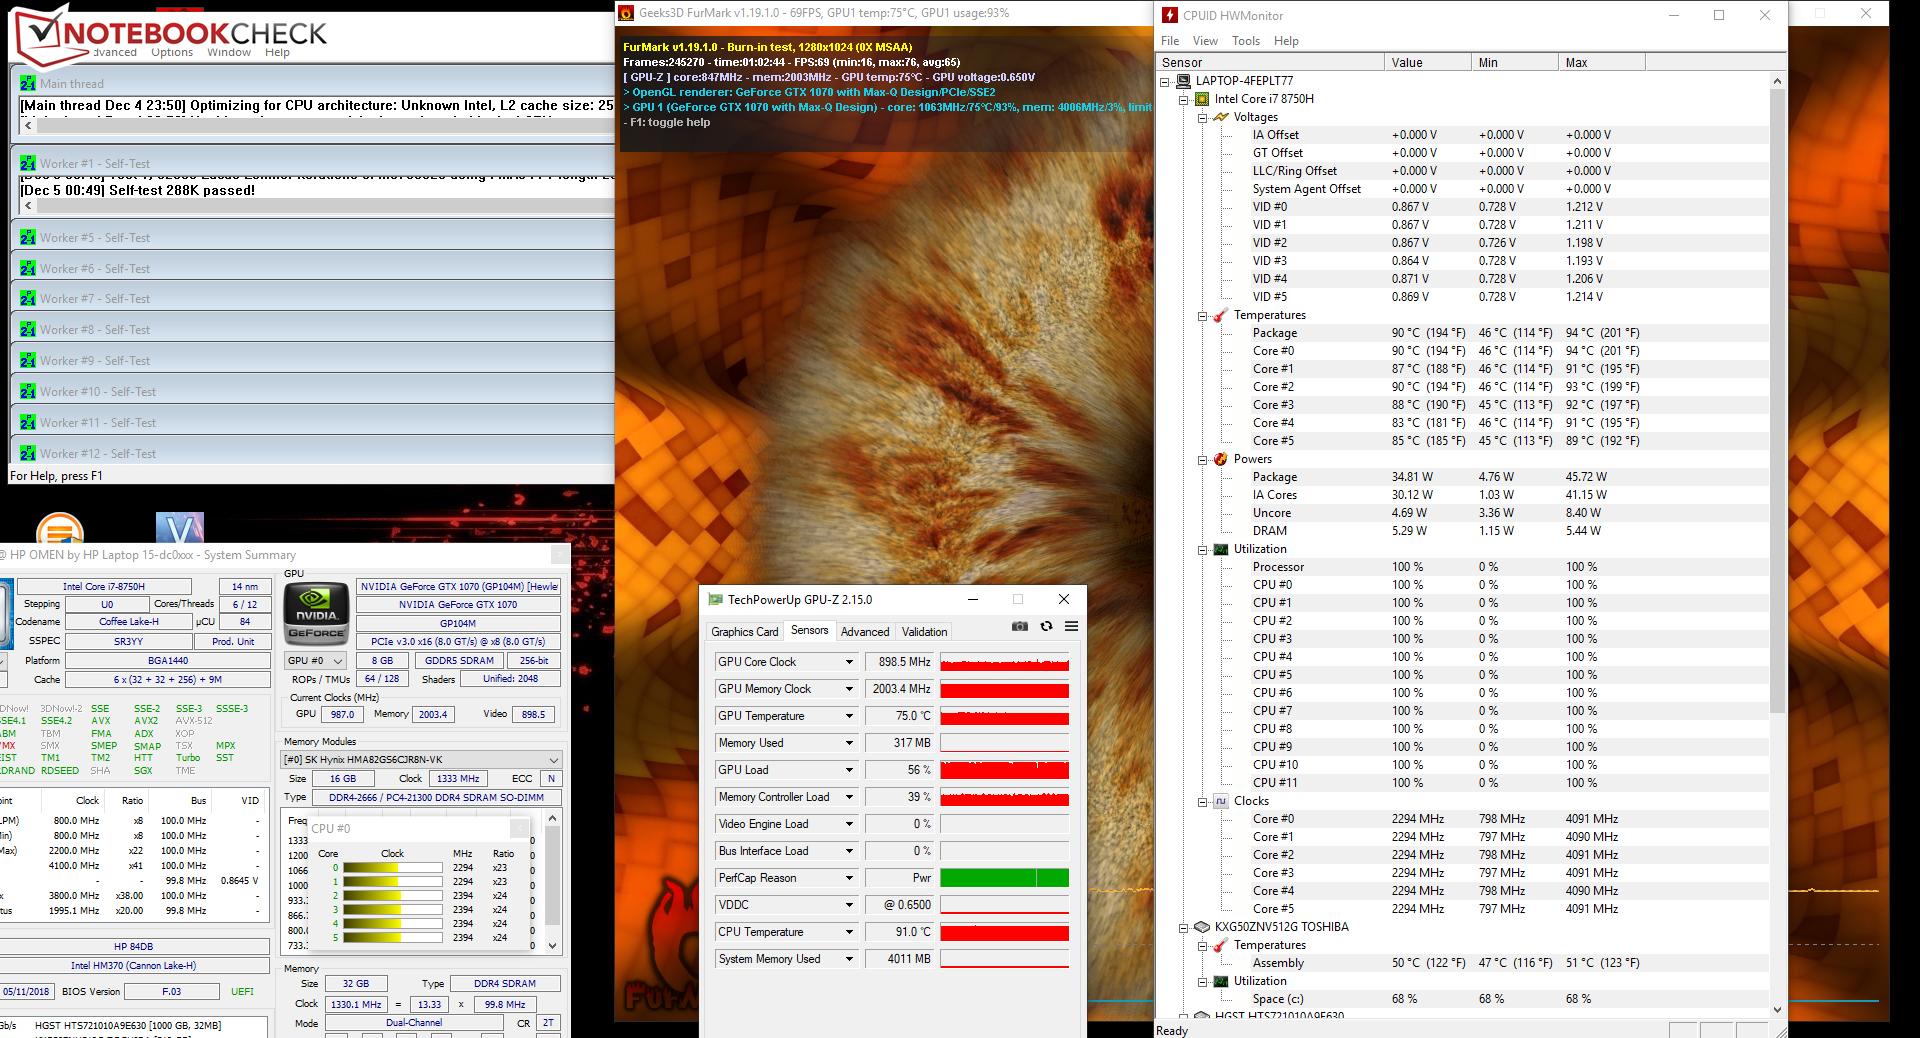
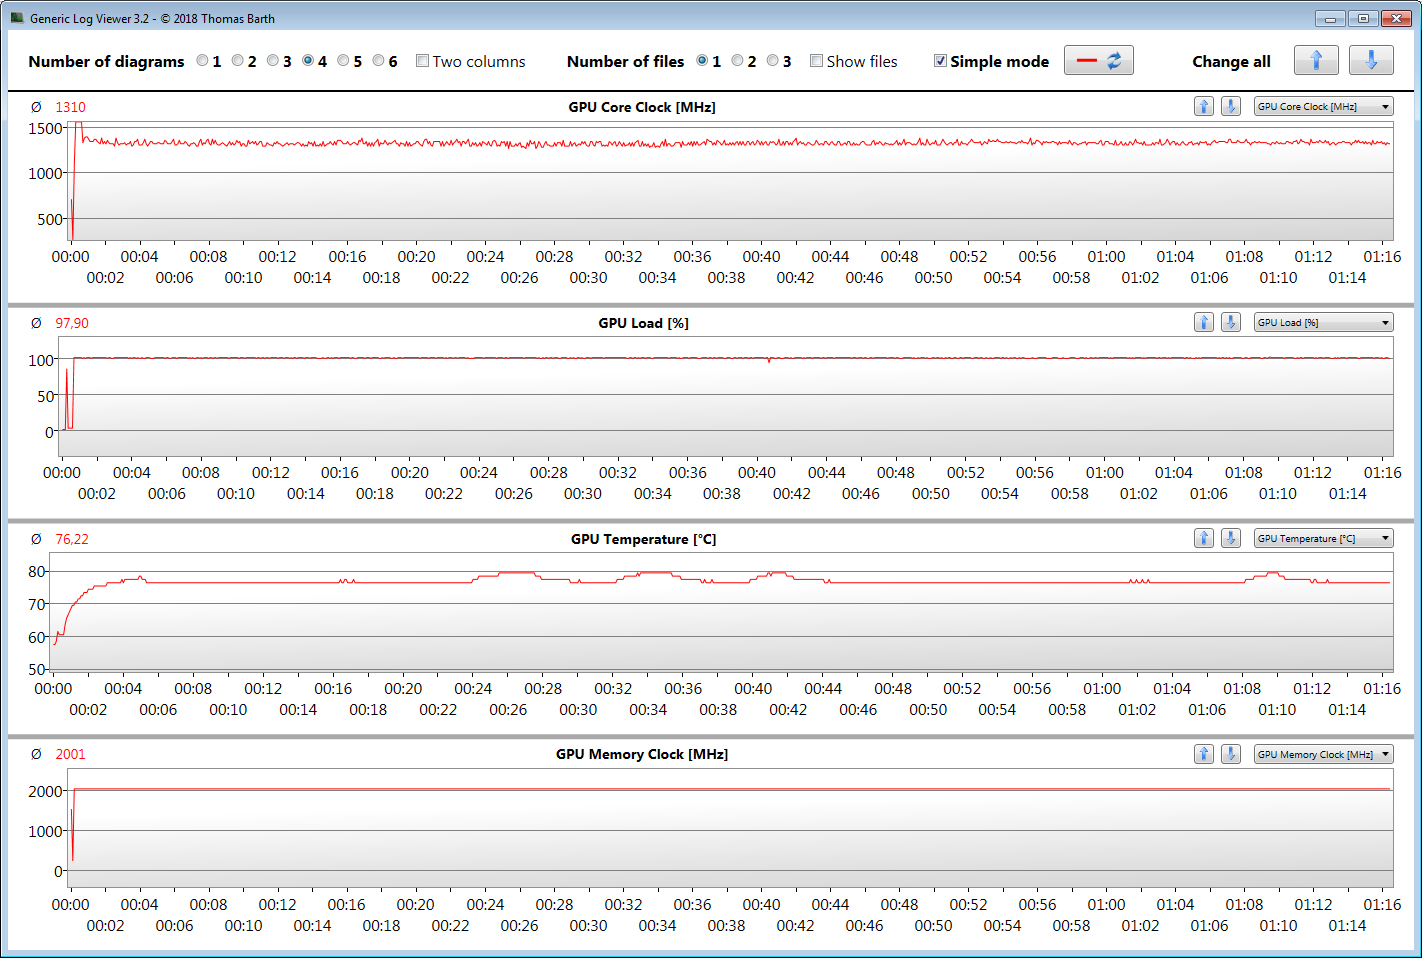
The Omen completes our stress test (Prime95 and FurMark run for at least one hour) in different ways in mains and battery operation. In mains operation, the processor initially runs at 2.6 - 2.7 GHz for a short time, before it is throttled to 2.1 - 2.2 GHz. The graphics core runs at speeds between 850 and 950 MHz. In battery operation, the CPU speed is throttled to 800 - 900 MHz, while the GPU runs at a constant 1215 MHz.
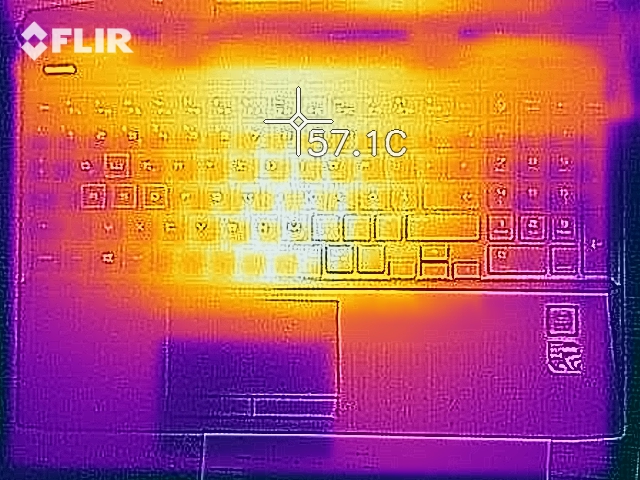
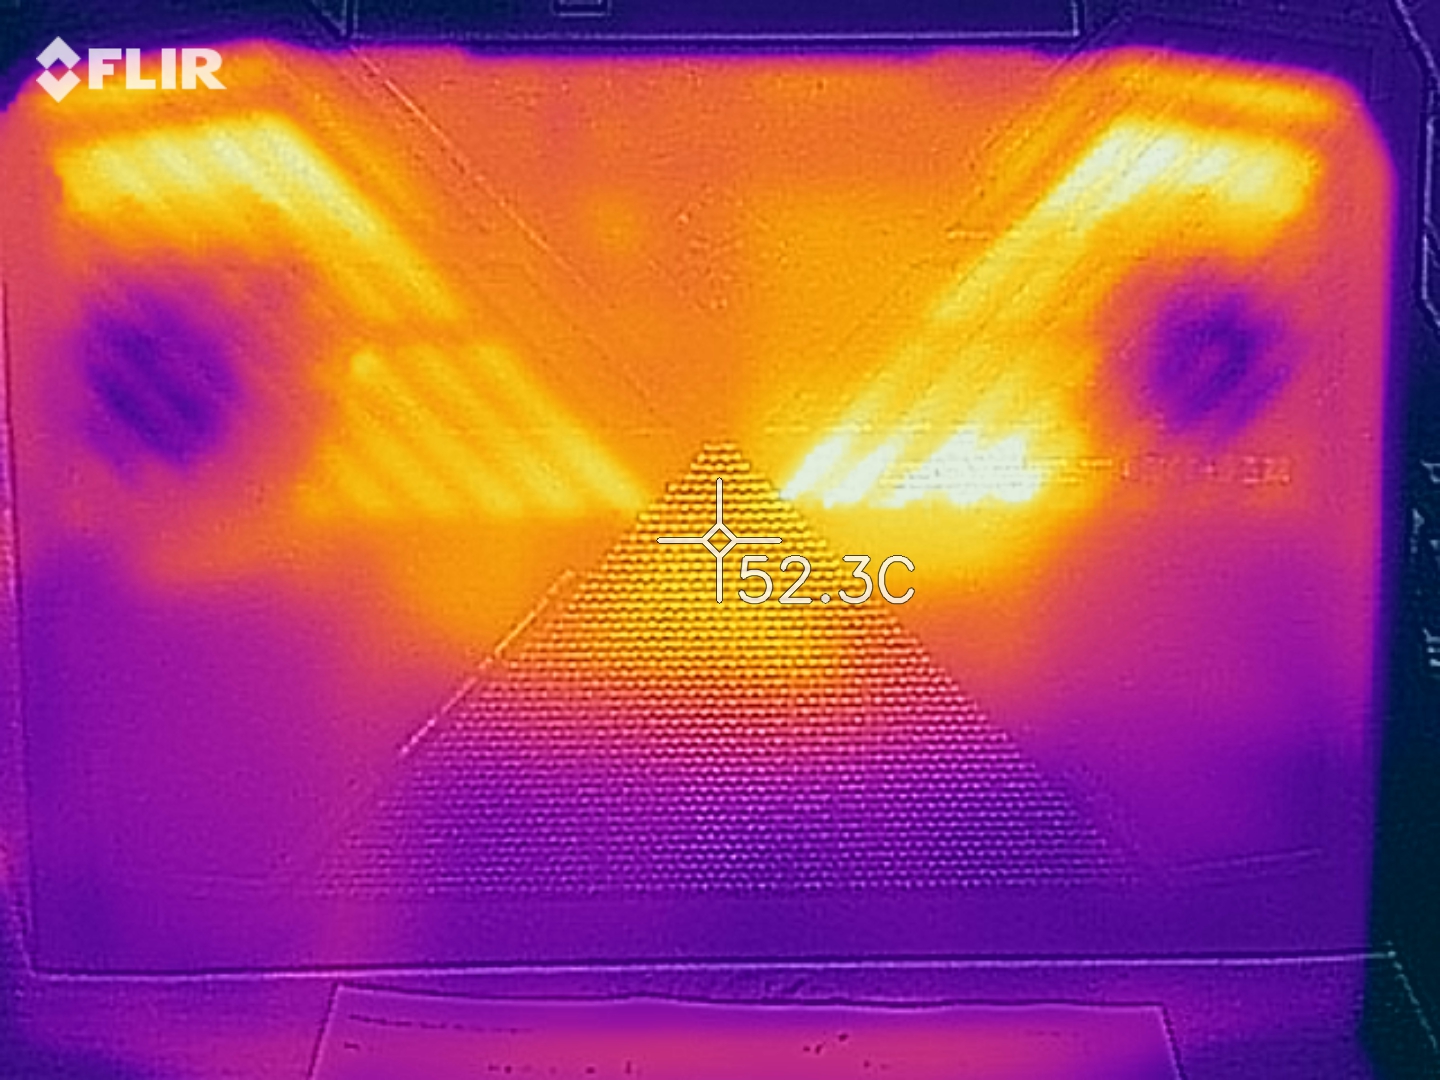
The computer does not warm up excessively. During the stress test, we register temperatures just below 50 °C (122 °F) in some spots, but this should give no reason for concern. The stress test represents an extreme scenario that should not occur during everyday operation. With this test, we evaluate whether the system remains stable during full load. While running our The Witcher 3 test (the game runs for one hour at Full HD resolution and maximum graphics settings), the warming turns out slightly higher. During everyday operation, the temperatures remain within the acceptable range.
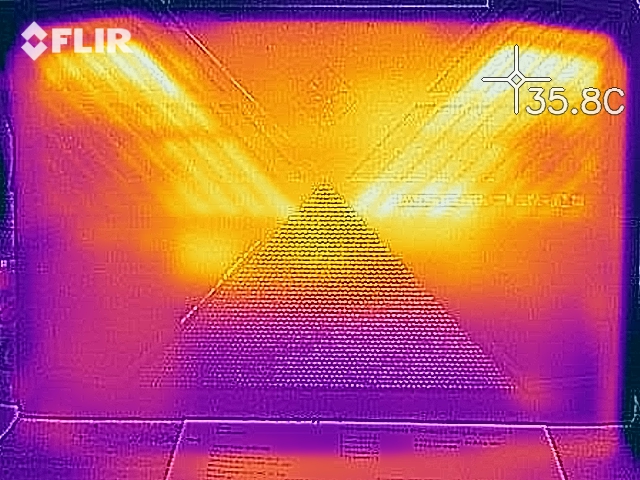
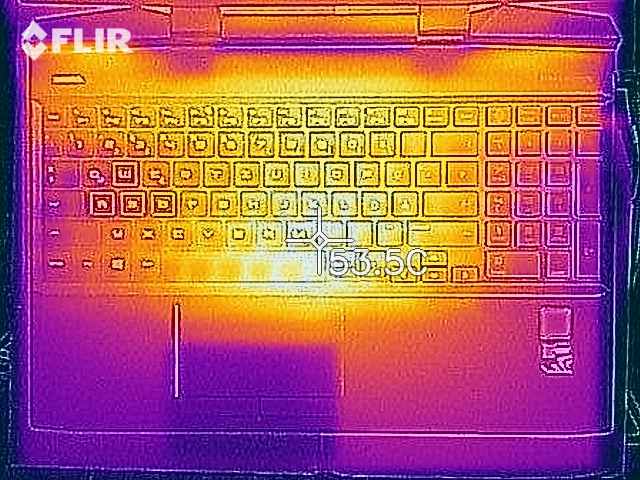
(-) The maximum temperature on the upper side is 49.7 °C / 121 F, compared to the average of 40.4 °C / 105 F, ranging from 21.2 to 68.8 °C for the class Gaming.
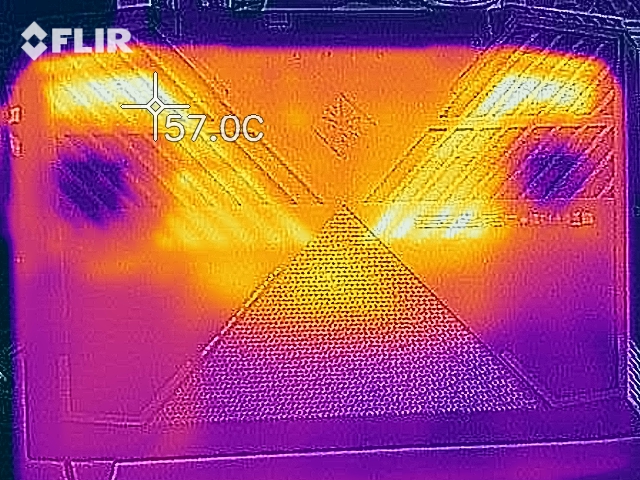
(-) The bottom heats up to a maximum of 48 °C / 118 F, compared to the average of 43.2 °C / 110 F
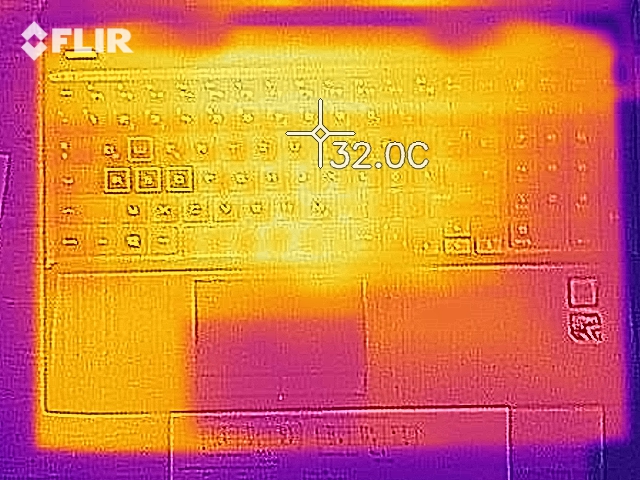
(+) In idle usage, the average temperature for the upper side is 29.2 °C / 85 F, compared to the device average of 33.9 °C / 93 F.
(-) Playing The Witcher 3, the average temperature for the upper side is 42 °C / 108 F, compared to the device average of 33.9 °C / 93 F.
(+) The palmrests and touchpad are reaching skin temperature as a maximum (34 °C / 93.2 F) and are therefore not hot.
(-) The average temperature of the palmrest area of similar devices was 28.8 °C / 83.8 F (-5.2 °C / -9.4 F).
| HP Omen 15-dc0015ng i7-8750H, GeForce GTX 1070 Max-Q | HP Omen 15-dc0001ng i5-8300H, GeForce GTX 1050 Ti Mobile | MSI P65 8RF-451 - Creator i7-8750H, GeForce GTX 1070 Max-Q | Asus Zephyrus S GX531GS i7-8750H, GeForce GTX 1070 Max-Q | Razer Blade 15 GTX 1060 i7-8750H, GeForce GTX 1060 Max-Q | Schenker XMG Neo 15 i7-8750H, GeForce GTX 1060 Mobile | MSI GE63 Raider RGB 8RF-008 i7-8750H, GeForce GTX 1070 Mobile | Average NVIDIA GeForce GTX 1070 Max-Q | Average of class Gaming | |
|---|---|---|---|---|---|---|---|---|---|
| Heat | -9% | 4% | -4% | -5% | -7% | 5% | -1% | 3% | |
| Maximum Upper Side * (°C) | 49.7 | 51 -3% | 46.6 6% | 54 -9% | 51.2 -3% | 56 -13% | 48 3% | 52.1 ? -5% | 45.2 ? 9% |
| Maximum Bottom * (°C) | 48 | 58 -21% | 56.6 -18% | 60 -25% | 55.2 -15% | 68 -42% | 49 -2% | 57.3 ? -19% | 48 ? -0% |
| Idle Upper Side * (°C) | 32 | 35 -9% | 28.8 10% | 30 6% | 31 3% | 28 12% | 29 9% | 29.2 ? 9% | 31.1 ? 3% |
| Idle Bottom * (°C) | 34 | 35 -3% | 28.5 16% | 30 12% | 35.6 -5% | 29 15% | 31 9% | 29.9 ? 12% | 34.2 ? -1% |
* ... smaller is better
Speakers
HP Omen 15-dc0015ng audio analysis
(-) | not very loud speakers (70.6 dB)
Bass 100 - 315 Hz
(-) | nearly no bass - on average 21.3% lower than median
(±) | linearity of bass is average (12.1% delta to prev. frequency)
Mids 400 - 2000 Hz
(+) | balanced mids - only 2.3% away from median
(±) | linearity of mids is average (8.9% delta to prev. frequency)
Highs 2 - 16 kHz
(+) | balanced highs - only 3.5% away from median
(+) | highs are linear (6.1% delta to prev. frequency)
Overall 100 - 16.000 Hz
(±) | linearity of overall sound is average (19.9% difference to median)
Compared to same class
» 70% of all tested devices in this class were better, 6% similar, 24% worse
» The best had a delta of 6%, average was 18%, worst was 132%
Compared to all devices tested
» 51% of all tested devices were better, 7% similar, 42% worse
» The best had a delta of 4%, average was 24%, worst was 134%
Apple MacBook 12 (Early 2016) 1.1 GHz audio analysis
(+) | speakers can play relatively loud (83.6 dB)
Bass 100 - 315 Hz
(±) | reduced bass - on average 11.3% lower than median
(±) | linearity of bass is average (14.2% delta to prev. frequency)
Mids 400 - 2000 Hz
(+) | balanced mids - only 2.4% away from median
(+) | mids are linear (5.5% delta to prev. frequency)
Highs 2 - 16 kHz
(+) | balanced highs - only 2% away from median
(+) | highs are linear (4.5% delta to prev. frequency)
Overall 100 - 16.000 Hz
(+) | overall sound is linear (10.2% difference to median)
Compared to same class
» 7% of all tested devices in this class were better, 2% similar, 91% worse
» The best had a delta of 5%, average was 18%, worst was 53%
Compared to all devices tested
» 5% of all tested devices were better, 1% similar, 94% worse
» The best had a delta of 4%, average was 24%, worst was 134%
Power Management - The HP laptop does not lack endurance
Power Consumption
During idle, we measure a power consumption of up to 24 watts. Here we notice the negative effect of deactivating the integrated GPU. In the beginning of the stress test, the consumption briefly rises up to 190 watts to later level out at about 158 watts, since the CPU and GPU are throttled. During gaming operation, the power consumption turns out only slightly lower. For example, the notebook consumes about 143 watts while we run our The Witcher 3 test. The power supply is rated at 200 watts.
| Off / Standby | |
| Idle | |
| Load |
|
Key:
min: | |
| HP Omen 15-dc0015ng i7-8750H, GeForce GTX 1070 Max-Q | HP Omen 15-dc0001ng i5-8300H, GeForce GTX 1050 Ti Mobile | MSI P65 8RF-451 - Creator i7-8750H, GeForce GTX 1070 Max-Q | Asus Zephyrus S GX531GS i7-8750H, GeForce GTX 1070 Max-Q | Razer Blade 15 GTX 1060 i7-8750H, GeForce GTX 1060 Max-Q | Schenker XMG Neo 15 i7-8750H, GeForce GTX 1060 Mobile | MSI GE63 Raider RGB 8RF-008 i7-8750H, GeForce GTX 1070 Mobile | Average NVIDIA GeForce GTX 1070 Max-Q | Average of class Gaming | |
|---|---|---|---|---|---|---|---|---|---|
| Power Consumption | 24% | 31% | -10% | 13% | 22% | 8% | 17% | -2% | |
| Idle Minimum * (Watt) | 14 | 12 14% | 7.4 47% | 17 -21% | 14.9 -6% | 10 29% | 9 36% | 11.4 ? 19% | 13.2 ? 6% |
| Idle Average * (Watt) | 18.2 | 14 23% | 11.7 36% | 20 -10% | 17.5 4% | 13 29% | 14 23% | 15.7 ? 14% | 18.9 ? -4% |
| Idle Maximum * (Watt) | 24 | 18 25% | 16.8 30% | 29 -21% | 19.2 20% | 18 25% | 19 21% | 20.7 ? 14% | 24.3 ? -1% |
| Load Average * (Watt) | 143 | 92 36% | 94 34% | 112 22% | 103.2 28% | 95 34% | 91 36% | 98.1 ? 31% | 108 ? 24% |
| Witcher 3 ultra * (Watt) | 126 | 100 21% | 152 -21% | 123.1 2% | 114 10% | 182 -44% | |||
| Load Maximum * (Watt) | 190 | 142 25% | 177 7% | 211 -11% | 132.7 30% | 179 6% | 238 -25% | 173.8 ? 9% | 254 ? -34% |
* ... smaller is better
Battery Life
In our realistic WLAN test, the Omen achieves a runtime of 4:34 hours. In this test, we simulate the load when opening up websites. The "Balanced" profile is active and the display brightness is adjusted to about 150 cd/m². The HP laptop lasts for 3:24 hours in our video test, where we evaluate the battery life while playing videos. For this, we run the Big Buck Bunny (H.264 coding, 1920x1080 pixels) short film in a continuous loop with the communication modules deactivated, the power-saving profile activated, and the display brightness reduced to 150 cd/m².
The battery life of the Omen turns out significantly shorter than that of the sibling model we already tested. This is primarily due to the fact that the economic integrated graphics core of our current test unit is deactivated. It is active in the sibling model.
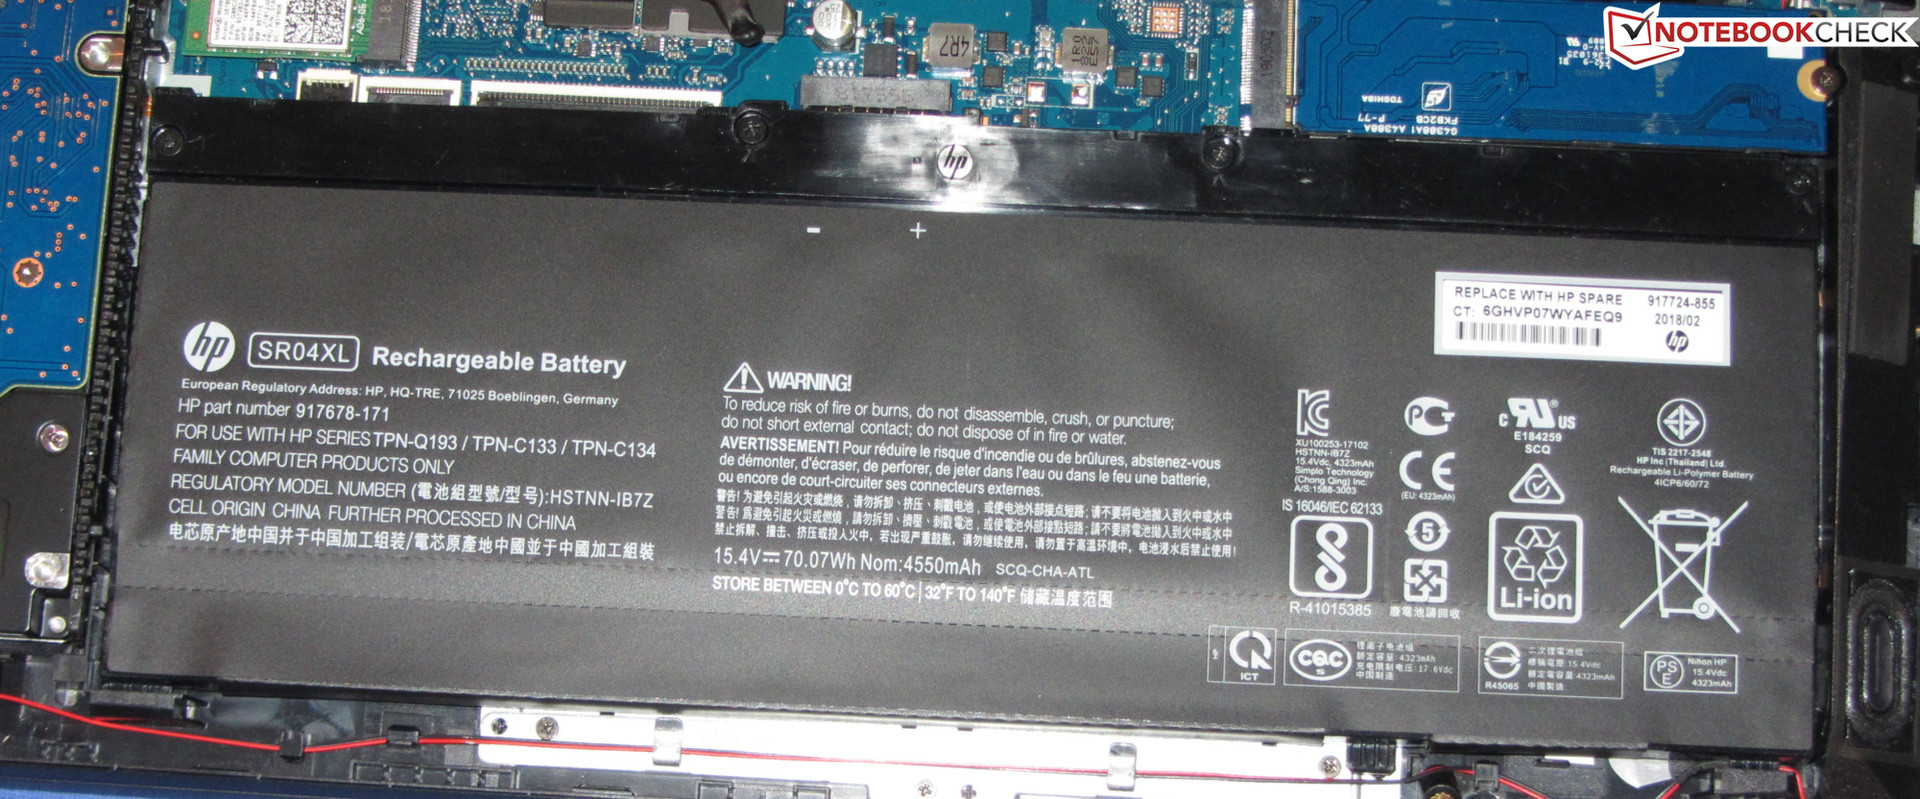
| HP Omen 15-dc0015ng i7-8750H, GeForce GTX 1070 Max-Q, 70.07 Wh | HP Omen 15-dc0001ng i5-8300H, GeForce GTX 1050 Ti Mobile, 70 Wh | MSI P65 8RF-451 - Creator i7-8750H, GeForce GTX 1070 Max-Q, 82 Wh | Asus Zephyrus S GX531GS i7-8750H, GeForce GTX 1070 Max-Q, 50 Wh | Razer Blade 15 GTX 1060 i7-8750H, GeForce GTX 1060 Max-Q, 80 Wh | Schenker XMG Neo 15 i7-8750H, GeForce GTX 1060 Mobile, 46.7 Wh | MSI GE63 Raider RGB 8RF-008 i7-8750H, GeForce GTX 1070 Mobile, 51 Wh | Average of class Gaming | |
|---|---|---|---|---|---|---|---|---|
| Battery runtime | 65% | 24% | -54% | 46% | 5% | -33% | 46% | |
| Reader / Idle (h) | 7.7 | 10.4 35% | 7.5 -3% | 3.6 -53% | 6.7 -13% | 5.7 -26% | 8.71 ? 13% | |
| H.264 (h) | 3.4 | 8.4 147% | 5.9 74% | 4.8 41% | 8.26 ? 143% | |||
| WiFi v1.3 (h) | 4.6 | 8.6 87% | 7.1 54% | 2.6 -43% | 6.7 46% | 4.4 -4% | 4 -13% | 7.02 ? 53% |
| Load (h) | 2 | 1.8 -10% | 1.4 -30% | 0.7 -65% | 1.9 -5% | 0.8 -60% | 1.47 ? -26% |
Verdict
Pros
Cons
The hardware of the Omen brings all the current computer games to the matte Full HD screen without stutters. You can always select high to maximum graphics quality settings. Nvidia's G-Sync technology ensures a smooth display of the images on the 144-Hz panel. According to the maintenance manual, G-Sync is also available for external monitors. When connecting the corresponding monitor, resolutions beyond Full HD are also possible, but then you have to reduce the graphics level.
With the Omen 15, Hewlett-Packard delivers a compact gaming notebook that can be called successful overall. However, despite its purchase price of 2100 Euros (~$2396), it is not free from weaknesses.
An extremely fast NVMe SSD ensures a quick-running system. In addition, the laptop is also equipped with a 1 TB hard drive. Both storage modules can be replaced. This is accompanied by a good keyboard. While the battery life is unable to inspire, it is acceptable for a gaming notebook that has a deactivated integrated graphics core.
The matte Full HD display pleases with stable viewing angles and fast response times. However, it lacks in brightness, and the contrast in particular is too low for a notebook of this price class.
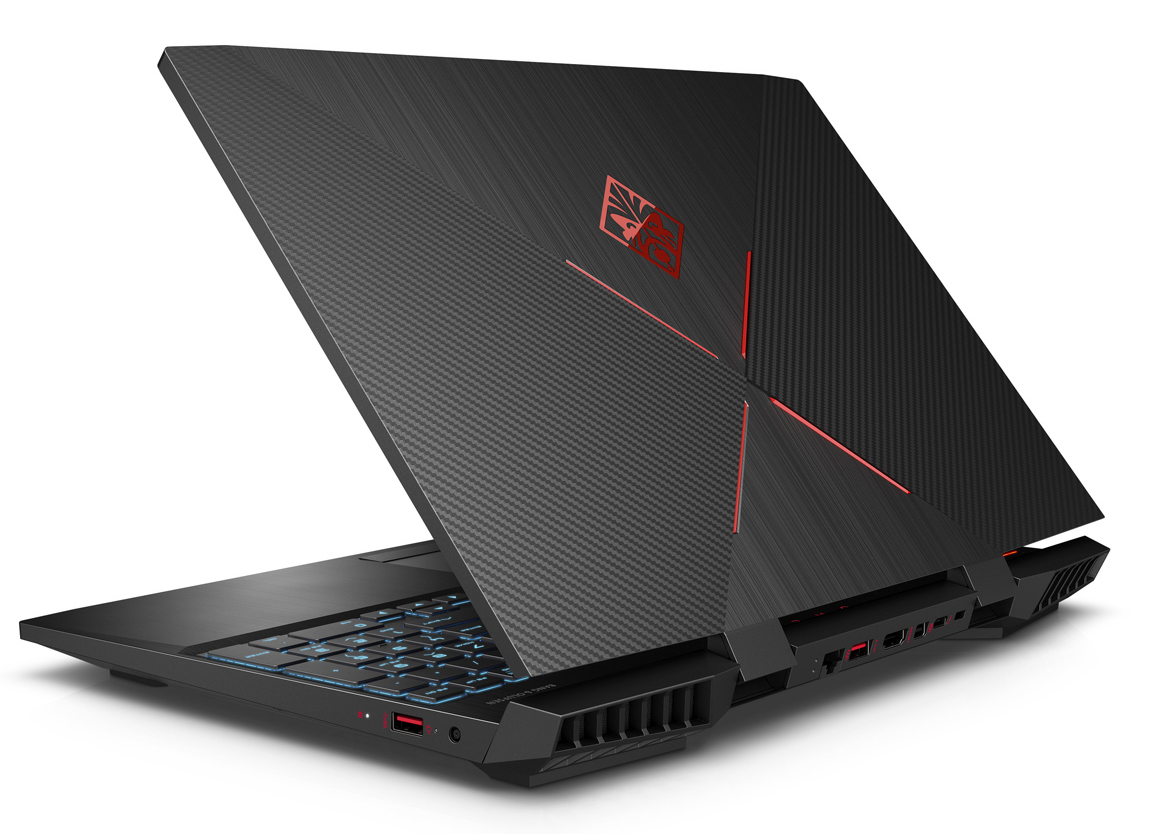
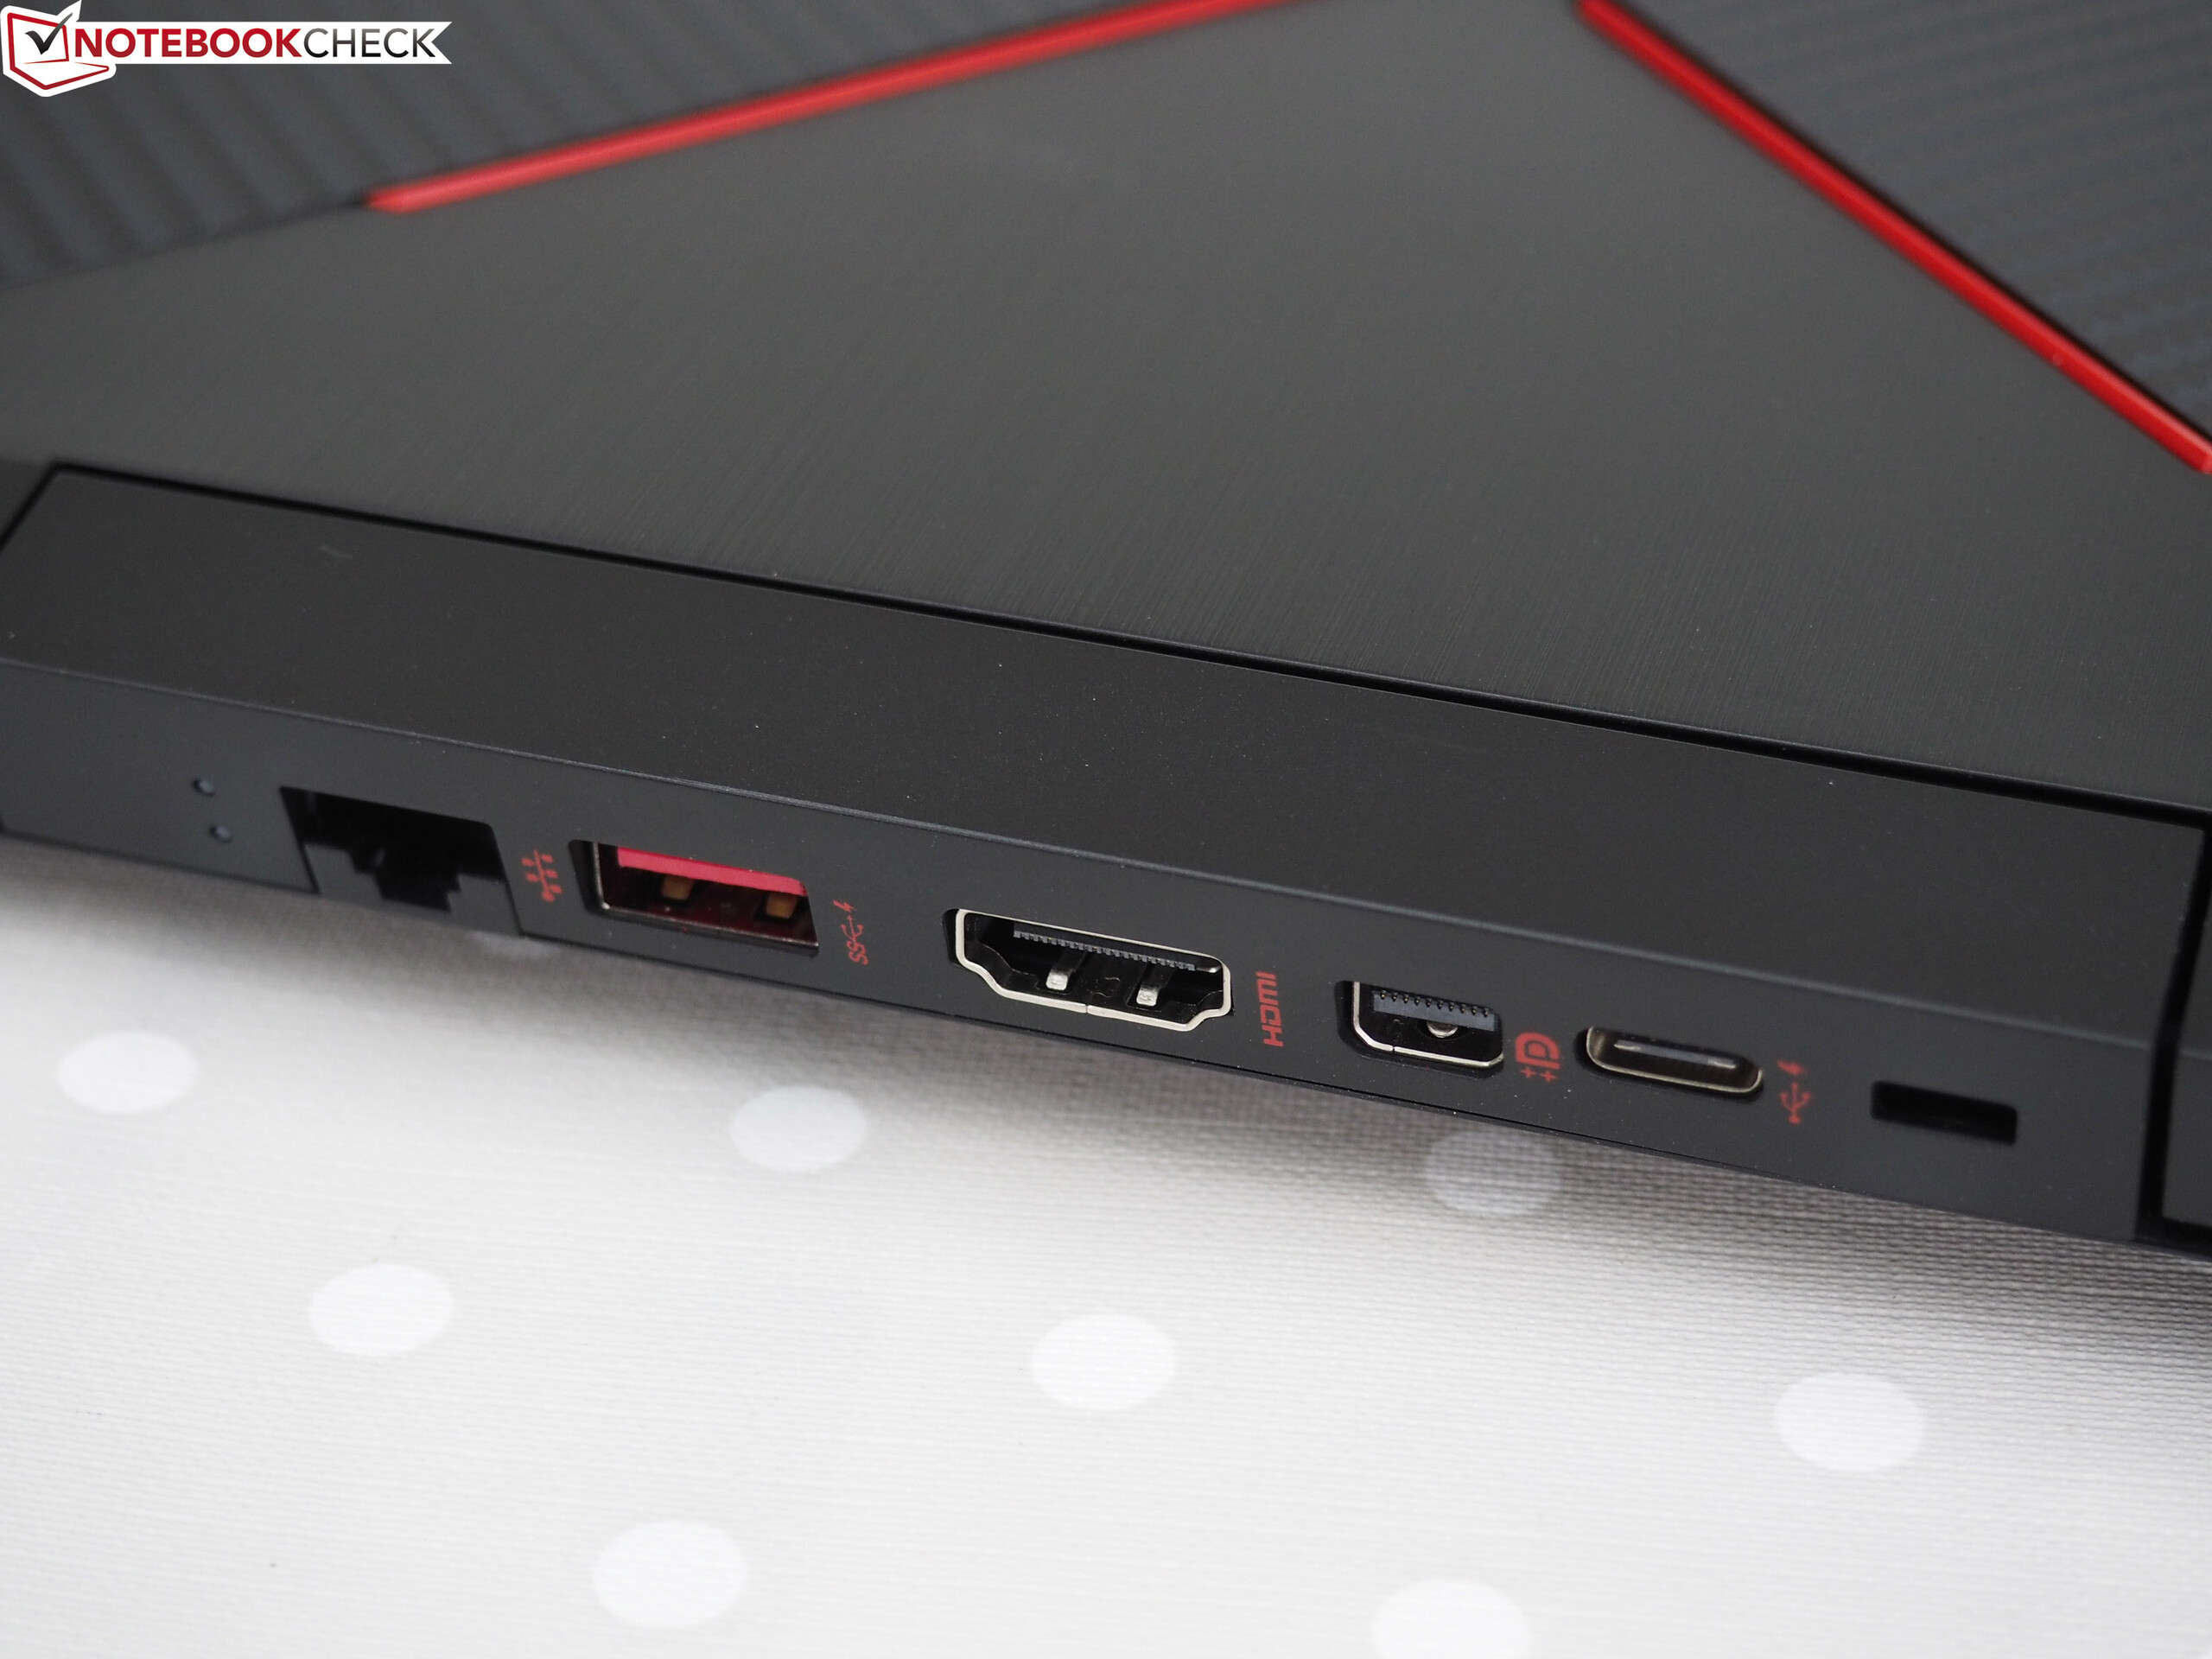
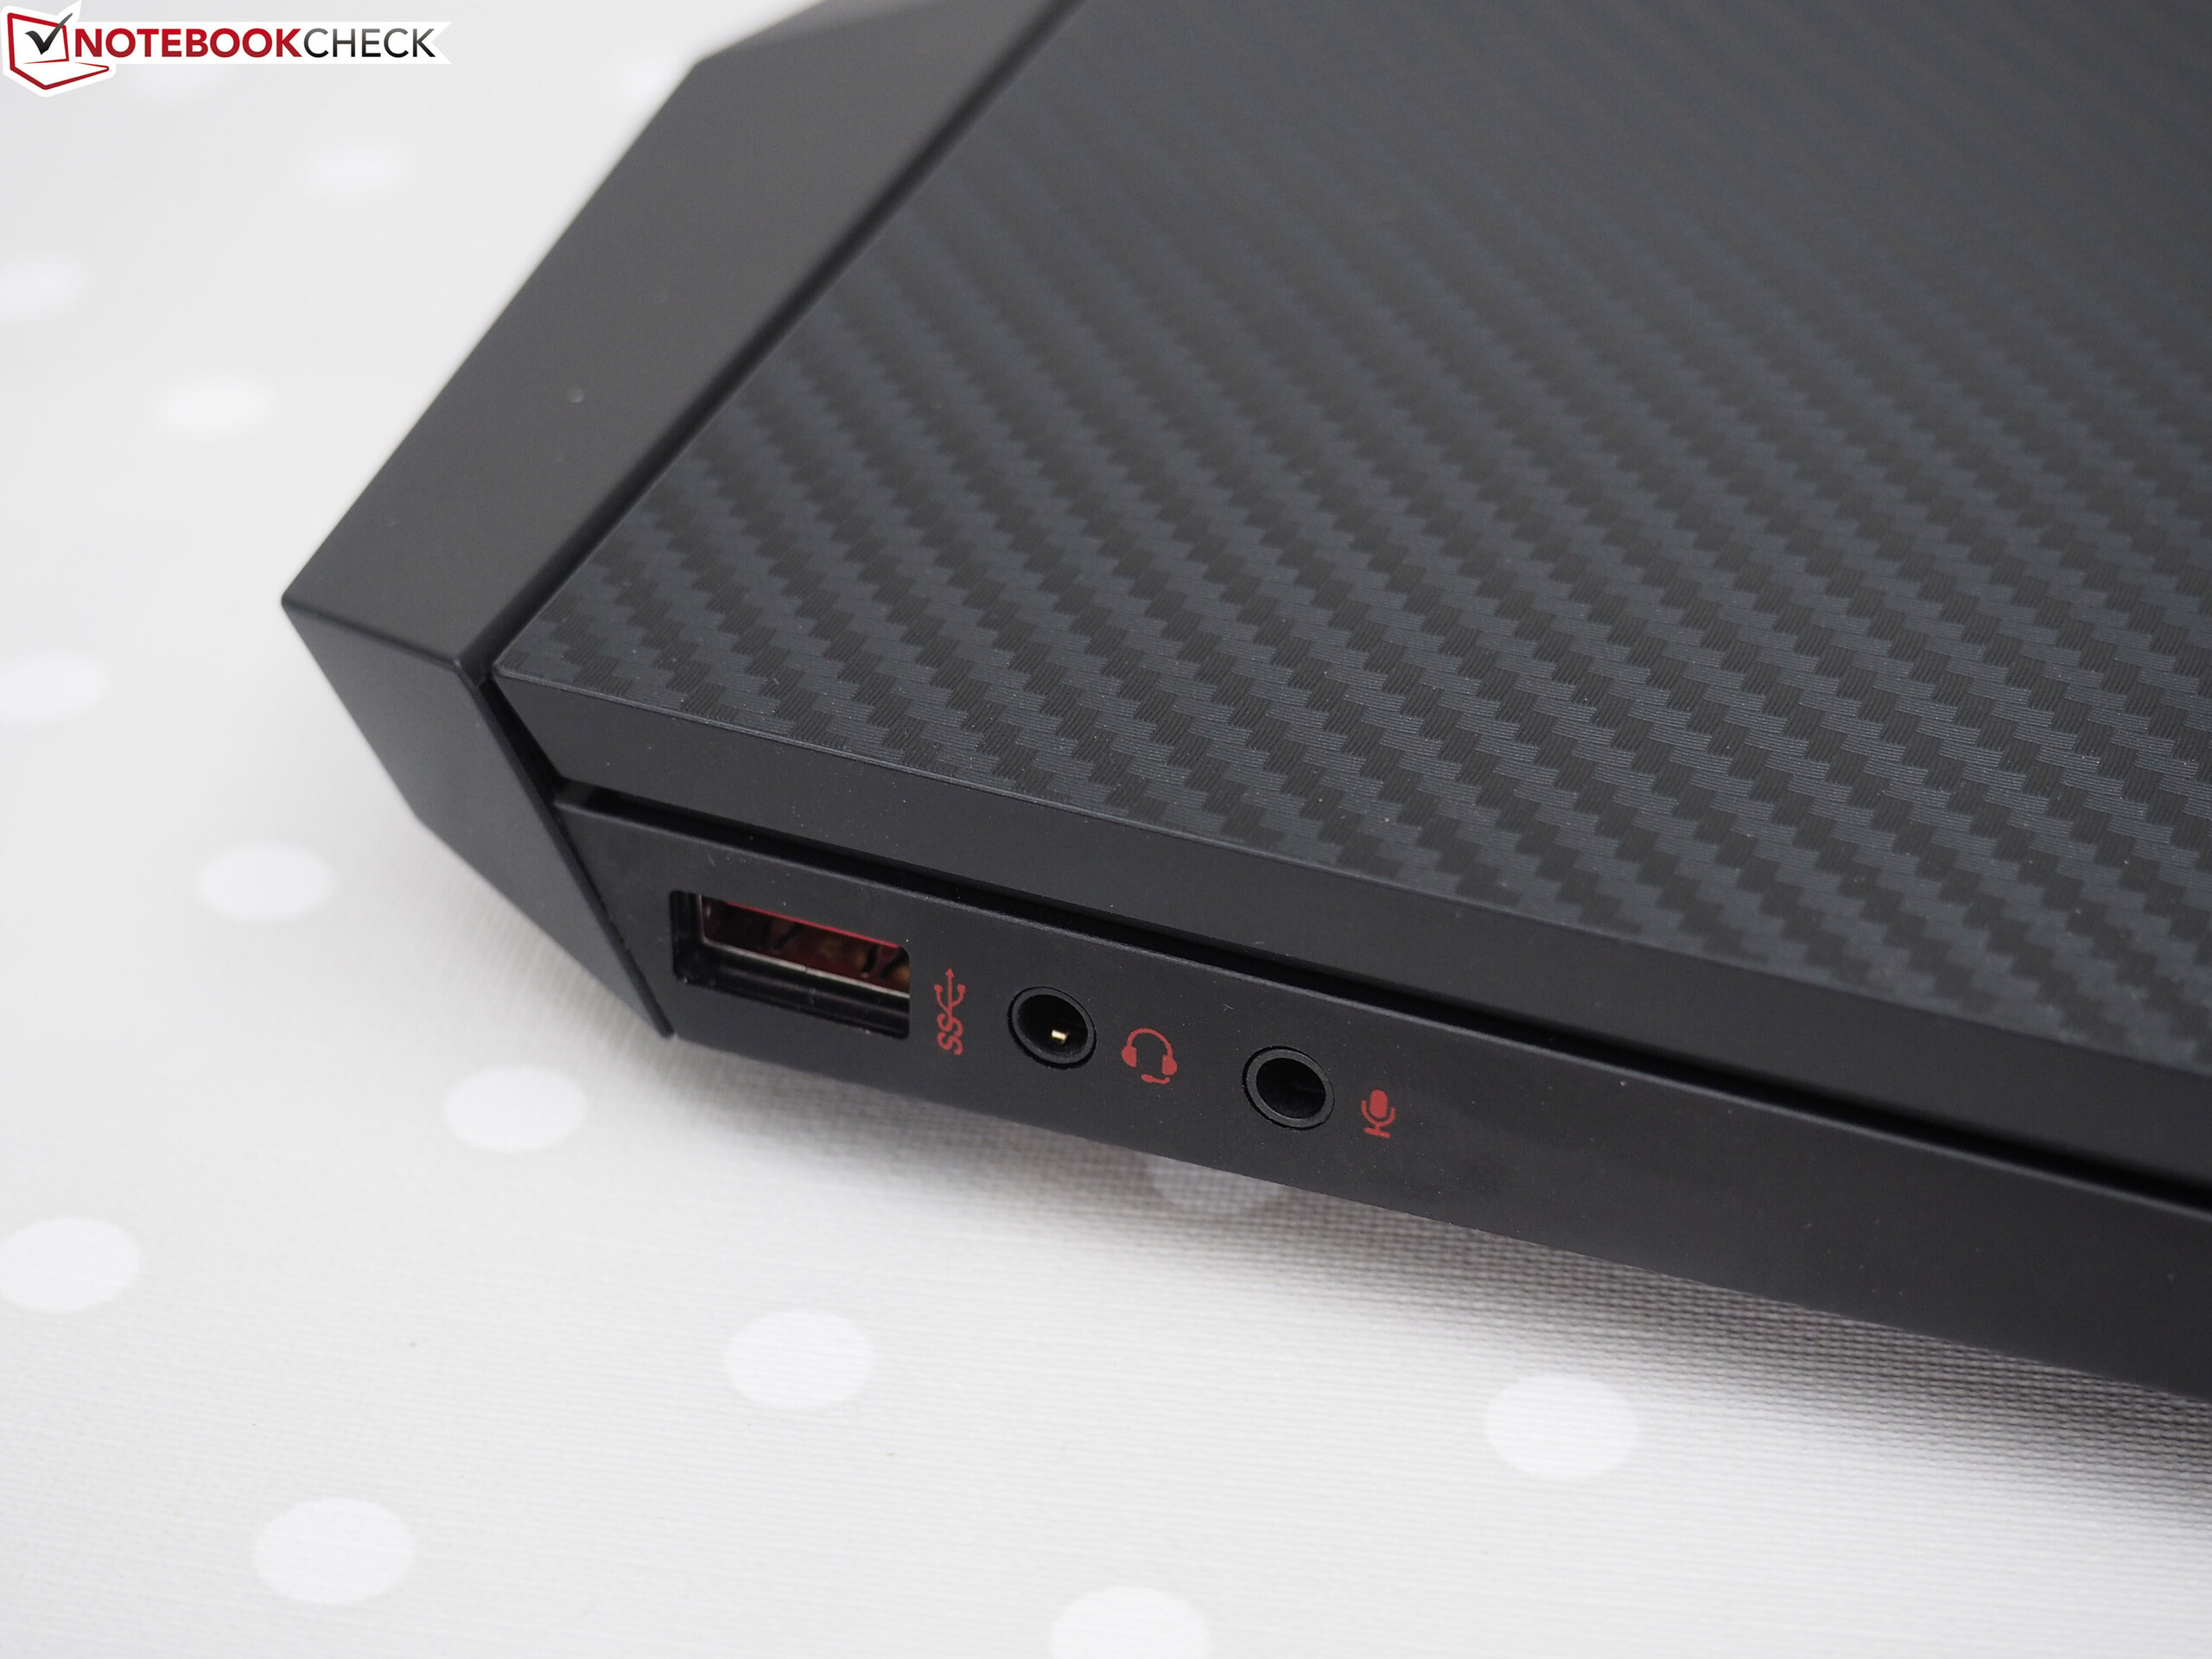
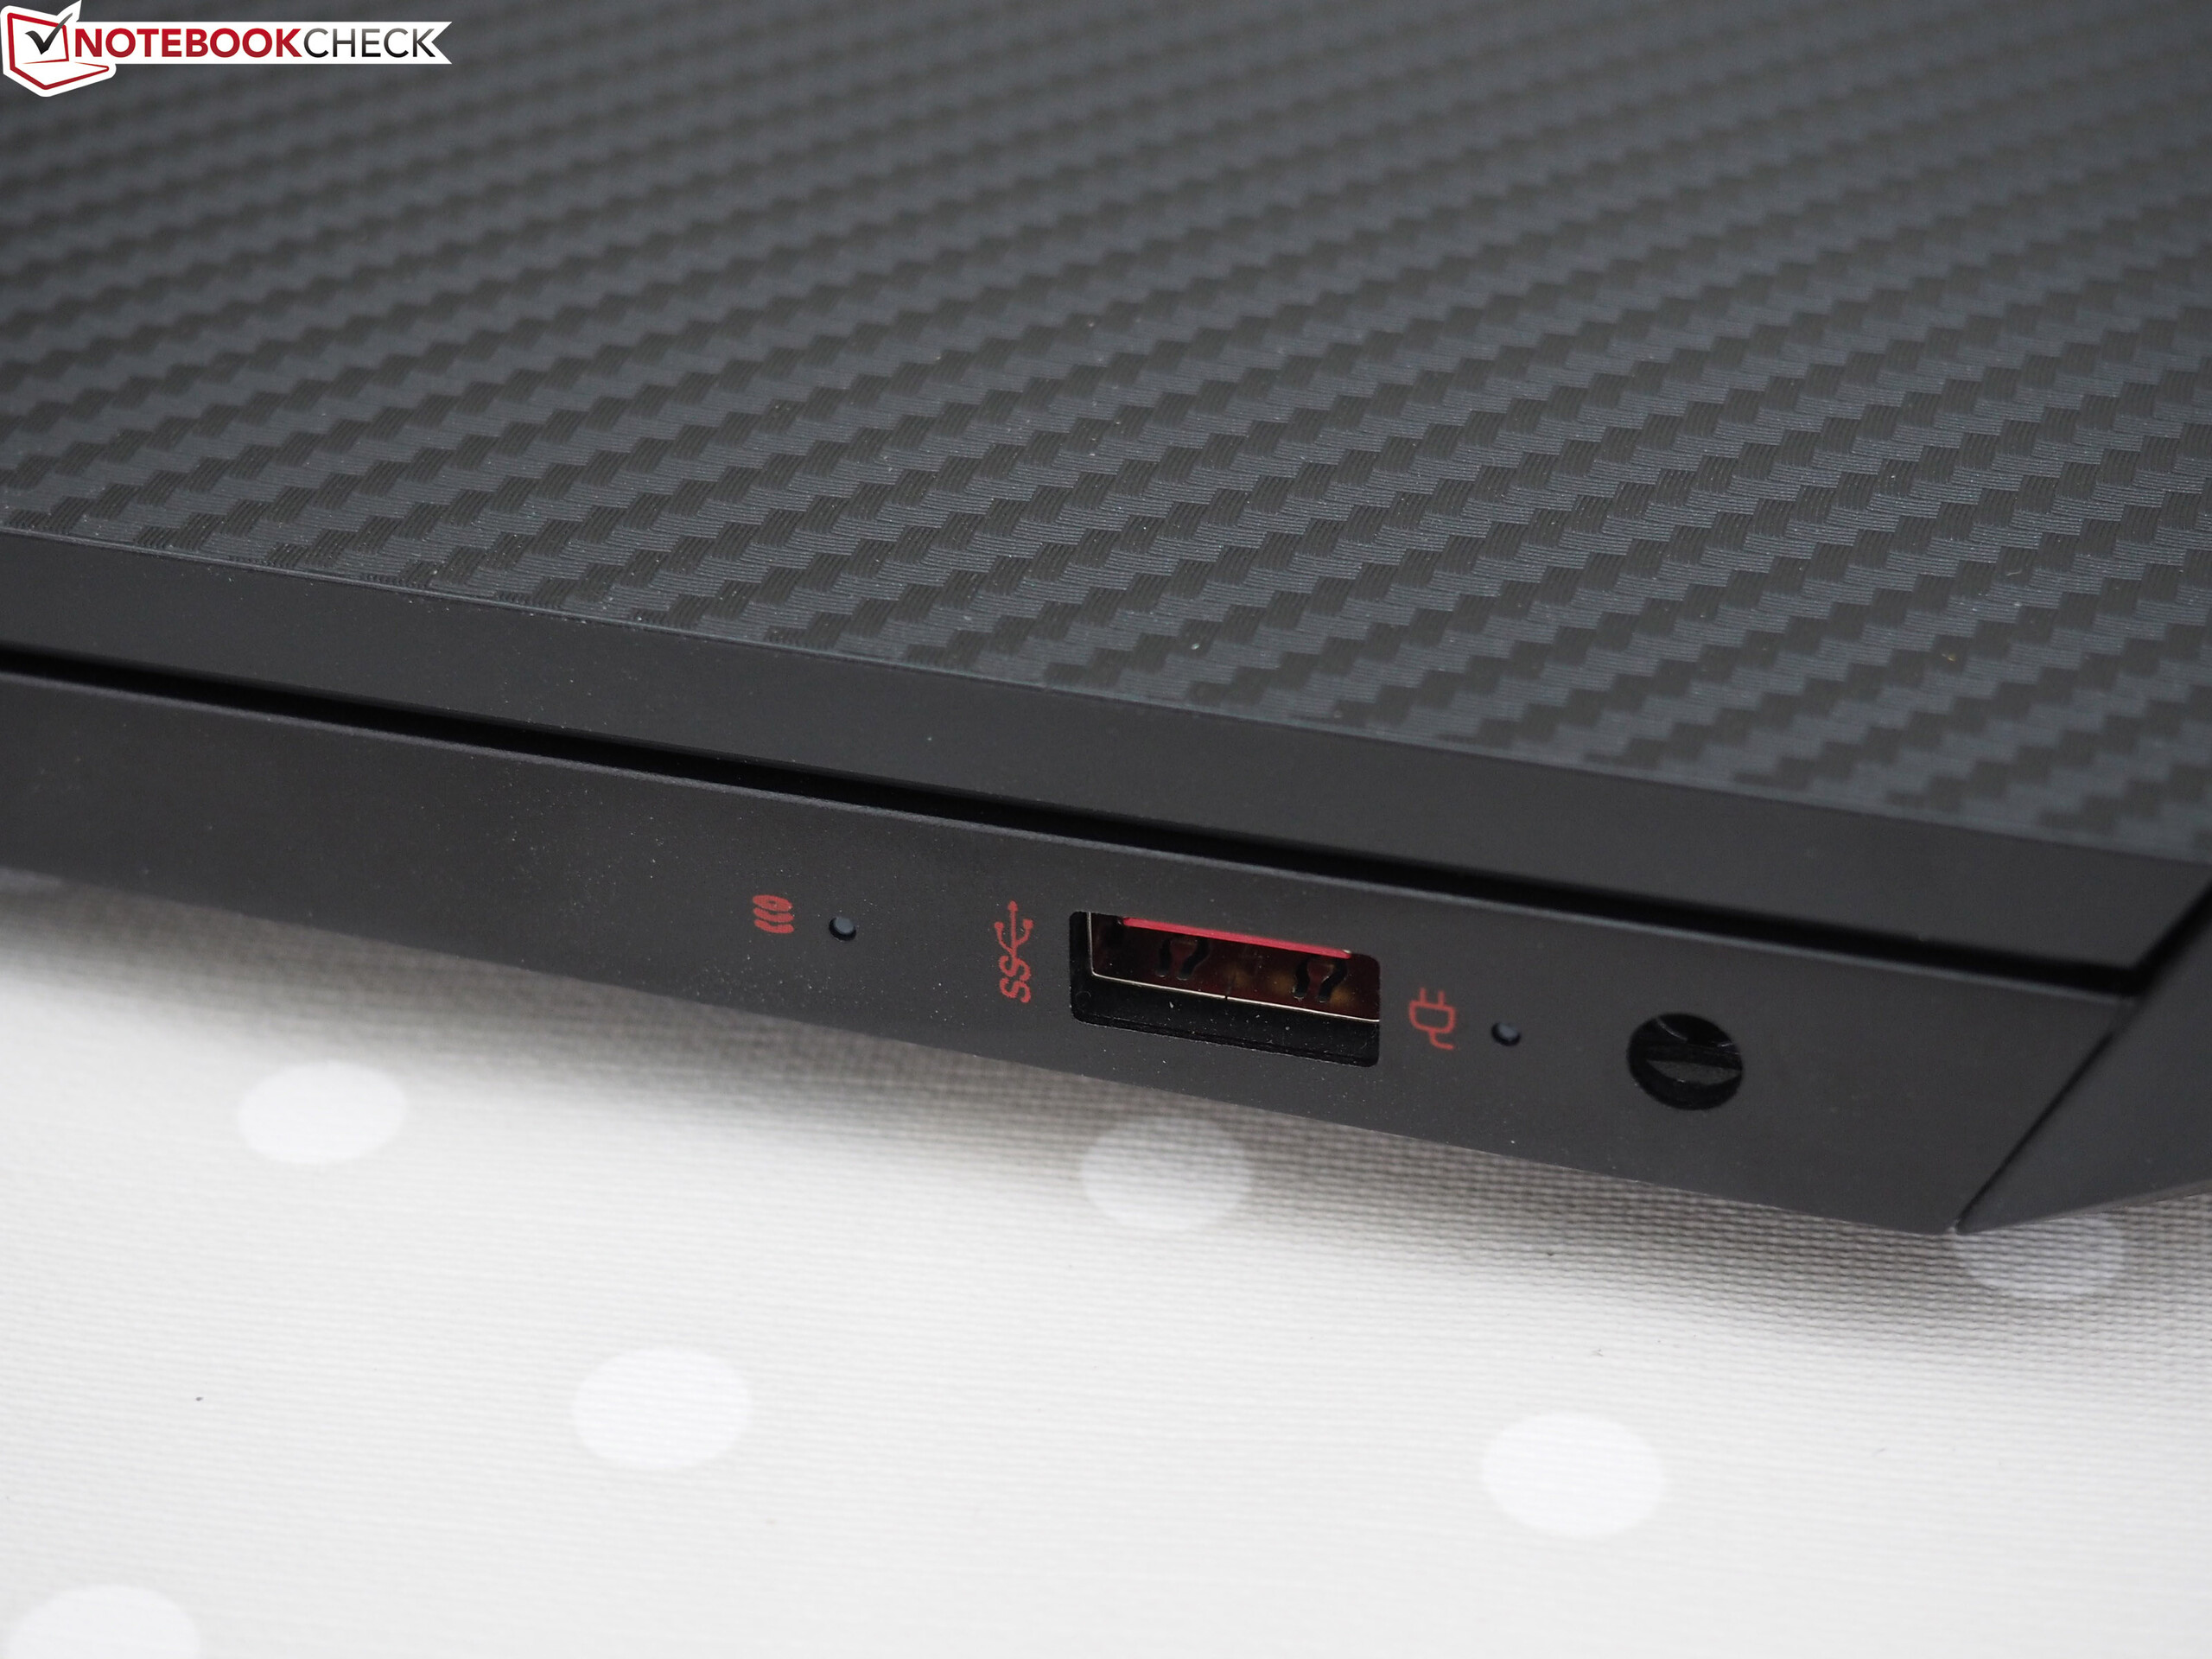
While the sibling model we previously tested only offers one Type-C USB 3.1 Gen 1 slot, our current test unit brings a Thunderbolt-3 connection, so you can also connect an external GPU in case the built-in model is unable to fulfill your demands one day.
HP Omen 15-dc0015ng
- 12/10/2018 v6 (old)
Sascha Mölck
Price comparison

