X-Plane 11 Benchmarks

Introduction
X-Plane 11 is the 2018 sequel to 2012’s popular X-Plane 10 and is a competing product to Microsoft's Flight Simulator in the consumer market. However, the 32-bit engine in Microsoft's product is showing its age, and this has allowed the more advanced 64-bit X-Plane engine to surpass it in technical prowess and scalability.
Developed by Laminar Research in South Carolina, USA, X-Plane 11 runs on Windows, MacOS, and Linux (X-Plane 10 also had a mobile version for Android and iOS). The base version of the game comes with a set of 19 stock aircraft at varying levels of detail and immersion and a set of global scenery that covers most of the earth from 74 degrees north to 60 degrees south latitude. There are runway locations for over 34,000 airports around the world, including small grass strips in rural bush areas, and community developers are creating and submitting free airport layouts (buildings, vehicles, etc.) for inclusion in the game. Those who want more detail and immersion can choose between a multitude of high-quality payware aircraft and extremely detailed airports. Alternatively, there are a considerable number of freely available airport layouts online to install to add some life to the places from which you take off and land.
As a highly detailed open-world flight simulator, the plane models, environment, and objects place a significant toll on systems. The highly advanced physics engine that accurately simulates factors such as airflow based off of the angles, lines, and engineering data of the plane models also places a heavy strain on the system. X-Plane is a good game for benchmarking because of a multitude of options for increasing visual detail, shadow quality, object count, and view distance which mean that the game scales well over a range of hardware (although graphics options have been simplified in the newest version). There is also an inbuilt testing system that allows us to run scenarios in a consistent environment.


Graphics
Most of the games we benchmark on Windows use the Microsoft DirectX graphical API due to its dominance on the platform. Since Microsoft Flight Simulator was a Windows product, X-Plane captured early market share on MacOS and used OpenGL due to good compatibility with the operating system. Laminar Research still uses OpenGL and its cross-platform nature is well suited to producing versions for Windows, MacOS, and Linux without having to rewrite huge parts of the code base from scratch. Having some OpenGL games in the test line up is essential to show performance over different graphical APIs since there are some differences between the level of GPU manufacturers support for non-DirectX APIs. For much of the last decade, Nvidia’s drivers gave better OpenGL performance on Windows, although this has improved in the last couple of years with AMD’s OpenGL support closing the gap with Nvidia. Unfortunately, AMD drivers do still perform comparatively worse on OpenGL than on DirectX when in Windows.
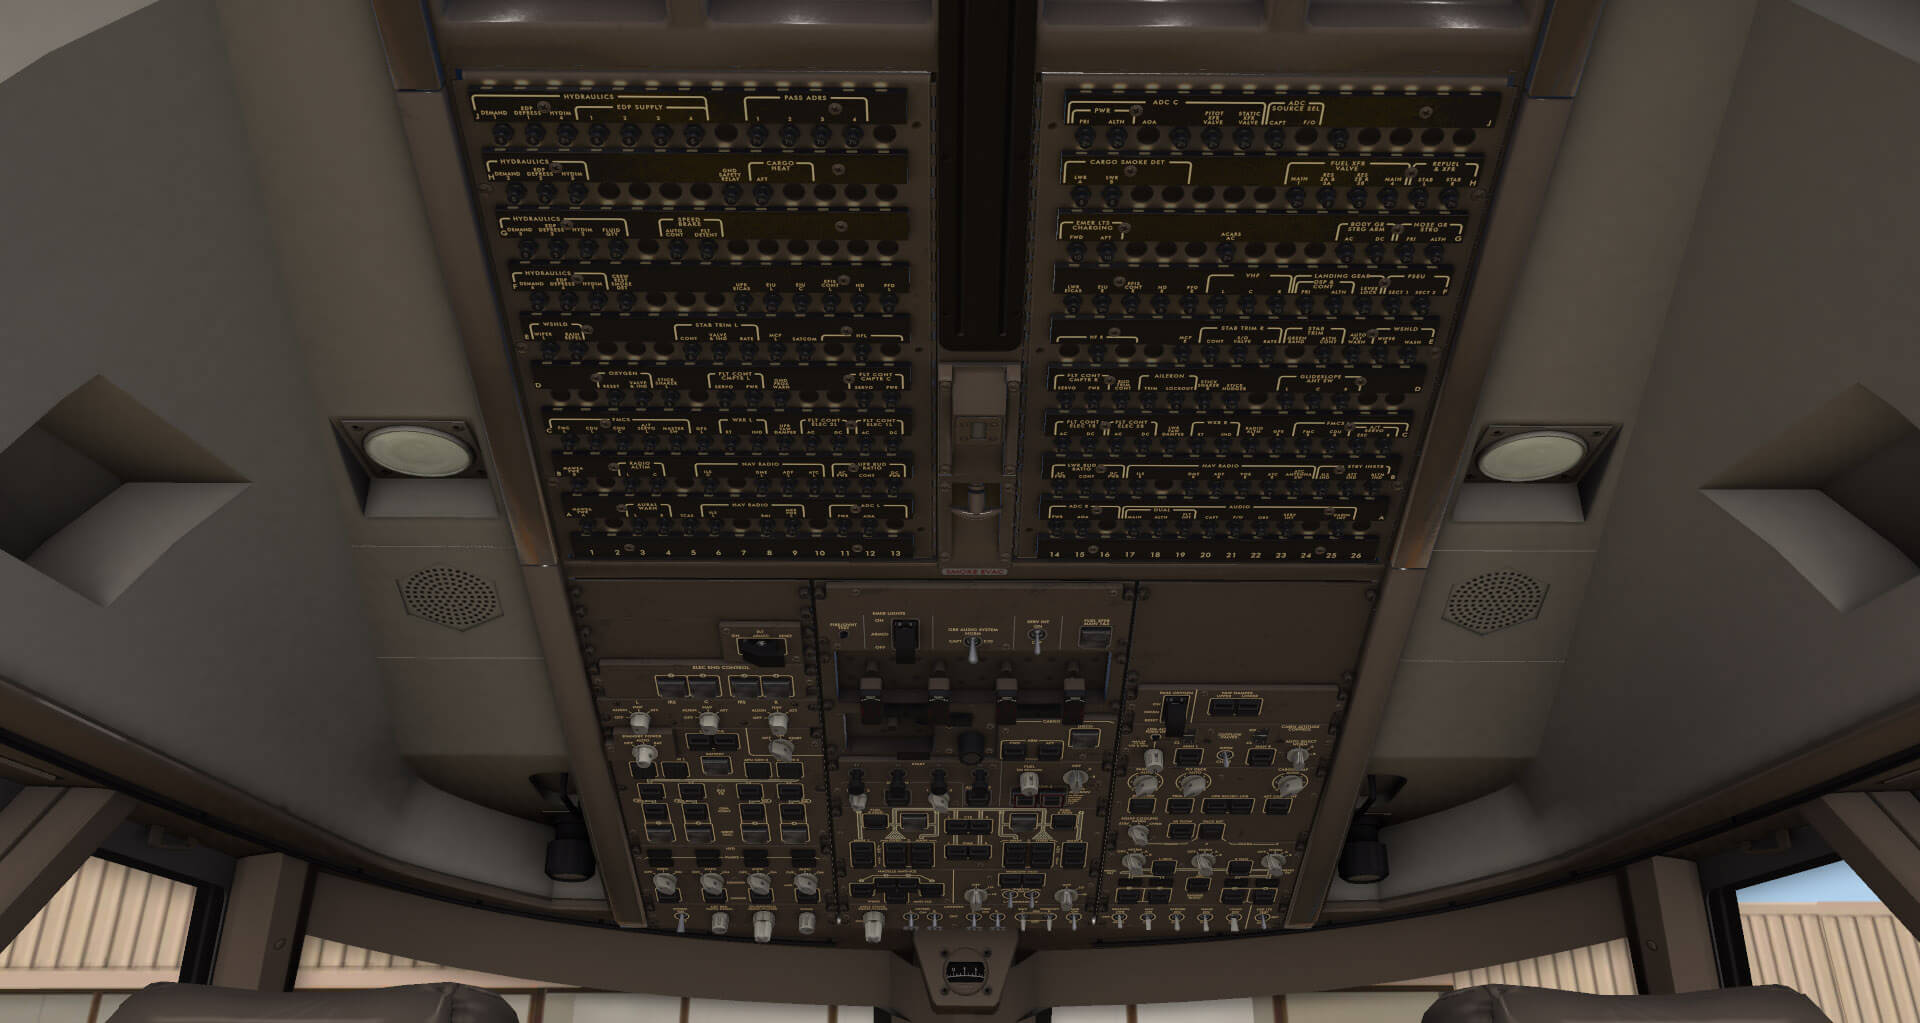
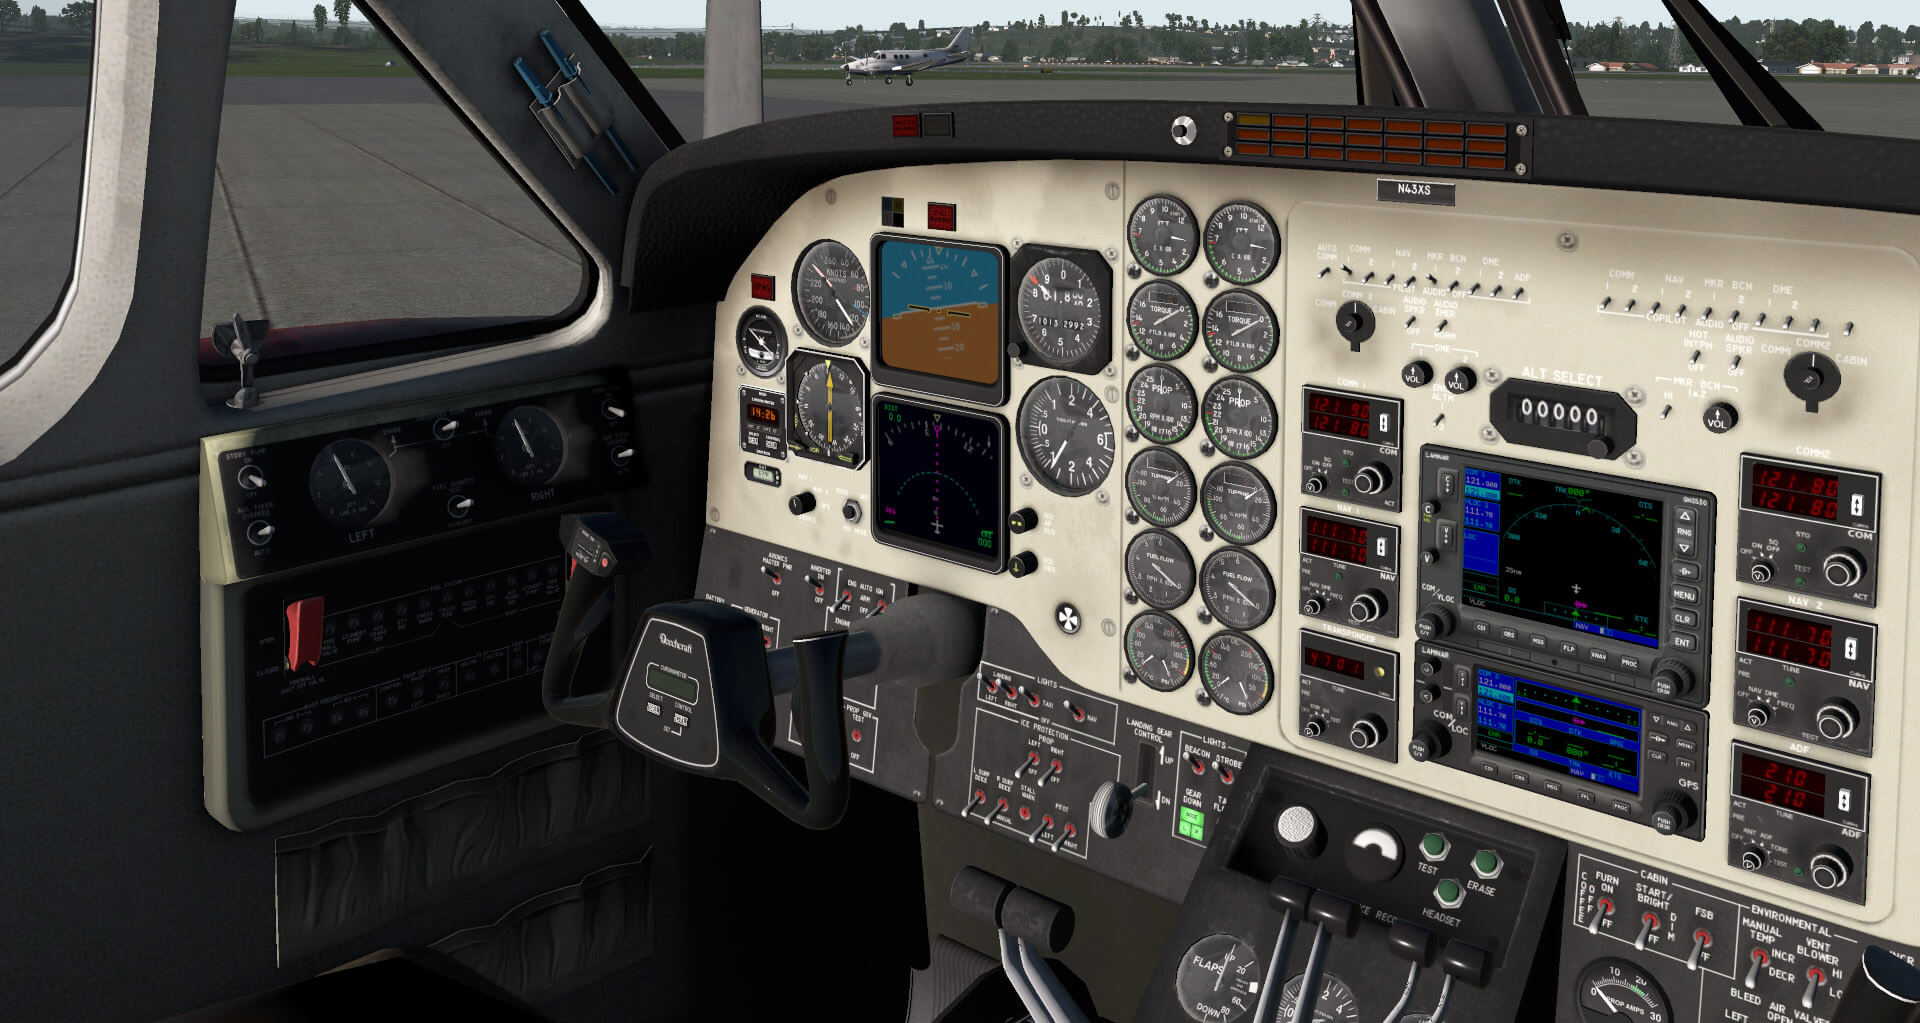
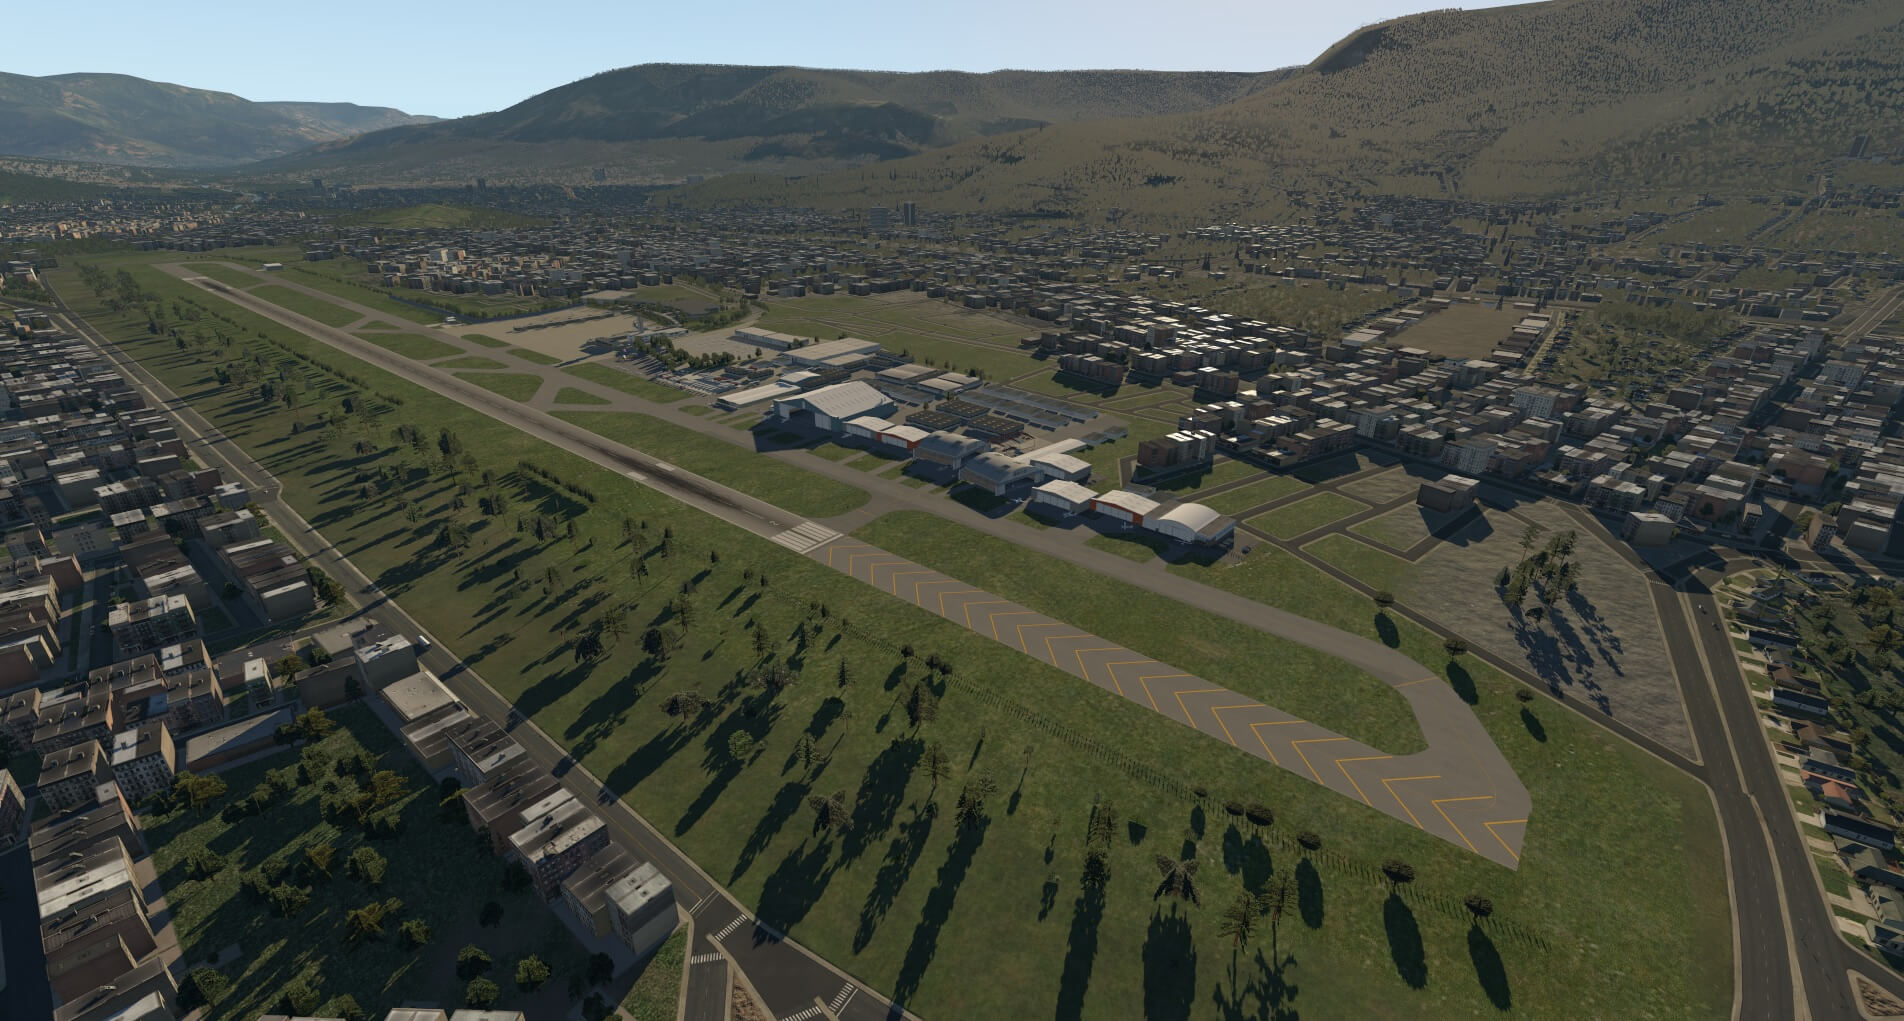
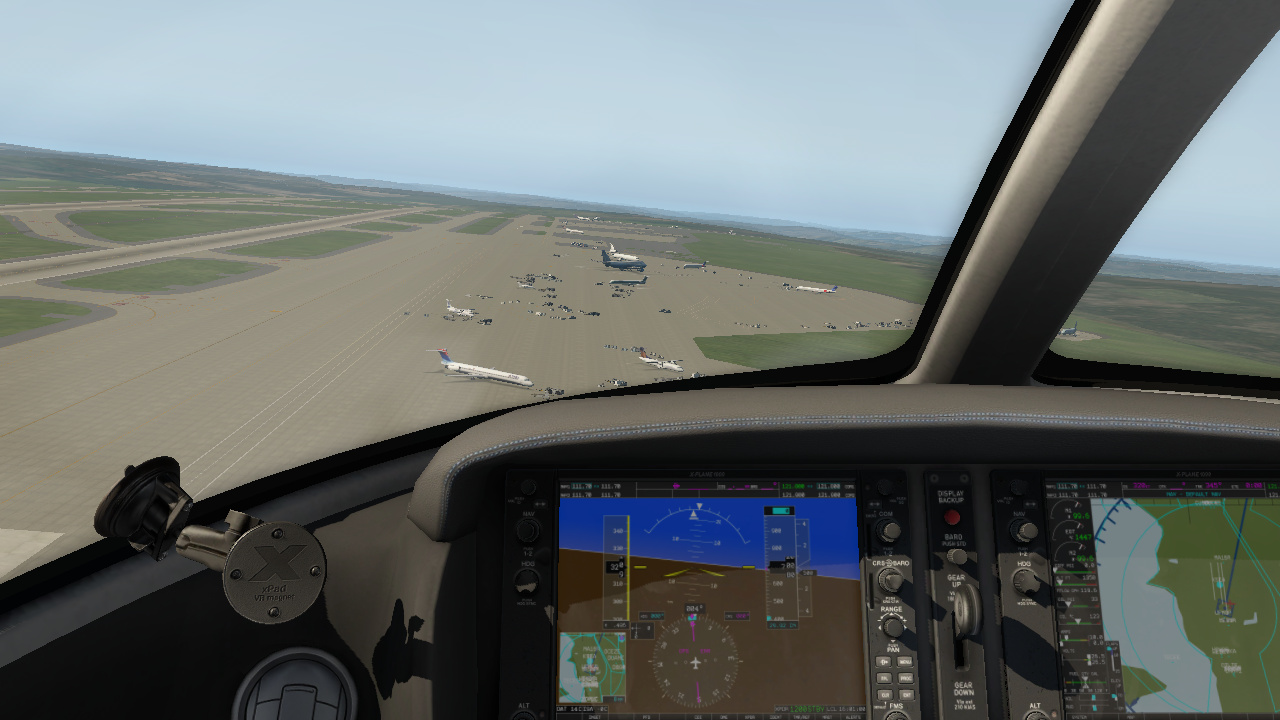
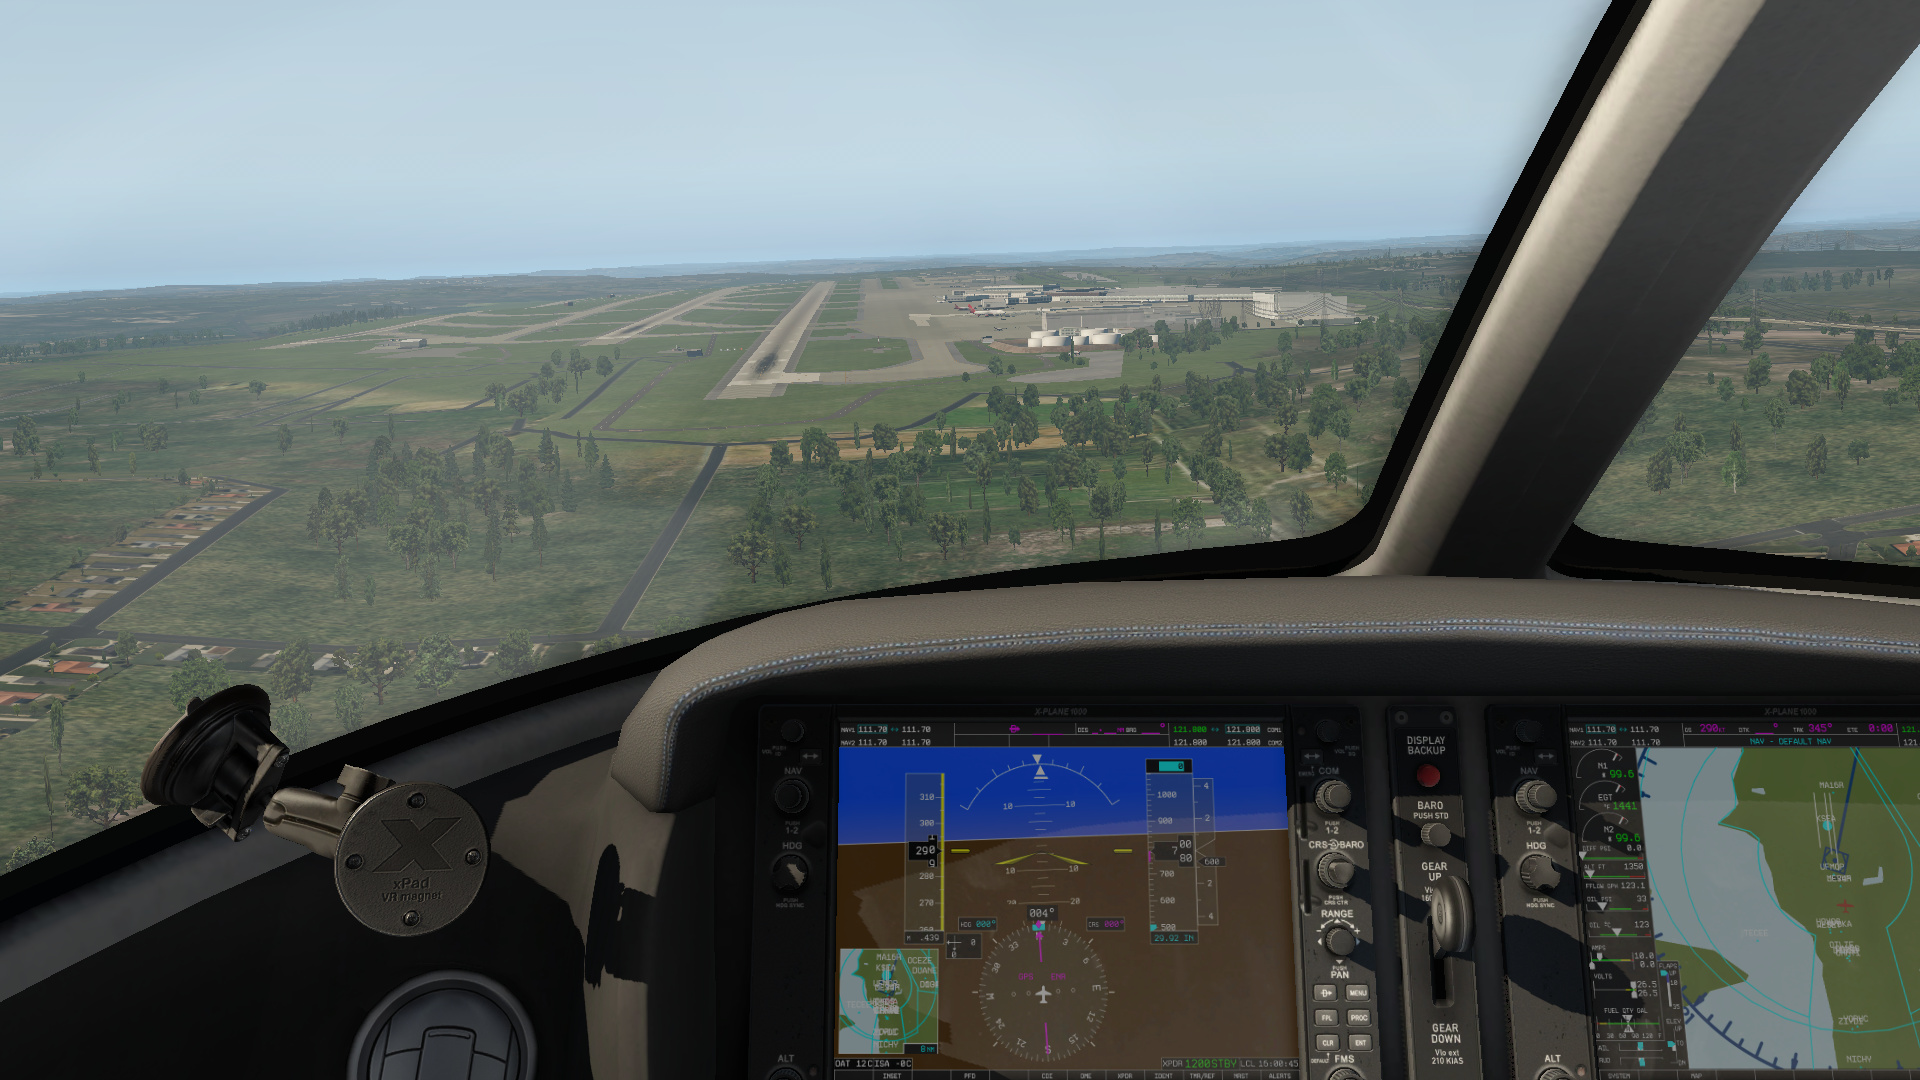
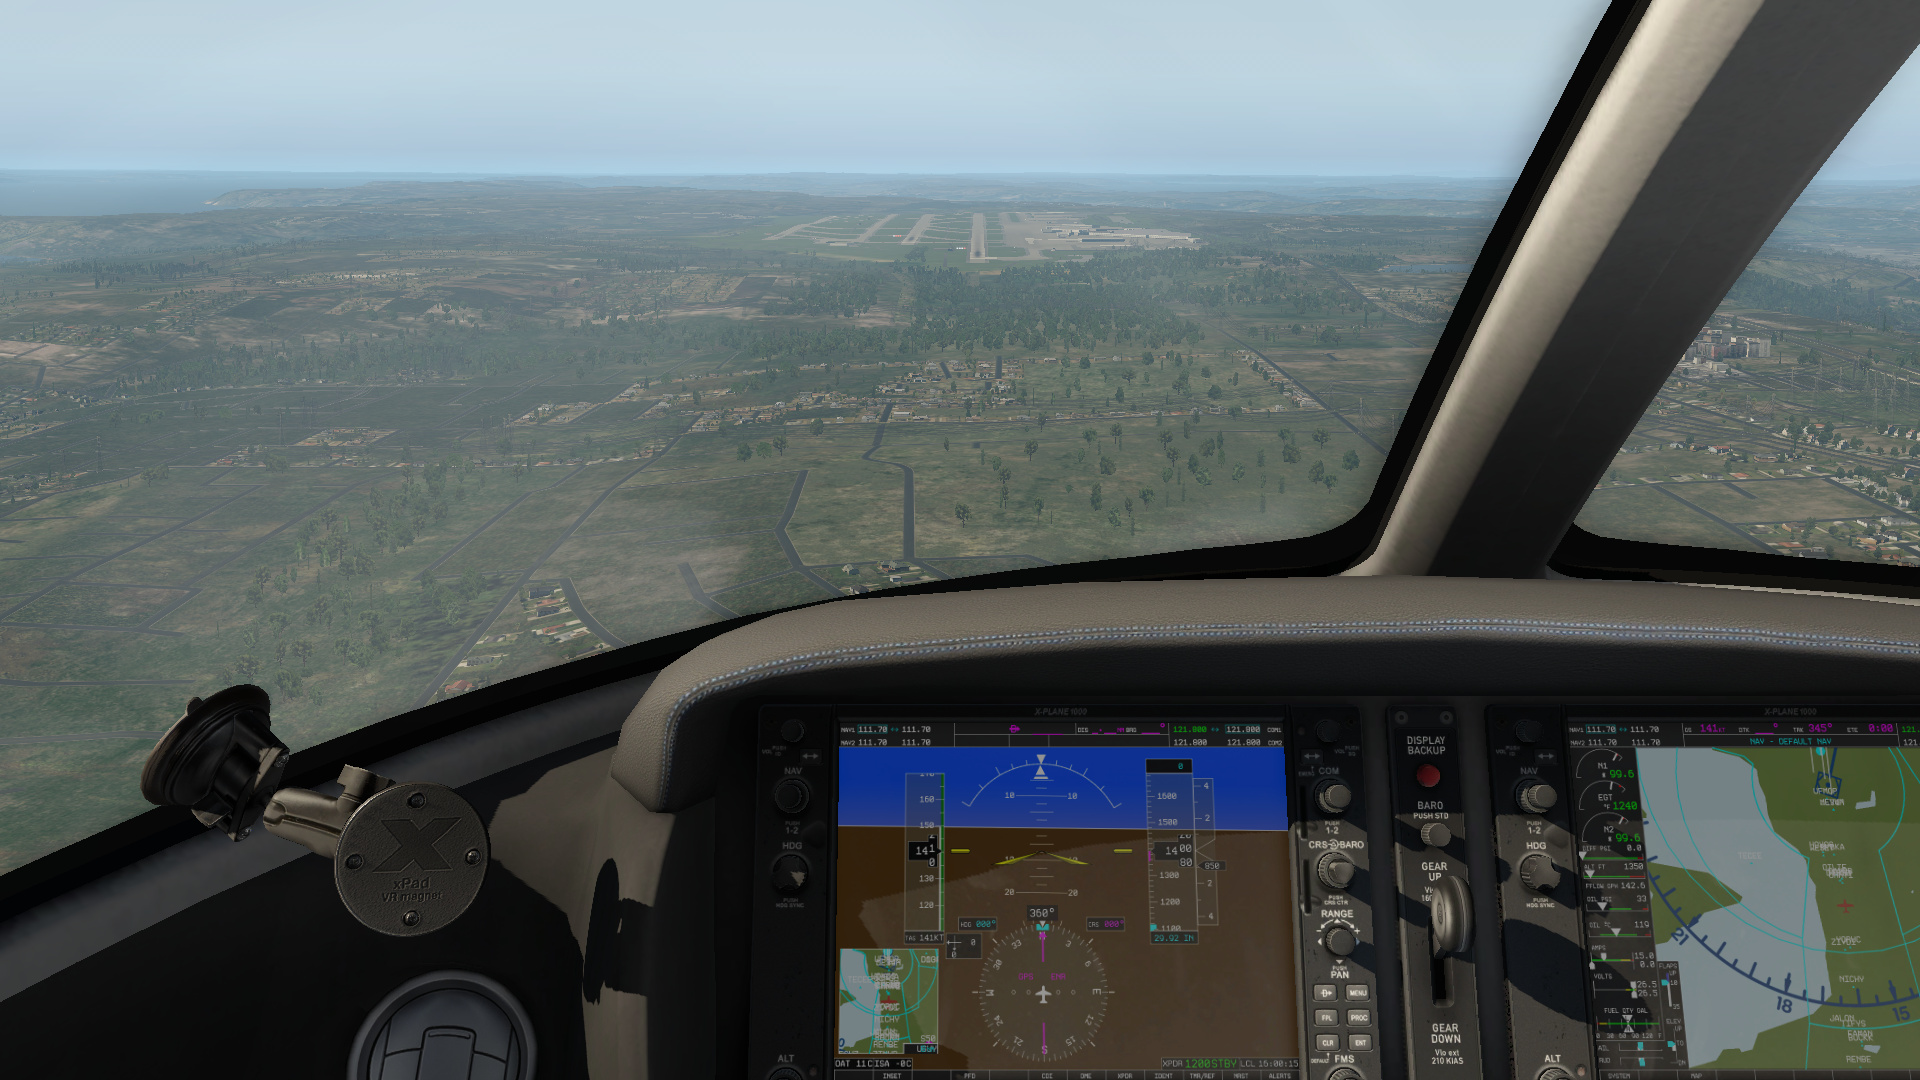
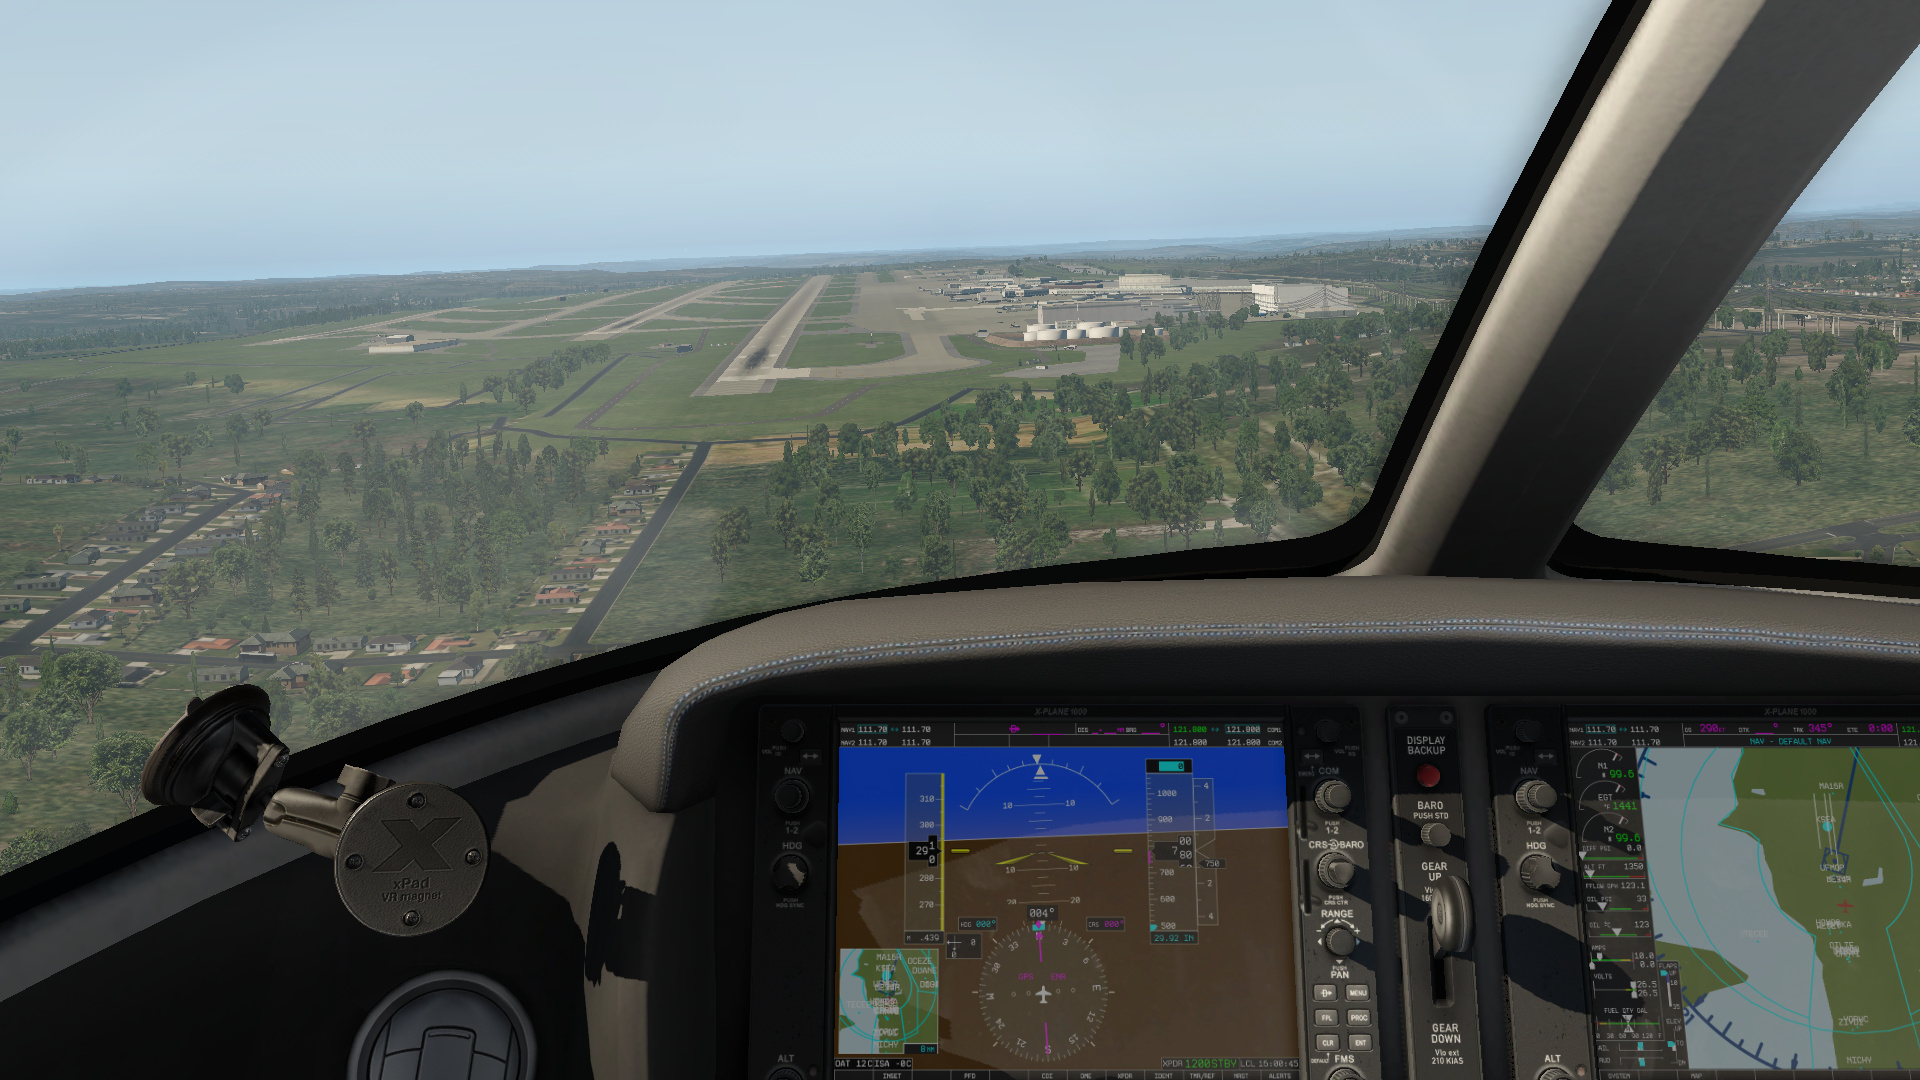
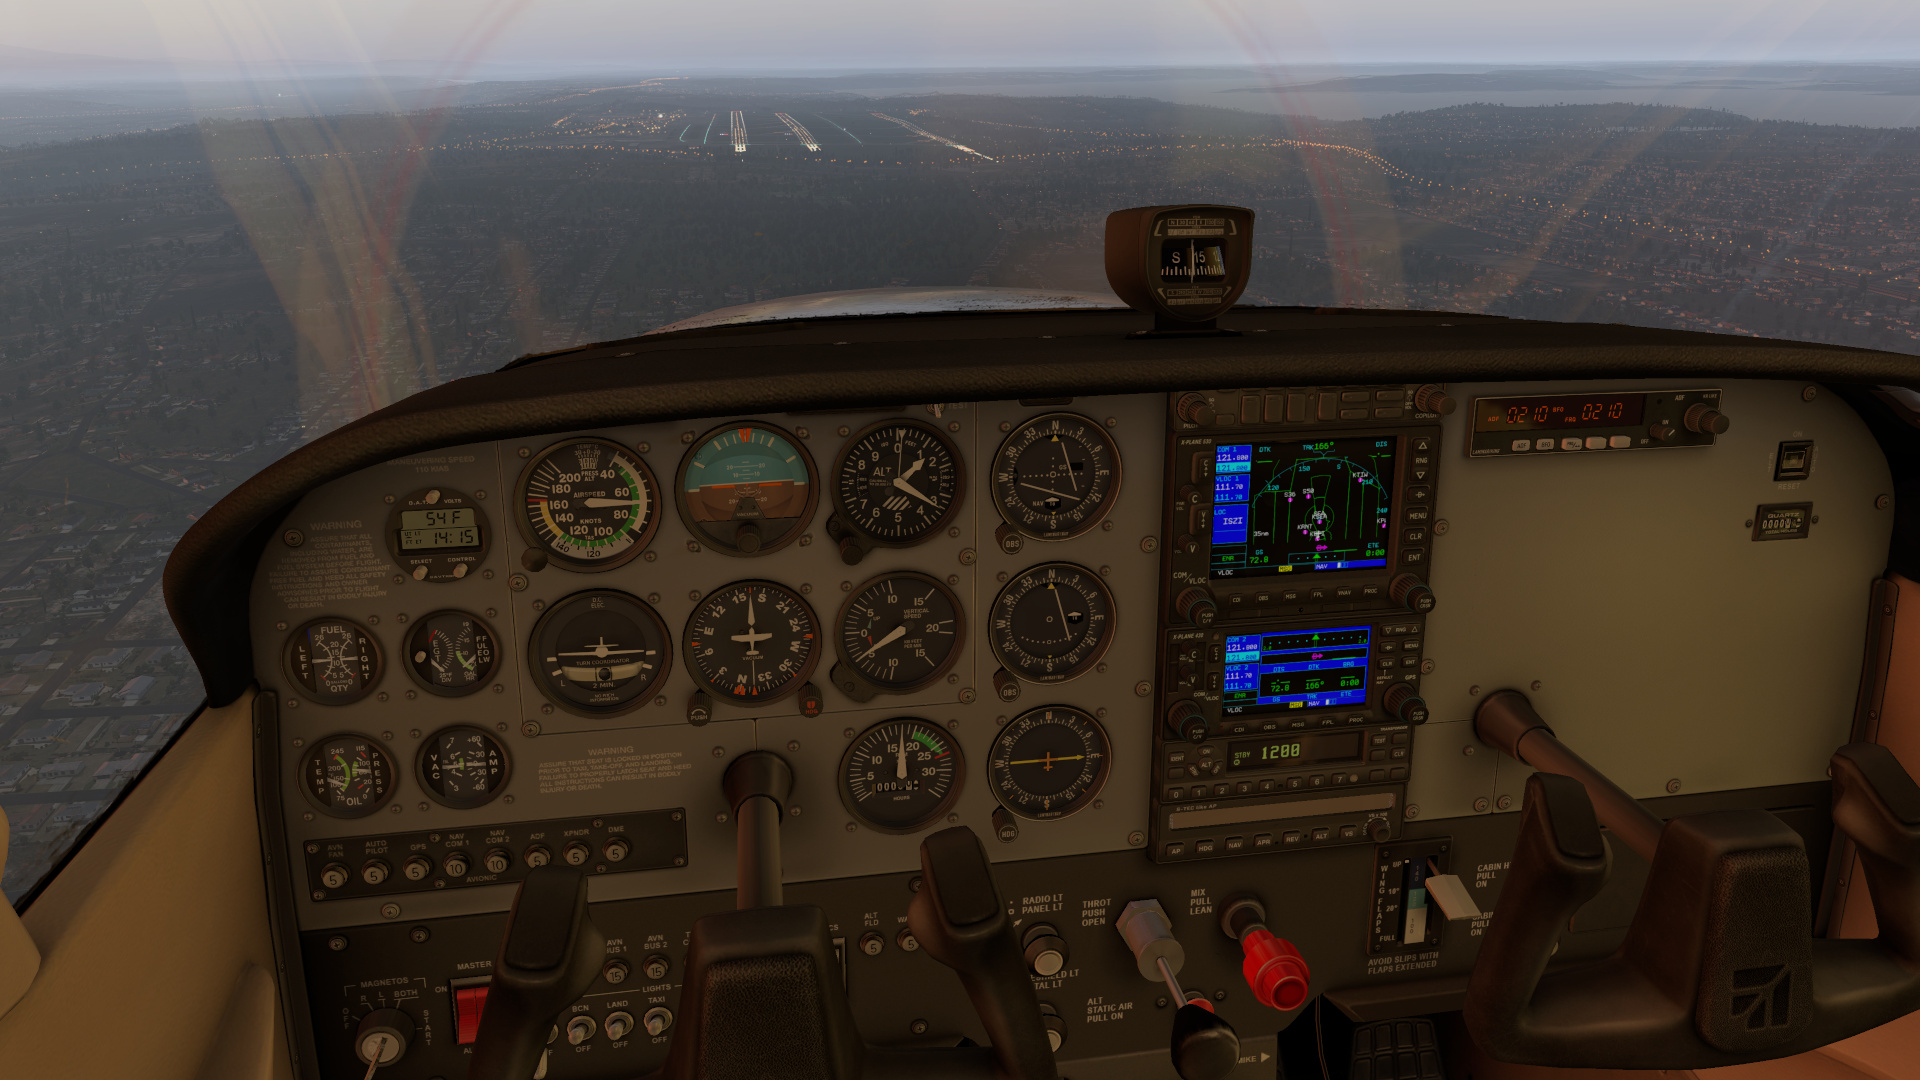
The X-Plane 11 landscape is made of ground textures laid over a detailed terrain mesh, but the world itself is full of 3D objects such as trees, houses, cars, and street lamps in towns, or terminals, fuel pumps, and support vehicles on airports. With a view distance that can be set to show several kilometers around the player, there is an opportunity for thousands of objects on screen at any one time, and these can place a heavy load on the system — the processor is a particular bottleneck. The airplanes themselves are equally as taxing (if not more so), due to high-poly models with detailed curves and 3D cockpits that have numerous knobs and dials to manipulate and a real depth to the instrument panel when viewed off center. Shadows place a heavy load on GPUs, and while X-Plane 11 has a more traditional descriptions in the setting menu, older versions of the game called the highest shadow setting “melt your GPU” as an example of how taxing shadows can be.
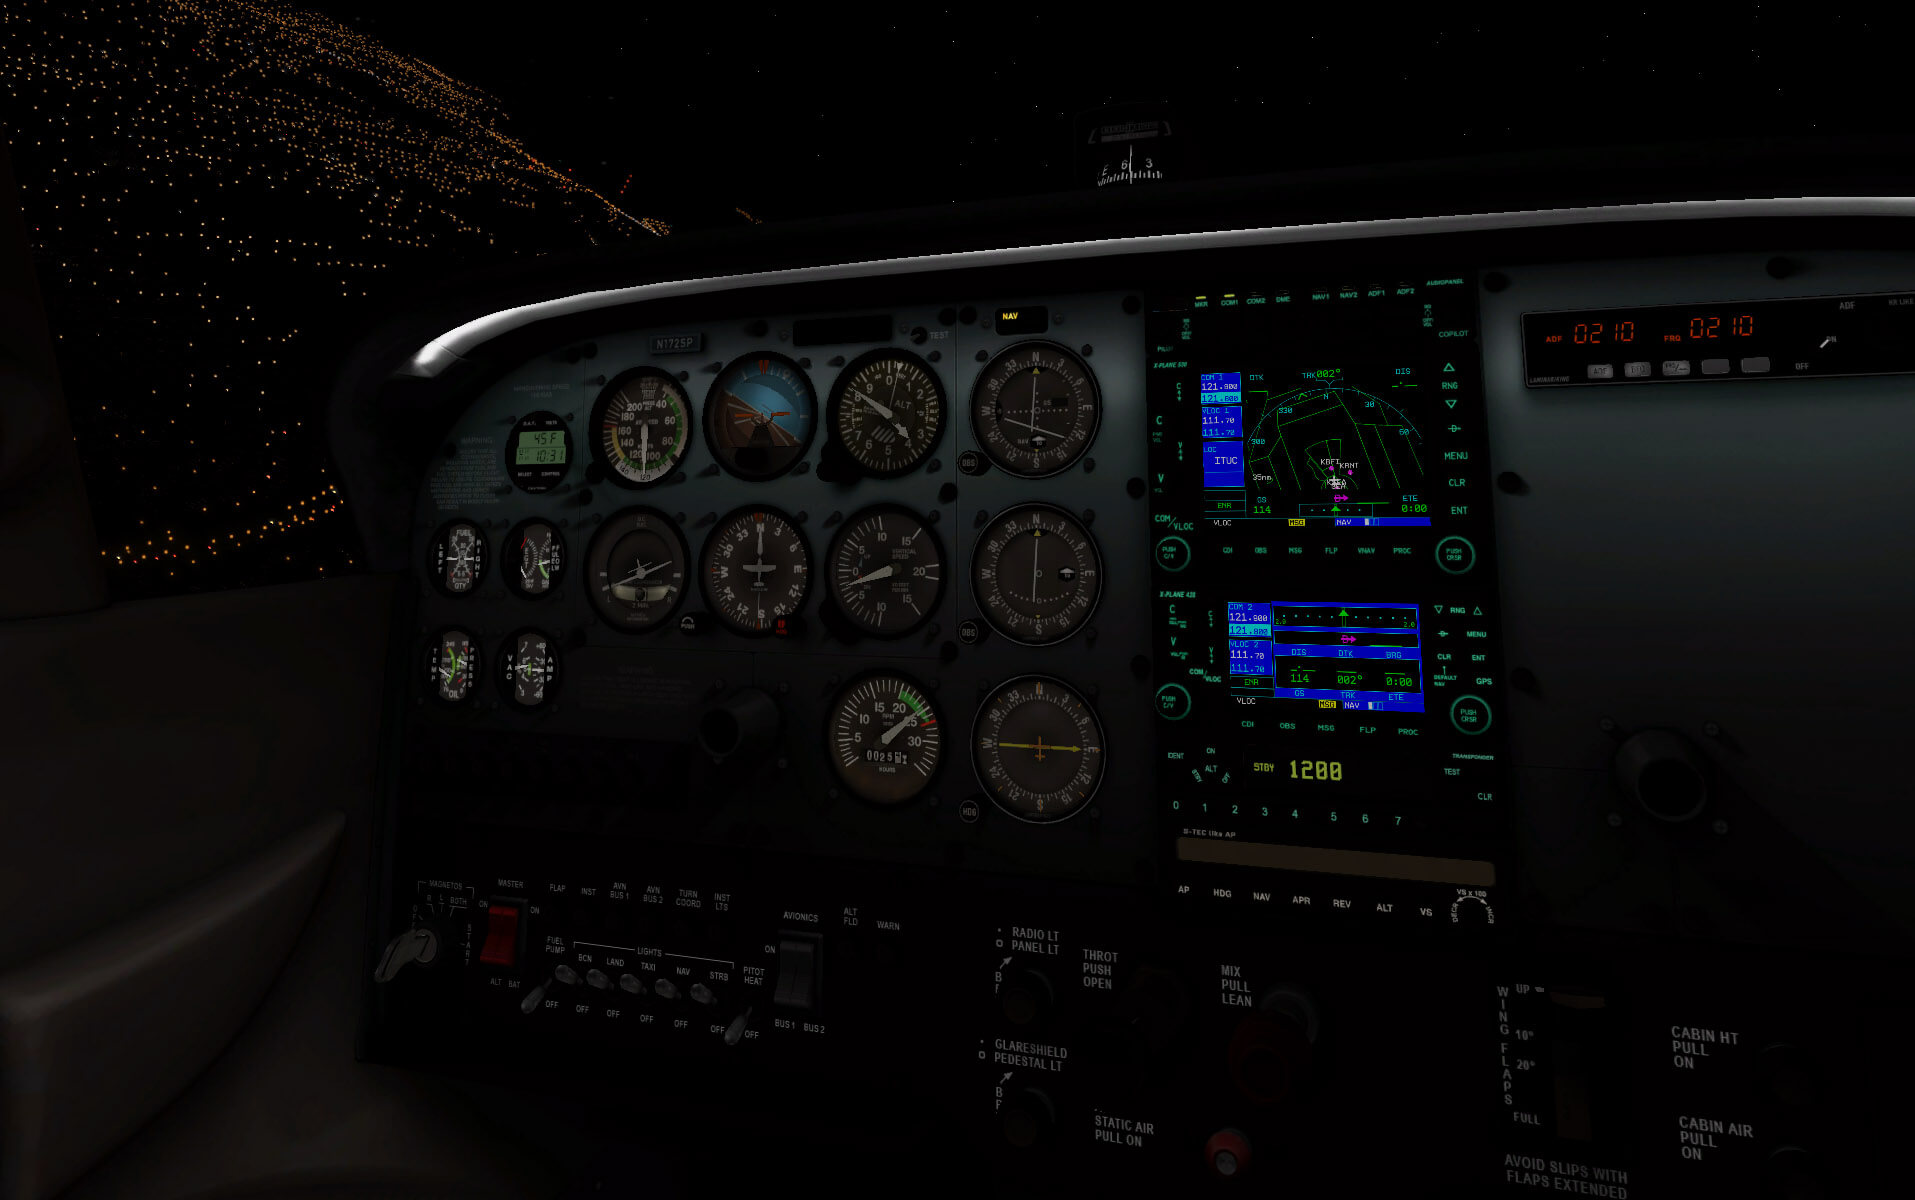
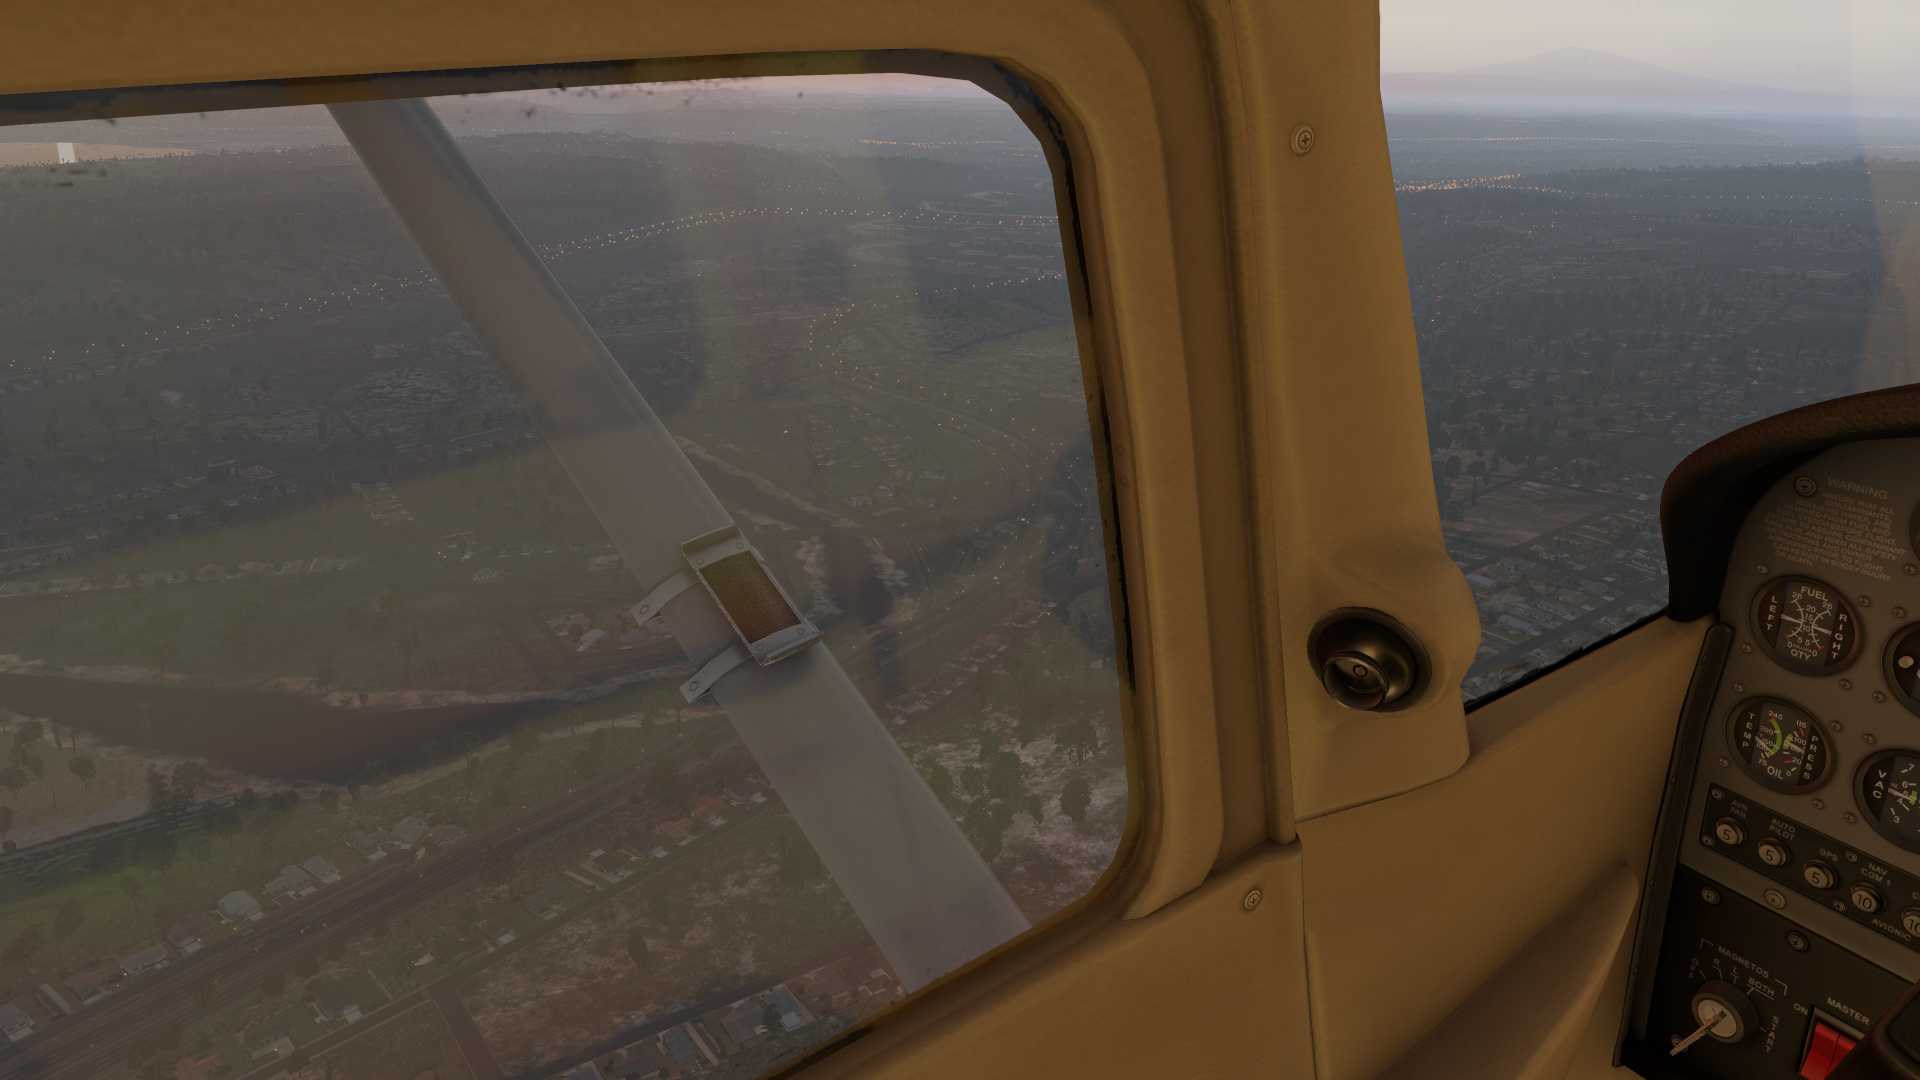
The advanced weather model simulates stratus or cumulus clouds at varying degrees of thickness and heights above sea level. The clouds aren’t solid objects and rendering them on screen is taxing, since they are a collection of smaller particles. Raindrops and the streaking they cause on windshields are beautiful, but again these also add an additional load to the system.


Benchmark
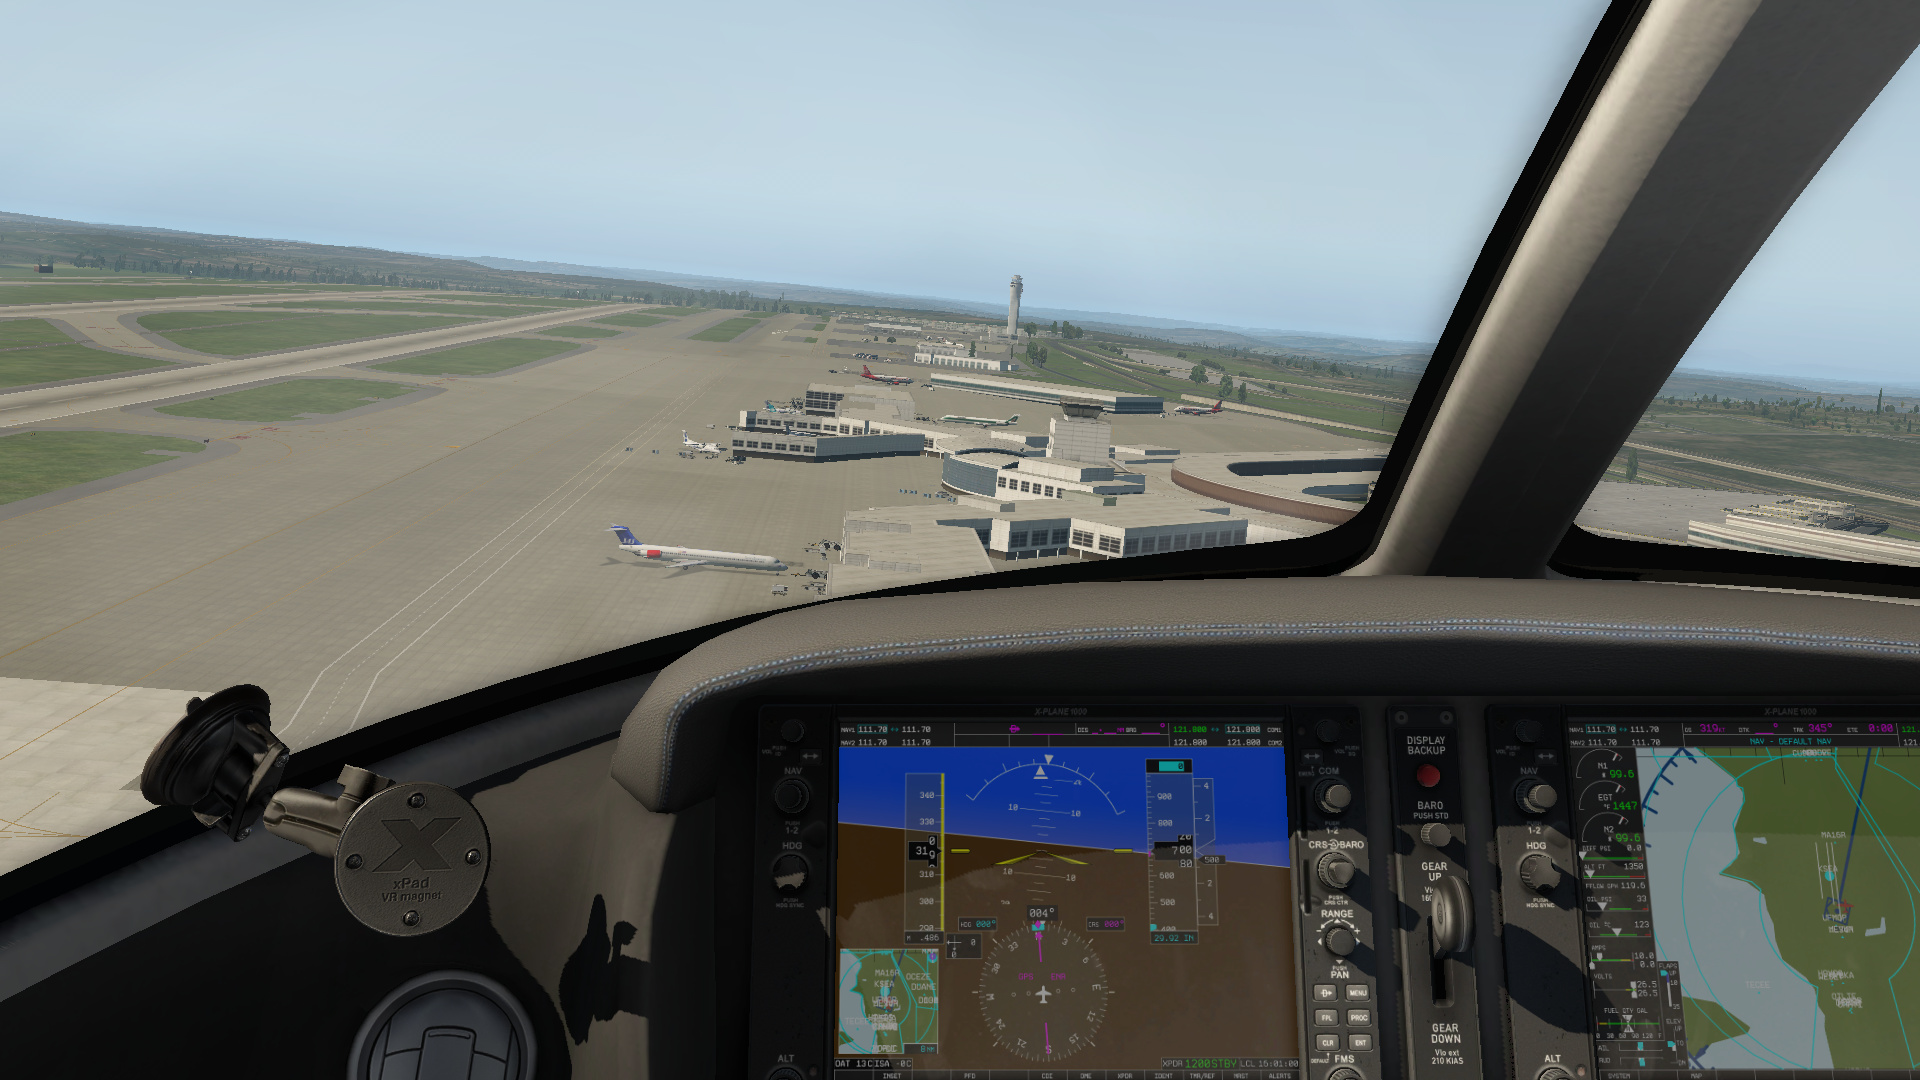
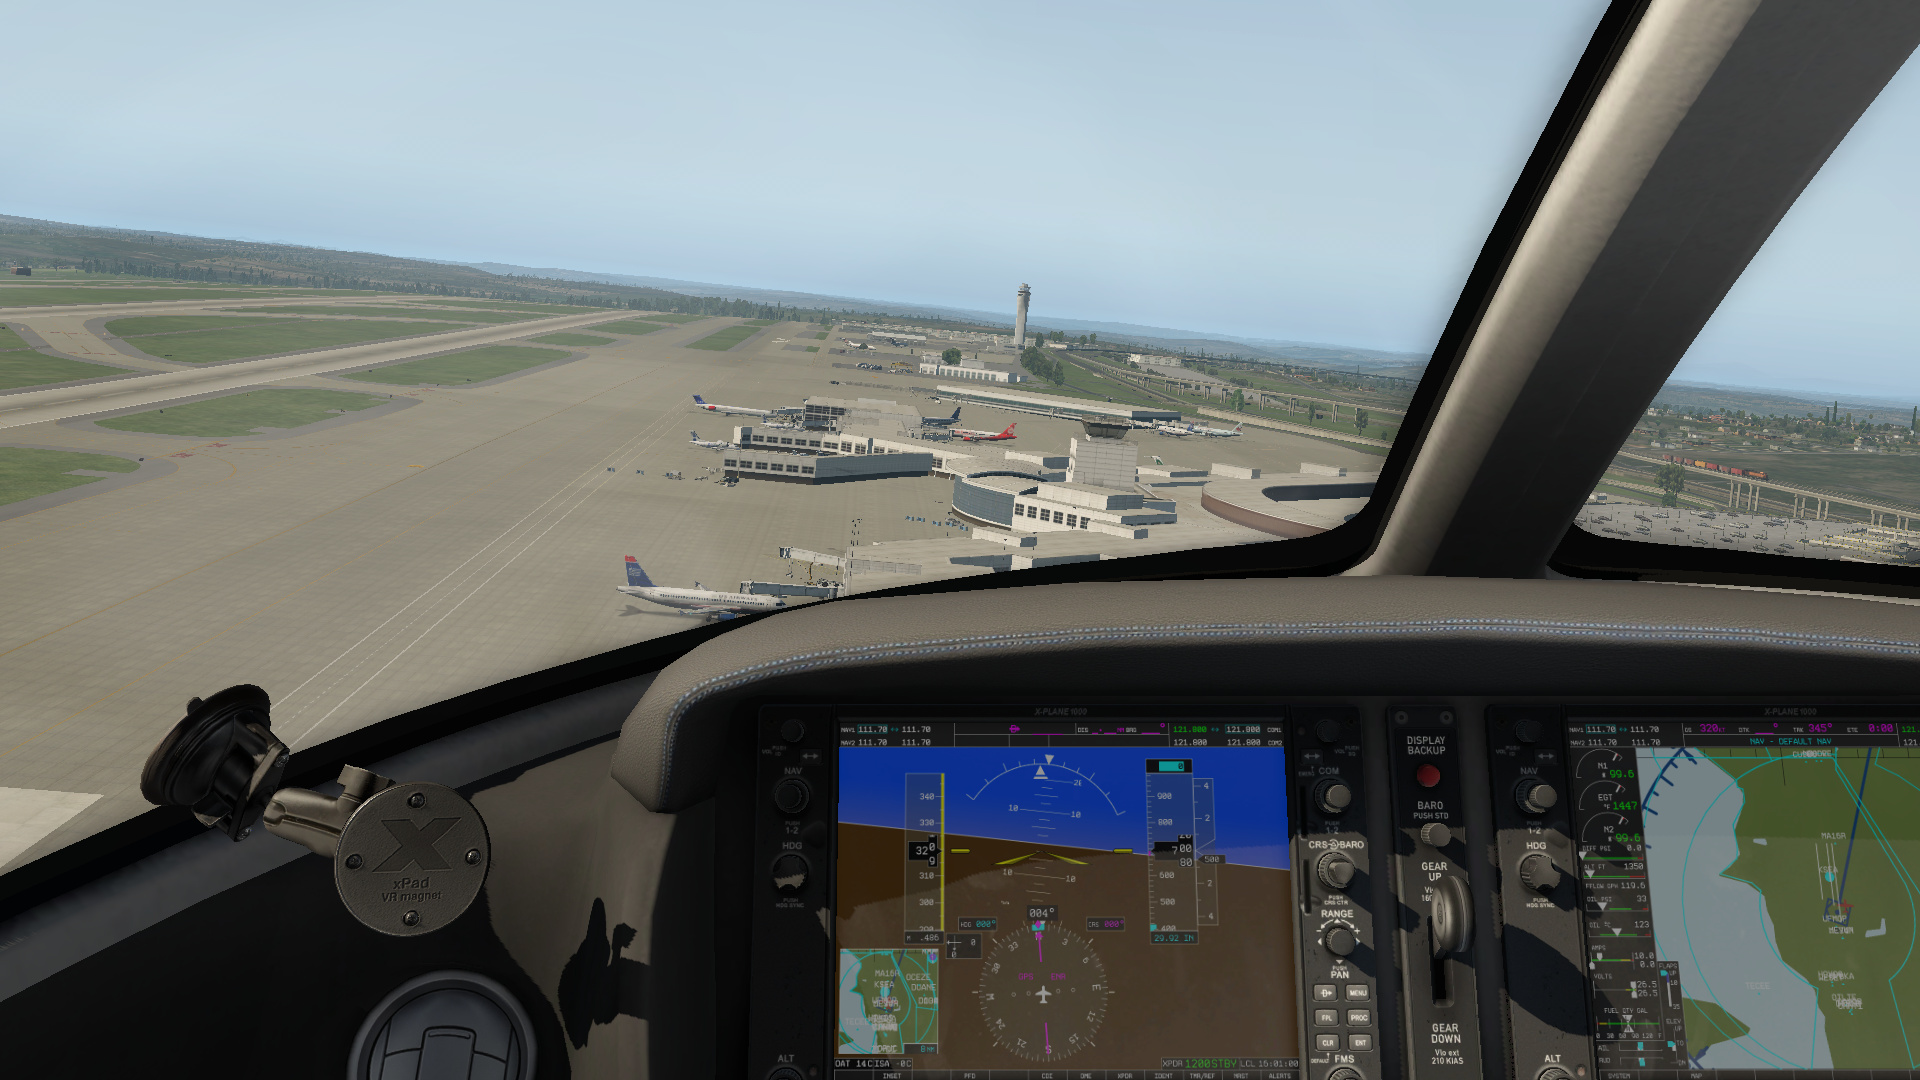
The benchmark isn’t available via the in-game menu, but X-Plane 11 has benchmark functionality that allows us to load a consistent set of tests on each system with the results outputting to a log file. It loads the test in the demo area with default scenery, making it the same for every user. While X-Plane 11 is a full retail game available via Steam or standalone via the developer’s website, there is a free demo which includes the KSEA airport and surrounding area, and this includes the benchmark location so readers can compare their system without having to purchase the game. Do note that the KSEA area is one of the more resource intensive parts of the game, but that the default aircraft are generally lighter on frame rates than third party models.
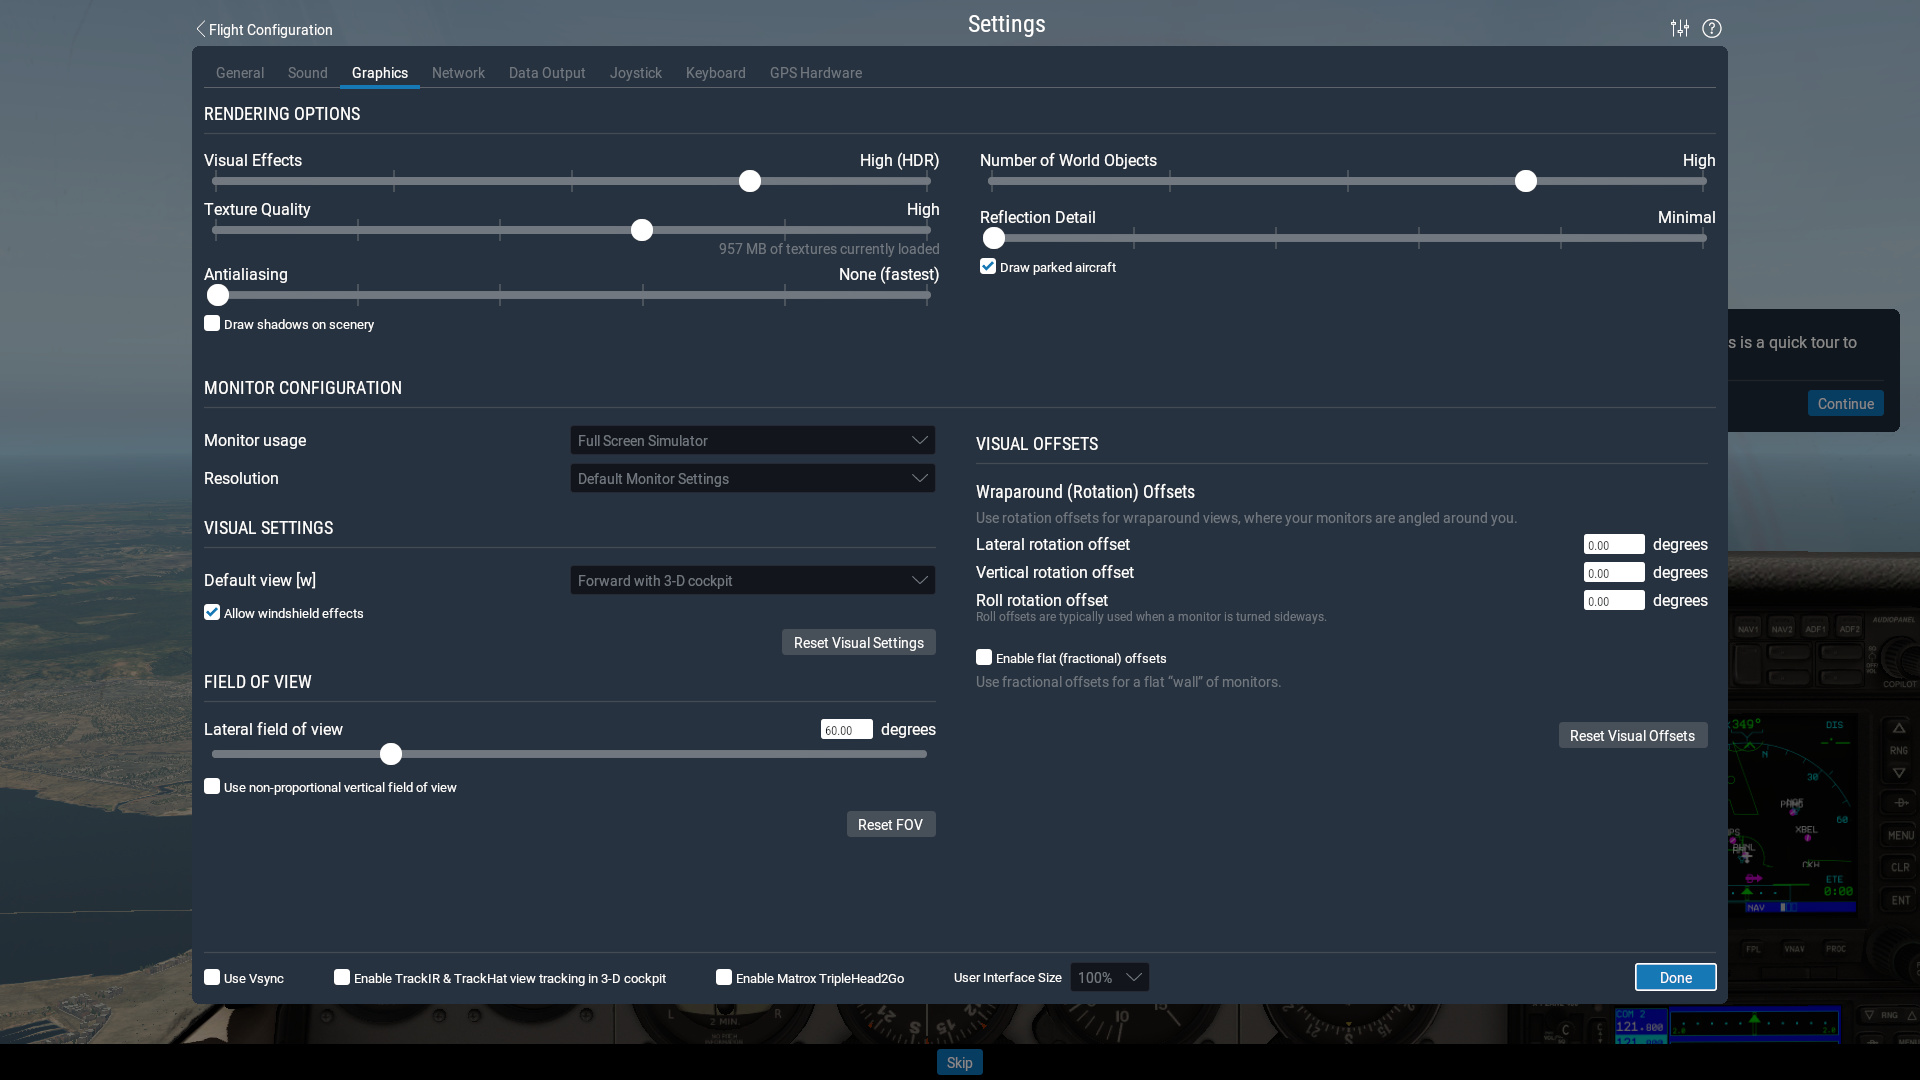
We use X-Plane version 11.11 and classify our tests as follows:
- X Plane 11 high UHD – Resolution: 3840 x 2160, Settings: High (fps_test=3).
- X Plane 11 high 1080p – Resolution: 1920 x 1080, Settings: High (fps_test=3).
- X Plane 11 med 1080p – Resolution: 1920 x 1080, Settings: Med (fps_test=2).
- X Plane 11 low 720p – Resolution: 1280 x 720, Settings: Low (fps_test=1).
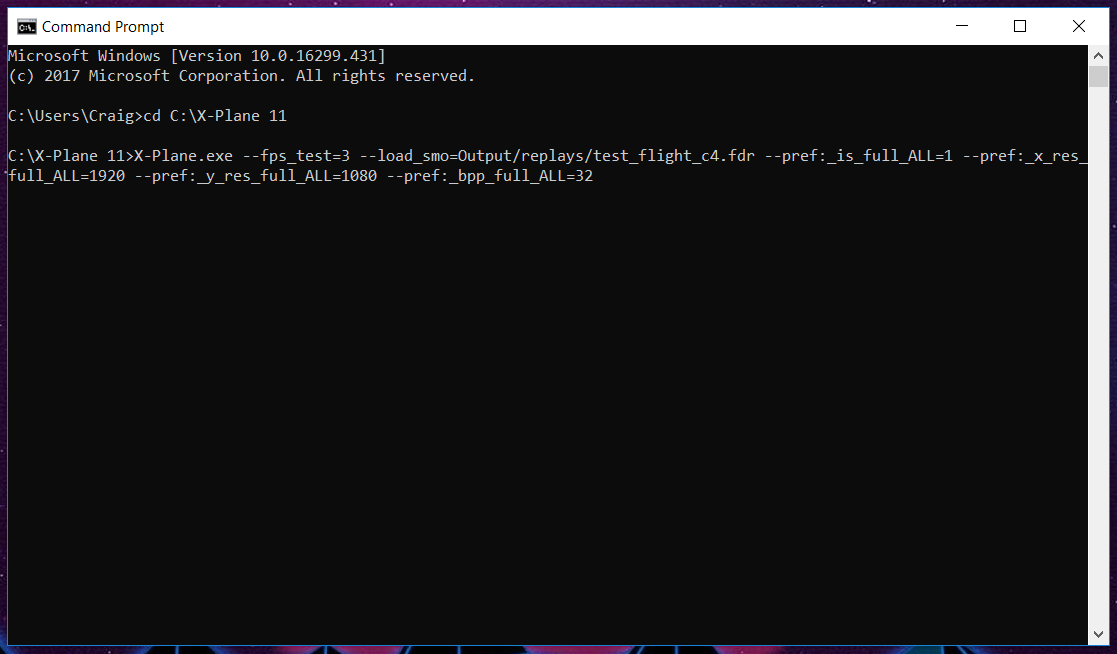
While we will detail the process for windows here, the procedure can be followed by users running Mac OS and Linux by using the Terminal and replacing ‘xplane.exe’ with ‘./X-Plane-i686’ or similar. Benchmarks are run from the command line, and you need to have navigated to the X-Plane 11 install folder before proceeding.
To perform each benchmark, we run the following strings via the command line:
- X-Plane 11 high UHD - X-Plane.exe --fps_test=3 --load_smo=Output/replays/test_flight_c4.fdr --pref:_is_full_ALL=1 --pref:_x_res_full_ALL=3840 --pref:_y_res_full_ALL=2160 --pref:_bpp_full_ALL=32
- X-Plane 11 high 1080p - X-Plane.exe --fps_test=3 --load_smo=Output/replays/test_flight_c4.fdr --pref:_is_full_ALL=1 --pref:_x_res_full_ALL=1920 --pref:_y_res_full_ALL=1080 --pref:_bpp_full_ALL=32
- X-Plane 11 med 1080p - X-Plane.exe --fps_test=2 --load_smo=Output/replays/test_flight_c4.fdr --pref:_is_full_ALL=1 --pref:_x_res_full_ALL=1920 --pref:_y_res_full_ALL=1080 --pref:_bpp_full_ALL=32
- X-Plane 11 low 720p - X-Plane.exe --fps_test=1 --load_smo=Output/replays/test_flight_c4.fdr --pref:_is_full_ALL=1 --pref:_x_res_full_ALL=1280 --pref:_y_res_full_ALL=720 --pref:_bpp_full_ALL=32
‘X-Plane.exe’ starts the software. ‘--fps_test=N’ is used to specify which benchmark you want to run, where N is replaced with the test number (1 = low, 2 = medium, 3 = high). These numbers can be further modified with more digits to control other effects such as weather or day/night, but we ignore these for the benchmark to reduce the number of variables. The astute will notice that we use fps_test=3 in two of the benchmark strings above. This is because we use the high preset for both our highest fidelity 1080p benchmark and for our UHD/4K benchmark.
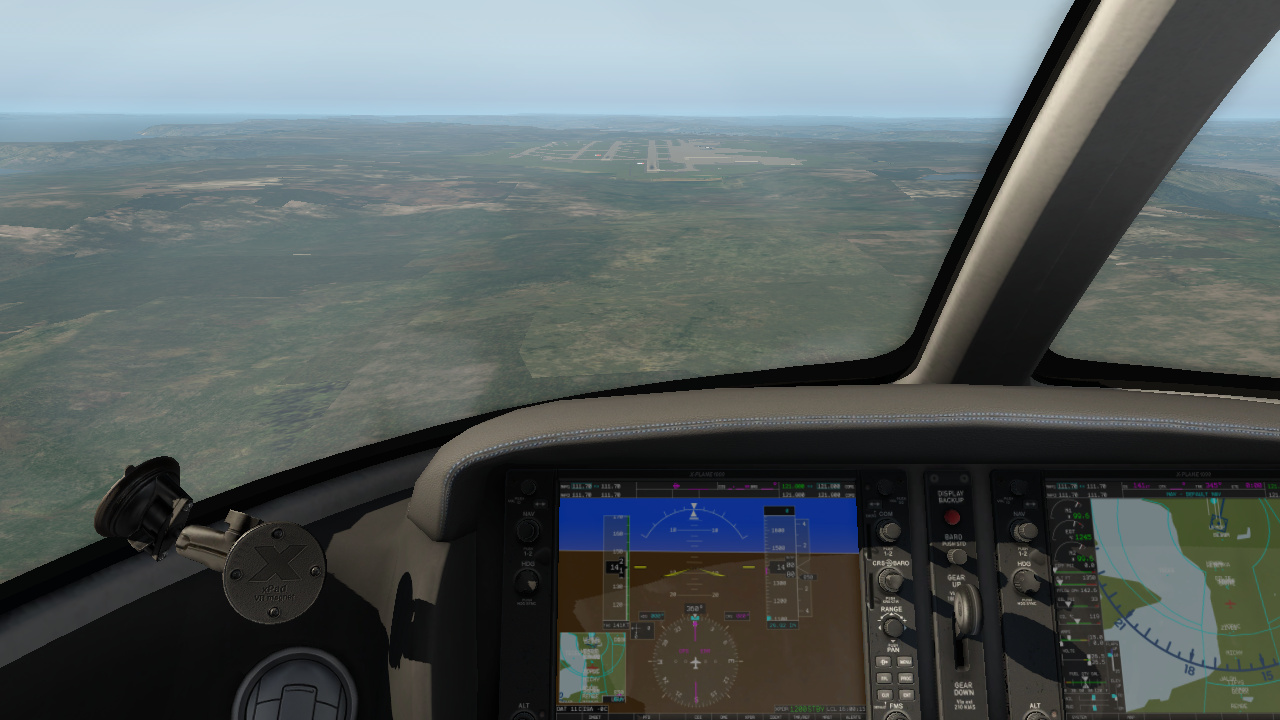
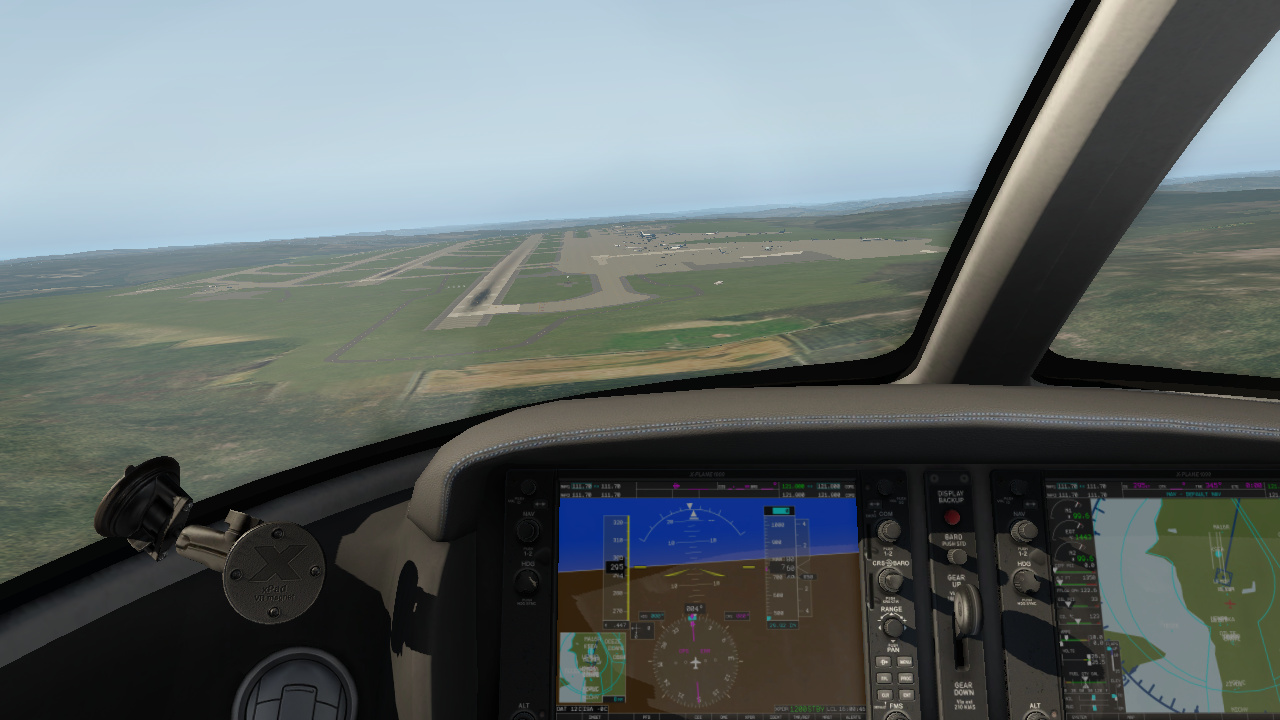
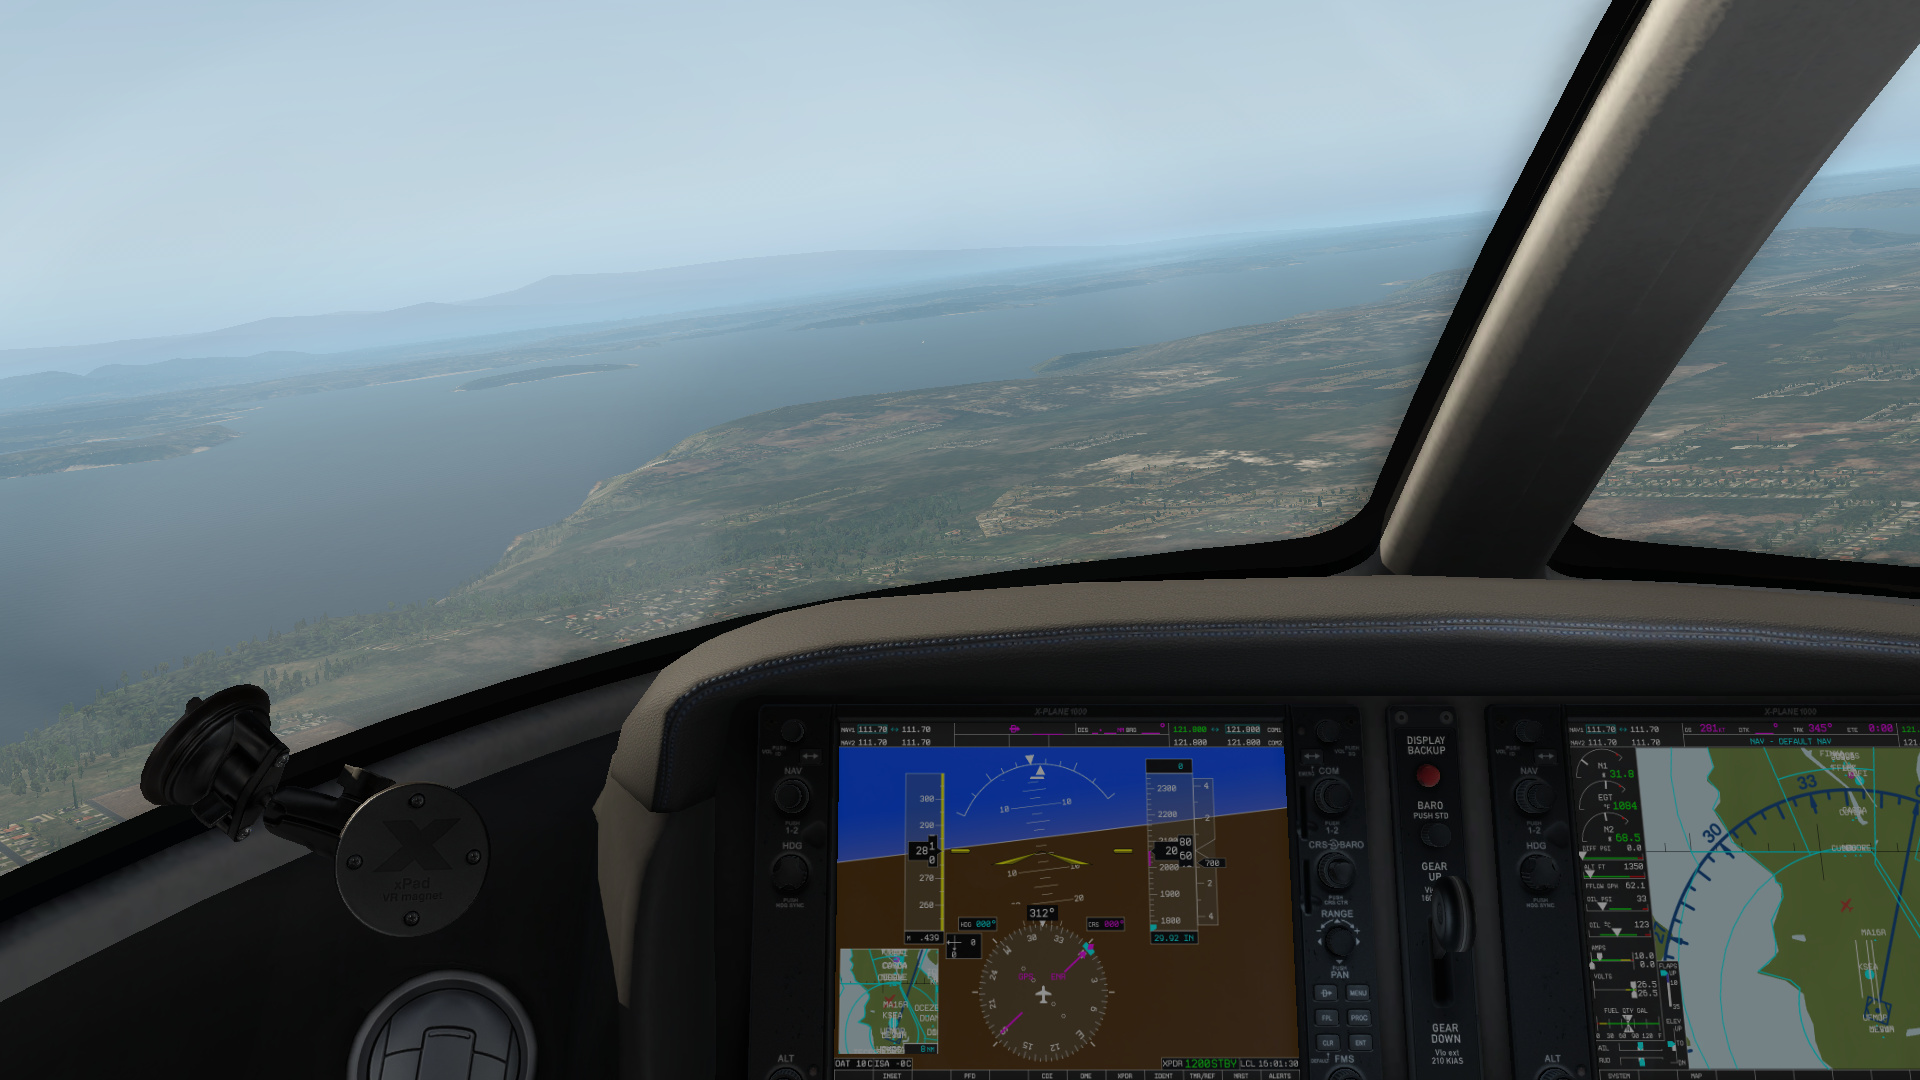
‘--load_smo=PATH’ will take a replay file and perform a 102-second live run to record fps, instead of using the default 90-second benchmark. We do this to obtain a result that is more representative of the in-game performance since the default benchmark simply spends 30 seconds showing the forward view with cockpit panel, 30 seconds of forward view without 3D cockpit panel, and 30 seconds of forward view without cockpit panel while the simulation is paused. The replay file is a default one that comes with the game and shows the CirrusJet cockpit panel as it flies over KSEA airport while systems are in use.
The pref setting allows us to specify a set of preferences which we use to ensure the benchmark resolution is fixed regardless of the screen resolution of the test device. ‘--pref:_is_full_ALL=1’ specifies that we want the benchmark to be run at full screen to help protect against differences in how drivers handle windowed or full-screen software. Laminar Research says that due to the way X-Plane handles resolutions this setting won’t cause any difference in result, but we use it anyway for consistency. ‘--pref:_x_res_full_ALL=HORIZONTAL --pref:_y_res_full_ALL=VERTICAL’ provides a fixed resolution where horizontal and vertical are replaced with pixel numbers. If you look closely at the strings written above you will see that we use 3840 x 2160 (UHD/4K), 1920 x 1080 (FullHD), and 1280 x 720 (HD) to be consistent with the resolutions we use for our other game benchmarks. ‘--pref:_bpp_full_ALL=32’ forces a resolution change even if it doesn’t match one supported by the driver based on the resolution of any connected displays. It won't show a resolution higher than the monitor can show and an external 3840 x 2160 UHD/4K display was used for benchmarking.
Results can be found on the ‘fps=’ line in the log.txt file created in the X-Plane 11 directory.


Results
X-Plane 10 had a reputation of bogging down powerful systems with top-of-the-line processors and graphics cards, especially once the user had loaded their favorite third-party aircraft, weather plugins, and scenery mods. But the stock game itself scaled reasonably well to low-performance hardware, and this shows true in X-Plane 11 as well.
If we take the entry-level Maxwell-based Nvidia GT 940MX — which was most frequently used on ultrabook models with dedicated GPUs and on more bulky consumer notebooks which wanted to be able to claim “Dedicated Nvidia graphics!” or “Play games with incredible detail!” — then we see that it hit 56 fps on 720p low, or 36 fps on 1080p medium. Of course the downside is that those low settings don’t look very good, and the medium option can have some more substantial frame rate drops near airports or cities, but if you can’t afford to upgrade (or don’t want to) then you can still get your flight sim fix… even if it is the ‘Zero Sugar’ version.
Stepping up to the replacement for the GT 940MX, the newer Pascal-based Nvidia MX150, we find that the base game without addons is playable at 1080p high with 47 fps average. When looking at the results graph, please keep in mind that at the time of writing we have only tested X Plane 11 with two MX150 devices, one running the original full-fat 25-watt version, and the other with the reduced 10-watt TDP variant (approx. 36% slower clock speed) so that 47 fps average is split between two results of 41.8 fps and 52.3 fps.
Our benchmarks show that those wanting to view their high-resolution cockpit panels at 4K/UHD can do so with an Nvidia GTX 1050 Ti (notebook) or AMD RX 470 (desktop). But the reality is that these cards will struggle with the higher-polygon count in third-party aircraft, and the benefits of a more expensive GPU will become apparent. In our experience getting good quality third-party aircraft with fully functional flight and navigation systems and bulking up the game with paid or free scenery/airports is one of the most rewarding and addicting aspects of a simulation game such as this.
With 75 fps on '1080p high,' the Nvidia GTX 1070 appears to be a good sweet-spot compromise between price and performance. The GTX 1080 only gained one additional frame per second when using the same processor, likely due to the games tendency to suffer CPU bottlenecks.

| X-Plane 11.11 | |
| 3840x2160 high (fps_test=3) 1920x1080 high (fps_test=3) 1920x1080 med (fps_test=2) 1280x720 low (fps_test=1) | |
| NVIDIA GeForce GTX 1080 Ti (Desktop), i7-7740X | |
| NVIDIA GeForce GTX 1080 (Desktop), 4790K | |
| NVIDIA GeForce GTX 1070 (Desktop), 4790K | |
| AMD Radeon RX 480 (Desktop), 4790K | |
| AMD Radeon RX 470 (Desktop), 4790K | |
| NVIDIA GeForce GTX 1050 Ti Mobile, i7-7700HQ | |
| AMD Radeon RX 460 (Desktop), 4790K | |
| NVIDIA GeForce 940MX, 6700HQ | |
| NVIDIA GeForce 920M, 2970M | |
CPU Scaling
To test if X-Plane 11 still exhibited the heavy reliance on CPU power that its predecessor showed we performed some benchmarks using four different processors paired with the Nvidia GTX 1080 Ti. For AMD these were the budget-range Ryzen 3 1200 (4C/4T), and their previous consumer flagship, the Ryzen 7 1800X (8C/16T). In the Intel camp, we have the i7-7740X (4C/8T) and the i7-4790K (4C/8T), the latter of which was arguably the most highly recommended CPU in PCs built for X-Plane 10 due to a mixture of favorable single core performance and a release year that fitted well within the games lifespan.
The Ryzen 3 1200 showing the lowest fps isn’t surprising given that it has the slowest clock speeds and the fewest threads. What is interesting is how the Ryzen 7 1800X gets beaten by the Kaby Lake i7-7740X and the much older (2014) Haswell i7-4790K. This is because the rendering process is all loaded on a single core (OpenGL shows threading and object handling problems here), and these two Intel CPUs both have high clock speeds on architectures with good IPC levels. There isn't much separating the clock speeds of the two Intel chips, so we are attributing most of the difference in frame rates to the generational IPC improvements made over time.
Laminar research says that X-Plane is multithreaded and they split out what they can onto additional threads to try and free up processing time for the main thread. We tested this using the Ryzen 7 1800X by limiting cores. We saw increasing performance for each additional core up to six active cores, but there was no additional gain for activating the seventh and eighth cores. This improved FPS was showing that extra cores allowed tasks not associated with the primary rendering thread to be offloaded. X-Plane 11 is currently being ported from OpenGL to Vulkan, which has several features that allow for significantly improved multithread performance. Frame rates on processors such as the 1800X will likely increase after this happens.
| X-Plane 11.11 | |
| 3840x2160 high (fps_test=3) 1920x1080 high (fps_test=3) 1920x1080 med (fps_test=2) 1280x720 low (fps_test=1) | |
| NVIDIA GeForce GTX 1080 Ti (Desktop), | |
| NVIDIA GeForce GTX 1080 Ti (Desktop), | |
| NVIDIA GeForce GTX 1080 Ti (Desktop), | |
| NVIDIA GeForce GTX 1080 Ti (Desktop), | |
Summary
X-Plane 11 is a powerful flight simulator which can push high-end computers to their limits, and this makes it well suited to benchmarking. It nicely complements our standard test suite of games since it runs in Windows on OpenGL, rather than the more common DirectX. The reliance on strong single-core CPU performance also makes it stand out from many other games and helps to highlight the importance of a balanced system when running simulators.
Performance scales well when resolution, graphical quality, and objects are dialed down, showing that those without a top-end PC can still get some enjoyment out of exploring the digital world. If you are building a PC to play X-Plane 11, the advice from previous iterations of picking a CPU based on single core performance still holds strong. This means that Intel’s i5 and i7 models stand out above the competition (e.g., i5-8600K and i7-8700K), although an overclocked Ryzen CPU should still hold up well here. Meanwhile, the port to Vulkan later this year will likely reduce the reliance on using a single thread for rendering and improve frame rates on multi-core processors. This would make AMD's Ryzen or Intel's enthusiast CPUs based on the X-series chipset more appealing.
Appendix I. Graphics Cards
Test systems
| Gerät | Grafikkarte | Prozessor | Arbeitsspeicher | Betriebssystem |
|---|---|---|---|---|
| Desktop-PC I | MSI GeForce GTX 1080 (8 GB GDDR5X) MSI GeForce GTX 1070 (8 GB GDDR5) Nvidia GeForce GTX 1060 (6 GB GDDR5) Nvidia GeForce GTX 980 (4 GB GDDR5) |
Intel Core i7-6700K | 2 x 8 GB DDR4 | Windows 10 64 Bit |
| Desktop-PC II | Nvidia GeForce GTX 1080 Ti (11 GB GDDR5X) Asus GeForce GTX 980 Ti (6 GB GDDR5) XFX Radeon R9 Fury (4 GB HBM) Sapphire Radeon R9 290X (4 GB GDDR5) Sapphire Radeon R9 280X (3 GB GDDR5) MSI Radeon R7 370 (2 GB GDDR5) |
Intel Core i7-4790K | 2 x 4 GB DDR3 | Windows 10 64 Bit |
| Alienware 17 R4 | Nvidia GeForce GTX 1080 (8 GB GDDR5X) | Intel Core i7-7820HK | 1 x 16 GB DDR4 | Windows 10 64 Bit |
| Asus G752VS | Nvidia GeForce GTX 1070 (8 GB GDDR5) | Intel Core i7-6820HK | 2 x 16 GB DDR4 | Windows 10 64 Bit |
| MSI GT62VR | Nvidia GeForce GTX 1060 (6 GB GDDR5) | Intel Core i7-6820HK | 2 x 8 GB DDR4 | Windows 10 64 Bit |
| MSI GE72 | Nvidia GeForce GTX 1050 Ti (4 GB GDDR5) | Intel Core i7-7700HQ | 2 x 4 GB DDR4 | Windows 10 64 Bit |
| Asus GL753VD | Nvidia GeForce GTX 1050 (4 GB GDDR5) | Intel Core i7-7700HQ | 1 x 8 GB DDR4 | Windows 10 64 Bit |
| MSI GL62 | Nvidia GeForce GTX 1050 (2 GB GDDR5) | Intel Core i7-7700HQ | 2 x 4 GB DDR4 | Windows 10 64 Bit |
| Asus G752VY | Nvidia GeForce GTX 980M (4 GB GDDR5) | Intel Core i7-6700HQ | 2 x 16 GB DDR4 | Windows 10 64 Bit |
| MSI GS60 | Nvidia GeForce GTX 970M (3 GB GDDR5) | Intel Core i7-6700HQ | 2 x 4 GB DDR4 | Windows 10 64 Bit |
| MSI GE72 | Nvidia GeForce GTX 965M (2 GB GDDR5) | Intel Core i7-6700HQ | 1 x 8 GB DDR4 | Windows 10 64 Bit |
| MSI GL72 | Nvidia GeForce GTX 960M (2 GB GDDR5) | Intel Core i7-7700HQ | 1 x 8 GB DDR4 | Windows 10 64 Bit |
| MSI PE60 | Nvidia GeForce GTX 950M (2 GB GDDR5) | Intel Core i7-6700HQ | 2 x 4 GB DDR4 | Windows 10 64 Bit |
| MSI PL62 | Nvidia GeForce MX150 (2 GB GDDR5) | Intel Core i7-7700HQ | 1 x 8 GB DDR4 | Windows 10 64 Bit |
| MSI CX72 | Nvidia GeForce 940MX (2 GB DDR3) | Intel Core i7-6700HQ | 2 x 8 GB DDR4 | Windows 10 64 Bit |
| MSI GP62 | Nvidia GeForce 940M (2 GB DDR3) | Intel Core i7-5700HQ | 1 x 8 GB DDR3 | Windows 10 64 Bit |
| MSI CX61 | Nvidia GeForce 920M (2 GB DDR3) | Intel Celeron 2970M | 1 x 8 GB DDR3 | Windows 10 64 Bit |
| Asus N551ZU | AMD Radeon R9 M280X (4 GB GDDR5) | AMD FX-7600P | 2 x 4 GB DDR3 | Windows 10 64 Bit |
| 4K Monitor | Nvidia Treiber | AMD Treiber | Intel Treiber |
|---|---|---|---|
| 2 x Asus PB287Q, Philips 328P6VJEB | ForceWare | Crimson |
