


HP Pro Mini 400 G9 Mini-PC review: Compact workstation impresses with good efficiency thanks to Intel Core i5-14500T
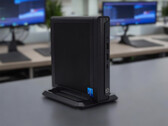
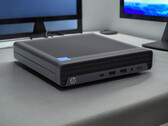
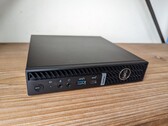
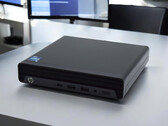
HP has the Pro Mini 400 G9 series in its portfolio as a small workstation that can handle a wide range of tasks. The modular design enables many different basic configurations. In this test, we look at the HP Pro Mini 400 G9 based on the Intel Core i5-14500T, evaluate its everyday performance, and take a closer look at its efficiency.
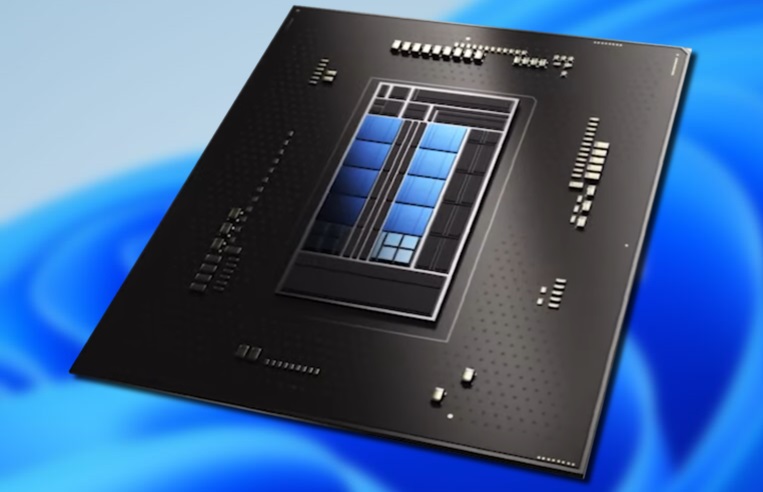
Intel Core i5-14500T, UHD Graphics 770, 1.2 kg