


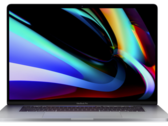
Apple MacBook Pro 16 2019 Laptop Review: A convincing Core i9-9880H and Radeon Pro 5500M powered multimedia laptop
A thicker case, proven keyboard design and better cooling: That is the latest MacBook Pro in a nutshell. It seems that Apple has finally listened to its users and the press by optimising its largest high-end laptop for professionals. We put the flagship model through its paces in this detailed review.
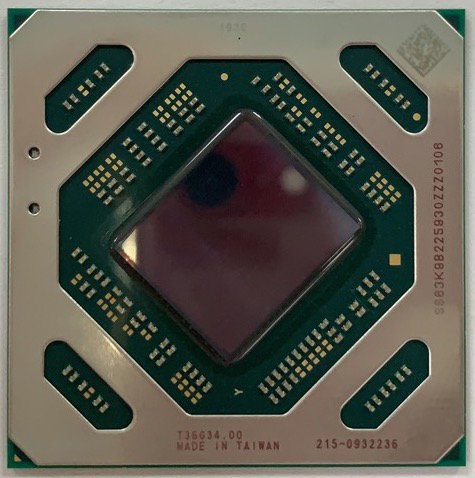
Intel Core i9-9880H, AMD Radeon Pro 5500M, 16", 2 kg