Apple MacBook Pro 15 2018 (2.6 GHz, 560X) Laptop Review
Apple did not just update the smaller MacBook Pro 13 2018 (here in review), but the 15-inch sibling received new components as well. The highlight is obviously the new processor with 6 cores, so the performance should be much significantly better in multi-core applications. Besides two Core i7 CPU, you can also select a Core i9 processor for the first time. However, the big question is whether the cooling solution of the MacBook Pro 15 can handle the new CPUs.
The step from LPDDR3 towards DDR4-RAM (2400 MHz) is another important step and the MacBook Pro now finally supports up to 32 GB memory. The PCIe-SSD has a maximum capacity of up to 4 TB, but there is not much to tell about the GPUs. The two AMD Radeon Pro GPUs are based on their predecessors Radeon Pro 555 and Radeon Pro 560, respectively. The clocks are a bit higher and the smaller Radeon Pro 555X is now equipped with twice the VRAM (4 GB). The TrueTone feature of the display is also new and familiar from other Apple products.
We review the more expensive SKU of the two pre-configured models for 3299 Euros. This will buy you a Core i7-8850H, 16 GB RAM, the Radeon Pro 560X, and 512 GB SSD storage. Apple charges a hefty premium for options, especially the memory and storage. If you select all the possible upgrades, you will have to pay 7959 Euros. Even mobile workstations with better components and service options are usually less expensive. We purchased our test model directly from Apple; it is not a press sample from the manufacturer.
| MacBook Pro 15 Mid 2018 | MacBook Pro 15 Mid 2018 | |
| Processor | Core i7 2.2 GHz (Coffee Lake, 45 W) Core i9 2.9 GHz (Coffee Lake, 45 W) |
Core i7 2.6 GHz (Coffee Lake, 45 W) Core i9 2.9 GHz (Coffee Lake, 45 W) |
| Graphics card | AMD Radeon Pro 555X AMD Radeon Pro 560X |
AMD Radeon Pro 560X |
| RAM | 16 GB DDR4-2400 32 GB DDR4-2400 |
16 GB DDR4-2400 32 GB DDR4-2400 |
| SSD | 256 GB / 512 GB / 1 TB / 2 TB / 4 TB | 1 TB / 2 TB / 4 TB |
| Display | 15.4" IPS 2880 x 1800 pixels | 15.4" IPS 2880 x 1800 pixels |
| Ports | 4x Thunderbolt 3 with USB-C connector 3.5 mm headset |
4x Thunderbolt 3 with USB-C connector 3.5 mm headset |
| Price | starting at 2799 Euros | starting at 3299 Euros |
We will obviously compare the new MacBook Pro 15 with its predecessor from 2017, but there are also Windows alternatives if macOS is not required. The biggest competitor is obviously the Dell XPS 15 9570. We have already reviewed the entry-level model with the Core i5 and the 1080p screen, but we are currently reviewing the better equipped model with the Core i7-8750H, 4K display and the GeForce GTX 1050 Ti Max-Q. Razer's Blade 15 is another contender and has some visual similarities with the MacBook. If you prefer high and steady CPU performance, you might also want to check out some gaming laptops like the Gigabyte Aero 15X v8. The Asus ZenBook Pro 15 UX580 with its dual-screen is another contender.
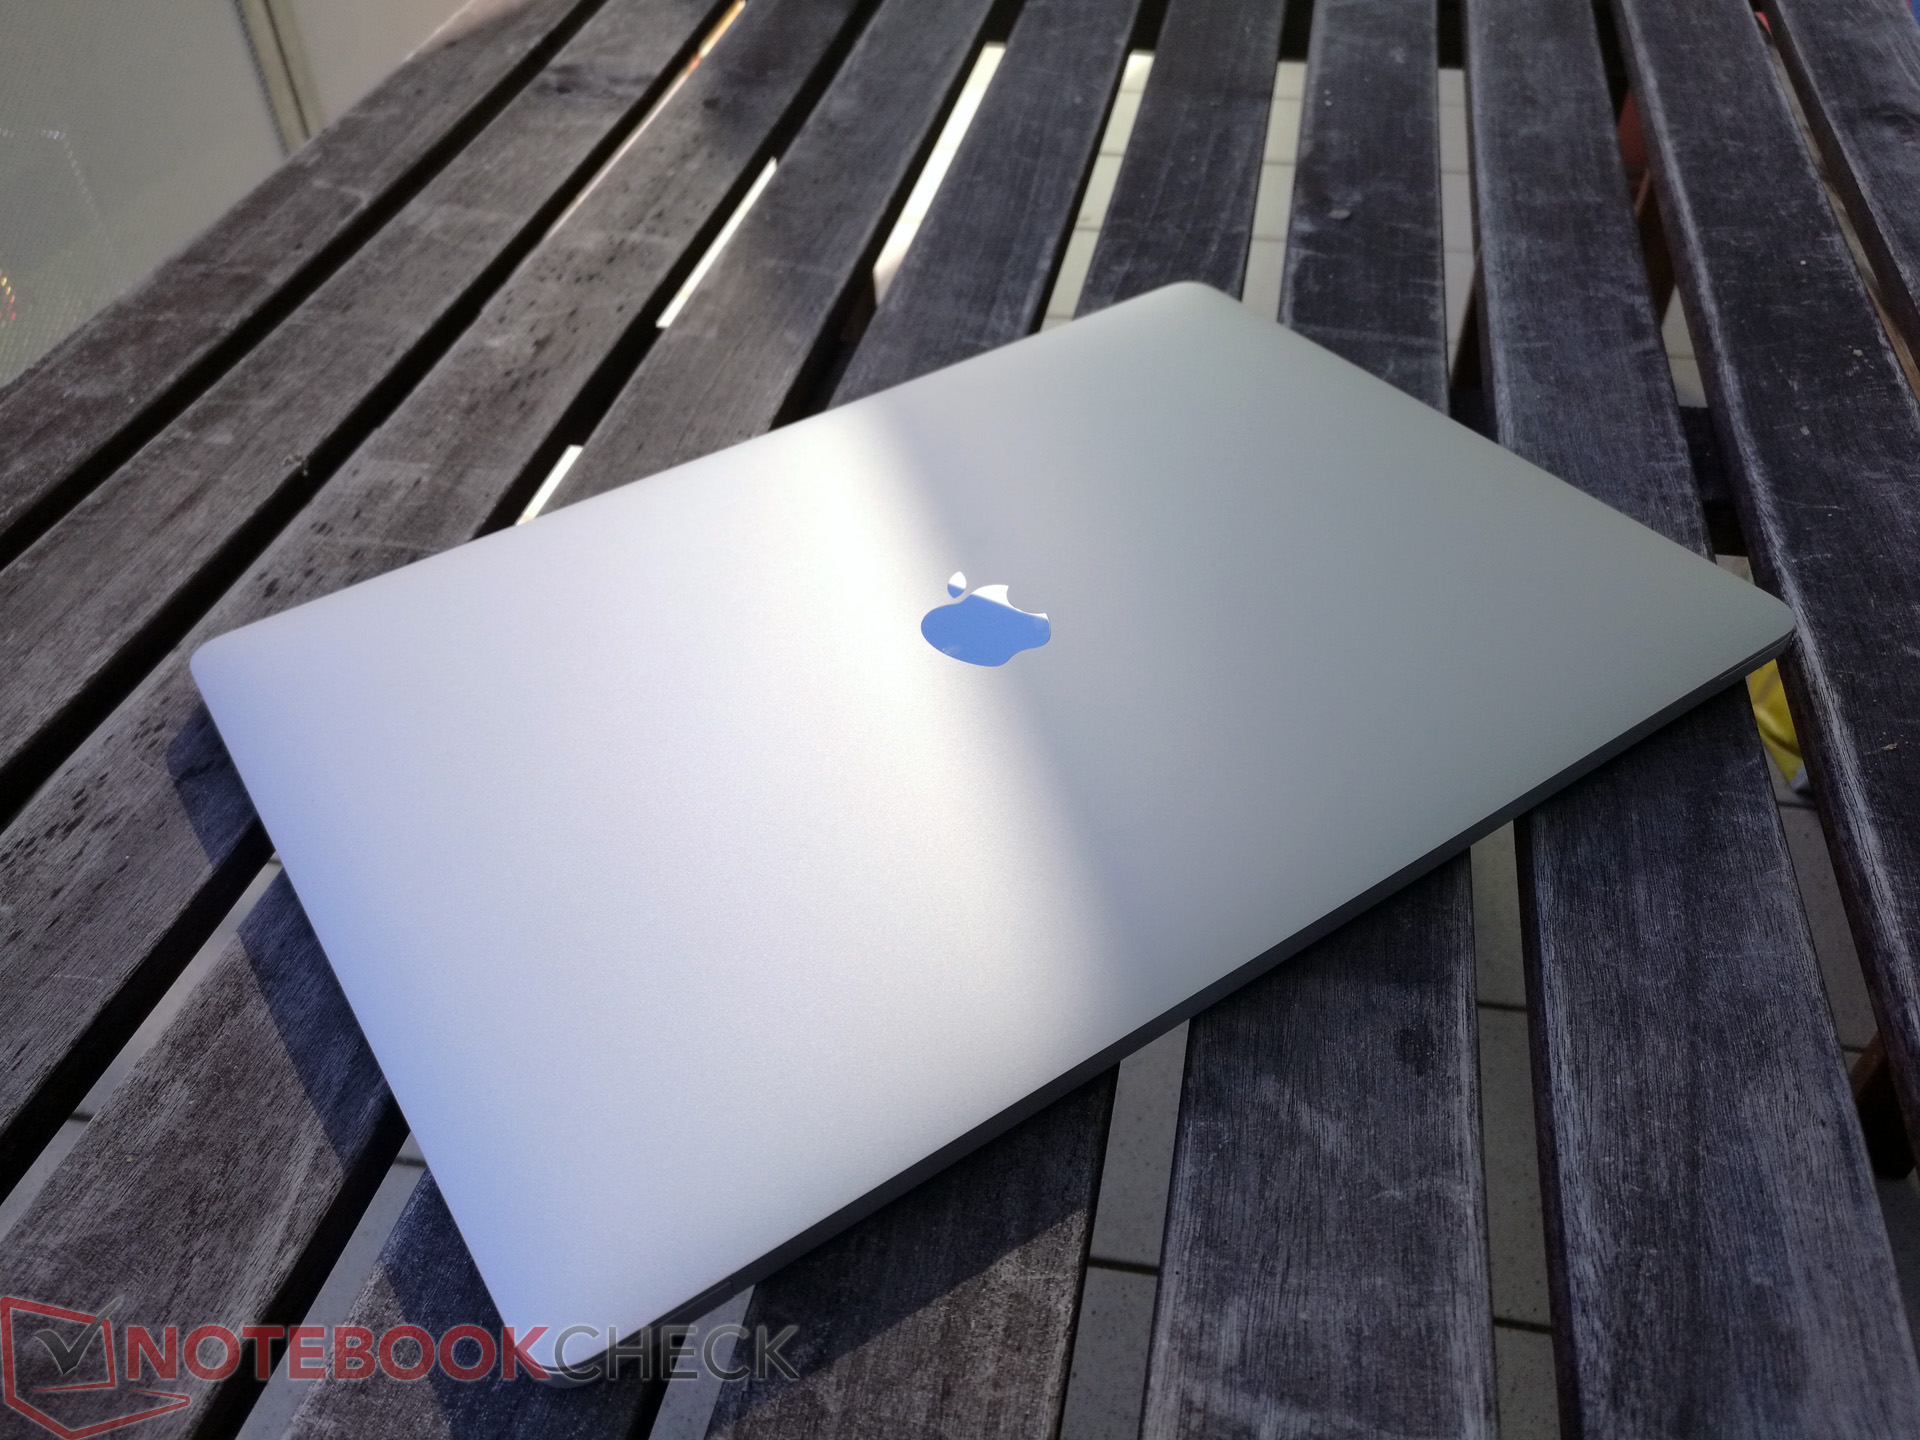
Case
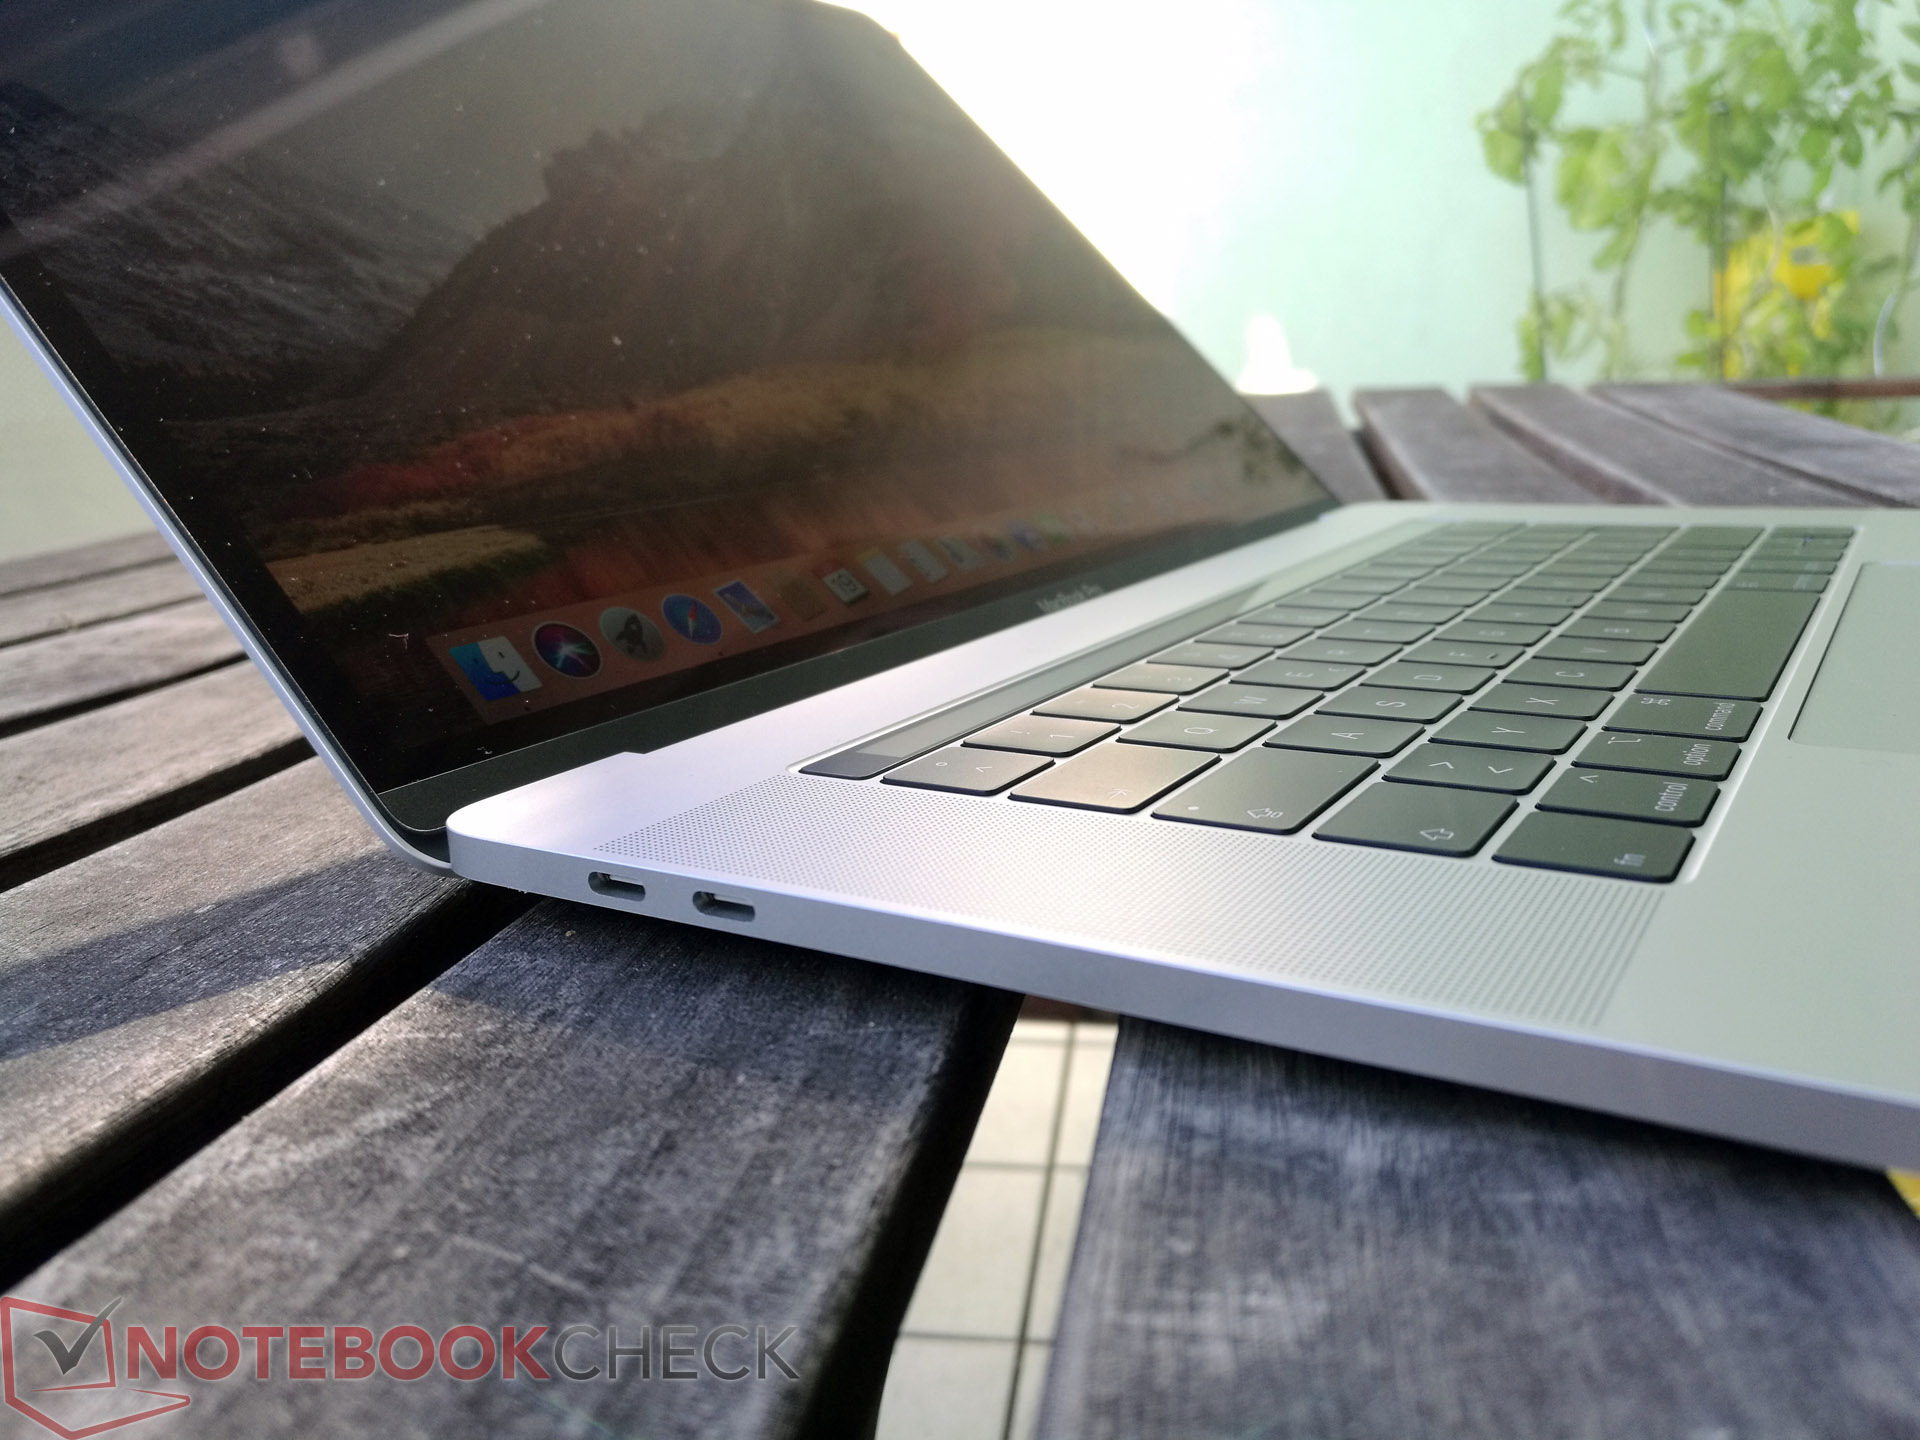
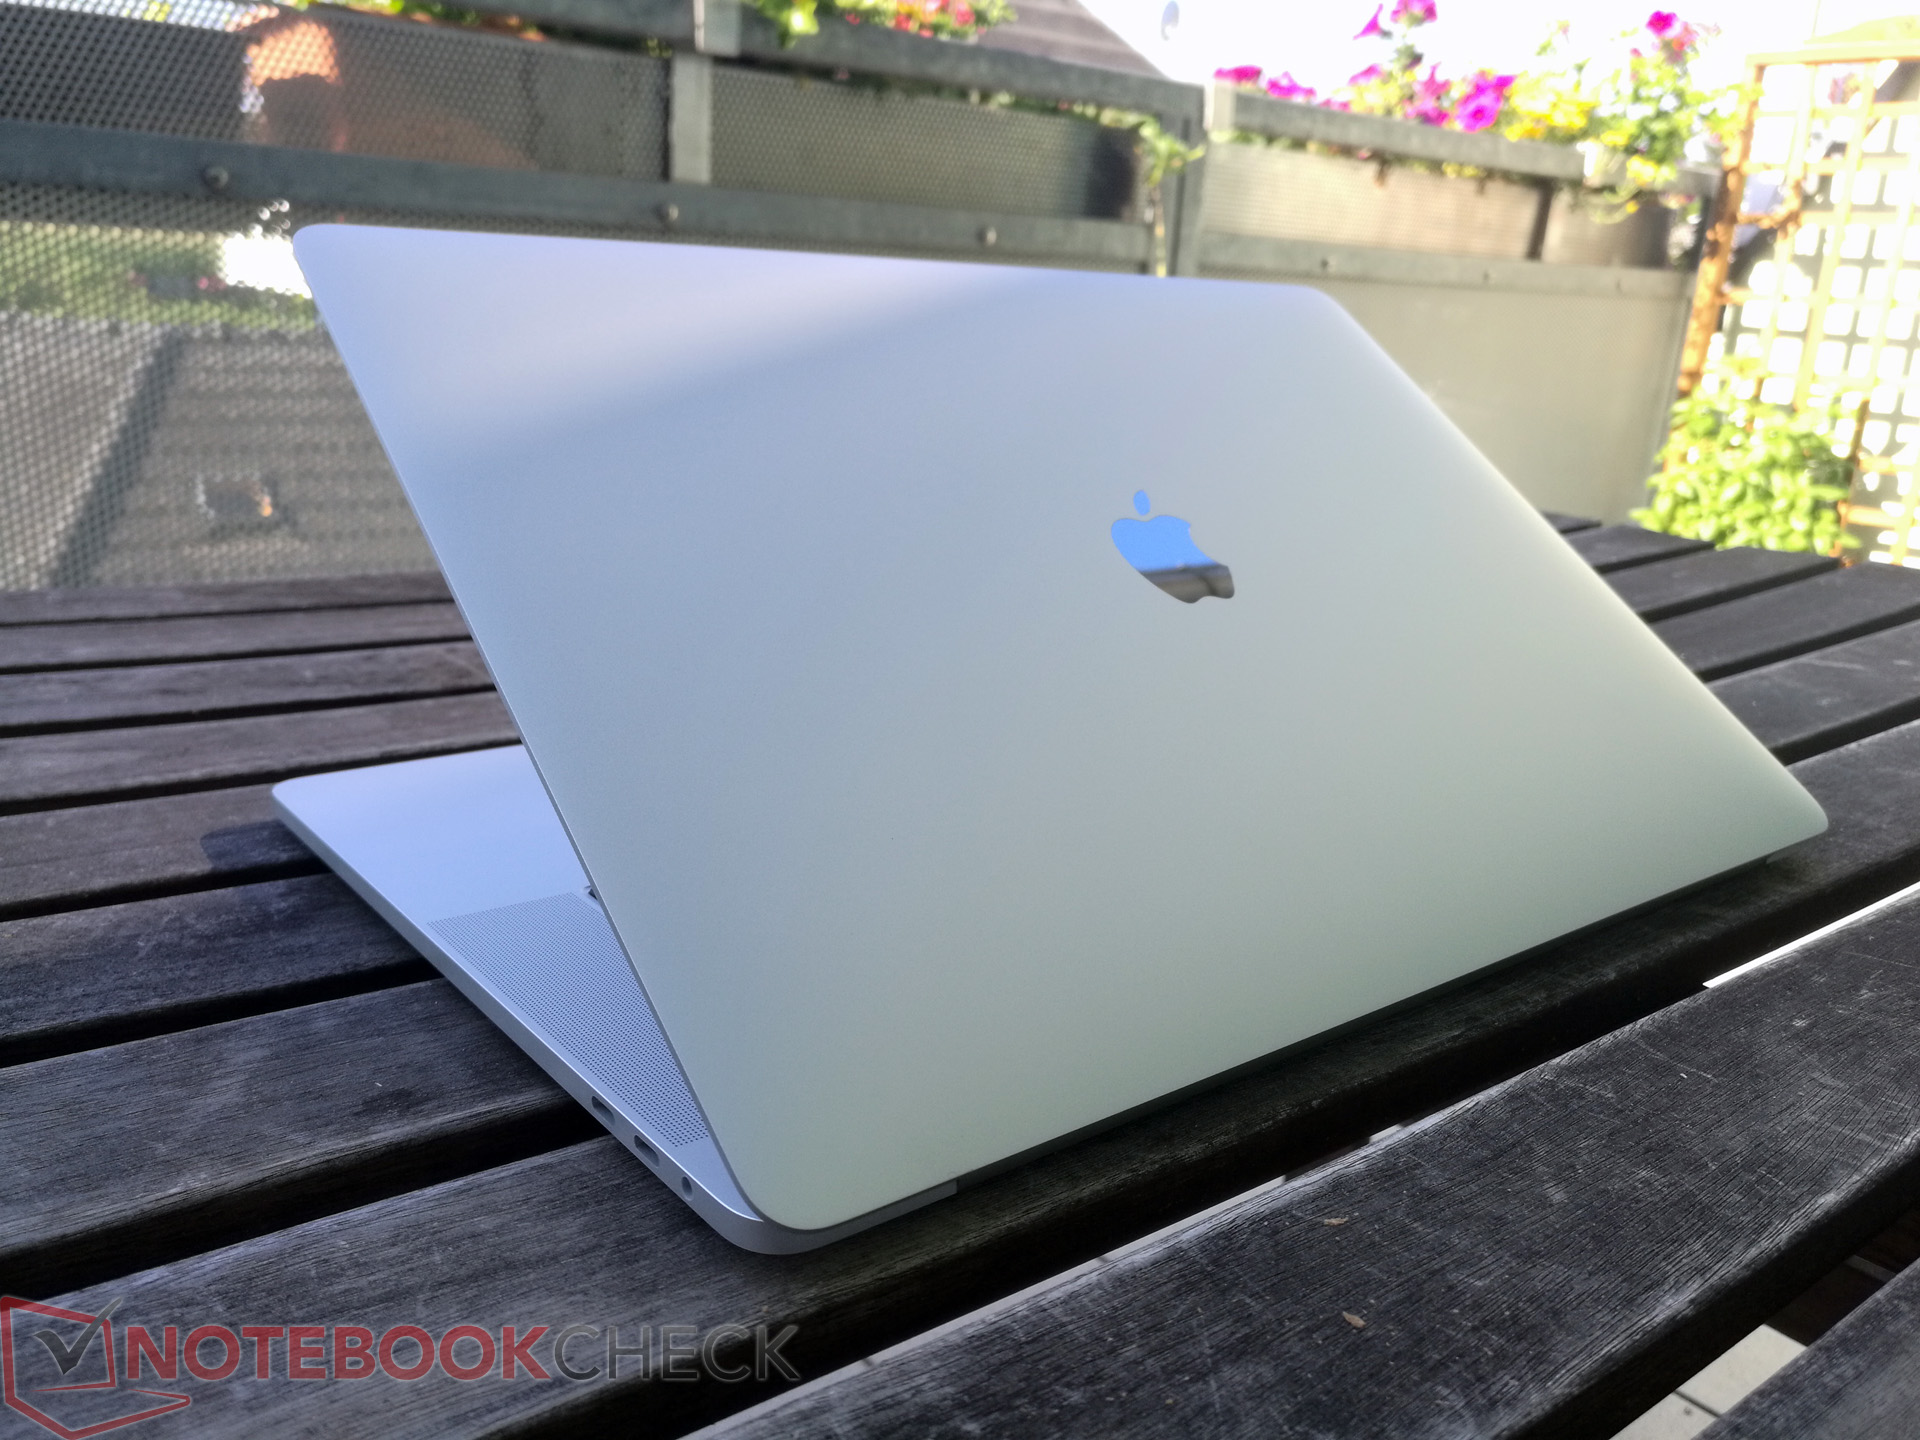
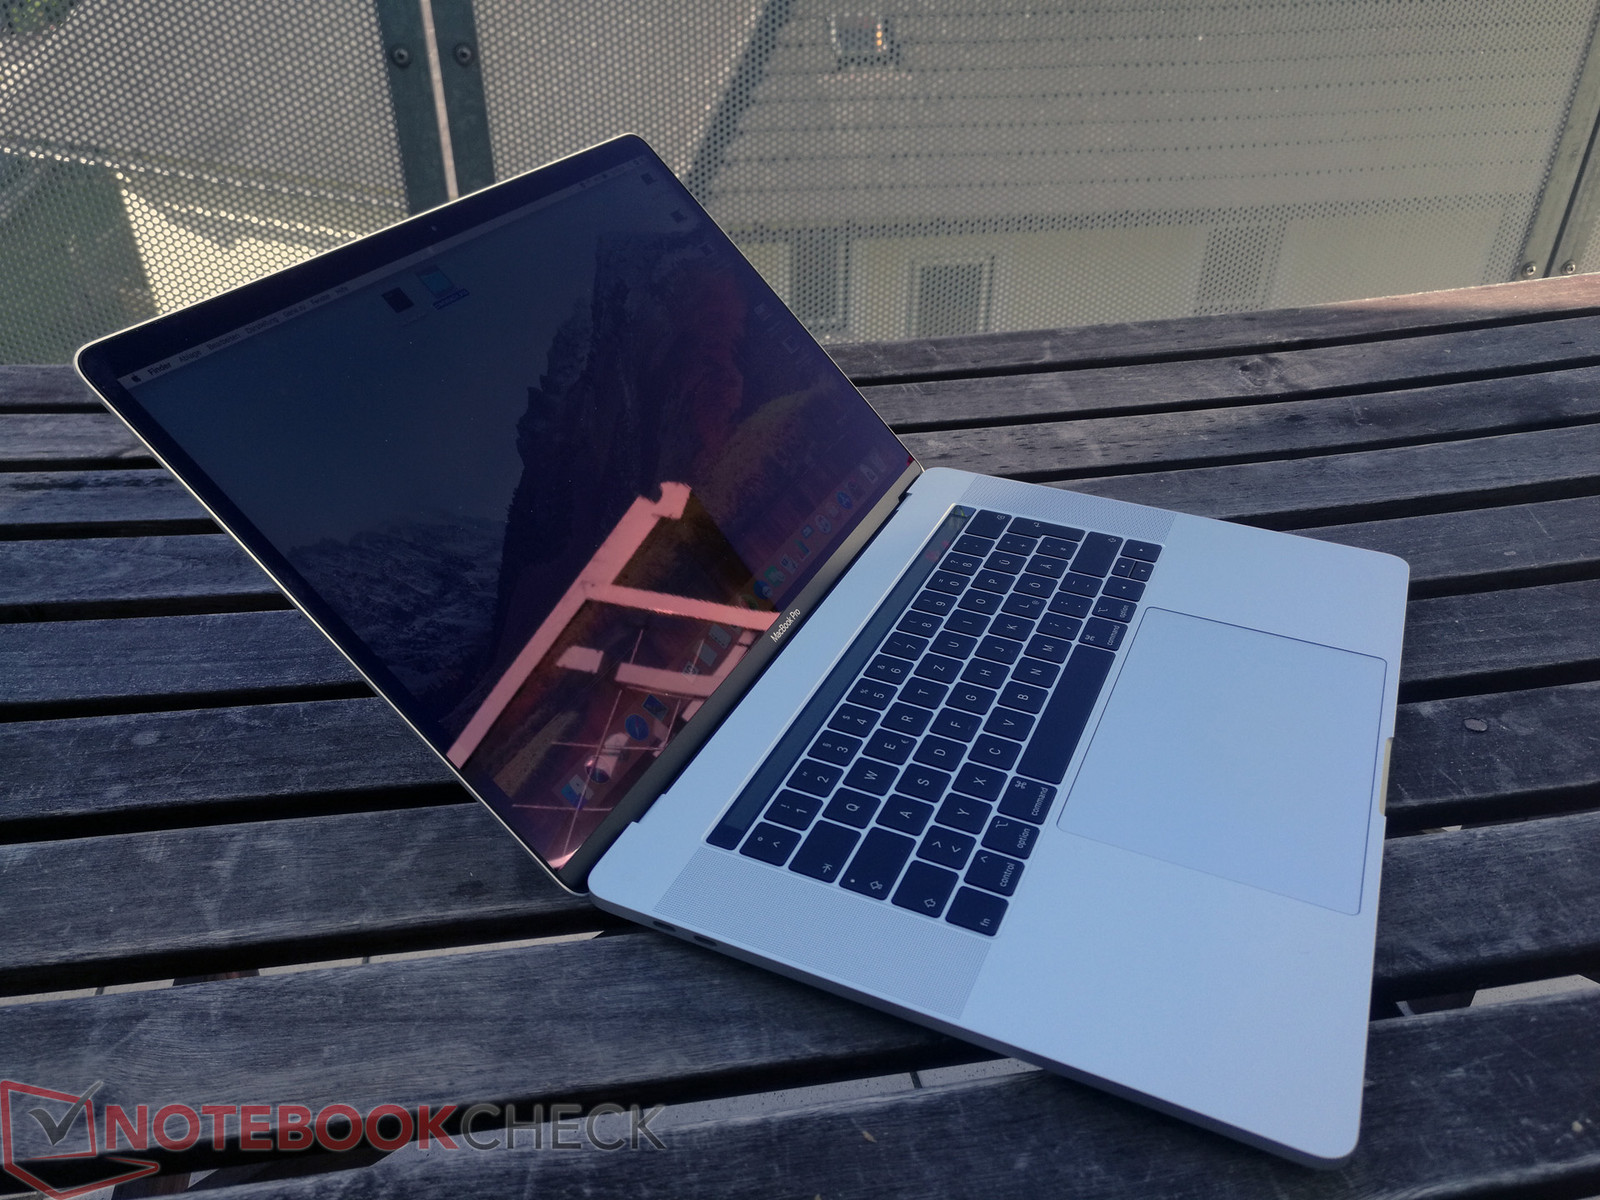
The design of the new MacBook Pro 15 did not change compared to the predecessor un or 2016 model. It seems the manufacturer slightly reworked something, because the battery is a bit bigger and heavier, so some material had to be removed elsewhere. We do not notice a stability difference though. The quality of the MacBook Pro 15, which is available in Silver and Space Gray, is still among the best you can get. It is extremely sturdy and the surfaces still look excellent after longer usage periods. We recommend our review of the predecessor for more details and pictures.
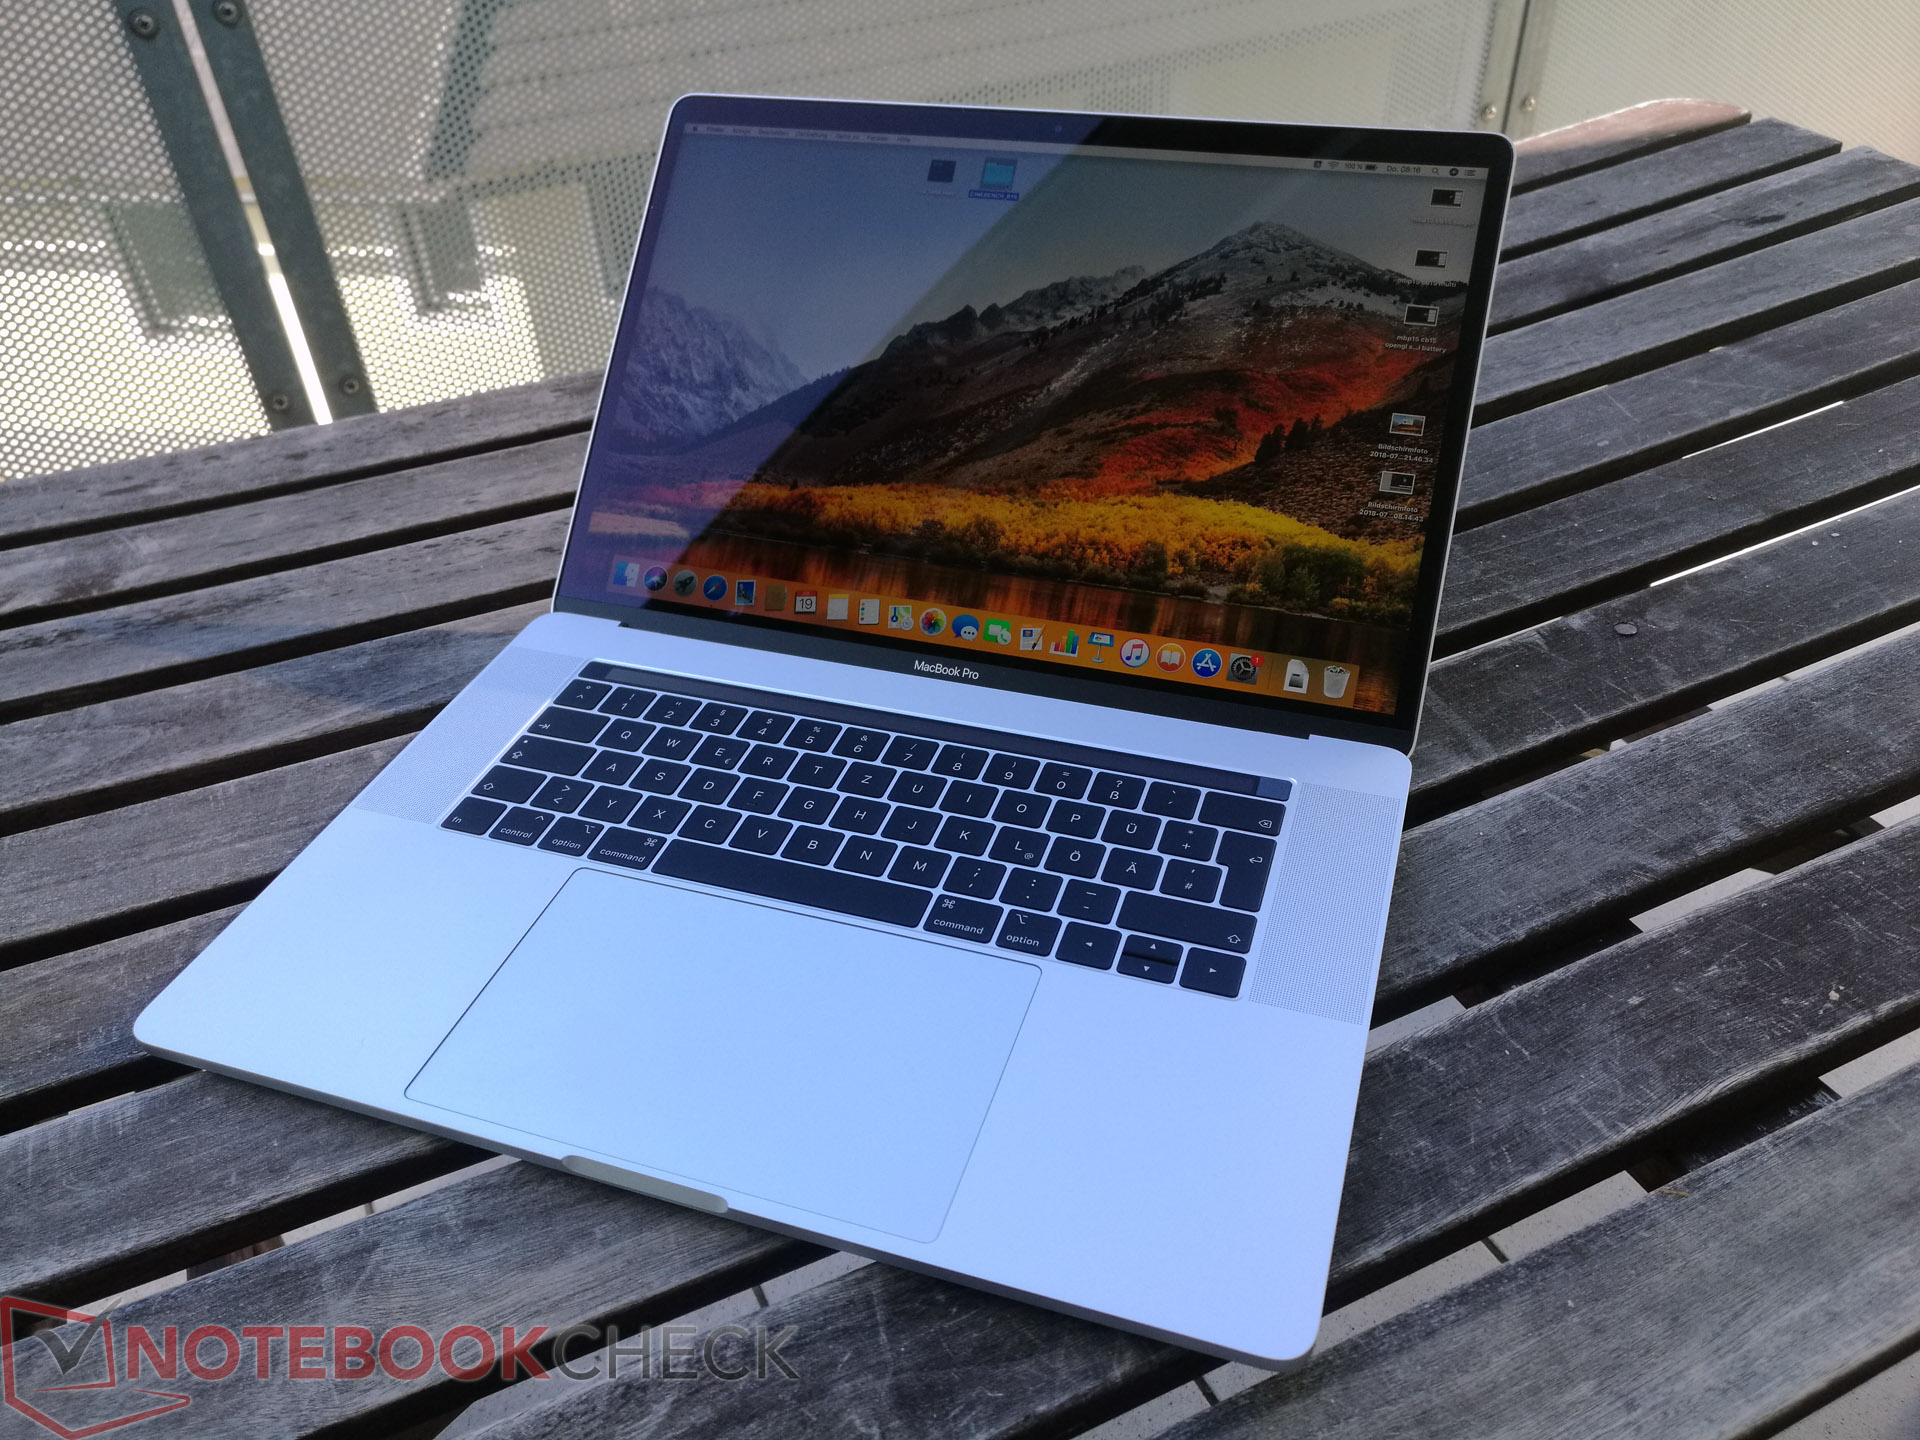
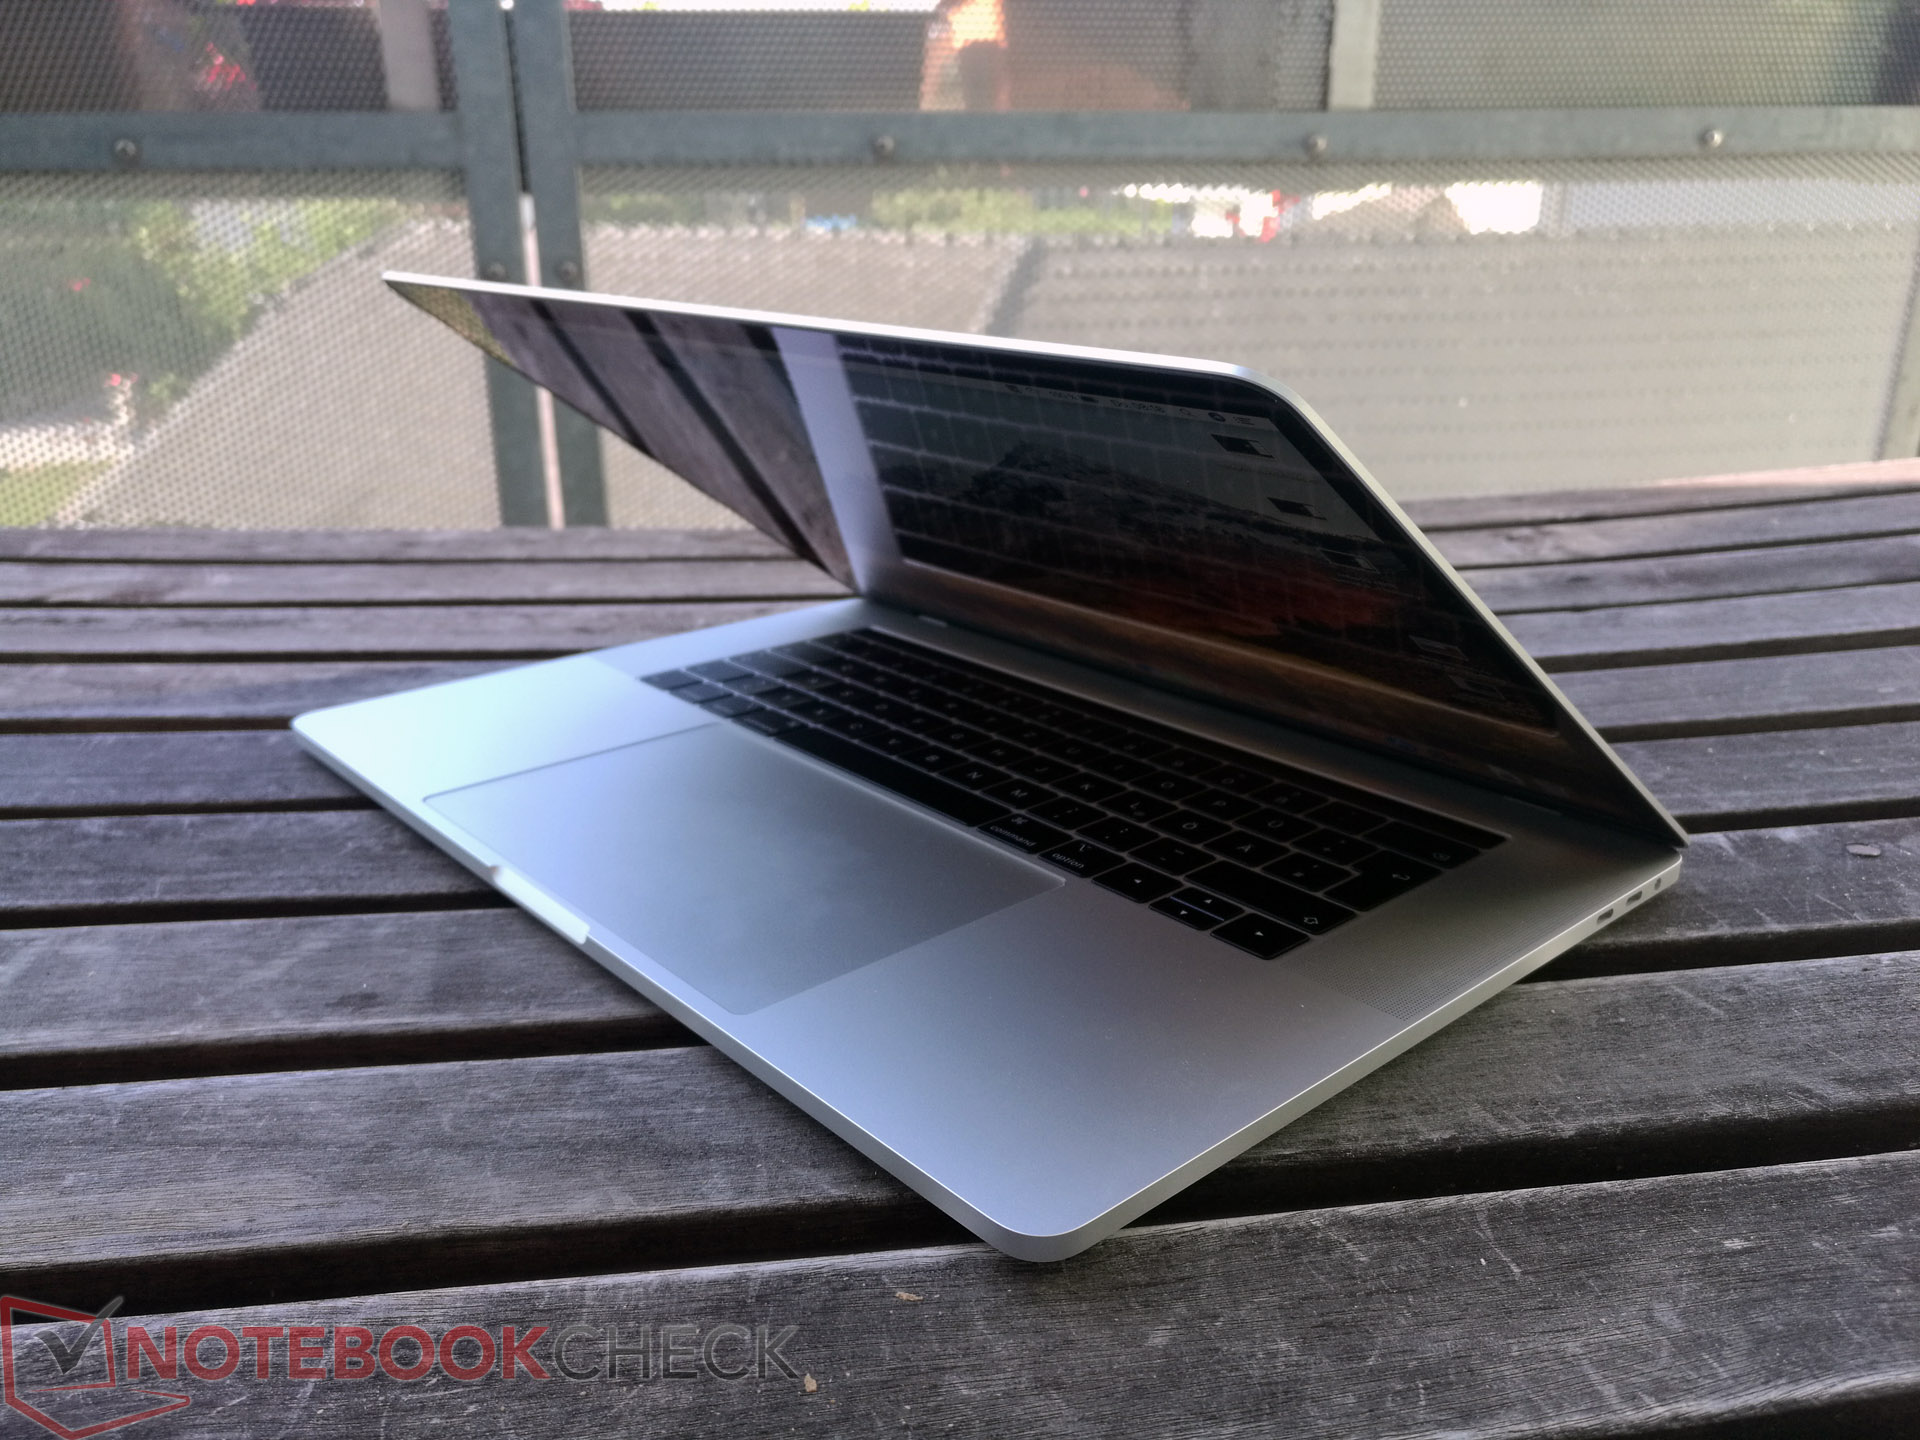

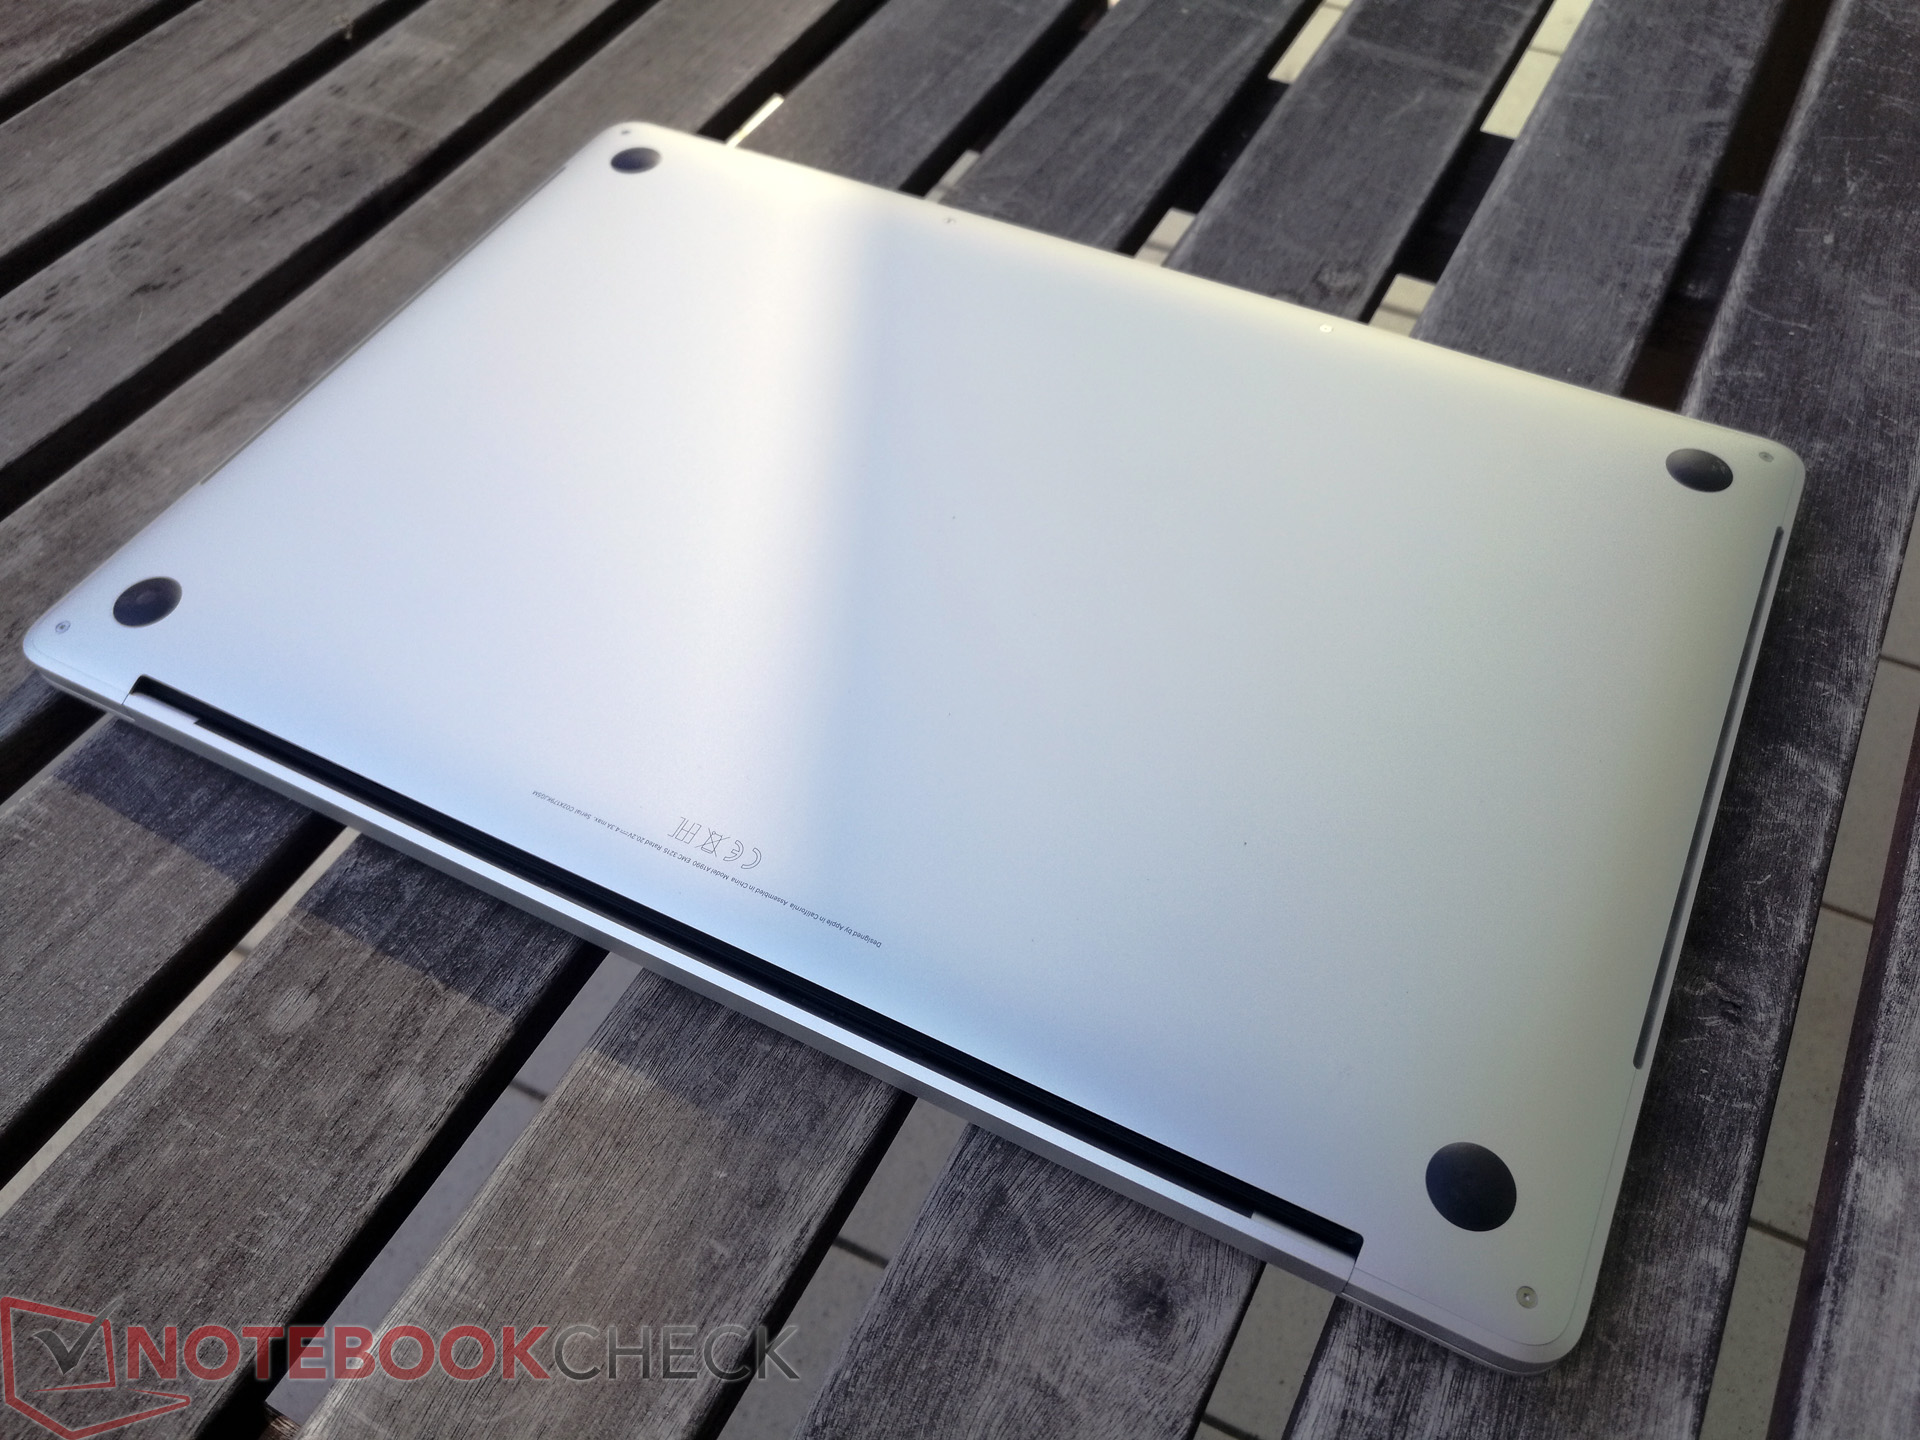
The MacBook Pro 15 still holds up extremely well in our size comparison. There are some differences, and many rivals are a bit wider and not as deep, but the MacBook is still the most compact and slim laptop overall. Dell's XPS 15 9570 is slimmer at the fron of the chassis, but gets thicker at the rear. The Apple laptop is also the lightest machine at little more than 1.8 kg.
Connectivity
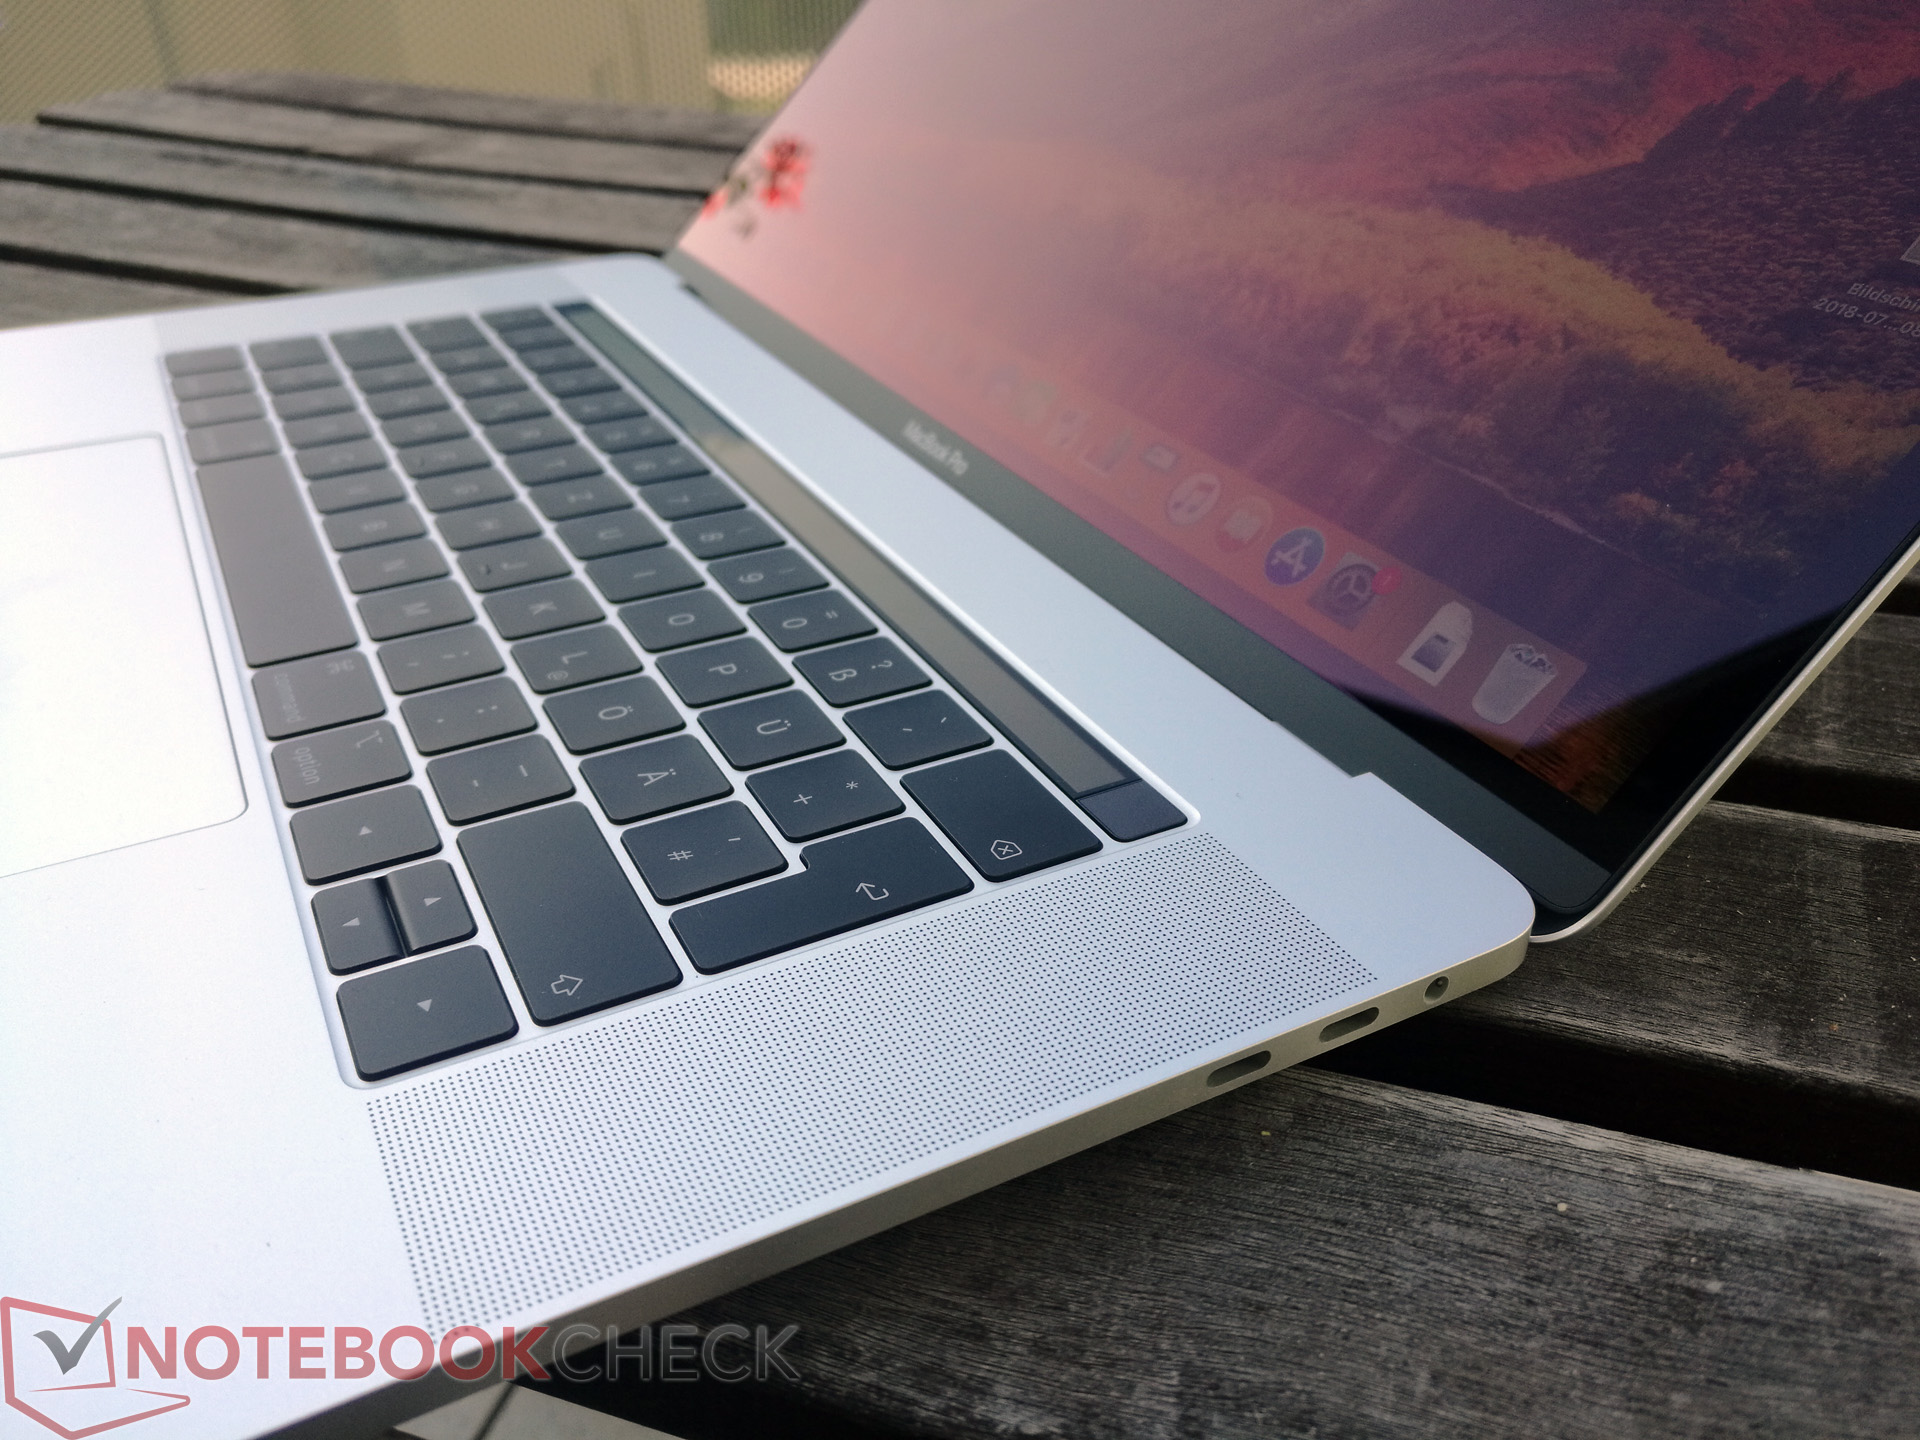
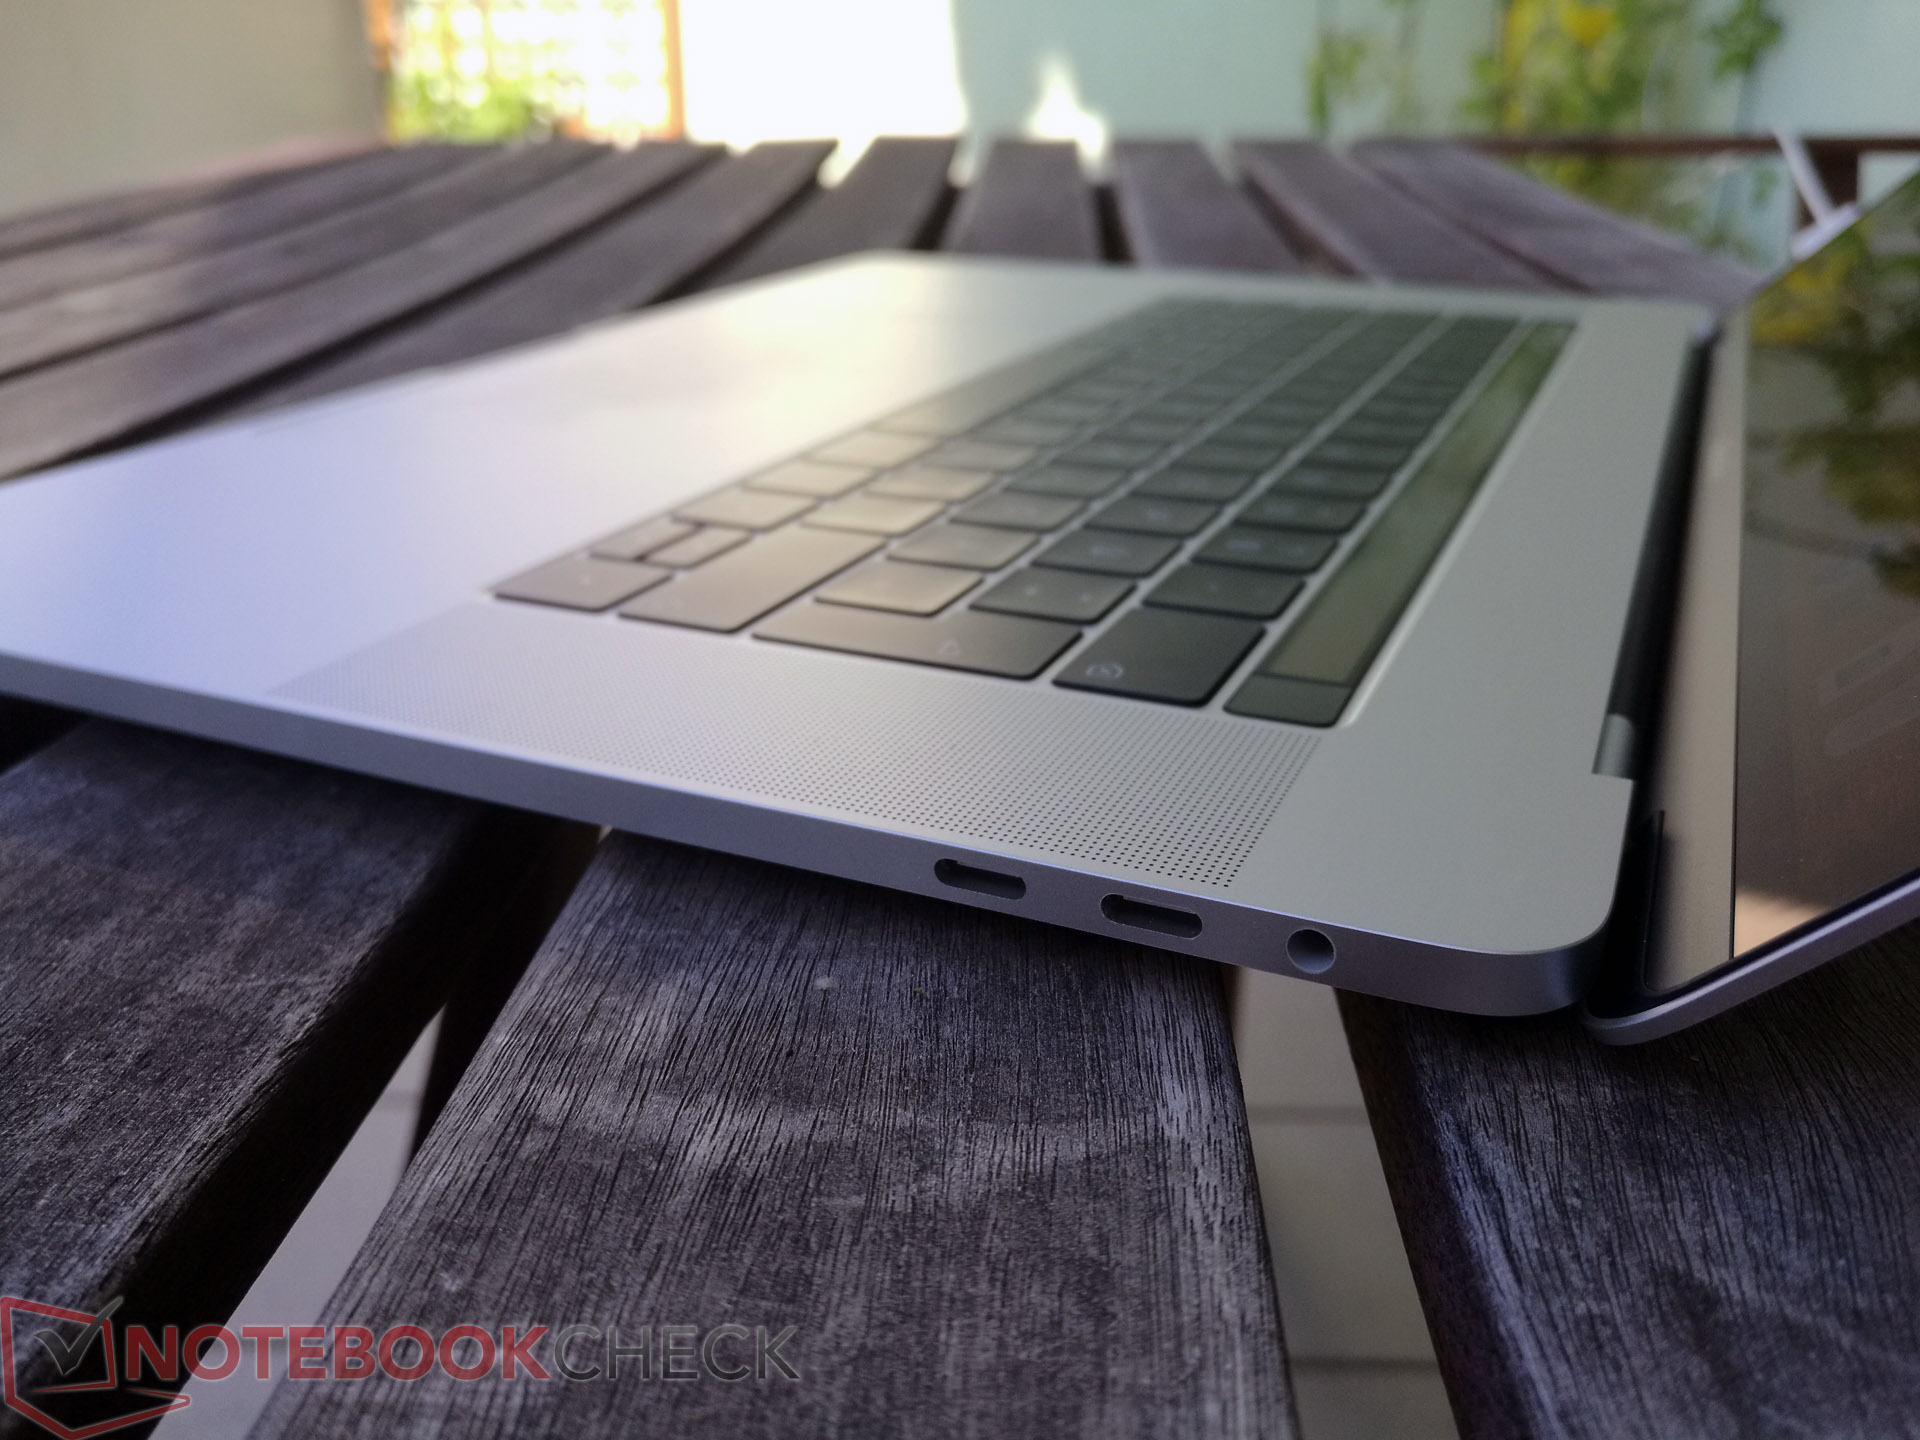
The port situation did not change, you still get four Thunderbolt 3 ports (full bandwidth) with USB Type-C connectors as well as a 3.5 mm stereo jack. This means you can pretty much attach anything to the current MacBook Pro and there are more and more USB-C accessories, but you will probably need adapters or dongles for now. There is still no SD-card reader, either, despite the large case.
Communication
Similar to the smaller 13-inch MacBook Pro 2018, Apple also equips the 15-inch laptop with an updates WLAN module including support for the modern Bluetooth 5.0 standard. The transfer rates in our standardized test with the router Linksys EA8500, however, are a bit slower compared to last year's model. Still, even these results are ahead of the Windows competition.
Apple managed to reduce the Wi-Fi connectivity issues in 2.4 GHz network when USB-C devices are attaches. We still see occasional package losses, but the connection itself is stable.
Security
Apple equips the 2018 MacBook Pro with its own T2 chip, which combines several functions including storage encryption and secure boot features. The user does not notice anything though. The access to the laptop is still secured by the Touch-ID fingerprint scanner, which is quick and reliable.
Warranty
Apple only ships its devices with a 12-month warranty, despite the high price. It is possible to extend the warranty to 36 months (Apple Care Protection Plan), which costs 349 Euros. An on-site service, which is available from companies like Dell, HP, or Lenovo, however, is not included. Please see our Guarantees, Return policies and Warranties FAQ for country-specific information.
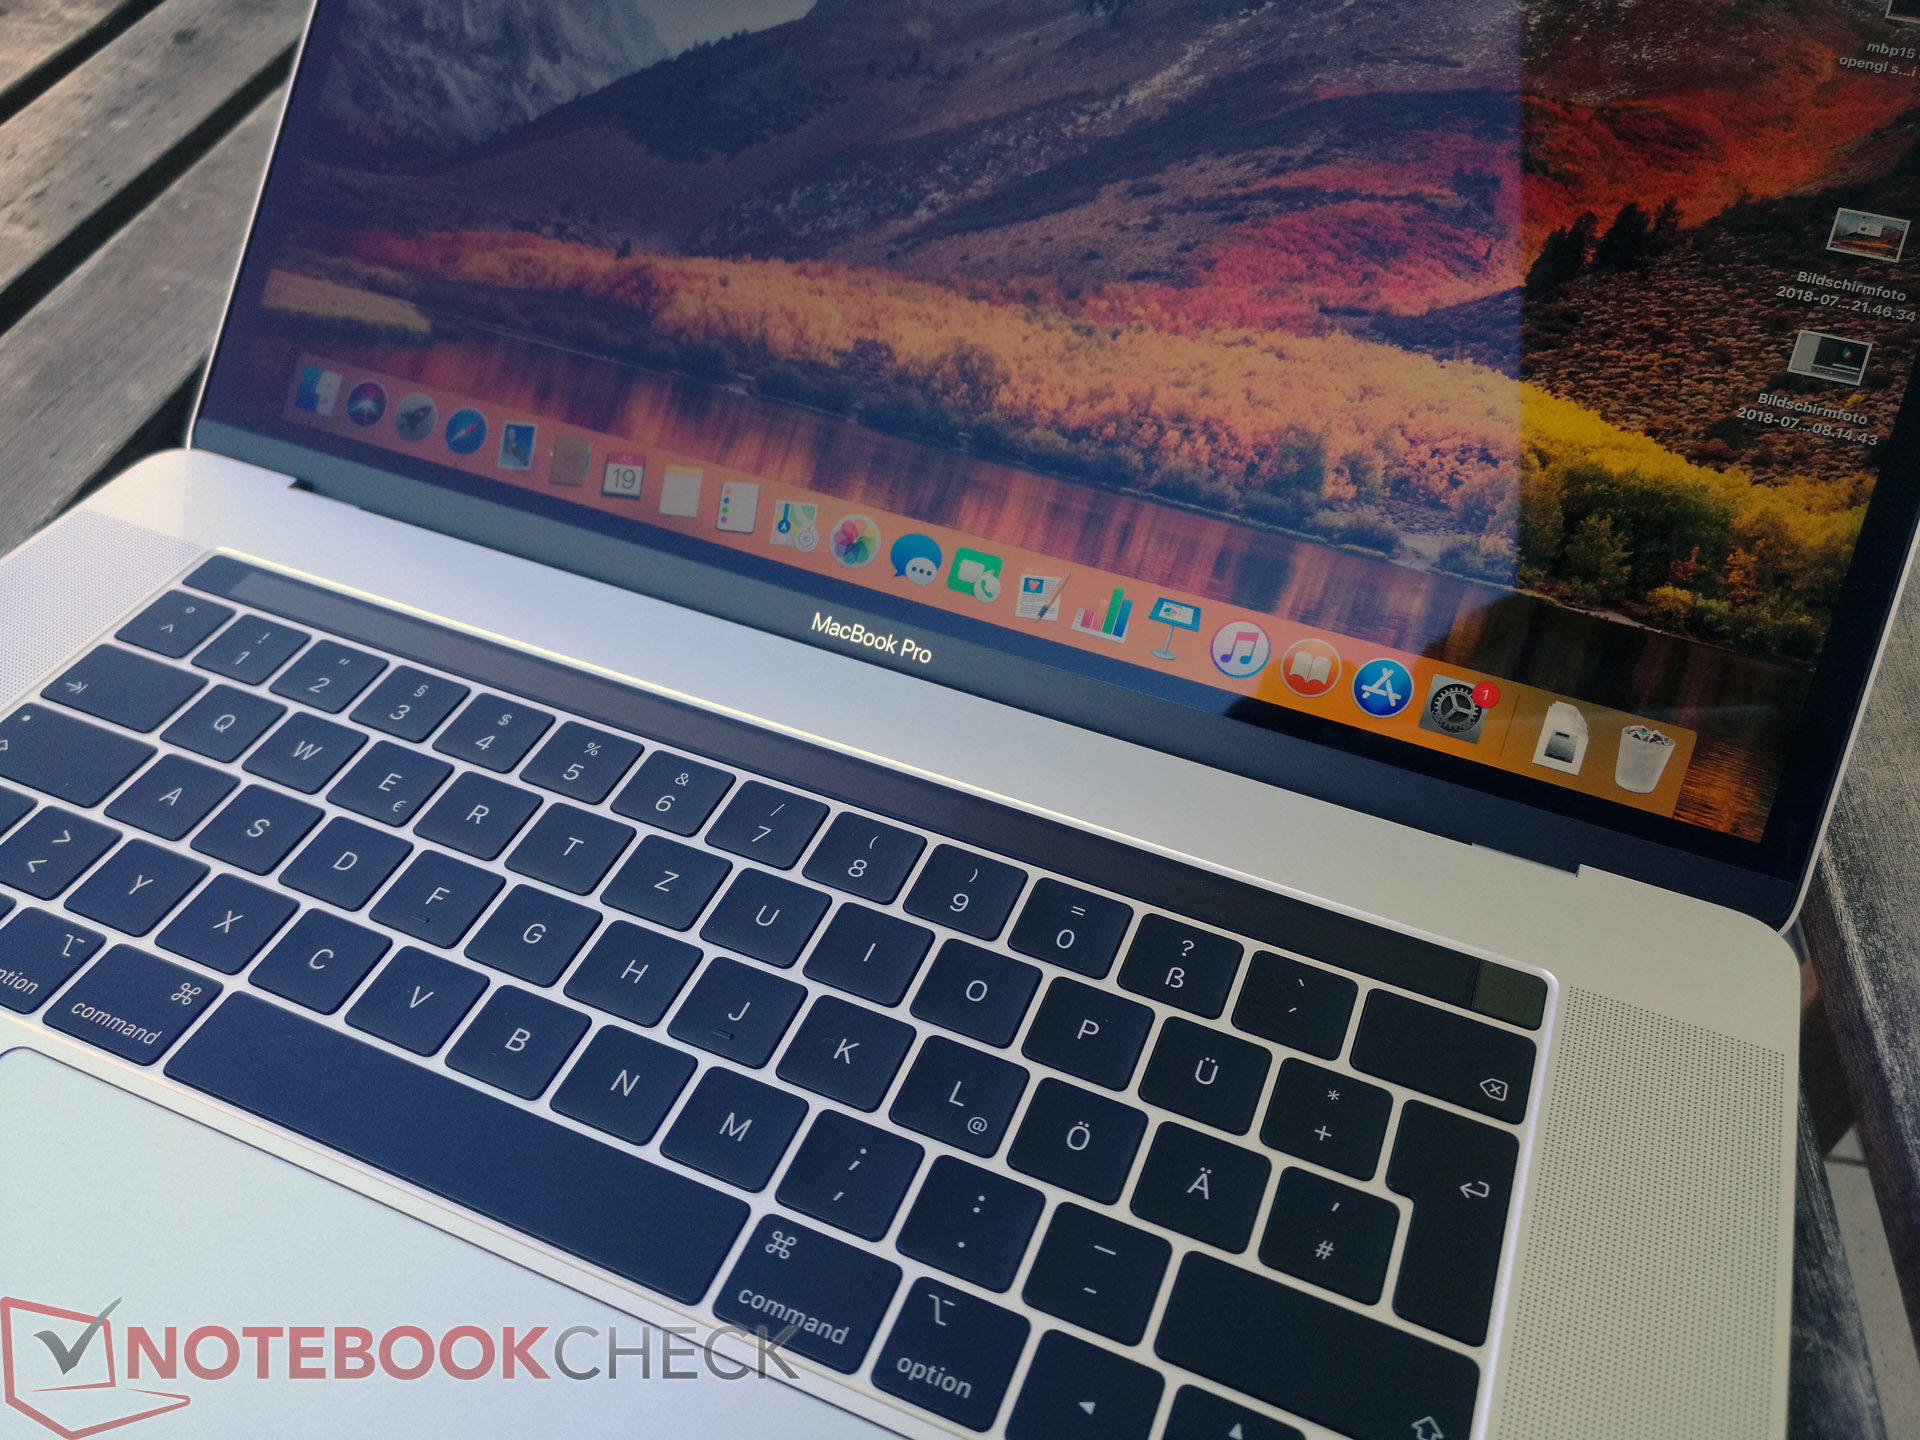
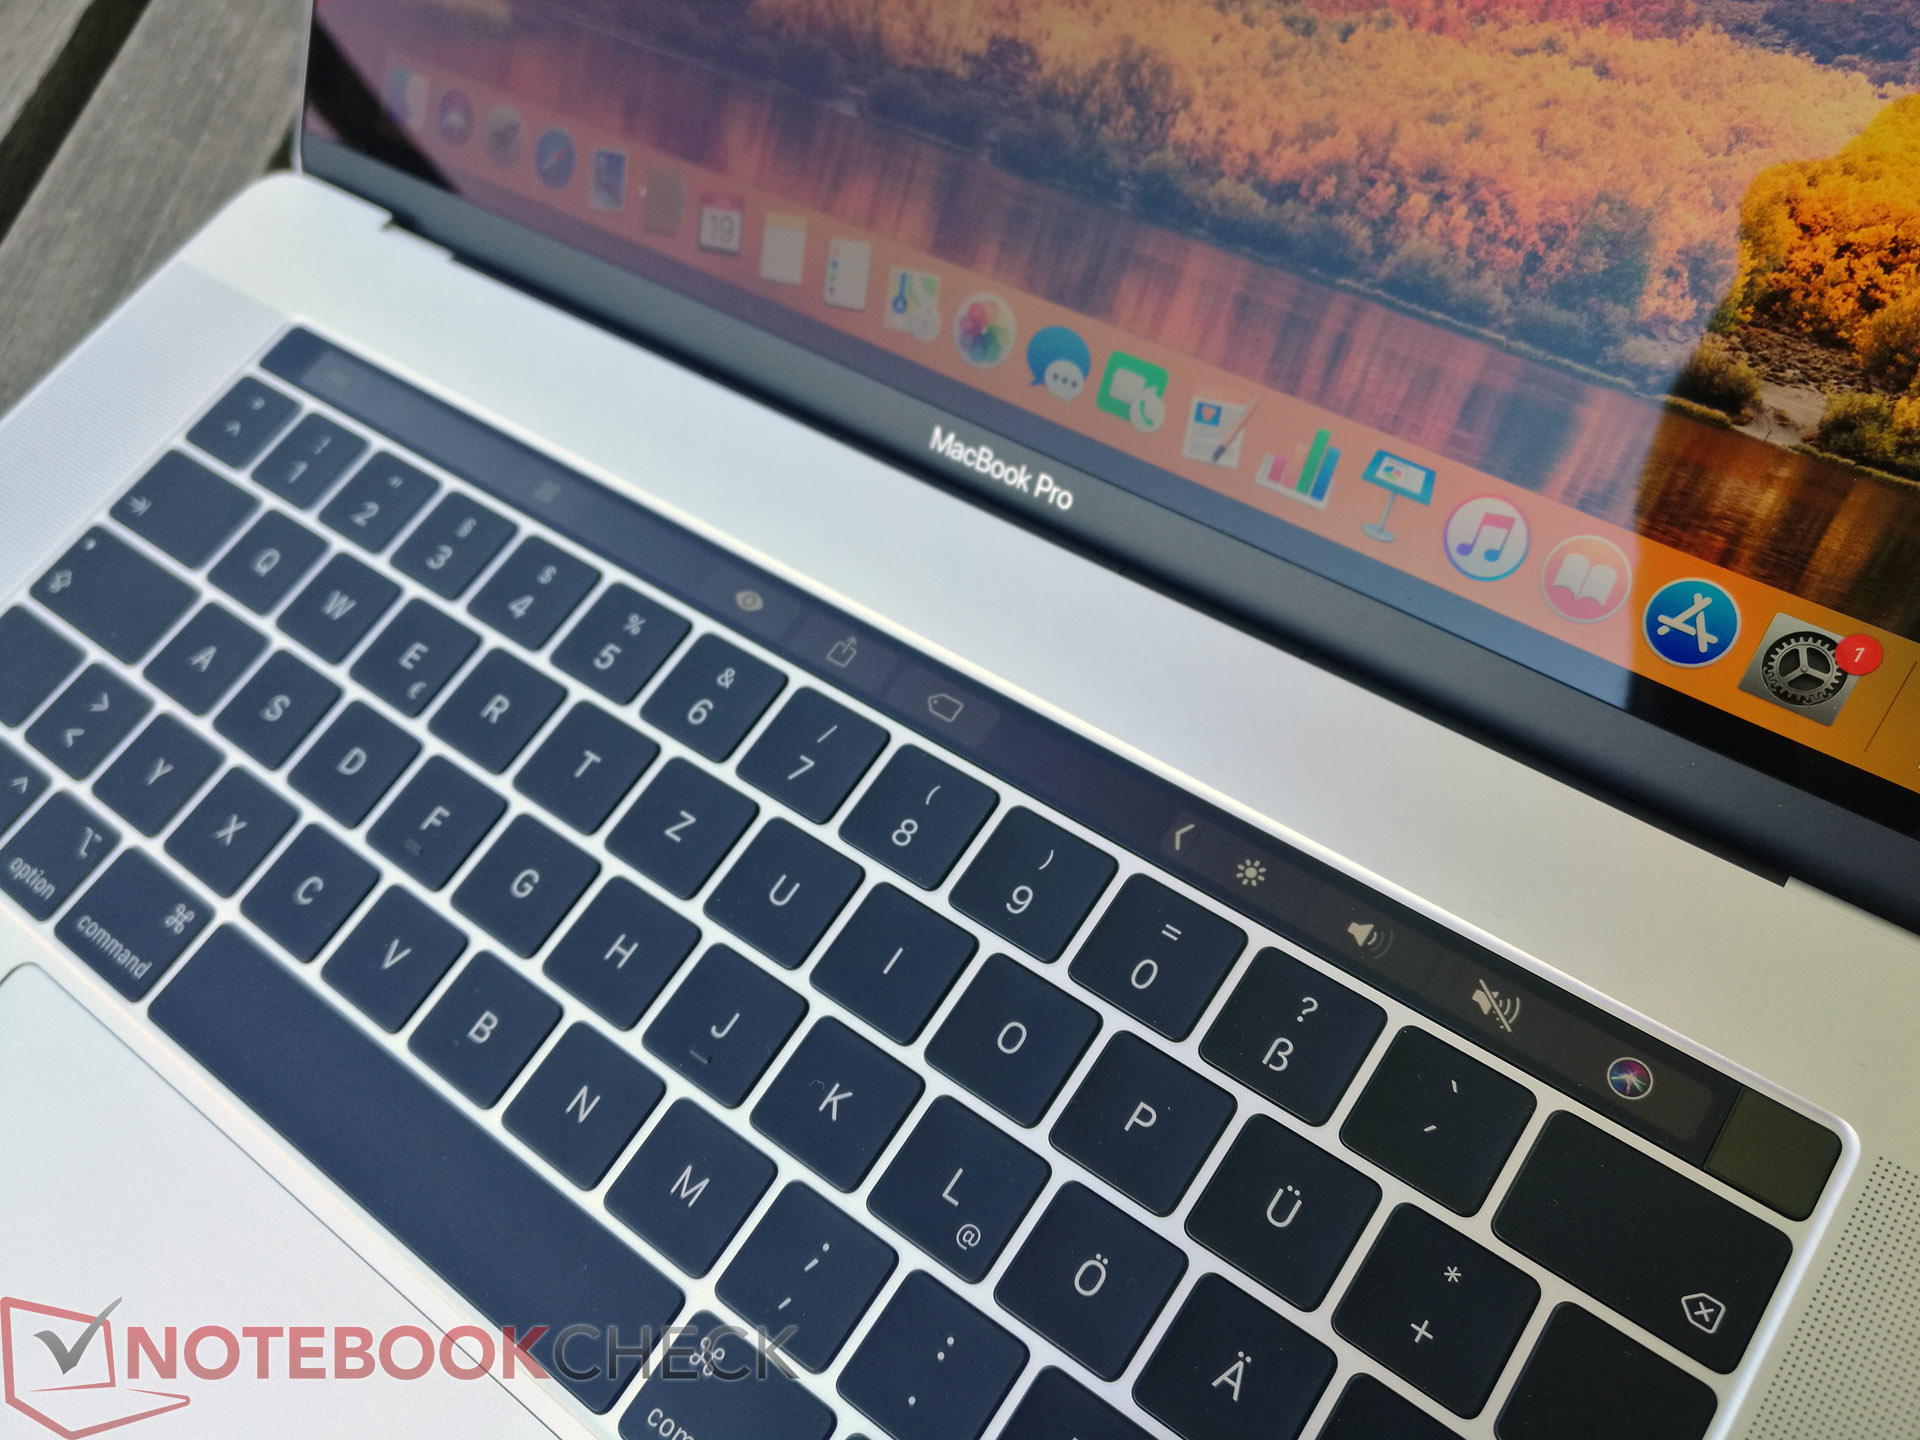
Input Devices - Butterfly with silicone membrane
Keyboard
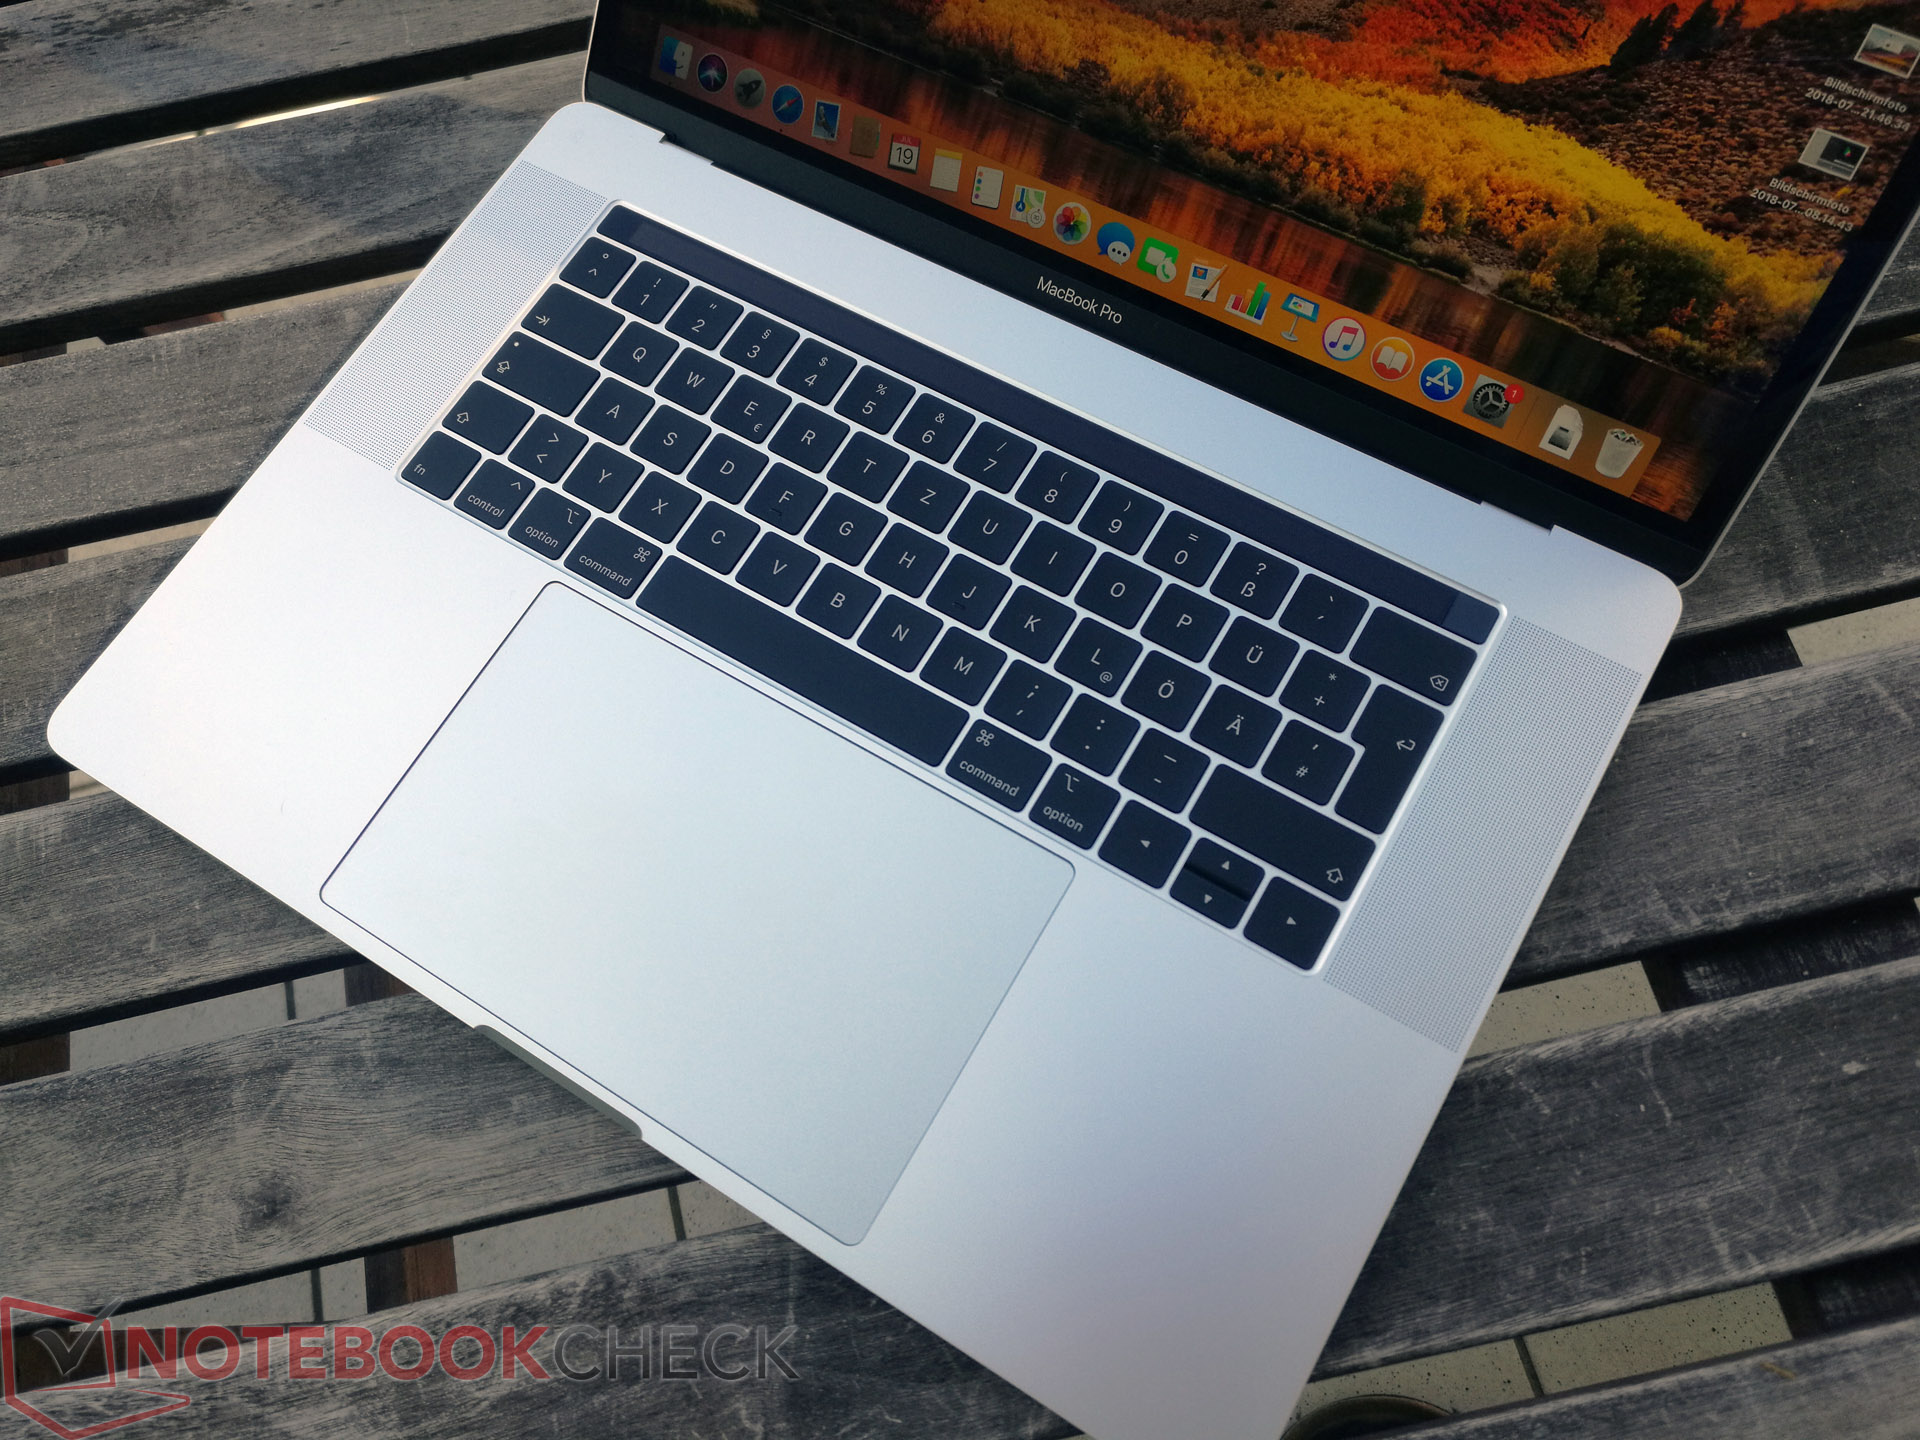
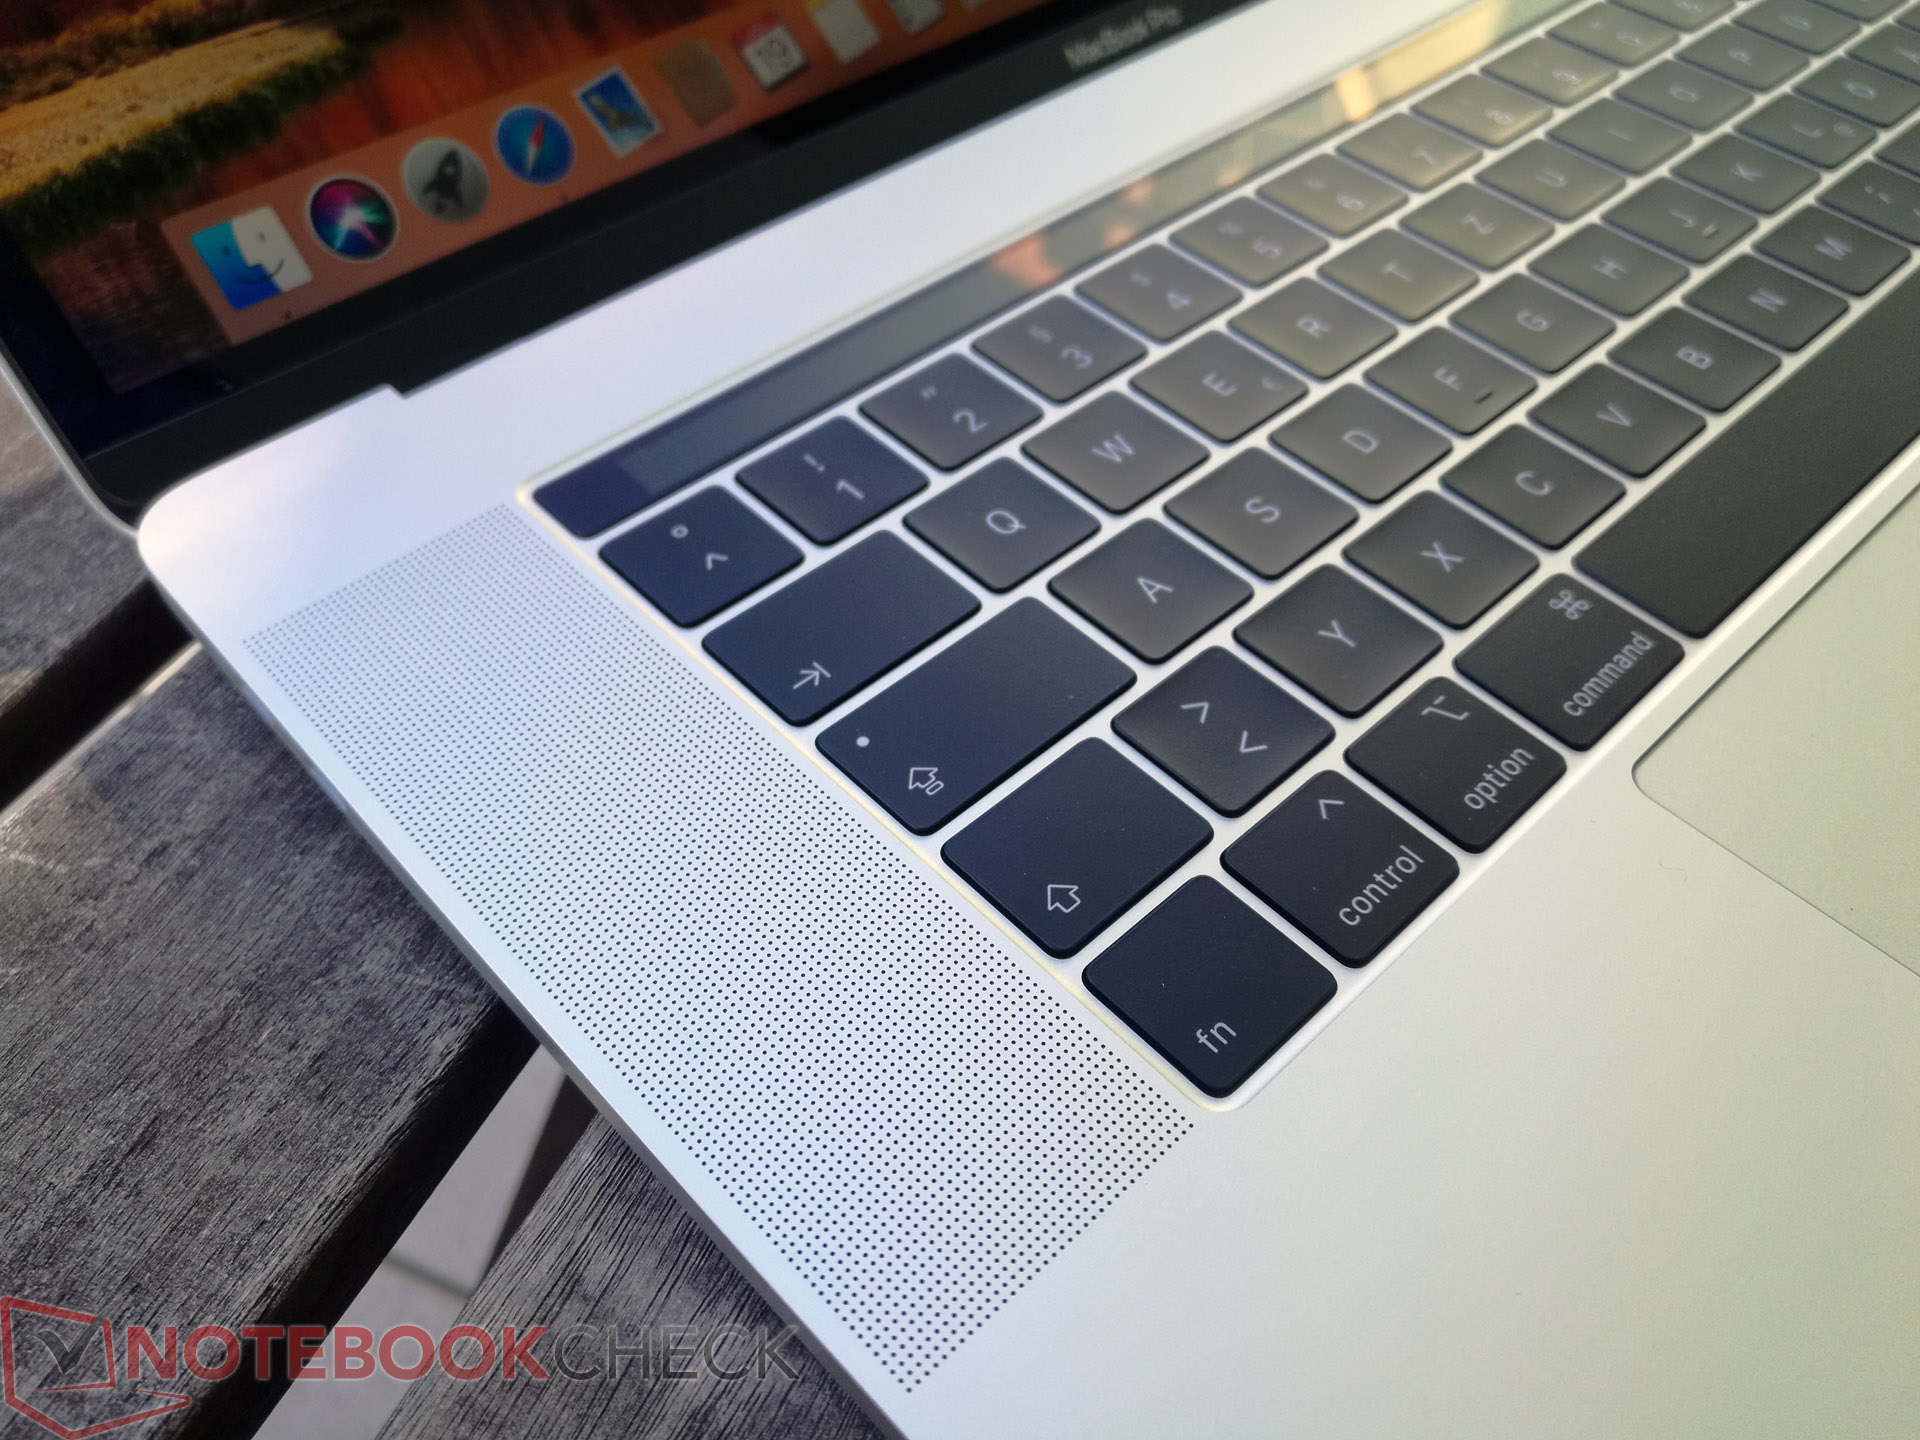
There have been a lot of discussions about the keyboard on the current MacBook Pro lineup. Apple uses keys with a very shallow travel to realize the slim base unit. The manufacturer uses its own Butterfly keys with very precise (and loud) key strokes, but the typing experience is just not comfortable for every user. Apple unfortunately sticks with the decision to waive a dedicated numpad, even though there would have been enough space. We still appreciate the keyboard illumination with multiple brightness settings and automatic adjustment to the ambient light.
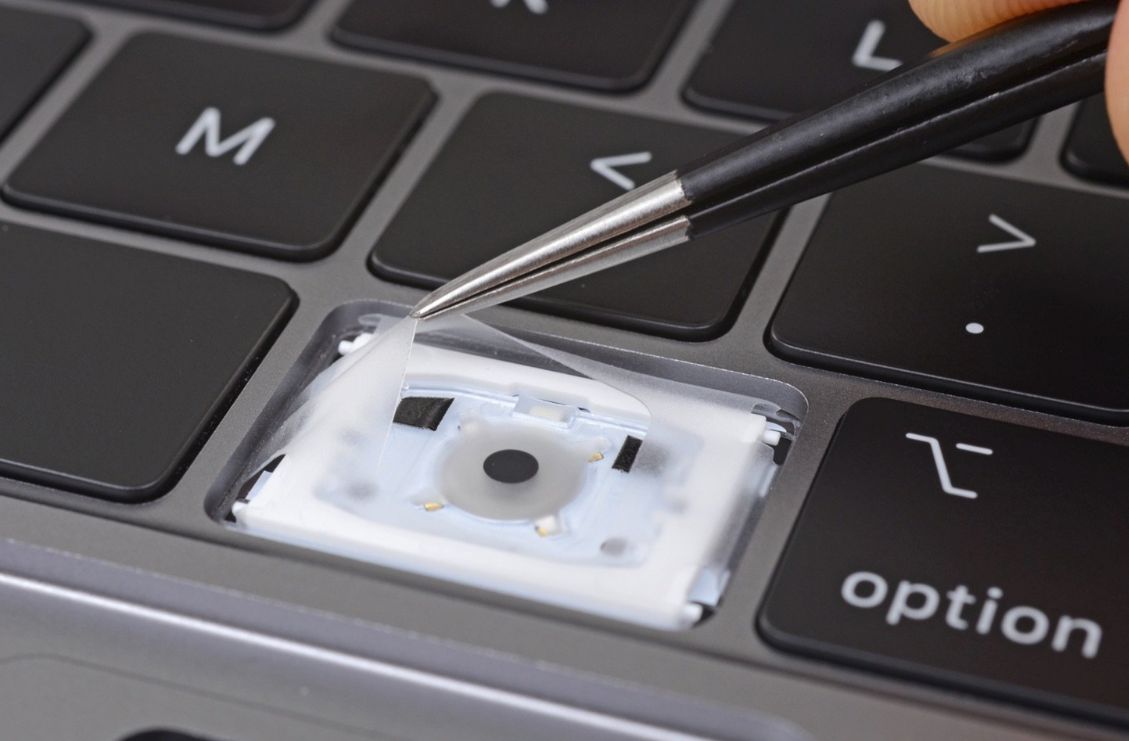
Then there is the problem with defective keyboards on the MacBook Pros, and Apple even introduced a special repair program. Even small objects (dirt, crumbs, etc.) can result in problems (keys won't work anymore). Apple did not mention this issue when they announced the 2018 models, but advertised a quieter keyboard. Our colleagues from iFixit already disassembled a 2018 model and found a new silicone membrane underneath the keys. They ensure a quieter typing noise, but also seem to prevent the intrusion of dirt, so it might be an reaction to the problems after all. We can obviously not check whether this solution works in the long term.
Subjectively, there is a distinct difference between the old keyboard (e. g. in the 2017 MacBook Pro 15) and the new one. The key stroke is much more muffled and not as light as before. The sound difference is actually only noticeable when you type with a lot of force. All in all it is tough to say whether the key stroke has improved, but it certainly requires a little adjustment period.
Update: Internal service documents from Apple confirm that the new membrane is supposed to prevent debris from entering the butterfly keys.
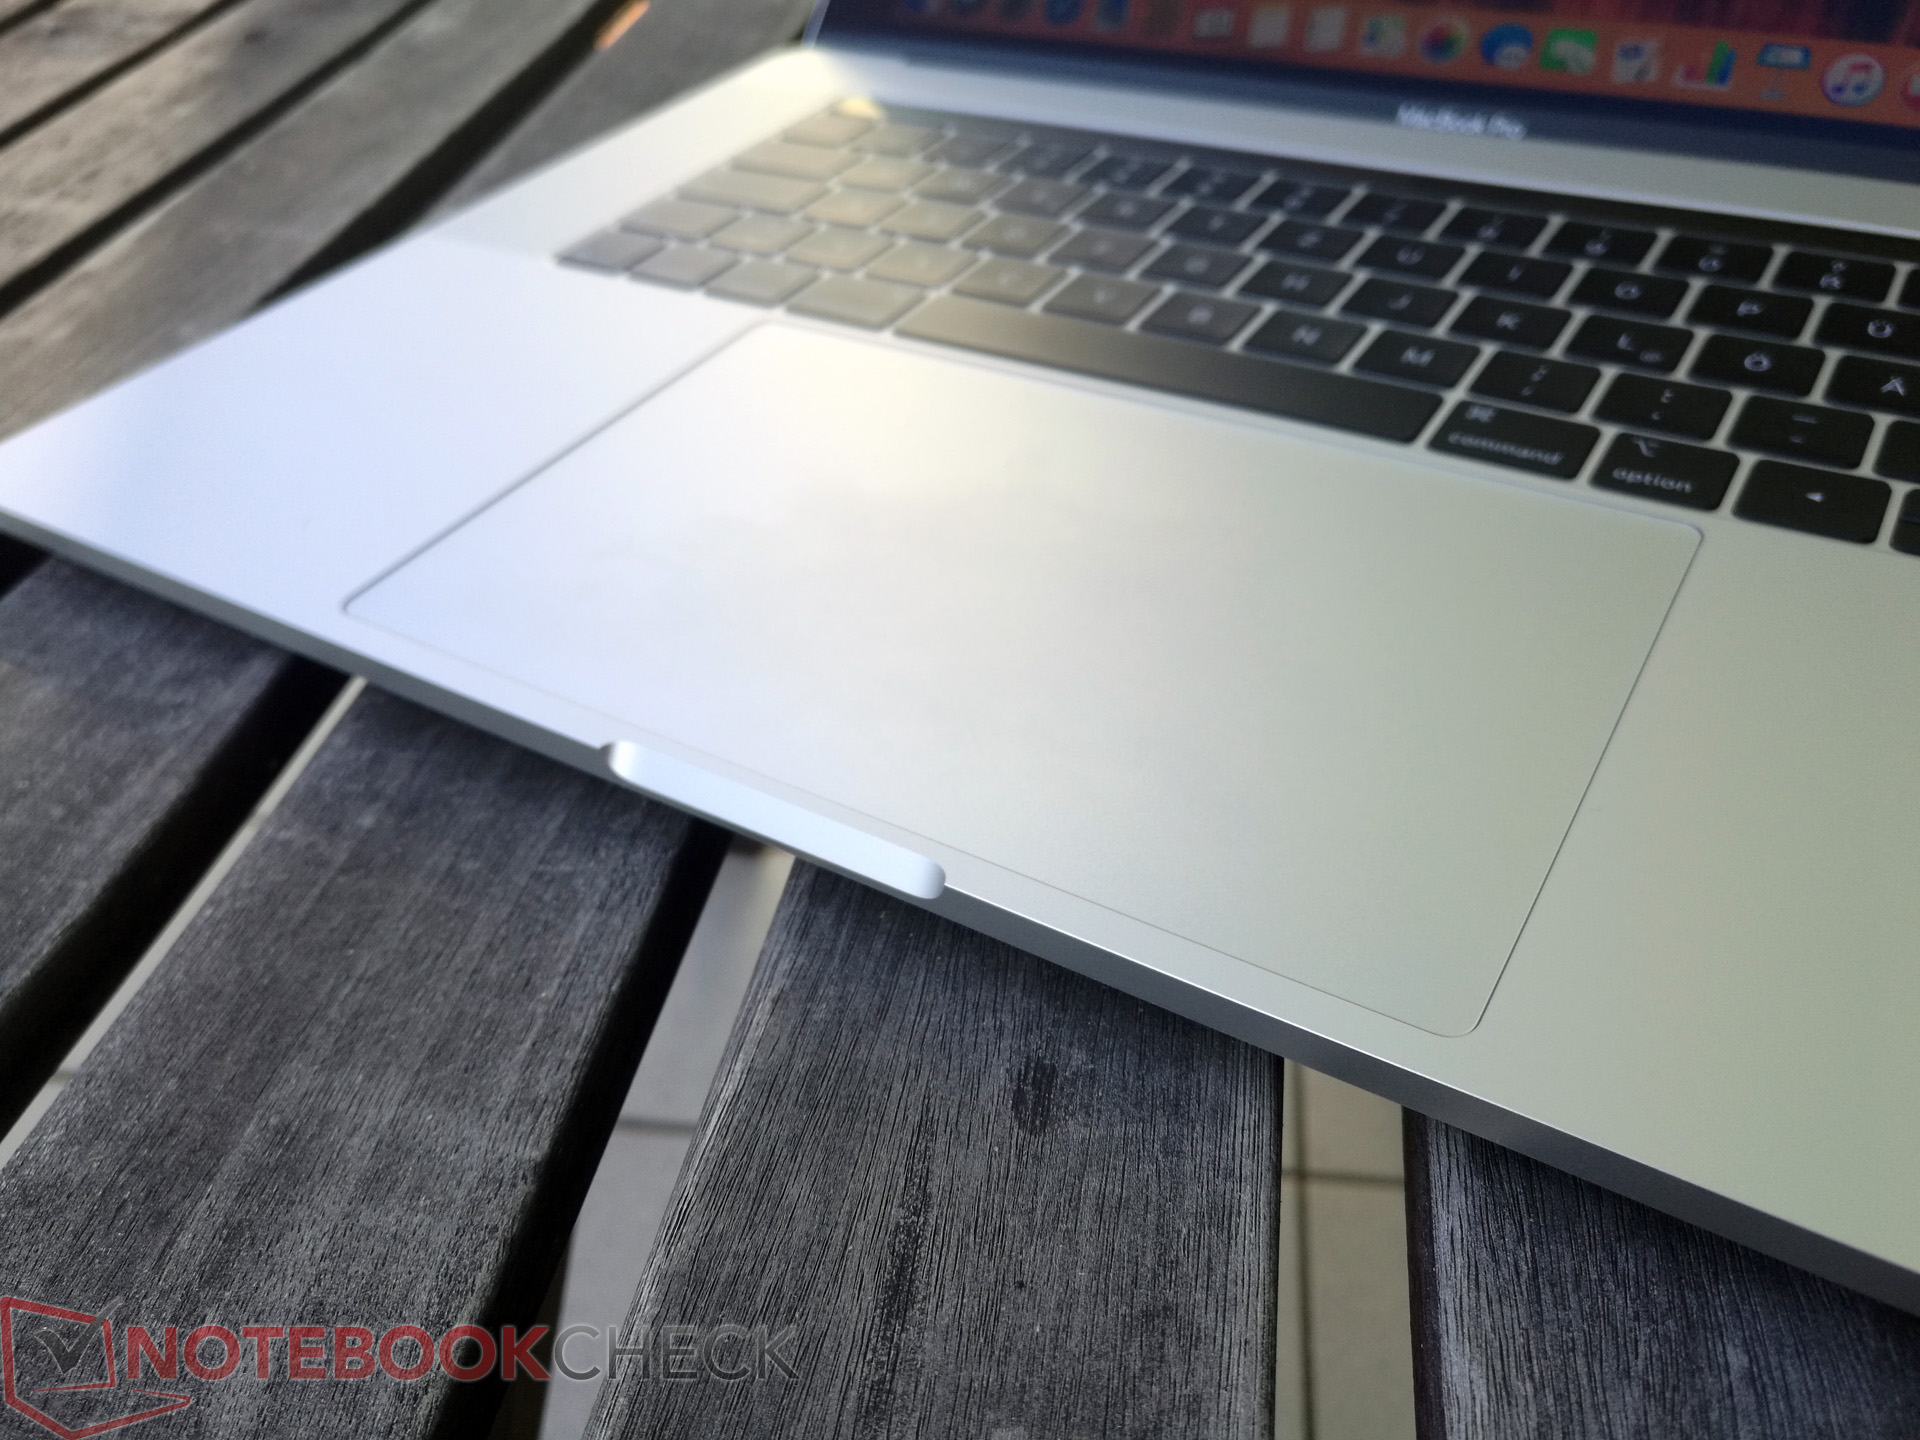
Touchpad & Touch Bar
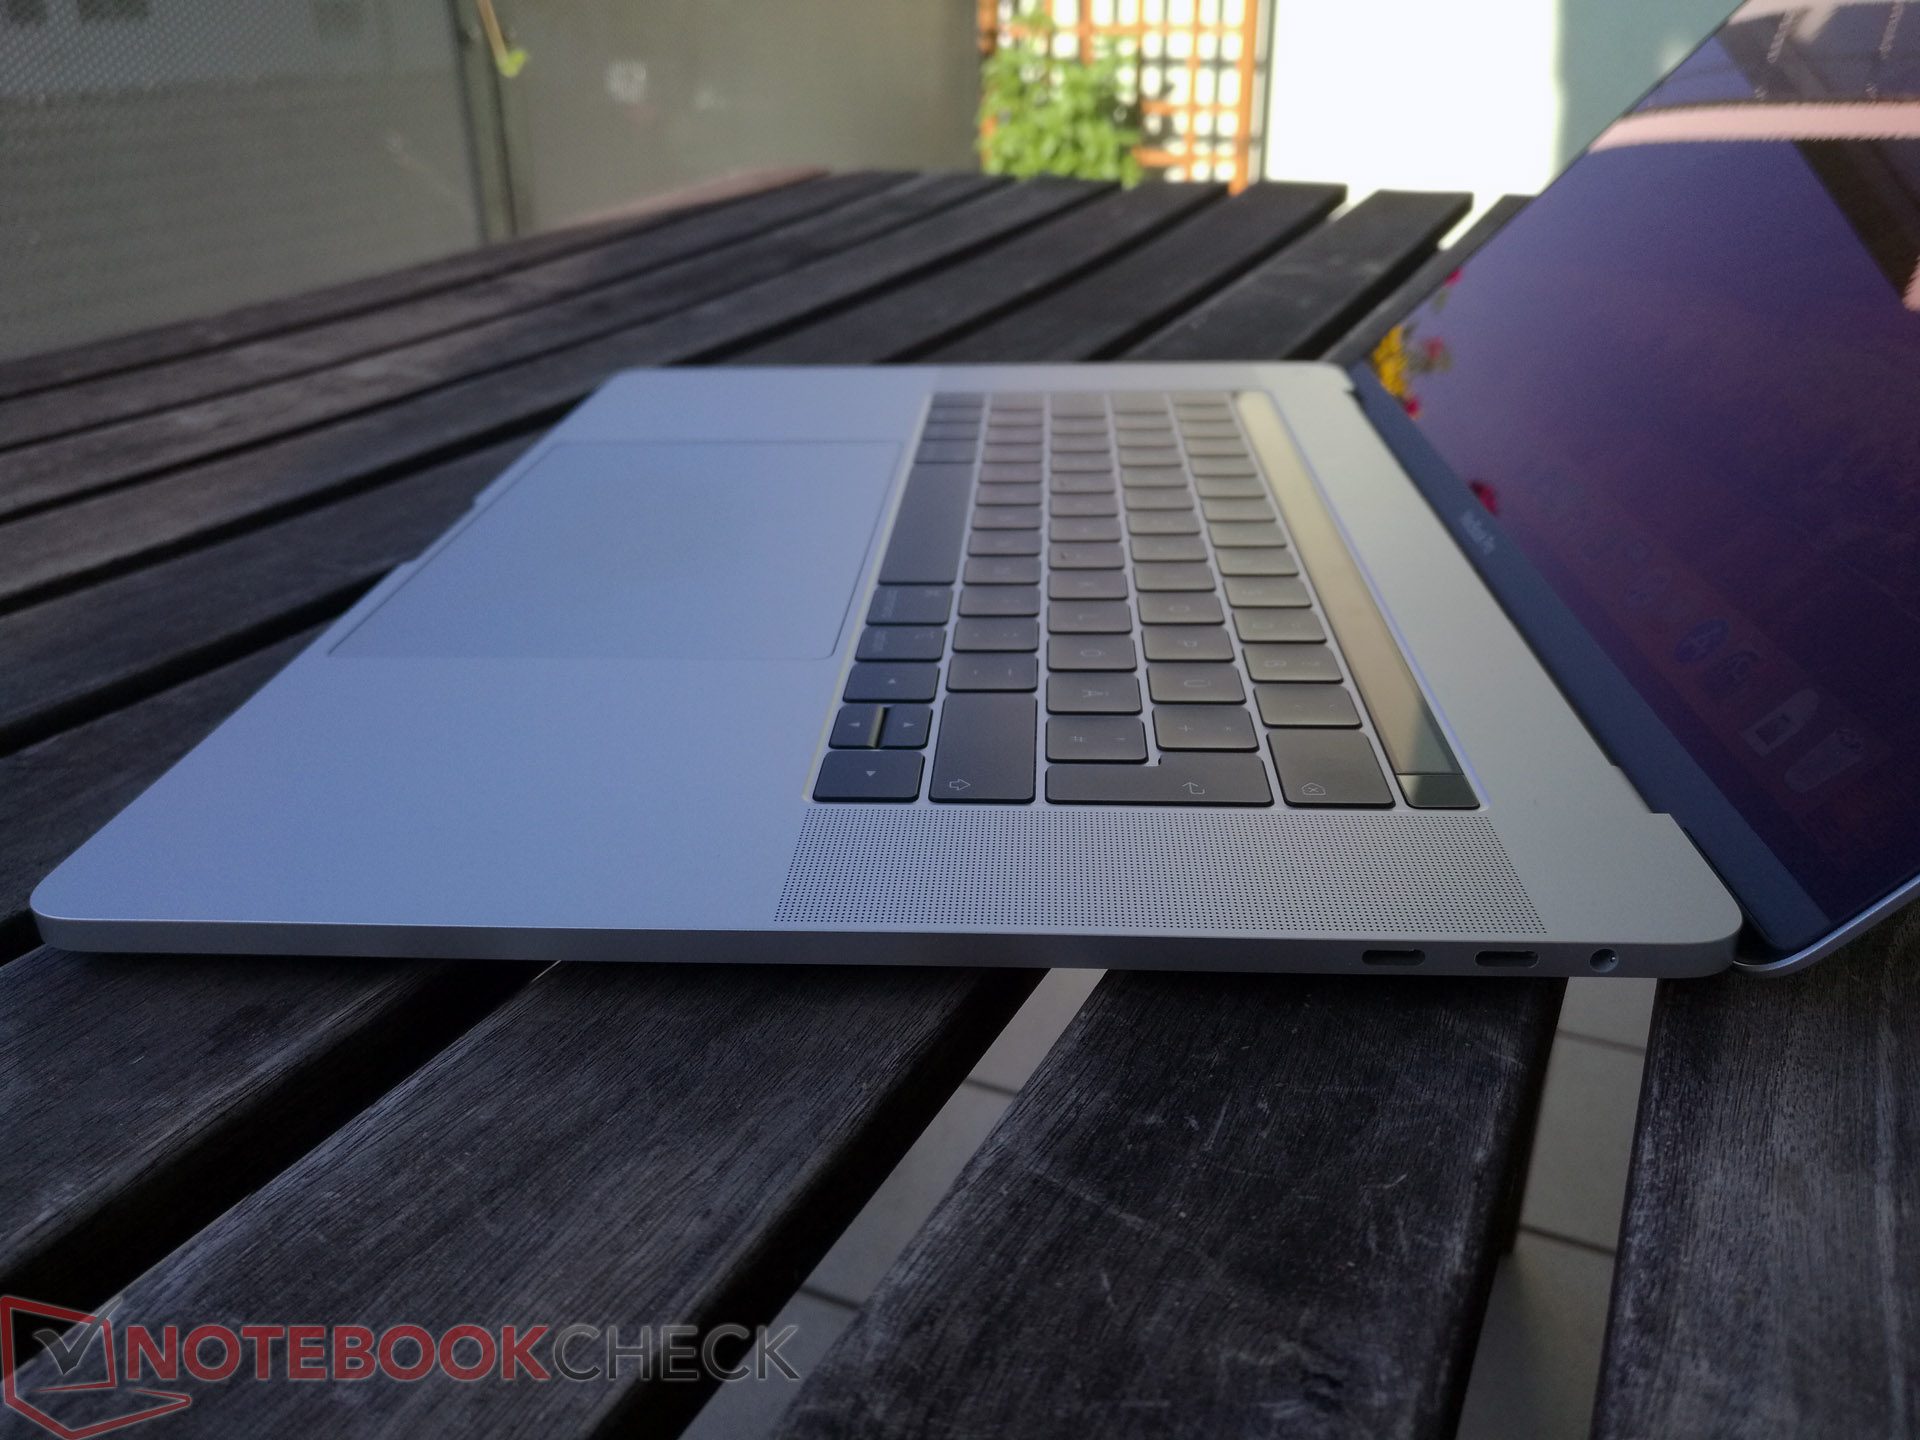
The big trackpad did not change this year. It is still the benchmark among touchpads and is easy to use. Even gestures with multiple fingers are no problem thanks to the large surface area. Basic controls also work well running on Windows (Bootcamp), but the drivers are not as well optimized as for Apple's own operating system. Drag-&-drop commands in particular are more complicated.
You also still get the Touch Bar above the keyboard, which can show different contents based on the application. It shows basic controls like brightness or volume by default, but you can also display the standard function keys (F1-F12). Whether the Touch Bar improves the productivity mainly depends on the software support.
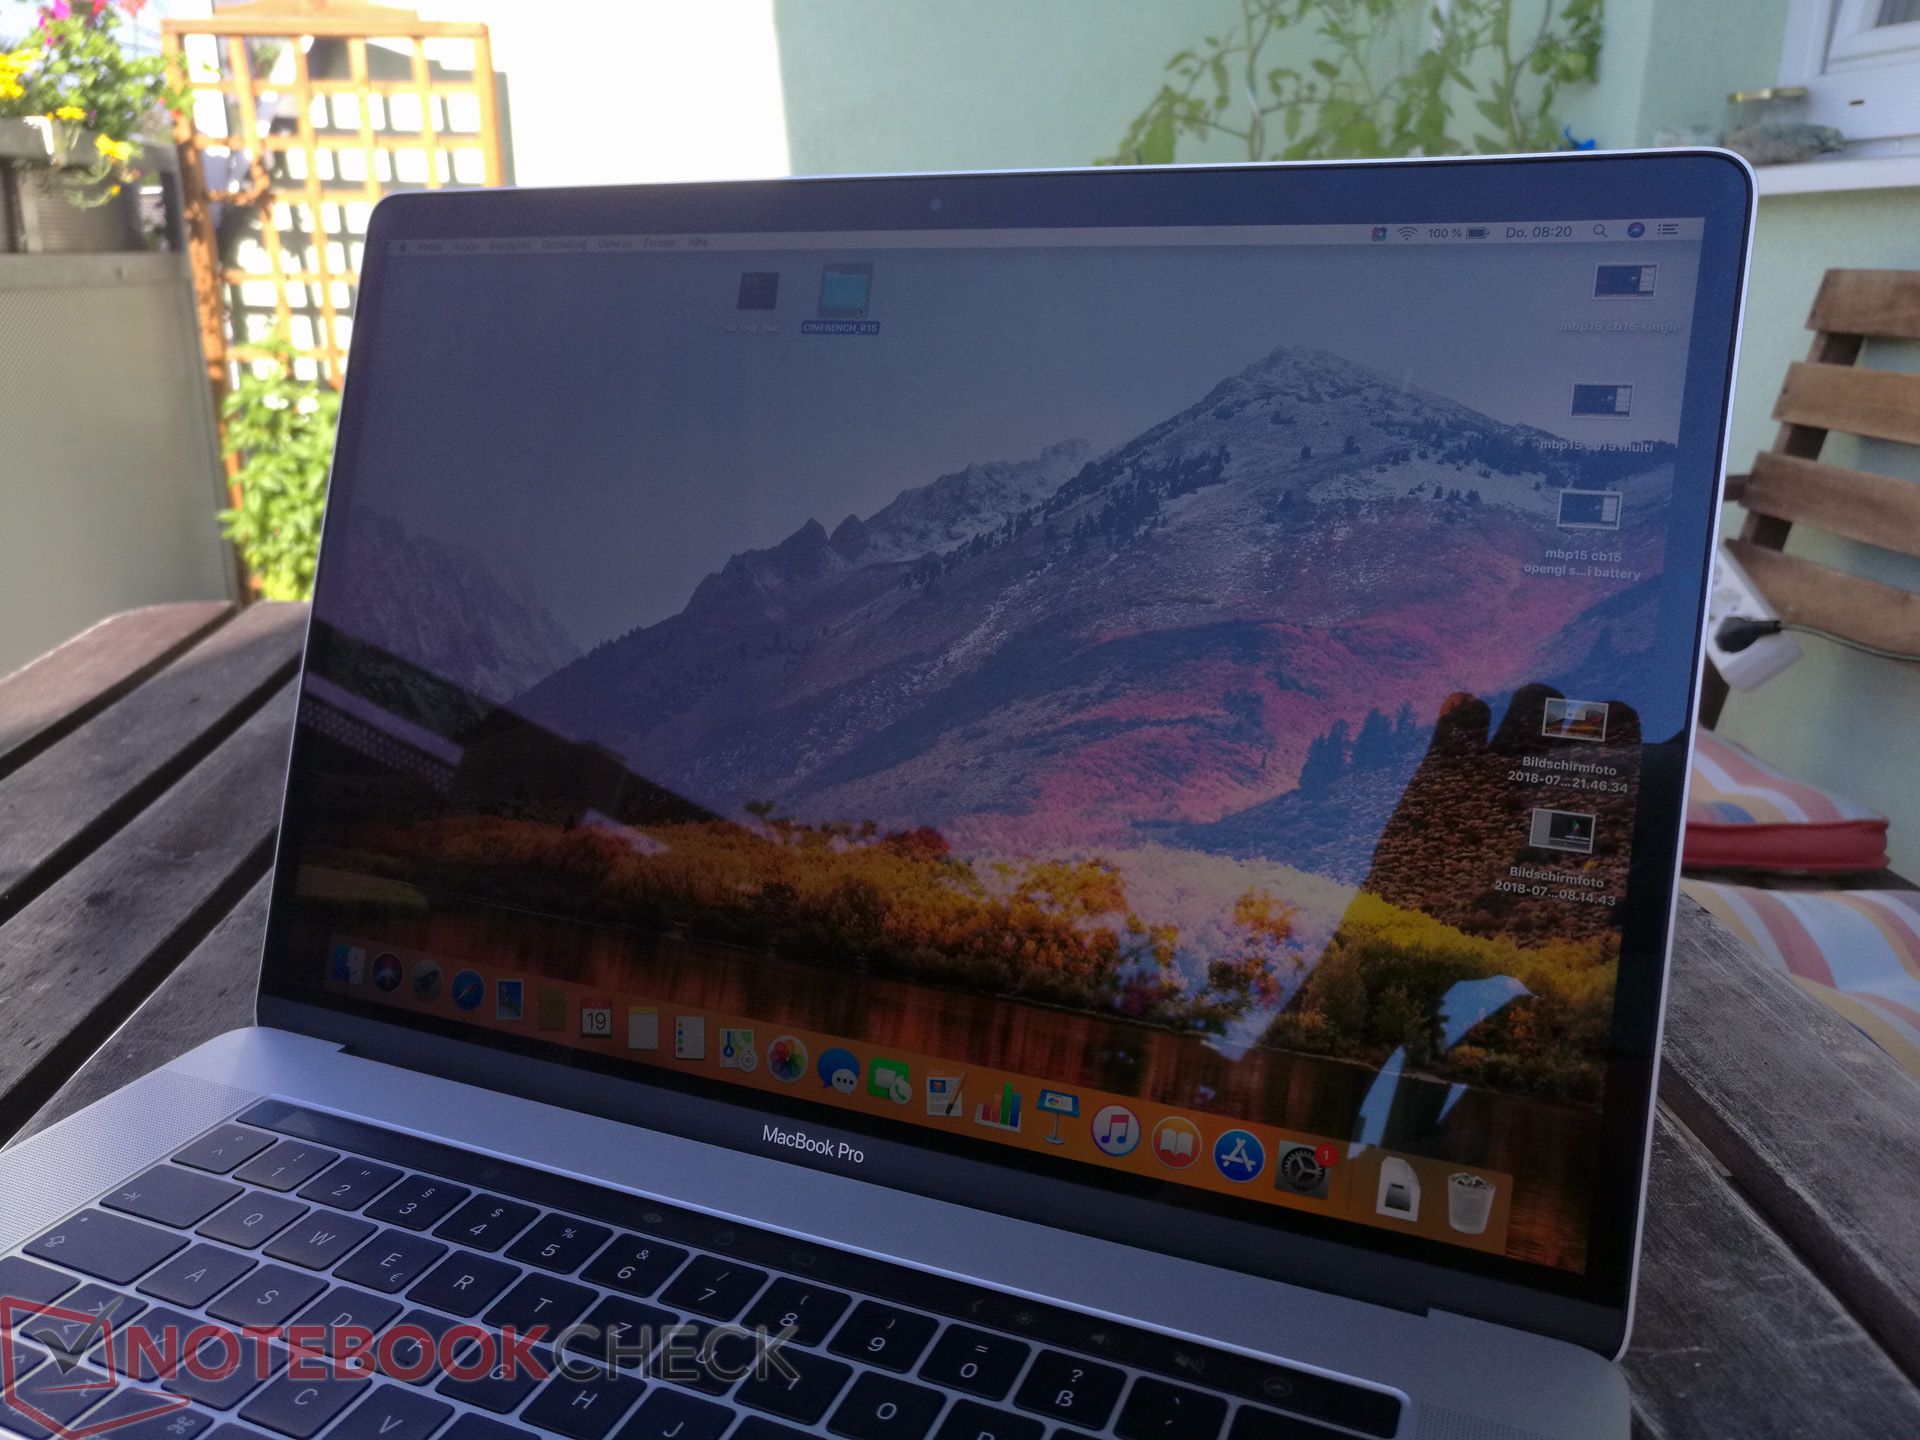
Display - MacBook Pro 2018 adds TrueTone
Apple is the only laptop manufacturer that still ships 16:10 display. 2880 x 1800 pixels (220 PPI, also called Retina by Apple) ensure a very sharp picture on the 15.4-inch IPS screen. The TrueTone support is the only new feature and we already know it from the iPhone or iPad, respectively. The white balance automatically adjusts according to the color temperature of the ambient light, which is supposed to create a more natural picture. The manual Night Shift mode, which reduces blue color contents, is still available. The latter can also be adjusted in the settings (automatic activation depending on the time, warmer or cooler picture). The panel in our test unit carries the designation APPA040 and differs from the previous models. Similar to the smaller 2018 MBP 13 this might just be a new revision or it might be necessary for the added TrueTone functionality.
Our test model reaches the advertised luminance of 500 nits at some points, but the last year's panel was a bit brighter. The black value is better in return, which improves the contrast ratio as well. The Dell XPS 15 9570 does not have to hide behind the Apple panel; its 4K screen is a bit darker, but has small advantages in terms of black value and contrast. Asus' ZenBook Pro 15 is equipped with a decent 4K screen, but cannot keep up with the two devices from Apple and Dell. The other two comparison devices use the same 1080p screen and fall behind when it comes to luminance and contrast.
| |||||||||||||||||||||||||
Brightness Distribution: 88 %
Center on Battery: 524 cd/m²
Contrast: 1333:1 (Black: 0.39 cd/m²)
ΔE ColorChecker Calman: 1.2 | ∀{0.5-29.43 Ø4.71}
ΔE Greyscale Calman: 1.3 | ∀{0.09-98 Ø4.96}
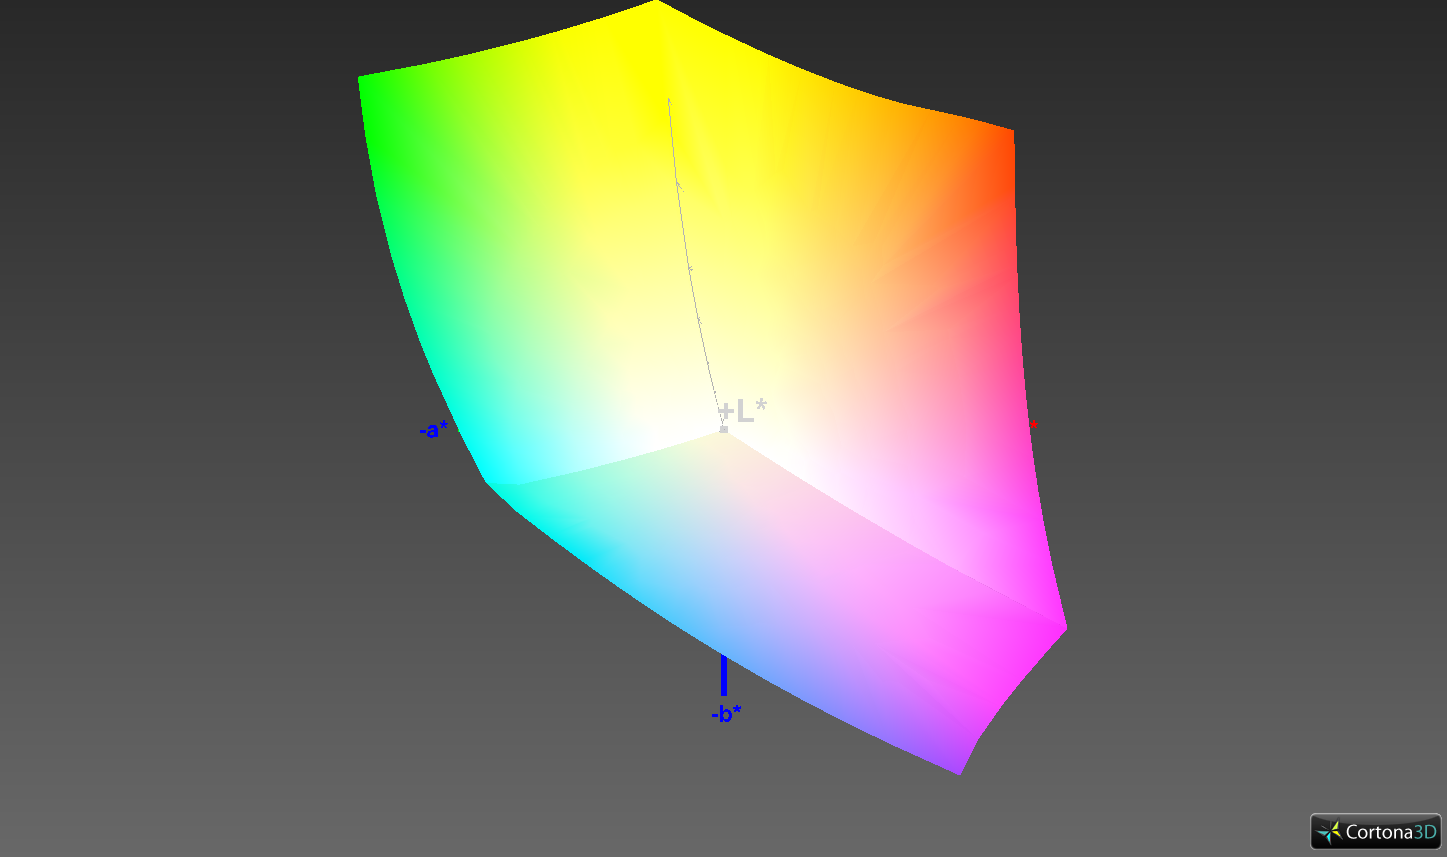
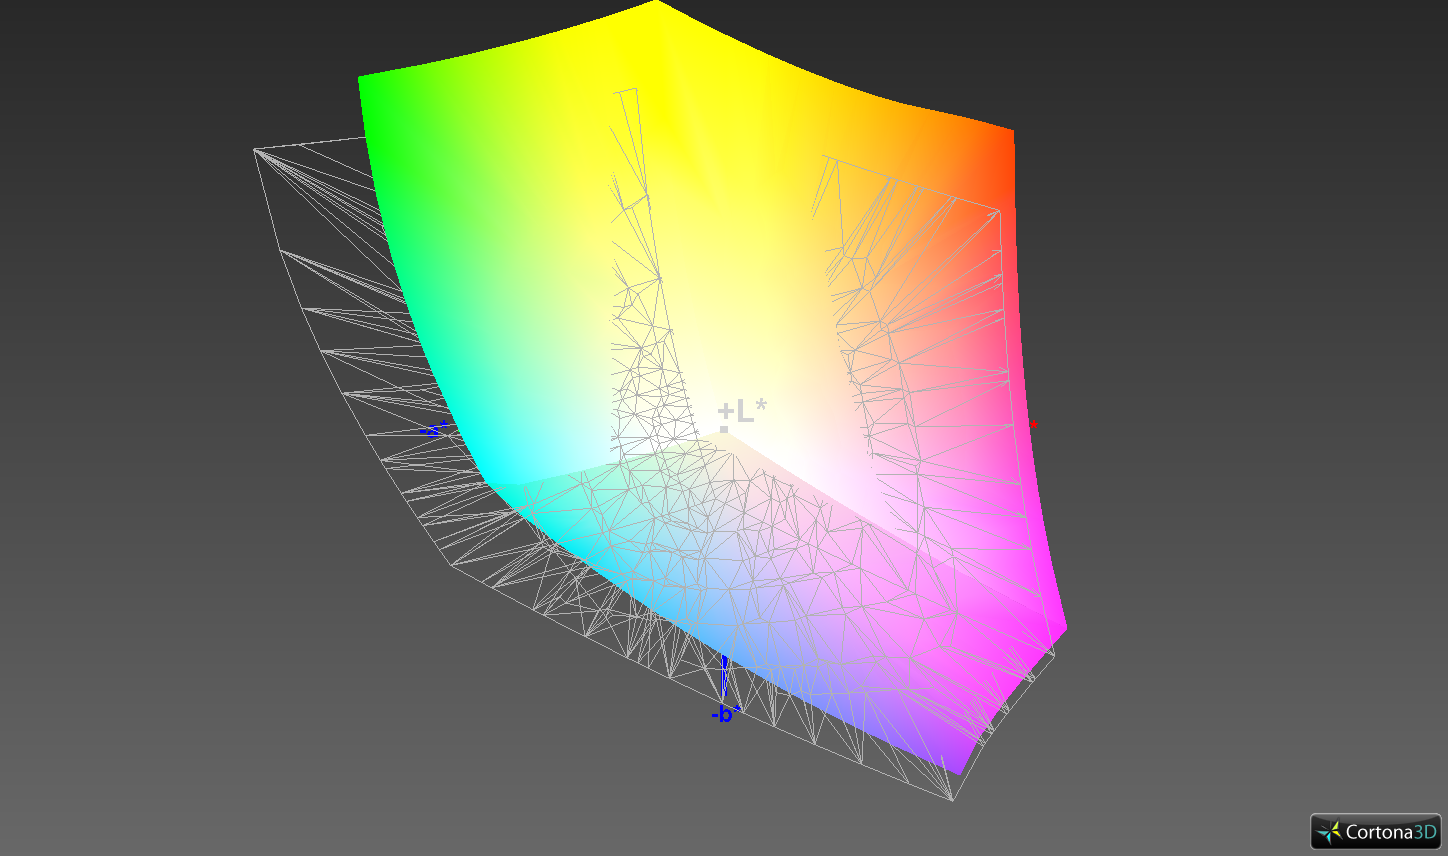
86.6% AdobeRGB 1998 (Argyll 3D)
99.9% sRGB (Argyll 3D)
98.7% Display P3 (Argyll 3D)
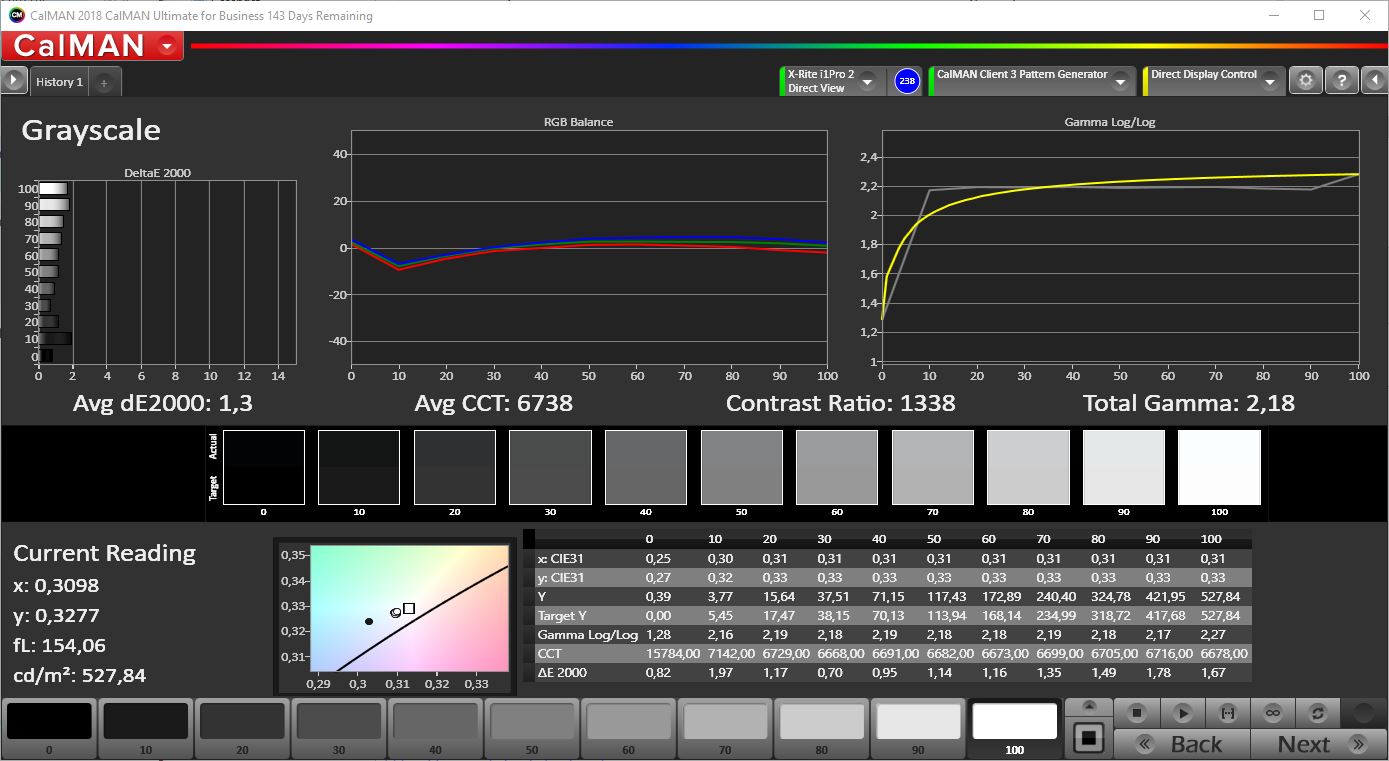
Gamma: 2.18
CCT: 6738 K
| Apple MacBook Pro 15 2018 (2.6 GHz, 560X) APPA040, , 2880x1800, 15.4" | Apple MacBook Pro 15 2017 (2.8 GHz, 555) APPA031, , 2880x1800, 15.4" | Dell XPS 15 9570 i7 UHD LQ156D1, , 3840x2160, 15.6" | Gigabyte Aero 15X v8 LGD05C0, , 1920x1080, 15.6" | Razer Blade 15 GTX 1060 LGD05C0, , 1920x1080, 15.6" | Asus ZenBook Pro 15 UX580GE AU Optronics B156ZAN03.1, , 3840x2160, 15.6" | |
|---|---|---|---|---|---|---|
| Display | -1% | -10% | -22% | -22% | 0% | |
| Display P3 Coverage (%) | 98.7 | 97.9 -1% | 79.1 -20% | 63.6 -36% | 64.4 -35% | 85.9 -13% |
| sRGB Coverage (%) | 99.9 | 99.9 0% | 98.8 -1% | 93.8 -6% | 93.4 -7% | 100 0% |
| AdobeRGB 1998 Coverage (%) | 86.6 | 85.9 -1% | 79.2 -9% | 64.9 -25% | 65.5 -24% | 99.1 14% |
| Response Times | -10% | -5% | 63% | 66% | 13% | |
| Response Time Grey 50% / Grey 80% * (ms) | 43.2 ? | 48 ? -11% | 46.4 ? -7% | 16.8 ? 61% | 13.6 ? 69% | 44 ? -2% |
| Response Time Black / White * (ms) | 31.2 ? | 33.8 ? -8% | 32 ? -3% | 11.2 ? 64% | 12 ? 62% | 22.8 ? 27% |
| PWM Frequency (Hz) | 117000 ? | 119000 ? | 980 ? | |||
| Screen | -19% | -137% | -7% | -28% | -86% | |
| Brightness middle (cd/m²) | 520 | 545 5% | 494 -5% | 313 -40% | 304.3 -41% | 357.6 -31% |
| Brightness (cd/m²) | 492 | 523 6% | 457 -7% | 300 -39% | 293 -40% | 350 -29% |
| Brightness Distribution (%) | 88 | 86 -2% | 88 0% | 78 -11% | 80 -9% | 85 -3% |
| Black Level * (cd/m²) | 0.39 | 0.44 -13% | 0.34 13% | 0.33 15% | 0.38 3% | 0.35 10% |
| Contrast (:1) | 1333 | 1239 -7% | 1453 9% | 948 -29% | 801 -40% | 1022 -23% |
| Colorchecker dE 2000 * | 1.2 | 1.6 -33% | 5.2 -333% | 1.29 -8% | 1.79 -49% | 4.12 -243% |
| Colorchecker dE 2000 max. * | 2.3 | 3.8 -65% | 17.5 -661% | 2.04 11% | 3.69 -60% | 9.91 -331% |
| Greyscale dE 2000 * | 1.3 | 1.9 -46% | 2.7 -108% | 0.69 47% | 1.1 15% | 1.8 -38% |
| Gamma | 2.18 101% | 2.26 97% | 2.1 105% | 2.43 91% | 2.27 97% | 2.17 101% |
| CCT | 6738 96% | 6834 95% | 7038 92% | 6550 99% | 6665 98% | 6613 98% |
| Color Space (Percent of AdobeRGB 1998) (%) | 71.2 | 60 | 59.8 | 87.5 | ||
| Color Space (Percent of sRGB) (%) | 98.8 | 94 | 92.8 | 100 | ||
| Colorchecker dE 2000 calibrated * | 4.23 | |||||
| Total Average (Program / Settings) | -10% /
-14% | -51% /
-87% | 11% /
0% | 5% /
-12% | -24% /
-51% |
* ... smaller is better
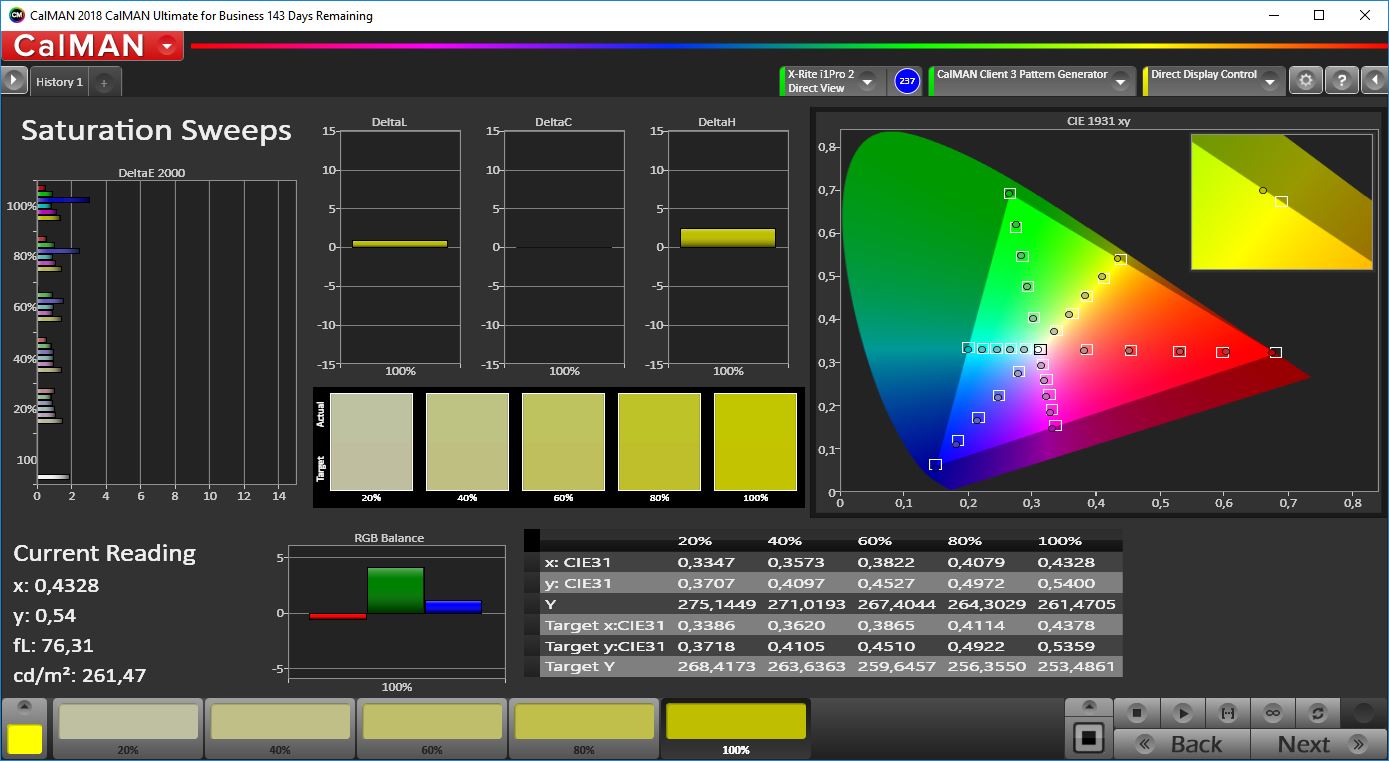
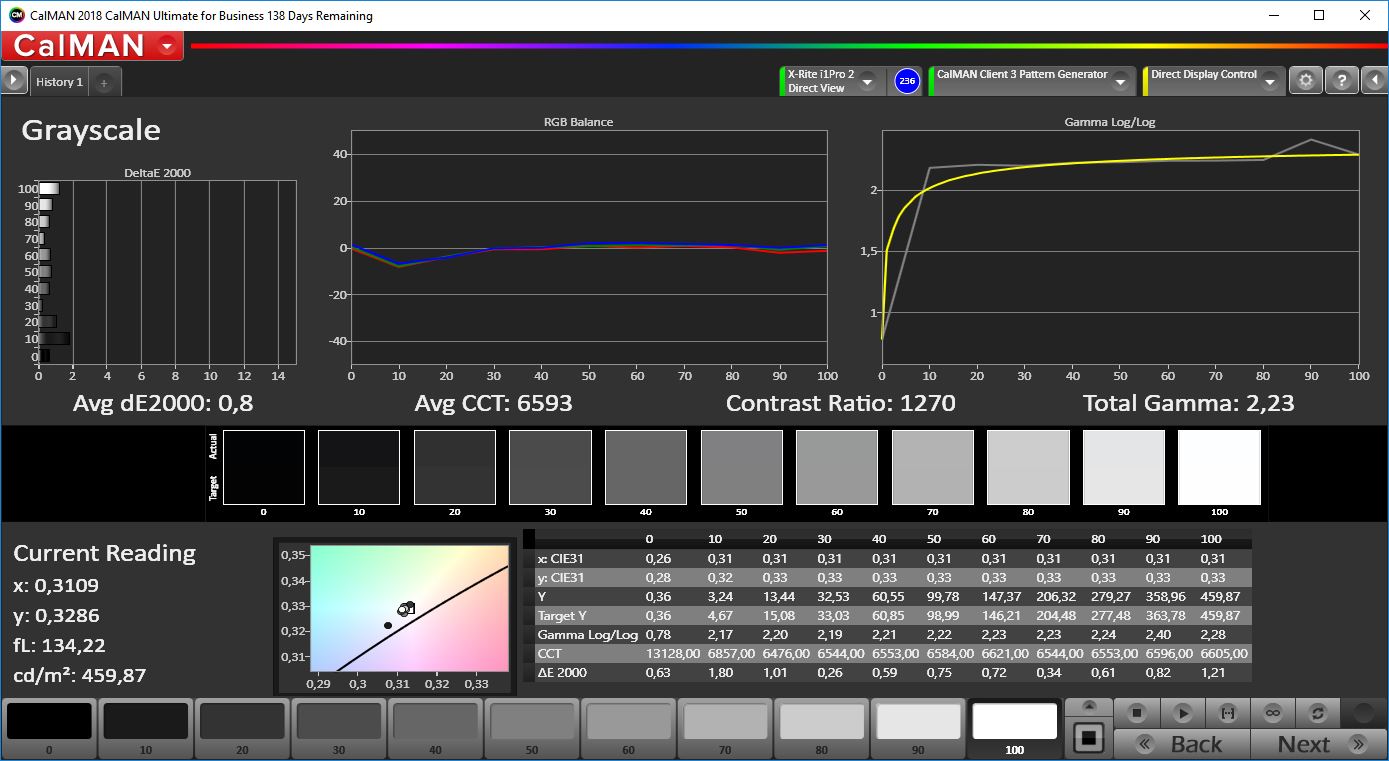
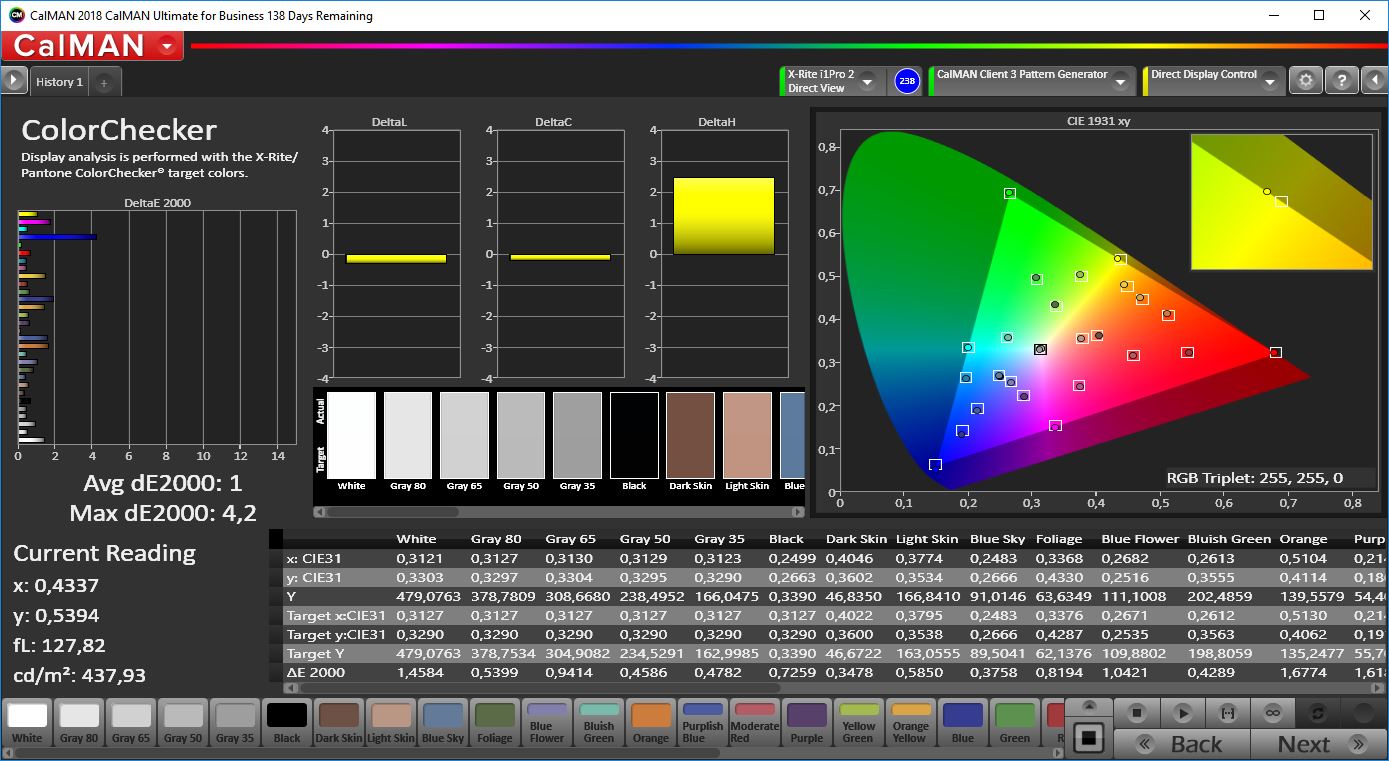
We tested the screen with our X-Rite i1 Pro2 spectrophotometer as well as the professional CalMAN software. The factory results are already very good and all the color deviations except for blue are already below the important mark of 3 (vs. P3 reference). The color temperature could be a bit better as well, but you cannot see a color cast.
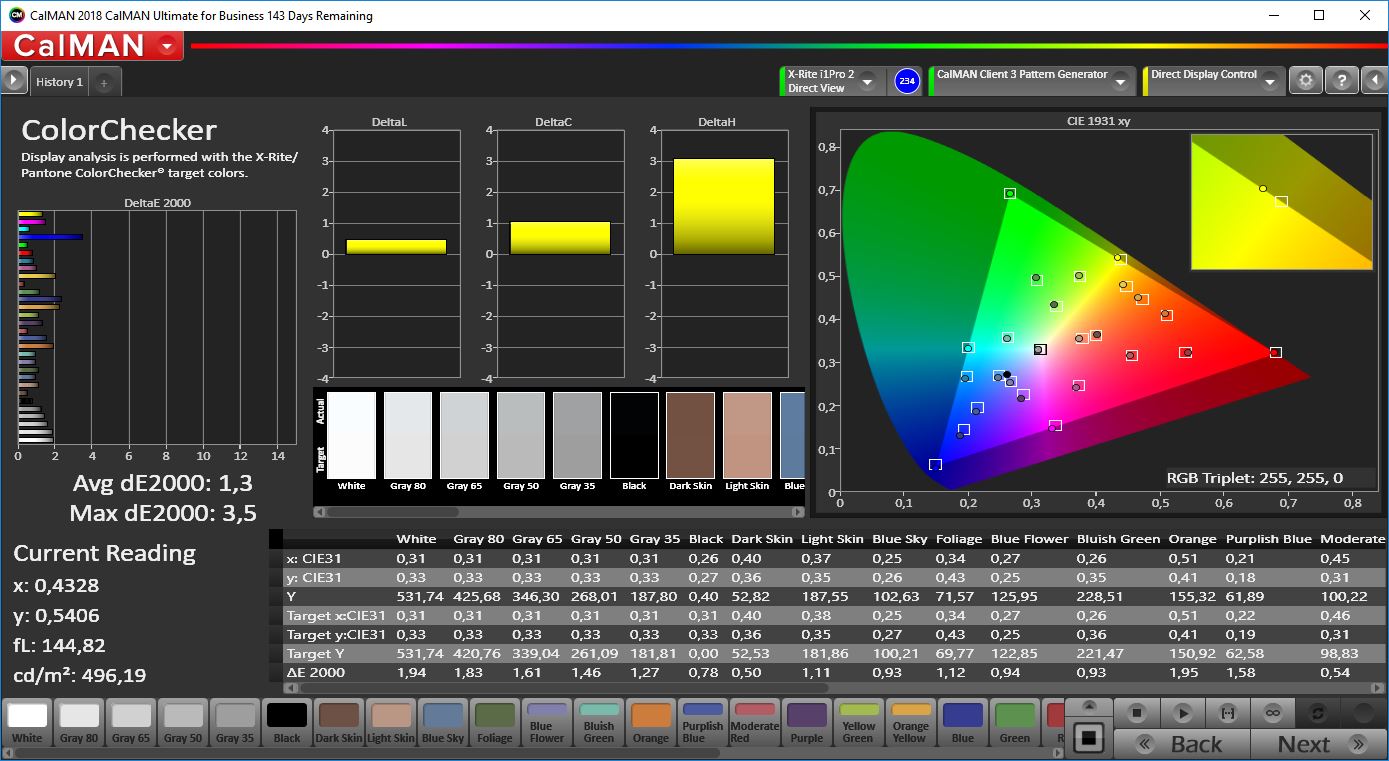
We checked and calibrated the display with our X-Rite i1 Pro 2 photospectrometer and managed to improve the majority of results. The average grayscale deviation is even lower and the slightly cool color temperature is corrected as well. We see a similar picture for the colors, where the average deviation compared to the P3 reference dropped to just 1.0, but the deviation of 100% blue is even slightly higher than before and is the only outlier above the important threshold of 3.
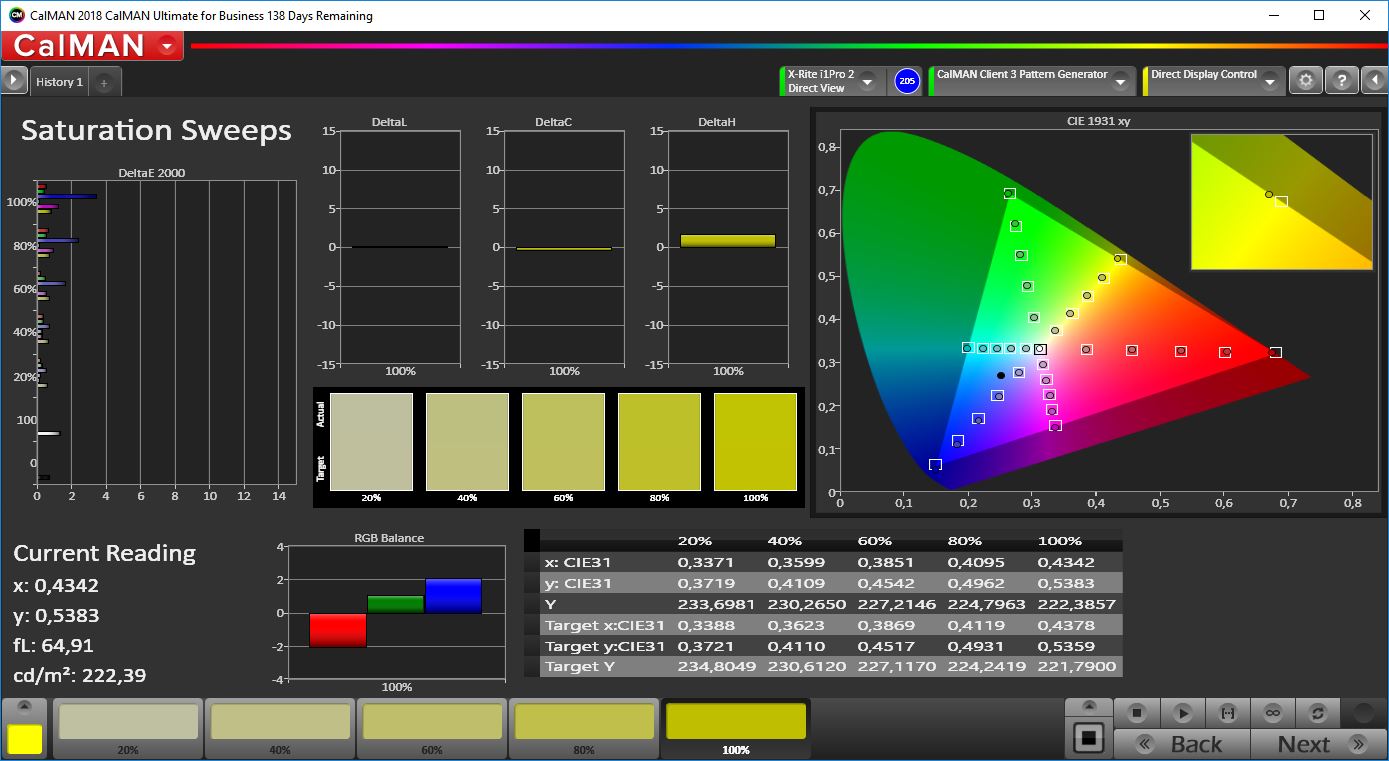
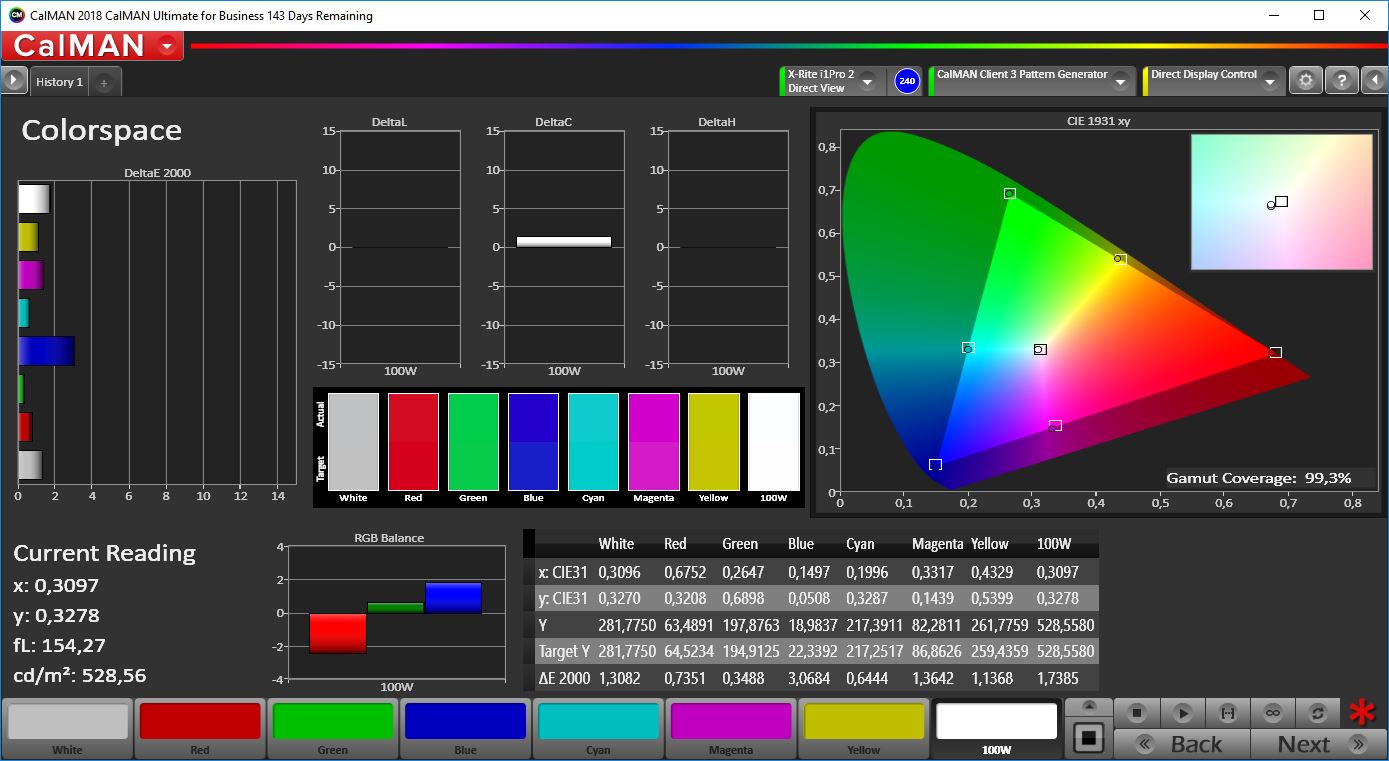
CalMAN confirms an almost full P3 coverage. We also checked the other two popular color spaces and the narrower sRGB gamut is completely covered as well. If you plan to work in the AdobeRGB reference, however, you have to use an external display.
The MacBook Pro 15 performs well outdoors. The display is glossy, but there are laptops with much more reflective panels. You can work very comfortably in the shade and the contents are still visible in bright environments. You should, however, avoid direct reflections from light sources.

Display Response Times
| ↔ Response Time Black to White | ||
|---|---|---|
| 31.2 ms ... rise ↗ and fall ↘ combined | ↗ 16.4 ms rise | 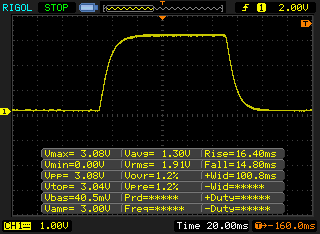 |
| ↘ 14.8 ms fall | ||
| The screen shows slow response rates in our tests and will be unsatisfactory for gamers. In comparison, all tested devices range from 0.1 (minimum) to 240 (maximum) ms. » 84 % of all devices are better. This means that the measured response time is worse than the average of all tested devices (19.8 ms). | ||
| ↔ Response Time 50% Grey to 80% Grey | ||
| 43.2 ms ... rise ↗ and fall ↘ combined | ↗ 20.4 ms rise | 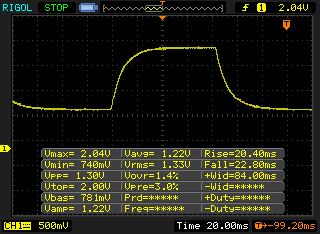 |
| ↘ 22.8 ms fall | ||
| The screen shows slow response rates in our tests and will be unsatisfactory for gamers. In comparison, all tested devices range from 0.165 (minimum) to 636 (maximum) ms. » 72 % of all devices are better. This means that the measured response time is worse than the average of all tested devices (31 ms). | ||
Performance
The MacBook Pro 15 has always been a very powerful laptop. One of the issues of the recent models was the limited amount of RAM, and especially users with virtual machines quickly will run out of 16 GB very quickly. Apple finally switches to DDR4-2400 RAM this year with an option for 32 GB. DDR4 consumes more power than LPDDR3 on the 2017 model, but Apple also slightly increased the battery capacity.
Apple replaces the Kaby Lake quad-core CPUs with hexa-core Coffee Lake chips; all three available processors are models with six cores and should provide a significant performance bump in multi-core scenarios. The dedicated GPUs are once again provided by AMD. The two models Radeon Pro 555X (now also with 4 GB VRAM) and 560X should only be slightly higher clocked versions of last year's GPUs. There is no official information on the GPUs yet, so we have to wait for our tests.
Processor
Our test model is equipped with Core i7-8850H, which is the second fastest CPU option. It is a hexa-core processor from the Coffee Lake series, which is still manufactured in a 14nm process. This is one of the issues, because the basic architecture did not change for more than 2 years, but we still get more cores and higher Boost clocks. All the hexa-cores also have a lower base frequencies compared to the old quad-cores to ensure the same 45W TDP classification. Our processor has a base frequency of 2.6 GHz, but can reach up to 4.3 GHz when you only stress one core and up to 4 GHz for all six cores (2 cores: 4.2 GHz, 4 cores: 4.1 GHz). More technical information on the Core i7-8850H is available here.
We use the benchmark Cinebench R15 for the assessment of the CPU performance since it is available for macOS and Windows 10, so we can compare the results with Windows systems. The single-core result of the new MacBook Pro 15 is okay, but the multi-core score of just 953 points is pretty low. The old MacBook Pro 2017 with the Core i7-7700HQ is beaten by almost 30%, but many rivals are faster.
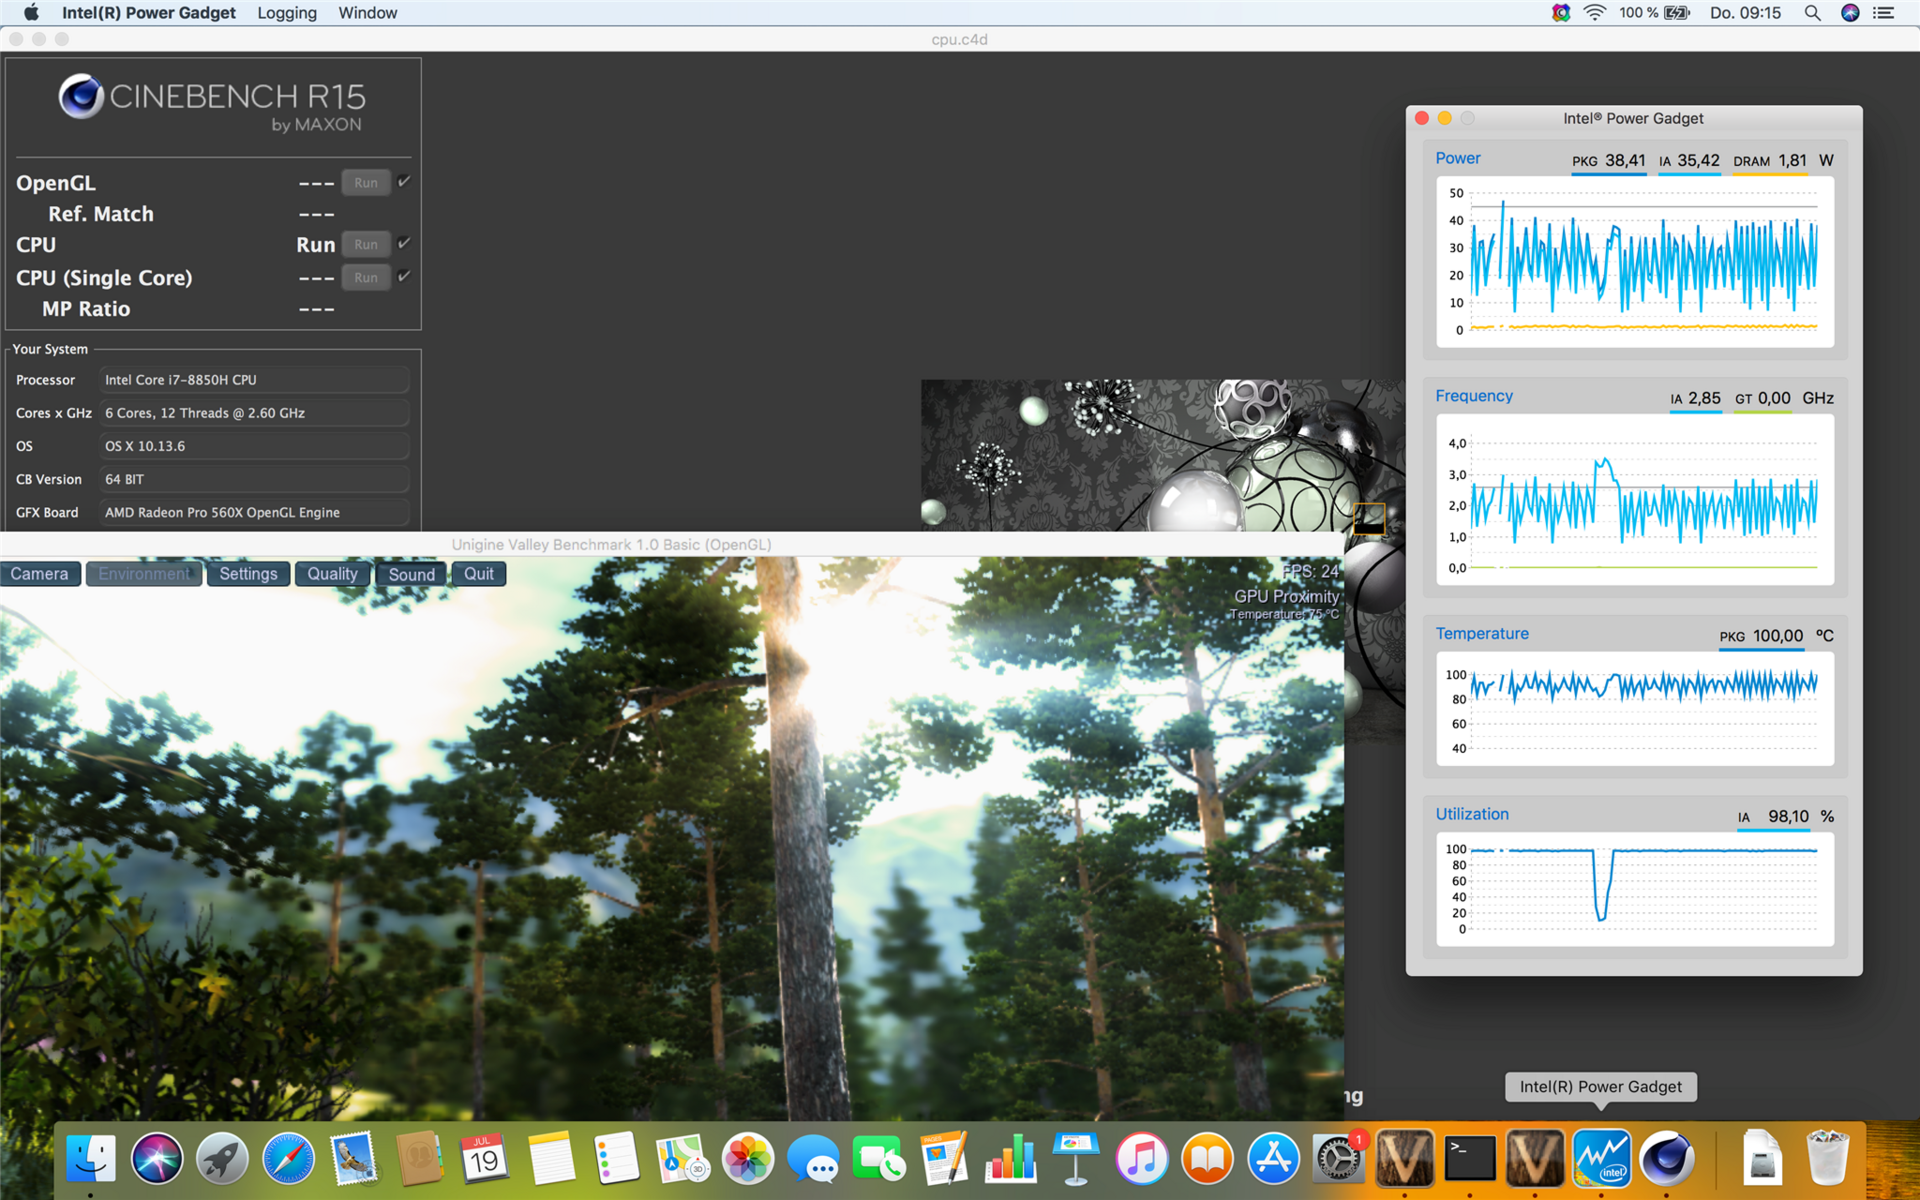
We use the tool Intel Power Gadget to observe the clock behavior of the processor. The following screenshot shows a single Cinebench R15 Multi run, which takes about 35 seconds. The processor starts with the full 4.0 GHz on all cores for about 1 second, which immediately results in a CPU temperature of 100 °C. We can see a clock reduction as a result and it starts to fluctuate between 1.8 - 3.5 GHz and the base frequency cannot always be maintained. This is also a result of Apple's philosophy to use all the possible performance until a certain temperature limit is reached (100 °C), before the clock has to be reduced again.
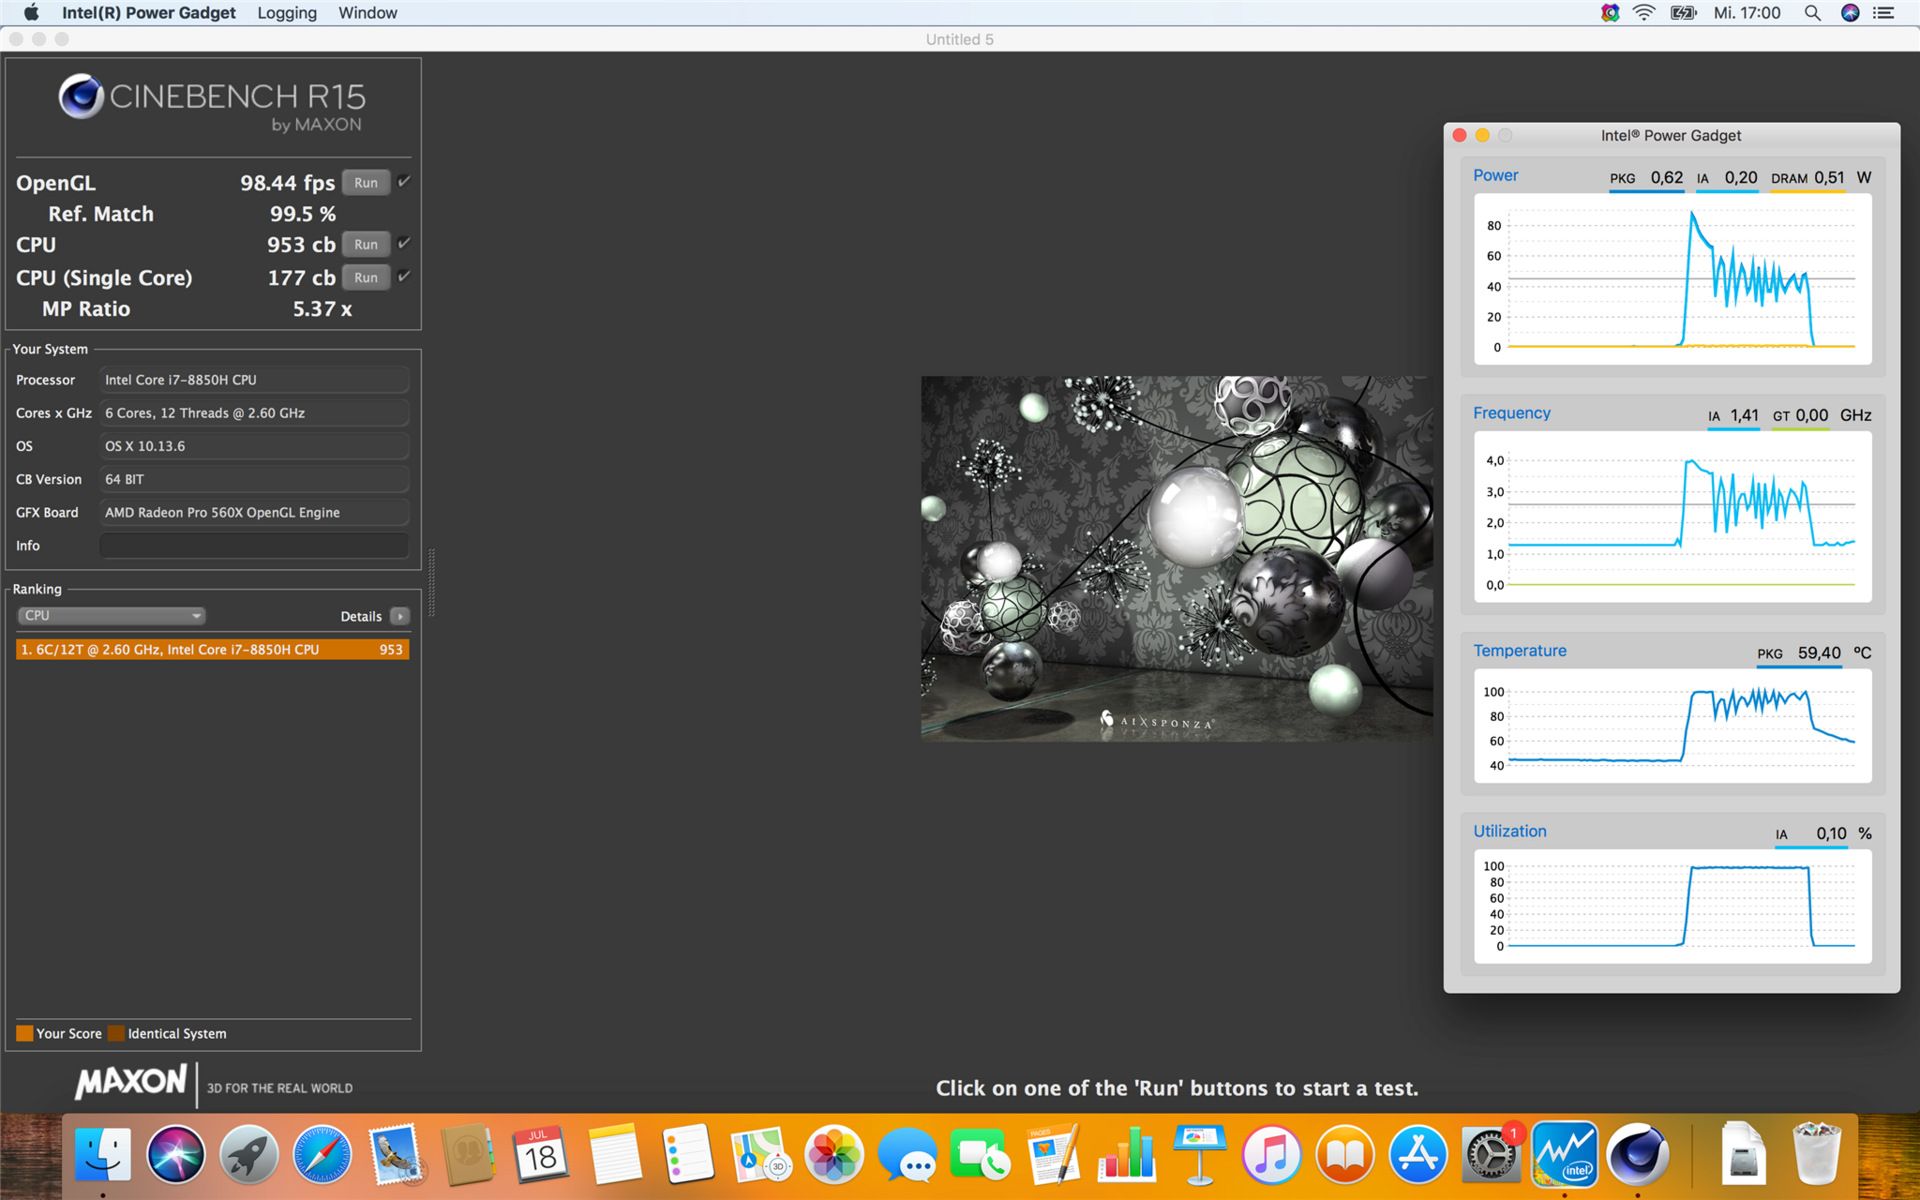
We know this behavior from almost every laptop, but many manufacturers decide to limit the CPU consumption to a certain level of 45 Watts, for example. The situation is a bit more problematic in our Cinebench loop, which is displays by the red curve in the diagram below. The second run already scores less points and it will eventually level off at around 820-830 points. If you compare the average scores, the new model is just 13% ahead of last year's entry-level MBP 15. The comparison with the current XPS 15 9570 is even more problematic (for Apple), because the model with the quad-core i5-8300H is basically on par except for the first run. Dell's XPS 15 9570 with the Core i7-8750H is even faster after 50 runs compared to the best result of the MacBook Pro.
We also repeated the Cinebench loop in Windows 10 and the average score is a bit better at 845 points, but still comparatively low. The details about the clock, consumption, and temperatures are more interesting though. The test runs for 42 minutes and we see an average clock of about 2.7 GHz for all 6 cores, which is slightly above the base frequency. The other two values are more interesting, because the average core temperature (CPU cores) is more than 90 °C, with a consumption of 37.5 Watts. This means there is still a gap to the specified 45 Watts.
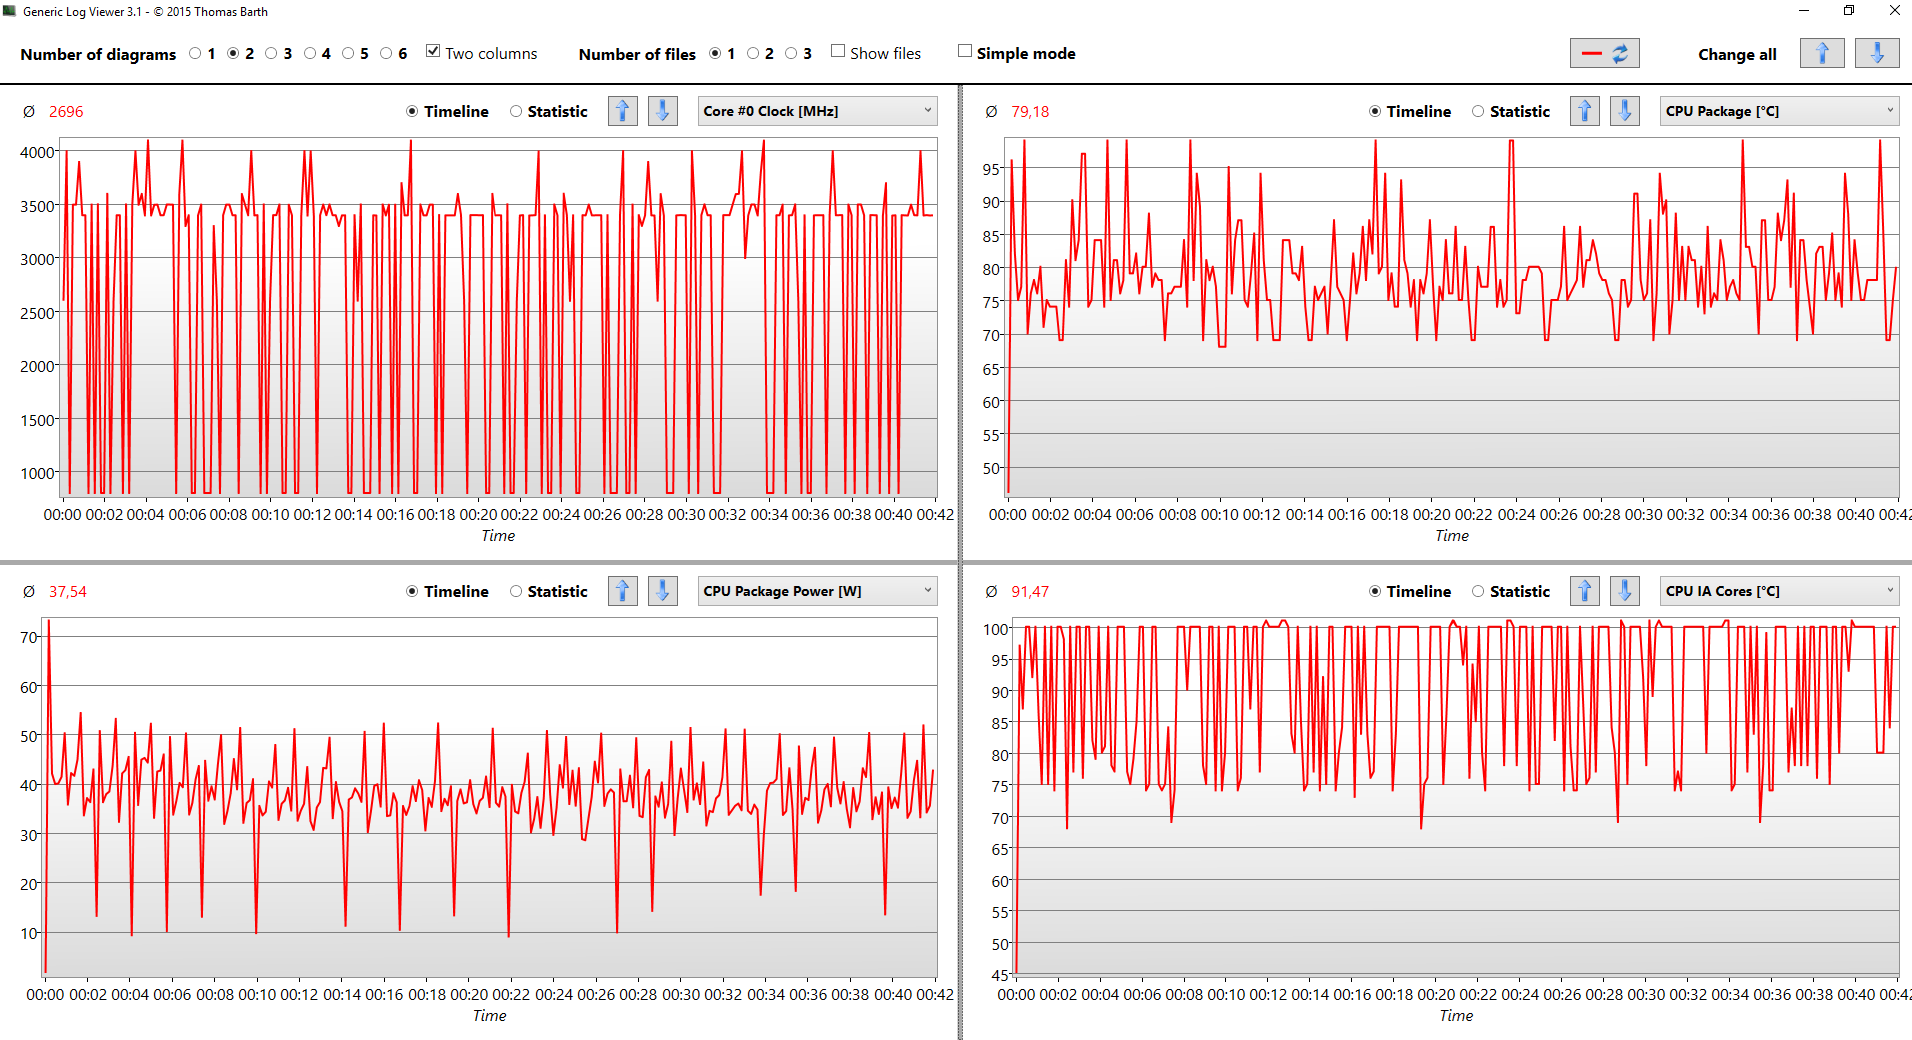
Apple's cooling solution is definitely not powerful enough to cool the processor at the specified 45 Watts, even when the discreet GPU is not running. It might have been better to enforce stricter TDP limits to avoid high temperatures at high clocks. Another problem is Intel's chip itself, because a consumption of almost 90 Watts when all cores run at the maximum is almost impossible to handle by a thin laptop because the TDP is just doubled. The chip manufacturer has to come up with something new soon, because it seems the architecture is at its limit (even though the high clocks are good for the marketing department).
Apple's software update stabilized the performance and we get multi-core results comparable to the current XPS 15. However, we still encountered a performance drop after a while, which was fixed by the second major software update.
Update 07/16/2020: After updating to the latest MacOS version 10.15.5 "Catalina" we repeated our Cinebench R15 loop on the MacBook. The results now oscillate in the range between the factory setting and the software update at the time of testing. The MacBook Pro 15 now stays about 10% below the top scores at that time.
CPU Tuning
Similar to the smaller sibling we tested the 15-inch model with other TDP settings to improve the performance. We limited the power consumption of the CPU to 45 W both in macOS (Volta) as well as Windows 10. The detailed results for the two 2018 MacBook Pro model are available in our dedicated article.
The diagrams clearly show that the CPU now maintains its clock and is about 20% faster on average. We also tried to improve the consumption in Windows (not possible in macOS), but it was not successful. Once we increase the short-term value, it can only be used for a short time since the temperature is immediately spiking. This results in fluctuations, so even the first Cinebench score is worse compared to the fixed 45 W test. An increase of the long-term value did not work, either, because the fluctuations started at 46 W. The cooling solution is right at the edge with the 45 W setting, at least on our test unit. This value can differ slightly (in both directions) depending on the processor.
One benchmark where the fixed TDP results in a lower score is Geekbench 4. The MacBook Pro 15 scores 22633 points in the CPU Multi test with the default settings, but only 19869 points with the 45 W limit. A look at the CPU utilization during the benchmark shows that the peak load is very short (only up to 1 second). The fans are not even spinning up for this load and the chip temperature only surpasses 80 °C a few times during the three-minute benchmark. The benchmark therefore benefits from the high Turbo clock, but does not test the cooling capabilities of the machine by any means.
System Performance
Thanks to the hexa-core processor, the dedicated graphics card and the fast PCIe-SSD storage in particular, the current MacBook Pro 15 is subjectively a very powerful and responsive system, which executes inputs without any noteworthy delays. The installation of Windows 10 was no problem, either. A Windows image file on your laptop is all you need, a USB drive is not necessary anymore. Our installation worked well and we did not notice any bugs when we ran apps. AS SSD is the only exception, but this was also the case for previous models of the MBP.
The synthetic benchmark scores are a bit lower than expected. The new model falls behind the two previous generations in the older PCMark 8, for instance, which has to be related to missing driver optimizations by Apple. Our MBP 15 2018 beats the 2017 model in the newer PCMark 10 and is average within the comparison group.
| PCMark 8 Home Score Accelerated v2 | 3735 points | |
| PCMark 8 Creative Score Accelerated v2 | 3836 points | |
| PCMark 8 Work Score Accelerated v2 | 4575 points | |
| PCMark 10 Score | 4805 points | |
Help | ||
Storage Devices

The PCIe-SSD in our MacBook Pro 15 2018 has the designation AP0512 and offers a storage capacity of 512 GB. Depending on the benchmark, we sequential read transfer rates between 2.5 and 3 GB/s or 1.5-1.7 GB/s write, respectively. You should not be scared off by the low 4K values in the Windows benchmarks, because we know this phenomenon from the previous models. The AS SSD benchmark does not finish properly, either, so this should be an issue with the BootCamp drivers.
Apple uses proprietary SSD modules for the MacBook Pro and the controller for the SSD is now integrated into Apple's own T2 chip. The latter also handles storage encryption and does not need CPU resources, so there is no performance deficit.

GPU Performance
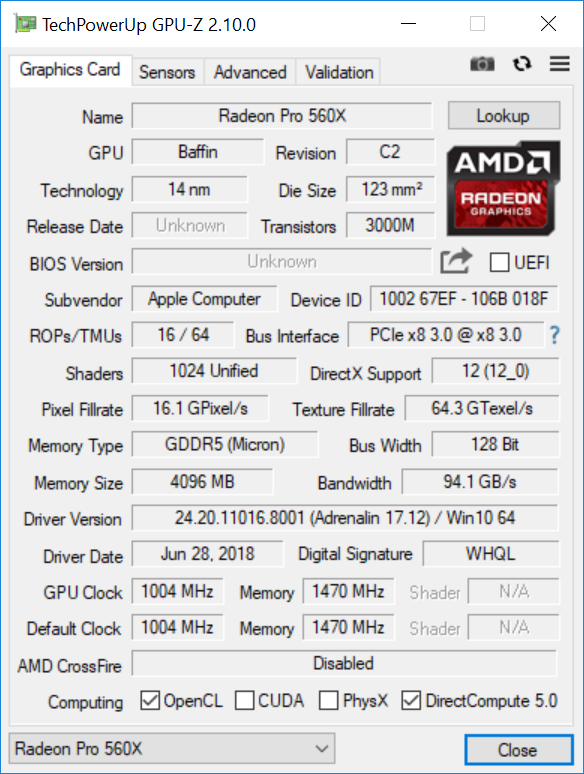
The Radeon Pro 560X is not a new graphics card, but a faster version of the Radeon Pro 560. The comparison of the two GPU-Z screenshots shows another revision of the Baffin GPU and especially higher clocks for the core as well as the memory. The basic memory equipment with 4 GB GDDR5-VRAM, however, did not change. The MBP 15 with the Radeon Pro 560X is faster in the synthetic benchmarks compared to previous generations, but still not as powerful as the competition equipped with the GeForce GTX 1050 or the GTX 1050 Ti.
However, the performance is – similar to the CPU – not steady. We performed the 3DMark Fire Strike stress test, which should not be a huge challenge (Time Spy stress test is more demanding), but the MacBook Pro 15 already fails here and there are fluctuations. The final result is 82.6 %, so the test is not passed.
| 3DMark 11 Performance | 7910 points | |
| 3DMark Cloud Gate Standard Score | 18251 points | |
| 3DMark Fire Strike Score | 4961 points | |
| 3DMark Time Spy Score | 1775 points | |
Help | ||
Gaming Performance
Even the Radeon Pro 560X does not transform the MacBook Pro 15 into a gaming laptop. In contrast to heavy CPU loads, however, the GPU performance (e. g. Witcher 3) can be maintained for longer periods (see diagram).
| The Witcher 3 - 1920x1080 Ultra Graphics & Postprocessing (HBAO+) | |
| Schenker XMG Neo 15 | |
| Razer Blade 15 GTX 1060 | |
| Dell XPS 15 9570 i7 UHD | |
| Apple MacBook Pro 15 2018 (2.6 GHz, 560X) | |
| Apple MacBook Pro 15 2017 (2.8 GHz, 555) | |
| low | med. | high | ultra | QHD | 4K | |
|---|---|---|---|---|---|---|
| Counter-Strike: GO (2012) | 79 | 51 | 27.6 | |||
| BioShock Infinite (2013) | 48.8 | |||||
| GTA V (2015) | 157 | 44.9 | 22 | 13.3 | ||
| The Witcher 3 (2015) | 96 | 55.1 | 34 | 19.7 | ||
| Dota 2 Reborn (2015) | 85.3 | 94.6 | 71 | 68.7 | ||
| World of Warships (2015) | 67.3 | 22 | ||||
| Rainbow Six Siege (2015) | 180 | 76.4 | 62.9 | 17.4 | ||
| Rise of the Tomb Raider (2016) | 30.5 | 24.3 | ||||
| The Division (2016) | 33.7 | |||||
| Overwatch (2016) | 235 | 165 | 91 | 45.1 | ||
| Deus Ex Mankind Divided (2016) | 61.8 | 27.9 | 13.1 | |||
| Battlefield 1 (2016) | 134 | 39.2 | 35.6 | 15.2 | ||
| Civilization 6 (2016) | 39.4 | 29.4 | ||||
| Farming Simulator 17 (2016) | 26.9 | |||||
| Call of Duty Infinite Warfare (2016) | 48.3 | |||||
| For Honor (2017) | 114 | 72 | 41.4 | 31.2 | ||
| Ghost Recon Wildlands (2017) | 69 | 32.5 | 29.7 | 13.3 | ||
| Rocket League (2017) | 69.8 | 25.9 | ||||
| Team Fortress 2 (2017) | 171 | 175 | 165 | 139 | 47.3 | |
| Playerunknown's Battlegrounds (PUBG) (2017) | 40 | |||||
| Middle-earth: Shadow of War (2017) | 98 | 41 | 29 | 21 | 9 | |
| Need for Speed Payback (2017) | 38.8 | |||||
| Star Wars Battlefront 2 (2017) | 112 | 42 | 37.7 | 30.3 | 3.4 | |
| Fortnite (2018) | 149 | 66 | 40 | 31.9 | ||
| Final Fantasy XV Benchmark (2018) | 44.4 | 23.6 | 14.3 | 5.8 | ||
| Kingdom Come: Deliverance (2018) | 81 | 27.6 | 25.5 | 19 | ||
| X-Plane 11.11 (2018) | 63.7 | 47.7 | 42.1 | 21.4 | ||
| World of Tanks enCore (2018) | 453 | 108 | 37.4 | 23.8 | 11.6 | |
| Far Cry 5 (2018) | 74 | 37 | 33 | 31 | 10 | |
| The Crew 2 (2018) | 59.9 | 38.8 | 38.3 | 35 | 10.3 | |
| Monster Hunter World (2018) | 78 | 30 | 27.8 | 19.6 | ||
| F1 2018 (2018) | 99 | 57 | 47 | 30 | 12 | |
| Shadow of the Tomb Raider (2018) | 81 | 31 | 27 | 23 | 6 | |
| FIFA 19 (2018) | 119 | 38.8 | ||||
| Forza Horizon 4 (2018) | 102 | 53 | 50 | 36 | ||
| Assassin´s Creed Odyssey (2018) | 50 | 31 | 25 | 14 | ||
| Call of Duty Black Ops 4 (2018) | 48.7 | 43.5 | 40.4 | |||
| Hitman 2 (2018) | 34.4 | 30.9 | 9.2 | |||
| Fallout 76 (2018) | 33.1 | 31.4 | ||||
| Battlefield V (2018) | 95 | 43.3 | 36.2 | 32.5 | ||
| Farming Simulator 19 (2018) | 47.7 | 23.5 | ||||
| Darksiders III (2018) | 144 | 39 | 29.8 | 25.4 | 7.8 | |
| Just Cause 4 (2018) | 37.8 | 28.9 | 27.3 | |||
| Apex Legends (2019) | 97 | 40.8 | 33.9 | 32.8 | ||
| Far Cry New Dawn (2019) | 71 | 36 | 31 | 27 | 9 | |
| Metro Exodus (2019) | 50.5 | 26.2 | 17 | 14.2 | 11 | 6.5 |
| Anthem (2019) | 60 | 34.8 | 28.8 | 26.6 | ||
| Dirt Rally 2.0 (2019) | 135 | 53.5 | 44.9 | 23.2 | ||
| The Division 2 (2019) | 104 | 41 | 30 | |||
| Anno 1800 (2019) | 92 | 39 | 20.8 | 10.7 | ||
| Rage 2 (2019) | 65.4 | 18.8 | ||||
| Total War: Three Kingdoms (2019) | 105 | 30.2 | 19.1 | 13.6 | ||
| League of Legends (2019) | 209 | 202 | 179 | 174 | 152 | |
| F1 2019 (2019) | 120 | 55.5 | 50.7 | 30.8 | 22.4 | |
| Control (2019) | 56.5 | 21.6 | 15.2 | |||
| Borderlands 3 (2019) | 78 | 33.6 | 20.8 | 15.8 | 10.8 | 3.1 |
| FIFA 20 (2019) | 99 | 77 | 45.3 | |||
| Ghost Recon Breakpoint (2019) | 51 | 29 | 25 | 18 | ||
| GRID 2019 (2019) | 94 | 43.4 | 33.5 | 20.5 | ||
| Call of Duty Modern Warfare 2019 (2019) | 61 | 39 | 30.1 | 22.1 | ||
| Need for Speed Heat (2019) | 62 | 33.5 | 29.1 | 23.4 | 15.9 | |
| Star Wars Jedi Fallen Order (2019) | 35.5 | 28.5 | 24.7 | 15.5 | ||
| Red Dead Redemption 2 (2019) | 61 | 30.4 | 19 | 0 | ||
| Hearthstone (2020) | 58.3 | |||||
| Escape from Tarkov (2020) | 87.8 | 37.2 | 33.5 | 16.3 | ||
| Hunt Showdown (2020) | 71 | 23.7 | 20.6 | |||
| Doom Eternal (2020) | 90.4 | 46.1 | 29.4 | 25.9 | 18.6 |
Emissions
System Noise
The MacBook Pro 15 is once again a quiet device, even with the hexa-core processor. The fans are always active, but they are only rotating at 2160/2000 rpm while idling, which is barely audible at 30 dB(A). You can hear this in very quiet environments with a distance of less than a meter, but the murmur is subjectively not unpleasant. The two fans can hit up to 5927/6489 rpm under load at up to 47 dB(A), but this is rare. We only measure 33.9 dB(A) in our Cinebench run, and 39 dB(A) in Fortnite (macOS). We determine 36.8 dB(A) in Windows with FurMark, Prime, and even our 3DMark 06 loop, but the noise drops over time. All in all, the MacBook Pro is still a very quiet laptop.
Noise level
| Idle |
| 30.1 / 30.1 / 30.1 dB(A) |
| HDD |
| 30.1 dB(A) |
| Load |
| 46.8 / 46.8 dB(A) |
 | ||
30 dB silent 40 dB(A) audible 50 dB(A) loud |
||
min: | ||
Temperature
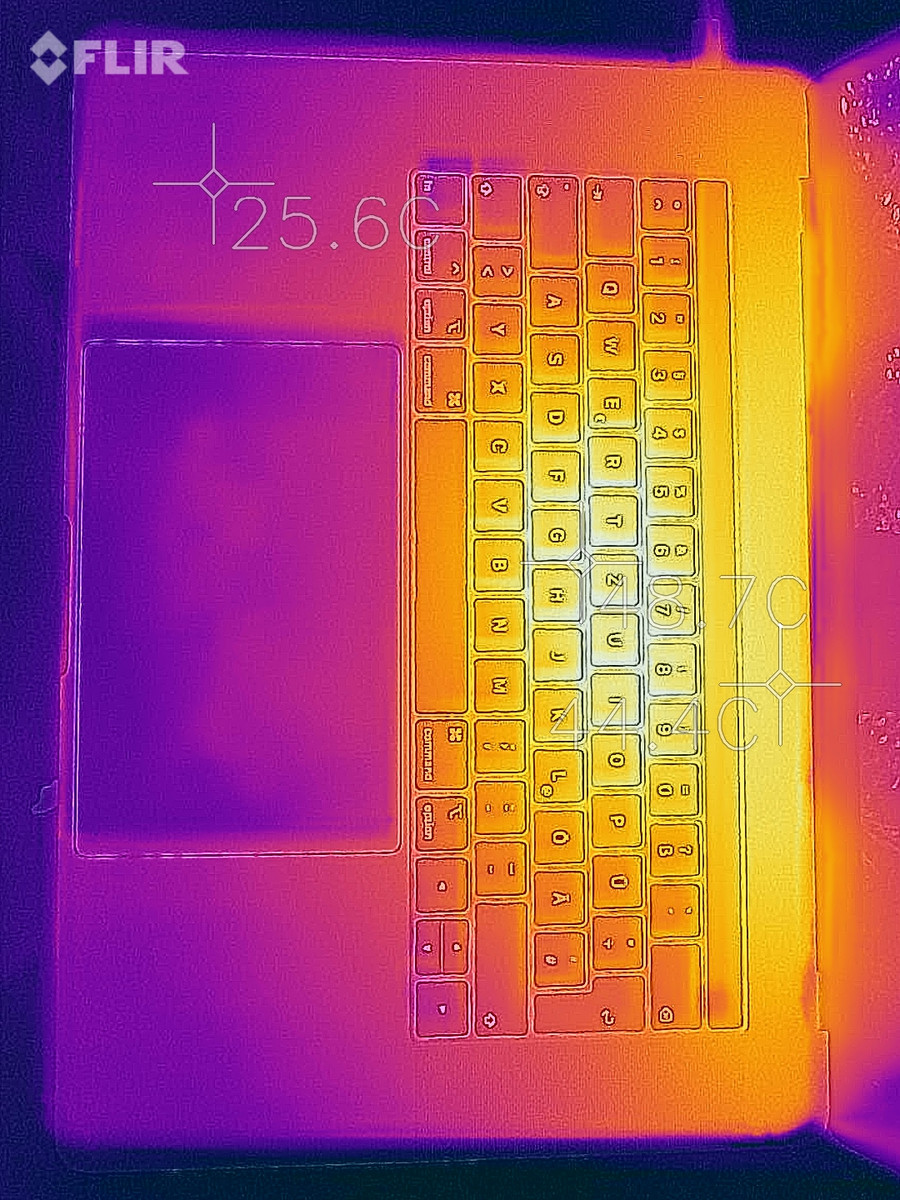
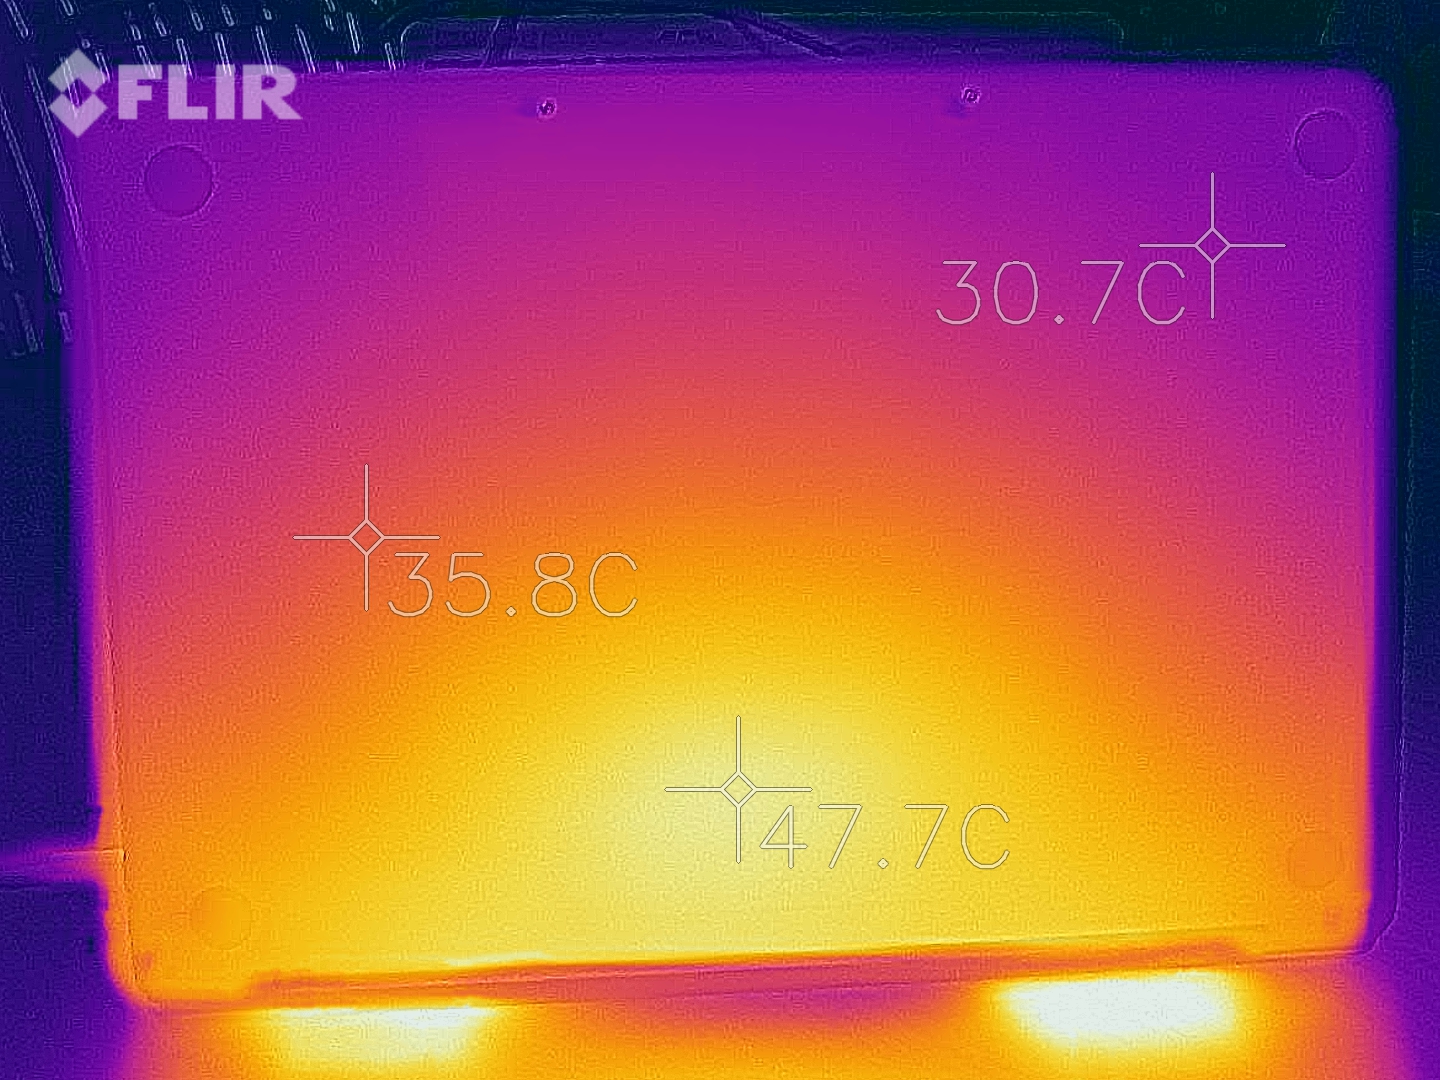
As expected, there are no temperature issues or hot spots while idling and with light workloads, but this changes under load. BootCamp was a not immediately available for the 2018 MacBooks, so we performed the stress test with macOS and the tools Cinebench R15 Multi and Unigine Valley. The MacBook gets pretty warm and the hot spot is in the center of the base unit towards the rear, where the two processors are located. This also warms up the surrounding sections including the keyboard. The temperatures are not critical, but this changes when we look at the PSU. More than 57 °C is too warm and indicates that it cannot handle the power consumption of the MacBook Pro 15.
The processor also runs quite hot and is close to 100 °C all the time. However, the cooling solution cannot maintain the specified 45 Watts for the processor and the CPU cannot maintain its base frequency of 2.6 GHz for most of the time. The graphics card is a bit cooler at 75 °C, but does not deliver the full performance, either. The Unigine Valley score is about 10% lower. We will add the exact information for the CPU/GPU when we repeat the stress test with Windows 10.
(-) The maximum temperature on the upper side is 45.7 °C / 114 F, compared to the average of 36.8 °C / 98 F, ranging from 21 to 71 °C for the class Multimedia.
(±) The bottom heats up to a maximum of 41.7 °C / 107 F, compared to the average of 39.1 °C / 102 F
(+) In idle usage, the average temperature for the upper side is 25.7 °C / 78 F, compared to the device average of 31.3 °C / 88 F.
(±) Playing The Witcher 3, the average temperature for the upper side is 37.7 °C / 100 F, compared to the device average of 31.3 °C / 88 F.
(+) The palmrests and touchpad are reaching skin temperature as a maximum (32.7 °C / 90.9 F) and are therefore not hot.
(-) The average temperature of the palmrest area of similar devices was 28.7 °C / 83.7 F (-4 °C / -7.2 F).
Speakers

The speakers of the 2018 MacBook Pro models are also revised. A direct comparison shows a slightly more linear frequency diagram for the new models and the subjective impression confirms the results compared to the already good 2017 model. Apple is still the benchmarks for notebooks in this respect, especially when you consider the height of the base unit.
Apple MacBook Pro 15 2018 (2.6 GHz, 560X) audio analysis
(+) | speakers can play relatively loud (85 dB)
Bass 100 - 315 Hz
(+) | good bass - only 4.7% away from median
(±) | linearity of bass is average (8.3% delta to prev. frequency)
Mids 400 - 2000 Hz
(+) | balanced mids - only 1.8% away from median
(+) | mids are linear (3.5% delta to prev. frequency)
Highs 2 - 16 kHz
(+) | balanced highs - only 2.6% away from median
(+) | highs are linear (5.7% delta to prev. frequency)
Overall 100 - 16.000 Hz
(+) | overall sound is linear (6.4% difference to median)
Compared to same class
» 4% of all tested devices in this class were better, 1% similar, 95% worse
» The best had a delta of 5%, average was 17%, worst was 45%
Compared to all devices tested
» 1% of all tested devices were better, 0% similar, 99% worse
» The best had a delta of 4%, average was 23%, worst was 134%
Apple MacBook Pro 15 2017 (2.8 GHz, 555) audio analysis
(+) | speakers can play relatively loud (87 dB)
Bass 100 - 315 Hz
(±) | reduced bass - on average 8.7% lower than median
(±) | linearity of bass is average (11.1% delta to prev. frequency)
Mids 400 - 2000 Hz
(+) | balanced mids - only 2.5% away from median
(±) | linearity of mids is average (7.5% delta to prev. frequency)
Highs 2 - 16 kHz
(+) | balanced highs - only 1.7% away from median
(+) | highs are linear (5% delta to prev. frequency)
Overall 100 - 16.000 Hz
(+) | overall sound is linear (7.9% difference to median)
Compared to same class
» 7% of all tested devices in this class were better, 2% similar, 91% worse
» The best had a delta of 5%, average was 17%, worst was 45%
Compared to all devices tested
» 2% of all tested devices were better, 1% similar, 98% worse
» The best had a delta of 4%, average was 23%, worst was 134%
Energy Management
Power Consumption
Apple managed to reduce the power consumption while idling and during light workloads compared to last year's model, while the MacBook Pro 13 is obviously more efficient thanks to its smaller display. Dell's XPS 15 with the UHD panel is not as efficient as the MacBook Pro 15, either.
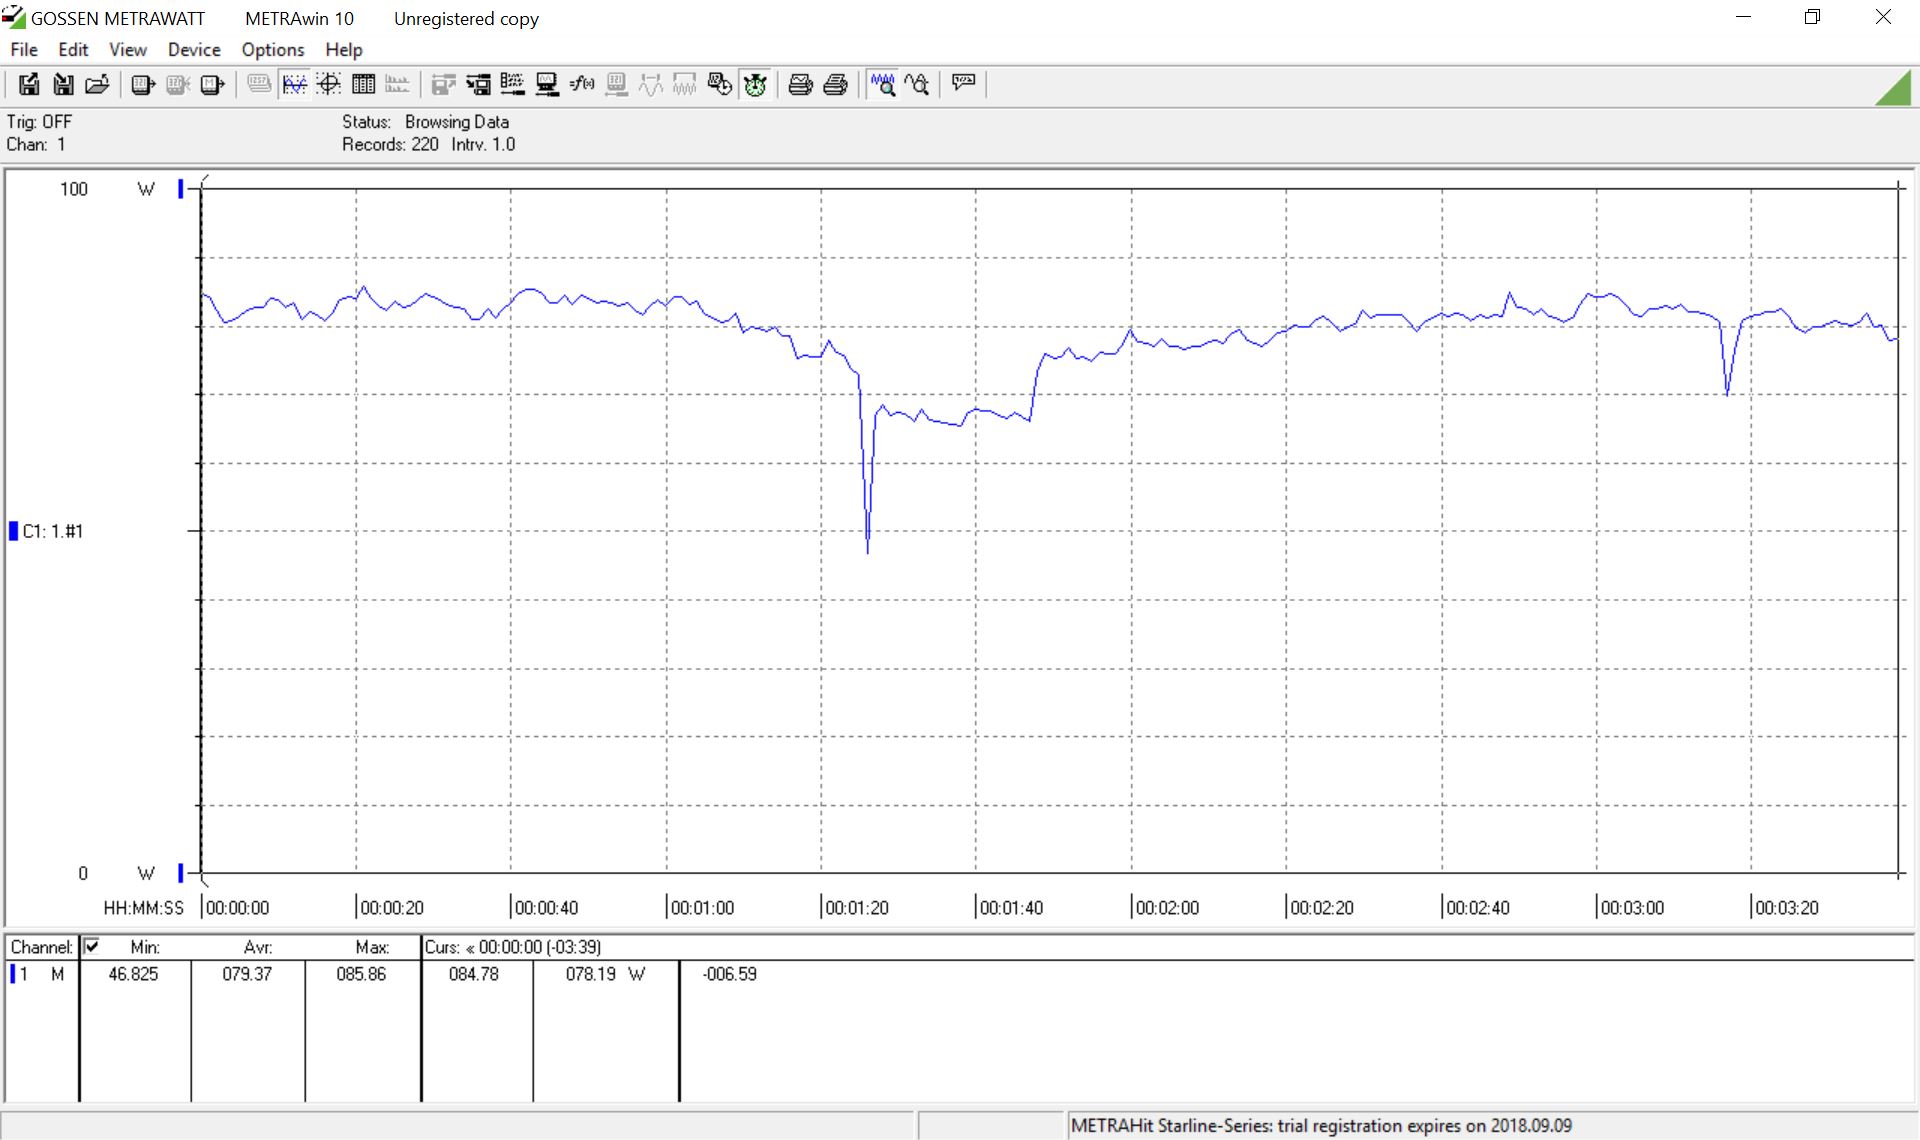
The more powerful processor is definitely noticeable under load and we are even reaching the limitations of the 87 W power adapter during our stress test (see screenshot), where the consumption fluctuates between 48-91 W and even the battery is slightly drained. This means the power adapter prevents better performance if you stress the processor and the graphics card at the same time. You should keep in mind that Windows (Bootcamp) only uses the dedicated Radeon GPU, which obviously affects the power consumption.


| Off / Standby | |
| Idle | |
| Load |
|
Key:
min: | |
| Apple MacBook Pro 15 2018 (2.6 GHz, 560X) i7-8850H, Radeon Pro 560X, Apple SSD AP0512, IPS, 2880x1800, 15.4" | Apple MacBook Pro 13 2018 Touchbar i5 i5-8259U, Iris Plus Graphics 655, , IPS, 2560x1600, 13.3" | Apple MacBook Pro 15 2017 (2.9 GHz, 560) i7-7820HQ, Radeon Pro 560, , , 2880x1800, 15.4" | Apple MacBook Pro 15 2017 (2.8 GHz, 555) i7-7700HQ, Radeon Pro 555, Apple SSD SM0256L, IPS, 2880x1800, 15.4" | Dell XPS 15 9570 i7 UHD i7-8750H, GeForce GTX 1050 Ti Max-Q, Toshiba XG5 KXG50ZNV512G, IPS, 3840x2160, 15.6" | Average of class Multimedia | |
|---|---|---|---|---|---|---|
| Power Consumption | 27% | -10% | -6% | -60% | -10% | |
| Idle Minimum * (Watt) | 3.4 | 2.3 32% | 3.7 -9% | 3.4 -0% | 9.48 -179% | 5.66 ? -66% |
| Idle Average * (Watt) | 11 | 8.7 21% | 16.2 -47% | 13.9 -26% | 16.1 -46% | 10.2 ? 7% |
| Idle Maximum * (Watt) | 14.9 | 12.2 18% | 18 -21% | 17.6 -18% | 16.9 -13% | 12.5 ? 16% |
| Load Average * (Watt) | 78.9 | 53.3 32% | 58.4 26% | 71.1 10% | 90.8 -15% | 65.2 ? 17% |
| Load Maximum * (Watt) | 91.2 | 64 30% | 89.6 2% | 88.5 3% | 134.4 -47% | 113.5 ? -24% |
| Witcher 3 ultra * (Watt) | 57.9 |
* ... smaller is better
Battery Runtime
Apple increased the battery capacity slightly compared to last year, and you now get a 83 instead of 76 Wh model. The runtime estimate from the manufacturer did not change though. The WLAN test (MacOS) lasts for 10 hours, but the old model even managed 30 minutes more. The Dell XPS 15 9570 with the UHD screen is just beaten by the MBP 15, only the 1080p model lasts much longer thanks to the lower display resolution.
We do notice an improvement in the video test since our loop of the short movie Big Buck Bunny (H.264, 1080p) now runs for more than 11 hours. We performed both tests with Apple's default power settings (no changes to the TDP).
Update: The WLAN battery runtime is much better after the software update at about 11.5 hours.
| Apple MacBook Pro 15 2018 (2.6 GHz, 560X) i7-8850H, Radeon Pro 560X, 83 Wh | Apple MacBook Pro 15 2017 (2.8 GHz, 555) i7-7700HQ, Radeon Pro 555, 76 Wh | Dell XPS 15 9570 i7 UHD i7-8750H, GeForce GTX 1050 Ti Max-Q, 97 Wh | Dell XPS 15 2018 i5 FHD 97Wh i5-8300H, GeForce GTX 1050 Mobile, 97 Wh | Gigabyte Aero 15X v8 i7-8750H, GeForce GTX 1070 Max-Q, 94.24 Wh | Asus ZenBook Pro 15 UX580GE i9-8950HK, GeForce GTX 1050 Ti Mobile, 71 Wh | Average of class Multimedia | |
|---|---|---|---|---|---|---|---|
| Battery runtime | -7% | -11% | 11% | -22% | -38% | 33% | |
| H.264 (h) | 11.7 | 8.5 -27% | 12.3 5% | 8.4 -28% | 17.1 ? 46% | ||
| WiFi v1.3 (h) | 10.2 | 10.7 5% | 9.6 -6% | 15.7 54% | 8.6 -16% | 6.3 -38% | 12.2 ? 20% |
| Witcher 3 ultra (h) | 1.5 | 1.5 0% | 1 -33% | 1 -33% |
Verdict – Apple MacBook Pro 15 2018
Pros
Cons
Similar to the current MacBook Pro 13 2018, it took two comprehensive software updates to fix some of the problems after the launch. Besides general improvements including the battery runtime, they were focused on the poor performance utilization of the new processors. The CPU performance is better after the update and is now on par with the competitor Dell XPS 15, at least for some time. The cooling solution still drops after a while. This changed with the second major CPU update, and the performance is now stable, even after longer periods of time. Still, the Core i7 cannot utilize its full potential, so the optional Core i9 does not make much sense.
The 87 W PSU is another problem, because it limits the performance. We measured higher consumption figures under load and the battery even slightly drains during the stress test. We just don't understand why Apple still sticks with the old power adapter for such an expensive machine. In combination with the cooling, you have to ask whether the current model really deserves the addition "Pro".
The 2018 Apple MacBook Pro 15 is an excellent multimedia laptop, but it might not be the best choice for professional users due to performance and cooling issues.
Except for these issues, the 2018 MacBook Pro 15 is once again a convincing product. Yes, the keyboard is still a matter of taste, even after the upgrade, but you get an excellent chassis, a great 16:10 screen, and long battery runtimes. You should not get any problems if you don't plan to utilize the full performance, and you can enjoy a quiet device instead. We did not notice any WLAN connection drops this time, so there is no deduction from the final score.
Apple should probably think hard about a major redesign, because other manufacturers like Dell offer more performance, both in terms of the processor as well as the graphics card. Lenovo's new ThinkPad X1 Extreme also targets the same audience in the segment of slim 15-inch laptops.
Apple MacBook Pro 15 2018 (2.6 GHz, 560X)
- 12/05/2019 v7 (old)
Andreas Osthoff, J. Simon Leitner
Price comparison
