Apple MacBook Pro 15 (Late 2016 2.9 GHz, 460) Notebook Review

For the original German review, see here.
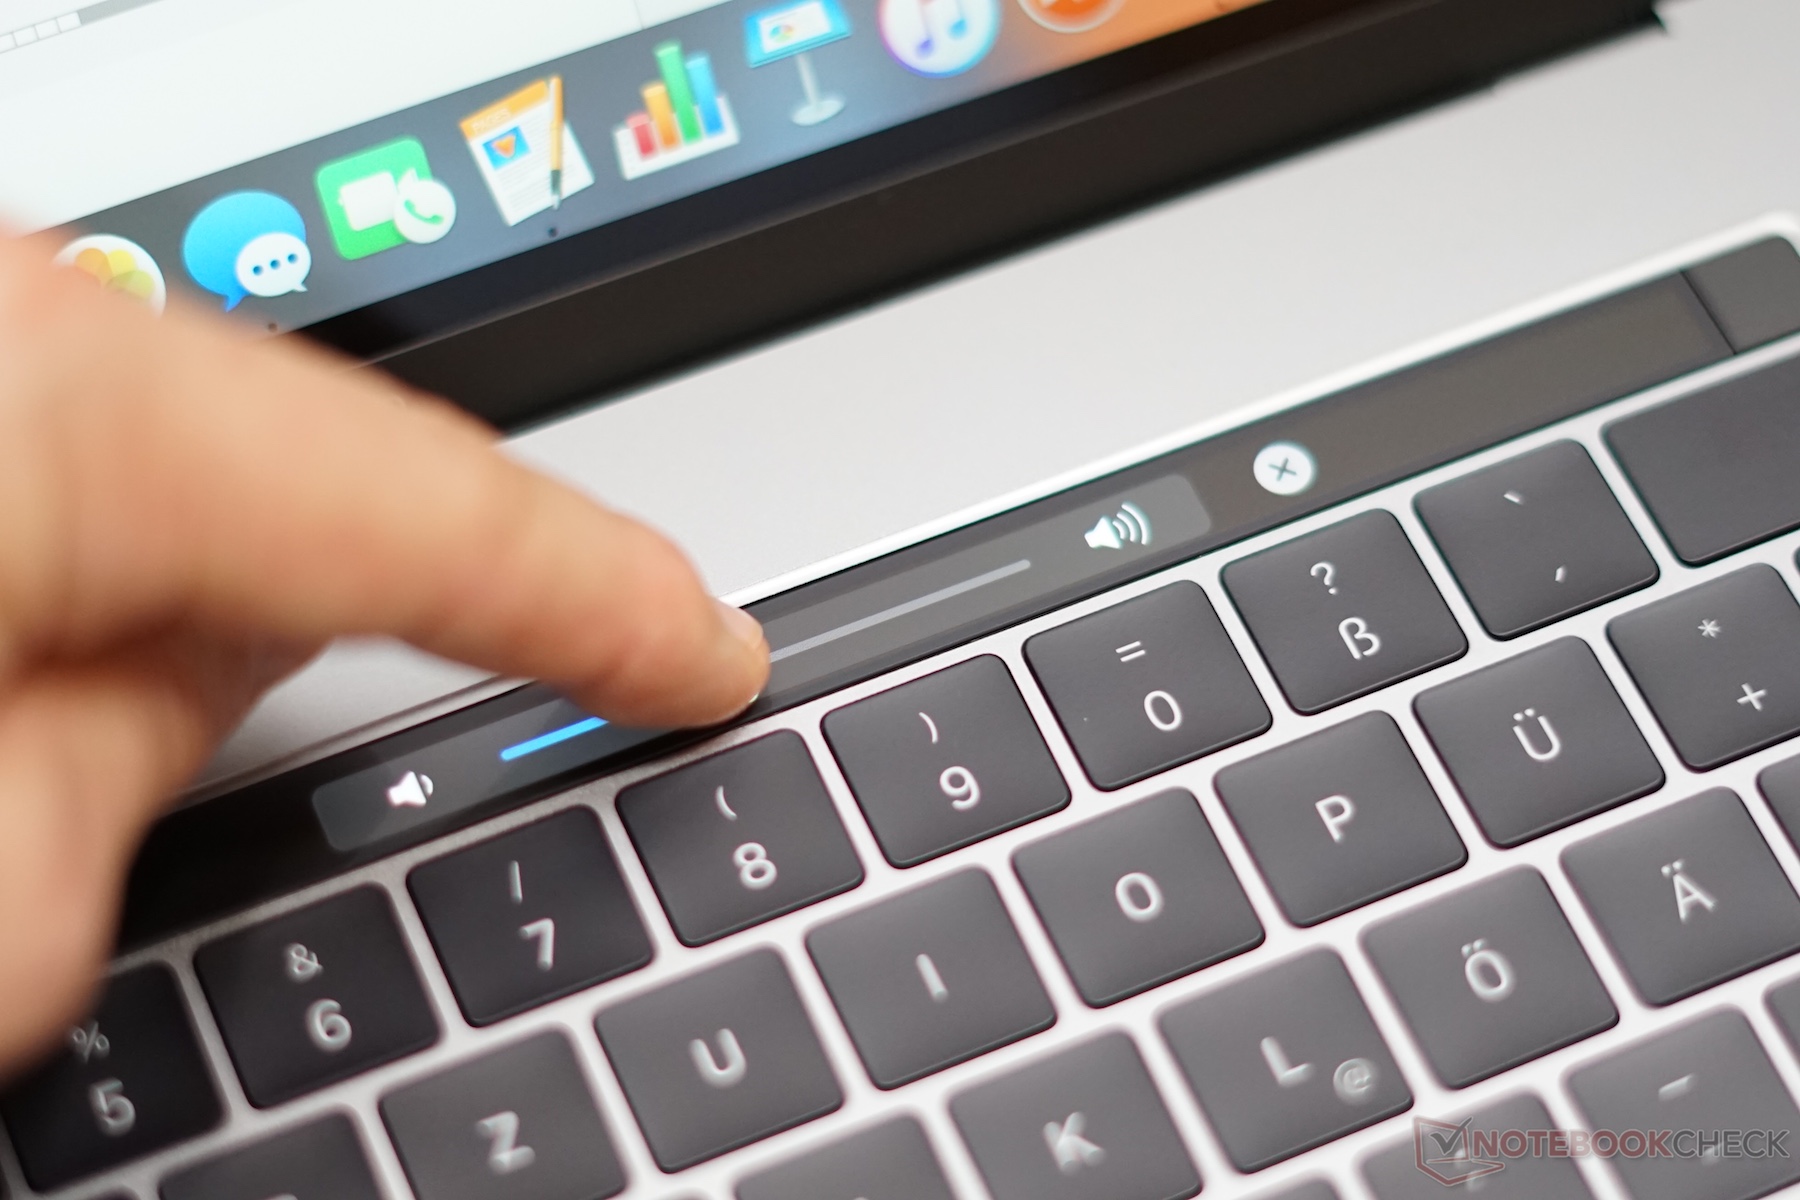
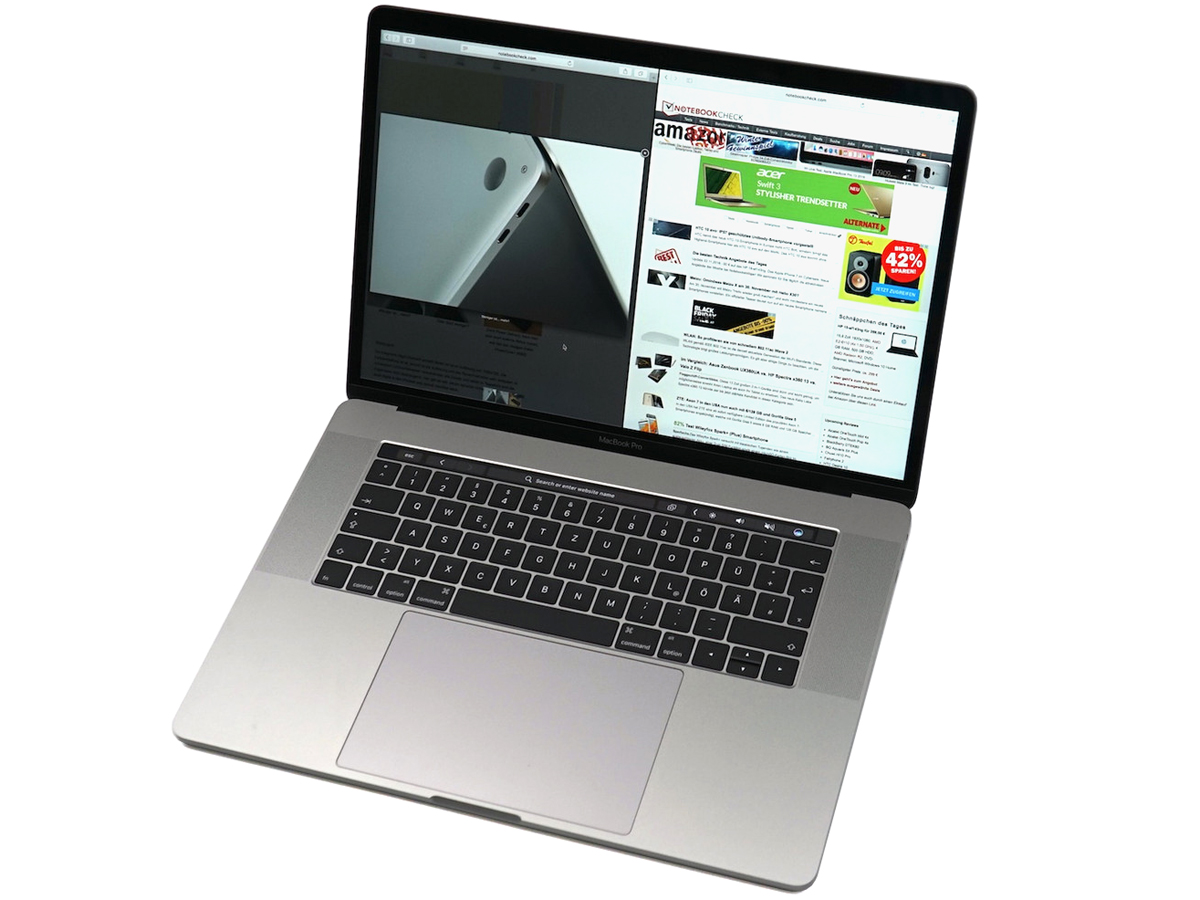
The current MacBook Pro 15 is the first major redesign in the last few years. As well as a slimmer and lighter chassis, the big highlight is obviously the Touch Bar. It is a small display above the keyboard and replaces the function keys. Our review showed that the functionality mainly depends on the software support, but it can actually make the handling rather more complicated in practice.
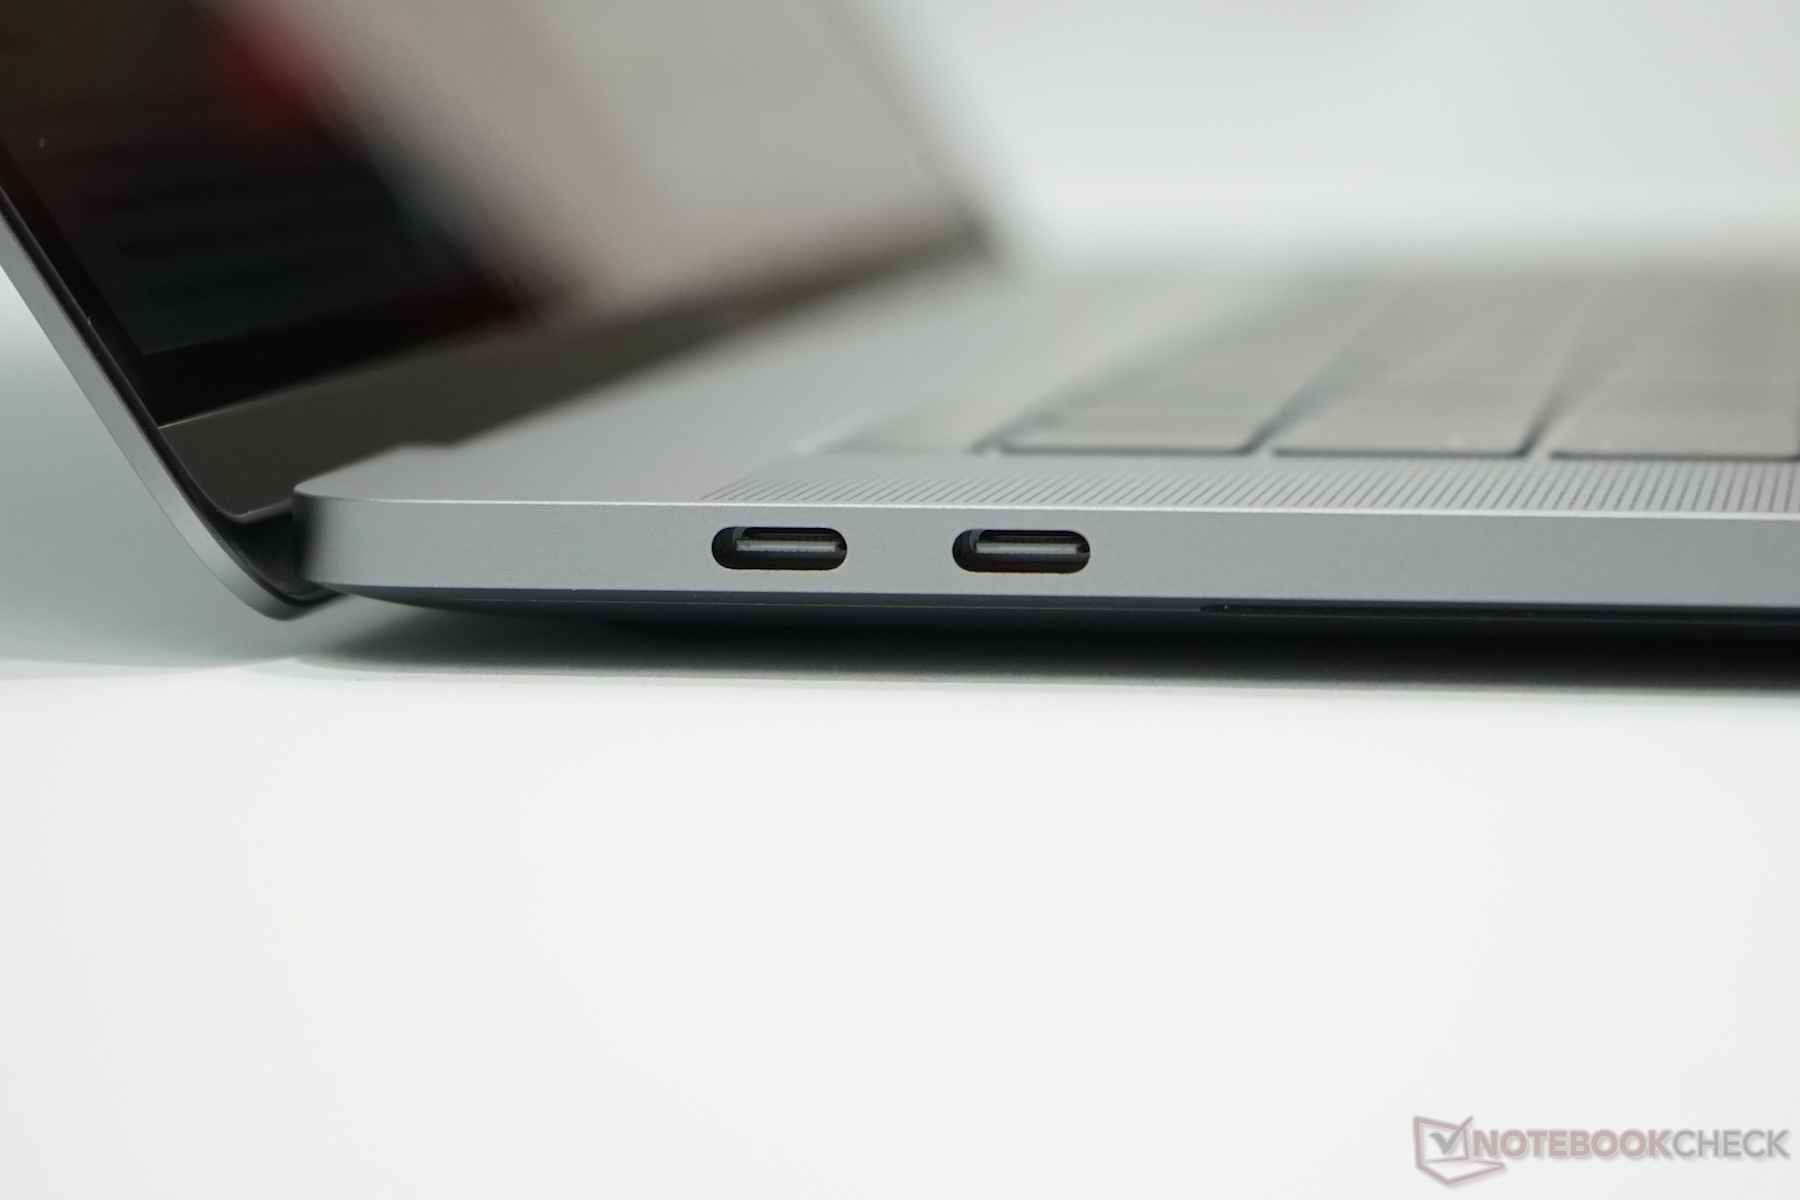
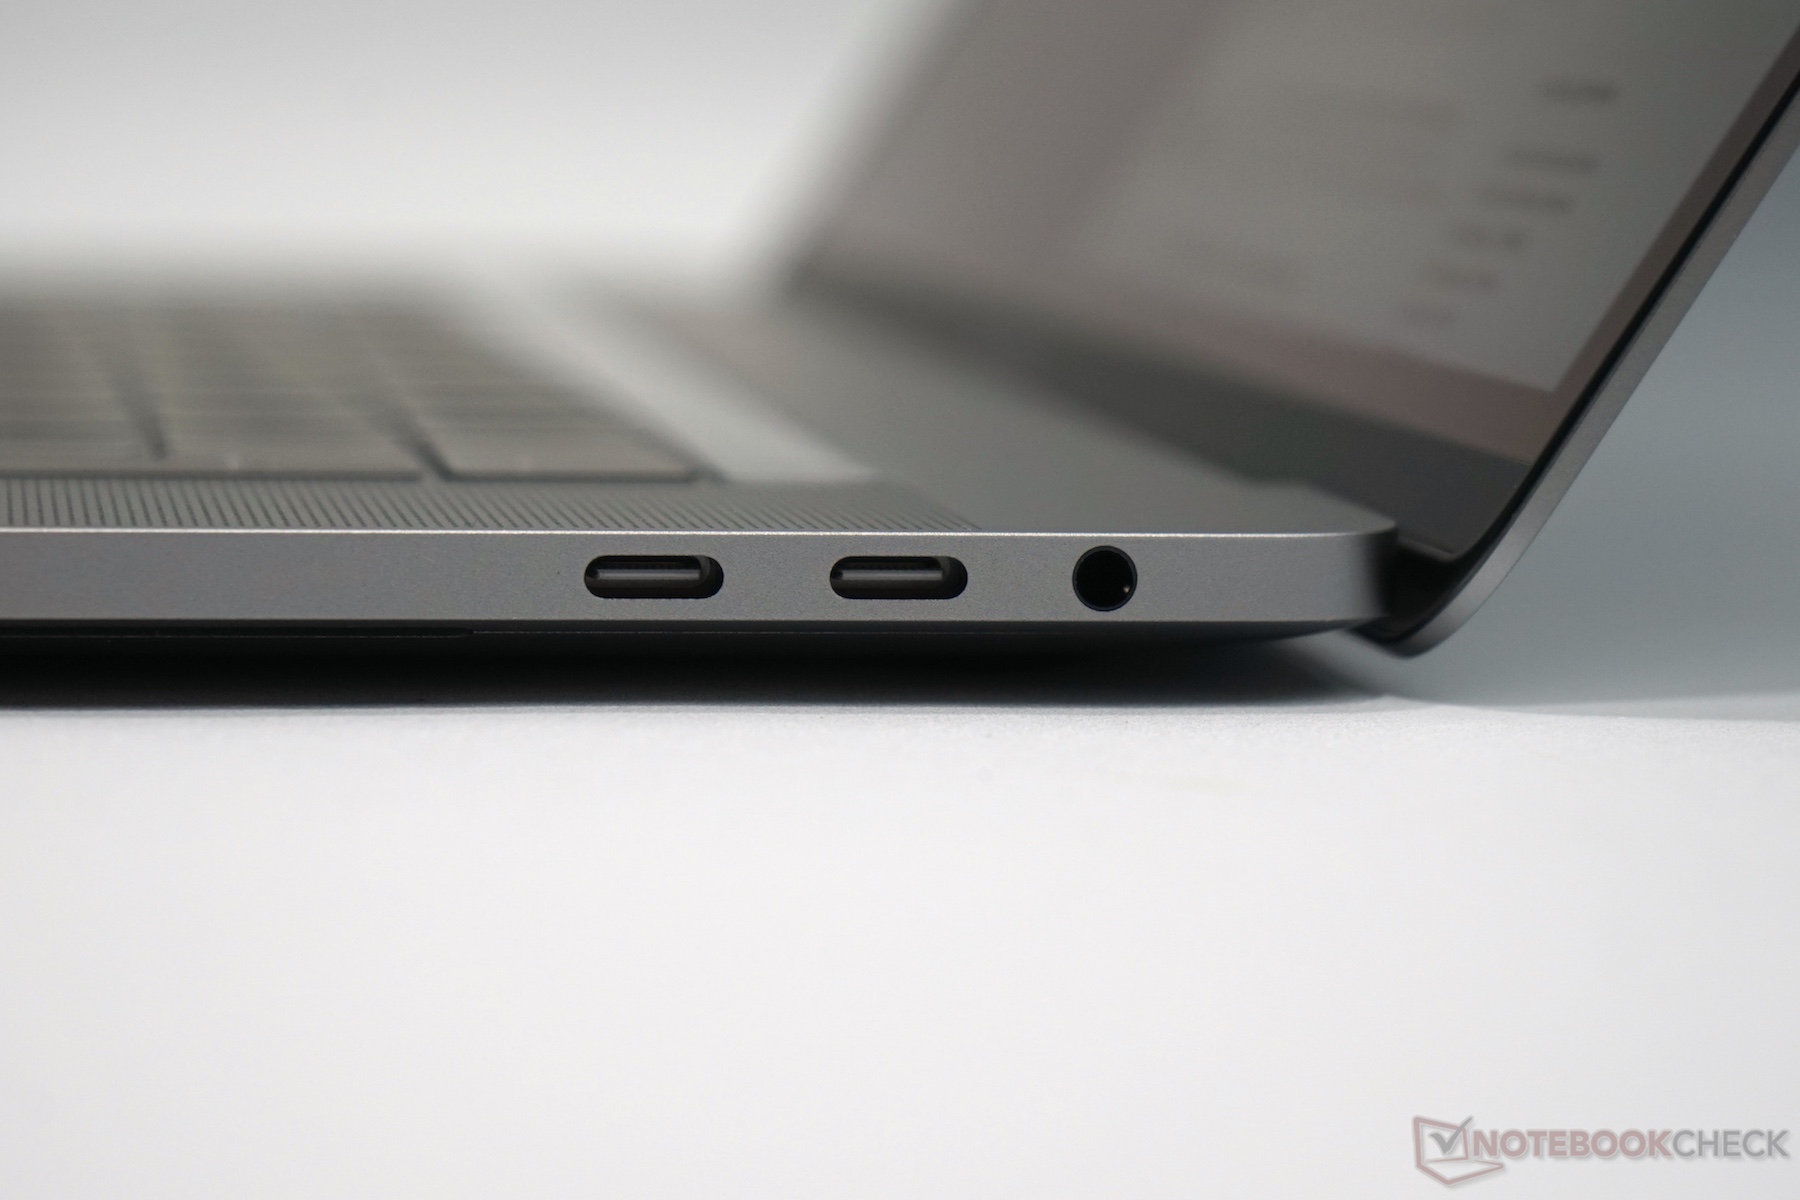
One of the biggest issues is probably the radical change of the port situation. Although 4x Thunderbolt 3 (USB Type-C) make the device quite future-proof, you will need adapters in the foreseeable future. Despite some problems, however, the current MacBook Pro is still a good product in many respects. This includes the great case, the excellent display, and the low emissions.
Our test sample today is the high-end model, where we checked (almost) all upgrade boxes in Apple's online store: Core i7-6920HQ (Skylake), 16 GB LPDDR3 RAM, 1 TB PCIe-SSD, and AMD Radeon Pro 460. This comes at a price though. While the entry-level model is available for $2399, Apple charges $3499 for the test model.
The two models of the current MacBook Pro 15 obviously use the same chassis constructions, so we will not cover sections such as the Case, Connectivity, Input Devices, or Speakers in this article. All this information is available in our in-depth review of the entry-level model with the Core i7-6700HQ and the Radeon Pro 450. Instead, we focus on the (additional) performance of the components and the effects on the emissions as well as the battery runtimes.
Display
As with the previously reviewed entry-level configuration of the Apple MacBook Pro 15, our current test model is equipped with the APPA030 panel. It is still an IPS screen with a resolution of 2880x1800 pixels, which results in a pixel density of 220 PPI. There are no scaling issues, which is typical for macOS, so you can always enjoy a sharp picture.
This time, we measured the screen running Windows via Bootcamp to get additional measurements. The determined results are slightly worse compared to the first test model (also APPA030), but they are still pretty good in general. The average luminance is 400 nits and can also be used on battery power. So far so good, but Apple seems to be using different panels. Our test model with the less powerful Core i7-6820HQ and the AMD Radeon Pro 455 is equipped with the APPA031 panel, which is noticeably brighter at up to 560 nits.
| |||||||||||||||||||||||||
Brightness Distribution: 90 %
Center on Battery: 420 cd/m²
Contrast: 1400:1 (Black: 0.3 cd/m²)
ΔE ColorChecker Calman: 3.33 | ∀{0.5-29.43 Ø4.71}
ΔE Greyscale Calman: 2.73 | ∀{0.09-98 Ø4.96}
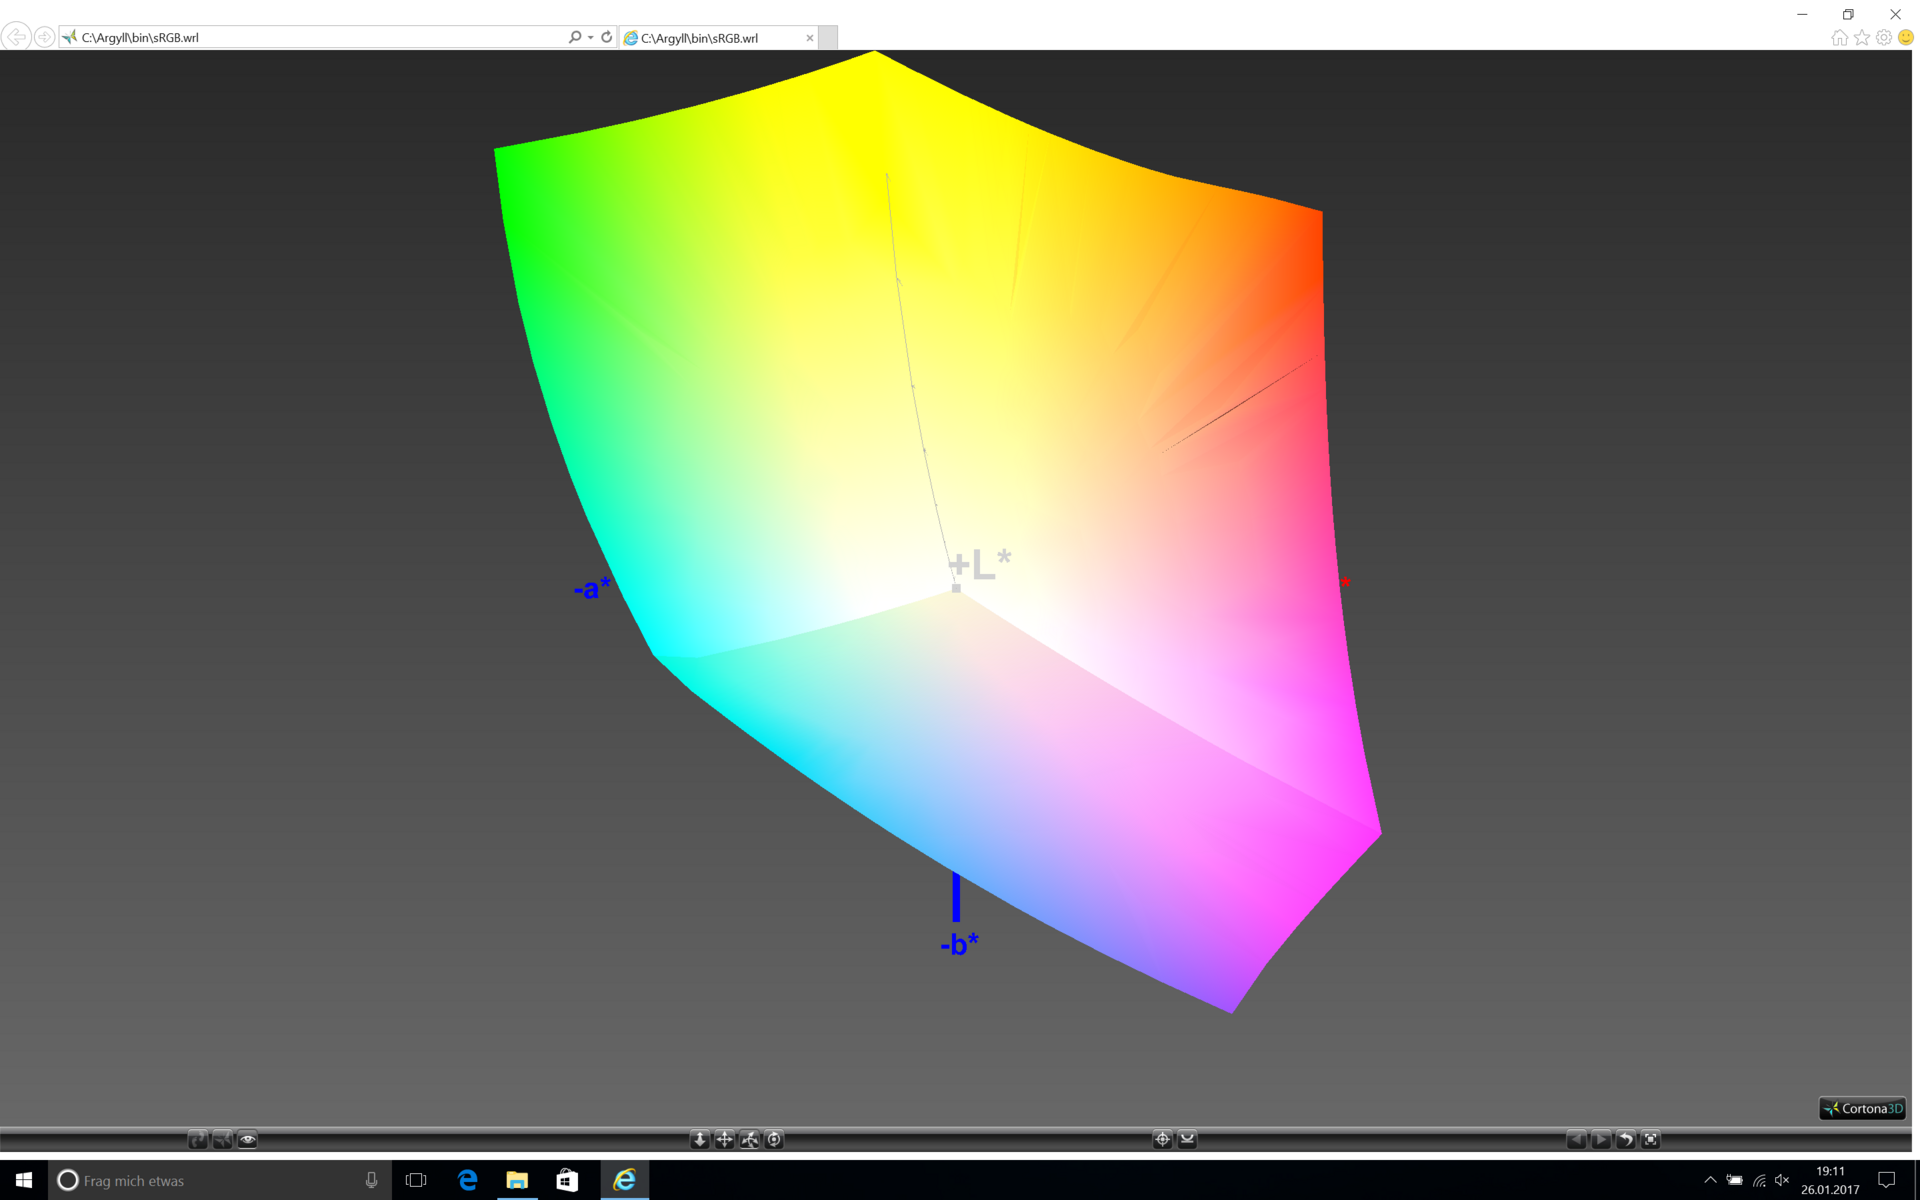
99.97% sRGB (Argyll 1.6.3 3D)
78.09% AdobeRGB 1998 (Argyll 1.6.3 3D)
87.3% AdobeRGB 1998 (Argyll 3D)
100% sRGB (Argyll 3D)
99% Display P3 (Argyll 3D)
Gamma: 2.48
CCT: 6457 K
| Apple MacBook Pro 15 2016 (2.9 GHz, 460) Apple APPA030, , 2880x1800, 15.4" | Apple MacBook Pro 15 2016 (2.6 GHz, 450) 2880x1800, 15.4" | Apple MacBook Pro 15 2016 (2.7 GHz, 455) APPA031, , 2880x1800, 15.4" | Apple MacBook Pro Retina 15 inch 2015-05 APPA02E, , 2880x1800, 15.4" | Dell XPS 15-9550 i7 SHARP LQ156D1JX01 Dell PN: 7PHPT, , 3840x2160, 15.6" | |
|---|---|---|---|---|---|
| Display | -1% | -25% | 1% | ||
| Display P3 Coverage (%) | 99 | 98.5 -1% | 61.4 -38% | 87.8 -11% | |
| sRGB Coverage (%) | 100 | 99.9 0% | 90.8 -9% | 100 0% | |
| AdobeRGB 1998 Coverage (%) | 87.3 | 86.4 -1% | 62.9 -28% | 99.4 14% | |
| Response Times | 21% | 15% | 6% | ||
| Response Time Grey 50% / Grey 80% * (ms) | 46 ? | 47.3 ? -3% | 46.4 ? -1% | 58 ? -26% | |
| Response Time Black / White * (ms) | 56 ? | 31.2 ? 44% | 39.2 ? 30% | 35 ? 37% | |
| PWM Frequency (Hz) | 119000 ? | 117000 ? | |||
| Screen | 22% | 22% | -2% | -23% | |
| Brightness middle (cd/m²) | 420 | 483 15% | 568 35% | 341 -19% | 361 -14% |
| Brightness (cd/m²) | 401 | 465 16% | 532 33% | 315 -21% | 344 -14% |
| Brightness Distribution (%) | 90 | 92 2% | 83 -8% | 82 -9% | 90 0% |
| Black Level * (cd/m²) | 0.3 | 0.33 -10% | 0.297 1% | 0.34 -13% | 0.38 -27% |
| Contrast (:1) | 1400 | 1464 5% | 1912 37% | 1003 -28% | 950 -32% |
| Colorchecker dE 2000 * | 3.33 | 1.4 58% | 1.4 58% | 2.07 38% | 5.34 -60% |
| Colorchecker dE 2000 max. * | 5.11 | 3 41% | 2.7 47% | 3.27 36% | |
| Greyscale dE 2000 * | 2.73 | 1.5 45% | 2.3 16% | 1.9 30% | 4.84 -77% |
| Gamma | 2.48 89% | 2.34 94% | 2.29 96% | 2.62 84% | 2.21 100% |
| CCT | 6457 101% | 6650 98% | 7165 91% | 6514 100% | 7395 88% |
| Color Space (Percent of AdobeRGB 1998) (%) | 78.09 | 77.4 -1% | 58 -26% | 89 14% | |
| Color Space (Percent of sRGB) (%) | 99.97 | 99.9 0% | 91 -9% | 100 0% | |
| Total Average (Program / Settings) | 22% /
21% | 12% /
16% | -14% /
-7% | -5% /
-14% |
* ... smaller is better
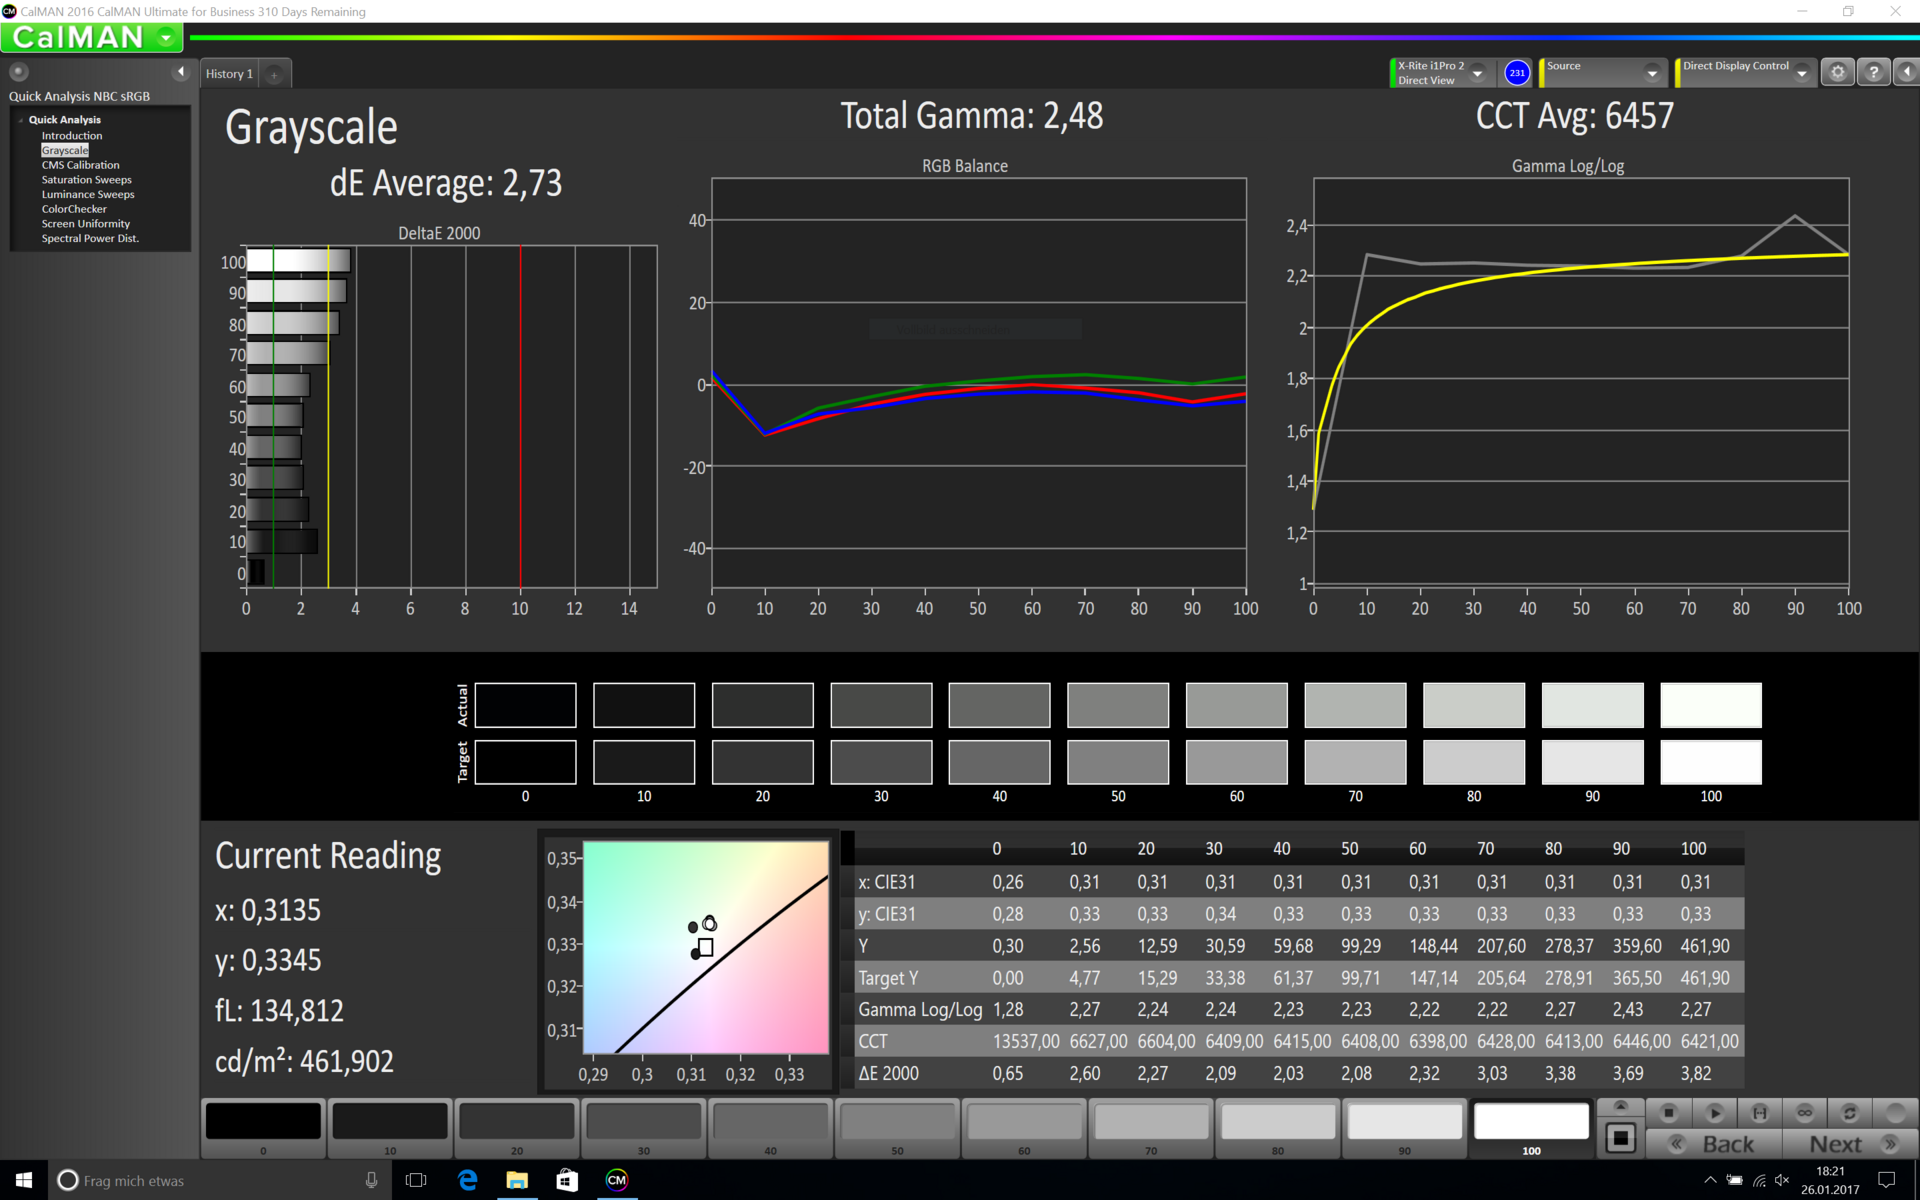
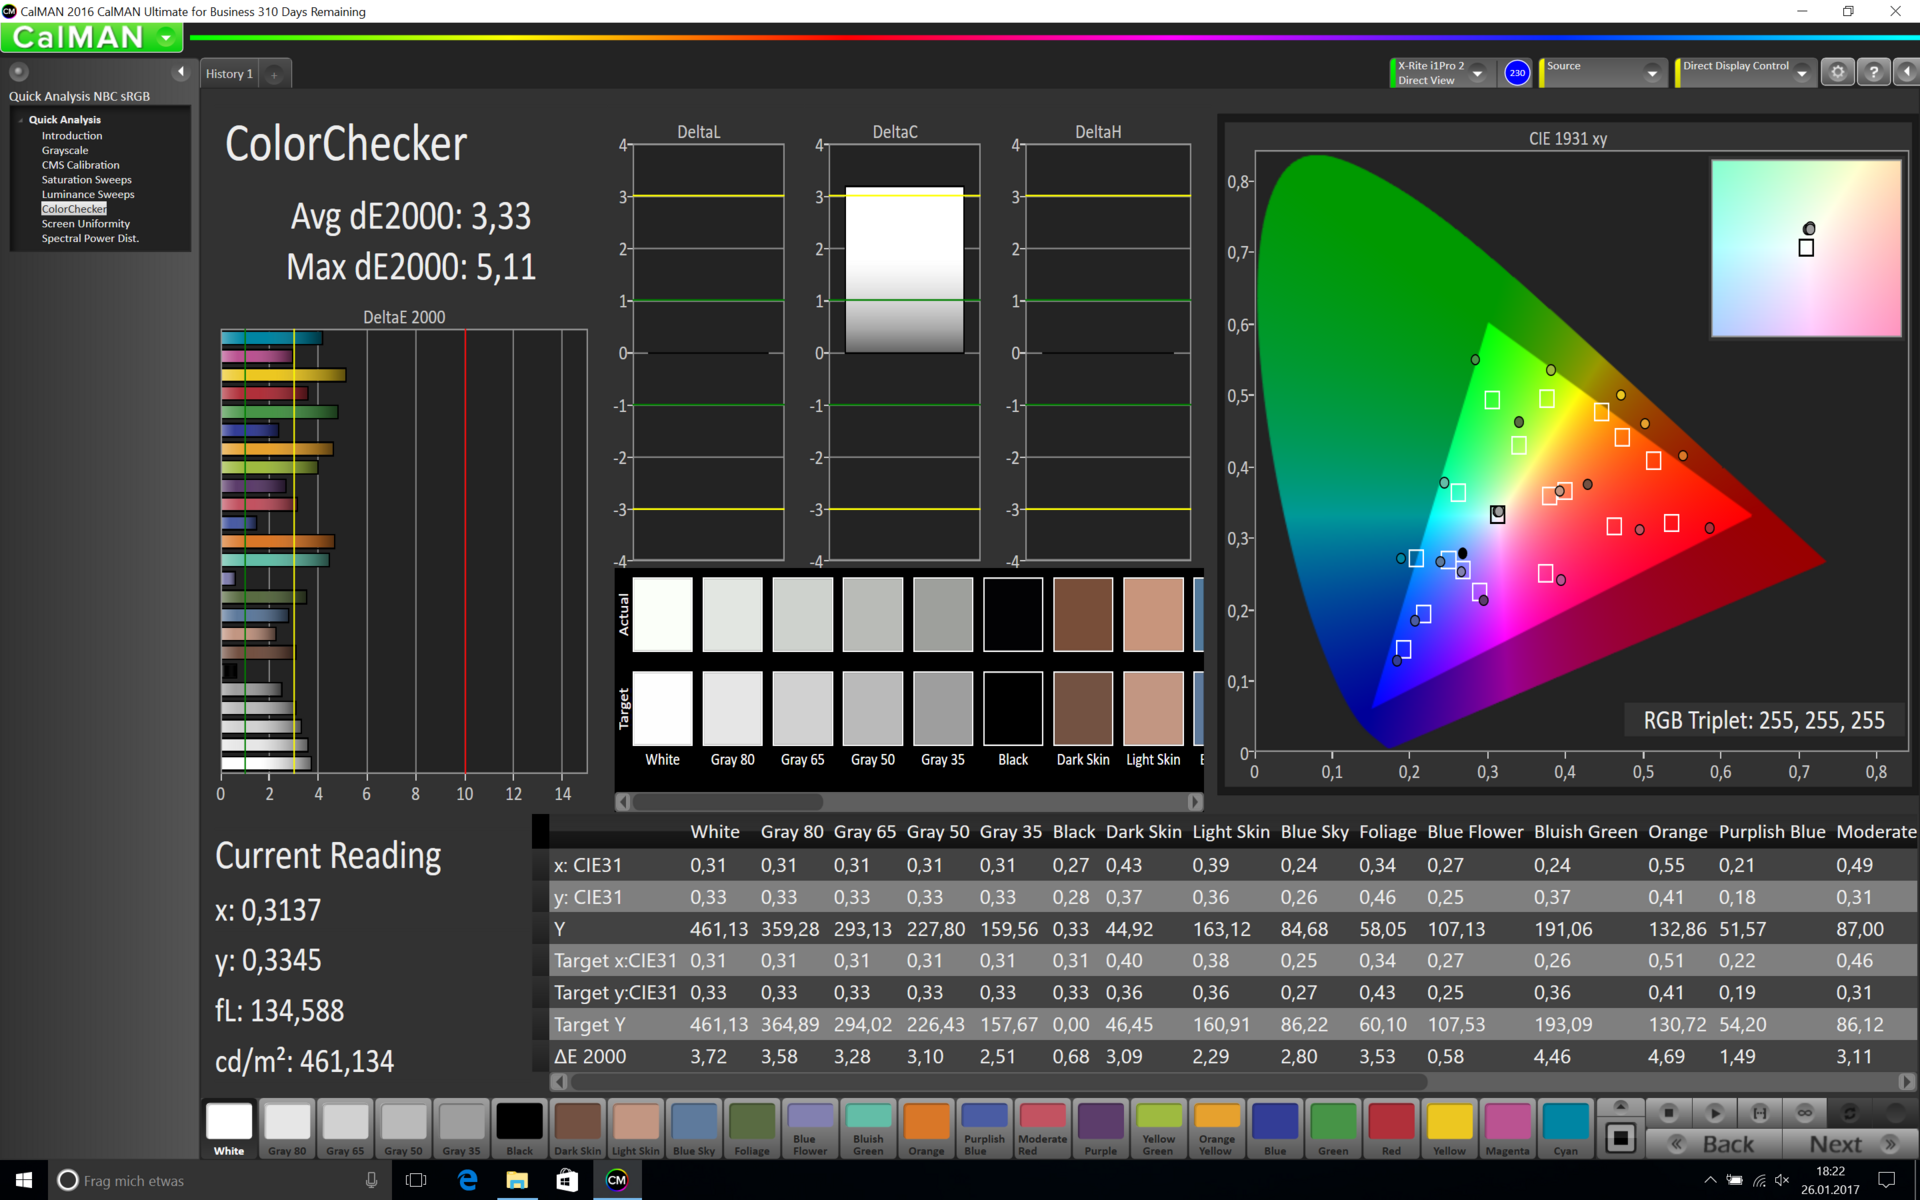

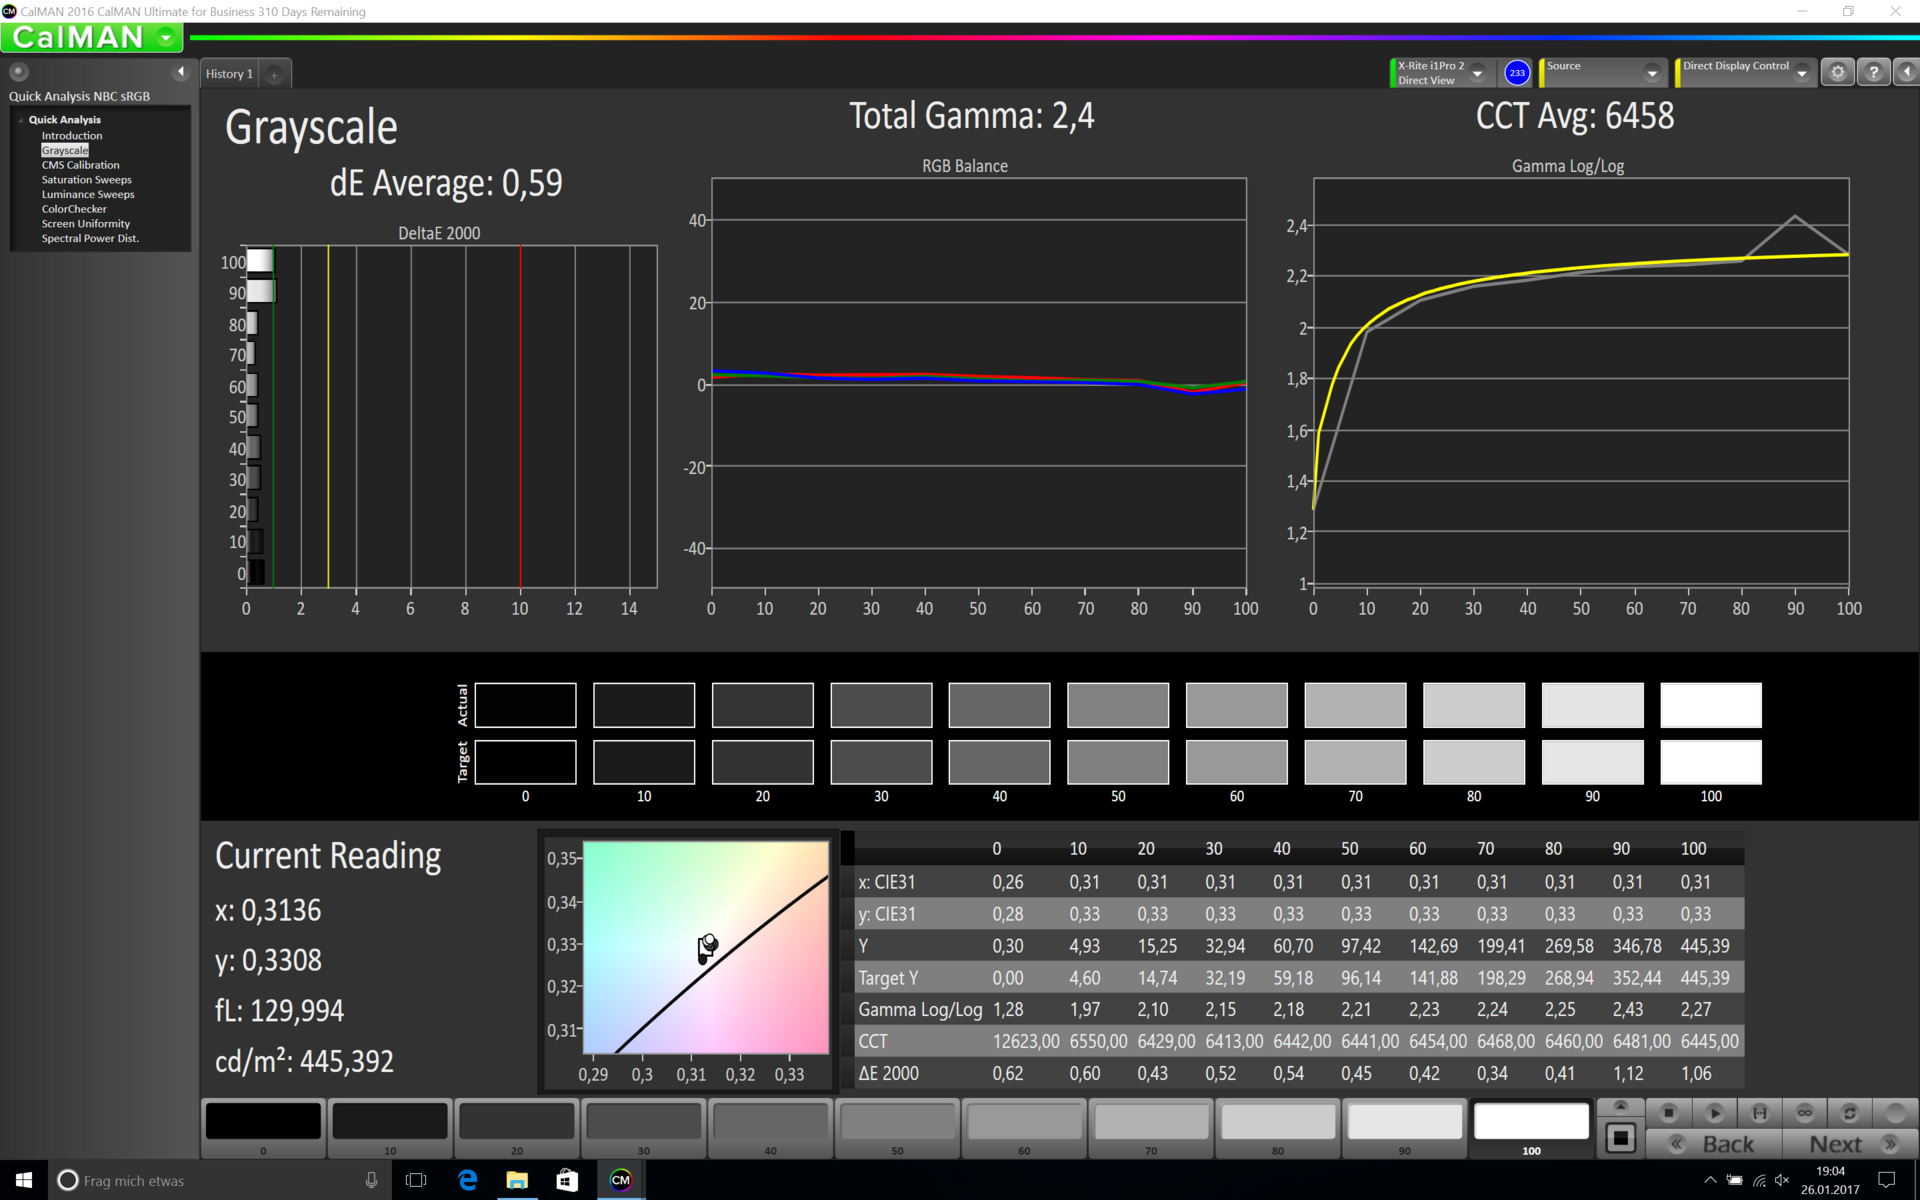
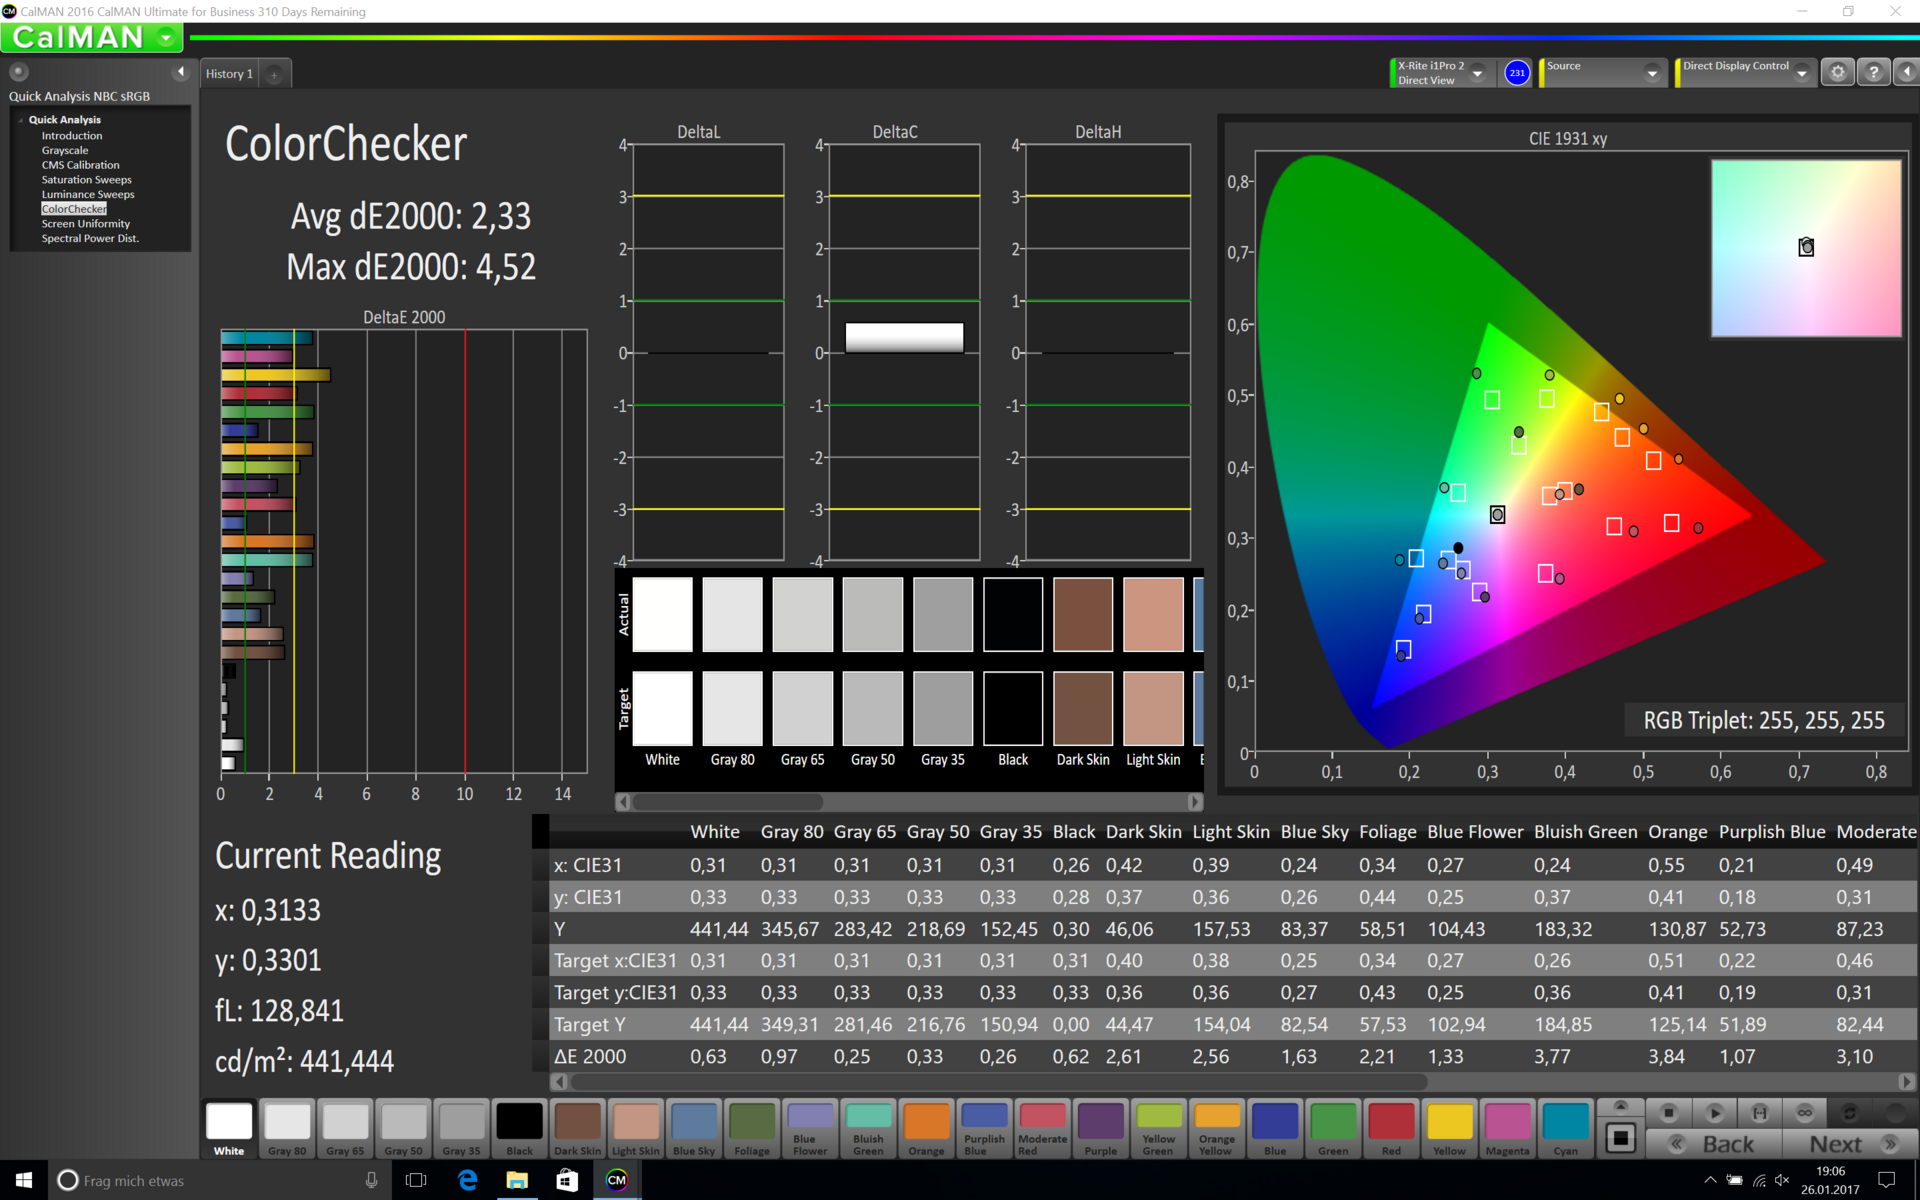
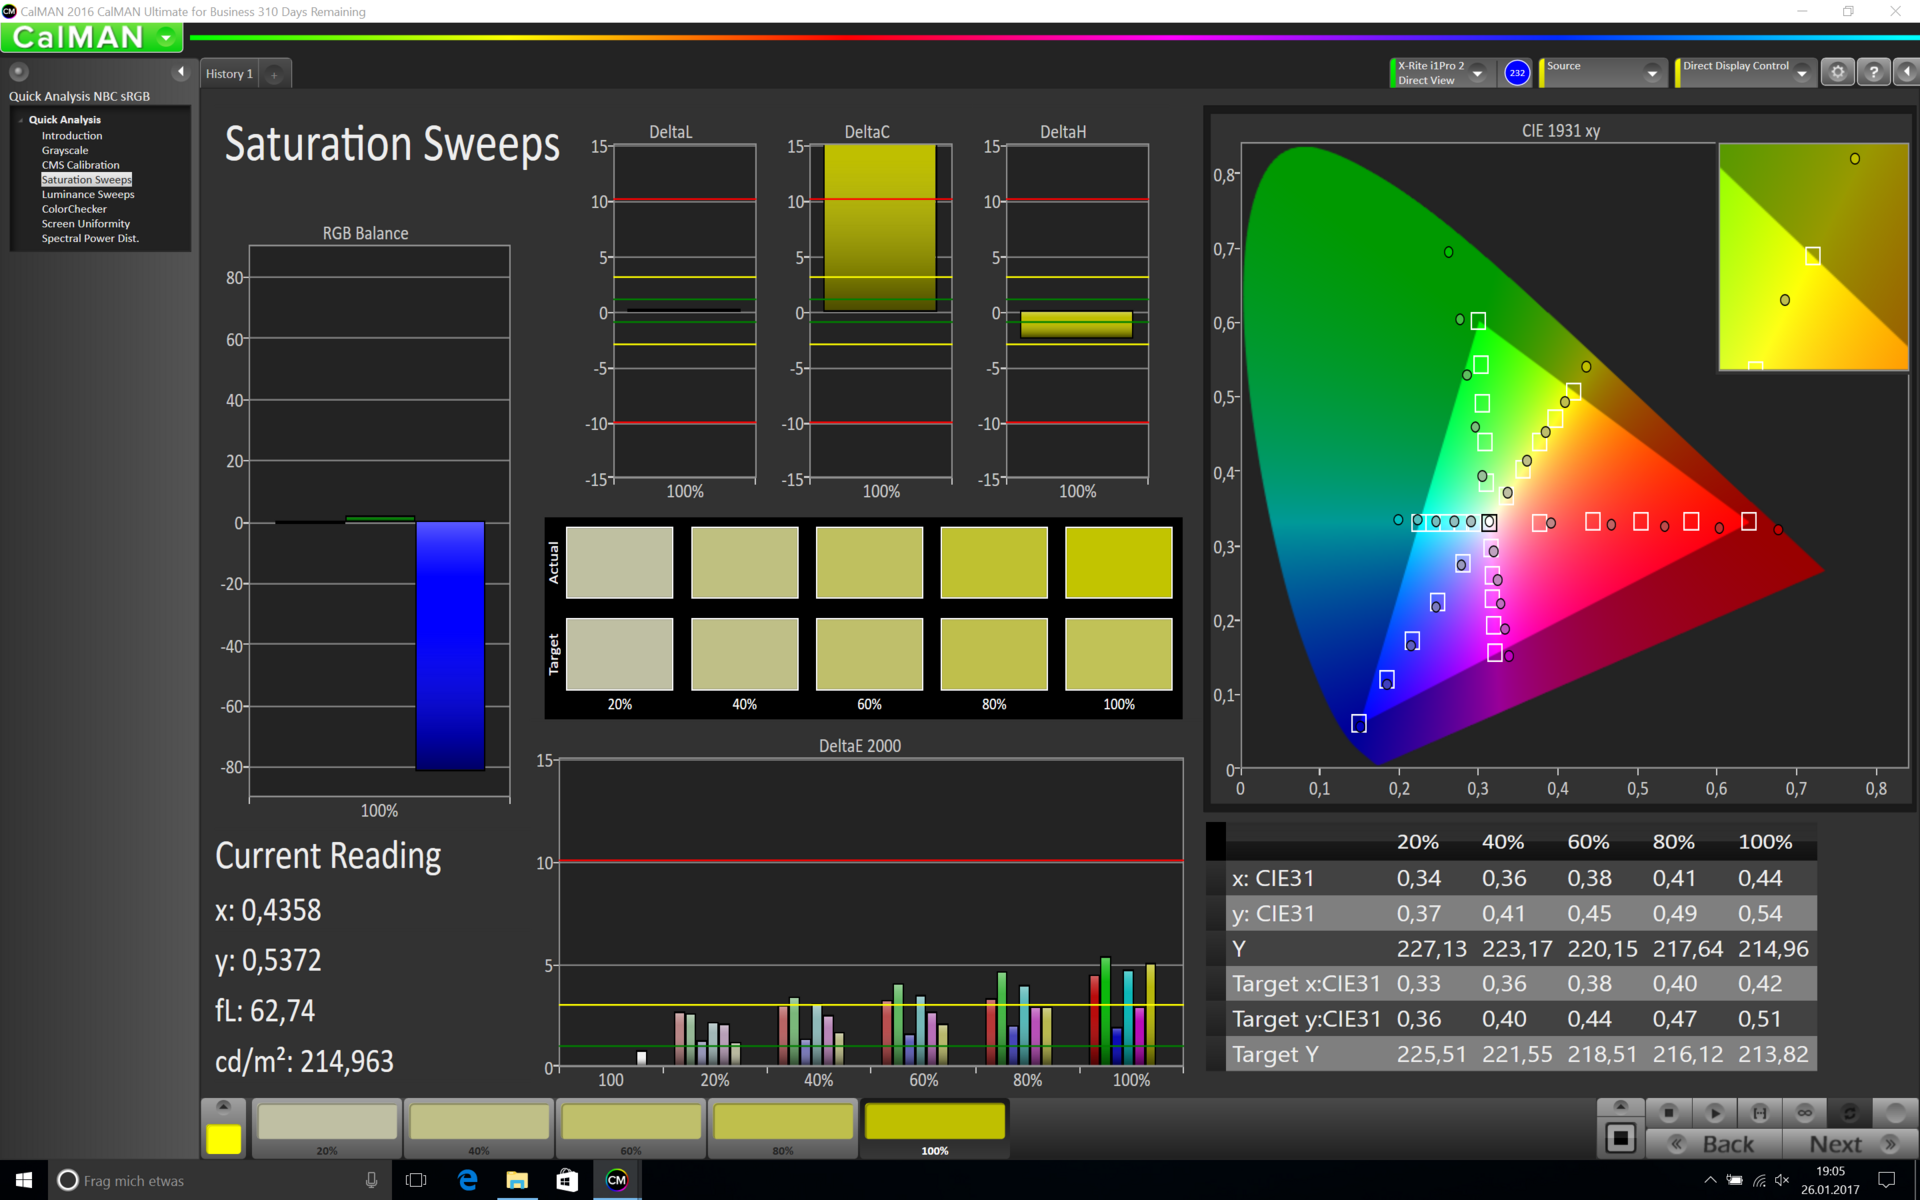
Both models of the MacBook Pro 15 are roughly on par with a contrast ratio of around 1400:1 thanks to the slightly lower black value. We can also measure slightly higher DeltaE-2000 deviations on Windows. The grayscale still hits the important mark of 3, while the colors just miss this. The result can be improved by a calibration, although the saturation is still too high – the panel could perform much better in theory. sRGB is fully covered; AdobeRGB by 78%.

Performance
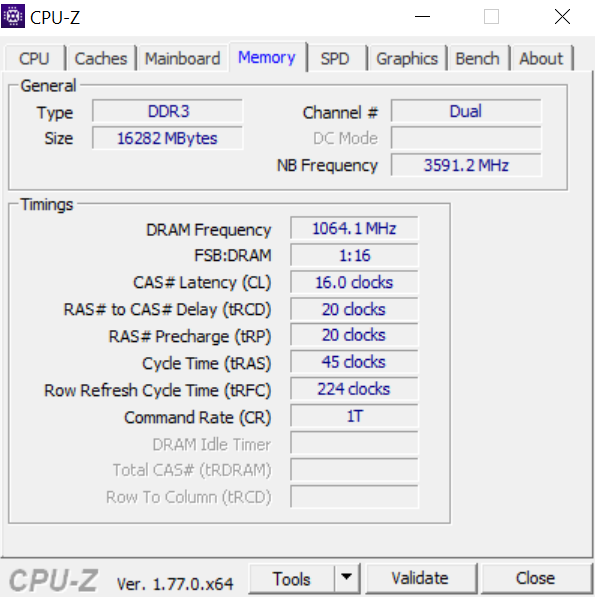
We have already mentioned that the test model is the fastest model of the current Apple MacBook Pro 15 lineup. However, the upgrades are not cheap: The Core i7-6920HQ (up to 3.8 GHz) adds $300 and the AMD Radeon Pro 460 (4 GB GDDR5) adds $200. The most expensive upgrade is the jump from the 256 GB SSD to the 1 TB model, where Apple charges a hefty sum of $600. All models are currently available with 16 GB LPDDR3 RAM.
The entry-level model of the MacBook Pro 15 with the Core i7-6700HQ and the Radeon Pro 450 is no slouch to begin with, so there is the question of whether the upgrades are really worth it. By the way, the latest Kaby Lake chips are not available yet. Apple still ships the MacBook Pro 15 with Skylake processors and LPDDR3 RAM until the upcoming refresh (probably next autumn).
Processor
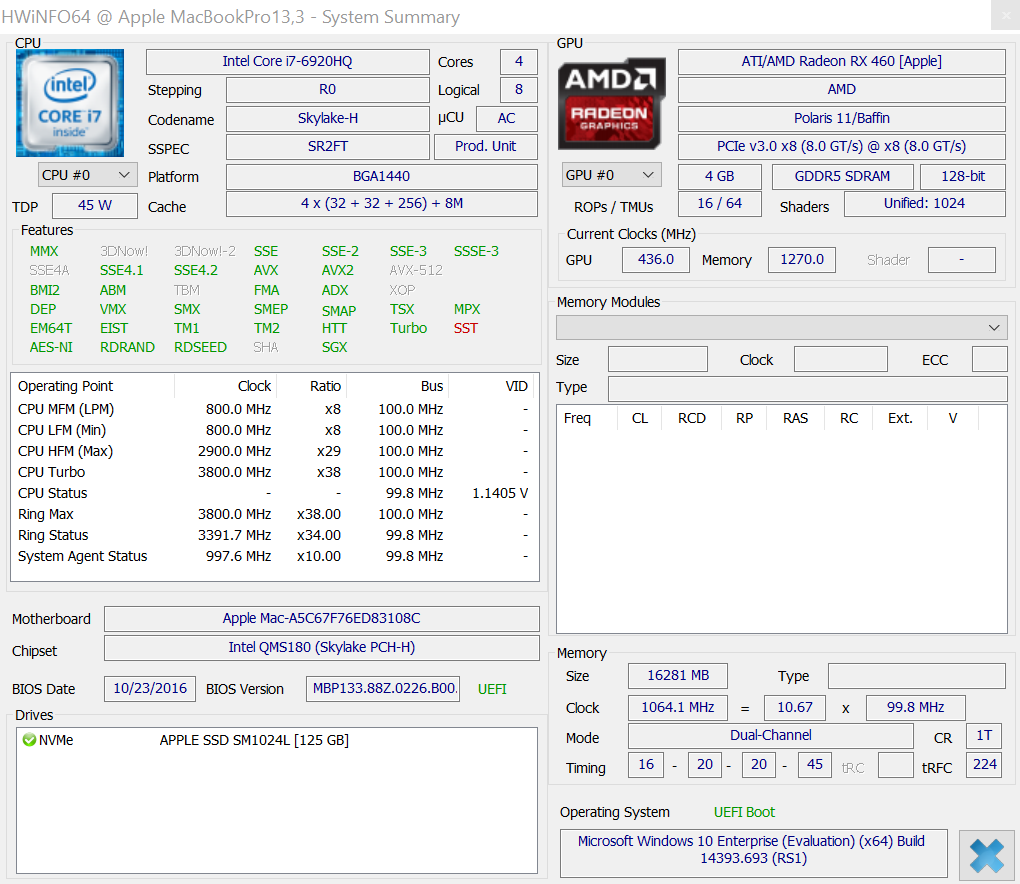
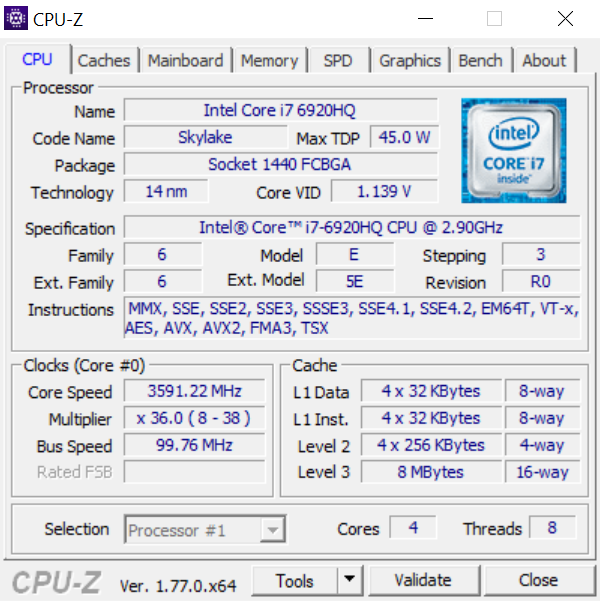
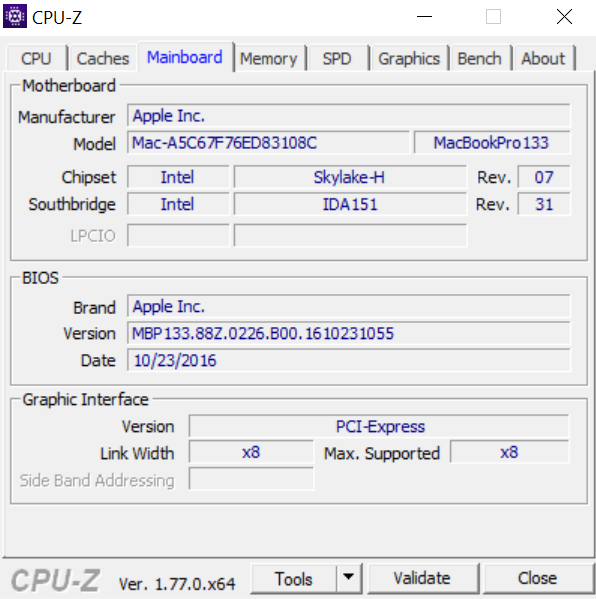
The Intel Core i7-6920HQ is one of the fastest mobile quad-core processors (TDP: 45 watts) from the Skylake generation and runs with a base frequency of 2.9 GHz and a Turbo of up to 3.8 GHz (2 cores: up to 3.6 GHz, 4 cores: up to 3.4 GHz). The Turbo levels are therefore identical to the new Kaby Lake Core i7-7700HQ, while the direct successor, i7-7920HQ is up to 300 MHz faster. As with other products from the past, Apple basically removes the usual TDP limit and allows a continuous power consumption of 100 watts. The temperature is therefore the only limiting factor.
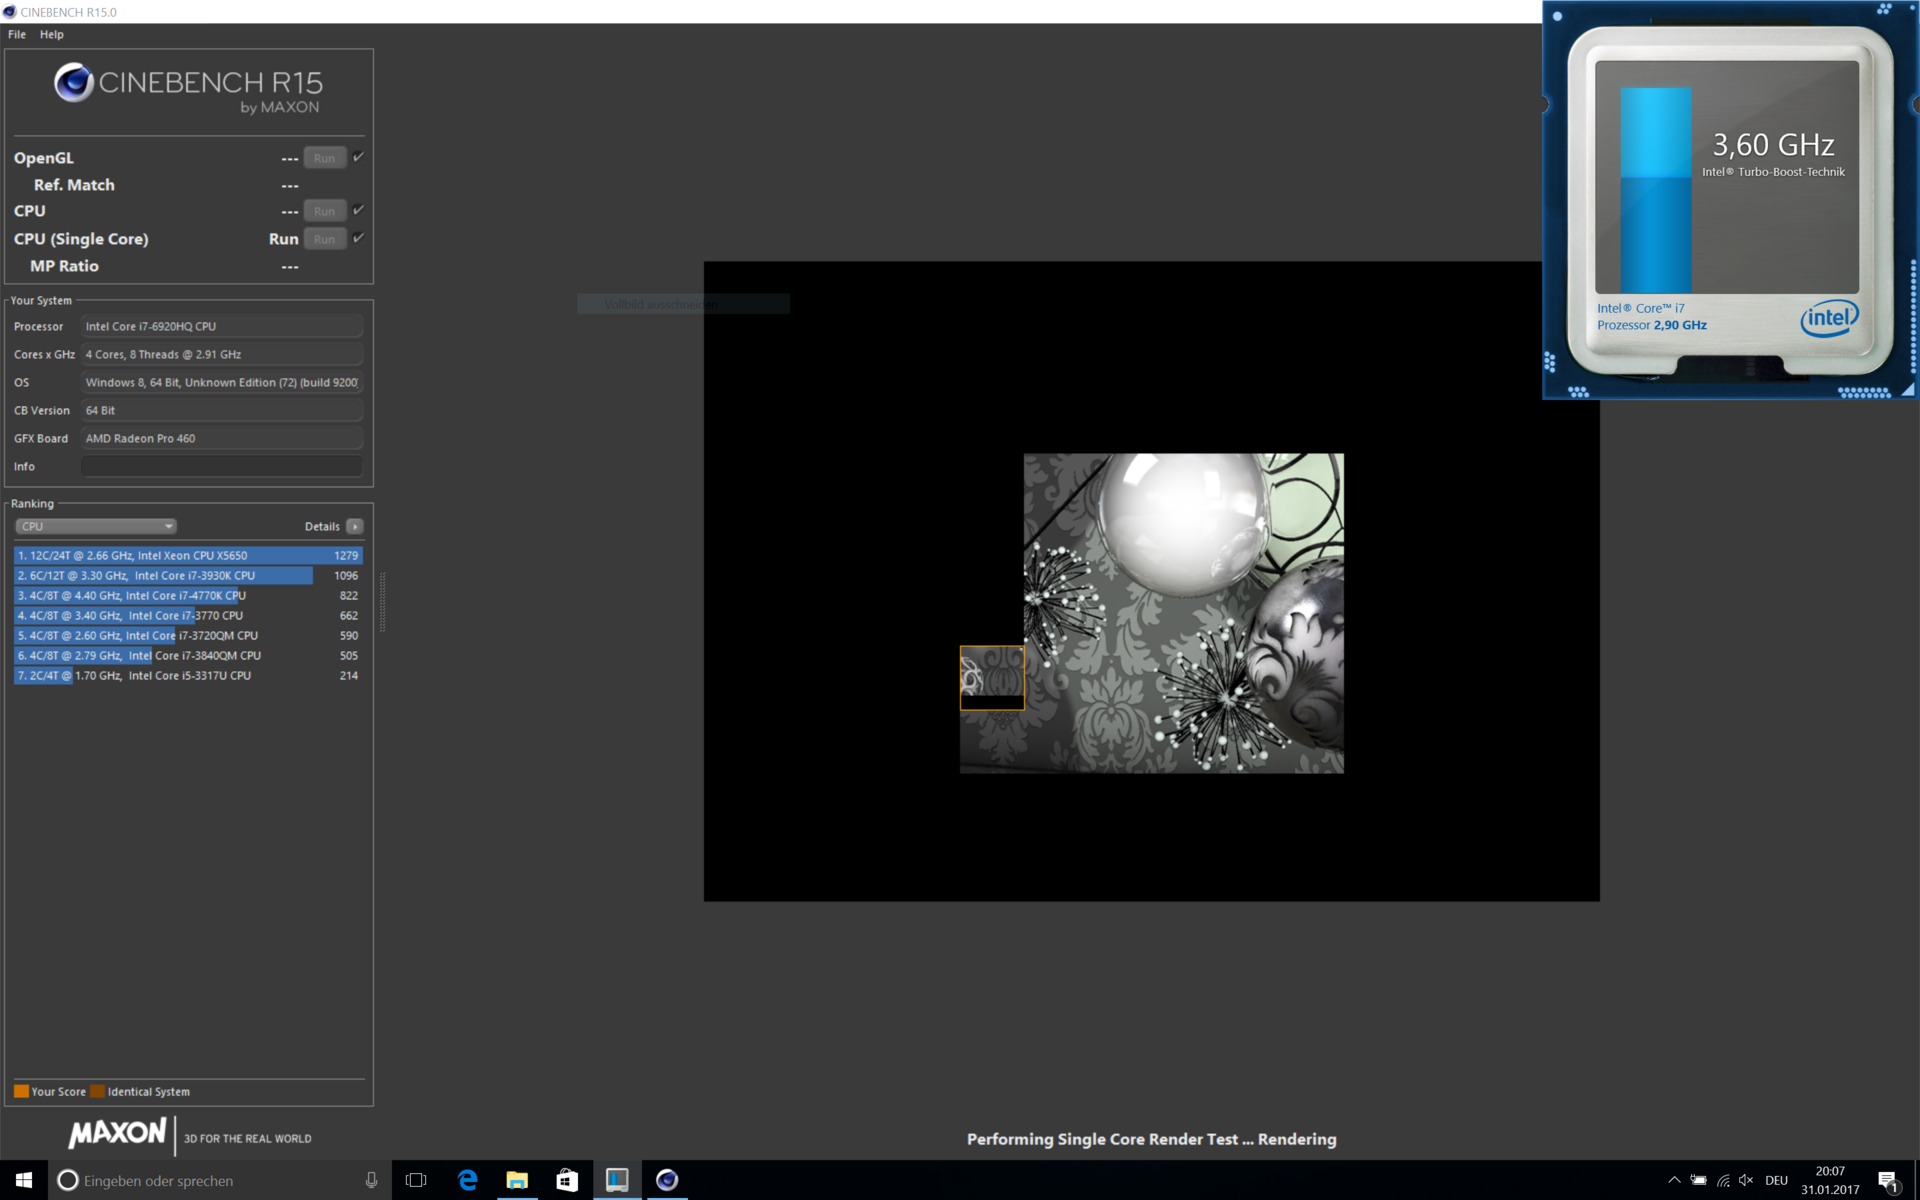
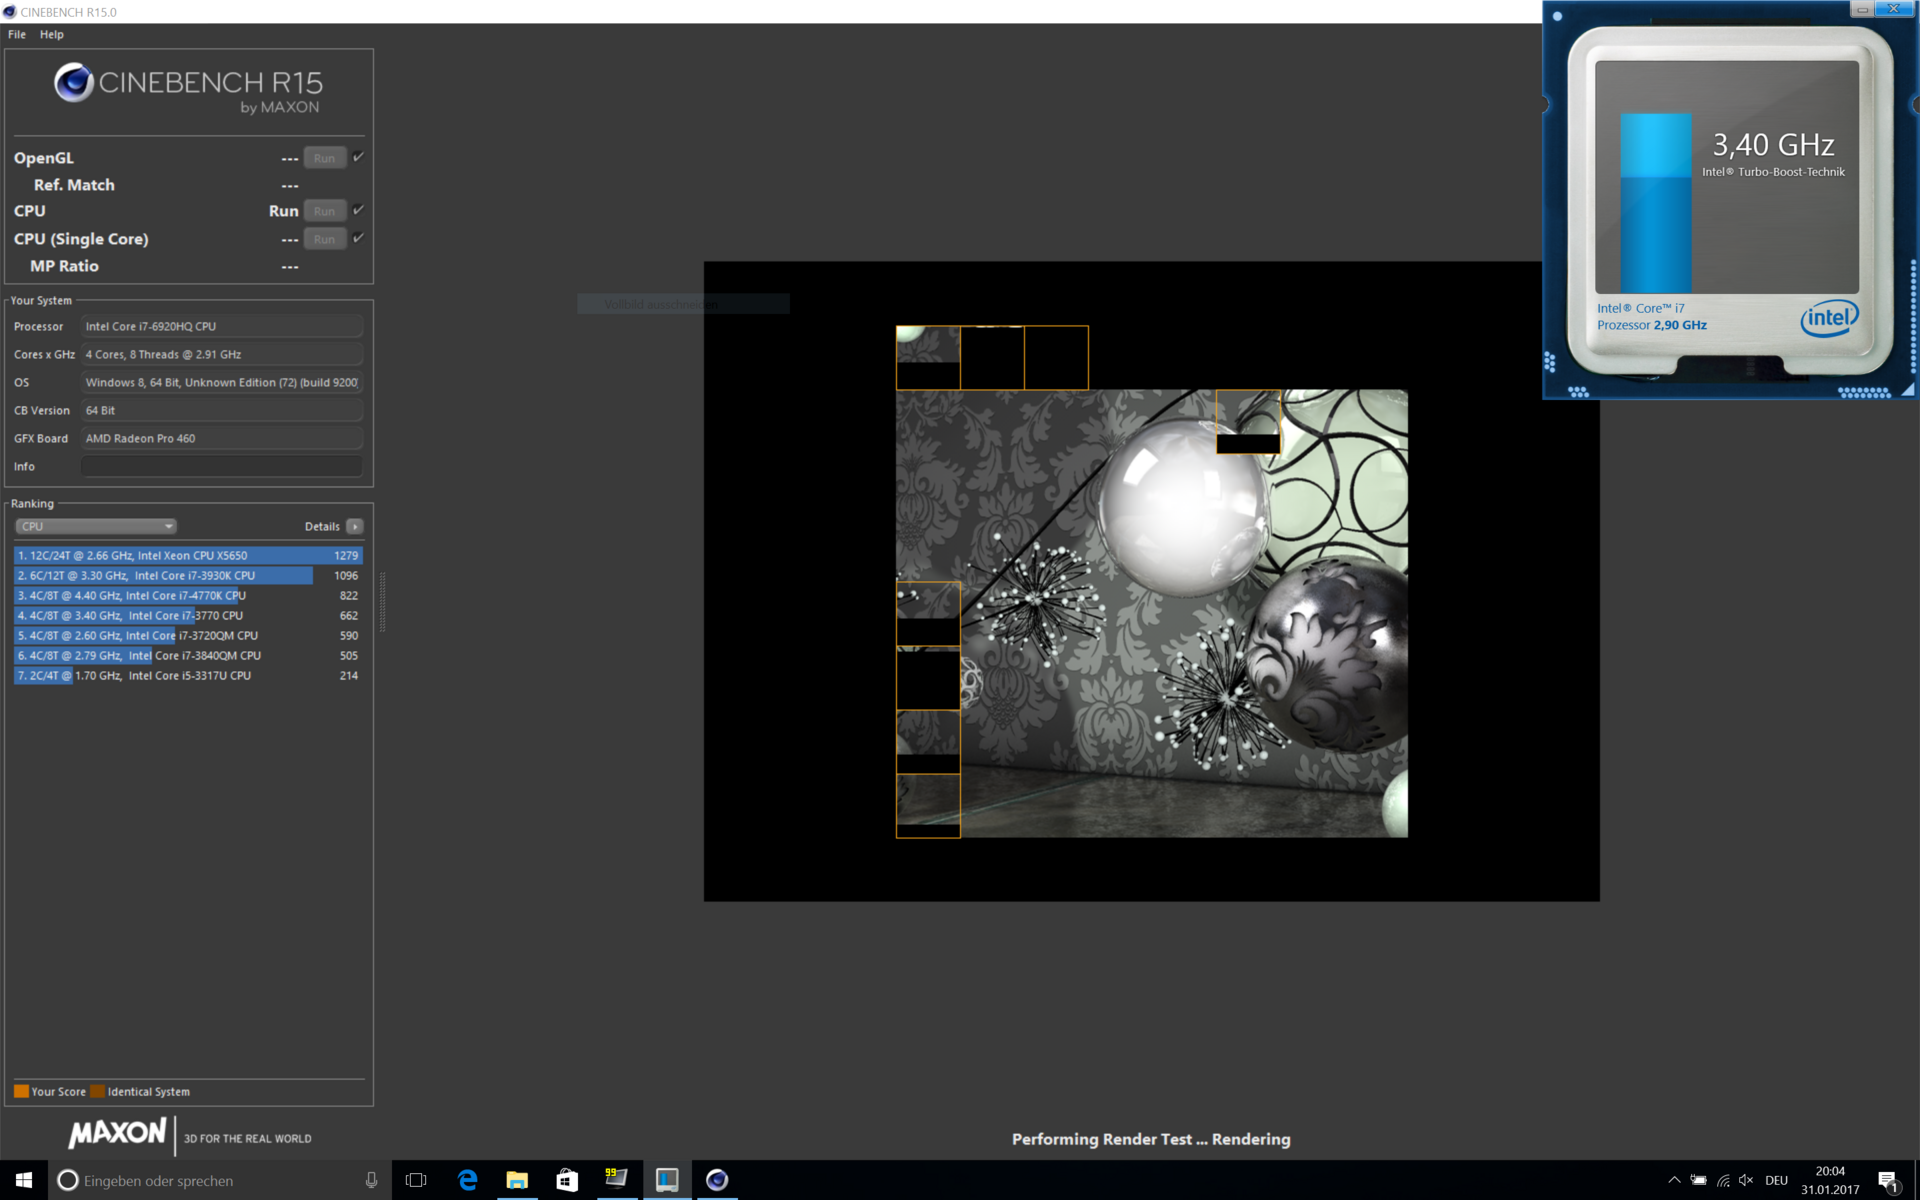
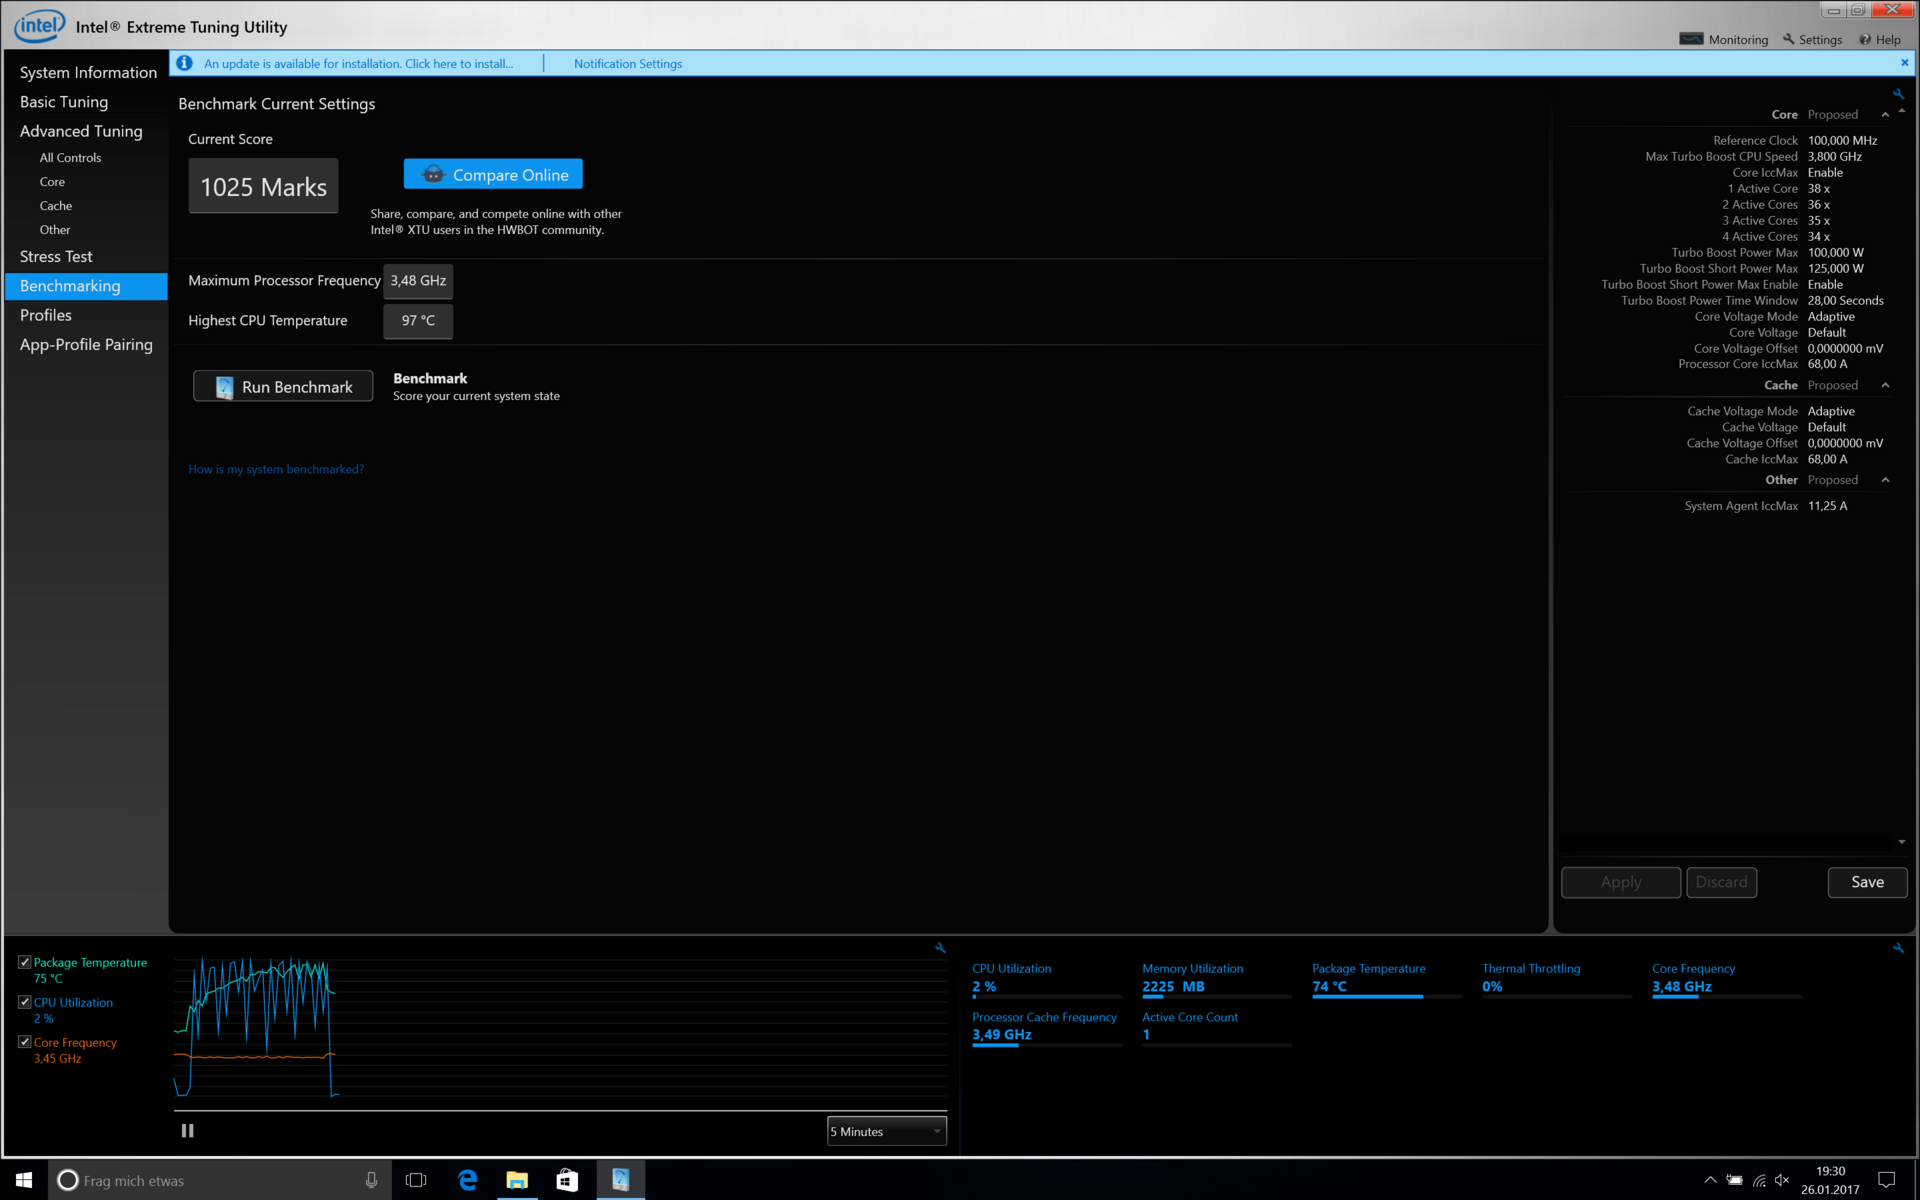
We can see a processor temperature of up to 97 °C (~207 °F) in the benchmarks, but the maximum clock of 3.4 GHz can be maintained. Even the extremely demanding tool Prime95 is executed with a steady clock of 3.3 GHz – a very good result.
But how does the more expensive MacBook Pro perform within our comparison group? The advantage over the base processor Core i7-6700HQ is 10 to 15% and only 5 to 8% over the i7-6820HQ. It is questionable whether this justifies an additional charge of $300. At least, normal users will not notice a difference in practice.
Power users that require every bit of performance have another problem right now. The Core i7-6920HQ is certainly a powerful processor, but only slightly faster compared to the new Kaby Lake Core i7-7700HQ. A comparable Core i7-7920HQ should be another 10% faster. However, the Kaby Lake chips will most probably not be available until the refresh next autumn.
The processor performance is not reduced on battery power. More benchmarks with the Core i7-6920HQ are listed in our Tech section.
System Performance
The top model of the current MacBook Pro 15 manages very good results in the synthetic PCMark 8 benchmarks (Windows Bootcamp) and can easily beat its less powerful siblings. This is a very fast notebook thanks to the powerful components, and the responsive handling is very enjoyable in practice.
| PCMark 8 Home Score Accelerated v2 | 4066 points | |
| PCMark 8 Creative Score Accelerated v2 | 4984 points | |
| PCMark 8 Work Score Accelerated v2 | 4755 points | |
Help | ||
Storage Devices
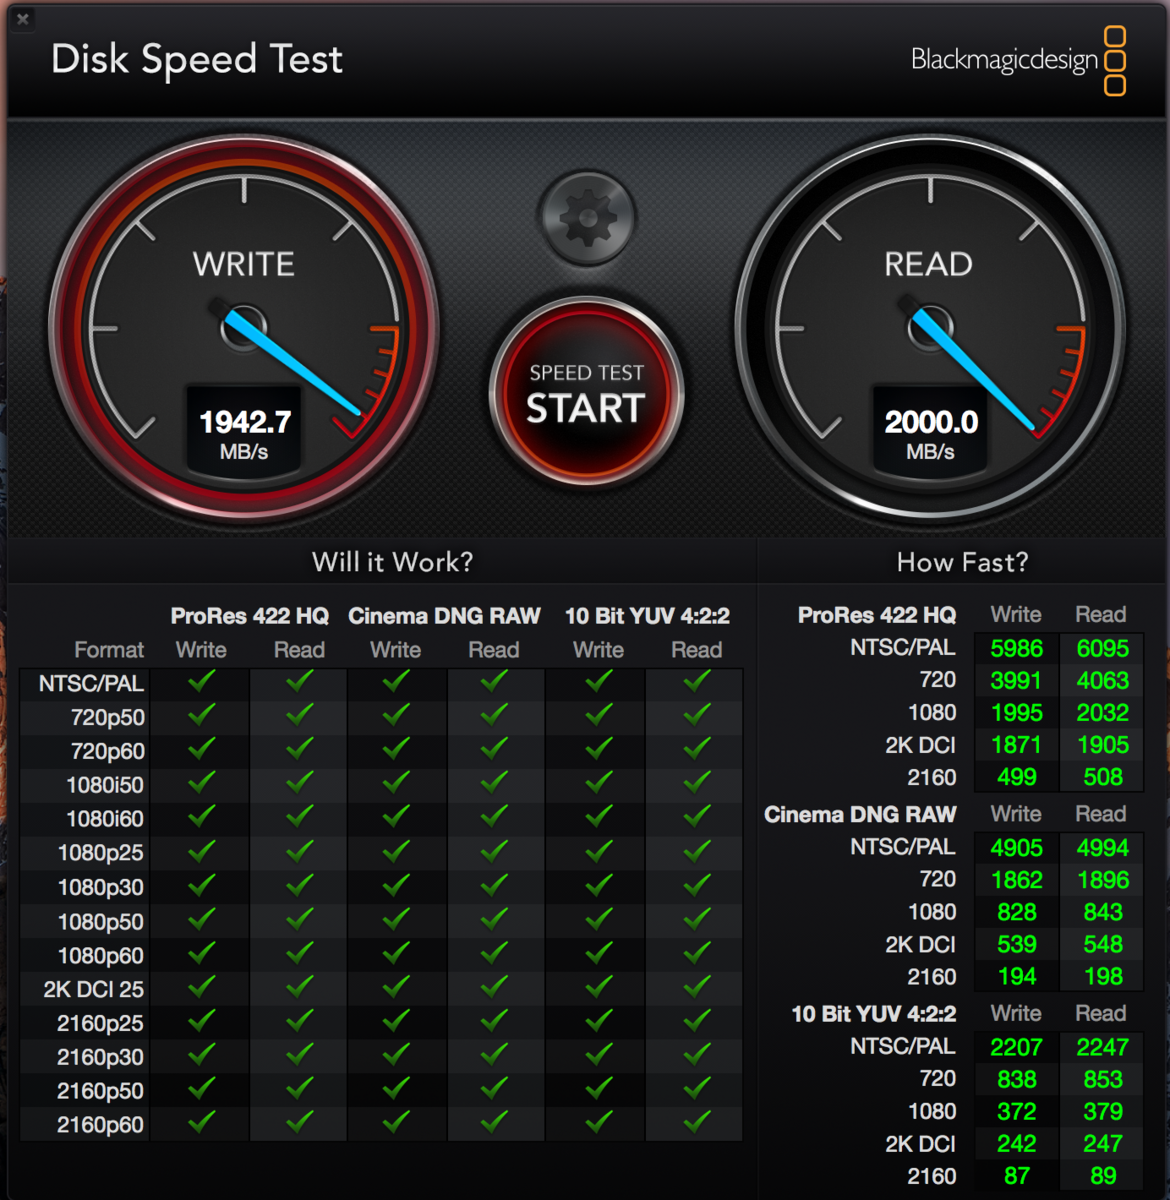
All three configurations of the MacBook Pro 15 use similar flash storage chips, only the capacity of the soldered model differs. Our version with 1 TB is slightly faster than the 256 GB model. We can determine sequential transfer rates of up to 2000 MB/s, so this is one of the fastest SSDs. It is also up to 500 MB/s faster (sequential write) than the entry-level model.

GPU Performance

The dedicated graphics card is the AMD Radeon Pro 460, which is based on the smaller Polaris 11 chip. Unlike the two less powerful models Radeon Pro 450 and Radeon Pro 455, however, the 460 utilizes the full number of shaders (1024). Another difference is the VRAM, because only the 460 is equipped with 4 GB GDDR5 VRAM. MacOS will automatically switch between the dedicated Radeon GPU and the integrated Intel HD Graphics 530 depending on the workload, but Windows (Bootcamp) can only use the dedicated GPU.
We used 3DMark (Windows Bootcamp) for the benchmarks. The Radeon Pro 460 is sitting on the expected level between the Nvidia GTX 960M and the GTX 965M both in 3DMark 11 as well as 3DMark Fire Strike (GPU subscores). However, the two new Pascal GPUs GeForce GTX 1050 and GTX 1050 Ti are another 30 and 70% faster in the current 3DMark. The OpenGL performance is on par with the Nvidia Quadro M1000M and roughly 10% behind the Quadro M2000M according to the Unigine Valley benchmark.
The smaller Radeon Pro 450 is beaten by 40 to 50% in general, so the GPU upgrade is the best way to increase the performance of the current MacBook Pro. As with the processor, the GPU performance is not reduced on battery power.
| Unigine Valley 1.0 - 1920x1080 Extreme HD Preset OpenGL AA:x8 | |
| Lenovo ThinkPad P50 | |
| Apple MacBook Pro 15 2016 (2.9 GHz, 460) | |
| Apple MacBook Pro 15 2016 (2.9 GHz, 460) | |
| HP ZBook Studio G3 | |
| Apple MacBook Pro 15 2016 (2.6 GHz, 450) | |
| Apple MacBook Pro 15 2016 (2.7 GHz, 455) | |
| Lenovo ThinkPad P40 Yoga 20GQ-0004GE | |
| 3DMark 06 Standard Score | 27694 points | |
| 3DMark Vantage P Result | 19234 points | |
| 3DMark 11 Performance | 6963 points | |
| 3DMark Cloud Gate Standard Score | 16824 points | |
| 3DMark Fire Strike Score | 4104 points | |
| 3DMark Fire Strike Extreme Score | 1980 points | |
| 3DMark Time Spy Score | 1374 points | |
Help | ||
Gaming Performance
The Radeon Pro 460 is neck and neck with the old GeForce GTX 960M in the gaming benchmarks, but the GTX 965M and the new Pascal chips in particular are usually noticeably faster.
We can see an advantage of around 30 to 40% for the Radeon Pro 460 compared to the Radeon Pro 450 from the entry-level model, but there can be outliers depending on the game. Many modern games can be played smoothly at high details in Full HD. Only more demanding games such as “Dishonored 2” or “Rise of the Tomb Raider” will require some reduced settings to ensure smooth frame rates.
| Rise of the Tomb Raider - 1920x1080 High Preset AA:FX AF:4x | |
| Acer Aspire VX5-591G-D0DD | |
| MSI GE72 965M Ti | |
| HP Omen 15-ax007ng | |
| Asus Strix GL753VD-GC045T | |
| HP Pavilion 17 FHD V3A33AV | |
| Schenker XMG A505 | |
| Apple MacBook Pro 15 2016 (2.9 GHz, 460) | |
| Apple MacBook Pro 15 2016 (2.7 GHz, 455) | |
| Apple MacBook Pro 15 2016 (2.6 GHz, 450) | |
| Apple MacBook Pro 15 2016 (2.6 GHz, 450) | |
| The Witcher 3 - 1920x1080 High Graphics & Postprocessing (Nvidia HairWorks Off) | |
| Acer Aspire VX5-591G-D0DD | |
| MSI GE72 965M Ti | |
| Asus Strix GL753VD-GC045T | |
| Apple MacBook Pro 15 2016 (2.9 GHz, 460) | |
| MSI GE62-6QD16H11 | |
| Schenker XMG A505 | |
| Apple MacBook Pro 15 2016 (2.7 GHz, 455) | |
| Apple MacBook Pro 15 2016 (2.6 GHz, 450) | |
| Apple MacBook Pro Retina 15 inch 2015-05 | |
| Battlefield 1 - 1920x1080 High Preset AA:T | |
| Acer Aspire VX5-591G-D0DD | |
| MSI GE72 965M Ti | |
| Asus Strix GL753VD-GC045T | |
| Apple MacBook Pro 15 2016 (2.9 GHz, 460) | |
| Schenker XMG A505 | |
| Apple MacBook Pro 15 2016 (2.7 GHz, 455) | |
| Apple MacBook Pro 15 2016 (2.6 GHz, 450) | |
| Apple MacBook Pro 13 2016 (2.9 GHz) | |
| Anno 2205 - 1920x1080 High Preset AA:4x | |
| Schenker XMG A726 | |
| Asus Strix GL753VD-GC045T | |
| Schenker XMG A505 | |
| Apple MacBook Pro 15 2016 (2.9 GHz, 460) | |
| Apple MacBook Pro 15 2016 (2.6 GHz, 450) | |
| Apple MacBook Pro 15 2016 (2.7 GHz, 455) | |
| Call of Duty Infinite Warfare - 1920x1080 High / On AA:FX | |
| MSI GE72 965M Ti | |
| Asus Strix GL753VD-GC045T | |
| Apple MacBook Pro 15 2016 (2.9 GHz, 460) | |
| Schenker XMG A505 | |
| Apple MacBook Pro 15 2016 (2.7 GHz, 455) | |
| Apple MacBook Pro 15 2016 (2.6 GHz, 450) | |
| low | med. | high | ultra | |
|---|---|---|---|---|
| Sims 4 (2014) | 164.9 | 69.6 | 63 | |
| The Witcher 3 (2015) | 83.3 | 28.9 | 17.4 | |
| Anno 2205 (2015) | 120.9 | 25.9 | 8.8 | |
| Rainbow Six Siege (2015) | 150.3 | 55.2 | 45 | |
| Rise of the Tomb Raider (2016) | 76 | 25.8 | 20.8 | |
| XCOM 2 (2016) | 88.7 | 31.9 | 21.7 | 9.9 |
| Far Cry Primal (2016) | 74 | 35 | 32 | 21 |
| The Division (2016) | 102.8 | 28.9 | 22.3 | |
| Doom (2016) | 65 | 30.3 | 29.7 | |
| Overwatch (2016) | 201.5 | 106.7 | 48.8 | |
| Deus Ex Mankind Divided (2016) | 66.6 | 25 | 12.2 | |
| FIFA 17 (2016) | 316.6 | 151.9 | 146.4 | |
| Battlefield 1 (2016) | 132.6 | 40.9 | 35.4 | |
| Farming Simulator 17 (2016) | 235.5 | 92.3 | 34.7 | |
| Titanfall 2 (2016) | 115.6 | 35.3 | 32 | |
| Call of Duty Infinite Warfare (2016) | 85.5 | 46.3 | 40.6 | |
| Dishonored 2 (2016) | 61.4 | 26 | 22.9 | |
| Resident Evil 7 (2017) | 157.8 | 47.1 | 21.7 |
Emissions
System Noise
The behavior of the two system fans is very similar to the entry-level model of the Apple MacBook Pro 15. Once again, the fans are spinning while idling, but the resulting noise of little more than 30 dB(A) is only audible as a subtle murmur in very quiet environments.
When we start to stress the MacBook with our benchmarks, for example, the fans will seamlessly increase their speed up to audible 35 dB(A). Maximum load will result in up to 46 dB(A), which is once again, on par with the less powerful model. This might be surprising at first since our test model is equipped with faster components. We will see that the power adapter is the limiting factor very soon. Both laptops consume the same amount of power in this scenario, so the cooling solution has to handle the same amount of heat. Both fans could reach even higher speeds at up to more than 50 dB(A) in theory.
Noise level
| Idle |
| 30.3 / 30.3 / 30.3 dB(A) |
| Load |
| 35.1 / 46 dB(A) |
 | ||
30 dB silent 40 dB(A) audible 50 dB(A) loud |
||
min: | ||
| Apple MacBook Pro 15 2016 (2.9 GHz, 460) Radeon Pro 460, 6920HQ, Apple SSD SM1024L | Apple MacBook Pro 15 2016 (2.6 GHz, 450) Radeon Pro 450, 6700HQ, Apple SSD SM0256L | Apple MacBook Pro 15 2016 (2.7 GHz, 455) Radeon Pro 455, 6820HQ, Apple SSD SM0512L | Apple MacBook Pro Retina 15 inch 2015-05 Radeon R9 M370X, 4870HQ, Apple SSD SM0512G | Dell XPS 15-9550 i7 GeForce GTX 960M, 6700HQ, Samsung PM951 NVMe 512 GB | |
|---|---|---|---|---|---|
| Noise | -1% | -5% | -3% | -10% | |
| off / environment * (dB) | 29 | 30.4 -5% | 30.4 -5% | ||
| Idle Minimum * (dB) | 30.3 | 30.6 -1% | 30.8 -2% | 28.9 5% | 31.4 -4% |
| Idle Average * (dB) | 30.3 | 30.6 -1% | 30.8 -2% | 28.9 5% | 32.5 -7% |
| Idle Maximum * (dB) | 30.3 | 30.6 -1% | 30.8 -2% | 28.9 5% | 33.6 -11% |
| Load Average * (dB) | 35.1 | 34.7 1% | 38.7 -10% | 46 -31% | 45.2 -29% |
| Load Maximum * (dB) | 46 | 46.3 -1% | 48.8 -6% | 46 -0% | 46 -0% |
* ... smaller is better
Temperature
We can determine only small differences for the chassis temperatures between the different models of the MacBook Pro 15. Only the central area (CPU/GPU) warms up while idling and with light workloads, but the average values for the top and the bottom of the base unit are at around 28 °C (~82 °F). We can only see the maximum values of 42 to 44 °C (~108 to 111 °F) during our stress test (Windows). The thermal pictures clearly show the position of the heat pipes from the processors to the fans. However, the palm rests are always conveniently cool (less than 30 °C/~86 °F).
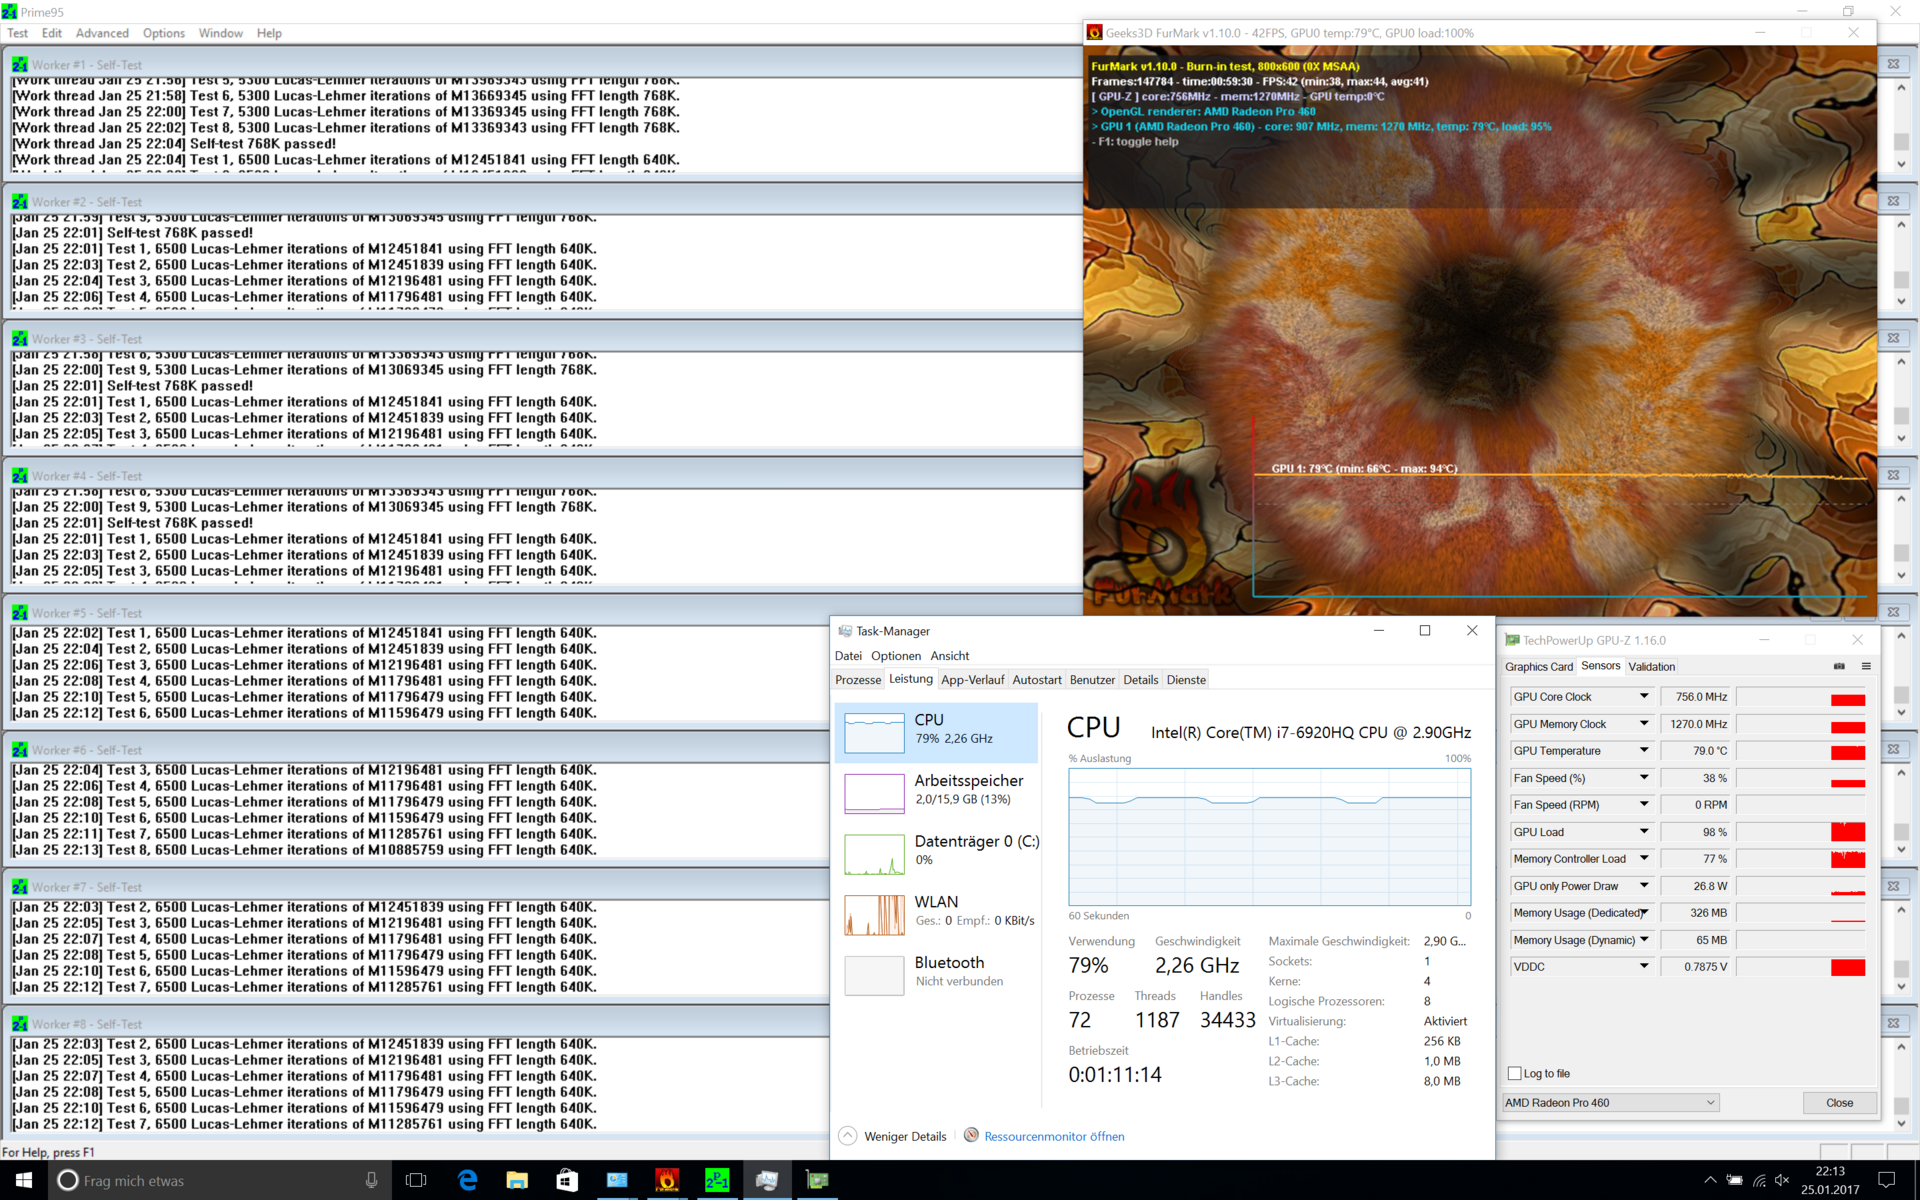
We have already noticed that the components – especially the processor – can reach very high temperatures of almost 100 °C (~212 °F). However, it can maintain the high clocks because the challenging tool Prime95 is executed with ~3.3 GHz. GPU load by FurMark is no problem for the graphics card either, because the core can maintain 907 MHz at a temperature of 77 °C (~171 °F).
The power adapter is the limiting factor during our stress test with both tools (Prime95 and FurMark run for at least one hour). The processor drops to ~2.3 GHz at 84 °C (~183 °F) and the GPU to ~750 MHz at 79 °C (~174 °F). This is unfortunate since the cooling solution still has some headroom.
(±) The maximum temperature on the upper side is 44.2 °C / 112 F, compared to the average of 36.8 °C / 98 F, ranging from 21 to 71 °C for the class Multimedia.
(±) The bottom heats up to a maximum of 41.6 °C / 107 F, compared to the average of 39.1 °C / 102 F
(+) In idle usage, the average temperature for the upper side is 28.2 °C / 83 F, compared to the device average of 31.3 °C / 88 F.
(+) The palmrests and touchpad are cooler than skin temperature with a maximum of 27.8 °C / 82 F and are therefore cool to the touch.
(±) The average temperature of the palmrest area of similar devices was 28.7 °C / 83.7 F (+0.9 °C / 1.7 F).
| Apple MacBook Pro 15 2016 (2.9 GHz, 460) Radeon Pro 460, 6920HQ, Apple SSD SM1024L | Apple MacBook Pro 15 2016 (2.6 GHz, 450) Radeon Pro 450, 6700HQ, Apple SSD SM0256L | Apple MacBook Pro 15 2016 (2.7 GHz, 455) Radeon Pro 455, 6820HQ, Apple SSD SM0512L | Apple MacBook Pro Retina 15 inch 2015-05 Radeon R9 M370X, 4870HQ, Apple SSD SM0512G | Dell XPS 15-9550 i7 GeForce GTX 960M, 6700HQ, Samsung PM951 NVMe 512 GB | |
|---|---|---|---|---|---|
| Heat | 13% | 1% | 6% | -5% | |
| Maximum Upper Side * (°C) | 44.2 | 43 3% | 46 -4% | 43.2 2% | 55.9 -26% |
| Maximum Bottom * (°C) | 41.6 | 40 4% | 39 6% | 39 6% | 50 -20% |
| Idle Upper Side * (°C) | 33.6 | 26 23% | 30 11% | 28.1 16% | |
| Idle Bottom * (°C) | 31.1 | 25 20% | 29.3 6% | 27.9 10% |
* ... smaller is better
Energy Management
Power Consumption
Our power consumption measurements do not reveal big differences either. We use macOS for the idle values, because the integrated GPU works on macOS only. The two measurements under load on the other hand, are performed on Windows (Bootcamp). The MacBook Pro 15 is very efficient in general, which is also confirmed by the comparison with the Dell XPS 15 and the previous MacBook Pro 15. However, our measurements also show a limitation at 90 watts, even though the value could be higher in theory. It is very unfortunate that Apple still uses a power adapter with a nominal output of 87 watts.
| Off / Standby | |
| Idle | |
| Load |
|
Key:
min: | |
| Apple MacBook Pro 15 2016 (2.9 GHz, 460) 6920HQ, Radeon Pro 460, 2880x1800 | Apple MacBook Pro 15 2016 (2.6 GHz, 450) 6700HQ, Radeon Pro 450, 2880x1800 | Apple MacBook Pro 15 2016 (2.7 GHz, 455) 6820HQ, Radeon Pro 455, 2880x1800 | Apple MacBook Pro Retina 15 inch 2015-05 4870HQ, Radeon R9 M370X, 2880x1800 | Dell XPS 15-9550 i7 6700HQ, GeForce GTX 960M, 3840x2160 | |
|---|---|---|---|---|---|
| Power Consumption | 7% | -3% | -31% | -112% | |
| Idle Minimum * (Watt) | 3 | 2.9 3% | 4 -33% | 6 -100% | 12.5 -317% |
| Idle Average * (Watt) | 9.9 | 9.7 2% | 10.9 -10% | 12.8 -29% | 19.6 -98% |
| Idle Maximum * (Watt) | 12.5 | 10.1 19% | 10.9 13% | 13.3 -6% | 22.8 -82% |
| Load Average * (Watt) | 70.6 | 65 8% | 64.6 8% | 82.4 -17% | 102 -44% |
| Load Maximum * (Watt) | 90.8 | 89.5 1% | 86.7 5% | 91.8 -1% | 107 -18% |
* ... smaller is better
Battery Runtime
It seems that there have been some optimizations since we reviewed the new Apple MacBook Pro 15 at the end of last year. The laptop now squeezes 15 minutes more out of the 76-Wh battery in the WLAN test at an adjusted luminance of 150 nits. The video runtime is even 30 minutes longer. Practical runtimes of 9 to 10 hours should easily be sufficient to last a full business day. As with the previous test model, the battery will last a little more than 50 minutes under load.
| Apple MacBook Pro 15 2016 (2.9 GHz, 460) 6920HQ, Radeon Pro 460, 76 Wh | Apple MacBook Pro 15 2016 (2.6 GHz, 450) 6700HQ, Radeon Pro 450, 76 Wh | Apple MacBook Pro 15 2016 (2.7 GHz, 455) 6820HQ, Radeon Pro 455, 76 Wh | Apple MacBook Pro Retina 15 inch 2015-05 4870HQ, Radeon R9 M370X, 100 Wh | Dell XPS 15-9550 i7 6700HQ, GeForce GTX 960M, 84 Wh | |
|---|---|---|---|---|---|
| Battery runtime | -3% | 2% | 15% | 14% | |
| H.264 (h) | 9.1 | 8.6 -5% | 6.9 -24% | 5.3 -42% | |
| WiFi v1.3 (h) | 10.3 | 10 -3% | 10.6 3% | 7.2 -30% | 5.2 -50% |
| Load (h) | 0.9 | 0.9 0% | 0.9 0% | 1.8 100% | 2.1 133% |
Pros
Cons
Verdict
This review update was primarily focused on the performance of the faster components as well as their effects on the emissions and the battery runtime. The dedicated graphics card AMD Radeon Pro 460 left the best impression, because it is about 40% faster (on average) than the entry-level Radeon Pro 450. We think this justifies the additional charge of $200.
We are not so impressed with the processor. The Core i7-6920HQ is about 10 to 15% faster than the regular Core i7-6700HQ, but this is also the case for the new entry-level quad-core i7-7700HQ, so you basically pay $300 for an "old" upgrade. The processor architecture is identical, so switching out the Skylake models with the new Kaby Lake CPUs should not be a big problem, but Apple users will probably have to wait until the next refresh.
We can clearly recommend the GPU upgrade, but the performance of the entry-level processor is usually sufficient.
Another unnecessary problem is the limitation by the power adapter. You cannot use the full performance when you really stress both components. This is even more annoying since the cooling solution still has some headroom. The other advantages and drawbacks obviously apply here as well, so once again, we refer you to our comprehensive review of the entry-level model.
Apple MacBook Pro 15 2016 (2.9 GHz, 460)
- 01/31/2017 v6 (old)
Andreas Osthoff, Till Schönborn
Price comparison
