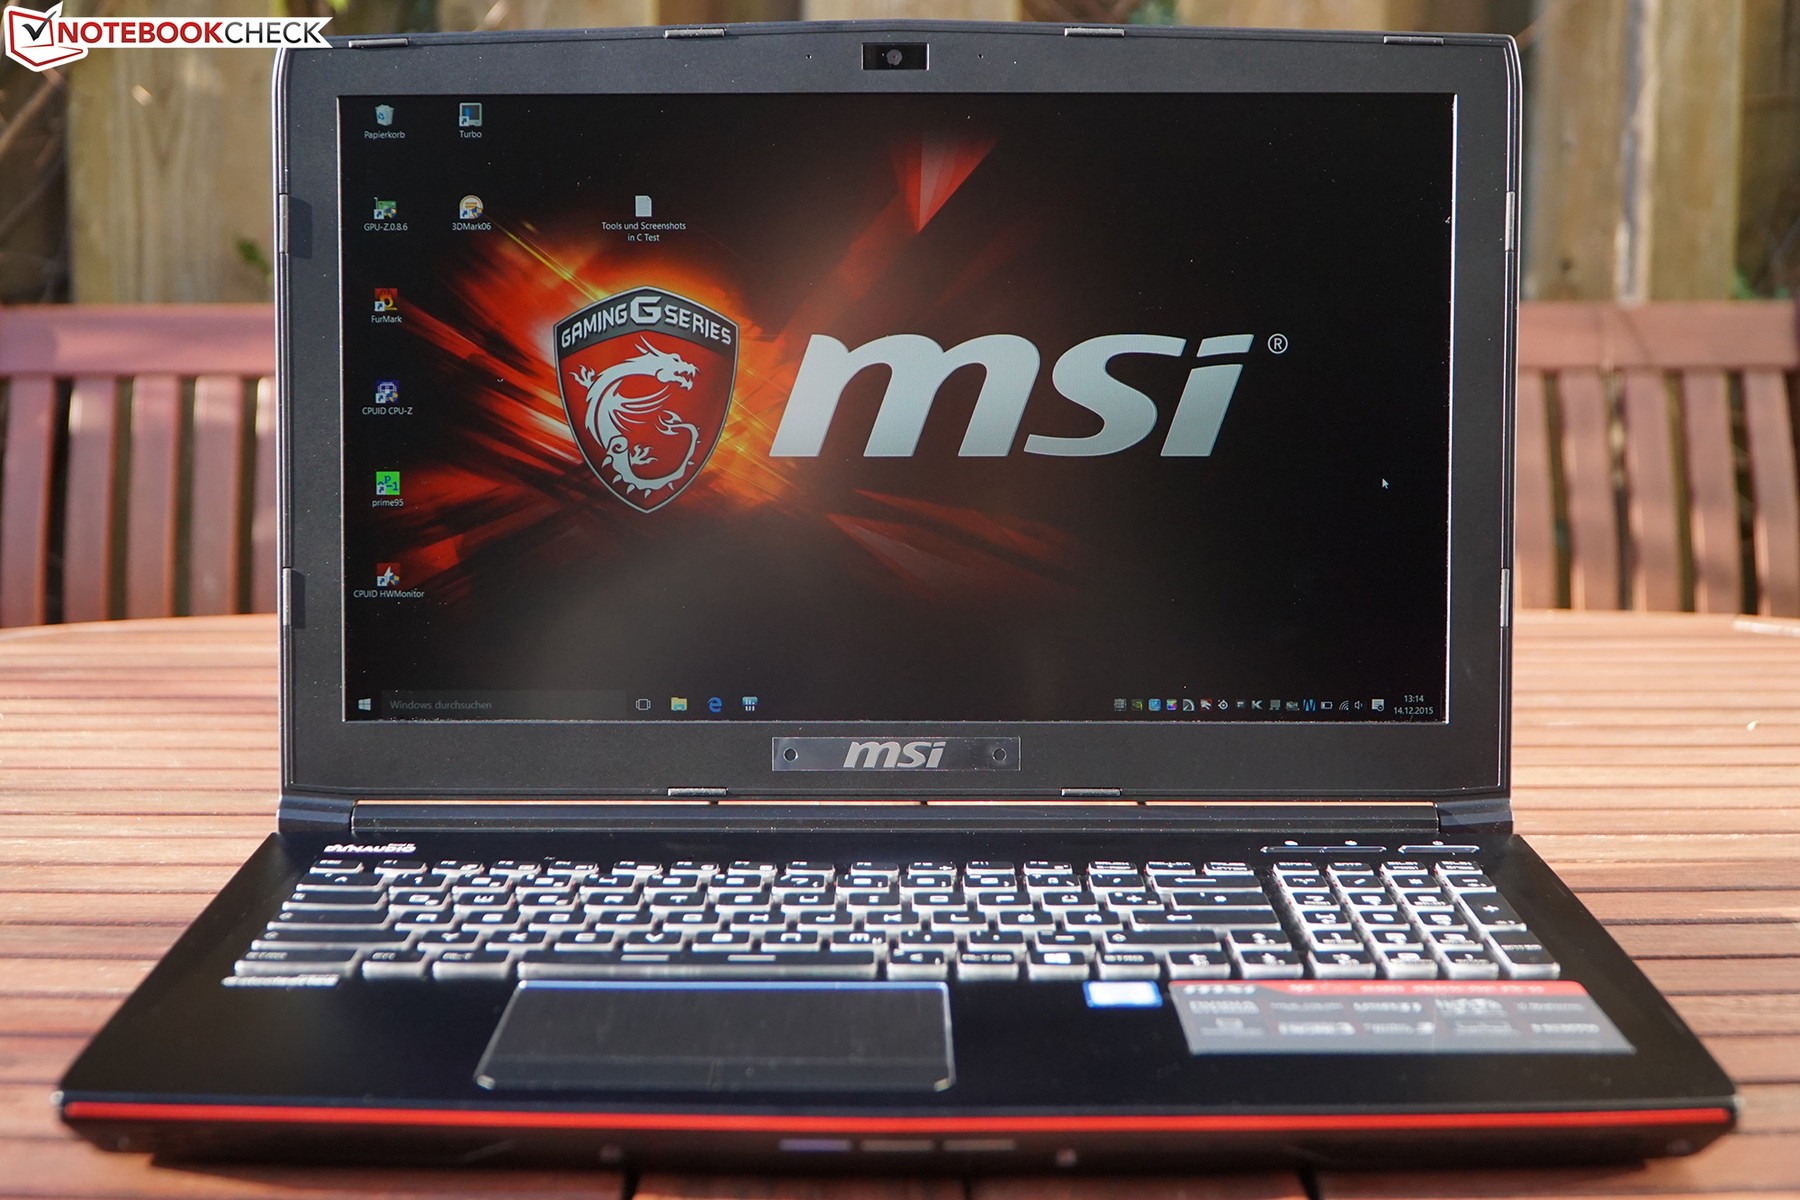
MSI GE62 6QD Apache Pro Notebook Review

For the original German review, see here.
We welcomed two Haswell-based MSI GE62 devices a bit over half a year ago. Only their graphics chips differed - GeForce GTX 965M versus GTX 970M -, which allowed us to put the performance difference into relation with the price. In addition to the CPU and memory configuration, they had the glare-type 4K panel in common. Its low brightness and high color shift did not really convince us.
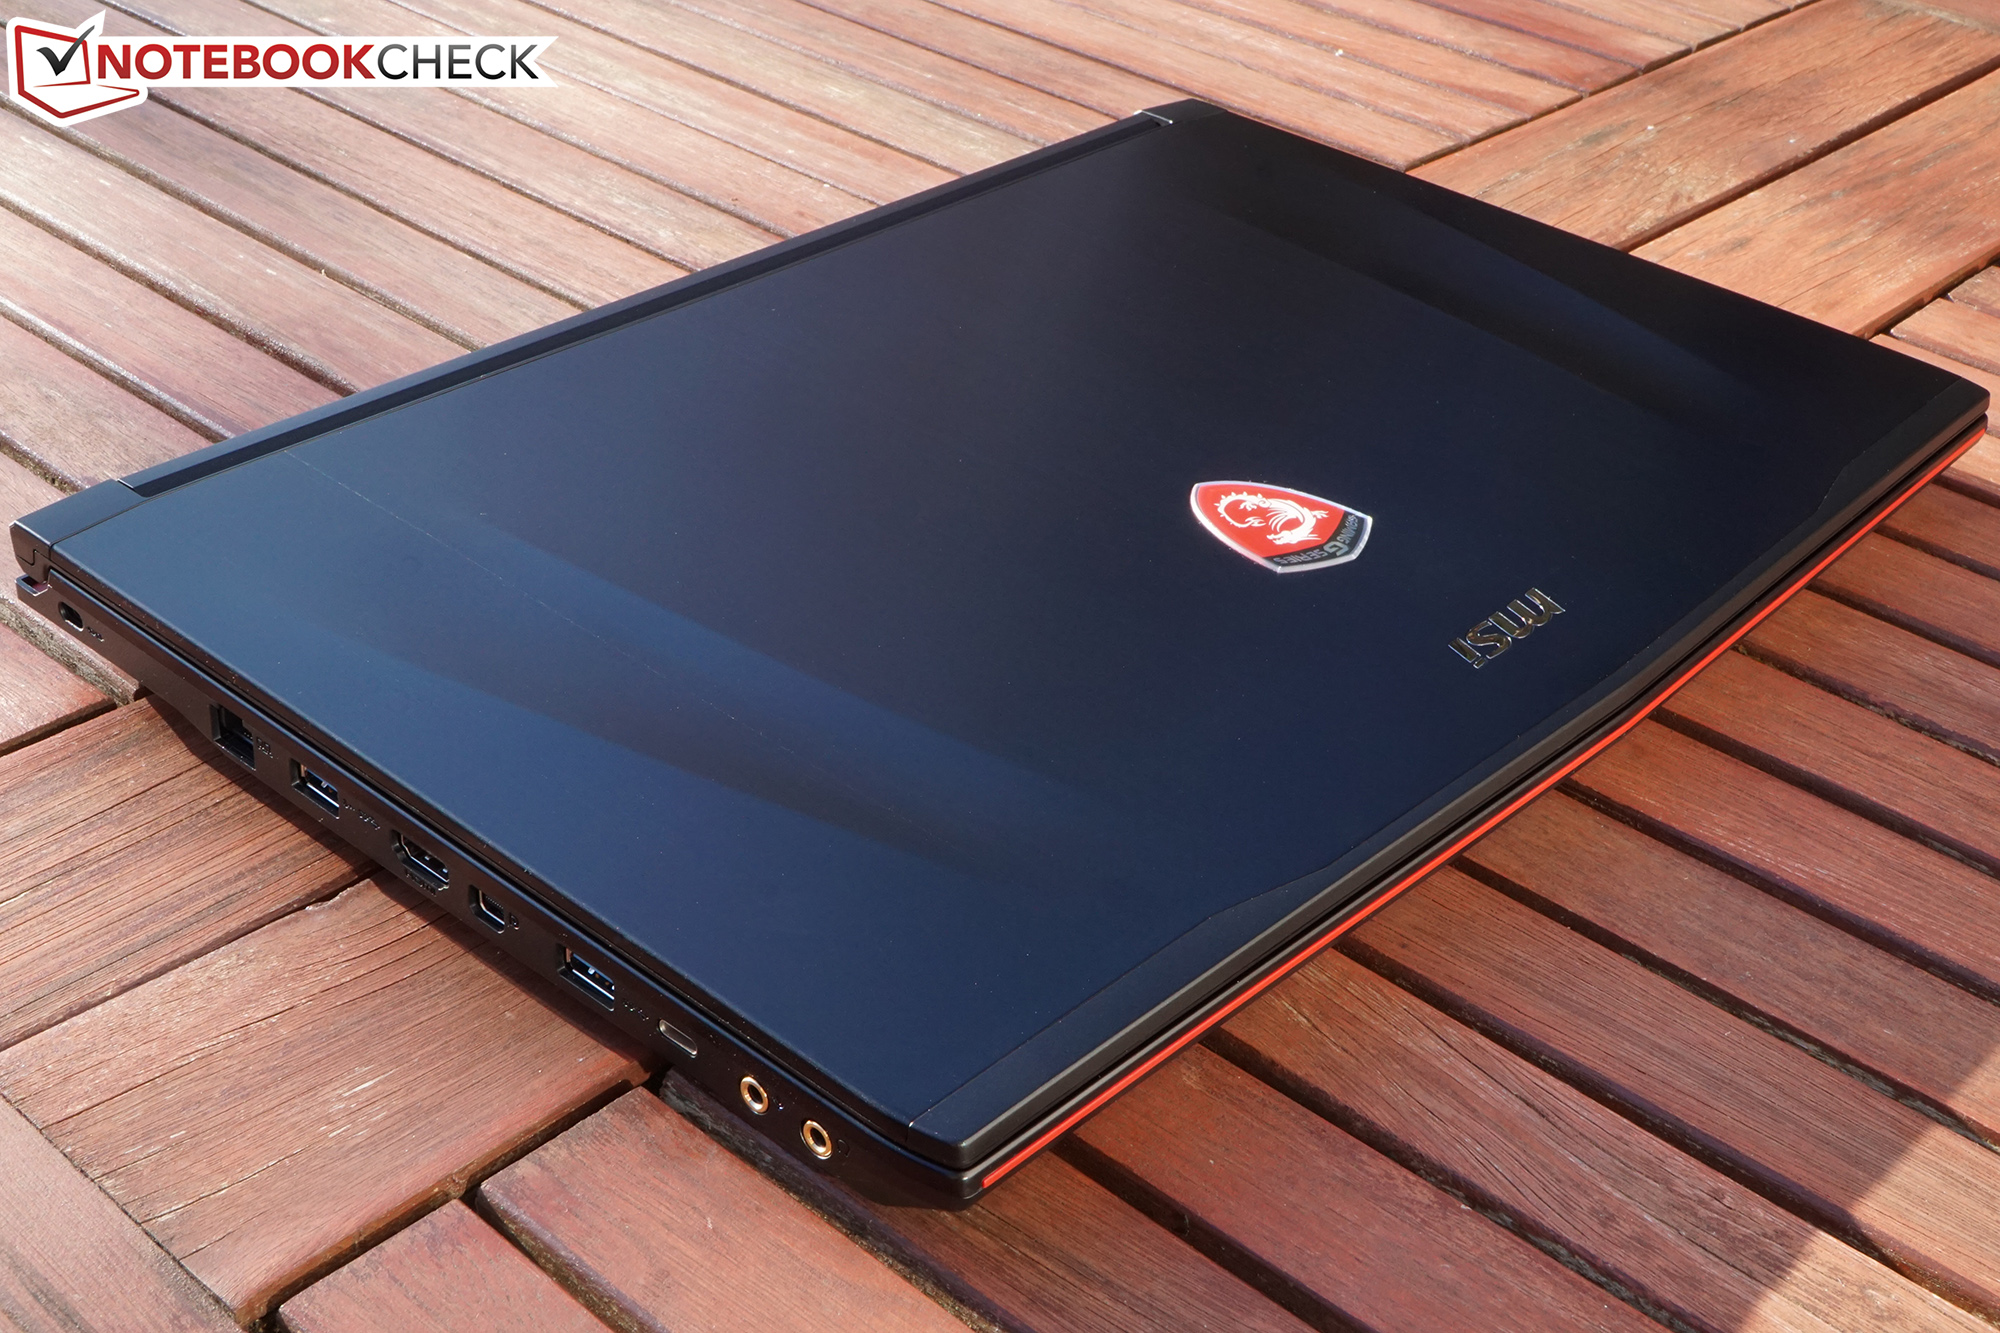
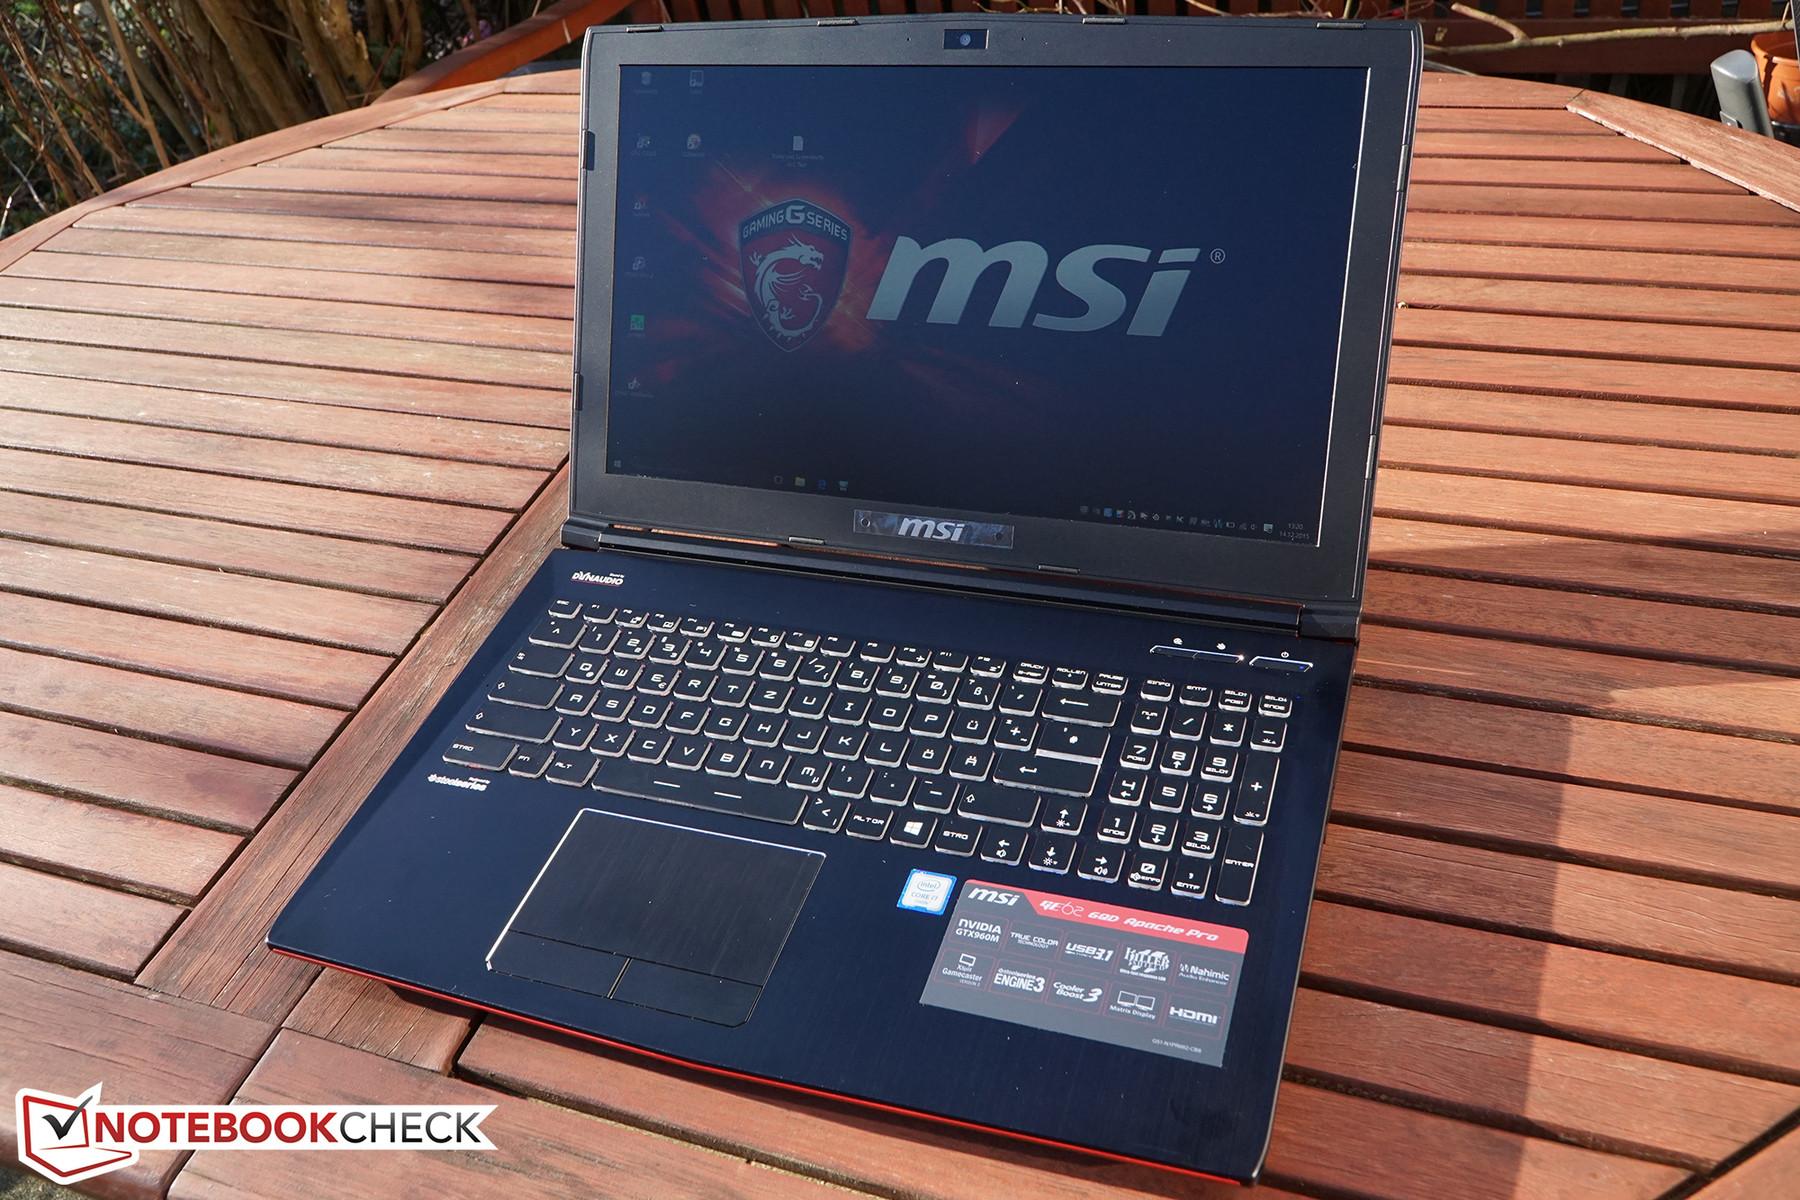
Now we have the opportunity to closely examine an updated Full HD model. The update does not involve many exterior modifications - apart from a USB 3.1 (Type C) port, the wrapping is identical. The innovations inside are more fundamental: It is now powered by a Core i7-6700HQ from the Skylake lineup rather than the former Core i7-4720HQ. A dedicated GeForce GTX 960M graphics solution is installed in our review sample.
The present GE2 6QD is the "smallest" version in the GE62 lineup and brings it lightly into the mid-range. Only MSI presently sells both Haswell models with a GTX 965M (GE62 2QE) and 970M (GE62 2QF). The GE62 6QF is the new top model. Although it sports a GTX 970M, it is also furnished with an i7-6700HQ Skylake CPU. To make things even more confusing, most models of the lineup are available with either UHD or Full HD screens.
Thus, our review sample also faces some serious in-house competition in the 15-inch sector. It has to prove that it really has an edge on both Haswell GE62 models. "Company-foreign" rivals, based on the same CPU-GPU combination and equal screen resolution, are Nexoc's G515 II and Lenovo's IdeaPad Y700 that we are presently testing. Dell's Inspiron 15 7559 also relies on a Core i7-6700HQ plus GeForce GTX 960M, but has a touchscreen with 4K resolution. Finally, Alienware's 15 R2 represents the luxury class in the mobile-gaming sector with its i7-6700HQ and GTX 980M - it is currently in fifth place in our Top 10 charts as the best 15-inch device.
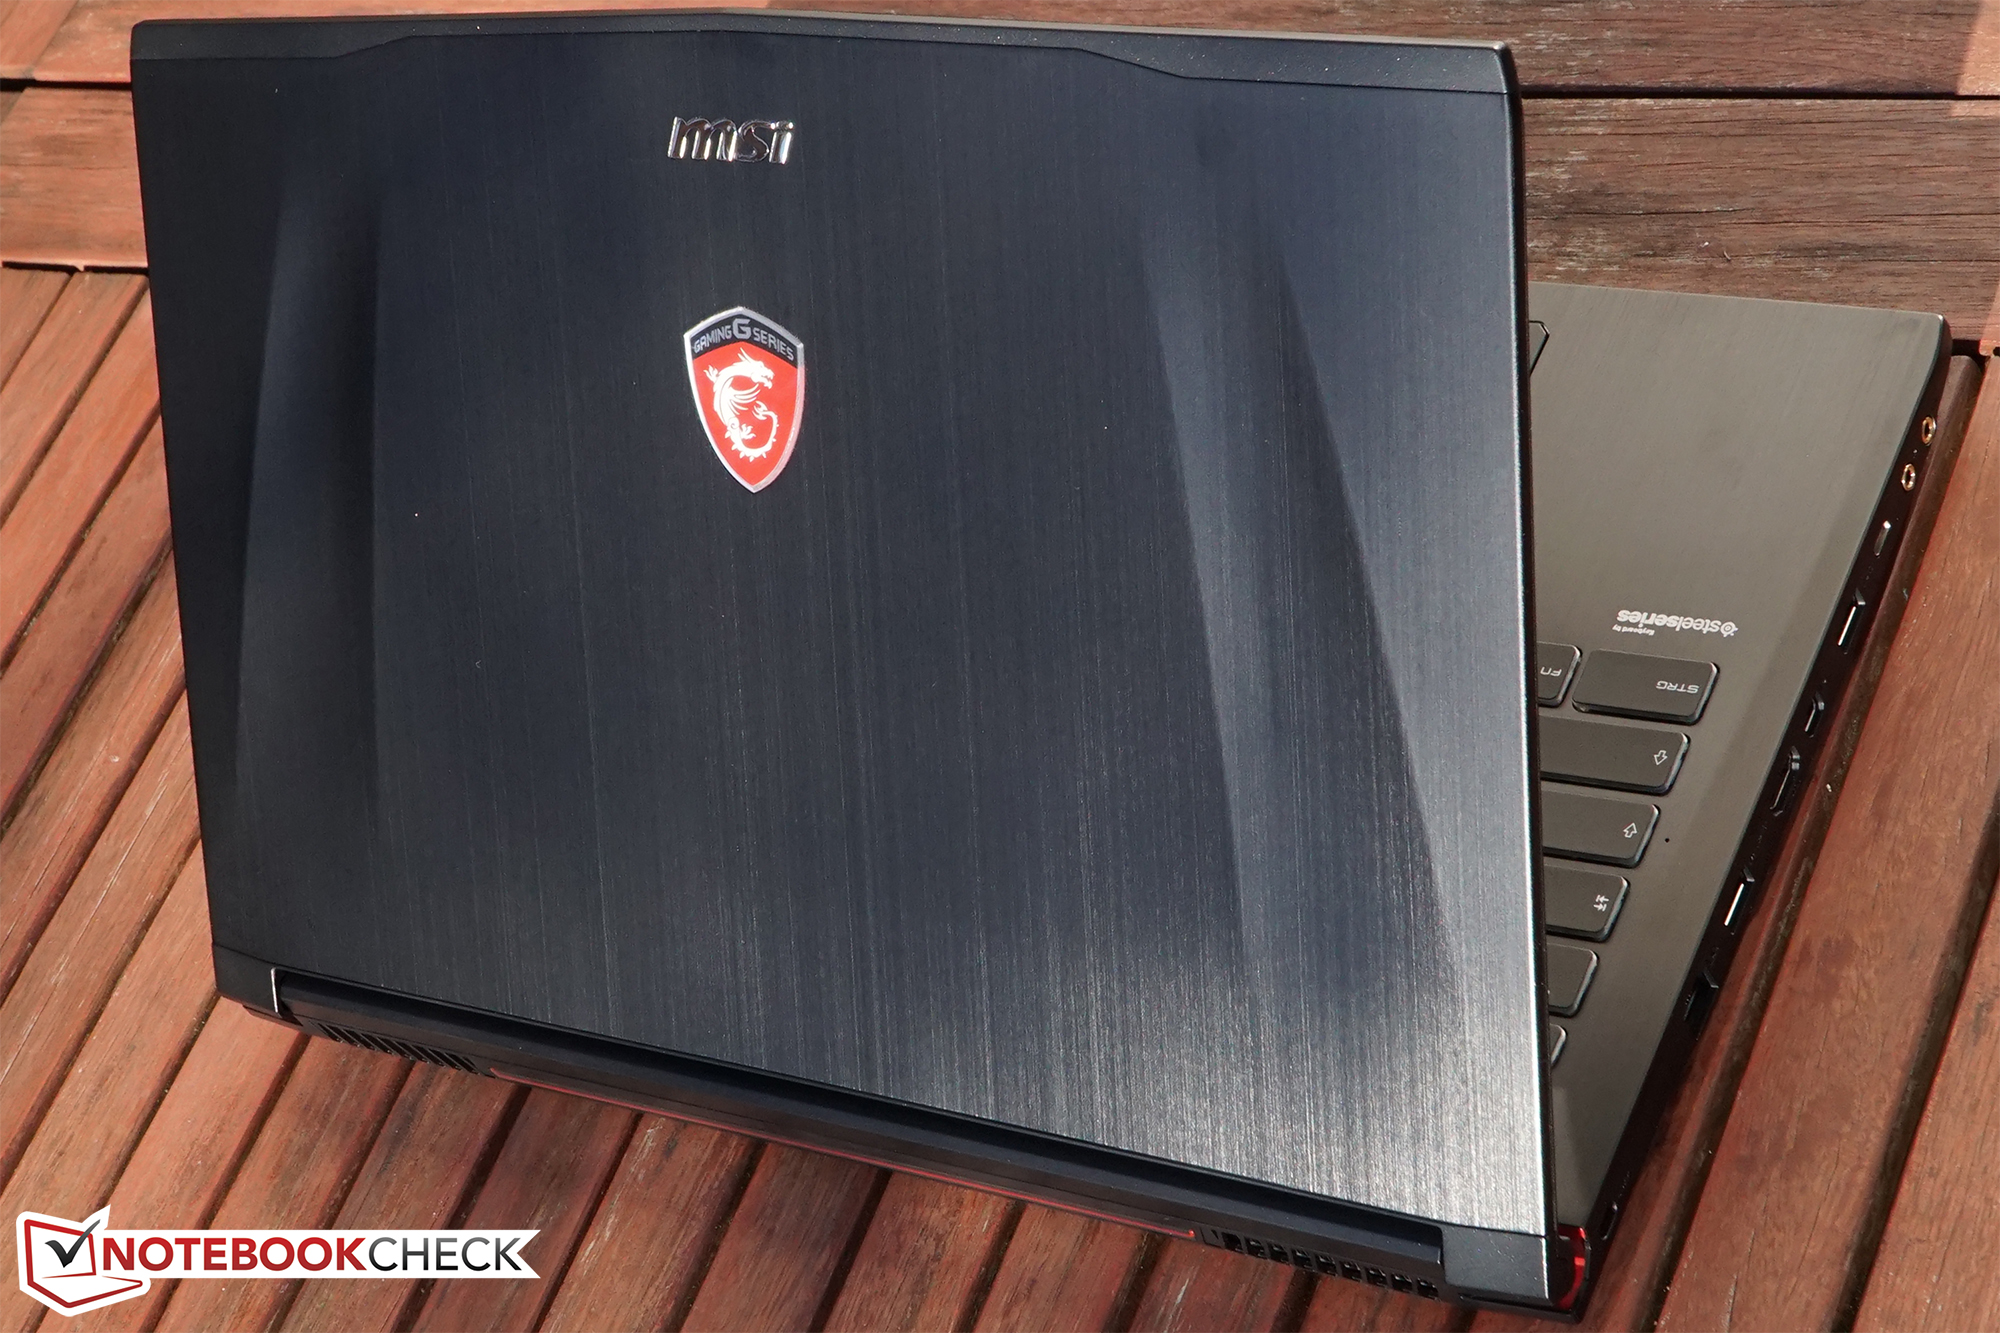
Since the casing and input devices are quite similar to those of the predecessors, we refer to the in-depth review of MSI's GE62 2QE. Instead, we would like to dedicate ourselves to the aspects that have really been modified.
Connectivity
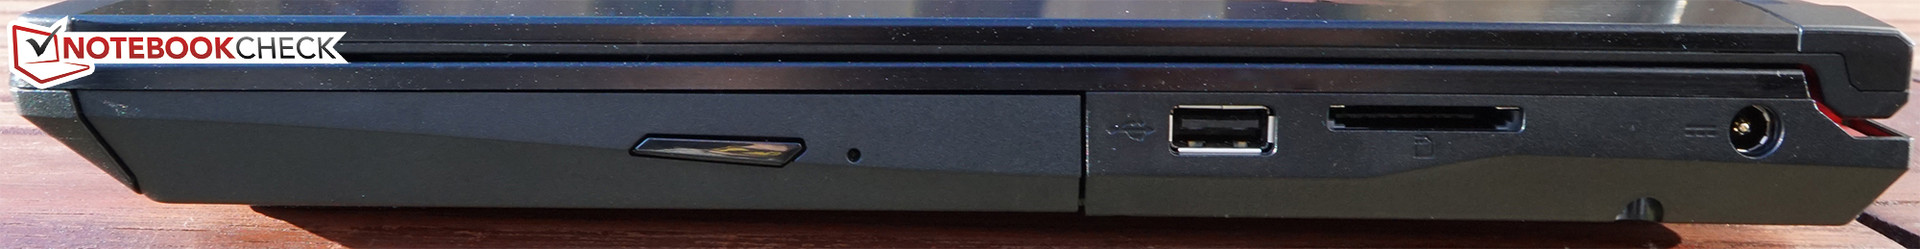
Admittedly, not many innovations are found here: One of the left-sided USB 3.0 ports has been replaced with a USB 3.1 Type C port. It is connected to a separate host controller by AS Media so that it can accomplish the higher speed of 10 Gbit/s, so it doesn't just provide the new interface type. Nothing has changed otherwise - the interface diversity is on a good average level. The ports are sufficiently spaced for preventing connection conflicts.
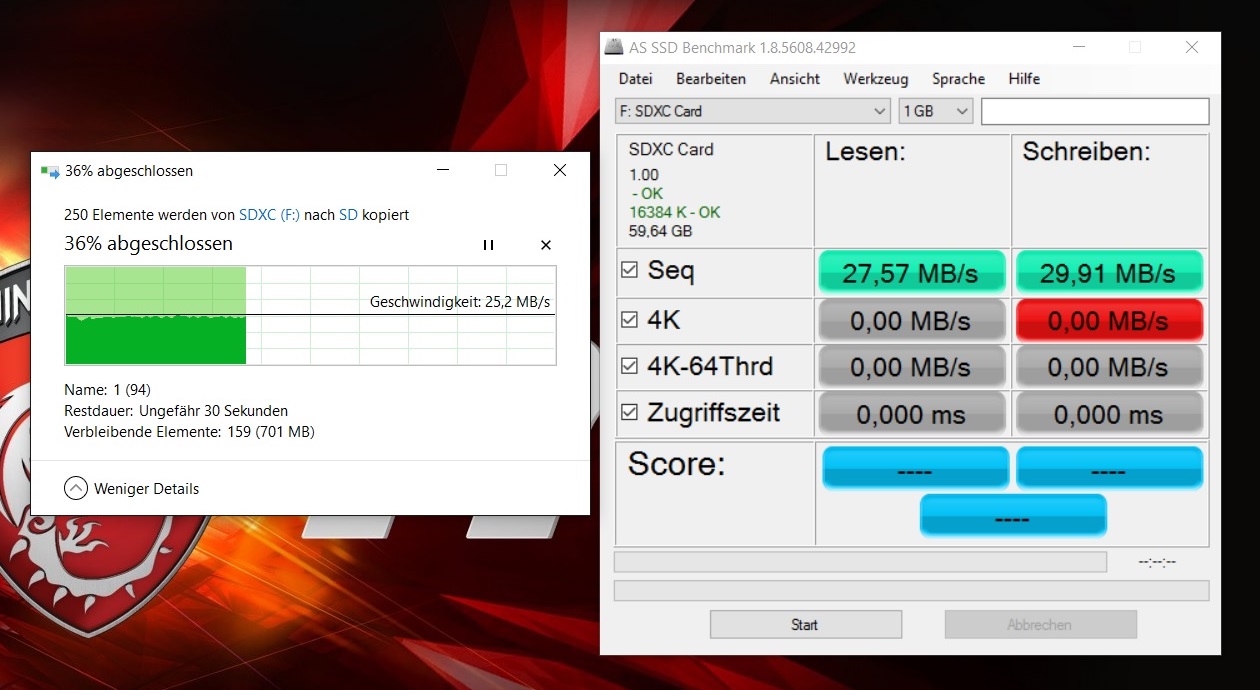
The installed card reader only achieves transfer rates on the level of USB 2.0. We measure transfer rates of just 30 MB in the test with our Toshiba Exceria Pro SDXC 64 GB UHS-II reference card. More should definitely be offered in this price range.

Display
The matte IPS FHD screen by LG Philips installed in our review sample (LP156WF6) has convinced us many times before. For example, it is found in both the Acer Aspire V 15 Nitro and Dell Latitude 3550 and turns up twice in the upper half our display charts.
1920x1080 pixels on 15.6-inches: Previously a good standard, it almost seems a bit outdated in view of the increasing number of devices with a UHD panel. However, a scrutinizing glance shows that "more" is not the same as "better". The present screen defeats MSI's own UHD version in all rating categories. The contrast difference is very extreme, but the color shifts of our review sample's screen are also lower than in the GE62 2QE.
Overall, we are dealing with a superb screen with a total quality unmatched by any comparison device here. Single rivals might score better in the one or other partial section, but none of the immediate followers deliver such a good total package.
| |||||||||||||||||||||||||
Brightness Distribution: 88 %
Center on Battery: 300 cd/m²
Contrast: 938:1 (Black: 0.32 cd/m²)
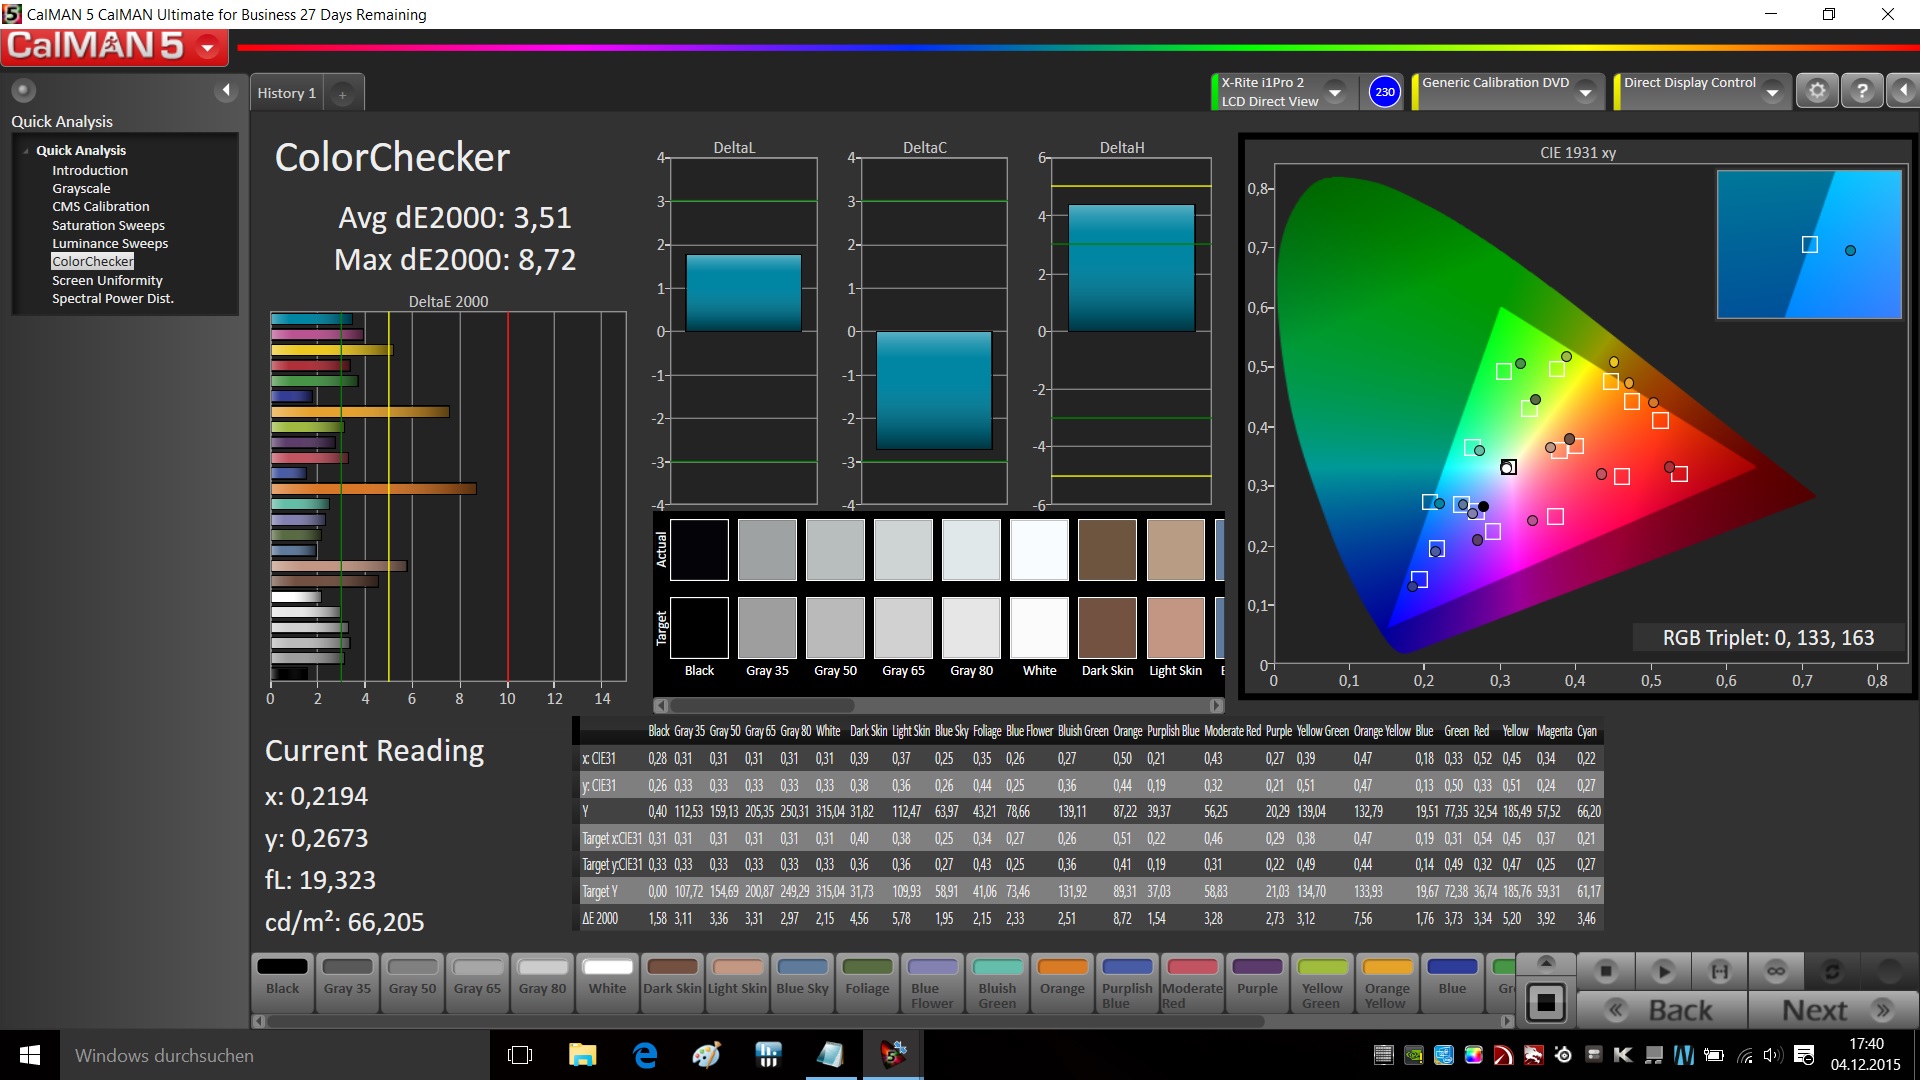
ΔE ColorChecker Calman: 3.51 | ∀{0.5-29.43 Ø4.72}
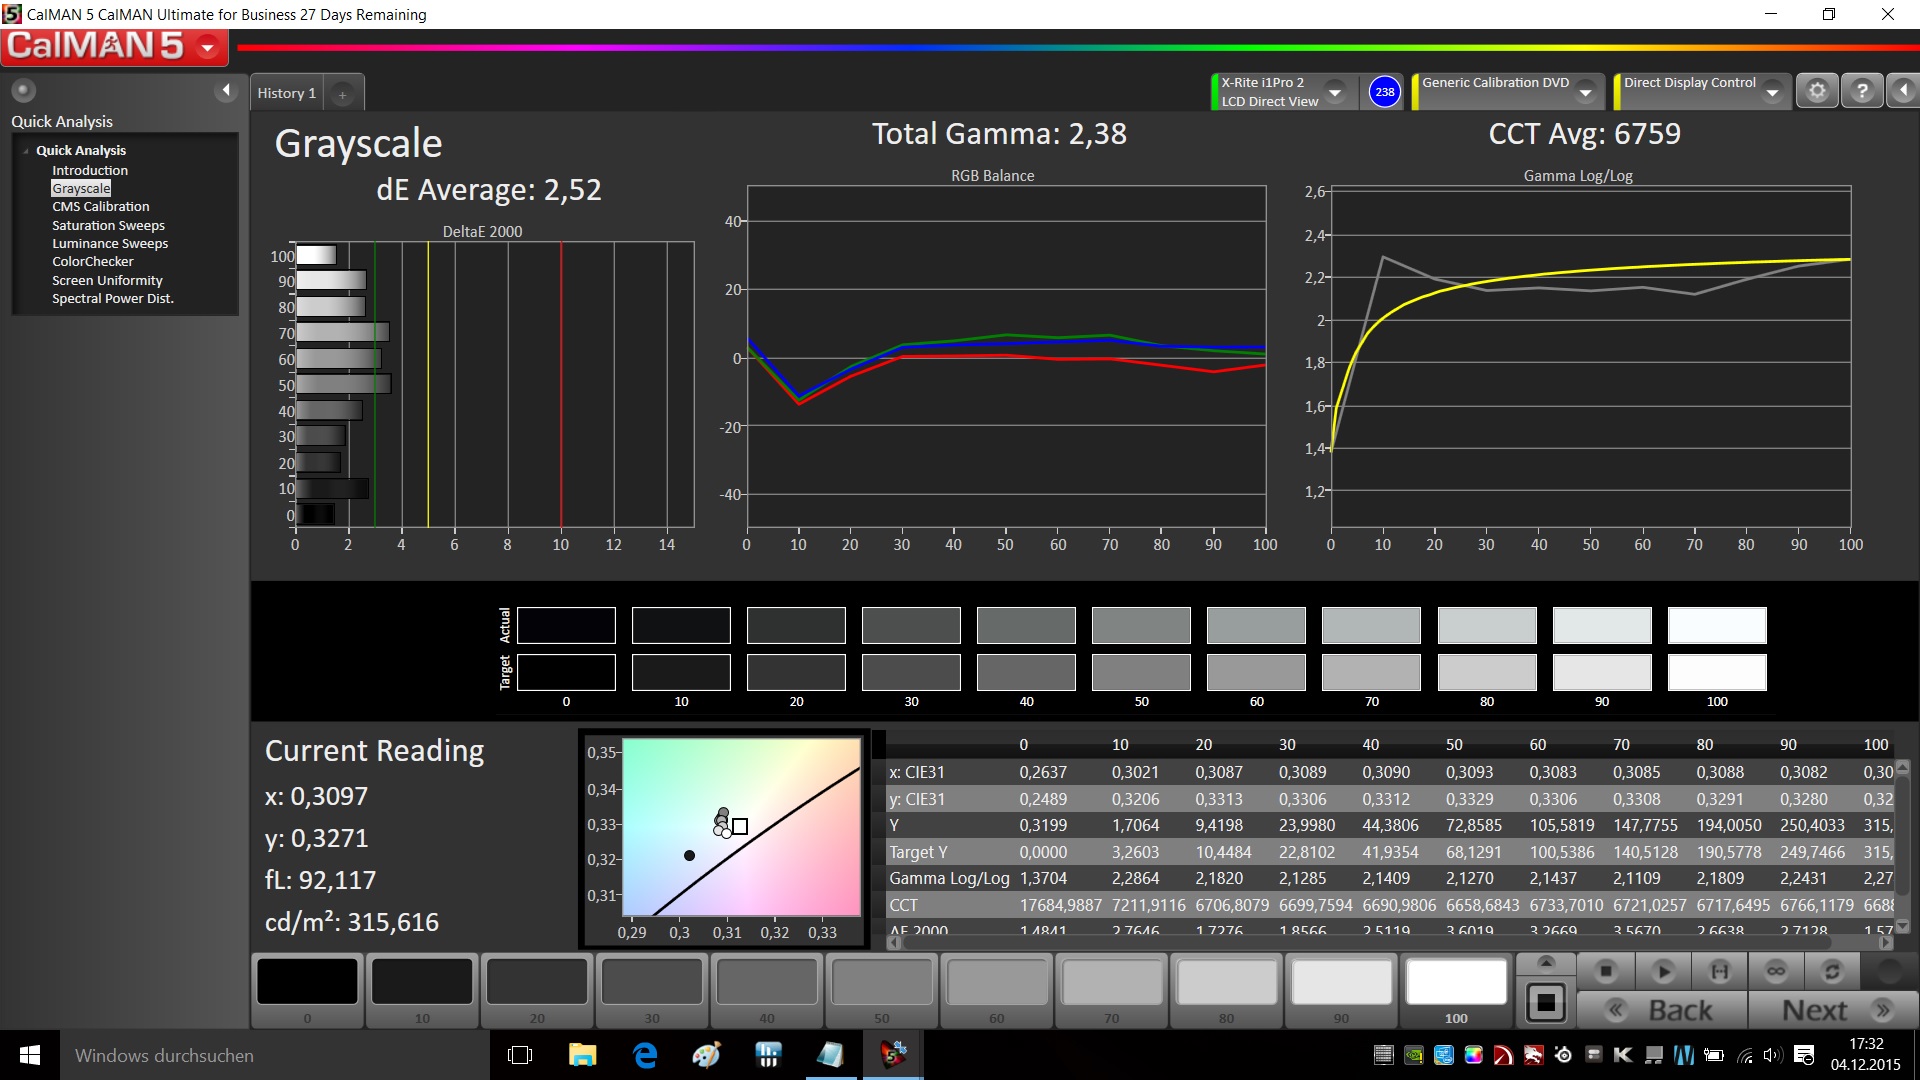
ΔE Greyscale Calman: 2.52 | ∀{0.09-98 Ø4.97}
86% sRGB (Argyll 1.6.3 3D)
56% AdobeRGB 1998 (Argyll 1.6.3 3D)
62.5% AdobeRGB 1998 (Argyll 3D)
85.6% sRGB (Argyll 3D)
64.5% Display P3 (Argyll 3D)
Gamma: 2.38
CCT: 6759 K
| MSI GE62-6QD16H11 LG Philips LP156WF6 | MSI GE62-2QFUi716H11 Samsung SDC4852 | Nexoc G515 II LG Philips LP156WF4-SPL1 (LGD044F) | Lenovo Ideapad Y700 15ISK 80NW LG Philips | Dell Inspiron 15 7559 LG Philips LGD04D9 / 156UD2 / Dell P/N: 53FC4 | Alienware 15 R2 (Skylake) Samsung 4NDDJ_156HL (SDC4C48) | |
|---|---|---|---|---|---|---|
| Display | -14% | -36% | -36% | 2% | -34% | |
| Display P3 Coverage (%) | 64.5 | 52.2 -19% | 38.59 -40% | 38.55 -40% | 63.4 -2% | 40.3 -38% |
| sRGB Coverage (%) | 85.6 | 78.7 -8% | 57.8 -32% | 57.6 -33% | 90 5% | 60.2 -30% |
| AdobeRGB 1998 Coverage (%) | 62.5 | 54 -14% | 39.88 -36% | 39.86 -36% | 64.6 3% | 41.67 -33% |
| Response Times | -11% | 1% | -31% | |||
| Response Time Grey 50% / Grey 80% * (ms) | 31 ? | 40.8 ? -32% | 32 ? -3% | 48.8 ? -57% | ||
| Response Time Black / White * (ms) | 27 ? | 24 ? 11% | 26 ? 4% | 28 ? -4% | ||
| PWM Frequency (Hz) | 58.1 | 200 ? | ||||
| Screen | -22% | -35% | -45% | -35% | -39% | |
| Brightness middle (cd/m²) | 300 | 268 -11% | 232 -23% | 258.6 -14% | 276 -8% | 180 -40% |
| Brightness (cd/m²) | 291 | 227 -22% | 216 -26% | 242 -17% | 273 -6% | 179 -38% |
| Brightness Distribution (%) | 88 | 74 -16% | 82 -7% | 88 0% | 85 -3% | 83 -6% |
| Black Level * (cd/m²) | 0.32 | 0.39 -22% | 0.3 6% | 0.277 13% | 0.78 -144% | 0.19 41% |
| Contrast (:1) | 938 | 687 -27% | 773 -18% | 934 0% | 354 -62% | 947 1% |
| Colorchecker dE 2000 * | 3.51 | 4.12 -17% | 6.26 -78% | 8.1 -131% | 4.05 -15% | 6.74 -92% |
| Colorchecker dE 2000 max. * | 8.72 | |||||
| Greyscale dE 2000 * | 2.52 | 3.65 -45% | 4.98 -98% | 7.23 -187% | 4.68 -86% | 6.44 -156% |
| Gamma | 2.38 92% | 2.5 88% | 2.25 98% | 1.99 111% | 2.55 86% | 2.29 96% |
| CCT | 6759 96% | 6423 101% | 6968 93% | 6567 99% | 6871 95% | 6465 101% |
| Color Space (Percent of AdobeRGB 1998) (%) | 56 | 49 -12% | 37 -34% | 36.5 -35% | 58 4% | 38 -32% |
| Color Space (Percent of sRGB) (%) | 86 | 58 -33% | 57.2 -33% | 90 5% | 60 -30% | |
| Total Average (Program / Settings) | -18% /
-19% | -36% /
-35% | -31% /
-38% | -11% /
-22% | -35% /
-37% |
* ... smaller is better
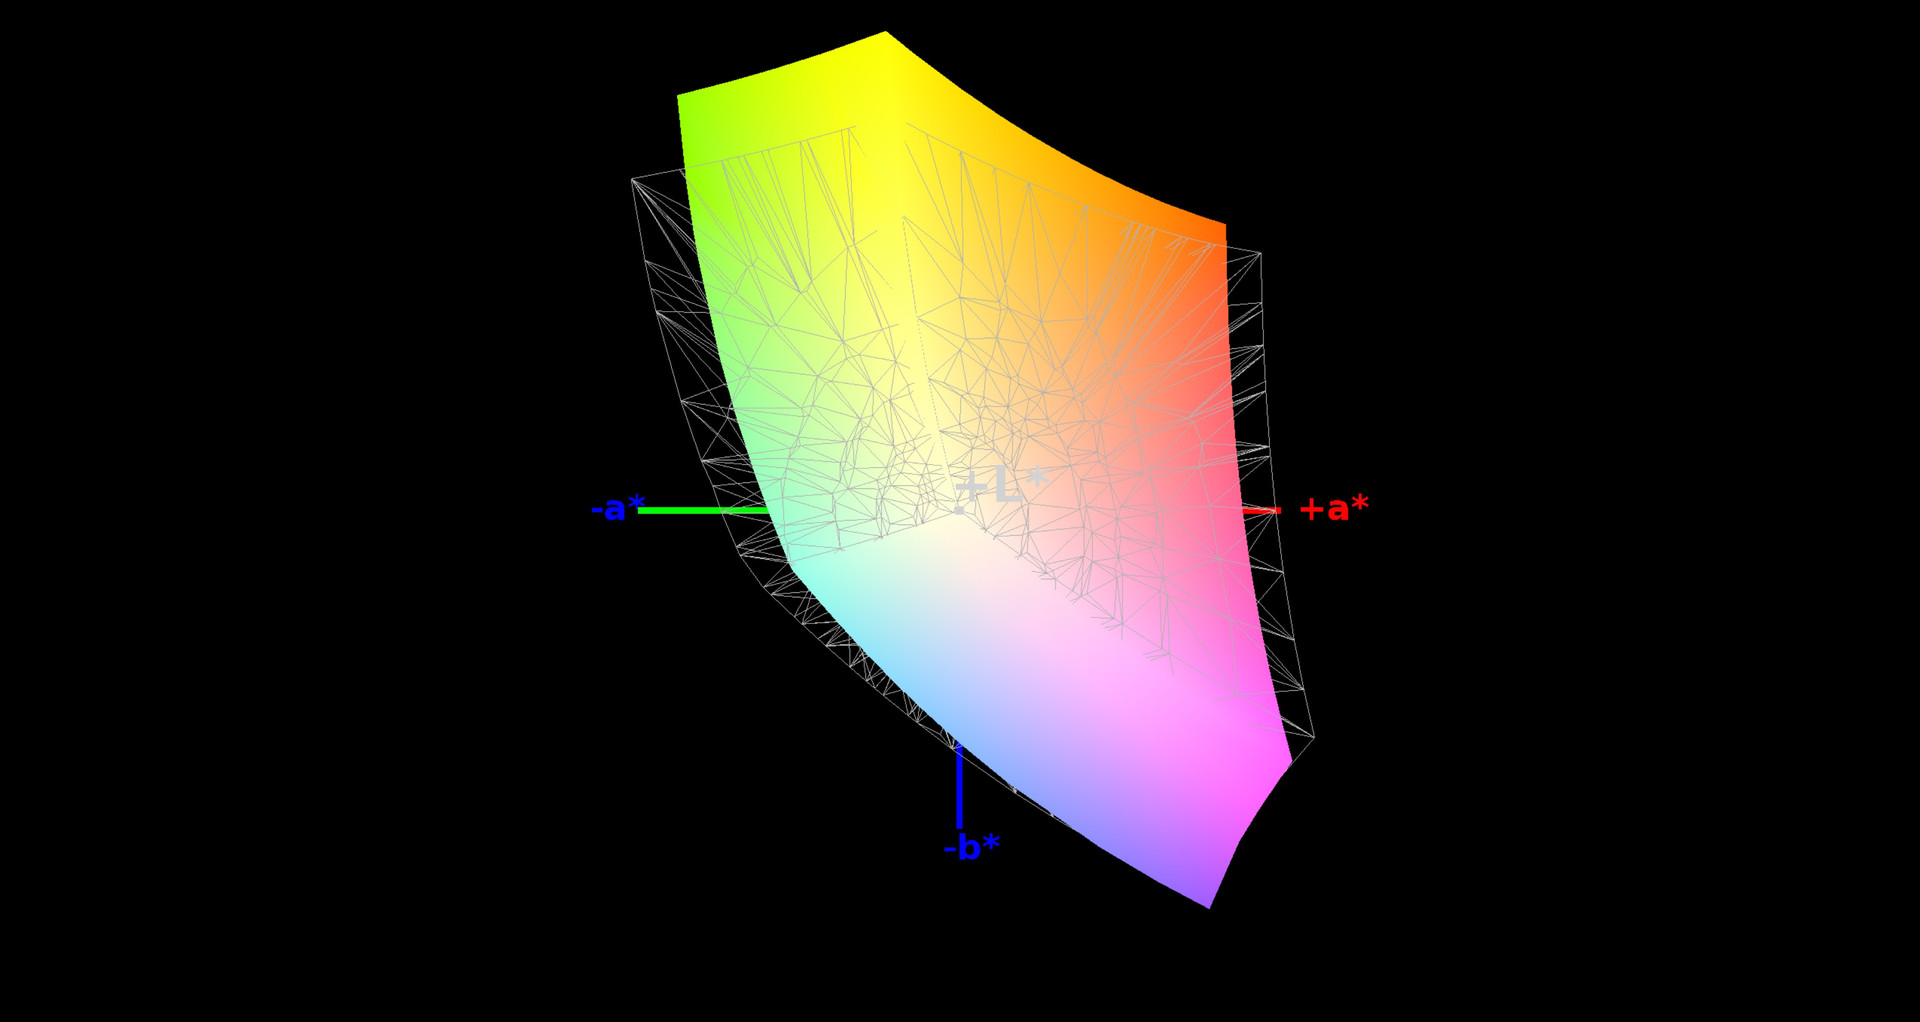
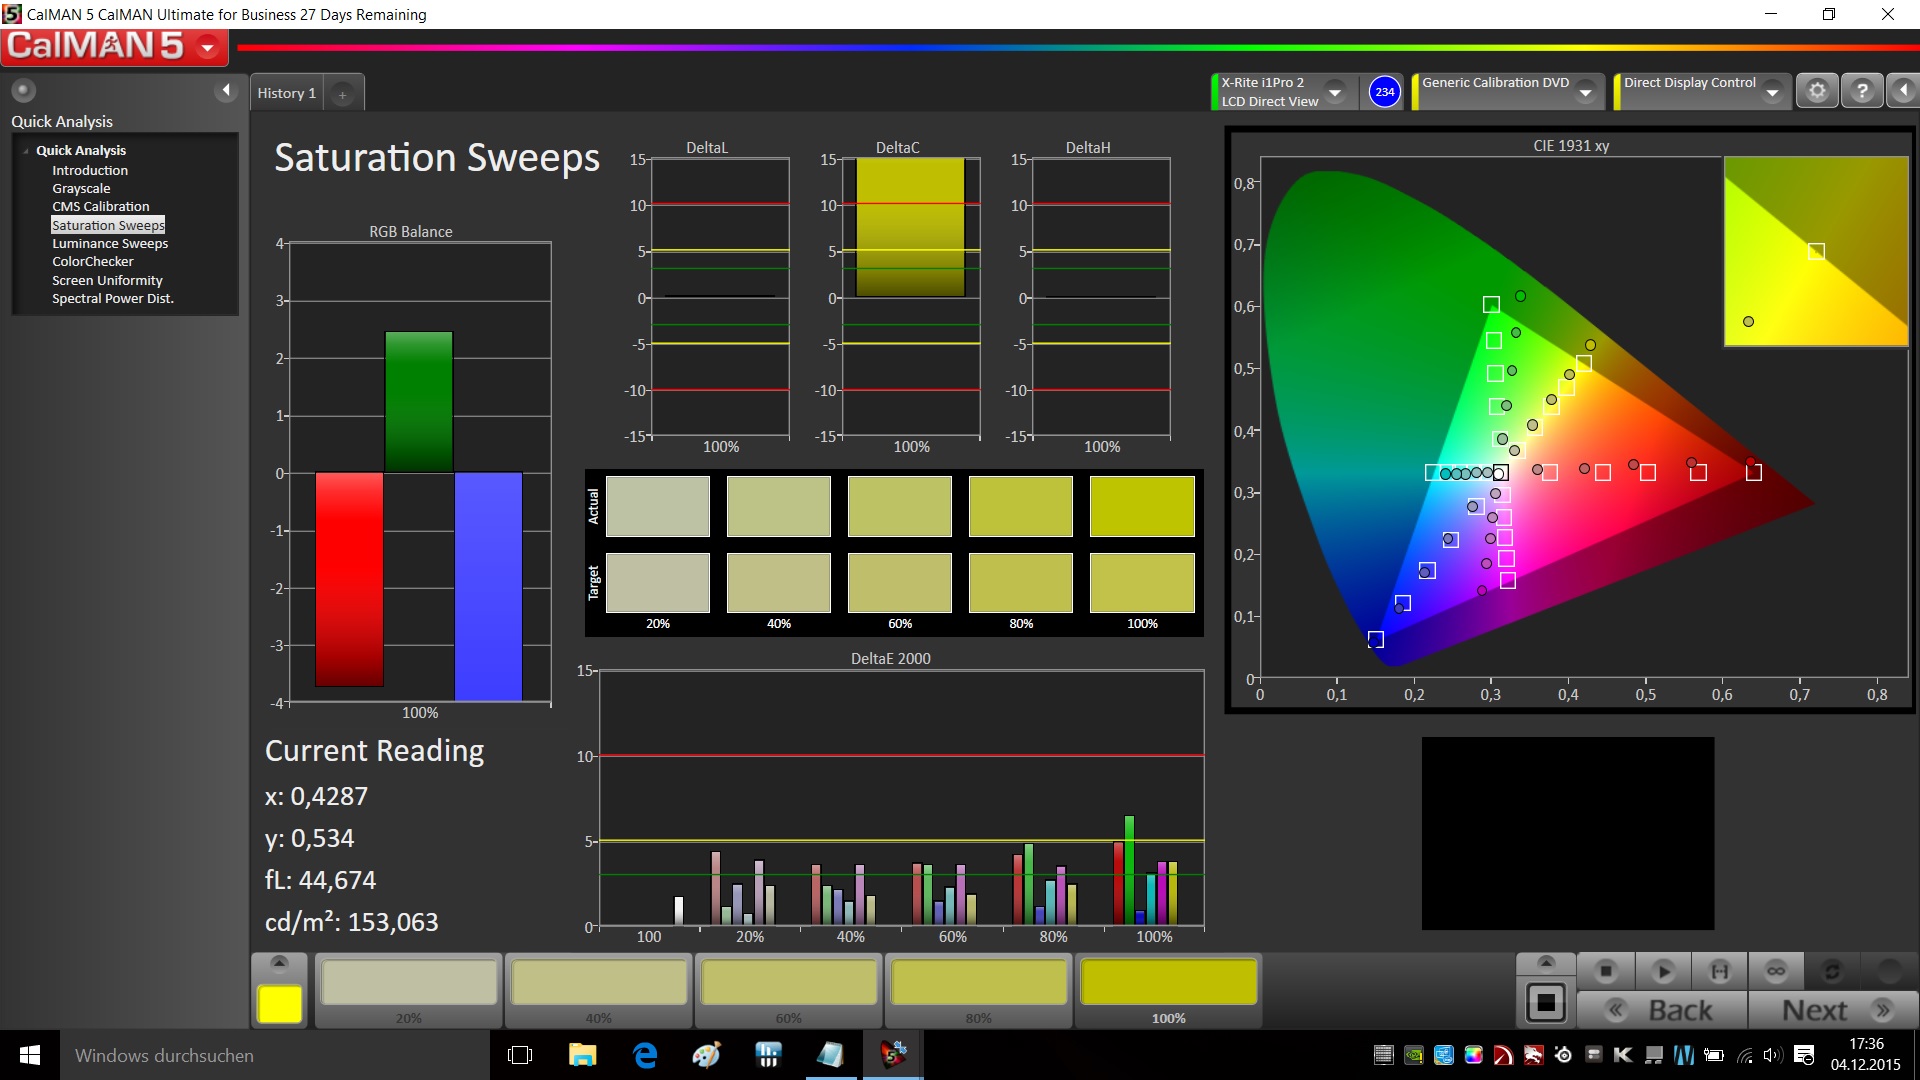
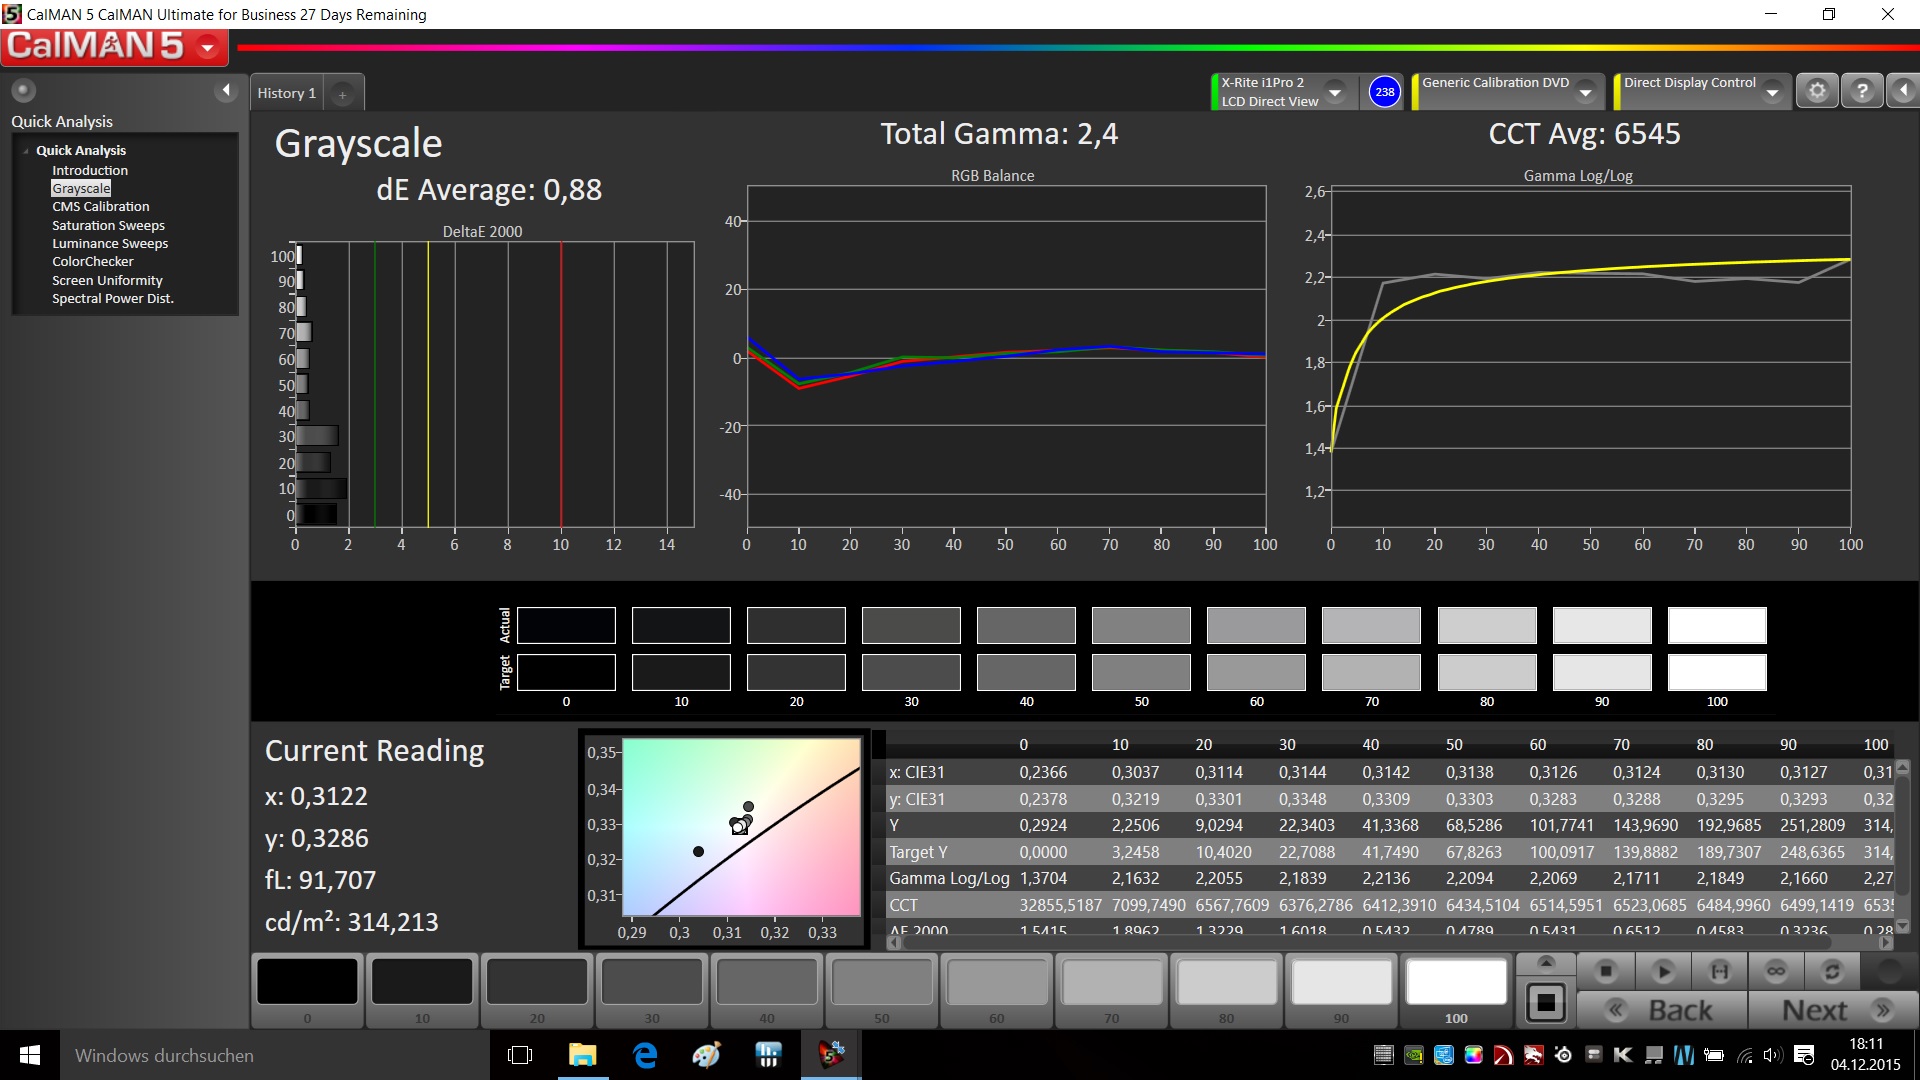
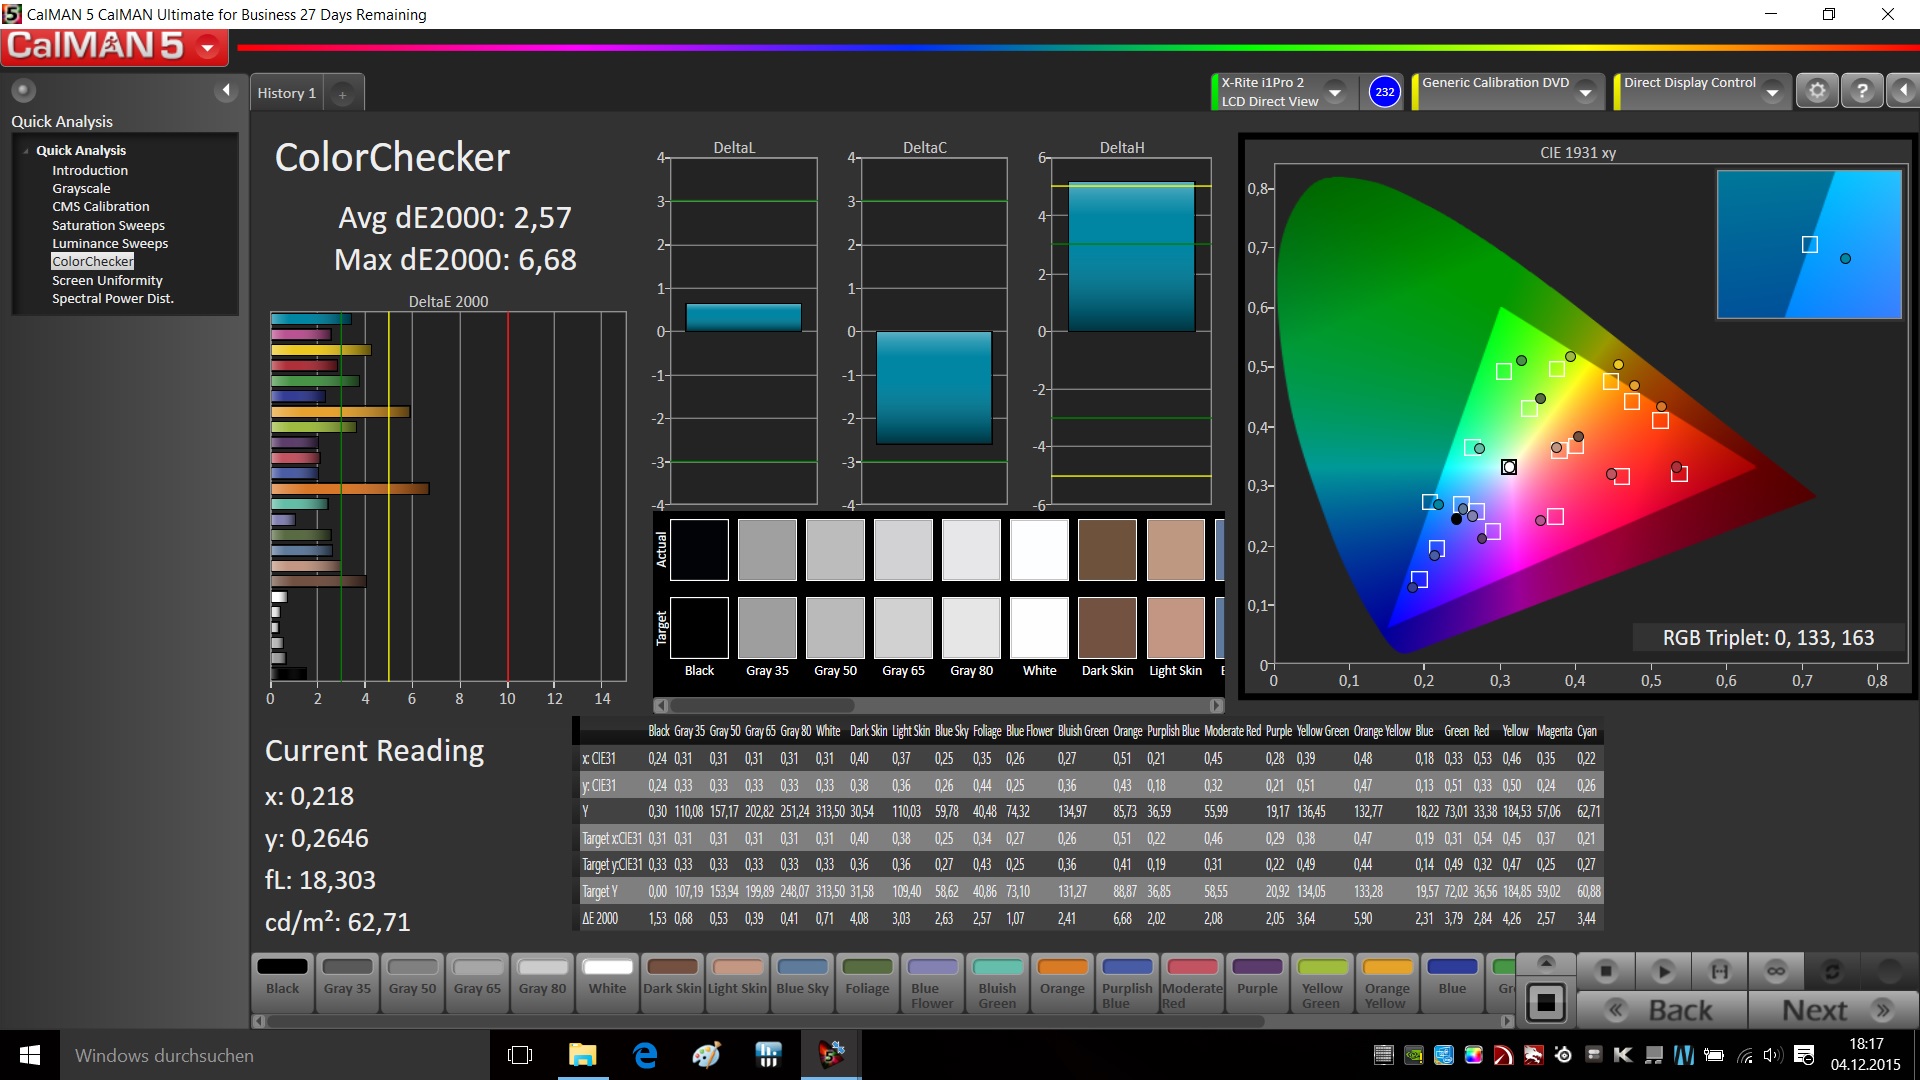
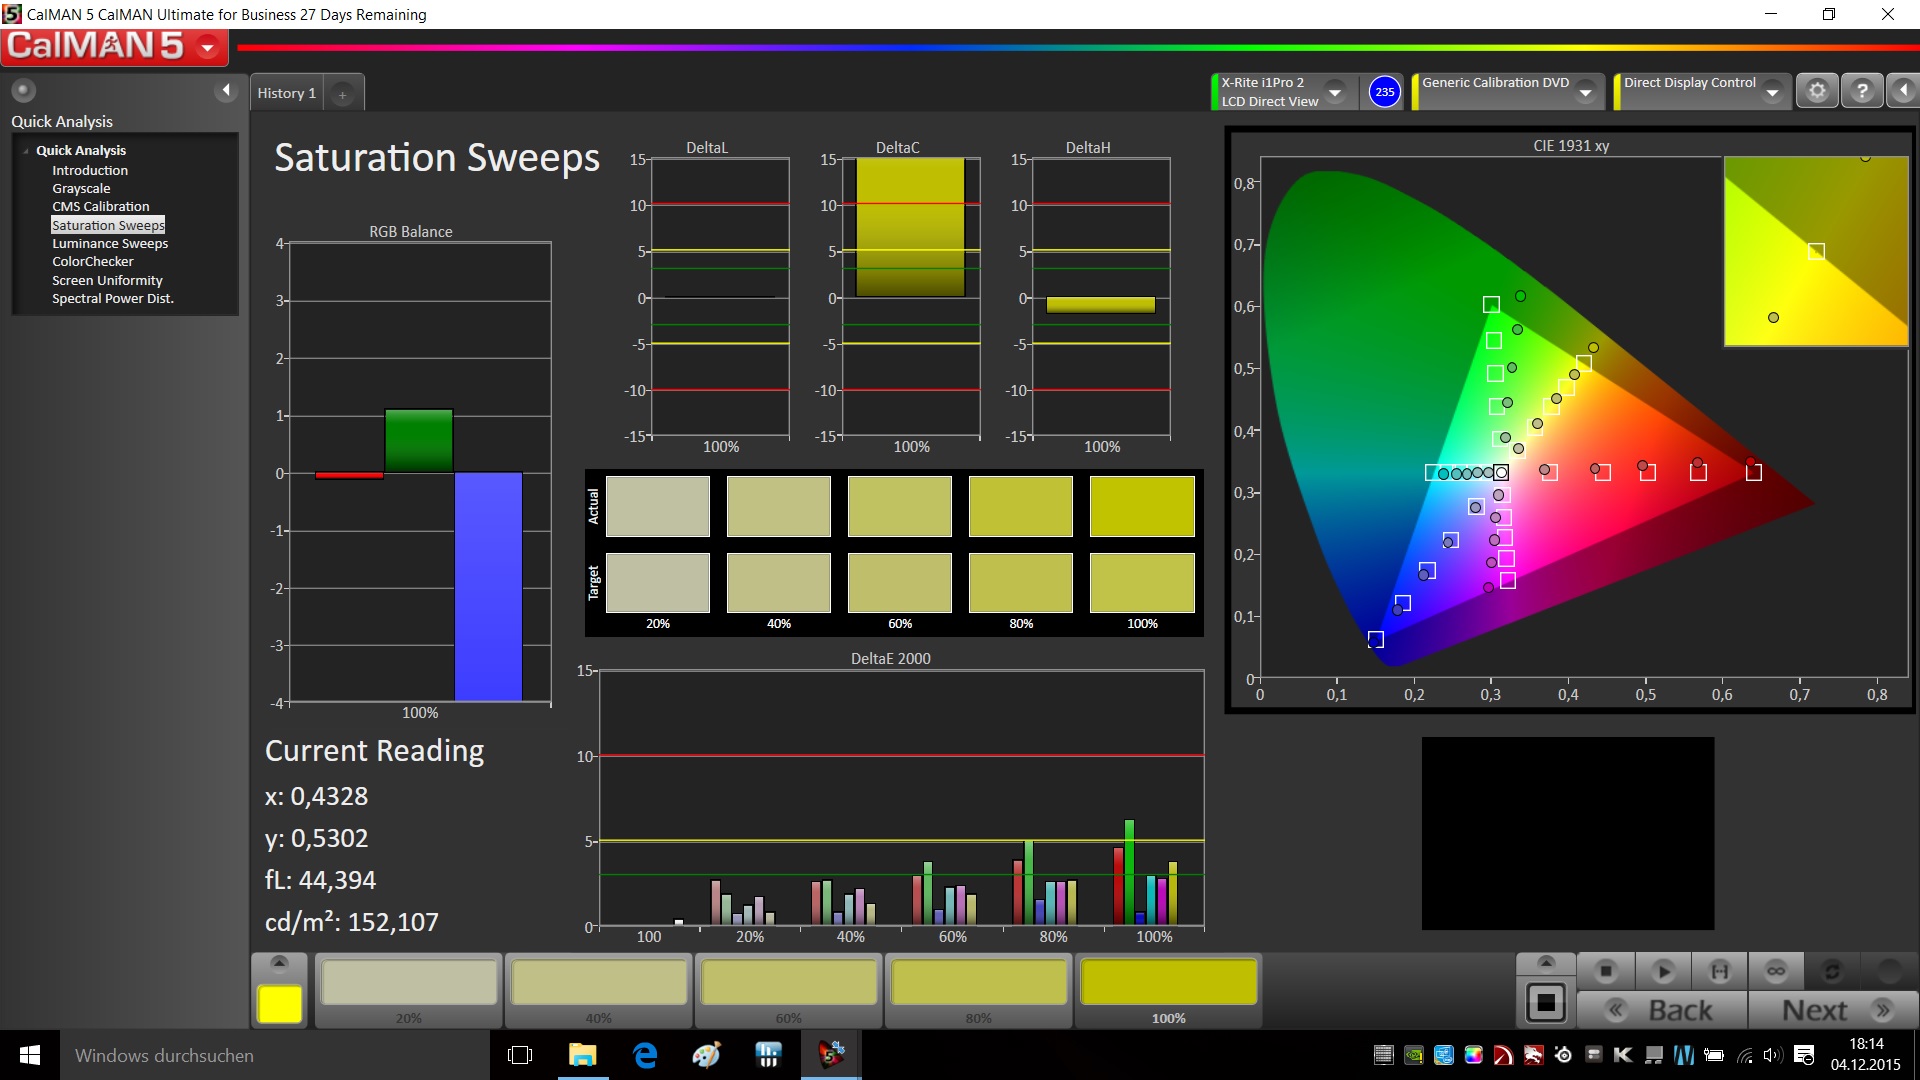
The color gamut coverage in the sRGB space is a high 86% - still too little for serious image editing but more than impressive in the category comparison. AdobeRGB is covered by 56%. The shifts in grayscale and color reproduction were already quite low ex-factory, but calibrating reduced the DeltaE even more and it was ultimately clearly below the critical rate of 3.
MSI provides a range of software-based, pre-defined color profiles for different application purposes. We generated our test results using the "sRGB" profile.
The good rates correspond to the subjective impression: The screen in the GE62 displays rich colors, deep black (void of backlight bleeding), and a generally high dynamic range.

The screen's relatively high brightness of 300 cd/m² is also fully available in battery mode. That in conjunction with the good contrast ratio will always allow working with the matte screen comfortably even outdoors. In contrast, using the glare-type UHD models from the GE62 lineup outdoors is only possible to a very limited degree.

Great: The screen is very legible from all viewing angles. The screen is throughout IPS typical here. The collage does not show extreme color distortions either. We could give the 4K screens that MSI uses a good viewing-angle stability rating at the time. At least this aspect does not discourage opting for the alternatives with a higher resolution screen.
Display Response Times
| ↔ Response Time Black to White | ||
|---|---|---|
| 27 ms ... rise ↗ and fall ↘ combined | ↗ 8 ms rise | 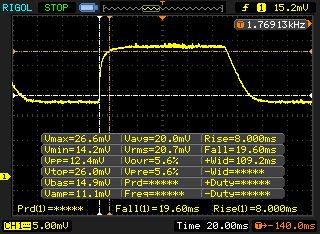 |
| ↘ 19 ms fall | ||
| The screen shows relatively slow response rates in our tests and may be too slow for gamers. In comparison, all tested devices range from 0.1 (minimum) to 240 (maximum) ms. » 67 % of all devices are better. This means that the measured response time is worse than the average of all tested devices (19.8 ms). | ||
| ↔ Response Time 50% Grey to 80% Grey | ||
| 31 ms ... rise ↗ and fall ↘ combined | ↗ 11 ms rise | 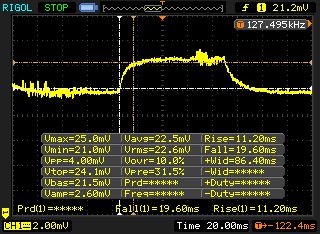 |
| ↘ 20 ms fall | ||
| The screen shows slow response rates in our tests and will be unsatisfactory for gamers. In comparison, all tested devices range from 0.165 (minimum) to 636 (maximum) ms. » 42 % of all devices are better. This means that the measured response time is similar to the average of all tested devices (31 ms). | ||
Screen Flickering / PWM (Pulse-Width Modulation)
| Screen flickering / PWM not detected | 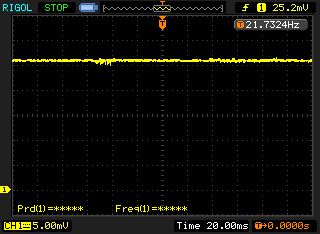 | ||
In comparison: 52 % of all tested devices do not use PWM to dim the display. If PWM was detected, an average of 7781 (minimum: 5 - maximum: 343500) Hz was measured. | |||
Performance
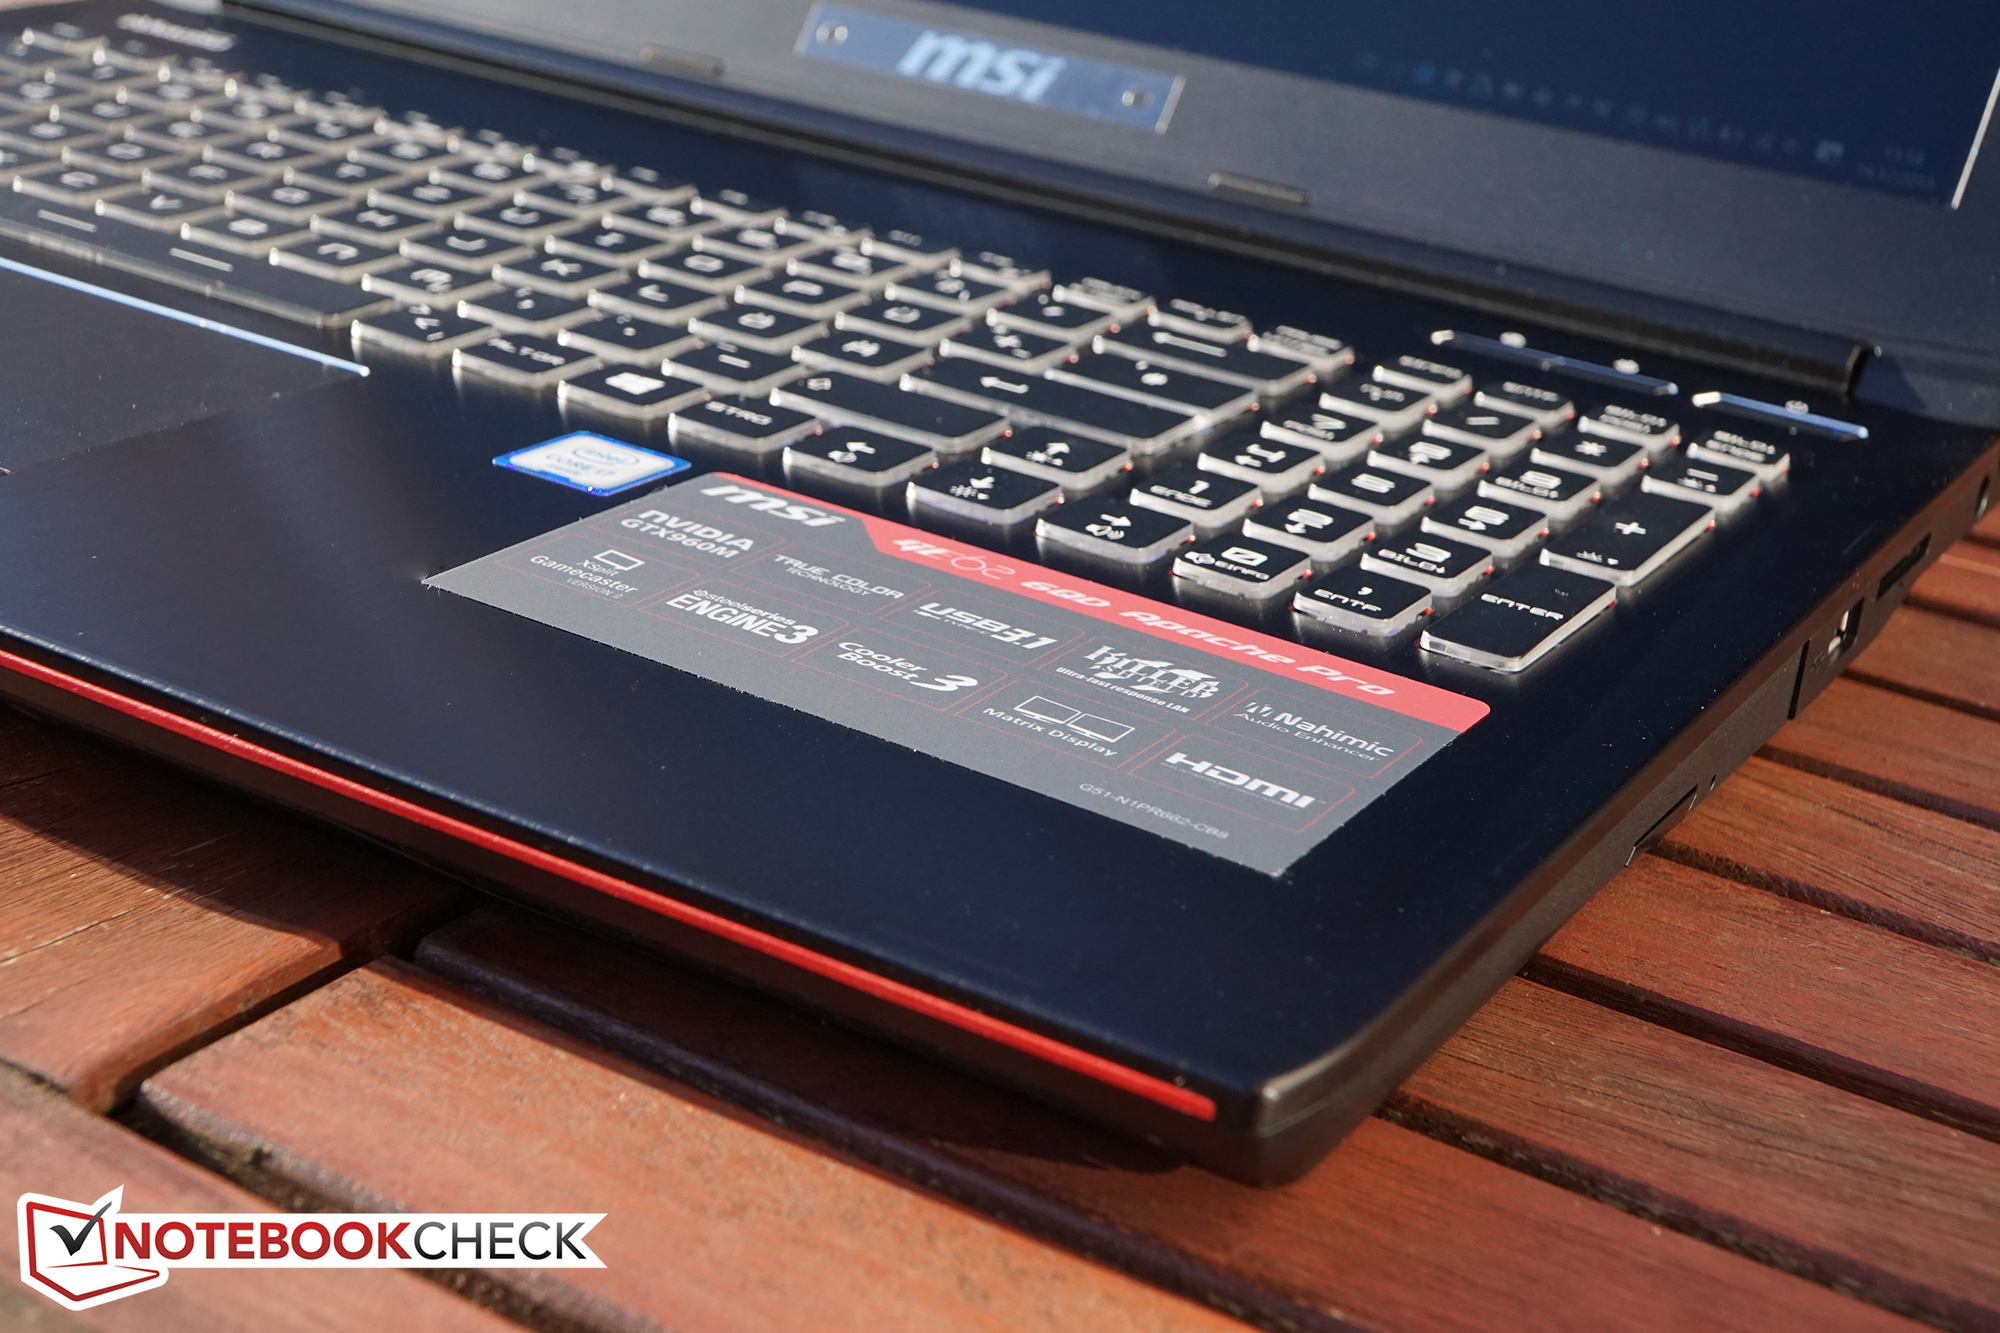
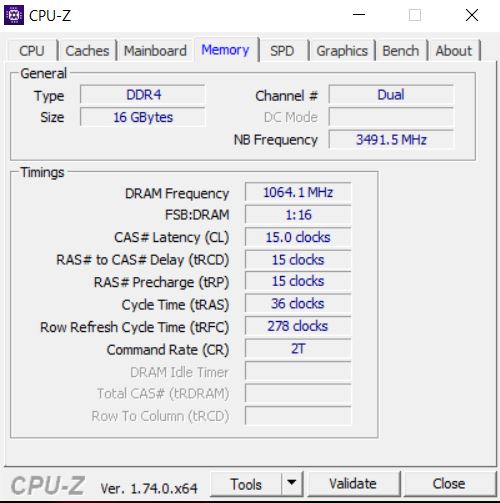
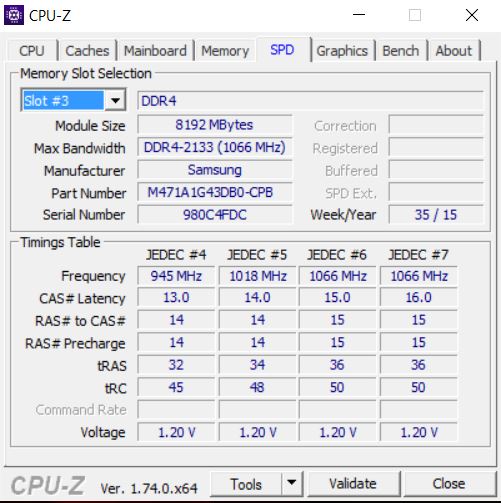
As already said, our review sample with a Core i7-6700HQ, GeForce GTX 960M and 16 GB of DDR4 RAM is the smallest configuration in the GE62 lineup. It can be expected that games will easily run in the native resolution of 1920x1080 pixels (contingently with reduced details). We will examine to what extent the possible limits can be stretched with a faster GPU further below.


Processor
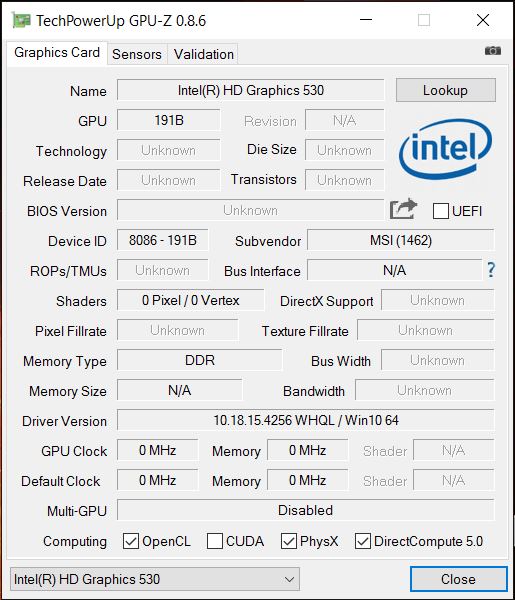
The Core i7-6700HQ is Intel's new mainstream CPU in the premium mobile sector - all present devices in the comparison field are based on it. The Skylake CPU has a base clock of 2.6 GHz that can be accelerated to 3.1 to 3.5 GHz when required (depending on the load of the single cores). The TDP is 45 watts by standard. Beyond that, the Optimus array with Intel's new HD Graphics 530 provides a graphics solution for less demanding tasks. Its performance comes close to that of a dedicated GeForce 820M.
According to the key specs, the new CPU is virtually equal with the Core i7-4720HQ that is used in both former models of our review sample. The base clock of both models is 2.6 GHz, but the Haswell CPU can be accelerated a bit more in Turbo mode at a marginally higher TDP (47 vs. 45 watts). That does not seem to result in measurable differences as a glance at the Cinebench comparison chart illustrates. In any case, the up to 15% higher performance that MSI wanted to achieve with the touted Skylake boost cannot be confirmed on this basis. The "old" GE62 with an i7-4720HQ is just as much on par as all other rivals based on a Core i7-6700HQ.
System Performance
A quad-core CPU, 16 GB of working memory and a combination of an M.2 SSD and conventional hard drive with 7200 RPM: The configuration of our GE62 ensures for smooth operation at all times. It also becomes clear that the review sample can compete with the rivals in the practical PCMark tests. Nexoc's G515 II, Alienware's 15 R2 and Lenovo's Y700 only have a very slight lead while Dell's Inspiron 15 7559's power-guzzling UHD touchscreen sometimes takes its toll. That is also the case with both predecessors GE62 2QE and 2QF (PCMark 8 Home & Work).
| PCMark 7 Score | 5839 points | |
| PCMark 8 Home Score Accelerated v2 | 3703 points | |
| PCMark 8 Creative Score Accelerated v2 | 4610 points | |
| PCMark 8 Work Score Accelerated v2 | 4797 points | |
Help | ||
| PCMark 7 - Score (sort by value) | |
| MSI GE62-6QD16H11 | |
| Nexoc G515 II | |
| Lenovo Ideapad Y700 15ISK 80NW | |
| Dell Inspiron 15 7559 | |
| MSI GE62-2QEUi716H21BW | |
| MSI GE62-2QFUi716H11 | |
| Alienware 15 R2 (Skylake) | |
Storage Device
The installed primary storage device could theoretically be a reason for the evident performance plus over the predecessors. The 128 GB M.2 SSD does a decent job - but mainly in write. It is much slower in read access, particularly with small data blocks.
MSI's GE62 still looks good compared with competing products such as Dell's Inspiron 15 7559. However, the Toshiba drive cannot compete with an NVMe storage solution like used in Nexoc's G515 II.

| MSI GE62-6QD16H11 Samsung SSD 850 EVO M.2 250 GB | Nexoc G515 II Samsung SM951 MZHPV256HDGL m.2 PCI-e | Lenovo Ideapad Y700 15ISK 80NW Samsung MZNLN128HCGR-000L2 | Dell Inspiron 15 7559 SK hynix SC300 M.2 | MSI GE62-2QEUi716H21BW Kingston RBU-SNS8100S3256GD1 | |
|---|---|---|---|---|---|
| AS SSD | 103% | 12% | -33% | 6% | |
| Seq Read (MB/s) | 500 | 1863 273% | 492 -2% | 509 2% | 502 0% |
| Seq Write (MB/s) | 449.1 | 1174 161% | 151 -66% | 202 -55% | 329.6 -27% |
| 4K Read (MB/s) | 21.05 | 39.56 88% | 34.29 63% | 25.01 19% | 33.07 57% |
| 4K Write (MB/s) | 72.9 | 92.6 27% | 94 29% | 59.3 -19% | 67.7 -7% |
| Access Time Read * (ms) | 0.168 | 0.053 68% | 0.094 44% | 0.106 37% | 0.099 41% |
| Access Time Write * (ms) | 0.041 | 0.041 -0% | 0.039 5% | 0.116 -183% | 0.052 -27% |
* ... smaller is better
Graphics Card
The GeForce GTX 960M is virtually the entry to the mobile GPU premium range. It has a core frequency of 1097 to 1176 MHz (in Turbo mode), and the memory is connected via a 128-bit interface. The chip in our review sample can fall back on 2 GB of GDDR5 memory that clocks at 5 GHz.
The next configuration level of the Maxwell architecture would be the GeForce GTX 965M, as found in the GE62 2QE. Its base clock is a bit lower, but it is supported by a considerably higher Shader count (1024 vs. 640 in the GTX 960M). A GE62 2QE with a Skylake update has not yet been released; a GE62 with a GTX 965M might possibly be discontinued soon.
That only leaves the GeForce GTX 970M as a higher performance option within the GE62 lineup. It is not only sold as a part of the GE62 2QF Haswell system but also in conjunction with the Skylake successor (GE62 6QF). The GTX 970M has a 192-bit memory interface in addition to 1280 execution units, and thus it promised considerably more gaming power than the GTX 965M.
The performance differences of the GPUs are especially evident in the results of the "Fire Strike" test of 3DMark 2013. While the review sample is exactly on par with other GTX 960M systems, the advantage of the GTX 965M in the GE62 2QE is already 20%. The distance to the GTX 970M is over 60%, and the GeForce GTX 980M in Alienware's laptop is more than twice as fast as the GTX 960M in our review sample.
| 3DMark 11 Performance | 5865 points | |
| 3DMark Ice Storm Standard Score | 69304 points | |
| 3DMark Cloud Gate Standard Score | 17764 points | |
| 3DMark Fire Strike Score | 4018 points | |
Help | ||
| 3DMark 11 - 1280x720 Performance (sort by value) | |
| MSI GE62-6QD16H11 | |
| Nexoc G515 II | |
| Lenovo Ideapad Y700 15ISK 80NW | |
| Dell Inspiron 15 7559 | |
| MSI GE62-2QEUi716H21BW | |
| MSI GE62-2QFUi716H11 | |
| Alienware 15 R2 (Skylake) | |
Gaming Performance
The difference among the different GeForce models is not only seen in the synthetic benchmarks but can also be observed in real-world gaming. The frame rate differences in Tomb Raider are quite identical with the impression above.
On its own, the GeForce GTX 960M has enough power for gaming in the native FHD resolution. It is not quite enough for high settings in newer and graphically demanding games like The Witcher 3 - slight stuttering can be observed in intricate scenes. Users who do not want to use medium settings will have to do some fine tuning in the graphics settings. Apart from games labeled premium graphics, the installed GPU will rarely have problems.
| low | med. | high | ultra | |
|---|---|---|---|---|
| Tomb Raider (2013) | 171 | 156.7 | 108.9 | 52.9 |
| Dirt Rally (2015) | 213.1 | 104.7 | 72.4 | 34.36 |
| The Witcher 3 (2015) | 83.6 | 52.3 | 27.4 | 15.2 |
| Metal Gear Solid V (2015) | 59.9 | 59.9 | 59.6 | 40.3 |
| Fallout 4 (2015) | 98.8 | 68.6 | 33.52 | 25.8 |
| Tomb Raider | |
| 1366x768 High Preset AA:FX AF:8x (sort by value) | |
| MSI GE62-6QD16H11 | |
| Lenovo Ideapad Y700 15ISK 80NW | |
| MSI GE62-2QEUi716H21BW | |
| MSI GE62-2QFUi716H11 | |
| Alienware 15 R2 (Skylake) | |
| 1920x1080 Ultra Preset AA:FX AF:16x (sort by value) | |
| MSI GE62-6QD16H11 | |
| Lenovo Ideapad Y700 15ISK 80NW | |
| MSI GE62-2QEUi716H21BW | |
| MSI GE62-2QFUi716H11 | |
| Alienware 15 R2 (Skylake) | |
| The Witcher 3 | |
| 1366x768 Medium Graphics & Postprocessing (sort by value) | |
| MSI GE62-6QD16H11 | |
| Nexoc G515 II | |
| 1920x1080 High Graphics & Postprocessing (Nvidia HairWorks Off) (sort by value) | |
| MSI GE62-6QD16H11 | |
| Nexoc G515 II | |
| Alienware 15 R2 (Skylake) | |
Emissions
System Noise
Everything seems okay at first: Although the Skylake GE62 is a bit louder than its rivals in idle mode, the rates are basically acceptable. It is also slightly louder during load but does not quite reach the noise level of Dell's Inspiron 15 7559 in the stress test. Nexoc's G515 II, based on the same CPU-GPU array, is the quietest in the group. Our review sample proves to be slightly louder in idle mode and a bit quieter during load compared with its Haswell predecessor.
However, our review sample suffers under prominent coil whining. That seems to be connected to the power supply since it only appears in AC mode; there are no problems in battery mode. Coil whining is a funny thing - while some believe that it is mostly imagination, it infuriates others. Fact is: It can get quite annoying depending on the sense of hearing and individual sensitivity to quiet whining noises. In any case, the writer could not miss hearing it. A small comfort: It becomes unimportant as soon as the fan starts up.
Noise level
| Idle |
| 33 / 34 / 38 dB(A) |
| HDD |
| 34 dB(A) |
| DVD |
| 39 / dB(A) |
| Load |
| 42 / 46 dB(A) |
 | ||
30 dB silent 40 dB(A) audible 50 dB(A) loud |
||
min: | ||
| MSI GE62-6QD16H11 6700HQ, GeForce GTX 960M | Nexoc G515 II 6700HQ, GeForce GTX 960M | Lenovo Ideapad Y700 15ISK 80NW 6700HQ, GeForce GTX 960M | Dell Inspiron 15 7559 6700HQ, GeForce GTX 960M | MSI GE62-2QEUi716H21BW 4720HQ, GeForce GTX 965M | Alienware 15 R2 (Skylake) 6700HQ, GeForce GTX 980M | |
|---|---|---|---|---|---|---|
| Noise | 9% | 6% | 3% | 2% | 1% | |
| Idle Minimum * (dB) | 33 | 29.4 11% | 30.4 8% | 32.6 1% | 29.2 12% | 33.6 -2% |
| Idle Average * (dB) | 34 | 30.2 11% | 30.5 10% | 32.6 4% | 32.6 4% | 33.8 1% |
| Idle Maximum * (dB) | 38 | 35.6 6% | 33.3 12% | 32.6 14% | 35 8% | 34 11% |
| Load Average * (dB) | 42 | 39.8 5% | 41.4 1% | 40.5 4% | 42.6 -1% | 39.3 6% |
| Load Maximum * (dB) | 46 | 41.6 10% | 47 -2% | 49.1 -7% | 52.4 -14% | 51.4 -12% |
* ... smaller is better
Temperature
The review sample's temperatures are also untypical. It already gets relatively warm in idle. The thermometer records over 40 °C in the touchpad's area where it will tend to be most annoying. That is likely due to the hard drive that never seems to be inactive even in idle mode. 50 °C is surpassed virtually everywhere on the upper side under load, which is quite high. Nexoc's G515 II proves that it could be worse with over 60 °C in some places under full load. In contrast, Lenovo's IdeaPad Y700 shows that the same core hardware can be managed better.
(-) The maximum temperature on the upper side is 53.3 °C / 128 F, compared to the average of 40.4 °C / 105 F, ranging from 21.2 to 68.8 °C for the class Gaming.
(-) The bottom heats up to a maximum of 49.3 °C / 121 F, compared to the average of 43.2 °C / 110 F
(±) In idle usage, the average temperature for the upper side is 36.7 °C / 98 F, compared to the device average of 33.9 °C / 93 F.
(-) The palmrests and touchpad can get very hot to the touch with a maximum of 49.5 °C / 121.1 F.
(-) The average temperature of the palmrest area of similar devices was 28.8 °C / 83.8 F (-20.7 °C / -37.3 F).
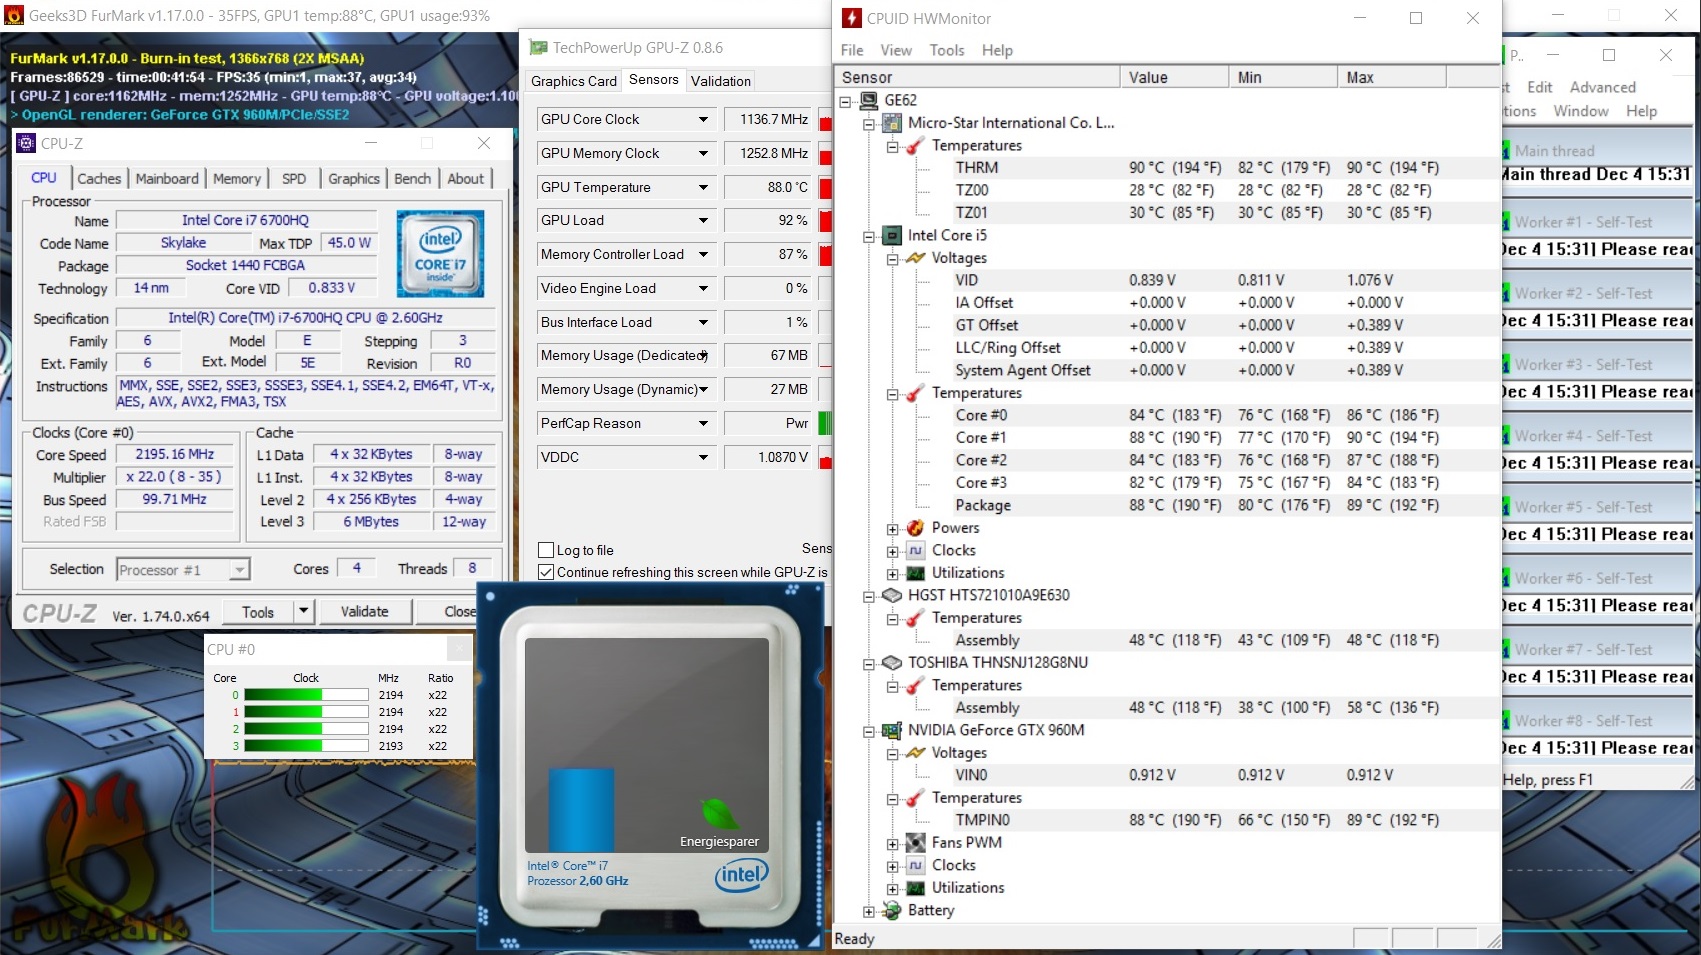
Looking at the temperature rates, it is not surprising that throttling is noticed in the stress test via the tools Furmark and Prime95. The clock frequency dropped to just 2.2 GHz after 40 minutes, which is 400 MHz below the base clock. The former GE62-2QF also displayed a similar behavior, but it sports a considerably stronger GeForce GTX 970M. The GE62-2QE with GTX 965M does not throttle at all - despite its somewhat more power-consuming CPU-GPU combination. To be fair, it must be said that no losses in work speed were noticed in real-world (gaming) use.
Note: We performed both the temperature and noise measurements in the "natural" operating mode. The Cooler Boost option that increases the cooling performance in favor of noise development was not used.
| MSI GE62-6QD16H11 6700HQ, GeForce GTX 960M | Nexoc G515 II 6700HQ, GeForce GTX 960M | Lenovo Ideapad Y700 15ISK 80NW 6700HQ, GeForce GTX 960M | Dell Inspiron 15 7559 6700HQ, GeForce GTX 960M | MSI GE62-2QEUi716H21BW 4720HQ, GeForce GTX 965M | MSI GE62-2QFUi716H11 4720HQ, GeForce GTX 970M | Alienware 15 R2 (Skylake) 6700HQ, GeForce GTX 980M | |
|---|---|---|---|---|---|---|---|
| Heat | -6% | 22% | 10% | 6% | 8% | 9% | |
| Maximum Upper Side * (°C) | 53.3 | 56.8 -7% | 43.8 18% | 54 -1% | 49.9 6% | 53.4 -0% | 48 10% |
| Maximum Bottom * (°C) | 49.3 | 62 -26% | 47.8 3% | 53.4 -8% | 43.7 11% | 43.3 12% | 57.3 -16% |
| Idle Upper Side * (°C) | 41.2 | 39.6 4% | 27.4 33% | 30.4 26% | 37.1 10% | 34.7 16% | 31.9 23% |
| Idle Bottom * (°C) | 40.8 | 39.1 4% | 26.8 34% | 31.3 23% | 41.5 -2% | 39.6 3% | 33.4 18% |
* ... smaller is better
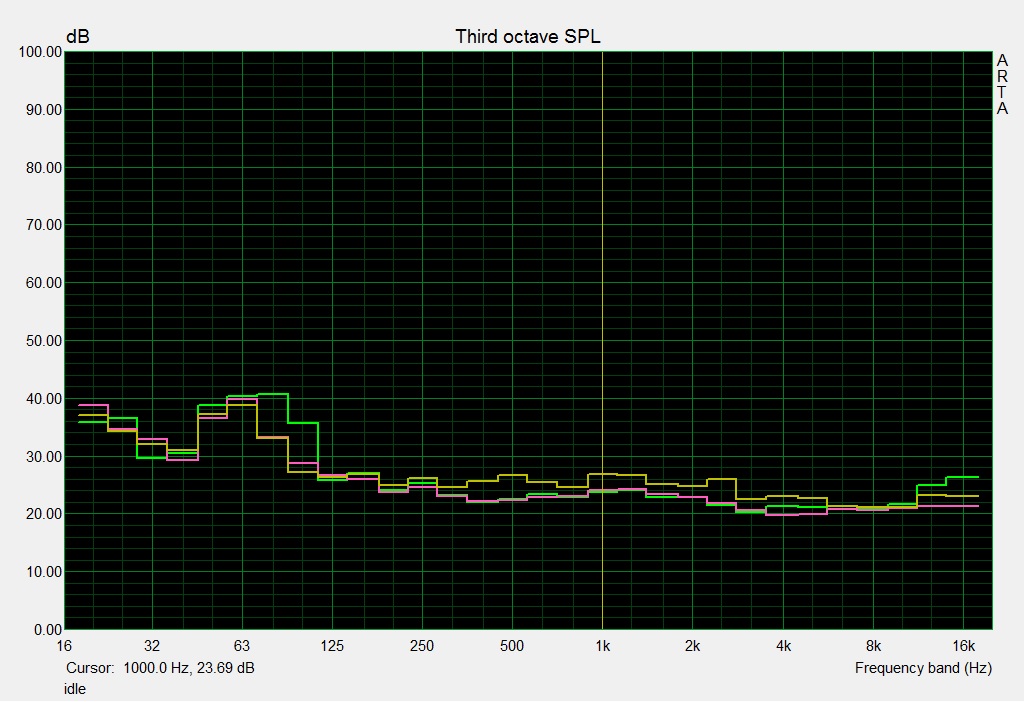
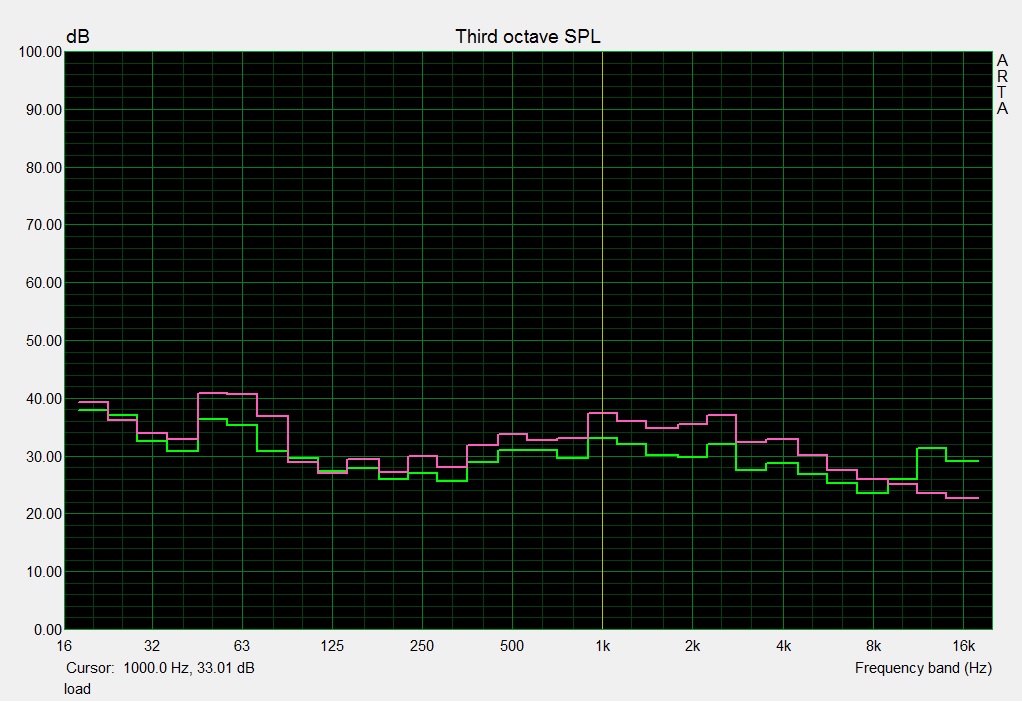
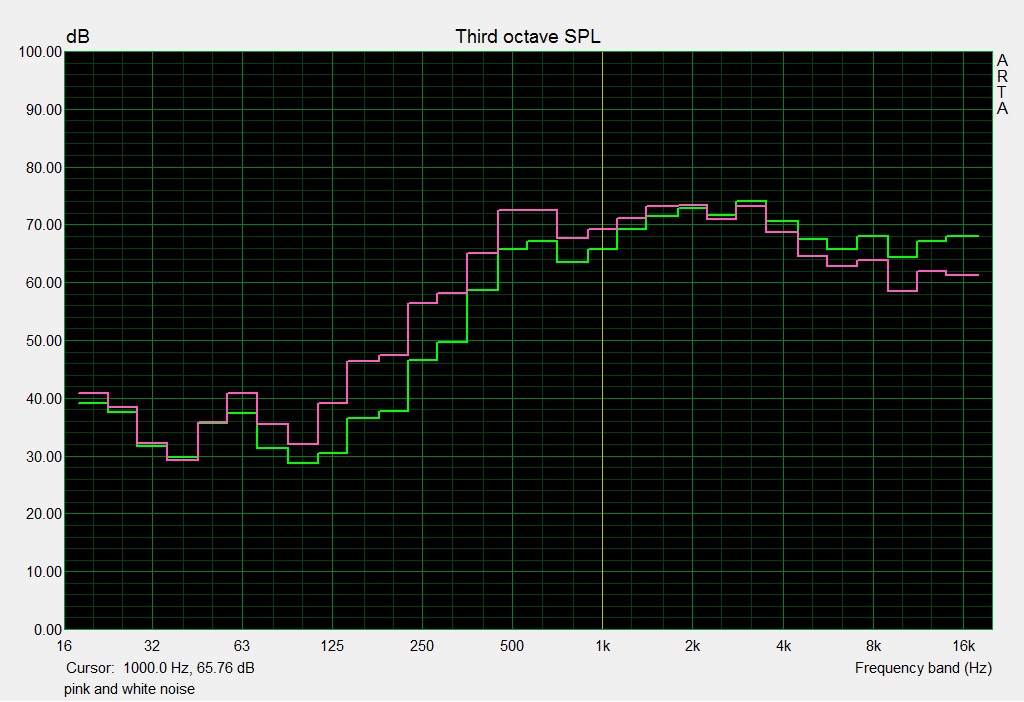
Speakers
A 2.1 system by Dynaudio like MSI installs in almost all its gaming laptops takes care of audio output. As expected, it delivers a decent sound that lacks a bit of force despite separate subwoofer. External analog speakers can be connected via the gold-plated jack that reduces circuit noise.
Energy Management
Power Consumption
The consumption rates present yet another nasty surprise. They are clearly higher than the category average. None of the comparison systems consume as much power as our GE62 6QD in idle. Even the former models furnished with screens and CPUs with a higher energy requirement are more frugal. The review sample makes an even worse impression compared with its Skylake rivals: An idle average of 24 versus 14.4 watts in Dell's Inspiron 15 7559 is quite extreme.
It does not look much better under load. Our review sample again guzzles more power than some rivals based on considerably stronger hardware. Alienware's 15 R2 with its GeForce GTX 980M provides almost twice the gaming power at lower energy consumption (despite a very high peak consumption). The "old" GE62 Haswell-based models also achieve more frames per watt. Finally, Nexoc's G515 II proves that Skylake is quite capable of "frugal". With a virtually identical configuration, it consumes a good 20 watts less than the present review sample.
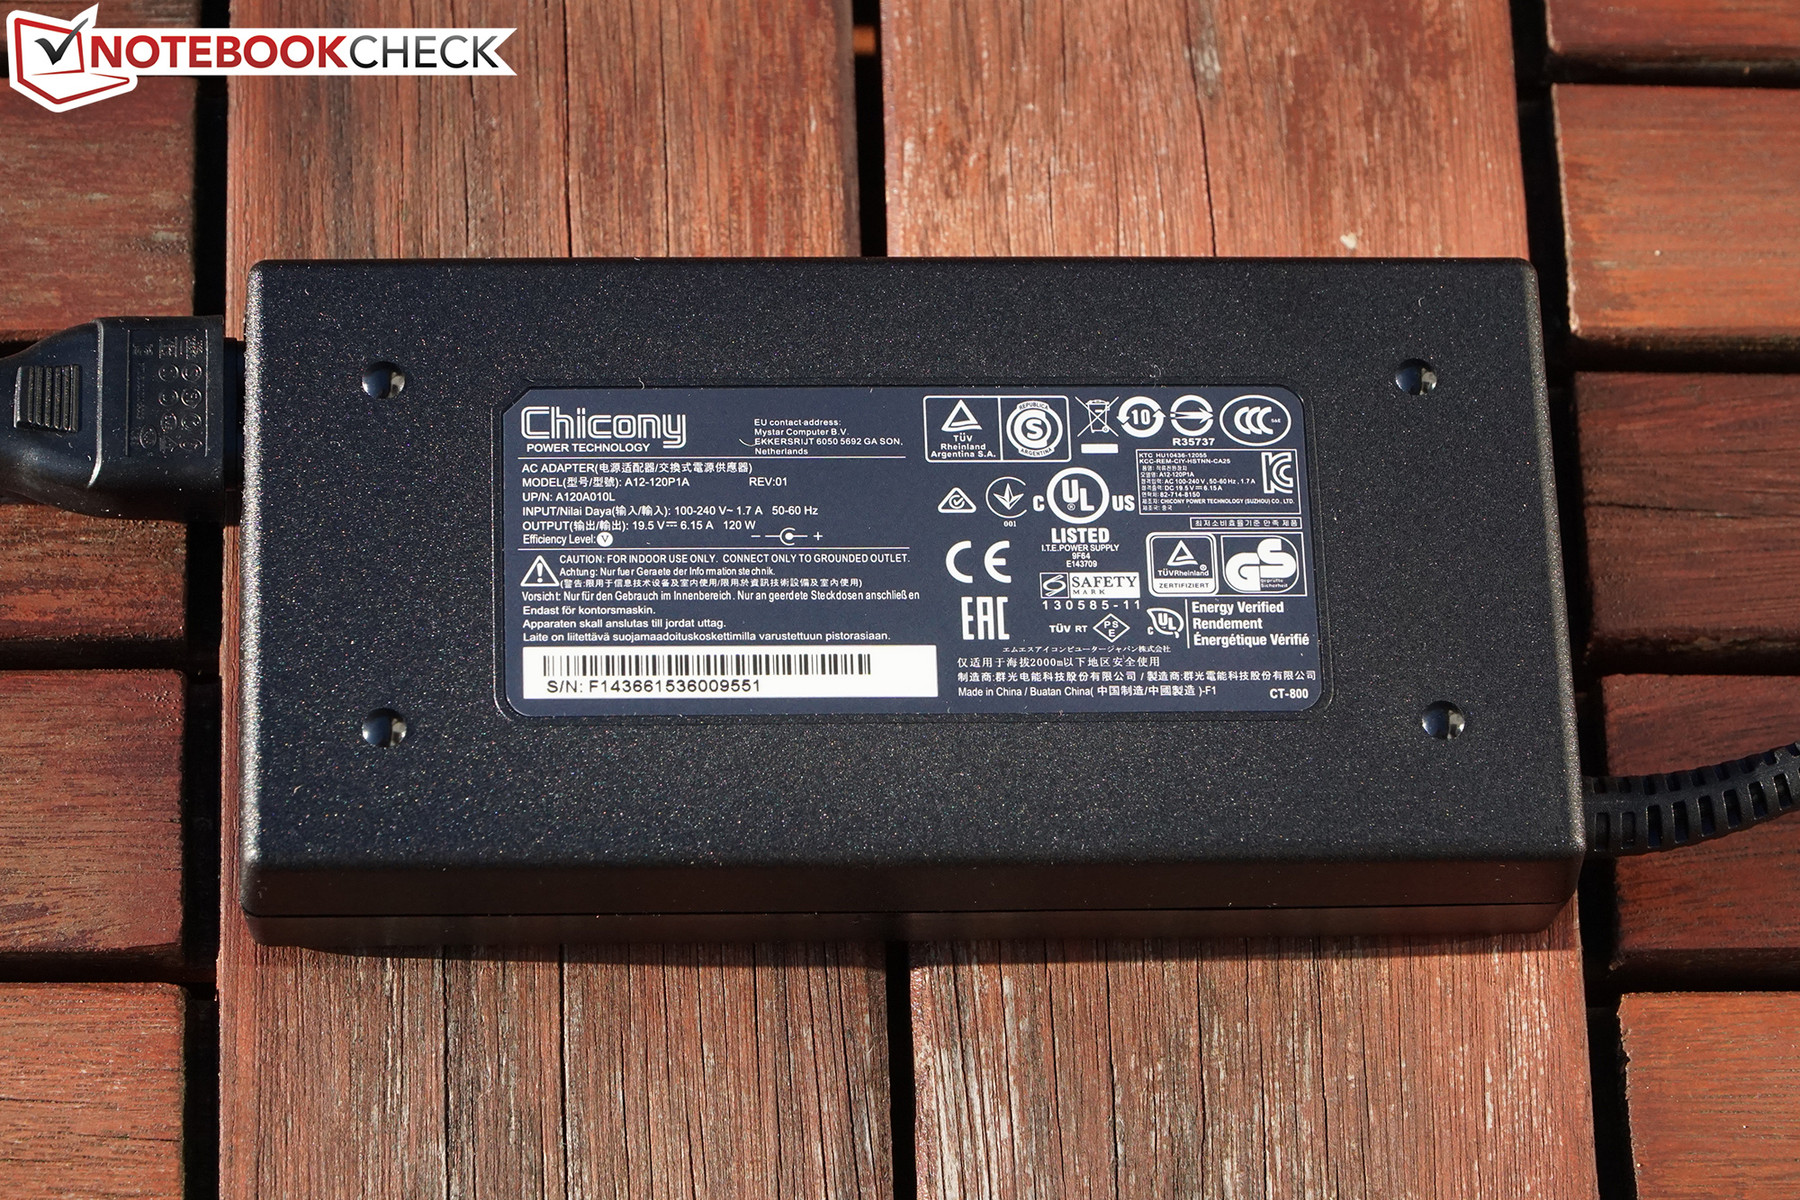
The 120-watt power supply is undersized - the battery slowly depletes even in AC mode, which will prevent prolonged gaming sessions. Apparently, the power supply's efficiency is too low to cover the high average load consumption. This issue is also found in other MSI gaming laptops, such as the GE72.
| Off / Standby | |
| Idle | |
| Load |
|
Key:
min: | |
| MSI GE62-6QD16H11 6700HQ, GeForce GTX 960M | Nexoc G515 II 6700HQ, GeForce GTX 960M | Dell Inspiron 15 7559 6700HQ, GeForce GTX 960M | MSI GE62-2QEUi716H21BW 4720HQ, GeForce GTX 965M | MSI GE62-2QFUi716H11 4720HQ, GeForce GTX 970M | Alienware 15 R2 (Skylake) 6700HQ, GeForce GTX 980M | |
|---|---|---|---|---|---|---|
| Power Consumption | 29% | 32% | 14% | 12% | 16% | |
| Idle Minimum * (Watt) | 20 | 11.2 44% | 9.4 53% | 15 25% | 14.7 26% | 11.4 43% |
| Idle Average * (Watt) | 24 | 14.6 39% | 14.4 40% | 20.8 13% | 20.9 13% | 16.5 31% |
| Idle Maximum * (Watt) | 30 | 21.8 27% | 15 50% | 25.4 15% | 25.6 15% | 22 27% |
| Load Average * (Watt) | 97 | 78.3 19% | 102 -5% | 91.8 5% | 101 -4% | 94.2 3% |
| Load Maximum * (Watt) | 155 | 132.6 14% | 120 23% | 136 12% | 138.8 10% | 192.2 -24% |
* ... smaller is better
Battery Runtime
It is thus not surprising that the battery life of the GE62 6QD is relatively short. Its 53 Wh battery achieves 149 minutes in the Internet browsing test and one hour in the load test. That again shows that the former models retrieved more from the available possibilities, i.e. even smaller batteries. The comparison with identically equipped Skylake rivals is not quite fair since they all have a higher capacity. However, a 137% longer Internet browsing time and only almost 10% more battery capacity achieved by the IdeaPad Y700 at least indicate where current Skylake systems should actually range.
| MSI GE62-6QD16H11 53 Wh | Nexoc G515 II 62 Wh | Lenovo Ideapad Y700 15ISK 80NW 60 Wh | Dell Inspiron 15 7559 74 Wh | MSI GE62-2QEUi716H21BW 51 Wh | MSI GE62-2QFUi716H11 51 Wh | Alienware 15 R2 (Skylake) 96 Wh | |
|---|---|---|---|---|---|---|---|
| Battery runtime | 79% | 139% | 122% | 21% | 17% | 207% | |
| Reader / Idle (h) | 3.1 | 10.3 232% | 11.8 281% | 4.5 45% | 3.9 26% | 12.8 313% | |
| H.264 (h) | 2.3 | 2.7 17% | 2.8 22% | 7.6 230% | |||
| WiFi v1.3 (h) | 2.5 | 4.2 68% | 5.9 136% | 3.9 56% | 2.7 8% | 7.4 196% | |
| Load (h) | 1 | 1.9 90% | 1.5 50% | 1.3 30% | 1 0% | 1.1 10% | 1.9 90% |
| WiFi (h) | 3 |
Pros
Cons
Verdict
It actually started nicely. Our review sample does a relatively good job in the "tough" rating categories even if the Skylake update is far from reaching MSI's promised higher performance. However, gamers will find a very important feature:
The main highlight of MSI's GE62 6QD is its Full HD screen that outperforms its rivals in virtually every rating category. The review sample at least is on par with its rivals in terms of gaming power and routine performance. The new USB 3.1 port is certainly not a primary purchase argument, but it definitely contributes to future-proofing the device.
Unfortunately, our test system makes a range of mistakes in the "secondary" ratings. A lot seems to be interconnected: An exorbitant power consumption and above average temperature development as well as short battery runtimes indicate that the cooling components have taken a turn for the worse compared with the Haswell predecessors. Although the noise development is satisfactory, the coil whining can get annoying depending on personal tolerance.
That makes it questionable whether buying MSI's GE62 6QD is at all worthwhile seeing that the predecessors are still in retail. The FHD screen would be the primary argument for the refresh; as far as we know another panel is installed in the FHD version of the Haswell models (by comparison: review of the iBuyPower GE62), which is far from this quality. The new Skylake CPU does not have an advantage in gaming, and the former GE62 models have the lead in terms of battery life and power consumption. Above all, the latter also develop considerably higher gaming performance thanks to faster GPUs.
Only a limited number of the GE62 2QF with GTX 970M are still available, and they also have a higher price tag than the almost 1600-Euro (~$1746) 6QF successor in some cases. The GE62 2QE with GTX 965M is sold for approximately 1450 Euros (~$1583); this offer seems quite attractive in view of 1500 Euros (~$1637) for our review sample. Buyers looking for an up-to-date and balanced system with a Skylake processor might find something among the competition. Nexoc's G515 II in the SSD version is available for a price starting at 1250 Euros (~$1364); Dell's Inspiron 15 7559 already starts at 1100 Euros (~$1201, with SSHD).
MSI GE62-6QD16H11
- 02/16/2016 v5 (old)
Oliver Moebel
Price comparison
