Dirt Rally Notebook Benchmarks
For the original German article, see here.
Game Engine
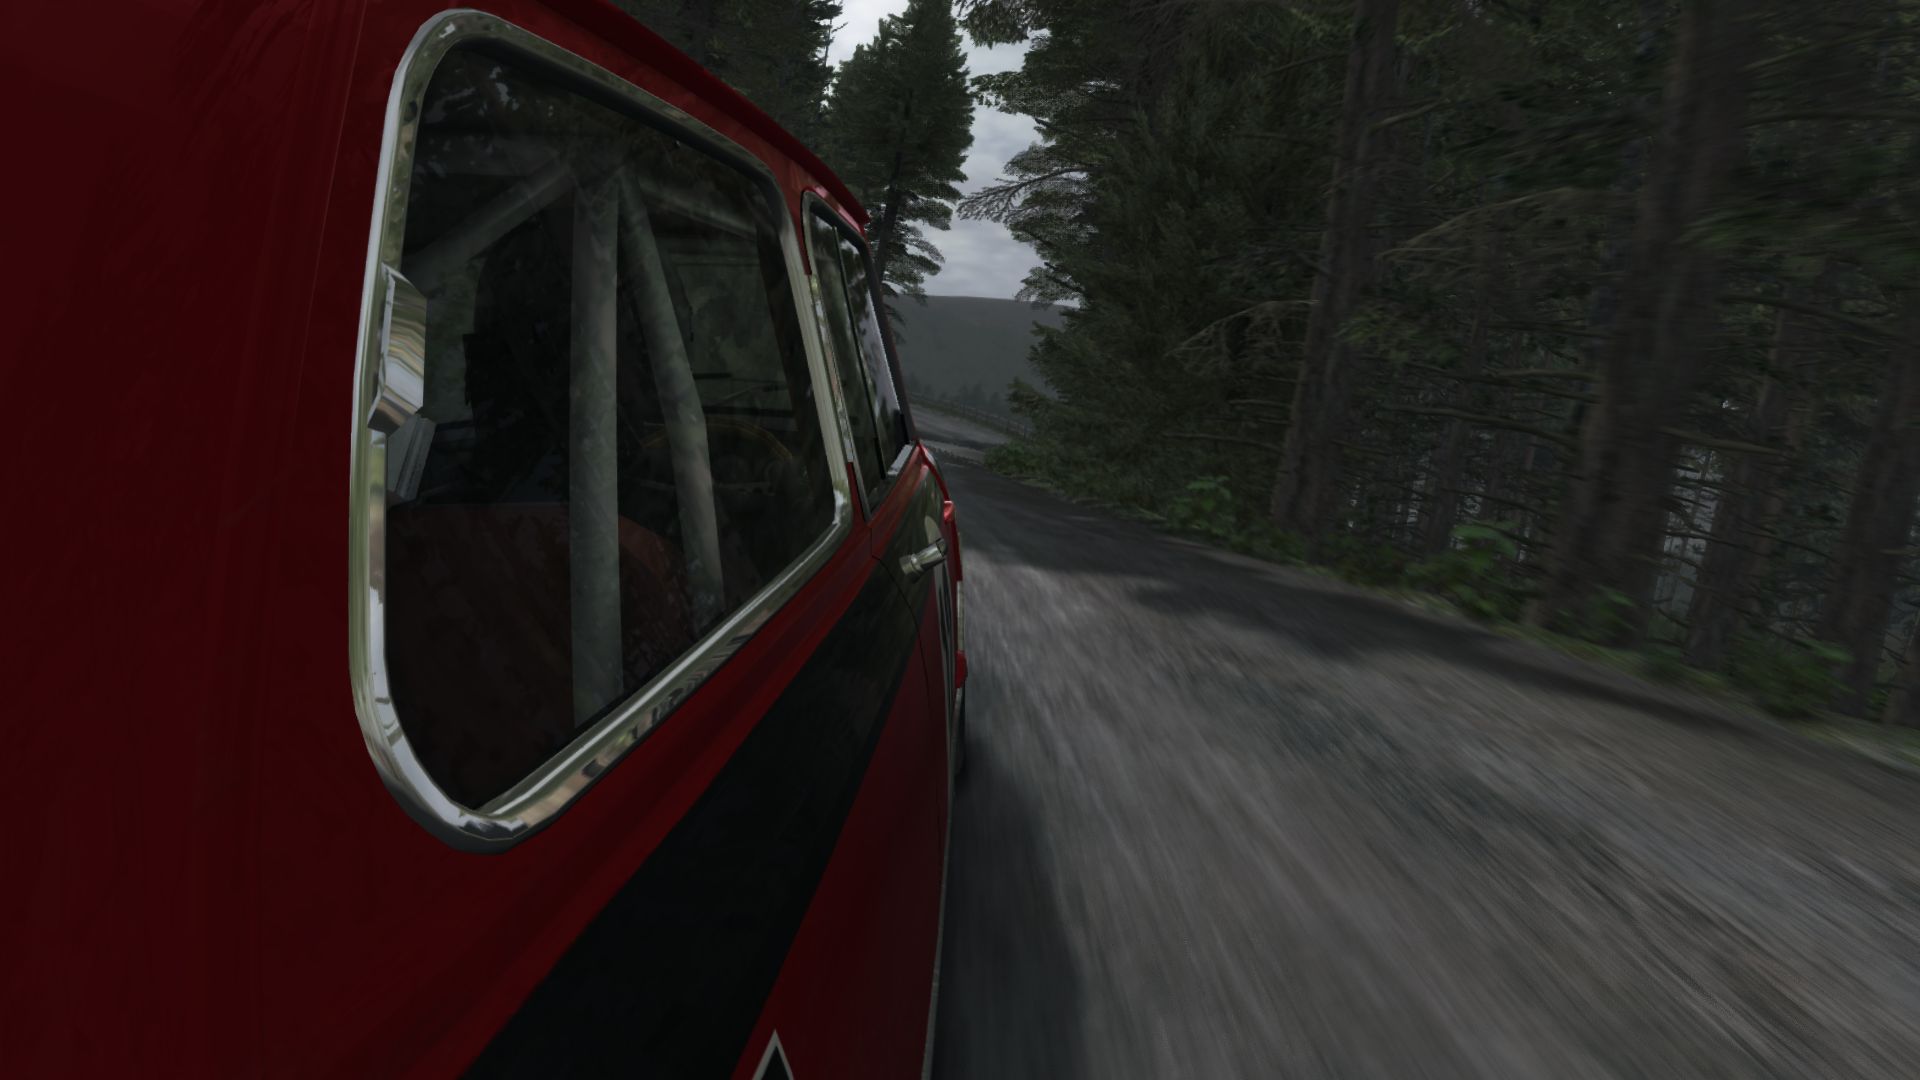
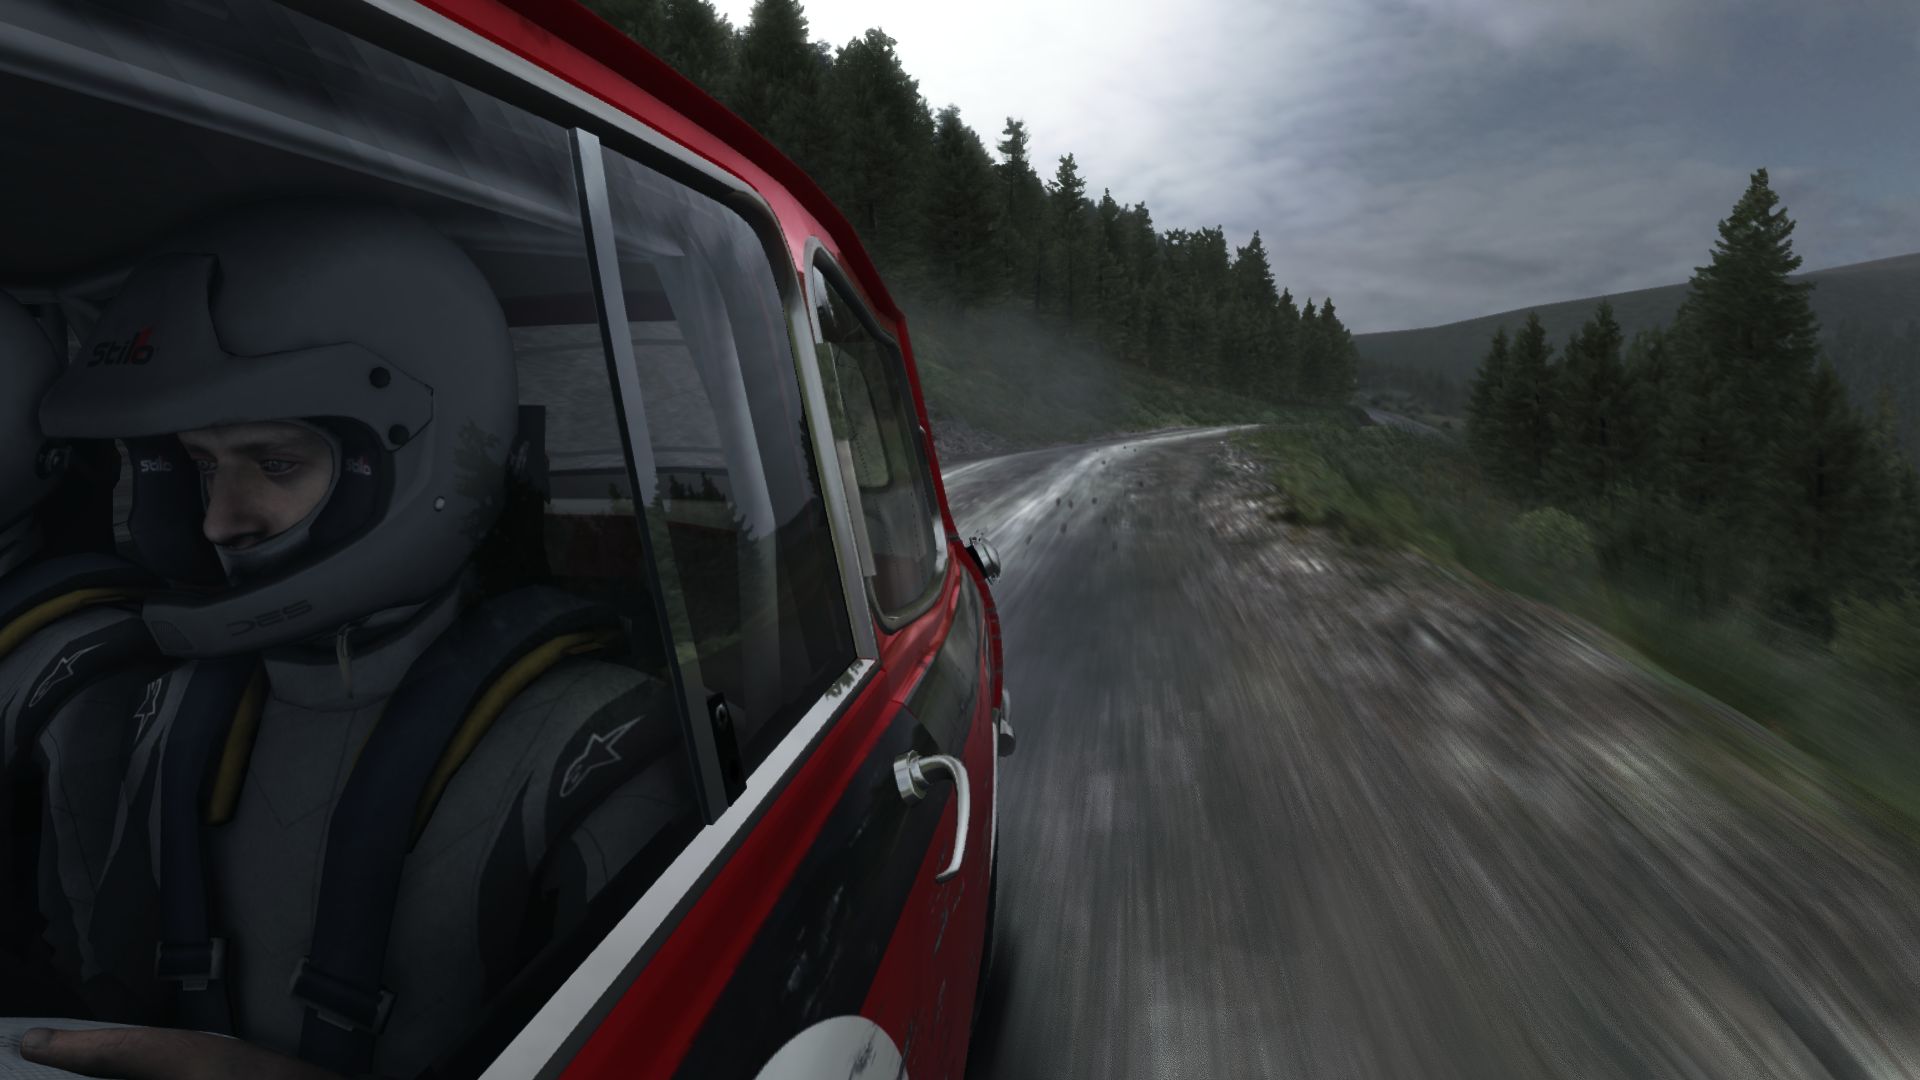
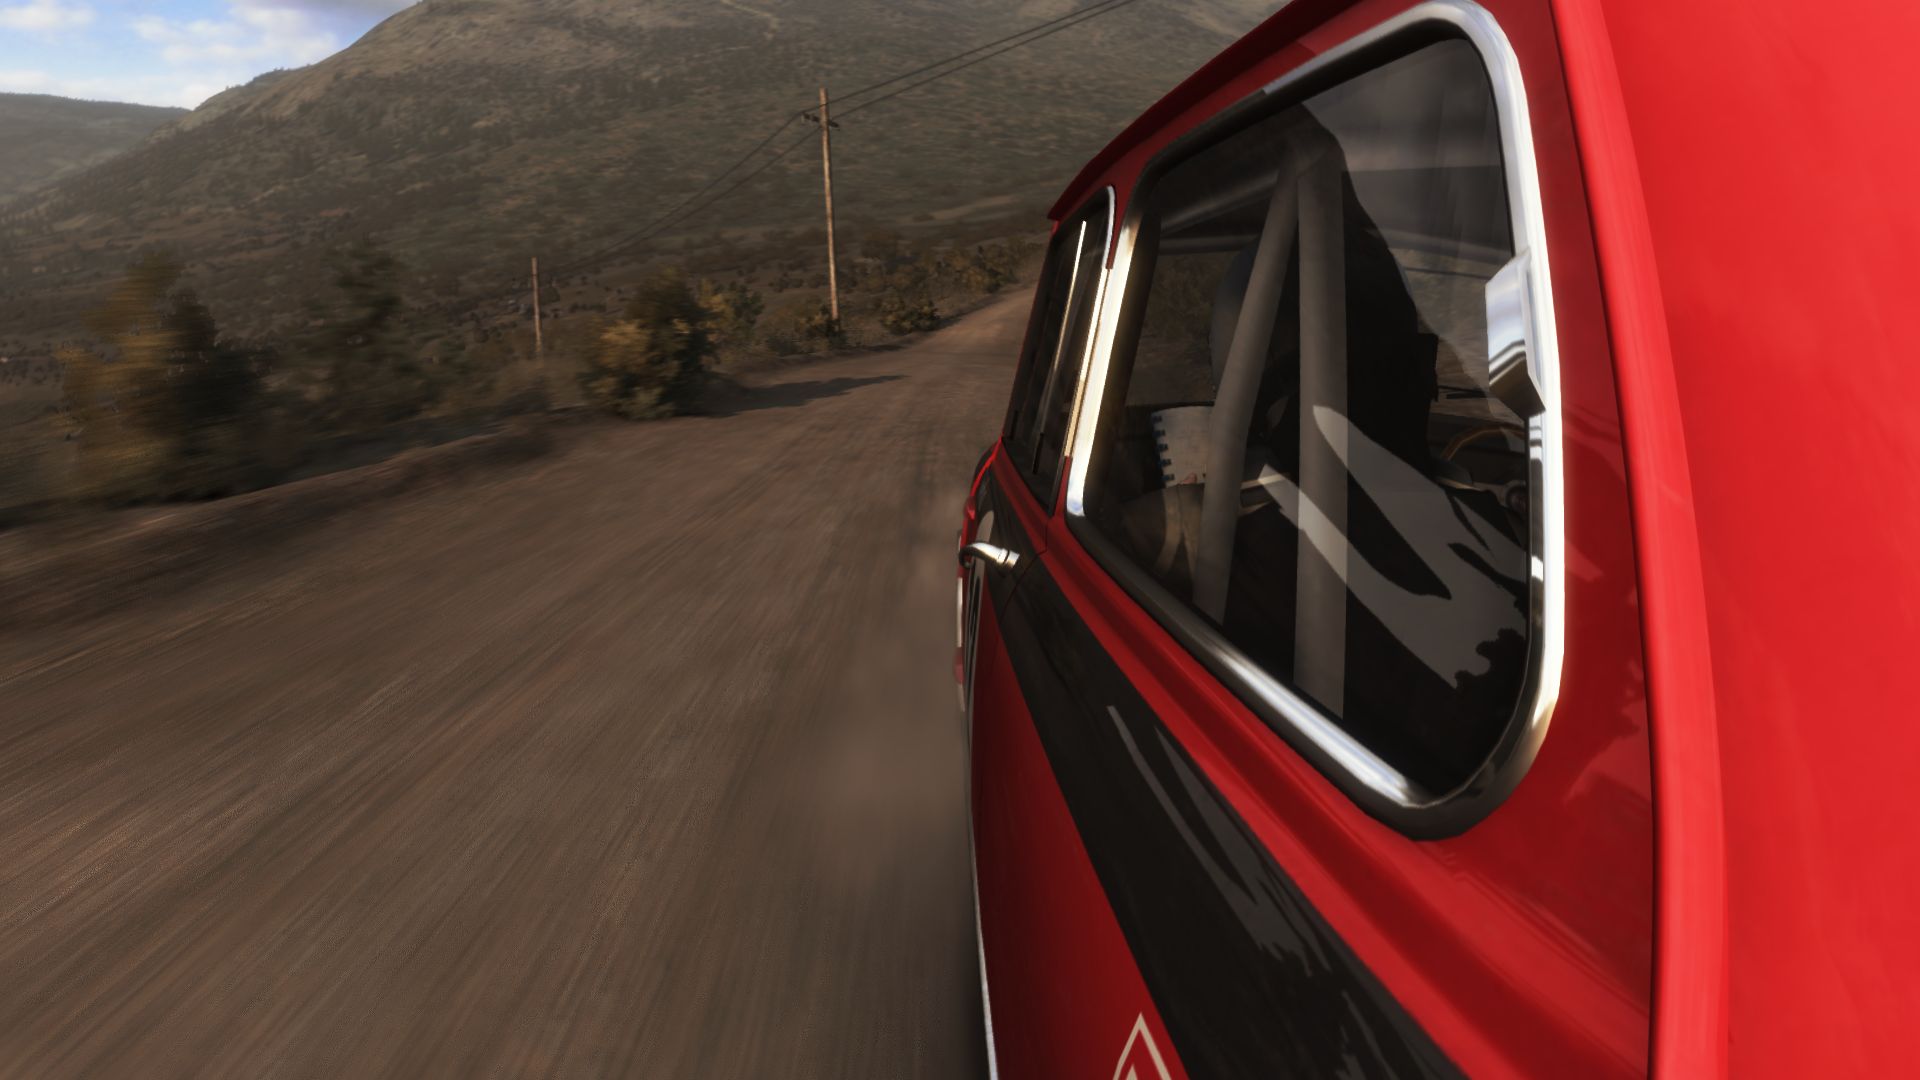
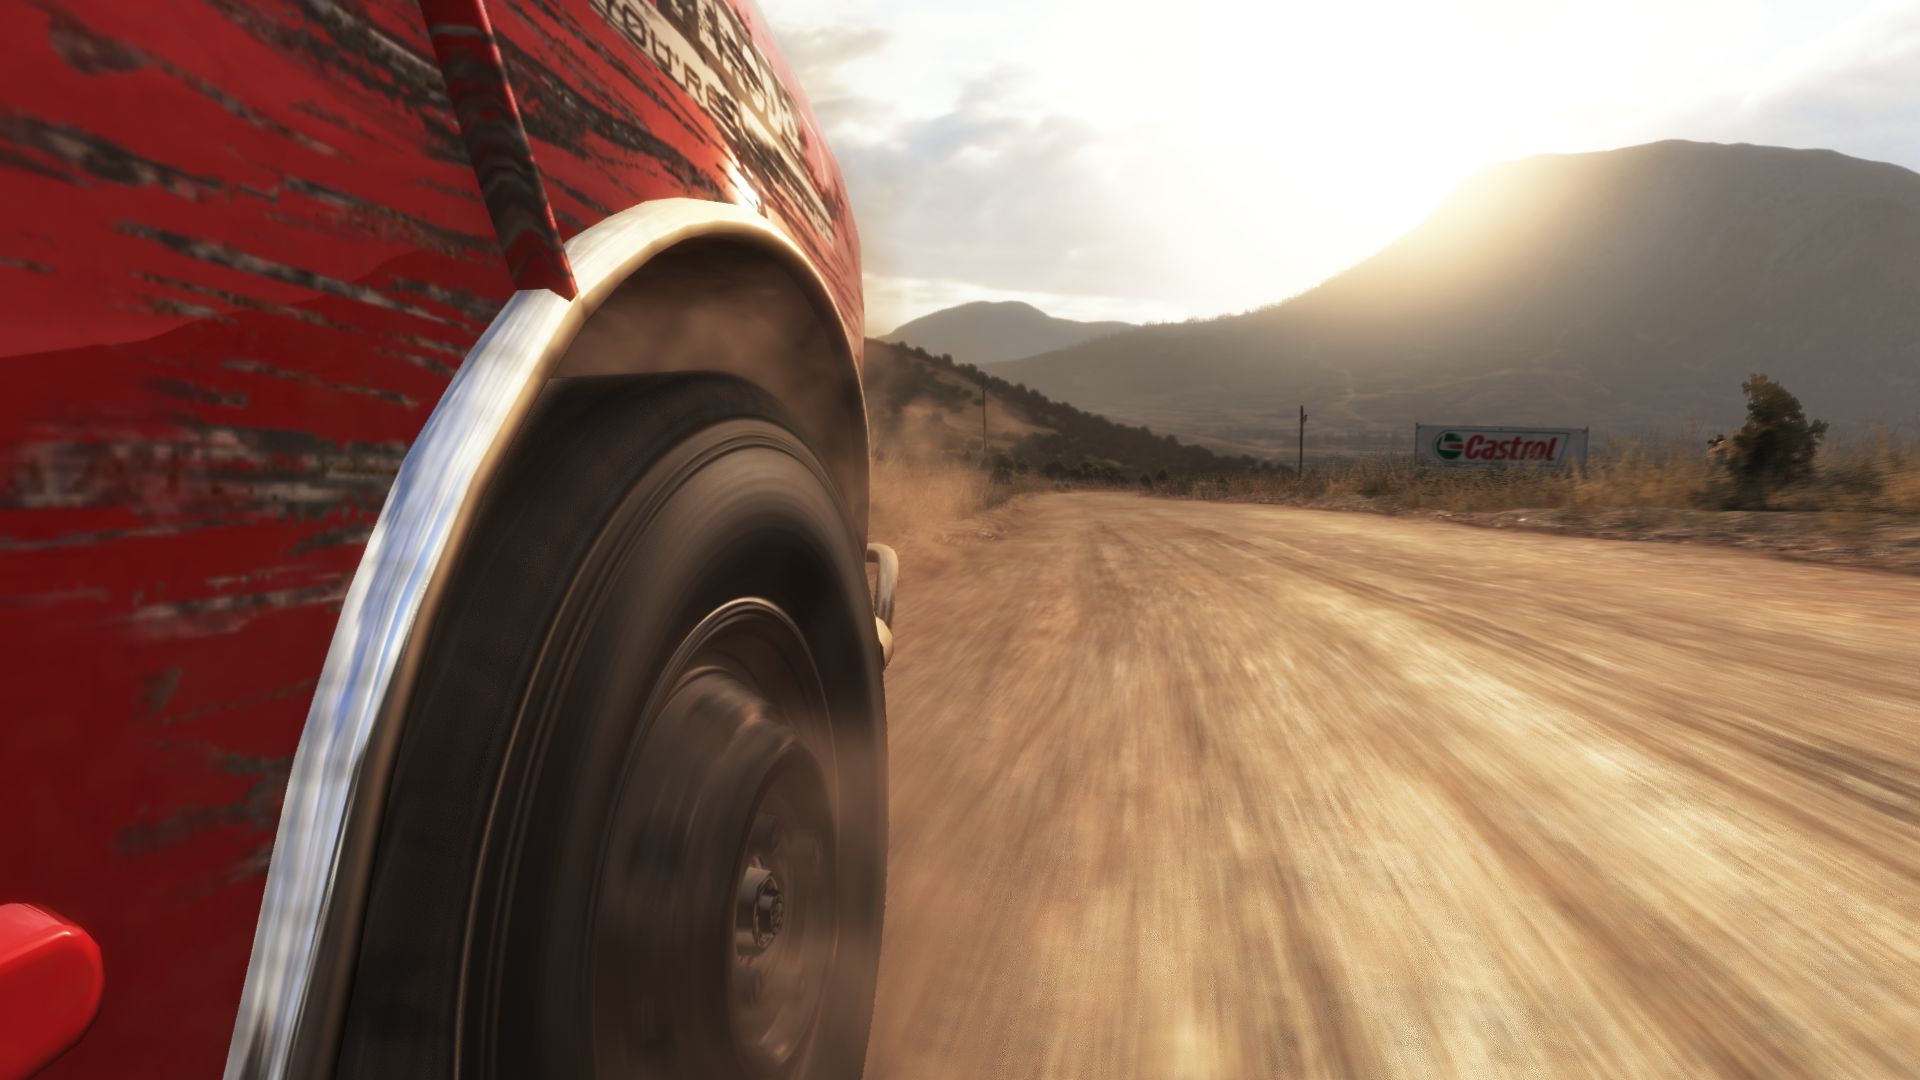
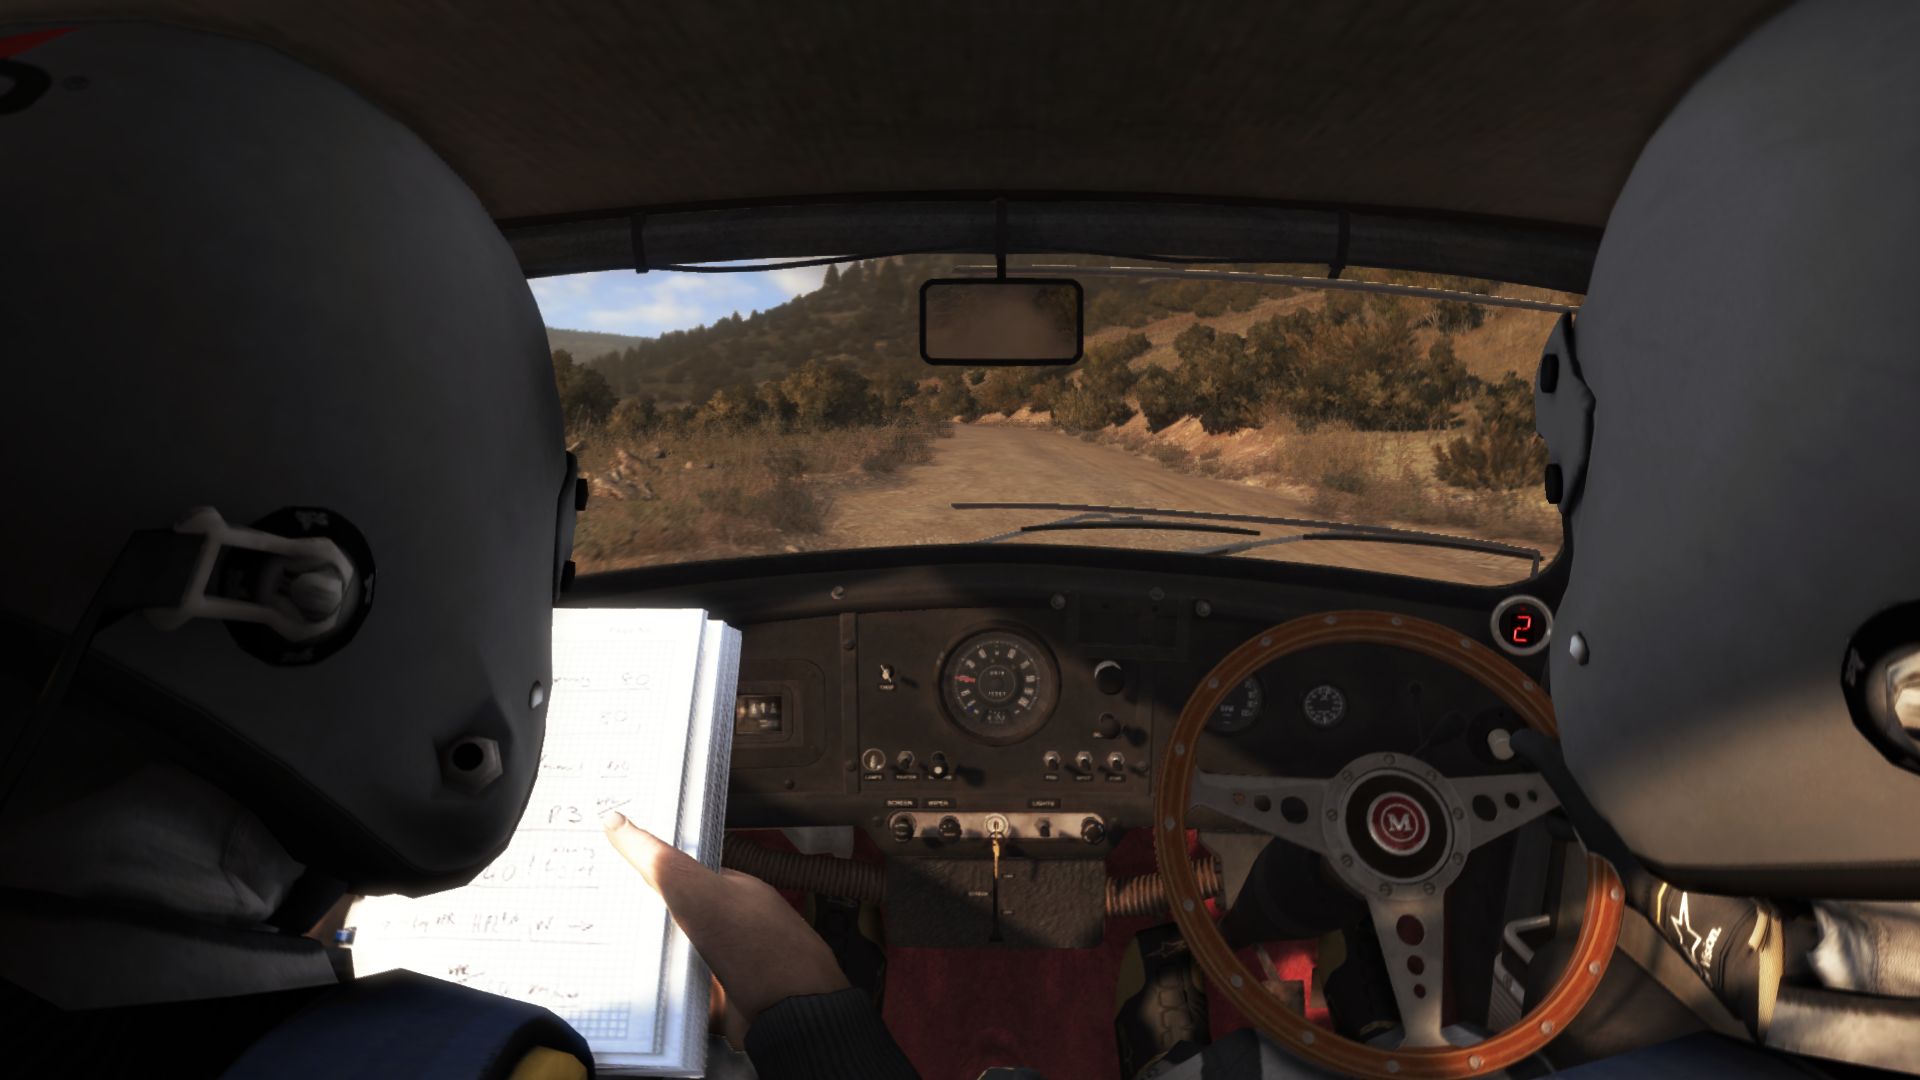
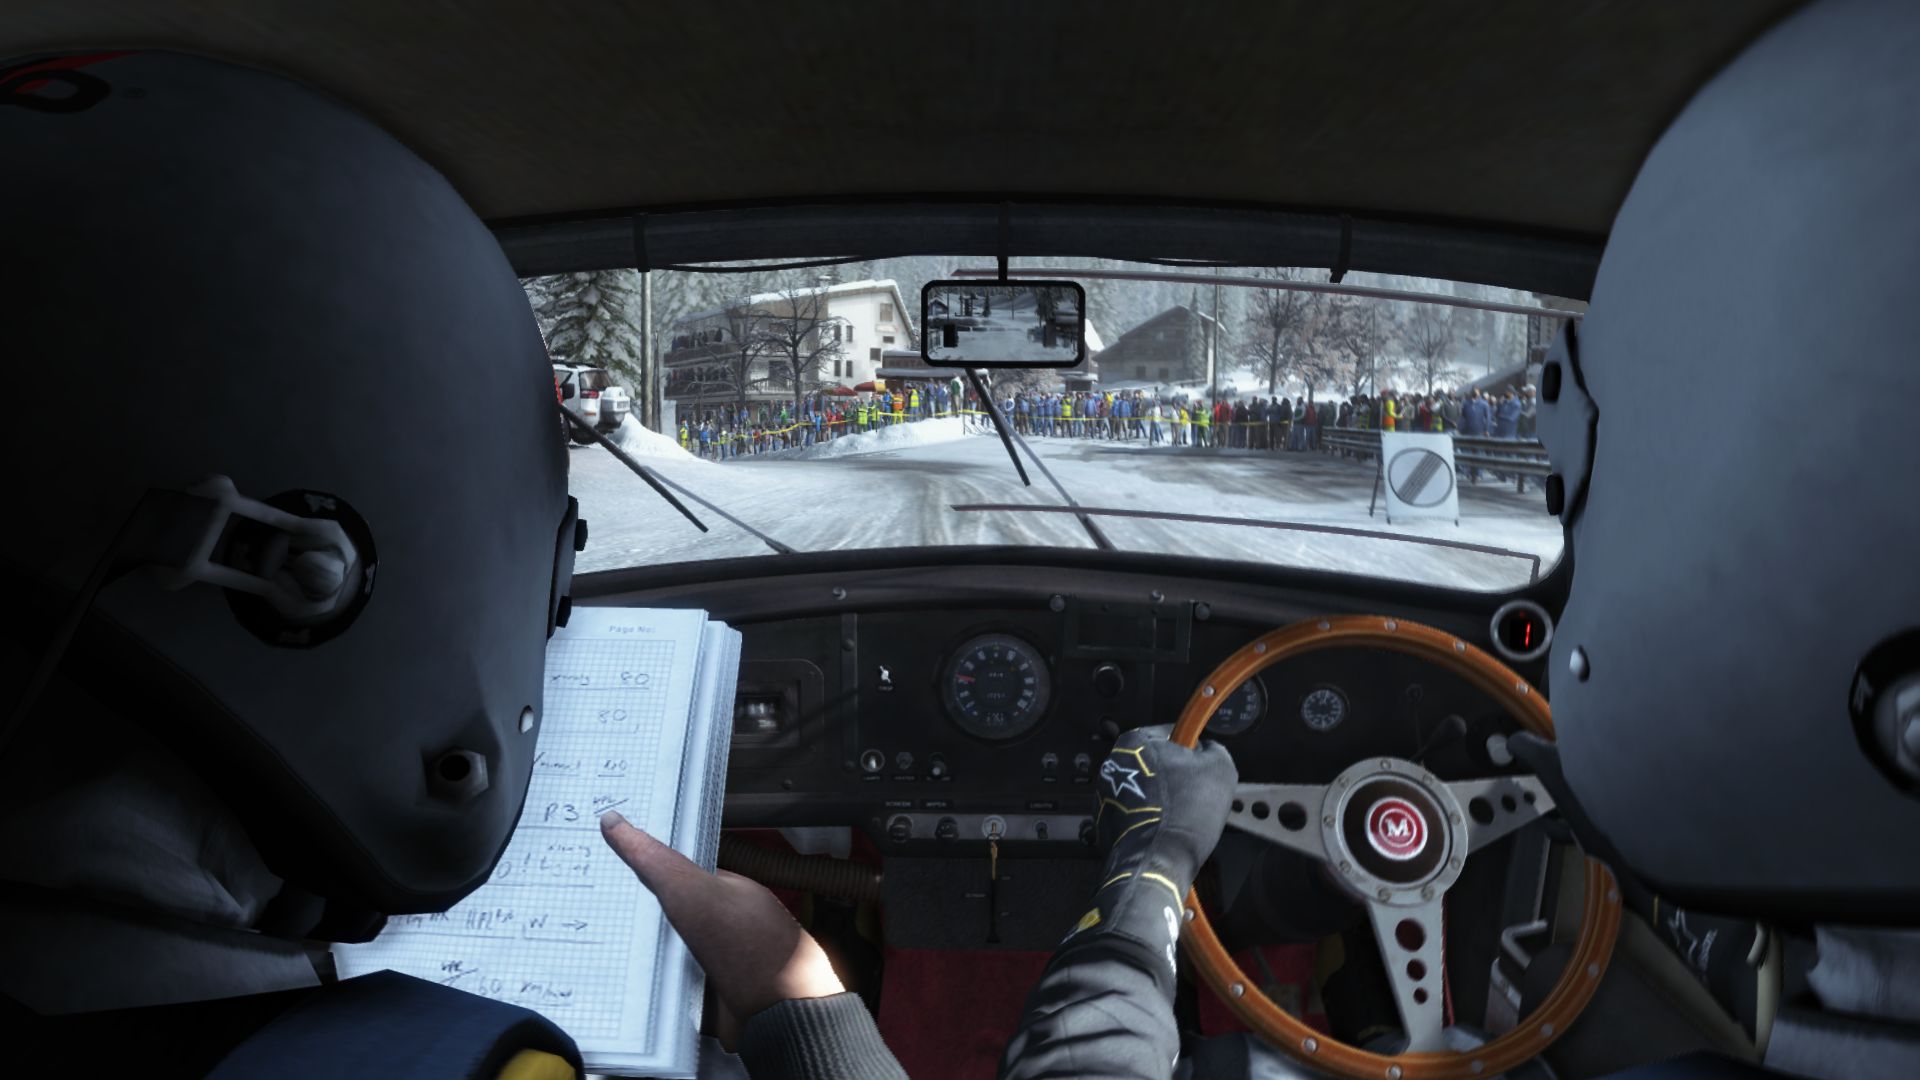
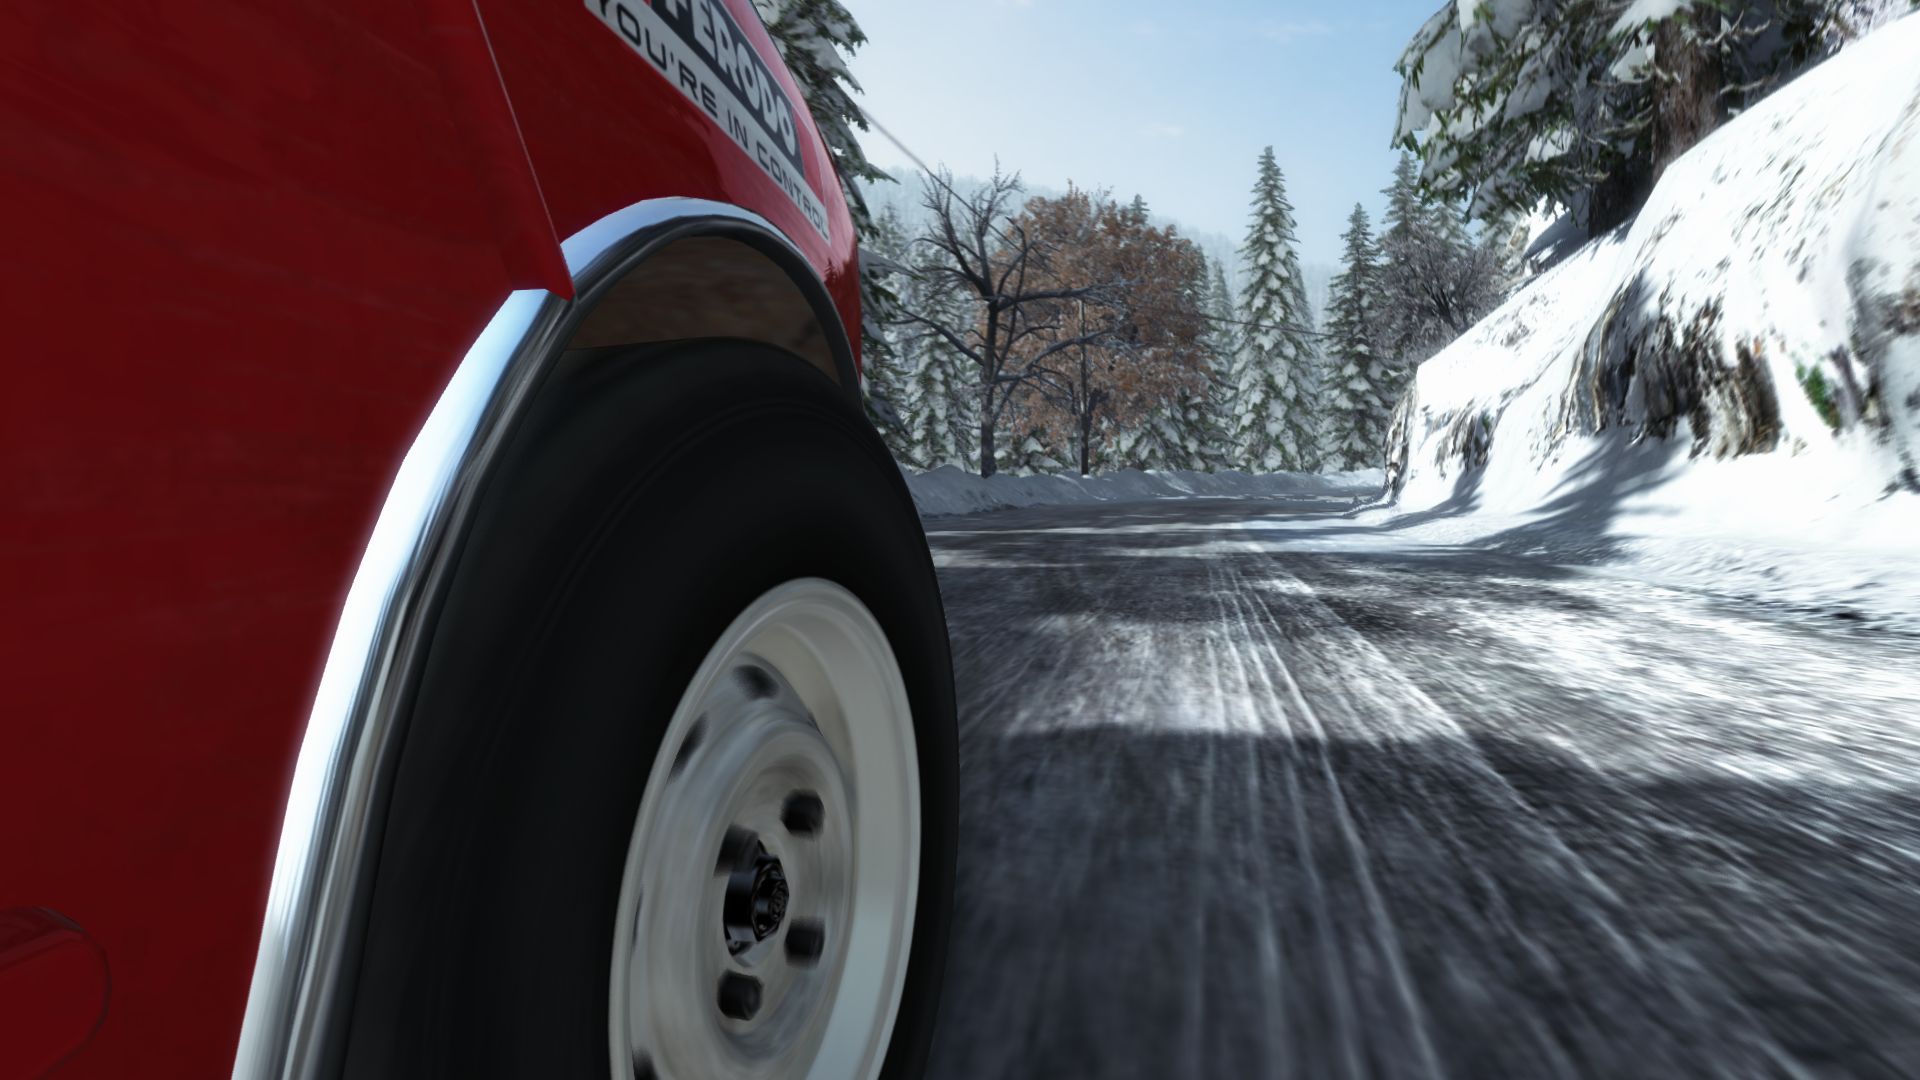
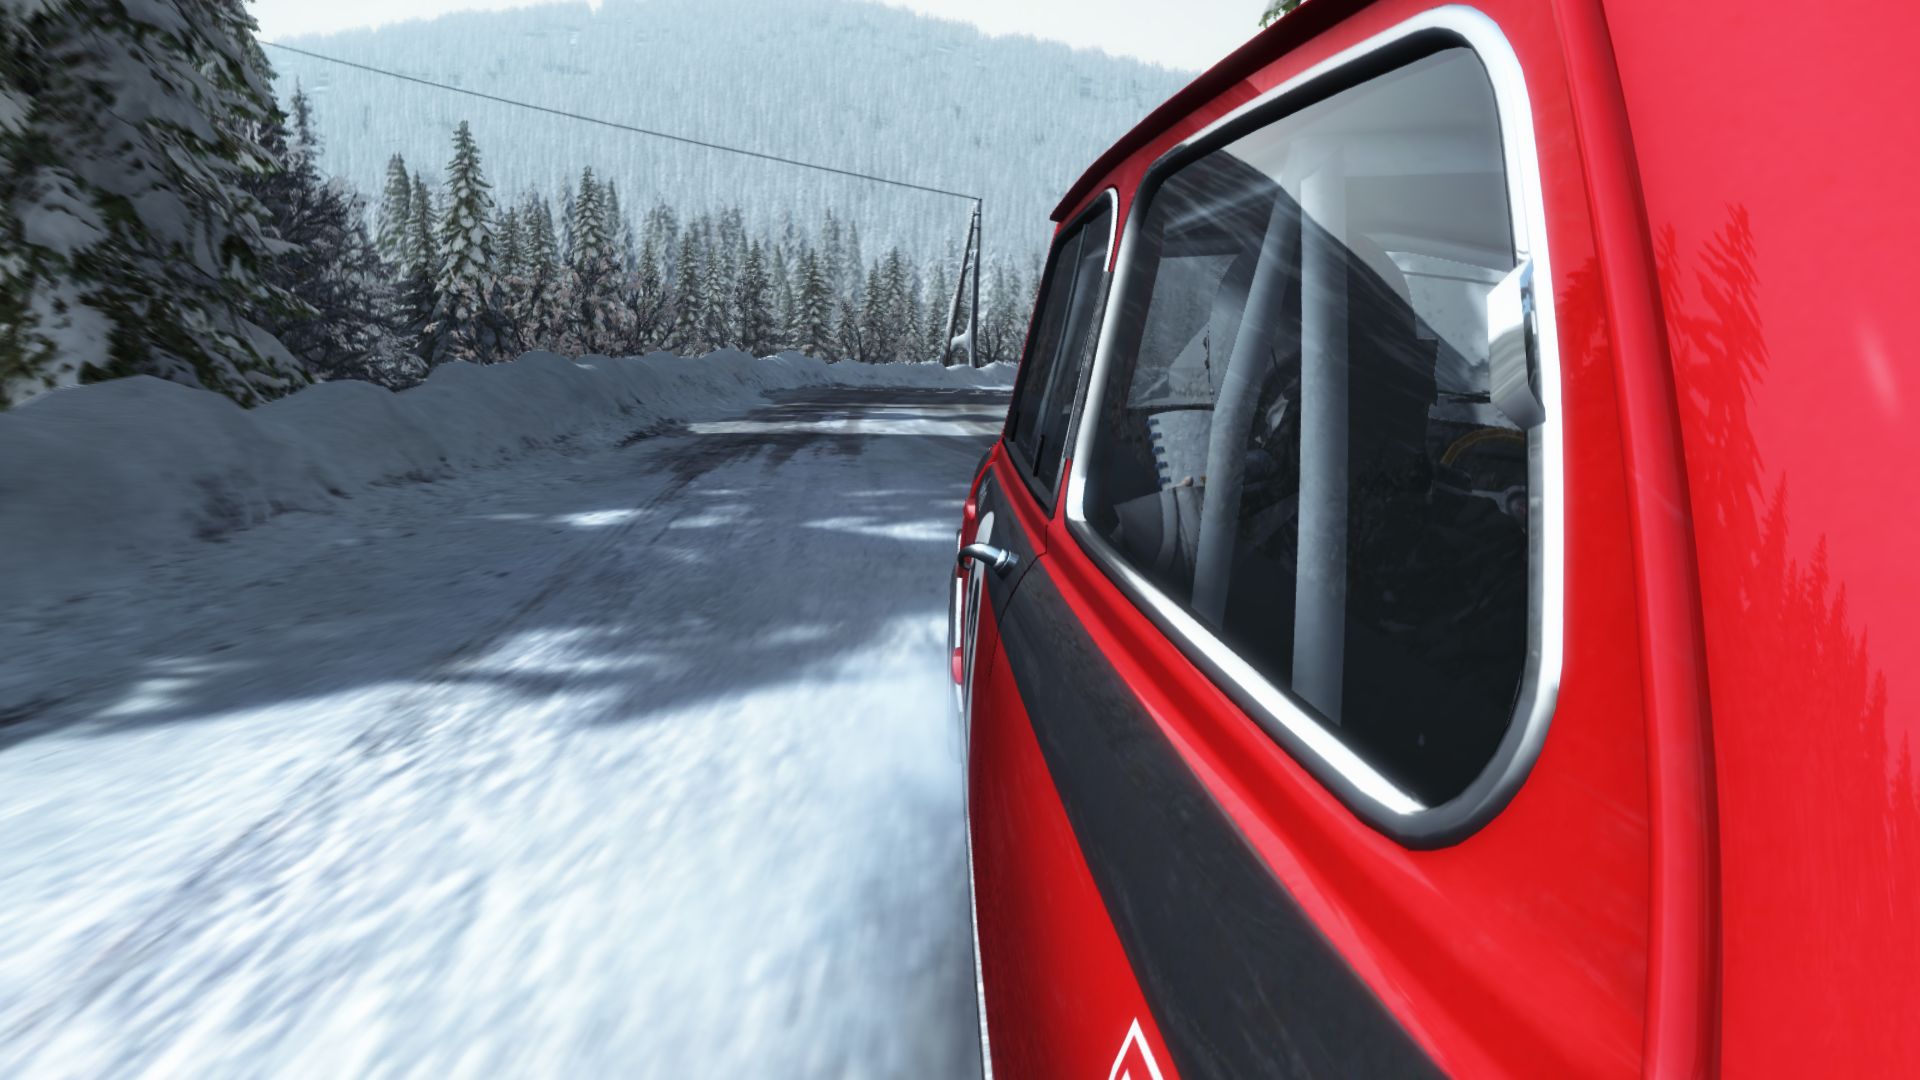
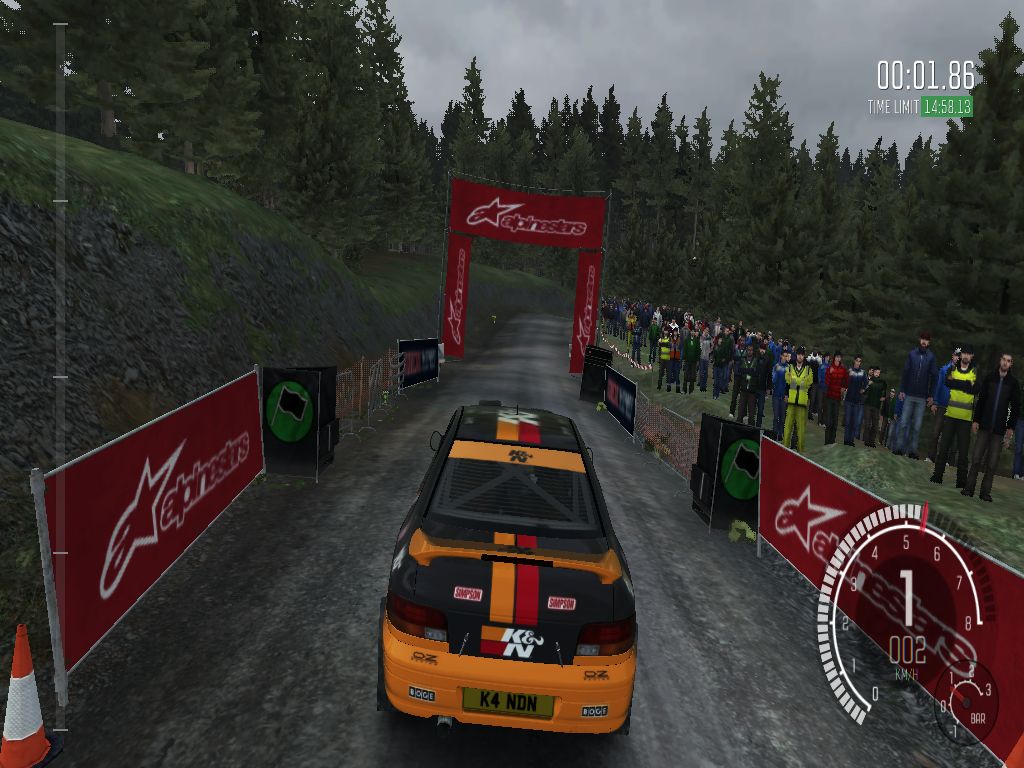
“Dirt Rally” uses the fourth phase of the EGO engine. The predecessor of this engine can be found in games like “Grid 2”, “Grid Autosport” and “F1 2013/2014” - all of which are made by Codemasters. Although the engine offers decent/good visuals, it looks a little outdated. The cars have glossy reflections and amazing details (inside and outside), but the race tracks are no longer up-to-date. The lighting is not great (depending on the time of day, the scene may appear pale and garish, similar to “Watch Dogs”) and the textures can be poor from time to time. We particularly dislike the ground graphics, which should be far better, considering this is the year 2015. Tessellation should add more structure and details here. Furthermore, the tracks left behind by the car seem to be 2D textures.
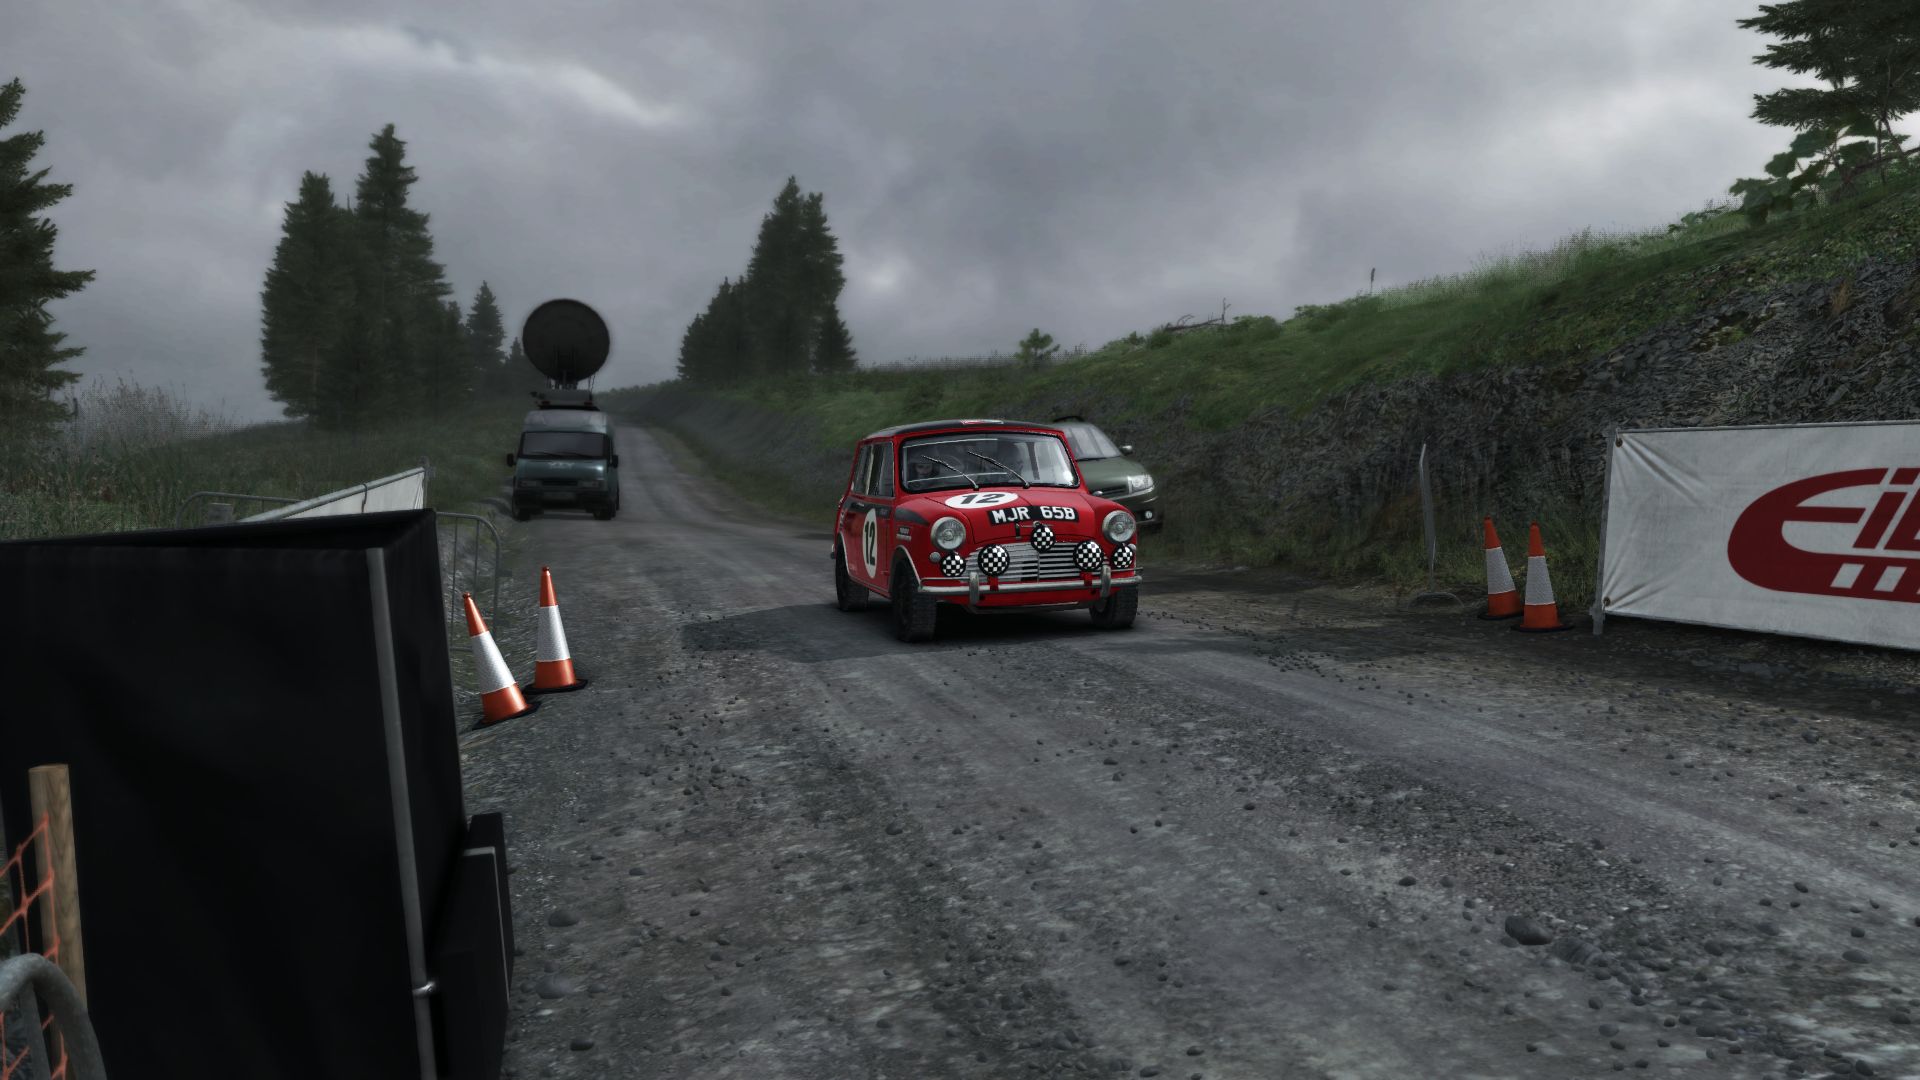
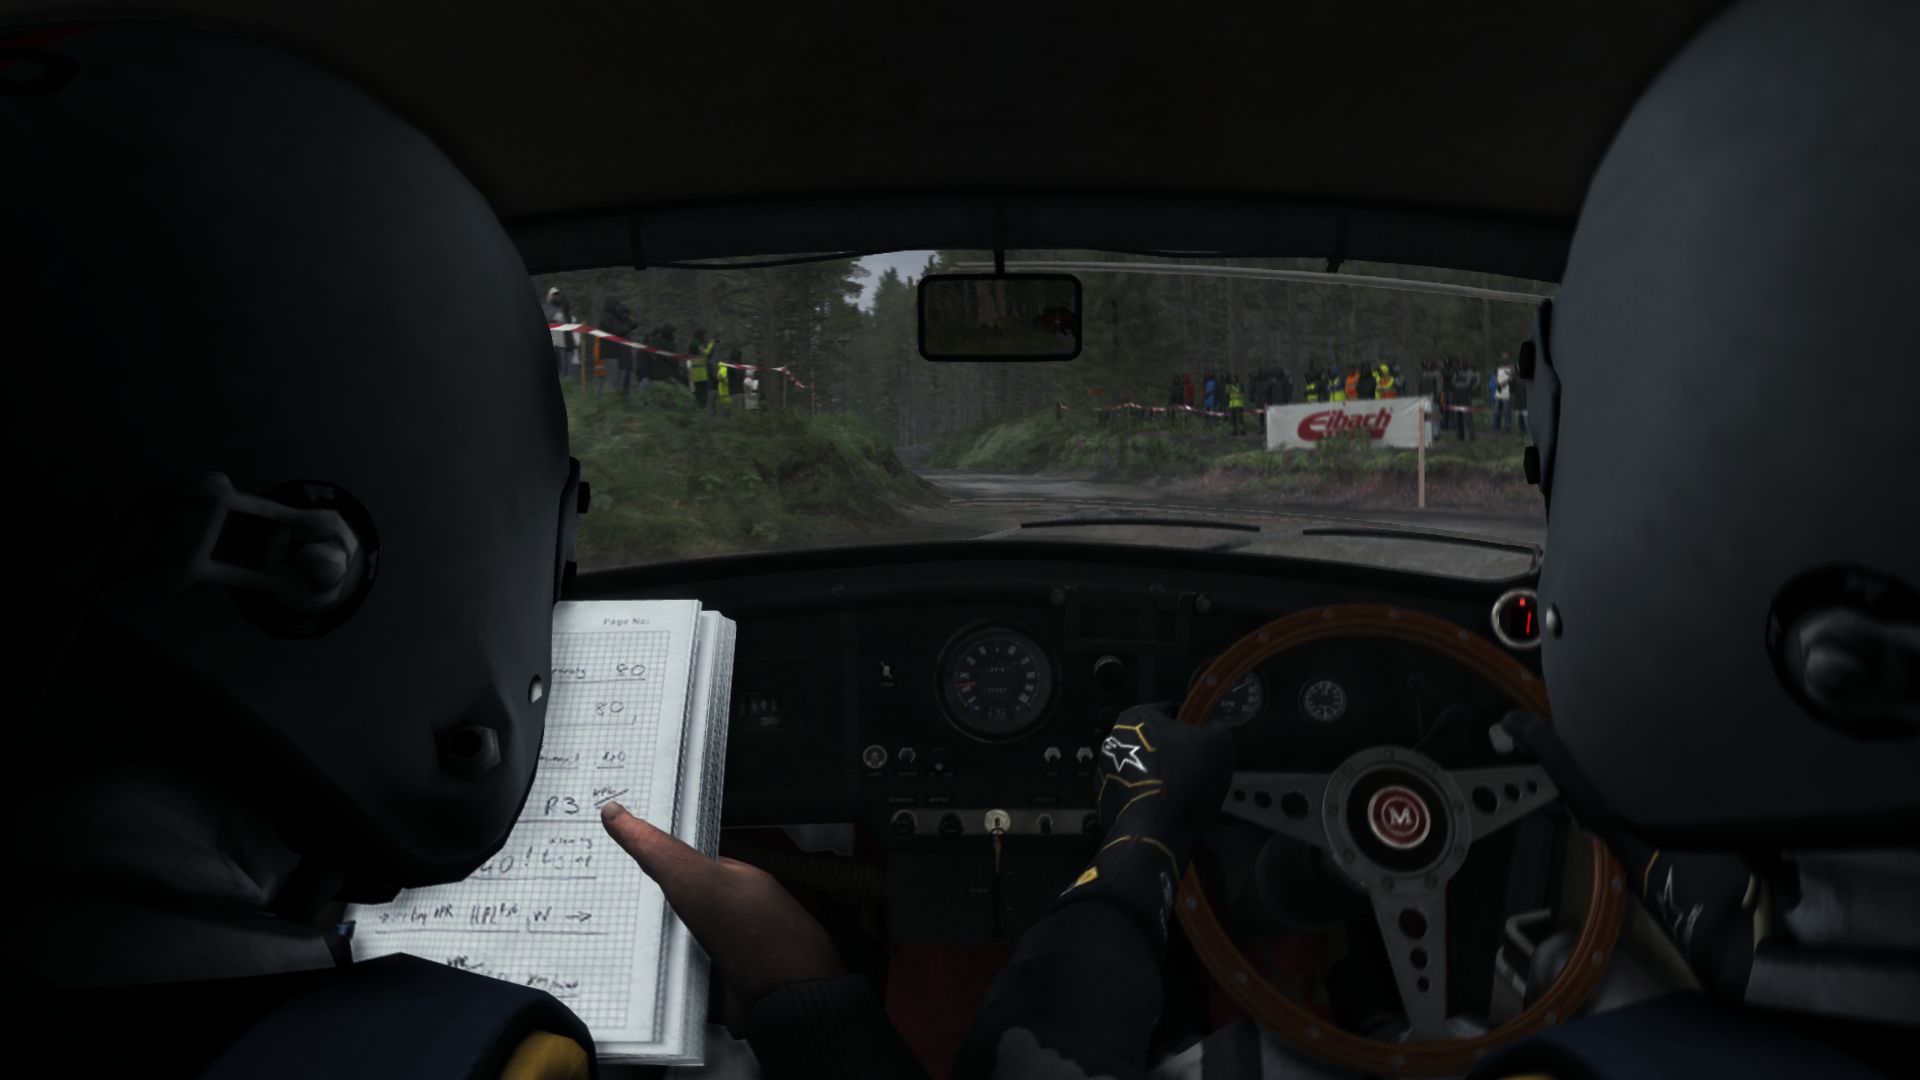
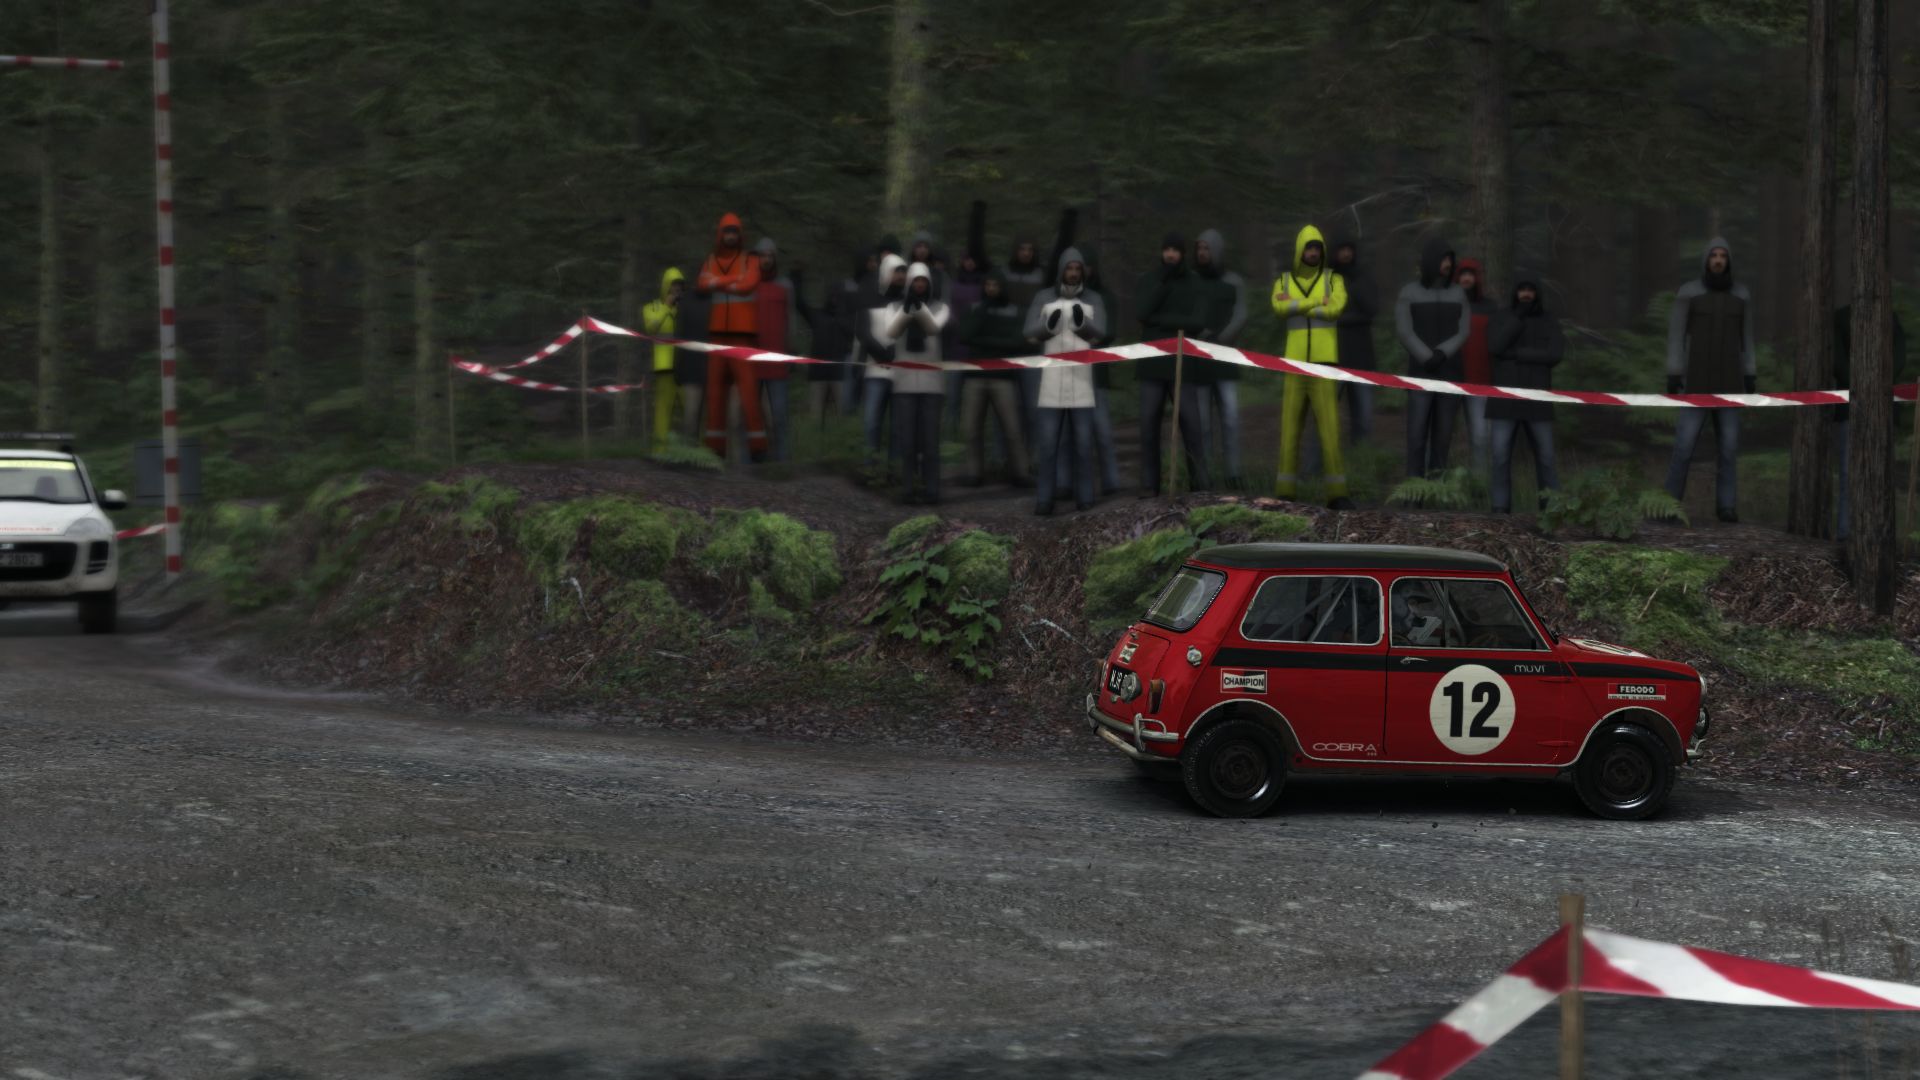
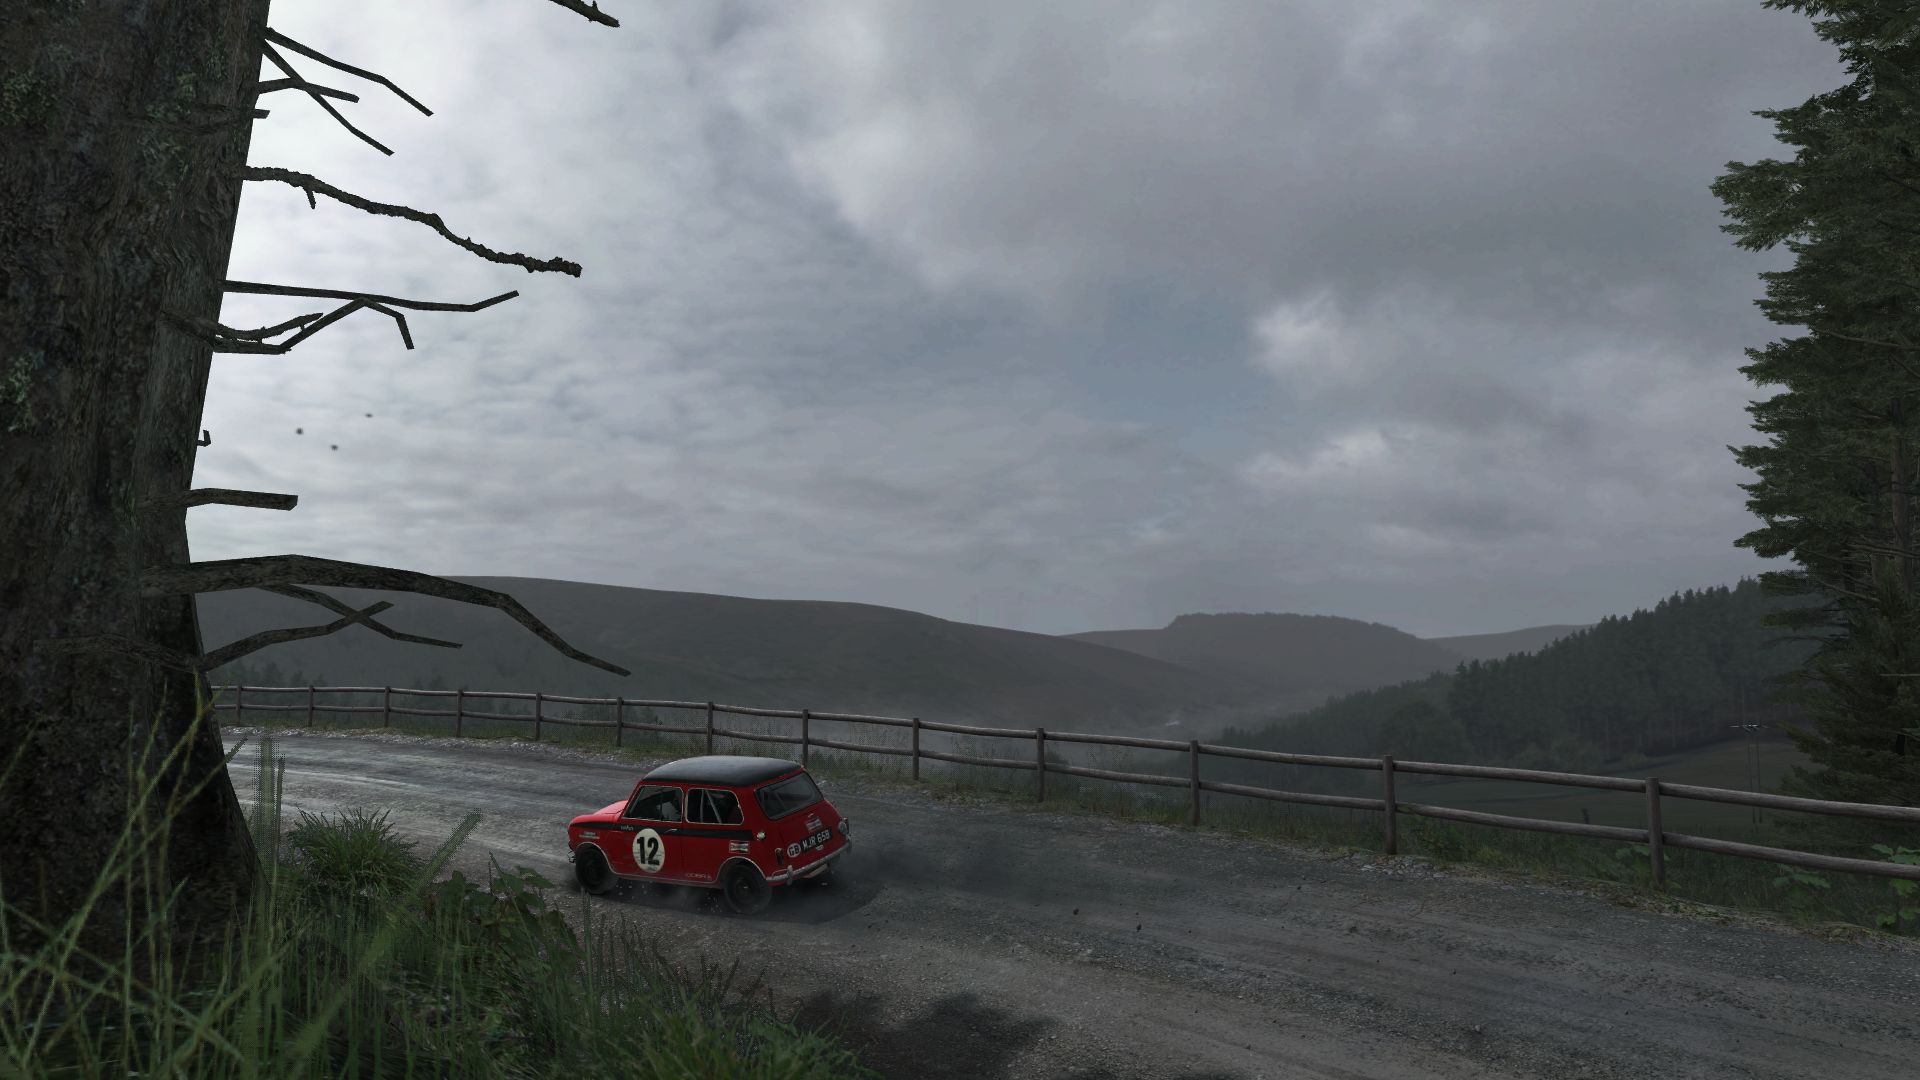
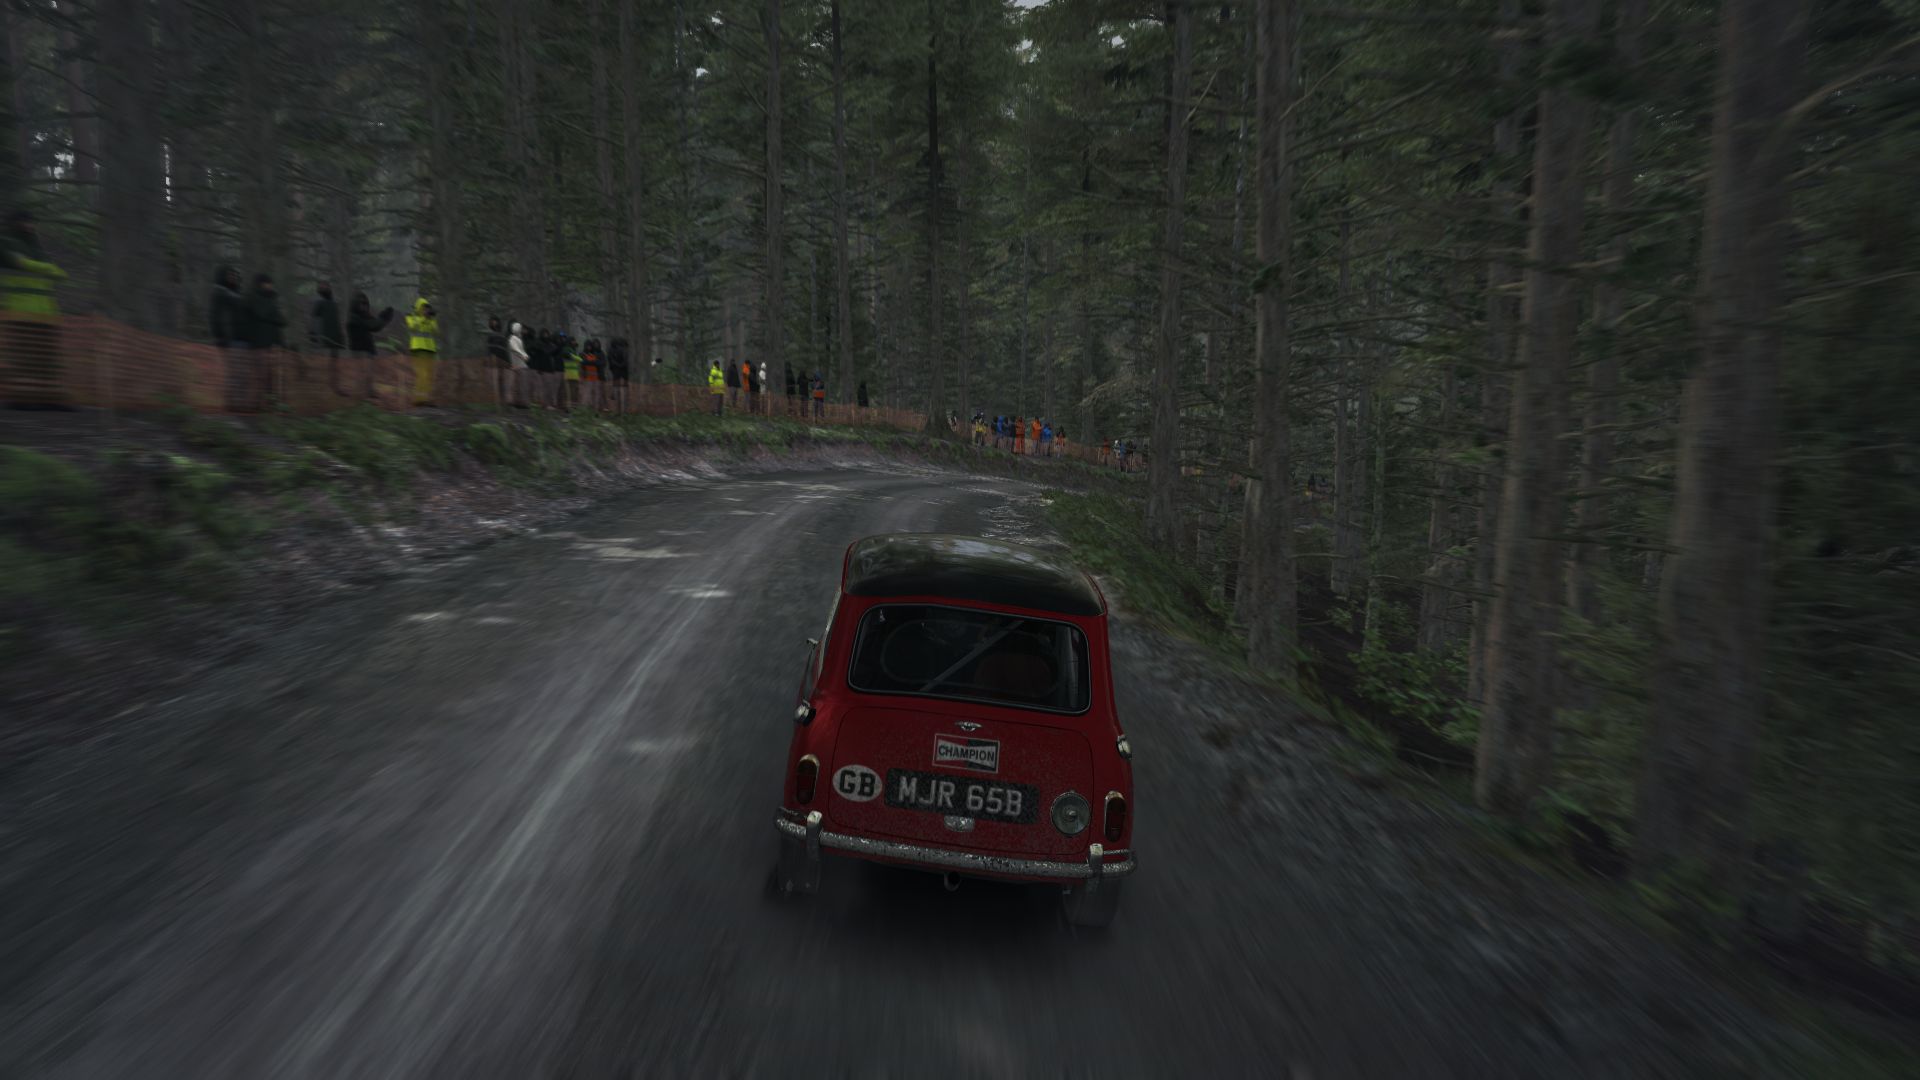
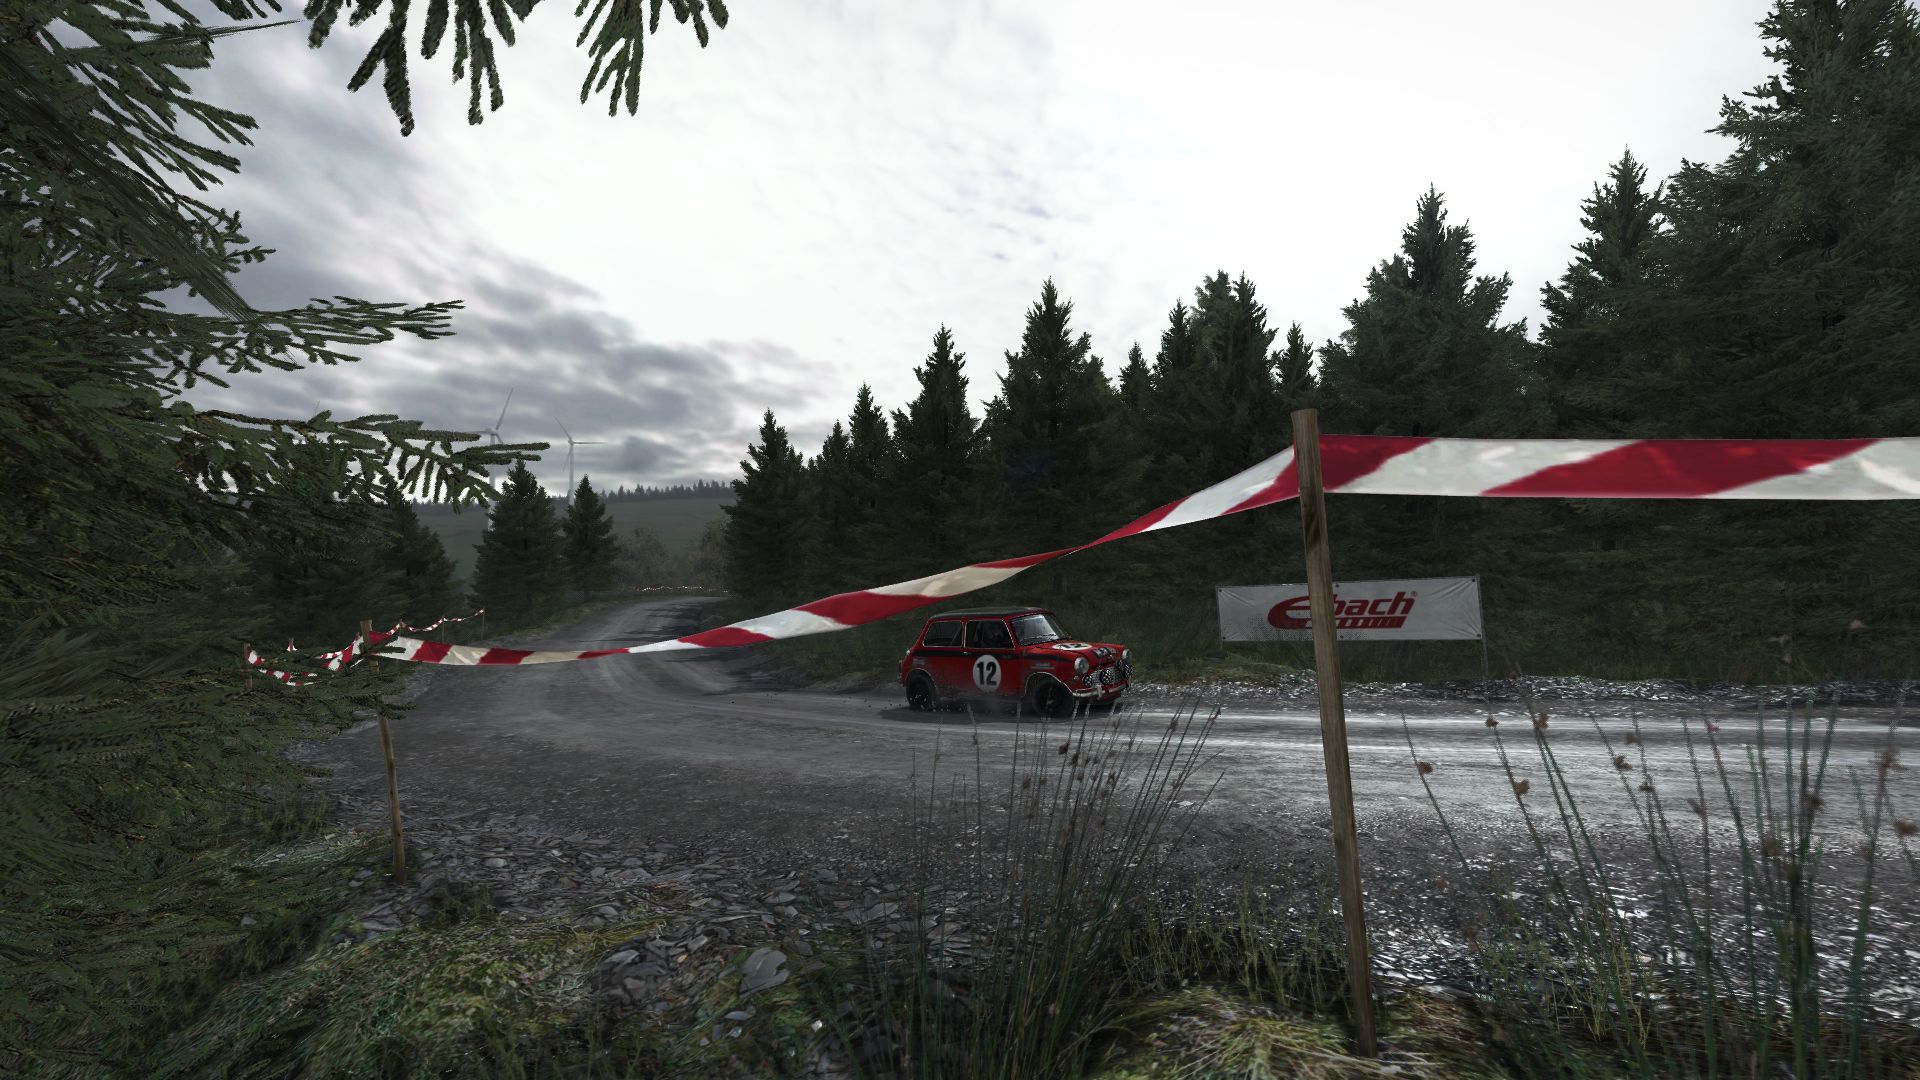
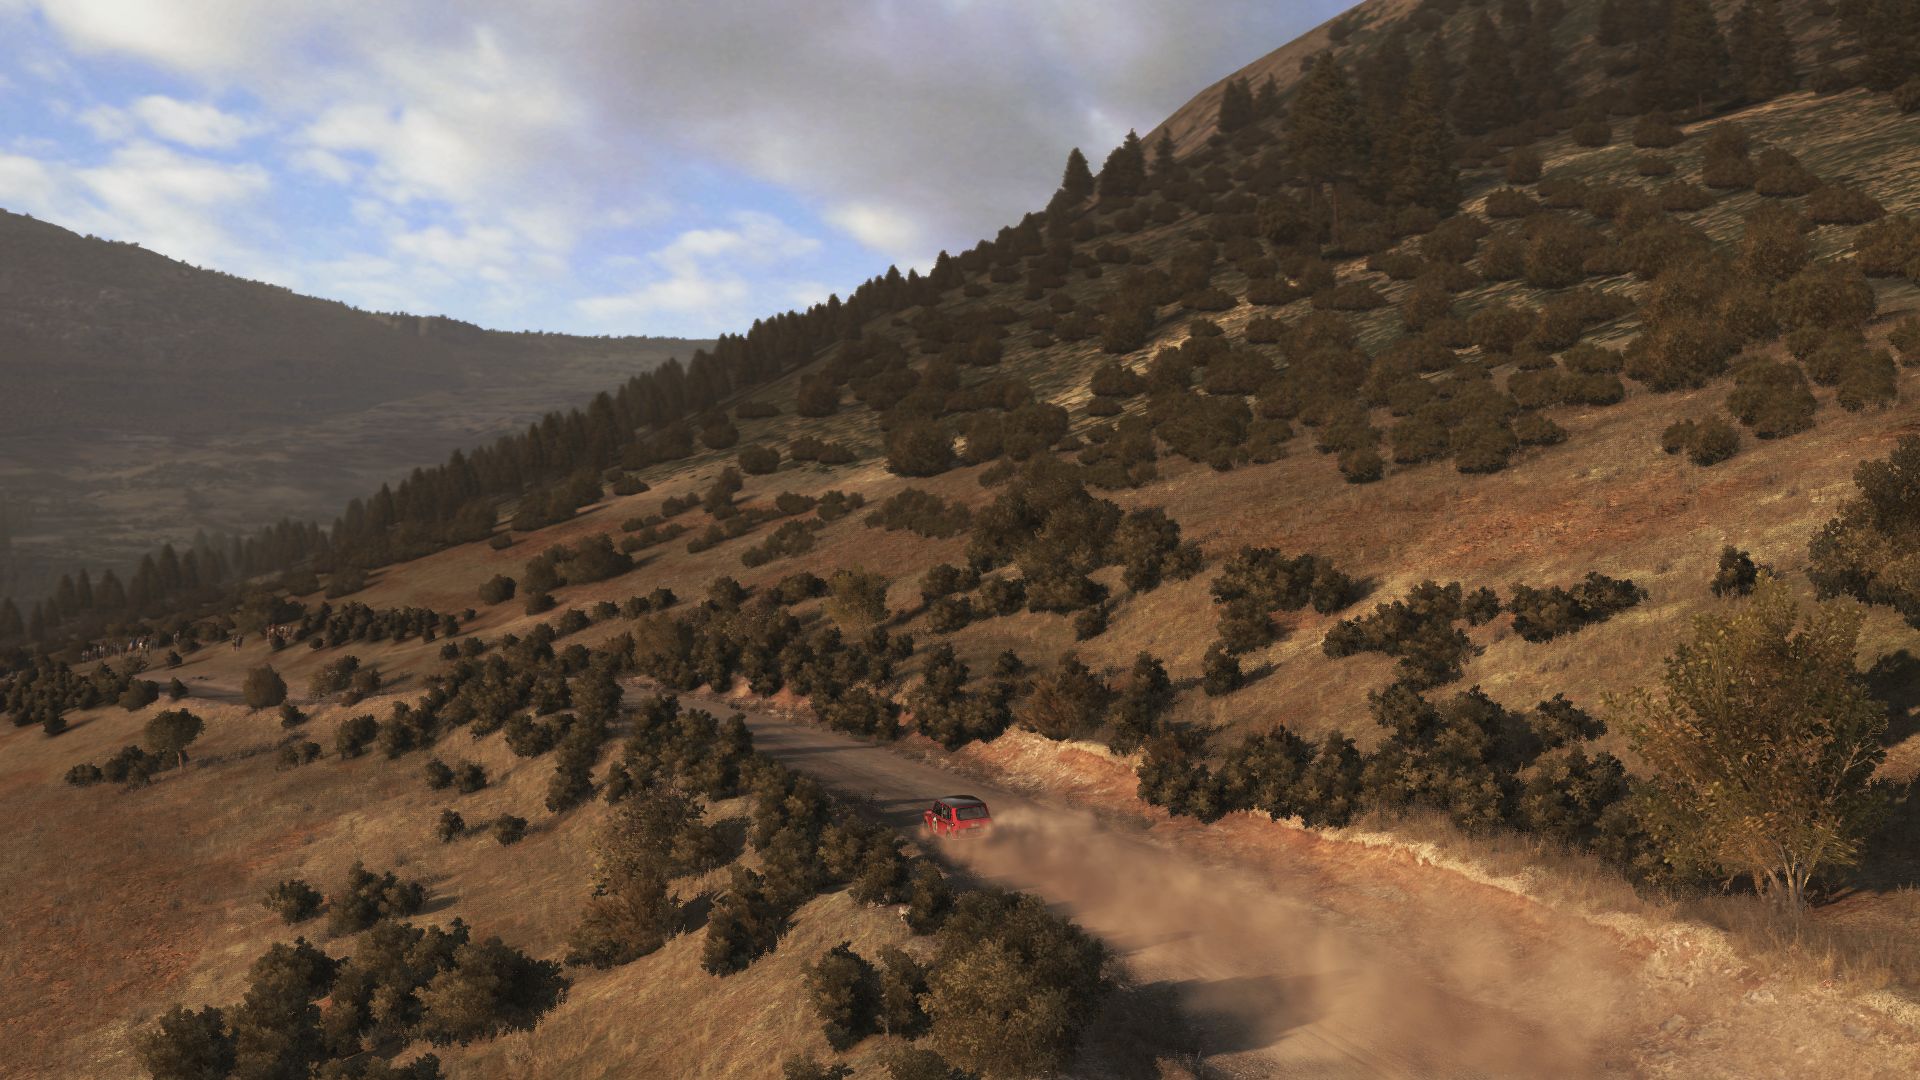
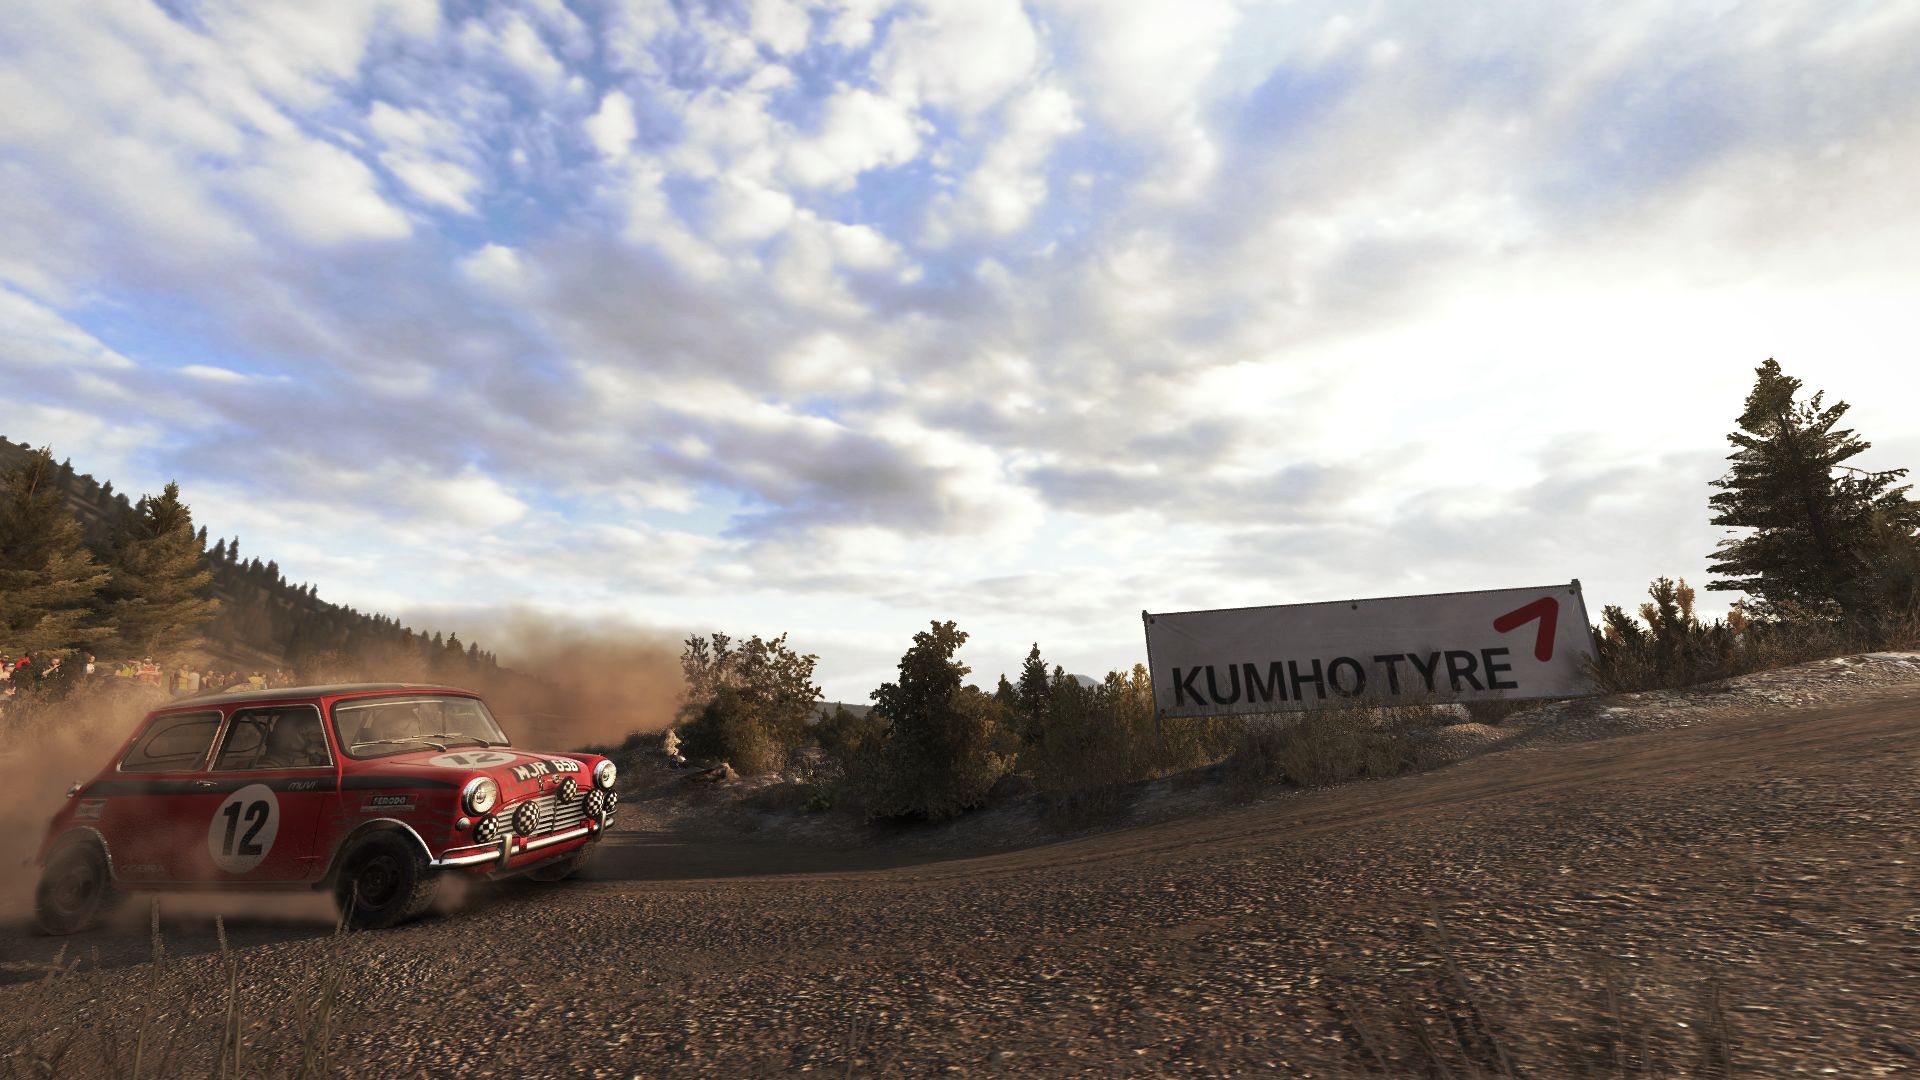
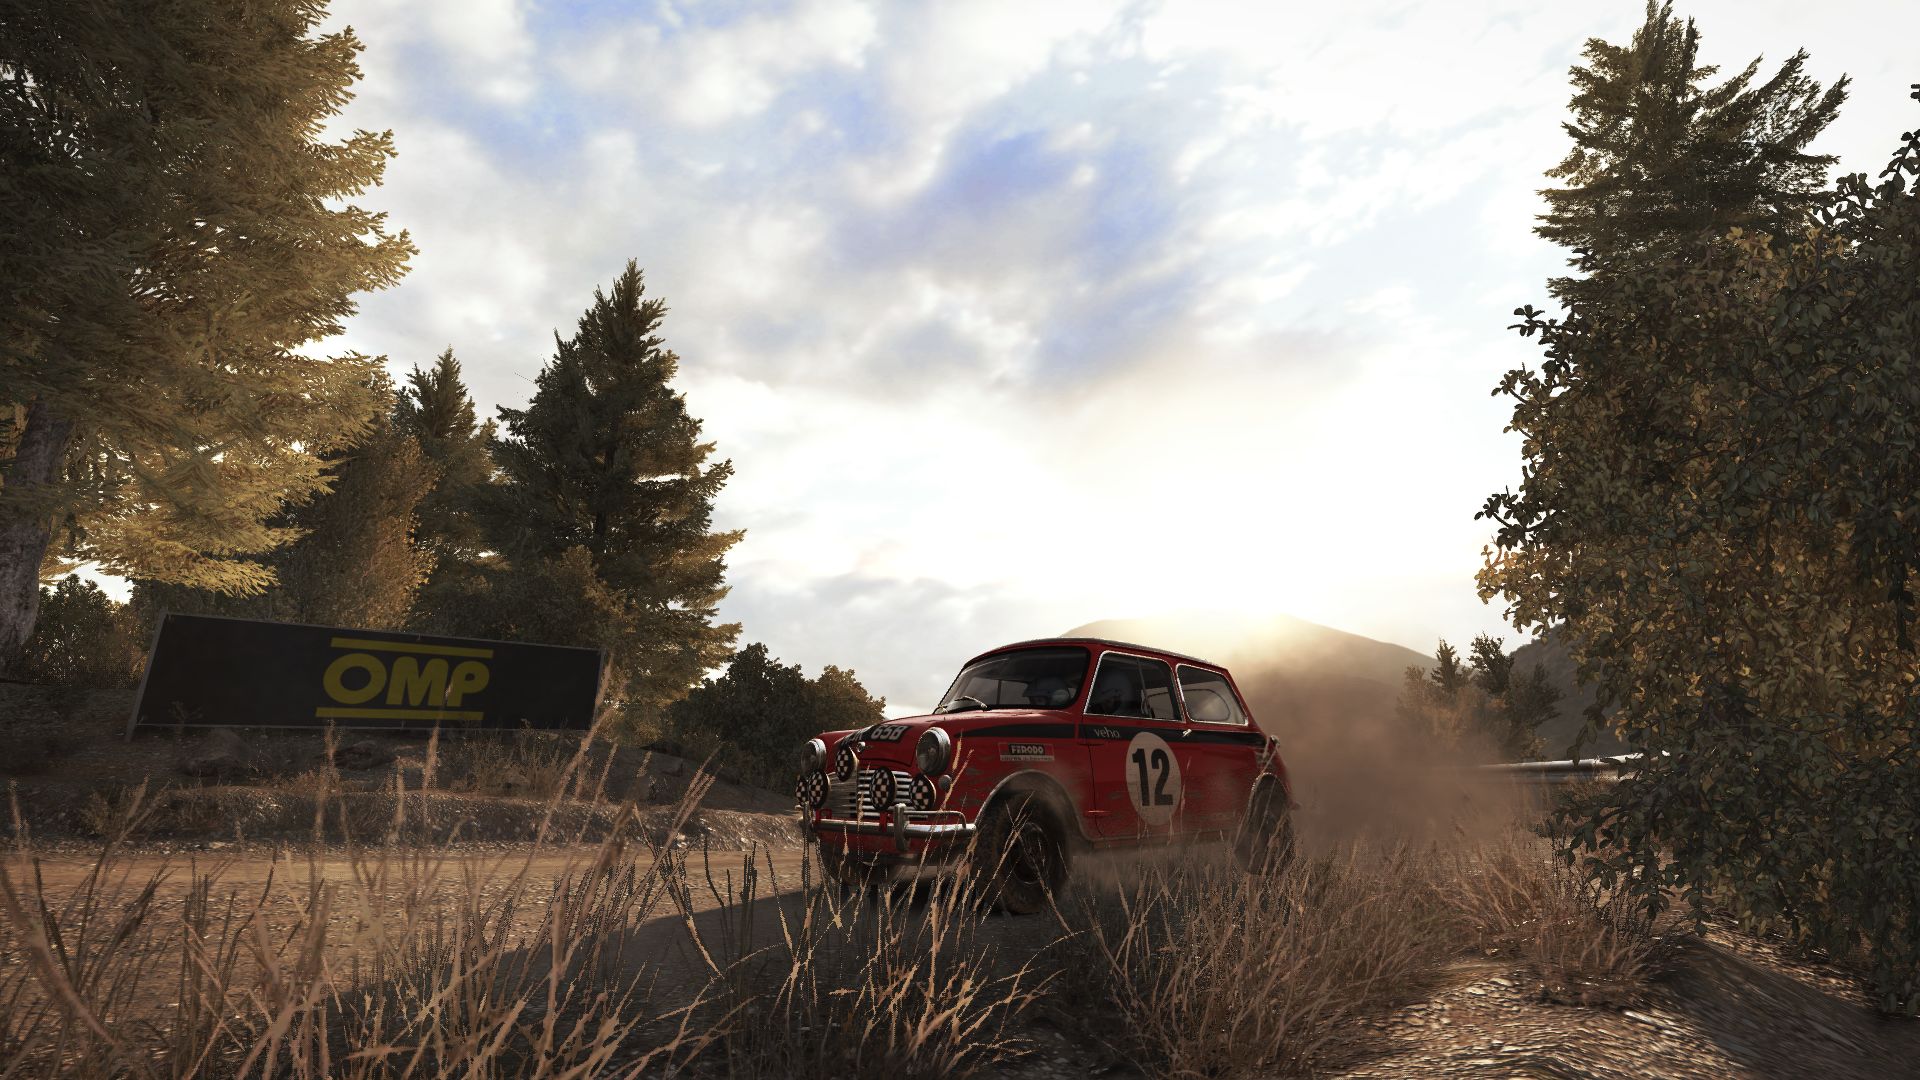
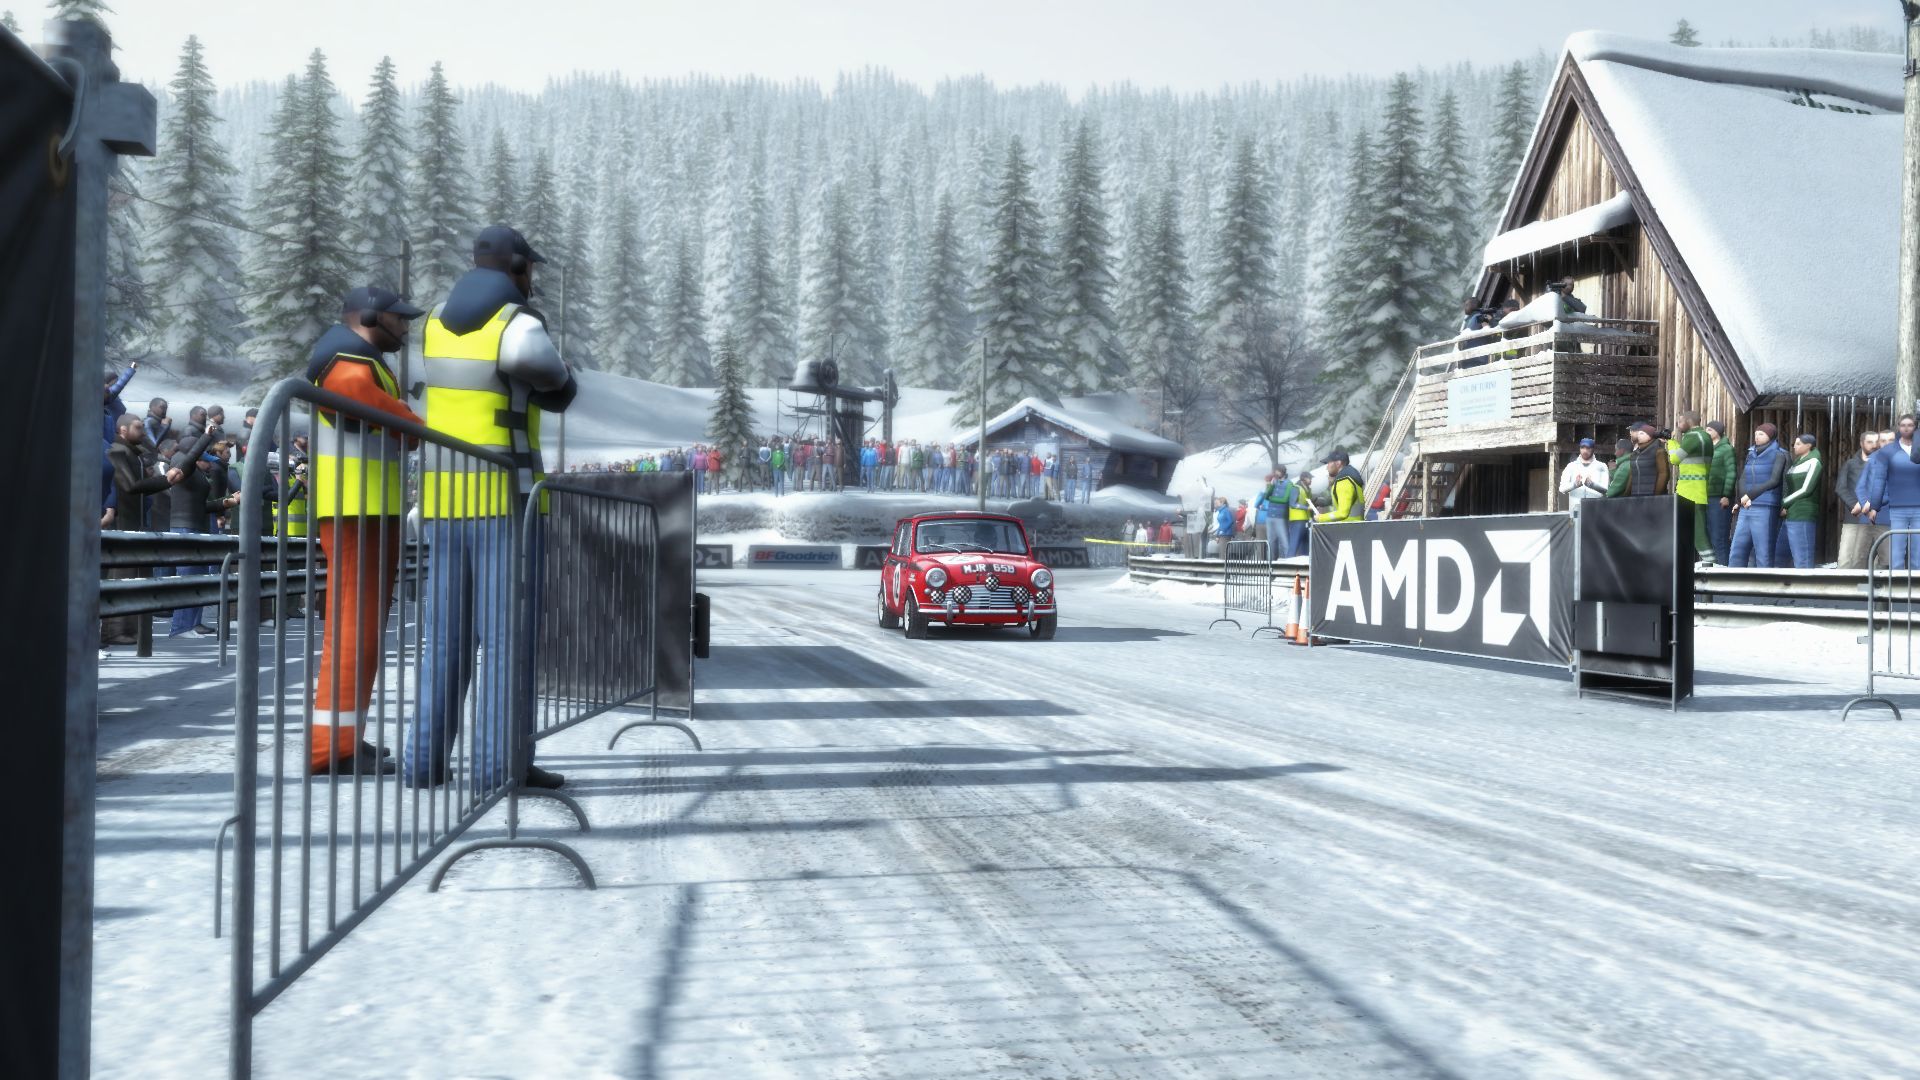
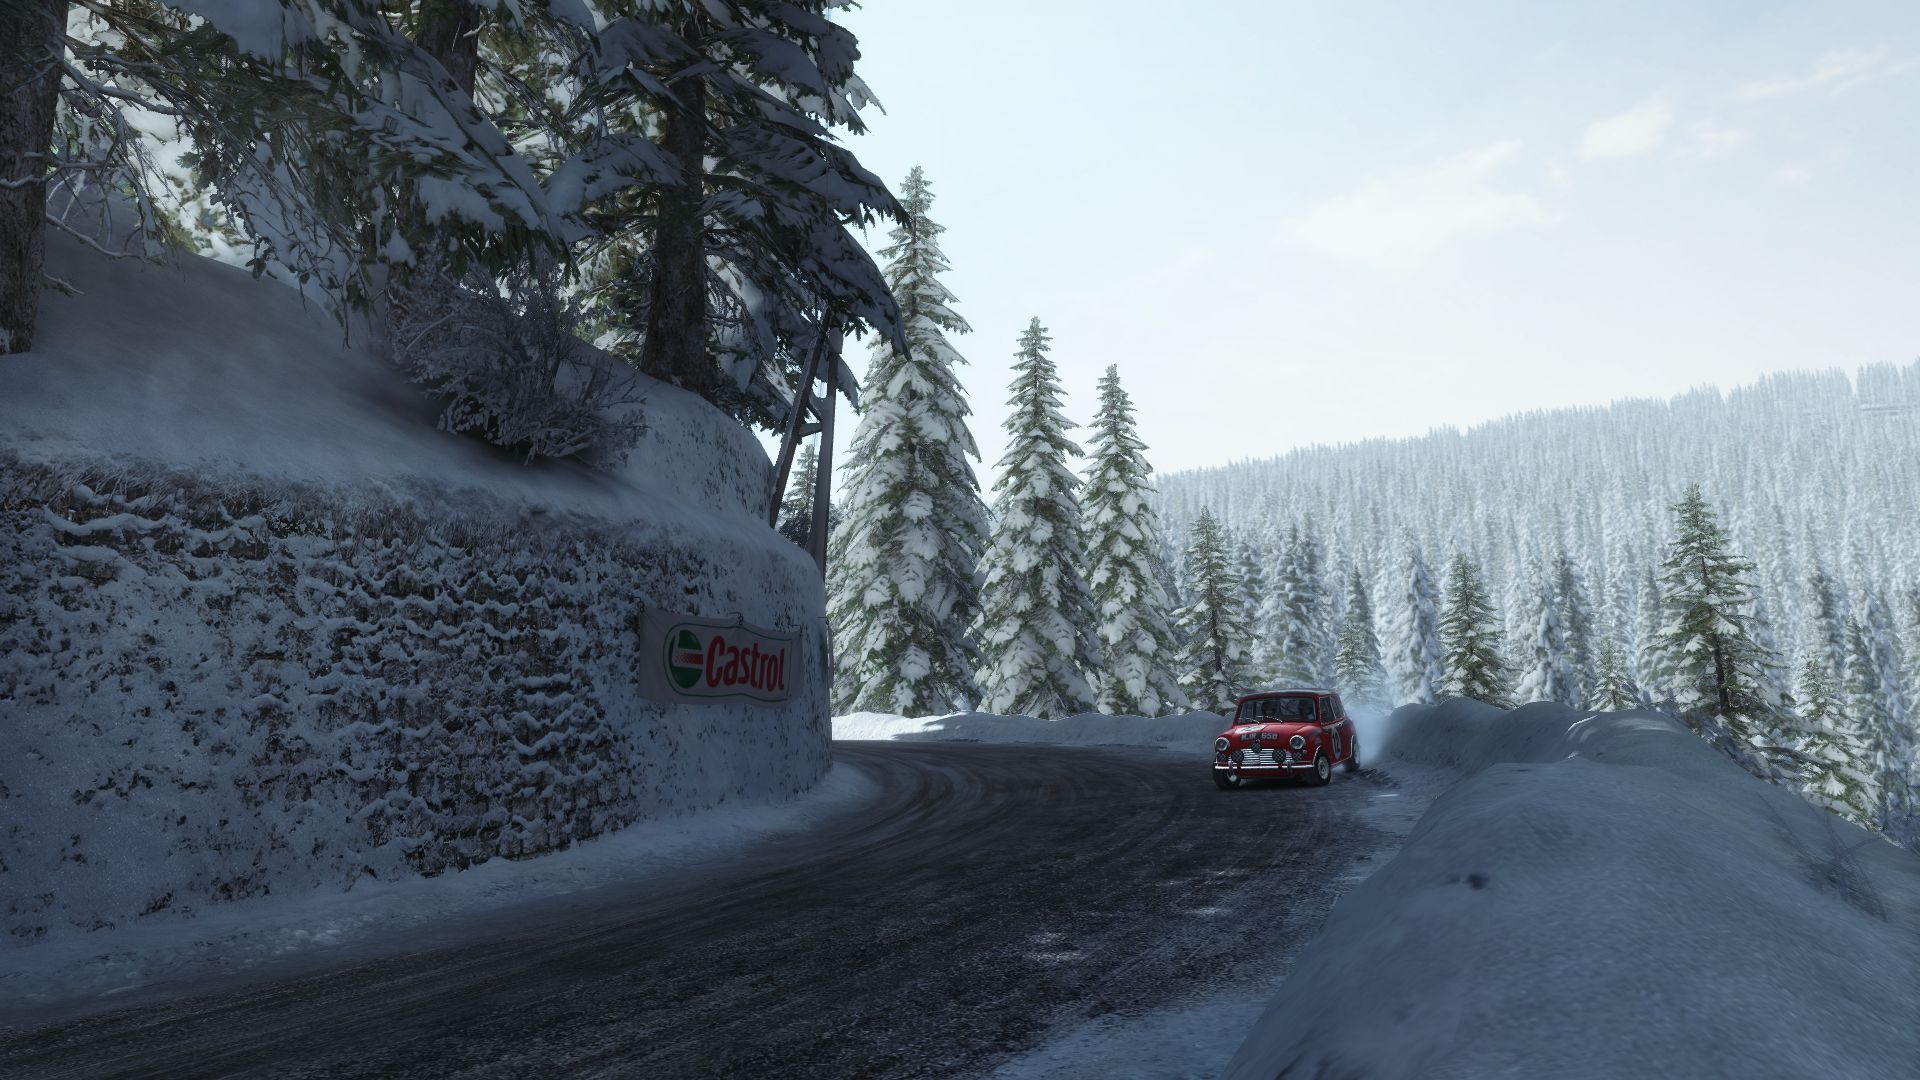
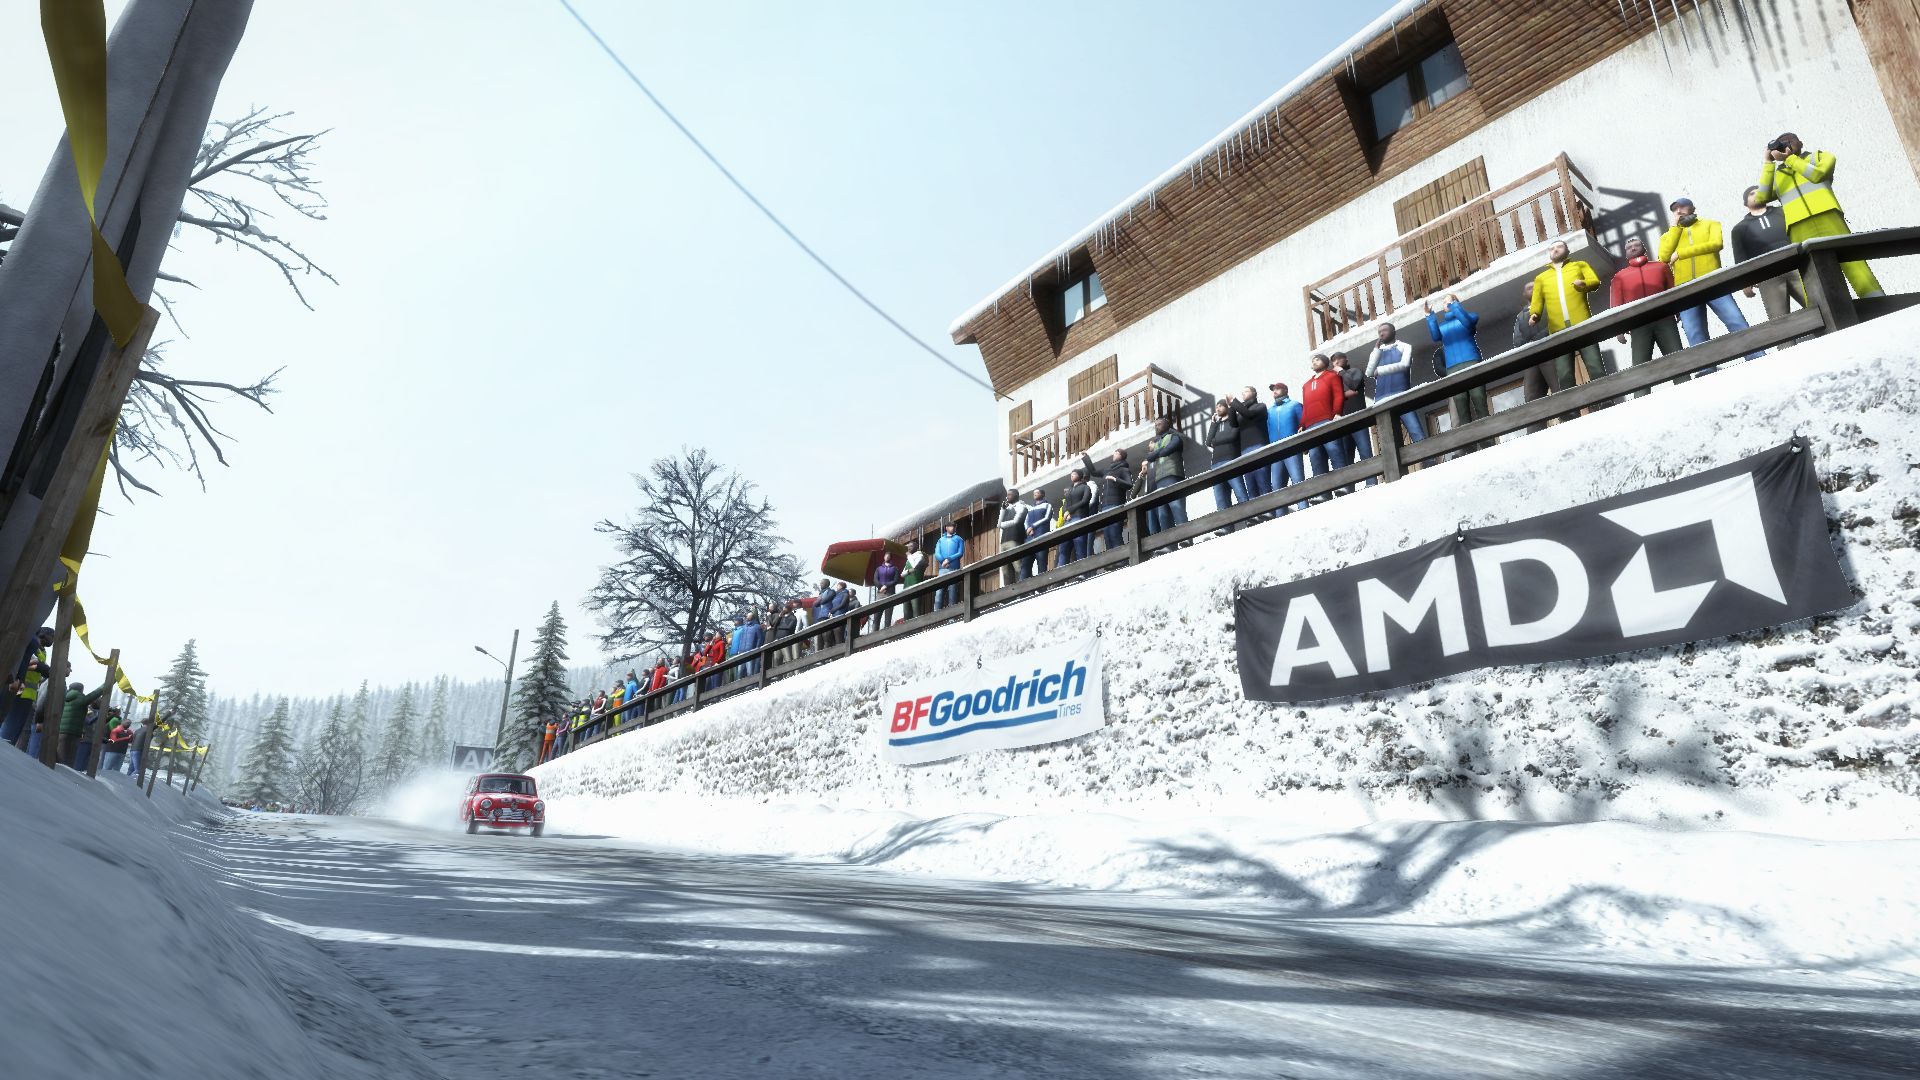
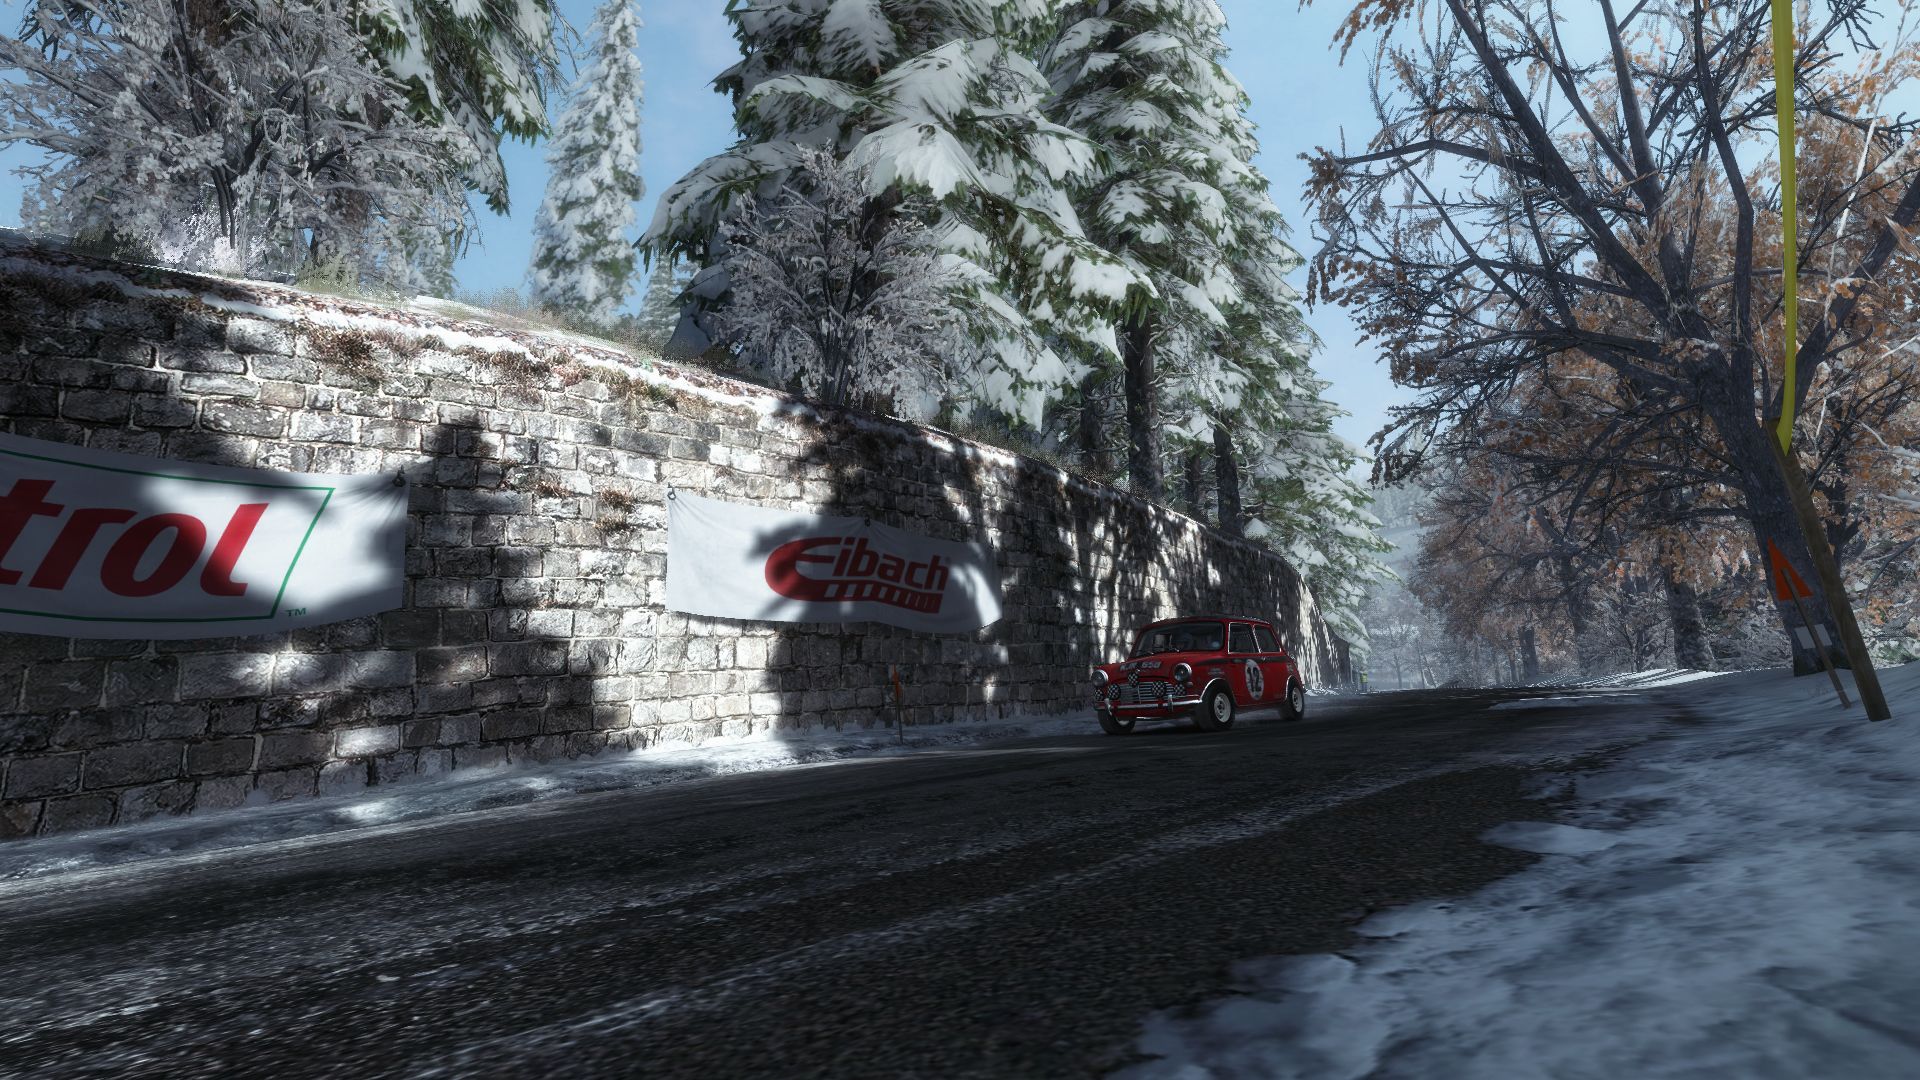
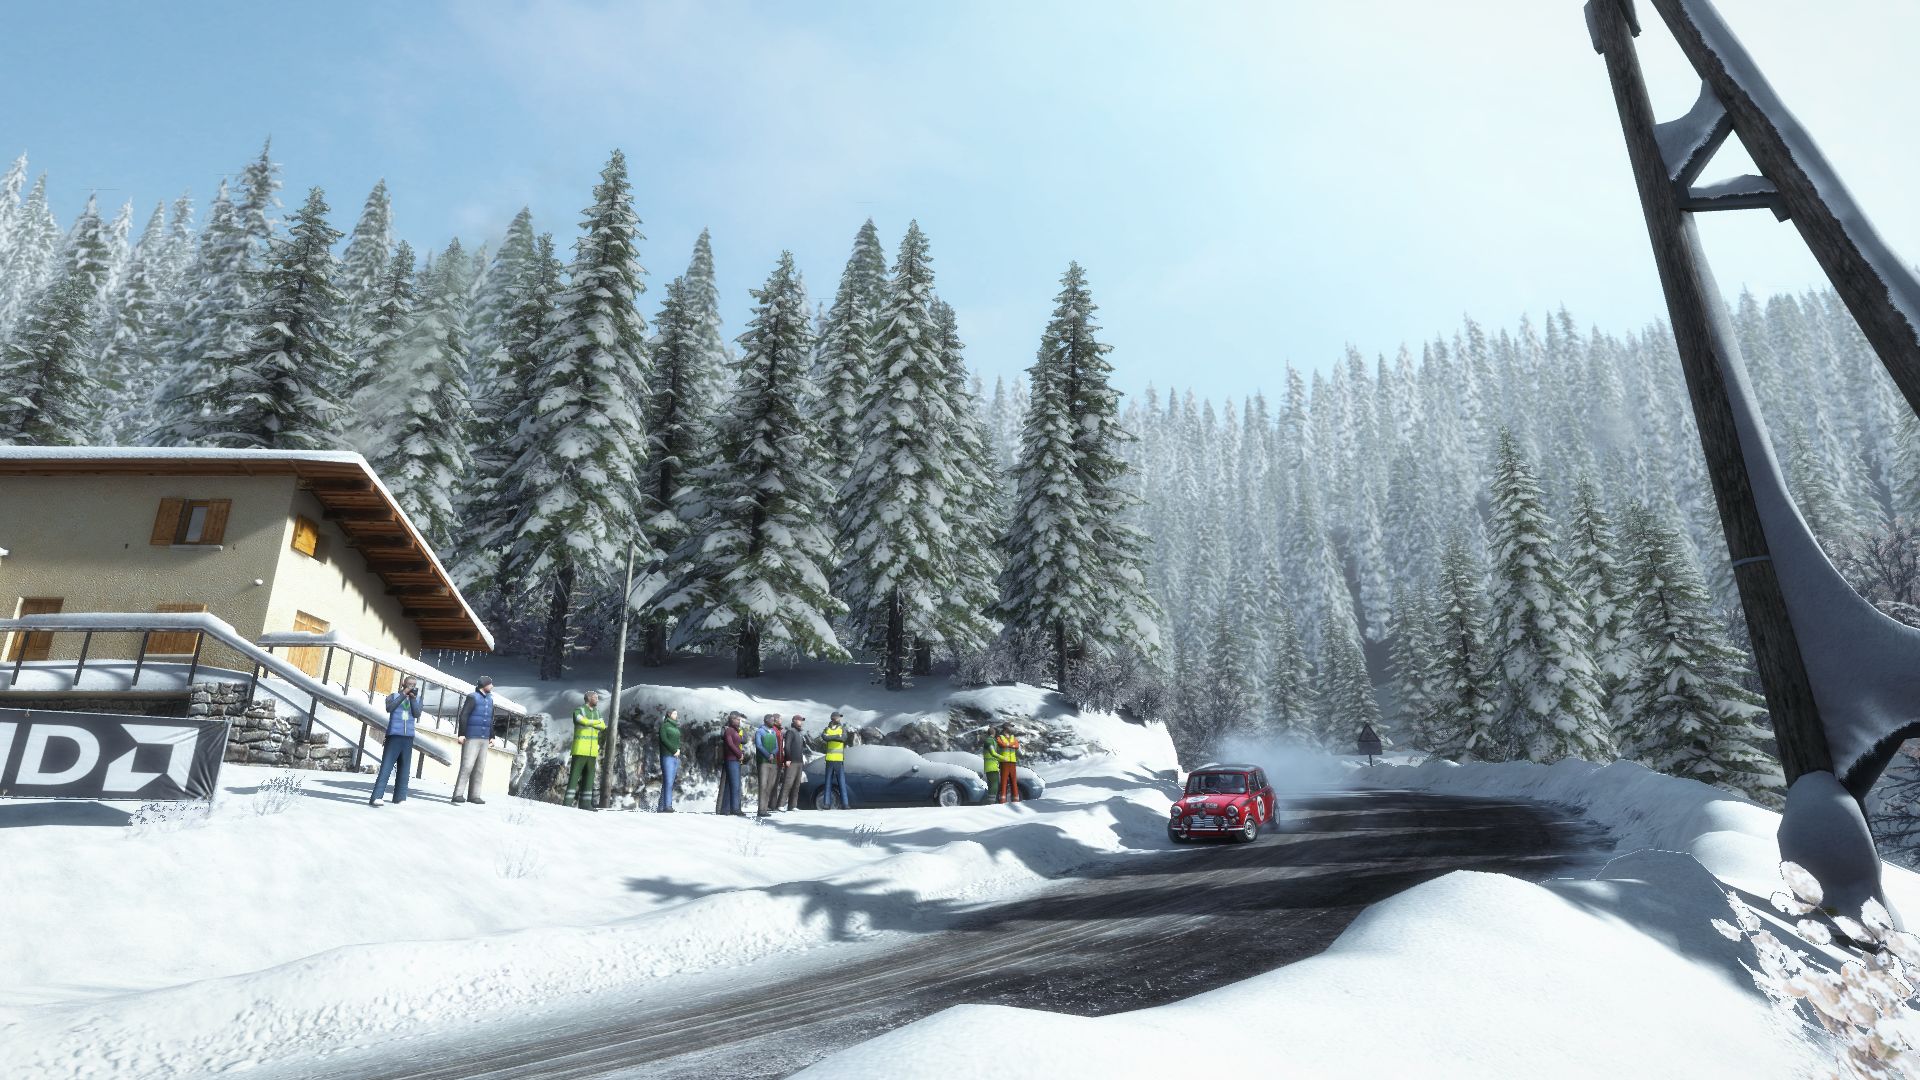
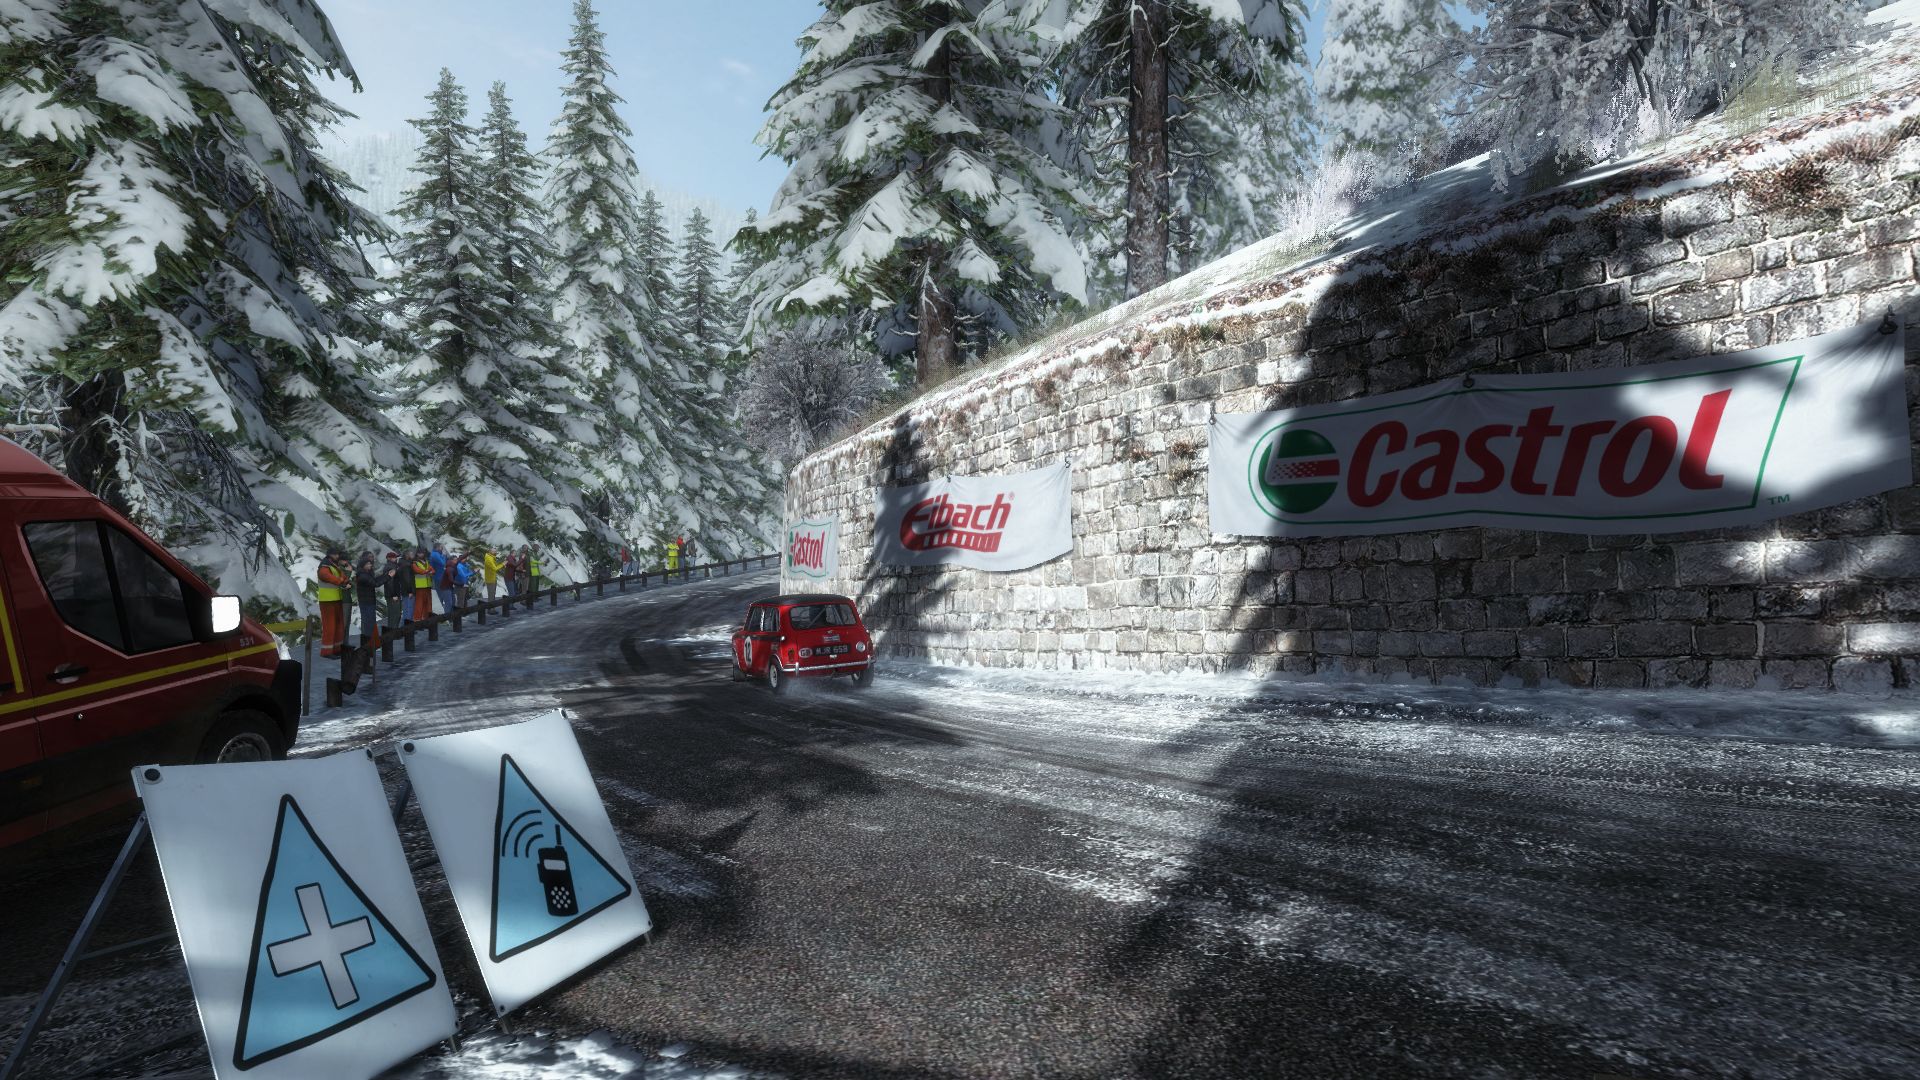
On the other hand, “Dirt Rally” offers great draw-distance and pretty panoramas, which look truly amazing in the race replays. Codemasters have done a great job with the vegetation as well: the lush grass, bushes and trees are rare in racing games. Compared with the “F1” series, “Dirt Rally” offers a much better atmosphere. We would also like to point out the smaller details on each track, such as houses, parked cars or the spectators (very polygonal). The particle and smoke effects during races are a nice touch.
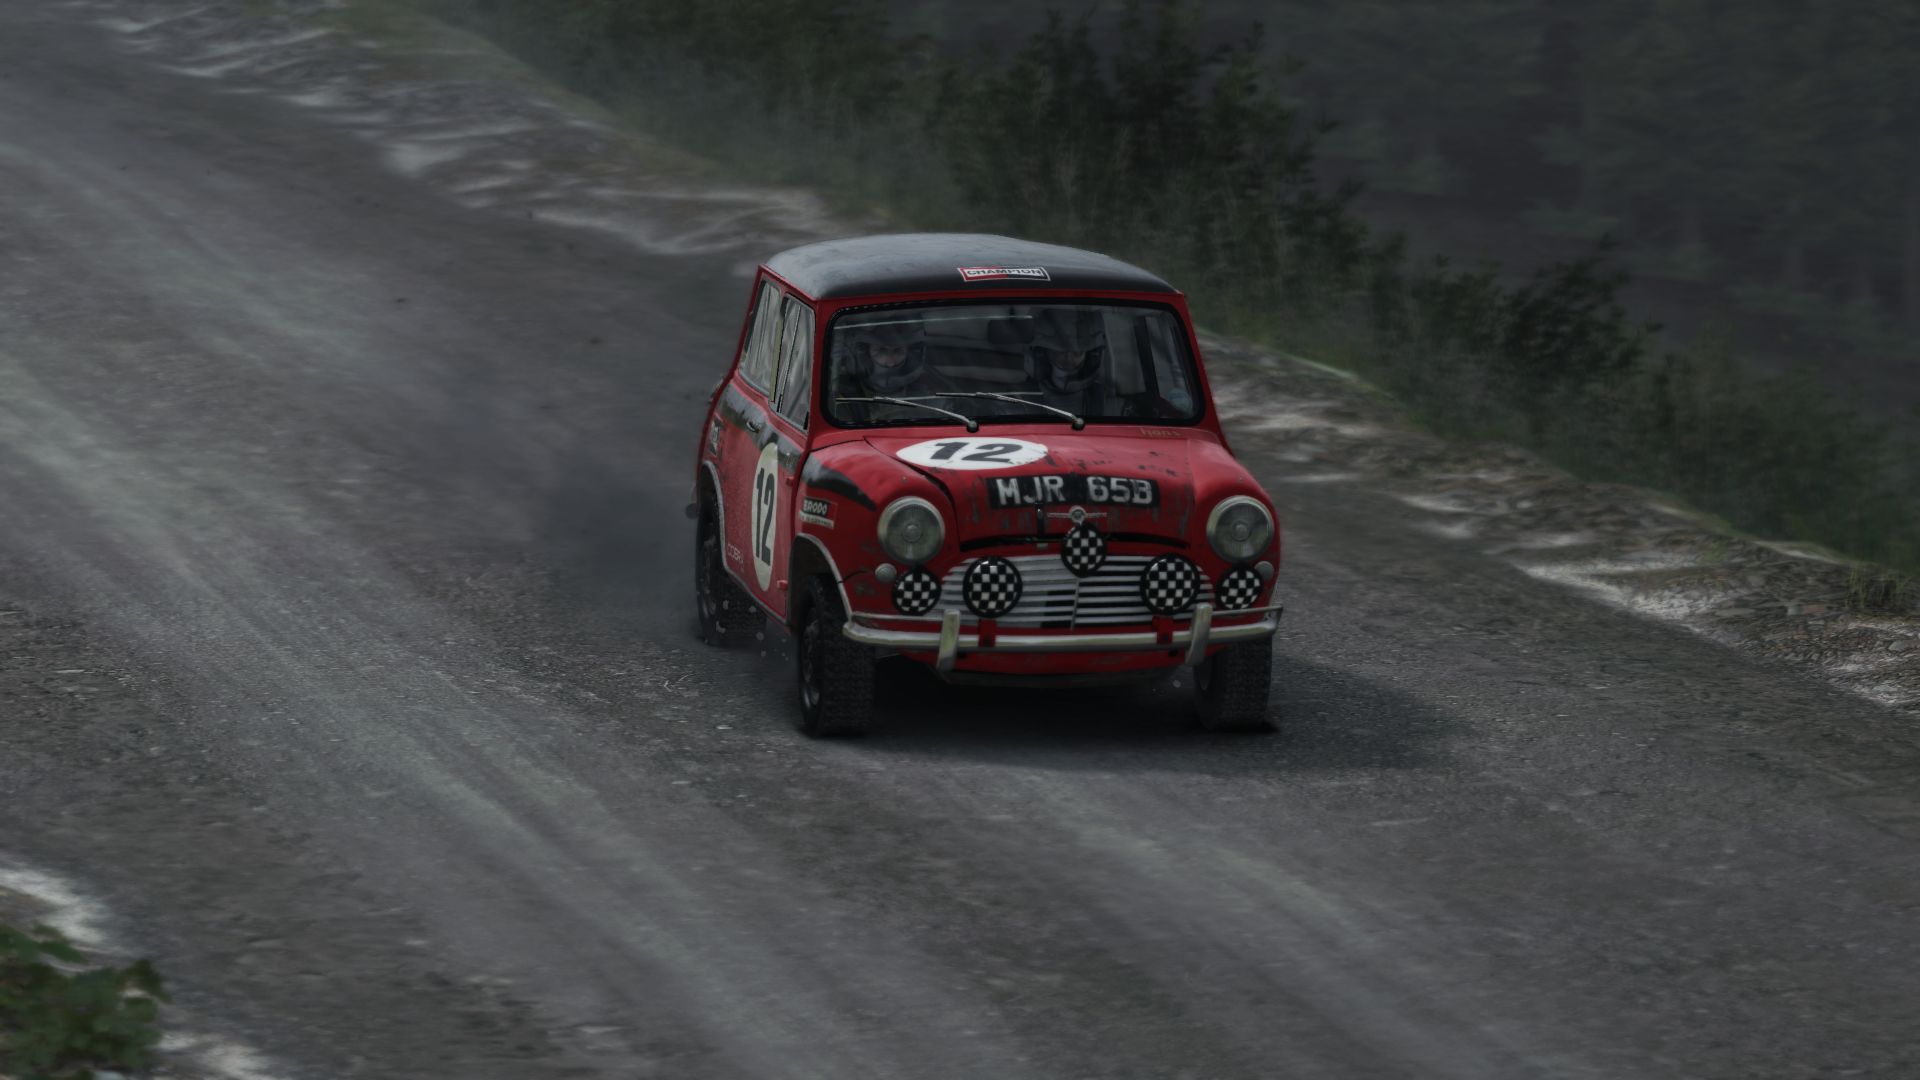
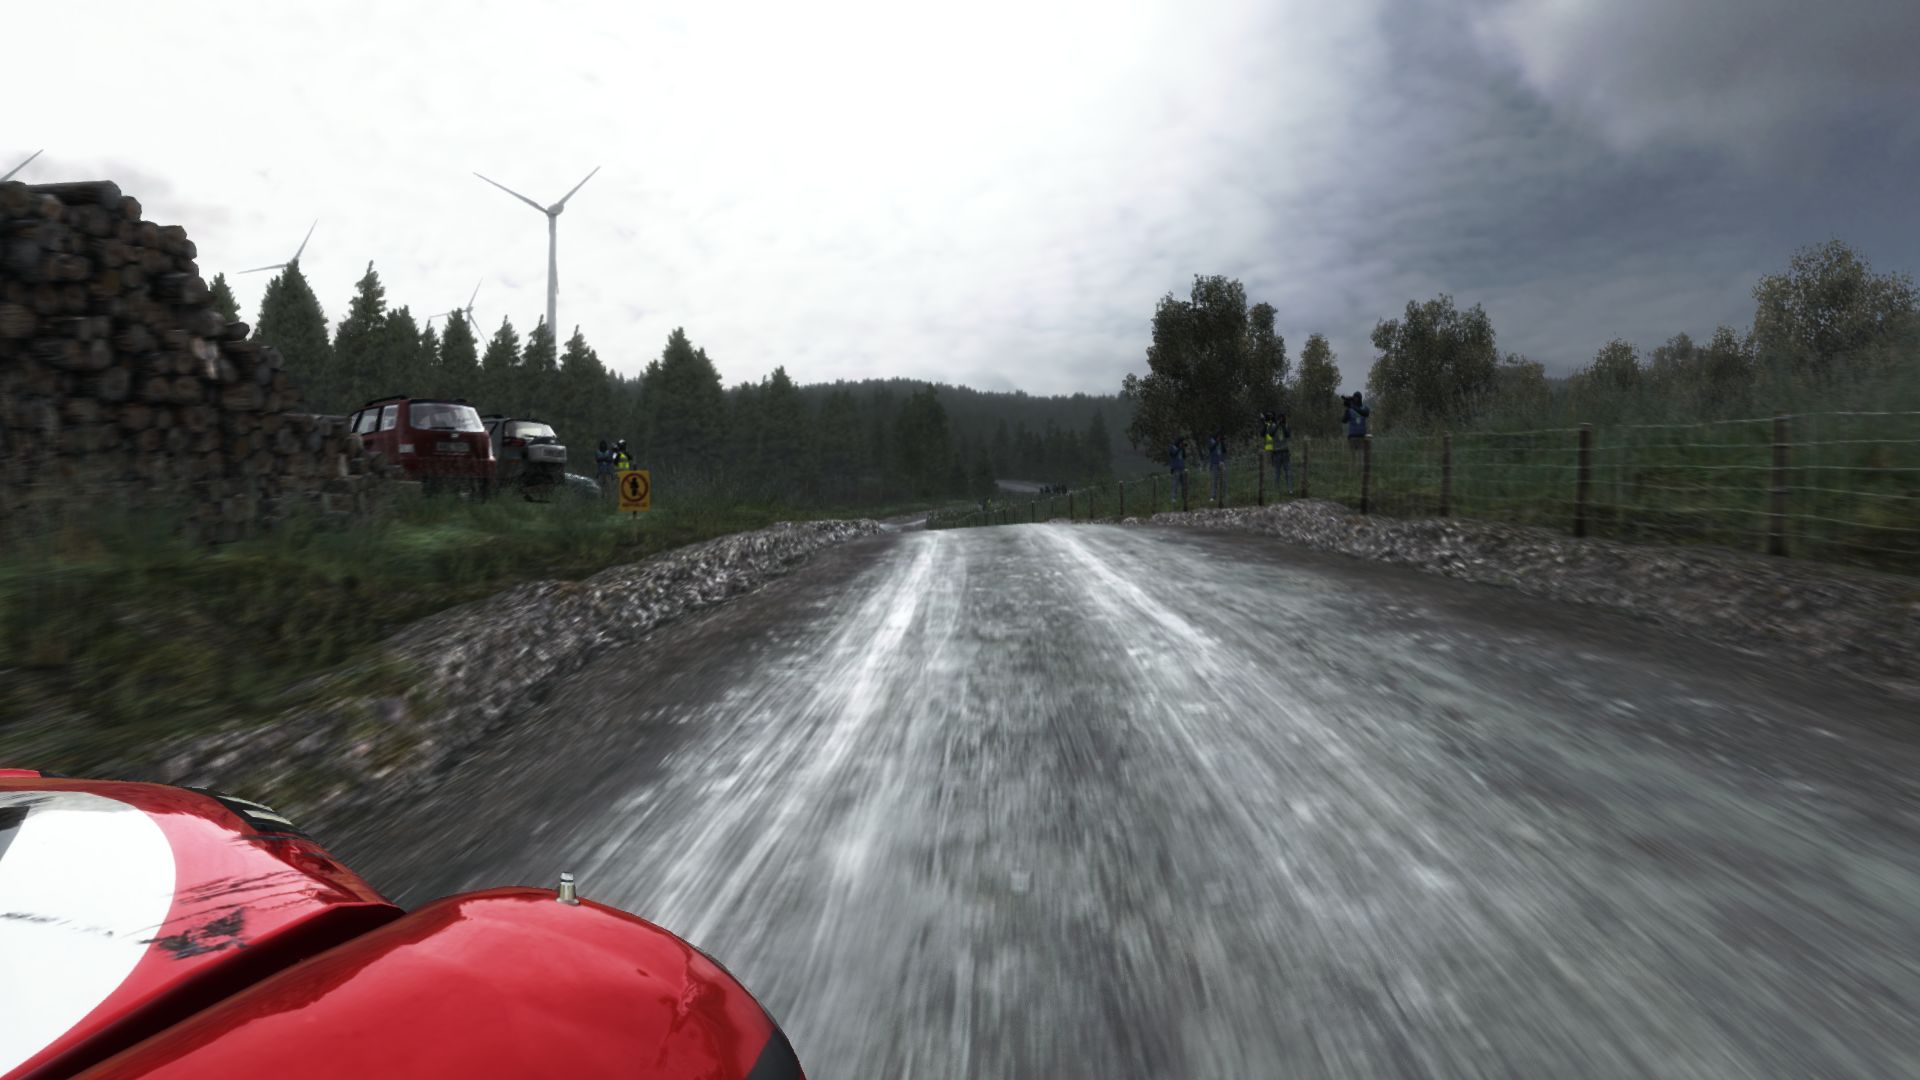
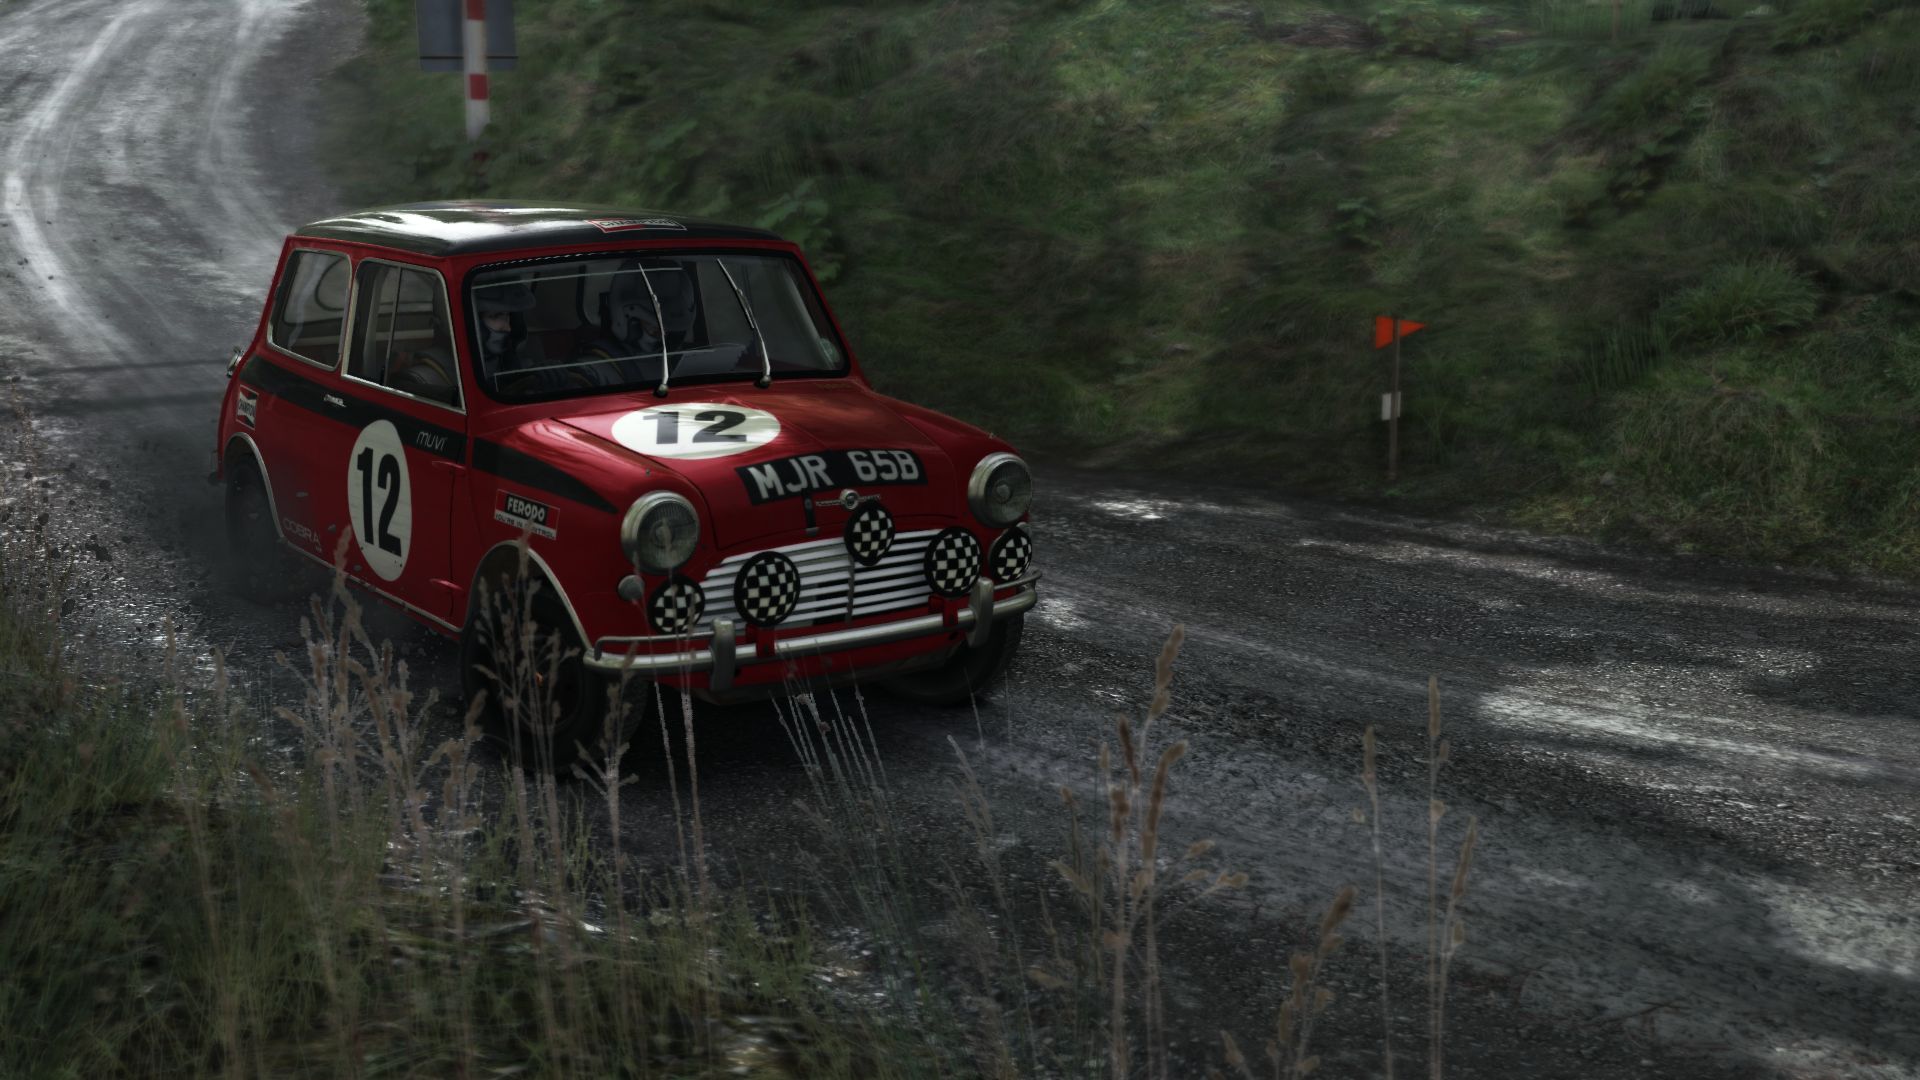
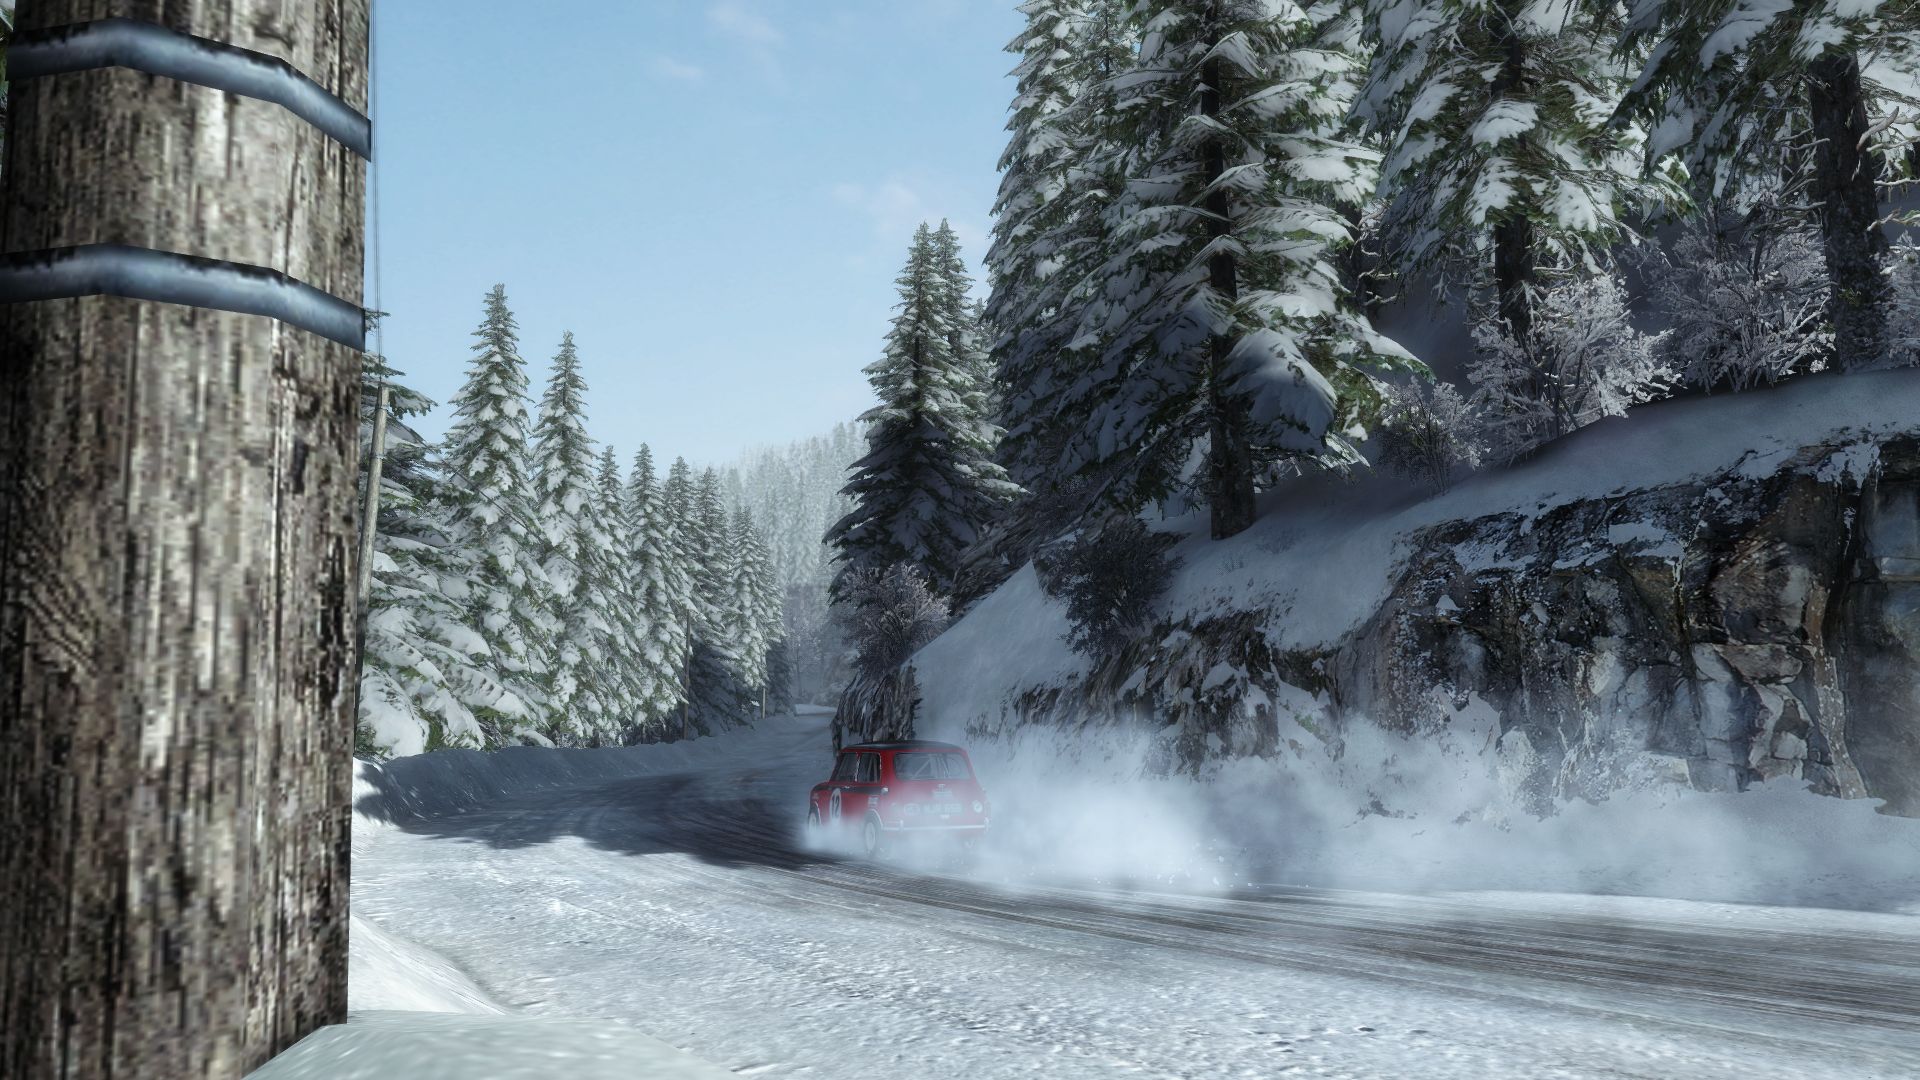
We love the damage system of the game. The car has to be smashed hard against objects to leave large marks, but smaller effects, like scratches and dirt, are easy to see. Depending on the race track, the visual car damage particles change: dirt, rain, mud and snow are all found in the game.
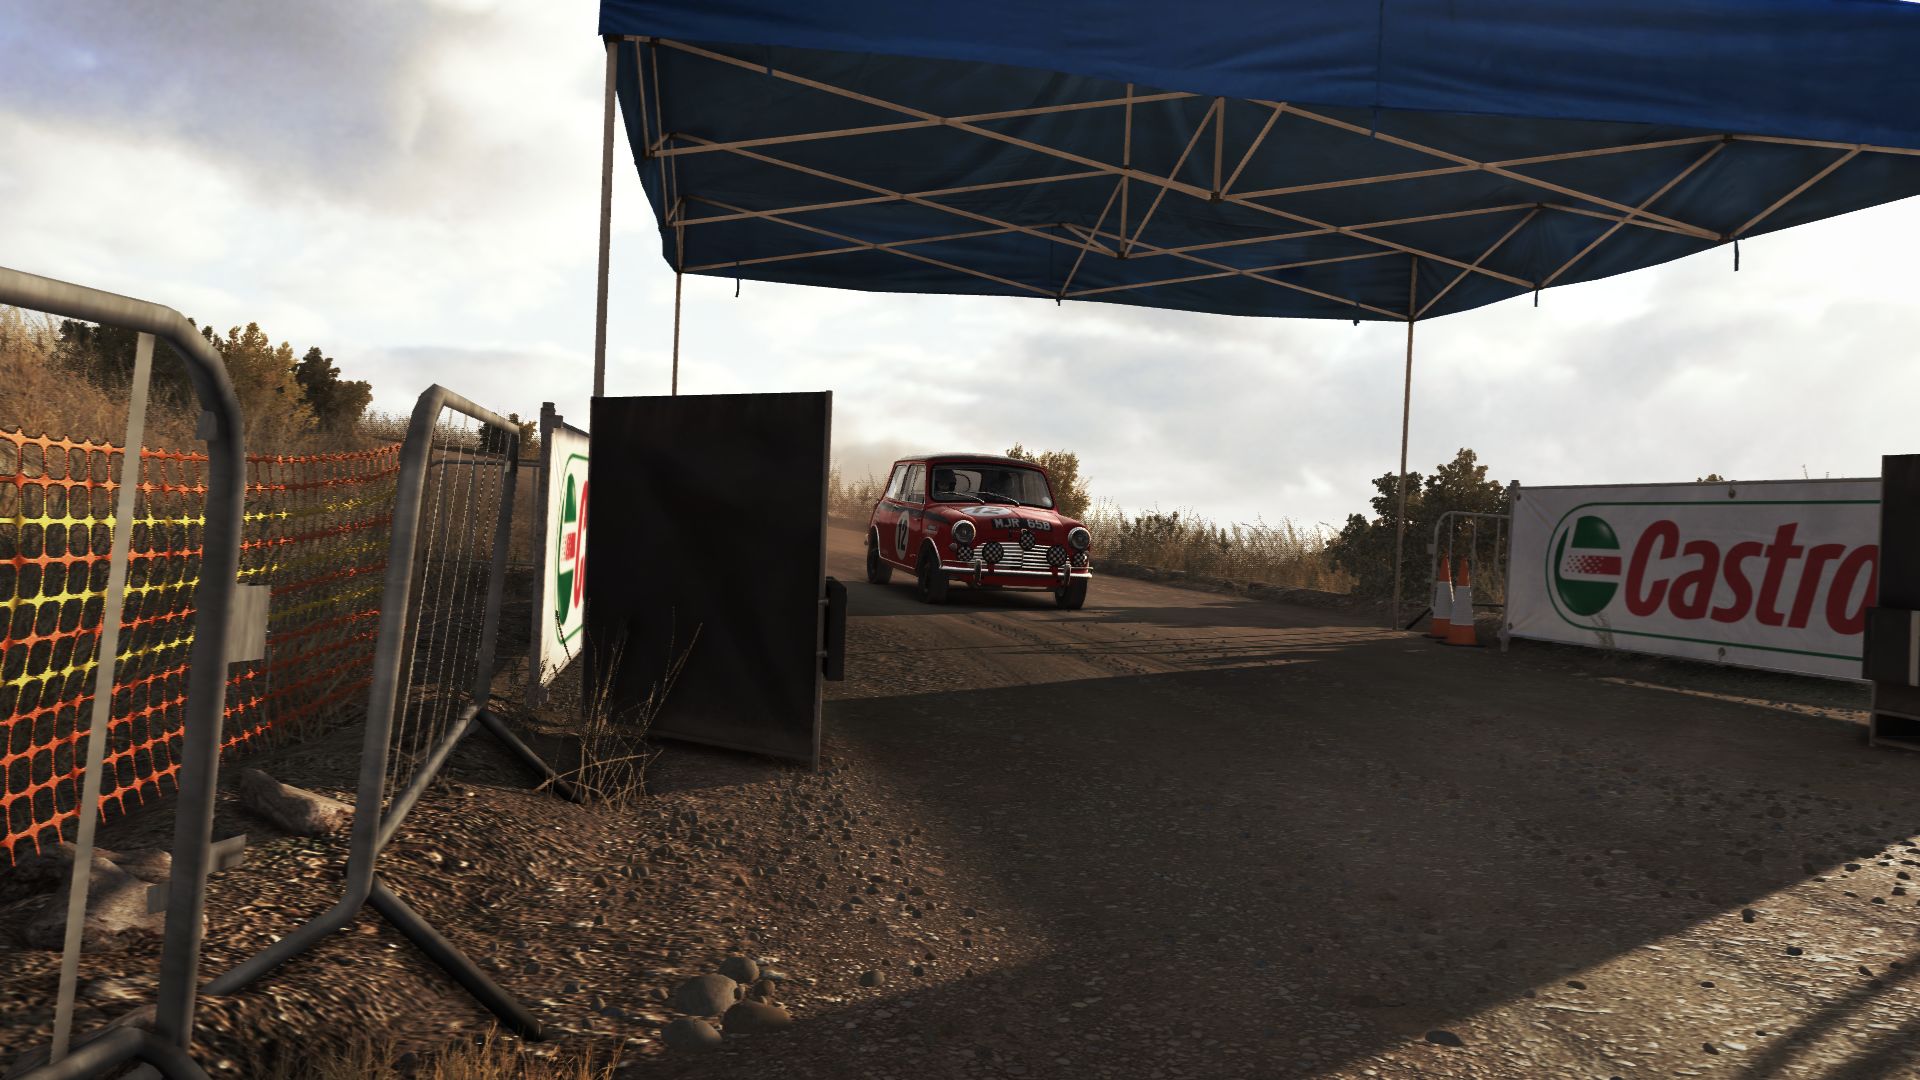
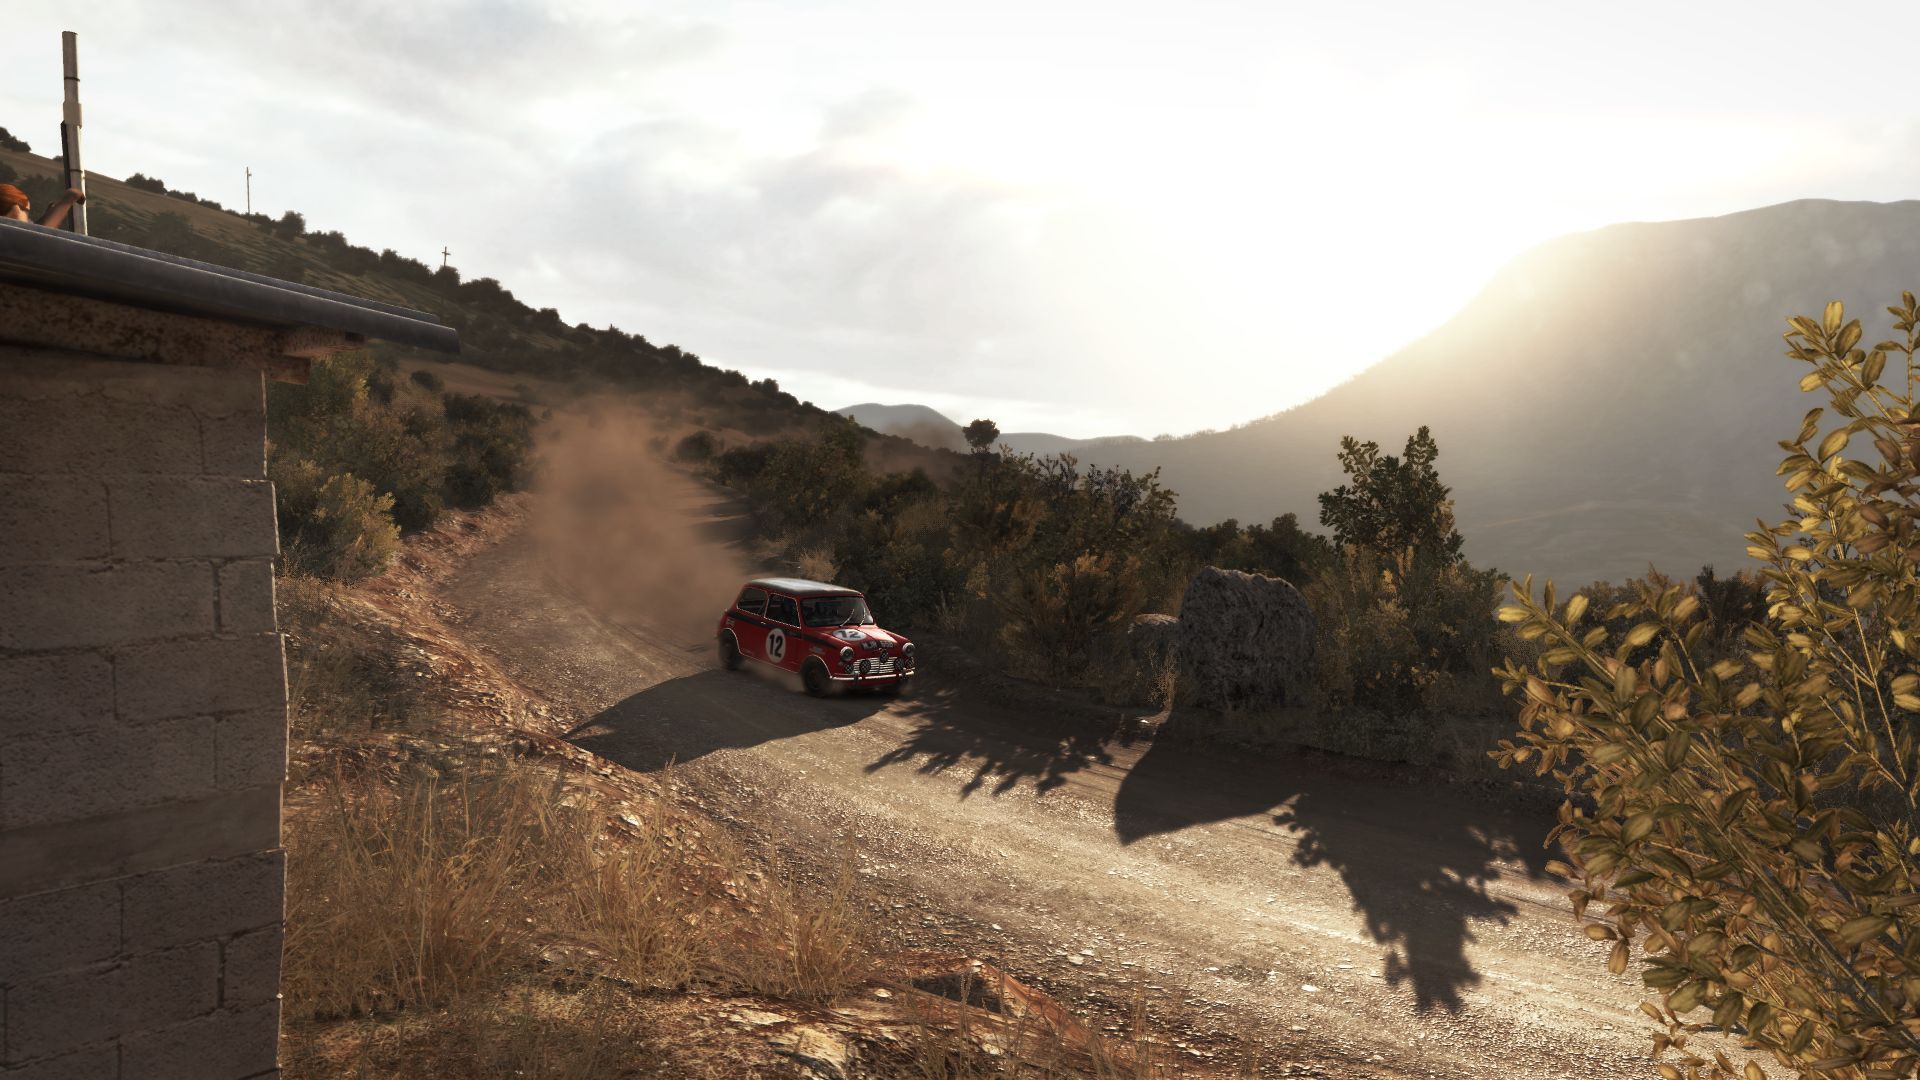
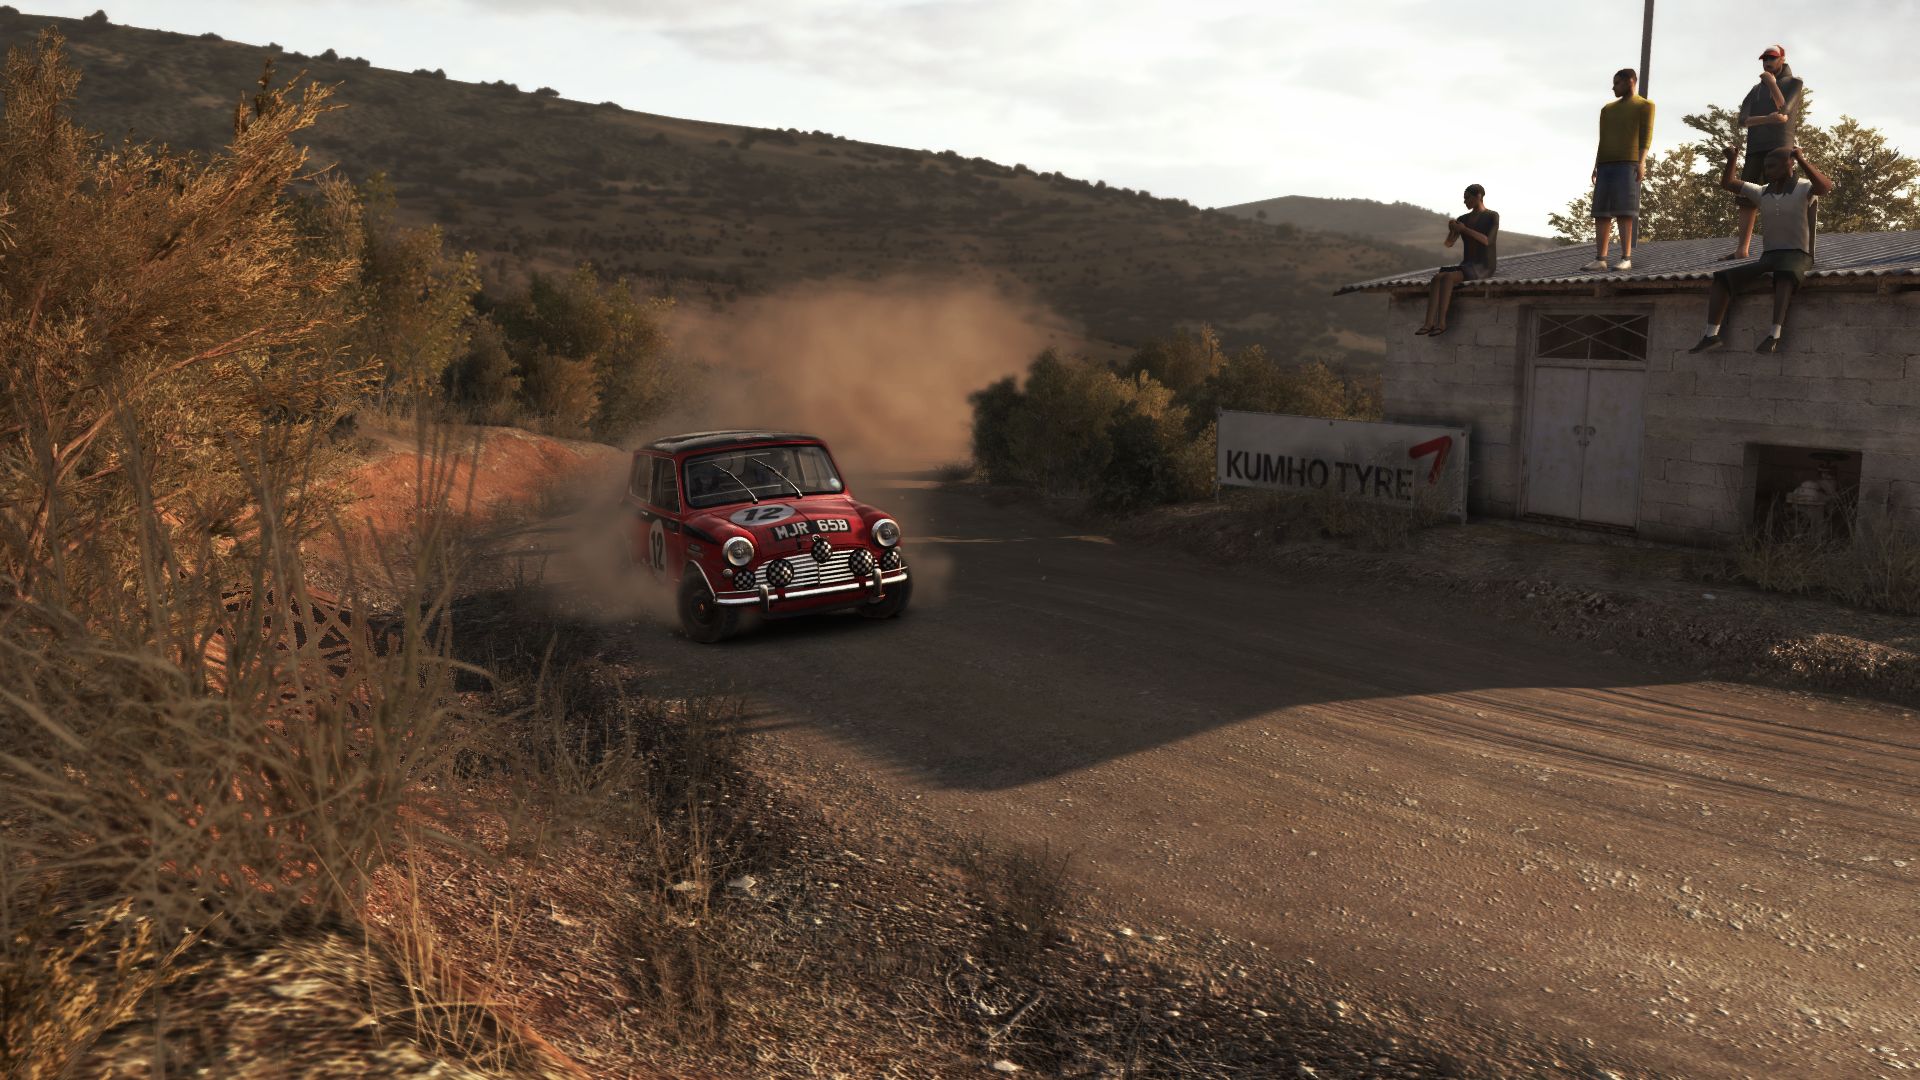
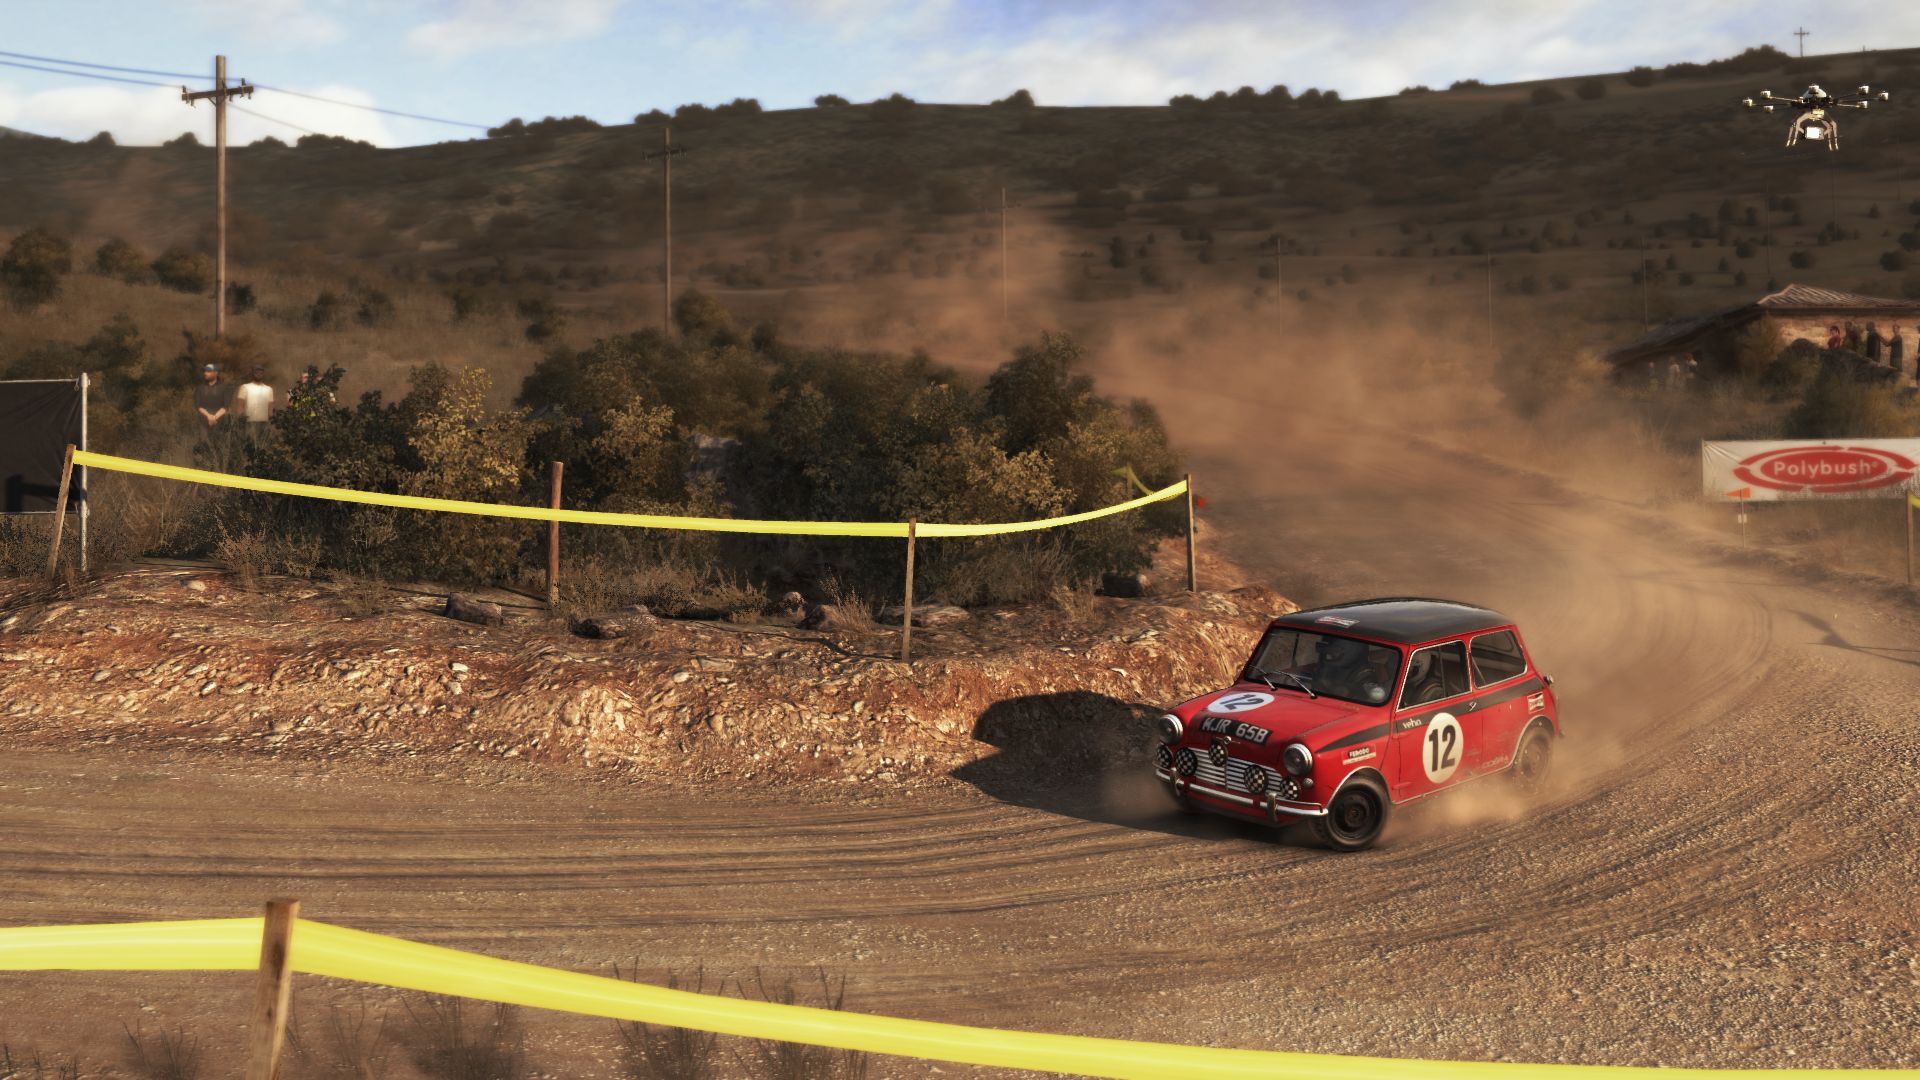
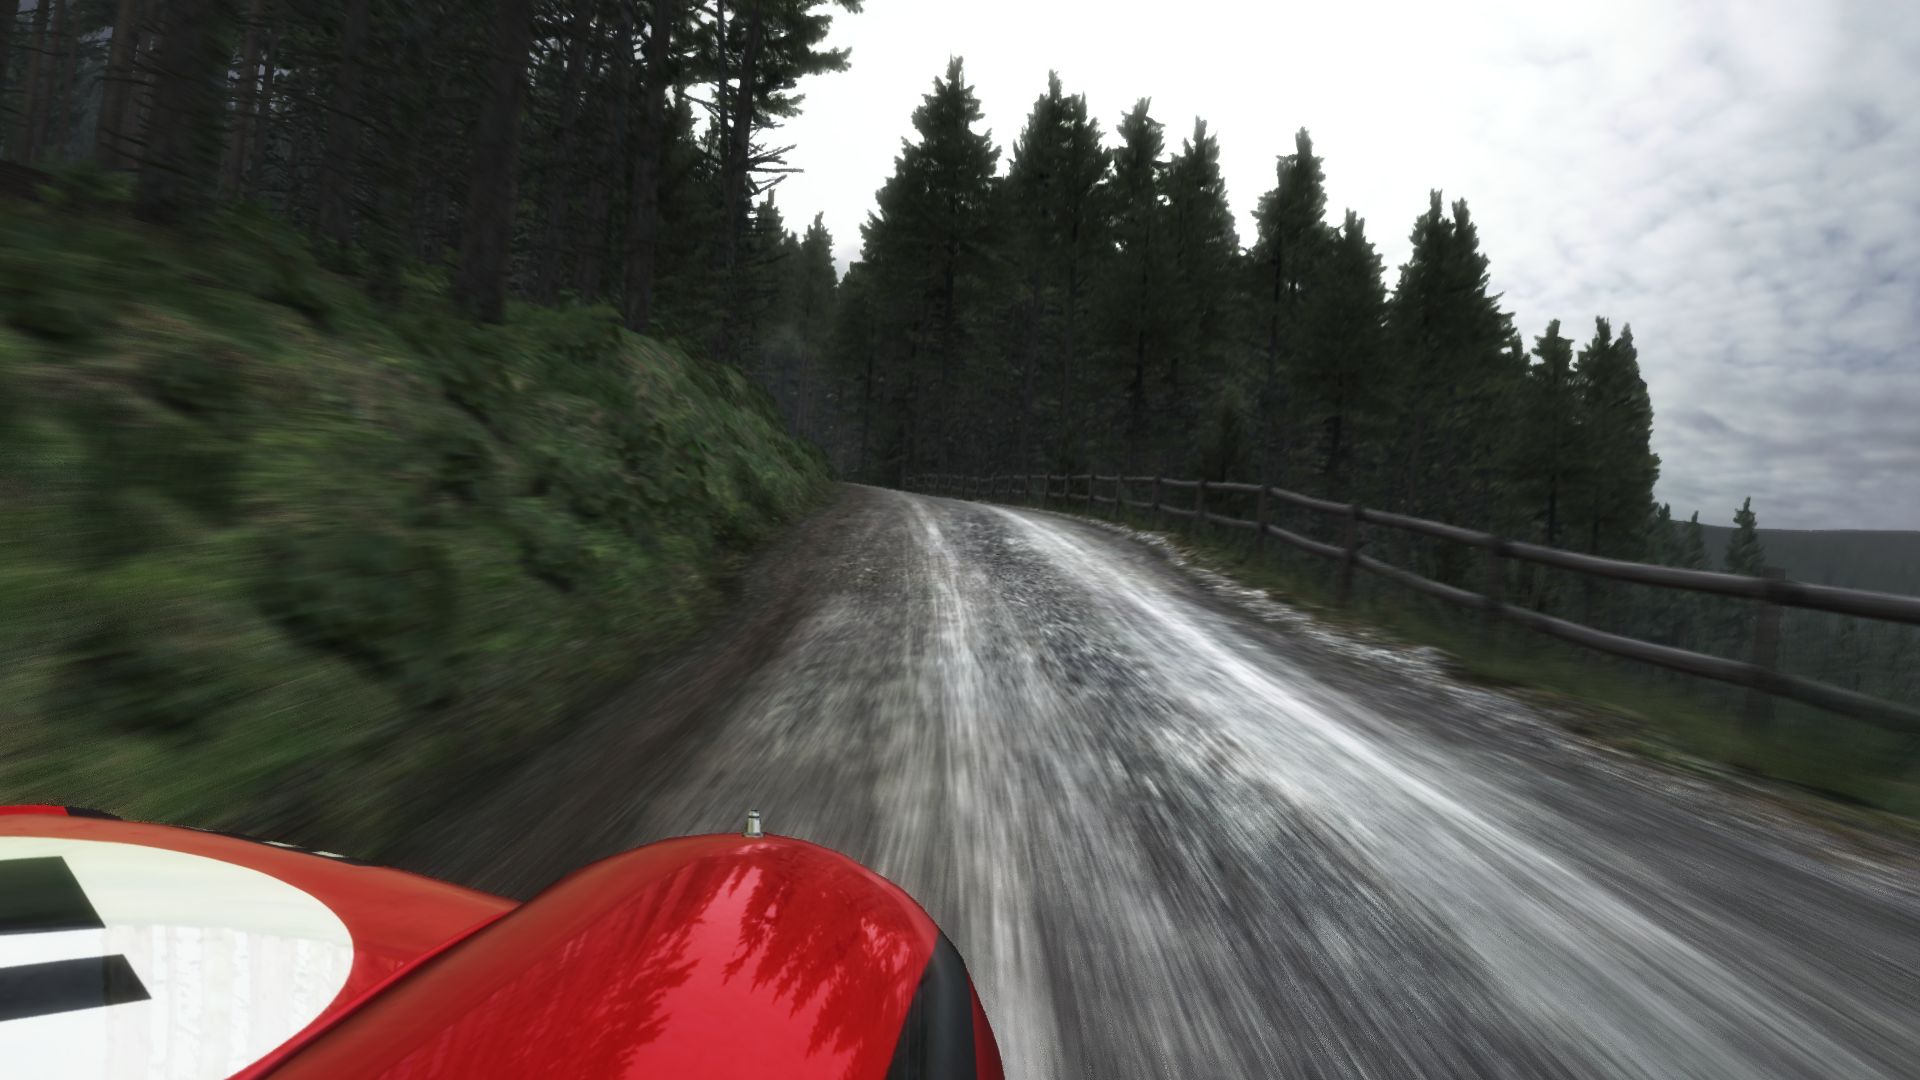
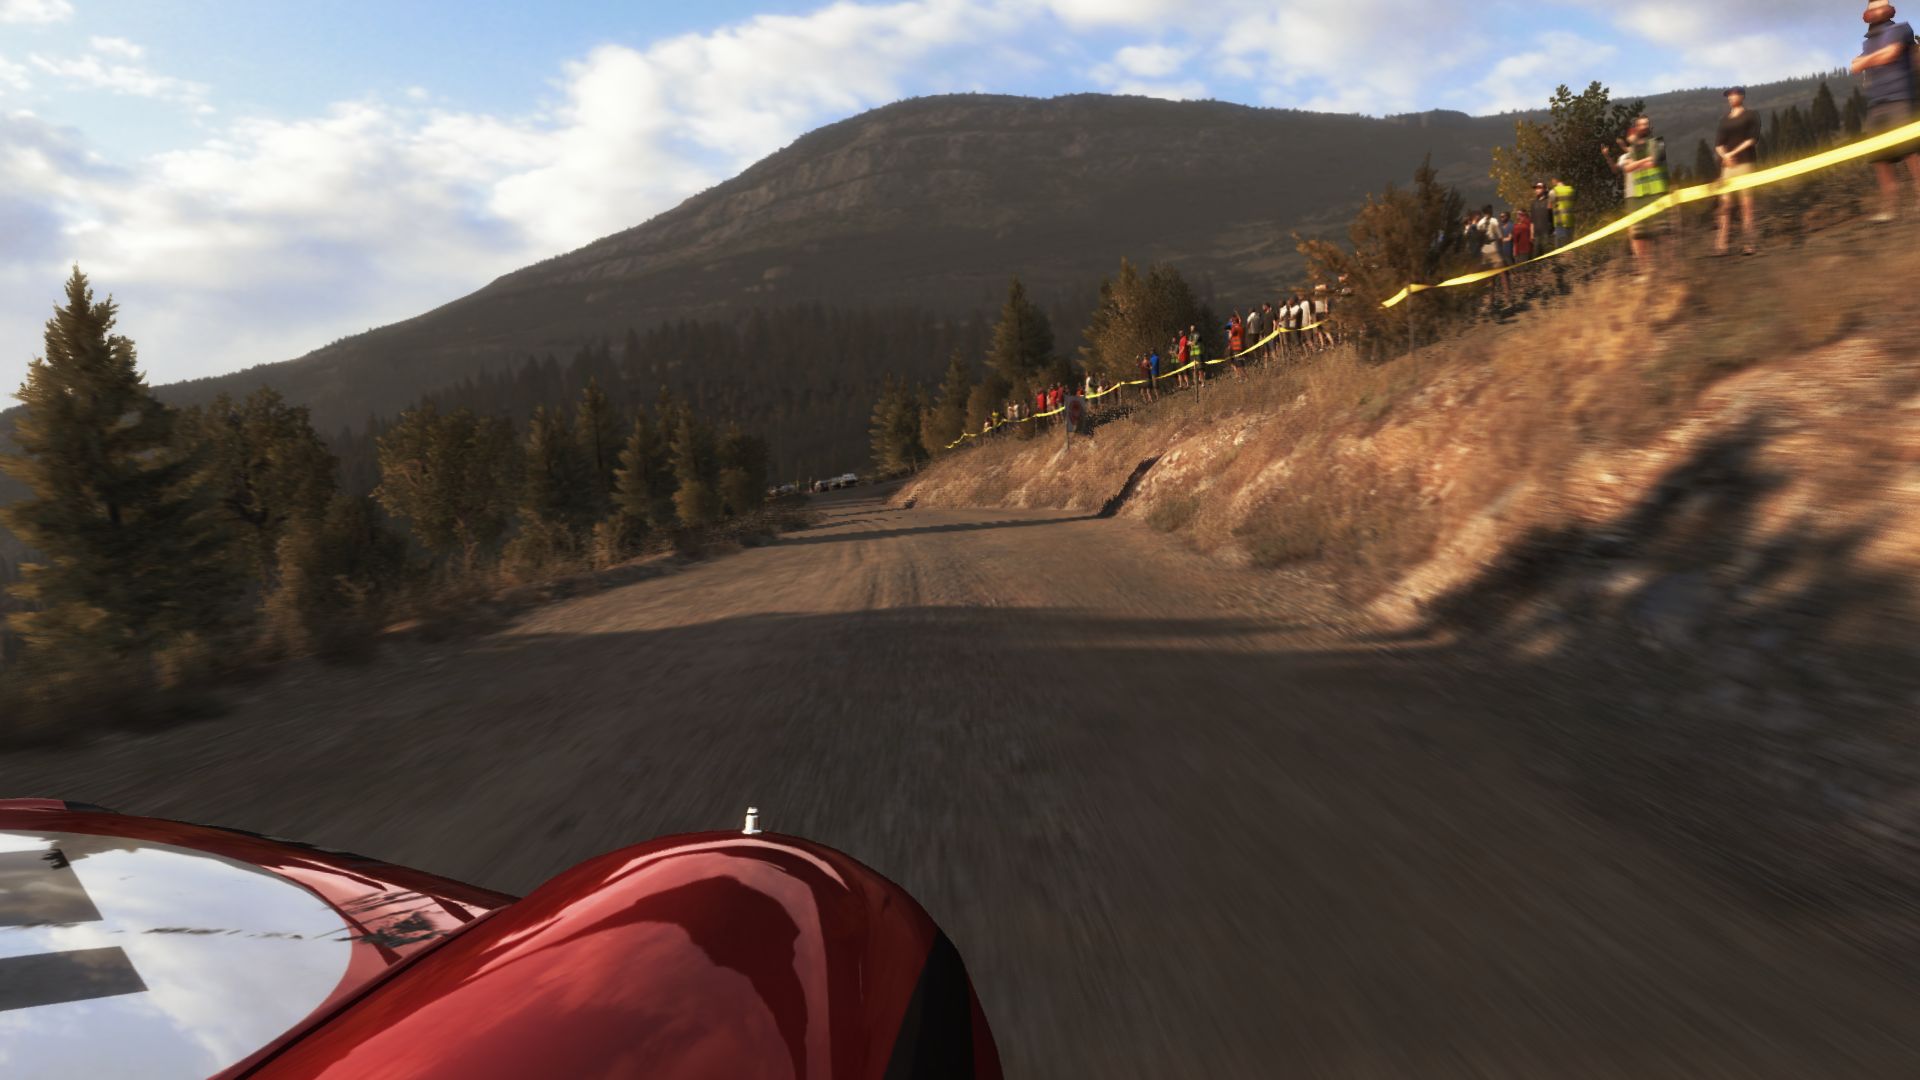
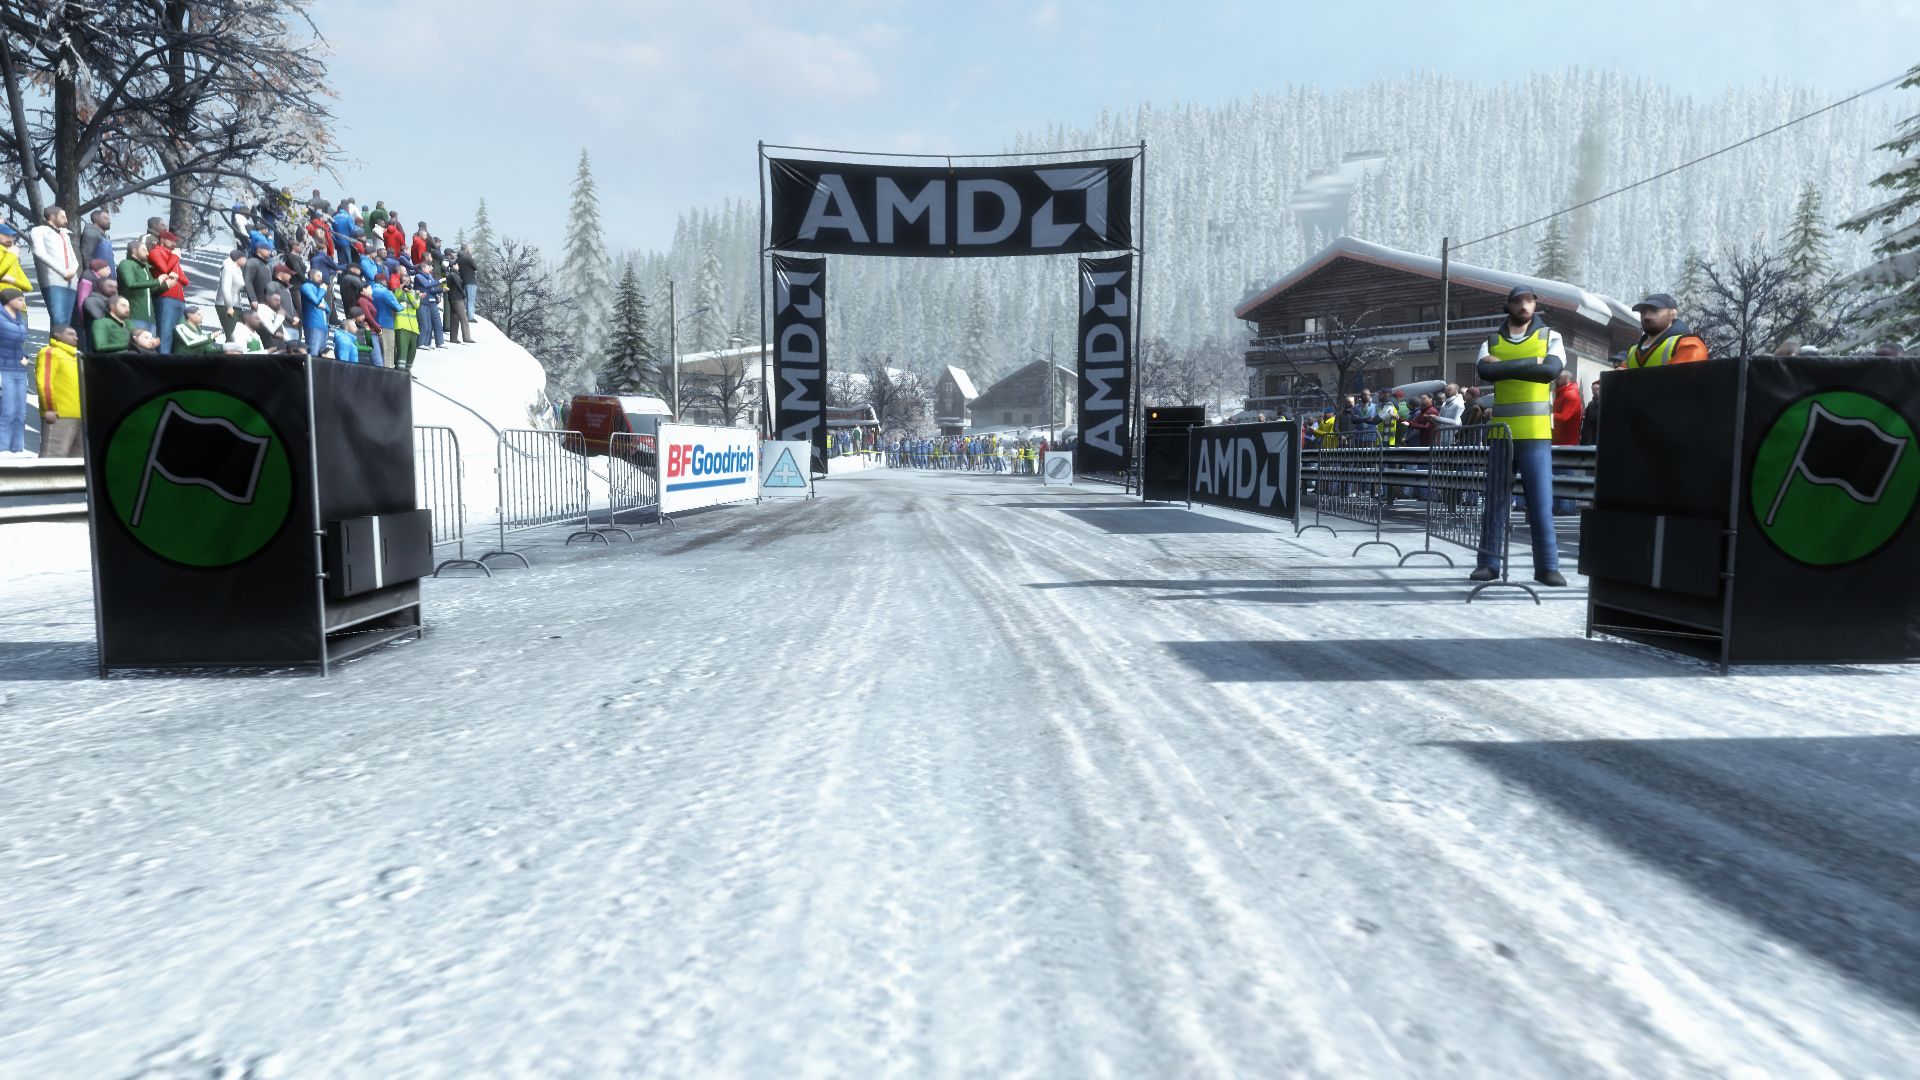
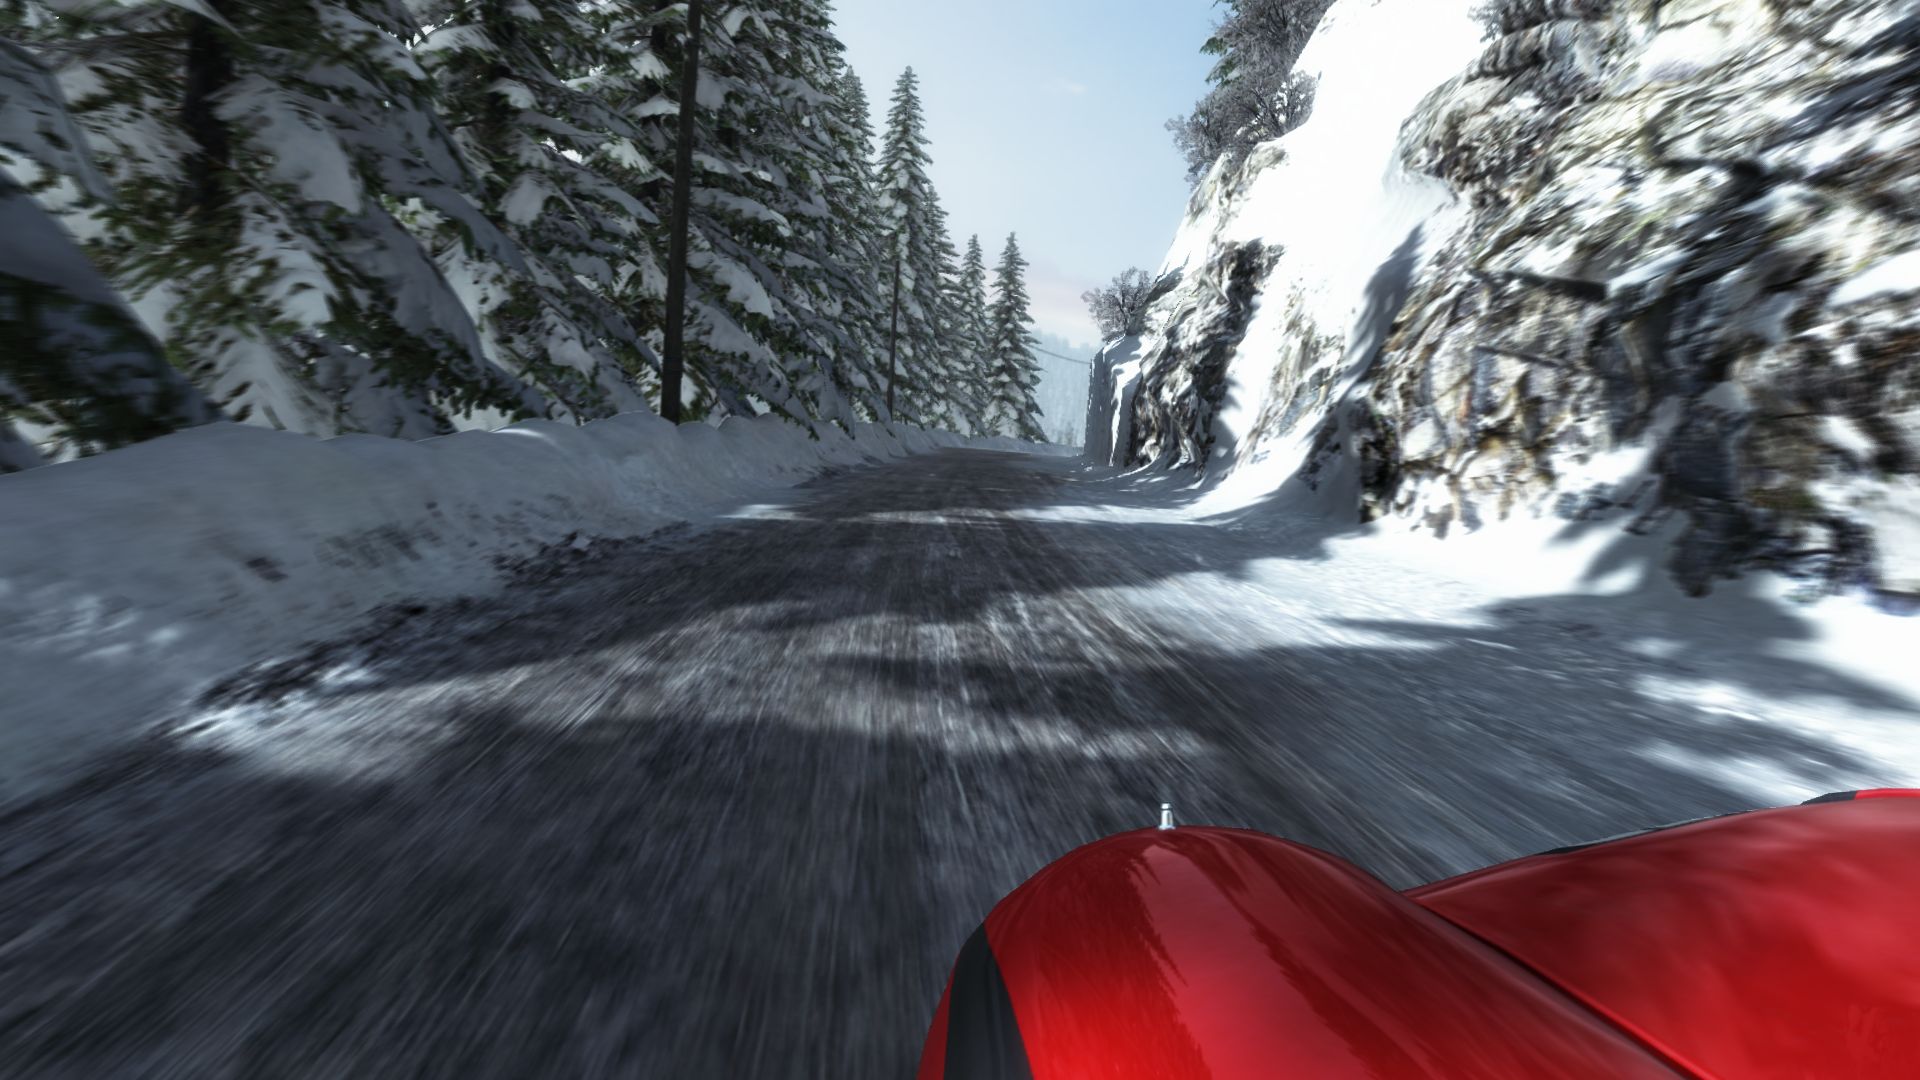
This brings us to our next topic: the tracks. There is a lot of variation in the looks and the architecture of the different race tracks. The demanding driving experience reminds us of Colin McRae and turns each track into a challenge. For example, cutting the corner too close will shoot the car over the border, into the trees. Codemasters has optimized the driving experience and the interface. The menus are far more intuitive now. Overall, although we find the engine to be above average, we think it is time for a new one.eack Other racing games (for example, “Need for Speed Rivals”) have far better graphics.

However, the gameplay is extremely fun. As mentioned before, “Dirty Rally” separates itself from the mass of Arcade racing games (like “The Crew”) with its demanding driving experience. If you are not looking for a story, but rather want to enjoy a classic racing game, then “Dirt Rally” is the right game for you. Currently, the game is available for 30 Euros (~$33) on Steam. Despite being an "Early-Access" version, we did not notice any bugs. In fact, the old "Codemasters Bug" (game would not run properly in full screen mode), occurred on only one notebook (Schenker XMG A505).
The studio deserves praise for its extensive settings. We are familiar with the advanced settings from “Grid” and “F1”, which hide many tweaks. Furthermore, the menu includes 5 presets and various options for the resolution, picture and additional display settings (frequency, gamma, vertical synchronization). Anti-aliasing is available in various modes, like CMAA and MSAA. All settings are applied immediately, without requiring a restart.
Benchmark
Thanks to the in-built, 3-minute benchmark; “Dirt Rally” is well suited for performance measurements. Overall, every test notebook performed at the level we expected. Since “Dirt Rally” belongs to the Gaming Evolved program, AMD systems can perform quite well, as can be seen in the comparison of the GeForce GTX 980 to the Radeon R9 290X (the latter lags further behind in other games). At very low settings, the CPU may be a bottleneck, but at higher settings, the GPU is the limiting factor. Considering the demanding driving experience, we believe having a constant frame rate of 35-40 fps (or higher) is important. Note: the benchmark does not go under 12.5 fps.
Results
First the good news: as long as your system supports DirectX 11 and has a dual-core processor with 4 GB of RAM, you can probably run “Dirt Rally”. Therefore, it does not matter if it is a lower-end multimedia notebook or an office laptop. The bad news: at low settings, the game is anything but pretty: blurry textures, poor 2D bitmap trees and missing shadows/reflections. Thankfully, “Dirt Rally” runs smoothly on low-end GPUs like the Intel HD Graphics 4000 or 4600 IGPs. Middle-class GPUs, like the GeForce GT 740M, are strong enough to run the game at 1366x768 pixels and the medium preset.
High details and the FHD resolution (1920x1080 pixels) require a more powerful gaming GPU, like the GeForce GTX 850M. For maximum settings and 4x MSAA, a high-end GPU, like the GeForce GTX 870M or higher, is necessary. Thankfully, the system requirements are not as extreme as most other games (see “The Witcher 3” or “GTA V”), which means that high-end gaming notebooks can run the game at 4K (3840x2160 pixels). High details without Anti-Aliasing will run smoothly on a GeForce GTX 880M. Overall, considering the benchmark results, we believe the hardware requirements are appropriate for the graphics quality.
| Dirt Rally | |
| 3840x2160 High Preset 1920x1080 Ultra Preset AA:4x MS 1920x1080 High Preset 1366x768 Medium Preset 1024x768 Ultra Low Preset | |
| NVIDIA GeForce GTX 980, 3770K | |
| AMD Radeon R9 290X, 4790K | |
| NVIDIA GeForce GTX 980M, 4700MQ | |
| AMD Radeon R9 280X, 3770K | |
| NVIDIA GeForce GTX 970M, 4700MQ | |
| NVIDIA GeForce GTX 880M, 4700MQ | |
| NVIDIA GeForce GTX 870M, 4700MQ | |
| NVIDIA GeForce GTX 960M, 4720HQ | |
| NVIDIA GeForce GTX 860M, 4700MQ | |
| NVIDIA GeForce GTX 850M, 4340M | |
| NVIDIA GeForce GT 750M, 4702MQ | |
| AMD Radeon R7 512 Cores (Kaveri Desktop), A10-7850K | |
| Intel Iris Pro Graphics 5200, 4750HQ | |
| NVIDIA GeForce GT 740M, 4200M | |
| NVIDIA GeForce GT 640M, 2637M | |
| NVIDIA GeForce GT 720M, 4200M | |
| AMD Radeon HD 8650G, A10-5750M | |
| NVIDIA GeForce GT 630M, 3720QM | |
| Intel Iris Graphics 5100, 4258U | |
| Intel HD Graphics 4600, 4700MQ | |
| Intel HD Graphics 5500, 5010U | |
| Intel HD Graphics 3000, 2637M | |
Test Systems
Four of our test models come from Schenker Technologies (mysn.de):
- W504 (Core i7-4700MQ, 8 GB DDR3, GeForce GTX 860M, GTX 870M, GTX 880M, GTX 970M, GTX 980M)
- A505 (Core i7-4720HQ, 8 GB DDR3, GeForce GTX 960M)
- M504 (Core i5-4340M, 8 GB DDR3, GeForce GTX 850M)
- M503 (Core i7-4702MQ, 8 GB DDR3, GeForce GT 750M)
These notebooks have Windows 7 64-bit installed on them (Win 8.1 @XMG A505).
Three of our test models come with Nvidia:
- HP Envy 15-j011sg (Core i5-4200M, 12 GB DDR3, GeForce GT 740M)
- MSI CX61-i572M281BW7 (Core i5-4200M, 8 GB DDR3, GeForce GT 720M)
- Acer Aspire Timeline Ultra M3-581TG (Core i7-2637M, 4GB DDR3, GeForce GT 640M)
Intel provided one model:
- Schenker S413 (Core i7-4750HQ, 8 GB DDR3, Iris Pro Graphics 5200)
The desktop PCs use CPUs/APUs from Intel and AMD, SSDs from Micron, Intel and Samsung, motherboards from Intel and Asus and graphics cards from Nvidia and AMD. The 4K monitor is an Asus PB287Q.
GPU drivers: Nvidia 352.86, AMD 15.5 Beta, Intel 10.18.14.4170
Overview
