Notebookcheck Logo

Watch Dogs Benchmarked

Hardware giant. The outburst of the community was big when Ubisoft announced the official system requirements for Watch Dogs. The open-world title not only requires a potent graphics chip but also a very fast processor. We have tested several notebooks and desktops with various settings.
Watch Dogs Logo

For the original German article, see here.

Graphics

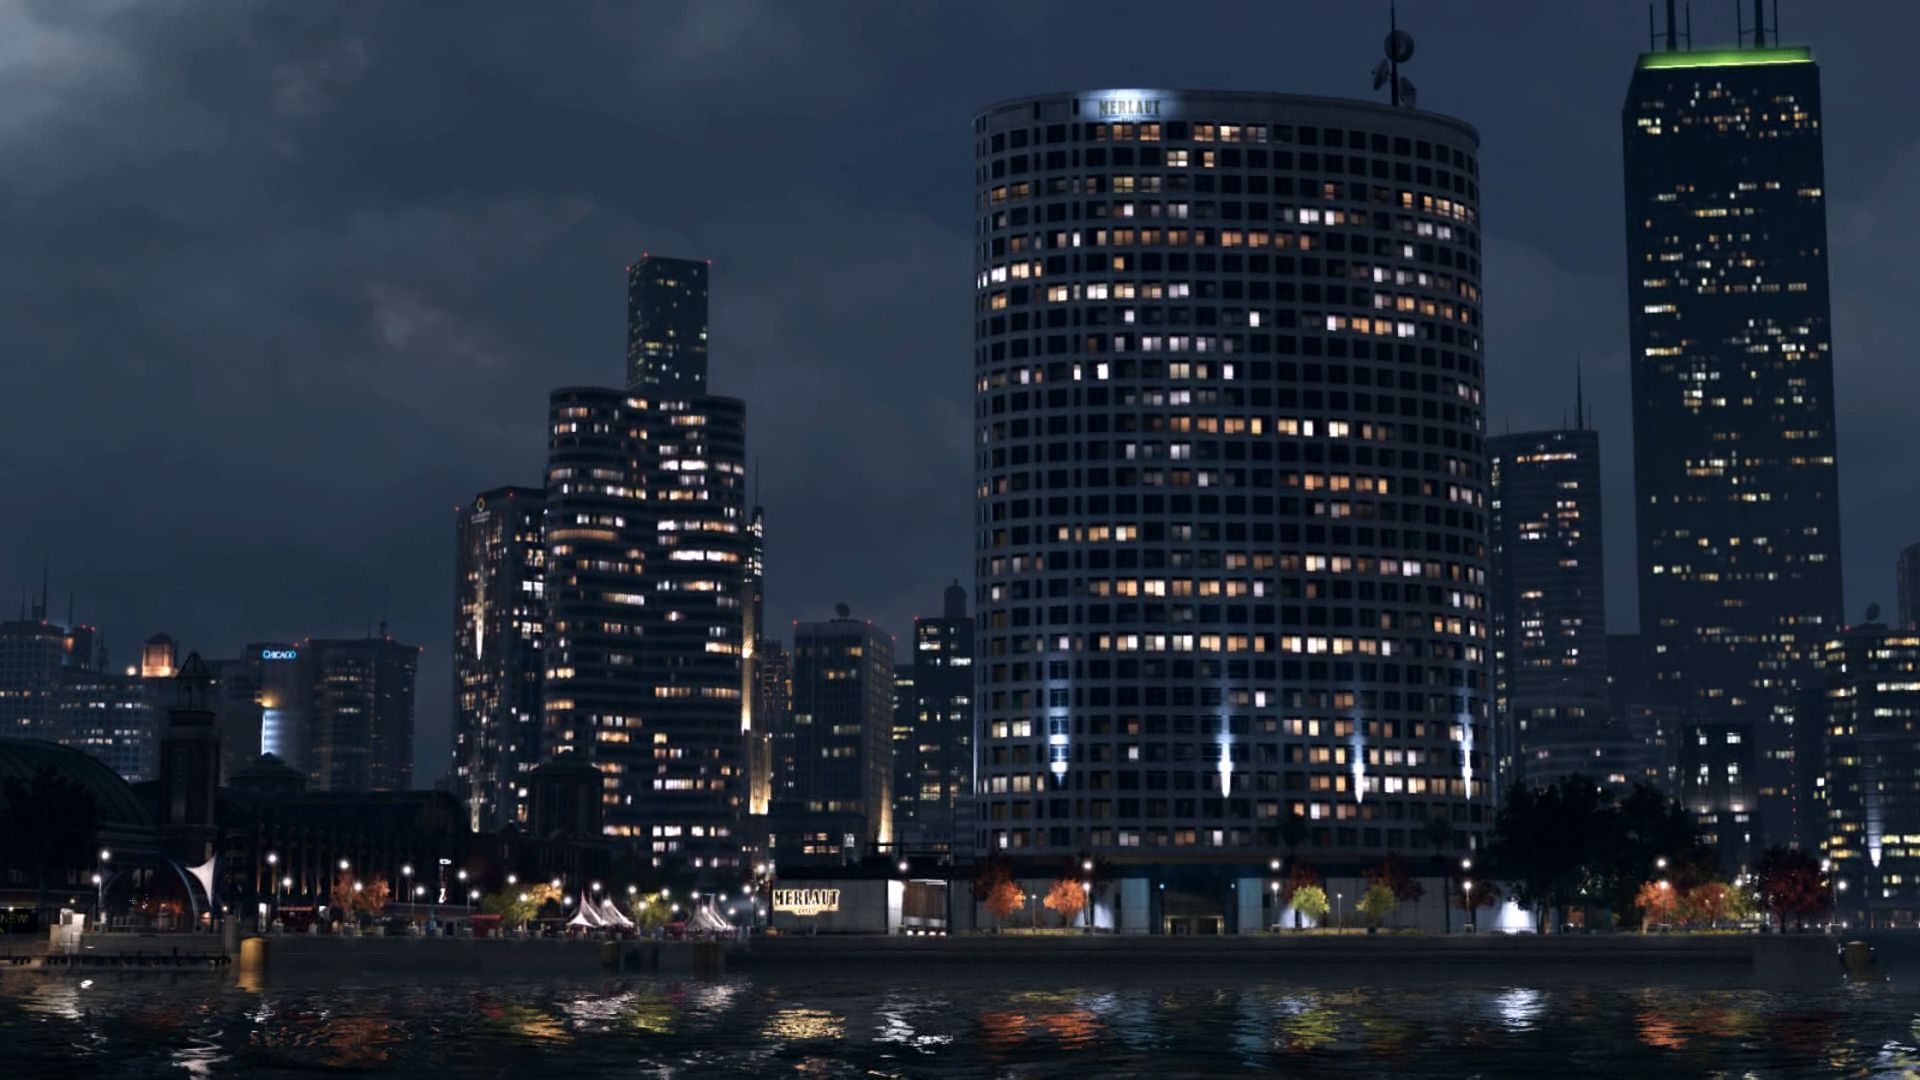
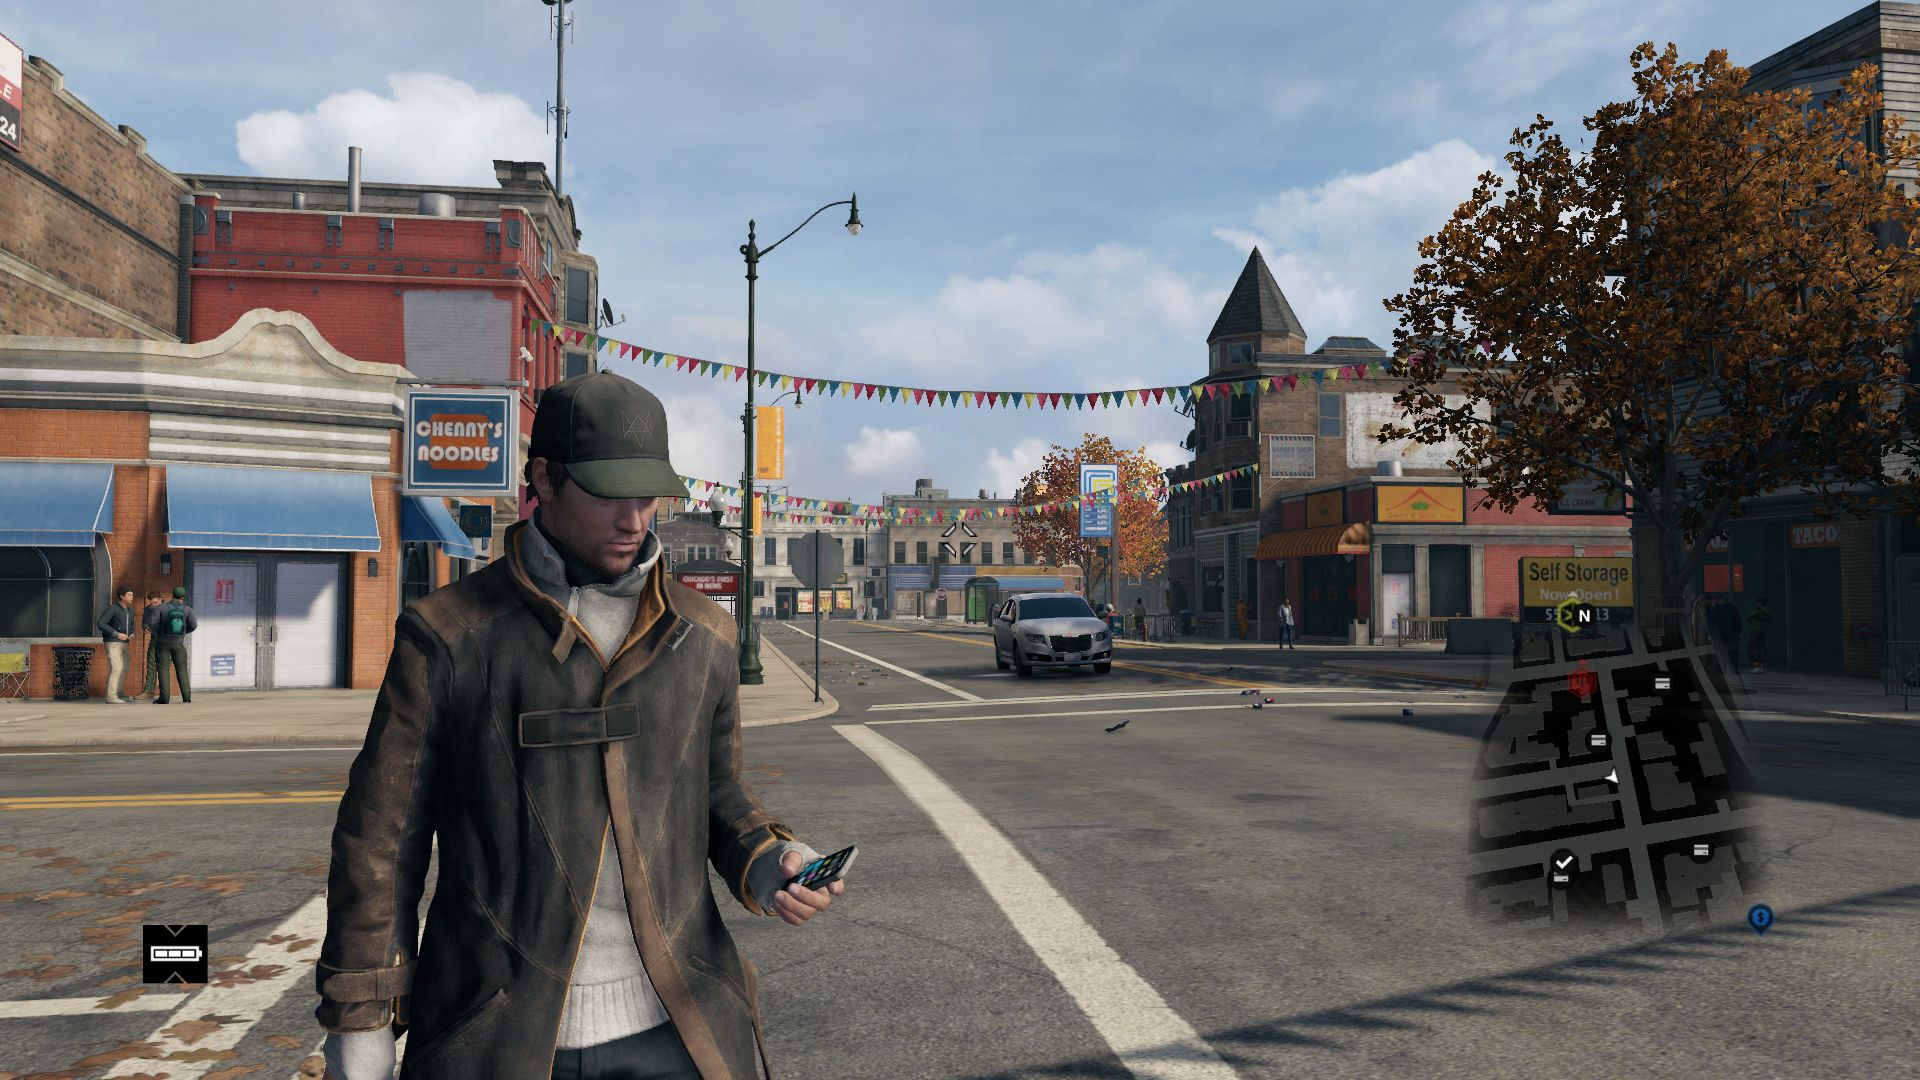
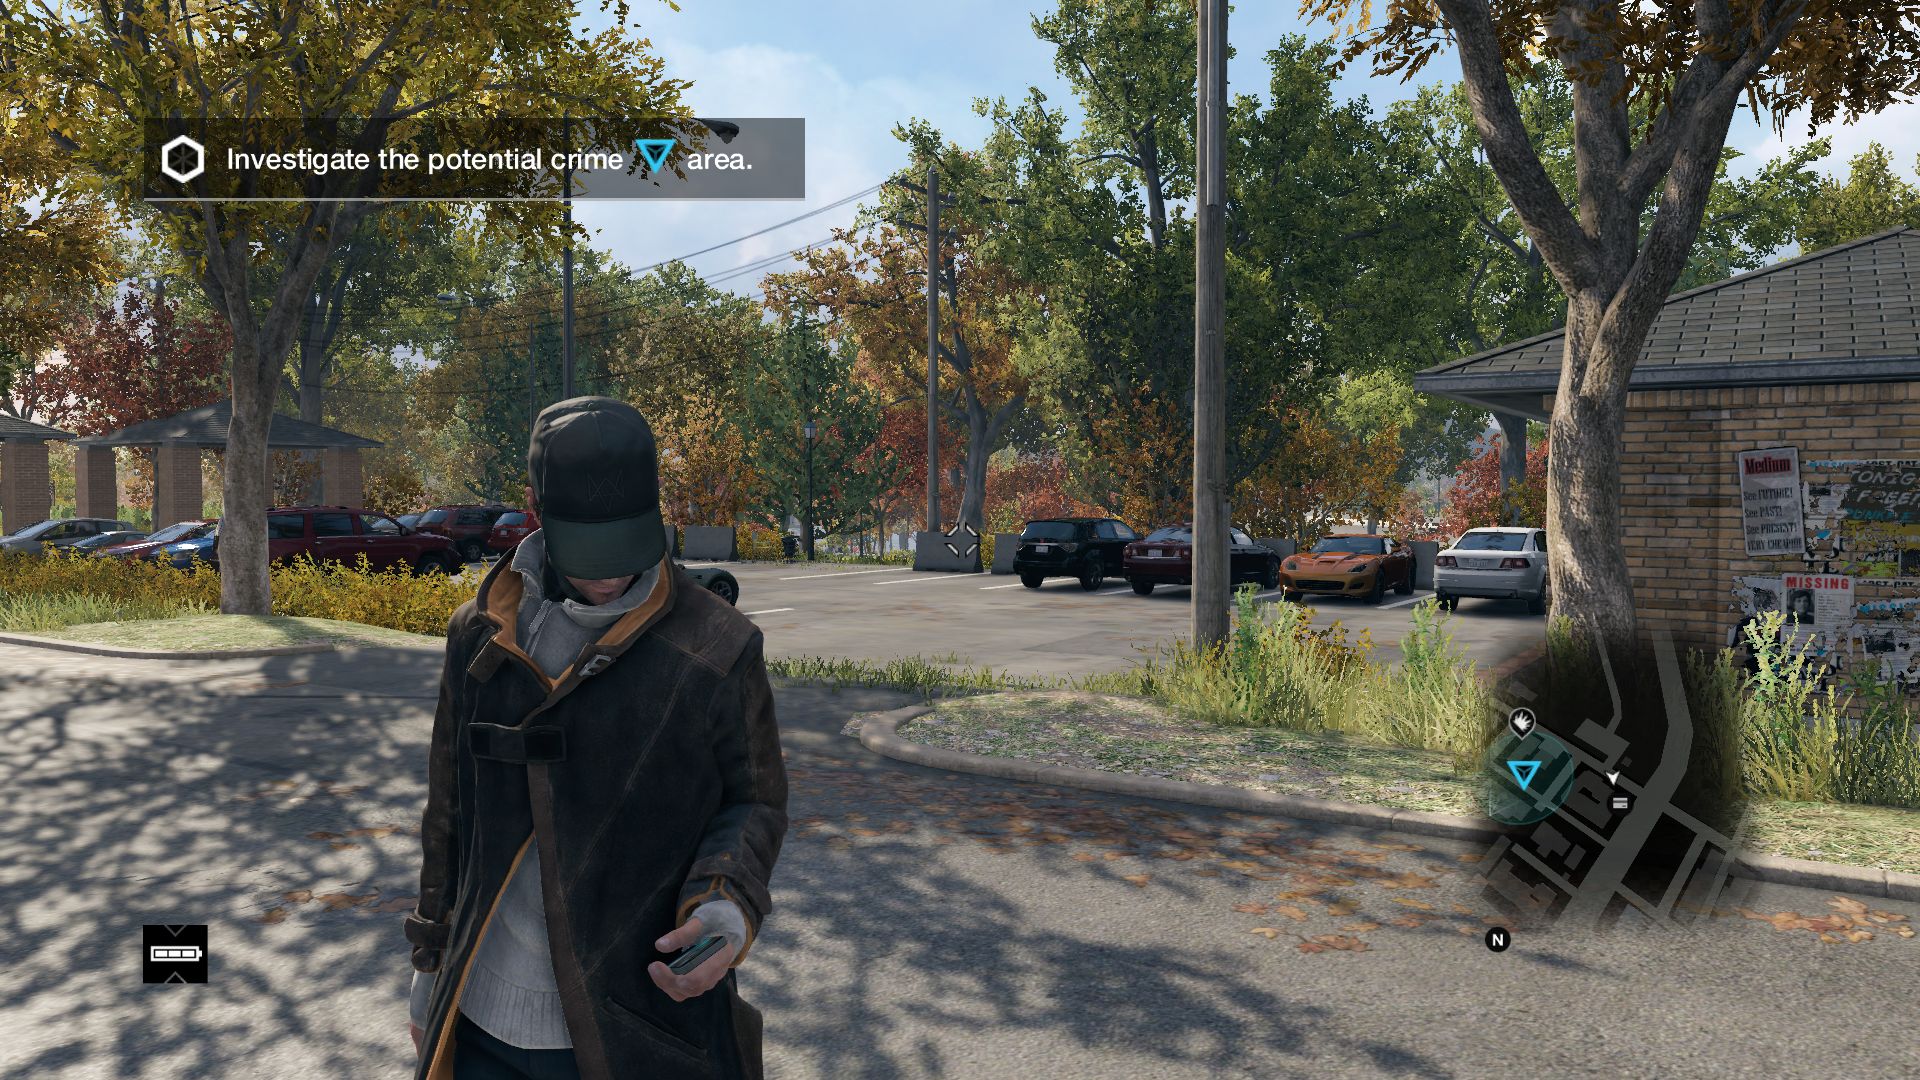
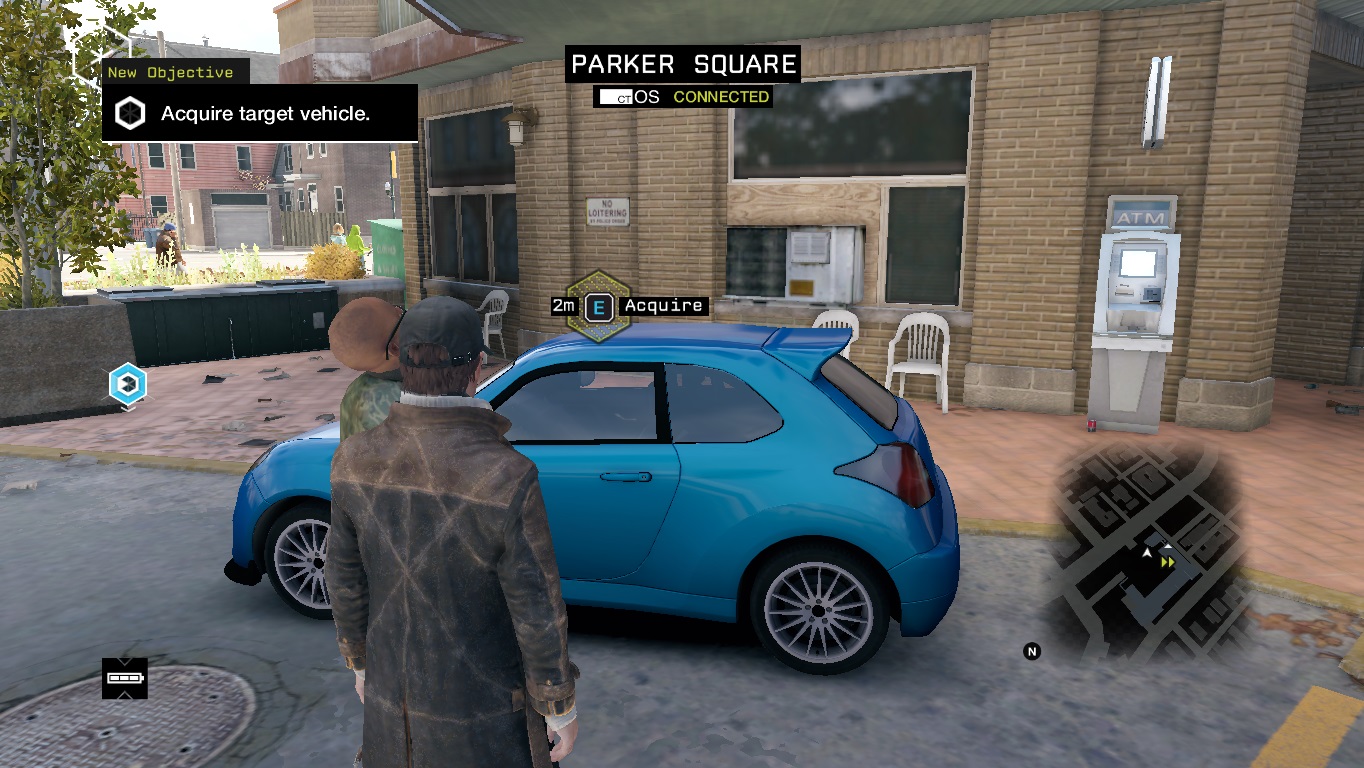
It is currently greatly debated if the graphics quality touches the first presentation videos of the publisher. For a 2014 game Watch Dogs looks good without a doubt, but it is no real graphics stunner. On the one hand the third person title excels with neat reflections and superb light and shadow effects at night and during rain, on the other hand the light in the daytime is not very convincing. Outdoors, the environment seems somewhat too bright and too little graded.

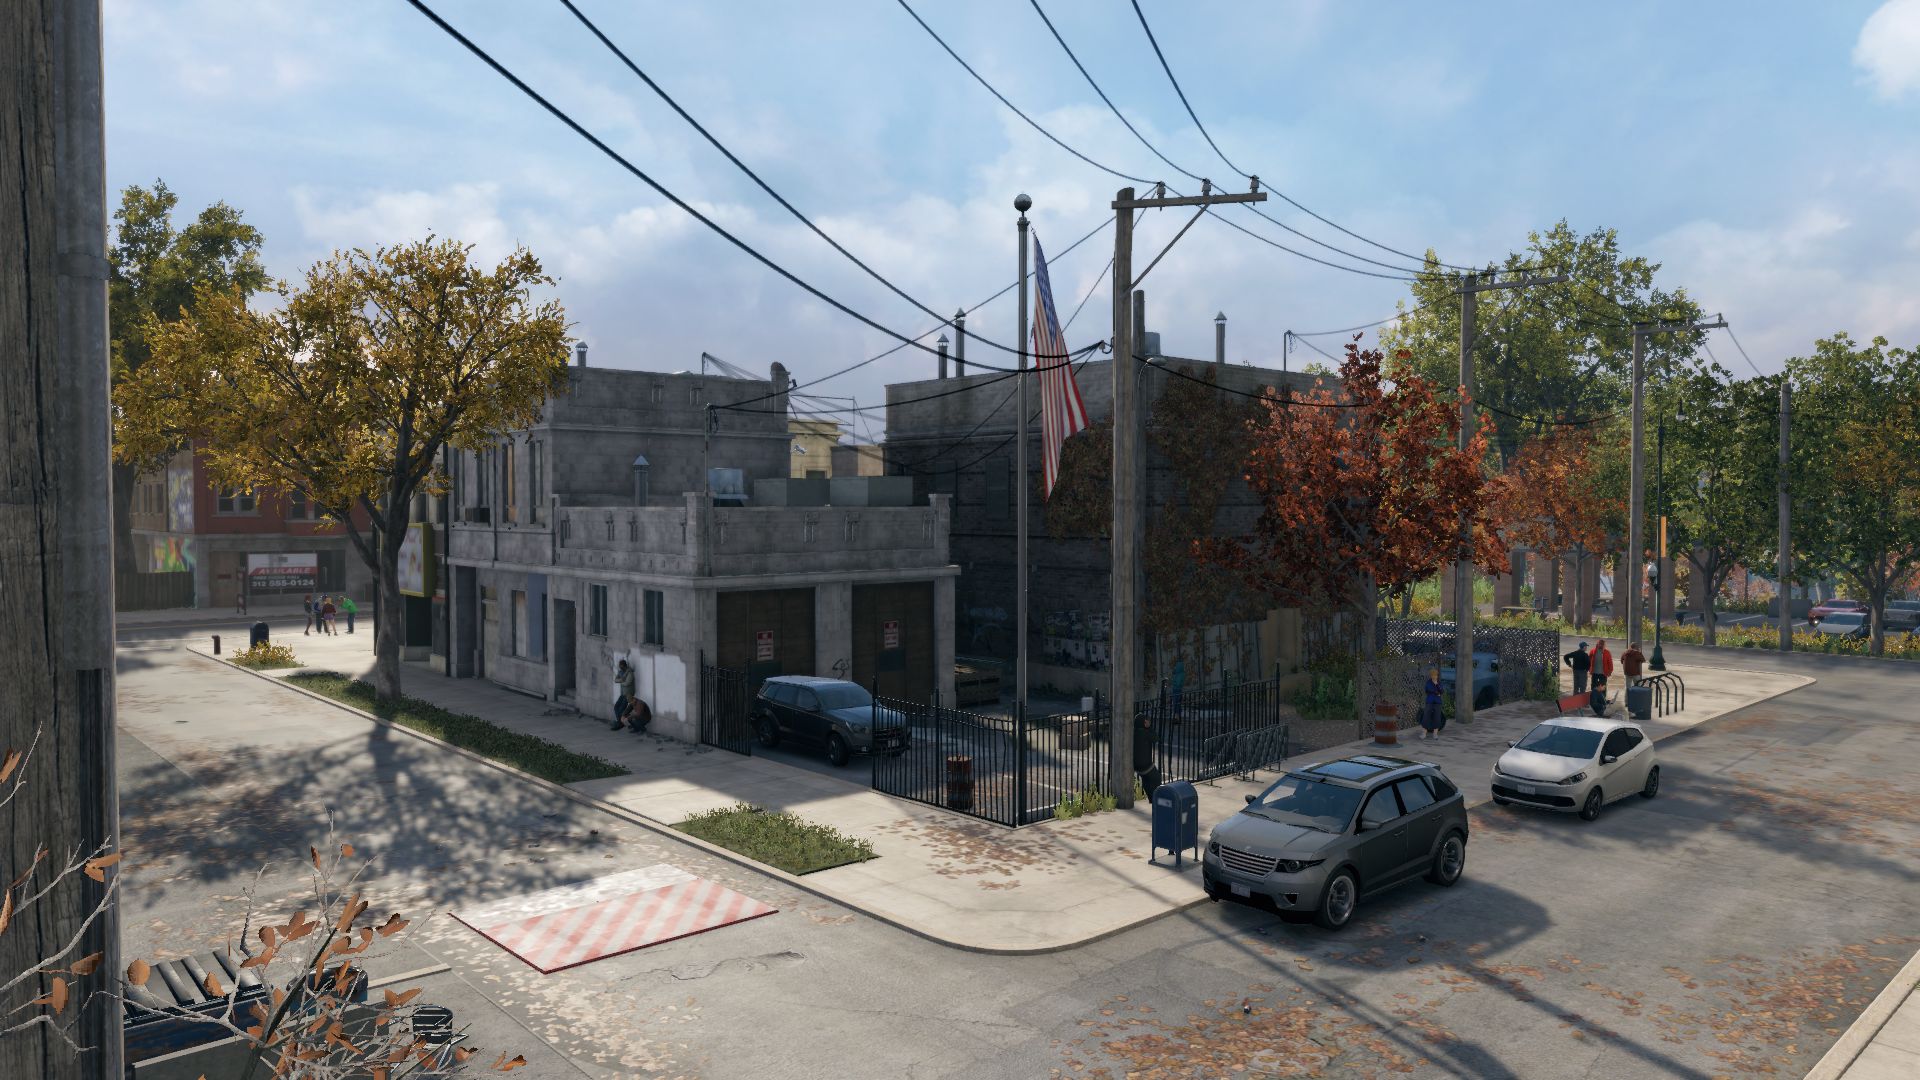
Nonetheless, Watch Dogs is able to create a coherent atmosphere, partly due to the high amount of vegetation and people. The characters appear realistic thanks to the credible animations and good character models. Another advantage of the Disrupt engine, which was specifically built for Watch Dogs, turns out to be the excellent display of water, which is definitely first-grade.

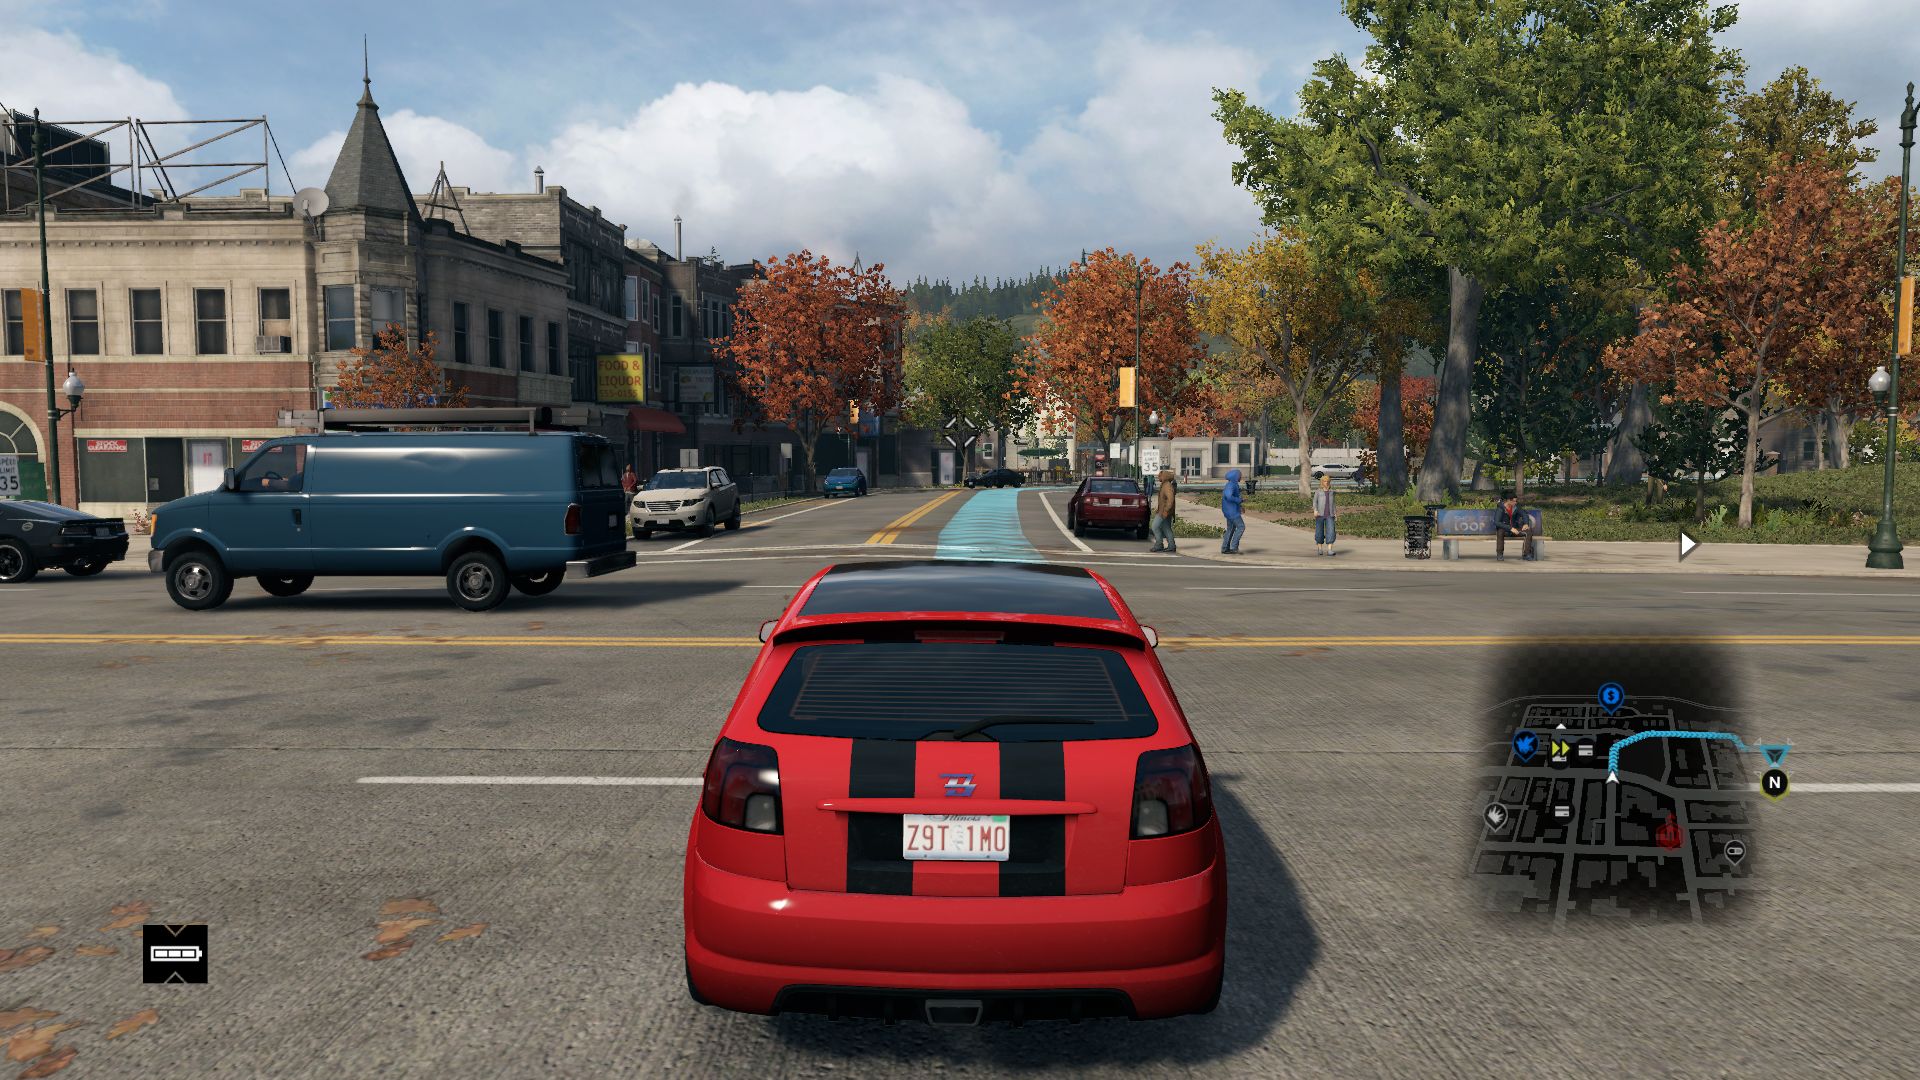
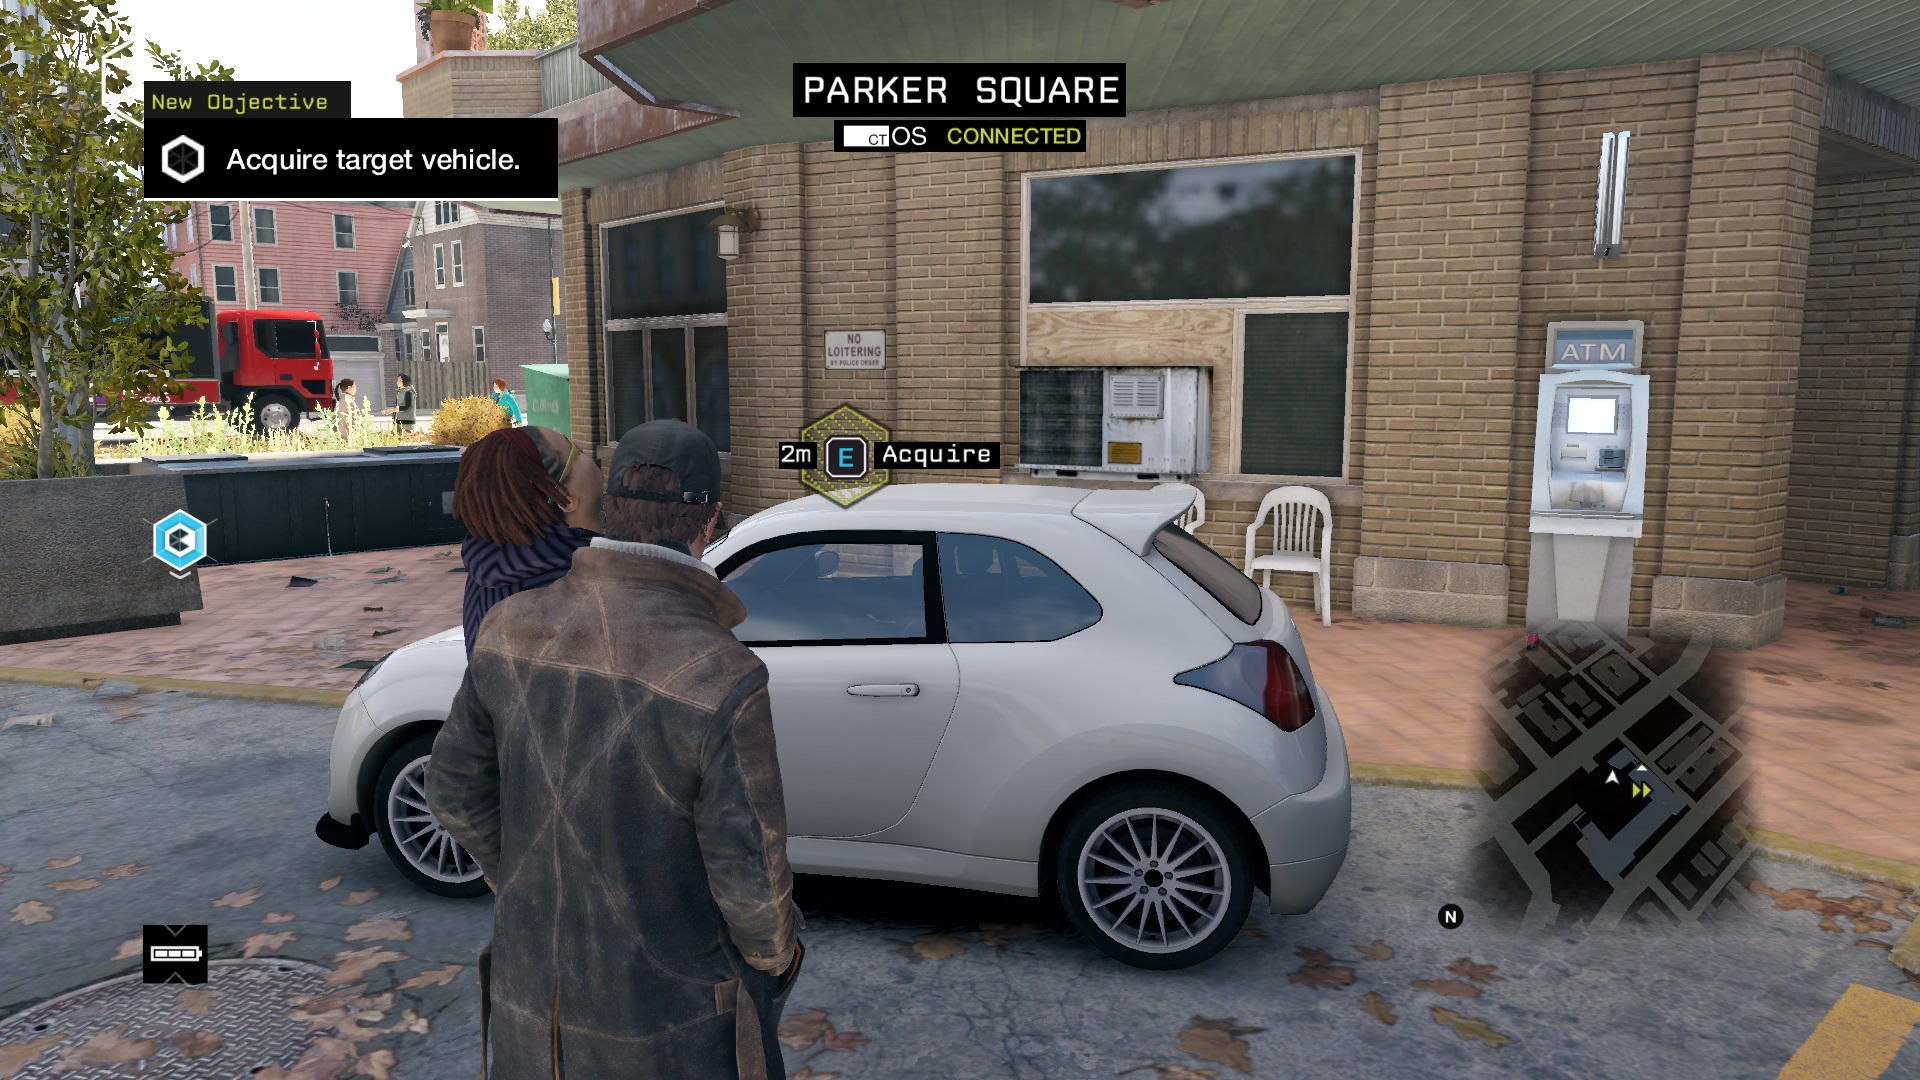
Furthermore, the game offers quite sharp textures - when using high or ultra-high graphics settings. Another fact that deserves praise is that objects only rarely pop up and "jump into the picture" when driving. In addition to that, Havok's eponymous physics software guarantees harmonious physical behavior. We were particularly impressed by the simulation of fabric (clothes etc.).

Watch Dogs
Watch Dogs
Watch Dogs
Watch Dogs
Watch Dogs
Watch Dogs

But it is not all roses. After only a few minutes into the game it becomes apparent that Ubisoft somewhat neglected the PC version. Besides the bad drivability (the control of vehicles feels vague via mouse and keyboard) there are also the many performance drops. Watch Dogs likes to crash despite brand new (beta) drivers from time to time.

Ubisoft ought to have foreseen that its online platform Uplay, which is necessary for the installation of the game, would not be able to handle the run of customers and thus will work inadequately after release (login not possible, error messages regarding the cloud data, etc.).

Watch Dogs
Watch Dogs
Watch Dogs
Watch Dogs
Watch Dogs
Watch Dogs

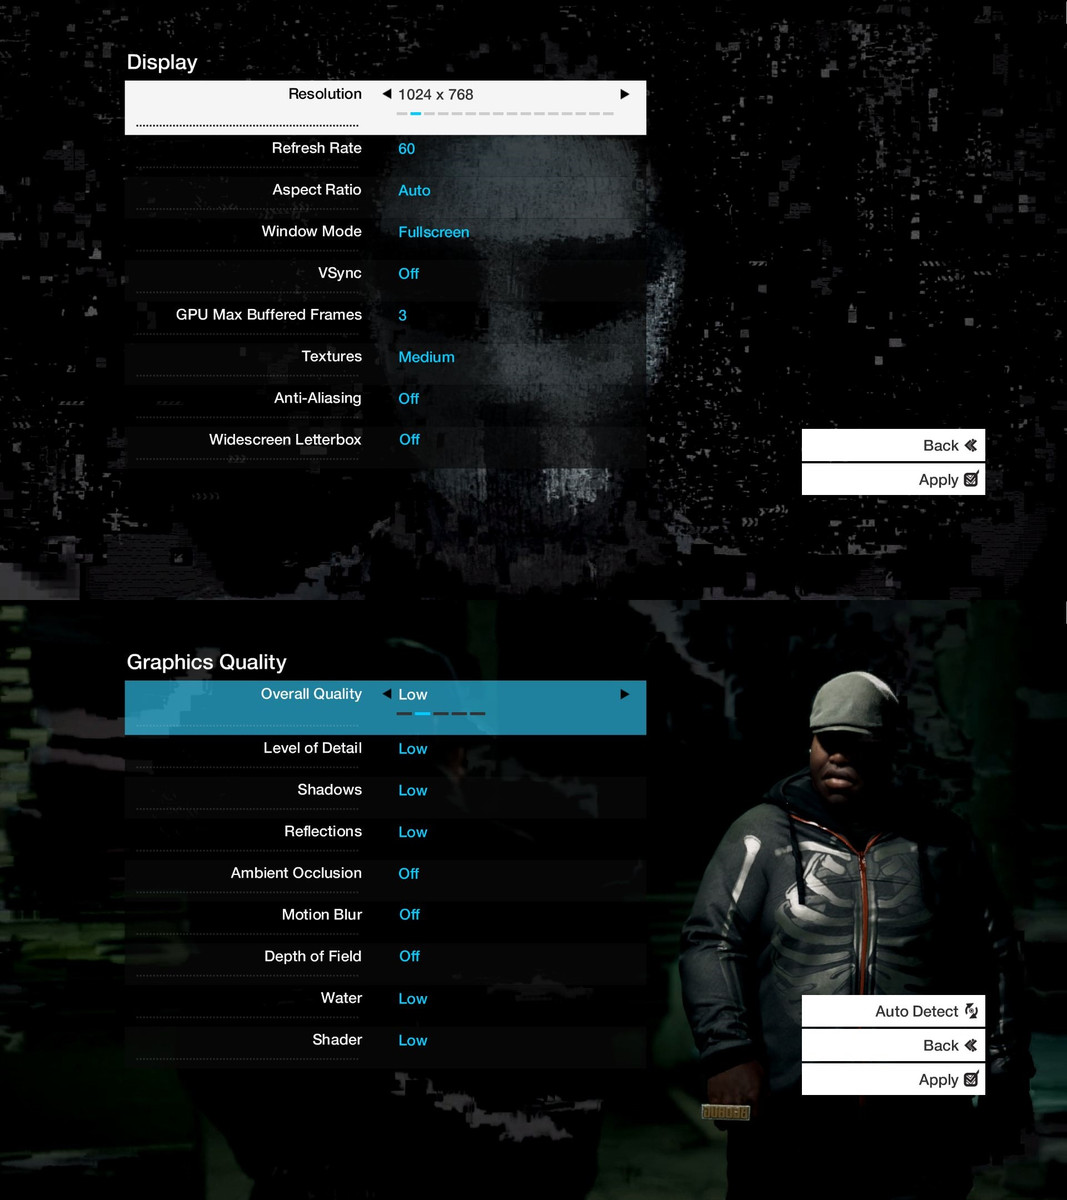
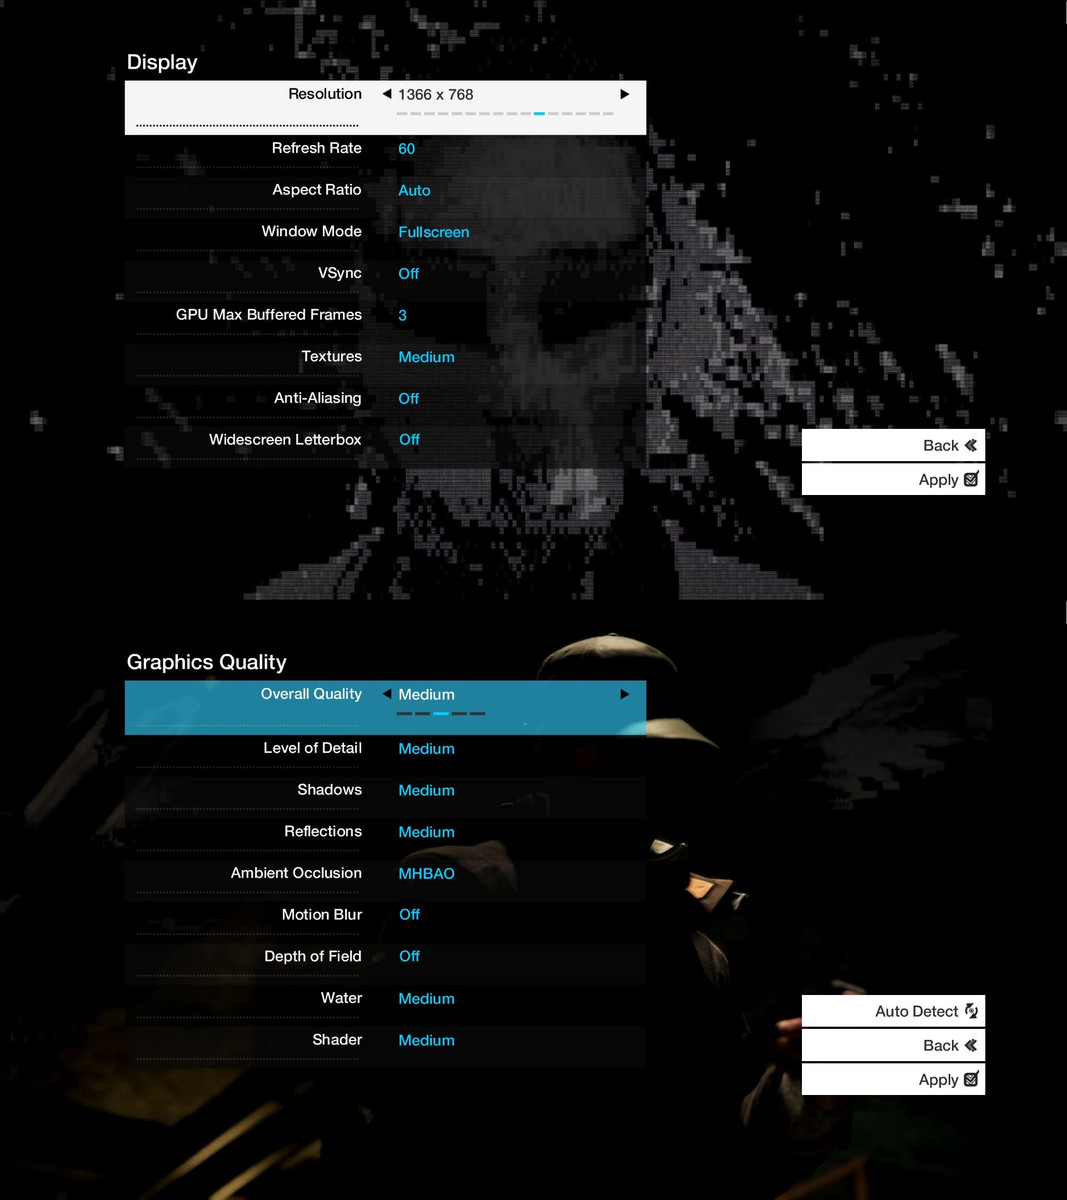
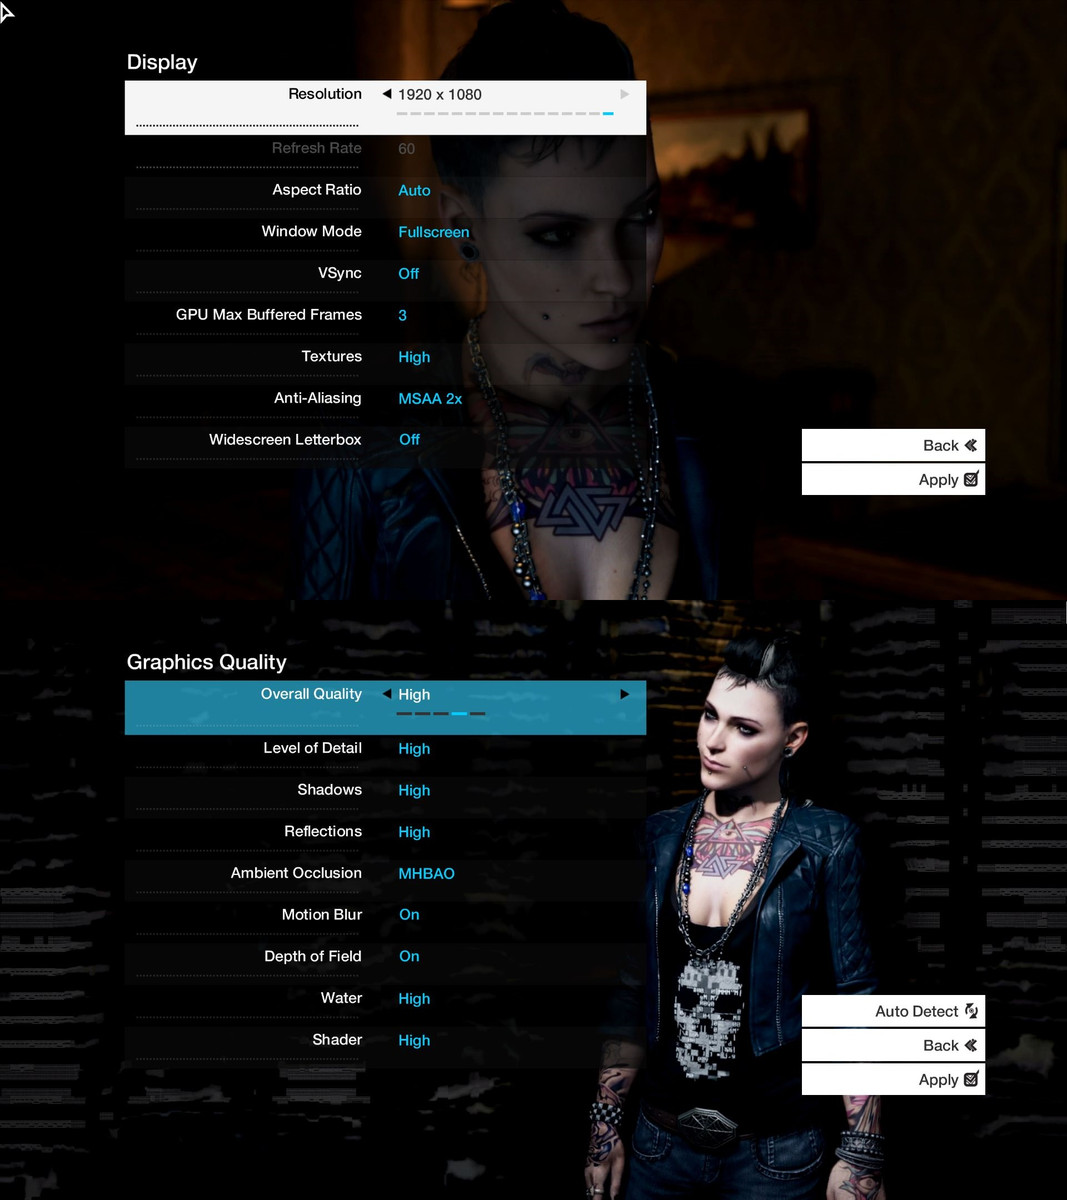
Start issues aside: The graphics menu is, for a PC game, decent by all means. The display tab allows changing the resolution, the screen mode, the anti-aliasing and other standard options. The graphics quality tab offers four presets (overall quality) and eight individual options ranging from A for ambient occlusion to W for water.

Since Watch Dogs is part of Nvidia's TWIMTBP program it not only offers FXAA, SMAA and MSAA but also TXAA for anti-aliasing. All settings can be changed during the game apart from the texture quality (3 GB VRAM should suffice for ultra settings).

Low settings
Low settings
Medium settings
Medium settings
High settings
High settings
Ultra settings
Ultra settings

Benchmark

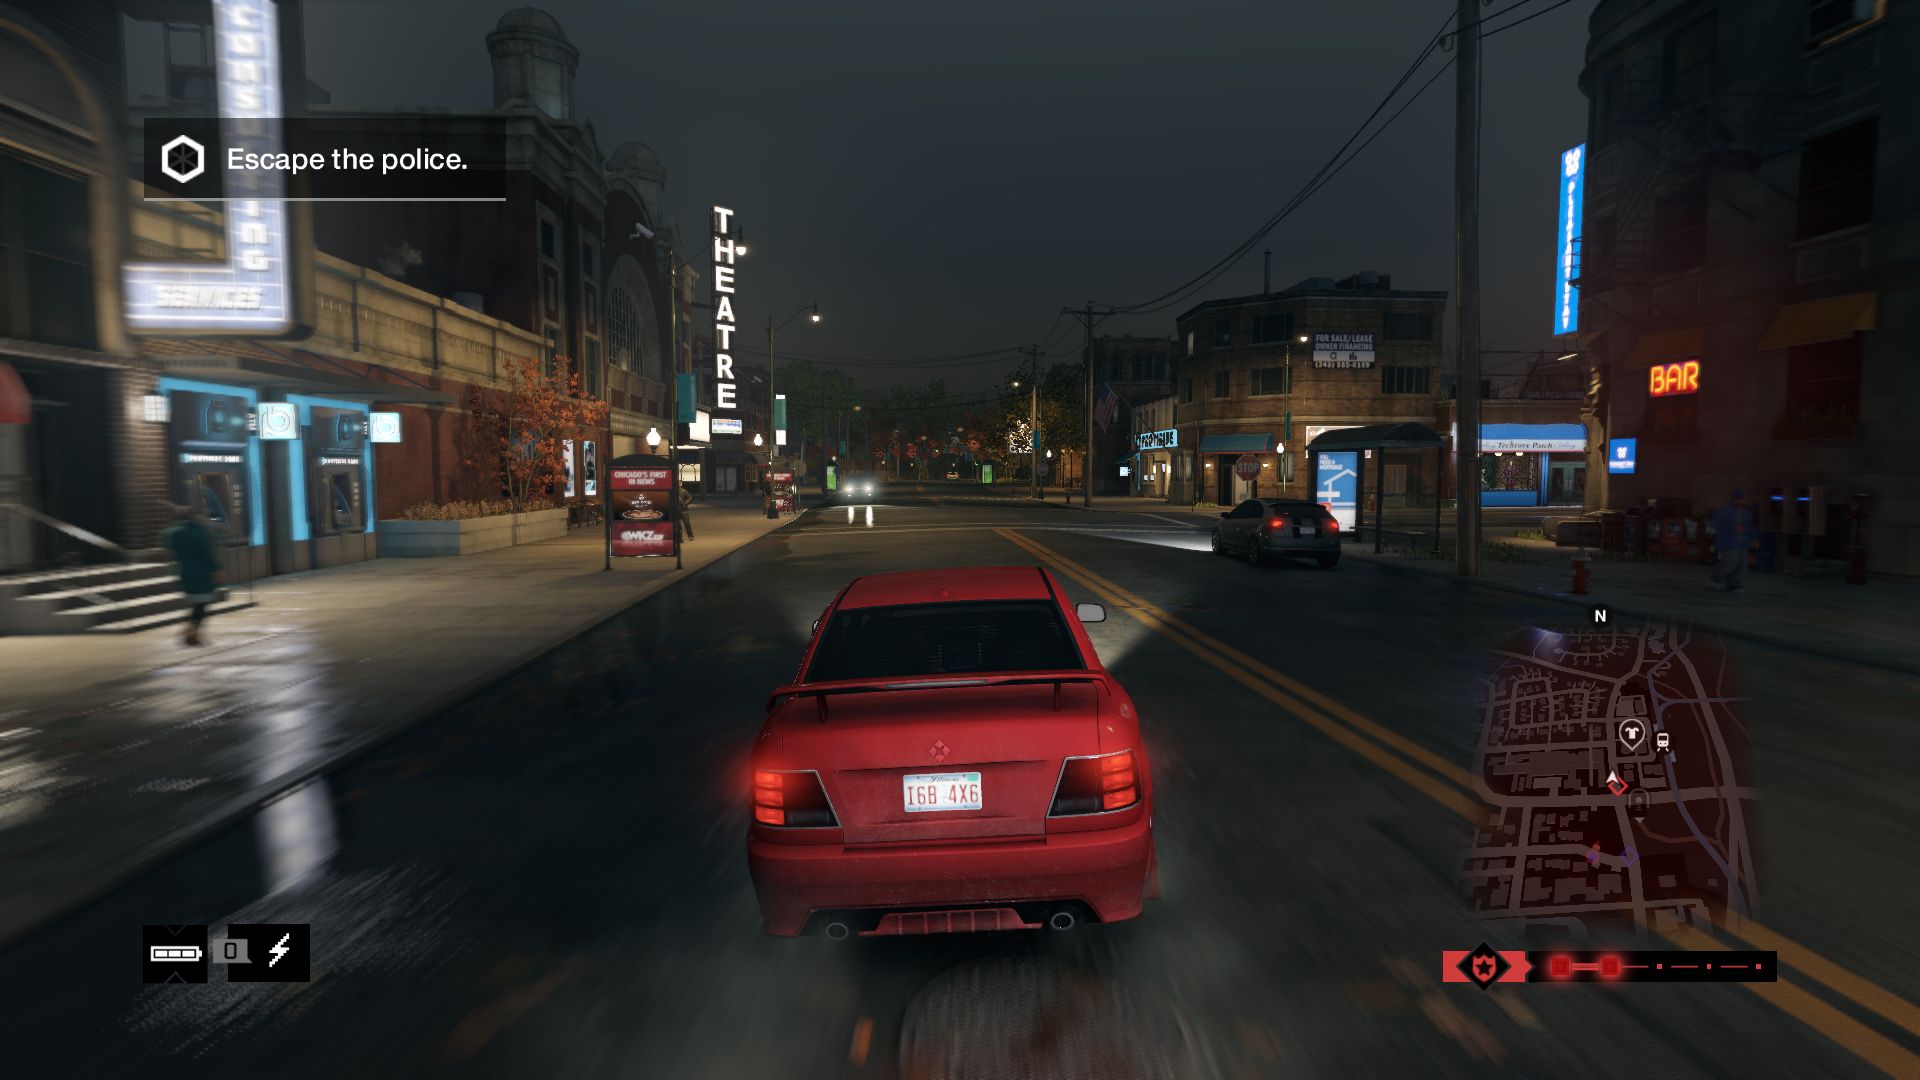
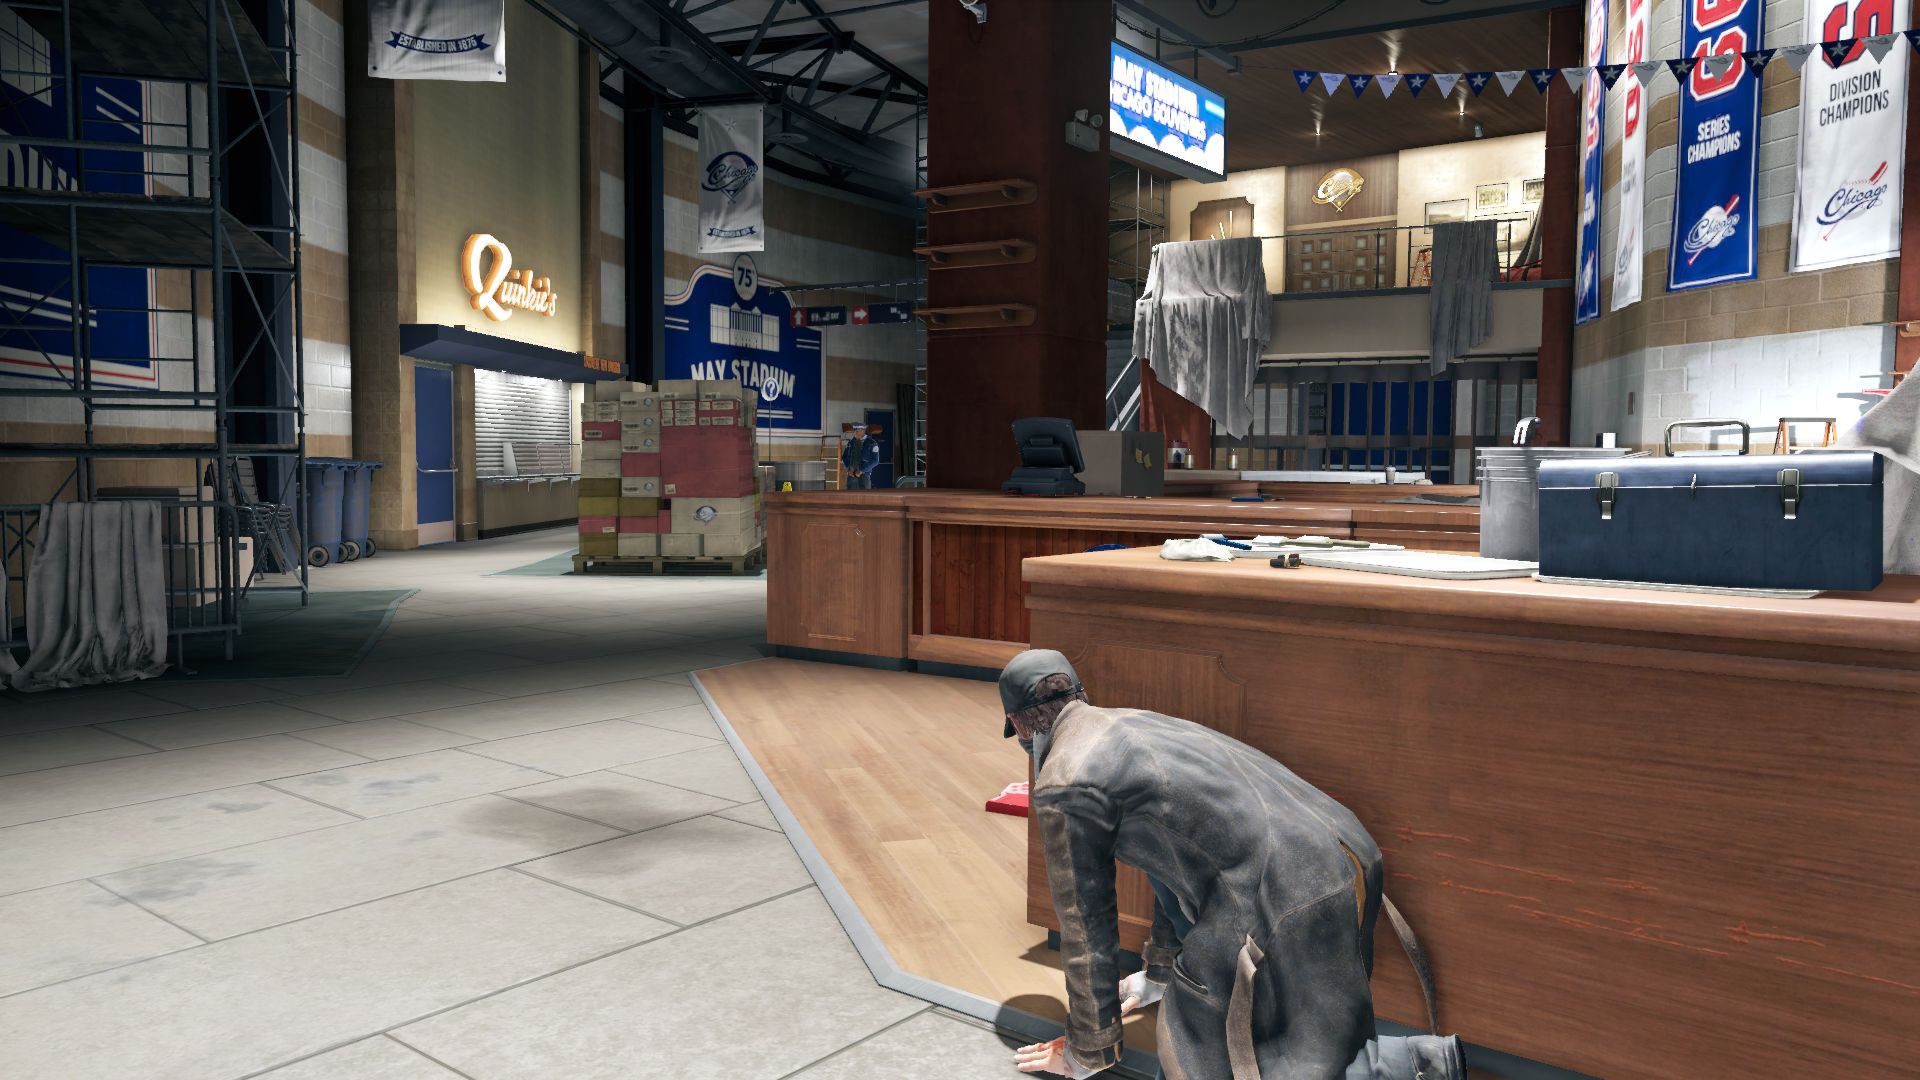
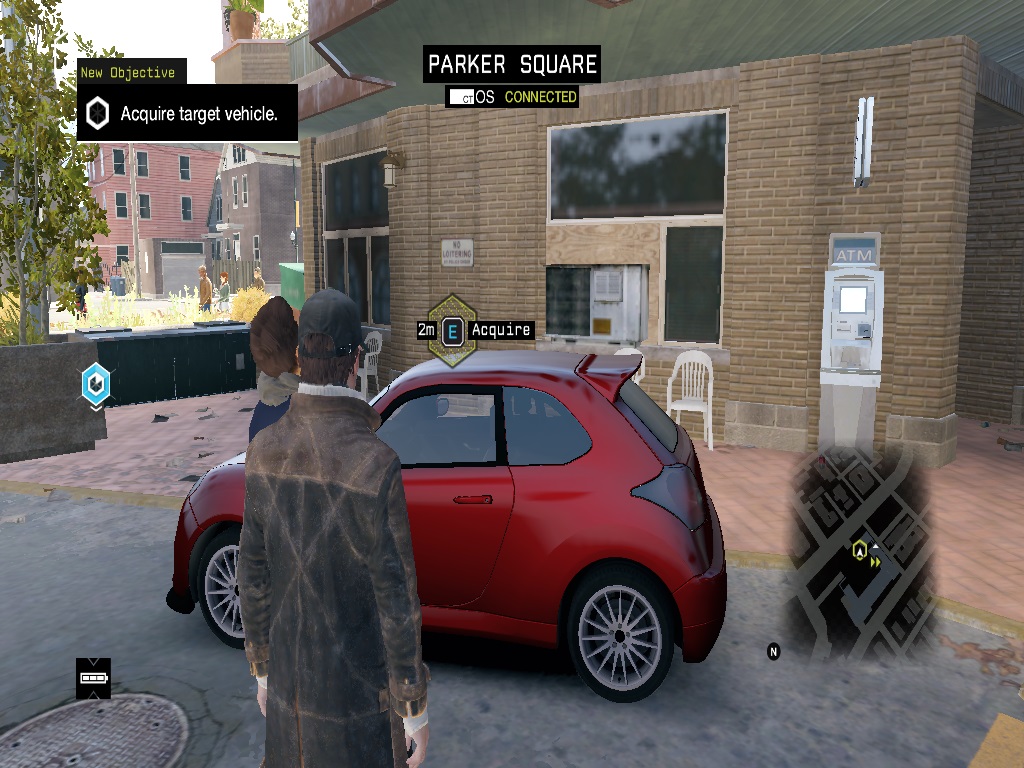
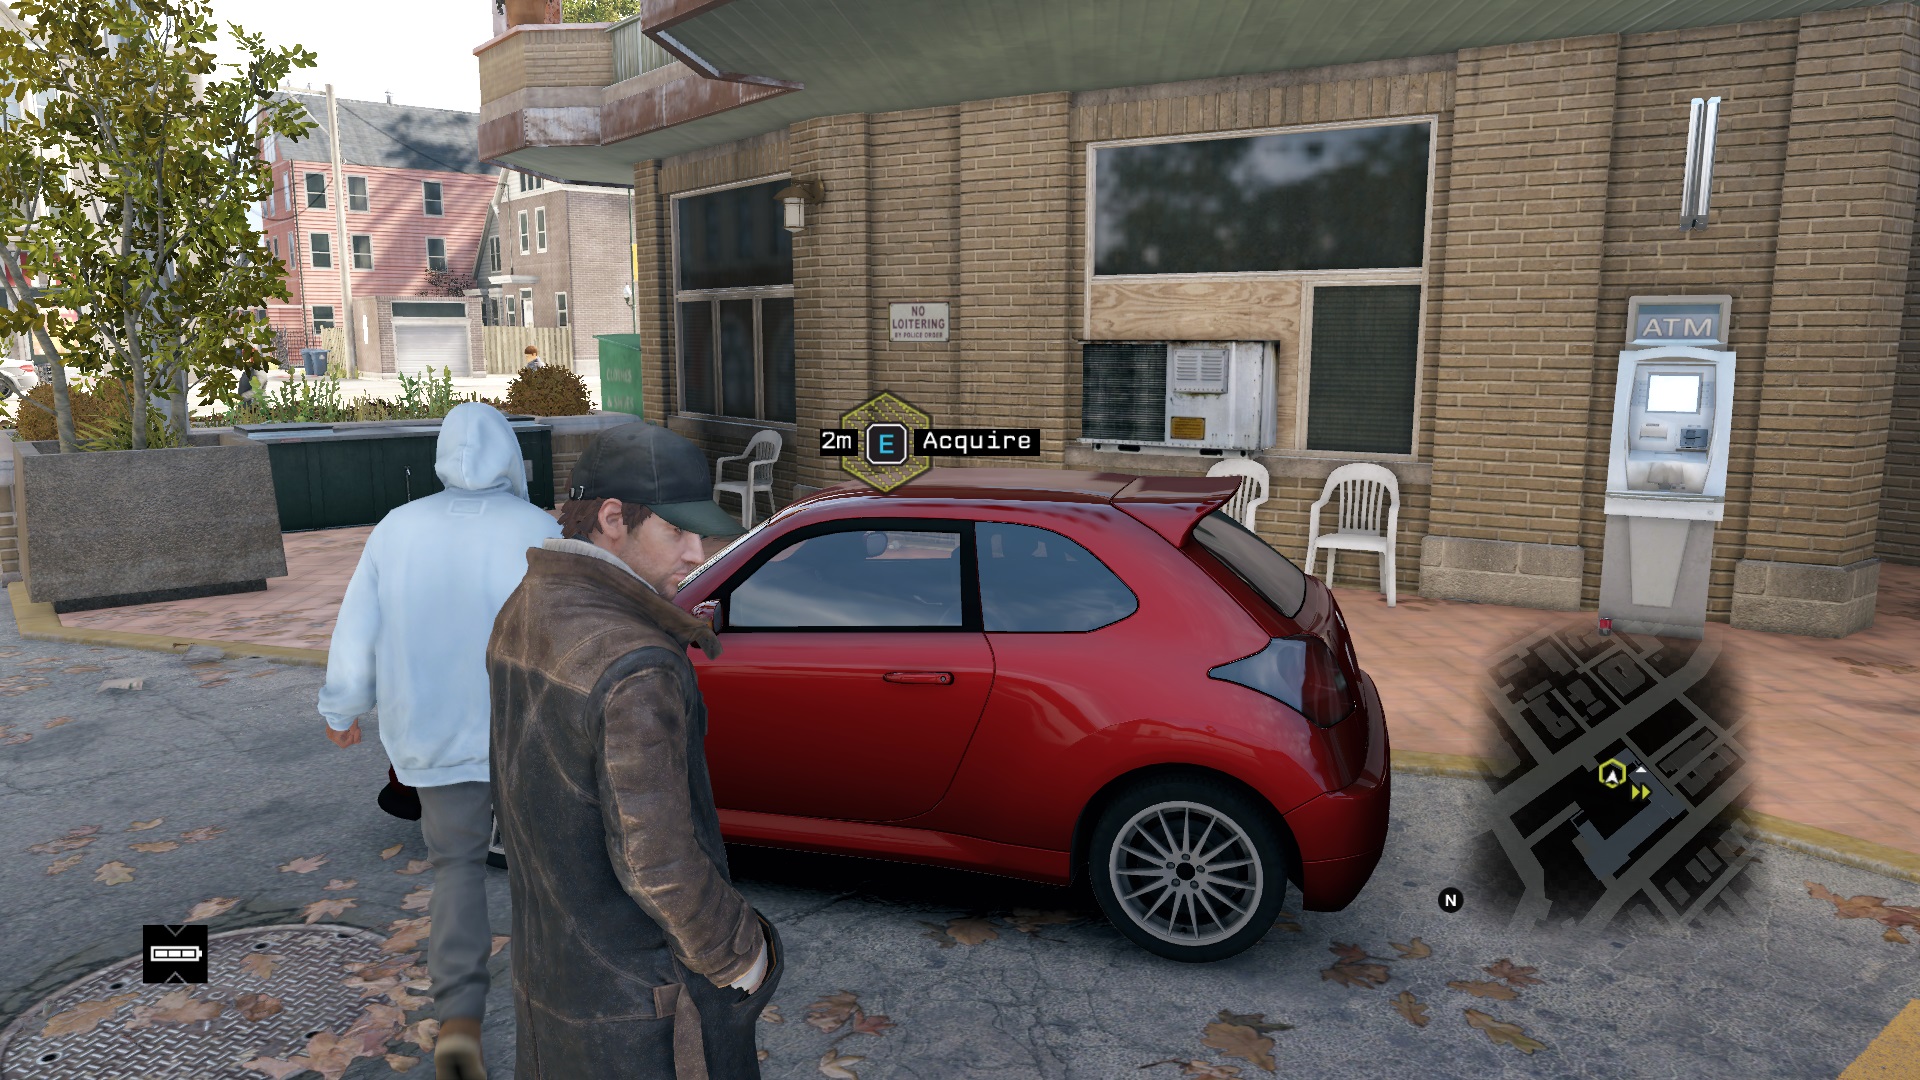
We tested the performance of the Triple A title with the help of a car race. As soon as the protagonist, Aiden, has fled the stadium and escaped the police after the prolog, there is a so-called fixer contract (= side mission) close to his hideout.

As can be seen in our video we raced from the first to the sixth checkpoint and recorded the average frame rate. The entire sequence is about 40 seconds long and is exemplary for the hardware demand. Due to the high speed of the game and the mentioned performance drops, we expected a benchmark result of at least 35 fps. Otherwise there would be annoying stutters once in a while.

Low settings
Low settings
Medium settings
Medium settings
High settings
High settings
Ultra settings
Ultra settings

Although the graphics card is the limiting factor for most systems, the processor is also of significance. At low or medium settings the performance follows the CPU (at least in high-end notebooks and/or devices based on AMD). Speaking of AMD: The graphics chips of the Nvidia competitor come off reproducibly worse at moderate settings (see R9 280X and HD 8970M). The minimum fps is also lower according to our experience.

Results

The hardware demand of Watch Dogs is quite high when adding up all benchmark scores. Entry-level GPUs, as known from inexpensive office notebooks, do not meet the requirements. Intel's popular processor chip HD Graphics 4600 struggles heavily even with 1024x768 pixels and low settings. It did not go any higher than 24 fps in the benchmark (Iris Pro 5200: ~33fps). A multimedia GPU like the GeForce GT 740M (~40 fps @1024x768, low settings) is at least necessary to play Watch Dogs fluently. For medium details and 1366x768 pixels we recommend a GeForce GT 750M or higher.

Those who want to play the game with high settings, 1920x1080 pixels and 2x MSAA anti-aliasing require a super-strong high-end model like the Radeon HD 8970M, the GeForce GTX 780M or the GeForce GTX 870M. The frame rate increases by almost 35% without anti-aliasing (+30% FXAA vs. 2x MSAA), allowing a GeForce GTX  770M or a GTX 860M to be used. There is currently no single-chip notebook able to display the game at maximum settings: 1920x1080 pixels and 4x MSAA without stuttering. Only the GeForce GTX 880M scratches 35 fps.

Watch Dogs
    1920x1080 Ultra Overall Quality, Ultra Textures AA:4x MS     1920x1080 High Overall Quality, High Textures AA:2x MS     1366x768 Medium Overall Quality, Medium Textures     1024x768 Low Overall Quality, Medium Textures
Radeon R9 280X, 3770K
Desktop-PC
34.6 (25min) fps ∼46%
46.4 (32min) fps ∼55%
60.6 (47min) fps ∼52%
73.6 (58min) fps ∼57%
GeForce GTX 880M, 4700MQ
Schenker W504
32.9 (28min) fps ∼44%
44.4 (39min) fps ∼52%
74.3 (59min) fps ∼64%
88.1 (71min) fps ∼68%
GeForce GTX 660 Ti, 3770K
Desktop-PC
31.7 (26min) fps ∼43%
43.4 (38min) fps ∼51%
76 (61min) fps ∼65%
87.3 (70min) fps ∼68%
GeForce GTX 780M, 4700MQ
Schenker W503
30.4 (25min) fps ∼41%
40.9 (35min) fps ∼48%
72.1 (57min) fps ∼62%
83 (67min) fps ∼64%
GeForce GTX 870M, 4700MQ
Schenker W504
26.8 (22min) fps ∼36%
37.4 (33min) fps ∼44%
73.8 (60min) fps ∼63%
85.7 (65min) fps ∼66%
Radeon HD 8970M, 4700MQ
Schenker W503
26.3 (21min) fps ∼35%
35 (28min) fps ∼41%
53.5 (39min) fps ∼46%
65.4 (50min) fps ∼51%
GeForce GTX 770M, 4700MQ
Schenker W503
19.8 (14min) fps ∼27%
27.7 (23min) fps ∼33%
66.1 (58min) fps ∼56%
80.7 (64min) fps ∼63%
GeForce GTX 860M, 4700MQ
Schenker W504
18.9 (14min) fps ∼25%
27 (24min) fps ∼32%
68.6 (58min) fps ∼59%
81.7 (66min) fps ∼63%
GeForce GTX 765M, 4700MQ
Schenker W503
21.1 (19min) fps ∼25%
56.9 (51min) fps ∼49%
81.3 (67min) fps ∼63%
GeForce GTX 850M, 4340M
Schenker M504
20.7 (18min) fps ∼24%
51.8 (41min) fps ∼44%
60.4 (47min) fps ∼47%
GeForce GT 750M, 4702MQ
Schenker M503
12.2 (10min) fps ∼14%
35.2 (30min) fps ∼30%
57.2 (51min) fps ∼44%
GeForce GT 740M, 4200M
HP Envy 15-j011sg
8.1 (6min) fps ∼10%
25 (21min) fps ∼21%
40.1 (33min) fps ∼31%
Radeon R7 512 Cores (Kaveri Desktop), A10-7850K, Samsung SSD 470 Series MZ-5PA256/EU
A10-7850K Asus A88-XM-PLUS
8.1 (5min) fps ∼10%
25.8 (22min) fps ∼22%
36.6 (28min) fps ∼28%
GeForce GT 720M, 4200M, WDC Scorpio Blue WD10JPVX-22JC3T0
MSI CX61-i572M
6.2 (0min) fps ∼7%
19.7 (0min) fps ∼17%
33.5 (0min) fps ∼26%
Iris Pro Graphics 5200, 4750HQ, Intel SSD 525 Series SSDMCEAC180B3
SCHENKER S413
6.1 (4min) fps ∼7%
21.9 (18min) fps ∼19%
33.1 (24min) fps ∼26%
Radeon HD 8650G, A10-5750M, Samsung SSD 470 Series MZ-5PA256/EU
Pumori Test Platform (A10-5750M)
15.8 (10min) fps ∼14%
22.1 (16min) fps ∼17%
HD Graphics 4600, 4700MQ
Schenker W503
3.6 (2min) fps ∼4%
14.1 (12min) fps ∼12%
24.4 (22min) fps ∼19%

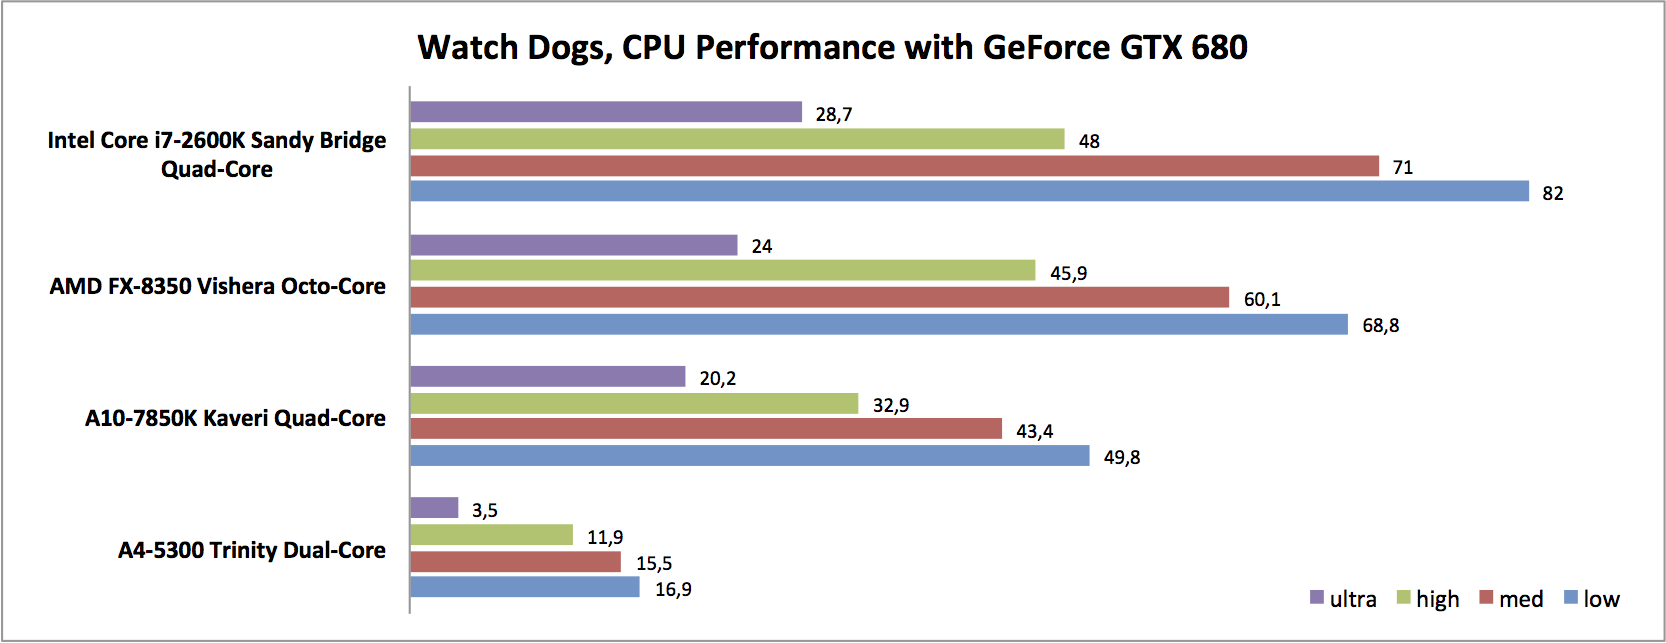
Processor Performance Benchmarks

We paired an Nvidia GeForce GTX 680 desktop graphics card with four different CPUs to evaluate the impact of differently powerful processors. Not even at minimum settings does the slow A4-5300 with a Piledriver module (2 integer, 1 FP core) reach smooth frame rates.

Furthermore, we concluded from the results of the octa-core FX-8650 (4 Piledriver modules) that the additional cores are used in comparison to the Kaveri quad-core. The Intel architecture, however, suits Watch Dogs best, as can be seen from the results of the older Sandy Bridge top model.

Benchmarks of a GeForce GTX 680 with different desktop CPUs.

Test Systems

Four of our test devices are courtesy of Schenker Technologies (mysn.de):

  • W504 (Core i7-4700MQ, 8 GB DDR3, GeForce GTX 860M, GTX 870M, GTX 880M)
  • W503 (Core i7-4700MQ, 8 GB DDR3, GeForce GTX 765M, GTX 770M, GTX 780M, Radeon HD 8970M)
  • M504 (Core i5-4340M, 8 GB DDR3, GeForce GTX 850M)
  • M503 (Core i7-4702MQ, 8 GB DDR3, GeForce GT 750M)

The 64-bit edition of Windows 7 is installed on each of these notebooks. Thanks to Micron for the 480 GB Crucial M500.

Another test device is courtesy of Nvidia:

  • HP Envy 15-j011sg (Core i5-4200M, 12 GB DDR3, GeForce GT 740M)

GPU drivers used: Nvidia 337.88, AMD 14.6 Beta, Intel 15.33.18.64.3496

Furthermore, we used benchmarks of other notebooks with possibly different drivers.

Overview

Show Restrictions
PosModel< PrevNext >Watch Dogs
 Watch Dogs (2014)
low
1024x768
Low Overall Quality, Medium Textures
med.
1366x768
Medium Overall Quality, Medium Textures
high
1920x1080
High Overall Quality, High Textures
2x MSAA
ultra
1920x1080
Ultra Overall Quality, Ultra Textures
4x MSAA
NVIDIA GeForce GTX 1080 SLI (Laptop)
75.6
67.1
NVIDIA GeForce GTX 1080 Mobile
75.1
74.5
NVIDIA GeForce GTX 980 SLI (Laptop)
106
94.3
78.5
69.3
NVIDIA GeForce GTX 1070 Mobile
67.1
57.7
NVIDIA GeForce GTX 980M SLI
108
92.9
72.5
52.4
NVIDIA GeForce GTX 980
94.9
82.3
47.5n4
38.45n4
NVIDIA GeForce GTX 980 (Laptop)
118.55n2
102.7n2
81.95n2
62n2
NVIDIA GeForce GTX 970M SLI
103.6
89.4
63.9
45.5
NVIDIA GeForce GTX 1060 (Desktop)
129
112
84.7
65.5
NVIDIA GeForce GTX 1060 Mobile
70.4
54.4
NVIDIA GeForce GTX 780 Ti
94.4
79.7
62.7
52.2
NVIDIA GeForce GTX 970
122.9
102
73.4
53.9
AMD Radeon R9 290X
45
35.4
NVIDIA GeForce GTX 980M
99.2n4
84.85n4
61n4
46.35n4
AMD Radeon R9 280X
73.6
60.6
46.4
34.6
NVIDIA GeForce GTX 960
89.7
76.4
52.8
34.4
NVIDIA GeForce GTX 970M
99n4
85.9n4
48.95n6
34.75n6
NVIDIA GeForce GTX 860M SLI
84.3
60
18.9
14.6
NVIDIA GeForce GTX 680
82
71
48
28.7
PosModel< PrevNext >Watch Dogs
low med. high ultra
AMD Radeon R9 M295X
55.3
46
37.7n2
28.15n2
AMD Radeon R7 370
96.3
101.2
38.58
28.41
NVIDIA GeForce GTX 880M
75.3n2
63.7n2
40.9n3
30.9n3
NVIDIA GeForce GTX 950
105.8
92
44
29.8
NVIDIA GeForce GTX 660 Ti
87.3
76
43.4
31.7
NVIDIA GeForce GTX 760
96.2
80.4
41.1
NVIDIA GeForce GTX 780M
83
72.1
40.9
30.4
NVIDIA Quadro K5100M
111.3
84.9
35.3
25.8
NVIDIA GeForce GTX 965M
83.7n3
73.9n3
36.9n3
19.3n3
NVIDIA GeForce GTX 870M
82.35n2
71.4n2
34.7n2
25.4n2
AMD Radeon HD 8970M
65.4
53.5
35
26.3
NVIDIA GeForce GTX 960M
74.85n4
61.35n4
29.1n4
15.4n4
NVIDIA GeForce GTX 750 Ti
85.7
72.4
29.4
NVIDIA GeForce GTX 770M
80.7
66.1
27.7
19.8
NVIDIA GeForce GTX 860M
61.6n4
53.2n4
26.8n4
18.9
NVIDIA GeForce GTX 950M
49.7n3
42.2n3
19.4n3
10.5n3
NVIDIA GeForce GTX 850M
63.2n3
52.8n3
20.8n3
15.75n2
AMD Radeon R9 M280X
22.8
20.3
12.6
NVIDIA GeForce 945M
65
53.2
19.4
13.7
NVIDIA GeForce GTX 765M
81.3
56.9
21.1
PosModel< PrevNext >Watch Dogs
low med. high ultra
NVIDIA Quadro K3100M
83.2
52.9
21.3
16.1
AMD Radeon R9 M265X
42.6
34.7n2
13.1n2
9.7n2
NVIDIA GeForce GT 750M
57.2
35.2
12.2
NVIDIA GeForce 940MX
49
29.6
NVIDIA Quadro K1100M
46.1
28.5
10.8
7.2
NVIDIA GeForce 940M
43.6n3
30.3n3
9.2n3
5.9n2
NVIDIA GeForce 840M
37.4n3
27.9n3
14.1n3
6.05n2
AMD Radeon R7 512 Cores (Kaveri Desktop)
36.6
25.8
8.1
Intel Iris Pro Graphics 5200
33.45n2
21.65n2
5.9n2
AMD Radeon R7 384 Cores (Kaveri Desktop)
34.1
24.5
8
NVIDIA GeForce GT 740M
40.1
25
8.1
NVIDIA GeForce 930M
40.4
25.8
7.9
4.8
NVIDIA GeForce 830M
18.8
14.9
NVIDIA GeForce GT 730M
35.5
21.9
6.2
AMD Radeon R7 M265
30.2
21.6
3.2
2.1
NVIDIA GeForce GT 640M
33.8
25.4
5.9
AMD Radeon R7 (Kaveri)
19
15.2
4.6
AMD Radeon R7 M360
31.1
20.3
6.4
3.3
NVIDIA GeForce 920M
35.5
22.6
7.4
4.1
AMD Radeon R7 M260
26.6
19
8.3
PosModel< PrevNext >Watch Dogs
low med. high ultra
Intel HD Graphics 530
19.2
13.3
6.8
4.8
AMD Radeon R6 (Kaveri)
17.5
Intel HD Graphics 5600
30.3
17.9
5.9
3.8
AMD Radeon HD 7660D
32.3
22.3
6.2
AMD Radeon HD 8650G
22.1
15.8
NVIDIA GeForce GT 630M
28
16.8
AMD Radeon R5 M330
26.1
16
AMD Radeon R5 M255
21.2
6.8
NVIDIA GeForce 820M
26.6n2
18.7n2
NVIDIA GeForce GT 720M
33.5
19.7
6.2
AMD Radeon R5 M240
20
15.9
AMD Radeon R5 M230
19.5
10.4
8.3
3.2
Intel HD Graphics 4600
24.4
14.1
3.6
Intel HD Graphics 5500
15.1n3
10.6n3
5.65n2
AMD Radeon HD 7660G
18.7
Intel HD Graphics 5000
17.55n2
11.25n2
AMD Radeon HD 8550G
20.3
14.8
Intel HD Graphics 4400
15.2n3
9.6n3
2.35n2
Intel HD Graphics 4000
12.7
AMD Radeon R5 (Beema/Carrizo-L)
9.5
7.3
2.1
0.7
PosModel< PrevNext >Watch Dogs
low med. high ultra
AMD Radeon R4 (Beema)
10.7
6.9
AMD Radeon R3 (Mullins/Beema)
10.9
8
Intel HD Graphics 4200
9.7
6.5
AMD Radeon HD 8450G
12.8
AMD Radeon HD 8350G
11.2
Intel HD Graphics (Haswell)
2.2
Intel HD Graphics (Bay Trail)
8.3
4.6
(-) * Smaller values are better. / n123 Number of benchmarks for this median value / * Approximate position


Legend
5Stutters – This game is very likely to stutter and have poor frame rates. Based on all known benchmarks using the specified graphical settings, average frame rates are expected to fall below 25fps
May Stutter – This graphics card has not been explicitly tested on this game. Based on interpolated information from surrounding graphics cards of similar performance levels, stutters and poor frame rates are expected.
30Fluent – Based on all known benchmarks using the specified graphical settings, this game should run at or above 25fps
40Fluent – Based on all known benchmarks using the specified graphical settings, this game should run at or above 35fps
60Fluent – Based on all known benchmarks using the specified graphical settings, this game should run at or above 58fps
May Run Fluently – This graphics card has not been explicitly tested on this game. Based on interpolated information from surrounding graphics cards of similar performance levels, fluent frame rates are expected.
?Uncertain – This graphics card experienced unexpected performance issues during testing for this game. A slower card may be able to achieve better and more consistent frame rates than this particular GPU running the same benchmark scene.
Uncertain – This graphics card has not been explicitly tested on this game and no reliable interpolation can be made based on the performances of surrounding cards of the same class or family.
The value in the fields displays the average frame rate of all values in the database. Move your cursor over the value to see individual results.
Read all 9 comments / answer
static version load dynamic
Loading Comments
Comment on this article
Please share our article, every link counts!
Florian Glaser, 2014-06- 1 (Update: 2021-05-18)