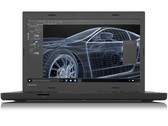


Dell Latitude 14 E5470 6440HQ Notebook Review
Workhorse with minor drawbacks. A business device for everyday use: This is where Dell comes in with its Latitude 14 E5470. Security features, strong processor, plenty of working memory, and a solid-state drive are installed. These are good prerequisites for a business laptop. However, not all that glitters is gold, and thus our review sample has to accept some criticism. Read just where these shortcomings are found in our in-depth report.
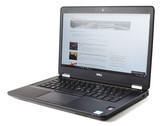
Intel Core i5-6440HQ, HD Graphics 530, 14", 1.9 kg