Notebook reviews with NVIDIA GeForce MX330 graphics card
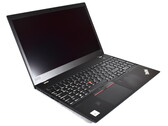
Lenovo ThinkPad T15 Gen 1 Laptop Review: Foiled by lack of AMD option
This year's T-series ThinkPads have only received minor updates. Nevertheless, the smaller 14-inch models have improved quite a bit in regard to performance thanks to AMD Ryzen 4000. This cannot be said about the larger ThinkPad T15 Gen 1 though as it lacks the Renoir option entirely and has to make do with Intel's Comet Lake. Our extensive review revealed that this can be a major show-stopper for the large T-series ThinkPad.
Intel Core i7-10510U, NVIDIA GeForce MX330, 15.6", 1.8 kgHP Envy 17t (Core i7-1065G7, Nvidia MX330, 4K) Laptop Review
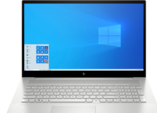
The HP Envy 17t is a well-crafted 17-inch laptop, but its beauty is only skin deep. Some of its components are major standouts, most notably the screen. While it is a competent laptop capable of crunching through office tasks and light graphical or gaming loads, it is held back by a few grating annoyances.
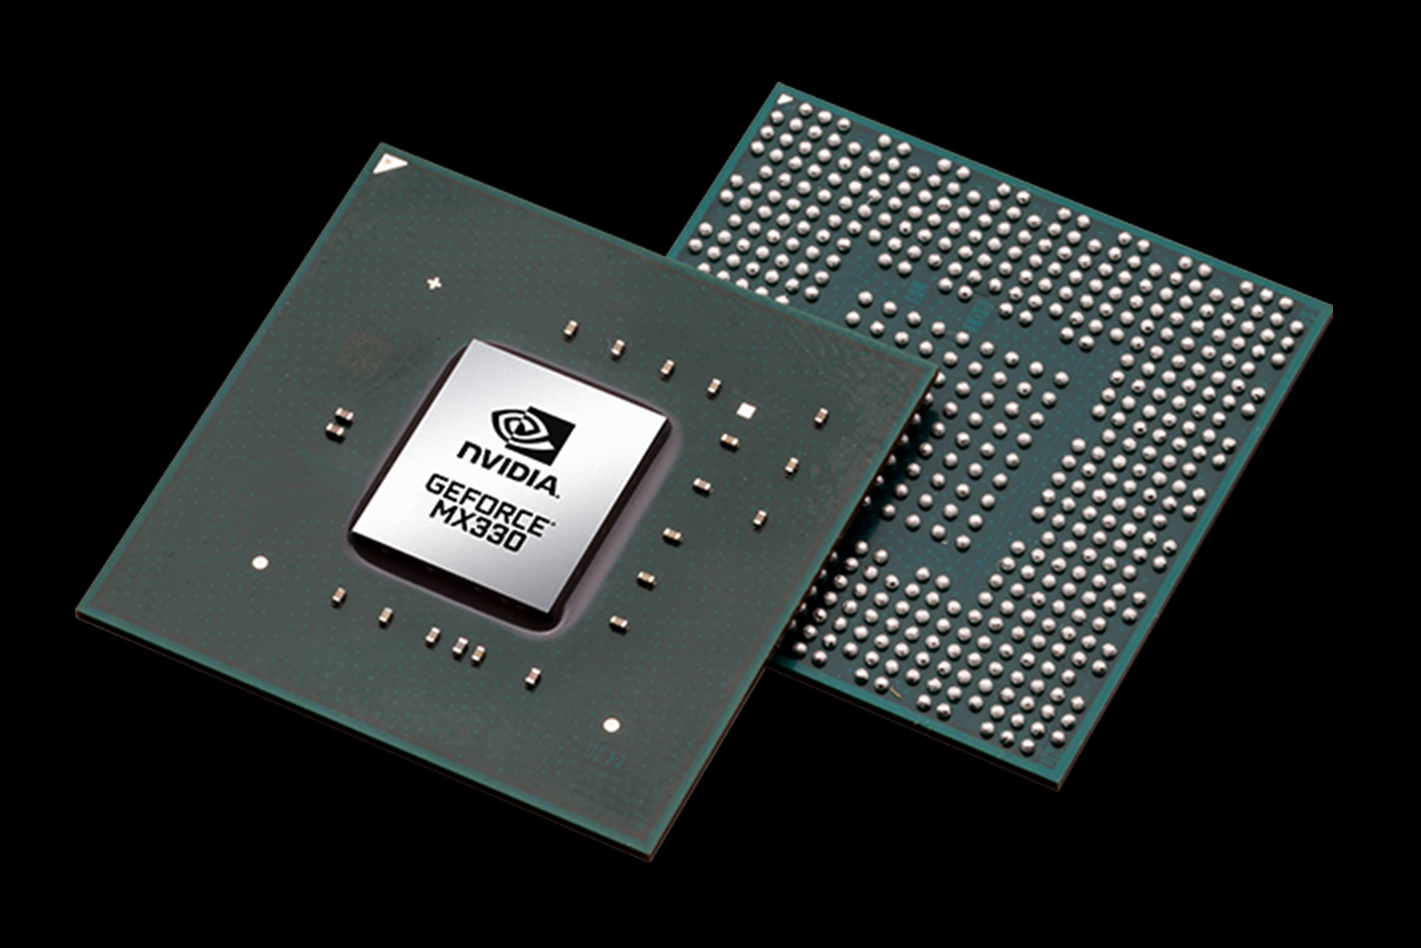
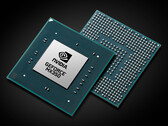
Intel Core i7-1065G7, NVIDIA GeForce MX330, 17.3", 2.7 kgNvidia GeForce MX330 and MX350 in review: Known architecture - New name
Nvidia is retiring the GeForce MX230 and MX250, replacing them with slightly faster models. We've taken a closer look at the two new entry-level GPUs, and in this review, you'll learn about their expected performance.
Intel Core i7-10510U, NVIDIA GeForce MX330, 14", 1.3 kgAcer Chromebook Spin 713 CP713-3W-5102: Intel Core i5-1135G7, 13.50", 1.4 kg
External Review » Acer Chromebook Spin 713 CP713-3W-5102
Acer Enduro Urban N3 EUN314-51WG-74PB: Intel Core i7-1165G7, 14.00", 1.9 kg
External Review » Acer Enduro Urban N3 EUN314-51WG-74PB
Dell Vostro 14 3401, i7-1165G7: Intel Core i7-1165G7, 14.00", 1.6 kg
External Review » Dell Vostro 14 3401, i7-1165G7
Asus ExpertBook B1 B1500C, i5-1135G7 MX330: Intel Core i5-1135G7, 15.60", 1.7 kg
External Review » Asus ExpertBook B1 B1500C, i5-1135G7 MX330
Asus ExpertBook B1 B1400C, 1165G7 MX330: Intel Core i7-1165G7, 14.00", 1.5 kg
External Review » Asus ExpertBook B1 B1400C, 1165G7 MX330
Asus ExpertBook B1 B1500C, i7-1165G7 MX330: Intel Core i7-1165G7, 15.60", 1.7 kg
External Review » Asus ExpertBook B1500C, i7-1165G7 MX330
Asus VivoBook X515EP, i5-1135G7 MX330: Intel Core i5-1135G7, 15.60", 1.8 kg
External Review » Asus VivoBook X515EP, i5-1135G7 MX330
Asus Vivobook 15 K513EP-EJ104T: Intel Core i7-1165G7, 15.60", 1.8 kg
External Review » Asus Vivobook 15 K513EP-EJ104T
Asus VivoBook 15 S512JP-EJ015: Intel Core i5-1035G1, 15.60", 1.8 kg
External Review » Asus VivoBook 15 S512JP-EJ015
Asus VivoBook Ultra 14 K413JP-EK070T: Intel Core i5-1035G1, 14.00", 1.4 kg
External Review » Asus VivoBook Ultra 14 K413JP-EK070T
HP Envy 17-cg0033nf : Intel Core i7-1065G7, 17.30", 2.8 kg
External Review » HP Envy 17-cg0033nf
Dell Inspiron 14 5406, i5-1135G7 MX330: Intel Core i5-1135G7, 14.00", 1.7 kg
External Review » Dell Inspiron 14 5406, i5-1135G7 MX330
Dell Vostro 15 5501: Intel Core i5-1035G1, 15.60", 1.7 kg
External Review » Dell Vostro 15 5501
Acer Aspire 3 A315-57G-59LG: Intel Core i5-1035G1, 15.60", 1.9 kg
External Review » Acer Aspire 3 A315-57G-59LG
Lenovo Yoga Slim 7i Carbon: Intel Core i7-1165G7, 13.30", 1 kg
External Review » Lenovo Yoga Slim 7i Carbon
Dell Inspiron 15 5501-FV9G2: Intel Core i5-1035G1, 15.60", 1.7 kg
External Review » Dell Inspiron 15 5501-FV9G2
Asus VivoBook 15 X512JP EJ228T: Intel Core i7-1065G7, 15.60", 1.8 kg
External Review » Asus VivoBook 15 X512JP EJ228T
Asus VivoBook Ultra 14 K413: Intel Core i5-1035G1, 14.00", 1.4 kg
External Review » Asus VivoBook Ultra 14 K413
Asus Vivobook 14 A409JP-EK502T: Intel Core i5-1035G1, 14.00", 1.6 kg
External Review » Asus Vivobook 14 A409JP-EK502T
MSI Modern 14 A10RAS-870XES: Intel Core i7-10510U, 14.00", 1.2 kg
External Review » MSI Modern 14 A10RAS-870XES
Asus VivoBook 14 A413, i5-10210U MX330: Intel Core i5-10210U, 14.00", 1.4 kg
External Review » Asus VivoBook 14 A413, i5-10210U MX330
HP Envy x360 15-ed0900ng: Intel Core i7-10510U, 15.60", 1.9 kg
External Review » HP Envy x360 15-ed0900ng
Lenovo IdeaPad Flex 5i: Intel Core i7-1065G7, 14.00"
External Review » Lenovo IdeaPad Flex 5i
Lenovo IdeaPad Flex 5 14IIL05-81X1001BGE: Intel Core i5-1035G1, 14.00", 1.5 kg
External Review » Lenovo IdeaPad Flex 5 14IIL05-81X1001BGE
HP 17-by3268ng: Intel Core i7-1065G7, 17.30", 2.4 kg
External Review » HP 17-by3268ng
MSI Modern 14 A10RAS-1049XES: Intel Core i7-10510U, 14.00", 1.2 kg
External Review » MSI Modern 14 A10RAS-1049XES
MSI Modern 15 A10RAS-089XES: Intel Core i5-10210U, 15.60", 1.6 kg
External Review » MSI Modern 15 A10RAS-089XES
HP 17-by3250ng: Intel Core i5-1035G1, 17.30", 2.4 kg
External Review » HP 17-by3250ng
HP Envy 17-cg0001ng: Intel Core i5-1035G1, 17.30", 2.7 kg
External Review » HP Envy 17-cg0001ng
HP Envy 17-cg0220ng: Intel Core i7-1065G7, 17.30", 2.7 kg
External Review » HP Envy 17-cg0220ng
MSI Modern 14 A10RAS-871XES: Intel Core i7-10510U, 14.00"
External Review » MSI Modern 14 A10RAS-871XES
Lenovo IdeaPad 3 17IML05-81WC0048GE: Intel Core i7-10510U, 17.30", 2.2 kg
External Review » Lenovo IdeaPad 3 17IML05-81WC0048GE
HP Envy 17t-cg000: Intel Core i7-1065G7, 17.30", 2.7 kg
External Review » HP Envy 17t-cg000
MSI Prestige 14 A10RC: Intel Core i7-10510U, 14.00", 1.3 kg
External Review » MSI Prestige 14 A10RC
Lenovo ThinkPad T15 Gen1-20S7S02U00: Intel Core i7-10510U, 15.60", 1.8 kg
» ThinkPad T15 review shows that Lenovo should be offering all of its ThinkPad laptop with AMD Ryzen 4000