Notebook reviews with NVIDIA GeForce MX350 graphics card
Lenovo V17 G2 review: 17-inch laptop with unrewarding MX350
With its 17-inch display, Nvidia graphics, and Intel's Core i7 CPU, Lenovo's V17 G2 is well suited for office and multimedia tasks, including simple gaming. Our review shows whether the additional premium for the top equipment is worthwhile for the otherwise affordable laptop.
Intel Core i7-1165G7, NVIDIA GeForce MX350, 17.3", 2.2 kgAsus Vivobook 15 K513EQ OLED laptop review: The Lenovo IdeaPad alternative
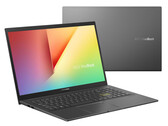
The VivoBook 15 K513 offers an amazing bang for the buck with its OLED display, 11th gen Intel CPU, and discrete Nvidia graphics all for under $950 USD. Though solid on paper, a few cut corners prevent it from reaching the same levels of a ZenBook.
Intel Core i7-1165G7, NVIDIA GeForce MX350, 15.6", 1.6 kgXiaomi Mi NoteBook 14 Horizon Edition Laptop Review: Cost-cutting not done right
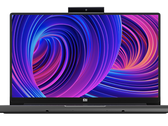
With the Mi NoteBook 14 Horizon Edition, Xiaomi aims to lower the entry point for a capable multimedia laptop. While the pricing seems right for a Core i7 Comet Lake device with discrete Nvidia MX350 graphics, it comes with several compromises. How do they affect overall usage? Let's find out.
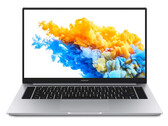
Intel Core i7-10510U, NVIDIA GeForce MX350, 14", 1.4 kgHonor MagicBook Pro review: Compact 16.1-inch allrounder with a good battery life
The MagicBook Pro offers a well-rounded level of equipment: a Core i5 processor, a GeForce MX350 GPU, 16 GB of working memory (dual-channel mode), an NVMe SSD, and a matte IPS display. All this is accompanied by a very good battery life.
Intel Core i5-10210U, NVIDIA GeForce MX350, 16.1", 1.7 kgDell Inspiron 14 7400 Laptop Review: Portable office laptop with a Tiger Lake CPU
The Inspiron 14 7400 is small and light. It also comes with a superb display. In combination with a Tiger Lake CPU and Nvidia’s GeForce MX350, the Inspiron 14 can be a very good office laptop. But is it? Read our review to find out.
Intel Core i7-1165G7, NVIDIA GeForce MX350, 14.5", 1.3 kgAcer Aspire 5 A517-52G-79Z5: Intel Core i7-1165G7, 17.30", 2.2 kg
Review » Acer Aspire 5 A517 laptop review: Attractive 17.3-incher with Tiger Lake CPU and MX350 GPU
Asus VivoBook S15 S533EQ-BQ002T: Intel Core i7-1165G7, 15.60", 1.8 kg
Review » Asus VivoBook S15 S533EQ in review: Elegant all-rounder with equipment weaknesses
Huawei MateBook 14 2020 Intel: Intel Core i7-10510U, 14.00", 1.5 kg
Review » Huawei MateBook 14 2020 laptop review: 3:2 clamshell convinces both with Intel and AMD CPUs
HP Envy 13-ba0001ng: Intel Core i7-10510U, 13.30", 1.3 kg
Review » HP Envy 13 Laptop Review: Elegant metal case and solid performance
Lenovo Yoga Slim 7-14IIL05: Intel Core i7-1065G7, 14.00", 1.4 kg
Review » Lenovo Yoga Slim 7 14 laptop review - With Nvidia GPU against AMD
Lenovo IdeaPad 5 15IIL05: Intel Core i5-1035G1, 15.60", 1.7 kg
Review » Lenovo IdeaPad 5 15IIL05 Review: Good performance and a long battery life - thanks to the 70-Wh battery
MSI Prestige 14 A10RD: Intel Core i7-10510U, 14.00"
Review » Nvidia GeForce MX330 and MX350 in review: Known architecture - New name
Acer Aspire 5 A514-54G, i3-1115G4 MX350: Intel Core i3-1115G4, 14.00", 1.7 kg
External Review » Acer Aspire 5 A514-54G, i3-1115G4 MX350
Acer Aspire 5 A515-56G-78TR: Intel Core i7-1165G7, 15.60", 1.7 kg
External Review » Acer Aspire 5 A515-56G-78TR
MSI Modern 14 B10RBSW-257XFR: Intel Core i7-10510U, 14.00", 1.3 kg
External Review » MSI Modern 14 B10RBSW-257XFR
Lenovo V17 G2 ITL-82NX00EUGE: Intel Core i7-1165G7, 17.30", 2.2 kg
External Review » Lenovo V17 G2 ITL-82NX00EUGE
Acer Aspire 5 A514-54G-743J: Intel Core i7-1165G7, 14.00", 1.7 kg
External Review » Acer Aspire 5 A514-54G-743J
Dell Vostro 15 3510, i7-1165G7 MX350: Intel Core i7-1165G7, 15.60", 1.7 kg
External Review » Dell Vostro 15 3510, i7-1165G7 MX350
Asus Vivobook 15 K513EQ: Intel Core i7-1165G7, 15.60", 1.6 kg
External Review » Asus Vivobook 15 K513EQ
Asus VivoBook 14 S433JQ-EB166: Intel Core i5-1035G1, 14.00", 1.5 kg
External Review » Asus VivoBook 14 S433JQ-EB166
Asus VivoBook S14 S433JQ-EB166T: Intel Core i5-1035G1, 14.00", 1.4 kg
External Review » Asus VivoBook S14 S433JQ-EB166T
Acer Aspire 5 A514-54G-58R8: Intel Core i5-1135G7, 14.00", 1.7 kg
External Review » Acer Aspire 5 A514-54G-58R8
Asus VivoBook Ultra 14 K413EQ-EK115T: Intel Core i7-1165G7, 14.00"
External Review » Asus VivoBook Ultra 14 K413EQ-EK115T
HP Pavilion 14-dv0006ns: Intel Core i5-1135G7, 14.00", 1.4 kg
External Review » HP Pavilion 14-dv0006ns
Acer Swift 5 SF514-55GT-72L0: Intel Core i7-1165G7, 14.00", 1.1 kg
External Review » Acer Swift 5 SF514-55GT-72L0
Honor MagicBook Pro 10210U: Intel Core i5-10210U, 16.10", 1.7 kg
External Review » Honor MagicBook Pro 10210U
Asus VivoBook S14 S433JQ-EB163: Intel Core i5-1035G1, 14.00", 1.4 kg
External Review » Asus VivoBook S14 S433JQ-EB163
Acer Aspire 5 A515-56G-51YF: Intel Core i5-1135G7, 15.60", 1.7 kg
External Review » Acer Aspire 5 A515-56G-51YF
Lenovo IdeaPad Slim 7 14IIL05-82A4000MUS: Intel Core i5-1035G1, 14.00", 1.5 kg
External Review » Lenovo IdeaPad Slim 7 14IIL05-82A4000MUS
Lenovo Yoga Slim 7 14IIL05-82A10076GE: Intel Core i5-1035G1, 14.00", 1.5 kg
External Review » Lenovo Yoga Slim 7 14IIL05-82A10076GE
MSI Modern 14 B10RBSW-064XES: Intel Core i7-10510U, 14.00", 1.3 kg
External Review » MSI Modern 14 B10RBSW-064XES
Acer Swift 5 SF514-55GT-79BM: Intel Core i7-1165G7, 14.00", 1 kg
External Review » Acer Swift 5 SF514-55GT-79BM
Asus VivoBook S15 S533EQ-BQ002T: Intel Core i7-1165G7, 15.60", 1.8 kg
External Review » Asus VivoBook S15 S533EQ-BQ002T
Acer Book RS Porsche Design AP714-51GT-71A4: Intel Core i7-1165G7, 14.00", 1.3 kg
External Review » Acer Book RS Porsche Design AP714-51GT-71A4
Lenovo Ideapad Slim 5 14IIL05: Intel Core i7-1065G7, 14.00", 1.6 kg
External Review » Lenovo Ideapad Slim 5 14IIL05
Huawei MateBook 14 2020 Intel: Intel Core i7-10510U, 14.00", 1.5 kg
External Review » Huawei MateBook 14 2020 Intel
HP Envy 13-ba0004ns: Intel Core i7-10510U, 13.30", 1.3 kg
External Review » HP Envy 13-ba0004ns
Asus VivoBook S14 S433JQ i5-1035G1: Intel Core i5-1035G1, 14.00", 1.5 kg
External Review » Asus VivoBook S14 S433JQ i5-1035G1
Lenovo Ideapad Slim 5i 15IIL05-81YK003SHH: Intel Core i7-1065G7, 15.60", 1.7 kg
External Review » Lenovo Ideapad Slim 5i 15IIL05-81YK003SHH
Xiaomi RedmiBook 16 i7-1065G7, MX350: Intel Core i7-1065G7, 16.10", 1.8 kg
External Review » Xiaomi RedmiBook 16 i7-1065G7, MX350
Huawei MateBook 14 KLVC-WFE9L: Intel Core i7-10510U, 14.00", 1.5 kg
External Review » Huawei MateBook 14 KLVC-WFE9L
Huawei MateBook 14 (2020): Intel Core i5-10210U, 14.00", 1.5 kg
External Review » Huawei MateBook 14 (2020)
Asus ZenBook 14 Q407IQ: AMD Ryzen 5 4500U, 14.00", 1.2 kg
External Review » Asus ZenBook 14 Q407IQ
Lenovo IdeaPad 5 15IIL05: Intel Core i5-1035G1, 15.60", 1.7 kg
External Review » Lenovo IdeaPad 5 15IIL05
Lenovo Yoga Slim 7-14IIL05: Intel Core i7-1065G7, 14.00", 1.4 kg
External Review » Lenovo Yoga Slim 7-14IIL05
HP Envy 13-ba0005ns: Intel Core i7-10510U, 13.30", 1.3 kg
External Review » HP Envy 13-ba0005ns
Acer Swift 5 SF514-54GT-72NT: Intel Core i7-1065G7, 14.00", 1 kg
External Review » Acer Swift 5 SF514-54GT-72NT
Acer Aspire A514-53G-55A8: Intel Core i5-1035G1, 14.00", 1.6 kg
External Review » Acer Aspire A514-53G-55A8
Xiaomi Mi NoteBook 14 Horizon Edition: Intel Core i7-10510U, 14.00", 1.4 kg
External Review » Xiaomi Mi NoteBook 14 Horizon, i7-10510U
Acer Swift 3 SF313-52G-54JU: Intel Core i5-1035G1, 13.50", 1.2 kg
External Review » Acer Swift 3 SF313-52G-54JU
Asus ZenBook 14 UM433IQ-A5026T: AMD Ryzen 7 4700U, 14.00", 1.2 kg
External Review » Asus ZenBook 14 UM433IQ-A5026T
Lenovo V17 G2 ITL-82NX00EUGE: Intel Core i7-1165G7, 17.30", 2.2 kg
» Lenovo V17 G2 reviewed: The 17-inch laptop is affordable when going without the MX350
Asus Vivobook 15 K513EQ: Intel Core i7-1165G7, 15.60", 1.6 kg
» 2021 Asus VivoBook 15 sets a new display standard for budget laptops with its outstanding 1080p OLED panel
Honor MagicBook Pro 10210U: Intel Core i5-10210U, 16.10", 1.7 kg
» Honor MagicBook Pro with AMD or Intel/Nvidia?
Dell Inspiron 14 7400-VY8JW: Intel Core i7-1165G7, 14.50", 1.3 kg
» Dell Inspiron 14 7400: Tiger Lake processor plus a good screen equals a great laptop
Asus VivoBook S15 S533EQ-BQ002T: Intel Core i7-1165G7, 15.60", 1.8 kg
» The Asus VivoBook S15 S533EQ comes with a Thunderbolt 4 port
Huawei MateBook 14 2020 Intel: Intel Core i7-10510U, 14.00", 1.5 kg
» Outdated Comet Lake CPU in the Huawei MateBook 14 is only convincing when it comes to battery life
Lenovo Yoga Slim 7-14IIL05: Intel Core i7-1065G7, 14.00", 1.4 kg
» The Lenovo Yoga Slim 7 14 with the Nvidia GPU is better for gaming
Lenovo IdeaPad 5 15IIL05: Intel Core i5-1035G1, 15.60", 1.7 kg
» The Lenovo Ideapad 5 15IIL05 comes close to entry-level gaming notebooks with its GeForce MX350 GPU