Notebookcheck Logo

Starfield in test: Laptop and desktop benchmarks

Off to the stars. After The Elder Scrolls and Fallout, Bethesda is following in the footsteps of Mass Effect and its ilk. The sci-fi adventure should thrill RPG fans with its gigantic dimensions. Whether the graphics requirements are also gigantic can be found out in our benchmark check.
Starfield

Test notebooks

XMG Neo 17 E23 (RTX 4090)
Schenker Key 17 Pro E23 (RTX 4080)
XMG Pro 15 E23 (RTX 4070 & RTX 4060)
XMG Focus 15 E23 (RTX 4050)
Asus ROG Strix Scar 17 (RTX 3080 Ti)
Acer Predator Helios 300 (RTX 3070 Ti)
Asus ROG Zephyrus G14 (RX 6800S & 680M)
 

We are currently running our gaming benchmarks with these notebooks. Clicking on the photos will take you to the respective manufacturer's homepage. All other test systems (tower PCs, mini PCs, ...) are listed at the end of the article.

Technology

Starfield has received quite high ratings from the press. If you take the basic tenor of the user ratings so far, the conclusion is rather "solid to good, but not outstanding". Our benchmark article is primarily dedicated to the technical side of the game.

Starfield
Starfield
Starfield
Starfield
Starfield
Starfield

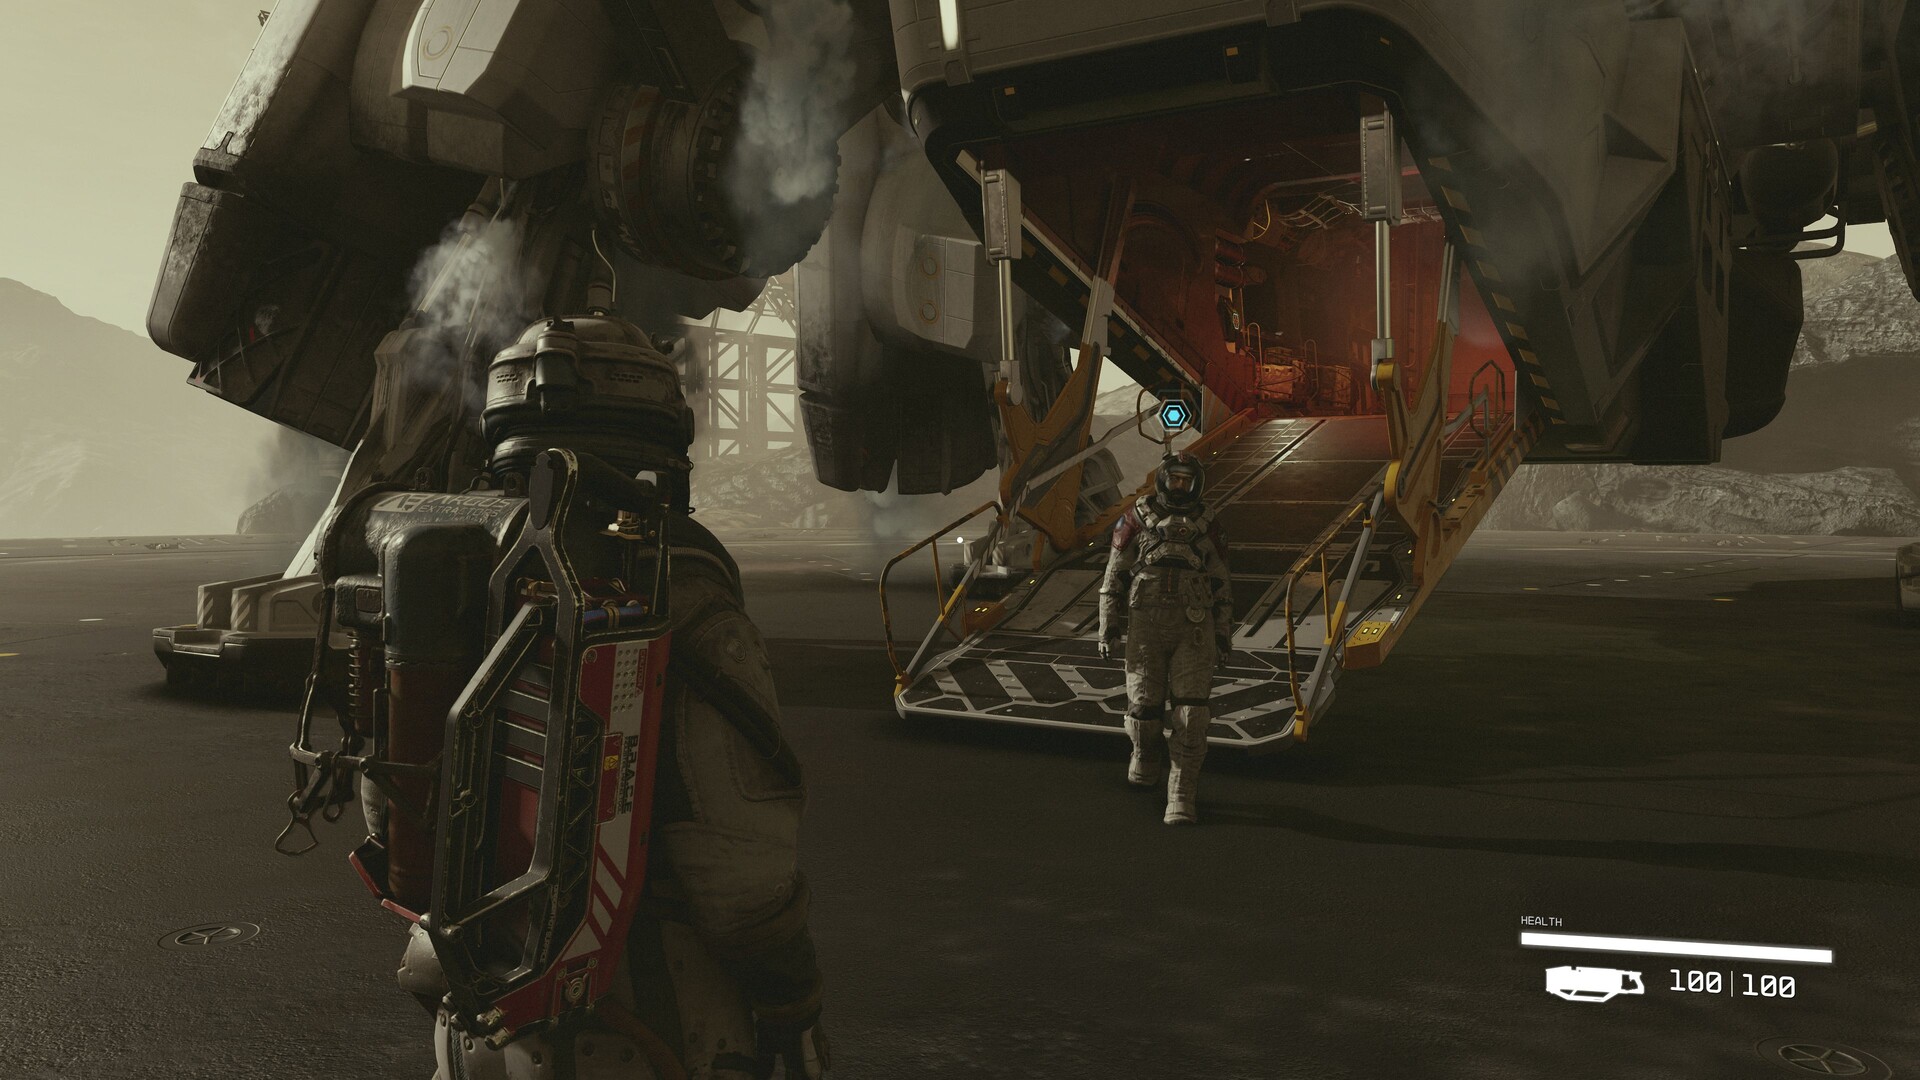
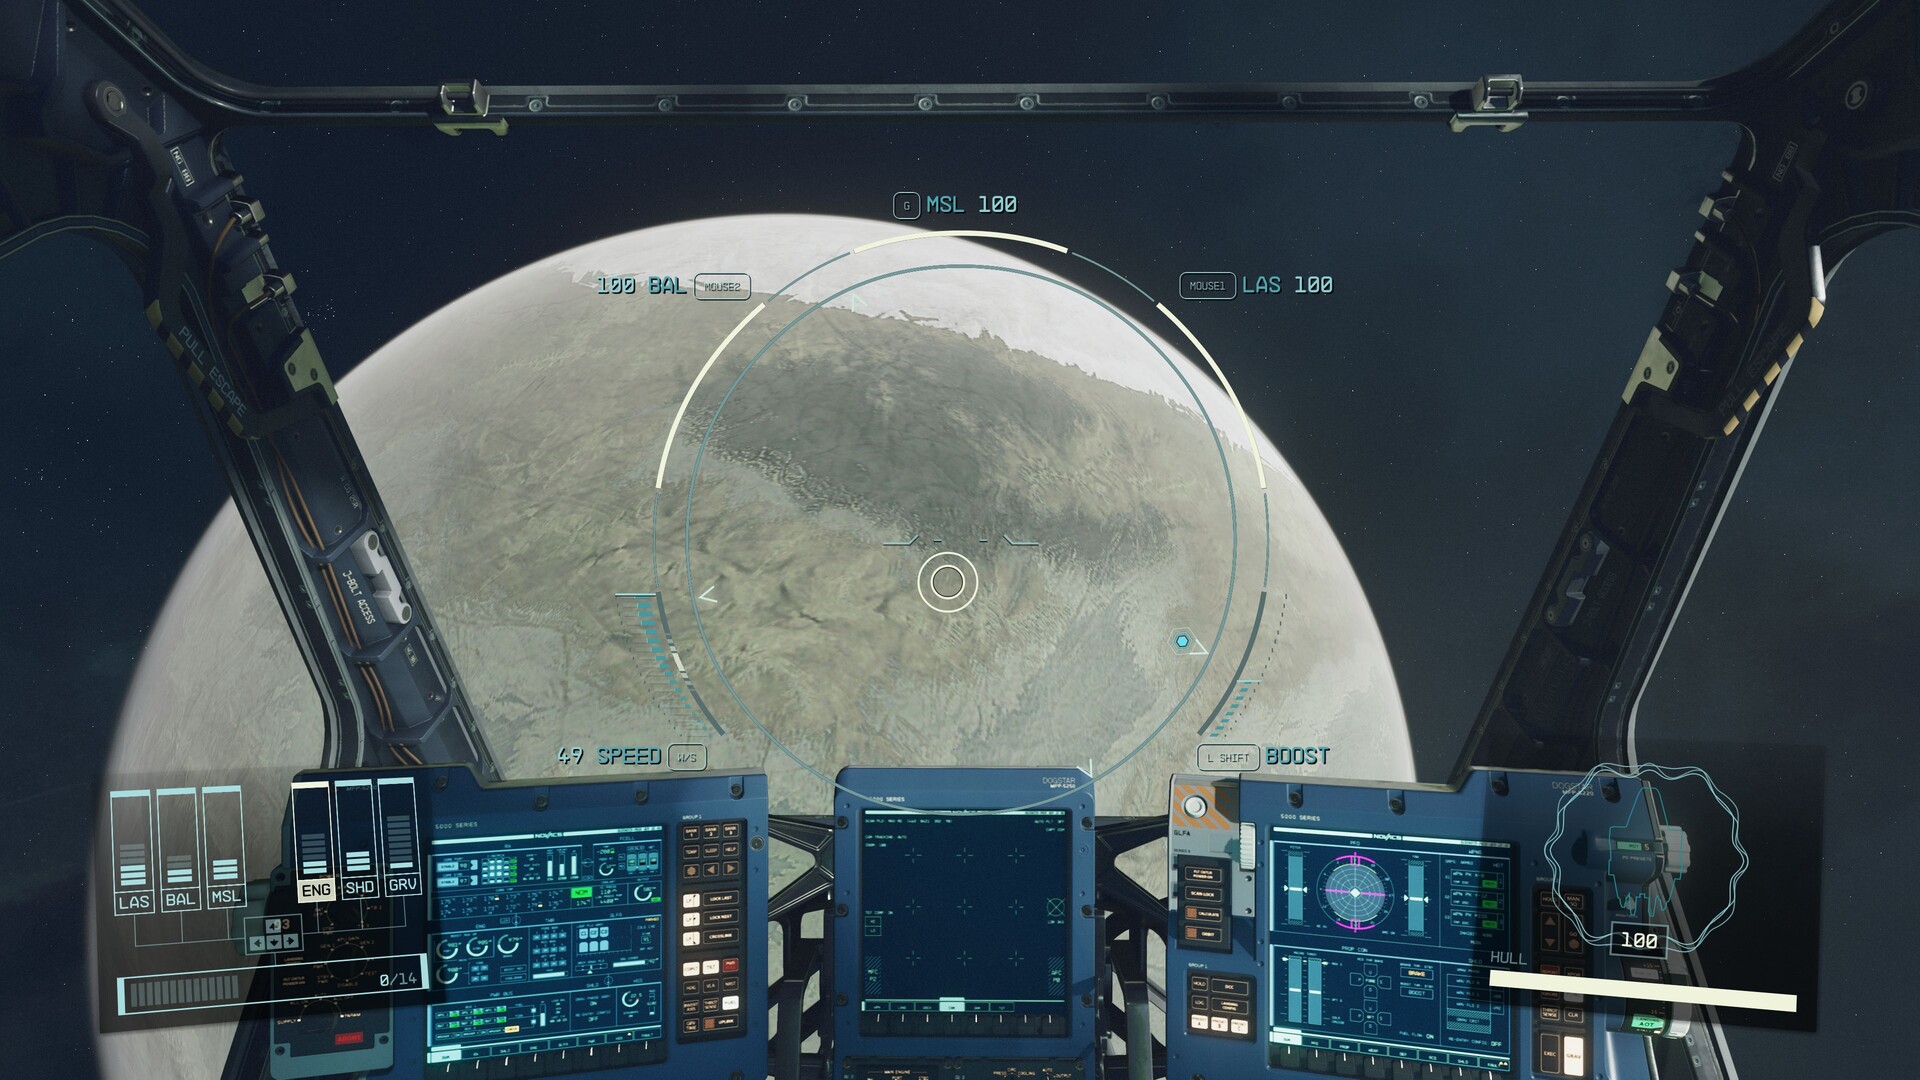
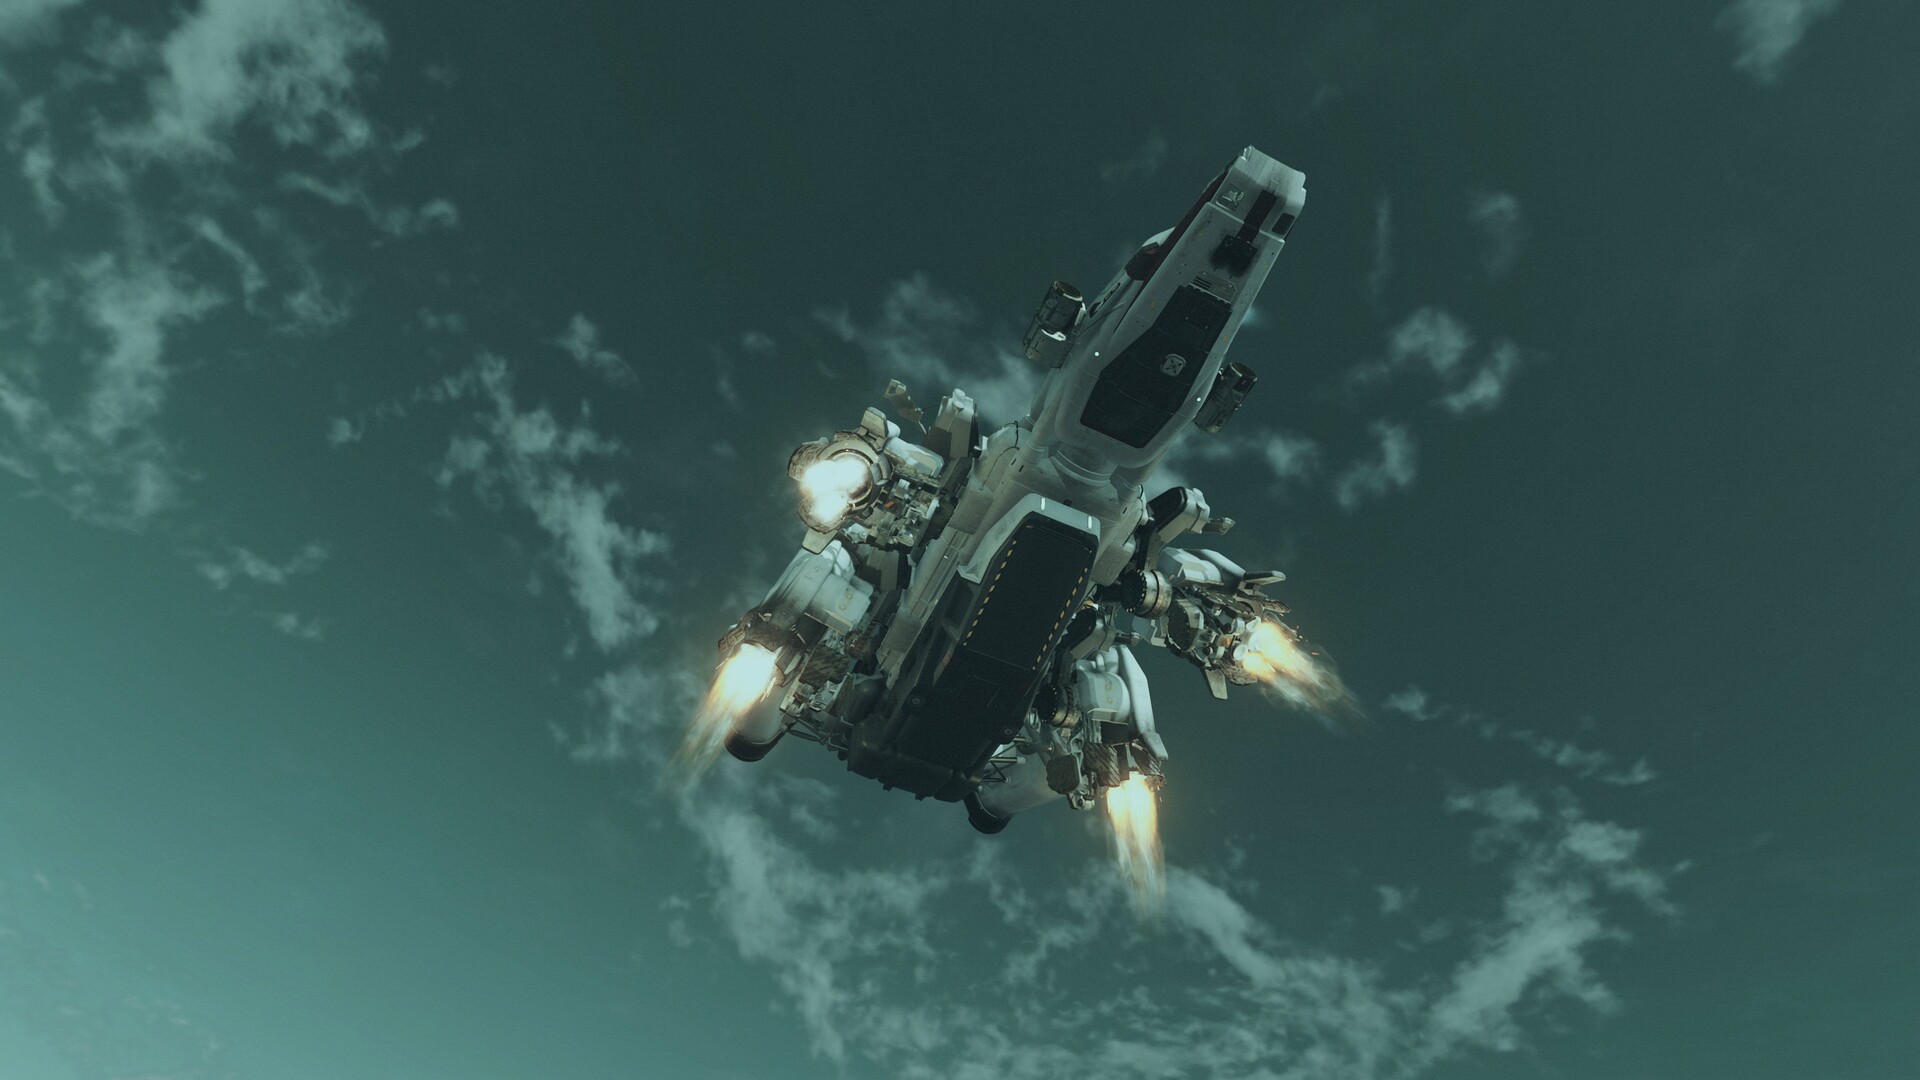
Bethesda uses its own Creation Engine 2, which is based on DirectX 12. The engine's strengths include a lush wide view (although details tend to disappear in the distance and thus leave a lot to be desired) and crisp textures. On the higher quality levels, object surfaces usually look quite sharp.

Starfield
Starfield
Starfield
Starfield
Starfield
Starfield

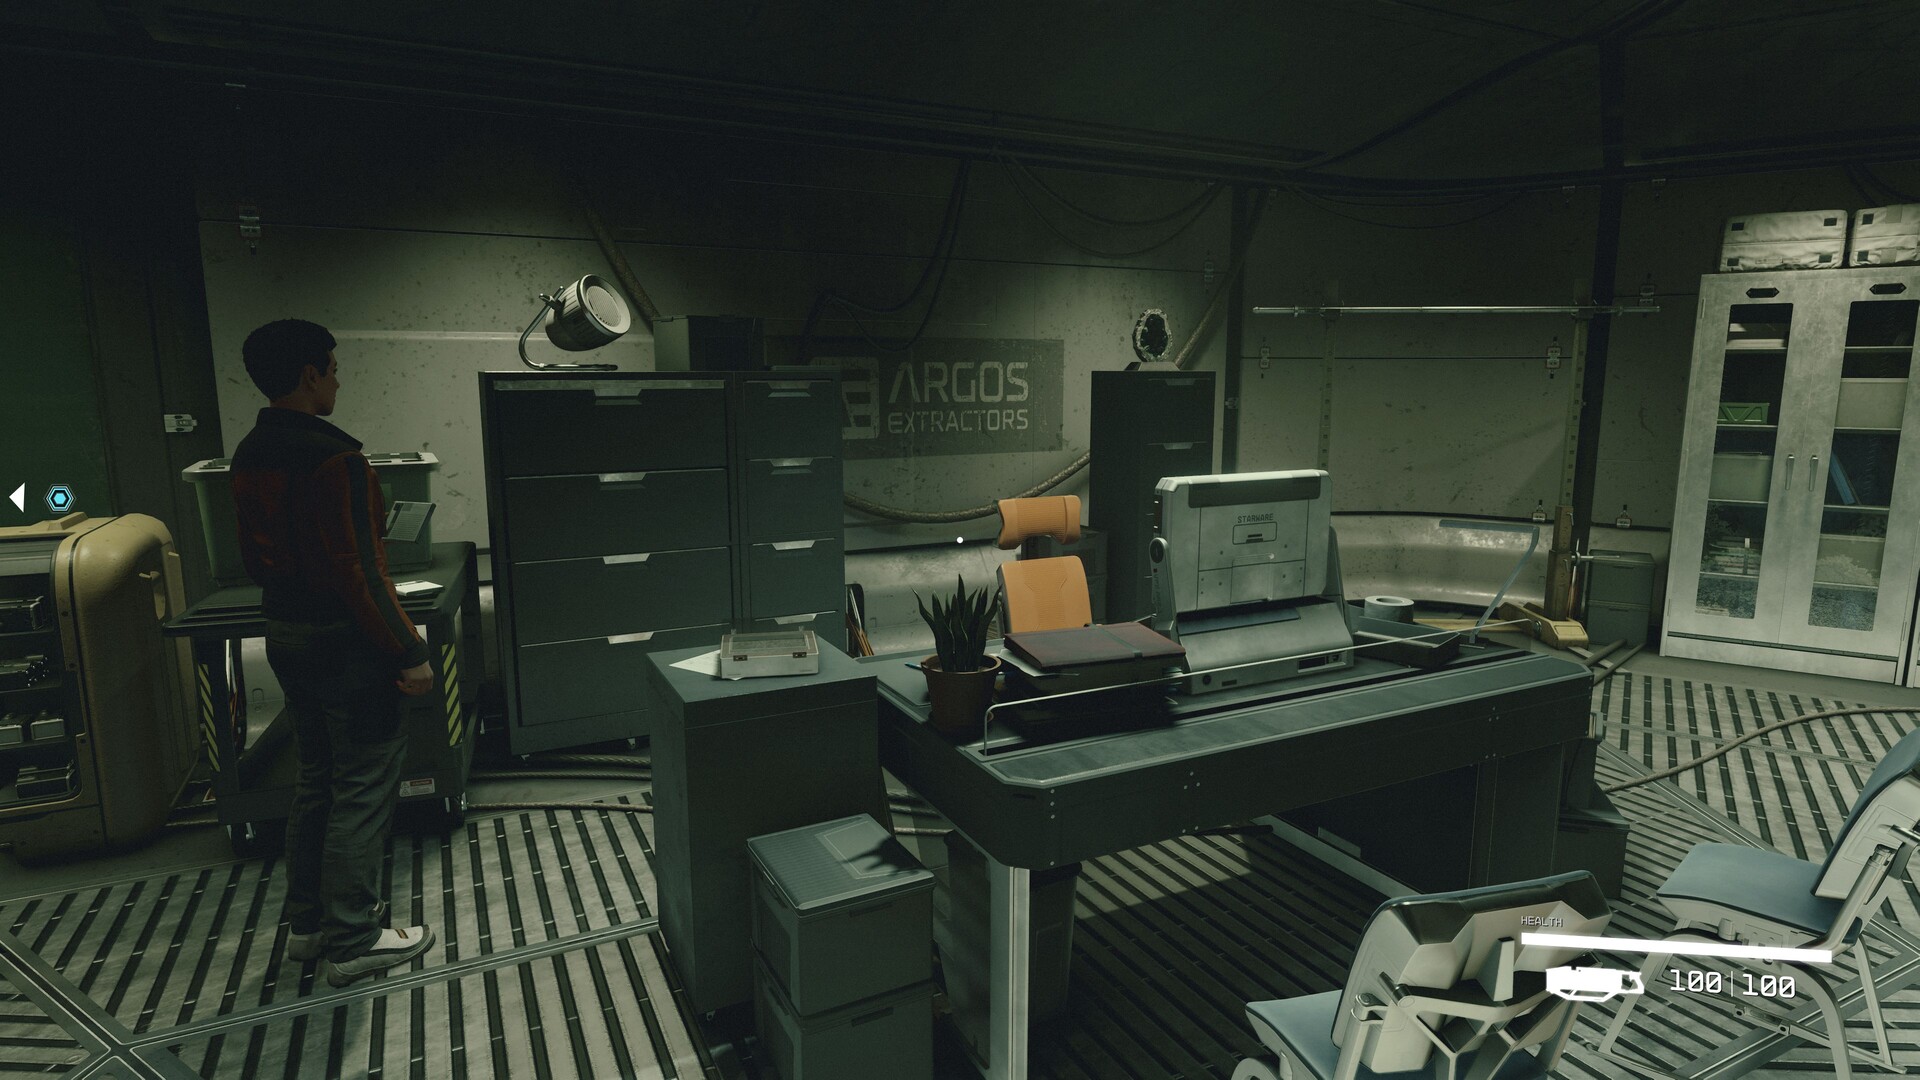
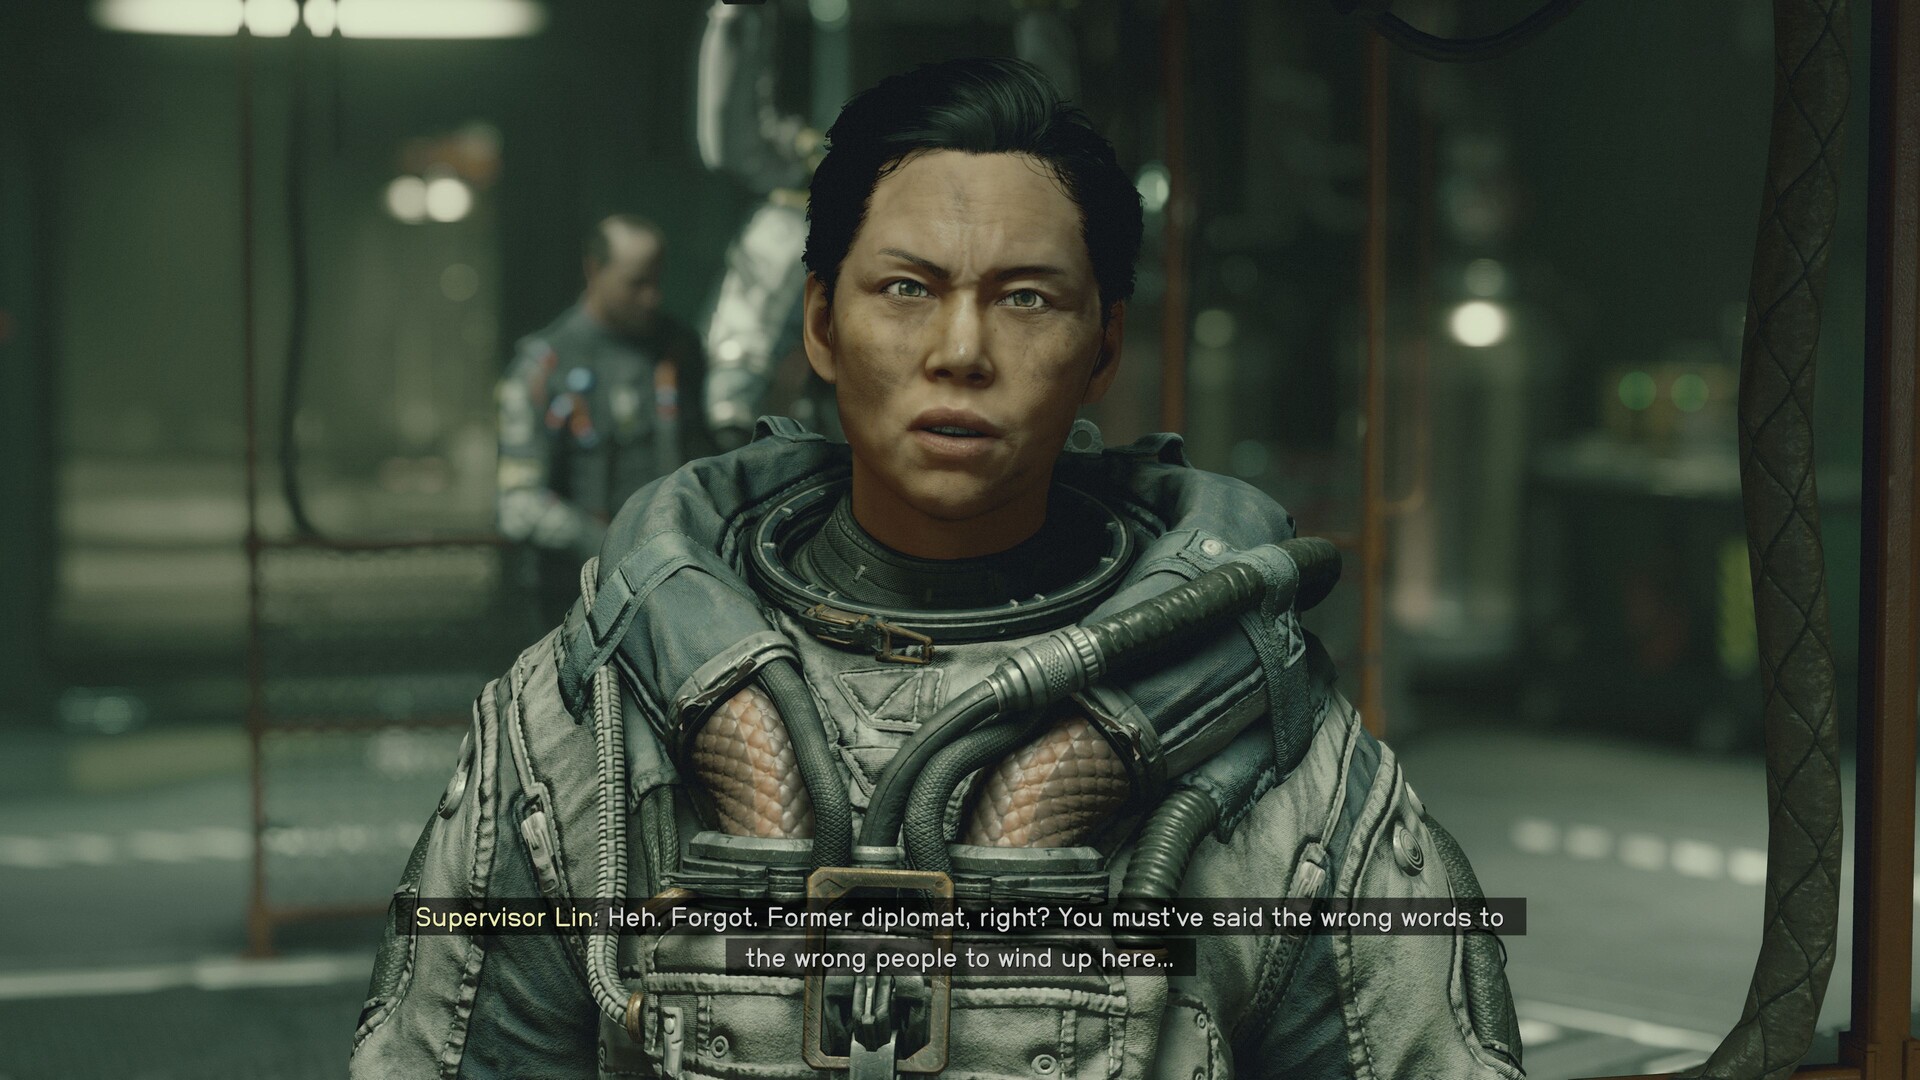
As is typical for Bethesda, there are weaknesses in the animations, the pathfinding, the AI and the facial expressions. The fact that the game often has to load when switching between different zones is also a bit annoying and a pity, but the duration of the loading times is okay. The "Building Shaders" process during the initial launch also doesn't take too much time. Players will be busy with the pure download for much longer. However, around 86 GB is no longer a big surprise in 2023 and is still acceptable considering the size of the world. Starfield currently takes up almost 116 GB on the hard drive, which is also an above-average value.

Starfield
Starfield
Starfield
Starfield
Starfield
Starfield

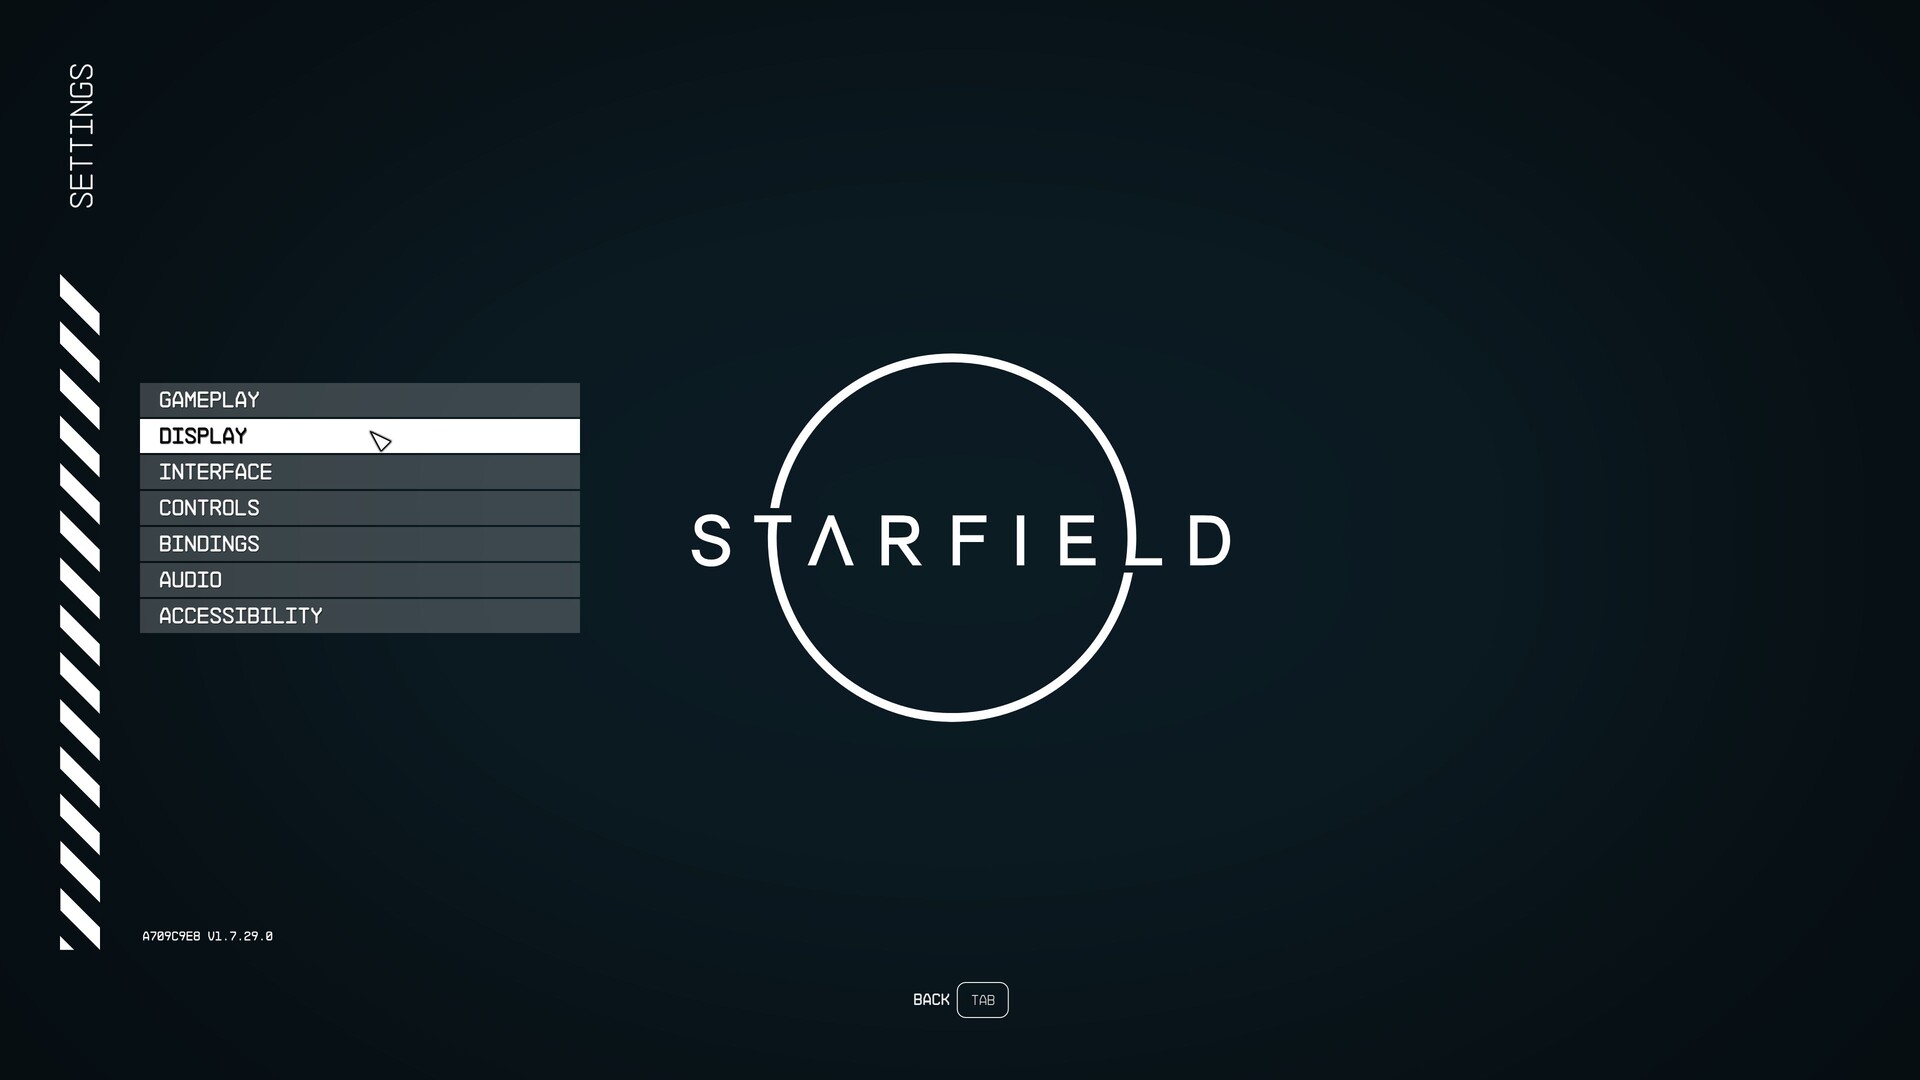
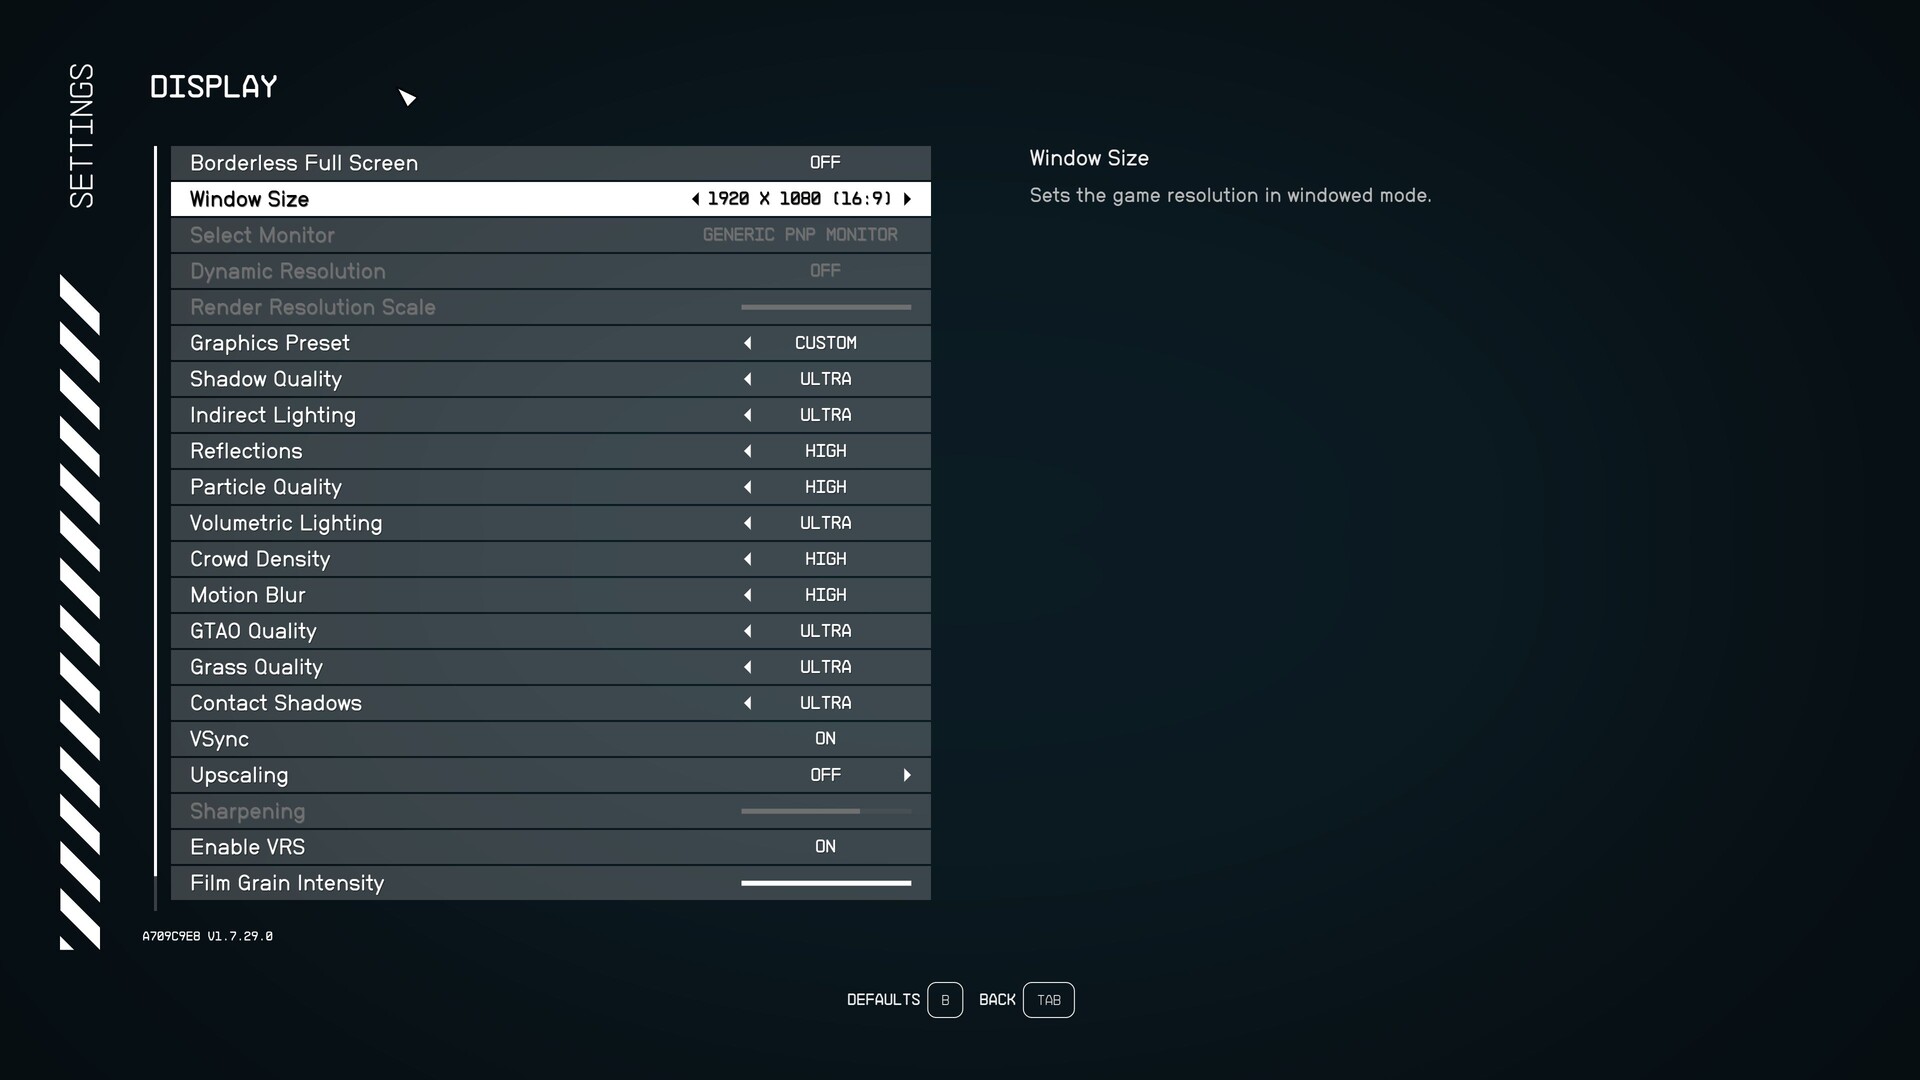
The graphics menu is neither puny nor particularly extensive. The display tab of the options menu contains about 10 quality controls that can be changed globally via preset. Unfortunately, the presets automatically activate Dynamic Resolution and Upscaling (Starfield only supports FSR 2 and not DLSS). Both options were disabled for the benchmarks (the same applies for VSync as usual).

Starfield
Starfield
Starfield
Starfield
Starfield
Starfield

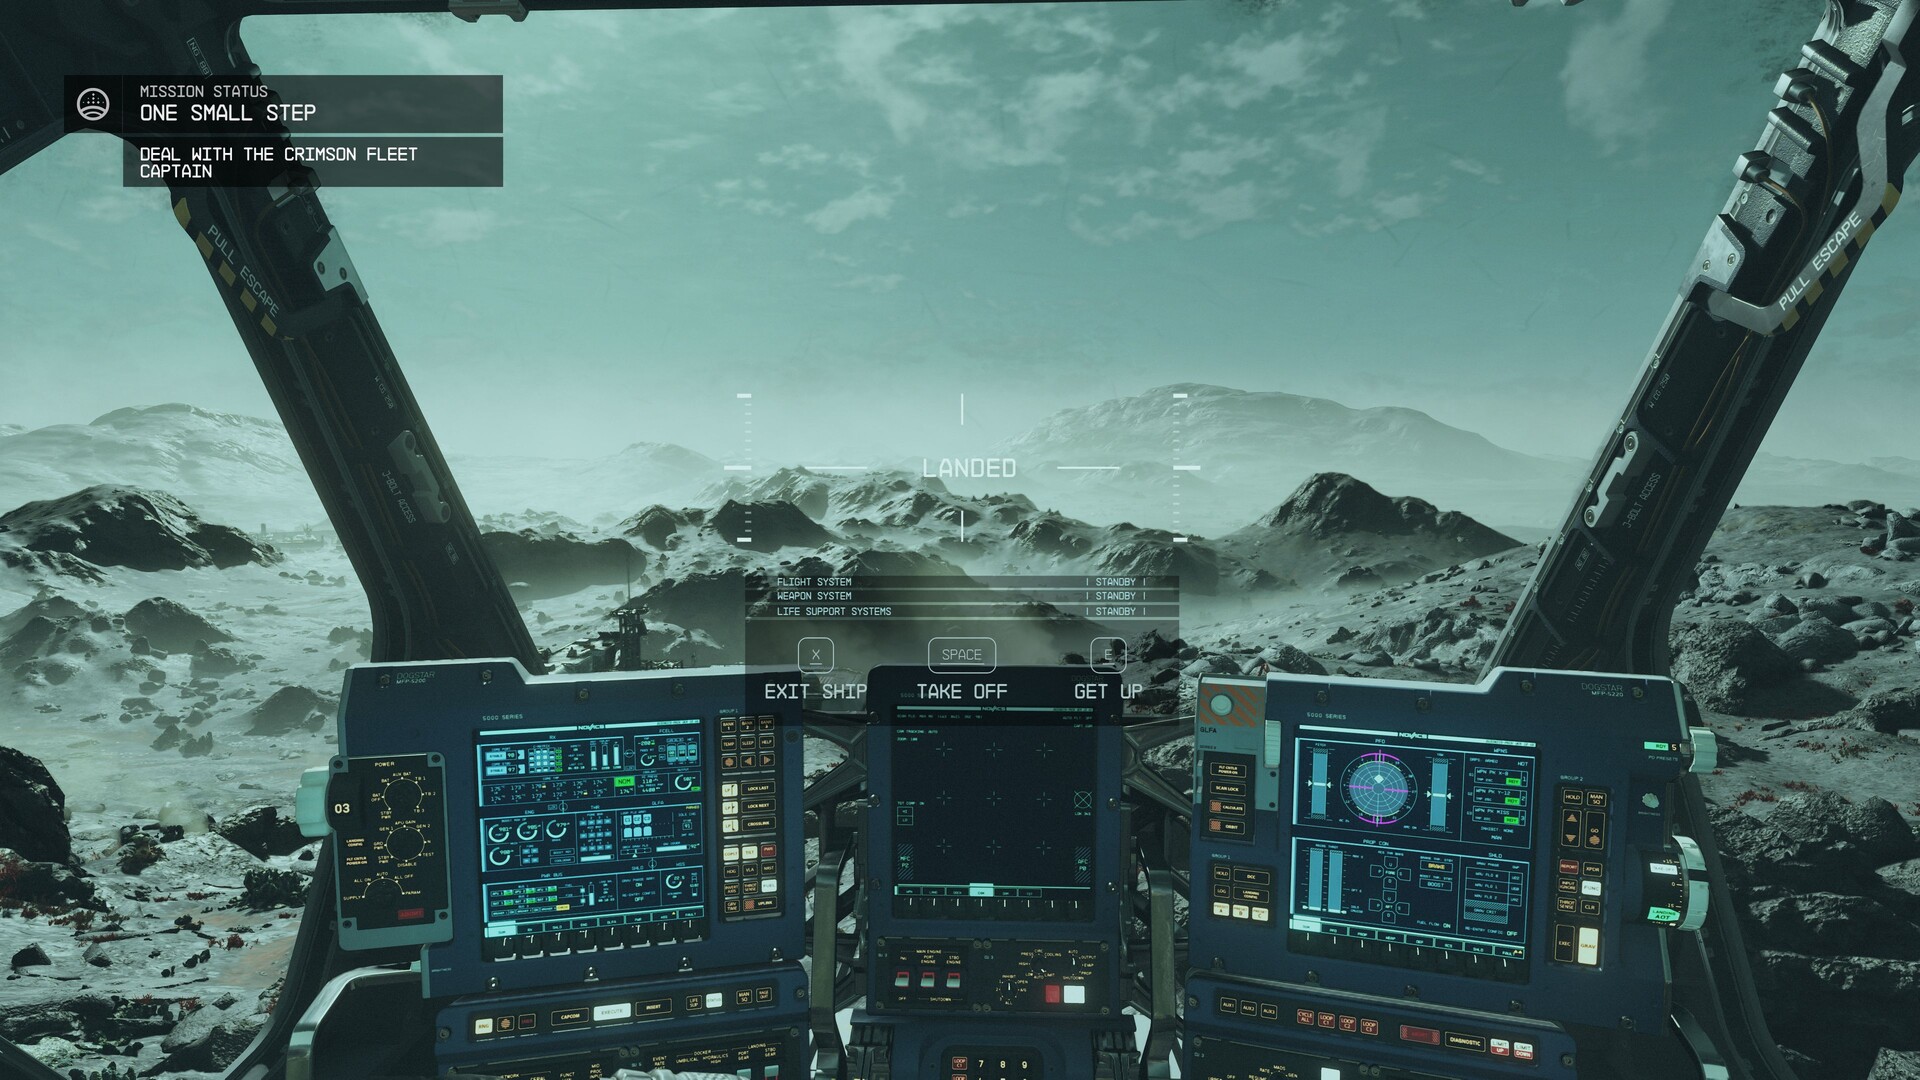
We cannot quite understand why a classic FullScreen mode is missing. You only have the choice between borderless fullscreen in the native or Windows resolution or the window mode. On the other hand, the fact that setting changes do not require a restart turns out to be pleasant. Bethesda does not provide comparative pictures of the individual settings, which is why players have to be satisfied with short text explanations.

Starfield
Starfield
Starfield

Benchmark

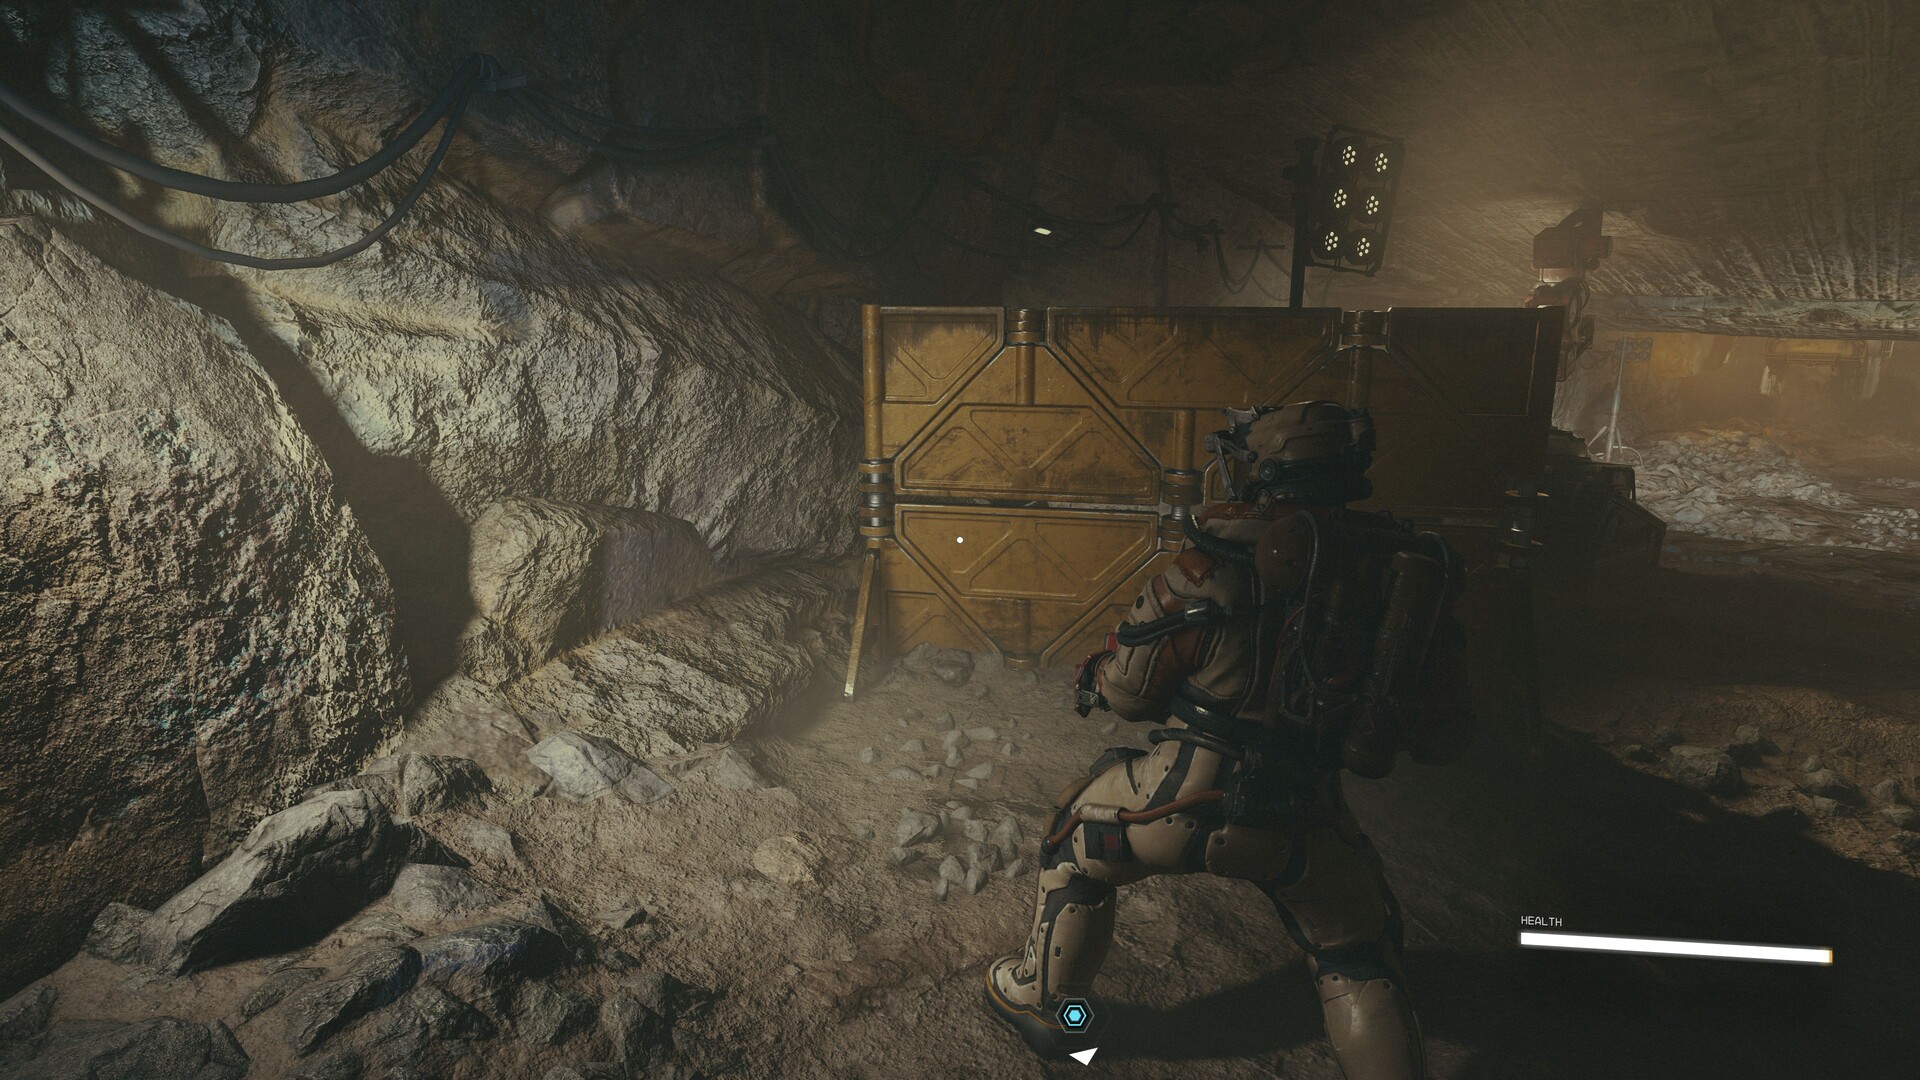
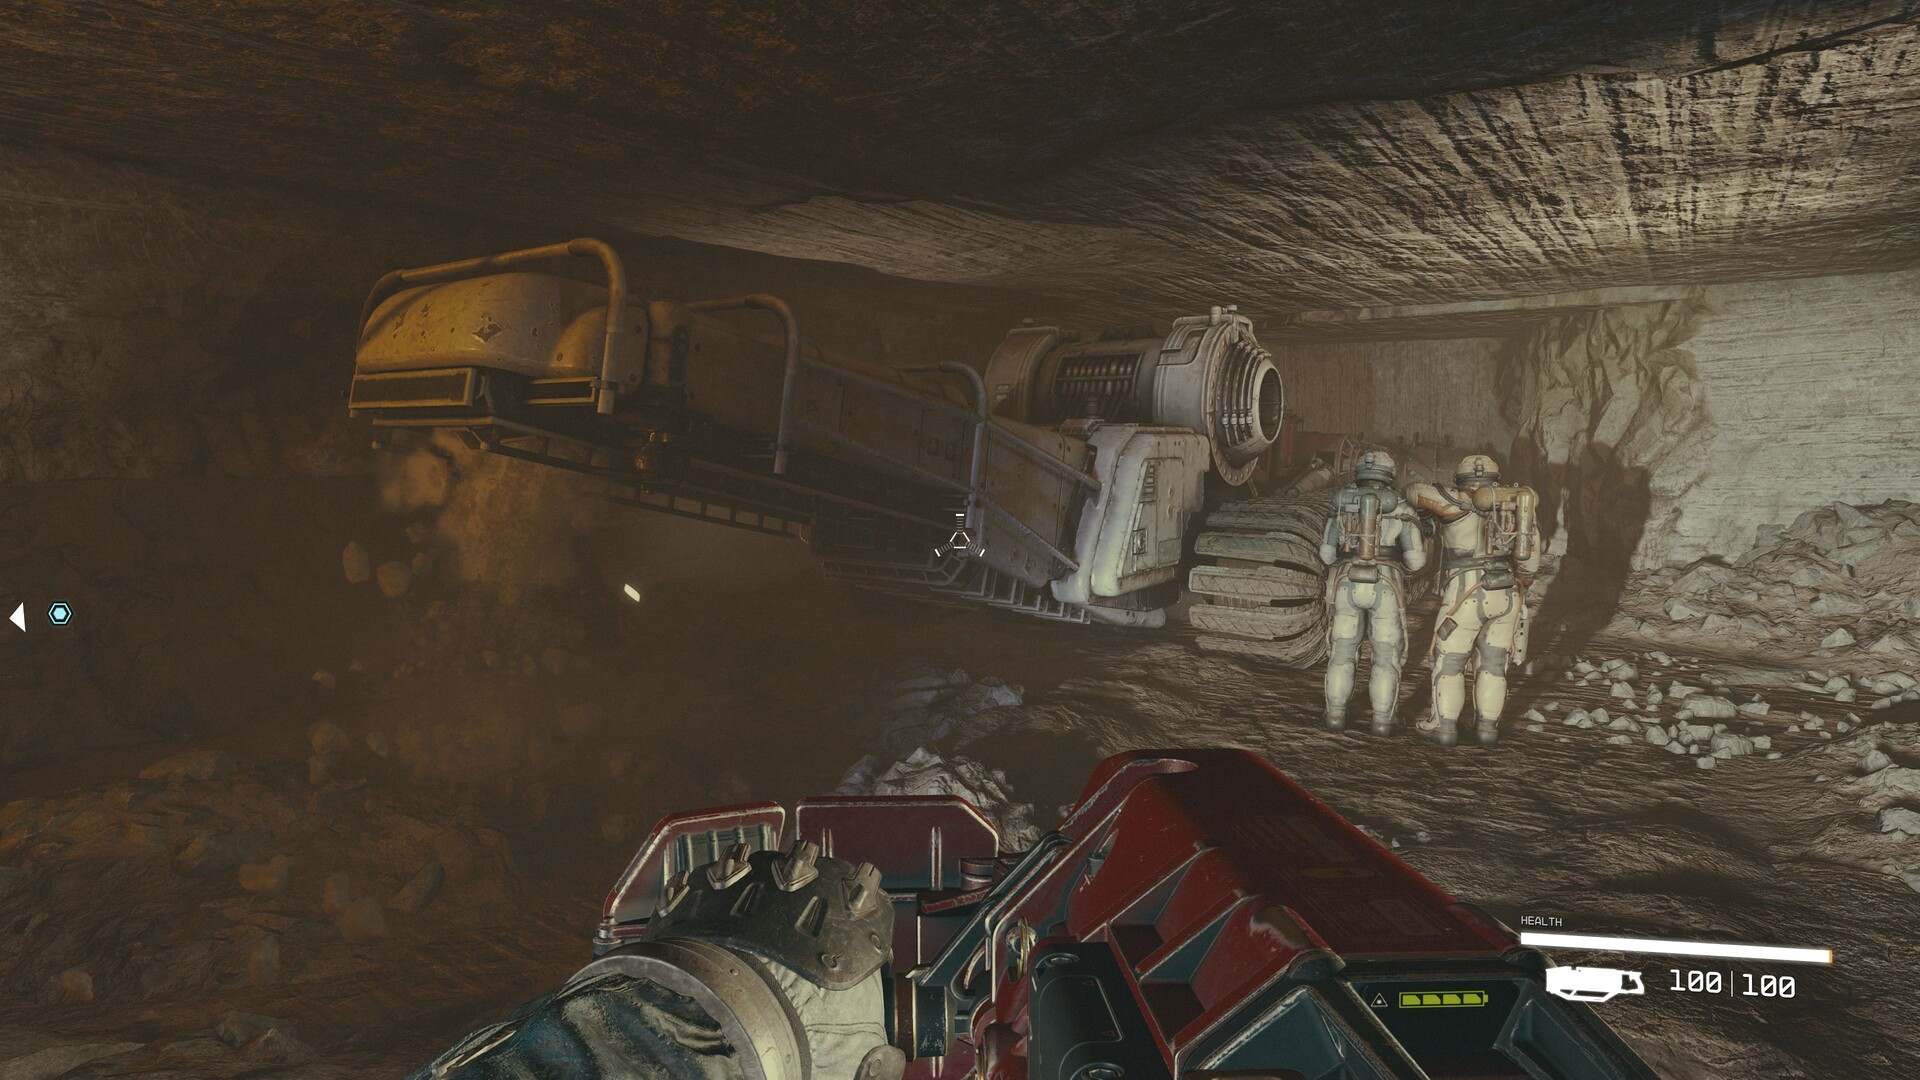
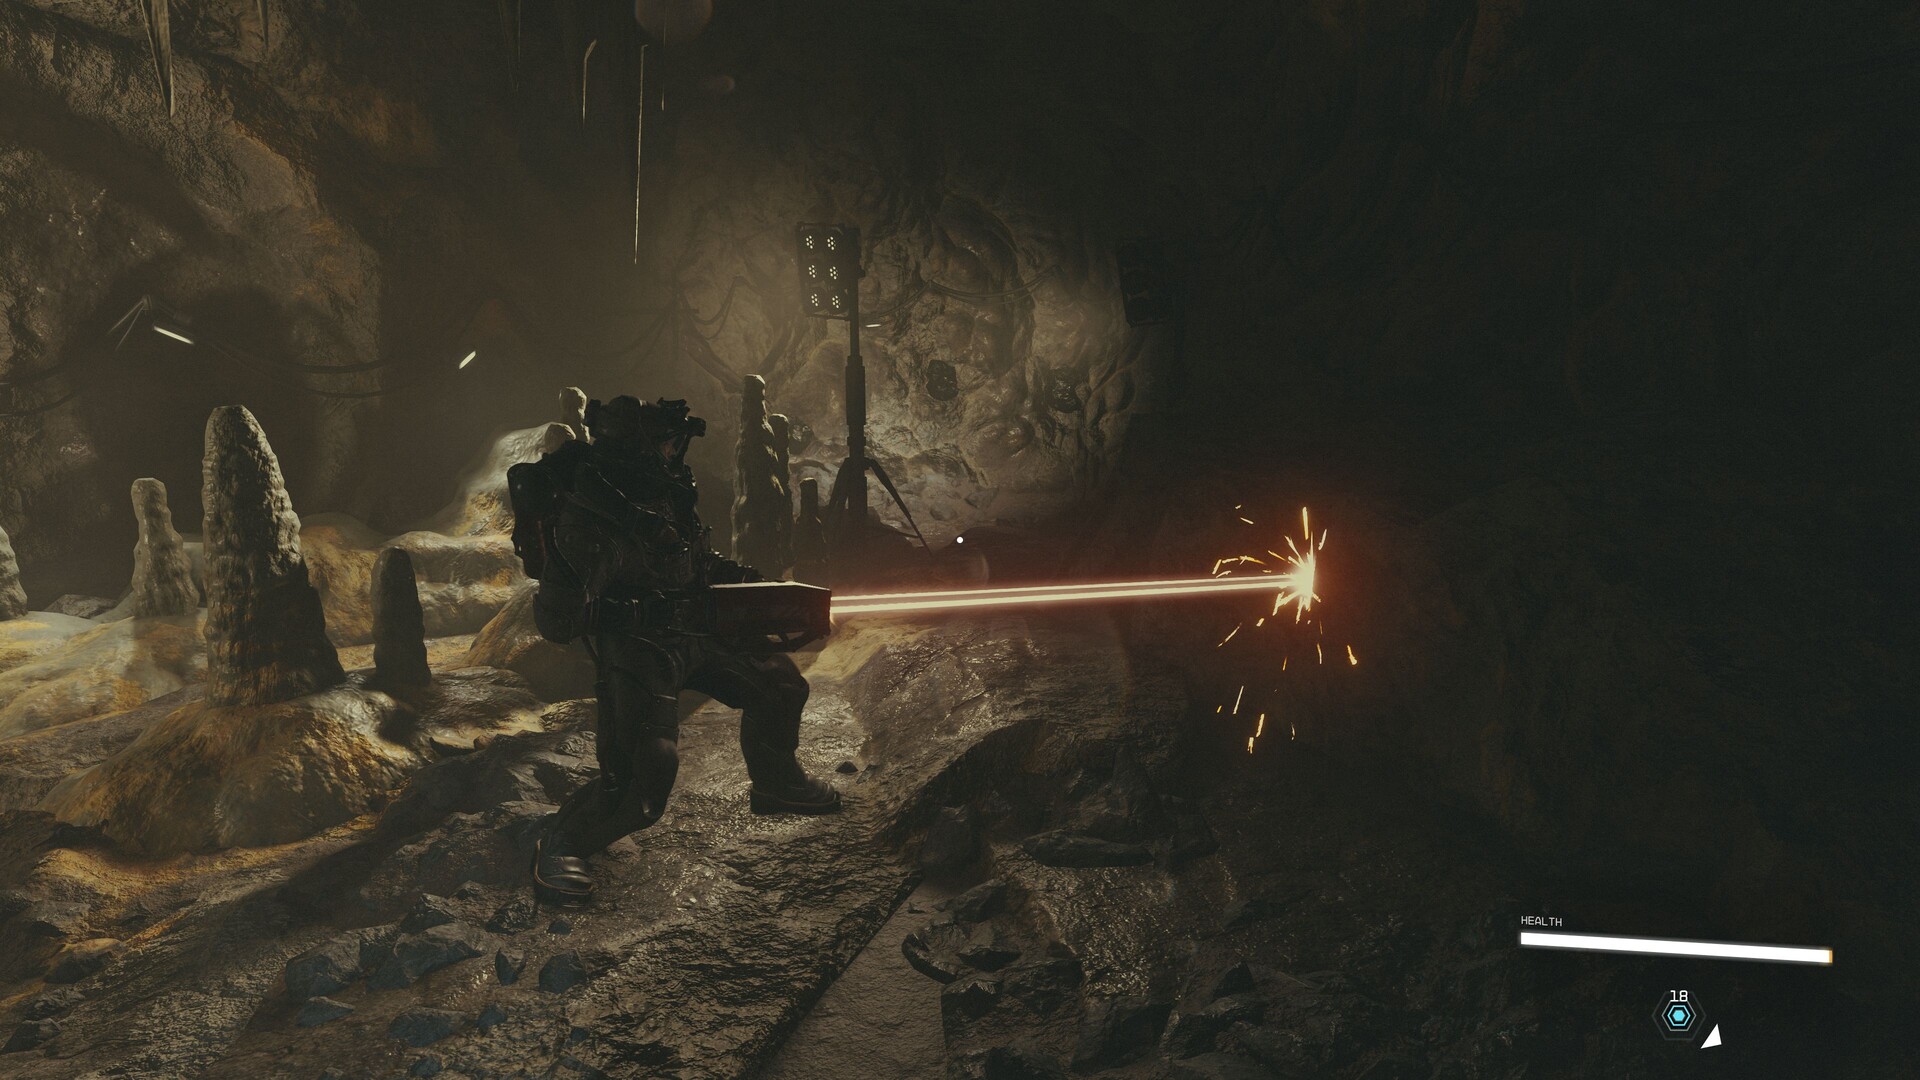
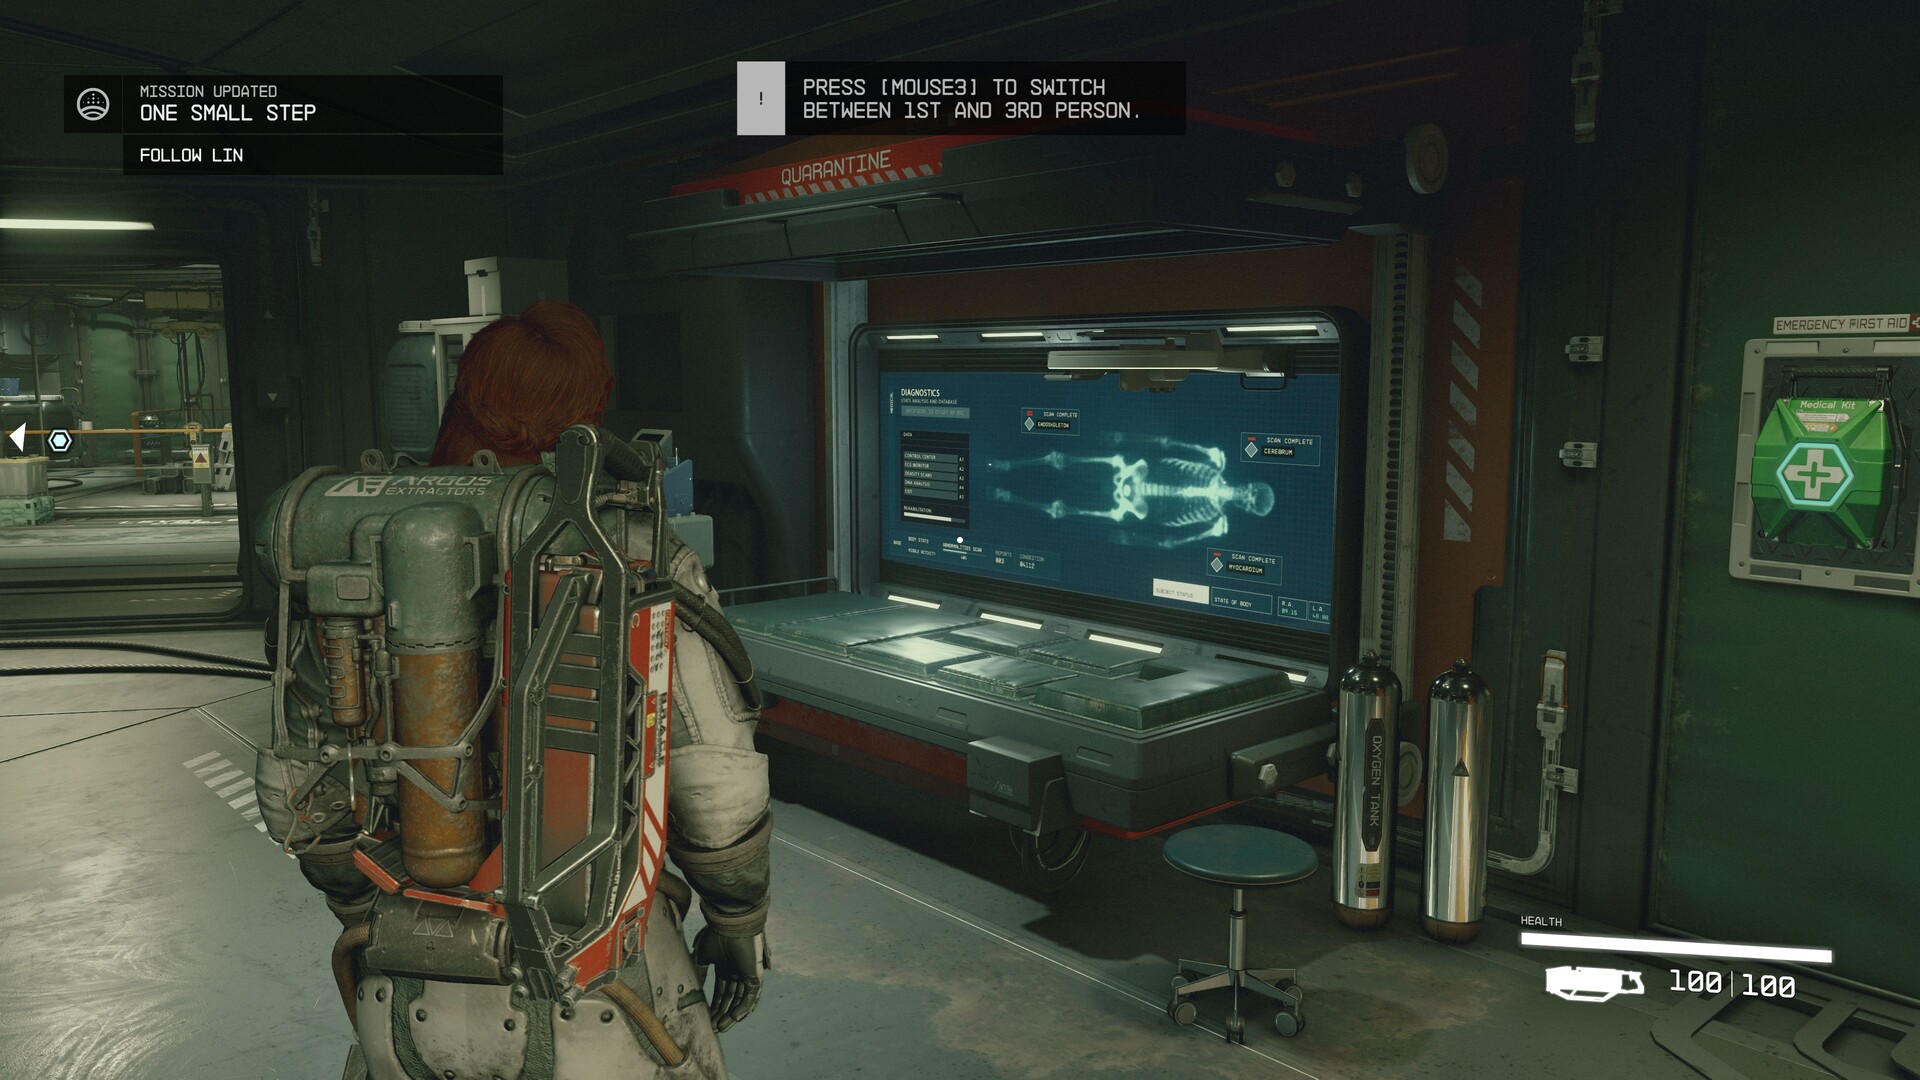
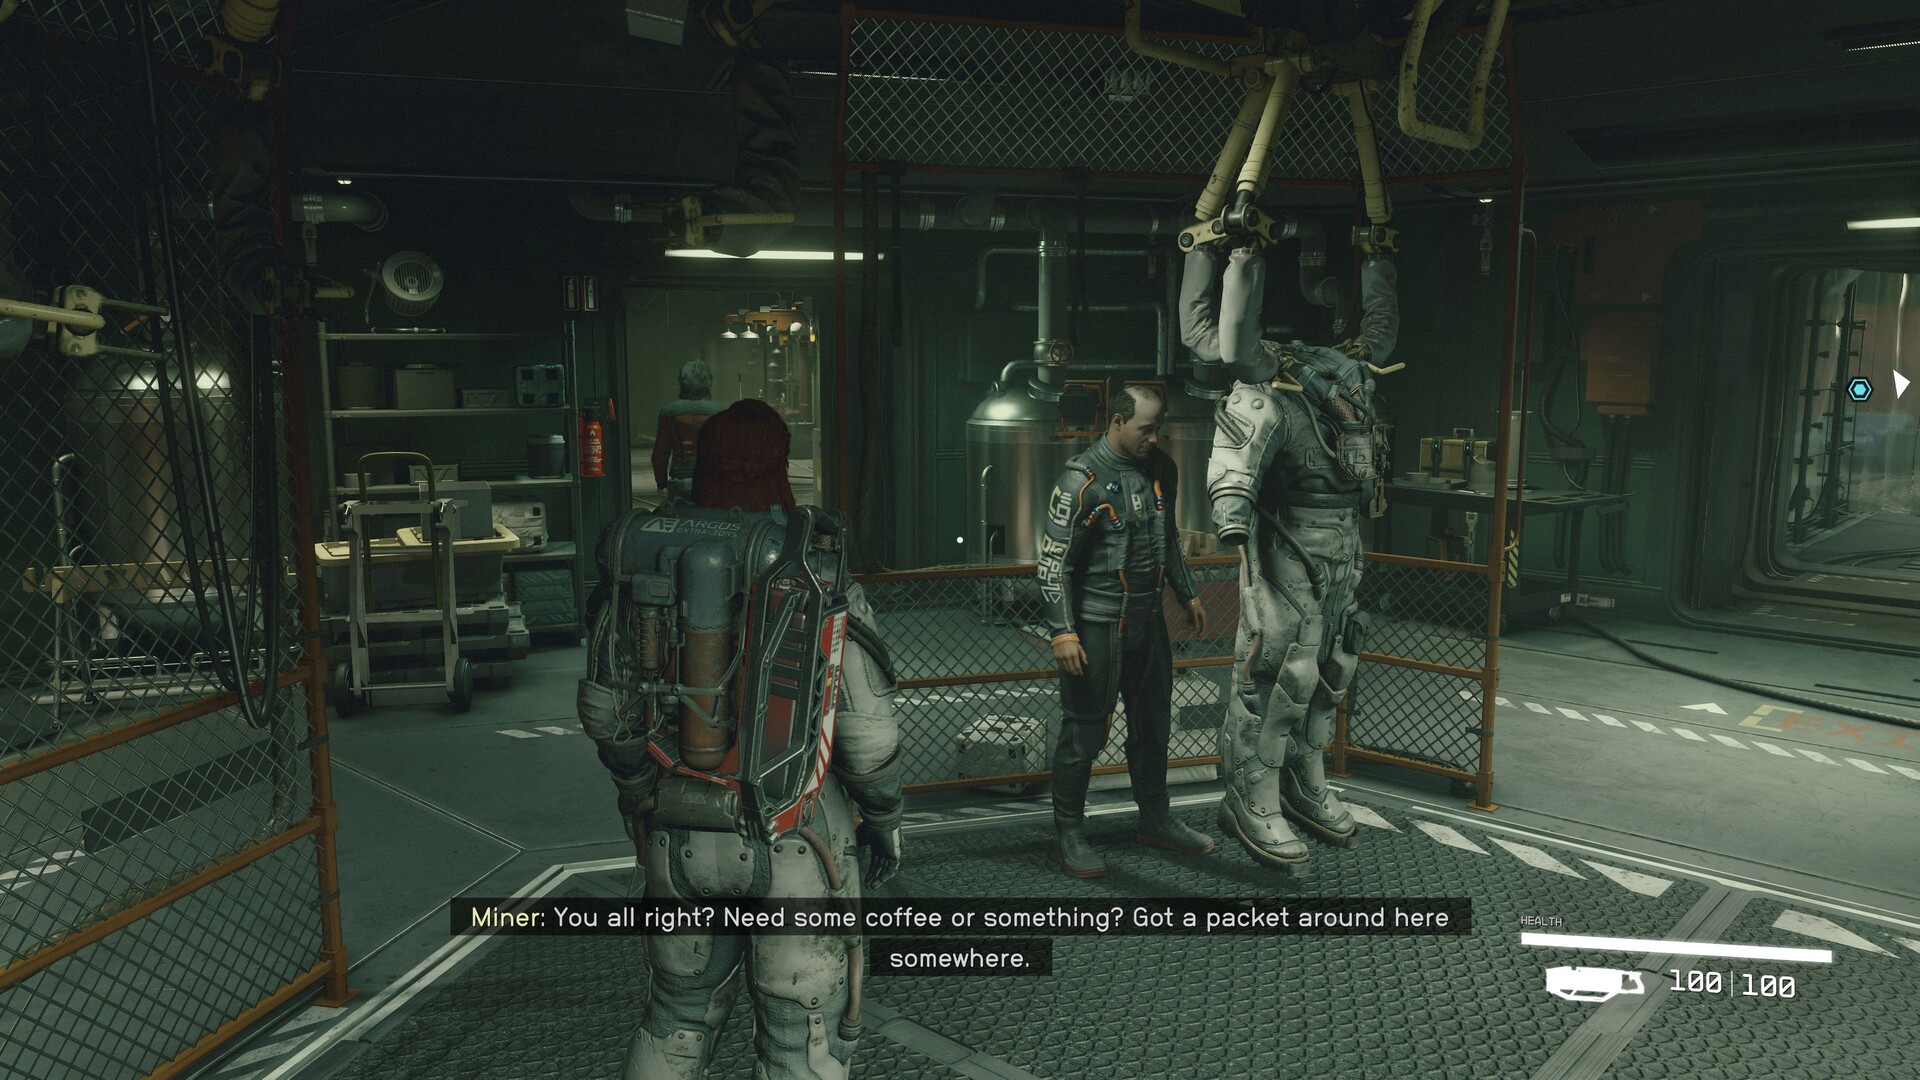
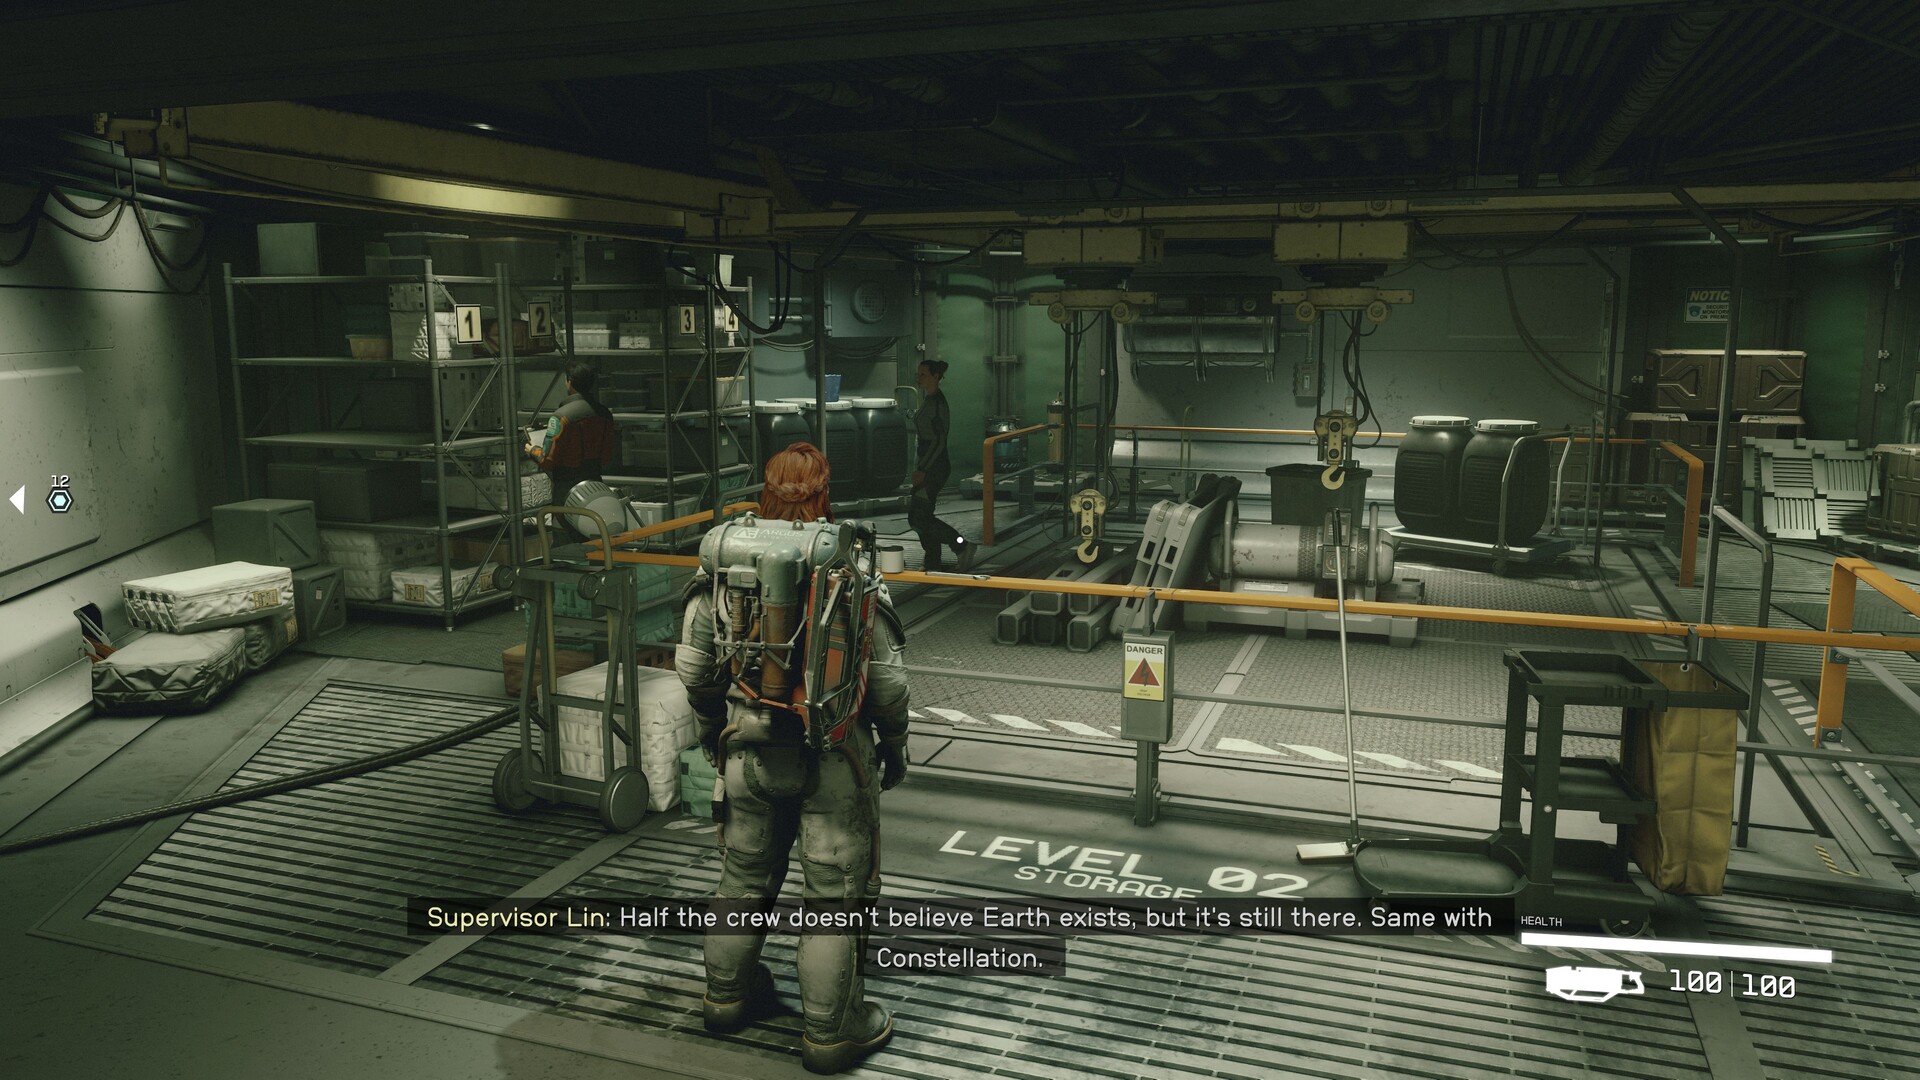
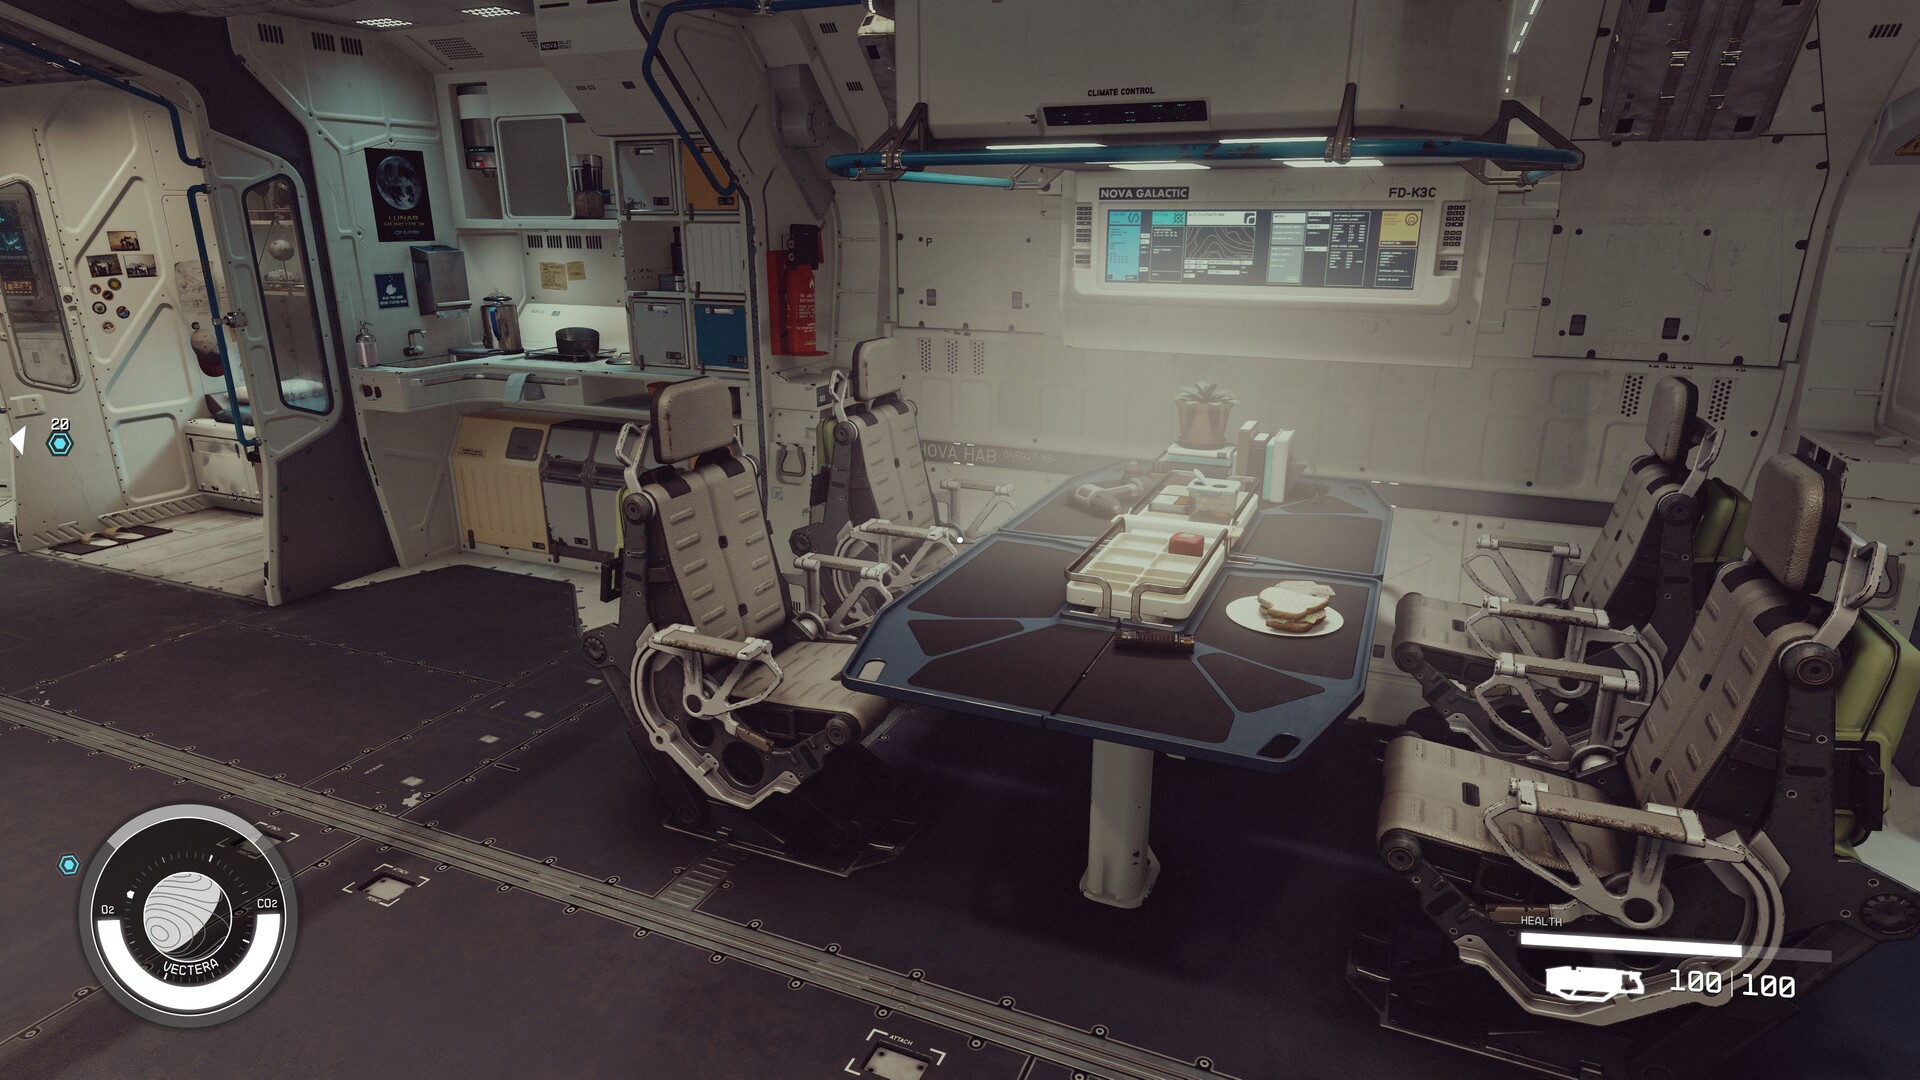
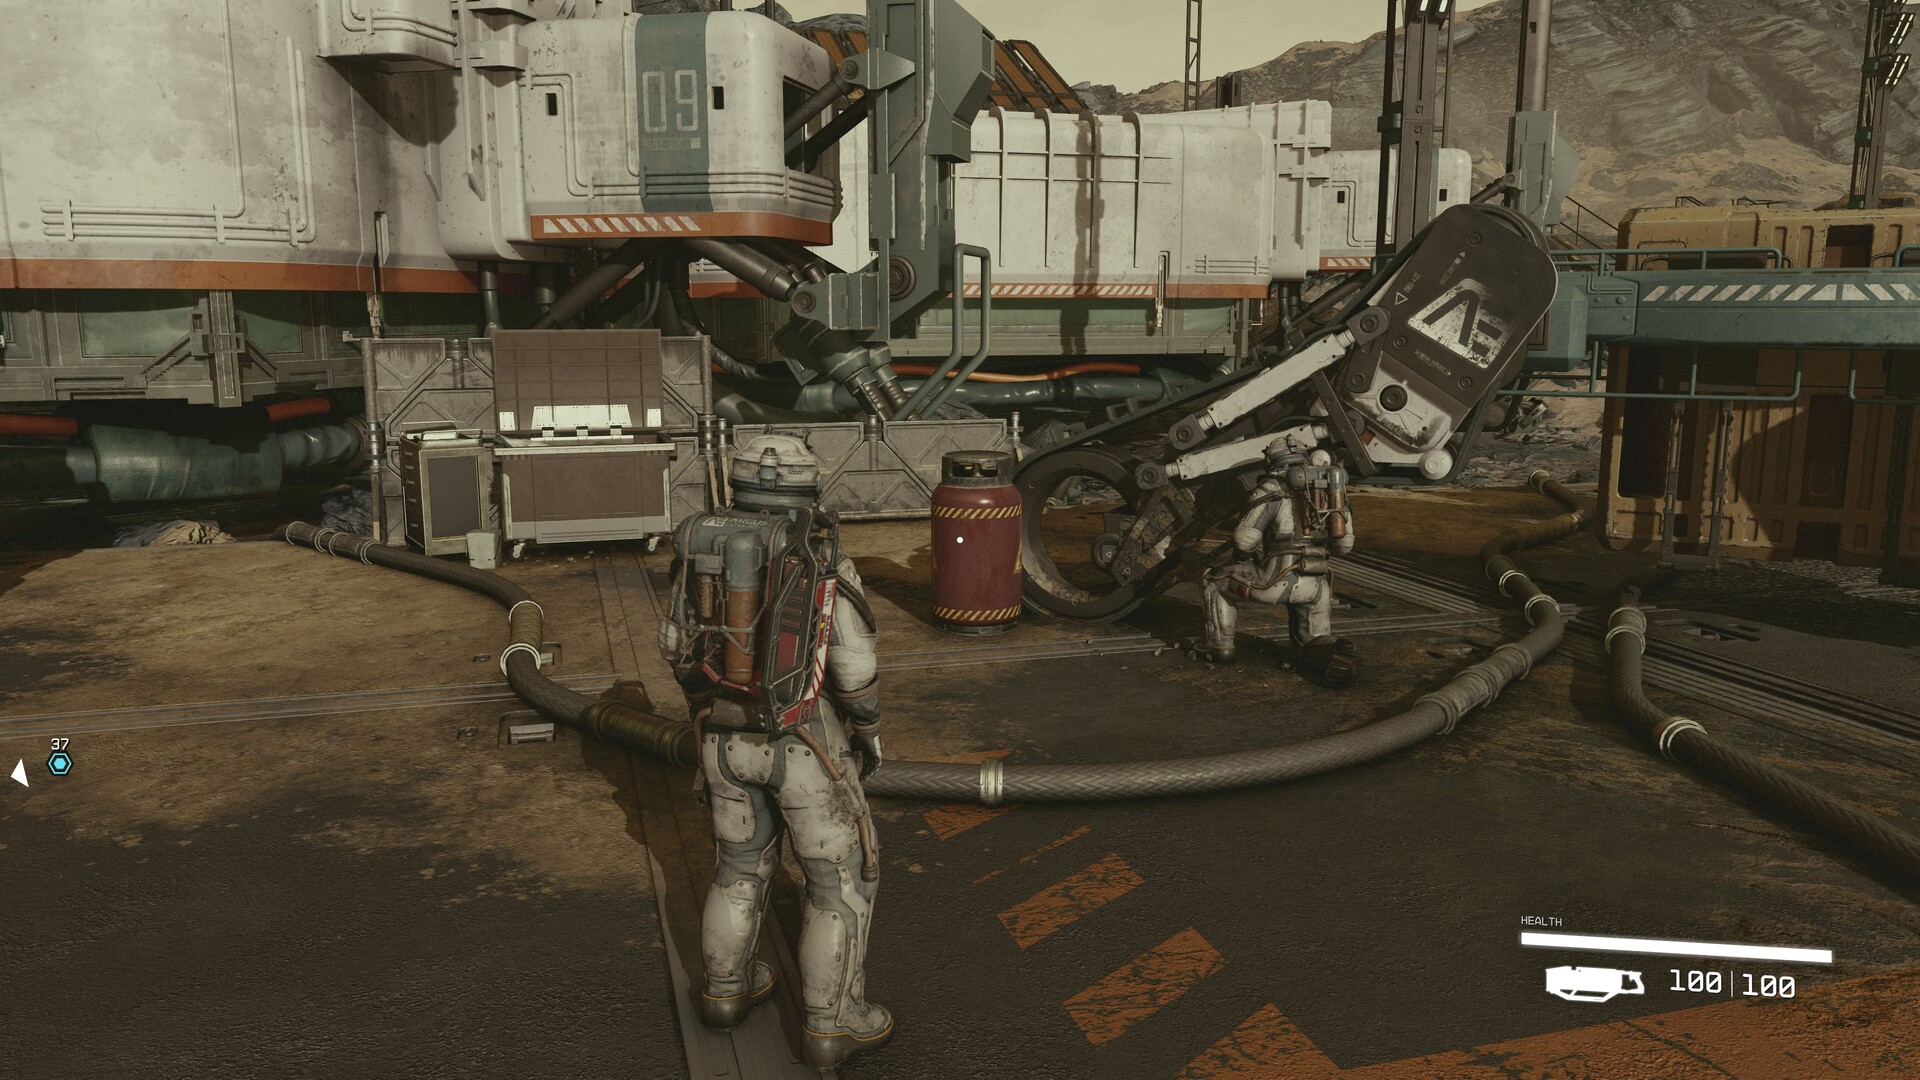
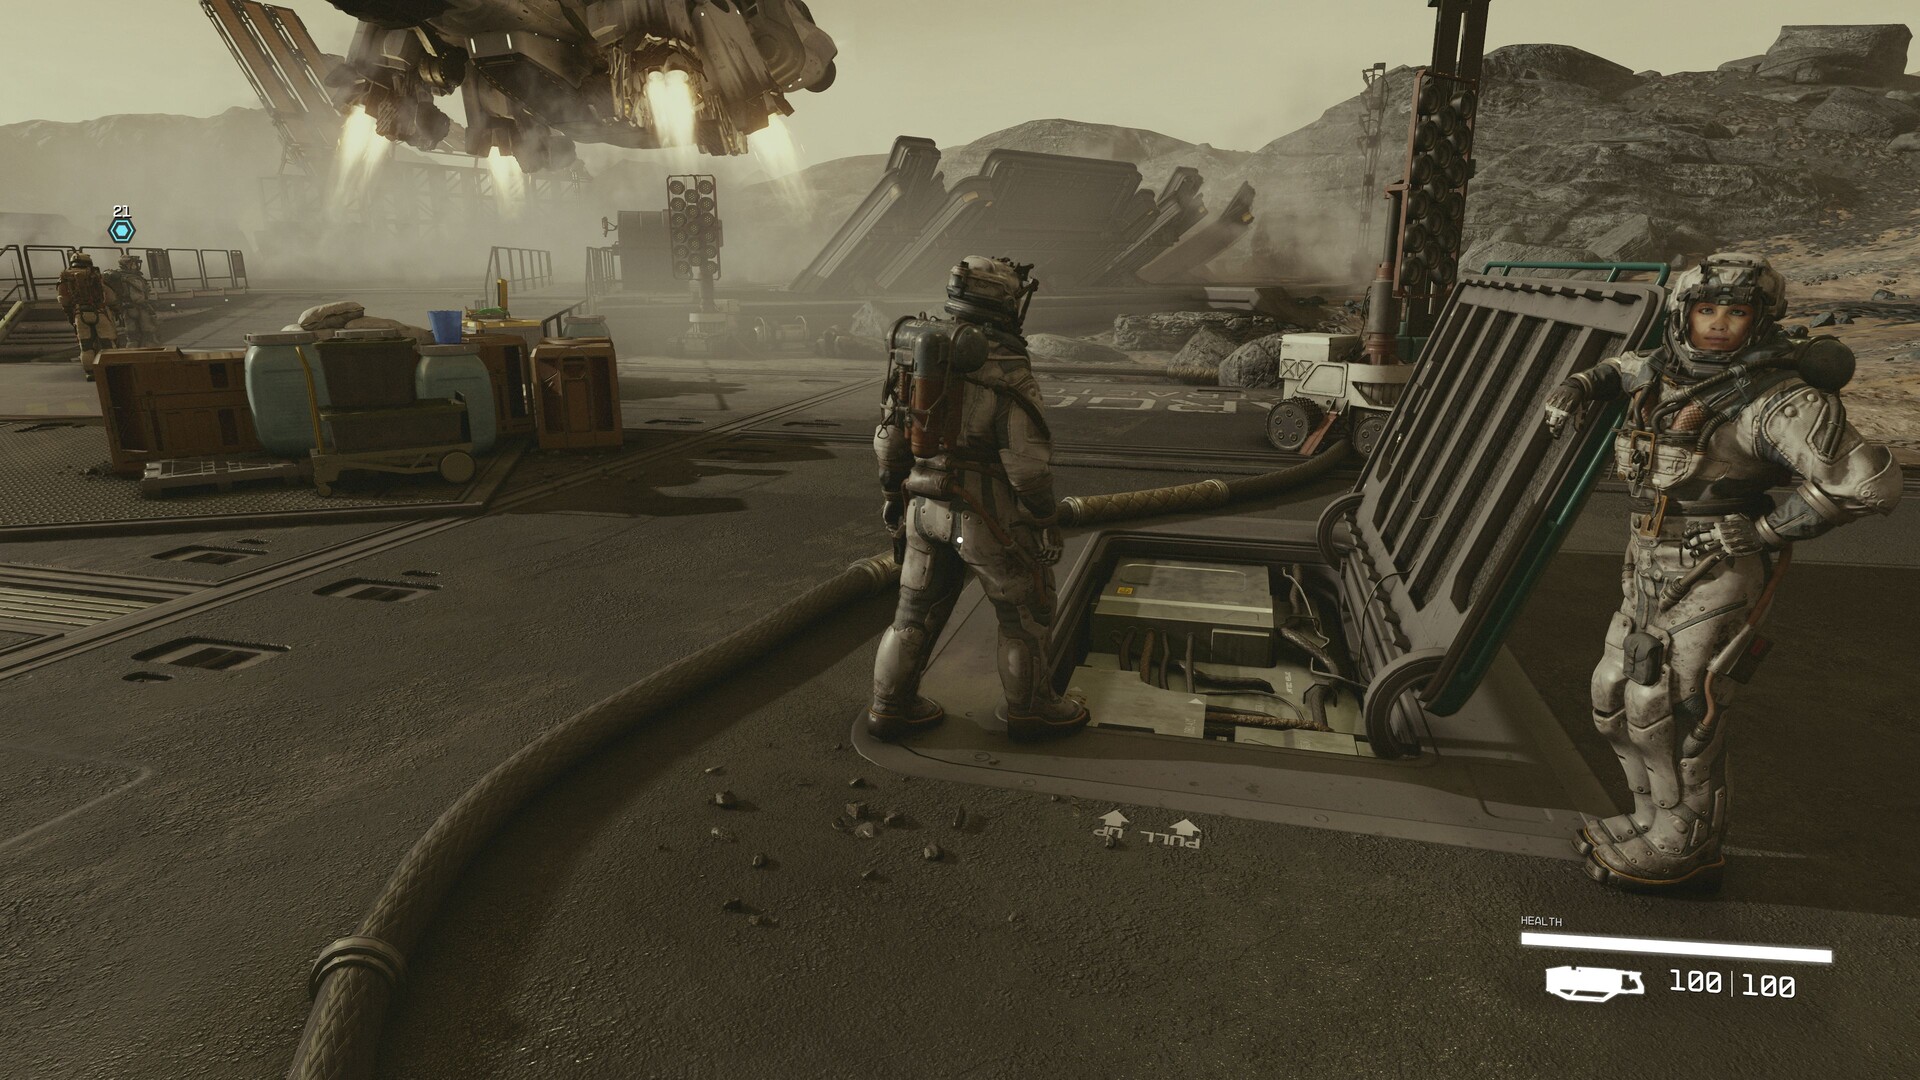
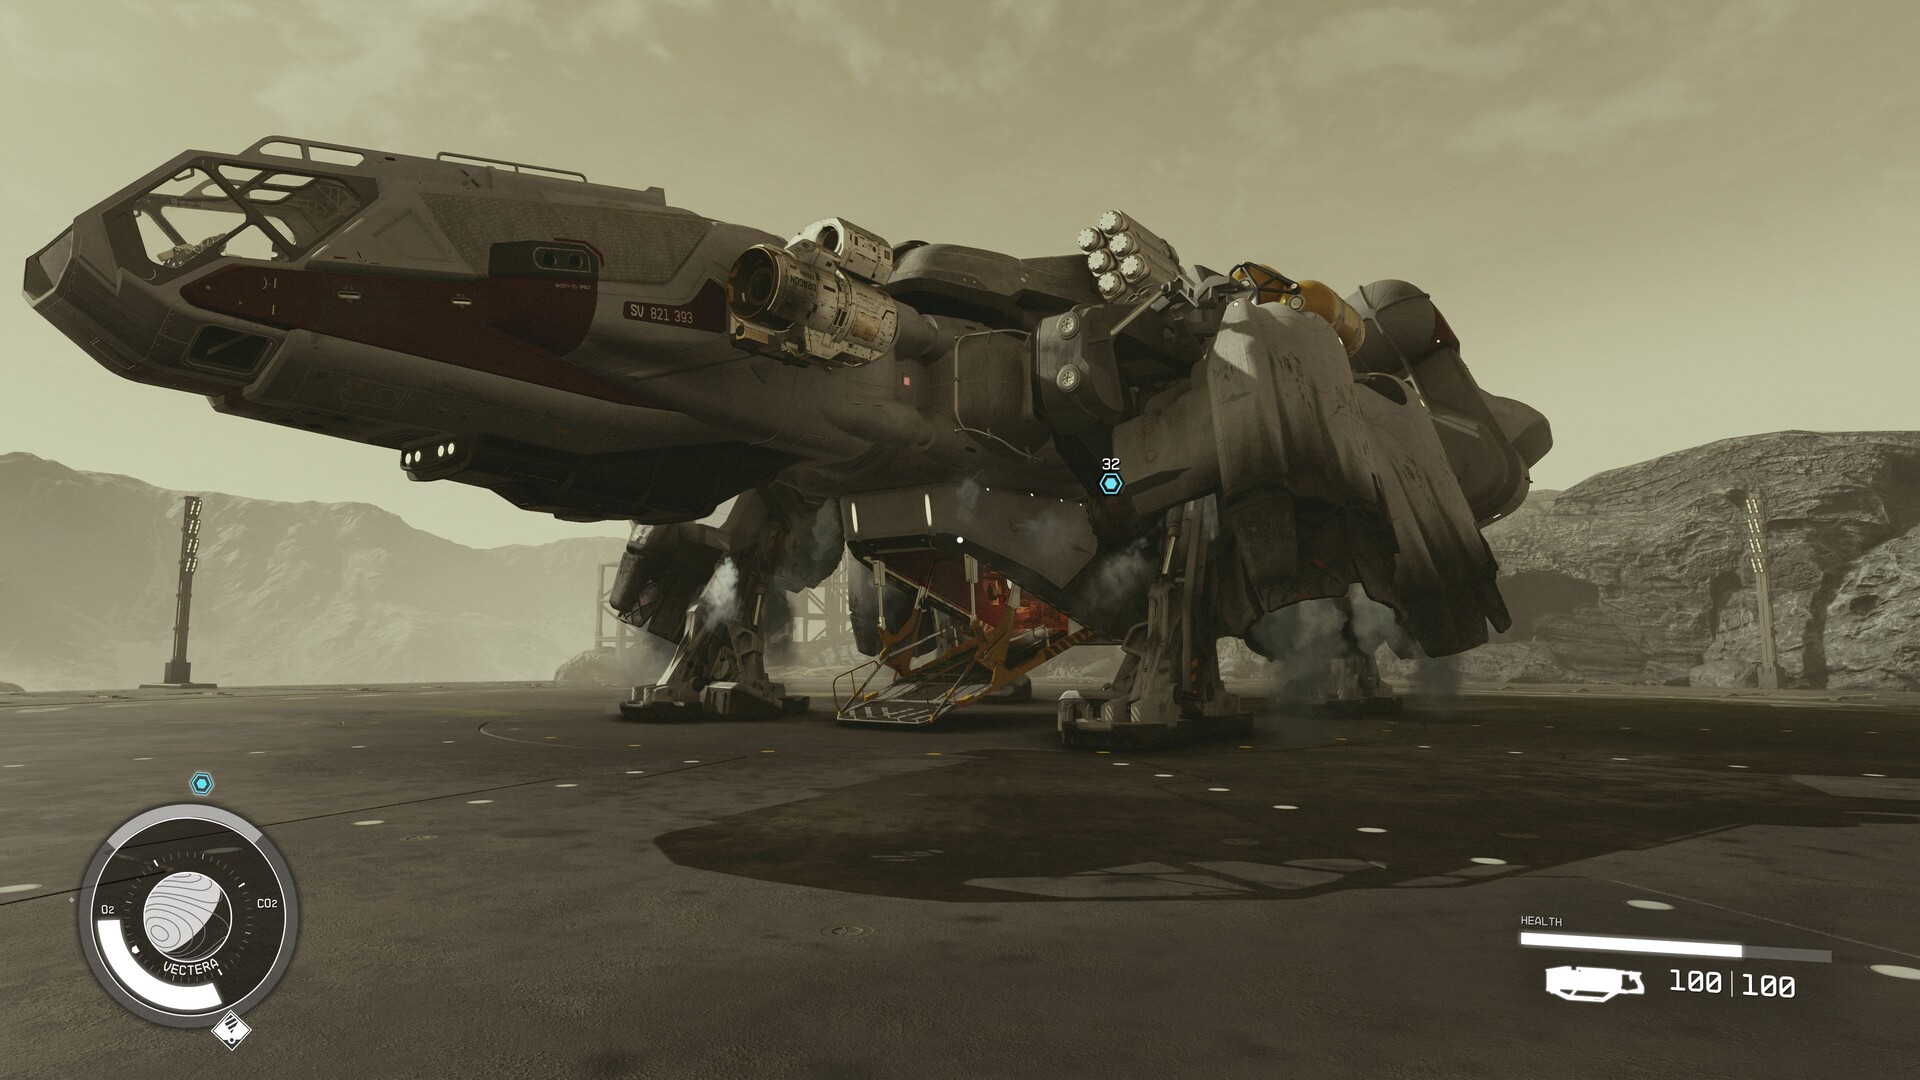
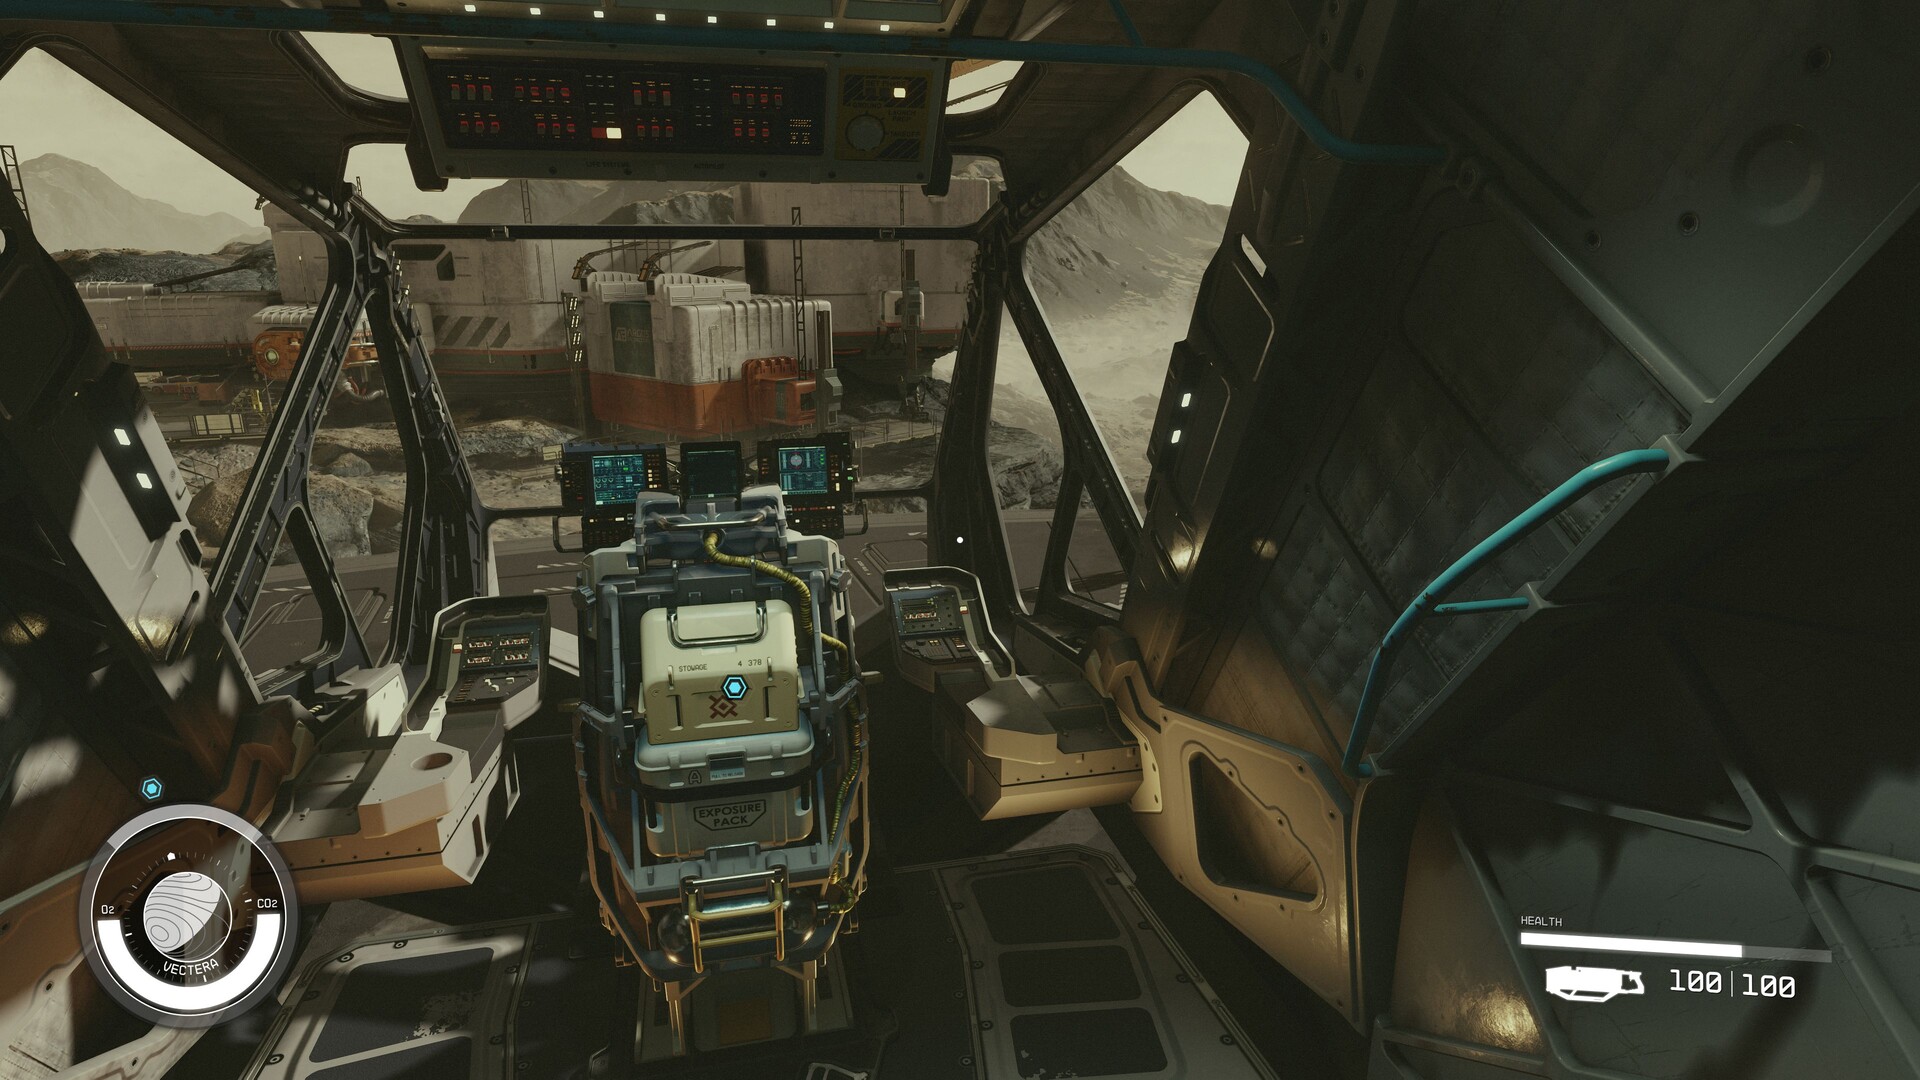
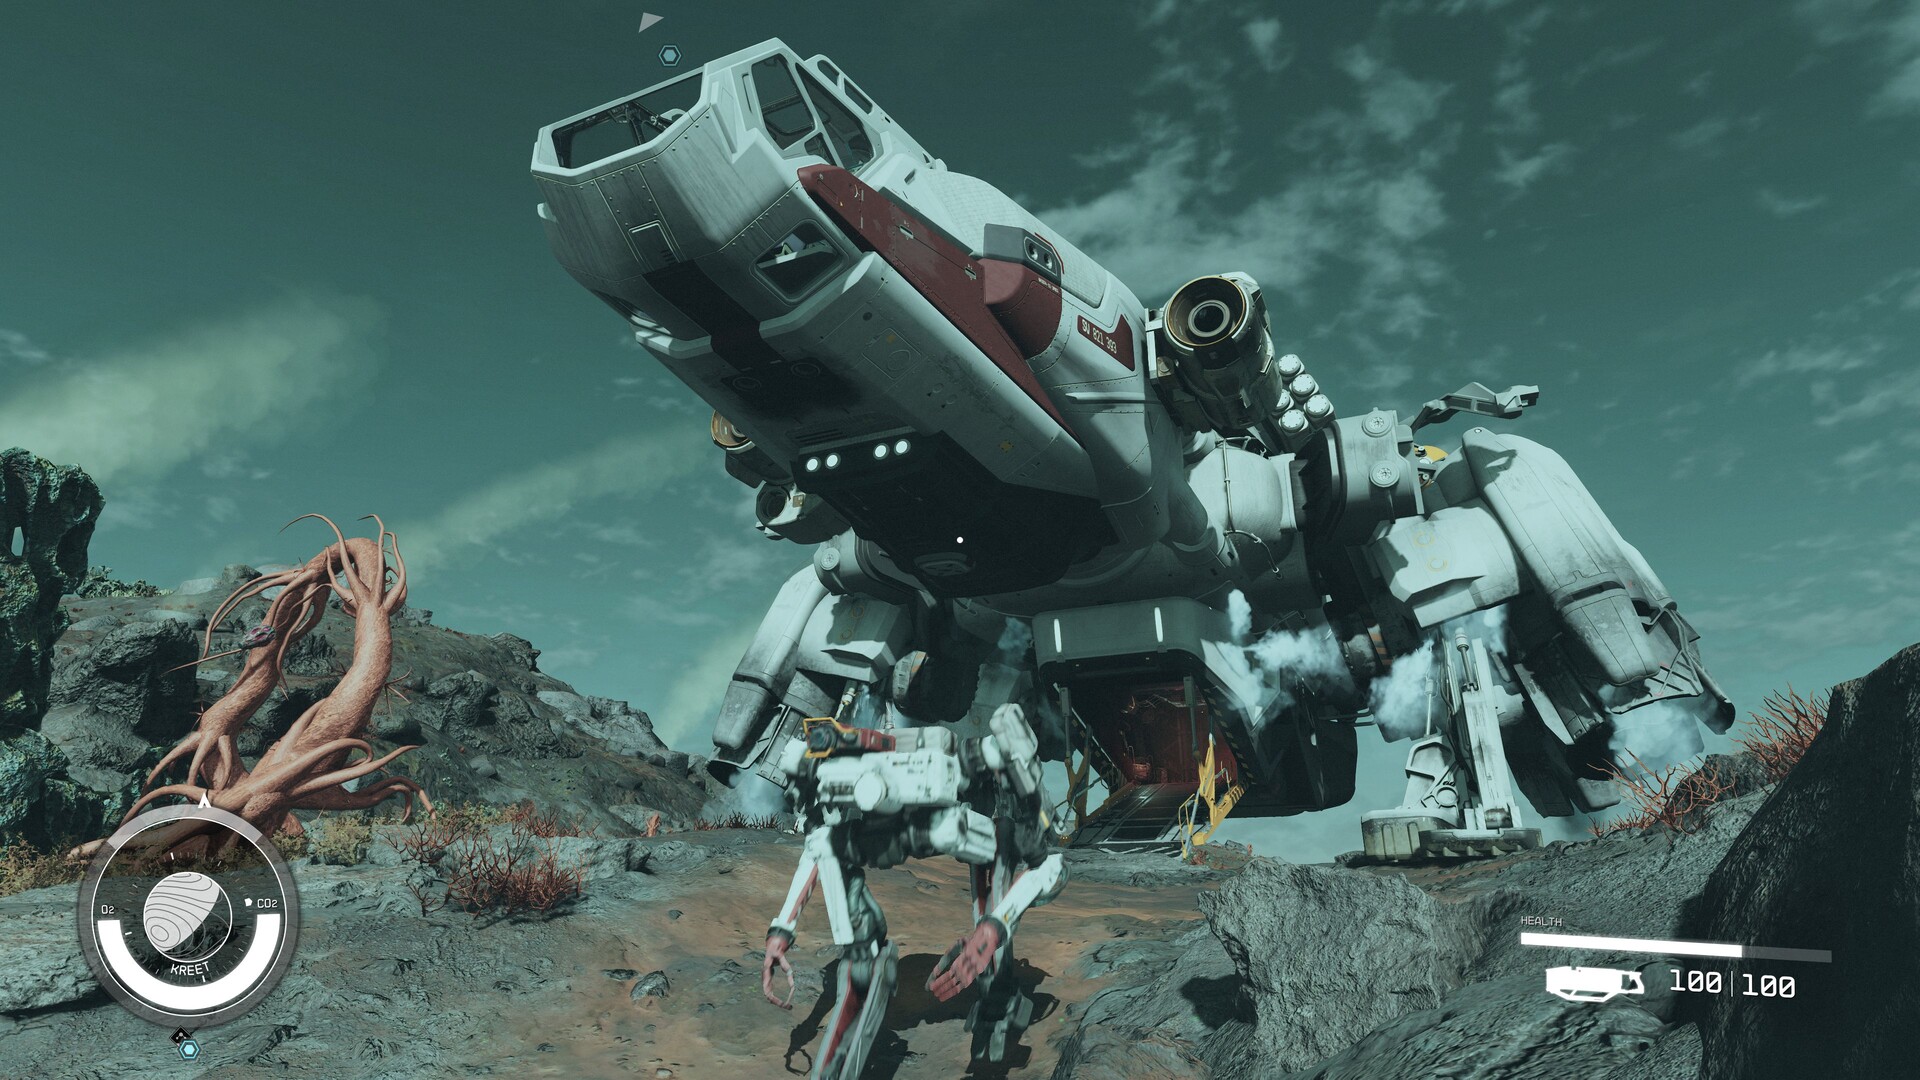
For our benchmark sequence, we use the starting world of Vectera (moon of Anselon), whose outdoor area you enter after a short tutorial in a mine. The tool CapFrameX records the march on a set route for just under 20 seconds. The sequence should have at least 40 FPS for an adequate gaming experience. Our GPU recommendations, which now follow, are made accordingly.

Results


FHD (1,920 x 1,080)

Even more powerful iGPUs like the Radeon 680M have a visibly hard time with Starfield. The latter model only manages 1,280 x 720 pixels and minimum details reasonably smoothly. It should at least be a mid-range chip for Full HD displays. Current mid-range representatives on the level of the Radeon RX 6800S or GeForce RTX 4050 can then also cope with high settings in 1,920 x 1,080. For the Ultra preset, we recommend an GeForce RTX 4060 or better.

Starfield
    1920x1080 Low Preset     1920x1080 Medium Preset     1920x1080 High Preset     1920x1080 Ultra Preset
AMD Radeon RX 7900 XT, i9-13900K
Desktop-PC Asus ROG Strix Z790-F
105.7 (67.7min, 77.3P0.1, 84.9P1) fps ∼86%
101.5 (66.2min, 67.9P0.1, 80P1) fps ∼97%
95.1 (58.2min, 62.3P0.1, 70.5P1) fps ∼100%
NVIDIA GeForce RTX 4080, i9-13900K
Desktop-PC Asus ROG Strix Z790-F
123.3 (73.1min, 82.2P0.1, 101.5P1) fps ∼100%
105.1 (66.8min, 75.4P0.1, 83.6P1) fps ∼100%
94.1 (63.7min, 66.5P0.1, 74.1P1) fps ∼99%
NVIDIA GeForce RTX 4090 Laptop GPU, i9-13900HX
XMG Neo 17 E23
105.4 (17min, 72.3P0.1, 83.1P1) fps ∼85%
89.3 (53.1min, 63.4P0.1, 70.7P1) fps ∼85%
80.5 (56min, 57.8P0.1, 62.2P1) fps ∼85%
NVIDIA GeForce RTX 4080 Laptop GPU, i9-13900HX
Schenker Key 17 Pro E23
90.5 (56.2min, 59.6P0.1, 70.5P1) fps ∼73%
75.1 (48.7min, 50.6P0.1, 54.9P1) fps ∼71%
67.1 (39.4min, 42.3P0.1, 49.1P1) fps ∼71%
NVIDIA GeForce RTX 3080 Ti Laptop GPU, i9-12900H
Asus ROG Strix Scar 17 G733ZX
70.3 (45.2min, 50.4P0.1, 56.4P1) fps ∼57%
58 (38.9min, 39.2P0.1, 44.6P1) fps ∼55%
51.8 (33.4min, 35P0.1, 39.4P1) fps ∼54%
NVIDIA GeForce RTX 4070 Laptop GPU, i9-13900HX
XMG Pro 15 E23
66.7 (44.9min, 45.8P0.1, 52.3P1) fps ∼54%
52.3 (31.6min, 35.6P0.1, 39.2P1) fps ∼50%
46.6 (31.5min, 31.9P0.1, 34.7P1) fps ∼49%
NVIDIA GeForce RTX 3070 Ti Laptop GPU, i7-12700H
Acer Predator Helios 300 PH315-55
61.7 (40.1min, 40.4P0.1, 45.1P1) fps ∼50%
50 (27.6min, 28P0.1, 34.5P1) fps ∼48%
44.8 (24.4min, 25.7P0.1, 30P1) fps ∼47%
NVIDIA GeForce RTX 4060 Laptop GPU, i9-13900HX
XMG Pro 15 E23
59.5 (37.3min, 39.2P0.1, 44.8P1) fps ∼48%
46.5 (27.3min, 32.7P0.1, 34P1) fps ∼44%
41 (25.5min, 26.9P0.1, 30.2P1) fps ∼43%
AMD Radeon RX 6800S, R9 6900HS
Asus ROG Zephyrus G14
63.9 (43.3min, 44.4P0.1, 50.3P1) fps ∼100%
54.6 (35.2min, 37.7P0.1, 43.1P1) fps ∼44%
44.6 (32min, 32.2P0.1, 35.1P1) fps ∼42%
39.4 (29.7min, 30P0.1, 31.8P1) fps ∼41%
NVIDIA GeForce RTX 4050 Laptop GPU, i9-13900HX
XMG Focus 15 E23
53.6 (29.7min, 30.9P0.1, 40.1P1) fps ∼43%
41.7 (28.1min, 28.6P0.1, 30.3P1) fps ∼40%
36.3 (22.1min, 24.7P0.1, 27.3P1) fps ∼38%
AMD Radeon 680M, R9 6900HS
Asus ROG Zephyrus G14
23.2 (17min, 17.1P0.1, 18.6P1) fps ∼36%
19.4 (14.7min, 15P0.1, 16P1) fps ∼16%
14.8 (8.47min, 8.62P0.1, 10.3P1) fps ∼14%
12.7 (7.99min, 8.15P0.1, 8.83P1) fps ∼13%

QHD (2,560 x 1,440)

You can hardly get around a high-end accelerator on QHD displays. 2,560 x 1,440 pixels and maximum details only run properly from an GeForce RTX 3080 Ti.

Starfield
    2560x1440 Ultra Preset
AMD Radeon RX 7900 XT, i9-13900K
Desktop-PC Asus ROG Strix Z790-F
88.3 (62.9min, 64.4P0.1, 71.1P1) fps ∼100%
NVIDIA GeForce RTX 4080, i9-13900K
Desktop-PC Asus ROG Strix Z790-F
80.6 (55min, 57.3P0.1, 64.9P1) fps ∼91%
NVIDIA GeForce RTX 4090 Laptop GPU, i9-13900HX
XMG Neo 17 E23
67.2 (7.08min, 22.5P0.1, 51.9P1) fps ∼76%
NVIDIA GeForce RTX 4080 Laptop GPU, i9-13900HX
Schenker Key 17 Pro E23
56.3 (32.3min, 39P0.1, 41.6P1) fps ∼64%
NVIDIA GeForce RTX 3080 Ti Laptop GPU, i9-12900H
Asus ROG Strix Scar 17 G733ZX
42.2 (29.1min, 30.9P0.1, 33.9P1) fps ∼48%
NVIDIA GeForce RTX 4070 Laptop GPU, i9-13900HX
XMG Pro 15 E23
37.2 (26.4min, 26.6P0.1, 28.1P1) fps ∼42%
NVIDIA GeForce RTX 3070 Ti Laptop GPU, i7-12700H
Acer Predator Helios 300 PH315-55
36.2 (19.5min, 20.3P0.1, 24.9P1) fps ∼41%
NVIDIA GeForce RTX 4060 Laptop GPU, i9-13900HX
XMG Pro 15 E23
32.5 (20.2min, 21.2P0.1, 24.5P1) fps ∼37%
NVIDIA GeForce RTX 4050 Laptop GPU, i9-13900HX
XMG Focus 15 E23
28.9 (21.4min, 21.6P0.1, 22.6P1) fps ∼33%

UHD (3,840 x 2,160)

Once again, the 4K range is the real deal. A mixture of 3,840 x 2,160 pixels and the Ultra preset even demands Nvidia's current notebook leader, the GeForce RTX 4090.

Starfield
    3840x2160 Ultra Preset
AMD Radeon RX 7900 XT, i9-13900K
Desktop-PC Asus ROG Strix Z790-F
59.6 (44.1min, 45.3P0.1, 49.3P1) fps ∼100%
NVIDIA GeForce RTX 4080, i9-13900K
Desktop-PC Asus ROG Strix Z790-F
55.3 (42.6min, 43.4P0.1, 45.4P1) fps ∼93%
NVIDIA GeForce RTX 4090 Laptop GPU, i9-13900HX
XMG Neo 17 E23
46.5 (36.3min, 36.8P0.1, 38.6P1) fps ∼78%
NVIDIA GeForce RTX 4080 Laptop GPU, i9-13900HX
Schenker Key 17 Pro E23
38.4 (24min, 25.6P0.1, 28.2P1) fps ∼64%
NVIDIA GeForce RTX 3080 Ti Laptop GPU, i9-12900H
Asus ROG Strix Scar 17 G733ZX
27.3 (22.4min, 22.5P0.1, 23.4P1) fps ∼46%
NVIDIA GeForce RTX 4070 Laptop GPU, i9-13900HX
XMG Pro 15 E23
24 (18.5min, 18.5P0.1, 19.4P1) fps ∼40%
NVIDIA GeForce RTX 3070 Ti Laptop GPU, i7-12700H
Acer Predator Helios 300 PH315-55
23.5 (14min, 14.6P0.1, 16.1P1) fps ∼39%
NVIDIA GeForce RTX 4060 Laptop GPU, i9-13900HX
XMG Pro 15 E23
20.3 (13.5min, 13.7P0.1, 14.4P1) fps ∼34%
NVIDIA GeForce RTX 4050 Laptop GPU, i9-13900HX
XMG Focus 15 E23
17.4 (14.3min, 14.3P0.1, 14.6P1) fps ∼29%

Note

Since gaming tests are very time-consuming and often restricted by installation or activation limits, we can only provide you with a part of the benchmarks for the publication of the articles. Further graphics cards will be installed later.

Overview

Show Restrictions
PosModel< PrevNext >Starfield
 Starfield (2023)
low
1920x1080
Low Preset
med.
1920x1080
Medium Preset
high
1920x1080
High Preset
ultra
1920x1080
Ultra Preset
QHD
2560x1440
Ultra Preset
4K
3840x2160
Ultra Preset
NVIDIA GeForce RTX 4090
161n3
147.3n3
131.5n3
134.4n2
115.6n4
78.1n3
AMD Radeon RX 7900 XTX
160.5
160.2
159
143.7
127.7
91.1
NVIDIA GeForce RTX 4080 Super
160.5n2
155.1n2
132.2n2
121.9n2
102.5n2
68.35n2
NVIDIA GeForce RTX 4080
123.3
105.1
94.1
80.6
55.3
AMD Radeon RX 7900 XT
105.7
101.5
95.1
88.3
59.6
AMD Radeon RX 6950 XT
137.4
123.6
104.9
96.2
78.4
49.2
NVIDIA GeForce RTX 4090 Laptop GPU
112.7
102.7n2
86.75n2
79.45n2
66.6n2
46.5
NVIDIA GeForce RTX 3090
131.7n2
118.15n2
95.75n2
84.85n2
71.85n2
48.6n2
NVIDIA GeForce RTX 4080 Laptop GPU
90.5
75.1
67.1
56.3
38.4
NVIDIA GeForce RTX 3080 12 GB
106.3
88.5
81.3
66.1
44.9
AMD Radeon RX 6800
104
92.9
78
70.6
57
35.1
AMD Radeon RX 7700 XT
100.5
90.4
73.6
68
55.1
36
NVIDIA Titan RTX
70.6
61.5
54
50.7
41
28.2
NVIDIA GeForce RTX 3070 Ti
86.4
74.9
61.7
56.3
46.7
31.8
NVIDIA GeForce RTX 4060 Ti 16G
94.9
81.7
65.7
57.7
46.6
29.4
NVIDIA GeForce RTX 3080 Ti Laptop GPU
70.3
58
51.8
42.2
27.3
NVIDIA GeForce RTX 4070 Laptop GPU
64.5n2
51.75n2
46.6n2
37.2
24
NVIDIA GeForce RTX 3070
87.1
66.9
59.5
47.9
31.6
AMD Radeon RX 6750 XT
78.45n2
60.8
55.2
44.5
28.2
PosModel< PrevNext >Starfield
low med. high ultra QHD 4K
AMD Radeon RX 6700 XT
81.1
70.9
58.3
53.7
43.2
27.2
NVIDIA GeForce RTX 3080 Laptop GPU
75.4
62.6
51.7
47.8n2
38.85n2
25.15n2
NVIDIA GeForce RTX 3060 Ti
78.4
68.6
55.7
50.4
41.2
27
Intel Arc A770
48.9
42.8
36.3
33.6
28.8
20.5
AMD Radeon RX 7600
80.2
76
61.2
55.5
43.6
26.7
NVIDIA GeForce RTX 3070 Ti Laptop GPU
61.7
50
44.8
36.2
23.5
NVIDIA GeForce RTX 4060 Laptop GPU
70.75n2
61.4n3
47n3
39.8n3
32.55n2
20.3
AMD Radeon RX 6650 XT
71.7
61.8
50
46.2
36.3
22.1
NVIDIA GeForce RTX 3070 Laptop GPU
73.5
64
51.6
47.1
32.5
23.1
AMD Radeon RX 6800S
63.9
54.6
44.6
39.4
AMD Radeon RX 7600M XT
66
57.7
47.9
43.8
35.9
22.5
Intel Arc A750
44.1
38.5
32.9
27.2
16.5
11.2
NVIDIA Titan X Pascal
50.8
43.1
33
31
25.5
16.7
NVIDIA GeForce RTX 2070 Super (Desktop)
55.1
49
40.5
36.6
30
20.1
AMD Radeon RX 5700 XT (Desktop)
66.4
57.4
47.8
43.2
33.9
20.8
NVIDIA GeForce RTX 3060 Laptop GPU
40.1
35.3
28.6
18.8
AMD Radeon RX 7600S
58.8
45.3
40.8
32.3
19.8
Intel Arc A580
55.3
48.8
39.1
32.6
16
10.8
NVIDIA GeForce RTX 2060 Super (Desktop)
54.9
48.1
39.9
35.7
29
18.6
AMD Radeon RX 6600
61.6
52.9
42.3
38.4
29.8
17.8
PosModel< PrevNext >Starfield
low med. high ultra QHD 4K
AMD Radeon RX 5700 (Desktop)
58.6
50.1
41.8
37.5
29.8
18.3
AMD Radeon RX 6600M
58.4n2
49.9n2
39.9n2
36.15n2
28.4n2
17.1n2
AMD Radeon RX 5600 XT (Desktop)
54.2
47.5
38.8
35.4
28
16.9
NVIDIA GeForce GTX 1660 Super (Desktop)
42.2
35.5
26
25.8
20.3
12.6
AMD Radeon RX 6500 XT
42.3
13.9
10.6
9.7
AMD Radeon RX 5500 XT (Desktop)
40.8
34.2
28.1
25.3
19.1
11
NVIDIA GeForce RTX 4050 Laptop GPU
63.8
54.5n3
42.5n3
36.3n3
28.35n2
17.4
Intel Arc A730M
34
30.1
24.8
22
NVIDIA GeForce GTX 1660 Ti Mobile
44.7
37.5
29.6
26.3
NVIDIA GeForce GTX 1660 (Desktop)
38.4
32.8
26.2
23.5
18.6
11.3
NVIDIA GeForce GTX 1650 Super (Desktop)
24
20
13
10
6.1
NVIDIA GeForce RTX 3050 4GB Laptop GPU
41.4
34
25.7
23.1
NVIDIA GeForce GTX 1650 Ti Mobile
29.7
25
19.8
17.3
AMD Radeon RX 5500M
35.5
29.7
24.3
21.8
NVIDIA GeForce RTX 2050 Mobile
24.6
21.4
15.9
13.6
NVIDIA GeForce GTX 1650 Mobile
28.3
23
18.2
15.9
Intel Arc A380
24.2
17.1
11.5
9.8
Intel Arc A310
17.3
14.2
13
10.3
Intel Arc 8-Cores iGPU
11.5
Intel Arc 7-Cores iGPU
19.1
16.5
13.2
10.7
PosModel< PrevNext >Starfield
low med. high ultra QHD 4K
AMD Radeon 780M
27n3
23n3
19n3
16n3
12
7
AMD Radeon 680M
23.2
19.4
14.8
12.7
AMD Radeon 760M
14.3
7.99
5.04
NVIDIA GeForce MX350
12.6
5.08
NVIDIA GeForce MX250
9.82
AMD Radeon RX Vega 10
7.83
AMD Radeon RX Vega 8 (Ryzen 4000/5000)
11.9
9.37
AMD Radeon RX Vega 6 (Ryzen 4000/5000)
8.13
AMD Radeon RX Vega 3
4.82
(-) * Smaller values are better. / n123 Number of benchmarks for this median value / * Approximate position


Legend
5Stutters – This game is very likely to stutter and have poor frame rates. Based on all known benchmarks using the specified graphical settings, average frame rates are expected to fall below 25fps
May Stutter – This graphics card has not been explicitly tested on this game. Based on interpolated information from surrounding graphics cards of similar performance levels, stutters and poor frame rates are expected.
30Fluent – Based on all known benchmarks using the specified graphical settings, this game should run at or above 25fps
40Fluent – Based on all known benchmarks using the specified graphical settings, this game should run at or above 35fps
60Fluent – Based on all known benchmarks using the specified graphical settings, this game should run at or above 58fps
May Run Fluently – This graphics card has not been explicitly tested on this game. Based on interpolated information from surrounding graphics cards of similar performance levels, fluent frame rates are expected.
?Uncertain – This graphics card experienced unexpected performance issues during testing for this game. A slower card may be able to achieve better and more consistent frame rates than this particular GPU running the same benchmark scene.
Uncertain – This graphics card has not been explicitly tested on this game and no reliable interpolation can be made based on the performances of surrounding cards of the same class or family.
The value in the fields displays the average frame rate of all values in the database. Move your cursor over the value to see individual results.

All Test Systems

Notebook Graphics card Processor Memory
XMG Neo 17 E23 Nvidia GeForce RTX 4090 @175 W TGP (16 GB GDDR6X) Intel Core i9-13900HX 2 x 16 GB DDR5
Schenker Key 17 Pro E23 Nvidia GeForce RTX 4080 @175 W TGP (12 GB GDDR6X) Intel Core i9-13900HX 2 x 16 GB DDR5
XMG Pro 15 E23 Nvidia GeForce RTX 4070 @140 W TGP (8 GB GDDR6) Intel Core i9-13900HX 2 x 16 GB DDR5
XMG Pro 15 E23 Nvidia GeForce RTX 4060 @140 W TGP (8 GB GDDR6) Intel Core i9-13900HX 2 x 16 GB DDR5
XMG Focus 15 E23 Nvidia GeForce RTX 4050 @140 W TGP (6 GB GDDR6) Intel Core i9-13900HX 2 x 16 GB DDR5
Asus ROG Strix Scar 17 Nvidia GeForce RTX 3080 Ti @150 W TGP (16 GB GDDR6) Intel Core i9-12900H 2 x 16 GB DDR5
Acer Predator Helios 300 Nvidia GeForce RTX 3070 Ti @150 W TGP (8 GB GDDR6) Intel Core i7-12700H 2 x 8 GB DDR5
Asus ROG Zephyrus G14 AMD Radeon RX 6800S (8 GB GDDR6) & AMD Radeon 680M AMD Ryzen 9 6900HS 2 x 16 GB DDR5
Mini-PC Graphics card Processor Memory
MinisforumNUCXi7 Nvidia GeForce RTX 3070 @125 W TGP (8 GB GDDR6) Intel Core i7-11800H 2 x 8 GB DDR4
Minisforum HX99G AMD Radeon RX 6600M @100 W TGP (8 GB GDDR6) AMD Ryzen 9 6900HX 2 x 16 GB DDR5
Morefine S500+ AMD Radeon RX Vega 8 AMD Ryzen 9 5900HX 2 x 16 GB DDR4
4K monitors operating system Nvidia drivers AMD drivers
Gigabyte M32U Windows 11 ForceWare 537.34 Adrenalin 23.9.2
static version load dynamic
Loading Comments
Comment on this article
Please share our article, every link counts!
> Expert Reviews and News on Laptops, Smartphones and Tech Innovations > Reviews > Starfield in test: Laptop and desktop benchmarks
Florian Glaser, 2023-09-25 (Update: 2023-09-27)