Notebook reviews with AMD Radeon RX Vega 6 (Ryzen 4000/5000) graphics card
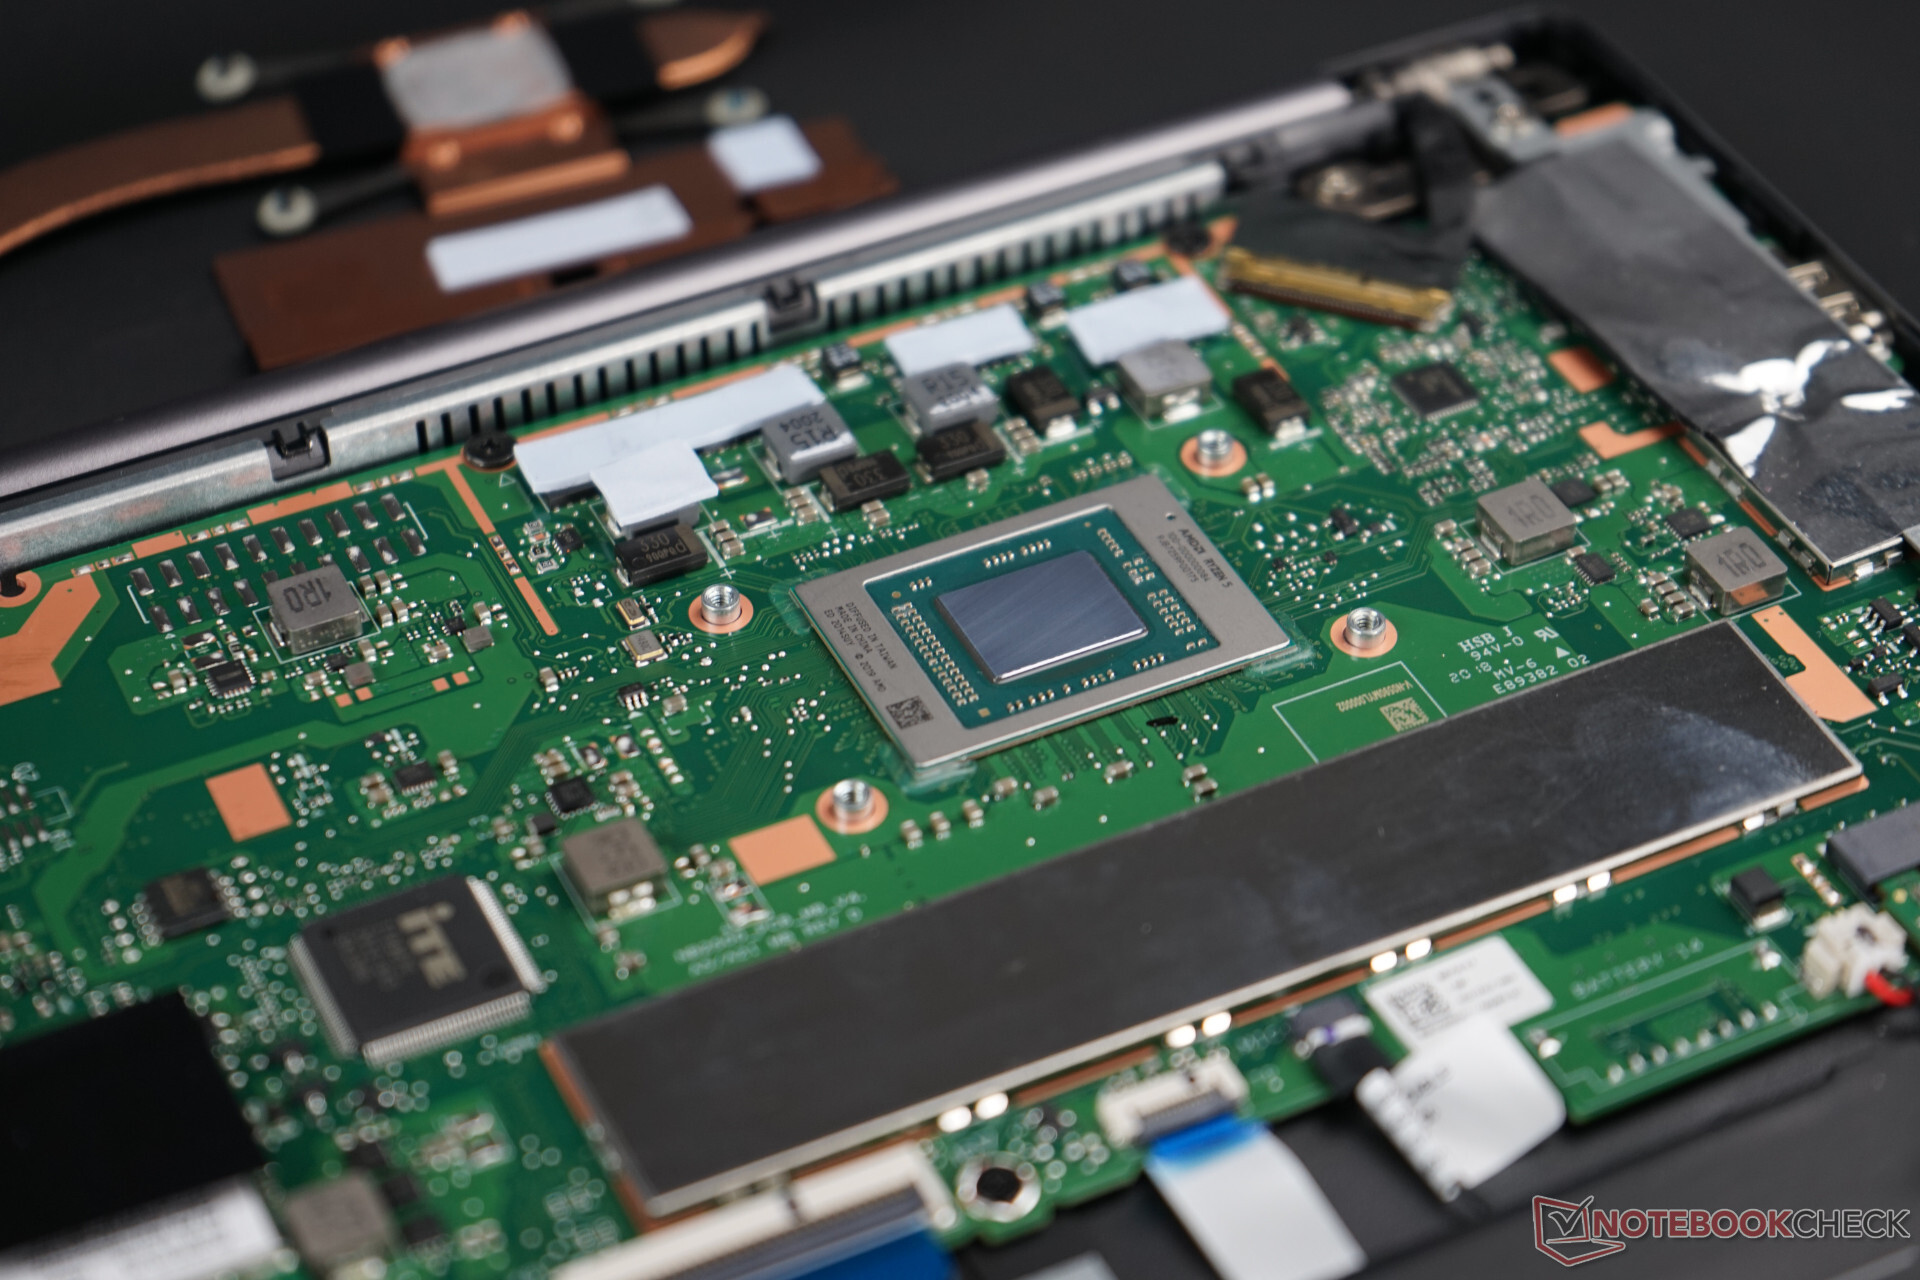
Ryzen 5 5560U performance debut: Beelink SER5 mini PC review
The Ryzen 5560U may be a couple years old, but it performs so similarly to the new Ryzen 5 7530U that most users would be unable to tell the difference especially for basic HTPC purposes. The SER5 is quite the bargain for just $230 USD complete with Windows 11.
AMD Ryzen 5 5560U, Vega 6, 439 gLenovo IdeaPad 3 14 AMD laptop review: Masters all core aspects
The smooth-running Lenovo IdeaPad 3 14 AMD offers all the important core aspects of an office laptop — a sufficiently bright IPS display, high CPU power, really good input devices, and expandable working and mass storage — for a low price of under €500. In this review, we test whether there are any real drawbacks as well.
AMD Ryzen 3 5300U, Vega 6, 14", 1.4 kgLG Ultra PC 16 (2022) AMD review: This is not a gram.
It is called an Ultra PC and is cheaper than a gram. This 16-inch laptop has a longer battery life than the already long-lasting Intel-based LG gram. What's more, the device only needs a 72 Wh battery (rather than 80 Wh) to achieve this level of battery life. At 400 g heavier, the Ultra PC is admittedly not quite a "gram", but it is still a respectable piece of hardware no less.
AMD Ryzen 3 5300U, Vega 6, 16", 1.6 kgRyzen 3 outperforming Core i3: Lenovo IdeaPad 3 15ALC6 laptop review
The IdeaPad 3 15 is a budget system that doesn't skimp on performance even when compared to a Core i7 in certain conditions. Though it feels fast for the price, the limited color space of the display and lack of some USB-C features can be disappointing.
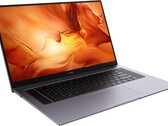
AMD Ryzen 3 5300U, Vega 6, 15.6", 1.7 kgHuawei MateBook D 16 in review: A lot of AMD power and hardly any points of criticism
With the MateBook D 16, Huawei offers an interesting and affordable multimedia laptop at an MSRP of 900 Euros (~$1,088). The device offers a 16.1-inch display packed into an elegant metal case. Can the Huawei MateBook D 16 convince in the test as much as its first impression suggests?
AMD Ryzen 5 4600H, Vega 6, 16.1", 1.7 kgTuxedo Pulse 15: AMD Ryzen 5 4600H, 15.60", 1.5 kg
Review » Tuxedo Pulse 15 Laptop Review - AMD-powered 15-inch Linux Ultrabook
Honor MagicBook 15 4500U: AMD Ryzen 5 4500U, 15.60", 1.5 kg
Review » Honor MagicBook 15 laptop in review: Inexpensive and powerful
Lenovo ThinkPad L14-20U50003GE: AMD Ryzen 5 4500U, 14.00", 1.7 kg
Review » Lenovo ThinkPad L14 Review: AMD Does It Again
Honor MagicBook 14, Ryzen 5 4500U: AMD Ryzen 5 4500U, 14.00", 1.4 kg
Review » Honor MagicBook 14 in review: Enduring laptop with Ryzen 5 4500U
HP EliteBook 855 G7-23Y52EA: AMD Ryzen 5 PRO 4650U, 15.60", 1.7 kg
Review » HP EliteBook 855 G7 Laptop Review - Stylish office laptop for on the go
Lenovo IdeaPad S540-13ARE-82DL000YGE: AMD Ryzen 5 4600U, 13.30", 1.3 kg
Review » Lenovo IdeaPad S540 13-inch Laptop Review: Ryzen has turned this small office laptop into a real powerhouse
HP EliteBook 835 G7 23Y57EA: AMD Ryzen 5 PRO 4650U, 13.30", 1.4 kg
Review » HP EliteBook 835 G7 laptop review: Upgradeable AMD compact class
Lenovo ThinkPad T14-20UES00H00: AMD Ryzen 5 PRO 4650U, 14.00", 1.5 kg
Review » Lenovo ThinkPad T14 AMD Review: Best Business Laptop you can buy?
HP EliteBook 845 G7-23Y60EA: AMD Ryzen 5 PRO 4650U, 14.00", 1.5 kg
Review » HP EliteBook 845 G7 review: AMD laptop is also better with Ryzen 5 than with Intel
Honor MagicBook Pro (AMD): AMD Ryzen 5 4600H, 16.10", 1.7 kg
Review » Honor MagicBook Pro in review - 16-inch multimedia laptop with a lot of power
HP Envy x360 15-ee0257ng: AMD Ryzen 5 4500U, 15.60", 2 kg
Review » HP Envy x360 15 (2020) Review: Ryzen 5 with bad performance utilization
HP ProBook x360 435 G7, Ryzen 5 4500U: AMD Ryzen 5 4500U, 13.30", 1.4 kg
Review » HP ProBook x360 435 G7 laptop review: AMD Ryzen also shines in the business convertible
Lenovo ThinkPad E14 Gen2-20T7S00W00: AMD Ryzen 5 4500U, 14.00", 1.6 kg
Review » Lenovo ThinkPad E14 Gen 2 laptop review: Affordable and fast thanks to AMD Renoir
HP ProBook 445 G7 175W4EA: AMD Ryzen 5 4500U, 14.00", 1.6 kg
Review » HP ProBook 445 G7 laptop review: Moving forward with Renoir
Xiaomi RedmiBook 16 R5: AMD Ryzen 5 4500U, 16.00", 1.8 kg
Review » Xiaomi RedmiBook 16 Ryzen 5 4500U laptop review - attractive price warrior from the Far East
Lenovo IdeaPad 5 14ARE05: AMD Ryzen 5 4500U, 14.00", 1.4 kg
Review » Lenovo IdeaPad 5 14ARE05 in review: A lot of computing power in a compact case
HP Envy x360 13-ay0010nr: AMD Ryzen 5 4500U, 13.30", 1.3 kg
Review » 2020 HP Envy x360 13 Convertible 2-in-1 Review: Ryzen 5 Beats a Core i7
HP 255 G10: AMD Ryzen 3 7330U, 15.60", 1.5 kg
External Review » HP 255 G10
Lenovo IdeaPad Slim 3 16ABR8: AMD Ryzen 3 7330U, 16.00", 1.7 kg
External Review » Lenovo IdeaPad Slim 3 16ABR8
Lenovo ThinkBook 14 G3 ACL, Ryzen 3 5300U: AMD Ryzen 3 5300U, 14.00", 1.4 kg
External Review » Lenovo ThinkBook 14 G3 ACL, Ryzen 3 5300U
HP 255 G8, R3 5300U: AMD Ryzen 3 5300U, 15.60", 1.7 kg
External Review » HP 255 G8, R3 5300U
Lenovo IdeaPad 5 14ABA7, R3 5425U: AMD Ryzen 3 5425U, 14.00", 1.4 kg
External Review » Lenovo IdeaPad 5 14ABA7, R3 5425U
Lenovo V14 G2 ALC, R3 5300U: AMD Ryzen 3 5300U, 15.60", 1.7 kg
External Review » Lenovo V14 G2 ALC, R3 5300U
Lenovo IdeaPad 5 14 ABA7, R3 5425U: AMD Ryzen 3 5425U, 14.00", 1.4 kg
External Review » Lenovo IdeaPad 5 14 ABA7, R3 5425U
Lenovo V15 G2 ALC, Ryzen 3 5300U: AMD Ryzen 3 5300U, 15.60", 1.7 kg
External Review » Lenovo V15 G2 ALC, Ryzen 3 5300U
HP 15s-eq2121ns: AMD Ryzen 3 5300U, 15.60", 1.7 kg
External Review » HP 15s-eq2121ns
HP 15s-eq2123ns: AMD Ryzen 3 5300U, 15.60", 1.7 kg
External Review » HP 15s-eq2123ns
Lenovo IdeaPad 3 15ALC6: AMD Ryzen 3 5300U, 15.60", 1.7 kg
External Review » Lenovo IdeaPad 3 15ALC6
HP Envy x360 15-ee0257ng: AMD Ryzen 5 4500U, 15.60", 2 kg
External Review » HP Envy x360 15-ee0257ng
Acer Swift 3 SF314-43-R4JU: AMD Ryzen 3 5300U, 14.00", 1.2 kg
External Review » Acer Swift 3 SF314-43-R4JU
HP 15s-eq2065ns: AMD Ryzen 3 5300U, 15.60", 1.7 kg
External Review » HP 15s-eq2065ns
Lenovo IdeaPad 3 15ALC6-LASP: AMD Ryzen 3 5300U, 15.60", 1.7 kg
External Review » Lenovo IdeaPad 3 15ALC6-LASP
Huawei MateBook 16 R5 5600H: AMD Ryzen 5 5600H, 16.00", 2 kg
External Review » Huawei MateBook 16 R5 5600H
Lenovo ThinkPad E14 G3-20Y700CTGE: AMD Ryzen 3 5300U, 14.00", 1.6 kg
External Review » Lenovo ThinkPad E14 G3-20Y700CTGE
HP 15s-eq2082ns: AMD Ryzen 3 5300U, 15.60", 1.7 kg
External Review » HP 15s-eq2082ns
Lenovo Thinkbook 14p G2 ACH, 5600H: AMD Ryzen 5 5600H, 14.00", 1.4 kg
External Review » Lenovo Thinkbook 14p G2 ACH, 5600H
Honor MagicBook 16: AMD Ryzen 5 5600H, 16.10", 1.8 kg
External Review » Honor MagicBook 16
Lenovo IdeaPad 3 15ALC6-82KU00FGMH: AMD Ryzen 3 5300U, 15.60", 1.7 kg
External Review » Lenovo IdeaPad 3 15ALC6-82KU00FGMH
HP Pavilion 14-ec0008AU: AMD Ryzen 3 5300U, 14.00", 1.4 kg
External Review » HP Pavilion 14-ec0008AU
Lenovo IdeaPad 5 14ARE05-81YM00F7MH: AMD Ryzen 5 4600U, 14.00", 1.4 kg
External Review » Lenovo IdeaPad 5 14ARE05-81YM00F7MH
Asus VivoBook Pro 15 M3500QA-L1149T: AMD Ryzen 5 5600H, 15.60", 1.7 kg
External Review » Asus VivoBook Pro 15 M3500QA-L1149T
Acer Swift 3 SF314-42-R0EG: AMD Ryzen 5 4500U, 14.00", 1.2 kg
External Review » Acer Swift 3 SF314-42-R0EG
Asus ZenBook 14X UM5401, 5600H: AMD Ryzen 5 5600H, 14.00", 1.4 kg
External Review » Asus ZenBook 14X UM5401, 5600H
HP 15s-eq2043ns: AMD Ryzen 3 5300U, 15.60", 1.7 kg
External Review » HP 15s-eq2043ns
Lenovo IdeaPad 5 Pro 16ACH6-82L5005TMH: AMD Ryzen 5 5600H, 16.10", 1.9 kg
External Review » Lenovo IdeaPad 5 Pro 16ACH6-82L5005TMH
Acer Swift 3 SF314-42-R0V4: AMD Ryzen 5 4500U, 14.00", 1.2 kg
External Review » Acer Swift 3 SF314-42-R0V4
HP ProBook 635 Aero G7-2W8S6EA: AMD Ryzen 5 4500U, 13.30", 1 kg
External Review » HP ProBook 635 Aero G7-2W8S6EA
Lenovo IdeaPad 5 15ARE05-81YQ0030MH: AMD Ryzen 5 4500U, 15.60", 0.7 kg
External Review » Lenovo IdeaPad 5 15ARE05-81YQ0030MH
Lenovo Yoga Slim 7 Pro 14ARH5-82MS0073SB: AMD Ryzen 5 5600H, 14.00", 1.3 kg
External Review » Lenovo Yoga Slim 7 Pro 14ARH5-82MS0073SB
Medion Akoya E15303: AMD Ryzen 5 4500U, 15.60", 1.8 kg
External Review » Medion Akoya E15303
MSI Modern 14 B4MW-056XES: AMD Ryzen 5 4500U, 14.00", 1.3 kg
External Review » MSI Modern 14 B4MW-056XES
HP 15s-eq1104ns: AMD Ryzen 5 4500U, 15.60", 1.7 kg
External Review » HP 15s-eq1104ns
HP 15s-eq1070ns: AMD Ryzen 5 4500U, 15.60", 1.7 kg
External Review » HP 15s-eq1070ns
HP EliteBook 845 G7-23Y60EA: AMD Ryzen 5 PRO 4650U, 14.00", 1.5 kg
External Review » HP EliteBook 845 G7-23Y60EA
HP 15s-eq1069ns: AMD Ryzen 5 4500U, 15.60", 1.7 kg
External Review » HP 15s-eq1069ns
Lenovo IdeaPad 3 14ALC6-82KT0066GE: AMD Ryzen 3 5300U, 14.00", 1.4 kg
External Review » Lenovo IdeaPad 3 14ALC6-82KT0066GE
Asus VivoBook 14 M413IA-HM899T: AMD Ryzen 5 4500U, 14.00", 1.4 kg
External Review » Asus VivoBook 14 M413IA-HM899T
HP 15s-eq1101ns: AMD Ryzen 5 4500U, 15.60", 1.7 kg
External Review » HP 15s-eq1101ns
Acer Aspire 5 A515-45-R5B9: AMD Ryzen 3 5300U, 15.60", 1.8 kg
External Review » Acer Aspire 5 A515-45-R5B9
HP EliteBook 835 G7 23Y57EA: AMD Ryzen 5 PRO 4650U, 13.30", 1.4 kg
External Review » HP EliteBook 835 G7 23Y57EA
HP Pavilion 15-eh0000ns: AMD Ryzen 5 4500U, 15.60", 1.8 kg
External Review » HP Pavilion 15-eh0000ns
Lenovo Yoga 6 13ARE05-82FN000TGE: AMD Ryzen 5 4500U, 13.30", 1.4 kg
External Review » Lenovo Yoga 6 13ARE05-82FN000TGE
Huawei MateBook D 16-53011VFJ: AMD Ryzen 5 4600H, 16.10", 1.7 kg
External Review » Huawei MateBook D 16-53011VFJ
Lenovo IdeaPad 3 15ARE05-81W4005AMH: AMD Ryzen 5 4500U, 15.60", 1.7 kg
External Review » Lenovo IdeaPad 3 15ARE05-81W4005AMH
Lenovo Yoga Slim 7 14ARE05-82A20073MH: AMD Ryzen 5 4500U, 14.00", 1.4 kg
External Review » Lenovo Yoga Slim 7 14ARE05-82A20073MH
HP 15s-eq1050ns: AMD Ryzen 5 4500U, 15.60", 1.7 kg
External Review » HP 15s-eq1050ns
HP 15s-eq1054ns: AMD Ryzen 5 4500U, 15.60", 1.7 kg
External Review » HP 15s-eq1054ns
Honor MagicBook 15 4500U: AMD Ryzen 5 4500U, 15.60", 1.5 kg
External Review » Honor MagicBook 15 4500U
Lenovo ThinkPad T14s-20UJ0014GE: AMD Ryzen 5 PRO 4650U, 14.00", 1.3 kg
External Review » Lenovo ThinkPad T14s-20UJ0014GE
Asus ZenBook 14 UM425IA-AM005T: AMD Ryzen 5 4500U, 14.00", 1.3 kg
External Review » Asus ZenBook 14 UM425IA-AM005T
Huawei MateBook 14 2020 AMD 4600H: AMD Ryzen 5 4600H, 14.00", 1.5 kg
External Review » Huawei MateBook 14 2020, 4600H
Lenovo ThinkPad E14-20T6000RSP: AMD Ryzen 5 4500U, 14.00", 1.7 kg
External Review » Lenovo ThinkPad E14-20T6000RSP
Acer Swift 3 SF314-42-R2MP: AMD Ryzen 5 4500U, 14.00", 1.2 kg
External Review » Acer Swift 3 SF314-42-R2MP
Honor MagicBook 15 2020: AMD Ryzen 5 4500U, 15.60", 1.6 kg
External Review » Honor MagicBook 15 2020
Huawei MateBook 14 2020 KLVL-WFH9: AMD Ryzen 5 4600H, 14.00", 1.5 kg
External Review » Huawei MateBook 14 2020 KLVL-WFH9
HP ProBook 455 G7-12X20EA: AMD Ryzen 5 4500U, 15.60", 2 kg
External Review » HP ProBook 455 G7-12X20EA
Asus ZenBook 14 UM425I: AMD Ryzen 5 4500U, 14.00", 1.2 kg
External Review » Asus ZenBook 14 UM425I
HP ProBook 445 G7 175W4EA: AMD Ryzen 5 4500U, 14.00", 1.6 kg
External Review » HP ProBook 445 G7 175W4EA
Huawei MateBook D 15 2020 AMD: AMD Ryzen 5 4500U, 15.60", 1.5 kg
External Review » Huawei MateBook D 15 2020 AMD
Lenovo IdeaPad 3 15ARE05-81W4006GMB: AMD Ryzen 5 4500U, 15.60", 1.9 kg
External Review » Lenovo IdeaPad 3 15ARE05-81W4006GMB
Lenovo ThinkPad E15 20T8000YMH: AMD Ryzen 5 4500U, 15.60"
External Review » Lenovo ThinkPad E15 20T8000YMH
Acer Swift 3 SF314-42-R8WD: AMD Ryzen 5 4500U, 14.00", 1.2 kg
External Review » Acer Swift 3 SF314-42-R8WD
MSI Modern 14 B4MW-048: AMD Ryzen 5 4500U, 14.00", 1.3 kg
External Review » MSI Modern 14 B4MW-048
Acer Aspire 5 A515-44-R41B: AMD Ryzen 5 4500U, 15.60", 1.8 kg
External Review » Acer Aspire 5 A515-44-R41B
Honor MagicBook 14, Ryzen 5 4500U: AMD Ryzen 5 4500U, 14.00", 1.4 kg
External Review » Honor MagicBook 14, Ryzen 5 4500U
Honor MagicBook Pro (AMD): AMD Ryzen 5 4600H, 16.10", 1.7 kg
External Review » Honor MagicBook Pro 4600H
HP Envy x360 13-ay0800no: AMD Ryzen 5 4500U, 13.30", 1.3 kg
External Review » HP Envy x360 13-ay0800no
Lenovo IdeaPad 5 14ARE05-81YM000JCK: AMD Ryzen 5 4500U, 14.00", 1.5 kg
External Review » Lenovo IdeaPad 5 14ARE05-81YM000JCK
Acer Swift 3 SF314-42-R4VD: AMD Ryzen 5 4500U, 14.00", 1.2 kg
External Review » Acer Swift 3 SF314-42-R4VD
Asus ZenBook 14 UM425IA-HM067R: AMD Ryzen 5 4500U, 14.00", 1.1 kg
External Review » Asus ZenBook 14 UM425IA-HM067R
Lenovo ThinkPad T14-20UD0010GE: AMD Ryzen 5 PRO 4650U, 14.00", 1.5 kg
External Review » Lenovo ThinkPad T14-20UD0010GE
Asus VivoBook S15 M533IA-BQ034T: AMD Ryzen 5 4500U, 15.60", 1.8 kg
External Review » Asus VivoBook S15 M533IA-BQ034T
HP Envy x360 13-ay0010nr: AMD Ryzen 5 4500U, 13.30", 1.3 kg
External Review » HP Envy x360 13-ay0010nr
Lenovo IdeaPad 5 14ARE05-81YM007EMH: AMD Ryzen 5 4500U, 14.00", 1.4 kg
External Review » Lenovo IdeaPad 5 14ARE05-81YM007EMH
Acer Swift 3 SF314-42-R8ZV: AMD Ryzen 5 4500U, 14.00", 1.2 kg
External Review » Acer Swift 3 SF314-42-R8ZV
HP Envy x360 13-ay0001nd: AMD Ryzen 5 4500U, 13.30", 1.3 kg
External Review » HP Envy x360 13-ay0001nd
Lenovo IdeaPad 5 14ARE05: AMD Ryzen 5 4500U, 14.00", 1.4 kg
External Review » Lenovo IdeaPad 5 14ARE05
Lenovo Yoga Slim 7 14ARE05, Ryzen 5 4500U: AMD Ryzen 5 4500U, 14.00", 1.3 kg
External Review » Lenovo Yoga Slim 7 14ARE05, Ryzen 5 4500U
Lenovo IdeaPad Flex 5 14ARE05-81X2006QMH: AMD Ryzen 5 4500U, 14.00"
External Review » Lenovo IdeaPad Flex 5 14ARE05-81X2006QMH
Lenovo IdeaPad Flex 5 14ARE05-81X2003MMH: AMD Ryzen 5 4500U, 14.00", 1.5 kg
External Review » Lenovo IdeaPad Flex 5 14ARE05-81X2003MMH
HP Envy x360 13-ay0001ns: AMD Ryzen 5 4500U, 13.30", 1.3 kg
External Review » HP Envy x360 13-ay0001ns
Lenovo IdeaPad 5 15ARE05-81YQ002BMH: AMD Ryzen 5 4500U, 15.60", 1.6 kg
External Review » Lenovo IdeaPad 5 15ARE05-81YQ002BMH
Lenovo ThinkPad X13 AMD, Ryzen 5 Pro 4650U: AMD Ryzen 5 PRO 4650U, 13.30", 1.3 kg
External Review » Lenovo ThinkPad X13 AMD, Ryzen 5 Pro 4650U
Lenovo IdeaPad Flex 5 14 AMD 81X20005US: AMD Ryzen 5 4500U, 14.00", 1.7 kg
External Review » Lenovo Flex 5 14 AMD 81X20005US
Acer Swift 3 SF314-42-R1PR: AMD Ryzen 5 4500U, 14.00", 1.2 kg
External Review » Acer Swift 3 SF314-42-R1PR
HP ProBook x360 435 G7, Ryzen 5 4500U: AMD Ryzen 5 4500U, 13.30", 1.4 kg
External Review » HP ProBook x360 435 G7, Ryzen 5 4500U
Lenovo V14 G2 ALC, R3 5300U: AMD Ryzen 3 5300U, 15.60", 1.7 kg
» Lenovo V14 Gen 2 reviewed: A silent, affordable office laptop, thanks to passive cooling.
Lenovo IdeaPad 3 15ALC6: AMD Ryzen 3 5300U, 15.60", 1.7 kg
» AMD Ryzen 3 5300U benchmarked: Intel Core i3 has every reason to worry
Tuxedo Pulse 15: AMD Ryzen 5 4600H, 15.60", 1.5 kg
» Tuxedo Pulse 15 combines Linux with AMD power and long battery life
Honor MagicBook 14, Ryzen 5 4500U: AMD Ryzen 5 4500U, 14.00", 1.4 kg
» Honor MagicBook 14: Ryzen 5 with top performance
Lenovo IdeaPad S540-13ARE-82DL000YGE: AMD Ryzen 5 4600U, 13.30", 1.3 kg
» Lenovo IdeaPad S540 13-inch: AMD Ryzen ensures a very good rating despite cut corners
HP EliteBook 835 G7 23Y57EA: AMD Ryzen 5 PRO 4650U, 13.30", 1.4 kg
» HP reinforces negative stereotypes about business laptops with the EliteBook 835 G7
Lenovo ThinkPad T14-20UES00H00: AMD Ryzen 5 PRO 4650U, 14.00", 1.5 kg
» Lenovo's ThinkPad T14 is also better with AMD Ryzen
HP EliteBook 845 G7-23Y60EA: AMD Ryzen 5 PRO 4650U, 14.00", 1.5 kg
» HP EliteBook 845 G7: Top laptop suffers from too dim display
Honor MagicBook Pro (AMD): AMD Ryzen 5 4600H, 16.10", 1.7 kg
» Honor offers a good multimedia laptop at a fair price with the MagicBook Pro
HP Envy x360 15-ee0257ng: AMD Ryzen 5 4500U, 15.60", 2 kg
» 15.6-inch Convertible With Pen Support: The HP Envy x360 15 (2020)
HP ProBook x360 435 G7, Ryzen 5 4500U: AMD Ryzen 5 4500U, 13.30", 1.4 kg
» HP ProBook x360 435 G7: AMD Ryzen 4000 as unique selling point
Honor MagicBook Pro (AMD): AMD Ryzen 5 4600H, 16.10", 1.7 kg
» Honor MagicBook Pro: Exclusive hands-on of the 16-inch laptop with Ryzen 5 4600H SoC
Lenovo ThinkPad E14 Gen2-20T7S00W00: AMD Ryzen 5 4500U, 14.00", 1.6 kg
» The Lenovo ThinkPad E14 AMD is the best E ThinkPad till now
HP ProBook 445 G7 175W4EA: AMD Ryzen 5 4500U, 14.00", 1.6 kg
» HP ProBook 445 G7: A darker display in exchange for better battery life
Lenovo IdeaPad 5 14ARE05: AMD Ryzen 5 4500U, 14.00", 1.4 kg
» Powerful subnotebook thanks to Ryzen 5 4500U: Lenovo IdeaPad 5 14ARE05
HP Envy x360 13-ay0010nr: AMD Ryzen 5 4500U, 13.30", 1.3 kg
» AMD hitting Intel where it hurts: 2020 Ryzen 5 HP Envy x360 13 vs. Intel Core i7 Spectre x360 13
Xiaomi RedmiBook 16 R5: AMD Ryzen 5 4500U, 16.00", 1.8 kg
» Xiaomi RedmiBook 16 R5 laptop in the test - Great price-performance ratio with drawbacks
HP Envy x360 13-ay0010nr: AMD Ryzen 5 4500U, 13.30", 1.3 kg
» Some AMD Zen 2 laptops are suffering from extreme 4K playback issues; the latest Radeon drivers provide the hotfix