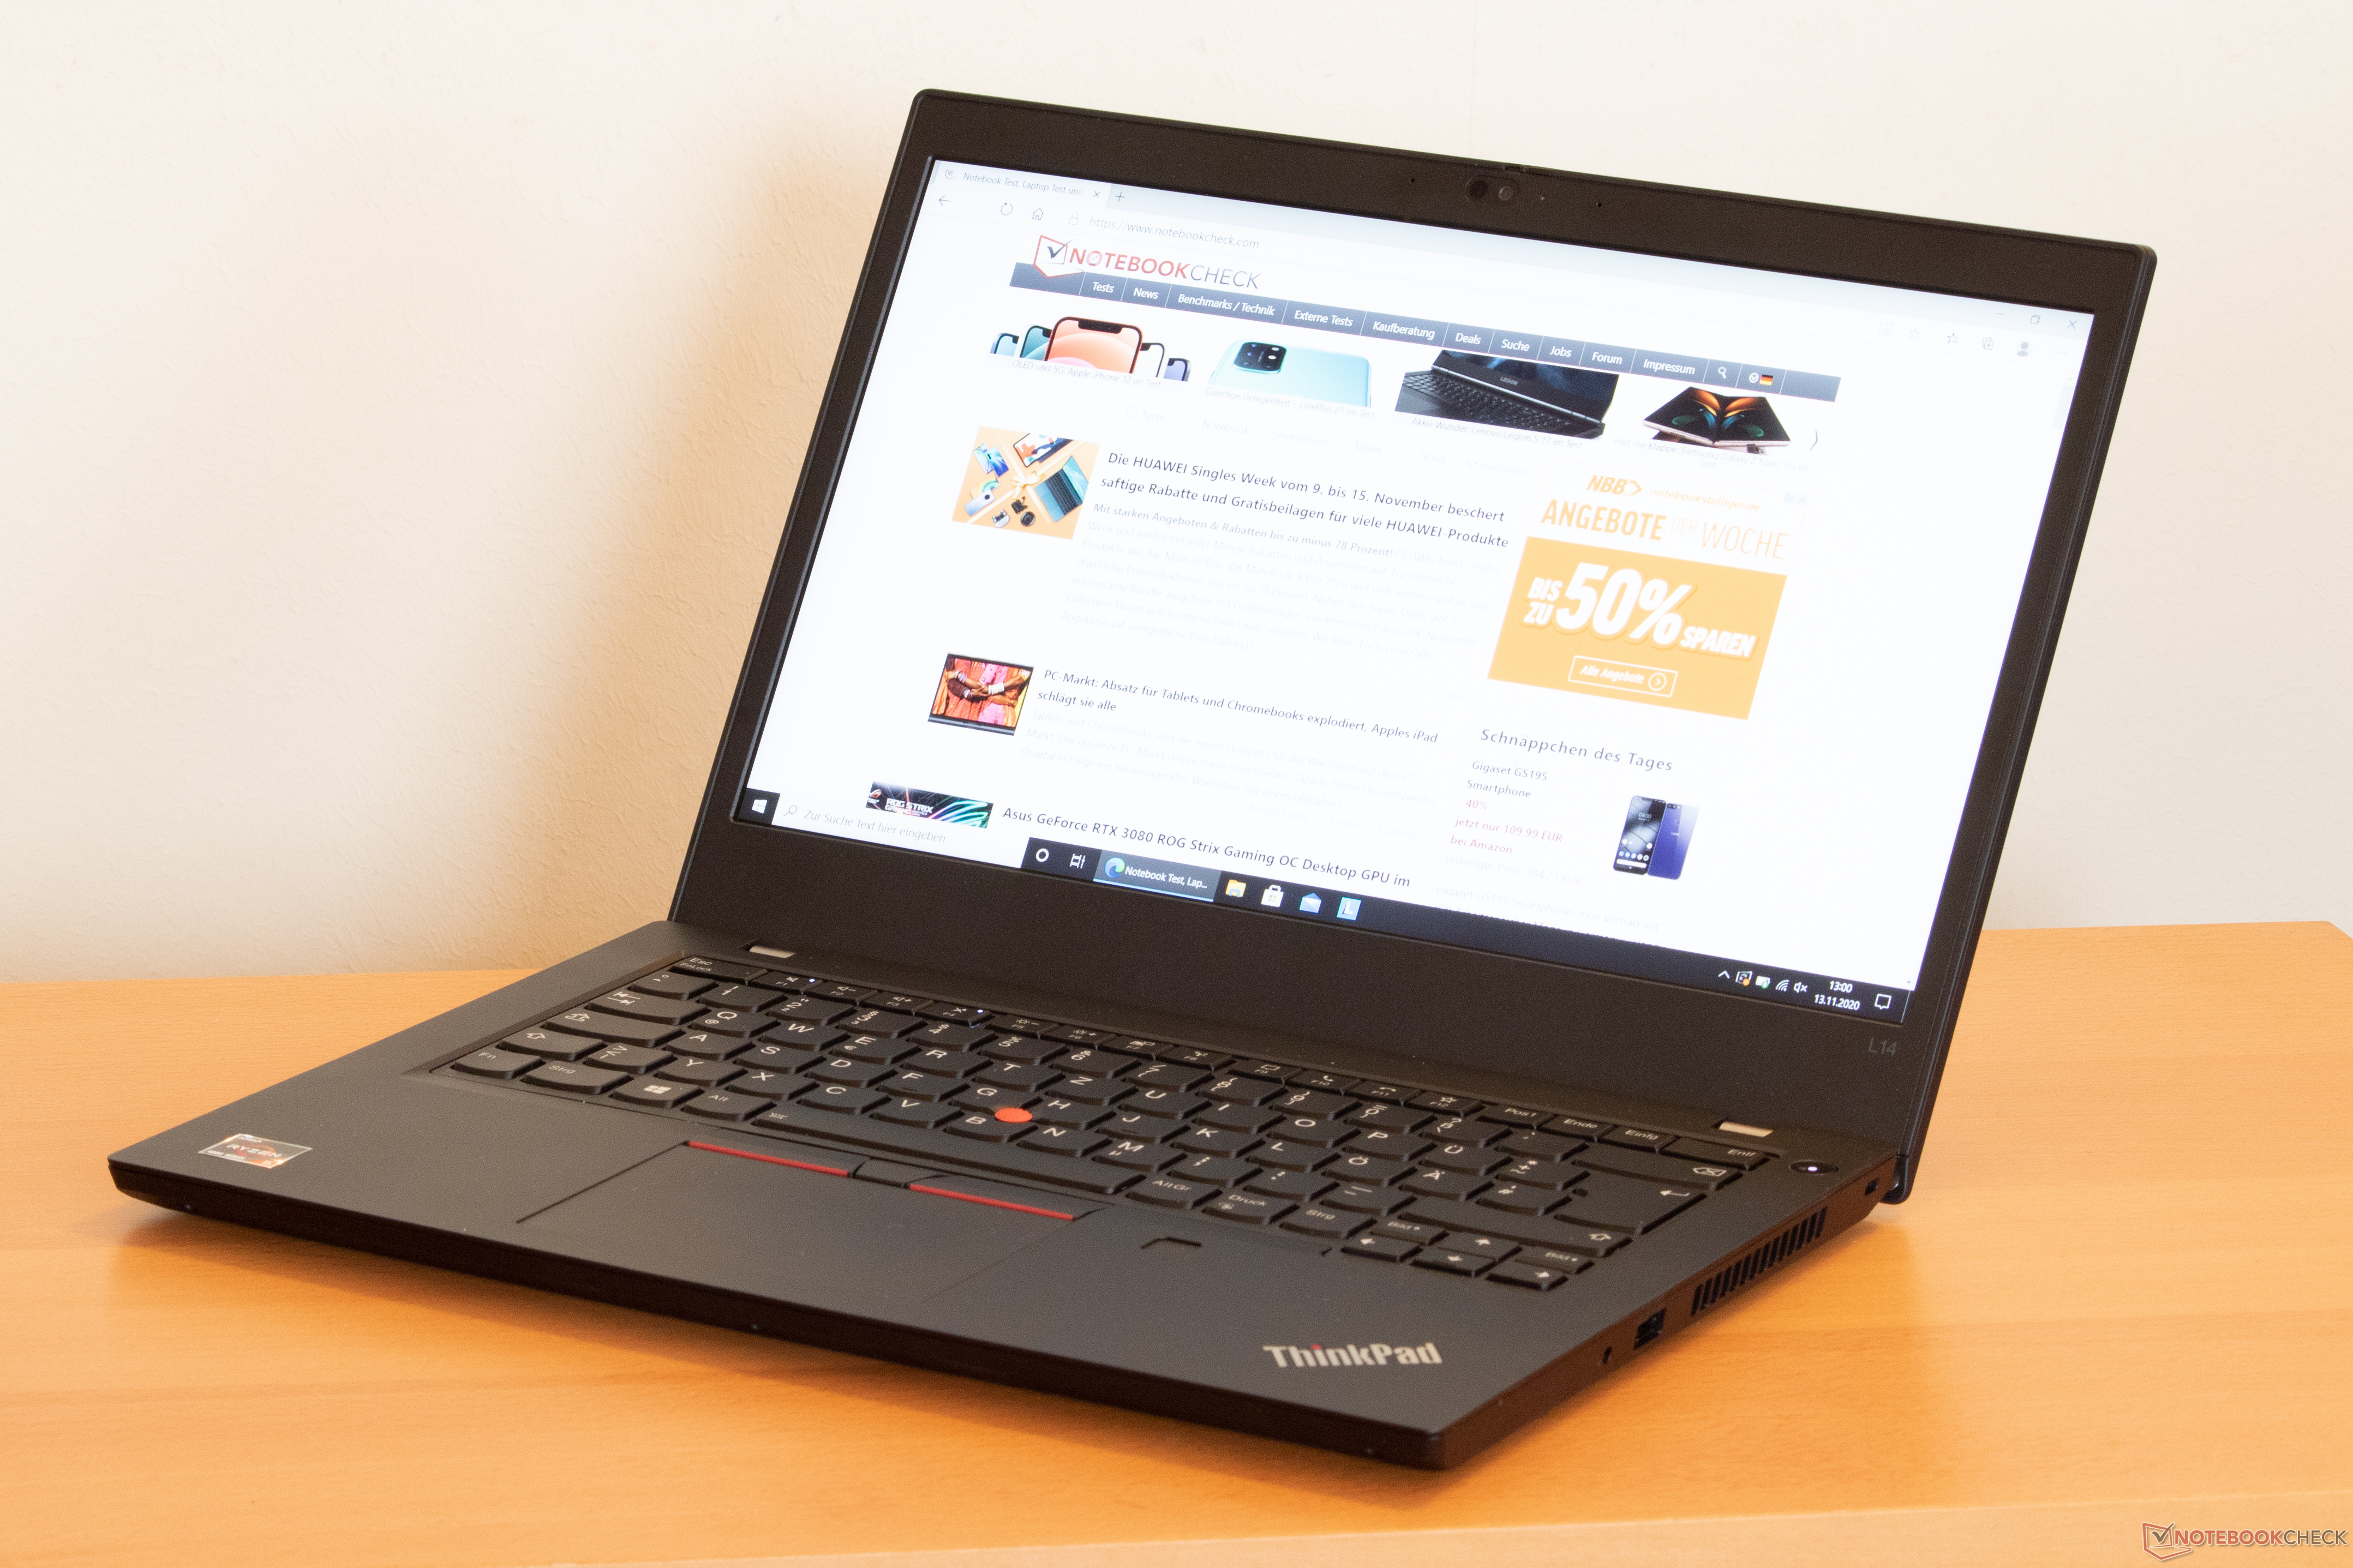
Lenovo ThinkPad L14 Review: AMD Does It Again
The Lenovo ThinkPad L14 is successor to last year’s 14-inch ThinkPad L490. During last year’s review, we noticed that neither the display nor the CPU performed particularly well despite what turned out to be an overall decent package. This year, for the first time in the history of Lenovo’s L-series, you can choose between an Intel and an AMD processor. Lenovo’s L-series sits right in-between the higher-quality T-series and the more affordable entry-level E-series and is aimed primarily at business users. Given that the L14 shares many of its exterior attributes with its predecessor we are going to focus mainly on the new AMD CPU in this review.
Rating | Date | Model | Weight | Height | Size | Resolution | Price |
|---|---|---|---|---|---|---|---|
| 85 % v7 (old) | 12 / 2020 | Lenovo ThinkPad L14-20U50003GE R5 4500U, Vega 6 | 1.7 kg | 20.4 mm | 14.00" | 1920x1080 | |
| 85 % v7 (old) | 09 / 2019 | Lenovo ThinkPad L490 20Q6S08600 i5-8265U, UHD Graphics 620 | 1.7 kg | 22.5 mm | 14.00" | 1920x1080 | |
| 85.6 % v7 (old) | 08 / 2020 | Lenovo ThinkPad E14 Gen2-20T7S00W00 R5 4500U, Vega 6 | 1.6 kg | 17.9 mm | 14.00" | 1920x1080 | |
| 88.8 % v7 (old) | 07 / 2020 | Lenovo ThinkPad T14s-20T00044GE i5-10210U, UHD Graphics 620 | 1.3 kg | 16.1 mm | 14.00" | 1920x1080 | |
| 83.2 % v7 (old) | 07 / 2020 | HP ProBook 445 G7 175W4EA R5 4500U, Vega 6 | 1.6 kg | 18 mm | 14.00" | 1920x1080 | |
| 85.3 % v7 (old) | 10 / 2020 | Dell Latitude 14 5410-RJ80D i5-10310U, UHD Graphics 620 | 1.6 kg | 20.7 mm | 14.00" | 1920x1080 |
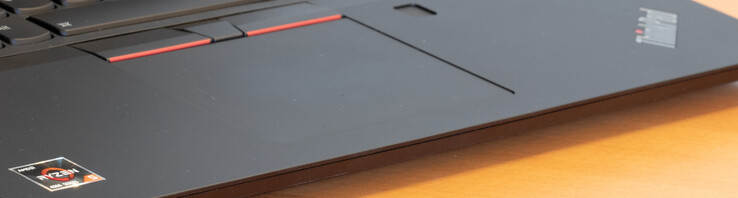
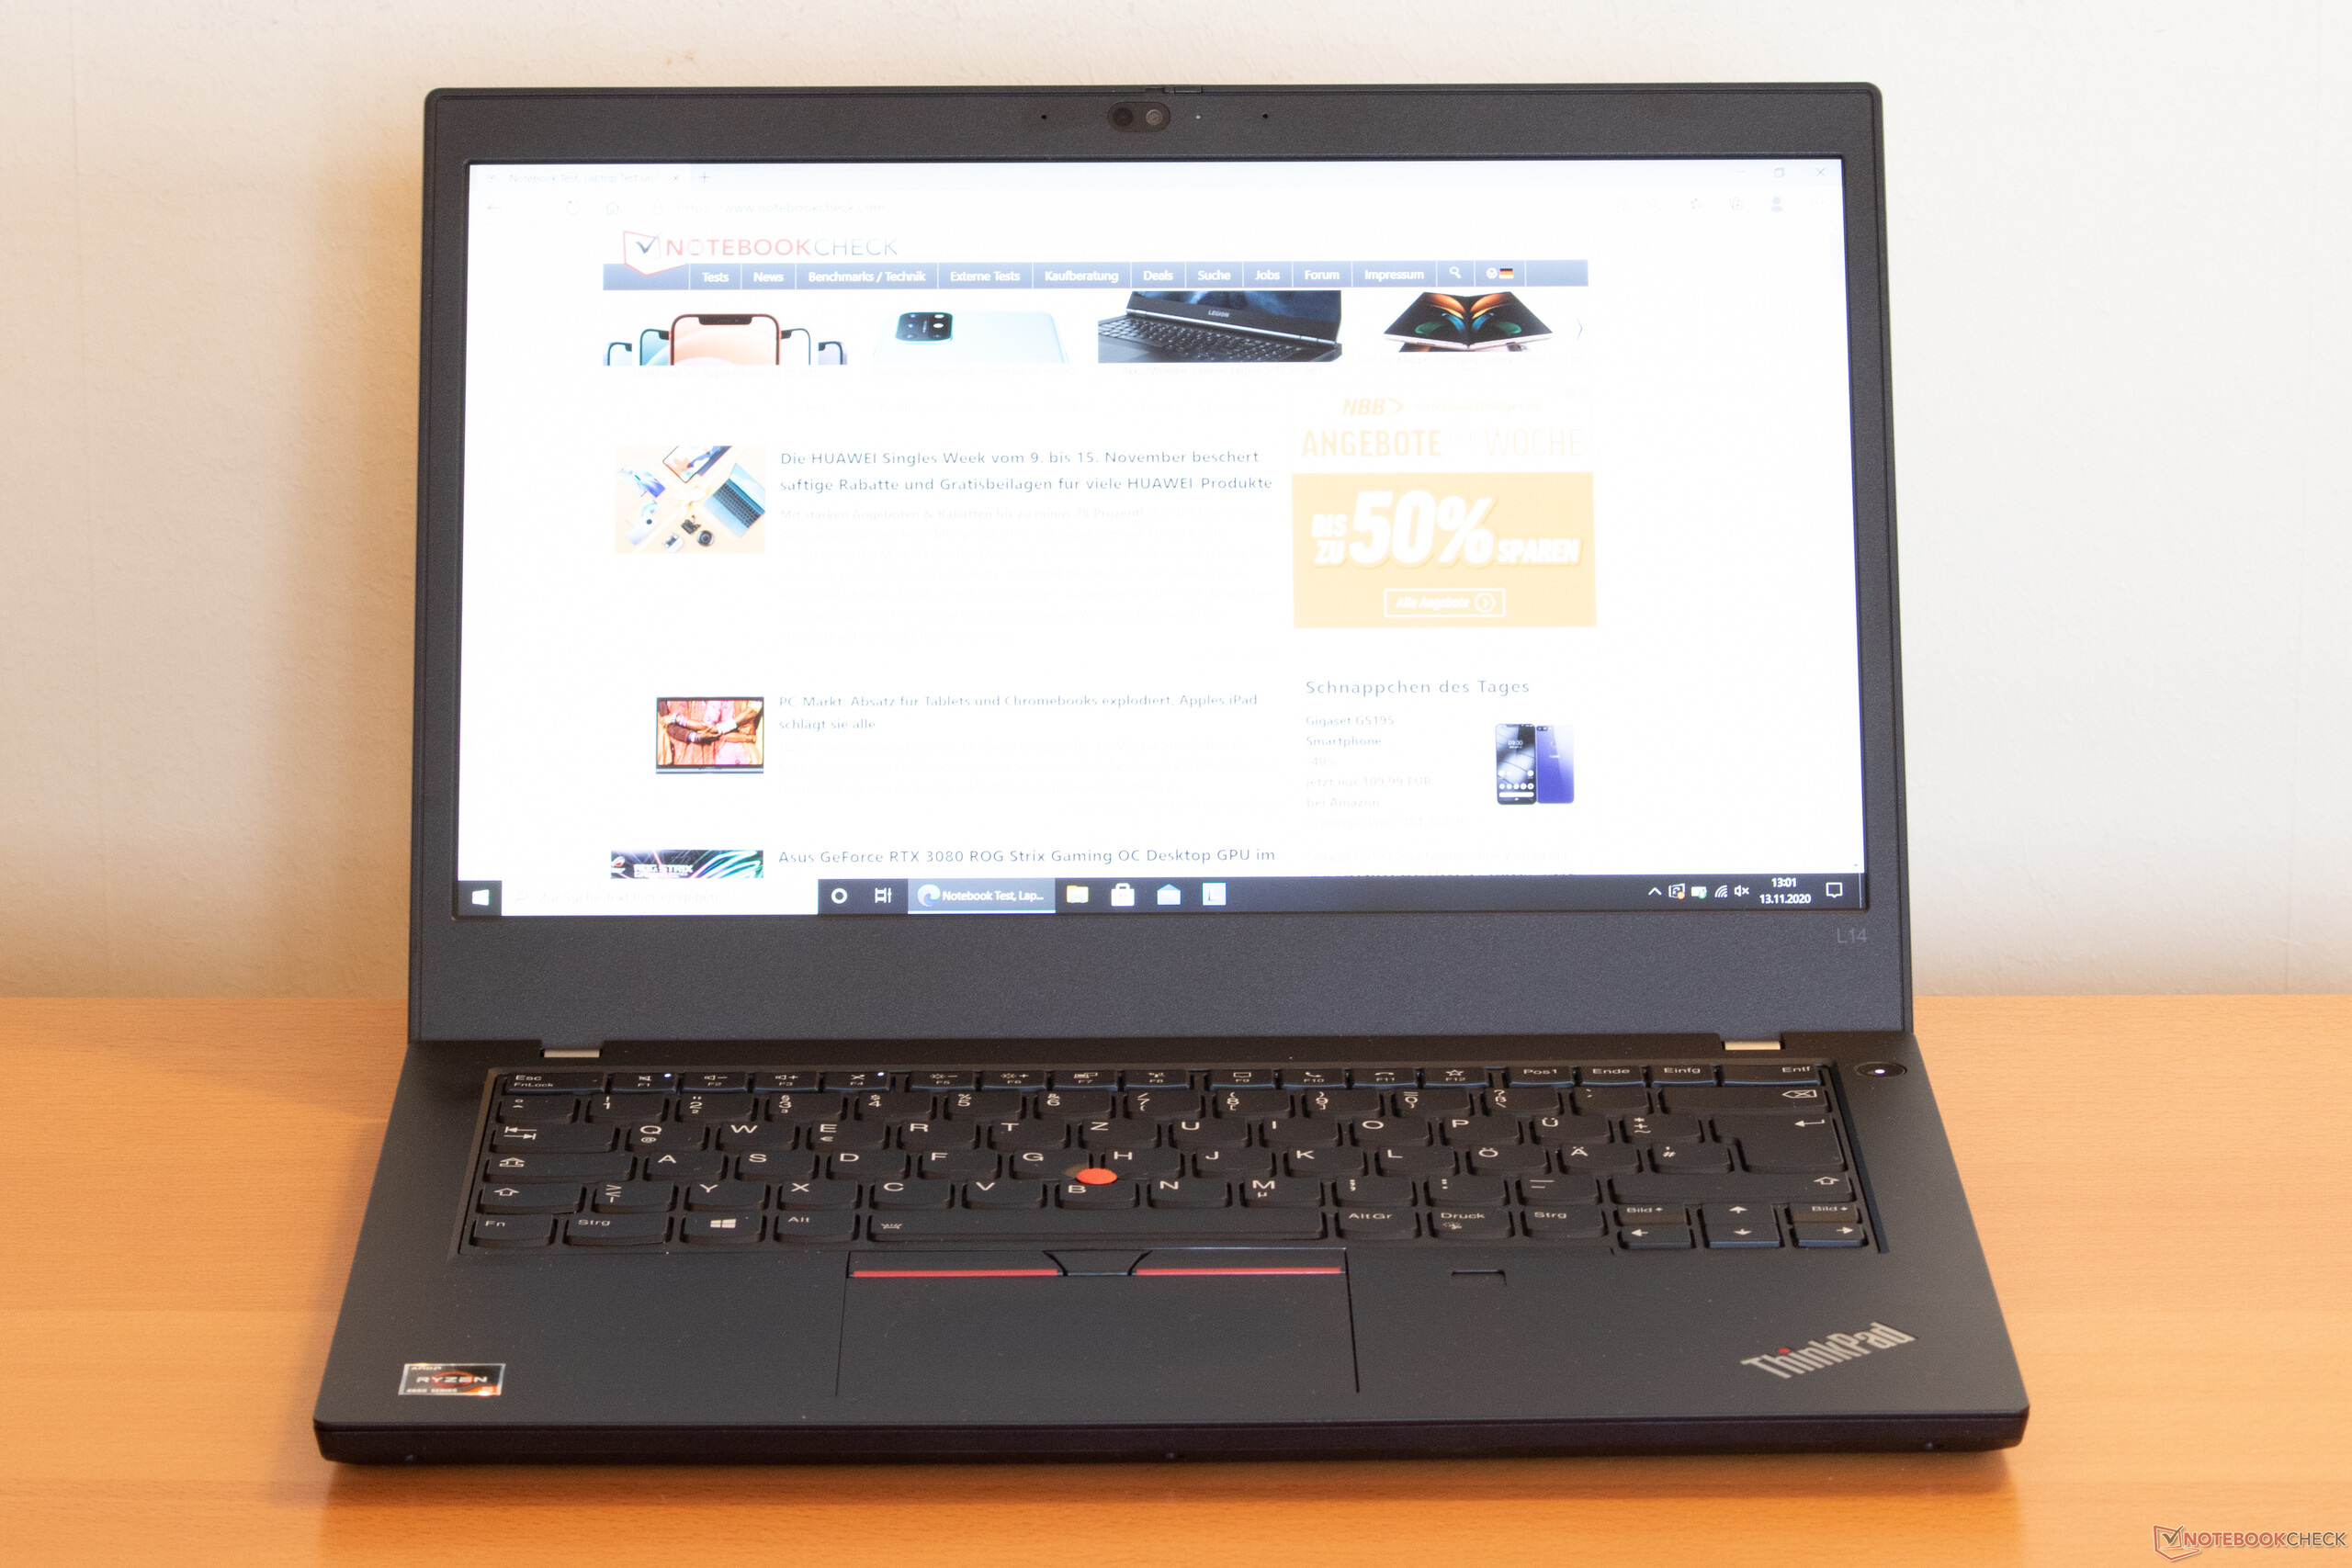
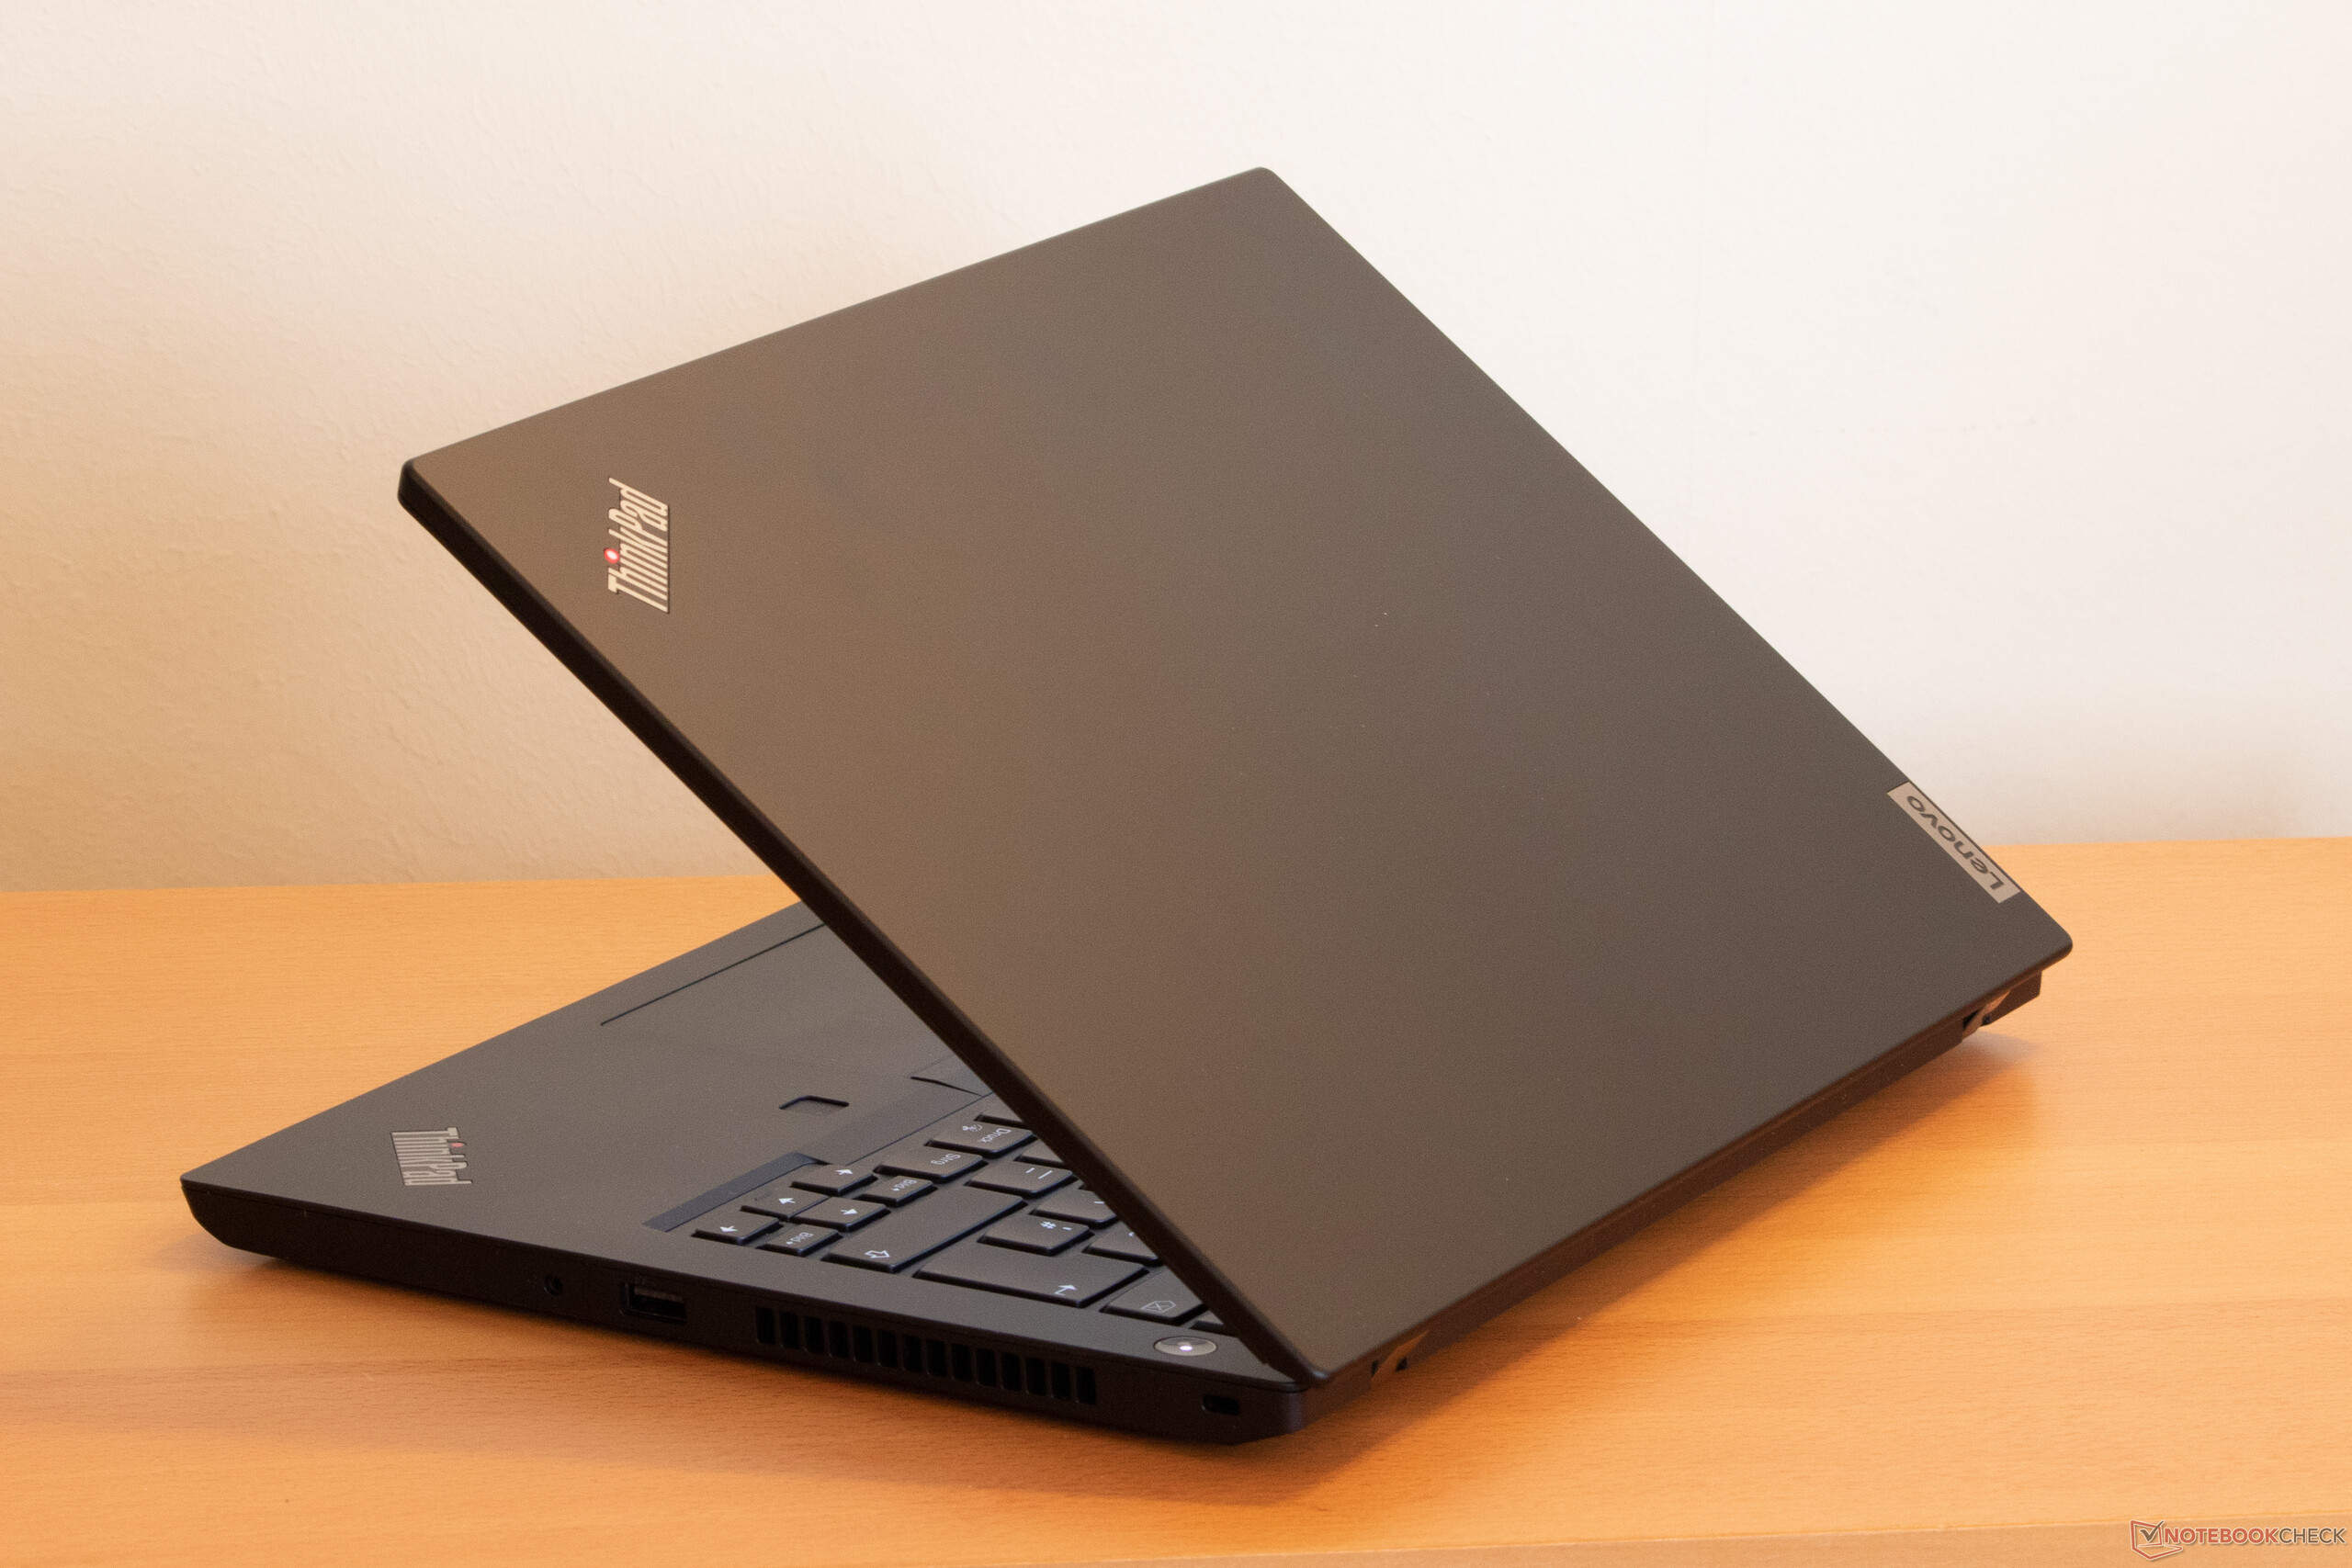
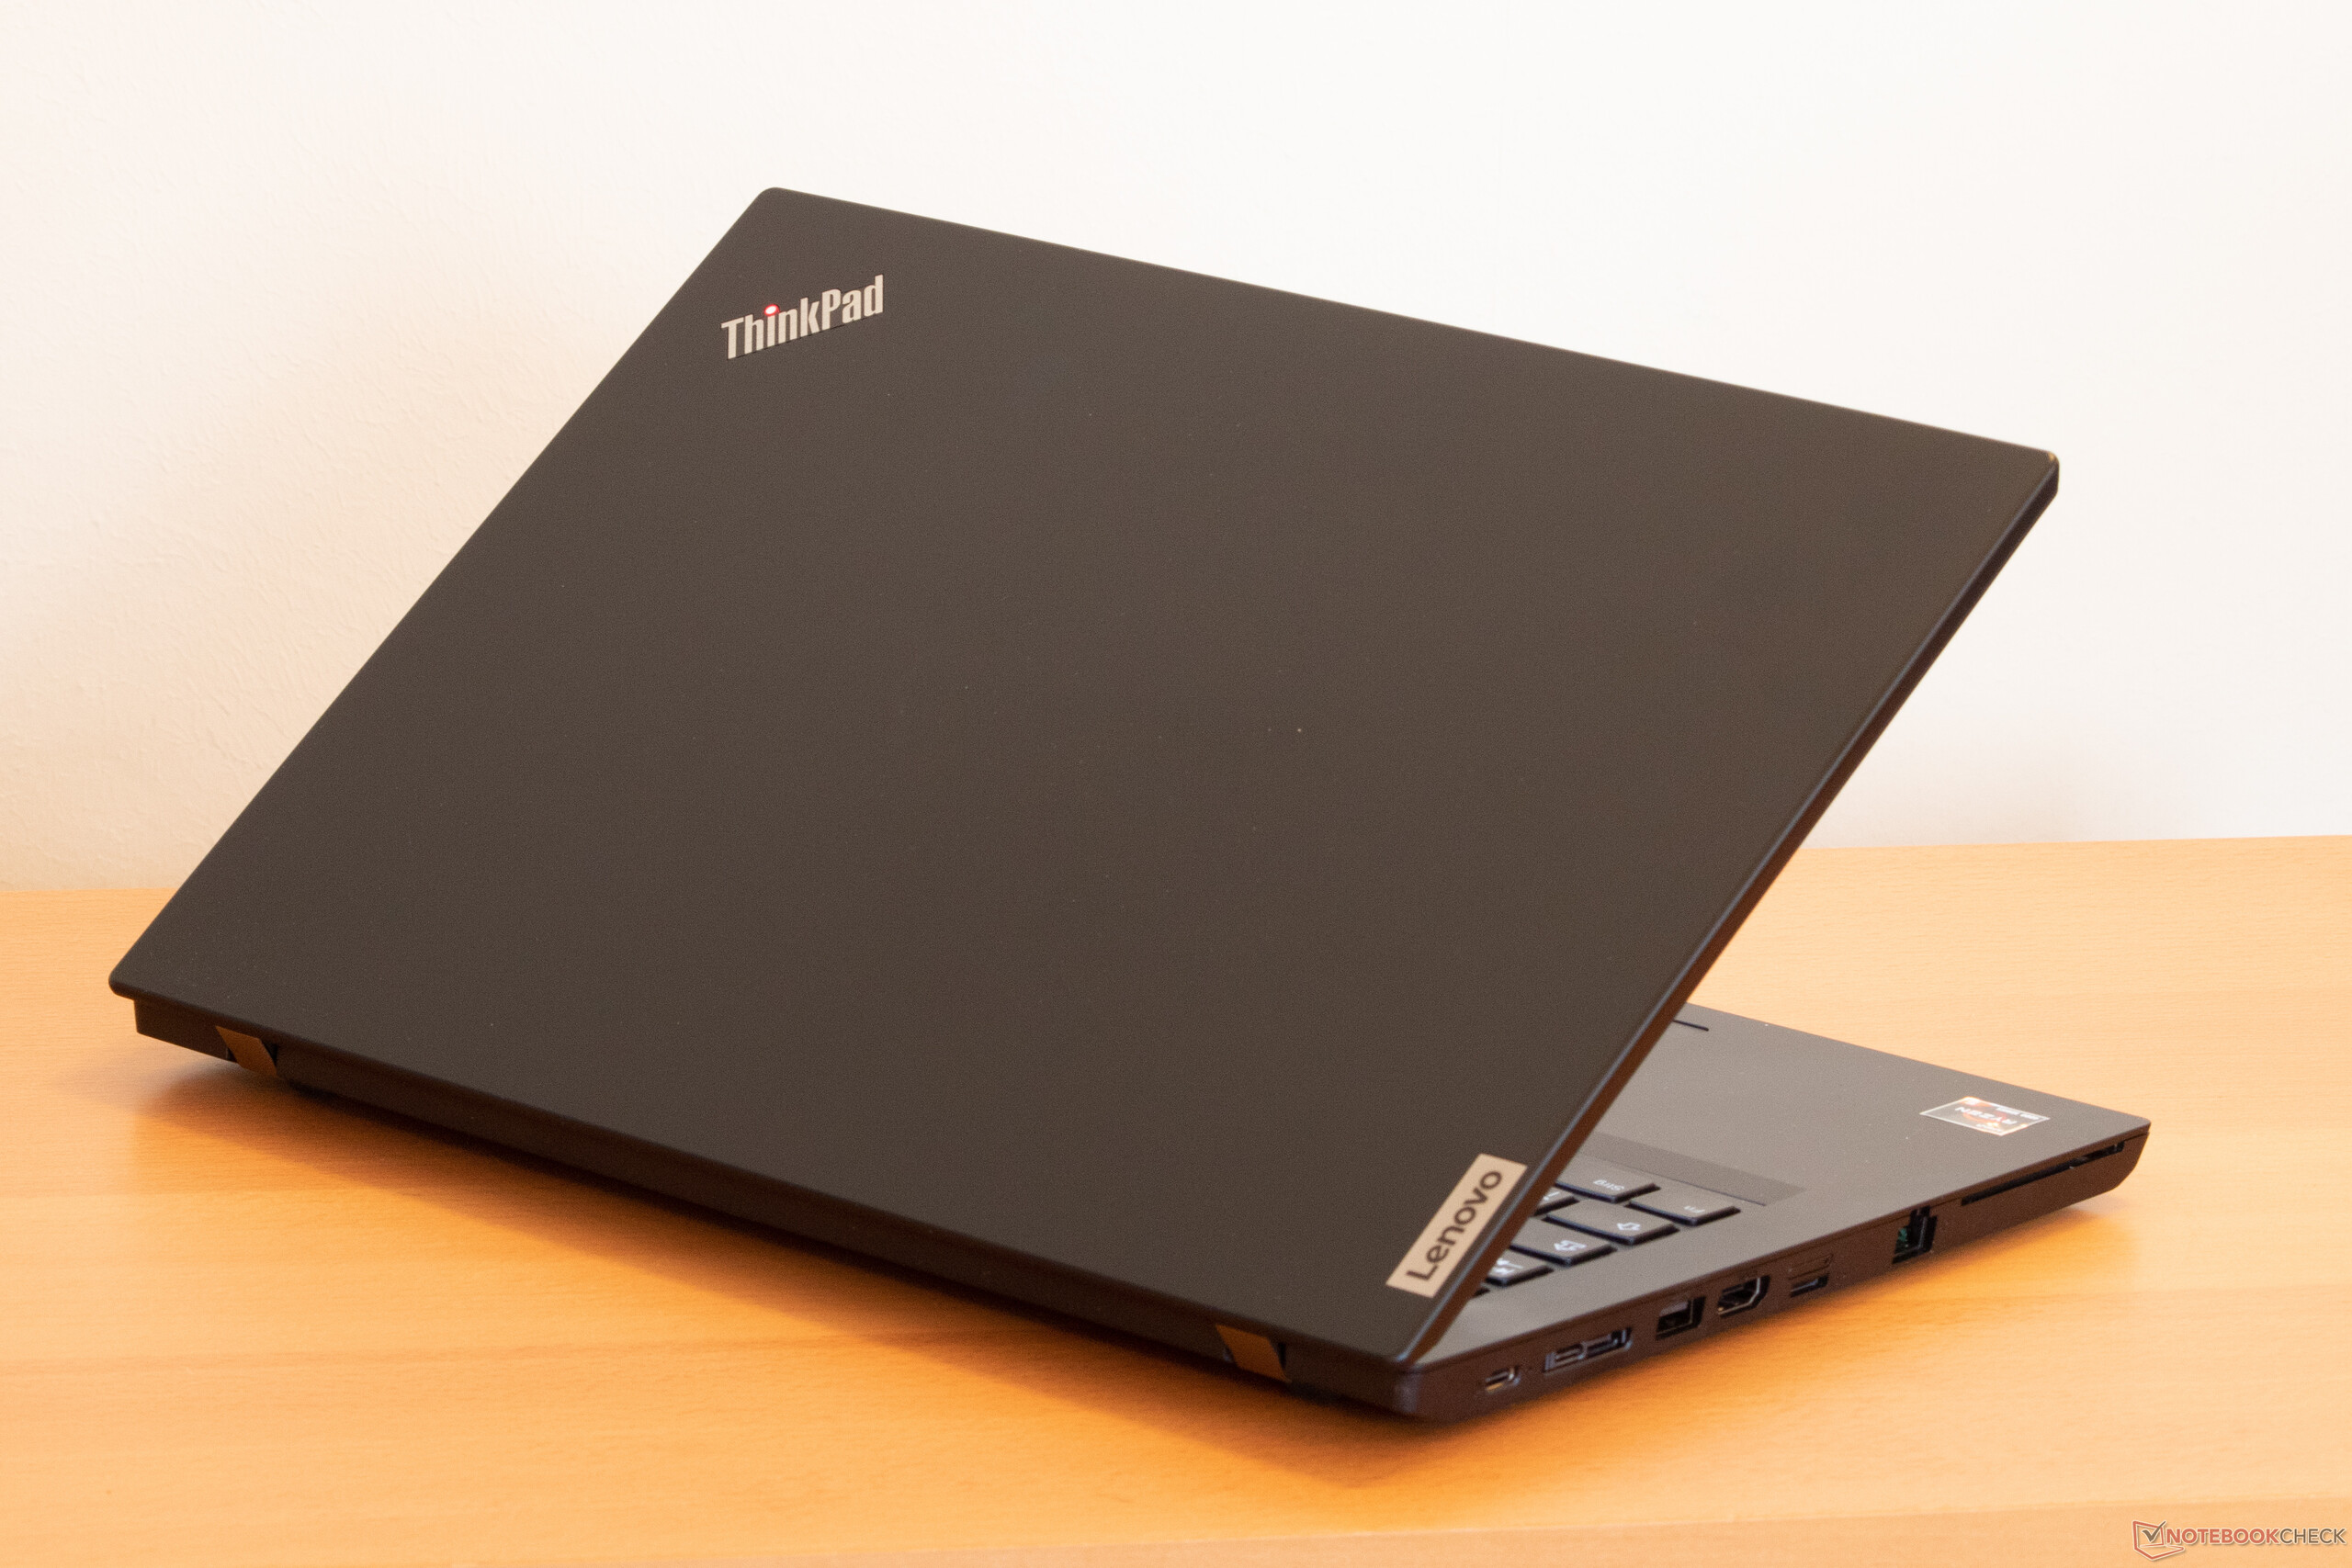
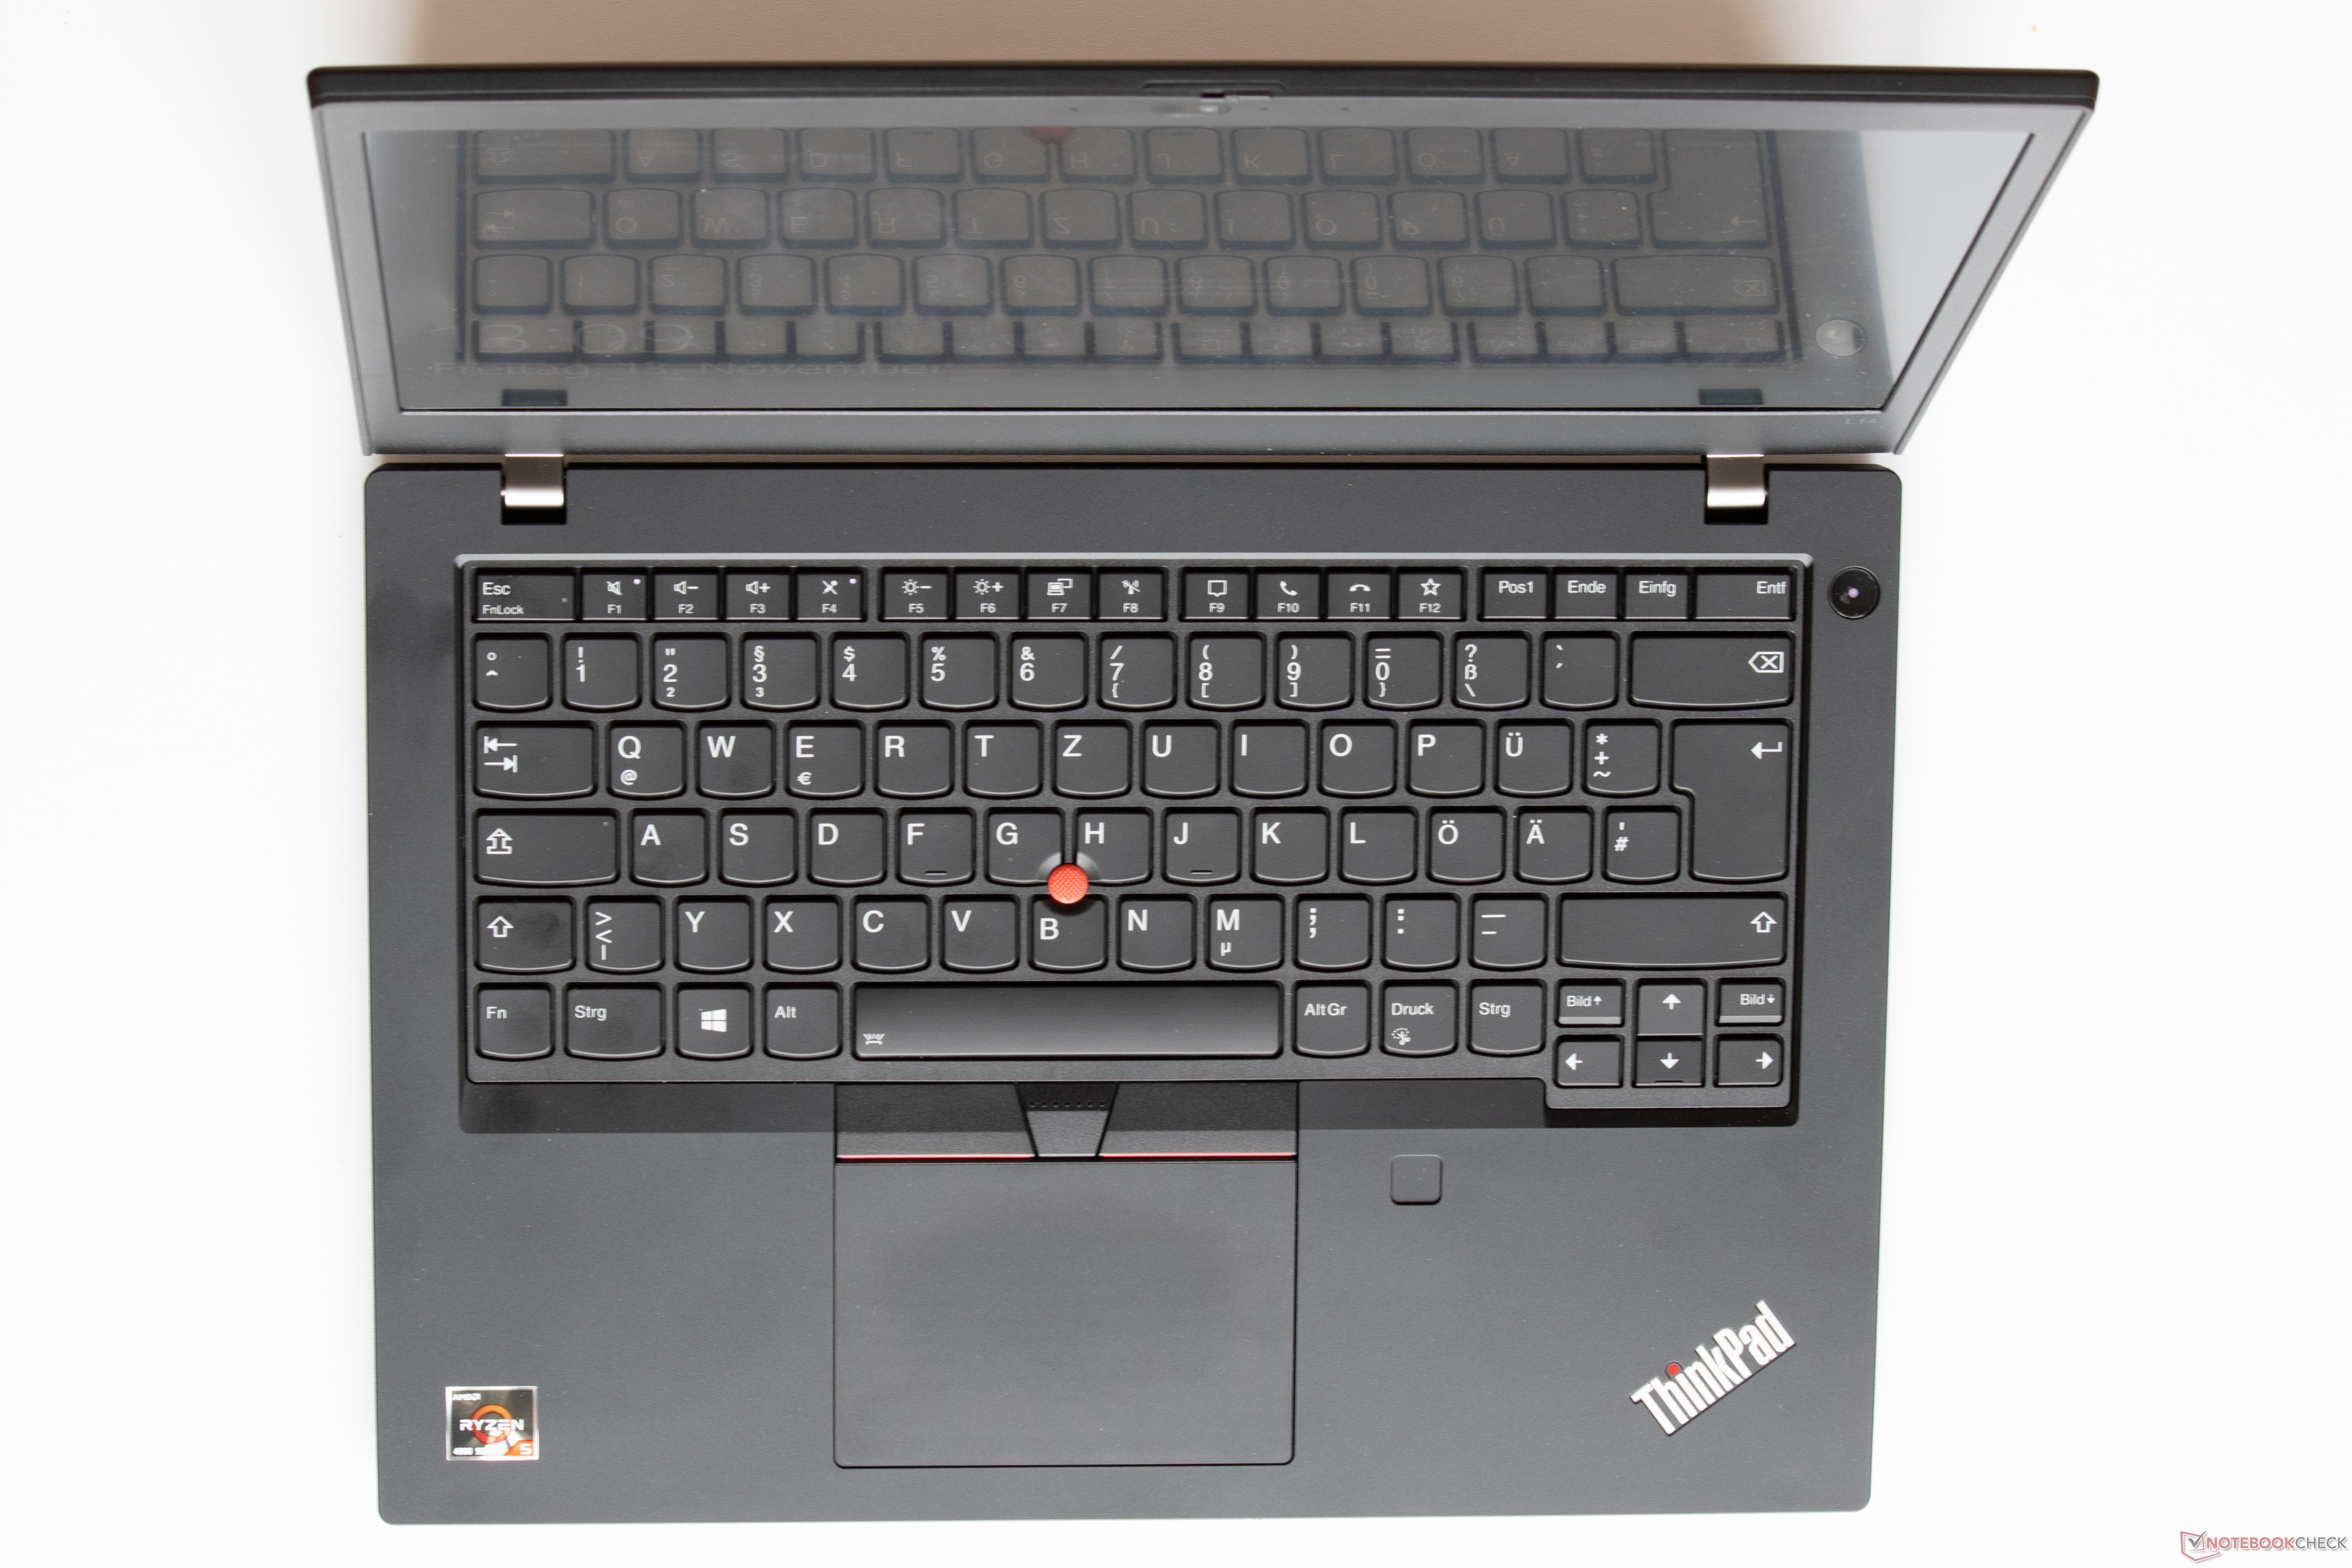
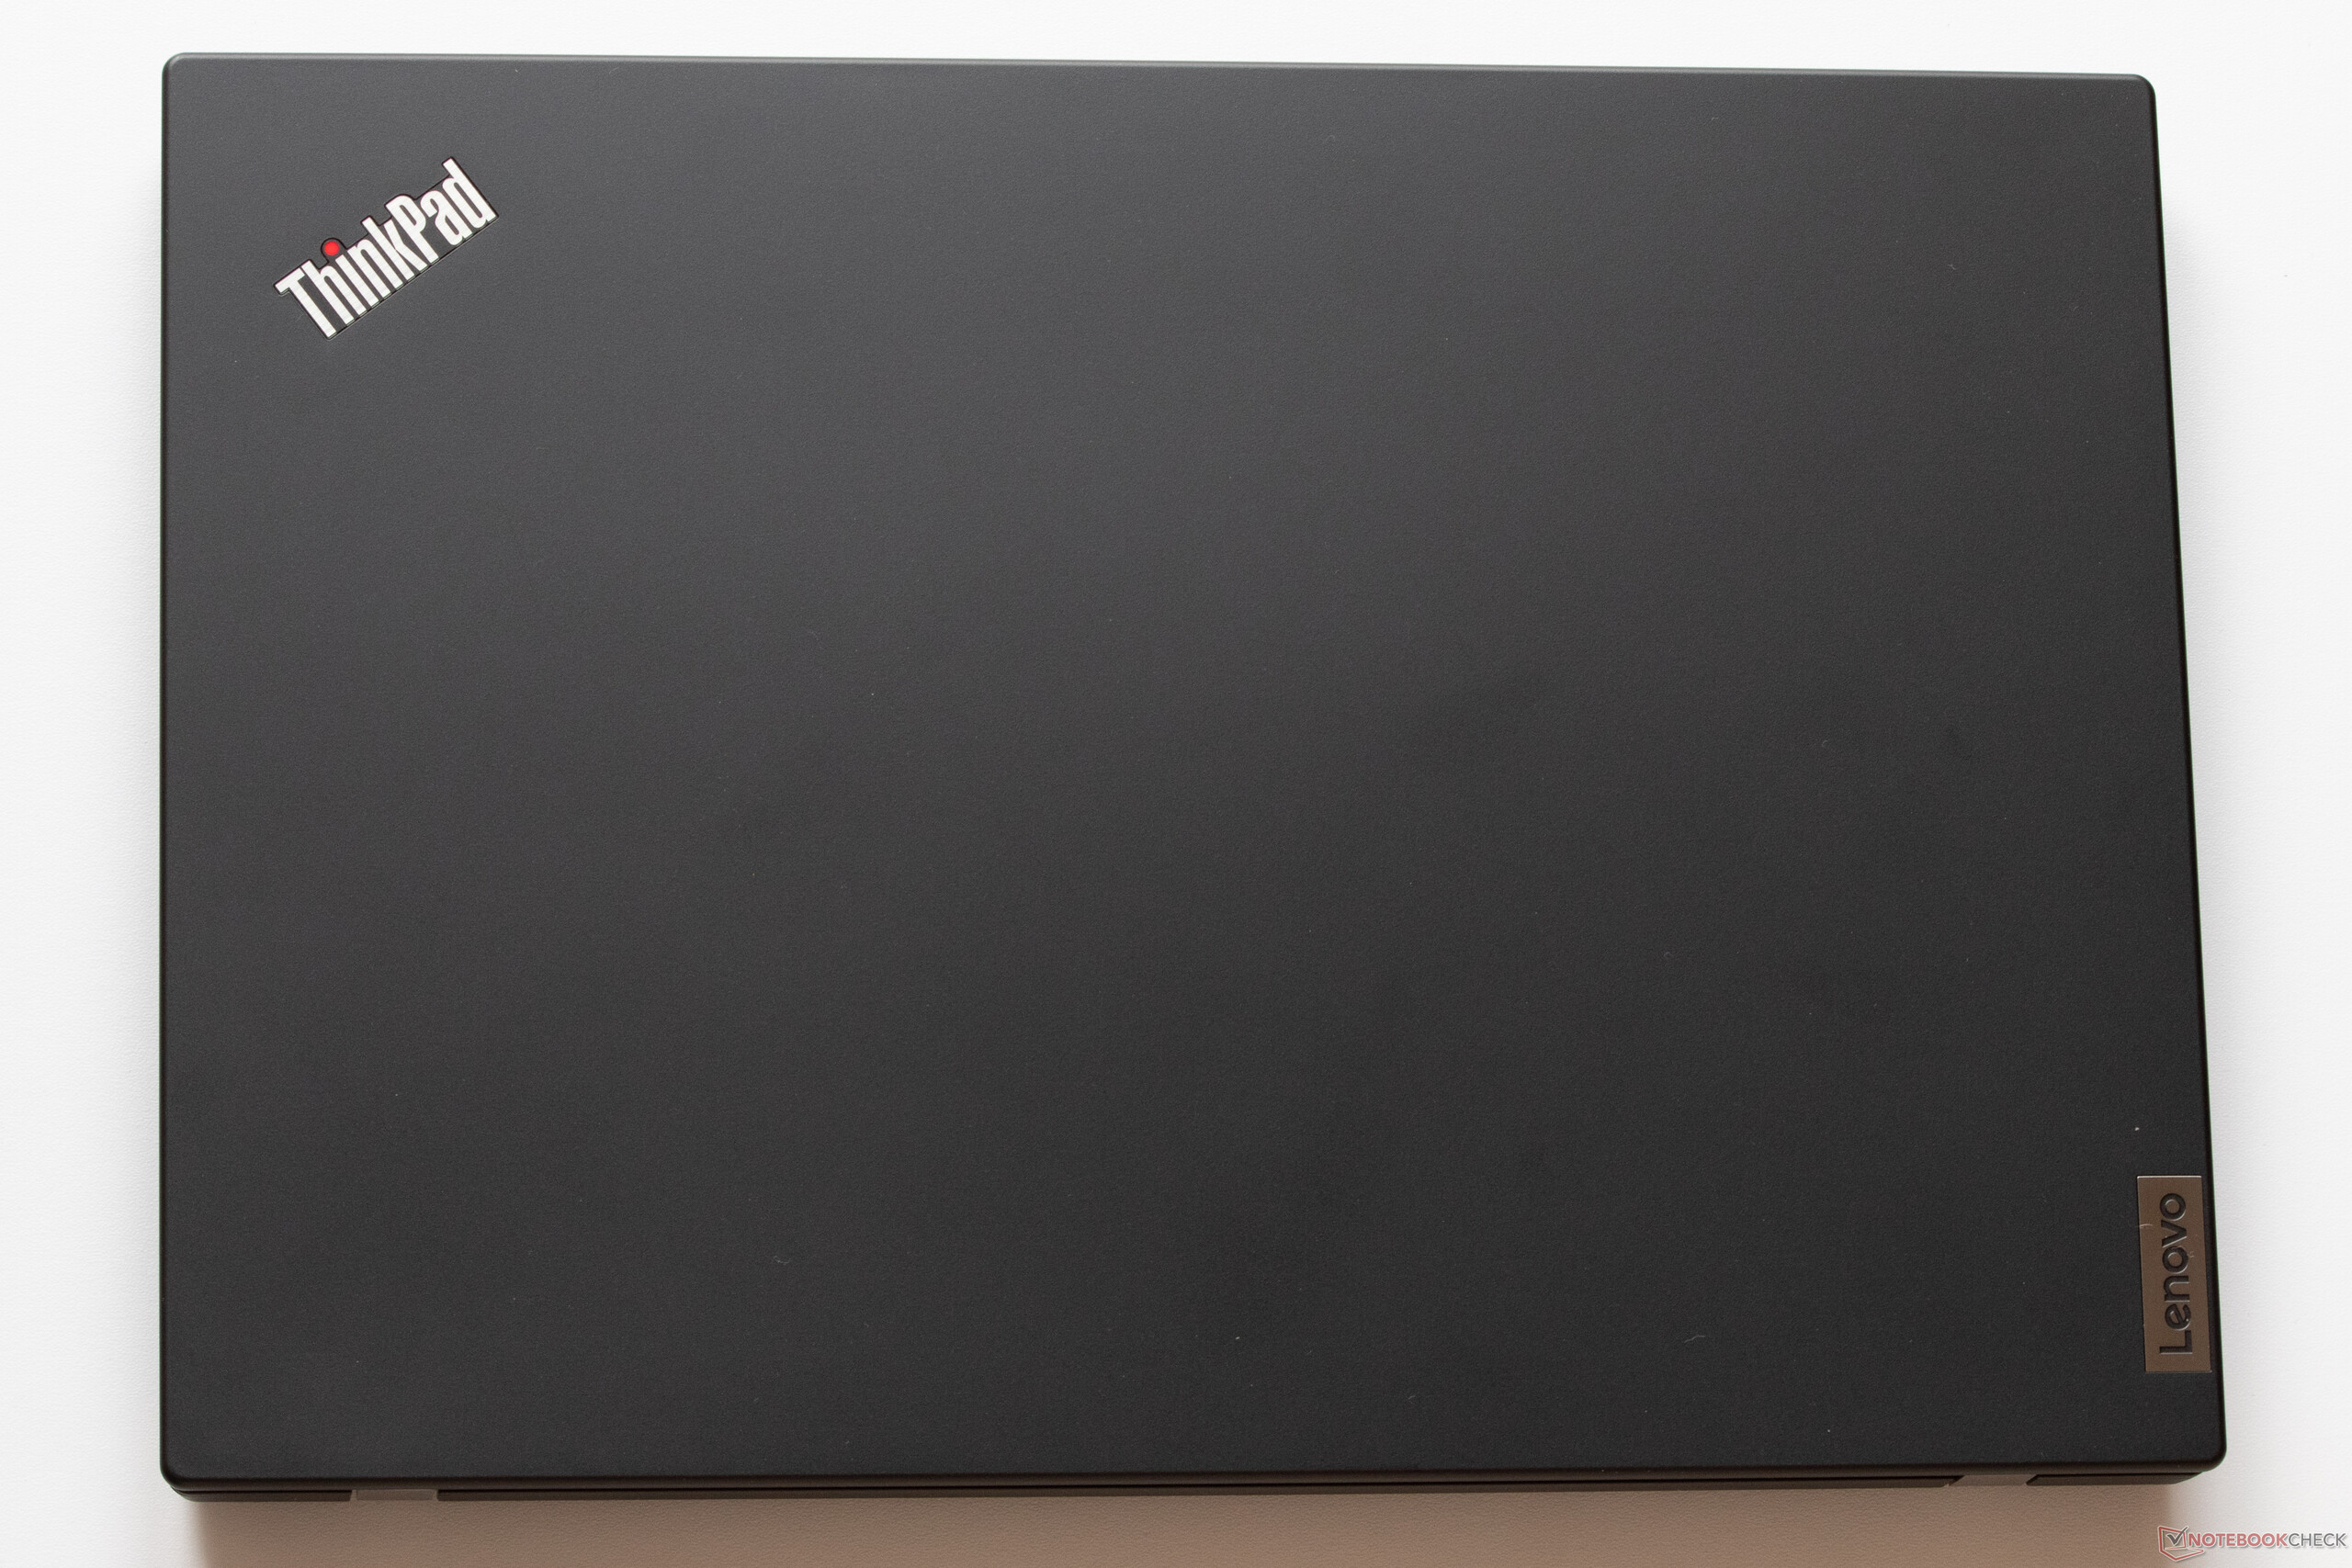
Case – Typical ThinkPad
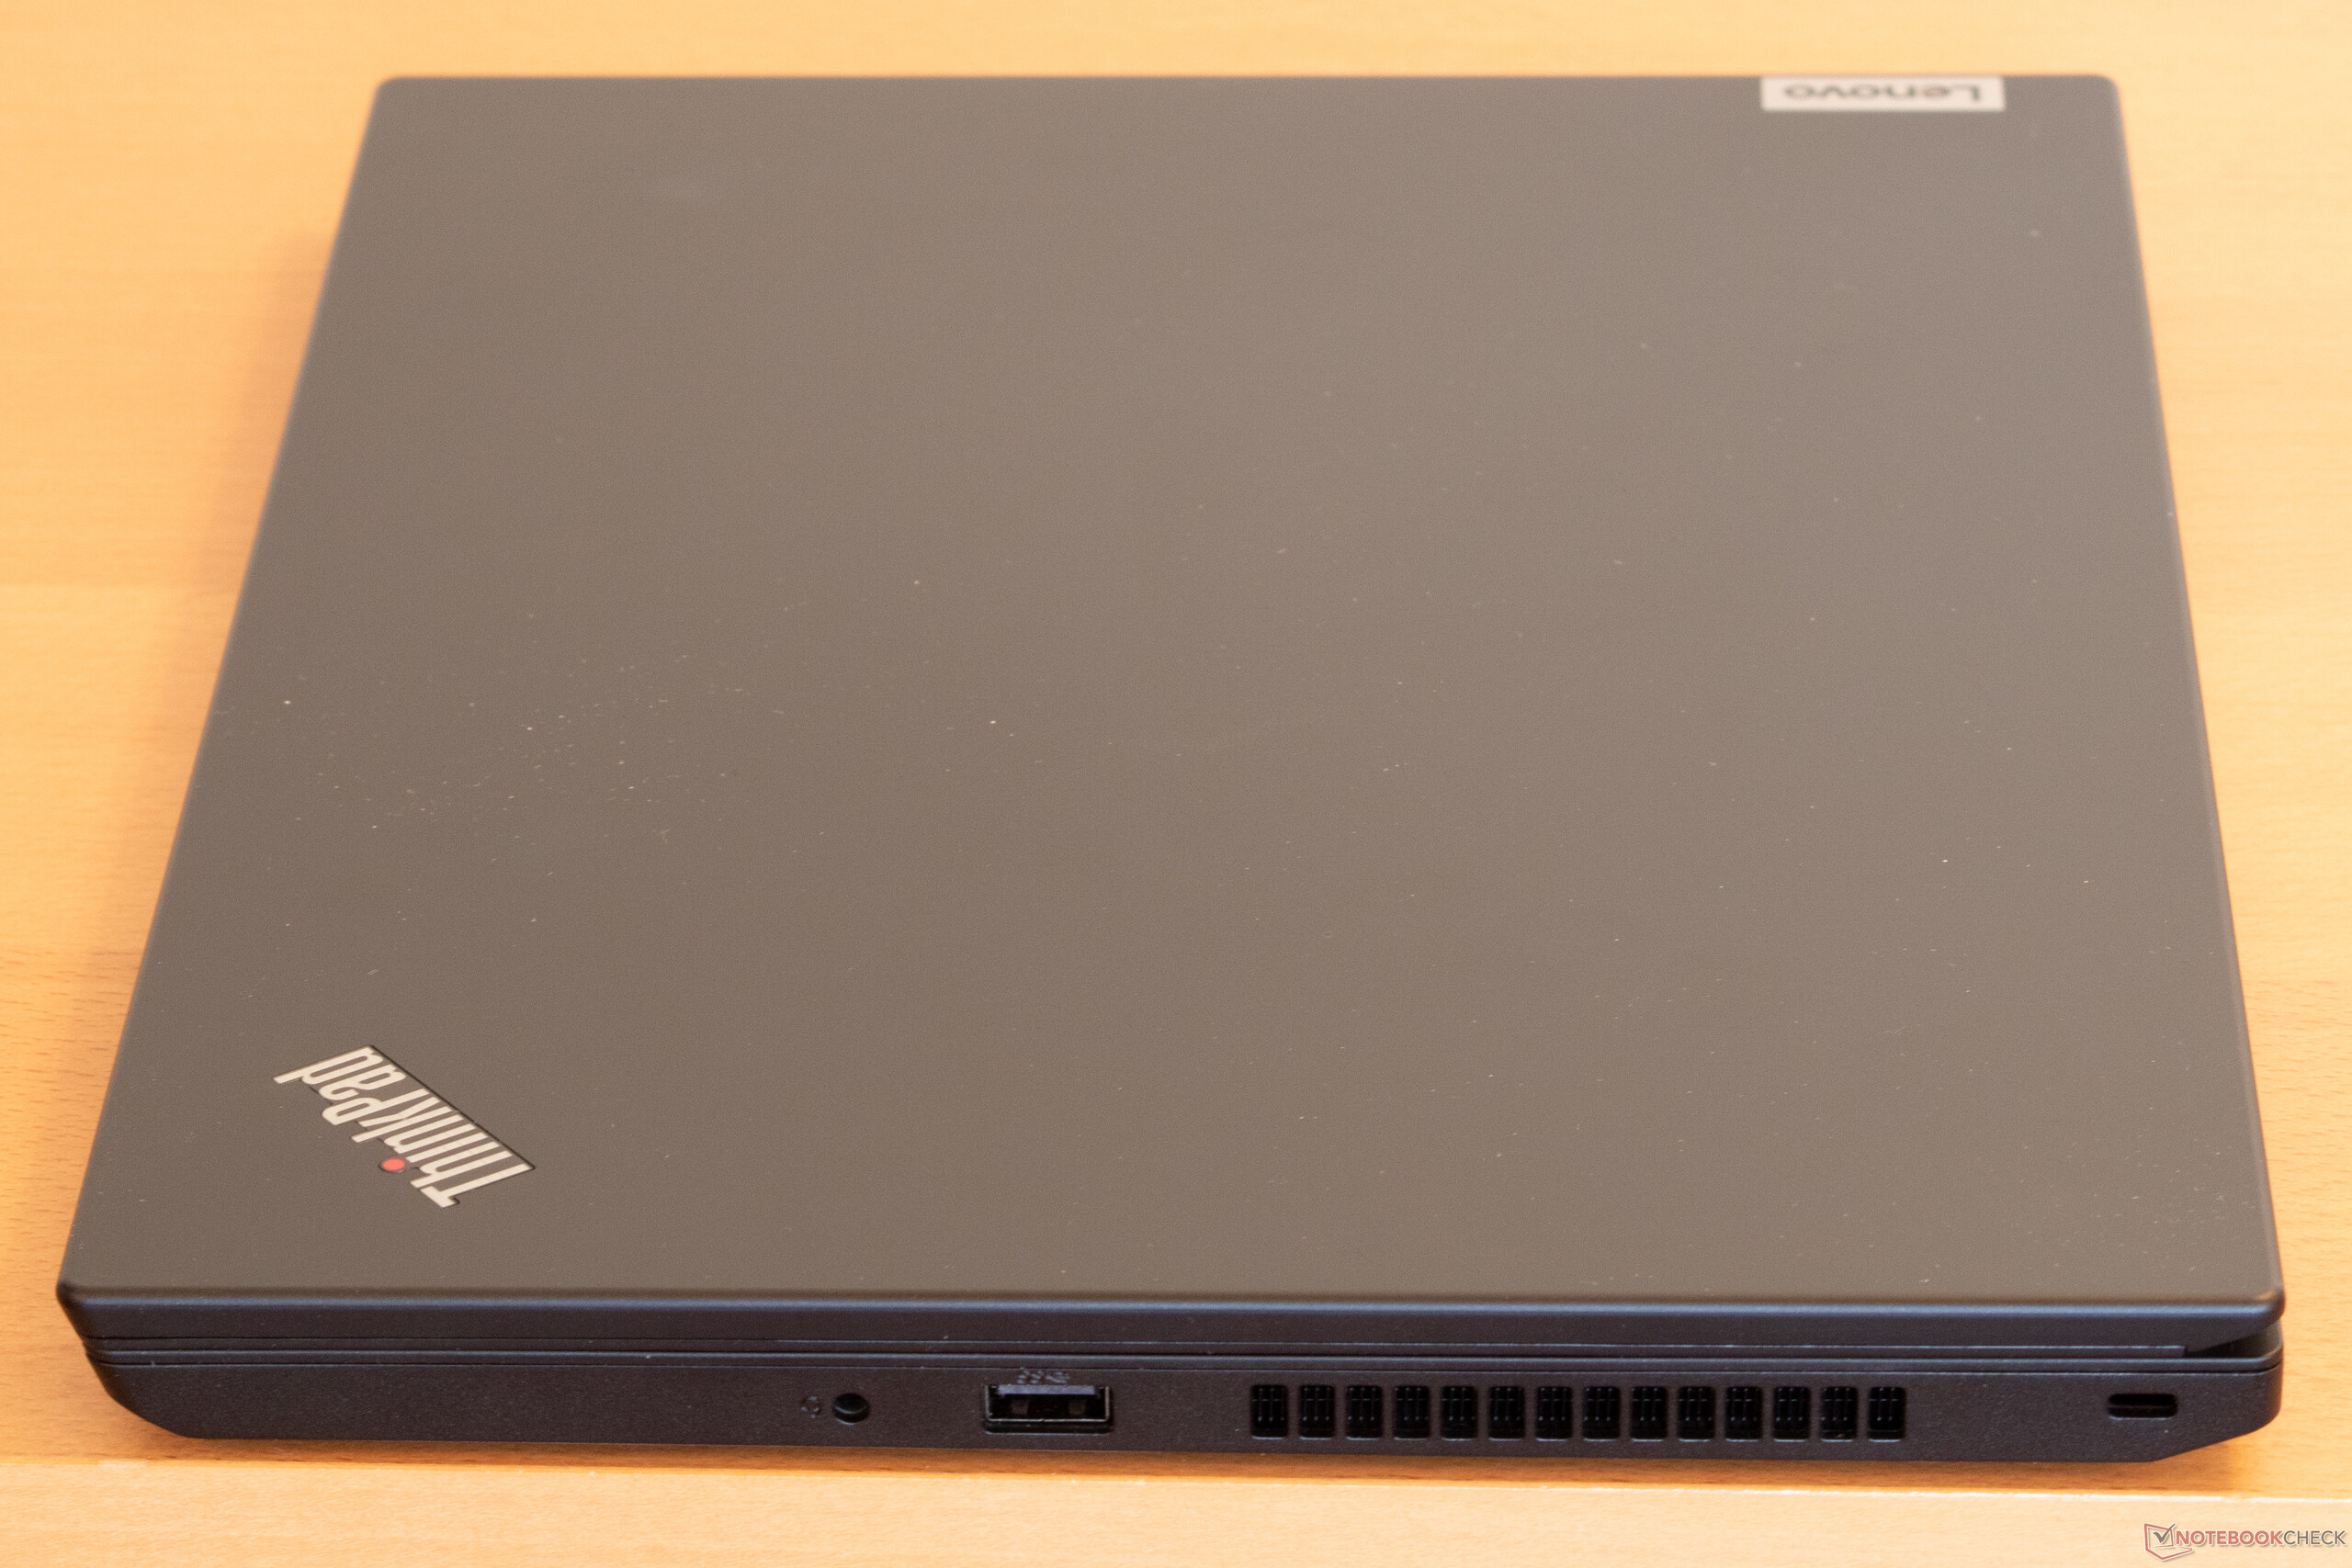
As expected of Lenovo overall build quality is solid. The ThinkPad L14 neither creaks nor flexes considerably, and the entire top of the 14-inch case is made of roughened plastic despite of which it manages to attract fingerprints. The thin display bezels are slightly rubberized and sit flush with the palm rests with the display lid closed. The two hinges are firm and offer the perfect amount of resistance required to ensure that one-handed opening remains possible. The maximum opening angle is 180 degrees.
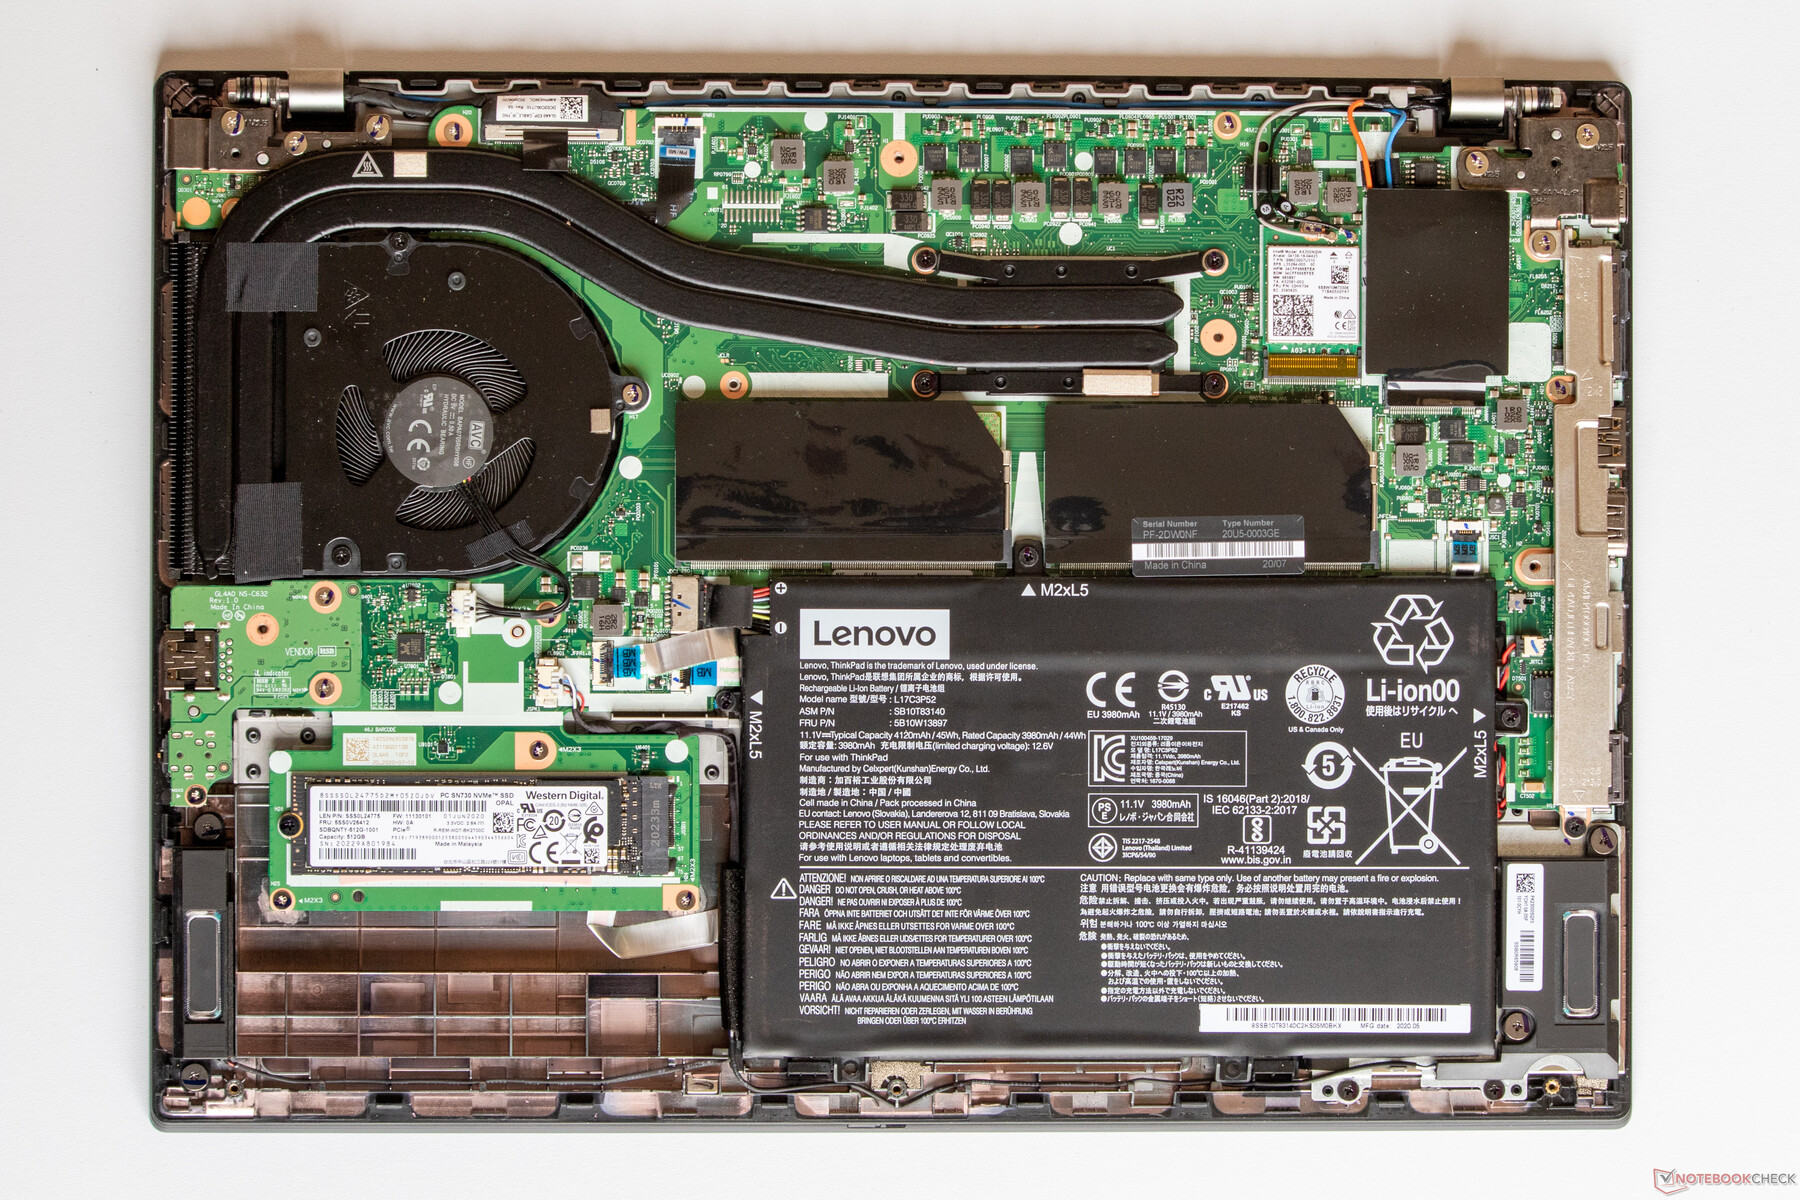
Maintenance is simple and straightforward on this model as well given that the bottom panel can be easily removed by undoing a few screws. This will give you access to the most important components, such as for example the RAM which can be upgraded up to 64 GB. The battery, unfortunately, is not user replaceable.
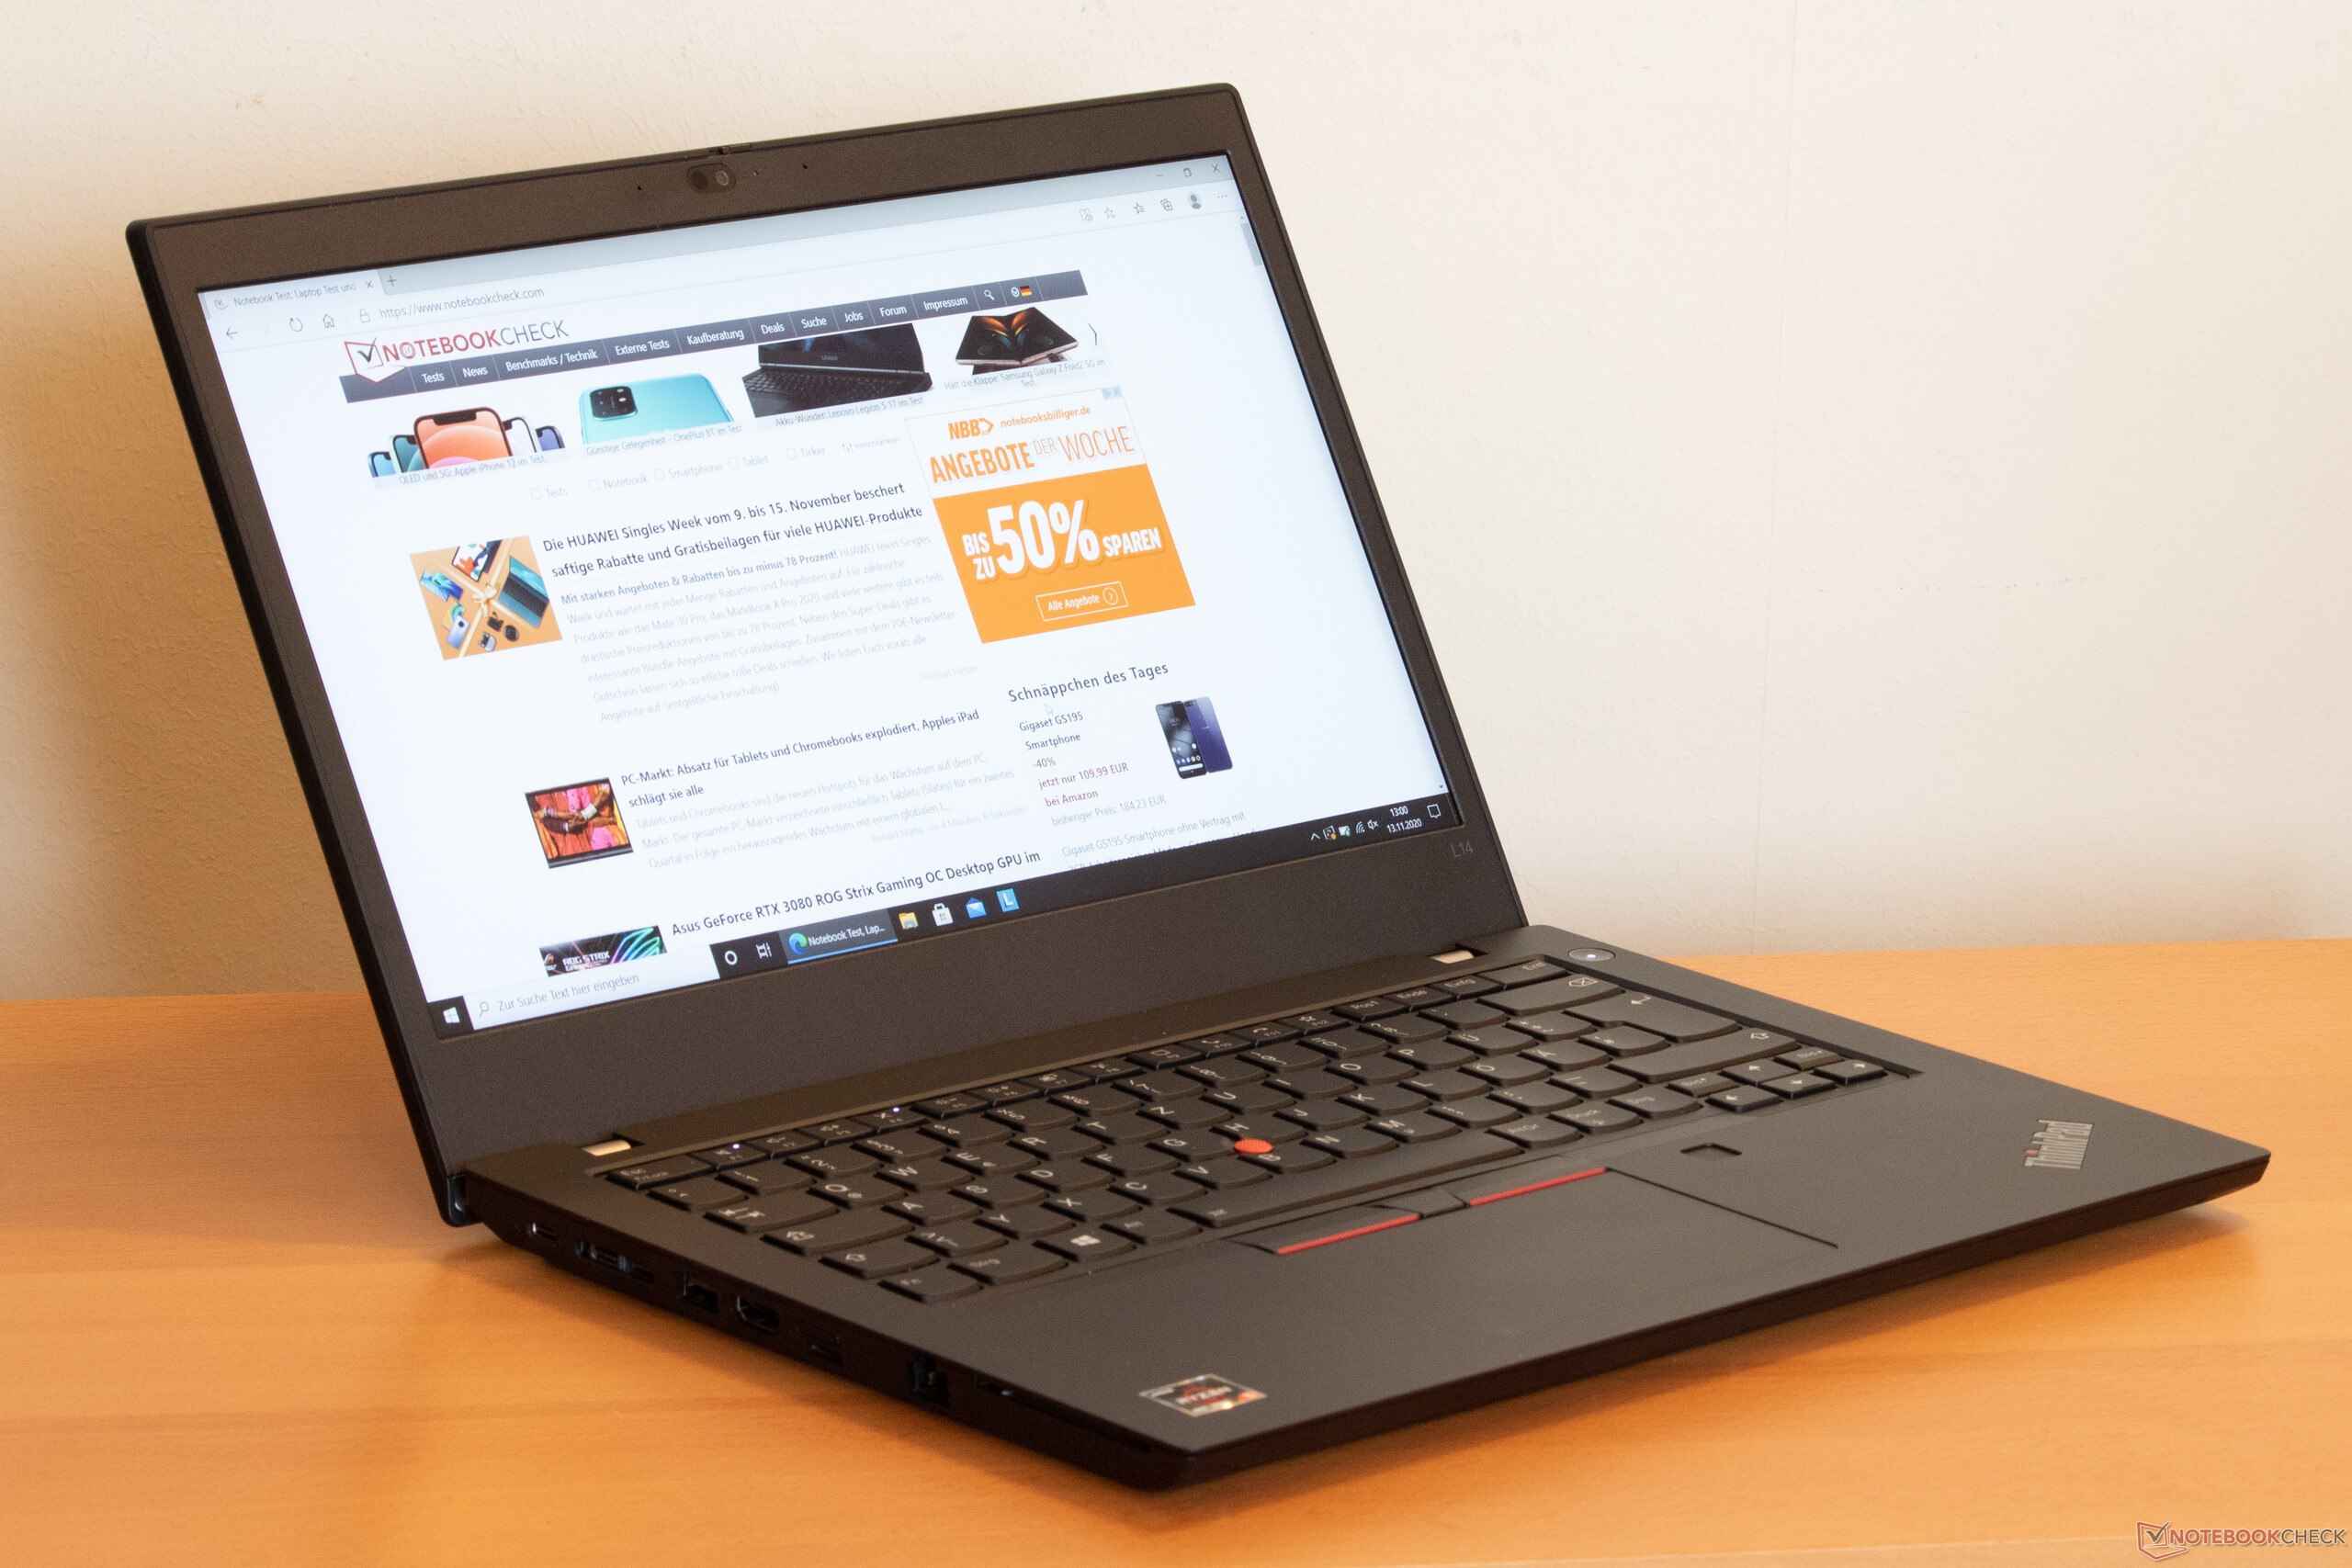
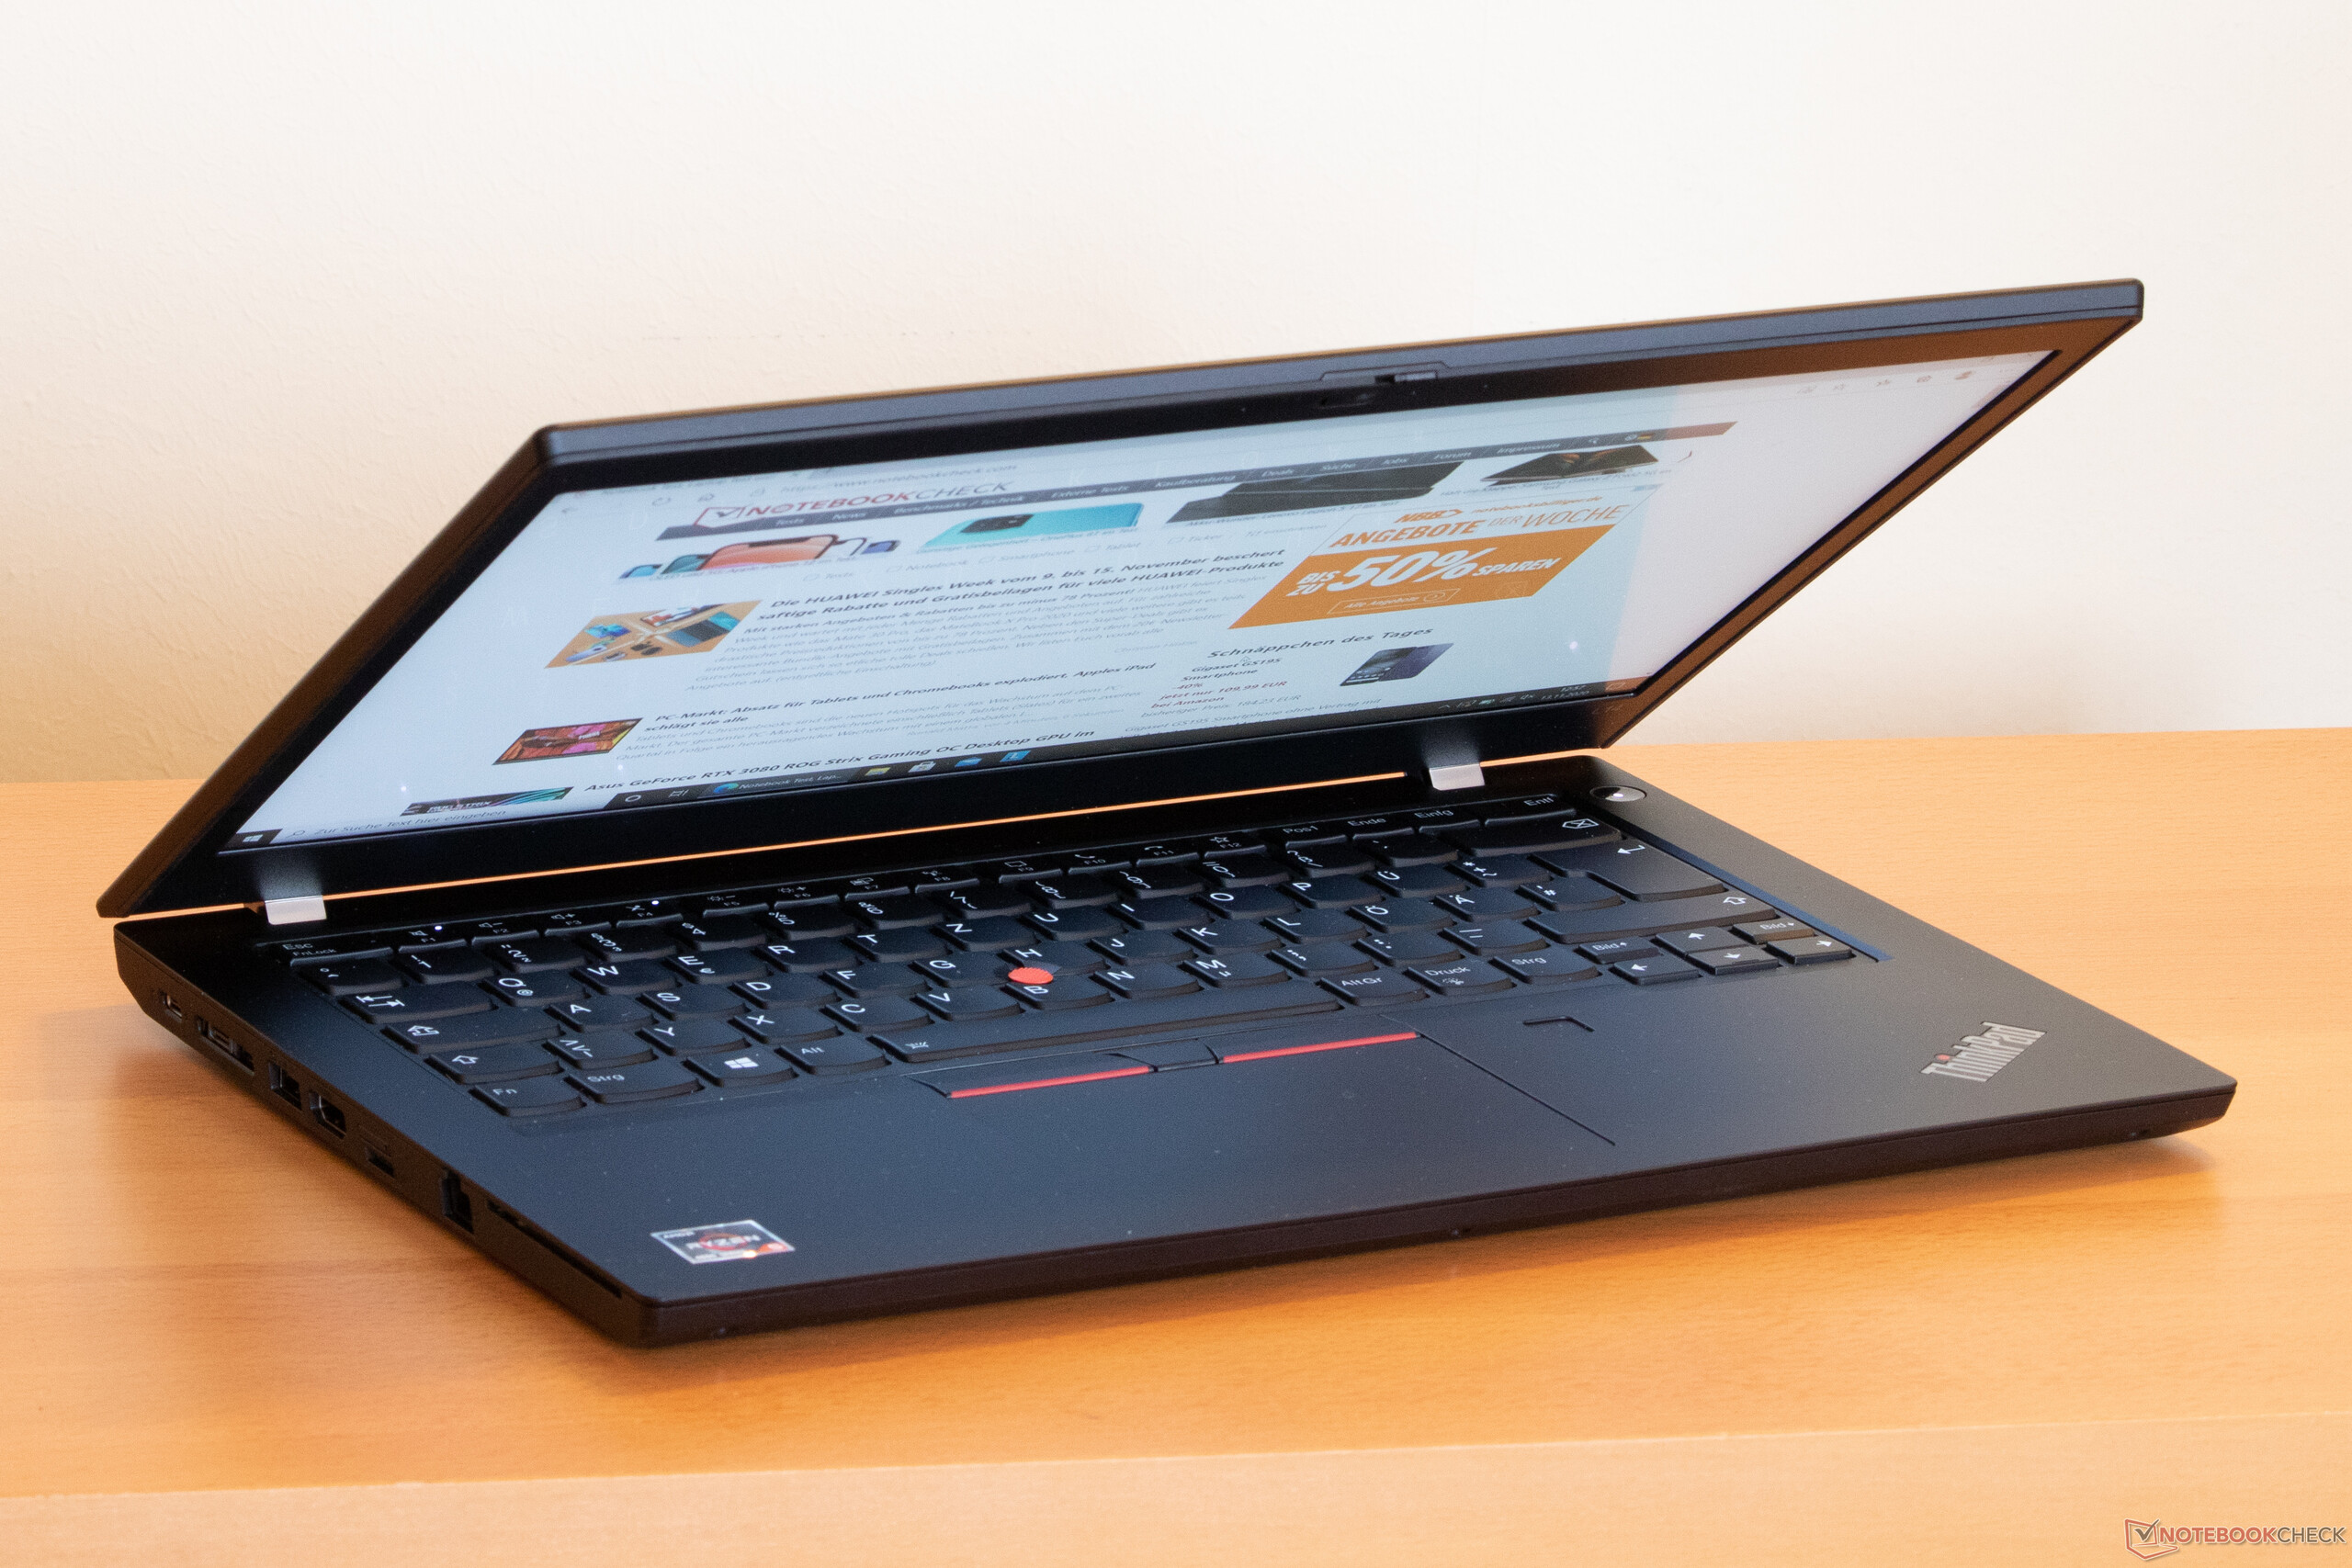
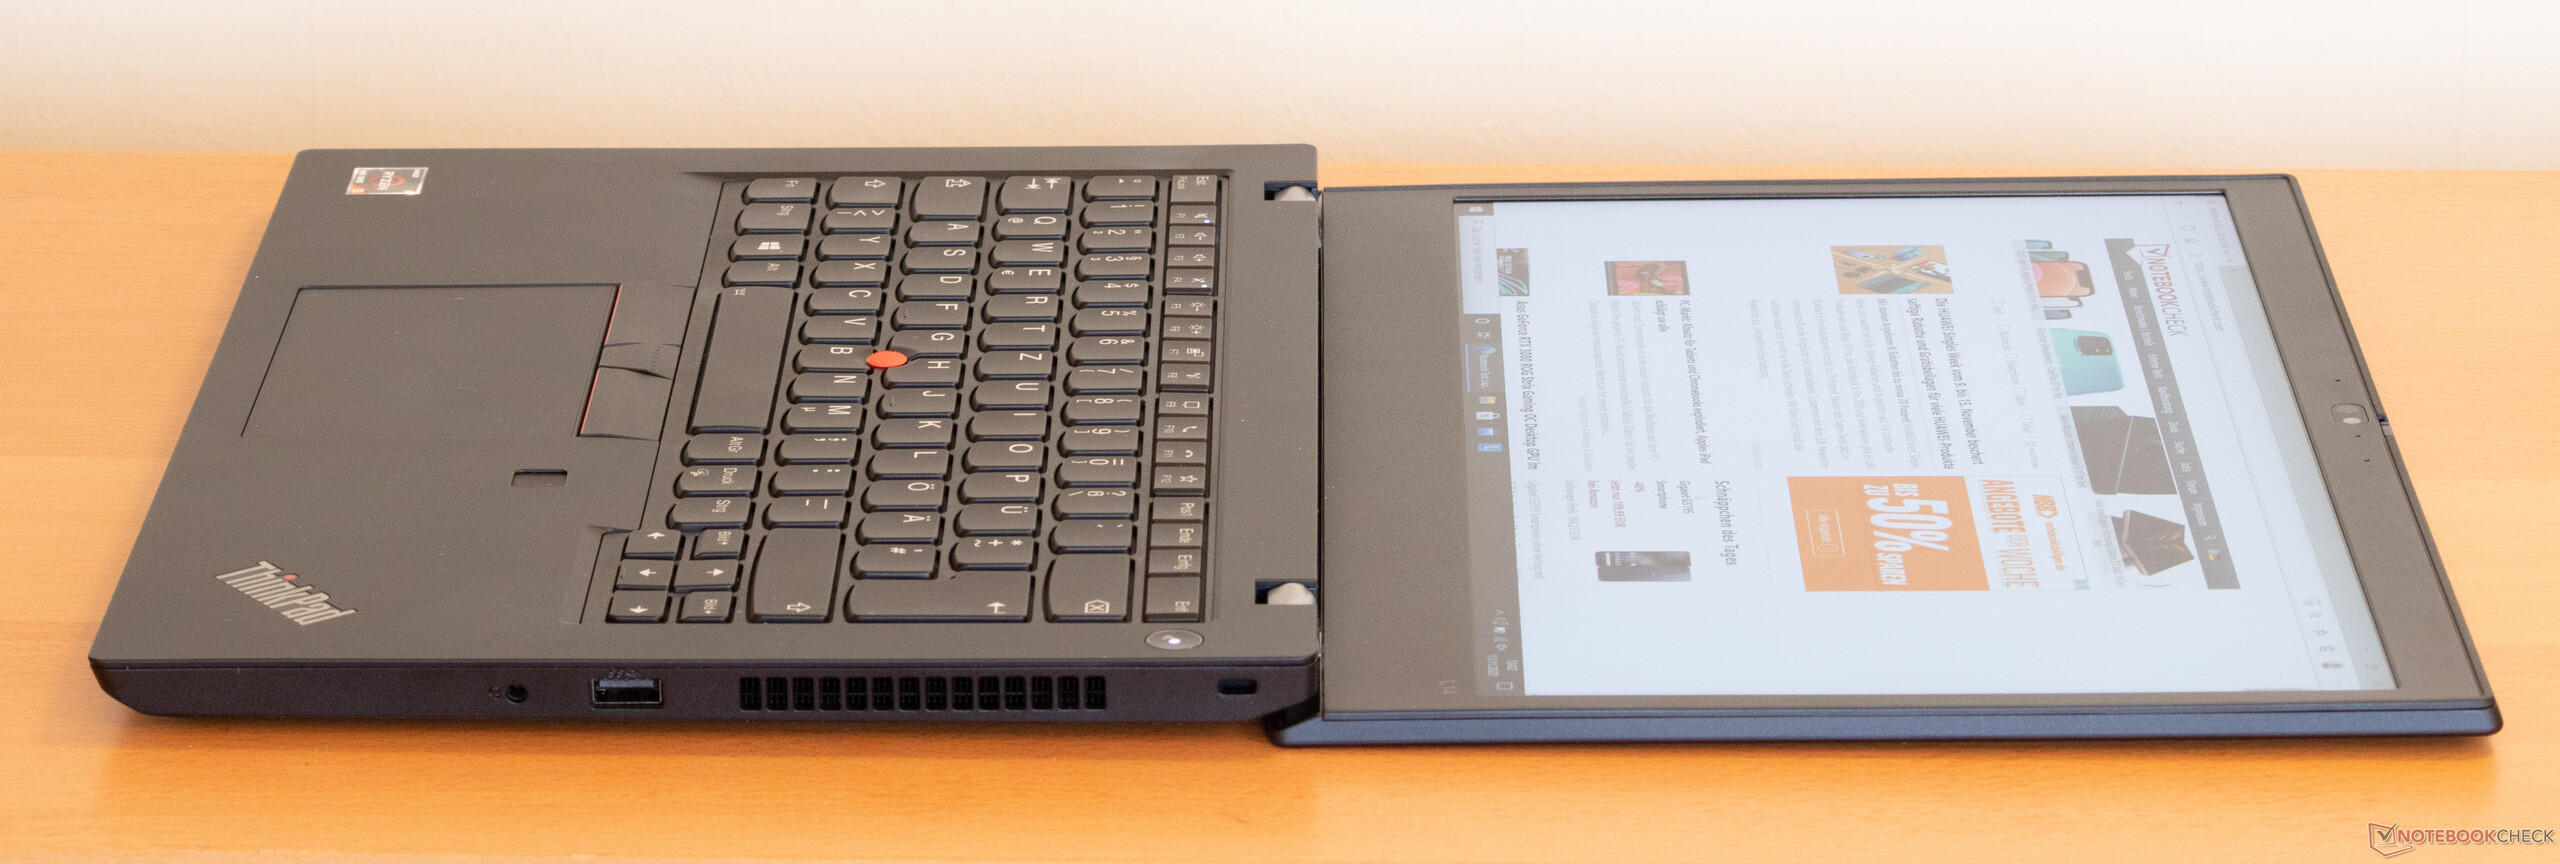
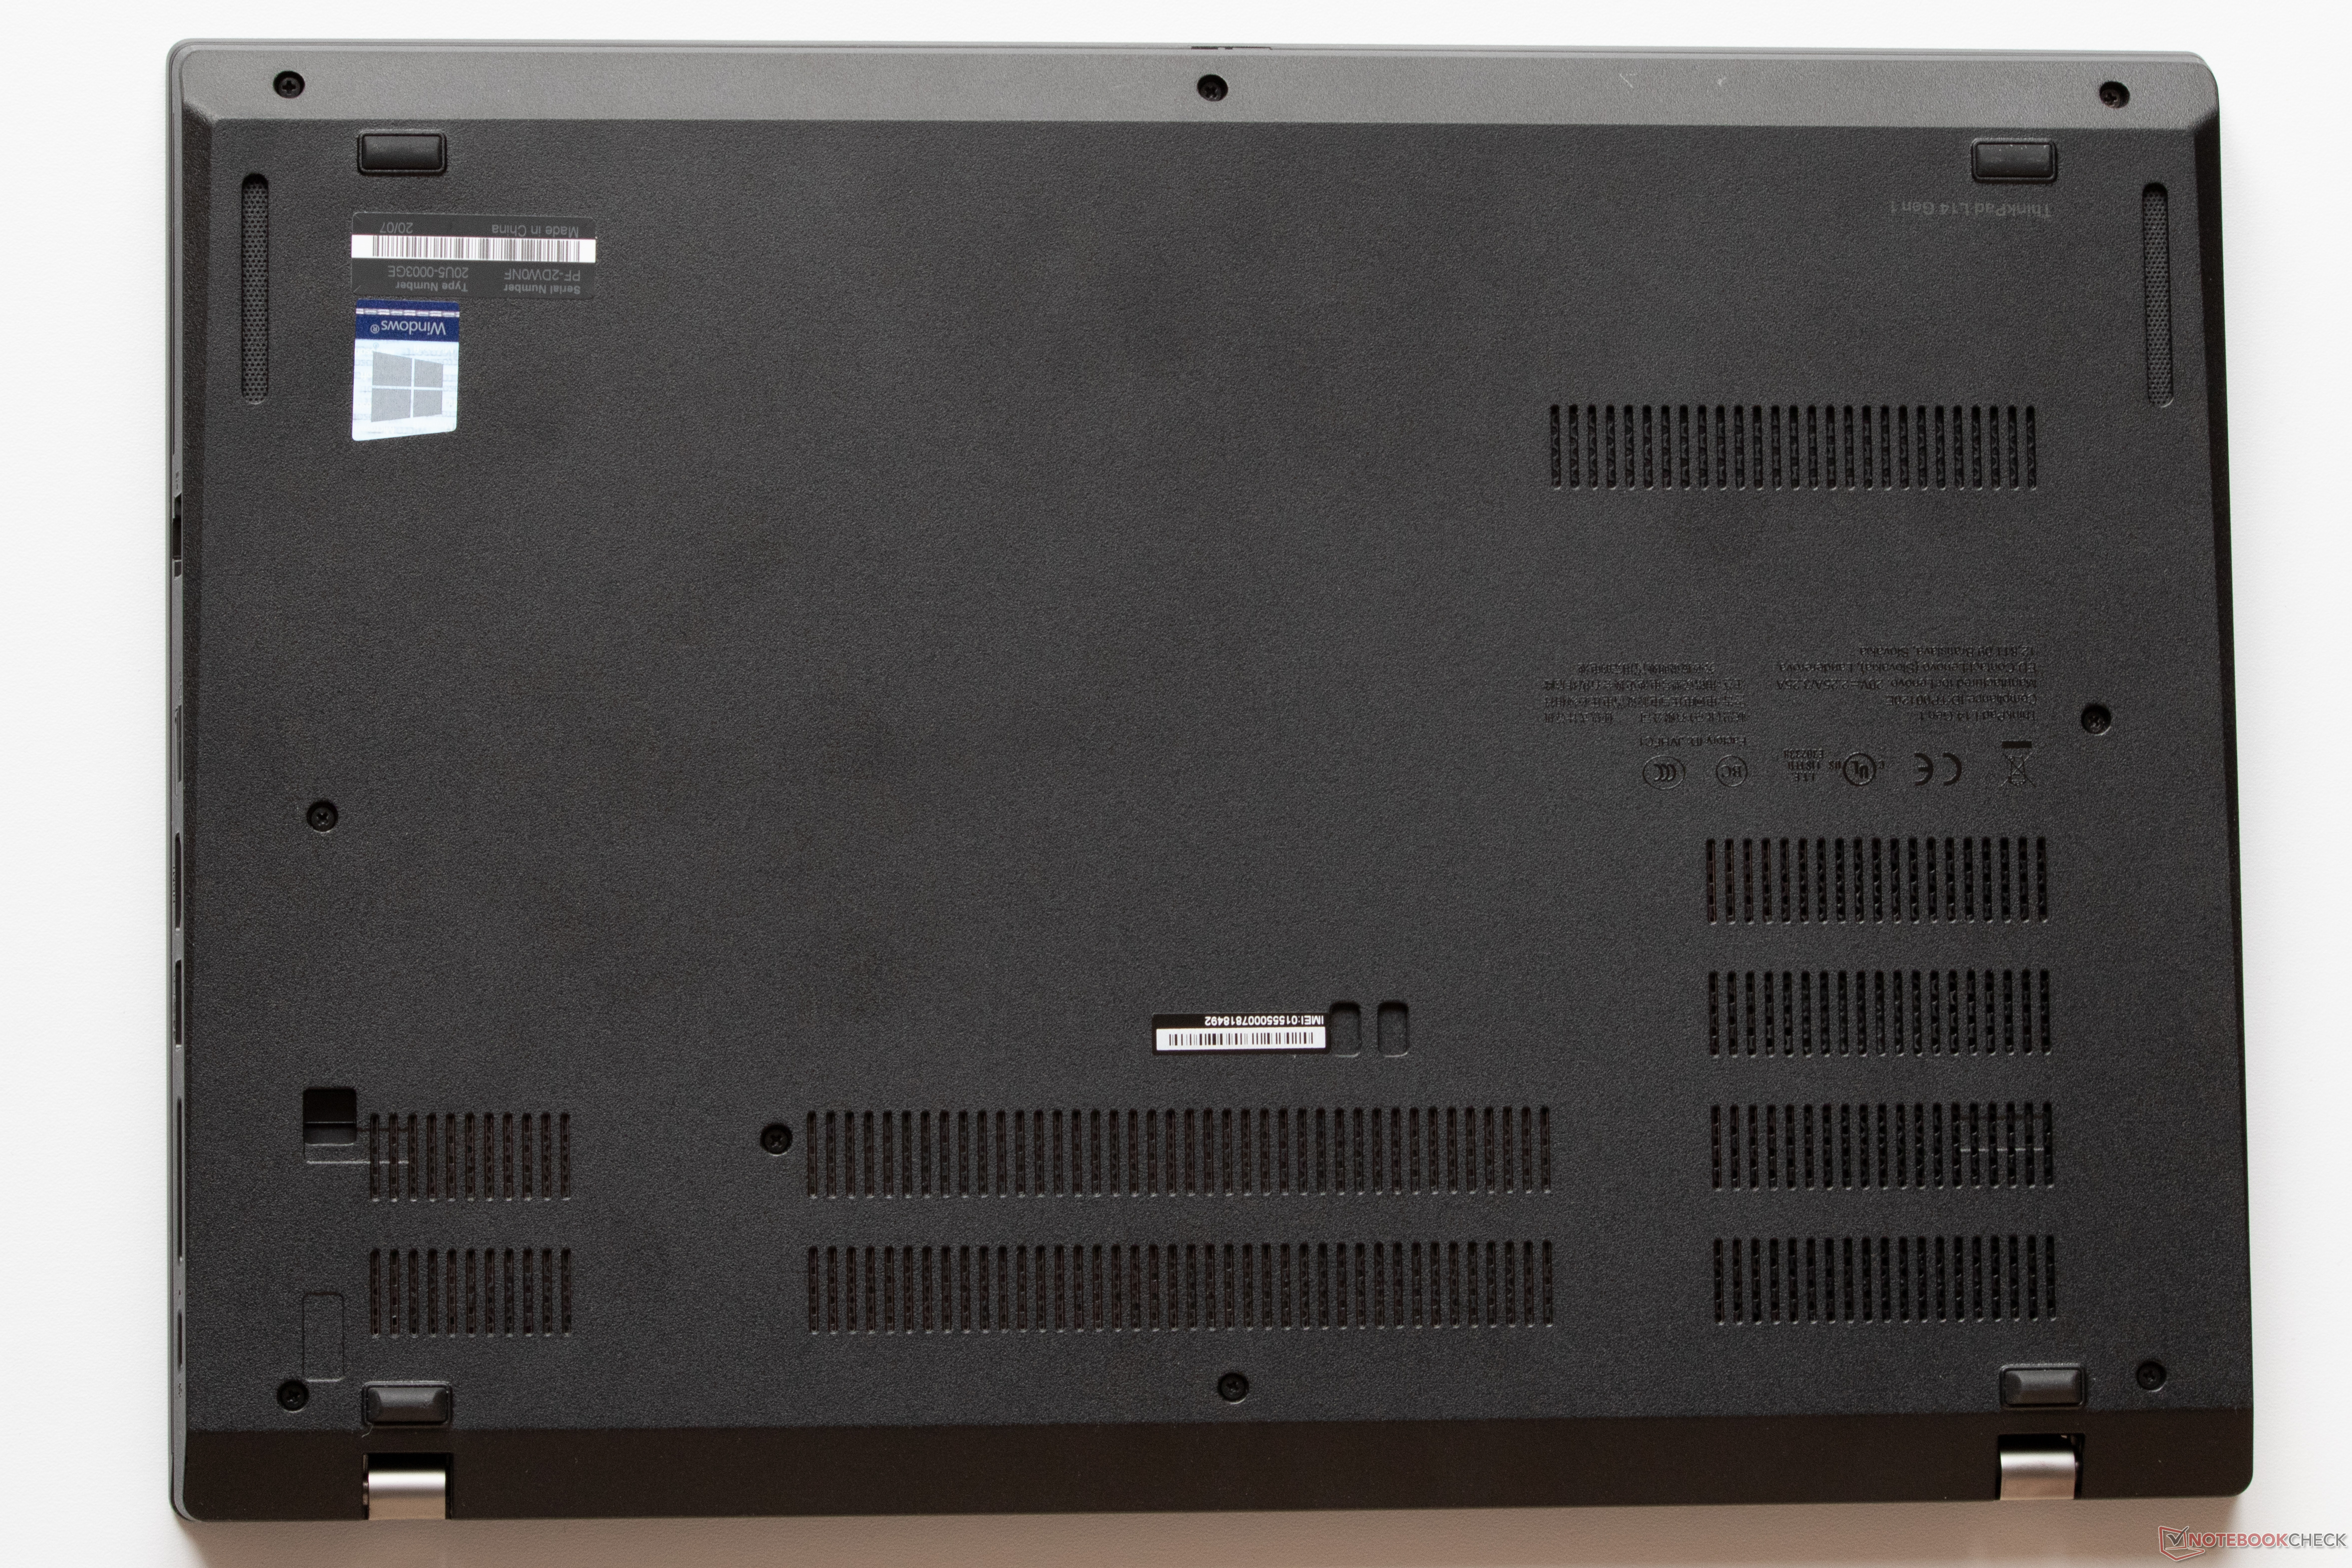
Compared to last year’s L490 the L14 is 2.1 mm thinner and 4 mm narrower. Its weight remained identical at 1.7 kg.
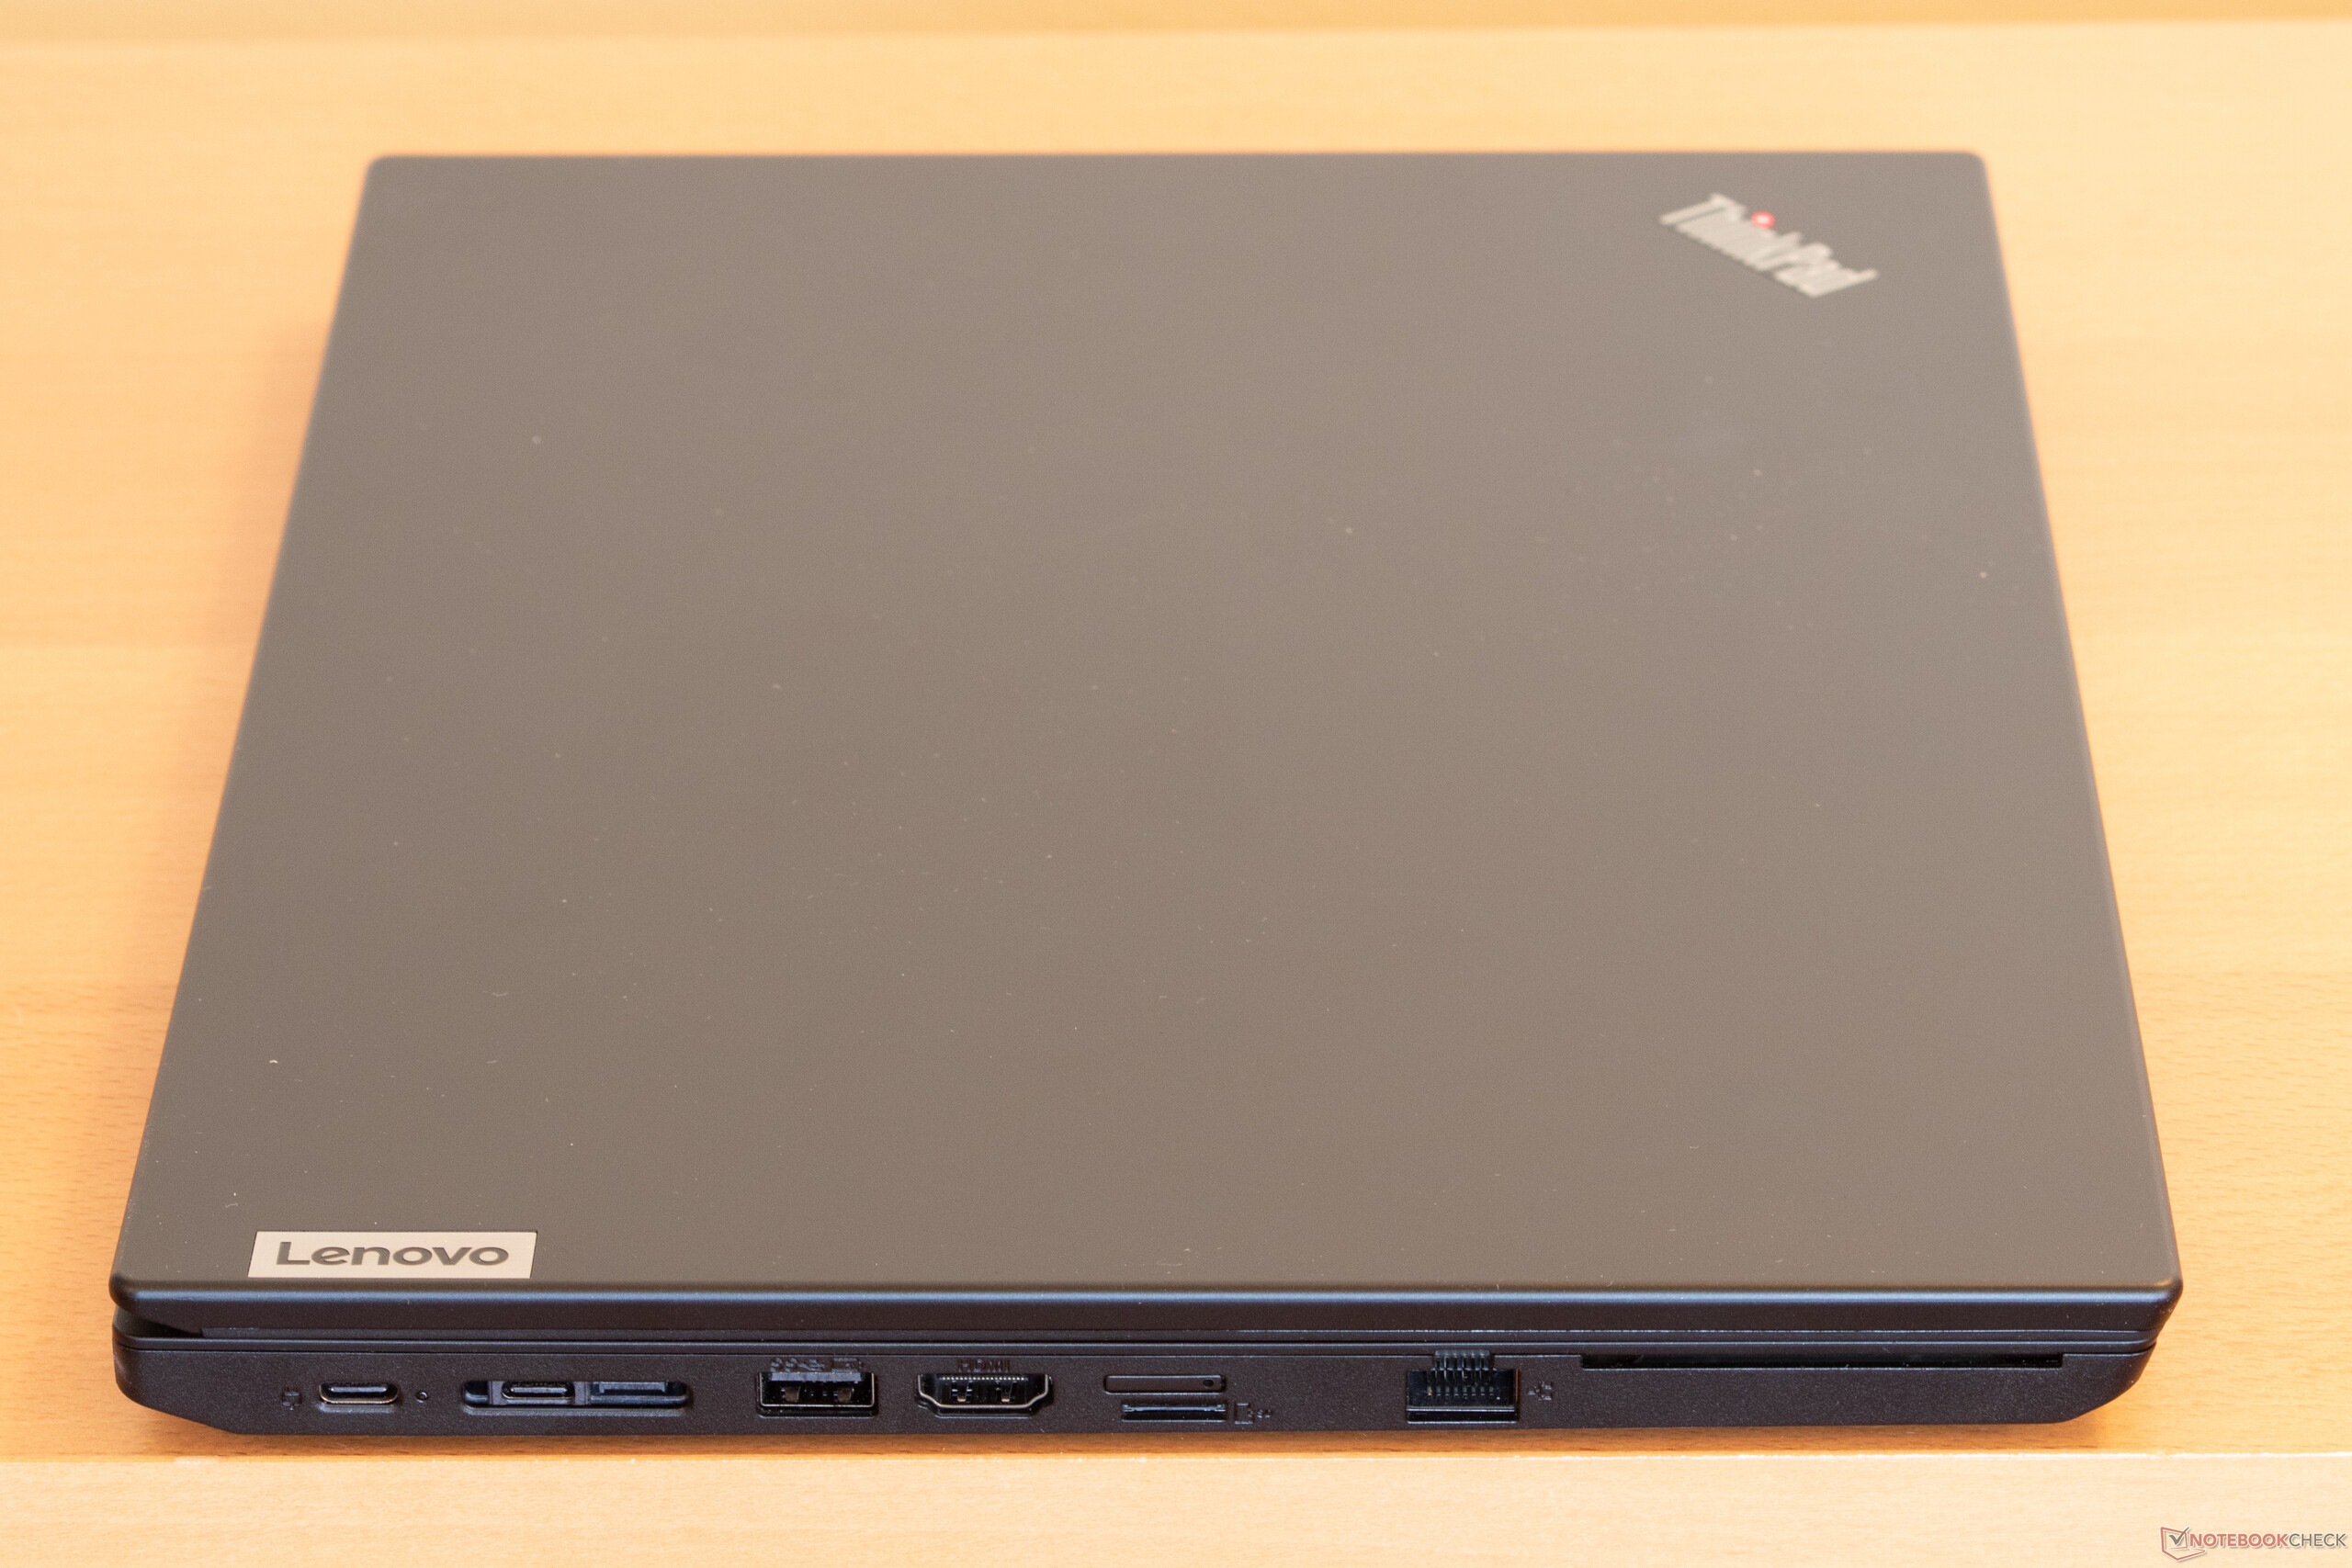
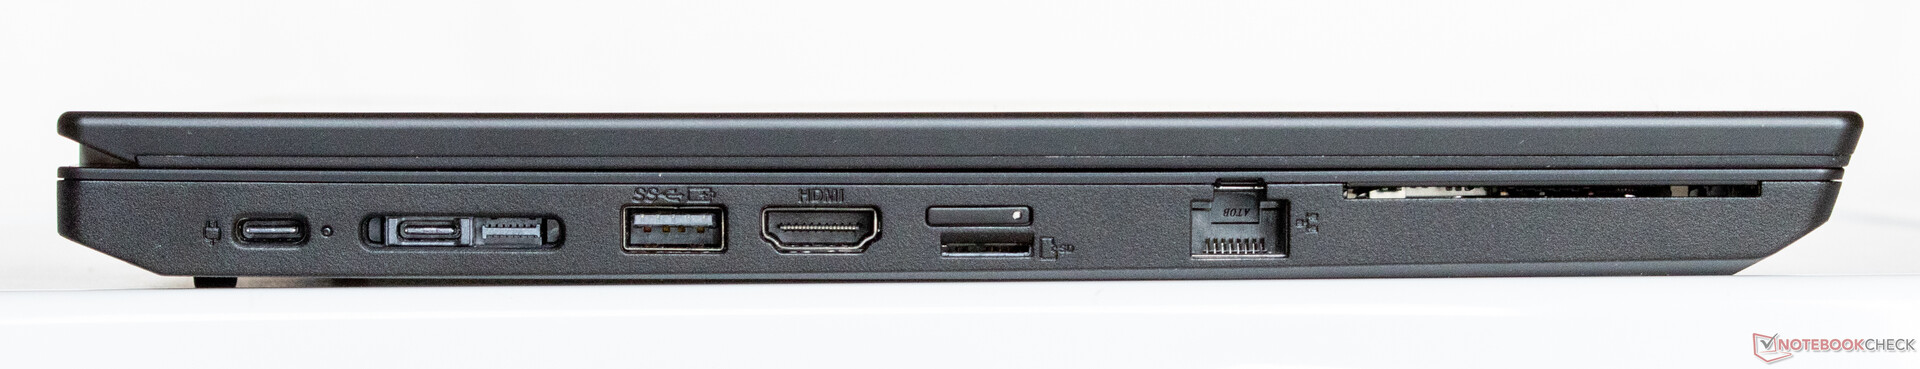
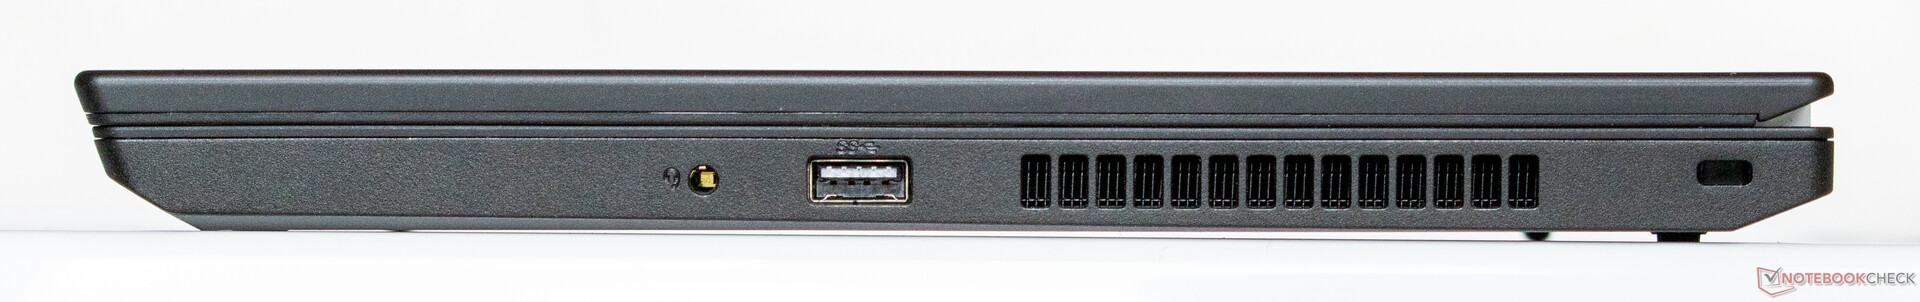
Connectivity – AMD brings HDMI 2.0
Connectivity remained unchanged over last year’s L490. The L-series continues to lack a Thunderbolt port, which is only available on the T-series. Port layout has also remained unchanged over the ThinkPad L490. The main difference is the new HDMI port, which now supports 4K resolutions at 60 instead of 30 Hz.
Keep in mind that the HDMI port differs between the Intel and AMD models. While AMD SKUs support HDMI 2.0 (4k at 60 Hz) Intel SKUs are still limited to HDMI 1.4 (4K at 24 Hz).
| SD Card Reader | |
| average JPG Copy Test (av. of 3 runs) | |
| Dell Latitude 14 5410-RJ80D (Toshiba Exceria Pro M501 microSDXC 64GB) | |
| Lenovo ThinkPad T14s-20UJS00K00 (Toshiba Exceria Pro M501 64 GB UHS-II) | |
| Lenovo ThinkPad L14-20U50003GE (Toshiba Exceria Pro M501 64 GB UHS-II) | |
| Lenovo ThinkPad L490 20Q6S08600 (Toshiba Exceria Pro M501 64 GB UHS-II) | |
| HP ProBook 445 G7 175W4EA (Toshiba Exceria Pro SDXC 64 GB UHS-II) | |
| Average of class Office (19.8 - 198.5, n=22, last 2 years) | |
| Lenovo ThinkPad T14s-20T00044GE (Toshiba Exceria Pro M501 64 GB UHS-II) | |
| maximum AS SSD Seq Read Test (1GB) | |
| Dell Latitude 14 5410-RJ80D (Toshiba Exceria Pro M501 microSDXC 64GB) | |
| HP ProBook 445 G7 175W4EA (Toshiba Exceria Pro SDXC 64 GB UHS-II) | |
| Lenovo ThinkPad L14-20U50003GE (Toshiba Exceria Pro M501 64 GB UHS-II) | |
| Lenovo ThinkPad T14s-20UJS00K00 (Toshiba Exceria Pro M501 64 GB UHS-II) | |
| Lenovo ThinkPad L490 20Q6S08600 (Toshiba Exceria Pro M501 64 GB UHS-II) | |
| Average of class Office (27.4 - 249, n=21, last 2 years) | |
| Lenovo ThinkPad T14s-20T00044GE (Toshiba Exceria Pro M501 64 GB UHS-II) | |


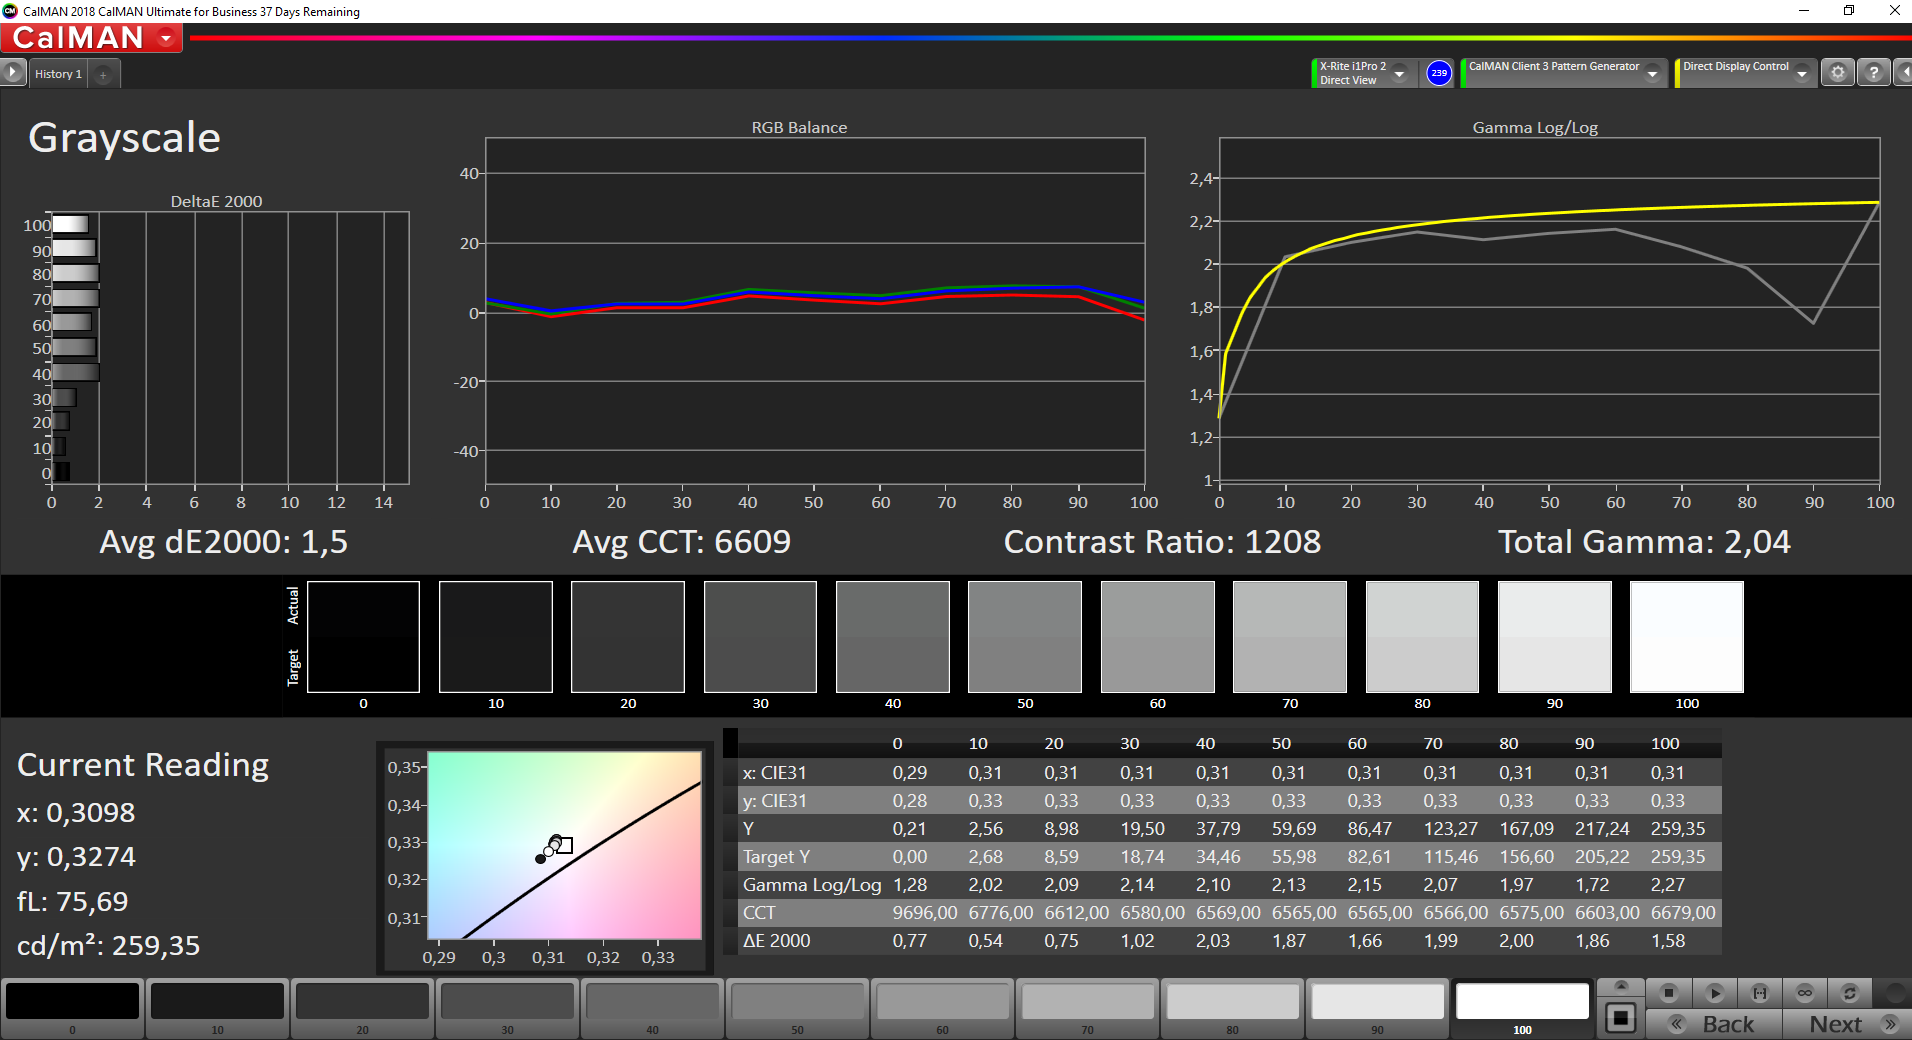
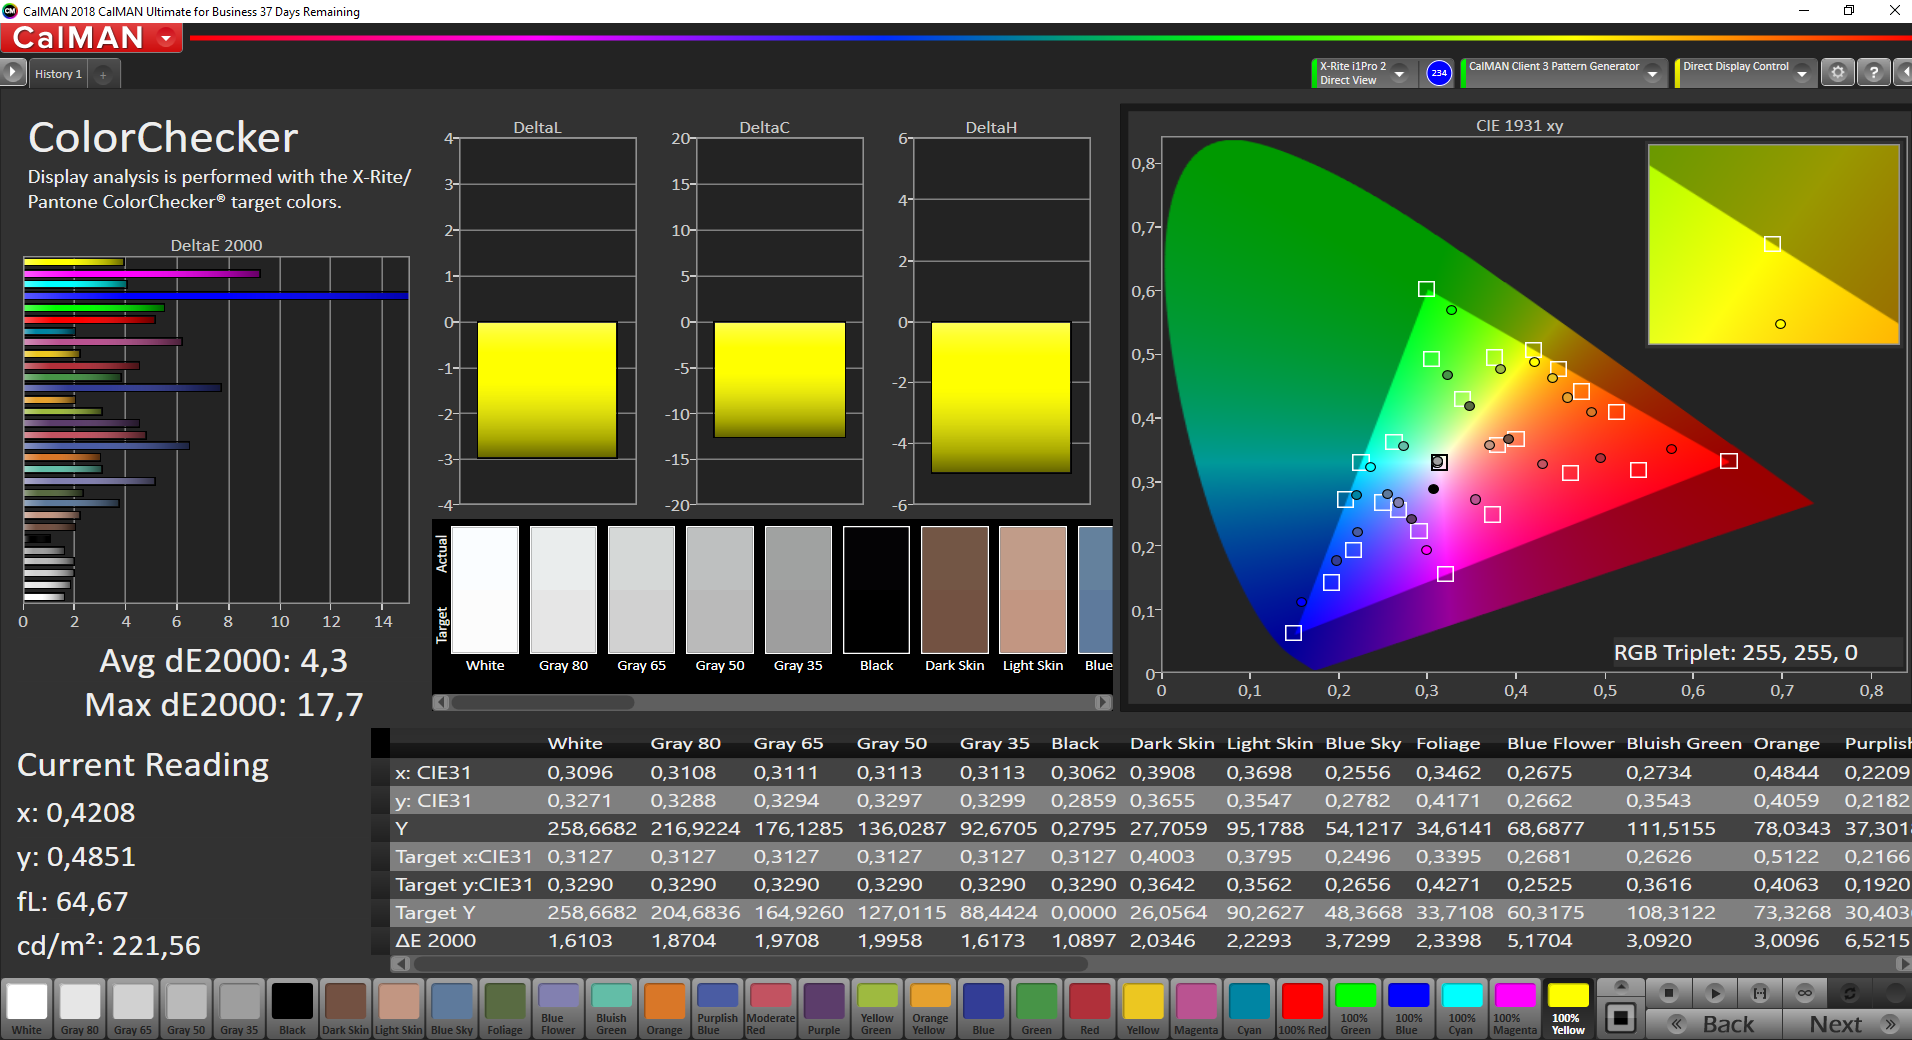
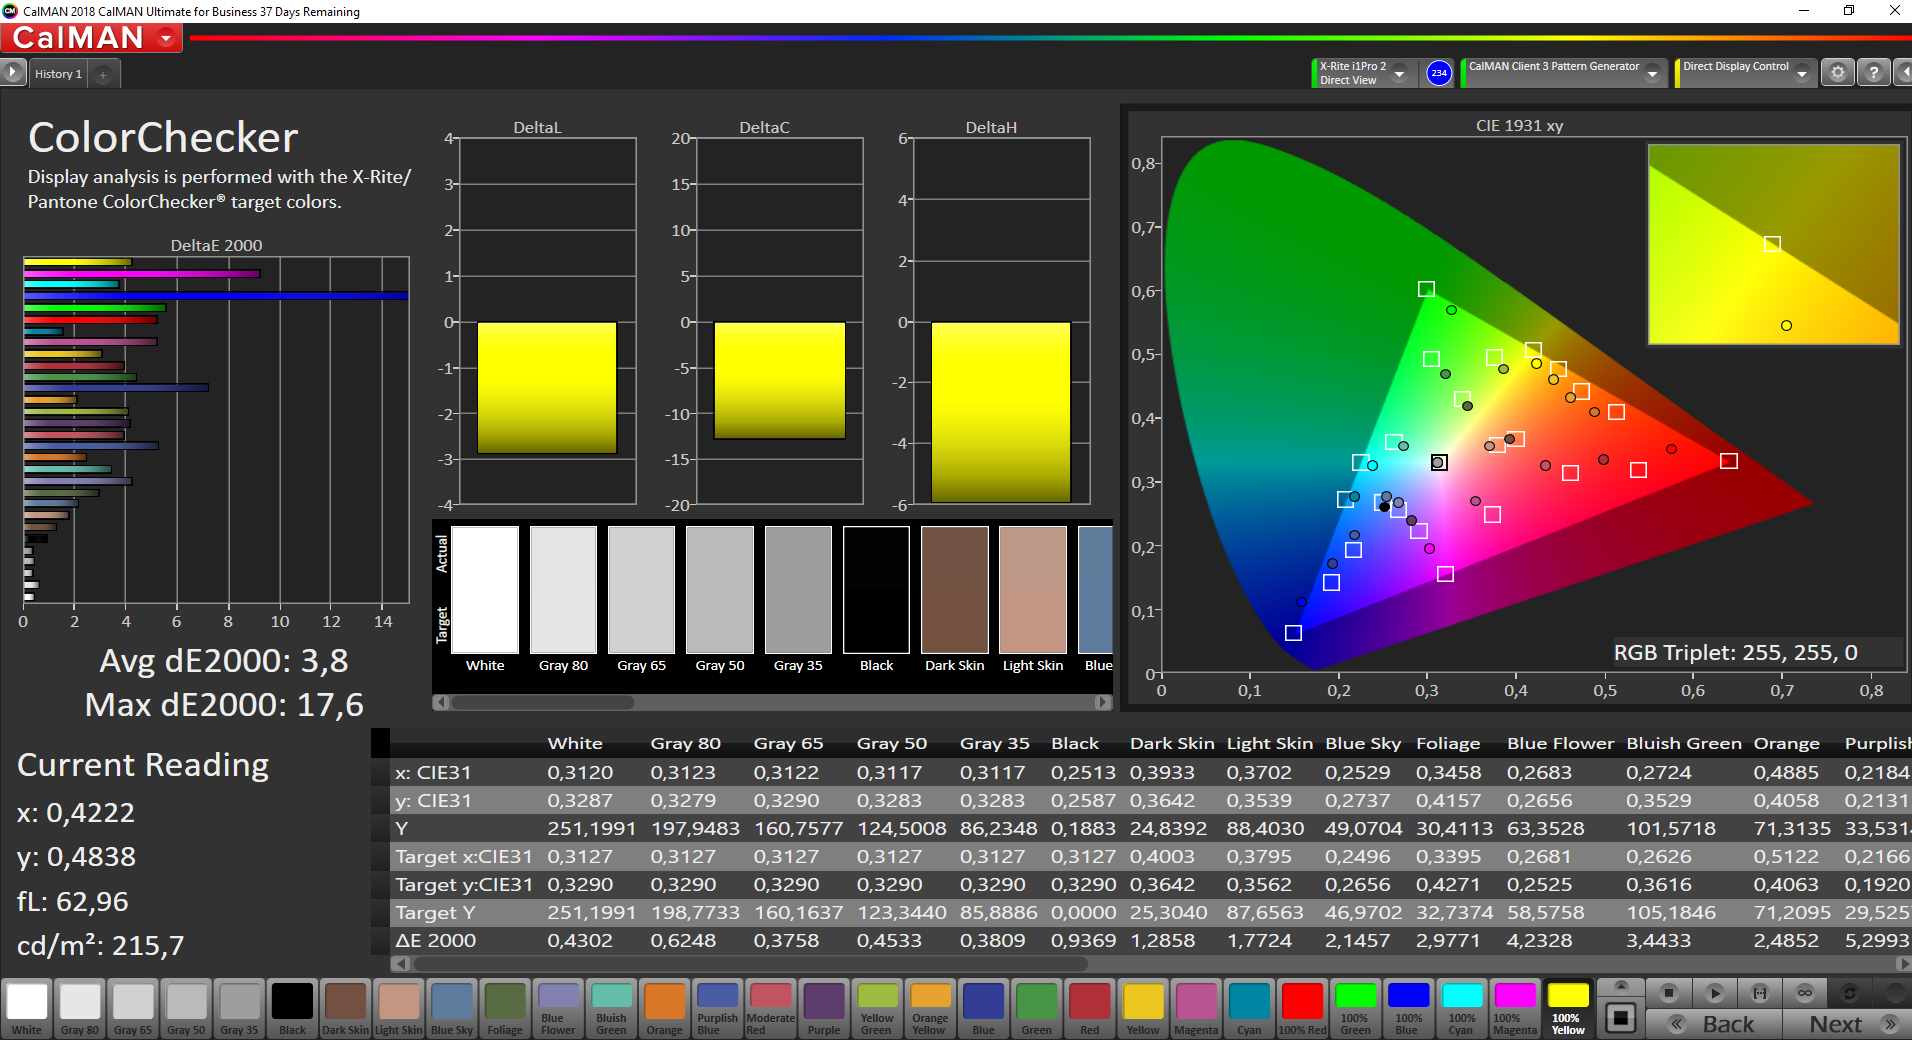
Display – Only Marginally Better

Last year’s L490 featured a different panel than its predecessor, and it was barely any brighter than the L480’s display that was significantly too dim. This year, we see yet another panel in the ThinkPad L14, the Innolux N140HCA-EAC – basically a cheaper model of the ThinkPad T14s’s Innolux N140HCG-GQ2 panel.
| |||||||||||||||||||||||||
Brightness Distribution: 92 %
Center on Battery: 260 cd/m²
Contrast: 1233:1 (Black: 0.21 cd/m²)
ΔE ColorChecker Calman: 4.3 | ∀{0.5-29.43 Ø4.71}
calibrated: 3.8
ΔE Greyscale Calman: 1.5 | ∀{0.09-98 Ø4.96}
62.9% sRGB (Argyll 1.6.3 3D)
40% AdobeRGB 1998 (Argyll 1.6.3 3D)
43.37% AdobeRGB 1998 (Argyll 3D)
63% sRGB (Argyll 3D)
41.96% Display P3 (Argyll 3D)
Gamma: 2.04
CCT: 6609 K
| Lenovo ThinkPad L14-20U50003GE N140HCA-EAC, IPS, 1920x1080, 14" | Lenovo ThinkPad L490 20Q6S08600 Lenovo LEN40A9, IPS, 1920x1080, 14" | Lenovo ThinkPad E14 Gen2-20T7S00W00 B140HAN05.7, a-Si IPS LED, 1920x1080, 14" | Lenovo ThinkPad T14s-20UJS00K00 N140HCG-GQ2, IPS , 1920x1080, 14" | Lenovo ThinkPad T14s-20T00044GE B140HAN05.7, LTPS AHVA-IPS LED, 1920x1080, 14" | HP ProBook 445 G7 175W4EA BOE0868, IPS, 1920x1080, 14" | Dell Latitude 14 5410-RJ80D BOE NV14N4F, a-Si IPS LED, 1920x1080, 14" | |
|---|---|---|---|---|---|---|---|
| Display | 0% | -9% | 58% | 56% | -5% | -7% | |
| Display P3 Coverage (%) | 41.96 | 41.93 0% | 38.16 -9% | 66.8 59% | 66.6 59% | 39.92 -5% | 39.02 -7% |
| sRGB Coverage (%) | 63 | 62.8 0% | 57.2 -9% | 97.9 55% | 96.8 54% | 59.6 -5% | 58 -8% |
| AdobeRGB 1998 Coverage (%) | 43.37 | 43.35 0% | 39.42 -9% | 69 59% | 67.6 56% | 41.25 -5% | 40.32 -7% |
| Response Times | 11% | -1% | 36% | -23% | 2% | -9% | |
| Response Time Grey 50% / Grey 80% * (ms) | 42 ? | 37.6 ? 10% | 46.4 ? -10% | 32.4 ? 23% | 63.2 ? -50% | 40 ? 5% | 46 ? -10% |
| Response Time Black / White * (ms) | 29.6 ? | 26.4 ? 11% | 27.2 ? 8% | 15.2 ? 49% | 28 ? 5% | 30 ? -1% | 32 ? -8% |
| PWM Frequency (Hz) | 25000 ? | 26040 ? | 192 ? | 1000 ? | |||
| Screen | -14% | -22% | 34% | 29% | -34% | -36% | |
| Brightness middle (cd/m²) | 259 | 252 -3% | 281 8% | 404 56% | 404 56% | 277 7% | 235 -9% |
| Brightness (cd/m²) | 244 | 238 -2% | 264 8% | 371 52% | 397 63% | 270 11% | 219 -10% |
| Brightness Distribution (%) | 92 | 82 -11% | 87 -5% | 88 -4% | 92 0% | 88 -4% | 81 -12% |
| Black Level * (cd/m²) | 0.21 | 0.32 -52% | 0.25 -19% | 0.34 -62% | 0.21 -0% | 0.285 -36% | 0.21 -0% |
| Contrast (:1) | 1233 | 788 -36% | 1124 -9% | 1188 -4% | 1924 56% | 972 -21% | 1119 -9% |
| Colorchecker dE 2000 * | 4.3 | 4.6 -7% | 5.8 -35% | 1.4 67% | 3.1 28% | 5.53 -29% | 6.11 -42% |
| Colorchecker dE 2000 max. * | 17.7 | 18.5 -5% | 22.3 -26% | 3.2 82% | 4.7 73% | 10.68 40% | 16.6 6% |
| Colorchecker dE 2000 calibrated * | 3.8 | 4 -5% | 4.9 -29% | 0.8 79% | 1.3 66% | 4.43 -17% | |
| Greyscale dE 2000 * | 1.5 | 2 -33% | 3.2 -113% | 1.6 -7% | 3.4 -127% | 6.2 -313% | 5.52 -268% |
| Gamma | 2.04 108% | 2 110% | 2.15 102% | 2.13 103% | 2.38 92% | 2.34 94% | 2.33 94% |
| CCT | 6609 98% | 6524 100% | 6452 101% | 6480 100% | 7070 92% | 7342 89% | 6680 97% |
| Color Space (Percent of AdobeRGB 1998) (%) | 40 | 40 0% | 36.2 -9% | 63 58% | 61.8 55% | 38 -5% | 37 -7% |
| Color Space (Percent of sRGB) (%) | 62.9 | 62.7 0% | 56.9 -10% | 97.9 56% | 96.6 54% | 59 -6% | 58 -8% |
| Total Average (Program / Settings) | -1% /
-8% | -11% /
-17% | 43% /
39% | 21% /
28% | -12% /
-24% | -17% /
-27% |
* ... smaller is better
The differences between the L and the T-series are very obvious in regard to maximum brightness (244 vs. 371 nits) as well as color space coverage, and the L14 is far behind its more expensive business sibling. When compared with the L490, brightness remained practically identical with some improvements in contrast ratio and black level. That said our review unit still managed to outperform the HP and Dell.
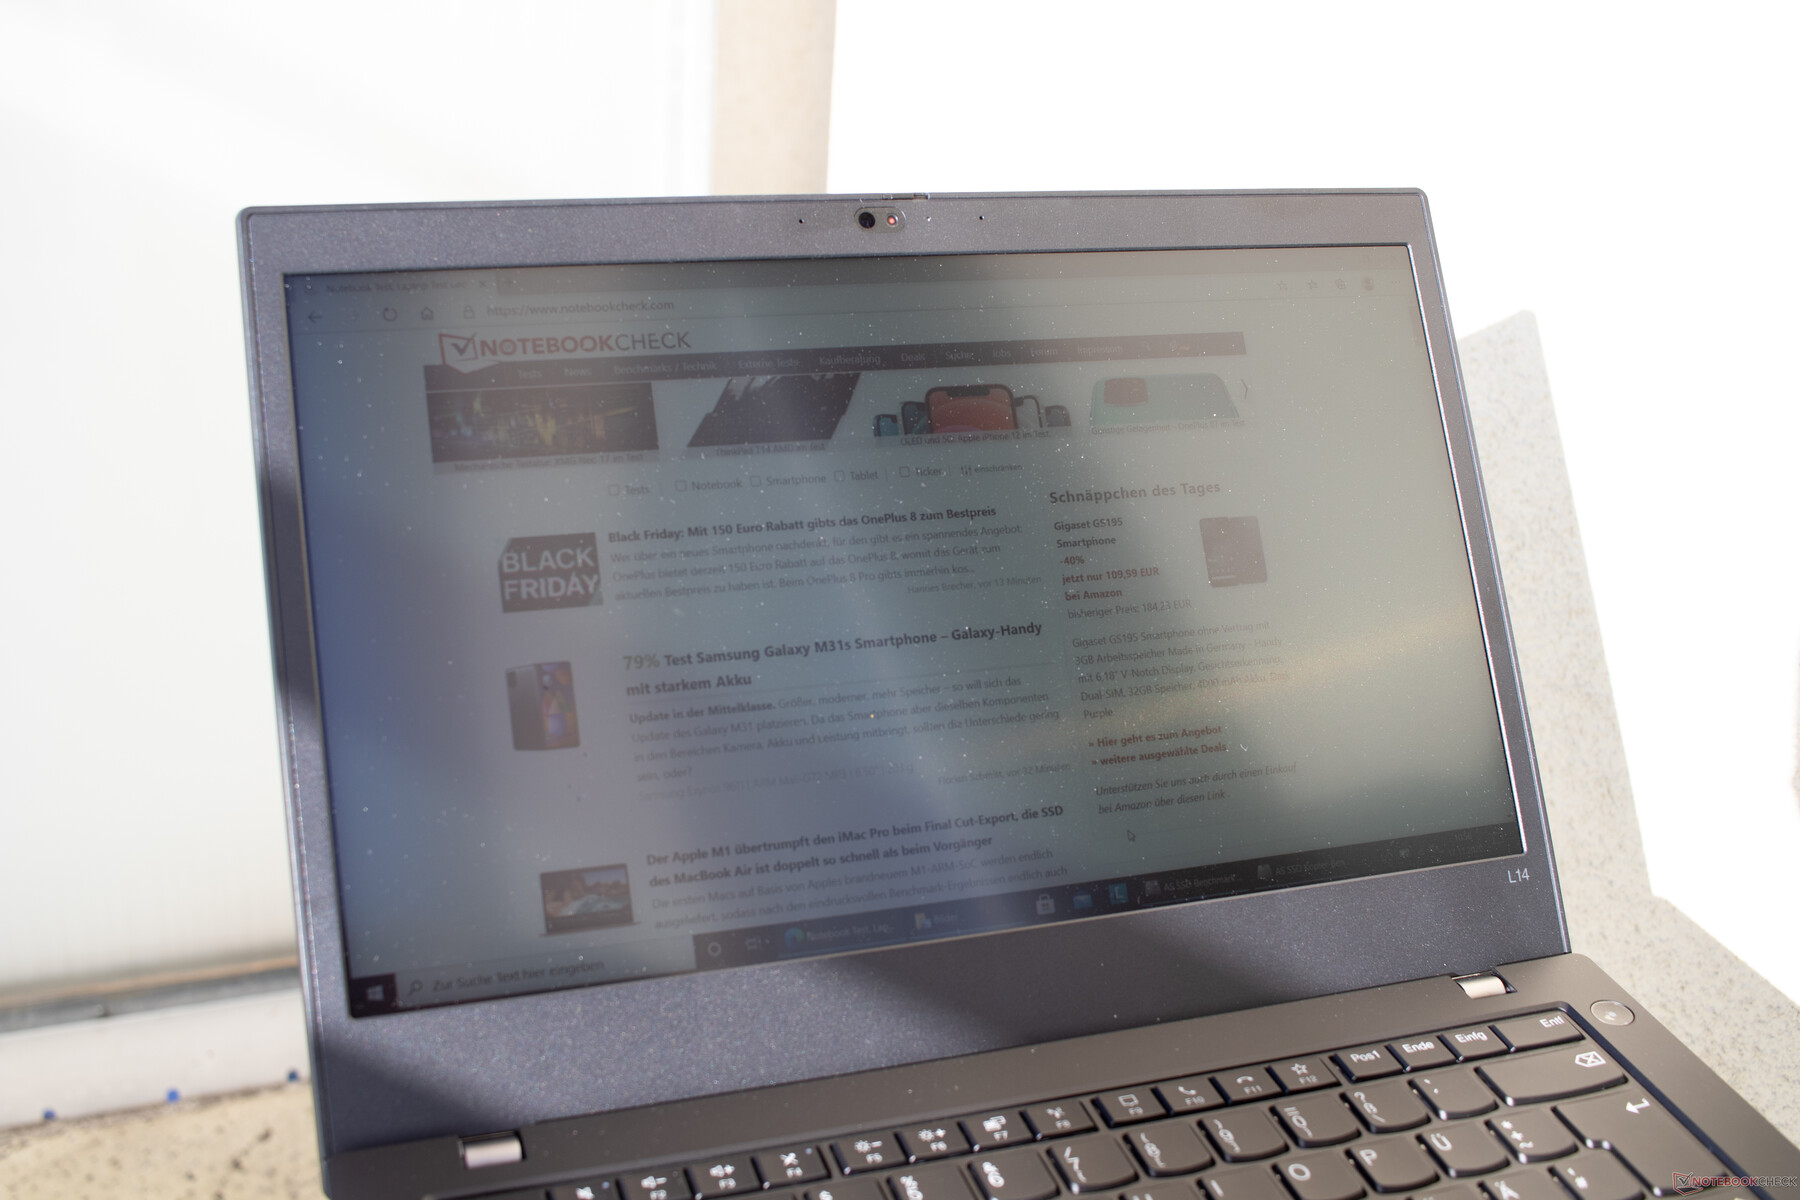
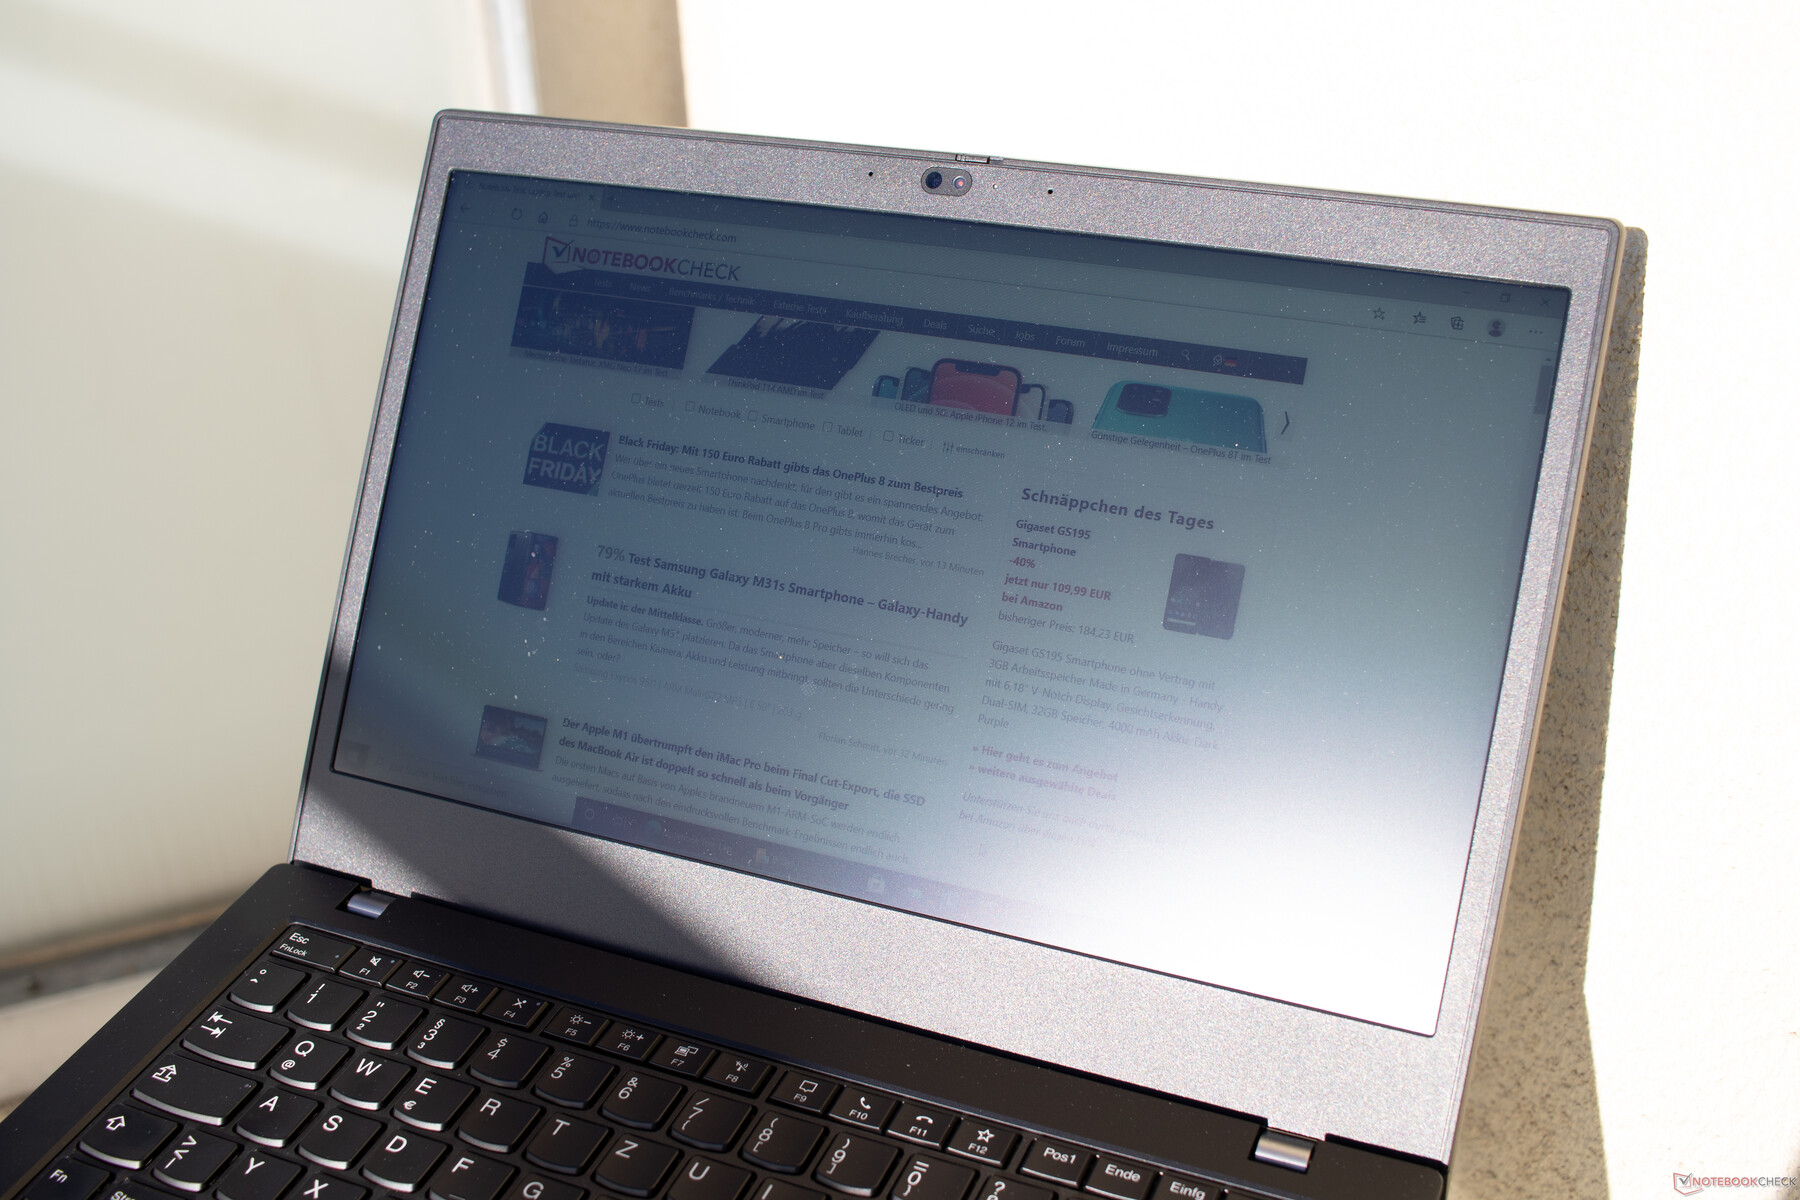
Outdoor usability was decent even in bright environments, but you should definitely avoid direct light sources. In order to get comfortable, you need an overcast day or at least full shade.
Display Response Times
| ↔ Response Time Black to White | ||
|---|---|---|
| 29.6 ms ... rise ↗ and fall ↘ combined | ↗ 15.6 ms rise | 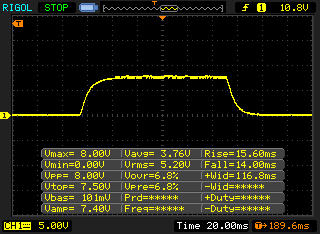 |
| ↘ 14 ms fall | ||
| The screen shows relatively slow response rates in our tests and may be too slow for gamers. In comparison, all tested devices range from 0.1 (minimum) to 240 (maximum) ms. » 79 % of all devices are better. This means that the measured response time is worse than the average of all tested devices (19.8 ms). | ||
| ↔ Response Time 50% Grey to 80% Grey | ||
| 42 ms ... rise ↗ and fall ↘ combined | ↗ 21.6 ms rise | 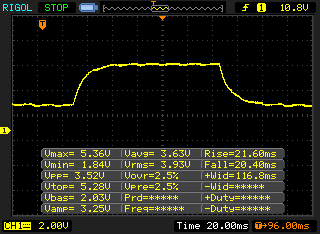 |
| ↘ 20.4 ms fall | ||
| The screen shows slow response rates in our tests and will be unsatisfactory for gamers. In comparison, all tested devices range from 0.165 (minimum) to 636 (maximum) ms. » 67 % of all devices are better. This means that the measured response time is worse than the average of all tested devices (30.9 ms). | ||
Screen Flickering / PWM (Pulse-Width Modulation)
| Screen flickering / PWM not detected | 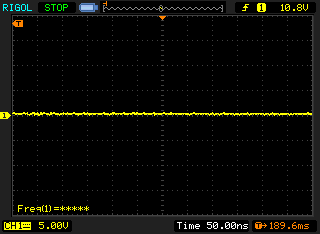 | ||
In comparison: 52 % of all tested devices do not use PWM to dim the display. If PWM was detected, an average of 7741 (minimum: 5 - maximum: 343500) Hz was measured. | |||
The panel itself is a relatively inexpensive IPS panel that continued to suffer from major color deviations even post calibration. The L14 is thus unsuitable for serious photo editing but should work perfectly fine in typical office and business environments.
Performance – No Throttling with AMD
Processor
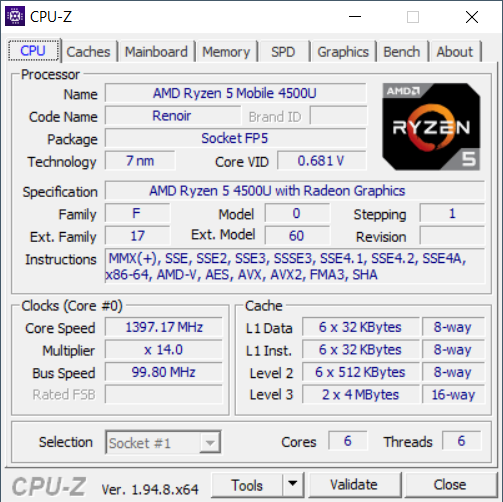
AMD’s Ryzen 5 4500U does not support Hyperthreading on its six Zen 2 cores and thus features exactly as many threads as it has cores to offer. It does, however, run at a slightly higher base clock speed of 2.3 GHz with a turbo boost of up to 4 GHz. Additional details can be found on our dedicated page.
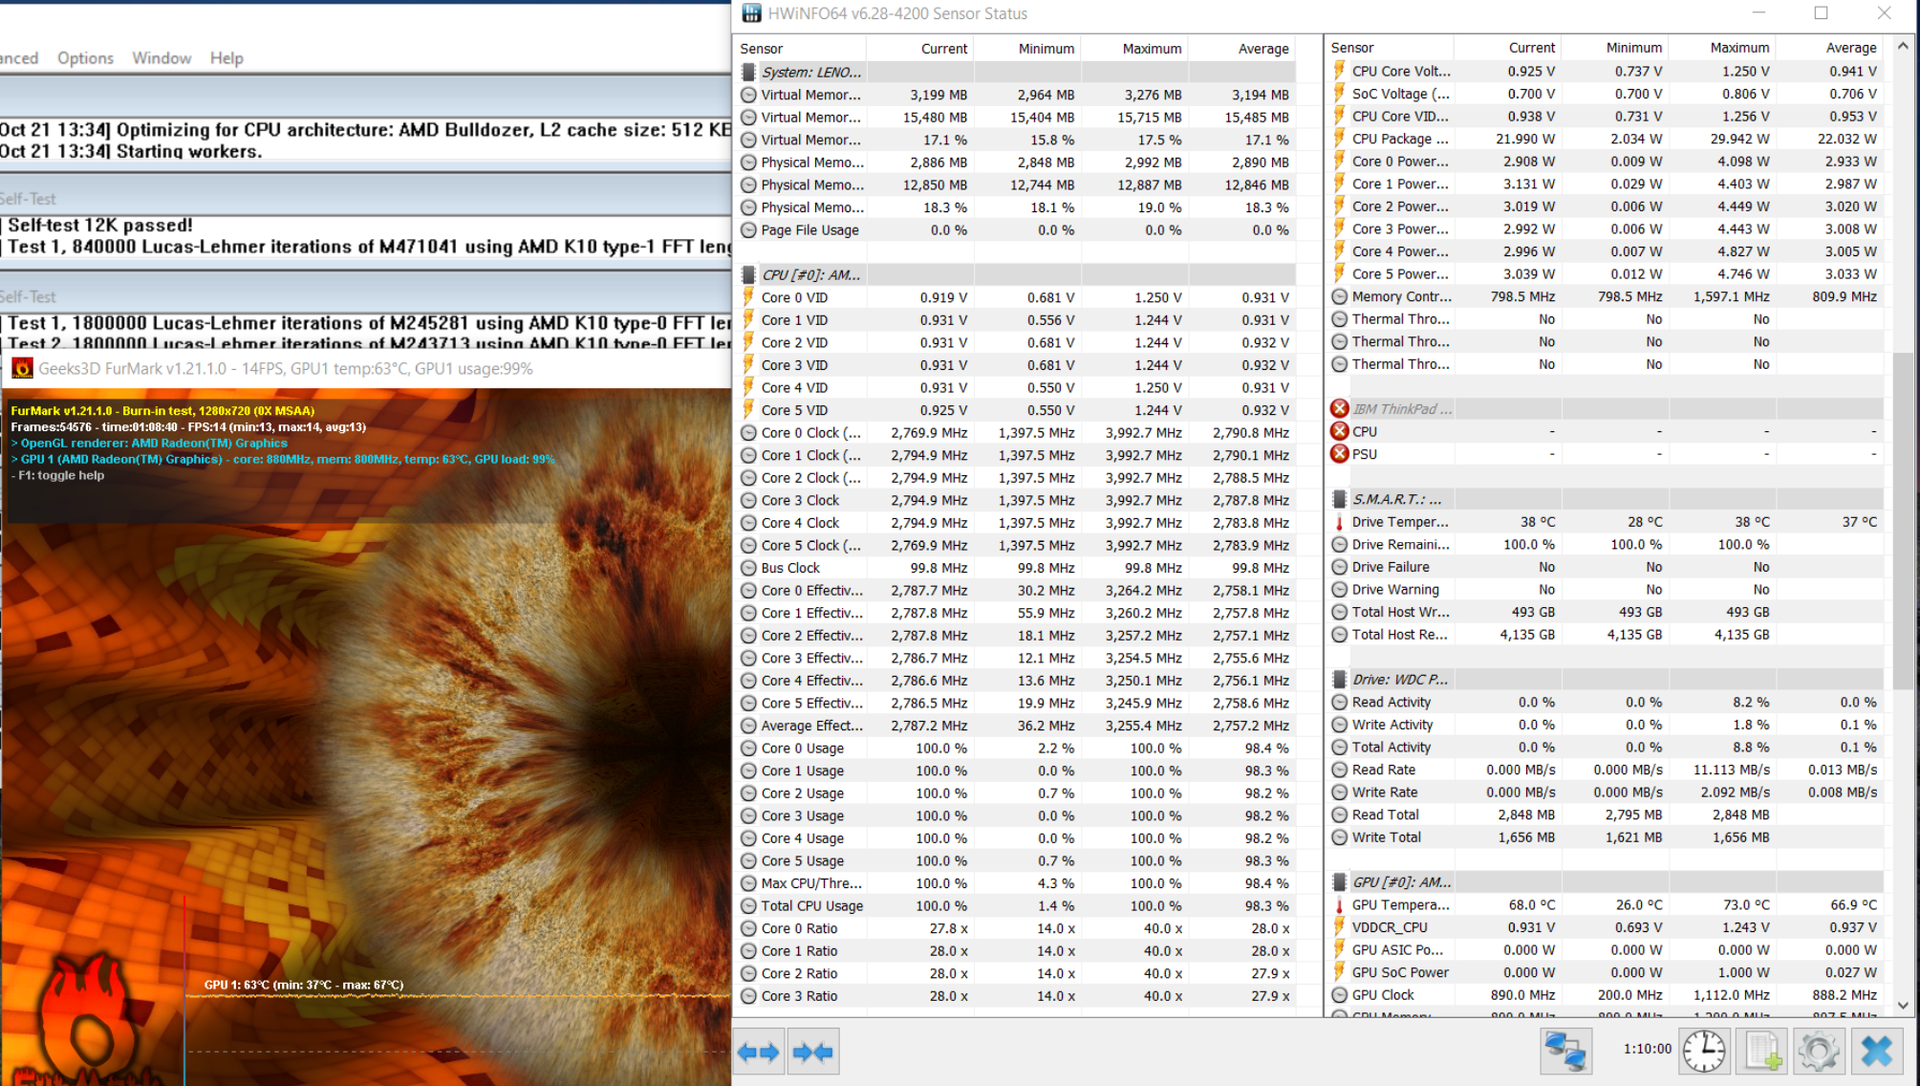
In multi-core benchmarks, the AMD Ryzen 5-powered ThinkPad L14 performed similarly to the recently reviewed ThinkPad E14 and outperformed its identically equipped HP ProBook 445 and Dell Latitude 14 competitors. We also found no evidence of throttling as performance remained stable and consistent even after 20 consecutive runs into our CineBench loop, much unlike Intel CPUs whose performance tends to drop significantly after the first run. Long story short: Intel CPUs seem to be more susceptible to performance throttling than AMD CPUs.
All Ryzen 5 notebooks performed almost identically in our single-core benchmark and managed to outperform Intel’s Core i5 by a small margin.
Cinebench R15: CPU Single 64Bit | CPU Multi 64Bit
Blender: v2.79 BMW27 CPU
7-Zip 18.03: 7z b 4 -mmt1 | 7z b 4
Geekbench 5.5: Single-Core | Multi-Core
HWBOT x265 Benchmark v2.2: 4k Preset
LibreOffice : 20 Documents To PDF
R Benchmark 2.5: Overall mean
| Cinebench R20 / CPU (Single Core) | |
| Average of class Office (345 - 816, n=75, last 2 years) | |
| Lenovo ThinkPad T14s-20UJS00K00 | |
| HP ProBook 445 G7 175W4EA | |
| Lenovo ThinkPad E14 Gen2-20T7S00W00 | |
| Lenovo ThinkPad L14-20U50003GE | |
| Average AMD Ryzen 5 4500U (424 - 453, n=12) | |
| Dell Latitude 14 5410-RJ80D | |
| Lenovo ThinkPad T14s-20T00044GE | |
| Cinebench R20 / CPU (Multi Core) | |
| Average of class Office (648 - 8840, n=75, last 2 years) | |
| Lenovo ThinkPad T14s-20UJS00K00 | |
| Lenovo ThinkPad L14-20U50003GE | |
| Average AMD Ryzen 5 4500U (1843 - 2530, n=13) | |
| HP ProBook 445 G7 175W4EA | |
| Lenovo ThinkPad E14 Gen2-20T7S00W00 | |
| Dell Latitude 14 5410-RJ80D | |
| Lenovo ThinkPad T14s-20T00044GE | |
| Cinebench R15 / CPU Single 64Bit | |
| Average of class Office (99.5 - 316, n=77, last 2 years) | |
| Lenovo ThinkPad T14s-20UJS00K00 | |
| Lenovo ThinkPad E14 Gen2-20T7S00W00 | |
| HP ProBook 445 G7 175W4EA | |
| Lenovo ThinkPad L14-20U50003GE | |
| Average AMD Ryzen 5 4500U (156 - 177, n=13) | |
| Dell Latitude 14 5410-RJ80D | |
| Lenovo ThinkPad L490 20Q6S08600 | |
| Lenovo ThinkPad T14s-20T00044GE | |
| Cinebench R15 / CPU Multi 64Bit | |
| Average of class Office (250 - 3380, n=77, last 2 years) | |
| Lenovo ThinkPad T14s-20UJS00K00 | |
| Average AMD Ryzen 5 4500U (715 - 1007, n=18) | |
| HP ProBook 445 G7 175W4EA | |
| Lenovo ThinkPad L14-20U50003GE | |
| Lenovo ThinkPad E14 Gen2-20T7S00W00 | |
| Dell Latitude 14 5410-RJ80D | |
| Lenovo ThinkPad T14s-20T00044GE | |
| Lenovo ThinkPad L490 20Q6S08600 | |
| Blender / v2.79 BMW27 CPU | |
| Lenovo ThinkPad L490 20Q6S08600 | |
| Dell Latitude 14 5410-RJ80D | |
| Lenovo ThinkPad T14s-20T00044GE | |
| HP ProBook 445 G7 175W4EA | |
| Average AMD Ryzen 5 4500U (533 - 748, n=11) | |
| Lenovo ThinkPad E14 Gen2-20T7S00W00 | |
| Lenovo ThinkPad L14-20U50003GE | |
| Lenovo ThinkPad T14s-20UJS00K00 | |
| Average of class Office (158 - 1940, n=76, last 2 years) | |
| 7-Zip 18.03 / 7z b 4 -mmt1 | |
| Average of class Office (3387 - 6469, n=77, last 2 years) | |
| Lenovo ThinkPad T14s-20UJS00K00 | |
| HP ProBook 445 G7 175W4EA | |
| Lenovo ThinkPad L14-20U50003GE | |
| Average AMD Ryzen 5 4500U (4235 - 4338, n=11) | |
| Lenovo ThinkPad E14 Gen2-20T7S00W00 | |
| Lenovo ThinkPad T14s-20T00044GE | |
| Lenovo ThinkPad L490 20Q6S08600 | |
| Dell Latitude 14 5410-RJ80D | |
| 7-Zip 18.03 / 7z b 4 | |
| Average of class Office (7098 - 76886, n=77, last 2 years) | |
| Lenovo ThinkPad T14s-20UJS00K00 | |
| Lenovo ThinkPad L14-20U50003GE | |
| Average AMD Ryzen 5 4500U (22466 - 25891, n=11) | |
| Lenovo ThinkPad E14 Gen2-20T7S00W00 | |
| HP ProBook 445 G7 175W4EA | |
| Dell Latitude 14 5410-RJ80D | |
| Lenovo ThinkPad T14s-20T00044GE | |
| Lenovo ThinkPad L490 20Q6S08600 | |
| Geekbench 5.5 / Single-Core | |
| Average of class Office (811 - 2175, n=73, last 2 years) | |
| Lenovo ThinkPad T14s-20UJS00K00 | |
| Dell Latitude 14 5410-RJ80D | |
| Average AMD Ryzen 5 4500U (1082 - 1220, n=10) | |
| Lenovo ThinkPad E14 Gen2-20T7S00W00 | |
| HP ProBook 445 G7 175W4EA | |
| Lenovo ThinkPad L14-20U50003GE | |
| Lenovo ThinkPad T14s-20T00044GE | |
| Geekbench 5.5 / Multi-Core | |
| Average of class Office (1483 - 16999, n=73, last 2 years) | |
| Lenovo ThinkPad T14s-20UJS00K00 | |
| Average AMD Ryzen 5 4500U (4352 - 6234, n=10) | |
| Lenovo ThinkPad E14 Gen2-20T7S00W00 | |
| HP ProBook 445 G7 175W4EA | |
| Lenovo ThinkPad L14-20U50003GE | |
| Lenovo ThinkPad T14s-20T00044GE | |
| Dell Latitude 14 5410-RJ80D | |
| HWBOT x265 Benchmark v2.2 / 4k Preset | |
| Average of class Office (2.21 - 26, n=76, last 2 years) | |
| Lenovo ThinkPad T14s-20UJS00K00 | |
| Lenovo ThinkPad E14 Gen2-20T7S00W00 | |
| Lenovo ThinkPad L14-20U50003GE | |
| Average AMD Ryzen 5 4500U (5.86 - 7.33, n=10) | |
| Lenovo ThinkPad T14s-20T00044GE | |
| Lenovo ThinkPad L490 20Q6S08600 | |
| Dell Latitude 14 5410-RJ80D | |
| LibreOffice / 20 Documents To PDF | |
| HP ProBook 445 G7 175W4EA | |
| Dell Latitude 14 5410-RJ80D | |
| Average AMD Ryzen 5 4500U (58.2 - 78, n=11) | |
| Lenovo ThinkPad E14 Gen2-20T7S00W00 | |
| Lenovo ThinkPad L14-20U50003GE | |
| Lenovo ThinkPad T14s-20UJS00K00 | |
| Average of class Office (39.9 - 102.3, n=76, last 2 years) | |
| Lenovo ThinkPad T14s-20T00044GE | |
| R Benchmark 2.5 / Overall mean | |
| Dell Latitude 14 5410-RJ80D | |
| Lenovo ThinkPad T14s-20T00044GE | |
| Lenovo ThinkPad L14-20U50003GE | |
| Lenovo ThinkPad E14 Gen2-20T7S00W00 | |
| Average AMD Ryzen 5 4500U (0.614 - 0.654, n=10) | |
| Lenovo ThinkPad T14s-20UJS00K00 | |
| Average of class Office (0.393 - 0.888, n=76, last 2 years) | |
* ... smaller is better
System Performance
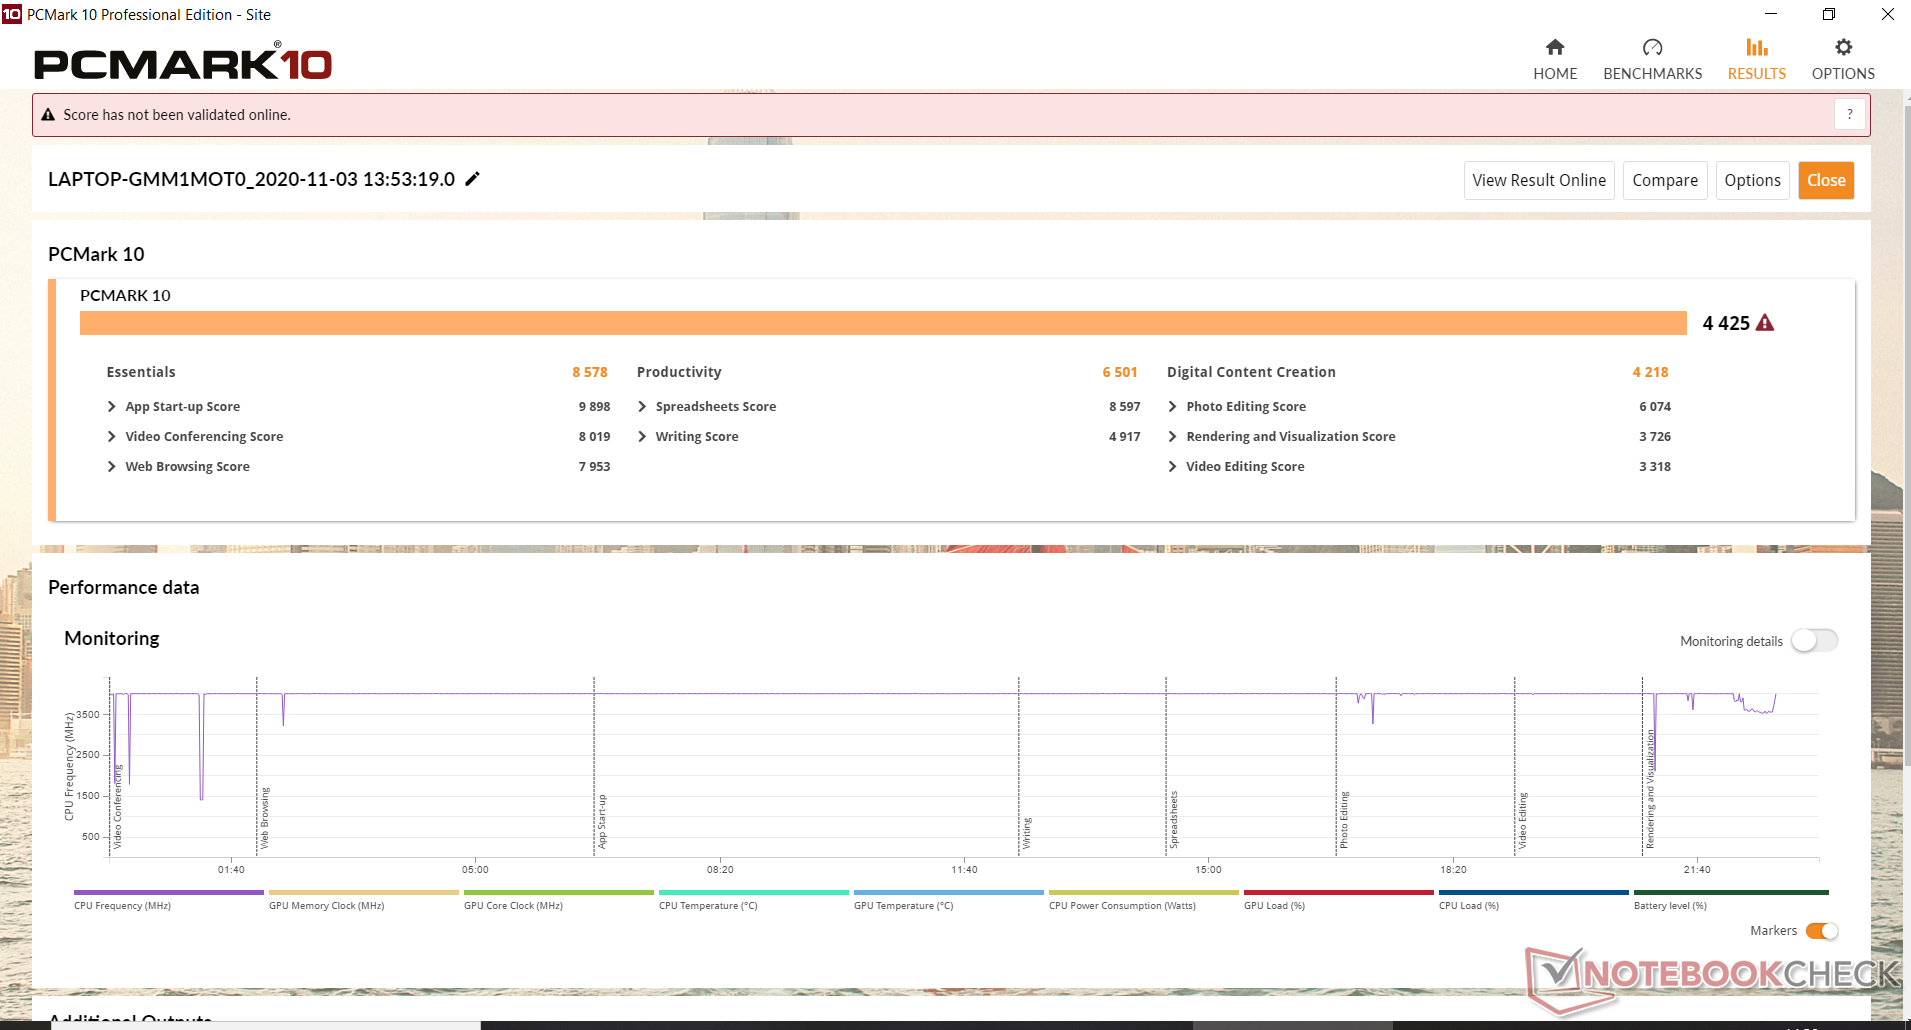
Compared to its competitors, the ThinkPad L14 performed average in PCMark 10. Nevertheless, it performed above average for an office and business notebook, which became noticeable not only in this particular synthetic benchmark but also during everyday use.
| PCMark 10 Score | 4425 points | |
Help | ||
| DPC Latencies / LatencyMon - interrupt to process latency (max), Web, Youtube, Prime95 | |
| Acer TravelMate P6 P614-51T-G2-72ZU | |
| Lenovo ThinkPad T14s-20T00044GE | |
| Dell Latitude 14 5410-RJ80D | |
| Lenovo ThinkPad L14-20U50003GE | |
| HP ProBook 445 G7 175W4EA | |
| Lenovo ThinkPad E14 Gen2-20T7S00W00 | |
* ... smaller is better
Storage Devices
Our review unit featured a 512 GB Wester Digital SSD (WDC PC SN730 SDBQNTY-512GB) whose very important (from the operating system’s point of view at least) CrystalDiskMark 5.2 read/write 4K performance was lower than on all of its competitors. In AS SSD, its 4K read performance was lower than expected as well. We also found a significant performance difference between running on battery and running on mains. Without an active power supply, the read seq numbers dropped by almost 40 %.
| Lenovo ThinkPad L14-20U50003GE WDC PC SN730 SDBQNTY-512GB | Lenovo ThinkPad L490 20Q6S08600 Intel SSD Pro 7600p SSDPEKKF512G8L | Lenovo ThinkPad E14 Gen2-20T7S00W00 Toshiba BG4 KBG40ZNT512G | HP ProBook 445 G7 175W4EA Samsung PM991 MZVLQ512HALU | Dell Latitude 14 5410-RJ80D Toshiba KBG40ZNS256G NVMe | Lenovo ThinkPad T14s-20UJS00K00 WDC PC SN730 SDBPNTY-1T00 | Lenovo ThinkPad T14s-20T00044GE Samsung SSD PM981a MZVLB256HBHQ | Average WDC PC SN730 SDBQNTY-512GB | |
|---|---|---|---|---|---|---|---|---|
| CrystalDiskMark 5.2 / 6 | 13% | 8% | 11% | 2% | 42% | 29% | 45% | |
| Write 4K (MB/s) | 76.7 | 128.3 67% | 102.3 33% | 144.6 89% | 95.5 25% | 108 41% | 117.5 53% | 140.9 ? 84% |
| Read 4K (MB/s) | 32.04 | 61.6 92% | 32.12 0% | 38.08 19% | 47.14 47% | 39.82 24% | 40.81 27% | 45.6 ? 42% |
| Write Seq (MB/s) | 1019 | 846 -17% | 1518 49% | 1320 30% | 1251 23% | 2028 99% | 2031 99% | 2066 ? 103% |
| Read Seq (MB/s) | 2014 | 1425 -29% | 1501 -25% | 1397 -31% | 1624 -19% | 1826 -9% | 1970 -2% | 2014 ? 0% |
| Write 4K Q32T1 (MB/s) | 415.6 | 503 21% | 356.4 -14% | 324.2 -22% | 333.5 -20% | 570 37% | 395.5 -5% | 472 ? 14% |
| Read 4K Q32T1 (MB/s) | 367.1 | 418.7 14% | 459.6 25% | 434.8 18% | 335.2 -9% | 401.5 9% | 361.4 -2% | 453 ? 23% |
| Write Seq Q32T1 (MB/s) | 1337 | 1391 4% | 1507 13% | 1382 3% | 1234 -8% | 3091 131% | 2330 74% | 2433 ? 82% |
| Read Seq Q32T1 (MB/s) | 2850 | 1570 -45% | 2327 -18% | 2354 -17% | 2247 -21% | 2872 1% | 2530 -11% | 3237 ? 14% |
| AS SSD | -15% | -64% | -21% | -81% | 13% | -7% | 0% | |
| Seq Read (MB/s) | 2247 | 1262 -44% | 2007 -11% | 1936 -14% | 1837 -18% | 2291 2% | 2631 17% | 2506 ? 12% |
| Seq Write (MB/s) | 1079 | 735 -32% | 1118 4% | 1213 12% | 700 -35% | 1343 24% | 1191 10% | 1655 ? 53% |
| 4K Read (MB/s) | 42.52 | 46.44 9% | 46.95 10% | 44.09 4% | 44.5 5% | 42.56 0% | 44.76 5% | 42.2 ? -1% |
| 4K Write (MB/s) | 129.1 | 137.5 7% | 124 -4% | 118.5 -8% | 90.1 -30% | 132.2 2% | 124.7 -3% | 127.5 ? -1% |
| 4K-64 Read (MB/s) | 1316 | 685 -48% | 1221 -7% | 867 -34% | 905 -31% | 850 -35% | 756 -43% | 1061 ? -19% |
| 4K-64 Write (MB/s) | 1332 | 905 -32% | 774 -42% | 838 -37% | 447.8 -66% | 2262 70% | 1300 -2% | 1480 ? 11% |
| Access Time Read * (ms) | 0.086 | 0.025 71% | 0.108 -26% | 0.122 -42% | 0.16 -86% | 0.05 42% | 0.089 -3% | 0.1012 ? -18% |
| Access Time Write * (ms) | 0.029 | 0.025 14% | 0.195 -572% | 0.034 -17% | 0.175 -503% | 0.028 3% | 0.03 -3% | 0.03833 ? -32% |
| Score Read (Points) | 1583 | 858 -46% | 1468 -7% | 1105 -30% | 1133 -28% | 1121 -29% | 1064 -33% | 1354 ? -14% |
| Score Write (Points) | 1569 | 1116 -29% | 1009 -36% | 1078 -31% | 608 -61% | 2529 61% | 1544 -2% | 1772 ? 13% |
| Score Total (Points) | 3907 | 2400 -39% | 3191 -18% | 2721 -30% | 2273 -42% | 4185 7% | 3090 -21% | 3781 ? -3% |
| Copy ISO MB/s (MB/s) | 1164 | 1181 | 2546 | 1813 | 1903 ? | |||
| Copy Program MB/s (MB/s) | 445.1 | 410.5 | 428.6 | 524 | 533 ? | |||
| Copy Game MB/s (MB/s) | 646 | 835 | 943 | 350.5 | 1074 ? | |||
| Total Average (Program / Settings) | -1% /
-3% | -28% /
-34% | -5% /
-7% | -40% /
-46% | 28% /
25% | 11% /
8% | 23% /
19% |
* ... smaller is better

Sustained Read: DiskSpd Read Loop, Queue Depth 8
GPU Performance
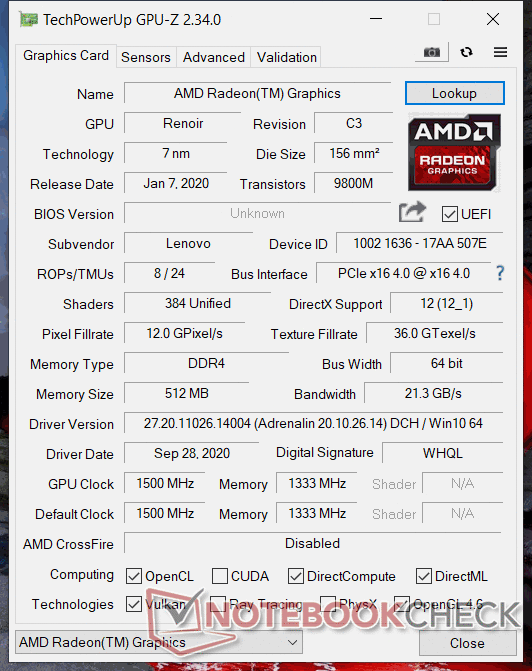
The Ryzen 5 features an AMD Radeon RX Vega 6 GPU with 8 CUs running at 1.2 GHz. This new GPU is a giant leap compared to the L490’s ancient Intel UHD Graphics 620, which is best exemplified by the fact that scores in 3DMark 11 doubled. Thus, the AMD-powered L-series is capable of taking on its Intel-equipped T-series that continues to include Intel’s UHD Graphics 620, and thus only performed half as well in our benchmarks. That said our review unit could have achieved even better scores with dual-channel RAM instead of its default single-channel configuration. Take for example the ThinkPad E14 with the very same iGPU as the L14 but dual-channel instead of single-channel mode RAM: it ran up to 29 % faster.
The L14 passed our stress test with flying colors. You will find more details in the emissions section under temperature below. Performance dropped slightly on battery. In 3DMark 11, we noticed a 5 % decrease in CPU (6,664 vs. 7,061 in Physics) and 9 % decrease in GPU performance (3,092 vs. 3,401 in Graphics).Gaming performance was right where we would have expected it to be. Overall, the L14 performed slightly below average for an AMD Radeon RX Vega 6. AMD’s Radeon RX Vega 7, such as we find for example in Lenovo’s T14s, was significantly faster, and outperformed our L14 by 10 FPS on average in FHD, a very common gaming display resolution.
| 3DMark 11 Performance | 3531 points | |
| 3DMark Fire Strike Score | 2025 points | |
Help | ||
Gaming Performance
Gaming performance was right where we would have expected it to be. Overall, the L14 performed slightly below average for an AMD Radeon RX Vega 6. AMD’s Radeon RX Vega 7, such as we find for example in Lenovo’s T14s, was significantly faster, and outperformed our L14 by 10 FPS on average in FHD, a very common gaming display resolution.
| The Witcher 3 | |
| 1024x768 Low Graphics & Postprocessing | |
| Average of class Office (32.2 - 135, n=3, last 2 years) | |
| Lenovo ThinkPad T14s-20UJS00K00 | |
| Lenovo ThinkPad E14 Gen2-20T7S00W00 | |
| Average AMD Radeon RX Vega 6 (Ryzen 4000/5000) (32.8 - 60, n=21) | |
| HP ProBook 445 G7 175W4EA | |
| Lenovo ThinkPad L14-20U50003GE | |
| Dell Latitude 14 5410-RJ80D | |
| Lenovo ThinkPad T14s-20T00044GE | |
| 1366x768 Medium Graphics & Postprocessing | |
| Average of class Office (44.7 - 90.4, n=3, last 2 years) | |
| Average AMD Radeon RX Vega 6 (Ryzen 4000/5000) (21.3 - 39, n=13) | |
| HP ProBook 445 G7 175W4EA | |
| 1920x1080 High Graphics & Postprocessing (Nvidia HairWorks Off) | |
| Average of class Office (23.7 - 53.4, n=3, last 2 years) | |
| Lenovo ThinkPad T14s-20UJS00K00 | |
| Lenovo ThinkPad E14 Gen2-20T7S00W00 | |
| Average AMD Radeon RX Vega 6 (Ryzen 4000/5000) (10.7 - 19.4, n=20) | |
| Lenovo ThinkPad L14-20U50003GE | |
| HP ProBook 445 G7 175W4EA | |
| F1 2020 | |
| 1280x720 Ultra Low Preset | |
| Lenovo ThinkPad T14s-20UJS00K00 | |
| Average AMD Radeon RX Vega 6 (Ryzen 4000/5000) (49.7 - 74, n=7) | |
| Lenovo ThinkPad L14-20U50003GE | |
| Acer TravelMate P6 P614-51T-G2-72ZU | |
| 1920x1080 Medium Preset AF:16x | |
| Lenovo ThinkPad T14s-20UJS00K00 | |
| Average AMD Radeon RX Vega 6 (Ryzen 4000/5000) (20 - 34, n=7) | |
| Lenovo ThinkPad L14-20U50003GE | |
| Acer TravelMate P6 P614-51T-G2-72ZU | |
| 1920x1080 High Preset AA:T AF:16x | |
| Lenovo ThinkPad T14s-20UJS00K00 | |
| Average AMD Radeon RX Vega 6 (Ryzen 4000/5000) (15 - 26, n=6) | |
| Lenovo ThinkPad L14-20U50003GE | |
| Acer TravelMate P6 P614-51T-G2-72ZU | |
| 1920x1080 Ultra High Preset AA:T AF:16x | |
| Lenovo ThinkPad T14s-20UJS00K00 | |
| Average AMD Radeon RX Vega 6 (Ryzen 4000/5000) (14 - 19, n=4) | |
| Lenovo ThinkPad L14-20U50003GE | |
| low | med. | high | ultra | |
|---|---|---|---|---|
| The Witcher 3 (2015) | 35 | 11.8 | ||
| Dota 2 Reborn (2015) | 90.6 | 70.7 | 34.7 | 32.7 |
| X-Plane 11.11 (2018) | 37.9 | 27.8 | 25.1 | |
| F1 2020 (2020) | 52 | 25 | 19 | 14 |
Emissions – Quiet Fan, Quiet Speaker
Noise Emissions
Just like its predecessor and the ThinkPad T14s our review unit remained pleasantly quiet overall. It peaked at just 32.8 dB(A) during our stress test, which was a pleasant surprise. Fan noise frequency was also very pleasant overall and not at all annoying even after long periods of time. We found no evidence of coil whine on our review unit.
Noise level
| Idle |
| 29.2 / 29.2 / 29.7 dB(A) |
| Load |
| 30.5 / 32.8 dB(A) |
 | ||
30 dB silent 40 dB(A) audible 50 dB(A) loud |
||
min: | ||
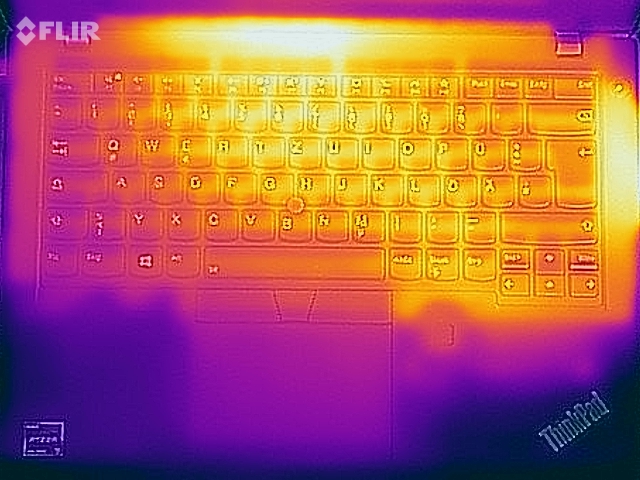
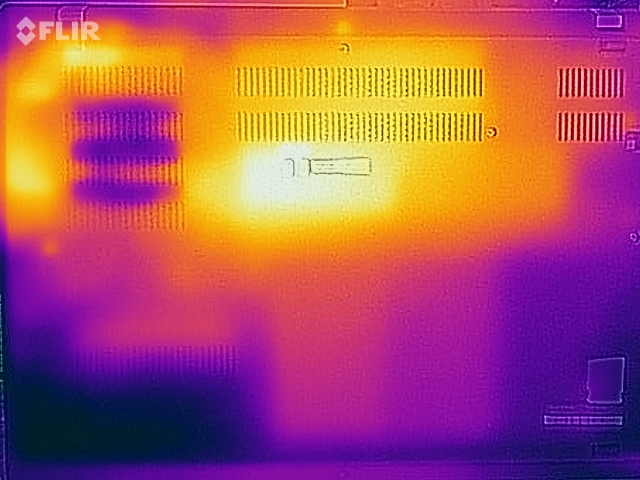
Temperature
Overall, the ThinkPad L14’s temperatures around the keyboard area were better than its L490 predecessor’s with Whiskey Lake that tended to reach up to 46 °C in the top right corner. In comparison, our AMD-powered review unit peaked at 43 °C. Unfortunately, temperatures around the palm rests are around 7 °C higher than on the L490. The L14’s hot spot is located at the bottom rear where it peaked at around 50 °C – too hot for lap use.
Power consumption very quickly settled at 25 W during our stress test resulting in around 2.8 GHz and around 890 MHz for CPU and GPU, respectively.
(±) The maximum temperature on the upper side is 42.9 °C / 109 F, compared to the average of 34.3 °C / 94 F, ranging from 21.2 to 62.5 °C for the class Office.
(-) The bottom heats up to a maximum of 49.5 °C / 121 F, compared to the average of 36.8 °C / 98 F
(+) In idle usage, the average temperature for the upper side is 25.2 °C / 77 F, compared to the device average of 29.5 °C / 85 F.
(+) The palmrests and touchpad are reaching skin temperature as a maximum (32.4 °C / 90.3 F) and are therefore not hot.
(-) The average temperature of the palmrest area of similar devices was 27.6 °C / 81.7 F (-4.8 °C / -8.6 F).
Speakers
Lenovo ThinkPad L14-20U50003GE audio analysis
(-) | not very loud speakers (68.7 dB)
Bass 100 - 315 Hz
(±) | reduced bass - on average 10.8% lower than median
(±) | linearity of bass is average (11.4% delta to prev. frequency)
Mids 400 - 2000 Hz
(±) | higher mids - on average 6.1% higher than median
(+) | mids are linear (5.1% delta to prev. frequency)
Highs 2 - 16 kHz
(+) | balanced highs - only 3% away from median
(±) | linearity of highs is average (9.5% delta to prev. frequency)
Overall 100 - 16.000 Hz
(±) | linearity of overall sound is average (23.8% difference to median)
Compared to same class
» 68% of all tested devices in this class were better, 8% similar, 23% worse
» The best had a delta of 7%, average was 21%, worst was 53%
Compared to all devices tested
» 71% of all tested devices were better, 6% similar, 22% worse
» The best had a delta of 4%, average was 23%, worst was 134%
HP ProBook 445 G7 175W4EA audio analysis
(±) | speaker loudness is average but good (76.8 dB)
Bass 100 - 315 Hz
(-) | nearly no bass - on average 25.1% lower than median
(±) | linearity of bass is average (9.5% delta to prev. frequency)
Mids 400 - 2000 Hz
(+) | balanced mids - only 3.1% away from median
(±) | linearity of mids is average (9% delta to prev. frequency)
Highs 2 - 16 kHz
(+) | balanced highs - only 4.8% away from median
(+) | highs are linear (5.7% delta to prev. frequency)
Overall 100 - 16.000 Hz
(±) | linearity of overall sound is average (19.8% difference to median)
Compared to same class
» 41% of all tested devices in this class were better, 9% similar, 50% worse
» The best had a delta of 7%, average was 21%, worst was 53%
Compared to all devices tested
» 51% of all tested devices were better, 7% similar, 42% worse
» The best had a delta of 4%, average was 23%, worst was 134%
Dell Latitude 14 5410-RJ80D audio analysis
(±) | speaker loudness is average but good (77.5 dB)
Bass 100 - 315 Hz
(-) | nearly no bass - on average 19.7% lower than median
(±) | linearity of bass is average (8.7% delta to prev. frequency)
Mids 400 - 2000 Hz
(+) | balanced mids - only 4.6% away from median
(±) | linearity of mids is average (7.4% delta to prev. frequency)
Highs 2 - 16 kHz
(±) | higher highs - on average 5.2% higher than median
(+) | highs are linear (5.1% delta to prev. frequency)
Overall 100 - 16.000 Hz
(±) | linearity of overall sound is average (16% difference to median)
Compared to same class
» 19% of all tested devices in this class were better, 6% similar, 76% worse
» The best had a delta of 7%, average was 21%, worst was 53%
Compared to all devices tested
» 25% of all tested devices were better, 5% similar, 69% worse
» The best had a delta of 4%, average was 23%, worst was 134%
Energy Management – AMD Is Power Hungry
Power Consumption
Compared to its predecessor, power consumption increased by around 13 %. At maximum load it drew 50.6 W through its 65 W power supply. Our comparison table also reveals that Lenovo’s AMD-powered notebooks on average tend to have a higher power consumption than their Intel-equipped counterparts.
| Off / Standby | |
| Idle | |
| Load |
|
Key:
min: | |
| Lenovo ThinkPad L14-20U50003GE R5 4500U, Vega 6, WDC PC SN730 SDBQNTY-512GB, IPS, 1920x1080, 14" | Lenovo ThinkPad L490 20Q6S08600 i5-8265U, UHD Graphics 620, Intel SSD Pro 7600p SSDPEKKF512G8L, IPS, 1920x1080, 14" | Lenovo ThinkPad T14s-20T00044GE i5-10210U, UHD Graphics 620, Samsung SSD PM981a MZVLB256HBHQ, LTPS AHVA-IPS LED, 1920x1080, 14" | HP ProBook 445 G7 175W4EA R5 4500U, Vega 6, Samsung PM991 MZVLQ512HALU, IPS, 1920x1080, 14" | Dell Latitude 14 5410-RJ80D i5-10310U, UHD Graphics 620, Toshiba KBG40ZNS256G NVMe, a-Si IPS LED, 1920x1080, 14" | Lenovo ThinkPad E14 Gen2-20T7S00W00 R5 4500U, Vega 6, Toshiba BG4 KBG40ZNT512G, a-Si IPS LED, 1920x1080, 14" | Lenovo ThinkPad T14s-20UJS00K00 R7 PRO 4750U, Vega 7, WDC PC SN730 SDBPNTY-1T00, IPS , 1920x1080, 14" | Average AMD Radeon RX Vega 6 (Ryzen 4000/5000) | Average of class Office | |
|---|---|---|---|---|---|---|---|---|---|
| Power Consumption | 13% | 16% | 11% | 13% | -7% | -14% | 3% | -11% | |
| Idle Minimum * (Watt) | 4.4 | 3.5 20% | 2.6 41% | 3.5 20% | 2.9 34% | 4.6 -5% | 5.7 -30% | 3.98 ? 10% | 4.25 ? 3% |
| Idle Average * (Watt) | 7.7 | 6.3 18% | 5.5 29% | 6.2 19% | 4.5 42% | 7.6 1% | 8.9 -16% | 6.53 ? 15% | 7.3 ? 5% |
| Idle Maximum * (Watt) | 8.9 | 8.7 2% | 7.5 16% | 8.8 1% | 7.4 17% | 9.7 -9% | 11 -24% | 8.65 ? 3% | 8.57 ? 4% |
| Load Average * (Watt) | 31.3 | 28.7 8% | 28.2 10% | 30 4% | 34.6 -11% | 39.1 -25% | 38.2 -22% | 35 ? -12% | 43.8 ? -40% |
| Witcher 3 ultra * (Watt) | 33 | ||||||||
| Load Maximum * (Watt) | 50.6 | 41.8 17% | 59.6 -18% | 45 11% | 60 -19% | 50.3 1% | 40.2 21% | 51.5 ? -2% | 64.5 ? -27% |
* ... smaller is better
Battery Life
Compared to its Whiskey Lake-equipped predecessor the AMD Ryzen 5-powered L14 ran about an hour longer under full load but shorter during video playback in return. In this particular test, the L14 landed in last place of its comparison group.
| Lenovo ThinkPad L14-20U50003GE R5 4500U, Vega 6, 45 Wh | Lenovo ThinkPad L490 20Q6S08600 i5-8265U, UHD Graphics 620, 45 Wh | Lenovo ThinkPad E14 Gen2-20T7S00W00 R5 4500U, Vega 6, 45 Wh | Lenovo ThinkPad T14s-20T00044GE i5-10210U, UHD Graphics 620, 57 Wh | HP ProBook 445 G7 175W4EA R5 4500U, Vega 6, 45 Wh | Dell Latitude 14 5410-RJ80D i5-10310U, UHD Graphics 620, 68 Wh | Lenovo ThinkPad T14s-20UJS00K00 R7 PRO 4750U, Vega 7, 57 Wh | Average of class Office | |
|---|---|---|---|---|---|---|---|---|
| Battery runtime | 4% | -17% | 37% | -13% | 47% | 24% | 41% | |
| H.264 (h) | 8.3 | 11.1 34% | 9.1 10% | 14.7 77% | 15.2 83% | 13.2 59% | 15.4 ? 86% | |
| WiFi v1.3 (h) | 8.1 | 7.9 -2% | 8.3 2% | 13.2 63% | 8.7 7% | 13.7 69% | 10.2 26% | 13.2 ? 63% |
| Load (h) | 2.4 | 1.9 -21% | 0.9 -62% | 1.7 -29% | 1.6 -33% | 2.1 -12% | 2.1 -12% | 1.808 ? -25% |
| Reader / Idle (h) | 18.6 | 12.4 | 22.2 ? |
Pros
Cons
Verdict – A Breath of Fresh Air thanks to AMD
Lenovo did an overall very good job with the ThinkPad L14, which continues to emphasize Lenovo’s traditional strengths such as its sturdy high-quality case, its pleasant-to-use keyboard, straightforward maintenance, and an interesting collection of ports and connectivity including a smart card reader as well as a docking port for business users.
On the other hand, Lenovo missed its opportunity to improve upon the L490’s weaknesses, such as for example the dim display or its overall poor speakers that lack both volume and bass. Lenovo’s choice of display panel is a sore point in particular, and we would have wished for a wiser choice.
The most important achievement for the L-series is the introduction of AMD’s Ryzen 5 4500U. In our reviews of the ThinkPad E14 and T14 the AMD SKUs proved to perform much better than the Intel SKUs, and the same holds true with the L14 as well. AMD is simply better.
There was no noticeable throttling and thus no drop in performance during our CineBench loop. In contrast, Intel CPUs tend to lose a lot of performance after the first run due to performance throttling. The price you pay for this increase in performance is a slightly higher power consumption as well as higher surface temperatures at the bottom under maximum load. The GPU’s comparatively poor performance can be easily remedied by adding a second RAM module.
AMD brings a breath of fresh air to Lenovo’s ThinkPad series, and changes the traditional rules. Intel’s dominance is about to falter as AMD not only offers lower prices but also a significant performance boost. Thus, we have no choice but to once again highly recommend the AMD SKU over its Intel counterpart.
Lenovo ThinkPad L14-20U50003GE
- 12/14/2020 v7 (old)
Daniel Puschina
Price comparison

