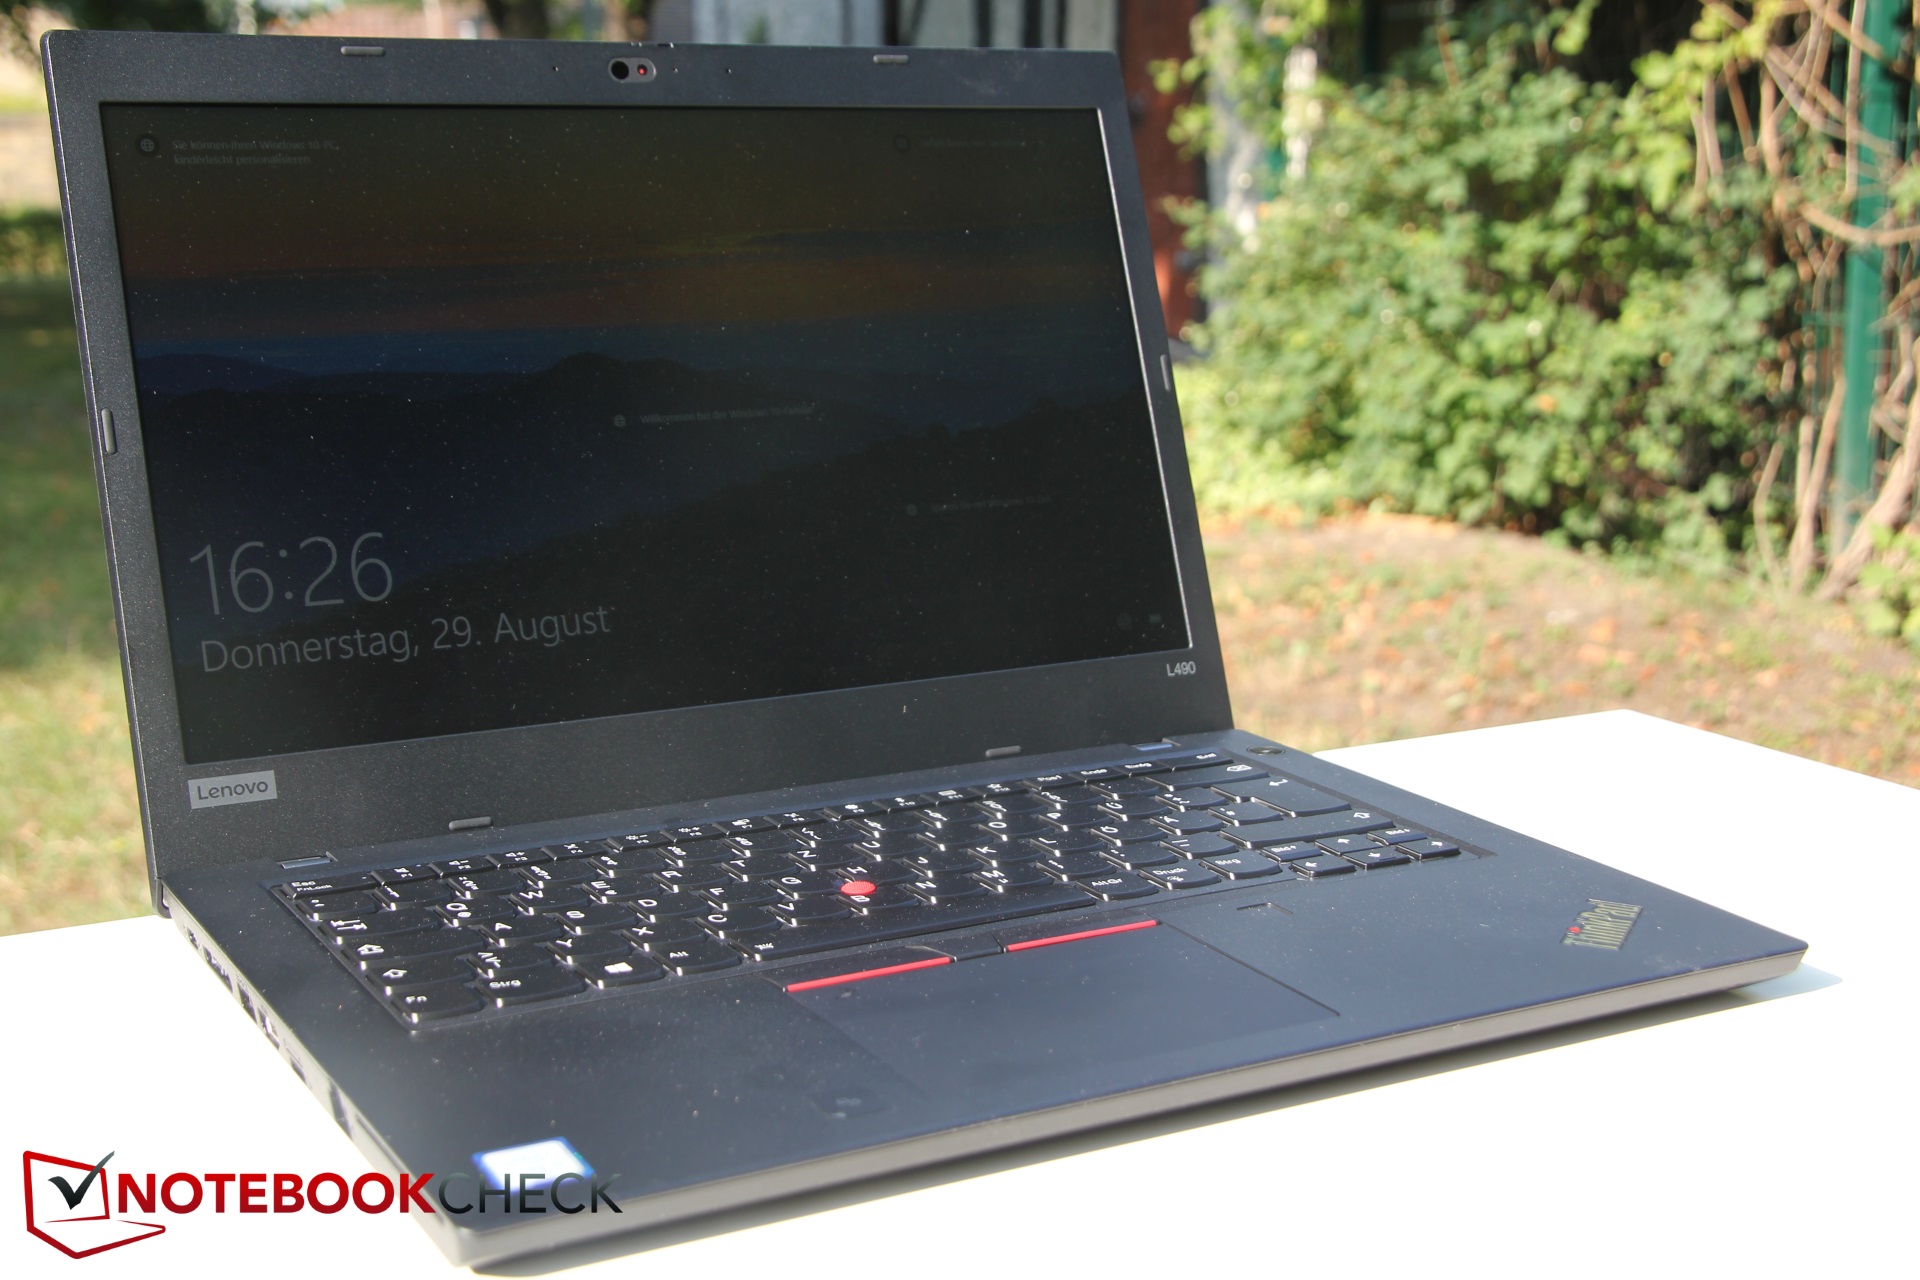
Lenovo ThinkPad L490 laptop review: Whiskey Lake disappoints in office laptop

In terms of price, the ThinkPad L490 is oriented significantly below the more expensive T series and just above the more economically priced E series. This makes it interesting for students, not least because of the good input devices that are typical in ThinkPads, which is why Campuspoint includes it in its program. Upon presentation of a student certificate, our review model can be purchased for a comparatively cheap 699 Euros (~$771), because ordinary citizens pay around 900 Euros (~$993) for this configuration.
The L490 is an update to the ThinkPad L480 from last year. Lenovo is primarily adding a new Whiskey Lake processor from Intel, but also a new display and a version change to Bluetooth 5.0 are in the program. In order to be able to discuss all the differences with the predecessor, it is naturally included as a comparison device. Otherwise, the ThinkPad L490 must face the current contenders such as the slightly cheaper ThinkPad E490 from the same manufacturer, the Lenovo Flex 14, the HP 250 G7 (15-inch) and the Schenker Slim 15 RED (15-inch).
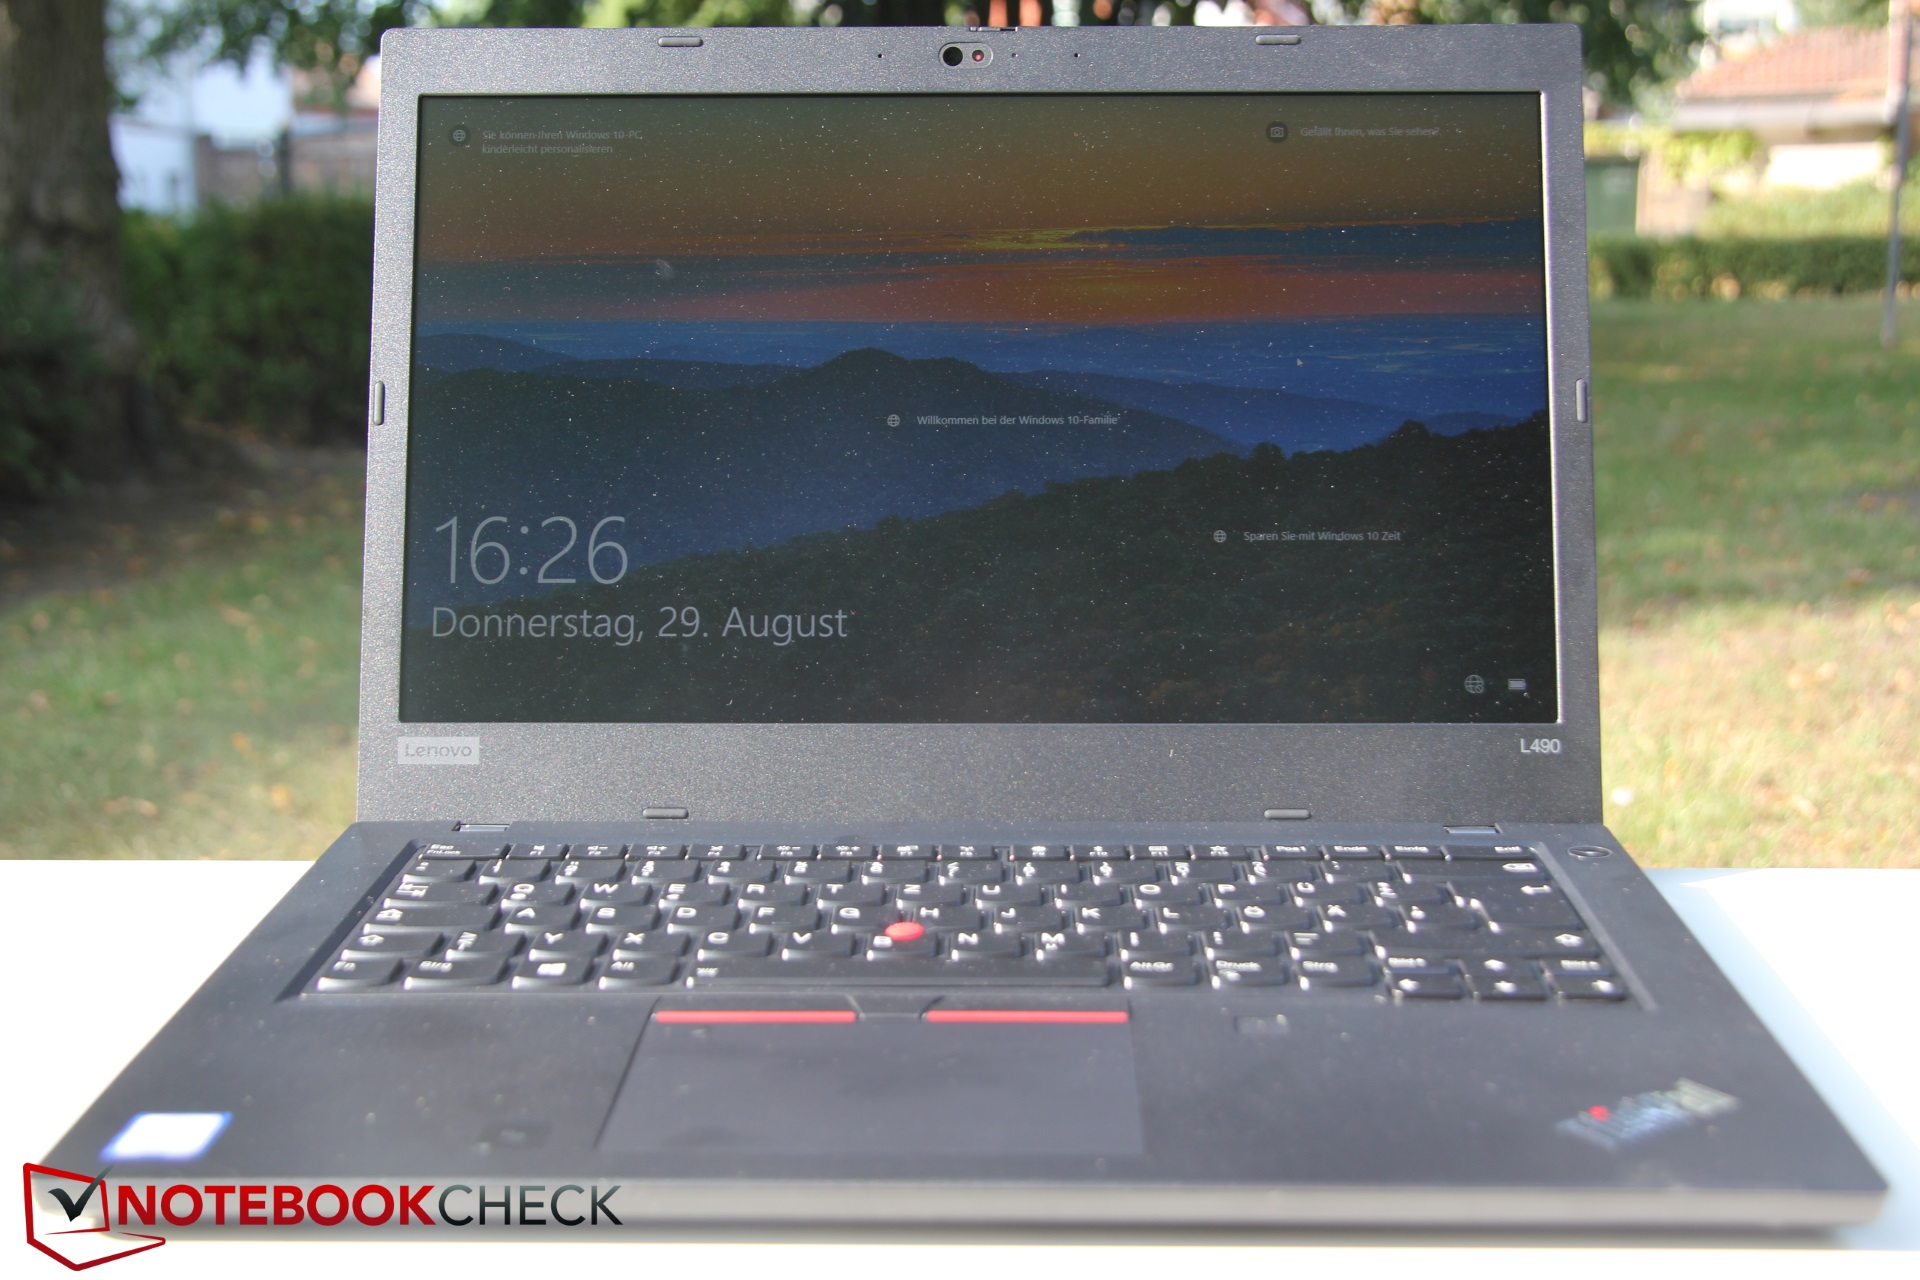
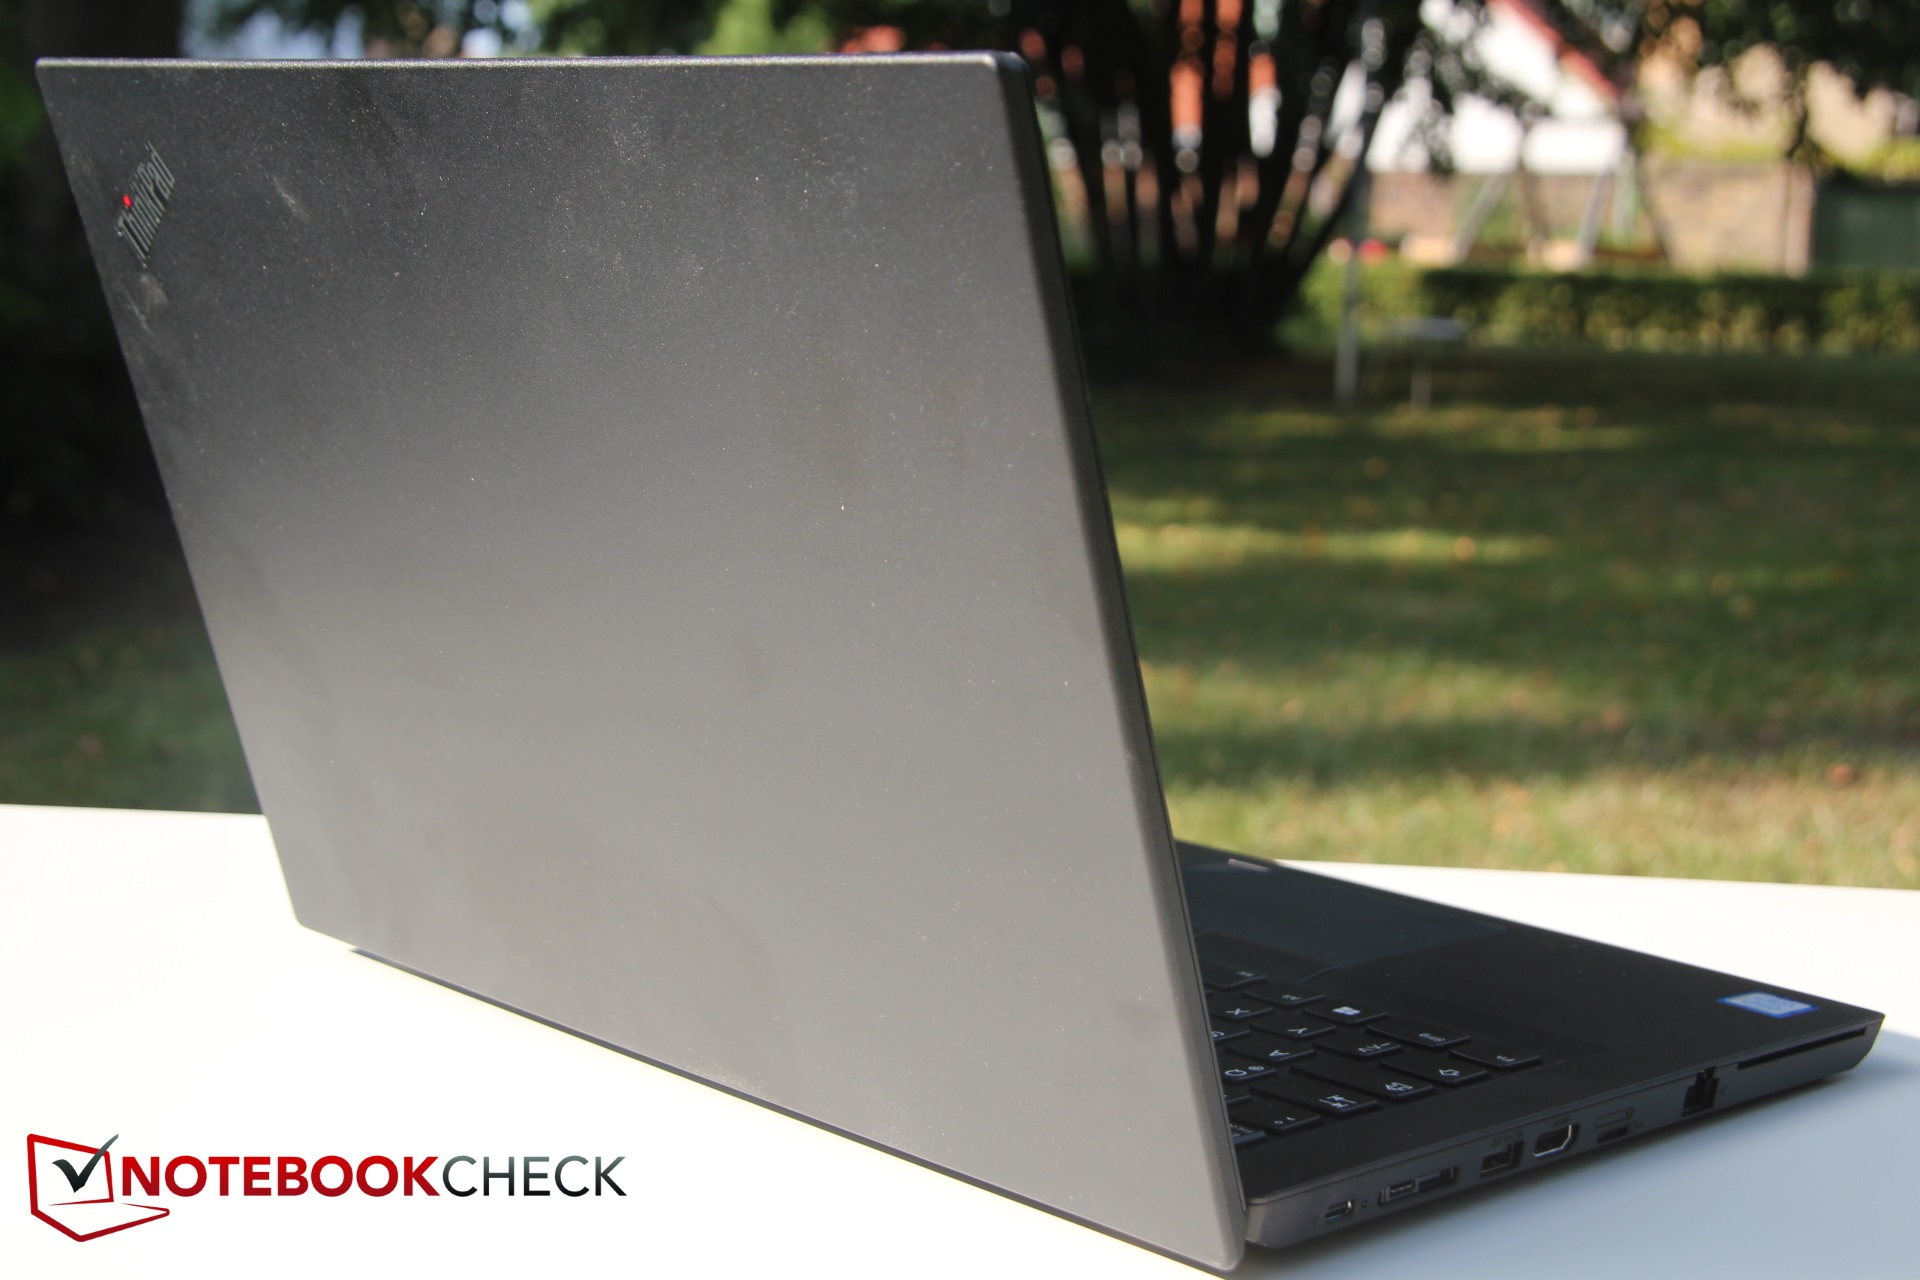
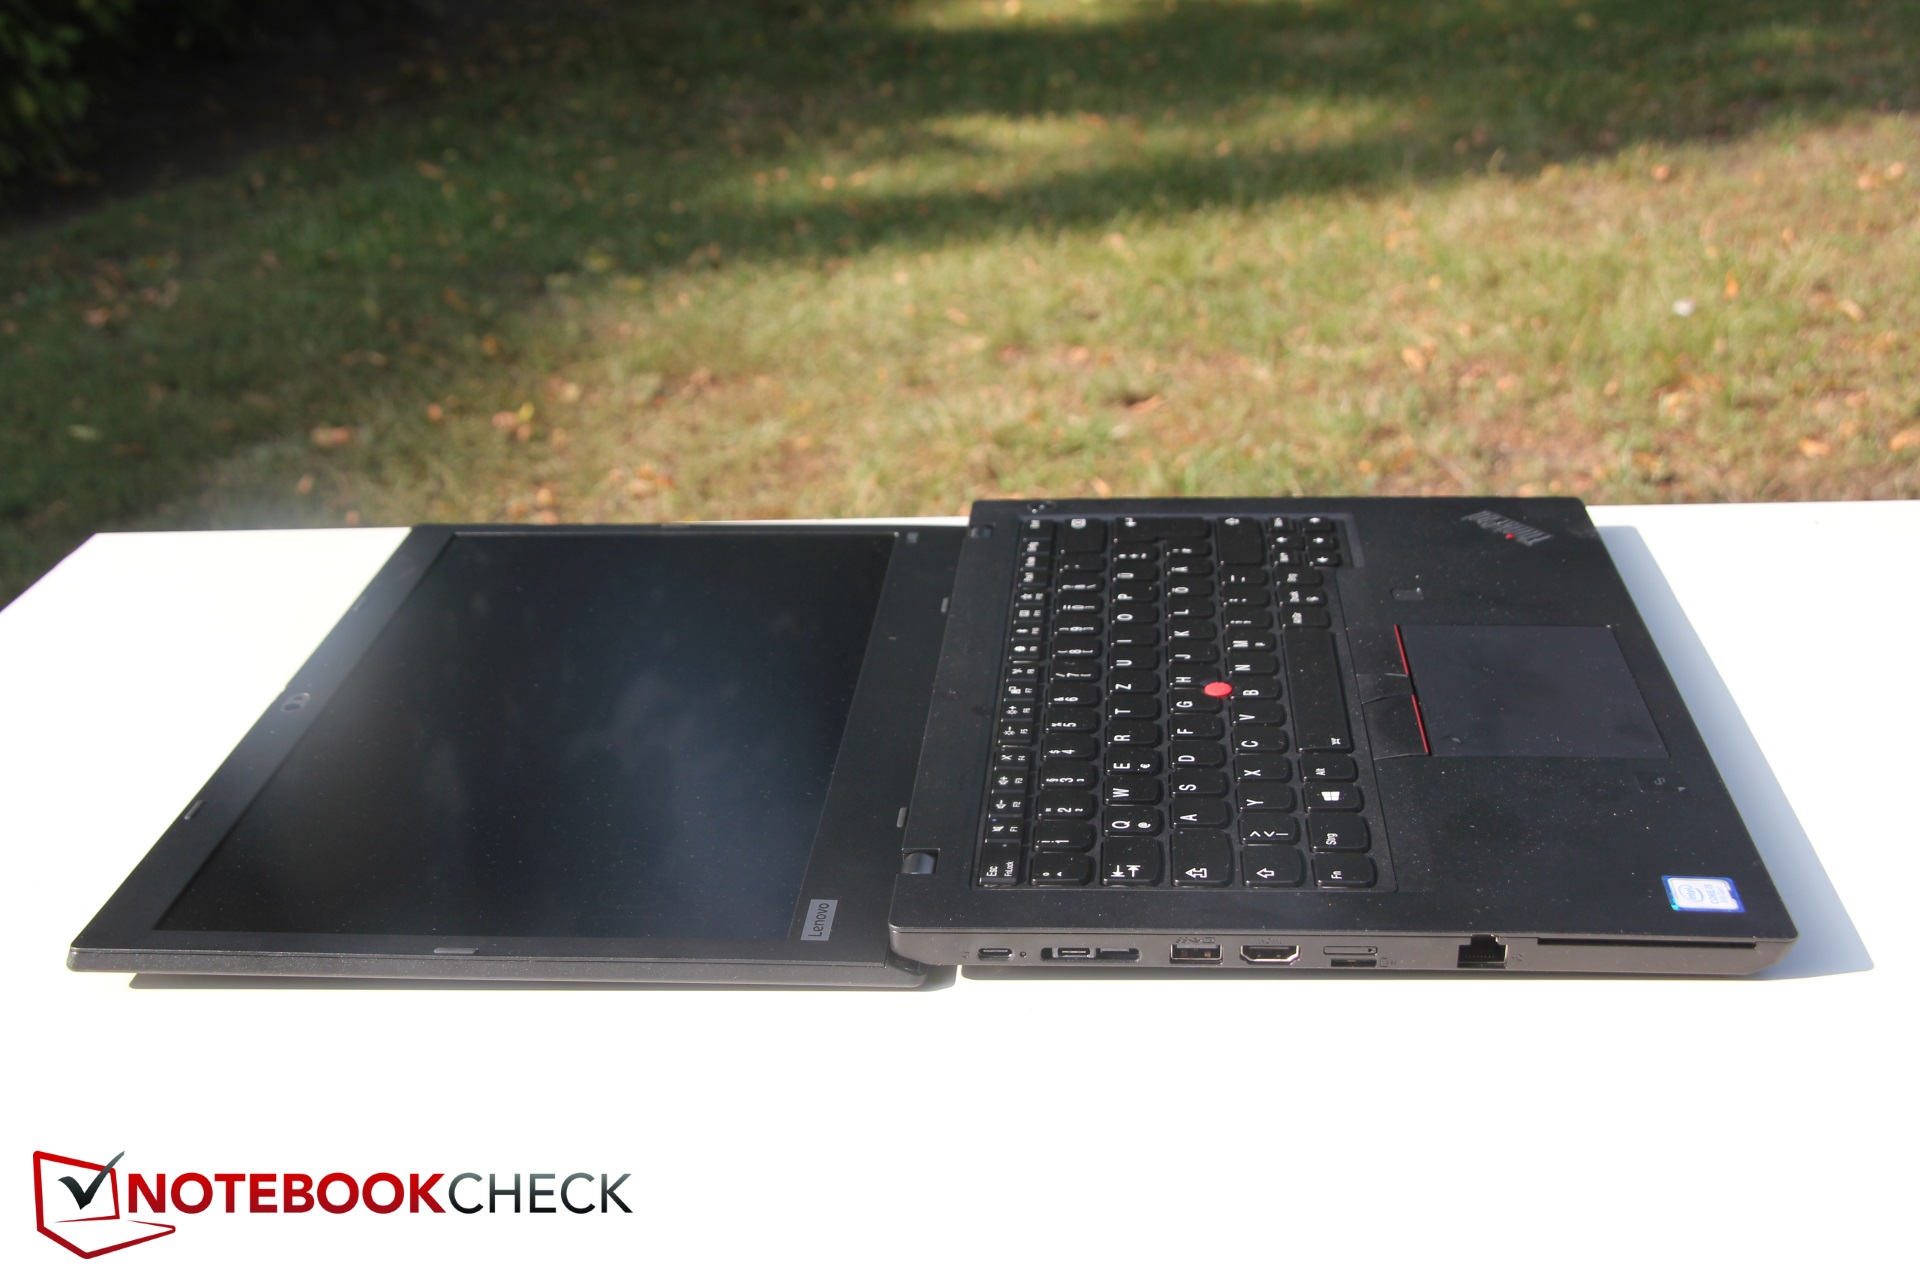
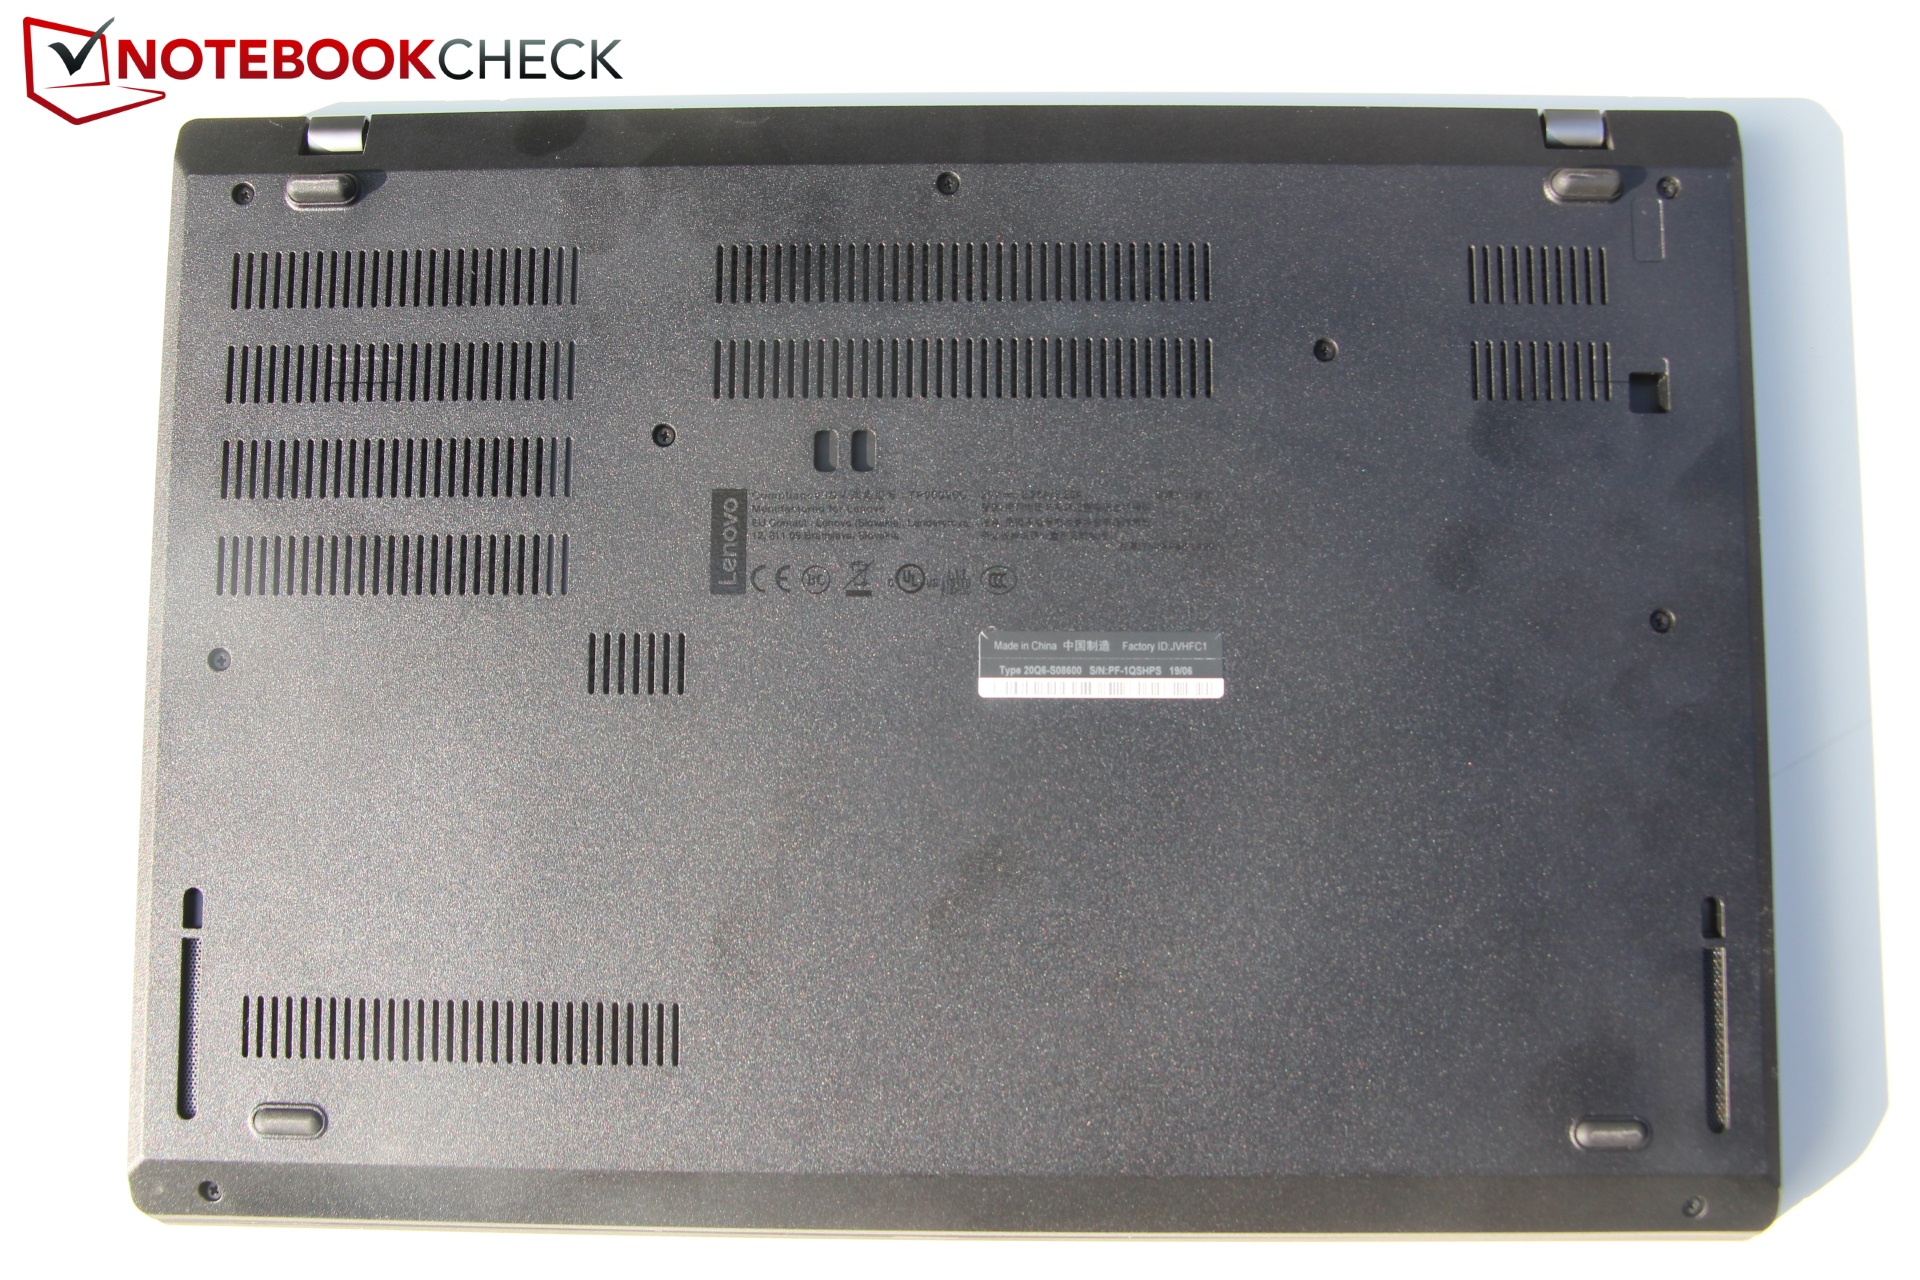
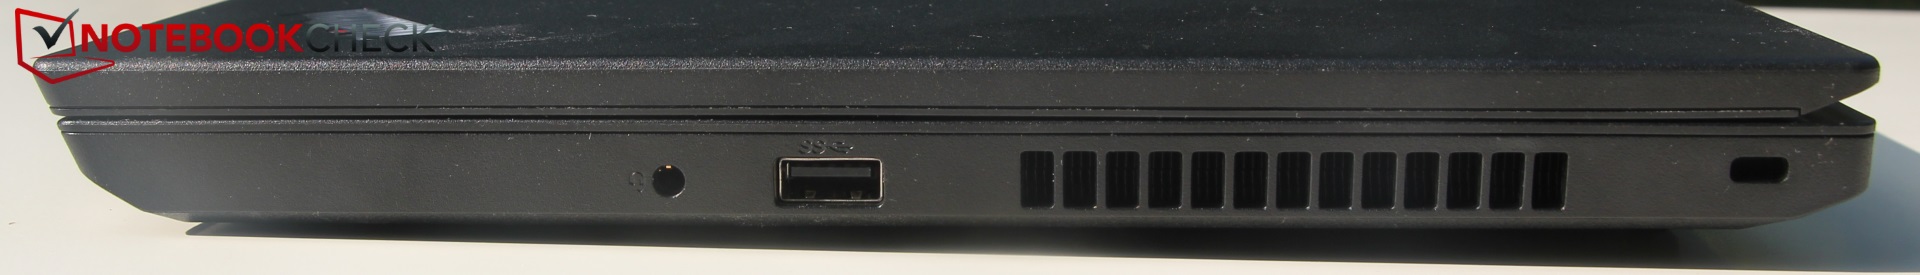
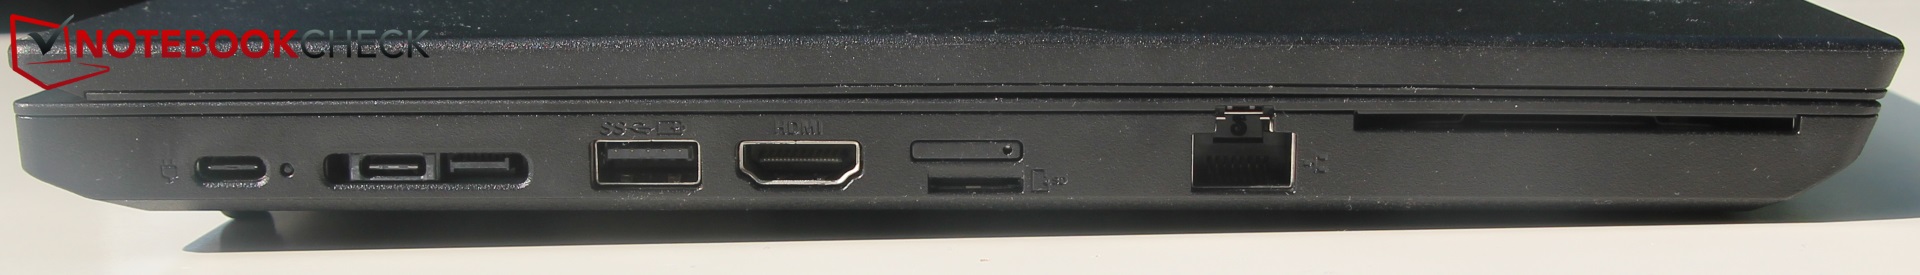
Since this is a review update to the L480, and Lenovo has left the exterior almost unchanged, we will skip the sections corresponding the case, the input devices and the connectivity. You can read about these characteristics in the ThinkPad L480 review.
| SD Card Reader | |
| average JPG Copy Test (av. of 3 runs) | |
| Lenovo Flex 14IWL (Toshiba Exceria Pro SDXC 64 GB UHS-II) | |
| Lenovo ThinkPad L490 20Q6S08600 (Toshiba Exceria Pro M501 64 GB UHS-II) | |
| Lenovo ThinkPad E490-20N8000RGE (Toshiba Exceria Pro M501) | |
| Lenovo ThinkPad L480-20LS001AGE (Toshiba Exceria Pro M501 microSDXC 64GB) | |
| Schenker Slim 15-RE-E19 (Toshiba Exceria Pro SDXC 64 GB UHS-II) | |
| Average of class Office (22.4 - 198.5, n=21, last 2 years) | |
| HP 250 G7 6HM85ES (Toshiba Exceria Pro SDXC 64 GB UHS-II) | |
| maximum AS SSD Seq Read Test (1GB) | |
| Lenovo ThinkPad L480-20LS001AGE (Toshiba Exceria Pro M501 microSDXC 64GB) | |
| Lenovo ThinkPad E490-20N8000RGE (Toshiba Exceria Pro M501) | |
| Lenovo Flex 14IWL (Toshiba Exceria Pro SDXC 64 GB UHS-II) | |
| Lenovo ThinkPad L490 20Q6S08600 (Toshiba Exceria Pro M501 64 GB UHS-II) | |
| Schenker Slim 15-RE-E19 (Toshiba Exceria Pro SDXC 64 GB UHS-II) | |
| Average of class Office (27.4 - 249, n=20, last 2 years) | |
| HP 250 G7 6HM85ES (Toshiba Exceria Pro SDXC 64 GB UHS-II) | |
Communication
The Wi-Fi communication has not changed much; the transfer speeds correspond to those of the predecessor. However, Lenovo has opted for Bluetooth 5.0 instead of 4.2. This means that users can theoretically get higher speeds, a greater range, less energy consumption and the support for IoT devices.
Security
Alongside the TPM 2.0, our review device also uses a fingerprint scanner, which is otherwise optional. It is found on the right side next to the touchpad, above the Lenovo logo. Additionally, there is also an ExpressCard slot, which is likely to be of particular interest to companies.
The webcam is also interesting, which is equipped with a ThinkShutter in our model. This is slid in front of the camera so that it is covered and no (remotely controlled) pictures are possible. Naturally, this does not apply to potential audio recordings, and manufacturers could also take action with regard to an additional safety mechanism.
Warranty
As usual, Lenovo unfortunately only provides a 12-month warranty.
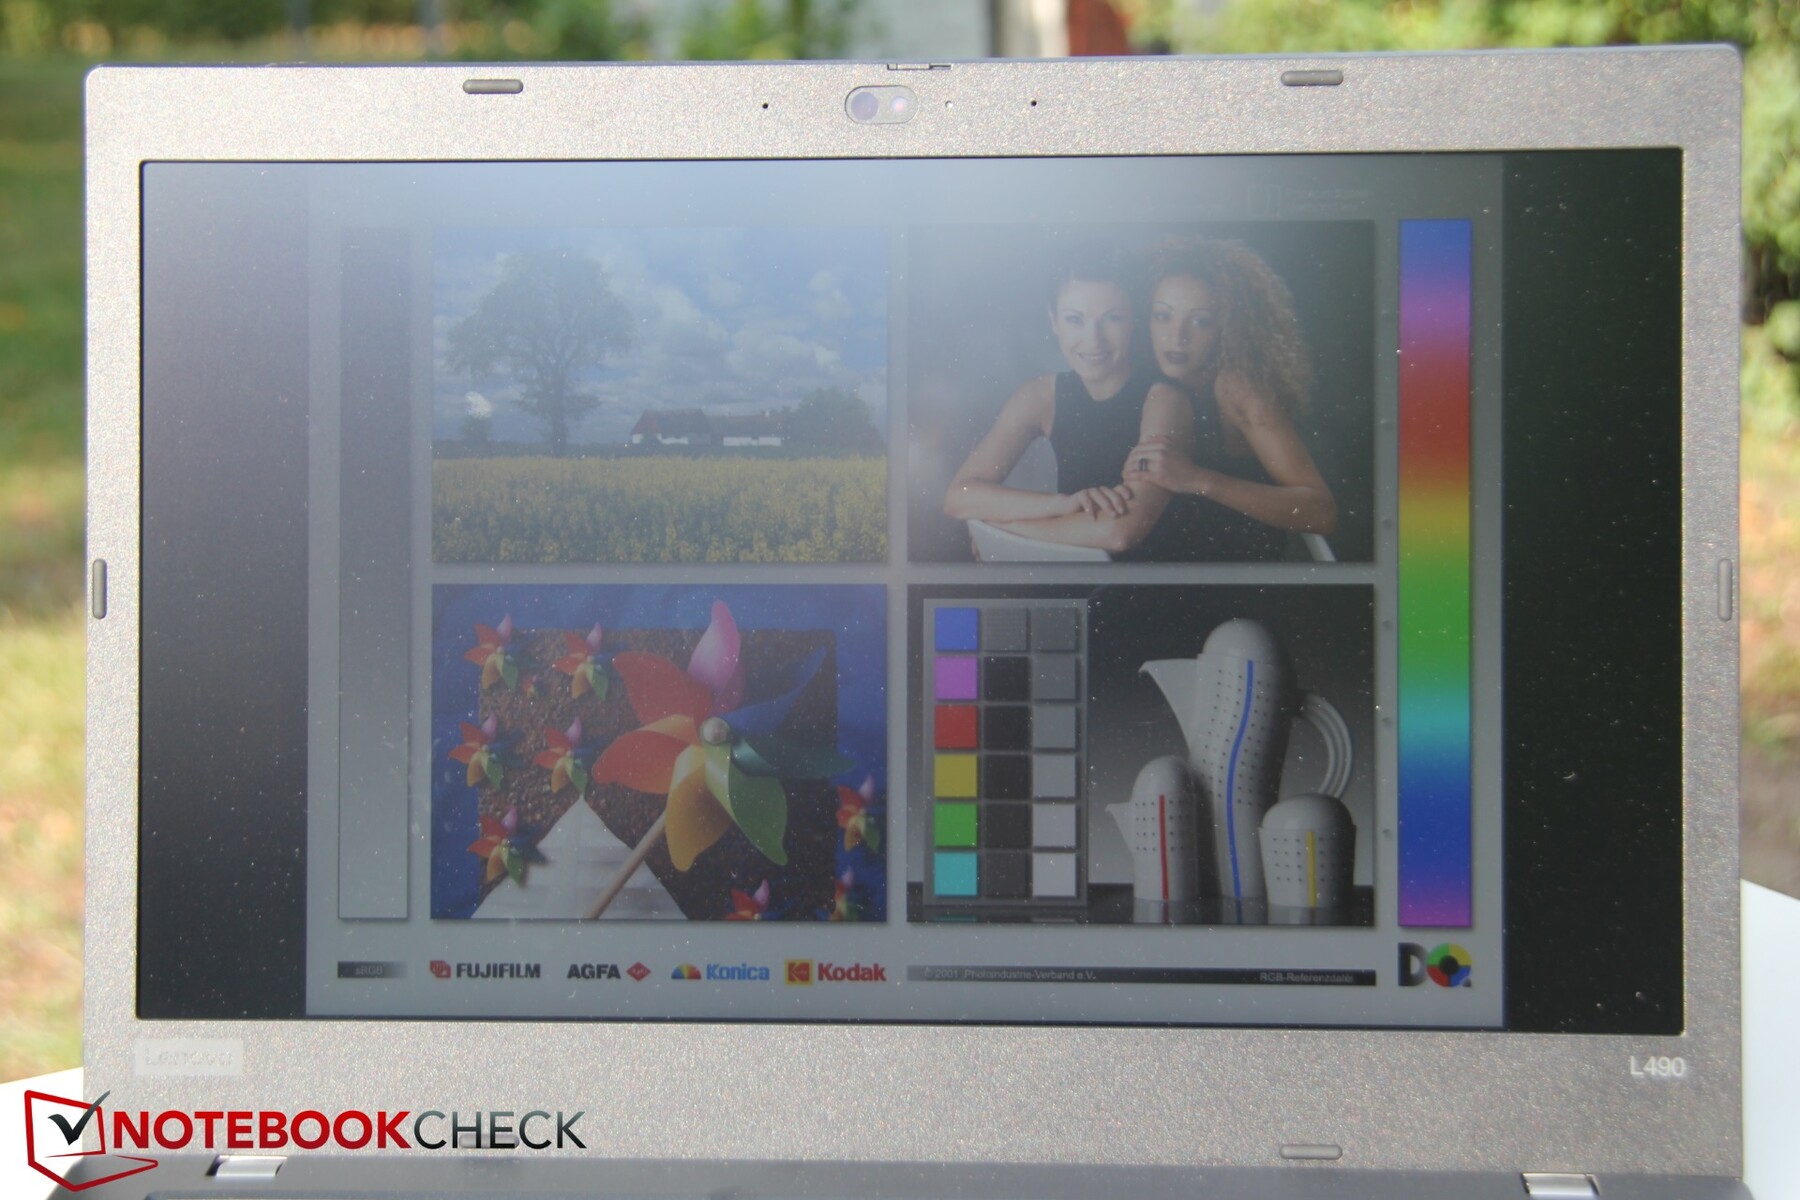
Display - Disimproved ThinkPad

The very dim display and the poor brightness distribution were some of the main points of criticism with the predecessor. Lenovo has handled the problem and swapped the panel. But the new Full HD display is not consistently better than the old model. Anyhow, the brightness increases from the previous 209 Nits to 238 Nits now, which still is not record-breaking. With the exception of the HP 250, the competition shows higher brightness. For example, the E490 sibling model is the brightest device in direct comparison at 295 Nits; Lenovo can do it significantly better then. We didn't notice any screen bleeding at least.
On the contrary, the brightness distribution has made a bigger leap, which now sits in the green area at 82%. But the E490 is clearly ahead again with a brightness distribution of 90%.
The manufacturer also offers an alternative HD panel, which is less expensive, as well as an IPS display with integrated touch functionality. For the latter, you need to pay about 54 Euros (~$60) more in the manufacturer's shop.
| |||||||||||||||||||||||||
Brightness Distribution: 82 %
Center on Battery: 251 cd/m²
Contrast: 788:1 (Black: 0.32 cd/m²)
ΔE ColorChecker Calman: 4.6 | ∀{0.5-29.43 Ø4.73}
calibrated: 4
ΔE Greyscale Calman: 2 | ∀{0.09-98 Ø4.97}
62.7% sRGB (Argyll 1.6.3 3D)
40% AdobeRGB 1998 (Argyll 1.6.3 3D)
43.35% AdobeRGB 1998 (Argyll 3D)
62.8% sRGB (Argyll 3D)
41.93% Display P3 (Argyll 3D)
Gamma: 2
CCT: 6524 K
| Lenovo ThinkPad L490 20Q6S08600 Lenovo LEN40A9, , 1920x1080, 14" | Lenovo ThinkPad L480-20LS001AGE B140HAN02.4, , 1920x1080, 14" | Lenovo ThinkPad E490-20N8000RGE Lenovo NV140FHM-N49, , 1920x1080, 14" | Lenovo Flex 14IWL BOE BOE06F2, , 1920x1080, 14" | HP 250 G7 6HM85ES BOE0687, , 1920x1080, 15.6" | Schenker Slim 15-RE-E19 Chi Mei CMN15E8, , 2x1, 15.6" | |
|---|---|---|---|---|---|---|
| Display | -13% | -6% | -5% | -6% | 46% | |
| Display P3 Coverage (%) | 41.93 | 36.37 -13% | 39.85 -5% | 40 -5% | 39.61 -6% | 63.7 52% |
| sRGB Coverage (%) | 62.8 | 54.7 -13% | 58.6 -7% | 59 -6% | 59.5 -5% | 87.7 40% |
| AdobeRGB 1998 Coverage (%) | 43.35 | 37.57 -13% | 41.18 -5% | 41.32 -5% | 40.93 -6% | 63.9 47% |
| Response Times | -60% | -37% | -3% | 23% | 6% | |
| Response Time Grey 50% / Grey 80% * (ms) | 37.6 ? | 73 ? -94% | 48.4 ? -29% | 30.4 ? 19% | 41 ? -9% | 37 ? 2% |
| Response Time Black / White * (ms) | 26.4 ? | 33 ? -25% | 38.4 ? -45% | 32.8 ? -24% | 12 ? 55% | 24 ? 9% |
| PWM Frequency (Hz) | 25000 ? | 1250 ? | 352.1 ? | 25000 ? | 25000 ? | |
| Screen | 15% | 7% | -15% | -73% | 10% | |
| Brightness middle (cd/m²) | 252 | 222 -12% | 305 21% | 284.2 13% | 205 -19% | 289 15% |
| Brightness (cd/m²) | 238 | 209 -12% | 295 24% | 271 14% | 205 -14% | 280 18% |
| Brightness Distribution (%) | 82 | 73 -11% | 90 10% | 89 9% | 88 7% | 87 6% |
| Black Level * (cd/m²) | 0.32 | 0.17 47% | 0.23 28% | 0.49 -53% | 0.52 -63% | 0.36 -13% |
| Contrast (:1) | 788 | 1306 66% | 1326 68% | 580 -26% | 394 -50% | 803 2% |
| Colorchecker dE 2000 * | 4.6 | 3.91 15% | 5.3 -15% | 4.59 -0% | 11.15 -142% | 3.93 15% |
| Colorchecker dE 2000 max. * | 18.5 | 7.74 58% | 18.9 -2% | 18.03 3% | 19.08 -3% | 6.98 62% |
| Colorchecker dE 2000 calibrated * | 4 | 5 -25% | 4.57 -14% | 2.98 25% | ||
| Greyscale dE 2000 * | 2 | 1.56 22% | 2.3 -15% | 3.9 -95% | 12.62 -531% | 3.73 -87% |
| Gamma | 2 110% | 2.53 87% | 2.09 105% | 2.123 104% | 2.38 92% | 2.42 91% |
| CCT | 6524 100% | 6701 97% | 6246 104% | 6679 97% | 14189 46% | 6802 96% |
| Color Space (Percent of AdobeRGB 1998) (%) | 40 | 35 -12% | 37.7 -6% | 38 -5% | 38 -5% | 57 43% |
| Color Space (Percent of sRGB) (%) | 62.7 | 55 -12% | 58.2 -7% | 59 -6% | 59 -6% | 87 39% |
| Total Average (Program / Settings) | -19% /
-1% | -12% /
-1% | -8% /
-11% | -19% /
-48% | 21% /
17% |
* ... smaller is better
The small gain in display brightness is unfortunately offset by a significant loss in contrast and black value. With the L480, these values are better by 47 and 66%, respectively.
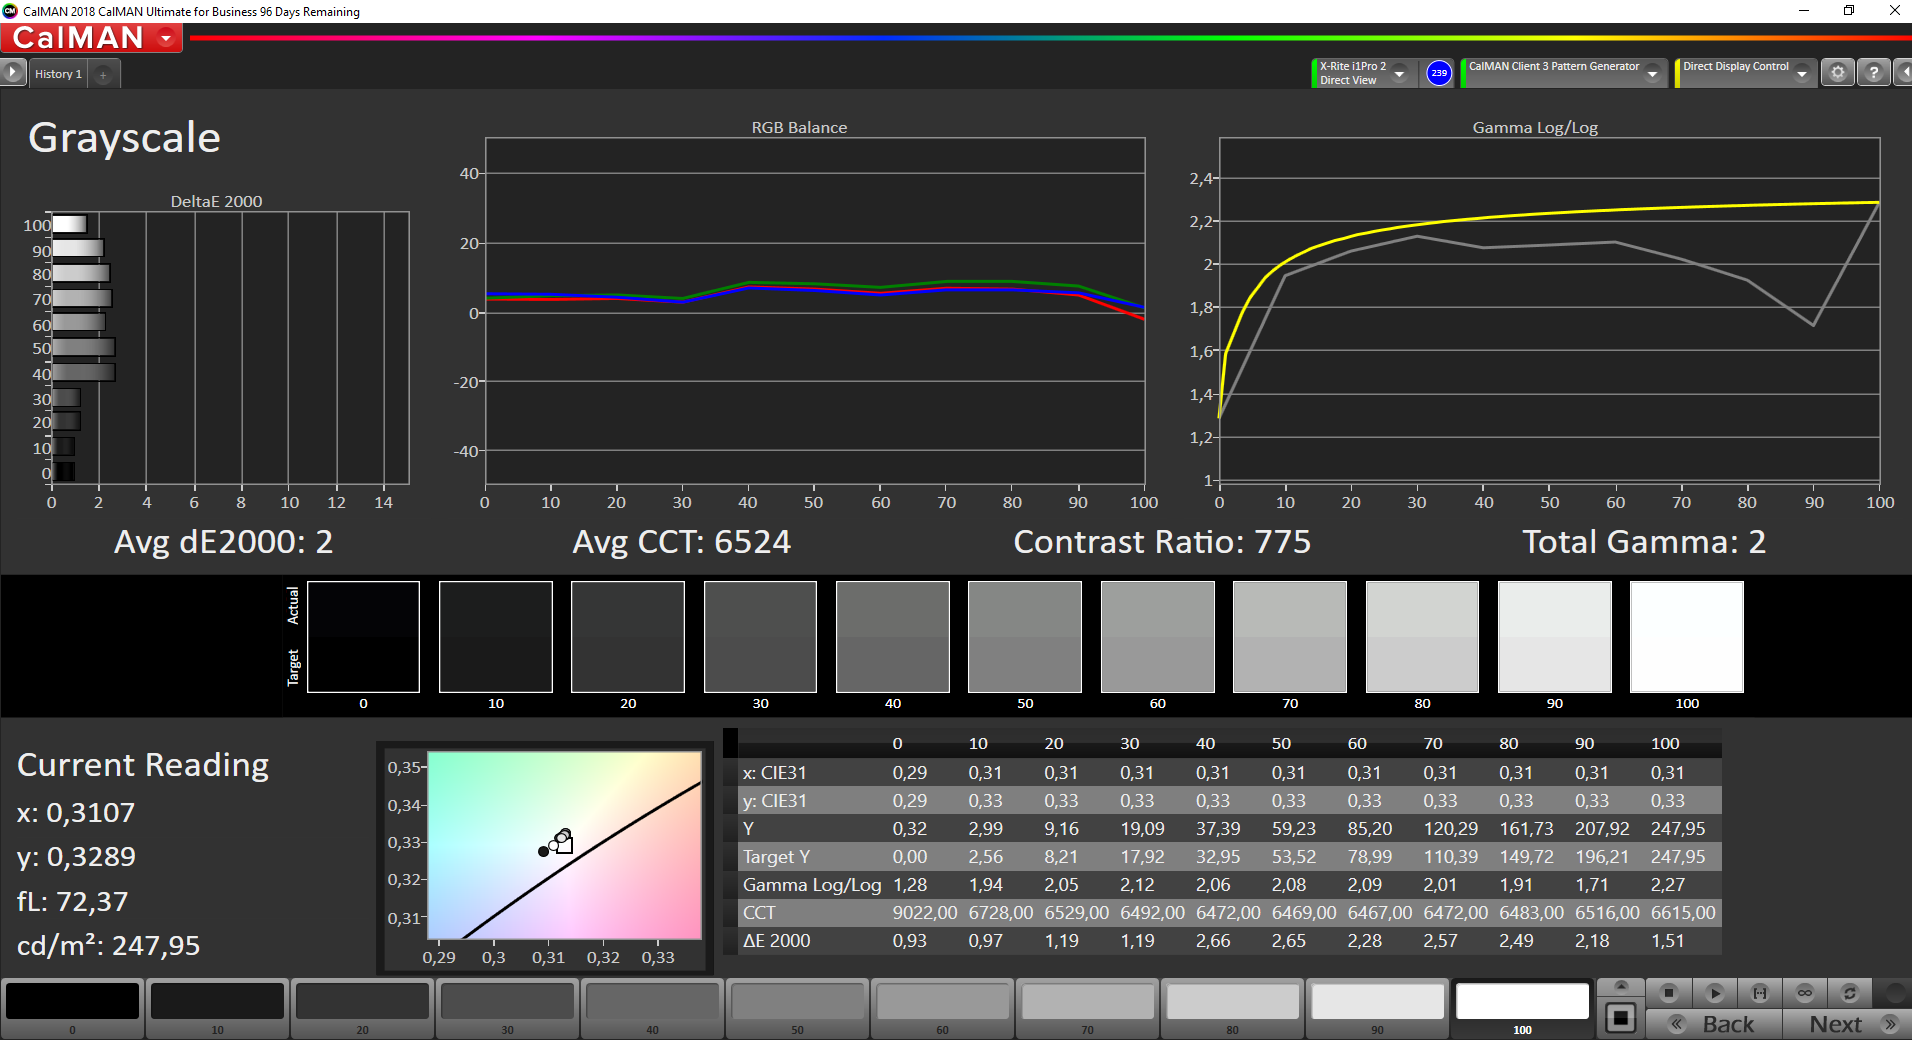

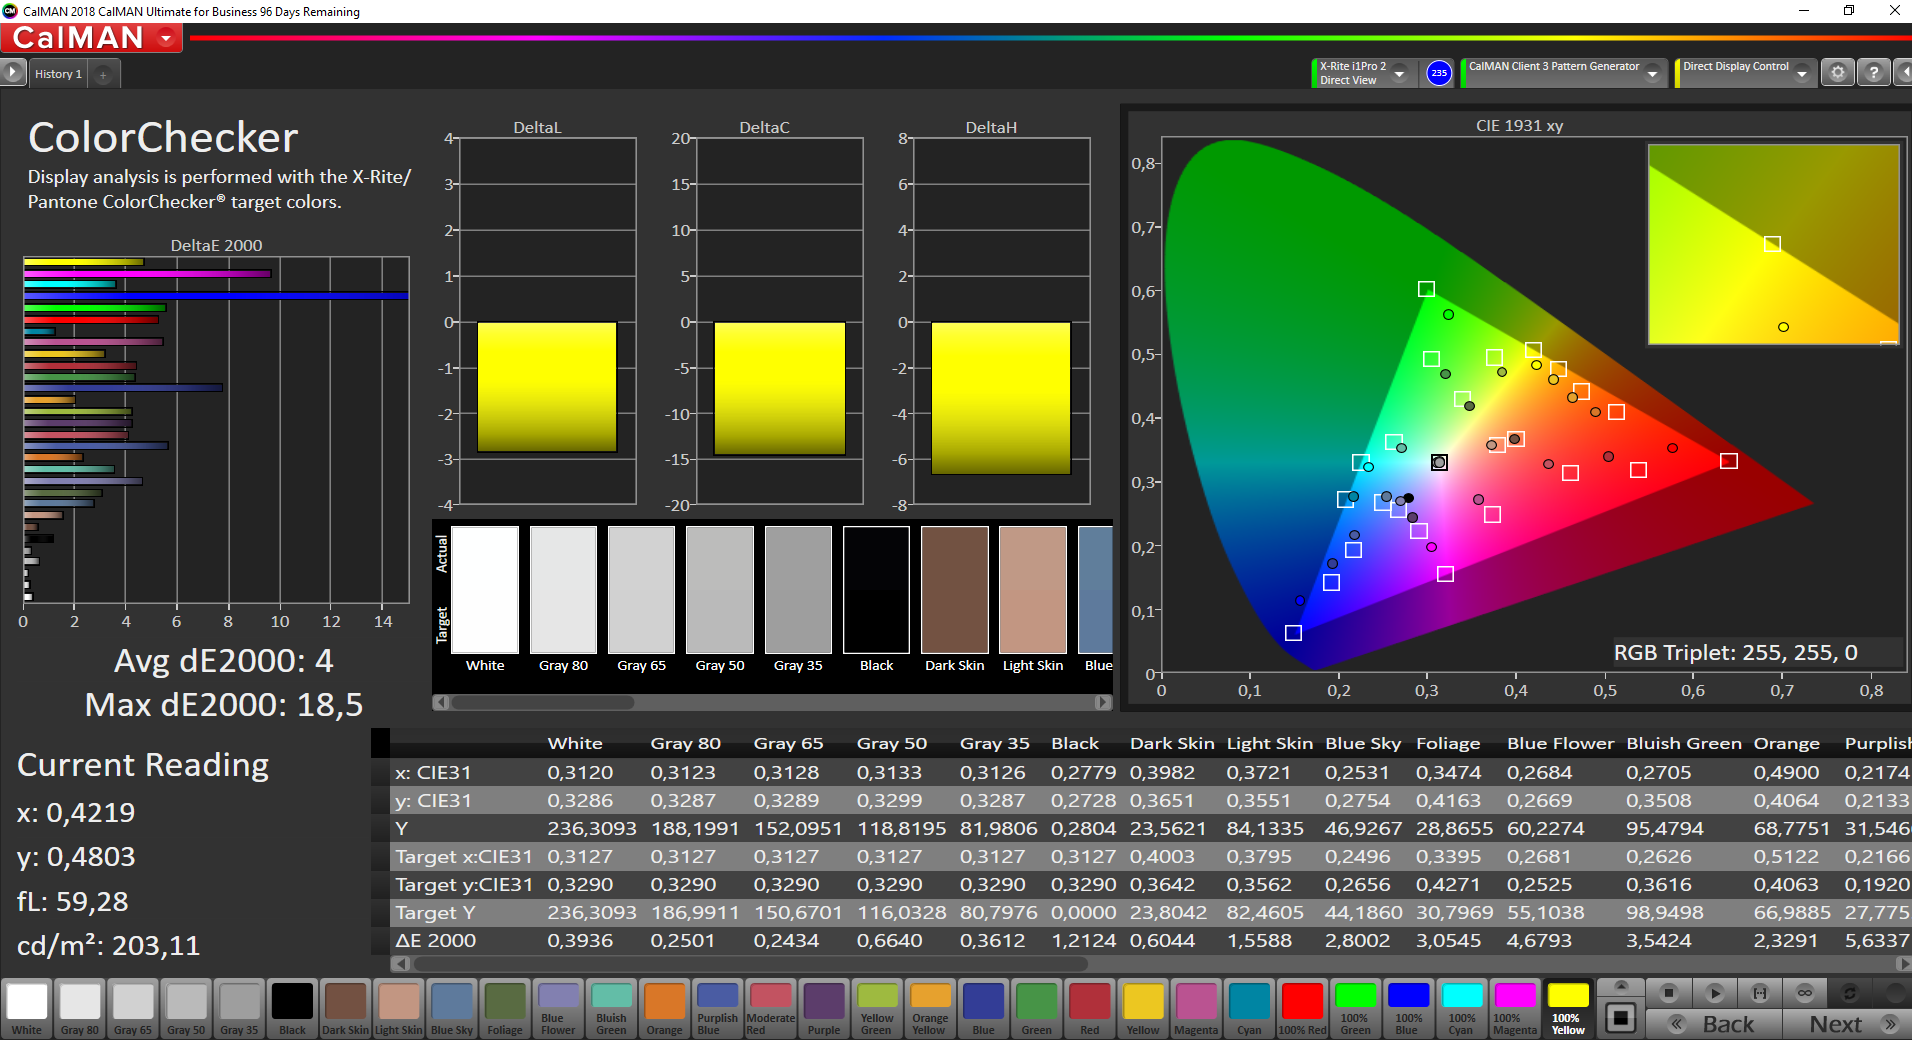
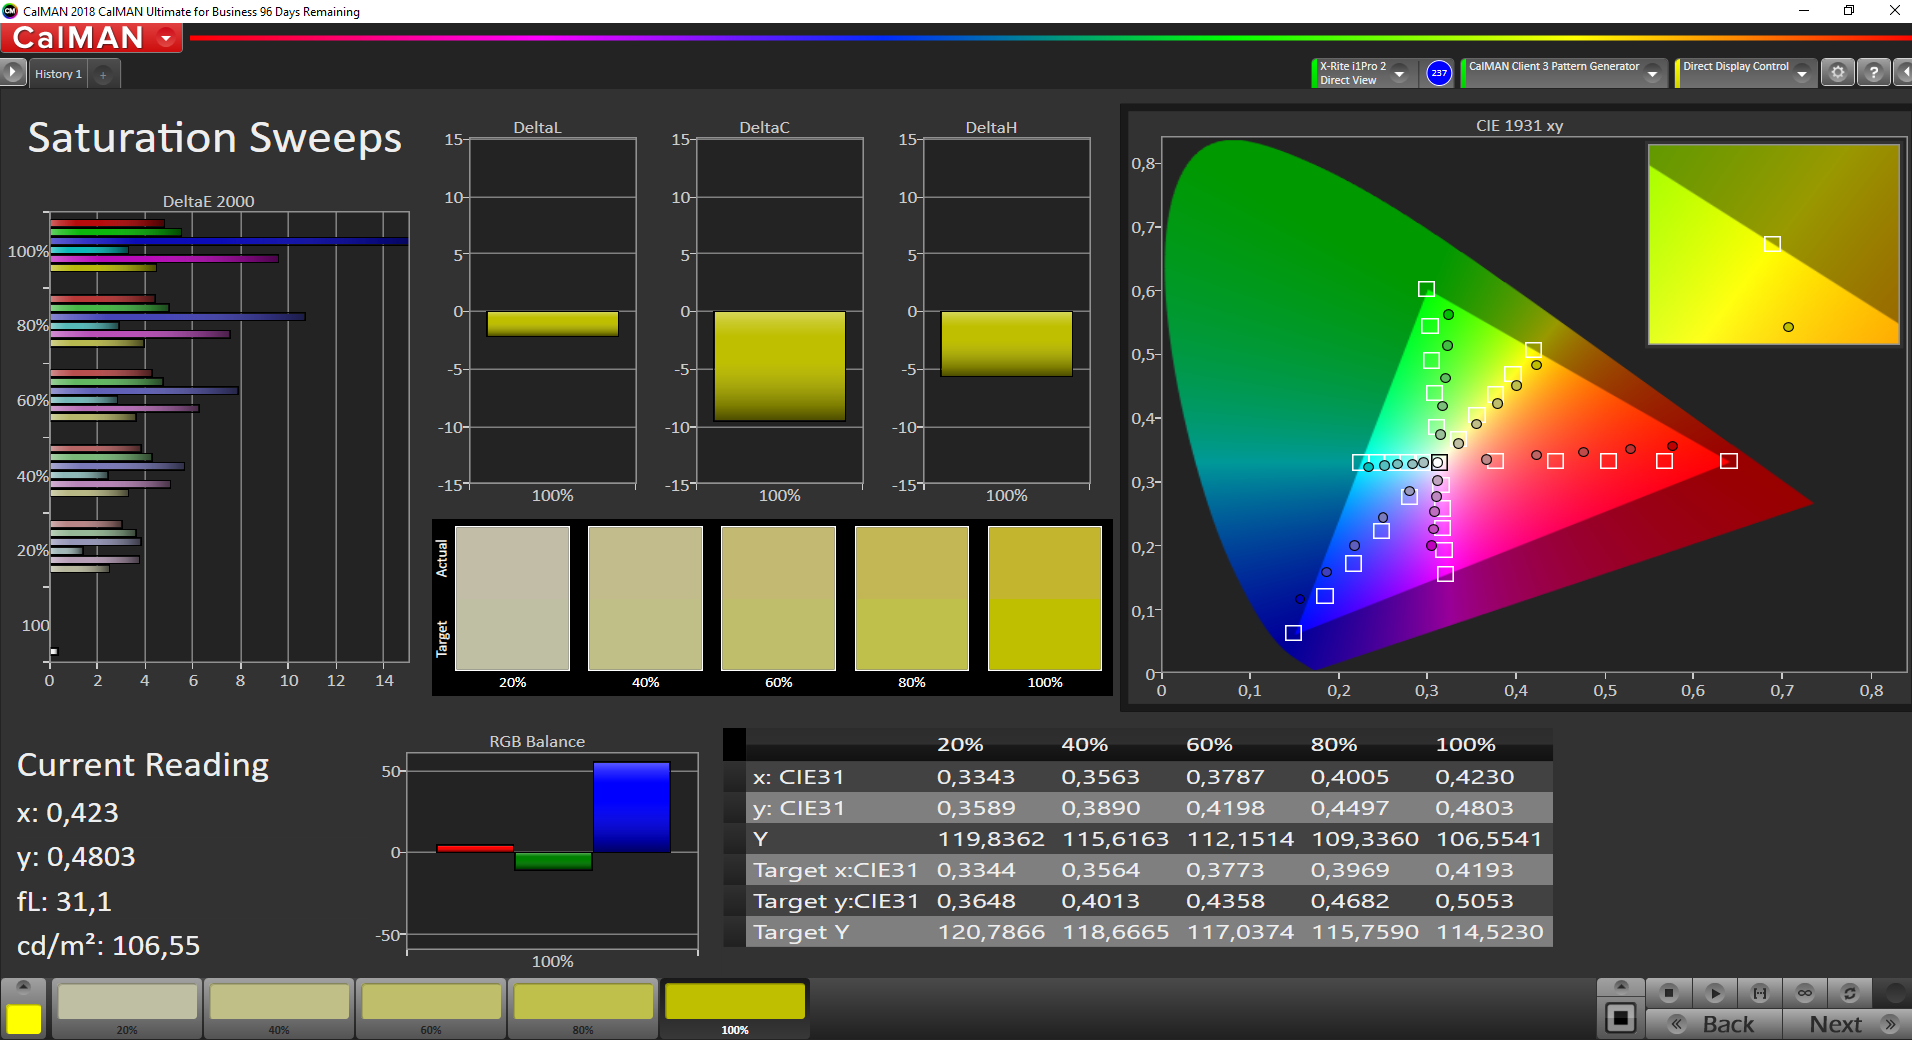
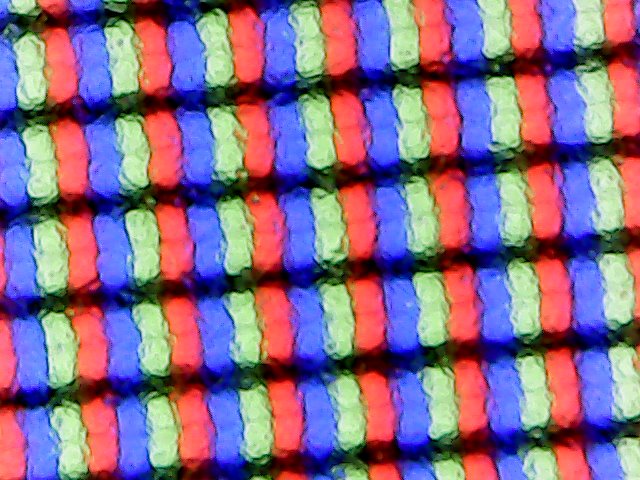
The color-space coverage sees a minimal increase again to around 635 sRGB and 40% AdobeRGB; the predecessor is about 12% worse here, which should barely be of interest to normal customers. The color deviations are very high and can only be minimally improved even after a calibration. The reproduction is sufficient for office applications, but the panel is only partially suitable for image or video editing.
Overall, Lenovo is making the screen worse; the price to pay for a small increase in brightness is a significant loss in black value and contrast. In terms of quality, it cannot be said that the panel switch was worth it here. As usual, however, the manufacturer relies again on several panel suppliers so that you only know which screen you get until after the purchase.
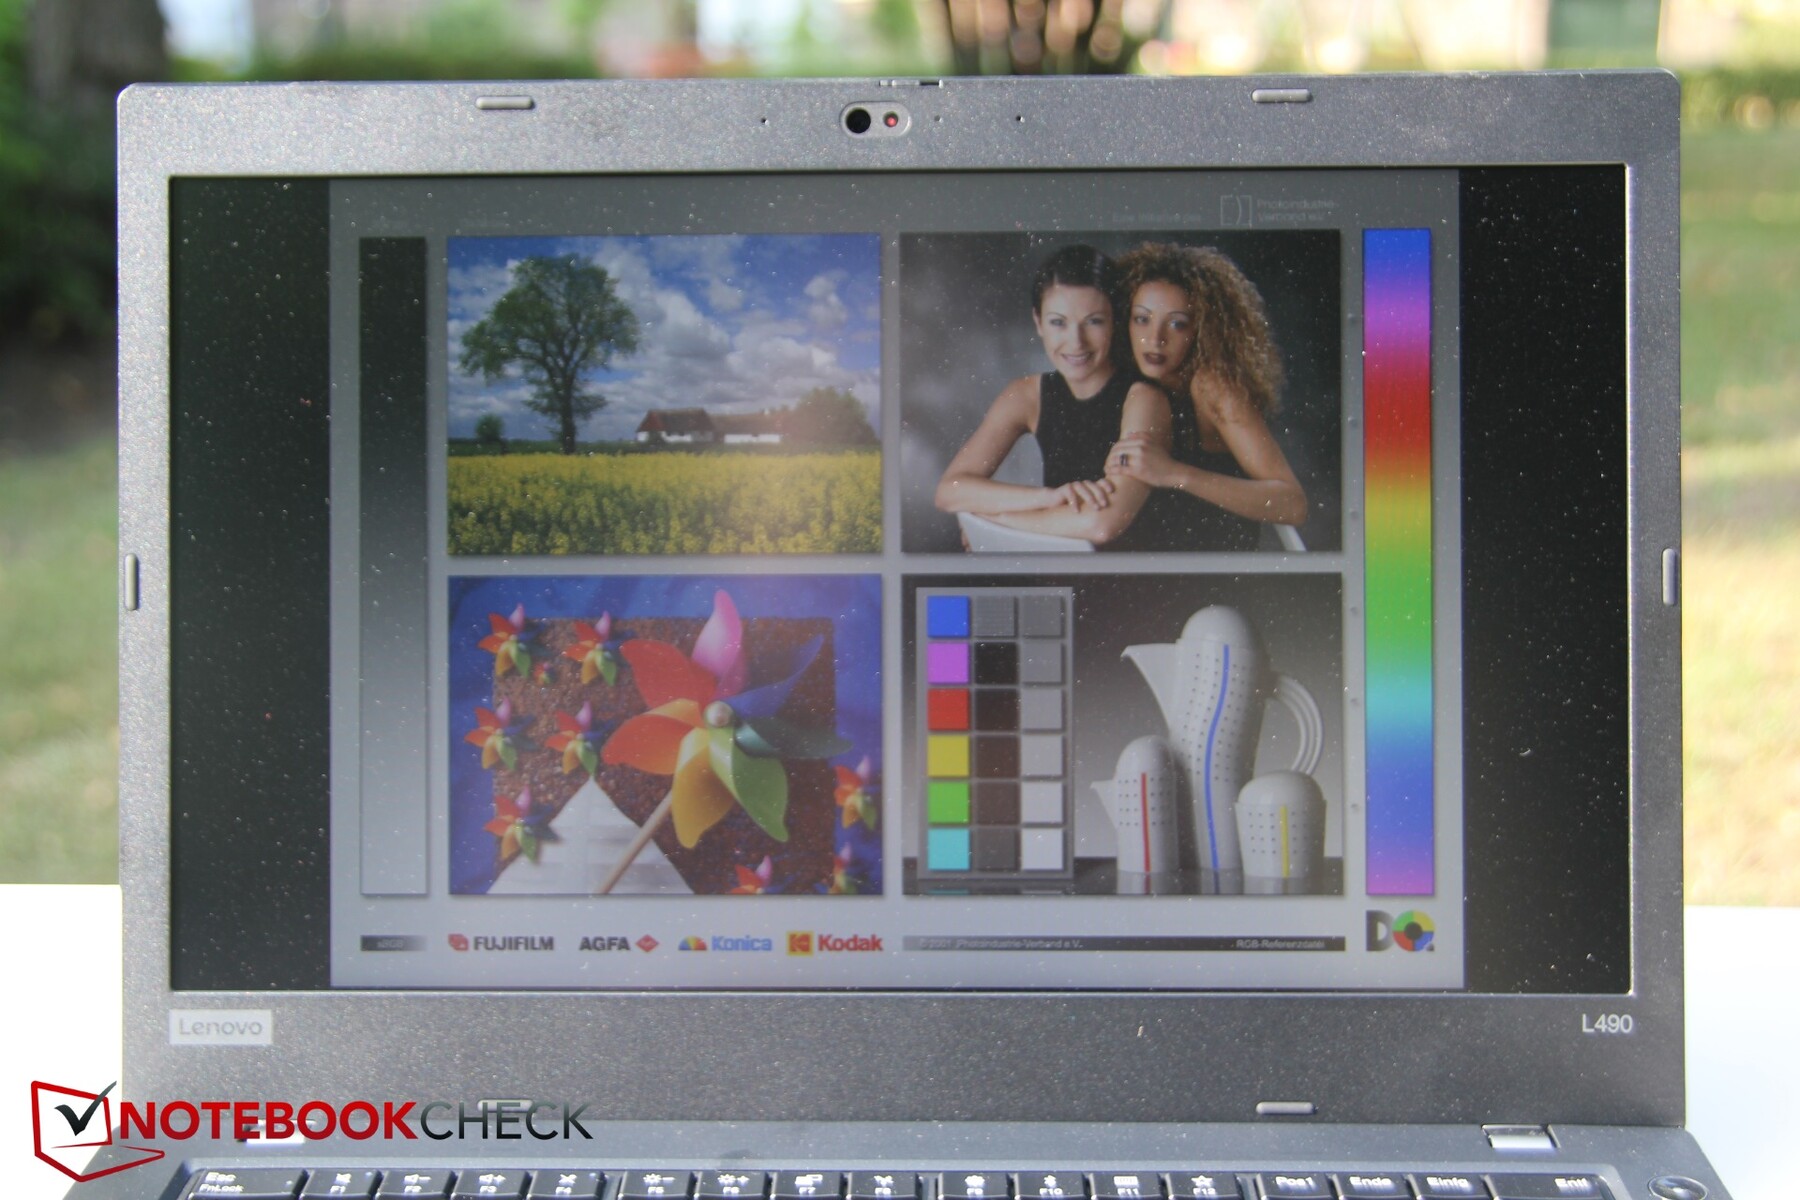
Despite the rather average values in terms of brightness, contrast and black value, the ThinkPad is still very usable outdoors. All bothersome reflections are filtered out through the matte display, and especially in the case of indirect sunlight, the content is still clearly recognizable.
Display Response Times
| ↔ Response Time Black to White | ||
|---|---|---|
| 26.4 ms ... rise ↗ and fall ↘ combined | ↗ 14 ms rise | 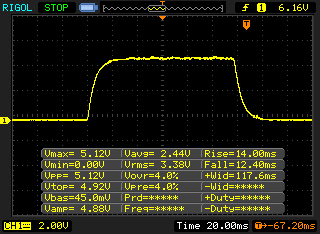 |
| ↘ 12.4 ms fall | ||
| The screen shows relatively slow response rates in our tests and may be too slow for gamers. In comparison, all tested devices range from 0.1 (minimum) to 240 (maximum) ms. » 66 % of all devices are better. This means that the measured response time is worse than the average of all tested devices (19.9 ms). | ||
| ↔ Response Time 50% Grey to 80% Grey | ||
| 37.6 ms ... rise ↗ and fall ↘ combined | ↗ 20.4 ms rise | 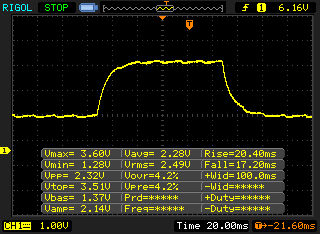 |
| ↘ 17.2 ms fall | ||
| The screen shows slow response rates in our tests and will be unsatisfactory for gamers. In comparison, all tested devices range from 0.165 (minimum) to 636 (maximum) ms. » 54 % of all devices are better. This means that the measured response time is worse than the average of all tested devices (31.1 ms). | ||
Screen Flickering / PWM (Pulse-Width Modulation)
| Screen flickering / PWM detected | 25000 Hz | ≤ 40 % brightness setting | 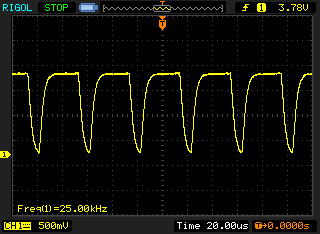 |
The display backlight flickers at 25000 Hz (worst case, e.g., utilizing PWM) Flickering detected at a brightness setting of 40 % and below. There should be no flickering or PWM above this brightness setting. The frequency of 25000 Hz is quite high, so most users sensitive to PWM should not notice any flickering. In comparison: 52 % of all tested devices do not use PWM to dim the display. If PWM was detected, an average of 7794 (minimum: 5 - maximum: 343500) Hz was measured. | |||
Viewing angle stability is definitely there. This is normally quite good with IPS panels; in our review device, however, further brightness information is lost relatively quickly, especially with the views from the top and the sides. There are IPS panels with clearly more stable viewing angles here. In addition, this means that the user should pay attention to an optimal positioning angle of the display, otherwise it will become darker.

Performance – Slower Whiskey Lake in Lenovo L490
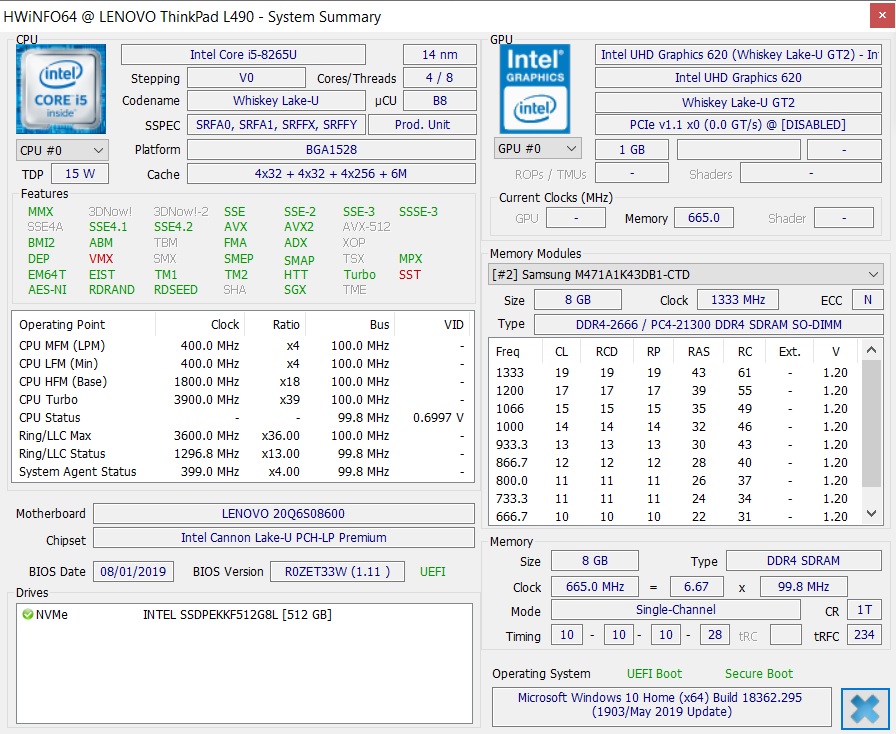
Not in vain is the L490 part of the Campuspoint program. With its Intel Core i5-8265U, 8 GB of RAM and integrated Intel graphics, it is best suited for office work, writing tasks and surfing the web. The ExpressCard slot also makes it interesting for companies. On the other hand, demanding graphics applications are not the territory of our review device.
The manufacturer naturally offers several configuration variants. You can choose between two i5 and two i7 models with the processor, and a maximum of 64 GB RAM is accepted as memory. In terms of performance a memory configuration of two RAM sticks in dual-channel mode is generally preferable to the single RAM installed here.
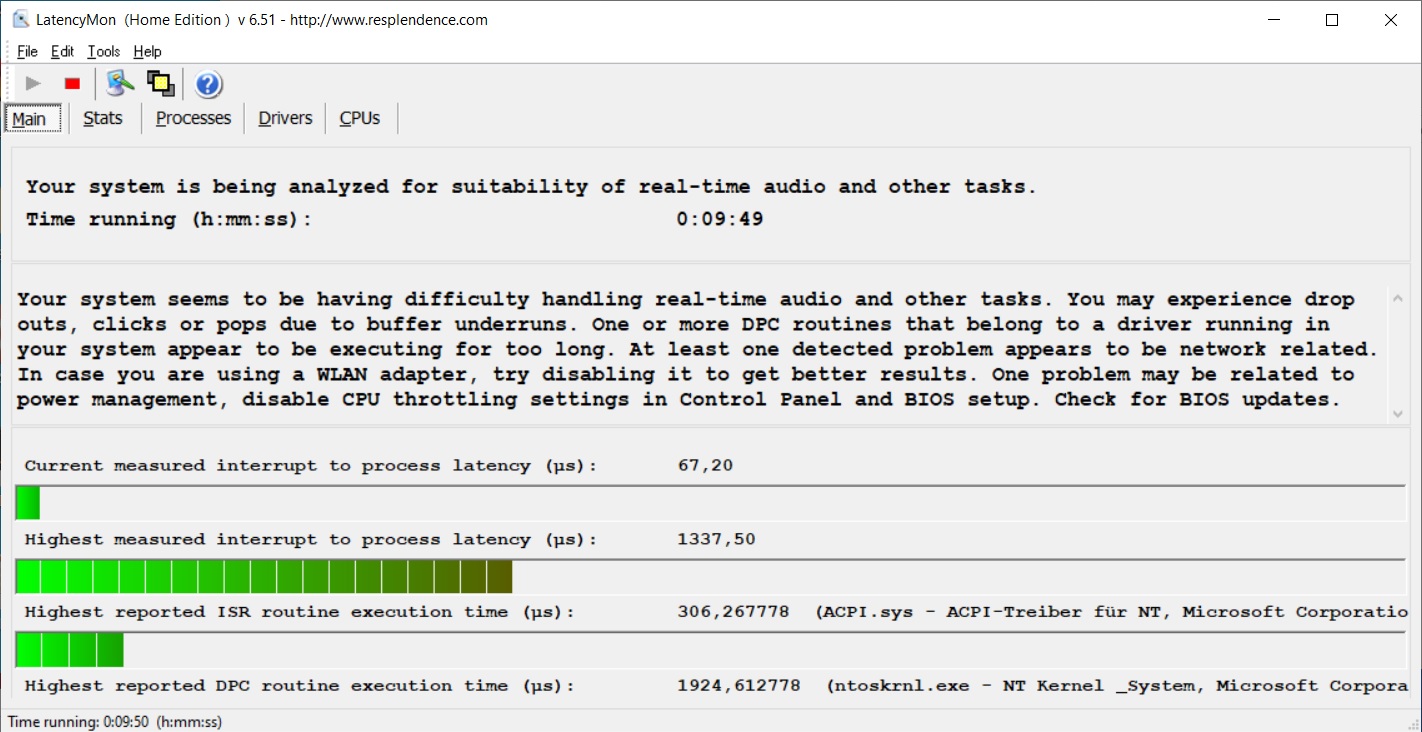
Unfortunately, drivers that may slow down the system were detected in an initial test with LatencyMon. Deactivating the Wi-Fi adapter did not help; Lenovo would need to correct this through driver updates.
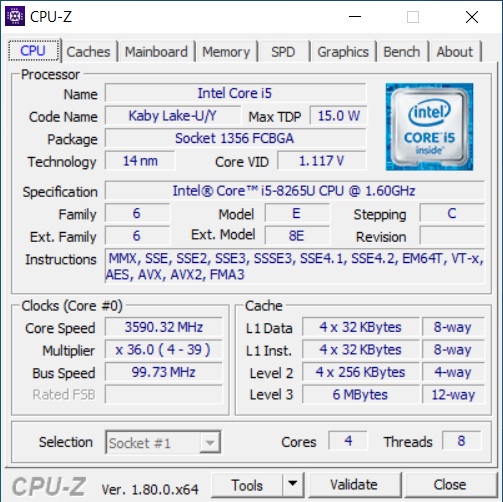
Processor
Lenovo uses an economical but performance capable Intel Core i5-8265U. It is based on the current Whiskey Lake Generation and offers a higher turbo speed than the predecessor. Overall, the CPU has speeds from 1.6 GHz to 3.9 GHz; all four cores reach simultaneously a maximum turbo speed of 3.7 GHz. This makes it perfectly suitable for all the intended application of the ThinkPad L490.
Alternatively, Lenovo also offers the Core i5-8365U with 200 MHz more of turbo speed as well as the Intel Core i7-8565U and the Intel Core i7-8665U. Whether the i7 models are actually faster would need to be confirmed through further testing. Normally faster CPUs are often slowed down by poor cooling systems.
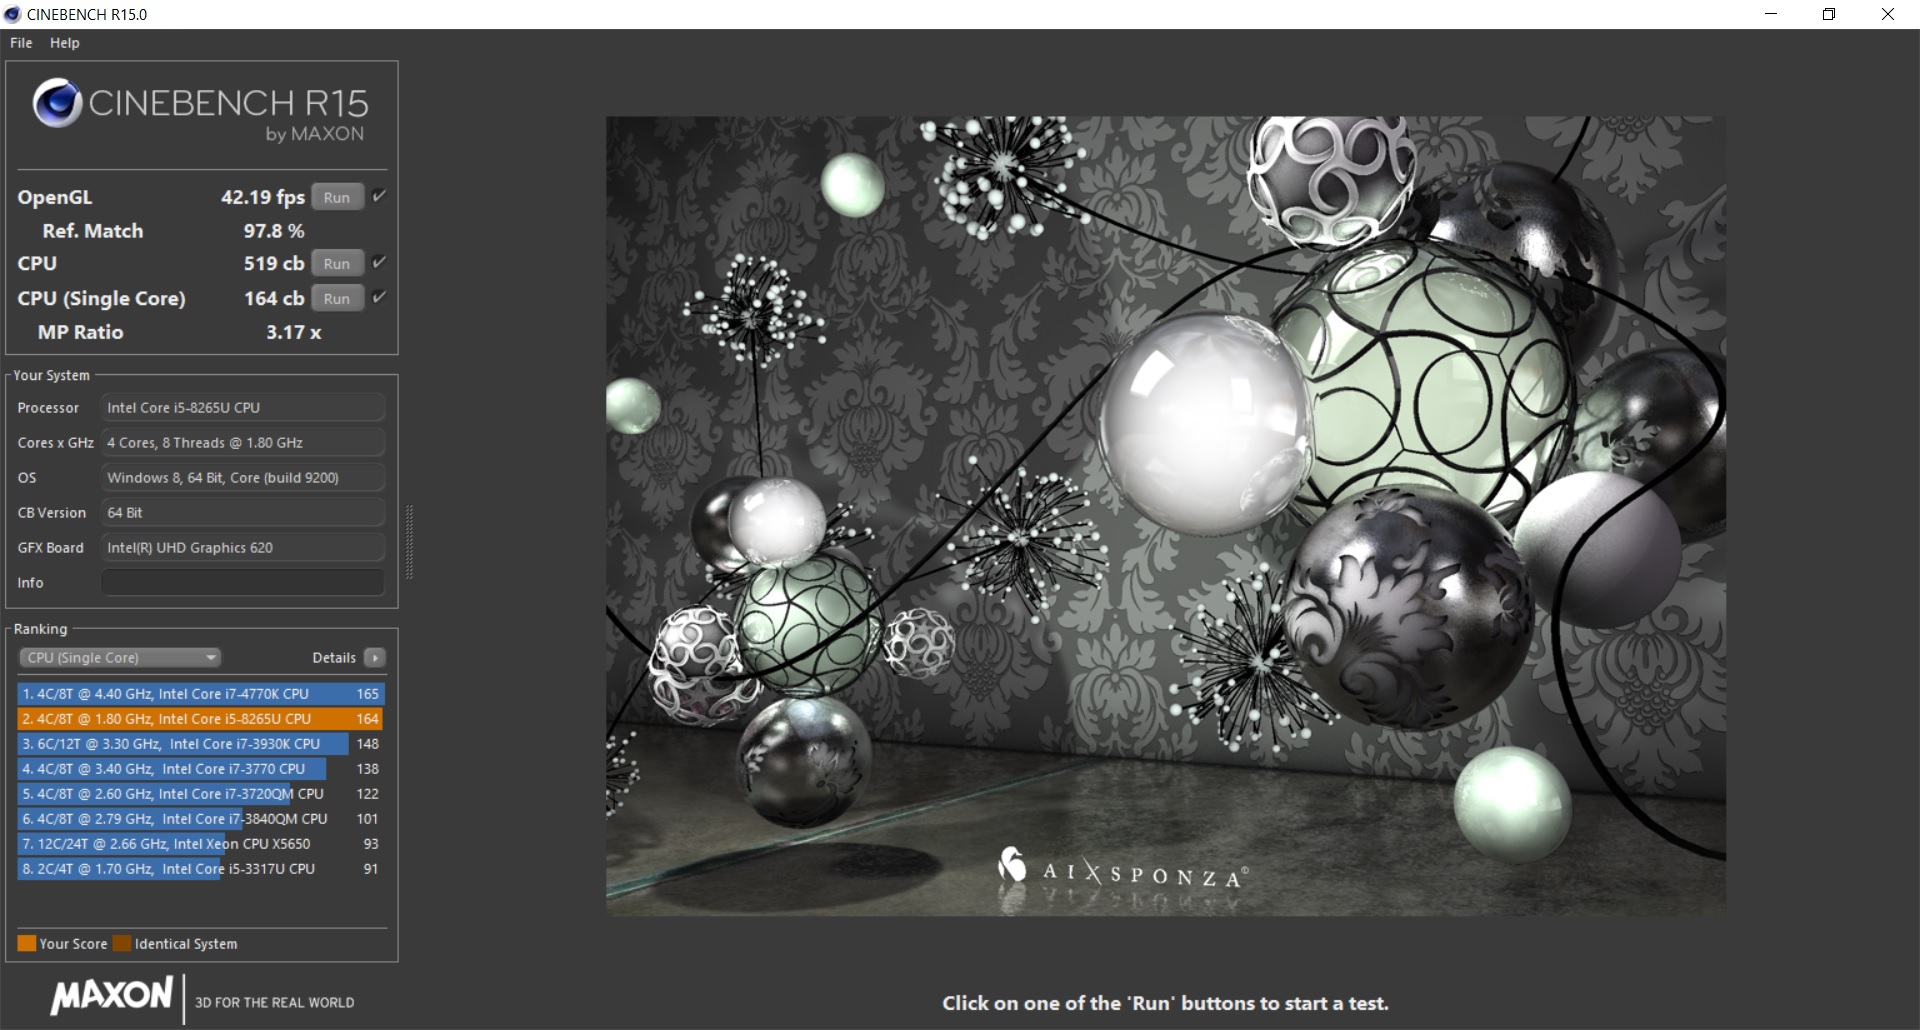
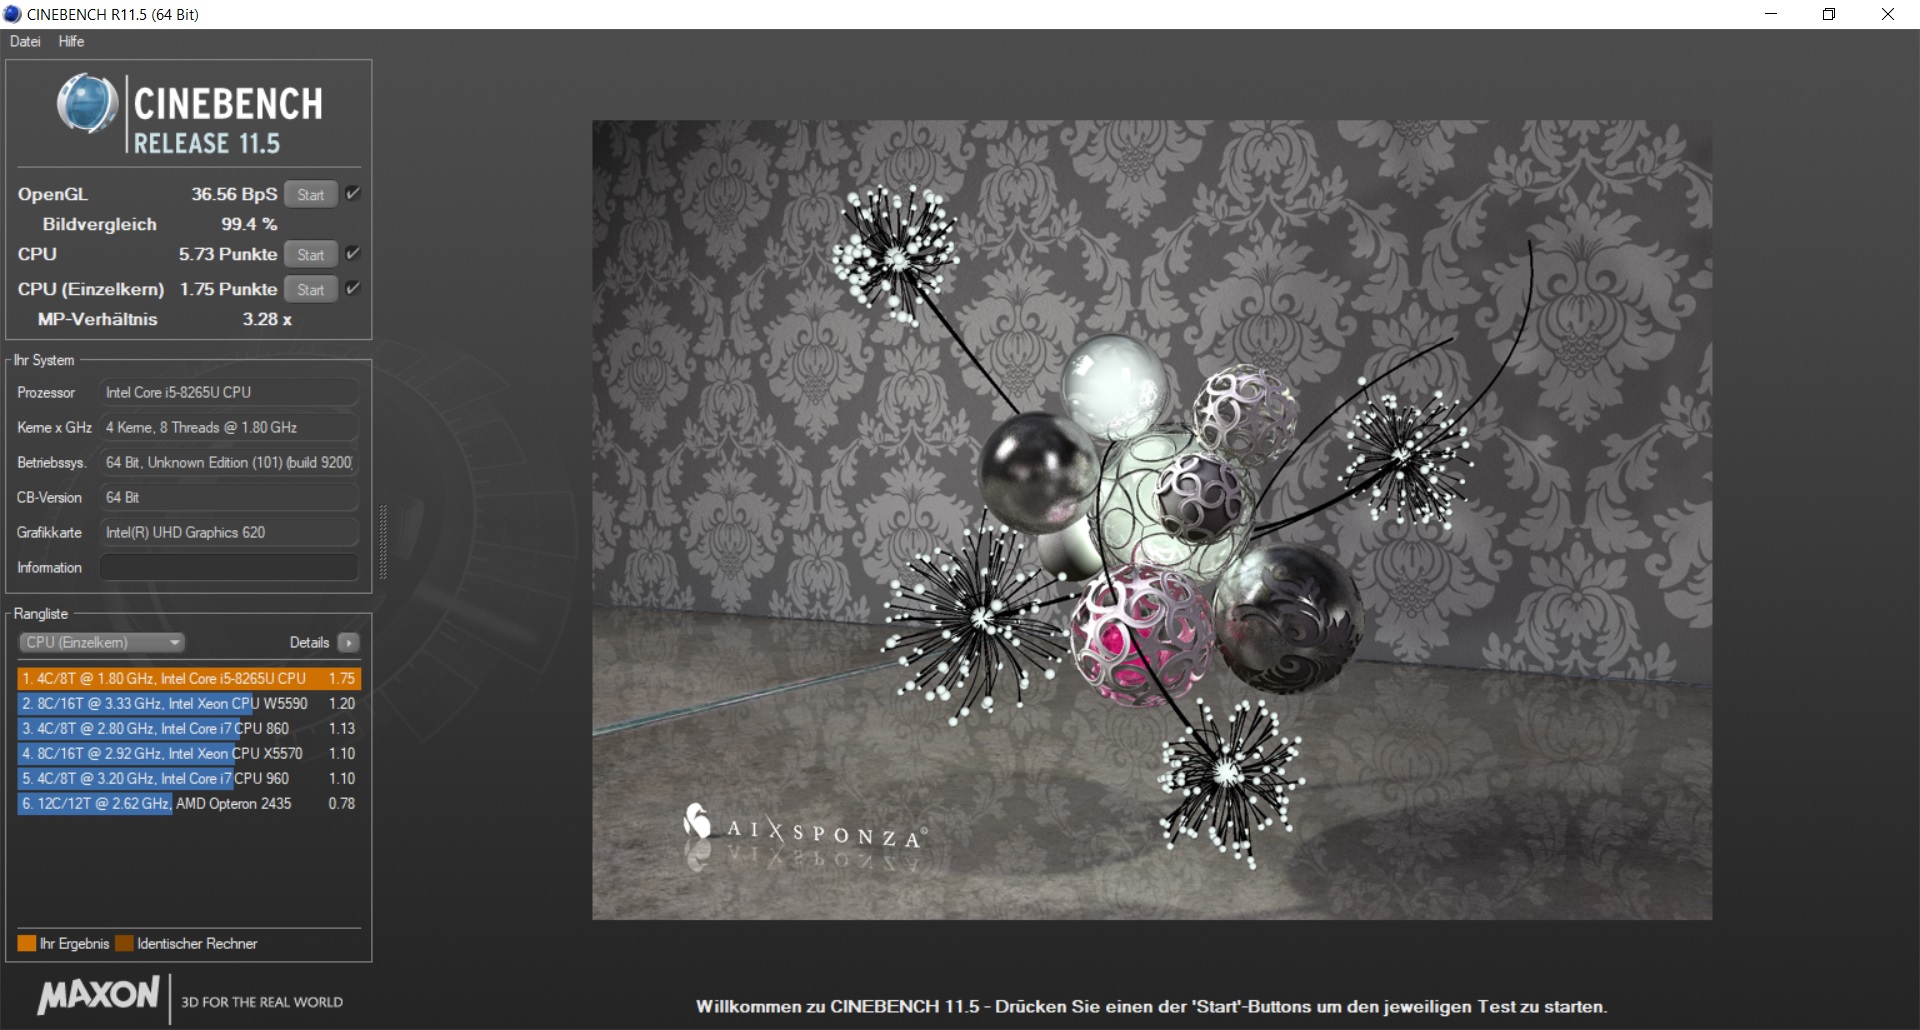
The Cinebench loop that runs for about 30 minutes shows that our review device works quite constantly. Although the value drops a bit after the first or second run, the loss of power is minimal, and performance is subsequently stable.
Stability is not difficult either if the output power is throttled, since the CPU of the L490 should actually be stronger than the one of its predecessor. However, the opposite is the case here. The L480 performs over 20% faster in the multi-core test and in fact across all Cinebench versions! The Whiskey Lake's processor performance is evidently strongly throttled.
Taking a look at the clock speeds reveals that the CPU only runs at an average of 2.5 GHz, but up to 3.7 GHz are theoretically available. Admittedly, this seems to be the case with the rest of the competitors. Within the comparison devices, hardly any i5-8265U performs according to its potential. The CPU performance of the predecessor is therefore considerably higher.
The measured values remain the same when unplugging the L490. According to this, stronger CPU throttling is not present on battery power.
System performance
System performance oscillates close to the reference values for the processor and graphics. The only exception is the Home score in PCMark 8. Incomprehensibly, performance is slightly below-average (-7%) here, but still within the limits. A second conduction of the test brought the same result. However, the differences between the devices are overall extremely small.
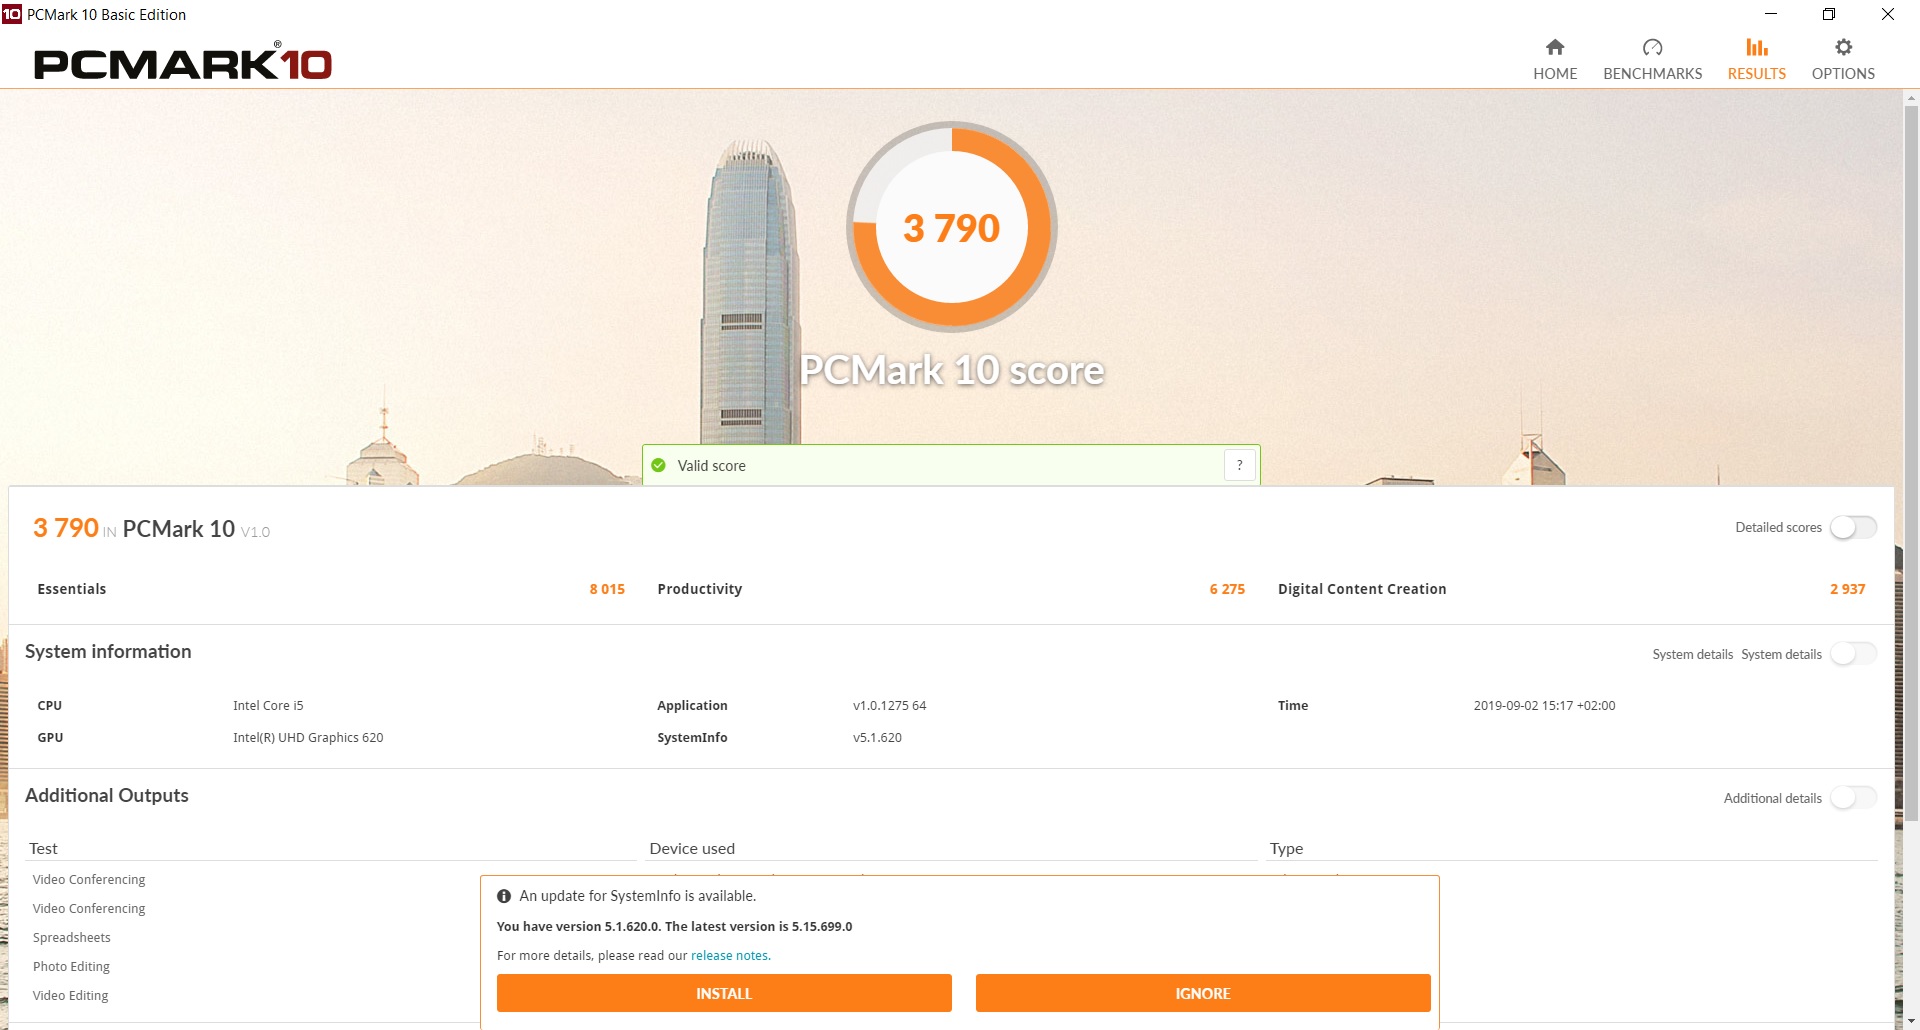
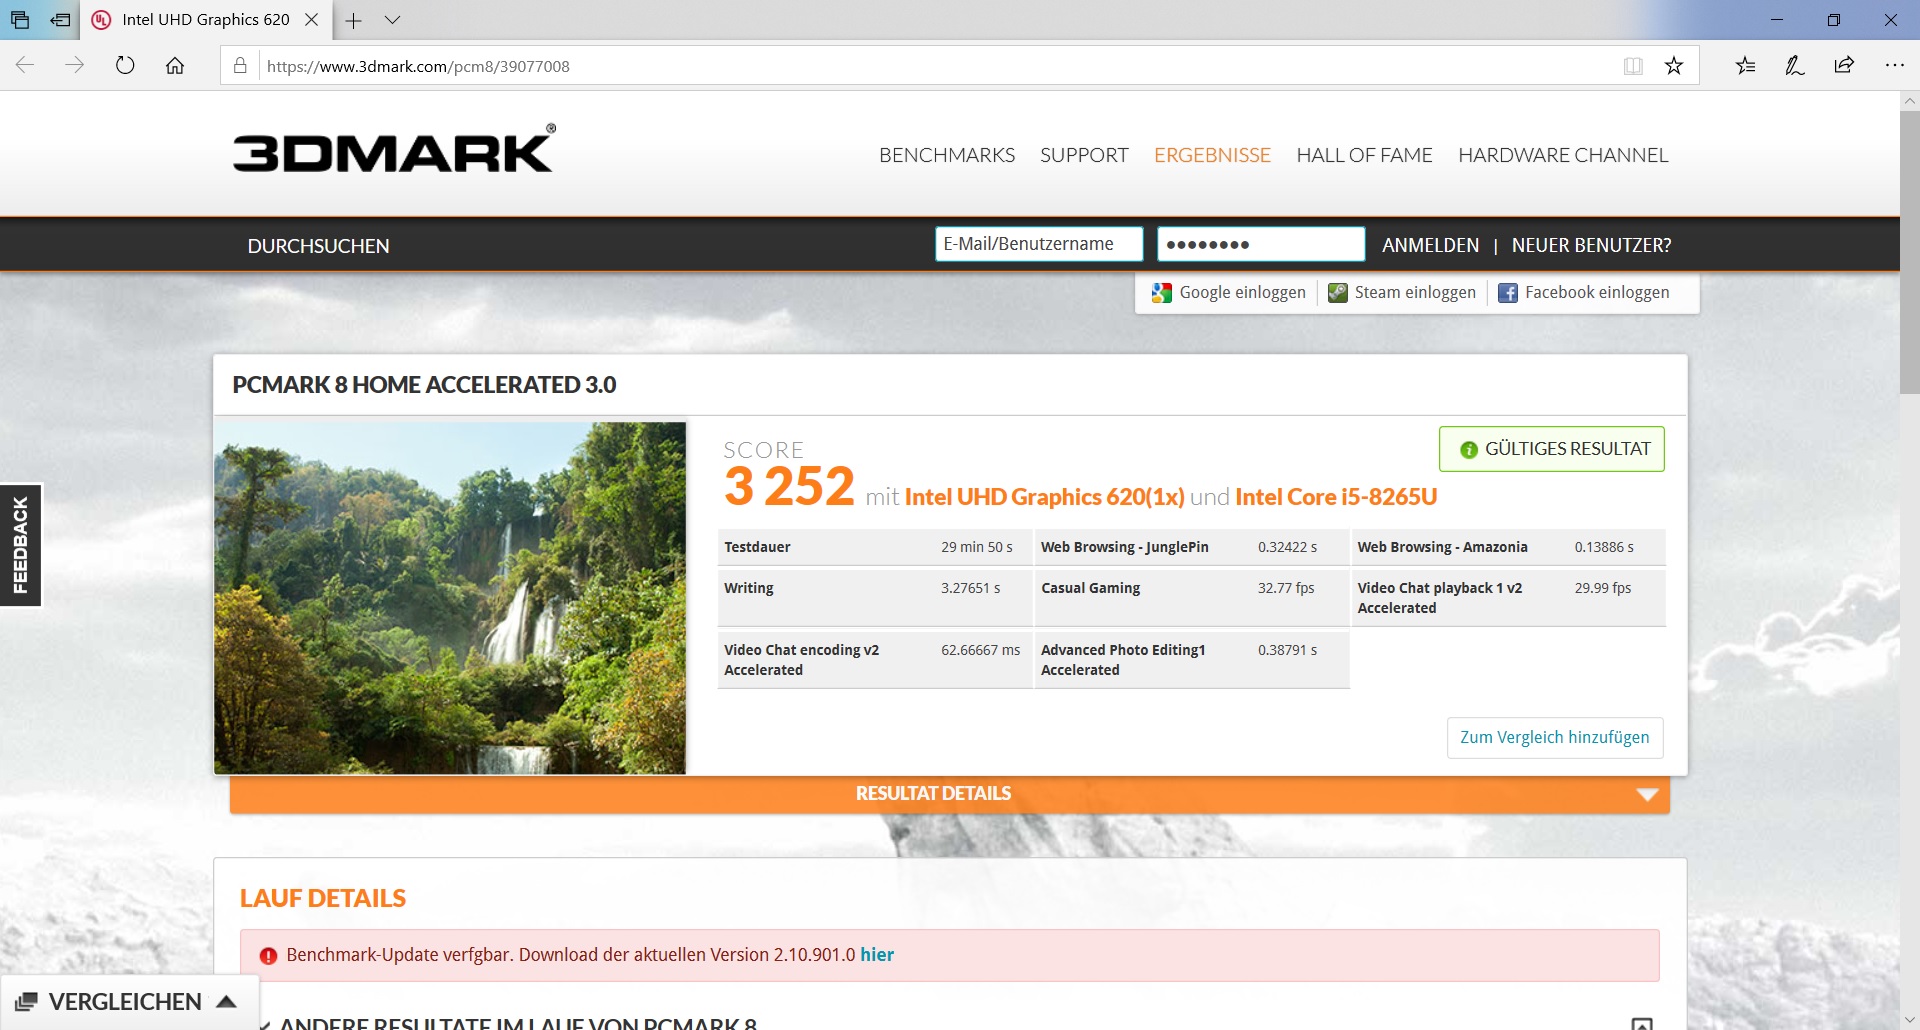
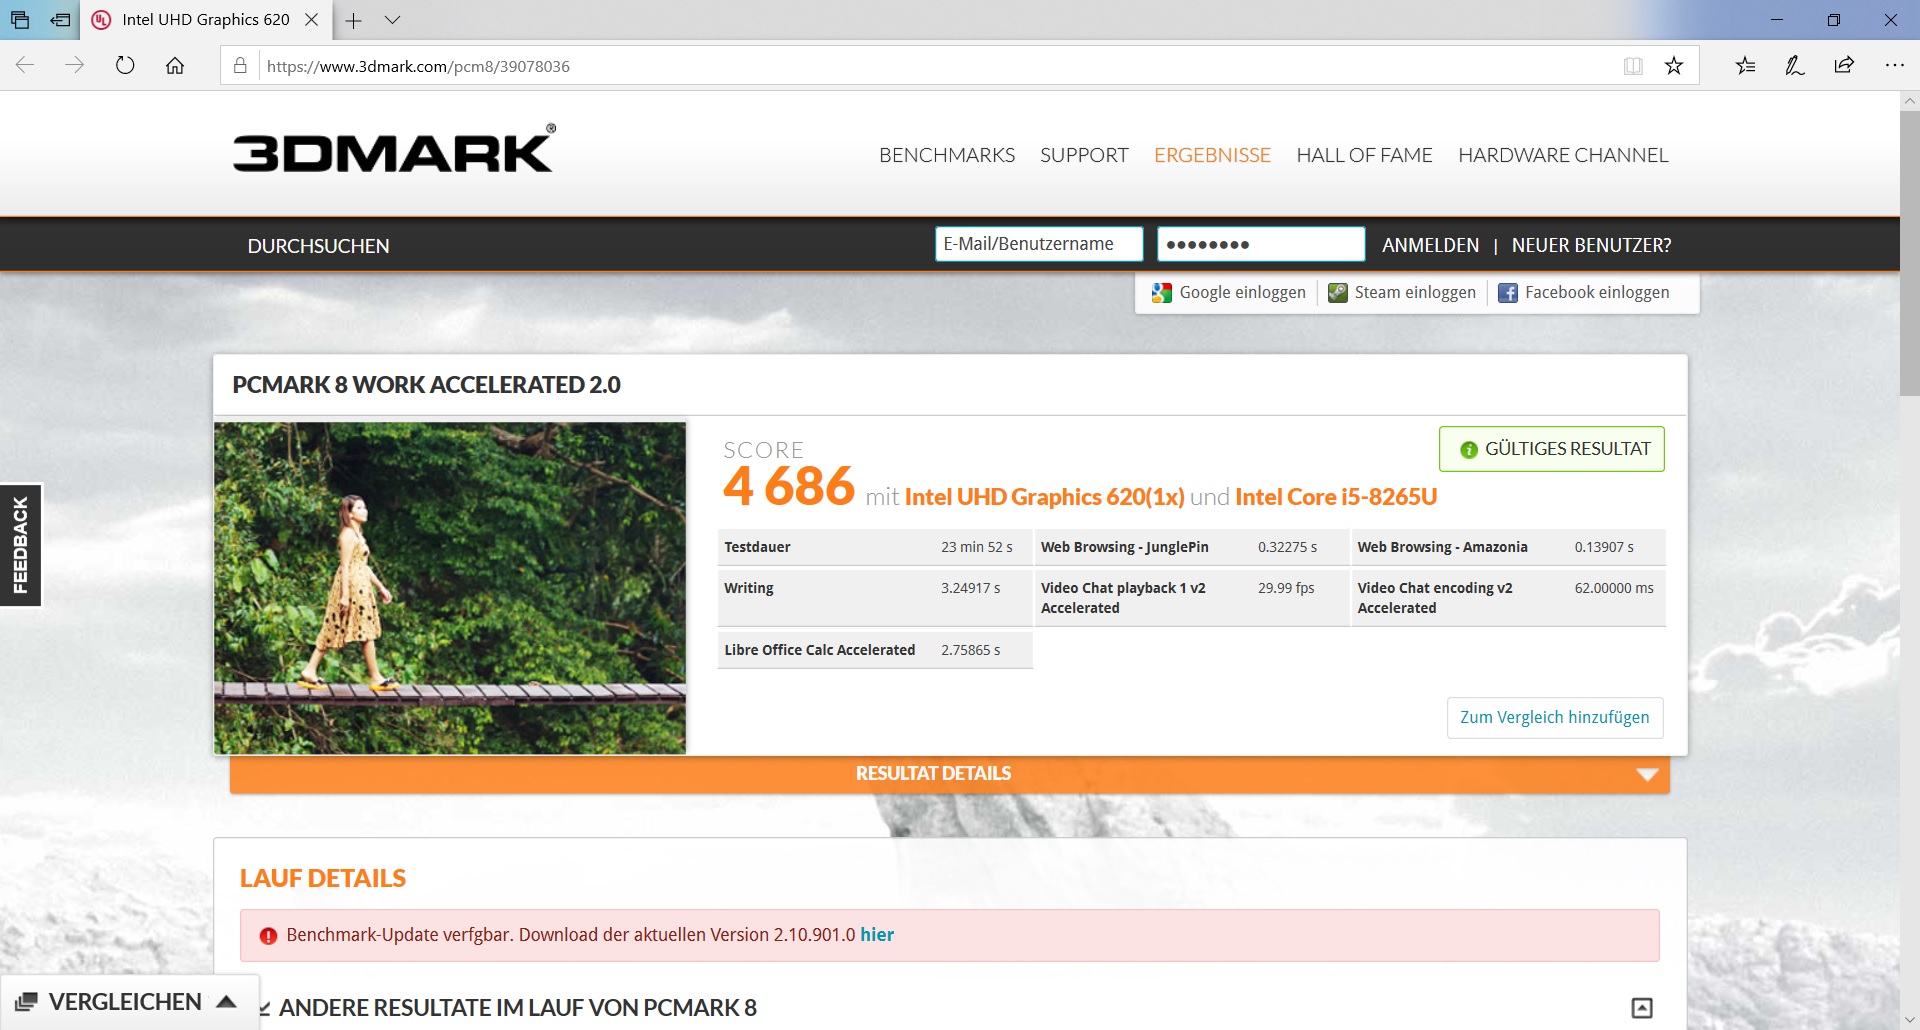
| PCMark 8 Home Score Accelerated v2 | 3252 points | |
| PCMark 8 Work Score Accelerated v2 | 4700 points | |
| PCMark 10 Score | 3790 points | |
Help | ||
Storage
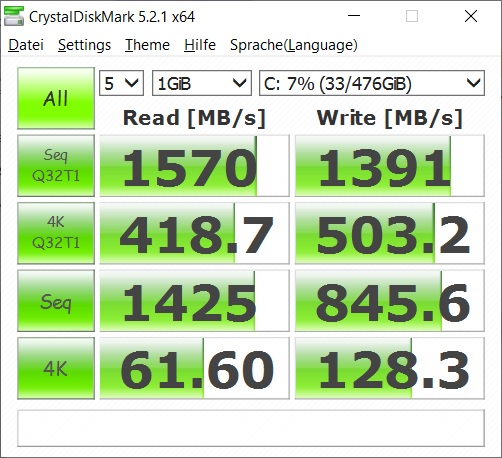
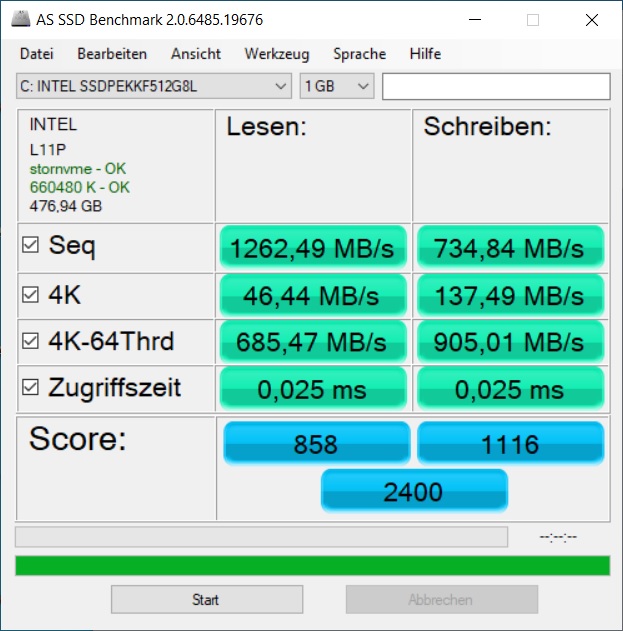
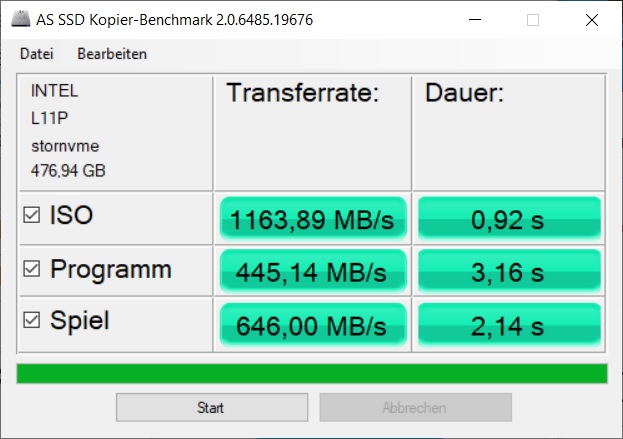
The storage device in our L490 is an Intel SSD with 512 GB. It sits on a removable rack in the M.2 slot and is controlled by PCIe. It is significantly faster than the Toshiba SSD found in the L480 and also outperforms the model in the E490. The remaining contenders are, however, partially still faster. Nevertheless, the SSD should produce good work results. The model takes the 48th place in our SSD/HDD ranking list. The model that is used here still performs a bit worse than our reference model (+19%).
| Lenovo ThinkPad L490 20Q6S08600 Intel SSD Pro 7600p SSDPEKKF512G8L | Lenovo ThinkPad L480-20LS001AGE Toshiba KXG5AZNV256G | Lenovo ThinkPad E490-20N8000RGE SK hynix BC501 HFM256GDHTNG | Lenovo Flex 14IWL Samsung SSD PM981 MZVLB256HAHQ | HP 250 G7 6HM85ES WDC PC SN520 SDAPNUW-512G | Schenker Slim 15-RE-E19 Samsung SSD 970 EVO Plus 500GB | Average Intel SSD Pro 7600p SSDPEKKF512G8L | |
|---|---|---|---|---|---|---|---|
| CrystalDiskMark 5.2 / 6 | -23% | -19% | 14% | 11% | 46% | 23% | |
| Write 4K (MB/s) | 128.3 | 110.8 -14% | 110.7 -14% | 136.5 6% | 179.3 40% | 187.2 46% | 133.9 ? 4% |
| Read 4K (MB/s) | 61.6 | 36.46 -41% | 41.02 -33% | 45.74 -26% | 47.7 -23% | 51.8 -16% | 59.1 ? -4% |
| Write Seq (MB/s) | 846 | 482.4 -43% | 757 -11% | 1265 50% | 1438 70% | 1378 ? 63% | |
| Read Seq (MB/s) | 1425 | 1425 0% | 1037 -27% | 1184 -17% | 1347 -5% | 2341 ? 64% | |
| Write 4K Q32T1 (MB/s) | 503 | 355.6 -29% | 359 -29% | 380.5 -24% | 450.6 -10% | 396.7 -21% | 355 ? -29% |
| Read 4K Q32T1 (MB/s) | 418.7 | 405.6 -3% | 402.4 -4% | 437.5 4% | 556 33% | 534 28% | 429 ? 2% |
| Write Seq Q32T1 (MB/s) | 1391 | 495.2 -64% | 833 -40% | 1502 8% | 1455 5% | 3280 136% | 1514 ? 9% |
| Read Seq Q32T1 (MB/s) | 1570 | 1777 13% | 1635 4% | 3357 114% | 1717 9% | 3556 126% | 2677 ? 71% |
| Write 4K Q8T8 (MB/s) | 1435 | 1018 ? | |||||
| Read 4K Q8T8 (MB/s) | 572 | 901 ? | |||||
| AS SSD | -108% | -36% | 17% | 7% | 65% | 19% | |
| Seq Read (MB/s) | 1262 | 1274 1% | 1420 13% | 2533 101% | 1477 17% | 2661 111% | 2408 ? 91% |
| Seq Write (MB/s) | 735 | 461.8 -37% | 552 -25% | 1438 96% | 1339 82% | 2426 230% | 1318 ? 79% |
| 4K Read (MB/s) | 46.44 | 29.74 -36% | 42.31 -9% | 51.7 11% | 46.26 0% | 59 27% | 60.9 ? 31% |
| 4K Write (MB/s) | 137.5 | 110.3 -20% | 112.1 -18% | 109.4 -20% | 143.9 5% | 166 21% | 153.3 ? 11% |
| 4K-64 Read (MB/s) | 685 | 415.8 -39% | 510 -26% | 771 13% | 937 37% | 1314 92% | 811 ? 18% |
| 4K-64 Write (MB/s) | 905 | 268.8 -70% | 357.9 -60% | 1268 40% | 1190 31% | 1494 65% | 895 ? -1% |
| Access Time Read * (ms) | 0.025 | 0.247 -888% | 0.053 -112% | 0.053 -112% | 0.046 -84% | 0.046 -84% | 0.0376 ? -50% |
| Access Time Write * (ms) | 0.025 | 0.055 -120% | 0.032 -28% | 0.034 -36% | 0.024 4% | 0.023 8% | 0.0352 ? -41% |
| Score Read (Points) | 858 | 573 -33% | 694 -19% | 1076 25% | 1131 32% | 1639 91% | 1113 ? 30% |
| Score Write (Points) | 1116 | 425 -62% | 525 -53% | 1521 36% | 1468 32% | 1902 70% | 1180 ? 6% |
| Score Total (Points) | 2400 | 1259 -48% | 1544 -36% | 3106 29% | 3181 33% | 4379 82% | 2825 ? 18% |
| Copy ISO MB/s (MB/s) | 1164 | 449.8 -61% | 637 -45% | 765 -34% | 1474 ? 27% | ||
| Copy Program MB/s (MB/s) | 445.1 | 187.8 -58% | 237 -47% | 239.9 -46% | 460 ? 3% | ||
| Copy Game MB/s (MB/s) | 646 | 395.1 -39% | 412 -36% | 528 -18% | 964 ? 49% | ||
| Total Average (Program / Settings) | -66% /
-77% | -28% /
-30% | 16% /
16% | 9% /
8% | 56% /
57% | 21% /
21% |
* ... smaller is better

Graphics card
The L490 lacks dedicated graphics. The model cannot be optionally configured with discrete graphics in the Lenovo website either. Users have to make do with the model that is integrated into the processor instead. But the Intel UHD Graphics 620 masters all the laptop's tasks reliably; it is only with graphically demanding work that sacrifices have to be made, and the same applies for games since the graphics are only of limited suitability for this.
In our synthetic graphics benchmarks, performance behaves as expected. However, the competitors perform almost on par in all tests; after all, they are all using the same processor and the same graphics.
There is no performance decline on battery power since the values are roughly at the same level as when plugged in.
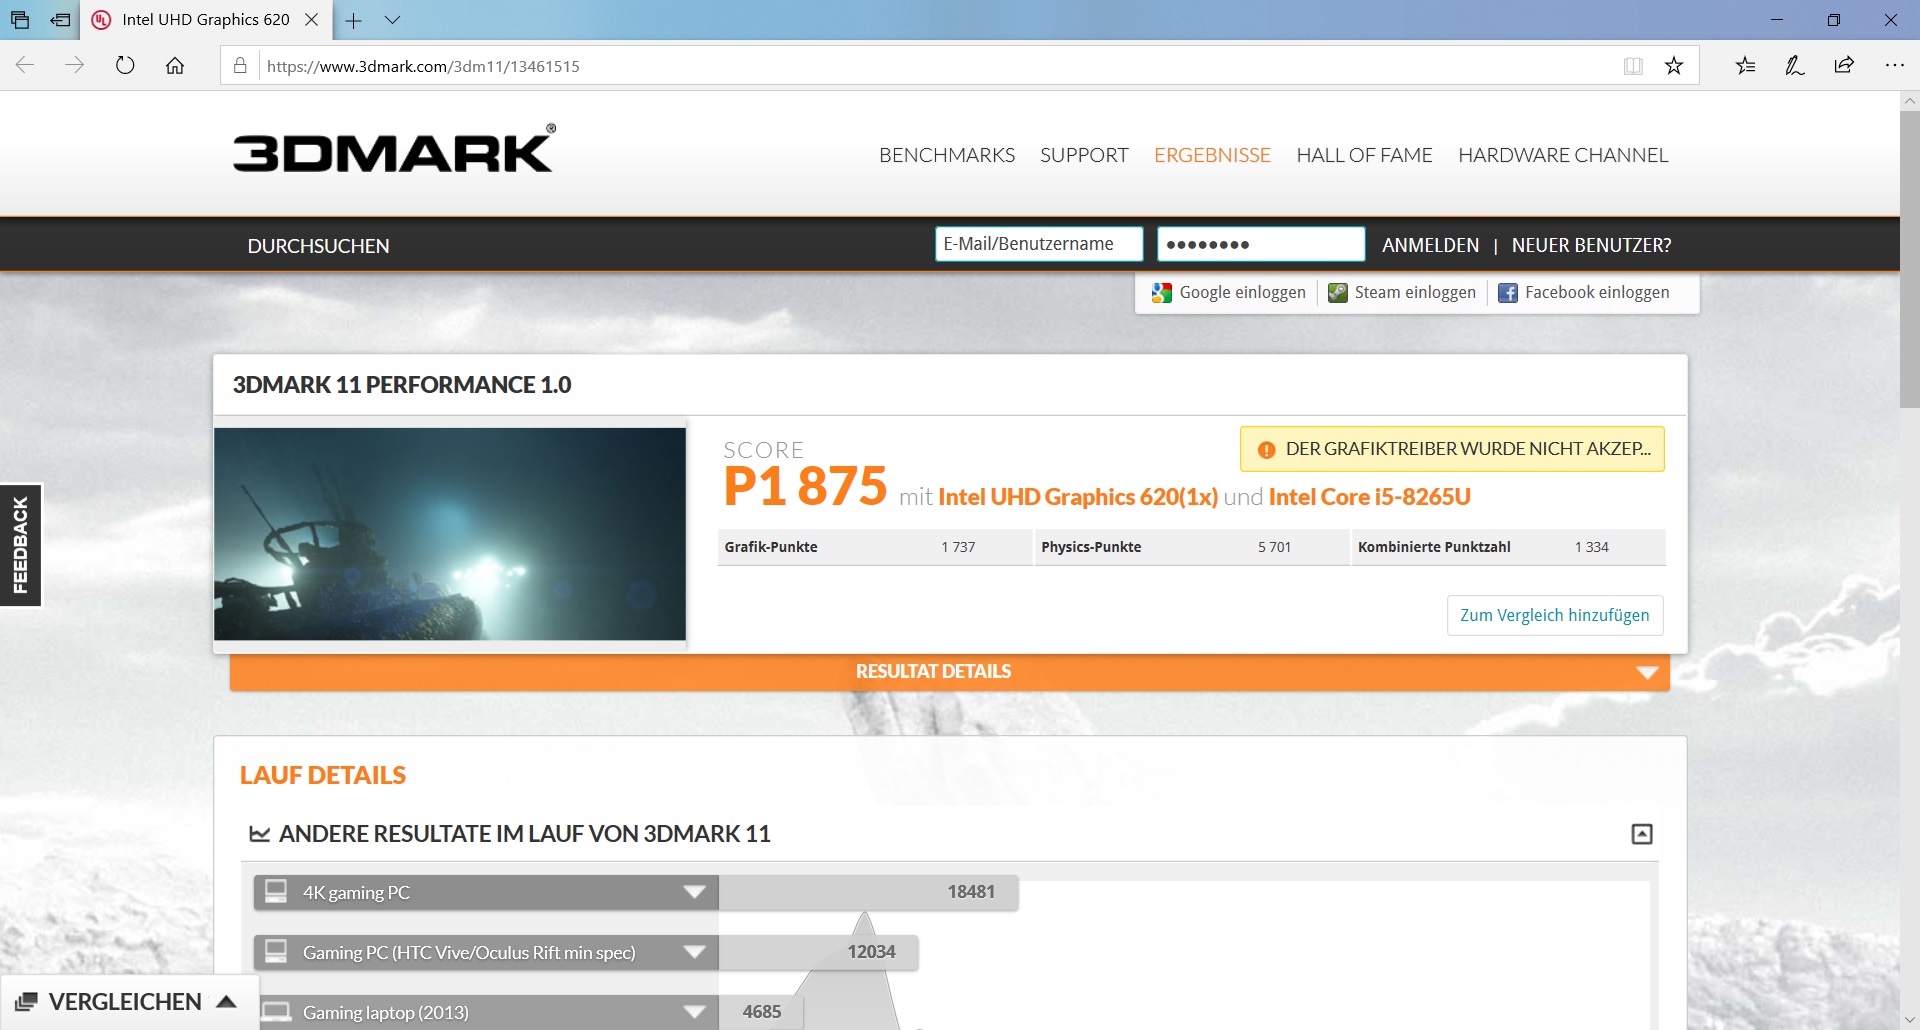
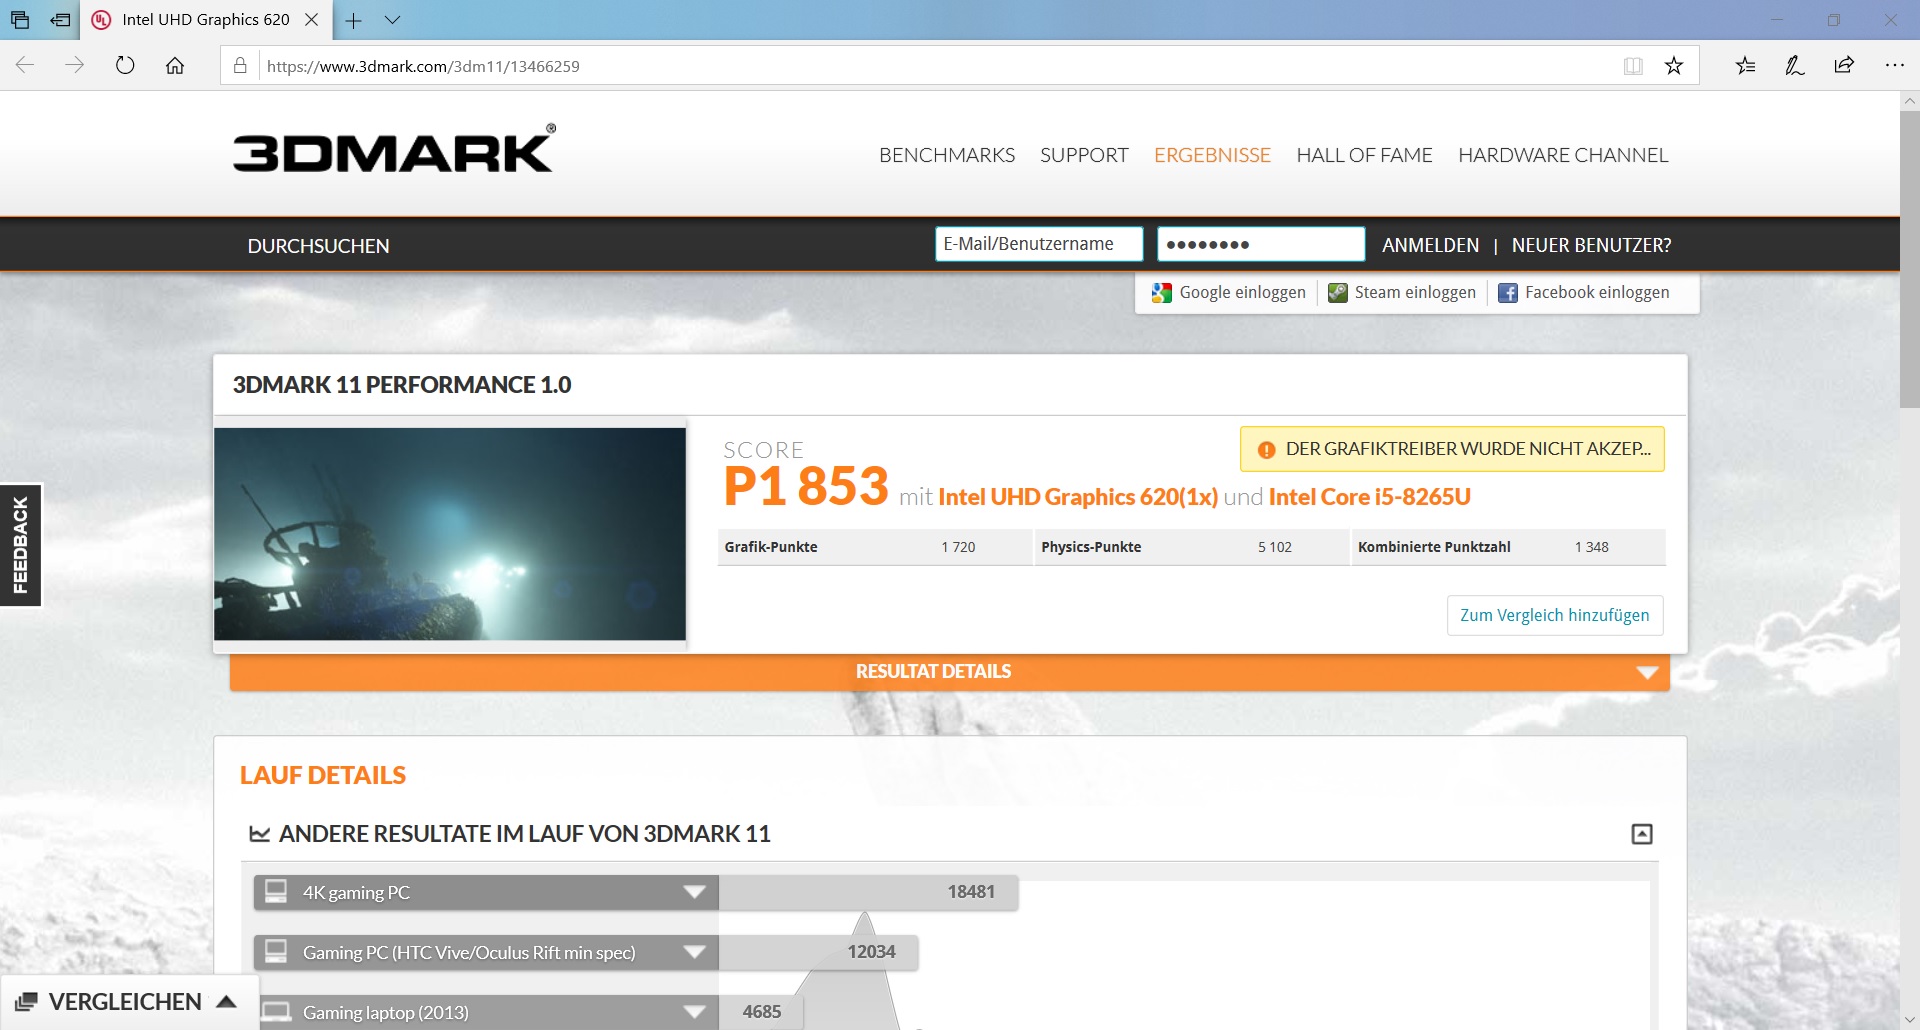
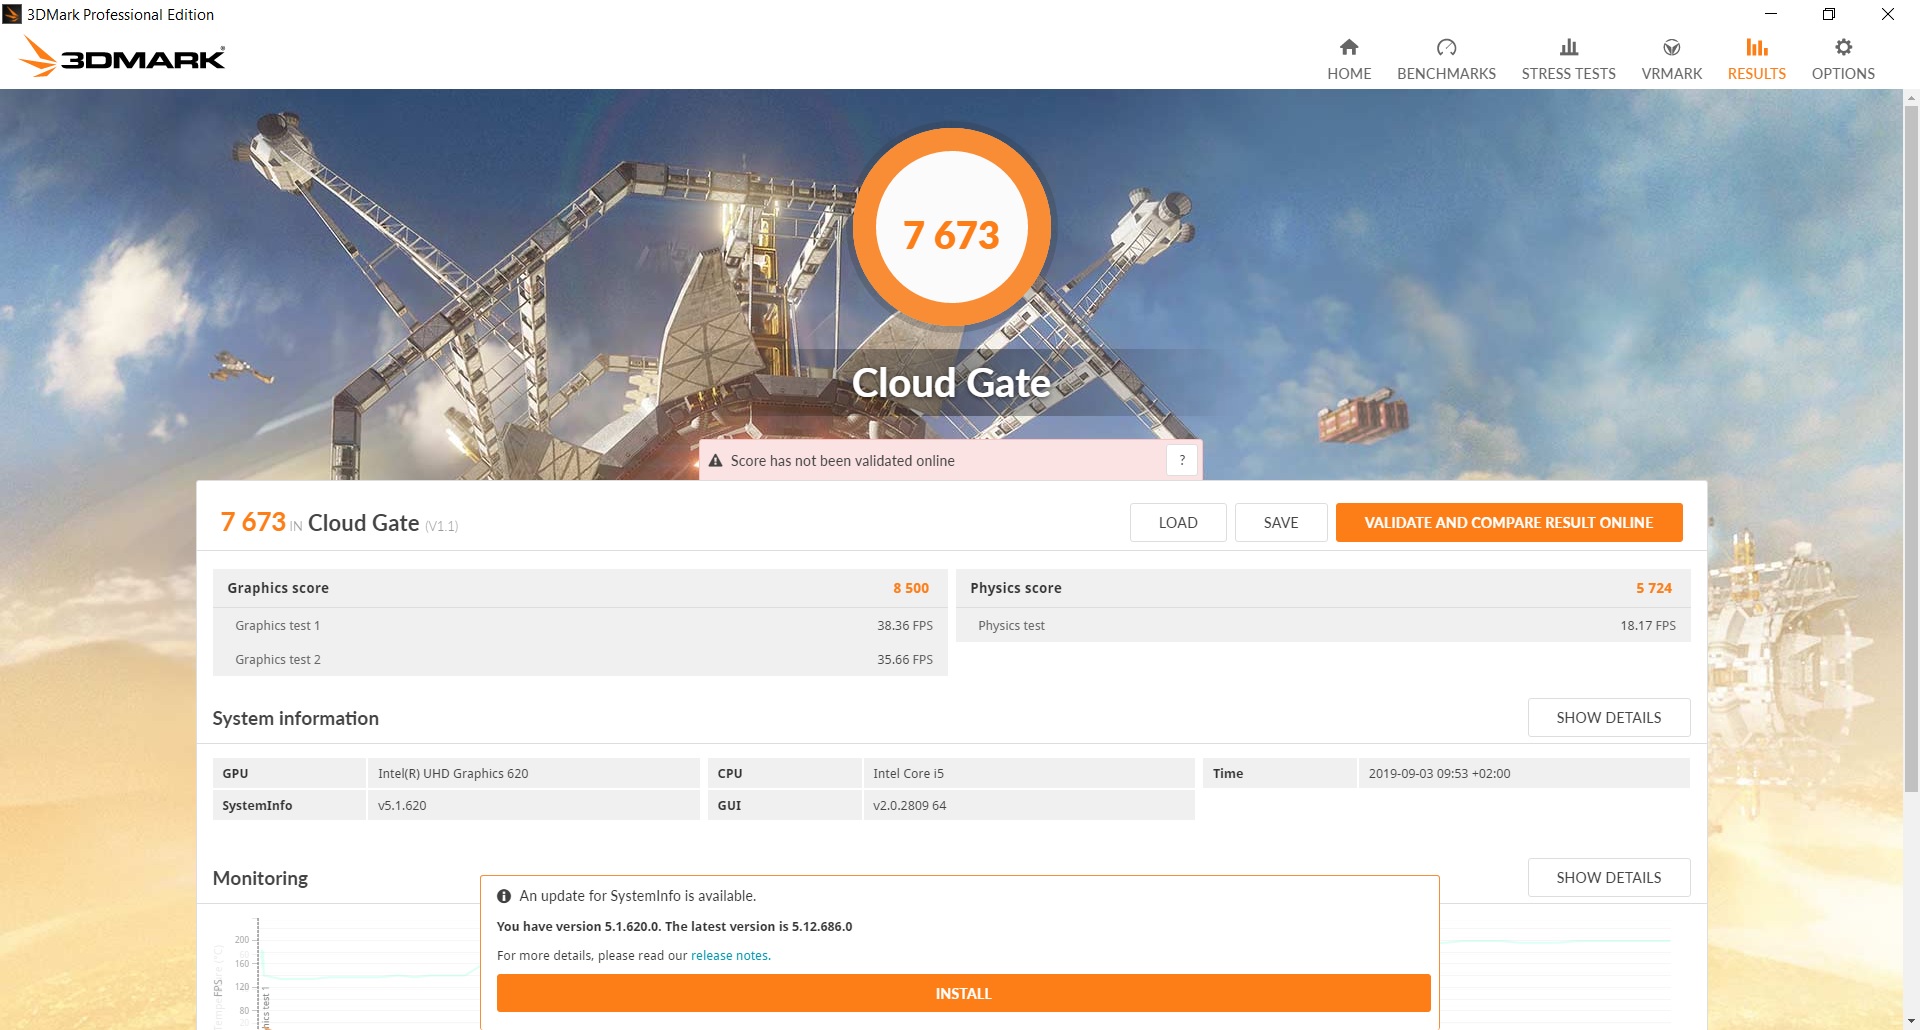
| 3DMark 11 Performance | 1875 points | |
| 3DMark Cloud Gate Standard Score | 7673 points | |
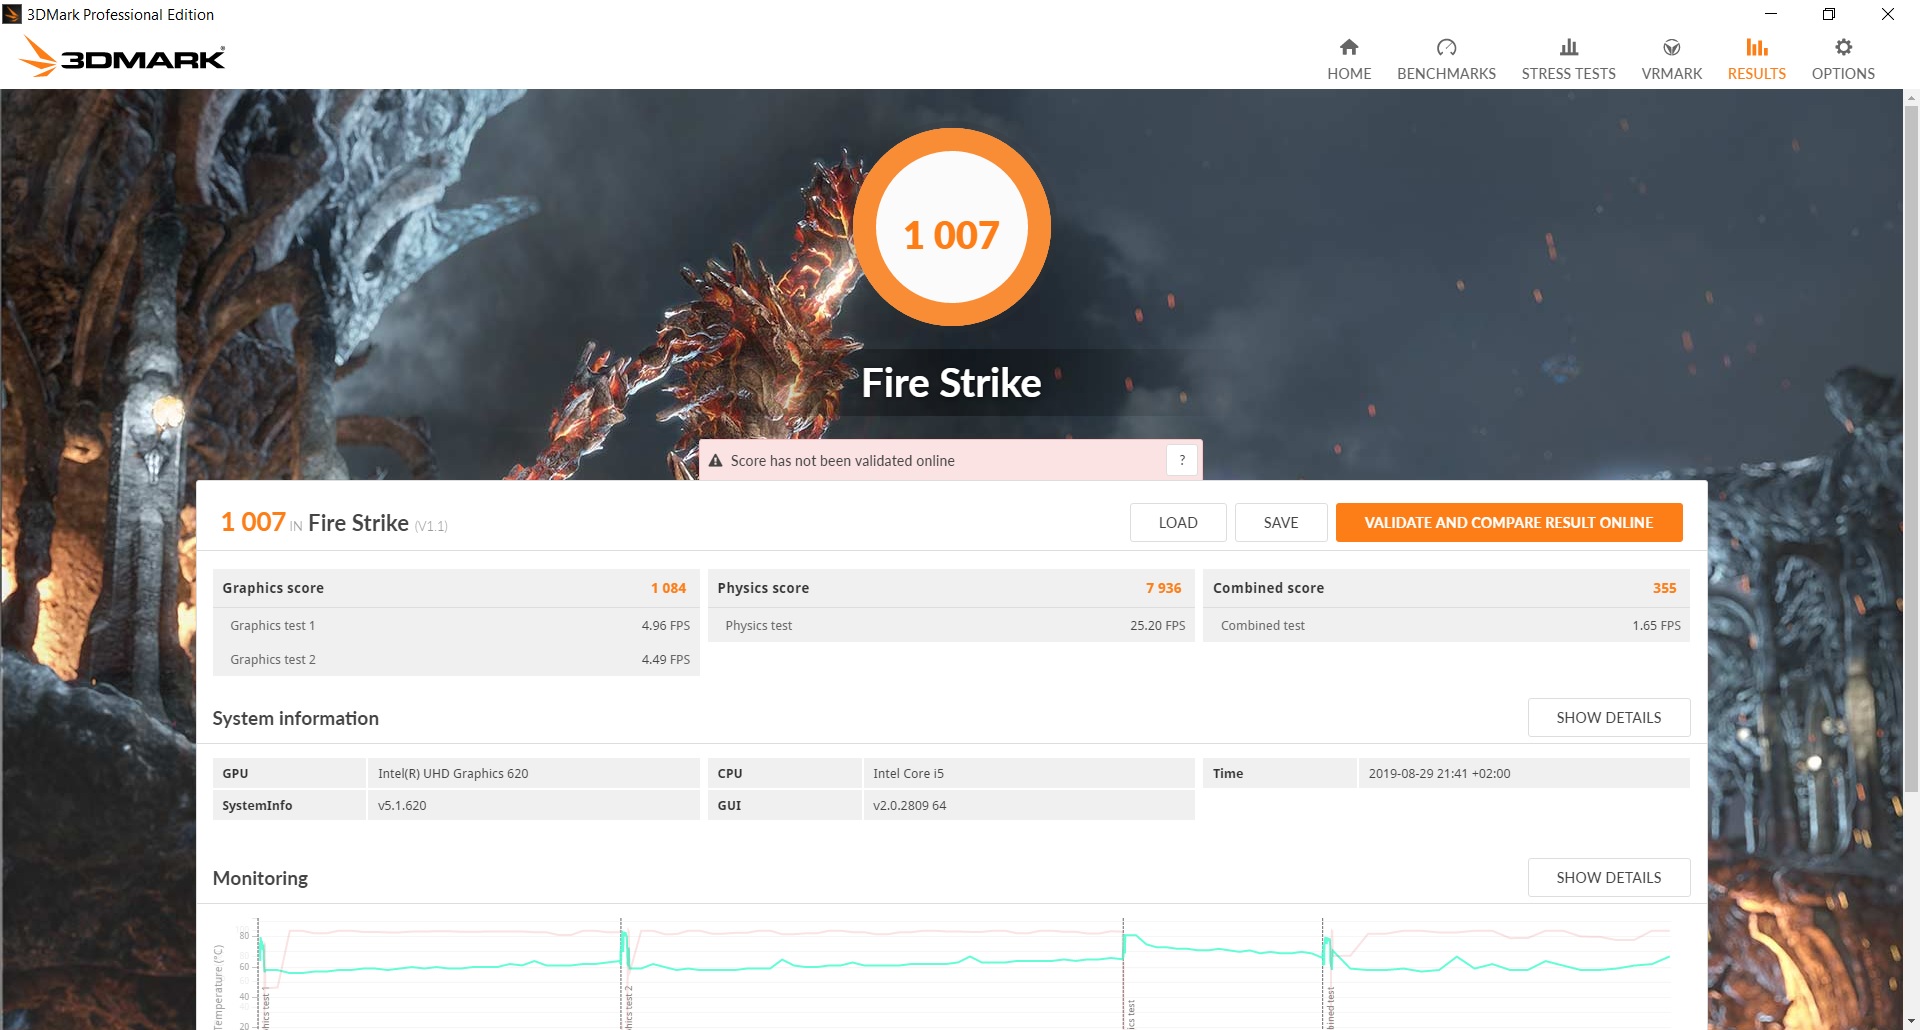
| 3DMark Fire Strike Score | 1007 points | |
Help | ||
Gaming performance
Gaming is of course not the intended purpose of the ThinkPad L490, but we will still compare the performance to the competition.
The L490 manages to come in about 5% ahead of its predecessor with the older "Bioshock Infinite" title. Otherwise, the competition is very close to each other; only the Schenker Slim 15 is about 40% faster.
The advantage of the Schenker Slim probably lies in its memory. 16 GB run in dual-channel mode here. Just like our L490, the remaining competition has to make do with single-channel RAM, which has a noticeable effect on gaming performance. However, less demanding or older titles are generally playable at low to medium resolutions and details. Newer titles should be ignored.
| low | med. | high | ultra | |
|---|---|---|---|---|
| BioShock Infinite (2013) | 49.23 | 30 | 24.26 | 7.8 |
| Dota 2 Reborn (2015) | 63 | 38.6 | 18 | 15.9 |
| X-Plane 11.11 (2018) | 23.5 | 16.1 | 14.6 |
Emissions - Quiet but...
Noise emissions
The ThinkPad is one of the quietest devices in direct comparison. The Schenker Slim, which has been praised for its performance, is 20% louder. It is clear that Lenovo wants to optimize its work device rather in the economy and low noise level direction than in the performance direction. And in principle, we also find this to be the right decision for an office laptop.
Lenovo could nonetheless further improve its cooling system since the fan behavior is relatively inconsistent. In this way, even under intense load, the fans go off in between in order to start again sometime later. A constant but in turn even quieter fan turning would possibly be better than the persistent change between being silent and turning up. Less temperature fluctuations would also be better for the CPU. Nevertheless, a quiet office laptop is always welcome.
| Lenovo ThinkPad L490 20Q6S08600 UHD Graphics 620, i5-8265U, Intel SSD Pro 7600p SSDPEKKF512G8L | Lenovo ThinkPad L480-20LS001AGE UHD Graphics 620, i5-8250U, Toshiba KXG5AZNV256G | Lenovo ThinkPad E490-20N8000RGE UHD Graphics 620, i5-8265U, SK hynix BC501 HFM256GDHTNG | Lenovo Flex 14IWL UHD Graphics 620, i5-8265U, Samsung SSD PM981 MZVLB256HAHQ | HP 250 G7 6HM85ES UHD Graphics 620, i5-8265U, WDC PC SN520 SDAPNUW-512G | Schenker Slim 15-RE-E19 UHD Graphics 620, i5-8265U, Samsung SSD 970 EVO Plus 500GB | |
|---|---|---|---|---|---|---|
| Noise | -8% | -1% | -5% | -9% | -20% | |
| off / environment * (dB) | 28.8 | 30.4 -6% | 29.4 -2% | 28.4 1% | 30.7 -7% | 30.4 -6% |
| Idle Minimum * (dB) | 28.8 | 30.4 -6% | 29.4 -2% | 28.4 1% | 30.9 -7% | 30.4 -6% |
| Idle Average * (dB) | 28.8 | 30.4 -6% | 29.4 -2% | 28.4 1% | 31.6 -10% | 30.4 -6% |
| Idle Maximum * (dB) | 28.8 | 30.4 -6% | 29.4 -2% | 29.1 -1% | 31.6 -10% | 31.6 -10% |
| Load Average * (dB) | 28.8 | 32.3 -12% | 30.2 -5% | 33.8 -17% | 34.3 -19% | 44.8 -56% |
| Load Maximum * (dB) | 33.6 | 37 -10% | 30.9 8% | 37.7 -12% | 33.8 -1% | 44.8 -33% |
* ... smaller is better
Noise level
| Idle |
| 28.8 / 28.8 / 28.8 dB(A) |
| Load |
| 28.8 / 33.6 dB(A) |
 | ||
30 dB silent 40 dB(A) audible 50 dB(A) loud |
||
min: | ||
Temperature
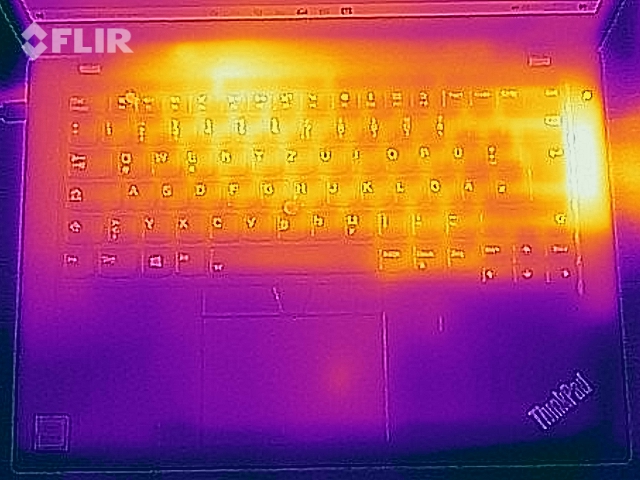
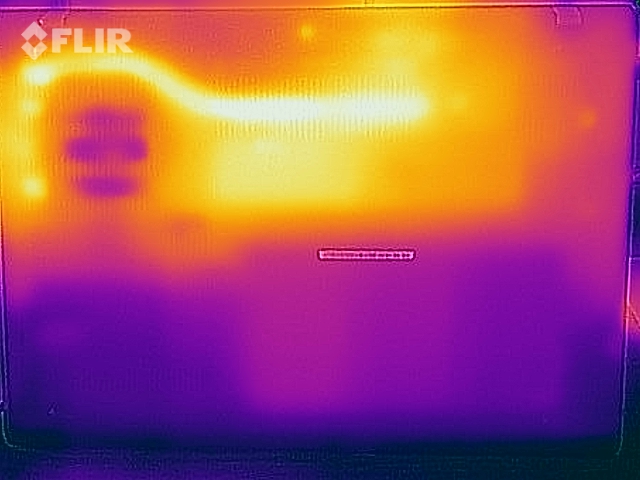
Alongside reduced performance, a conservative cooling system mostly results in another disadvantage in a laptop: Higher temperatures. The L490 is not able to escape this principle either. Although it remains partially cooler than the competition in idle usage, it becomes the hottest device in comparison under load. 46 ºC (~115 ºF) on the top and up to 47 ºC (~117 ºF) on the bottom are quite high for an office laptop.
At least the palm rest remains comparatively cool. The heat concentrates mainly on the right side and towards the display. It becomes noticeable here that the fans simply turn off at times, even under strong load.
(-) The maximum temperature on the upper side is 46.1 °C / 115 F, compared to the average of 34.3 °C / 94 F, ranging from 21.2 to 62.5 °C for the class Office.
(-) The bottom heats up to a maximum of 46.9 °C / 116 F, compared to the average of 36.8 °C / 98 F
(+) In idle usage, the average temperature for the upper side is 23.7 °C / 75 F, compared to the device average of 29.5 °C / 85 F.
(+) The palmrests and touchpad are cooler than skin temperature with a maximum of 25.4 °C / 77.7 F and are therefore cool to the touch.
(+) The average temperature of the palmrest area of similar devices was 27.5 °C / 81.5 F (+2.1 °C / 3.8 F).
| Lenovo ThinkPad L490 20Q6S08600 UHD Graphics 620, i5-8265U, Intel SSD Pro 7600p SSDPEKKF512G8L | Lenovo ThinkPad L480-20LS001AGE UHD Graphics 620, i5-8250U, Toshiba KXG5AZNV256G | Lenovo ThinkPad E490-20N8000RGE UHD Graphics 620, i5-8265U, SK hynix BC501 HFM256GDHTNG | Lenovo Flex 14IWL UHD Graphics 620, i5-8265U, Samsung SSD PM981 MZVLB256HAHQ | HP 250 G7 6HM85ES UHD Graphics 620, i5-8265U, WDC PC SN520 SDAPNUW-512G | Schenker Slim 15-RE-E19 UHD Graphics 620, i5-8265U, Samsung SSD 970 EVO Plus 500GB | |
|---|---|---|---|---|---|---|
| Heat | 2% | 4% | -10% | 7% | 2% | |
| Maximum Upper Side * (°C) | 46.1 | 43 7% | 39.9 13% | 37.6 18% | 35.1 24% | 40.3 13% |
| Maximum Bottom * (°C) | 46.9 | 41.7 11% | 45 4% | 45.8 2% | 42.4 10% | 47.1 -0% |
| Idle Upper Side * (°C) | 24.7 | 25.7 -4% | 24.7 -0% | 30 -21% | 25.4 -3% | 25 -1% |
| Idle Bottom * (°C) | 25.2 | 27.1 -8% | 25.8 -2% | 35.4 -40% | 25.8 -2% | 26.4 -5% |
* ... smaller is better
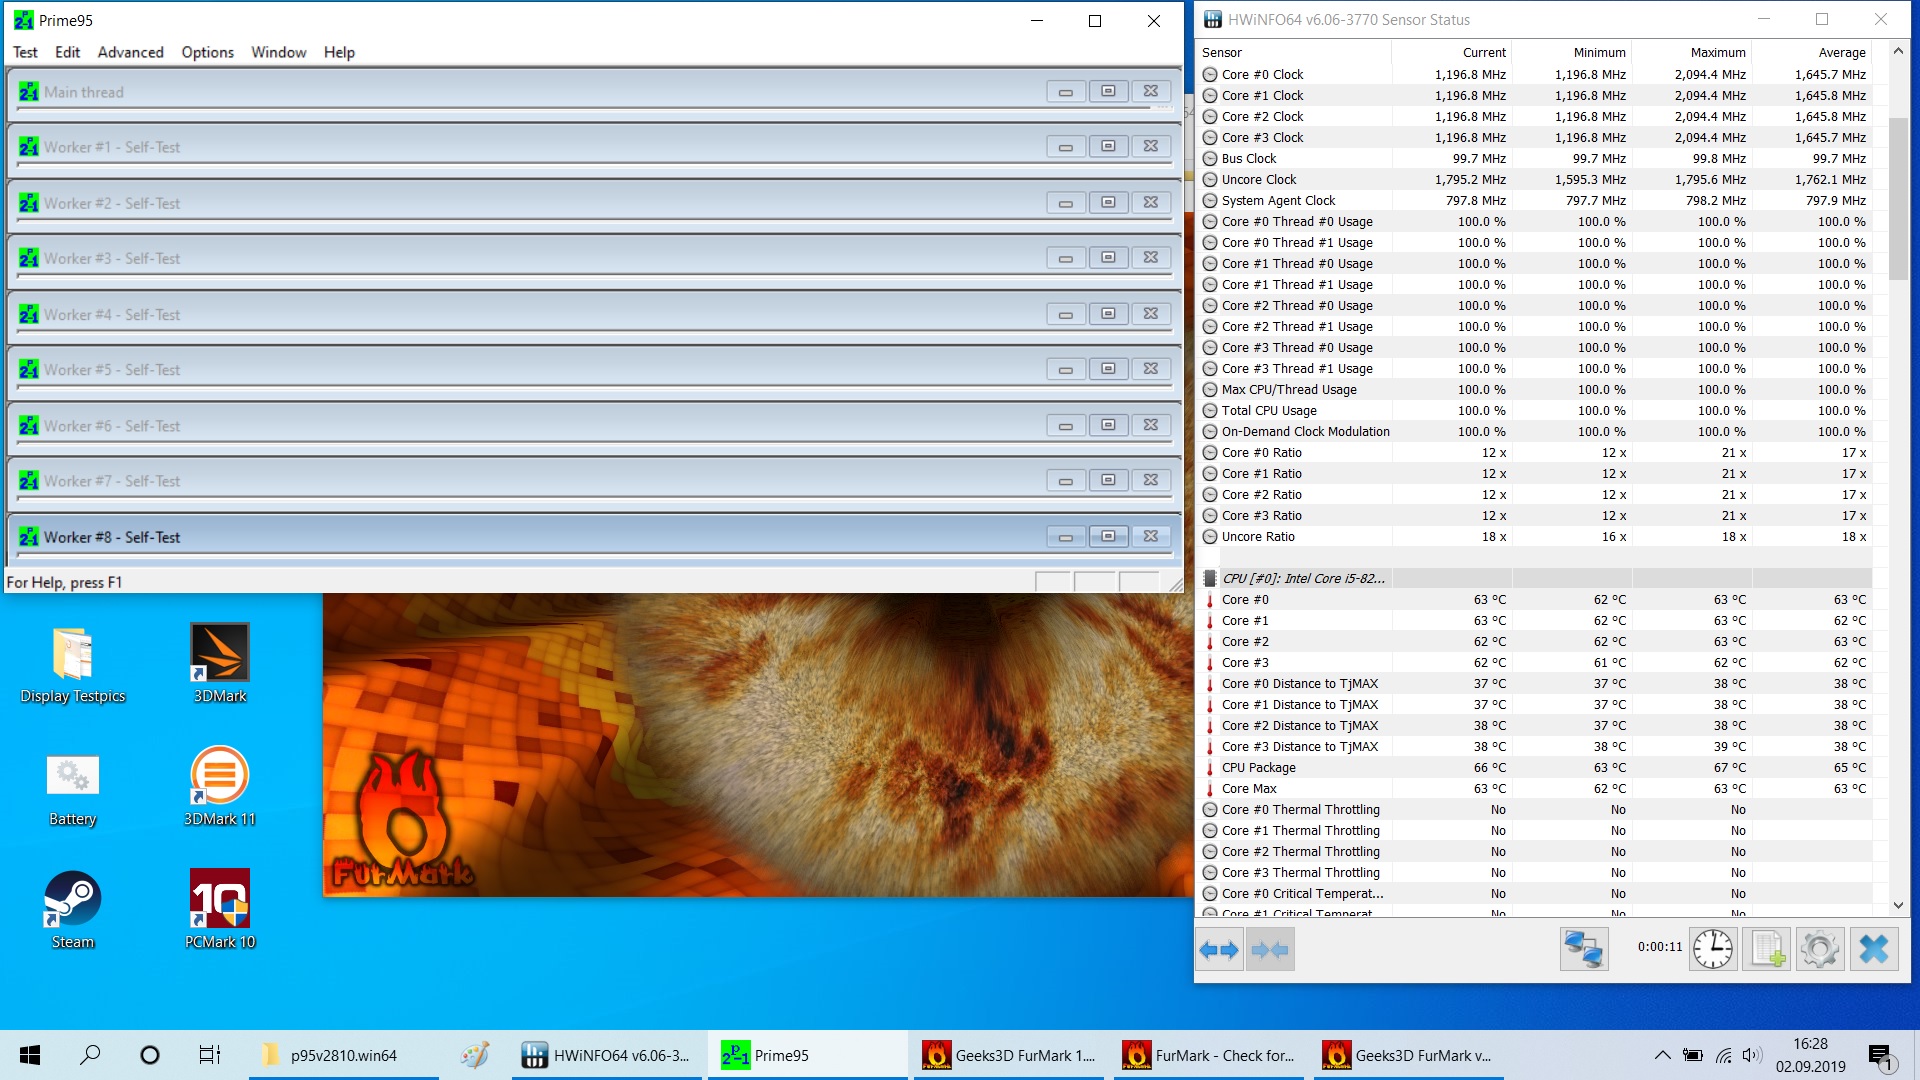
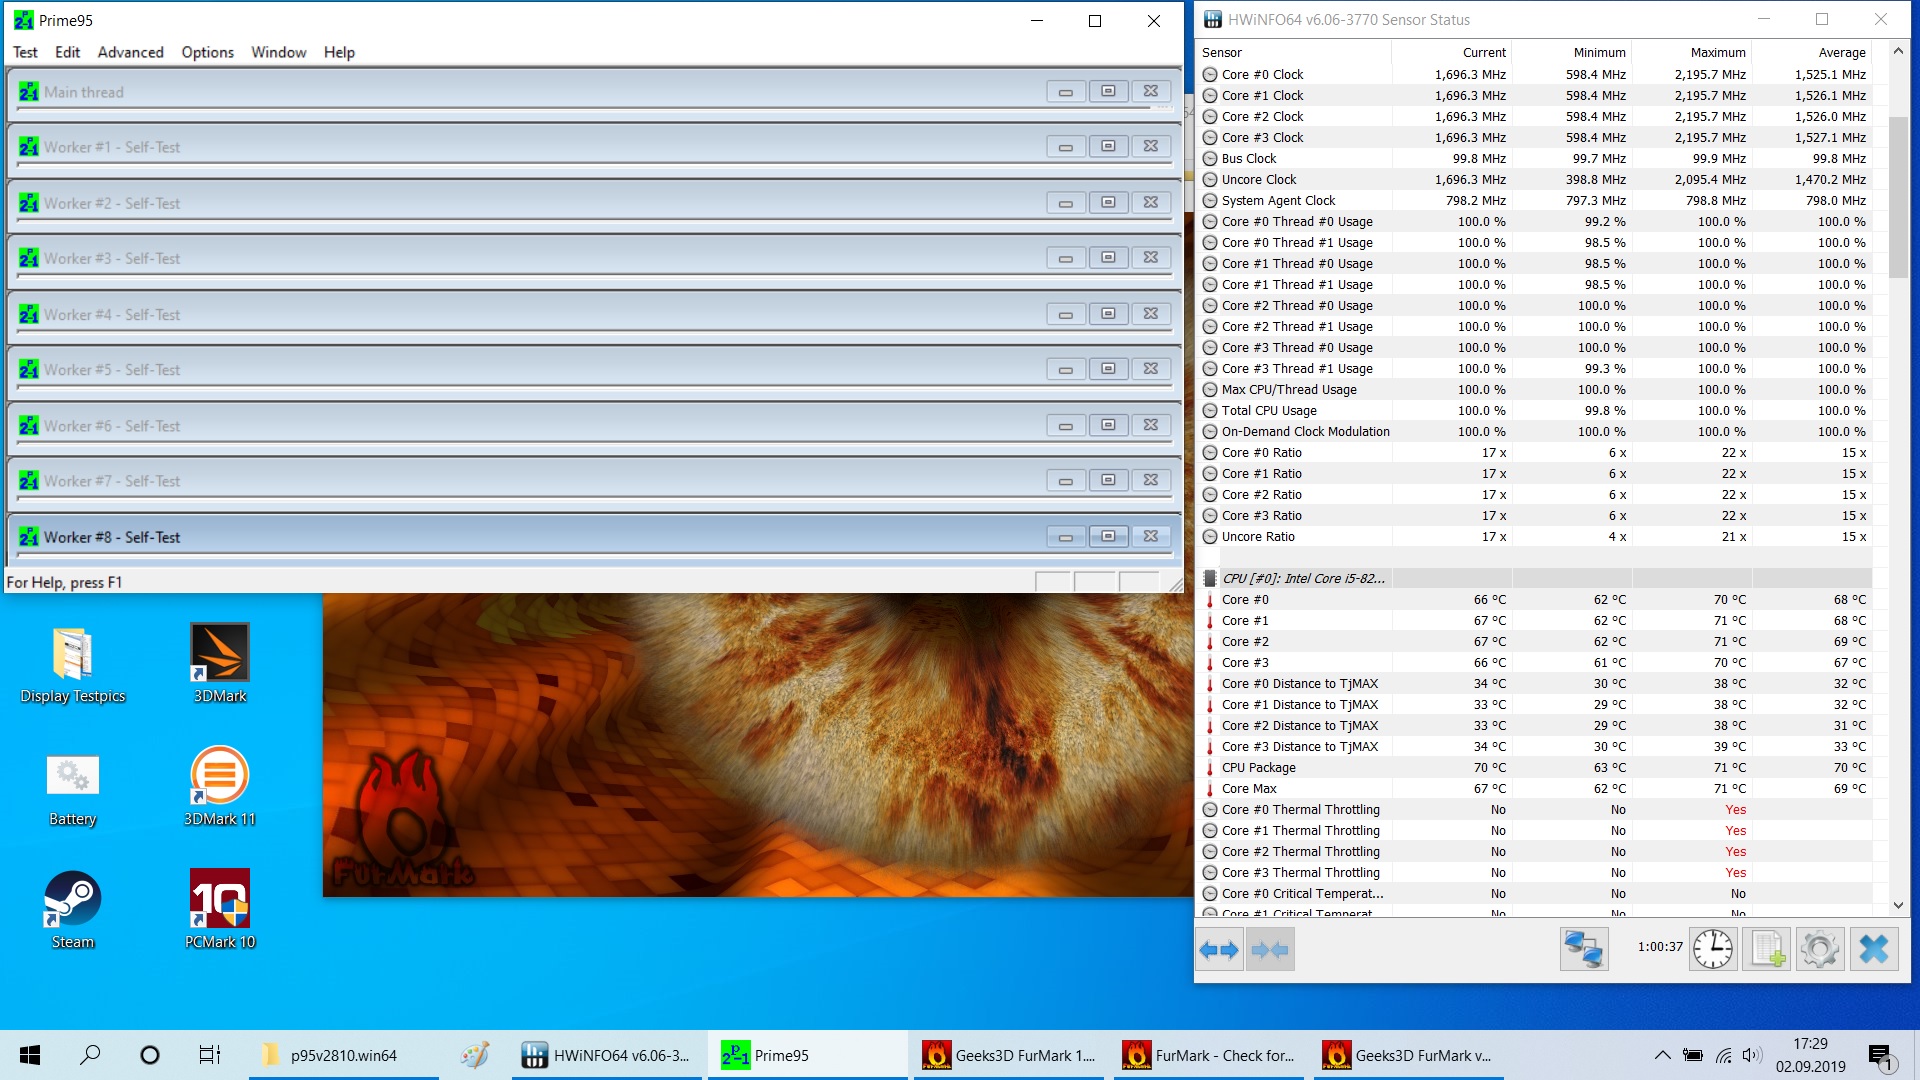
The L490 does not make any compromises during our one-hour stress test. Already at the beginning of the test, it has no problem with undercutting its base clock speed and consistently reducing performance for better noise levels and temperatures. At least things do not really go any further downhill in terms of performance, even after an hour. Although the clock speeds fluctuate between 600 MHz and 2.2 GHz, the average is about 1.5 GHz over the entire time.
The core temperatures level out at about 67 ºC (~153 ºF). This is far from critical temperatures so that there is clearly performance potential that is being wasted here. This is another reason why an update of the fan behavior and a related adjustment of the clock speed limit would be desirable.
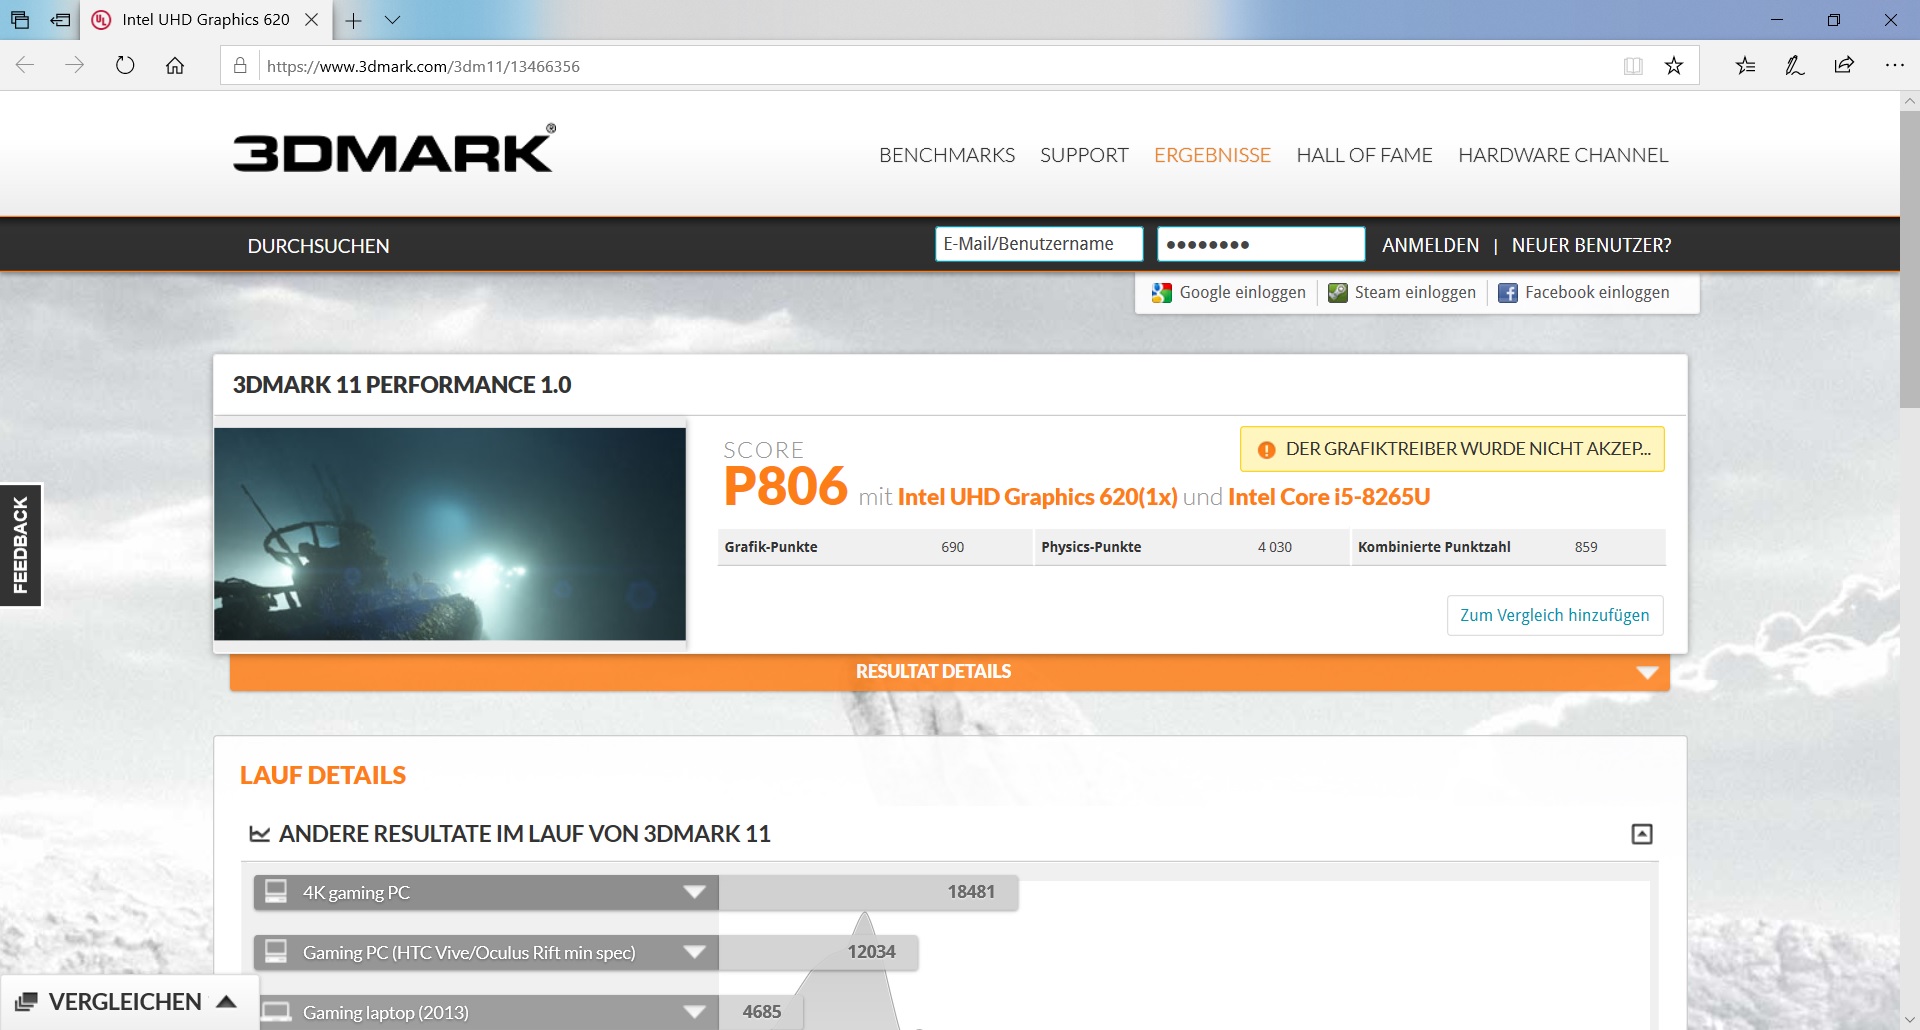
If 3DMark 11 is conducted once again right after the stress test, there is not much left of the original performance. There is only enough for 43% of the power output, and the L490 loses a whole 57% of performance according to this.
Speakers
The stereo speakers of the L490 produce an average sound. At least both the high and mid tones are quite uniform, but naturally, as is typical for this class, the audio system lacks any bass. The maximum volume is rather below-average. A combined audio port in the jack format is available for the connection of headphones or an external system.
Lenovo ThinkPad L490 20Q6S08600 audio analysis
(±) | speaker loudness is average but good (74.7 dB)
Bass 100 - 315 Hz
(-) | nearly no bass - on average 25.7% lower than median
(±) | linearity of bass is average (12.2% delta to prev. frequency)
Mids 400 - 2000 Hz
(+) | balanced mids - only 2.9% away from median
(±) | linearity of mids is average (8.6% delta to prev. frequency)
Highs 2 - 16 kHz
(+) | balanced highs - only 3% away from median
(+) | highs are linear (4.8% delta to prev. frequency)
Overall 100 - 16.000 Hz
(±) | linearity of overall sound is average (23.4% difference to median)
Compared to same class
» 65% of all tested devices in this class were better, 8% similar, 27% worse
» The best had a delta of 7%, average was 21%, worst was 53%
Compared to all devices tested
» 70% of all tested devices were better, 6% similar, 24% worse
» The best had a delta of 4%, average was 24%, worst was 134%
Lenovo ThinkPad L480-20LS001AGE audio analysis
(-) | not very loud speakers (68.3 dB)
Bass 100 - 315 Hz
(-) | nearly no bass - on average 21.3% lower than median
(±) | linearity of bass is average (10.9% delta to prev. frequency)
Mids 400 - 2000 Hz
(+) | balanced mids - only 4.2% away from median
(±) | linearity of mids is average (14% delta to prev. frequency)
Highs 2 - 16 kHz
(+) | balanced highs - only 2.6% away from median
(±) | linearity of highs is average (9.1% delta to prev. frequency)
Overall 100 - 16.000 Hz
(±) | linearity of overall sound is average (24.3% difference to median)
Compared to same class
» 71% of all tested devices in this class were better, 8% similar, 22% worse
» The best had a delta of 7%, average was 21%, worst was 53%
Compared to all devices tested
» 74% of all tested devices were better, 6% similar, 21% worse
» The best had a delta of 4%, average was 24%, worst was 134%
Energy management - Long-lasting Lenovo PC
Energy consumption
The energy requirement has remained about the same in comparison to the predecessor, but the focus has changed. The L490 now consumes significantly less under average load, but it sacrifices some economy in idle usage in return. The E490 sibling model is overall about 10% more economical with somewhat similar performance. The L490 remains considerably more economical overall than its class average though.
We measure short load spikes of around 42 watts. Since the power adapter has a capacity of 65 watts, it should be able to charge the laptop reliably at all times.
| Off / Standby | |
| Idle | |
| Load |
|
Key:
min: | |
| Lenovo ThinkPad L490 20Q6S08600 i5-8265U, UHD Graphics 620, Intel SSD Pro 7600p SSDPEKKF512G8L, IPS, 1920x1080, 14" | Lenovo ThinkPad L480-20LS001AGE i5-8250U, UHD Graphics 620, Toshiba KXG5AZNV256G, IPS, 1920x1080, 14" | Lenovo ThinkPad E490-20N8000RGE i5-8265U, UHD Graphics 620, SK hynix BC501 HFM256GDHTNG, IPS, 1920x1080, 14" | Lenovo Flex 14IWL i5-8265U, UHD Graphics 620, Samsung SSD PM981 MZVLB256HAHQ, IPS, 1920x1080, 14" | HP 250 G7 6HM85ES i5-8265U, UHD Graphics 620, WDC PC SN520 SDAPNUW-512G, TN, 1920x1080, 15.6" | Schenker Slim 15-RE-E19 i5-8265U, UHD Graphics 620, Samsung SSD 970 EVO Plus 500GB, IPS, 2x1, 15.6" | Average Intel UHD Graphics 620 | Average of class Office | |
|---|---|---|---|---|---|---|---|---|
| Power Consumption | -3% | 10% | -78% | 6% | -7% | -11% | -29% | |
| Idle Minimum * (Watt) | 3.5 | 3.3 6% | 2.76 21% | 9.4 -169% | 3.2 9% | 3.2 9% | 3.81 ? -9% | 4.44 ? -27% |
| Idle Average * (Watt) | 6.3 | 6.6 -5% | 5.96 5% | 13.3 -111% | 5.7 10% | 6.5 -3% | 6.94 ? -10% | 7.38 ? -17% |
| Idle Maximum * (Watt) | 8.7 | 7.3 16% | 6.57 24% | 13.9 -60% | 6.1 30% | 11.3 -30% | 8.75 ? -1% | 8.59 ? 1% |
| Load Average * (Watt) | 28.7 | 40.4 -41% | 28.2 2% | 39.7 -38% | 36.5 -27% | 32 -11% | 35 ? -22% | 43 ? -50% |
| Load Maximum * (Watt) | 41.8 | 37.4 11% | 43.6 -4% | 46.5 -11% | 37.5 10% | 42.2 -1% | 47.5 ? -14% | 64.5 ? -54% |
* ... smaller is better
Battery life
Battery life has improved in contrast to the one of the predecessor; by about 15% on average. At the same time the L490 shows almost identical results to the smaller E490. With almost 8 hours in the Wi-Fi test and about 11 hours in the video test, both models sit at the top of the comparison devices in the practical procedures. The competition lasts 11% (Lenovo Flex) to 44% (Schenker Slim) less. The class average (-27%) is also clearly surpassed. In this respect, we can attest good battery life for the ThinkPad.
| Lenovo ThinkPad L490 20Q6S08600 i5-8265U, UHD Graphics 620, 45 Wh | Lenovo ThinkPad L480-20LS001AGE i5-8250U, UHD Graphics 620, 45 Wh | Lenovo ThinkPad E490-20N8000RGE i5-8265U, UHD Graphics 620, 45 Wh | Lenovo Flex 14IWL i5-8265U, UHD Graphics 620, 45 Wh | HP 250 G7 6HM85ES i5-8265U, UHD Graphics 620, 41 Wh | Schenker Slim 15-RE-E19 i5-8265U, UHD Graphics 620, 36 Wh | Average of class Office | |
|---|---|---|---|---|---|---|---|
| Battery runtime | -15% | 2% | -11% | -28% | -43% | 30% | |
| Reader / Idle (h) | 18.6 | 16.9 -9% | 17.7 -5% | 13.6 -27% | 13.9 -25% | 23.7 ? 27% | |
| H.264 (h) | 11.1 | 8 -28% | 11.5 4% | 7.1 -36% | 15 ? 35% | ||
| WiFi v1.3 (h) | 7.9 | 7.7 -3% | 8.1 3% | 10.4 32% | 5.7 -28% | 4.5 -43% | 12.9 ? 63% |
| Load (h) | 1.9 | 1.5 -21% | 2 5% | 1.2 -37% | 1.5 -21% | 1.807 ? -5% |
Pros
Cons
Verdict - Stronger or weaker than the L480?
As an office and work computer, Lenovo continues to do little wrong with the ThinkPad L490. Writing with the keyboard is still fast and pleasant, and the working speed is decent overall.
However, you need to take a look at the details so as not to perceive this year's hardware update as something superfluous. Since the evident alterations - namely the new display and the Whiskey Lake processor - did not turn out as desired. The CPU is throttled and therefore slower than Kaby Lake in the predecessor. The display exchanges a bit more brightness for a weaker contrast and black value.
On the other hand, Lenovo is finally including a faster SSD, Bluetooth 5 is now on board, and the mobile computer is usually comfortably quiet or even silent. We did not quite like the cooling system though; it repeatedly indulges in taking breaks, even under intense load. But the pleasant, sadly only temporary, silence happens at the expense of performance and makes for highly fluctuating core temperatures.
The Lenovo ThinkPad L490 continues to impress as a very good office laptop. Its input devices, the good battery life and finally also a faster SSD make the laptop a capable work computer for companies, students and anyone else who deals with writing and the web.
But it is actually not easy at all to pronounce a clear purchase recommendation since on the one hand, the L490 sets itself apart from the predecessor with too little benefits, and on the other hand, it is very close to the E490. With the latter, those who can do without an ExpressCard slot will get the considerably brighter and contrast-richer display with about the same performance and an equally good battery life at a presumably more favorable price, at least outside the special discount for students. For 699 Euros (~$771), the latter can pull the purchase trigger without hesitation.
Lenovo ThinkPad L490 20Q6S08600
- 09/04/2019 v7 (old)
Christian Hintze
Price comparison
