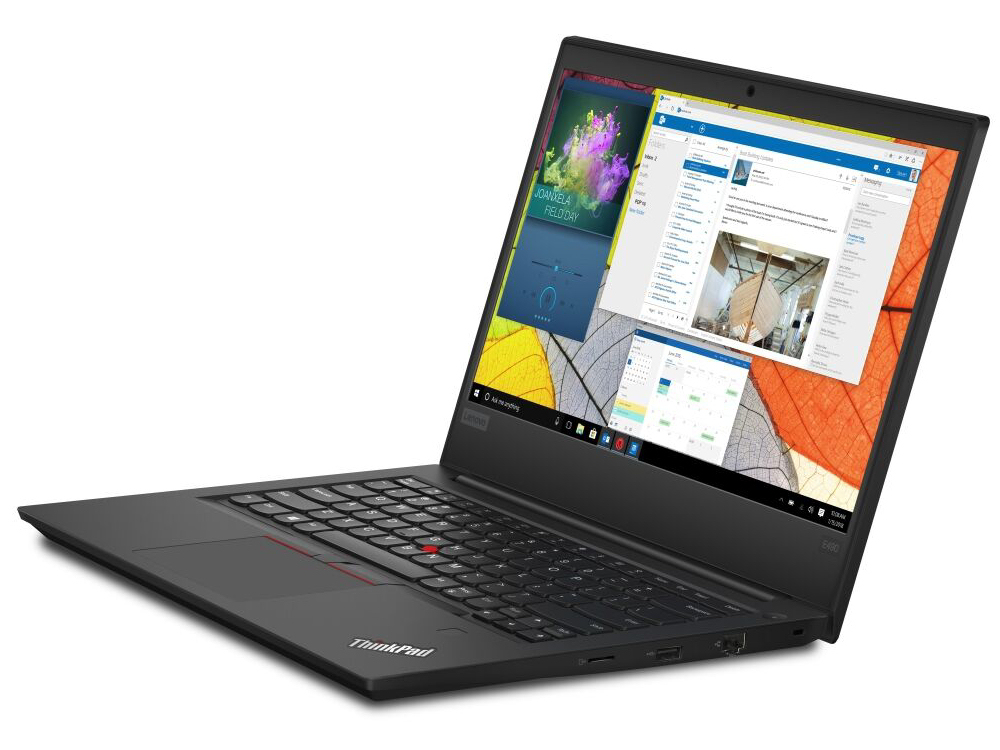
Lenovo ThinkPad E490 (i5-8265U, SSD, FHD) Laptop Review

The ThinkPad E series from Lenovo represents an affordable entry into the world of business notebooks. With the ThinkPad E490 we have a current 14-inch model of the series in our test lab. Externally, the E490 shows no changes to the preceding generation. The only changes are inside, where the E490 models are equipped with Whiskey Lake processors (predecessor: Kaby Lake). Our test unit does not have a dedicated graphics card. The review of a correspondingly equipped sibling model will follow shortly. The ThinkPad does not lack competitors, and we can mention the HP ProBook 440 G6 and 445 G6, the Dell Latitude 3490, and the Acer TravelMate P2410-G2 here.
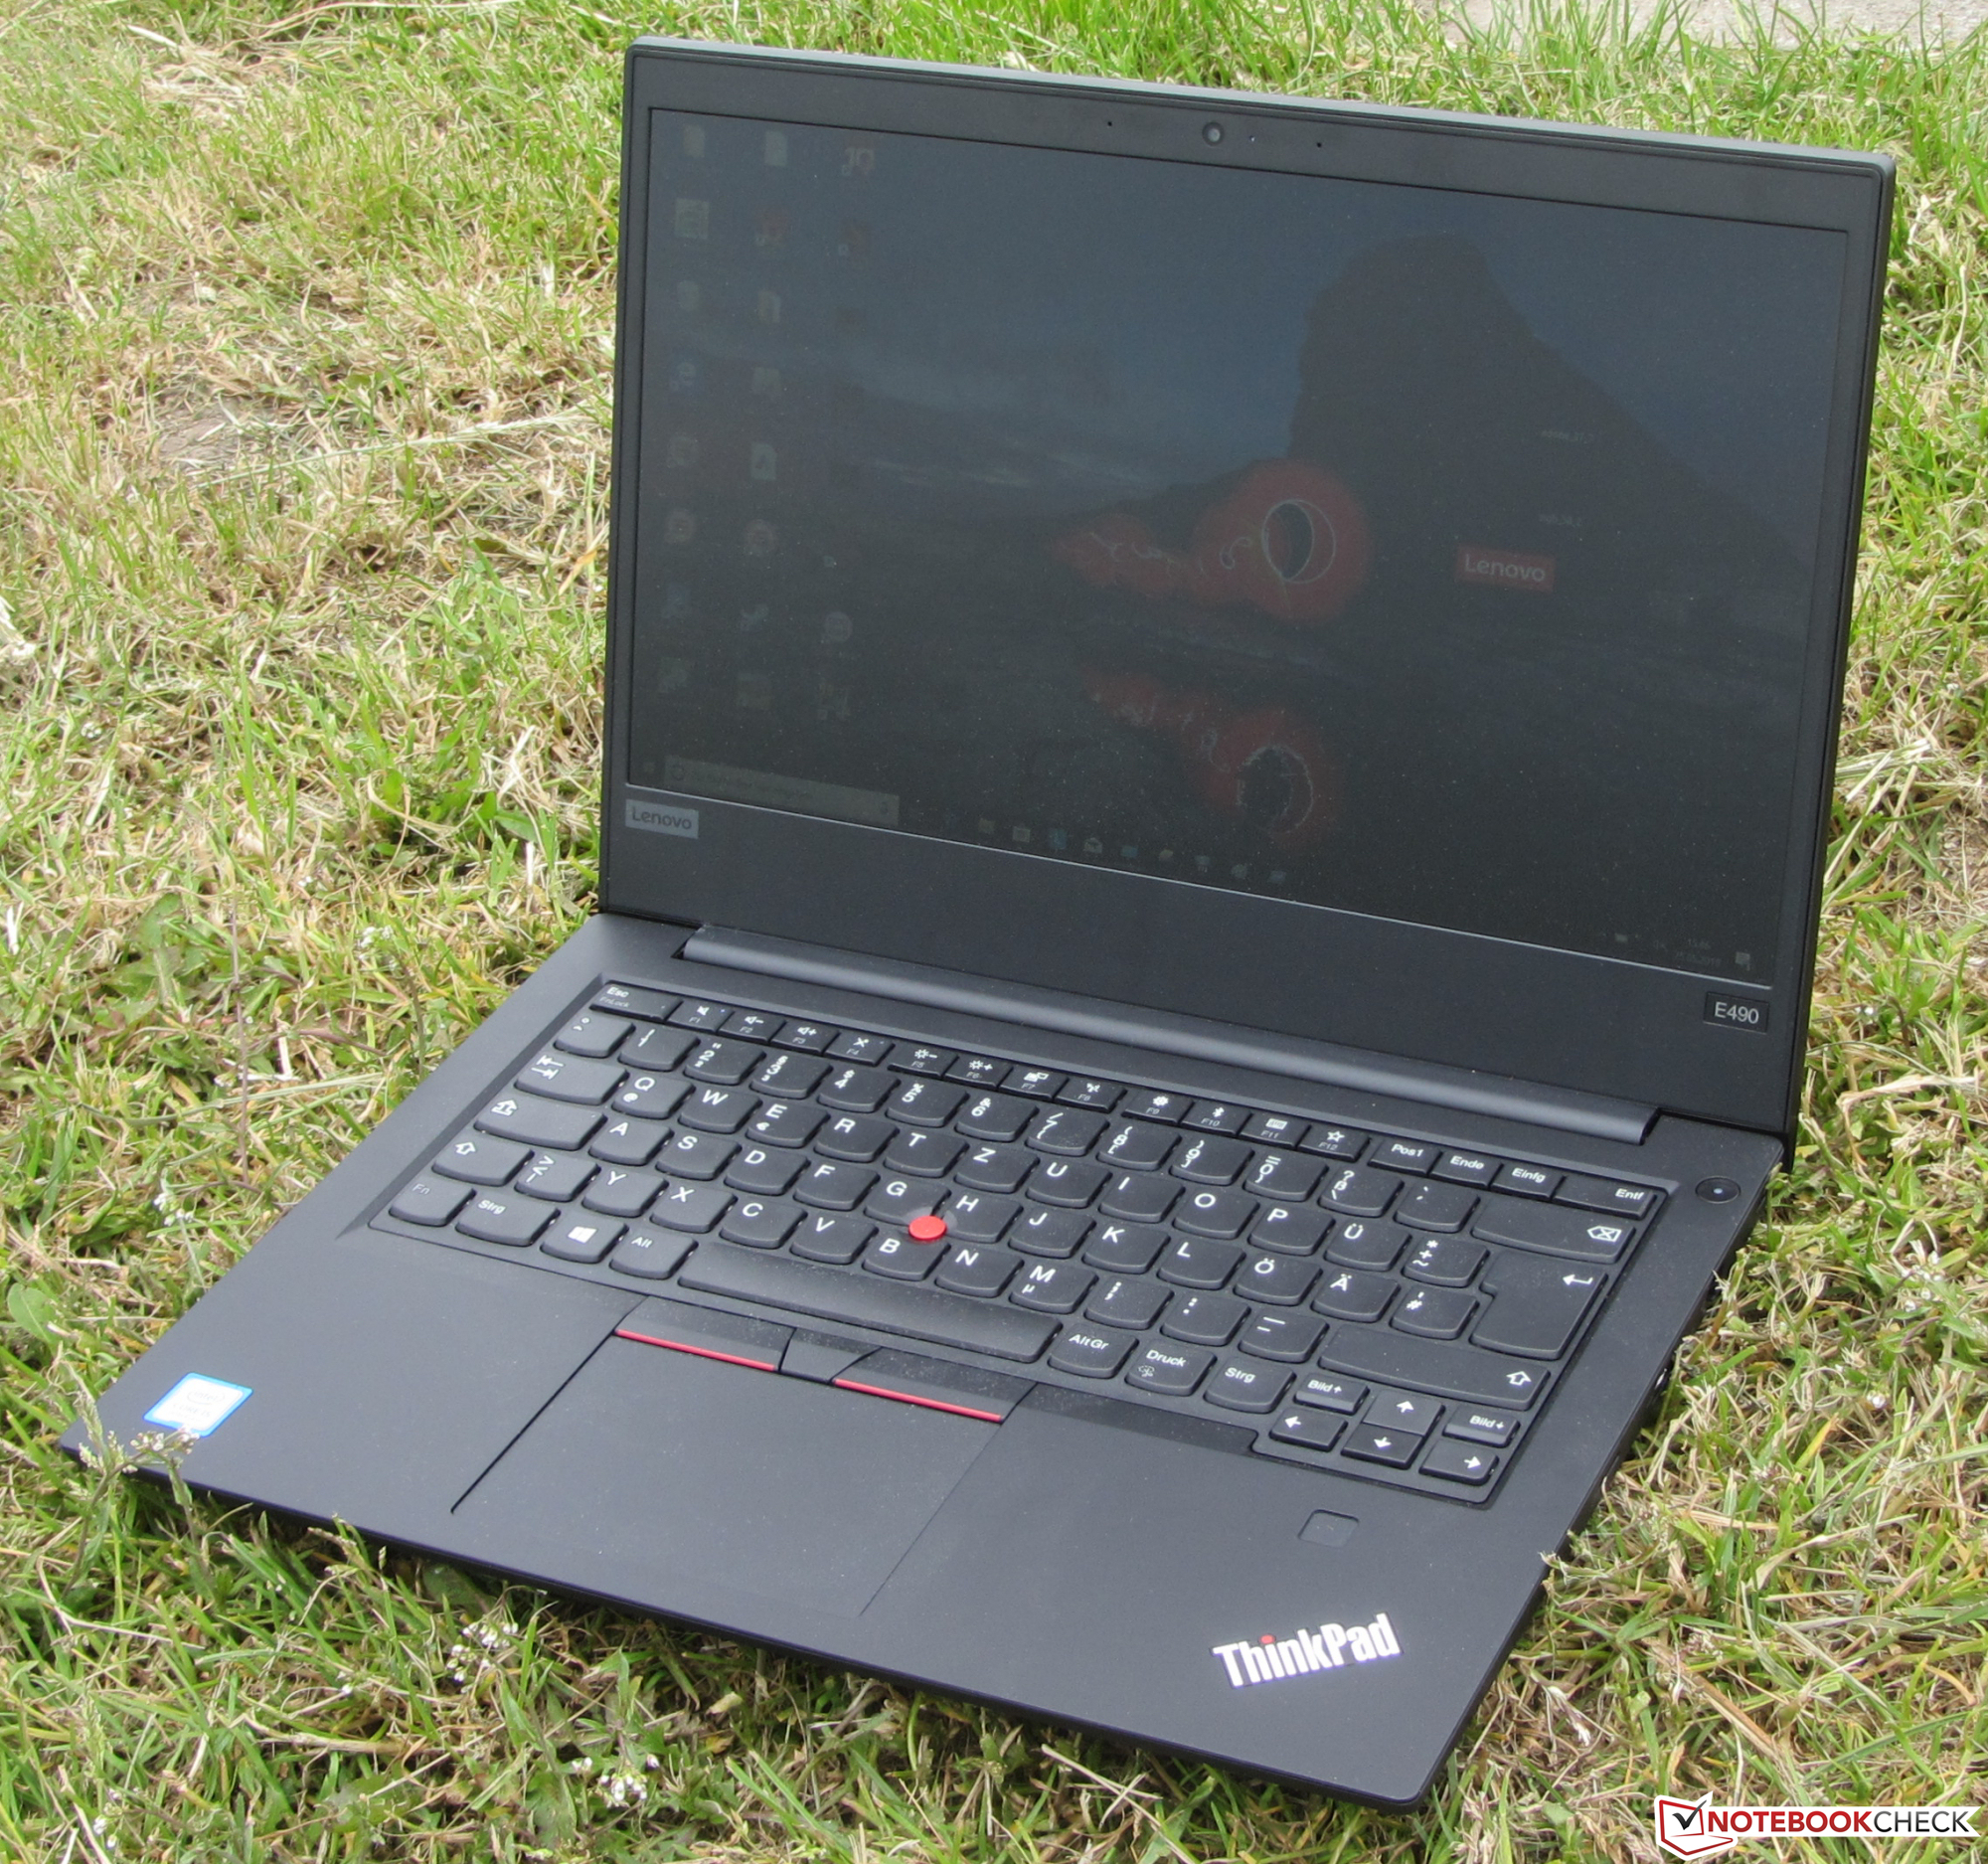
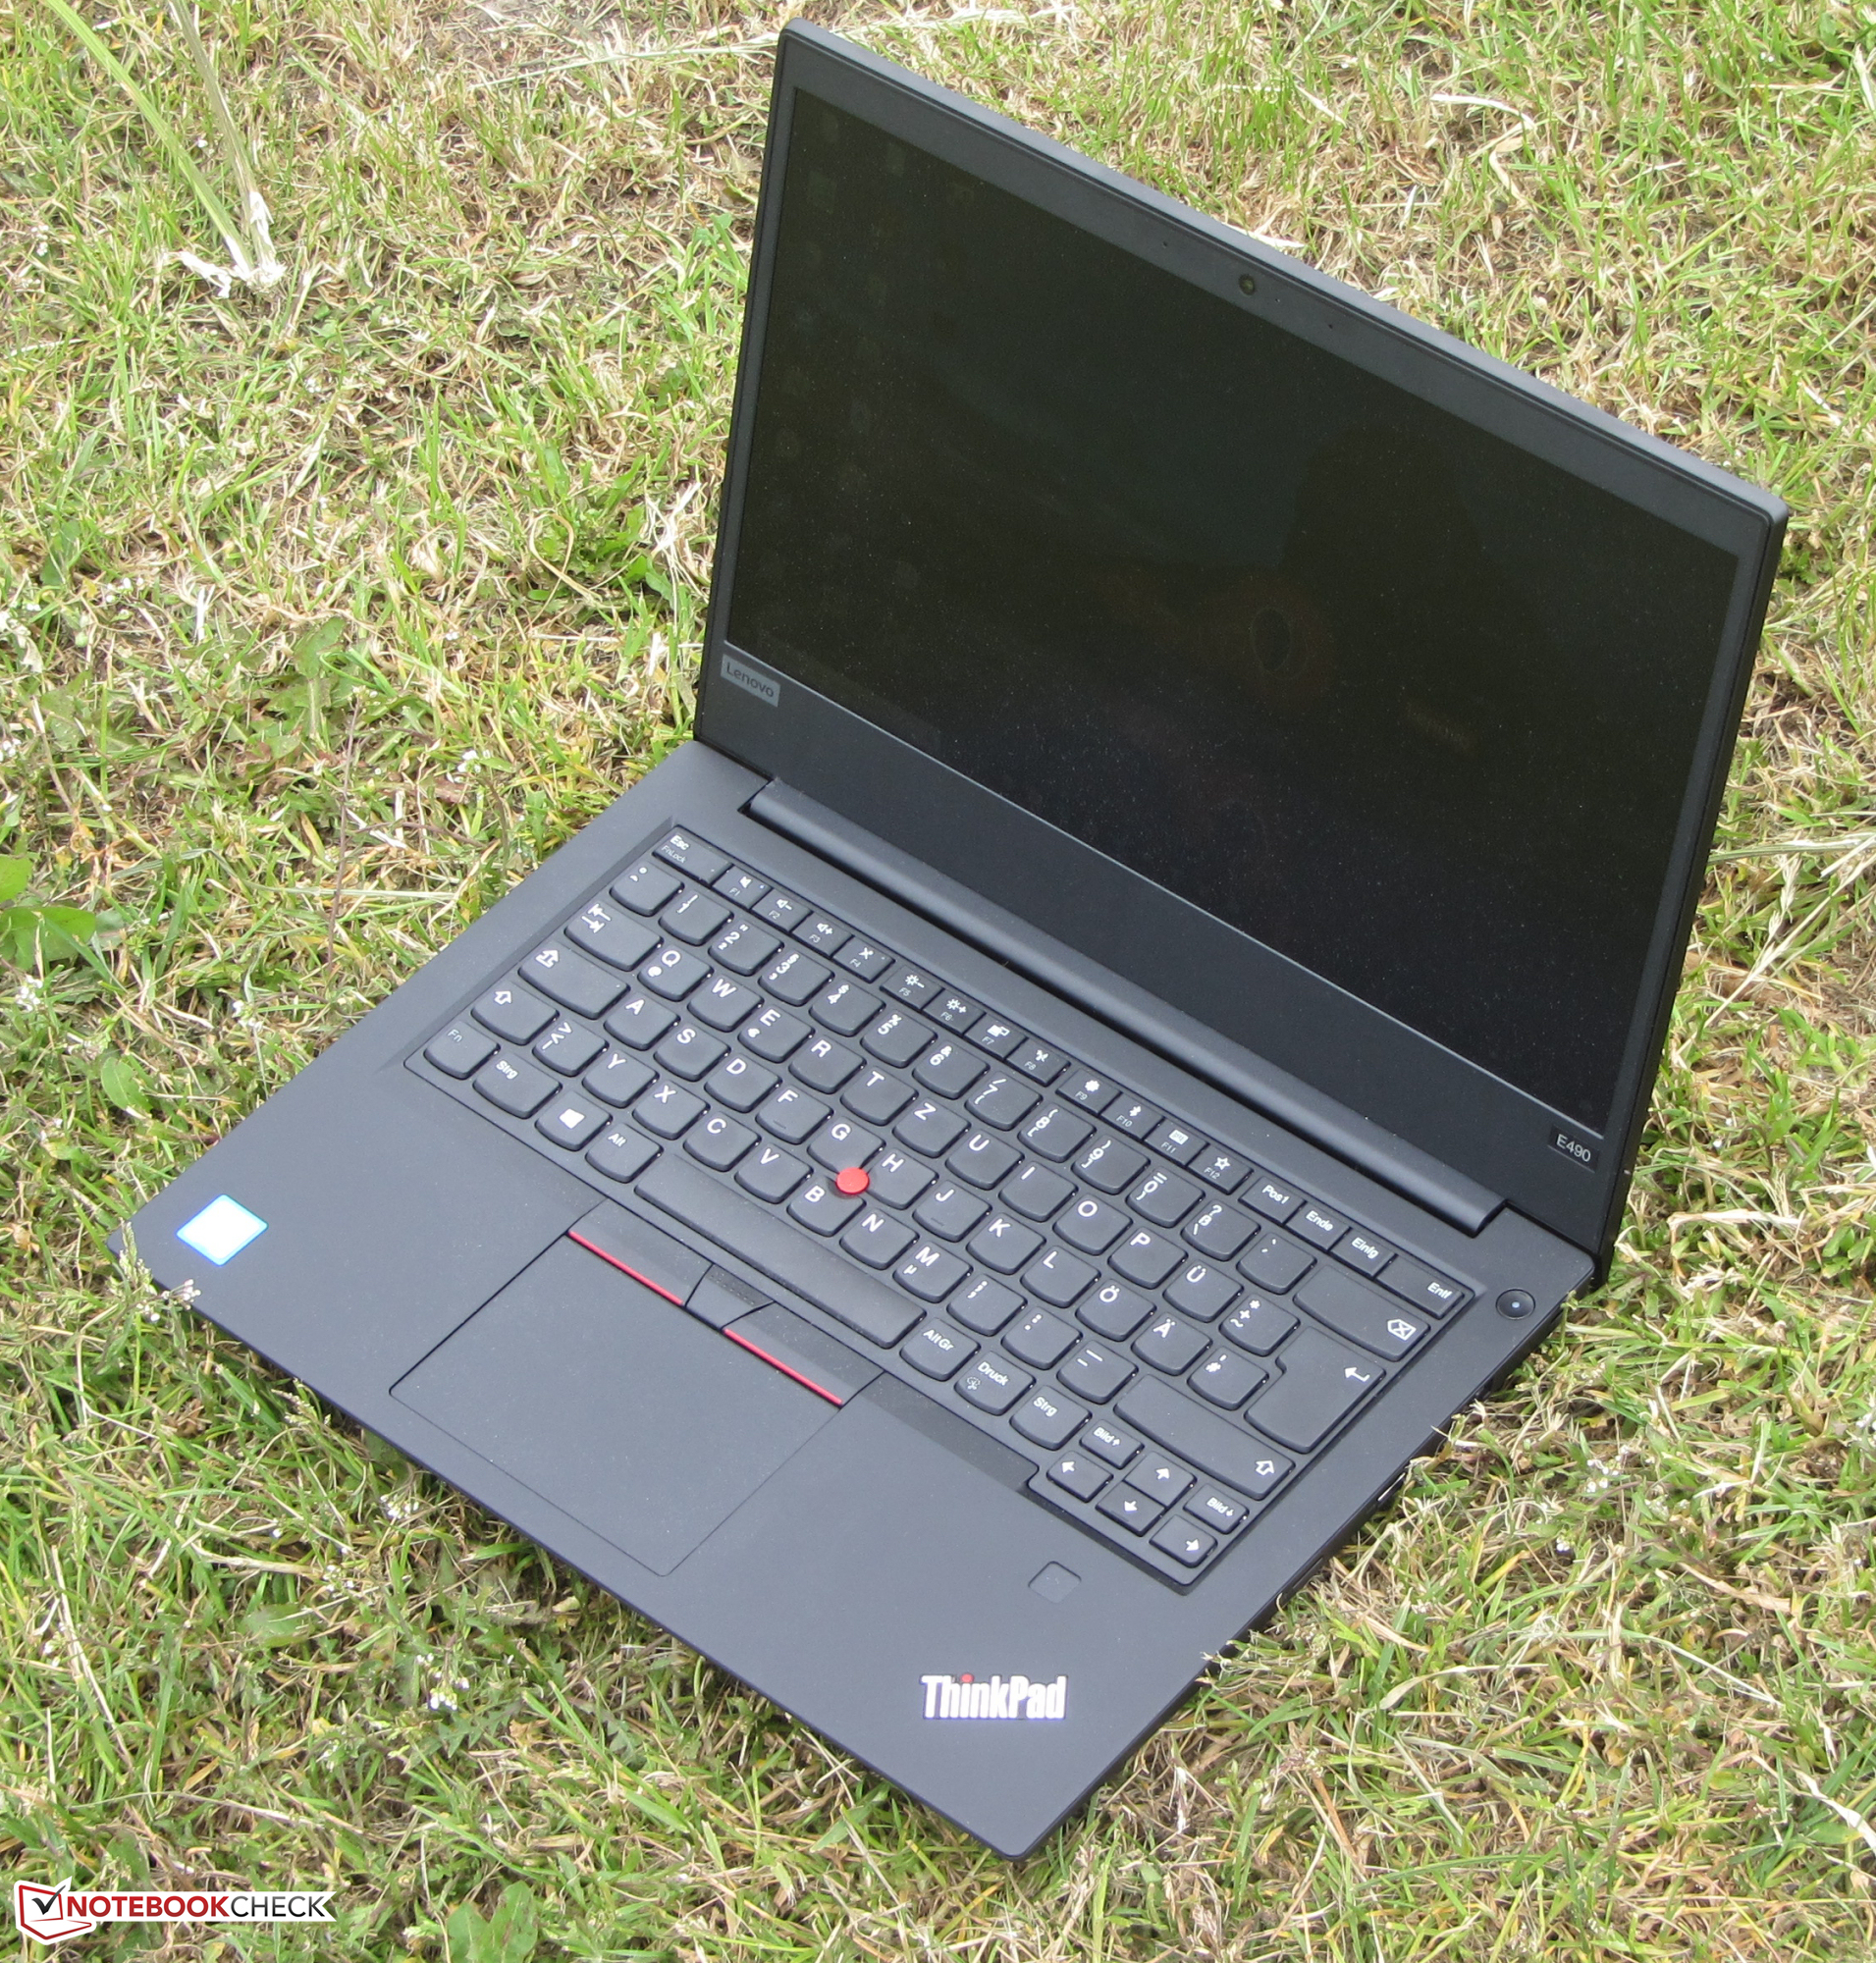
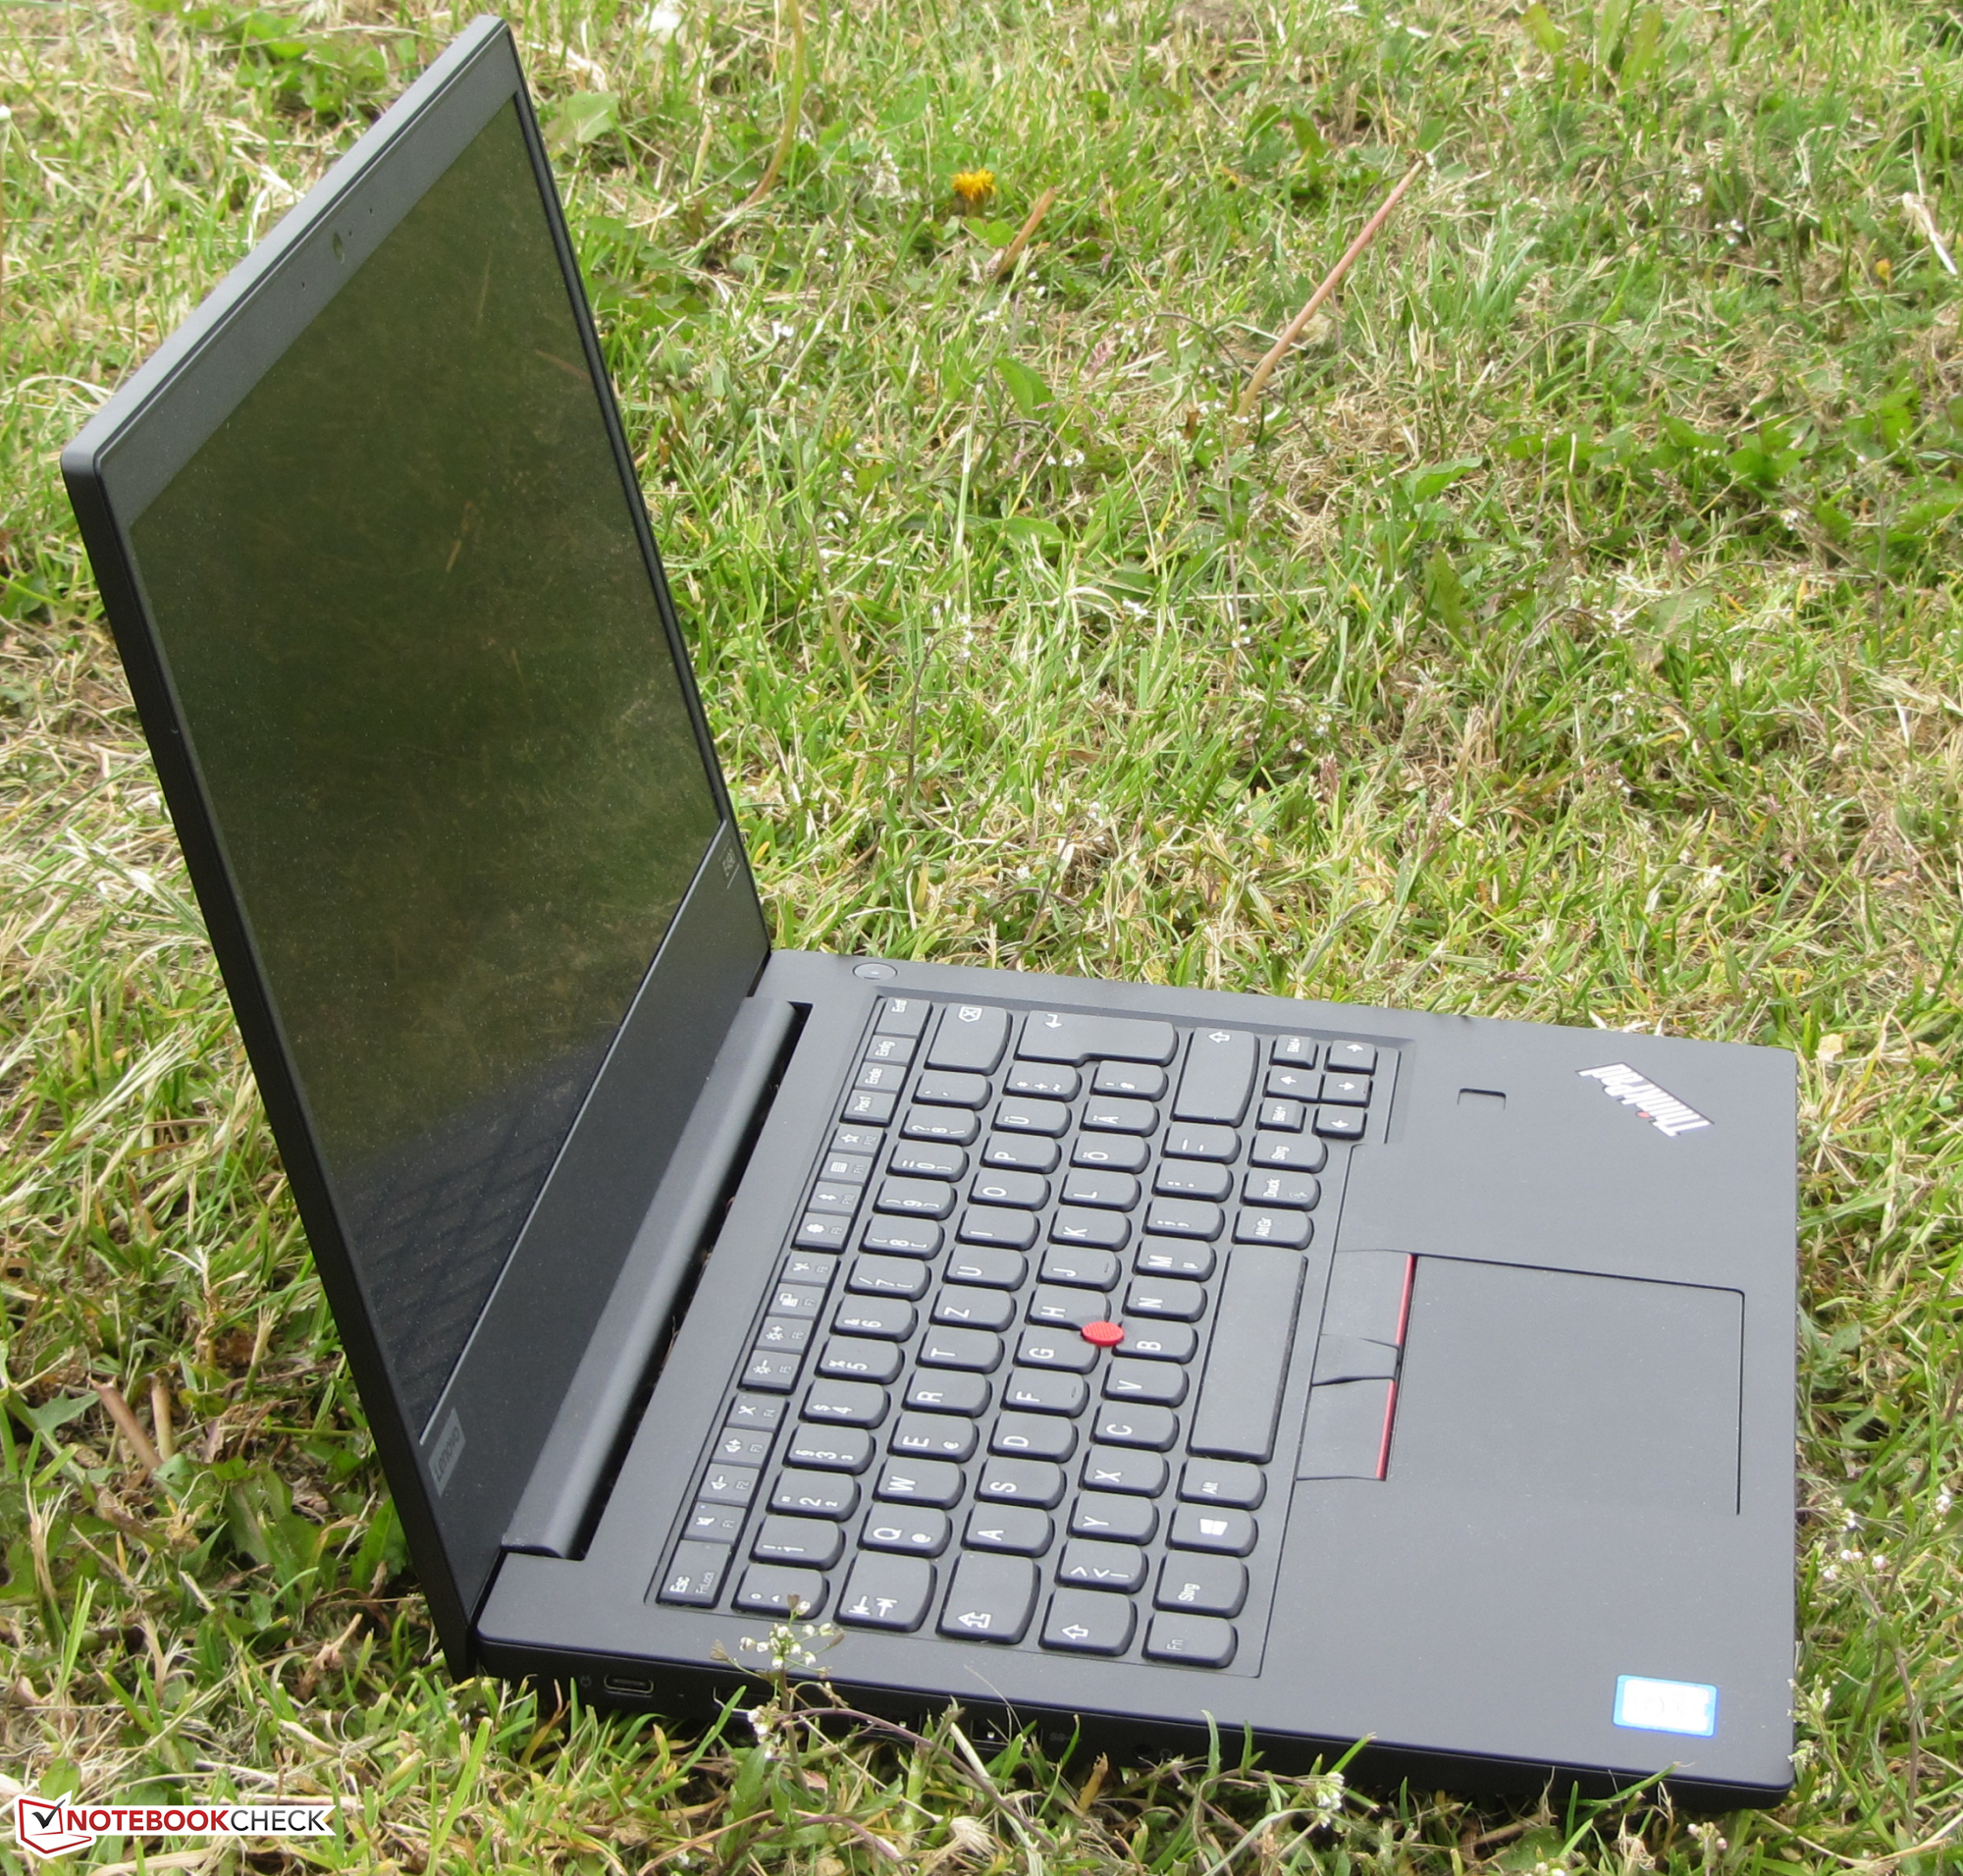
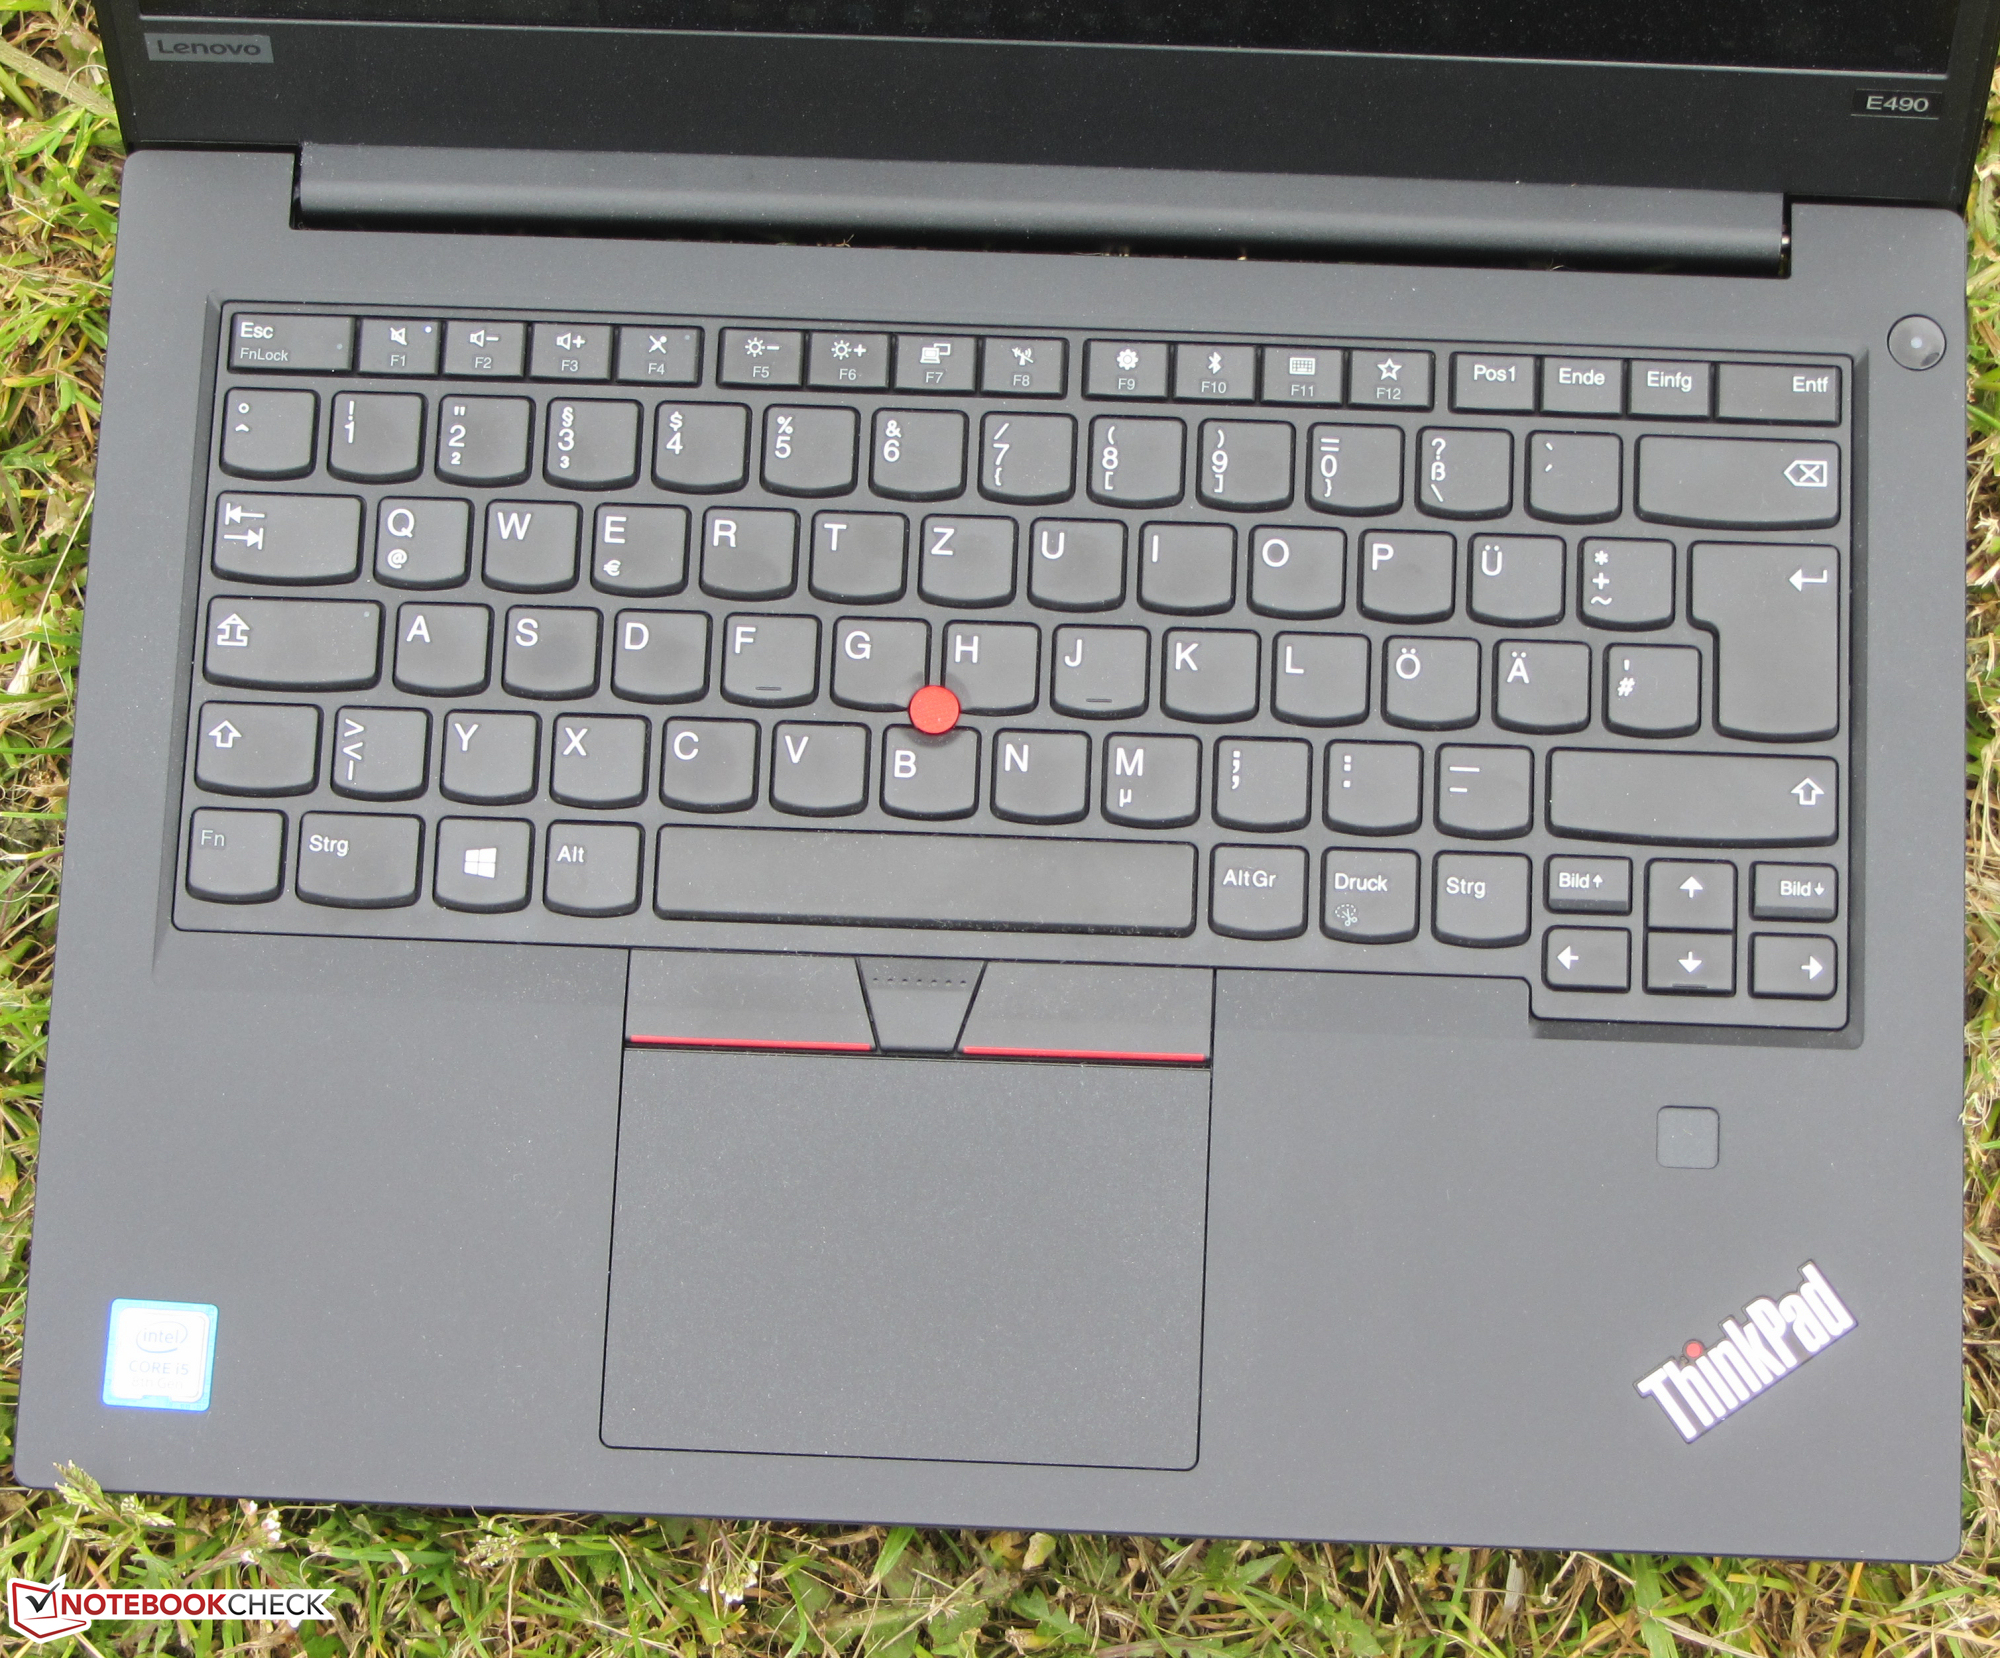
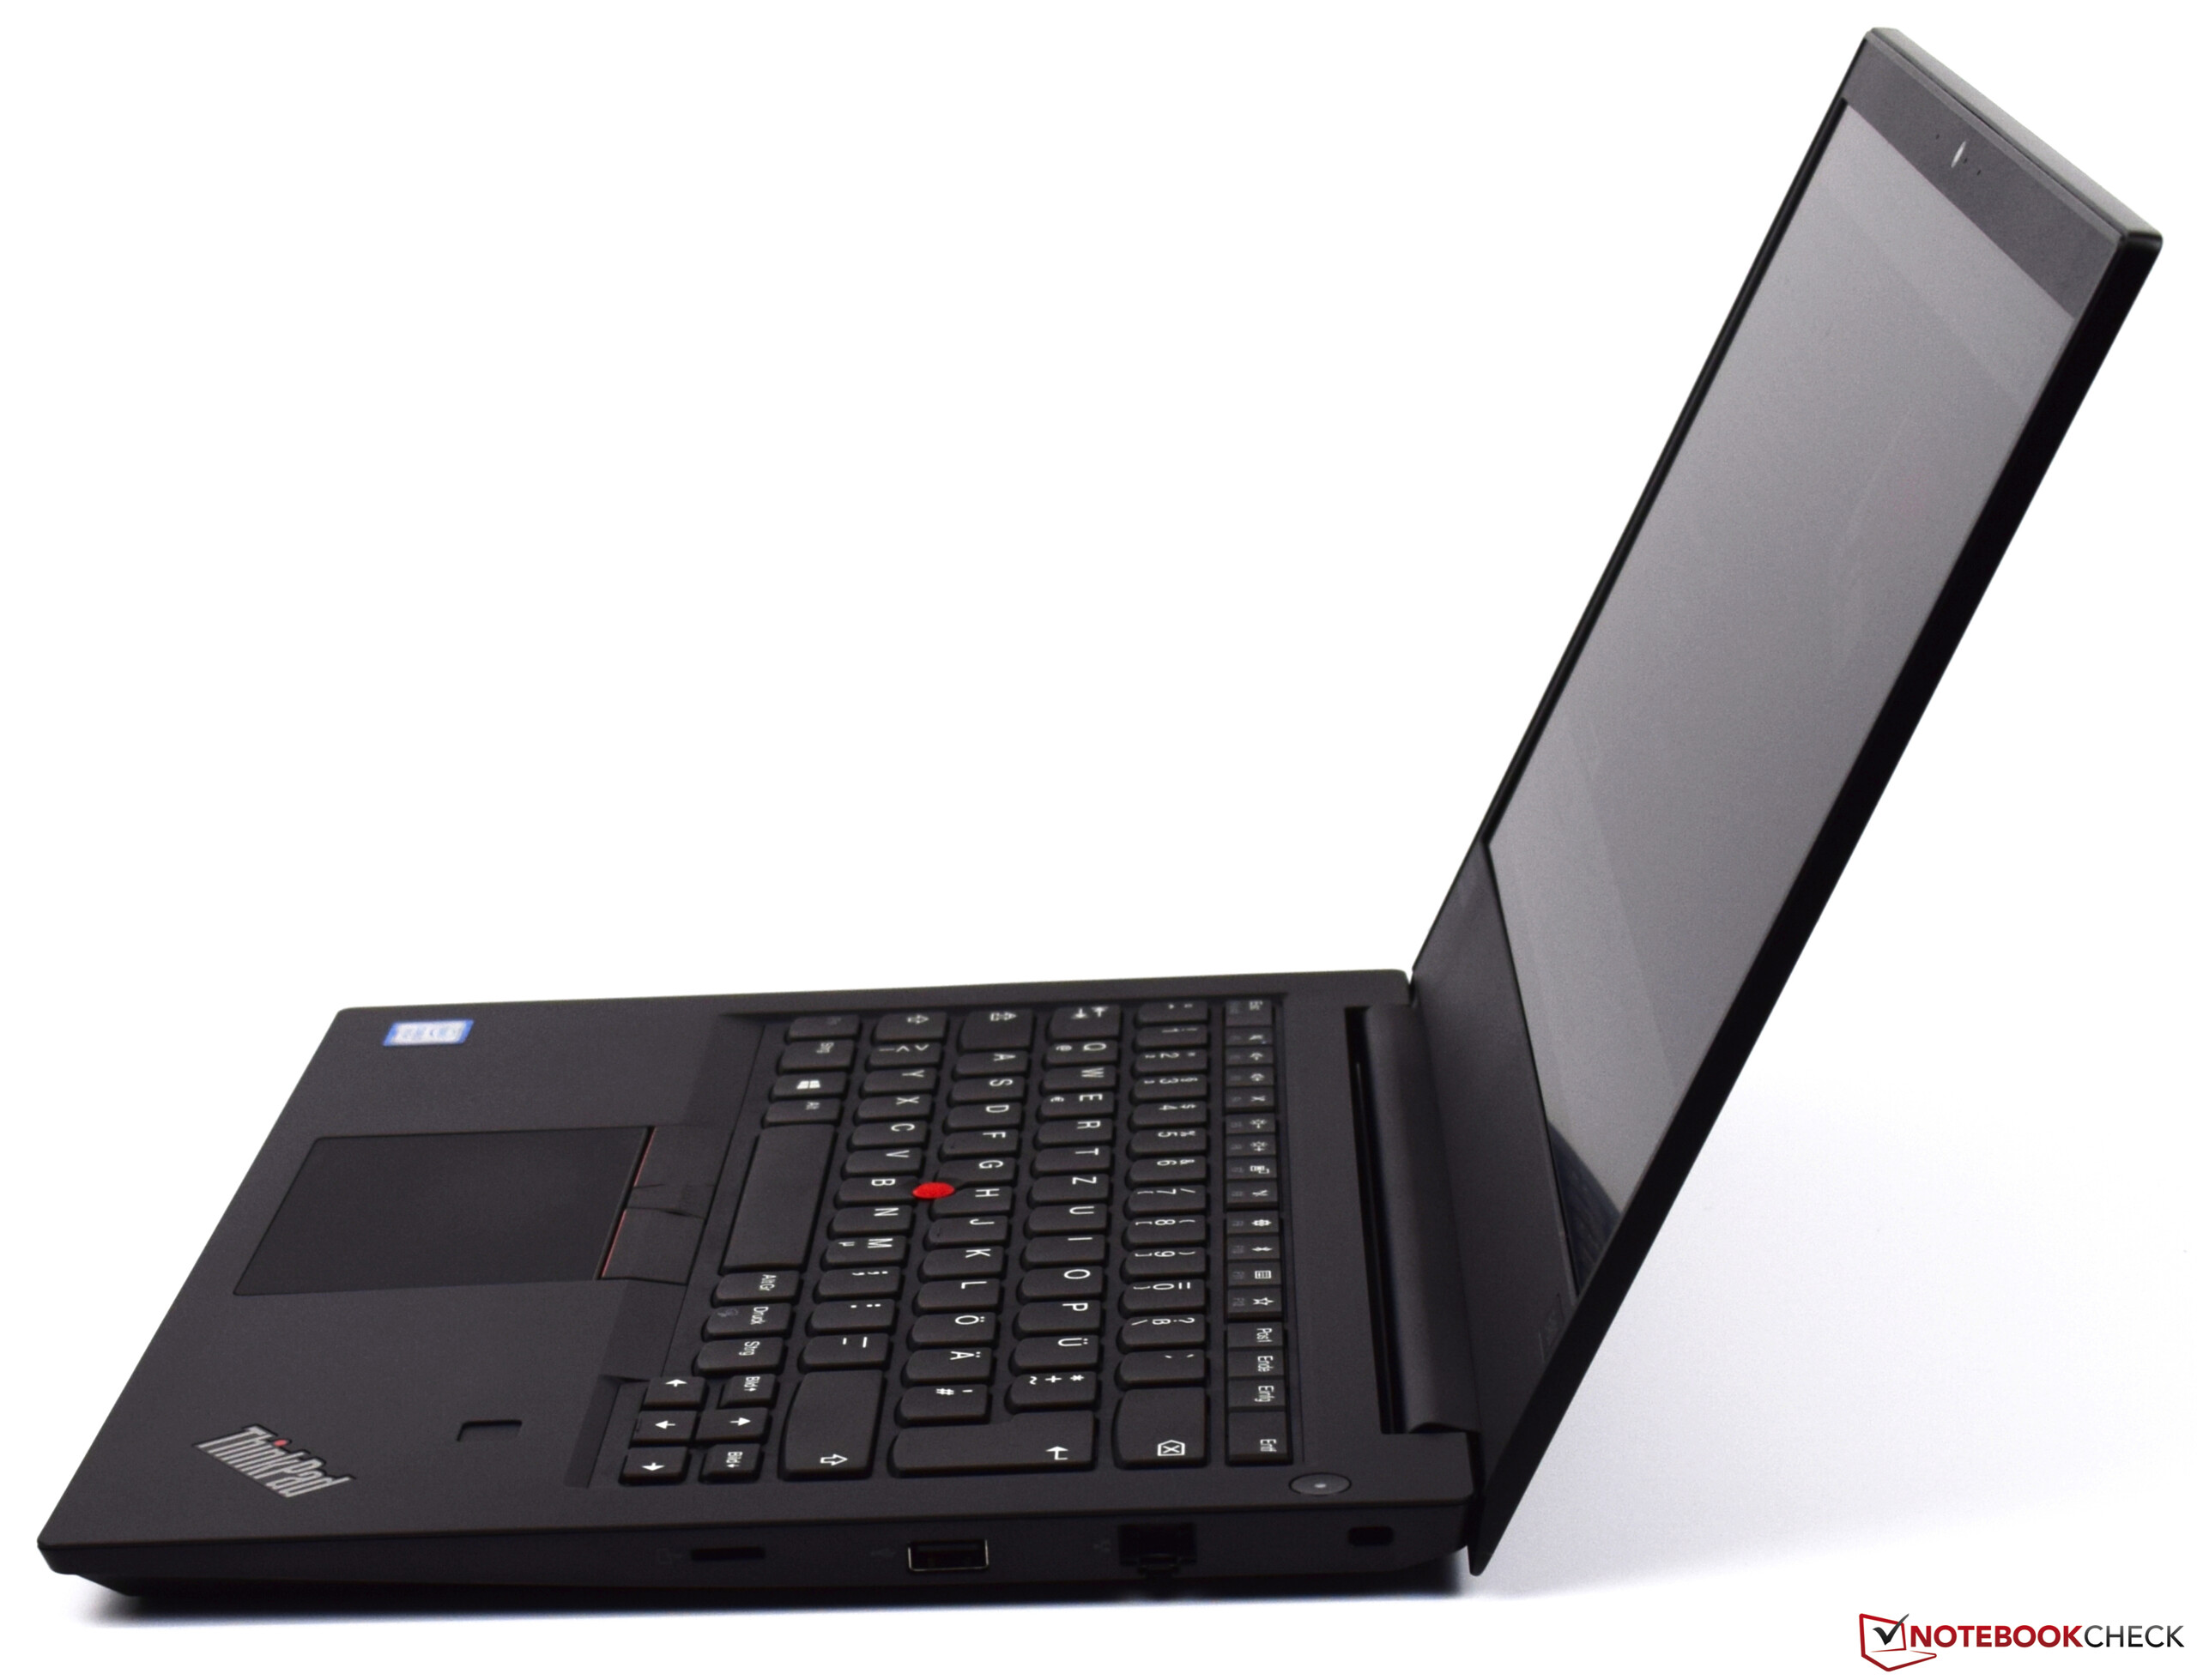
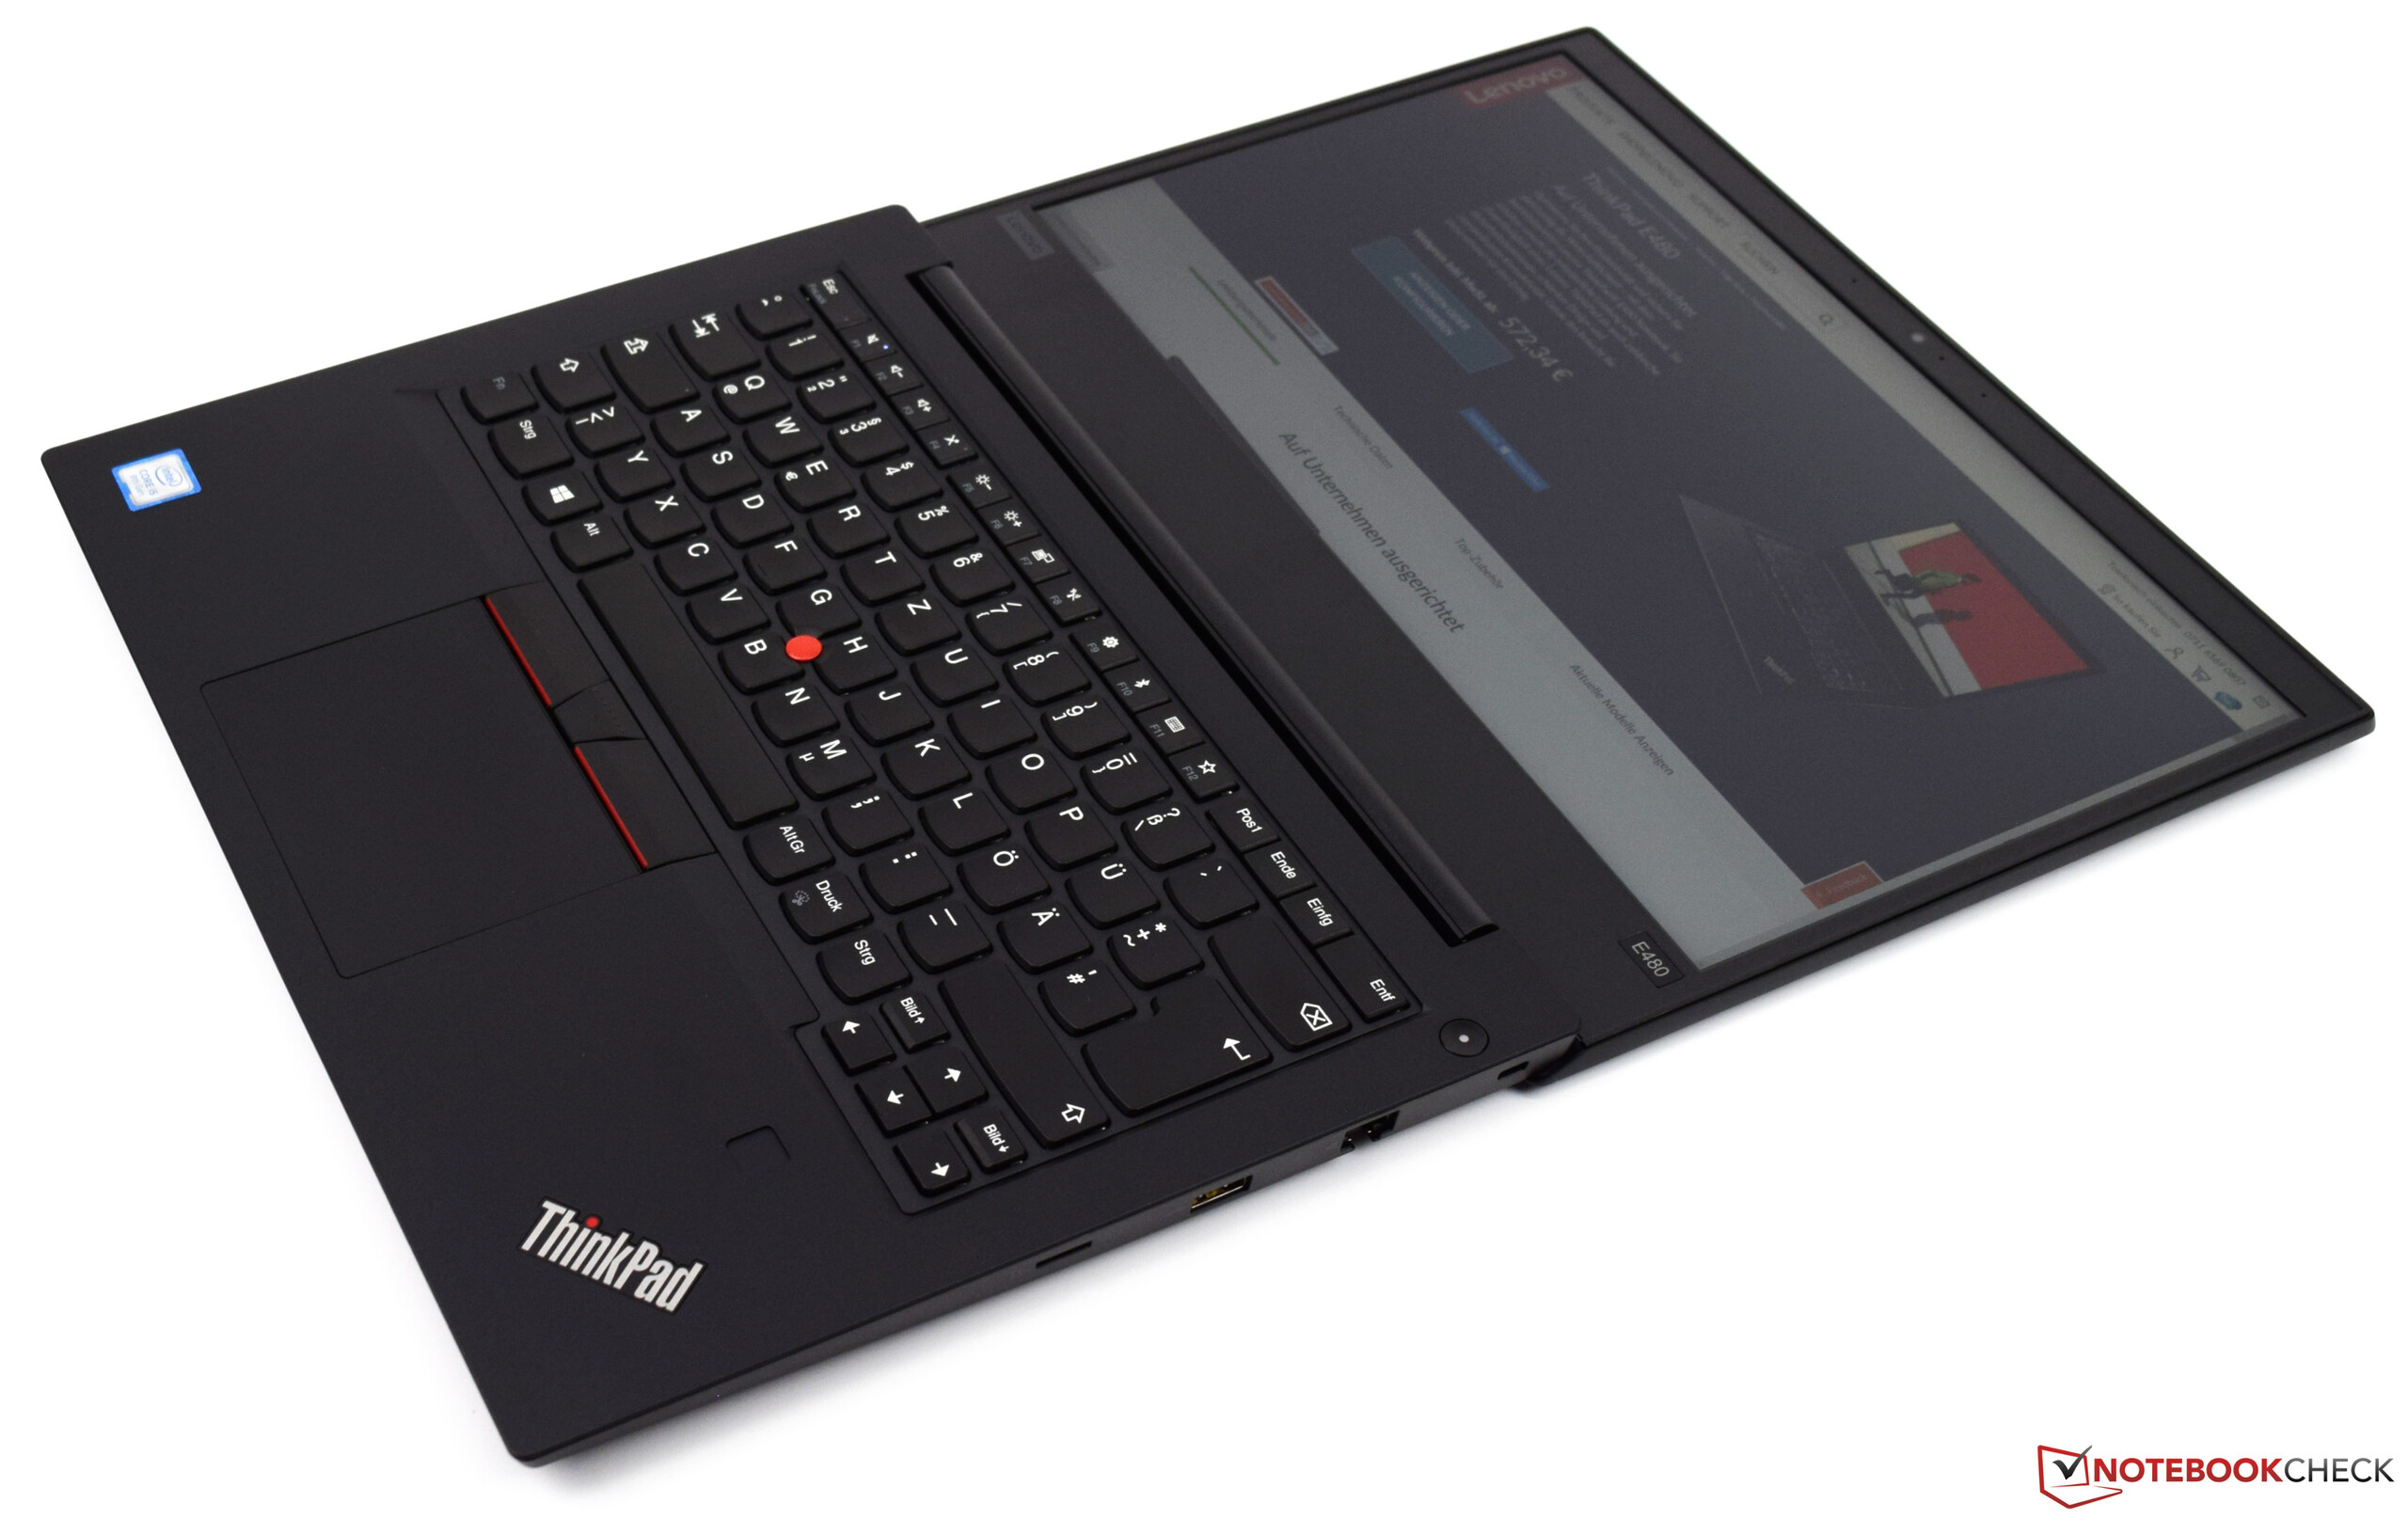
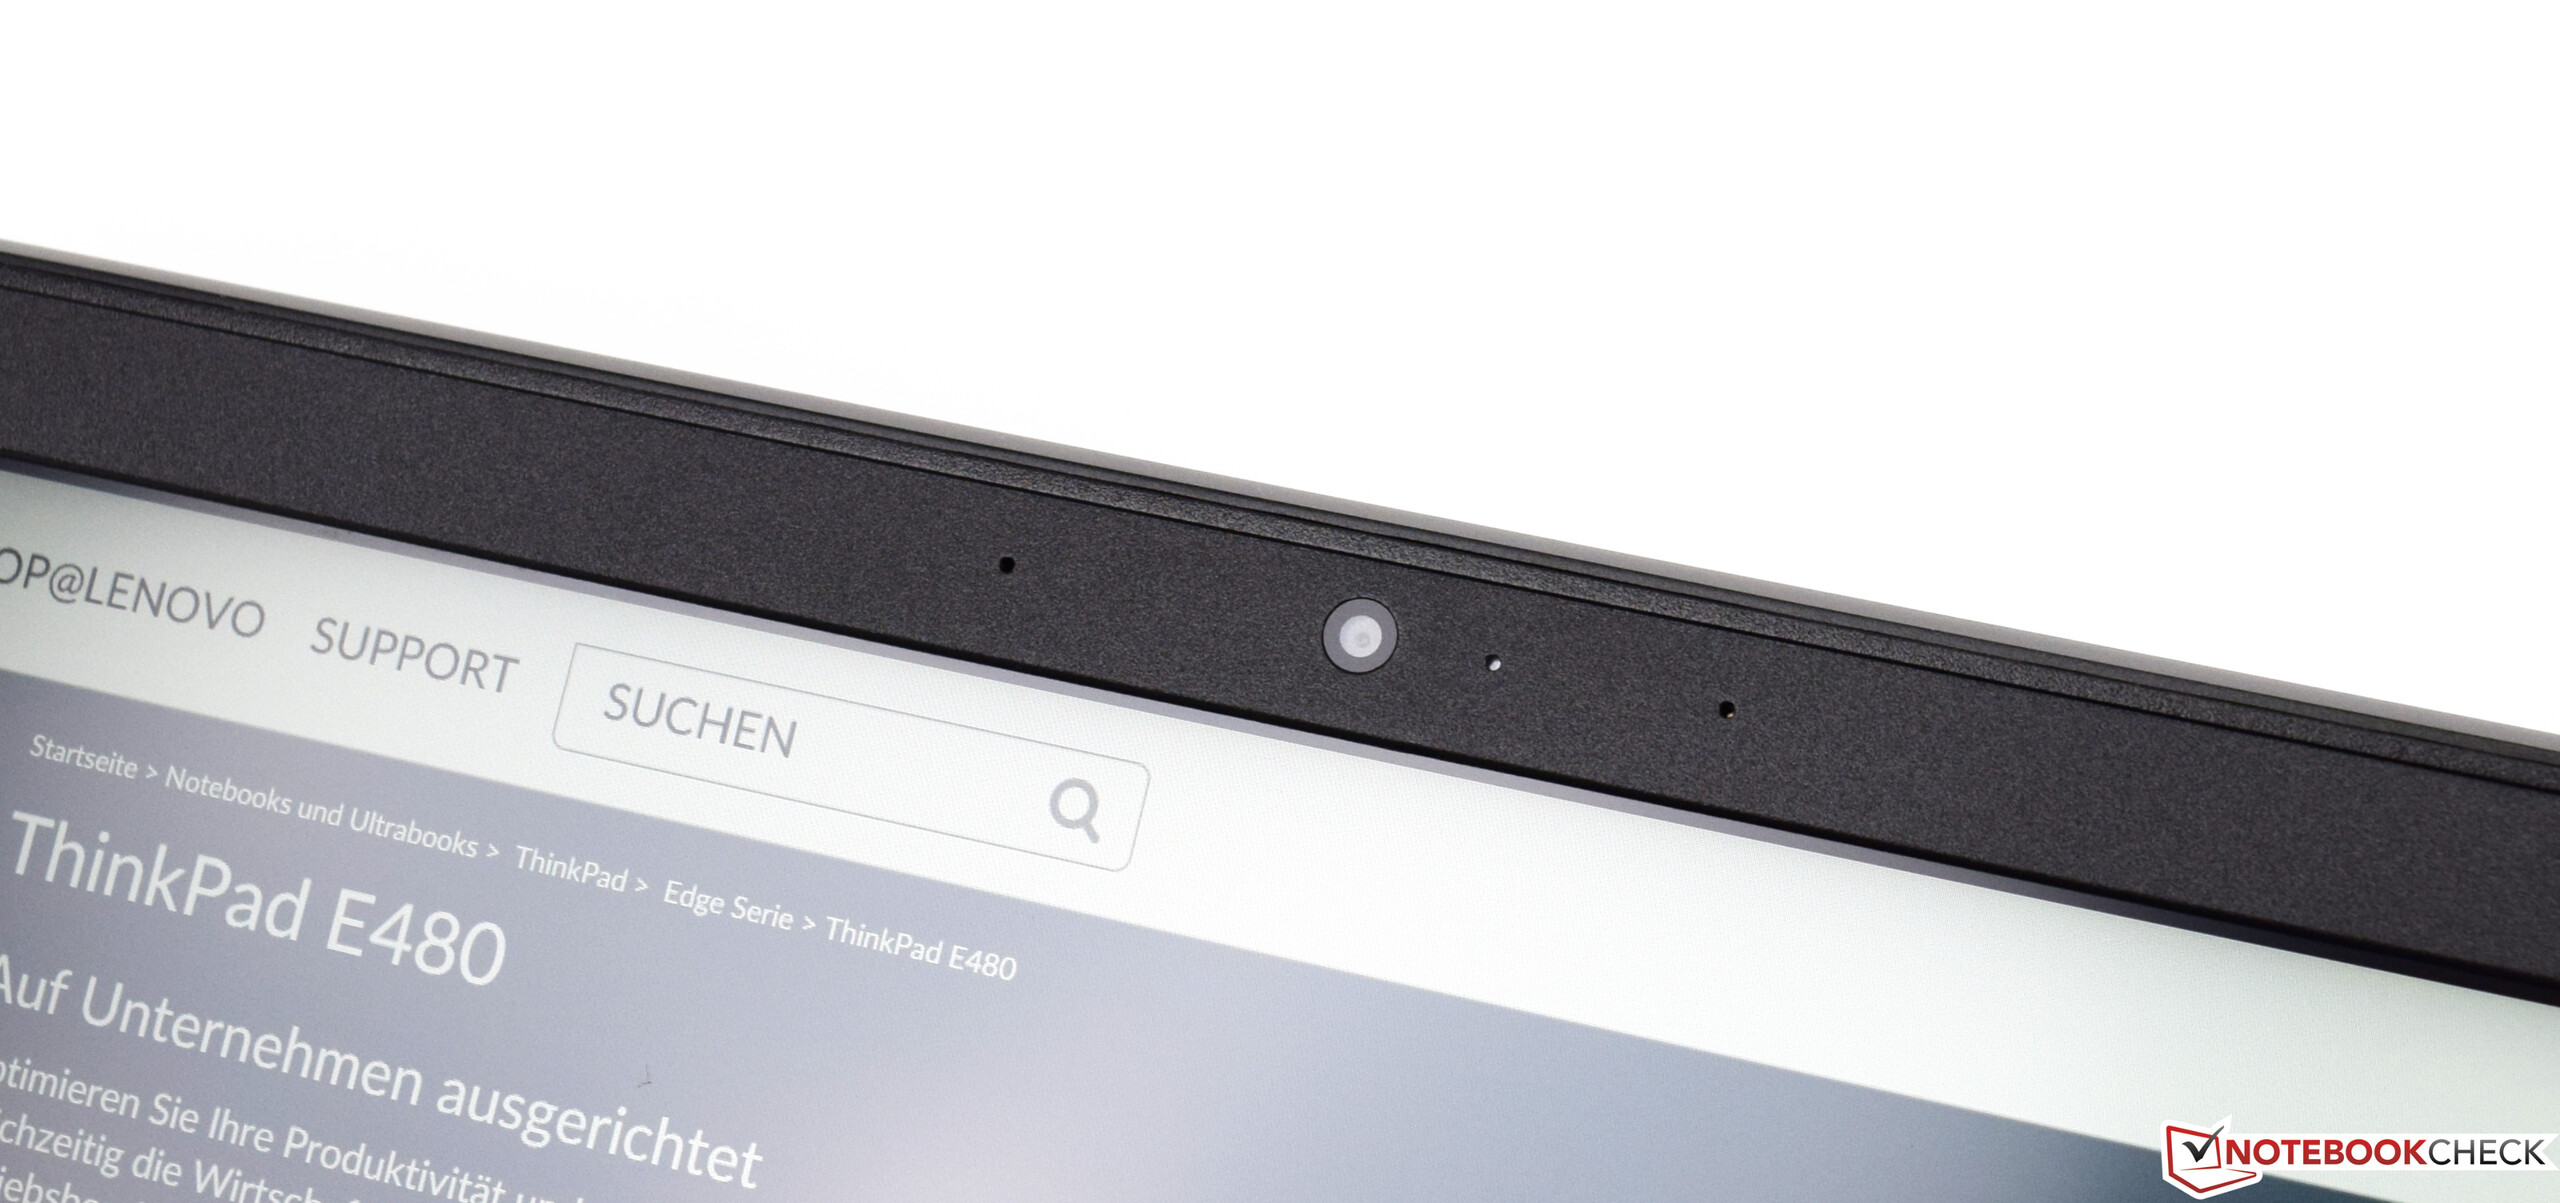
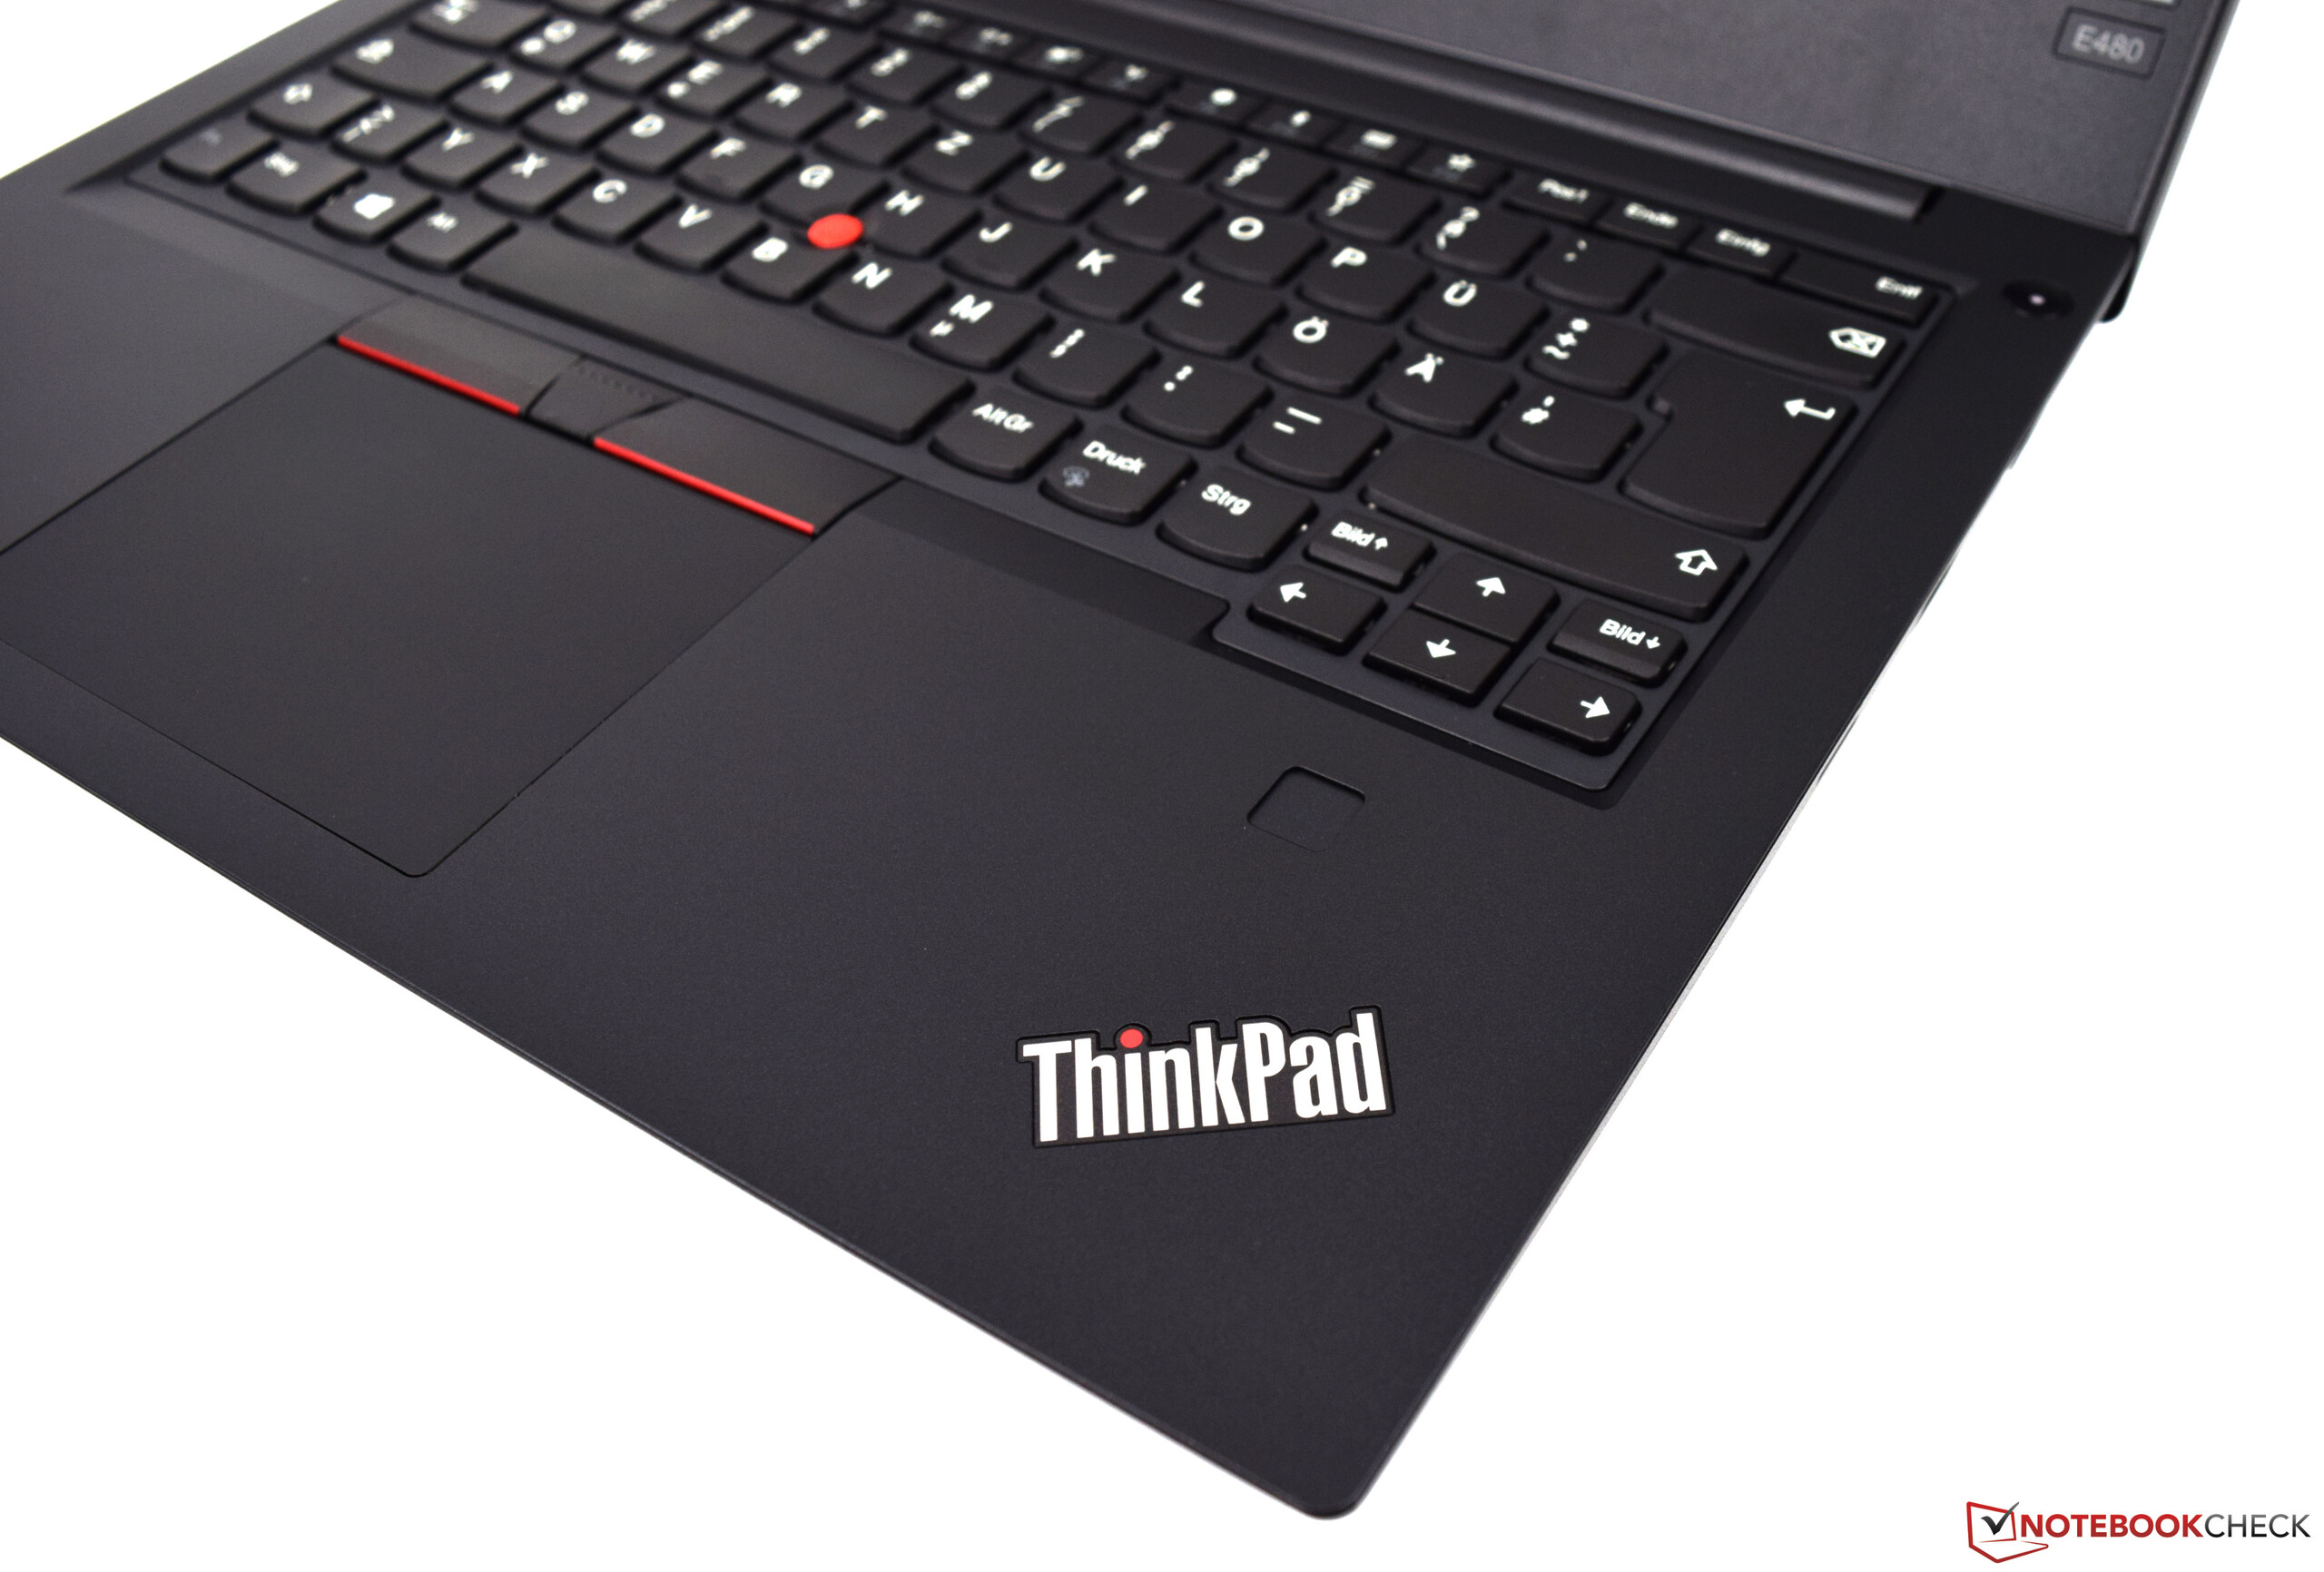
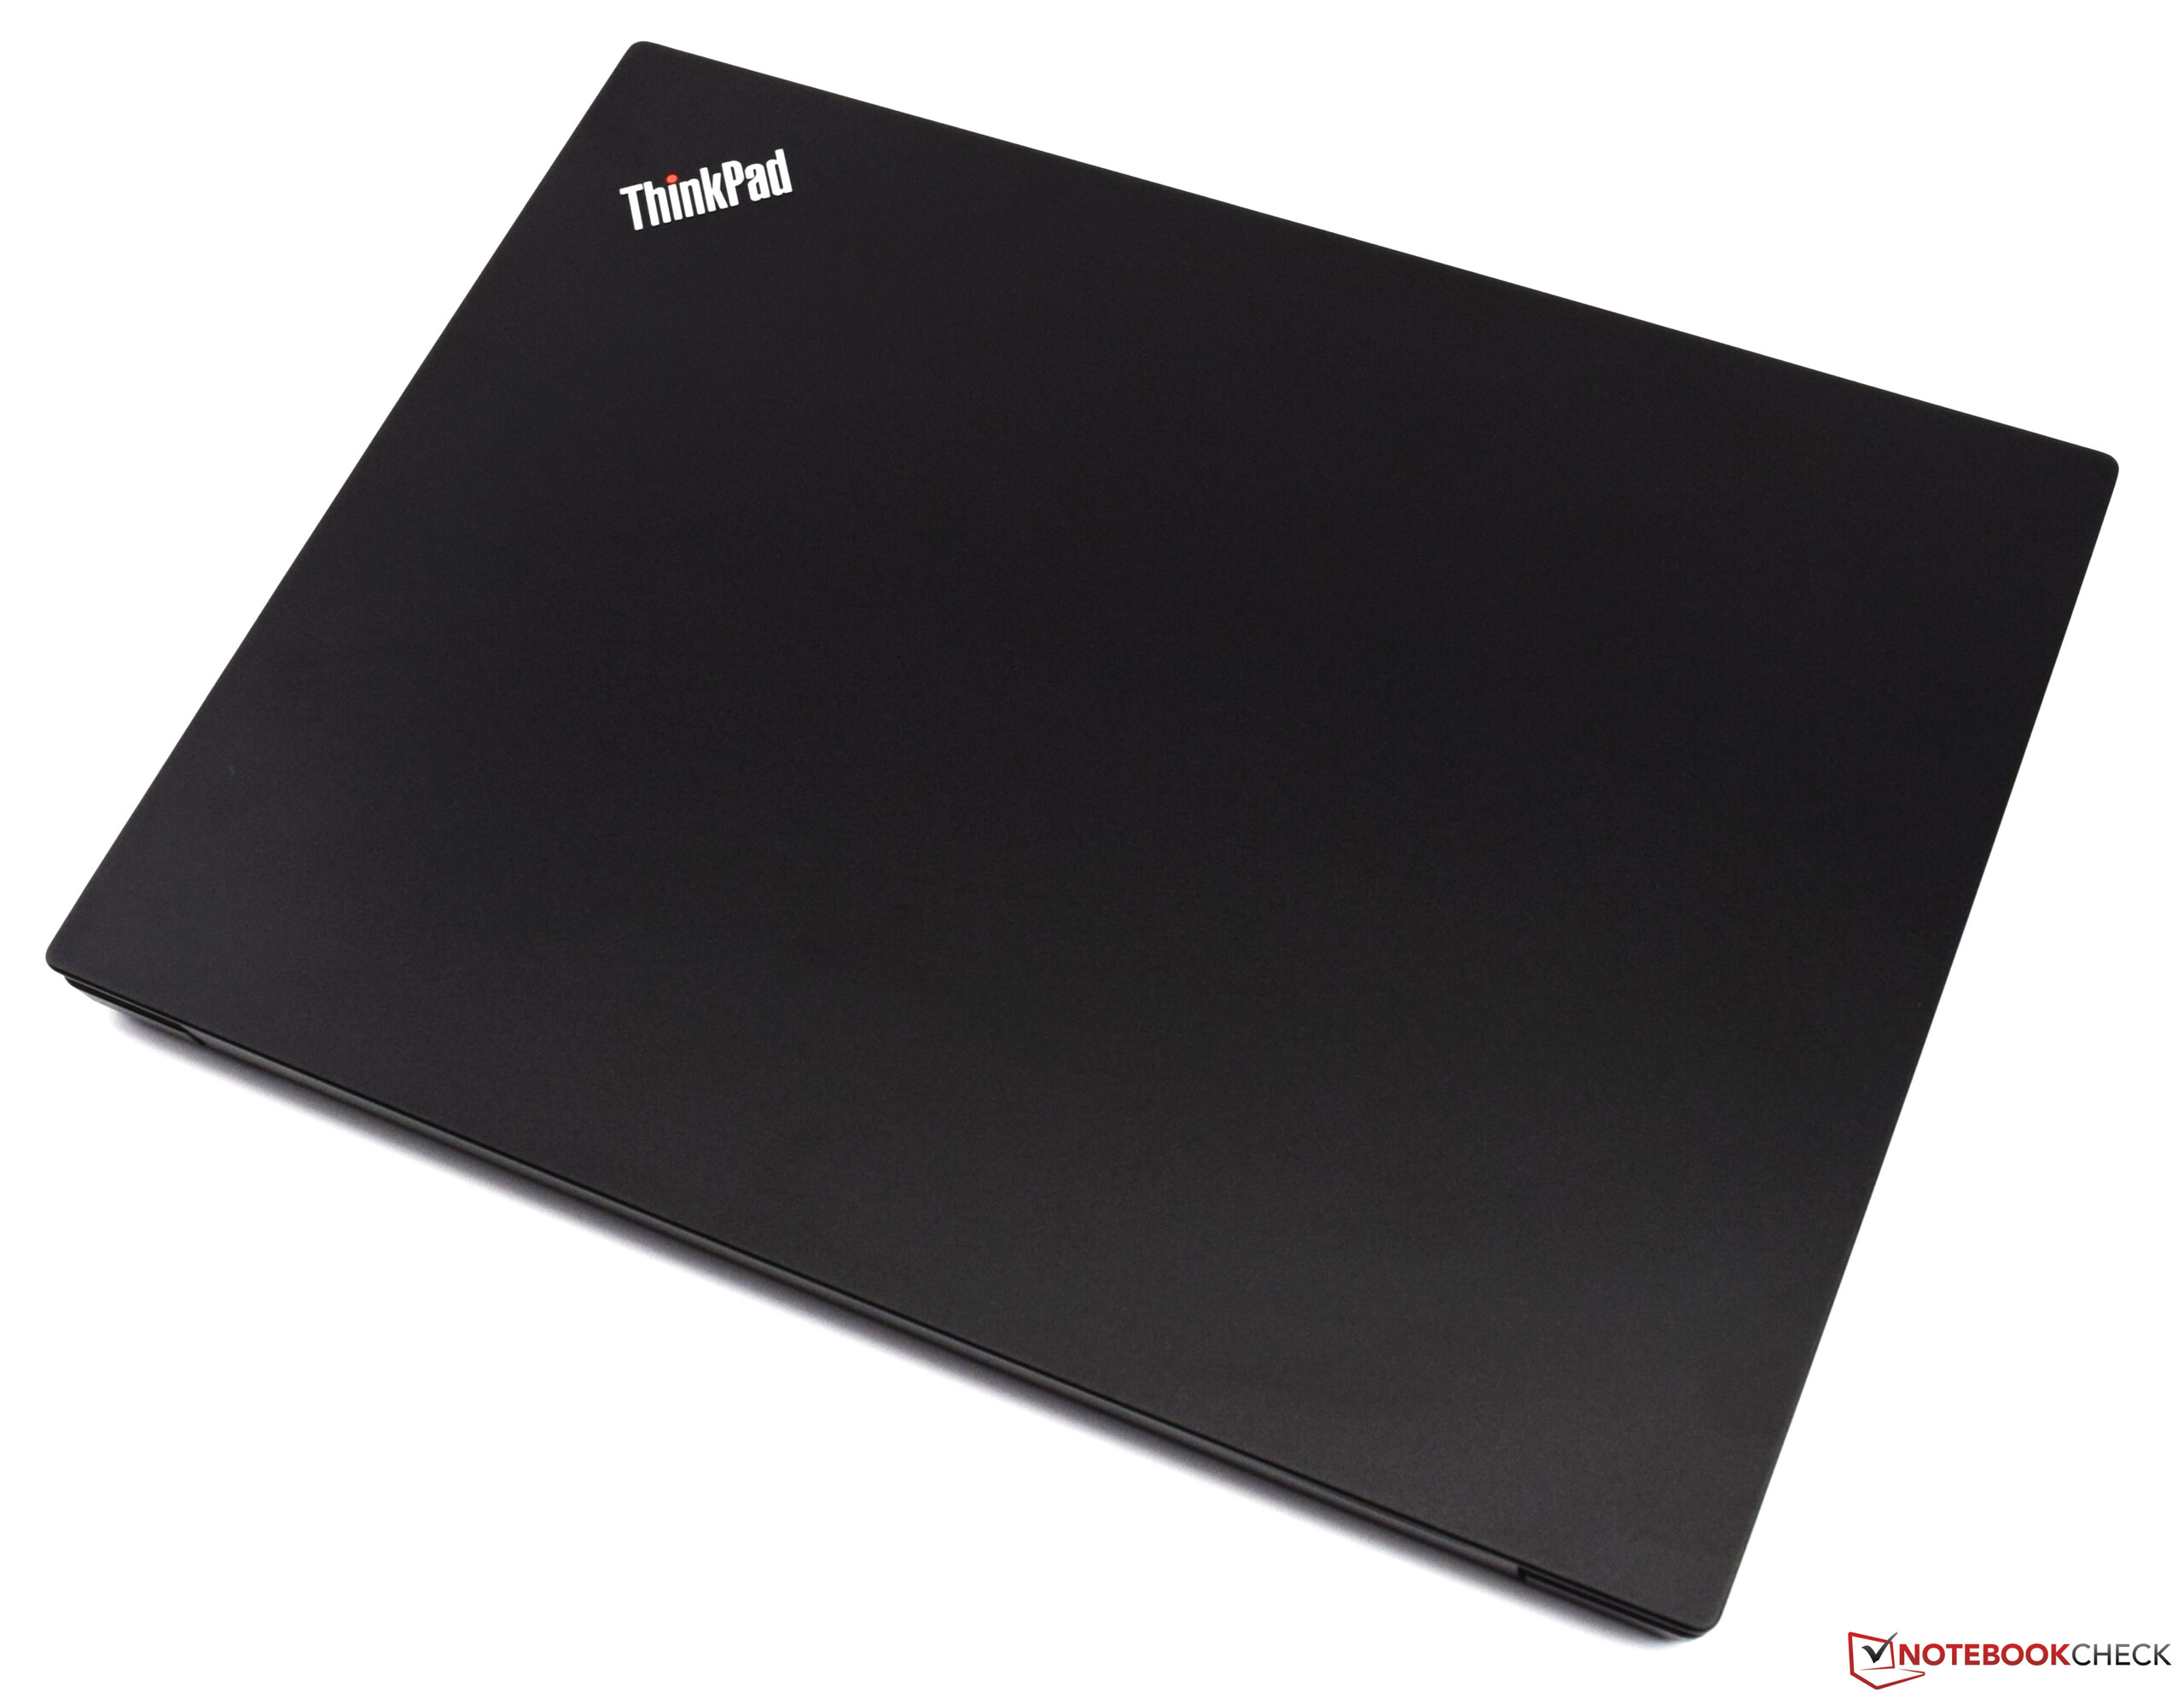
Since the ThinkPad E480 and E490 models share an identical build, we will not discuss the case, connections, input devices, and speakers again here. You can find the corresponding information in our review of the ThinkPad E480.
Update September 16th: The rating drops from 89% to 86% due to our rating update from v6 to v7. For more information, please see this article.
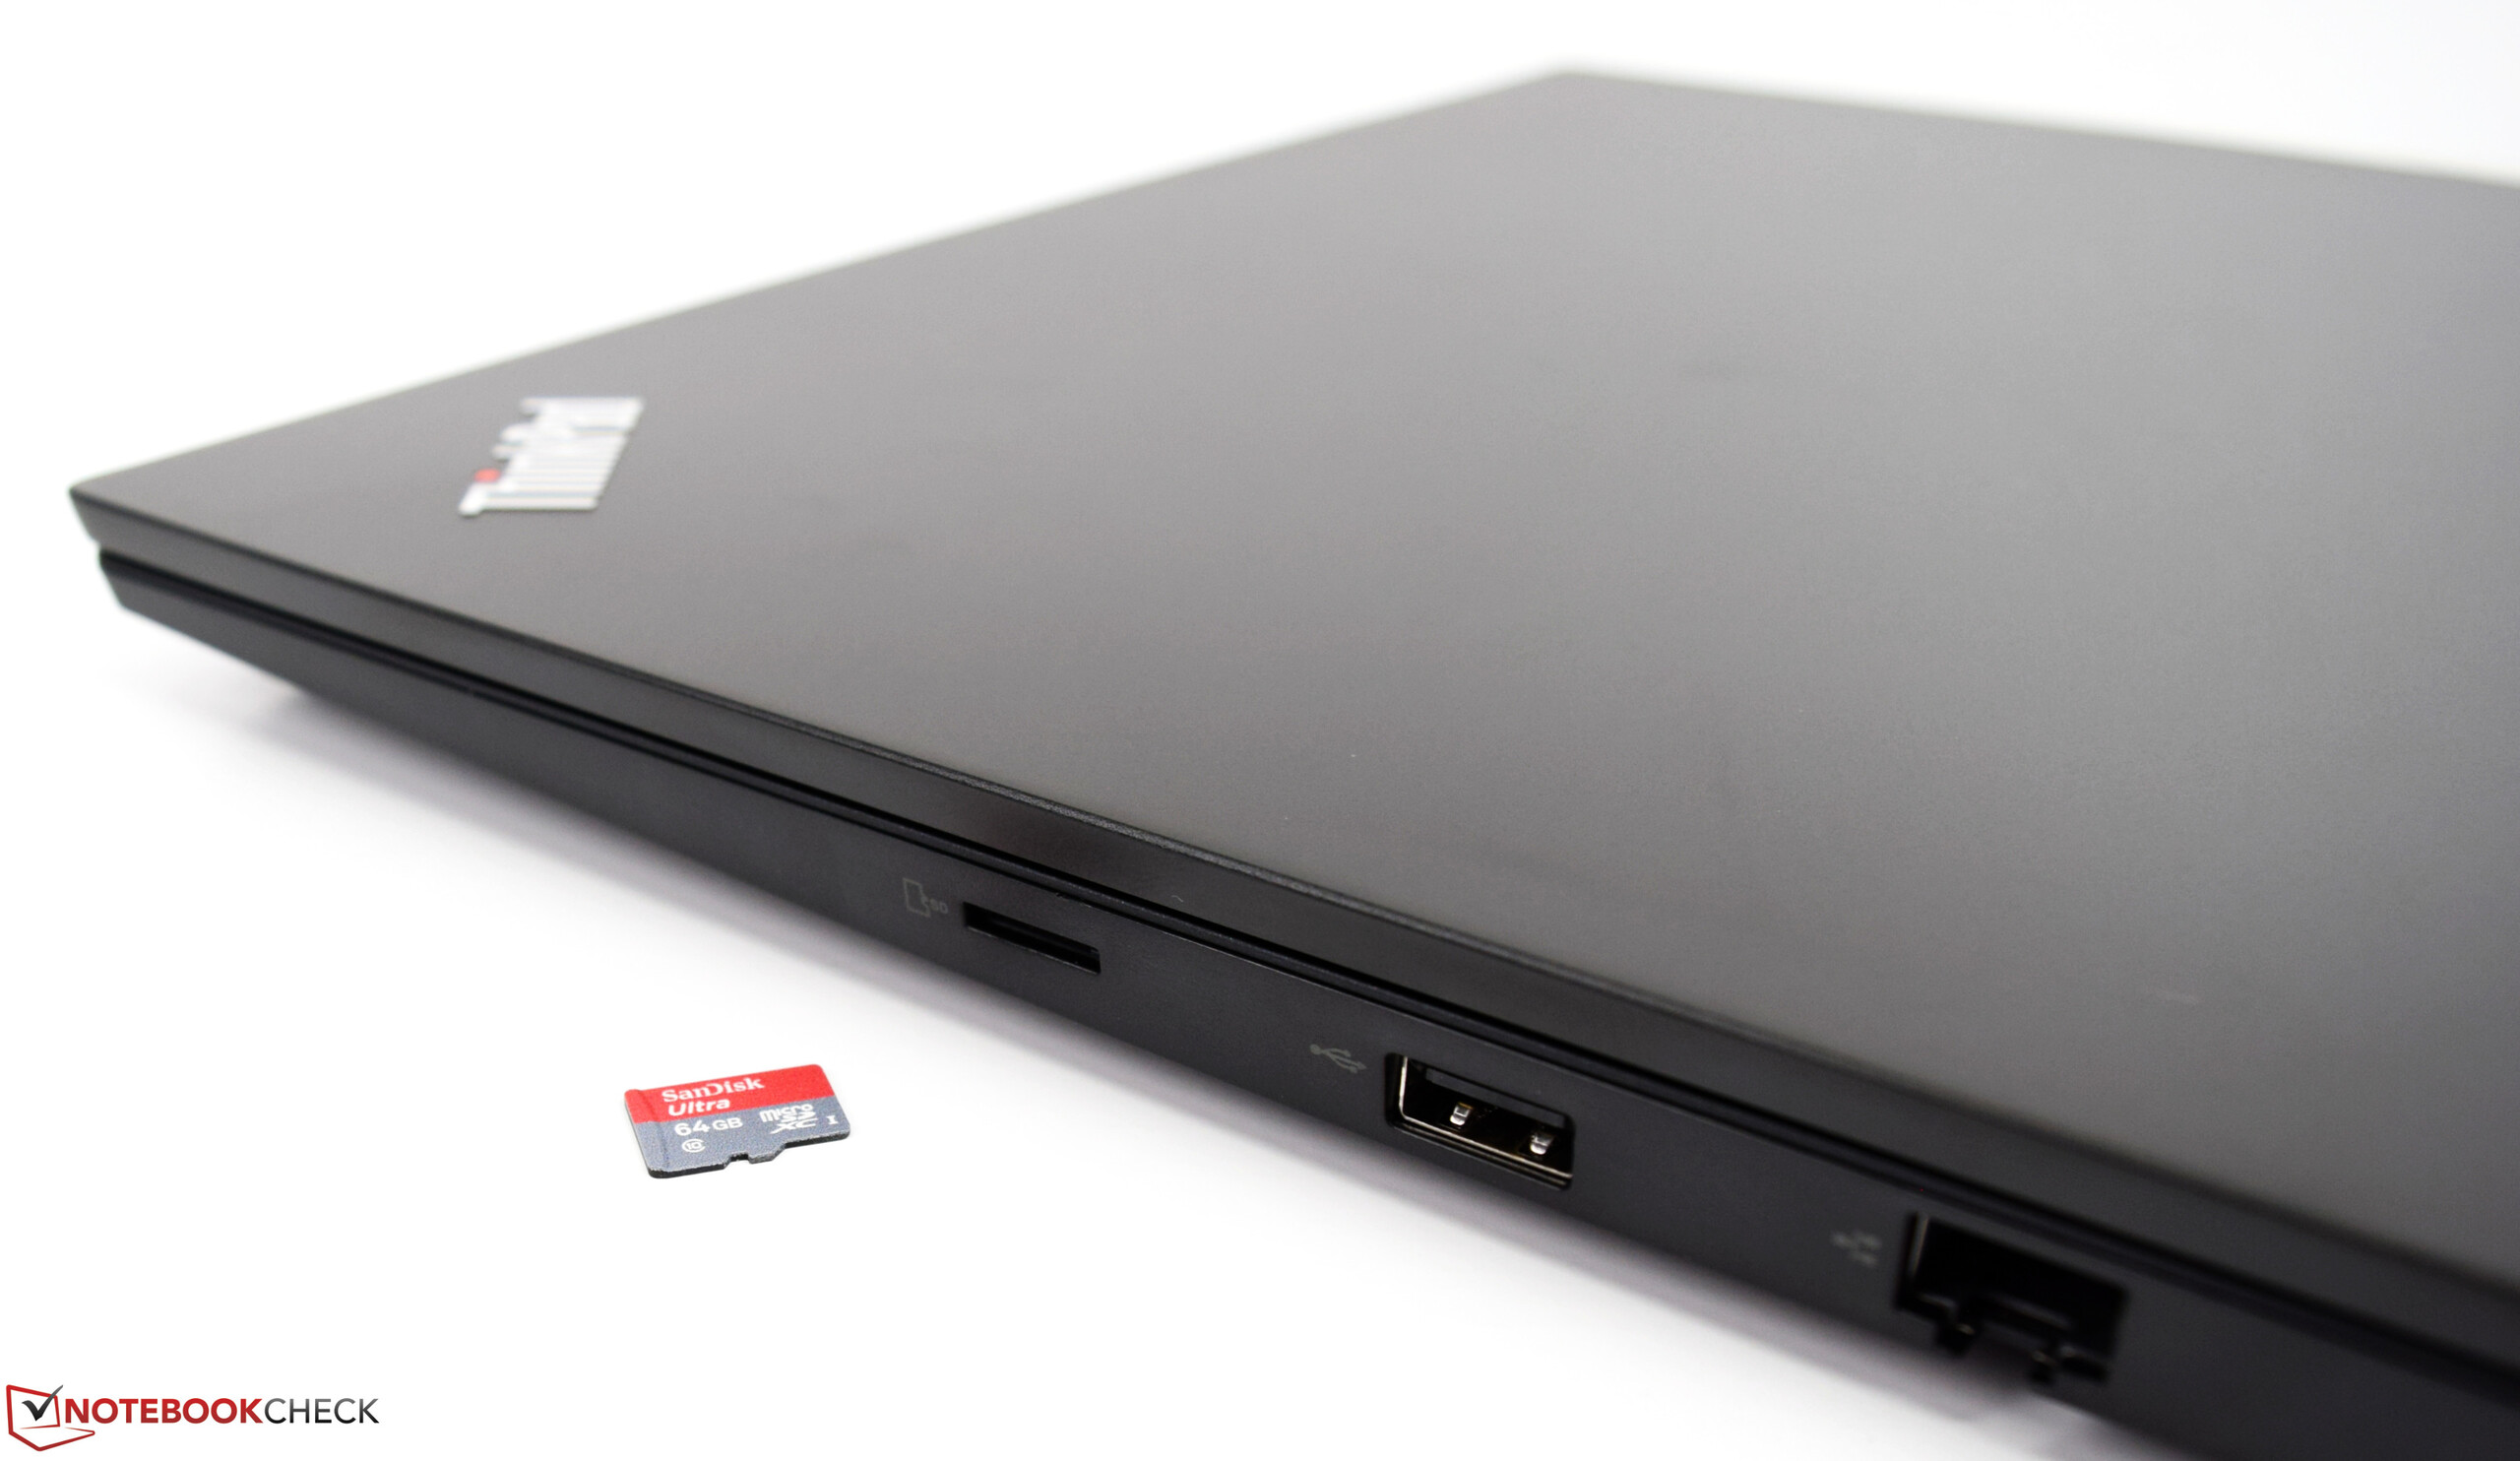
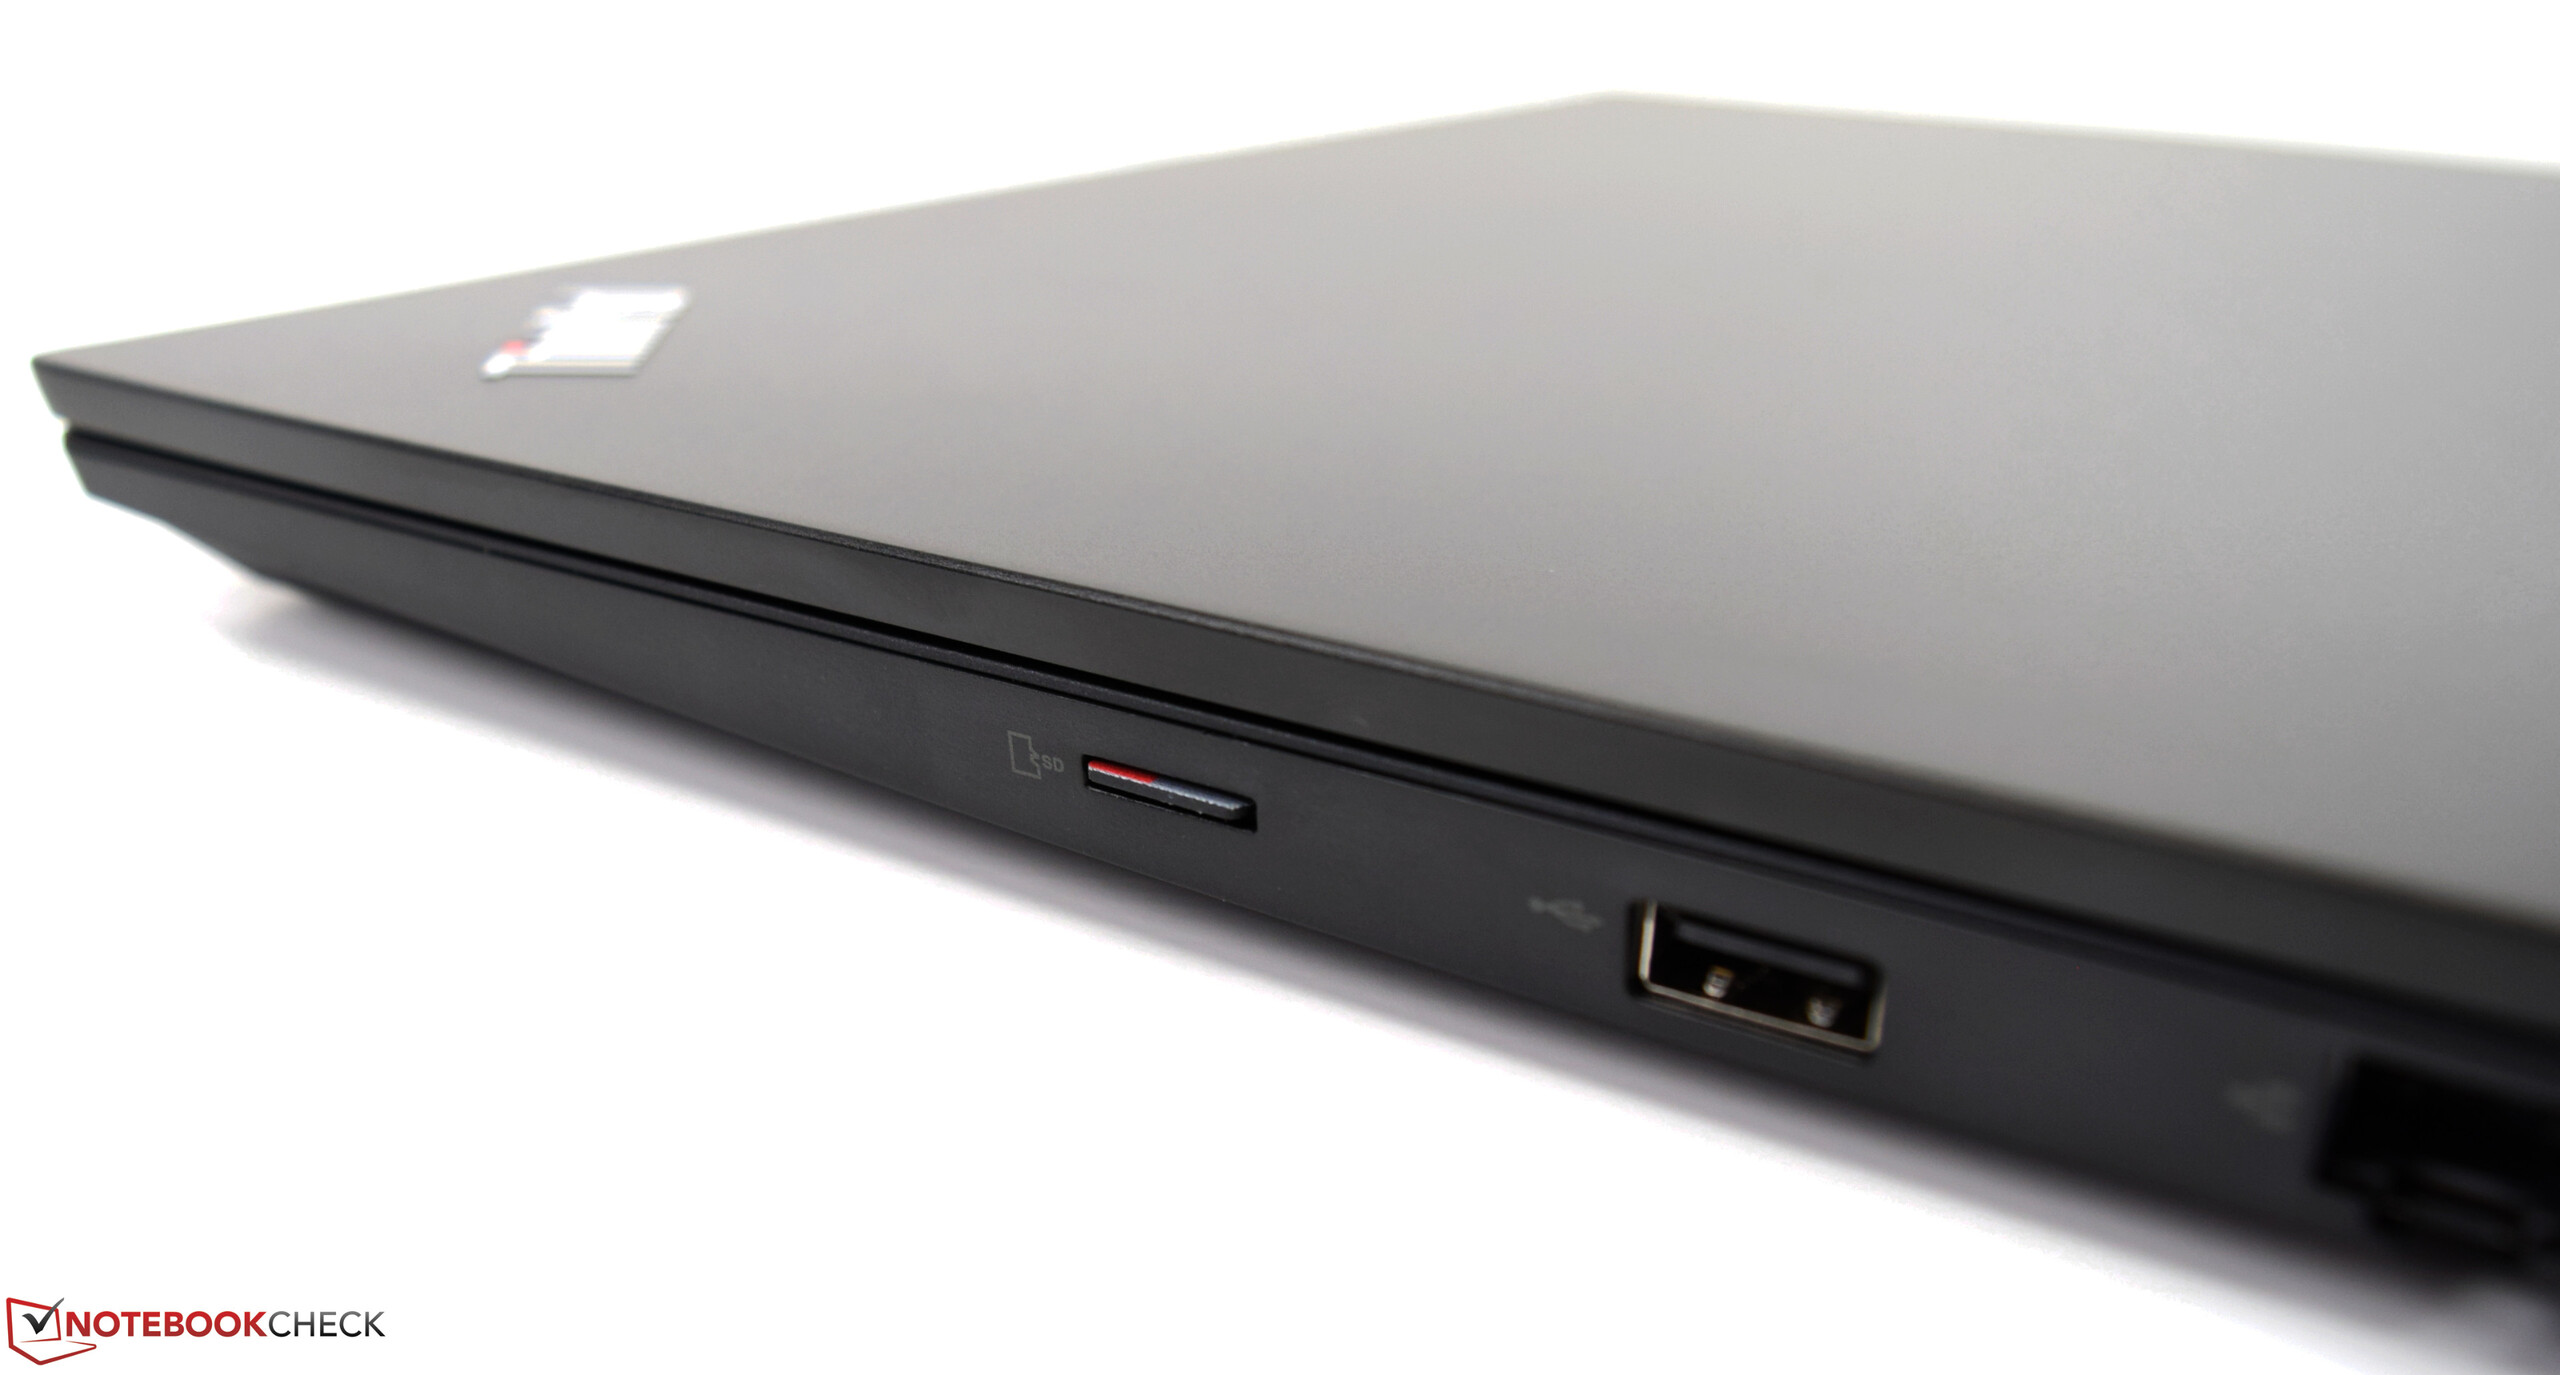
| SD Card Reader | |
| average JPG Copy Test (av. of 3 runs) | |
| Dell Latitude 14 5495 (Toshiba Exceria Pro SDXC 64 GB UHS-II) | |
| HP ProBook 440 G6-5TK01EA (Toshiba Exceria Pro SDXC 64 GB UHS-II) | |
| HP ProBook 445 G6 (Toshiba Exceria Pro SDXC 64 GB UHS-II) | |
| Lenovo ThinkPad E480-20KQS00000 (Toshiba Exceria Pro M501) | |
| Lenovo ThinkPad E480-20KNCTO1WW (Toshiba Exceria Pro M501) | |
| Lenovo ThinkPad E490-20N8000RGE (Toshiba Exceria Pro M501) | |
| Lenovo ThinkPad E485-20KU000NGE (Toshiba Exceria Pro M501) | |
| Average of class Office (22.4 - 198.5, n=21, last 2 years) | |
| Dell Latitude 3490 (Toshiba Exceria Pro SDXC 64 GB UHS-II) | |
| Acer TravelMate X3410-M-866T (Toshiba Exceria Pro SDXC 64 GB UHS-II) | |
| Acer TravelMate X3410-M-50DD (Toshiba Exceria Pro SDXC 64 GB UHS-II) | |
| Acer TravelMate 2410-G2-MG-82E6 (Toshiba Exceria Pro SDXC 64 GB UHS-II) | |
| maximum AS SSD Seq Read Test (1GB) | |
| Dell Latitude 14 5495 (Toshiba Exceria Pro SDXC 64 GB UHS-II) | |
| Lenovo ThinkPad E480-20KNCTO1WW (Toshiba Exceria Pro M501) | |
| HP ProBook 445 G6 (Toshiba Exceria Pro SDXC 64 GB UHS-II) | |
| Lenovo ThinkPad E490-20N8000RGE (Toshiba Exceria Pro M501) | |
| Lenovo ThinkPad E480-20KQS00000 (Toshiba Exceria Pro M501) | |
| Lenovo ThinkPad E485-20KU000NGE (Toshiba Exceria Pro M501) | |
| HP ProBook 440 G6-5TK01EA (Toshiba Exceria Pro SDXC 64 GB UHS-II) | |
| Average of class Office (27.4 - 249, n=20, last 2 years) | |
| Acer TravelMate X3410-M-50DD (Toshiba Exceria Pro SDXC 64 GB UHS-II) | |
| Dell Latitude 3490 (Toshiba Exceria Pro SDXC 64 GB UHS-II) | |
| Acer TravelMate 2410-G2-MG-82E6 (Toshiba Exceria Pro SDXC 64 GB UHS-II) | |
| Acer TravelMate X3410-M-866T (Toshiba Exceria Pro SDXC 64 GB UHS-II) | |
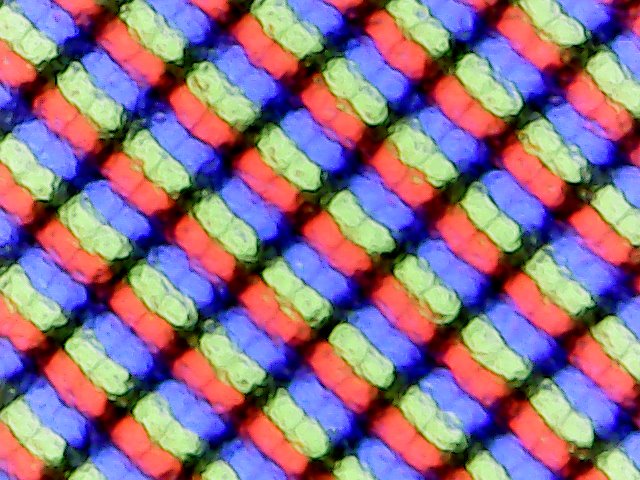
Display - IPS on board
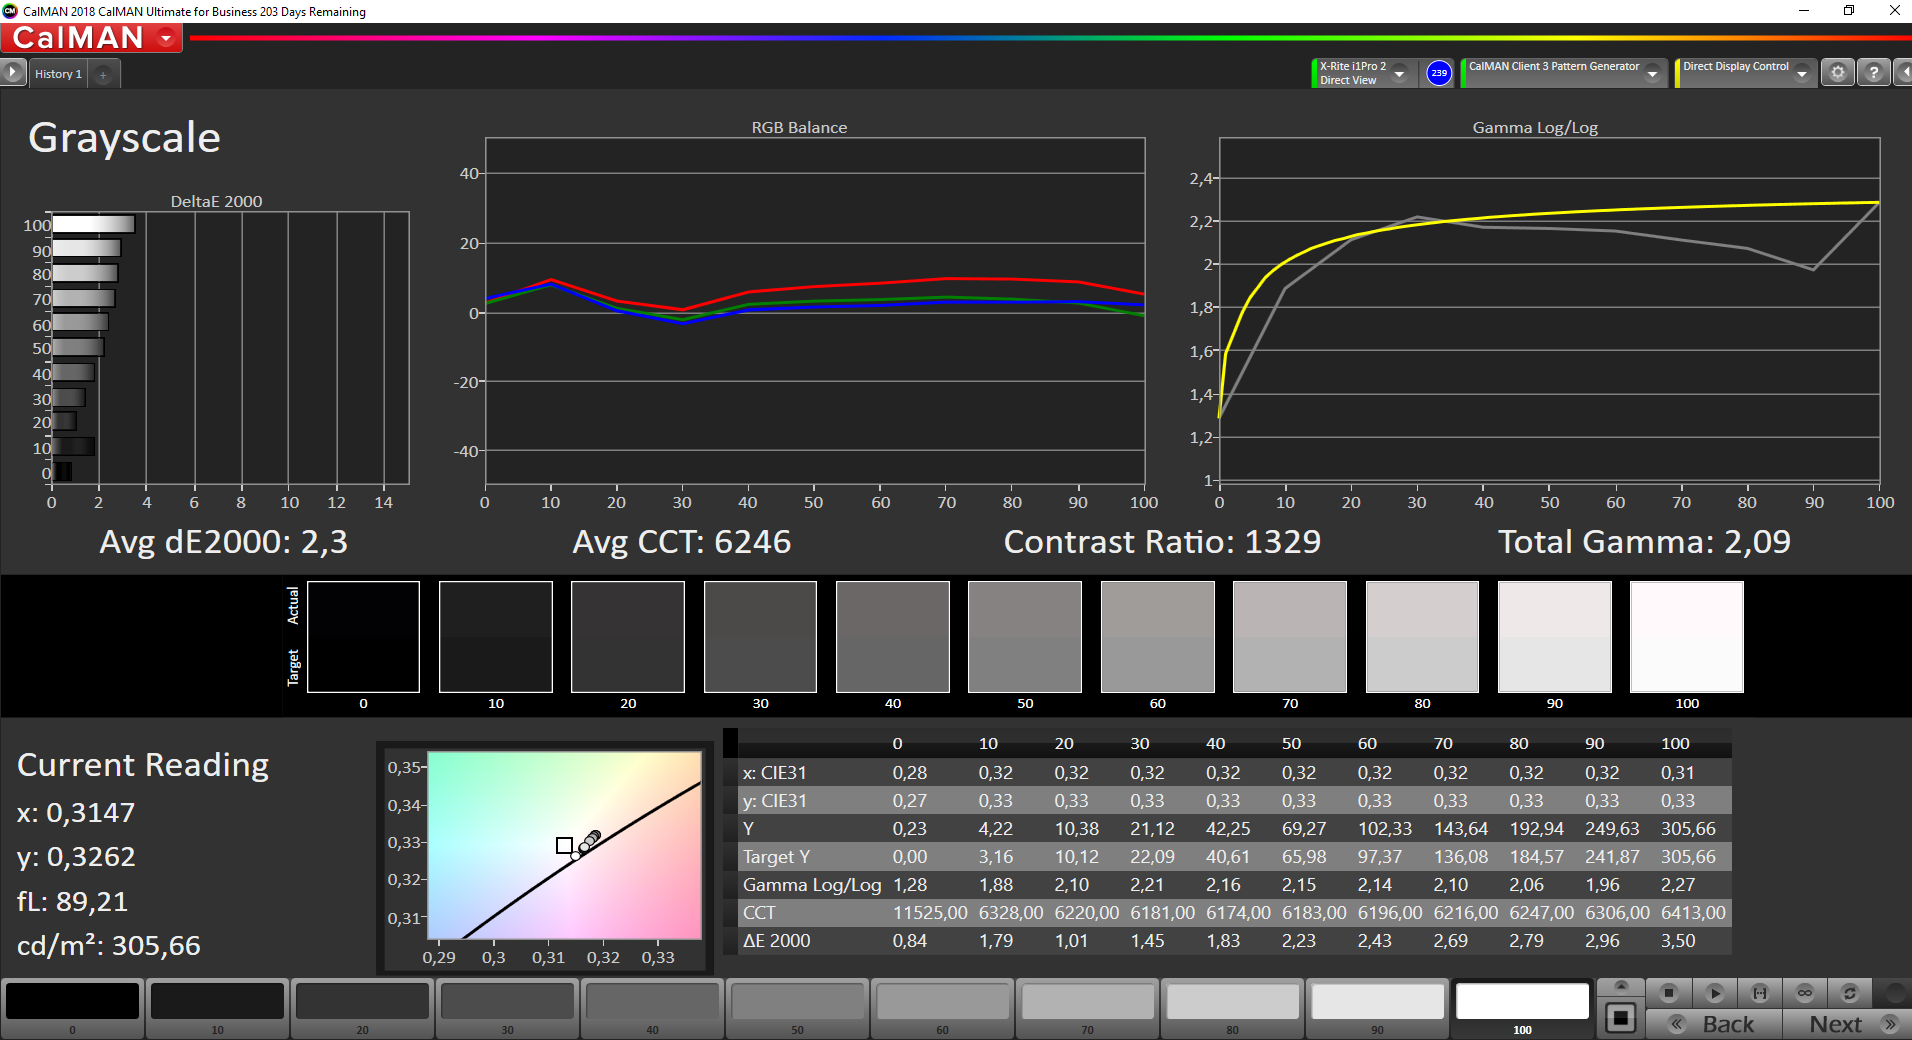
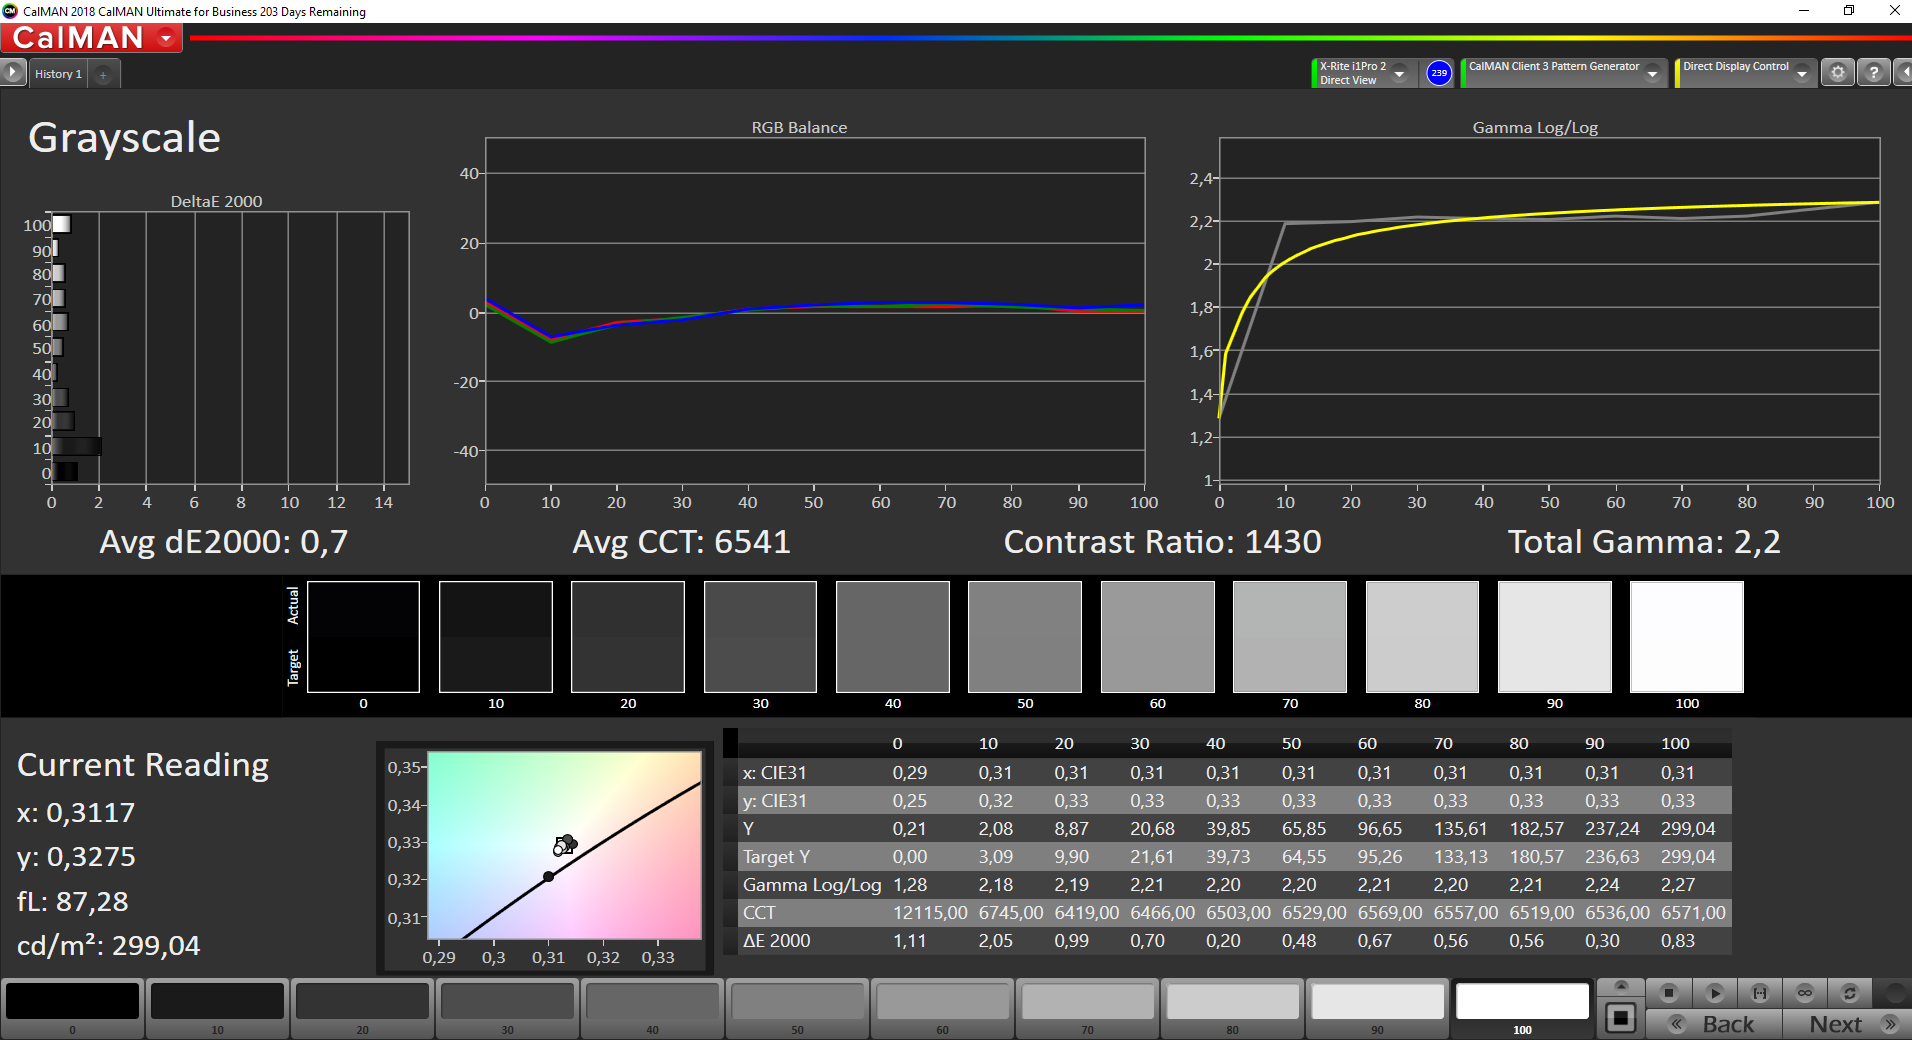
The matte 14-inch display of the Lenovo E490 has a native resolution of 1920x1080 pixels. The display offers a good contrast ratio (1326:1), and while the brightness (294.6 cd/m²) is okay, it barely misses our target set at 300 cd/m². Nonetheless, the ThinkPad offers the brightest display within our comparison field, and at the same time it also is the model with the best brightness distribution.
With black screen contents you can see some halos, but they are not very noticeable in daily operation. Unfortunately, the display shows some PWM flicker at brightness levels below 99%. The frequency is 1250 Hz, so sensitive people should not be bothered by problems such as headaches or eye problems with this relatively high frequency.

| |||||||||||||||||||||||||
Brightness Distribution: 90 %
Center on Battery: 305 cd/m²
Contrast: 1326:1 (Black: 0.23 cd/m²)
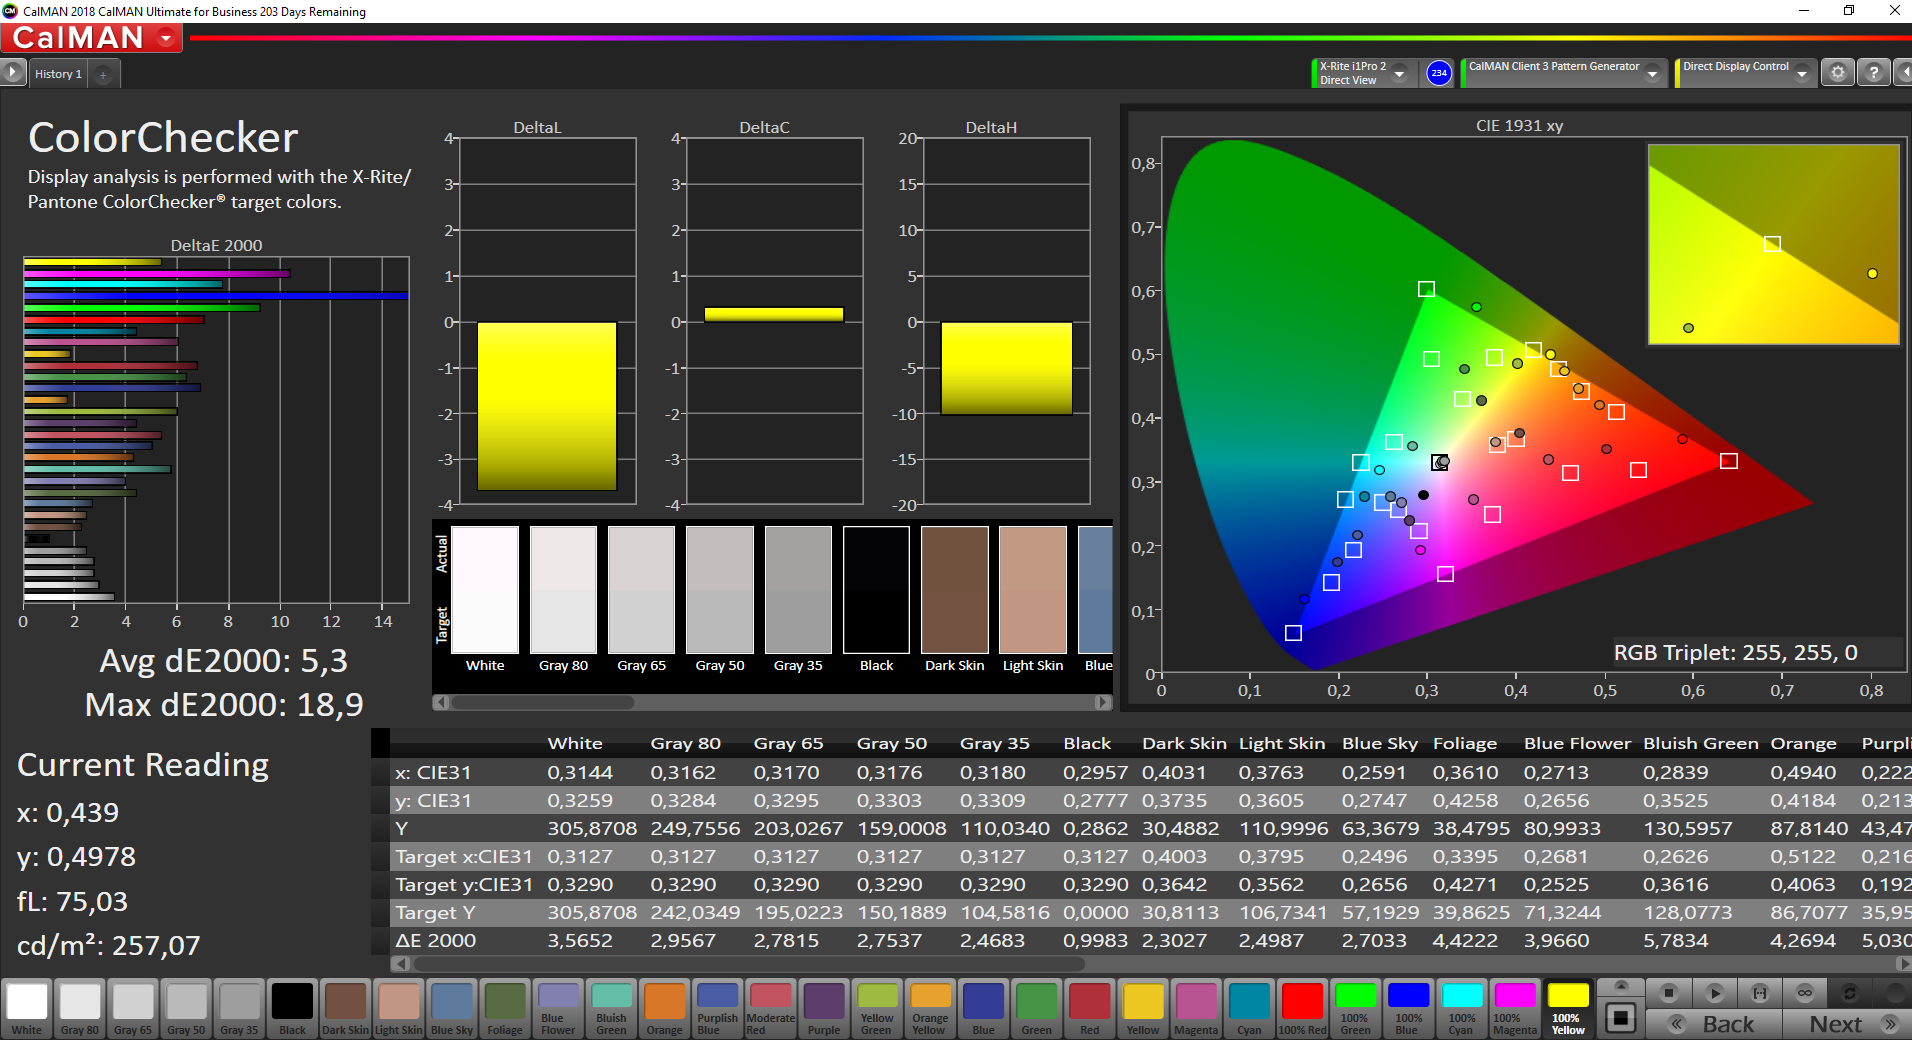
ΔE ColorChecker Calman: 5.3 | ∀{0.5-29.43 Ø4.73}
calibrated: 5
ΔE Greyscale Calman: 2.3 | ∀{0.09-98 Ø4.97}
58.2% sRGB (Argyll 1.6.3 3D)
37.7% AdobeRGB 1998 (Argyll 1.6.3 3D)
41.18% AdobeRGB 1998 (Argyll 3D)
58.6% sRGB (Argyll 3D)
39.85% Display P3 (Argyll 3D)
Gamma: 2.09
CCT: 6246 K
| Lenovo ThinkPad E490-20N8000RGE IPS, 1920x1080, 14" | Lenovo ThinkPad E480-20KNCTO1WW IPS LED, 1920x1080, 14" | Lenovo ThinkPad E480-20KQS00000 IPS LED, 1920x1080, 14" | Lenovo ThinkPad E485-20KU000NGE IPS, 1920x1080, 14" | HP ProBook 440 G6-5TK01EA IPS, 1920x1080, 14" | HP ProBook 445 G6 IPS, 1920x1080, 14" | Dell Latitude 3490 IPS LED, 1920x1080, 14" | Acer TravelMate 2410-G2-MG-82E6 IPS, 1920x1080, 14" | |
|---|---|---|---|---|---|---|---|---|
| Display | 5% | 6% | -2% | -3% | 5% | 1% | 2% | |
| Display P3 Coverage (%) | 39.85 | 41.56 4% | 41.88 5% | 39.21 -2% 38.48 -3% | 38.08 -4% | 41.53 4% | 39.81 0% | 40.28 1% |
| sRGB Coverage (%) | 58.6 | 62.2 6% | 62.8 7% | 58.8 0% 57.9 -1% | 57.2 -2% | 62 6% | 59.6 2% | 60.4 3% |
| AdobeRGB 1998 Coverage (%) | 41.18 | 42.96 4% | 43.29 5% | 40.52 -2% 39.76 -3% | 39.37 -4% | 42.94 4% | 41.16 0% | 41.65 1% |
| Response Times | 13% | 14% | 10% | 22% | 25% | 31% | 34% | |
| Response Time Grey 50% / Grey 80% * (ms) | 48.4 ? | 44.8 ? 7% | 44 ? 9% | 44.8 ? 7% | 41.6 ? 14% | 40 ? 17% | 36.4 ? 25% | 34 ? 30% |
| Response Time Black / White * (ms) | 38.4 ? | 31.2 ? 19% | 31.2 ? 19% | 33.6 ? 12% | 27.2 ? 29% | 26 ? 32% | 24 ? 37% | 24 ? 37% |
| PWM Frequency (Hz) | 1250 ? | 25000 ? | 24880 ? | 208 ? | 25000 ? | |||
| Screen | -24% | -7% | -1% | -13% | -3% | -14% | -2% | |
| Brightness middle (cd/m²) | 305 | 262 -14% | 251 -18% | 289 -5% | 256 -16% | 200 -34% | 250 -18% | 265 -13% |
| Brightness (cd/m²) | 295 | 245 -17% | 231 -22% | 271 -8% | 238 -19% | 196 -34% | 241 -18% | 239 -19% |
| Brightness Distribution (%) | 90 | 83 -8% | 80 -11% | 87 -3% | 85 -6% | 67 -26% | 81 -10% | 85 -6% |
| Black Level * (cd/m²) | 0.23 | 0.19 17% | 0.19 17% | 0.19 17% | 0.23 -0% | 0.17 26% | 0.25 -9% | 0.37 -61% |
| Contrast (:1) | 1326 | 1379 4% | 1321 0% | 1521 15% | 1113 -16% | 1176 -11% | 1000 -25% | 716 -46% |
| Colorchecker dE 2000 * | 5.3 | 7 -32% | 5.1 4% | 5.6 -6% | 6.2 -17% | 4.26 20% | 5.5 -4% | 3.93 26% |
| Colorchecker dE 2000 max. * | 18.9 | 23.6 -25% | 10.6 44% | 20.8 -10% | 18.2 4% | 9.7 49% | 23.5 -24% | 8.79 53% |
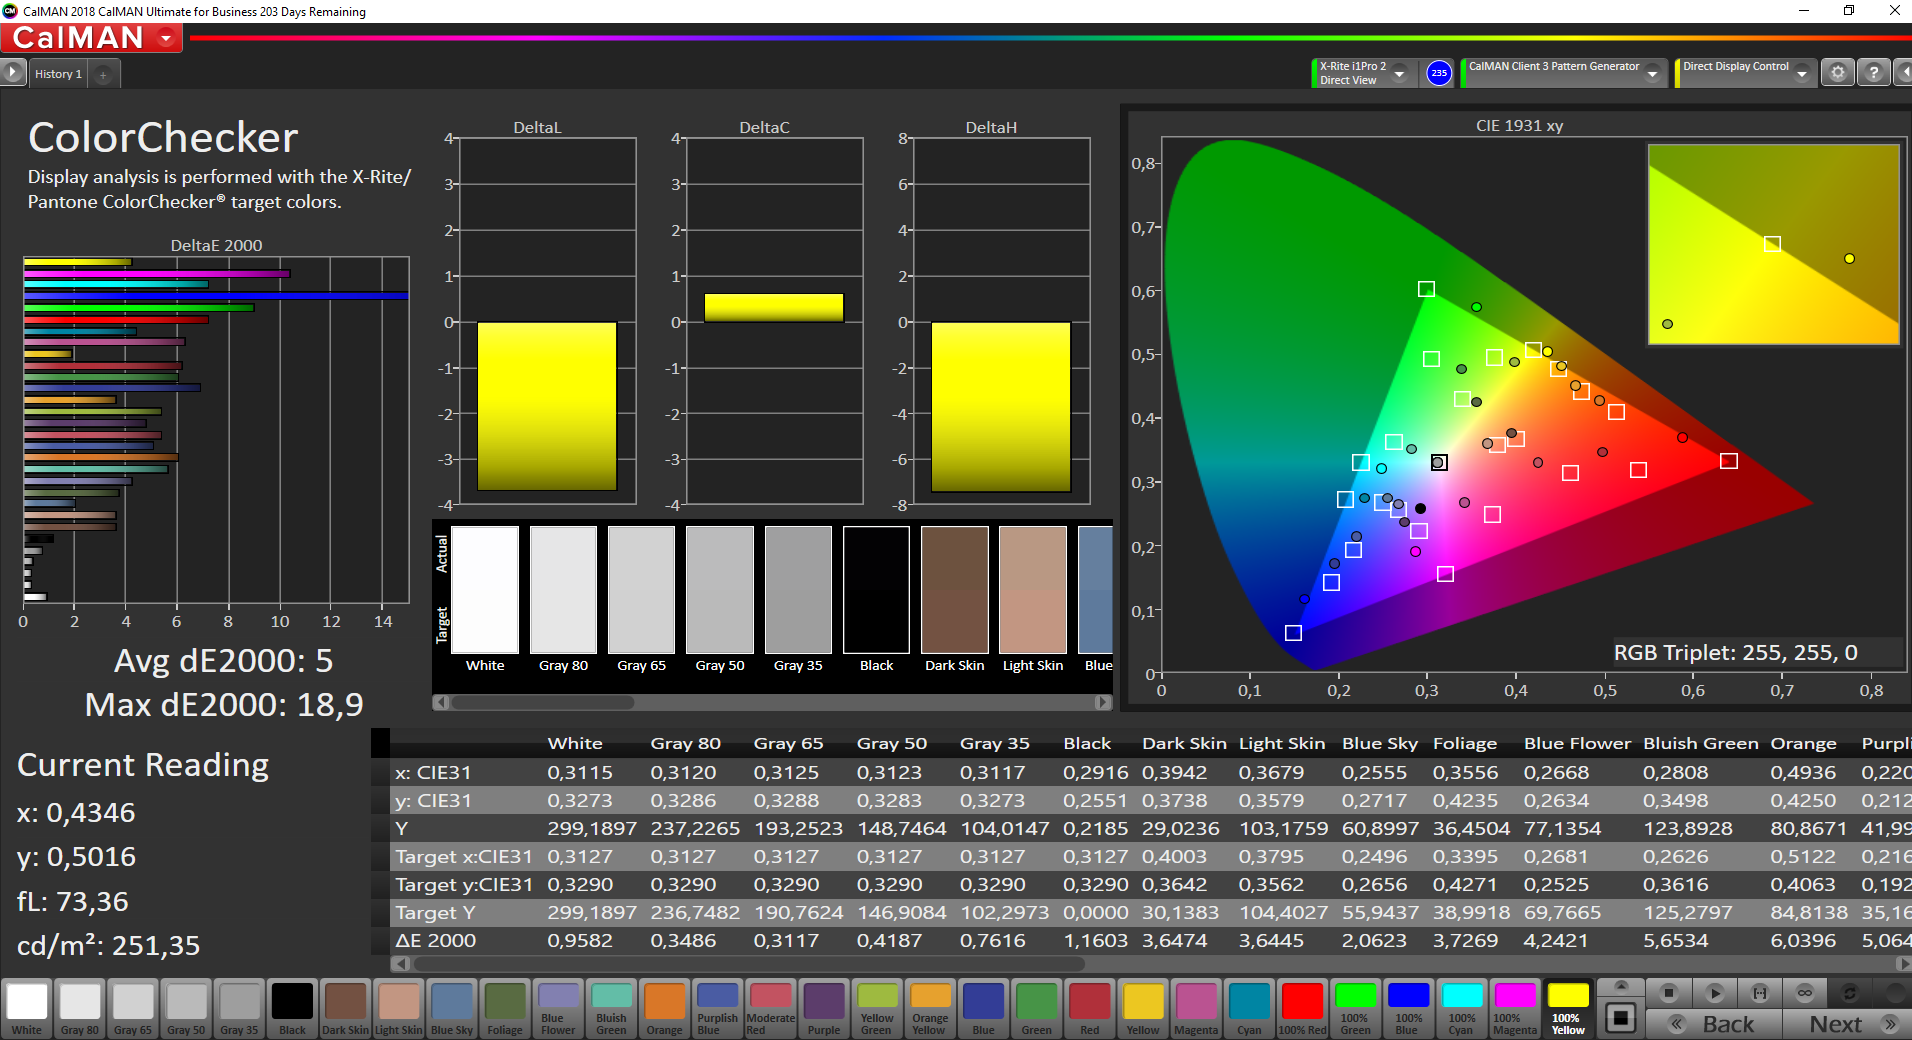
| Colorchecker dE 2000 calibrated * | 5 | 4.7 6% | 5.2 -4% | 4.8 4% | 3.13 37% | |||
| Greyscale dE 2000 * | 2.3 | 6.4 -178% | 4.5 -96% | 2.7 -17% | 3.8 -65% | 3.15 -37% | 3.5 -52% | 2.29 -0% |
| Gamma | 2.09 105% | 2.14 103% | 2.18 101% | 1.96 112% | 2.5 88% | 2.31 95% | 2.27 97% | 2.33 94% |
| CCT | 6246 104% | 6065 107% | 6146 106% | 6506 100% | 6643 98% | 6882 94% | 7049 92% | 6951 94% |
| Color Space (Percent of AdobeRGB 1998) (%) | 37.7 | 39.5 5% | 39.8 6% | 37.2 -1% | 36.1 -4% | 40 6% | 37.9 1% | 38 1% |
| Color Space (Percent of sRGB) (%) | 58.2 | 61.9 6% | 62.5 7% | 58.5 1% | 56.9 -2% | 62 7% | 59.4 2% | 60 3% |
| Total Average (Program / Settings) | -2% /
-13% | 4% /
-2% | 2% /
-0% | 2% /
-7% | 9% /
2% | 6% /
-6% | 11% /
3% |
* ... smaller is better
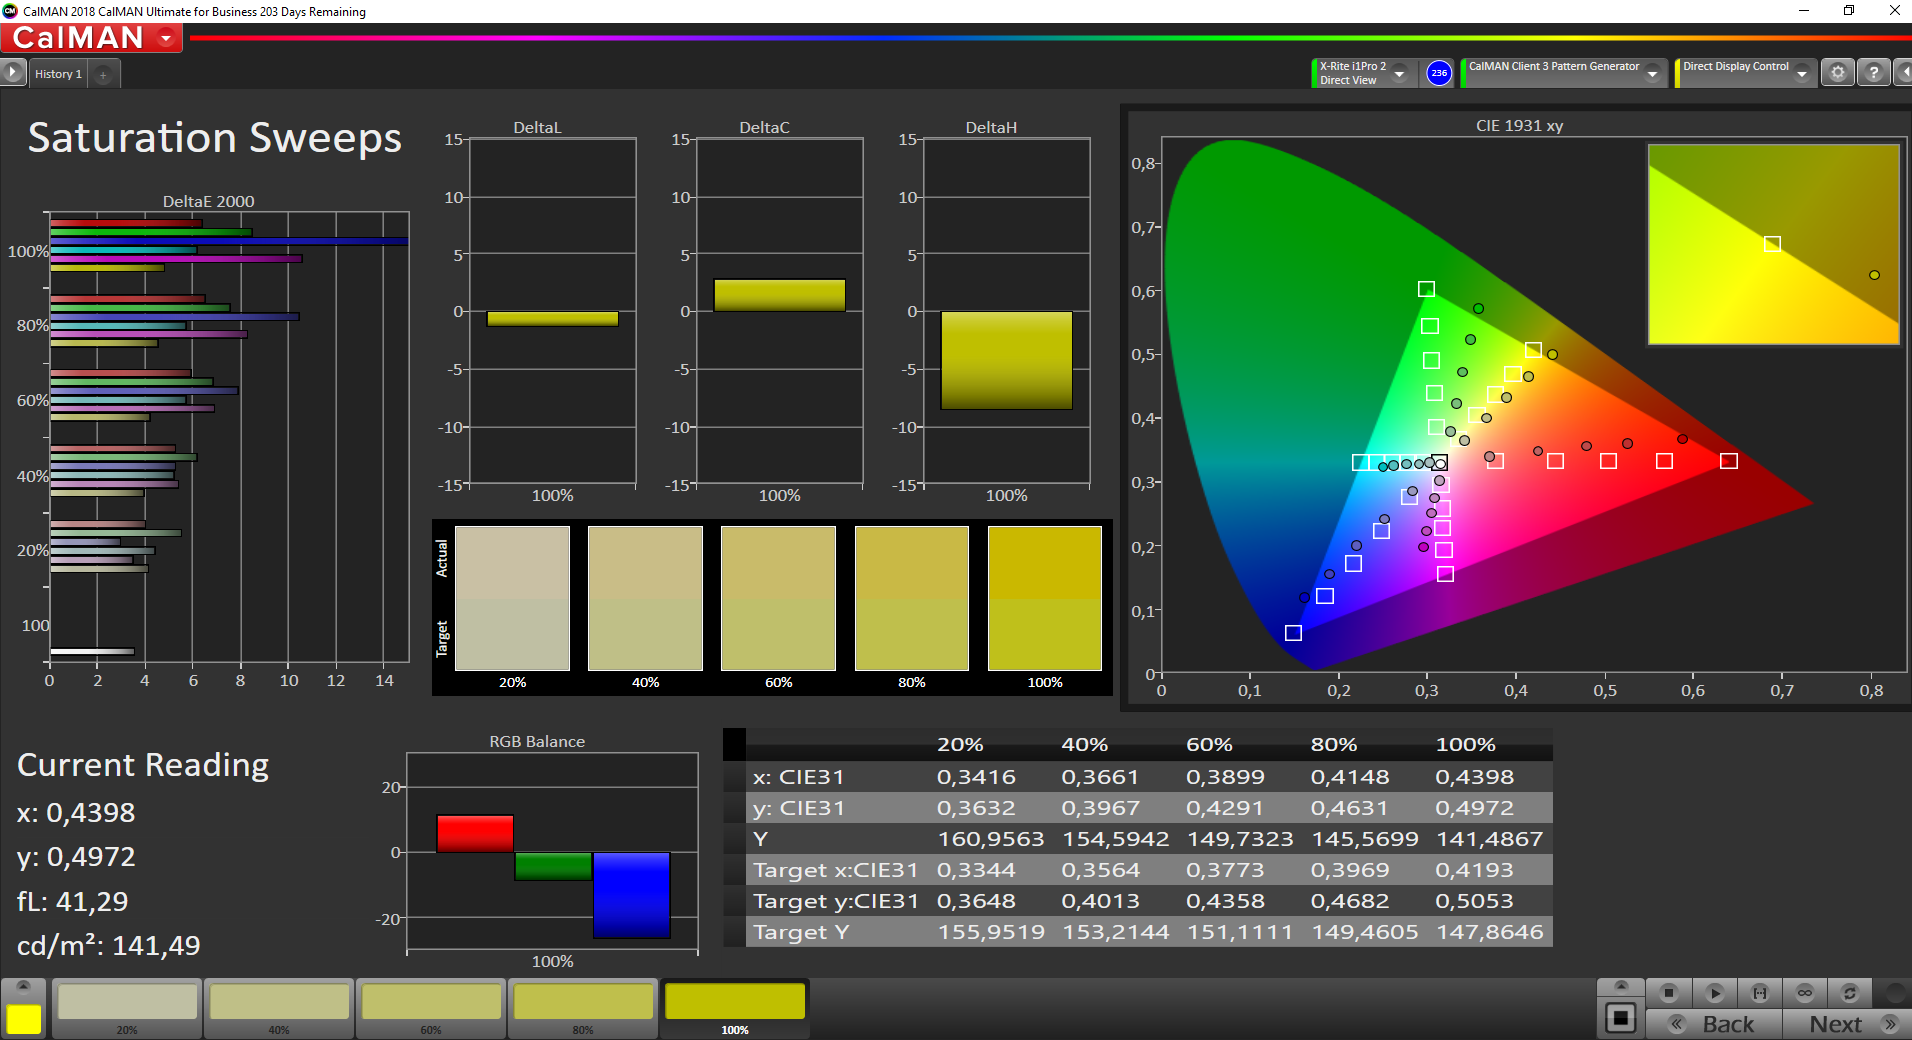
In the state of delivery, the color reproduction can be called average at best. With a DeltaE-2000 color deviation of 5.3, the target (DeltaE < 3) is missed. The display does not suffer from a blue tint. A calibration can bring a slight improvement in the color reproduction: The deviation drops to a value of 5 and the Grayscales are reproduced clearly more balanced. The display is unable to reproduce the AdobeRGB and sRGB color spaces, with the coverage rates being 37.7% (AdobeRGB) and 58.2% (sRGB).
By using the color profile we are offering, the color reproduction of the display can be adjusted according to our calibration. However, you need to make sure that you have the same display model (manufacturer + model number) as our test unit, otherwise the color reproduction can become worse instead of improving. Often displays from different manufacturers are used within a notebook series.
Display Response Times
| ↔ Response Time Black to White | ||
|---|---|---|
| 38.4 ms ... rise ↗ and fall ↘ combined | ↗ 21.2 ms rise | 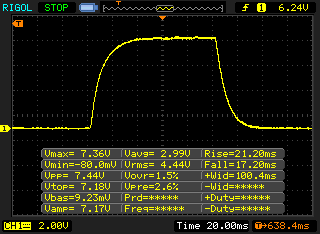 |
| ↘ 17.2 ms fall | ||
| The screen shows slow response rates in our tests and will be unsatisfactory for gamers. In comparison, all tested devices range from 0.1 (minimum) to 240 (maximum) ms. » 96 % of all devices are better. This means that the measured response time is worse than the average of all tested devices (19.9 ms). | ||
| ↔ Response Time 50% Grey to 80% Grey | ||
| 48.4 ms ... rise ↗ and fall ↘ combined | ↗ 25.2 ms rise | 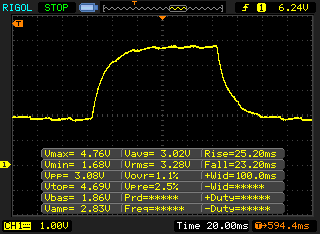 |
| ↘ 23.2 ms fall | ||
| The screen shows slow response rates in our tests and will be unsatisfactory for gamers. In comparison, all tested devices range from 0.165 (minimum) to 636 (maximum) ms. » 84 % of all devices are better. This means that the measured response time is worse than the average of all tested devices (31.1 ms). | ||
Screen Flickering / PWM (Pulse-Width Modulation)
| Screen flickering / PWM detected | 1250 Hz | ≤ 99 % brightness setting | 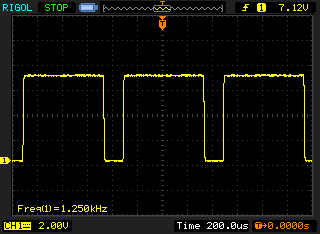 |
The display backlight flickers at 1250 Hz (worst case, e.g., utilizing PWM) Flickering detected at a brightness setting of 99 % and below. There should be no flickering or PWM above this brightness setting. The frequency of 1250 Hz is quite high, so most users sensitive to PWM should not notice any flickering. In comparison: 52 % of all tested devices do not use PWM to dim the display. If PWM was detected, an average of 7794 (minimum: 5 - maximum: 343500) Hz was measured. | |||
Lenovo has equipped the E490 with an IPS panel with stable viewing angles, so you can read the screen from any position. Outdoors, reading the screen is only possible when the sun is not too bright.
Performance - Sufficient for office and Internet
With the Lenovo ThinkPad E490, you get a mobile work notebook in the 14-inch format. It offers more than enough computing performance for office and Internet applications. You have to pay about 700 to 750 Euros (~$780-835) for our test unit, and many other equipment variants are also available. At the time of our test, you can find the most affordable model (519 Euros: Core i3-8145U, 128 GB NVMe-SSD; ~$578, starting from $583 with 500 GB hard drive in the US) in the Lenovo store. However, this model only offers an HD display with unstable viewing angles.

Processor
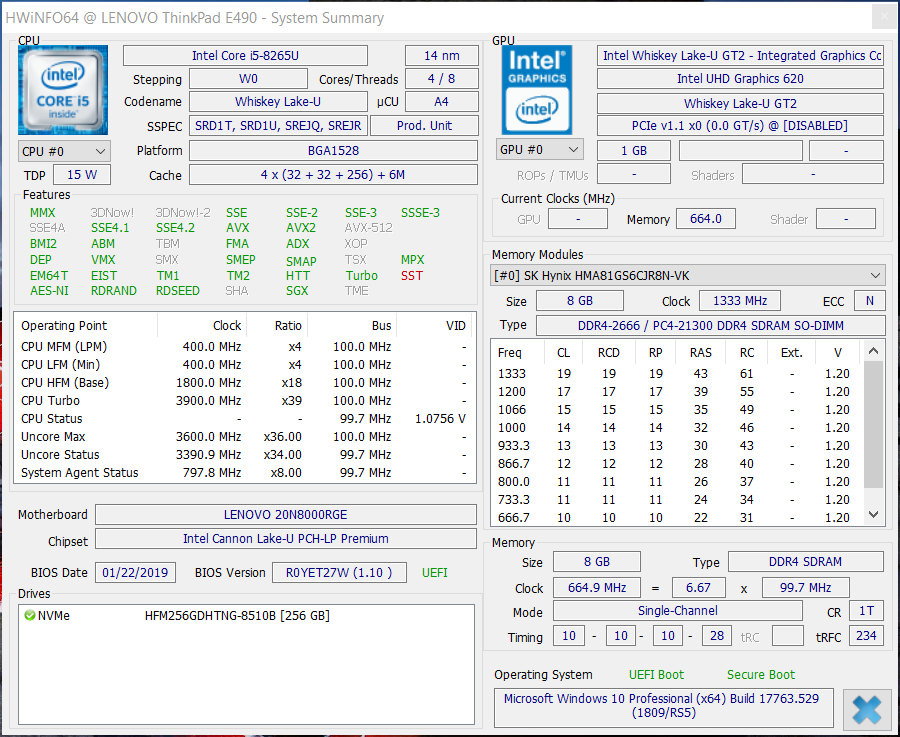
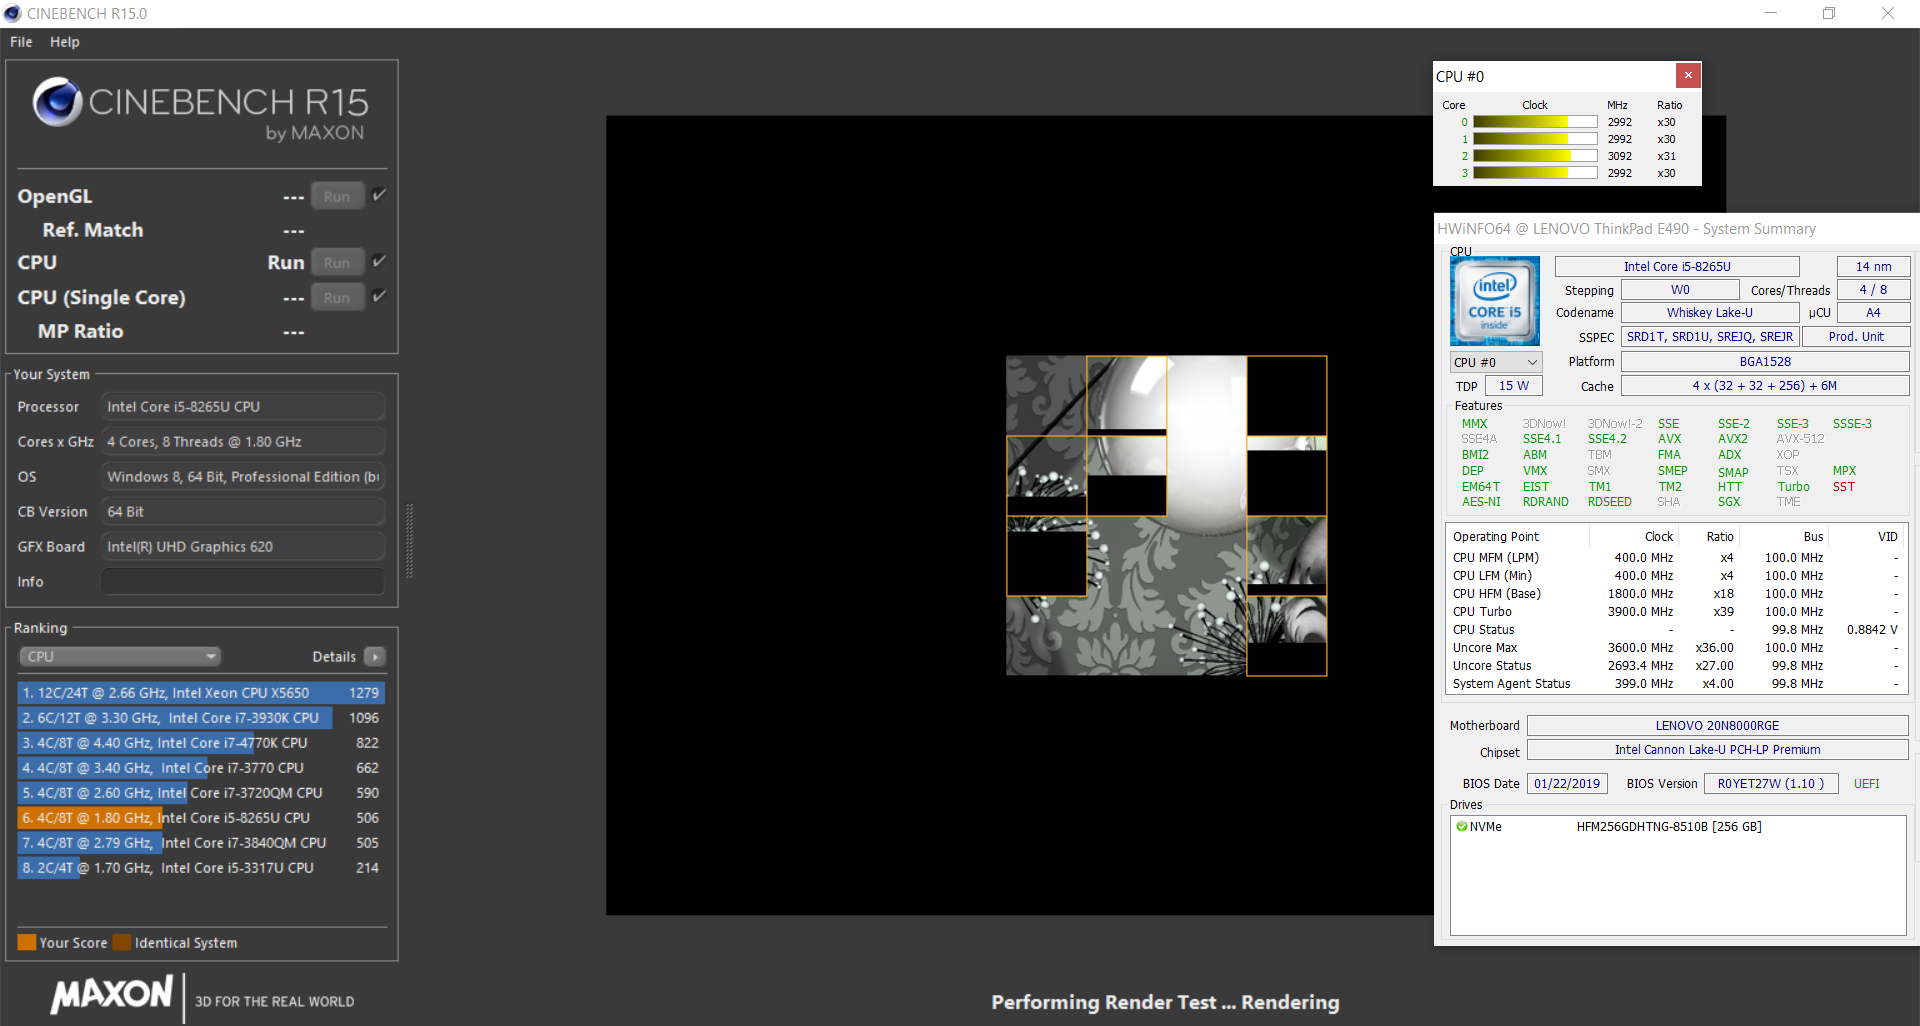
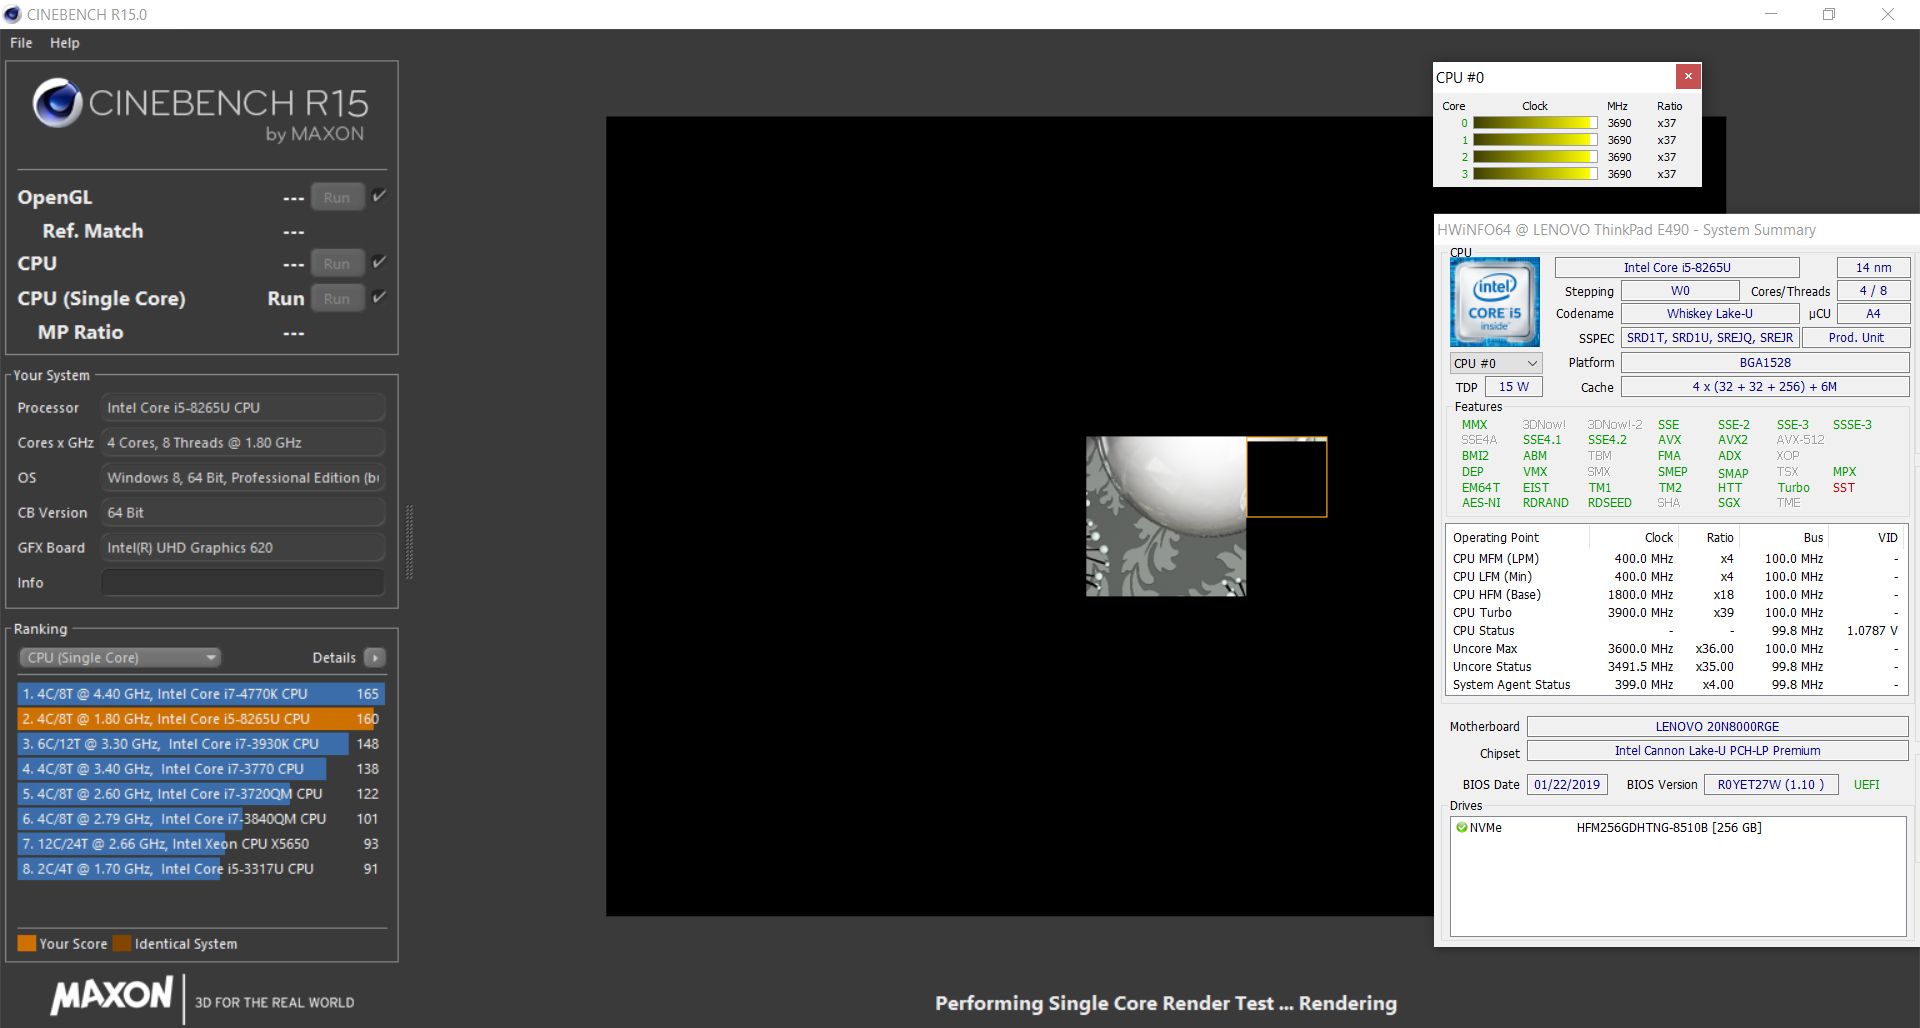
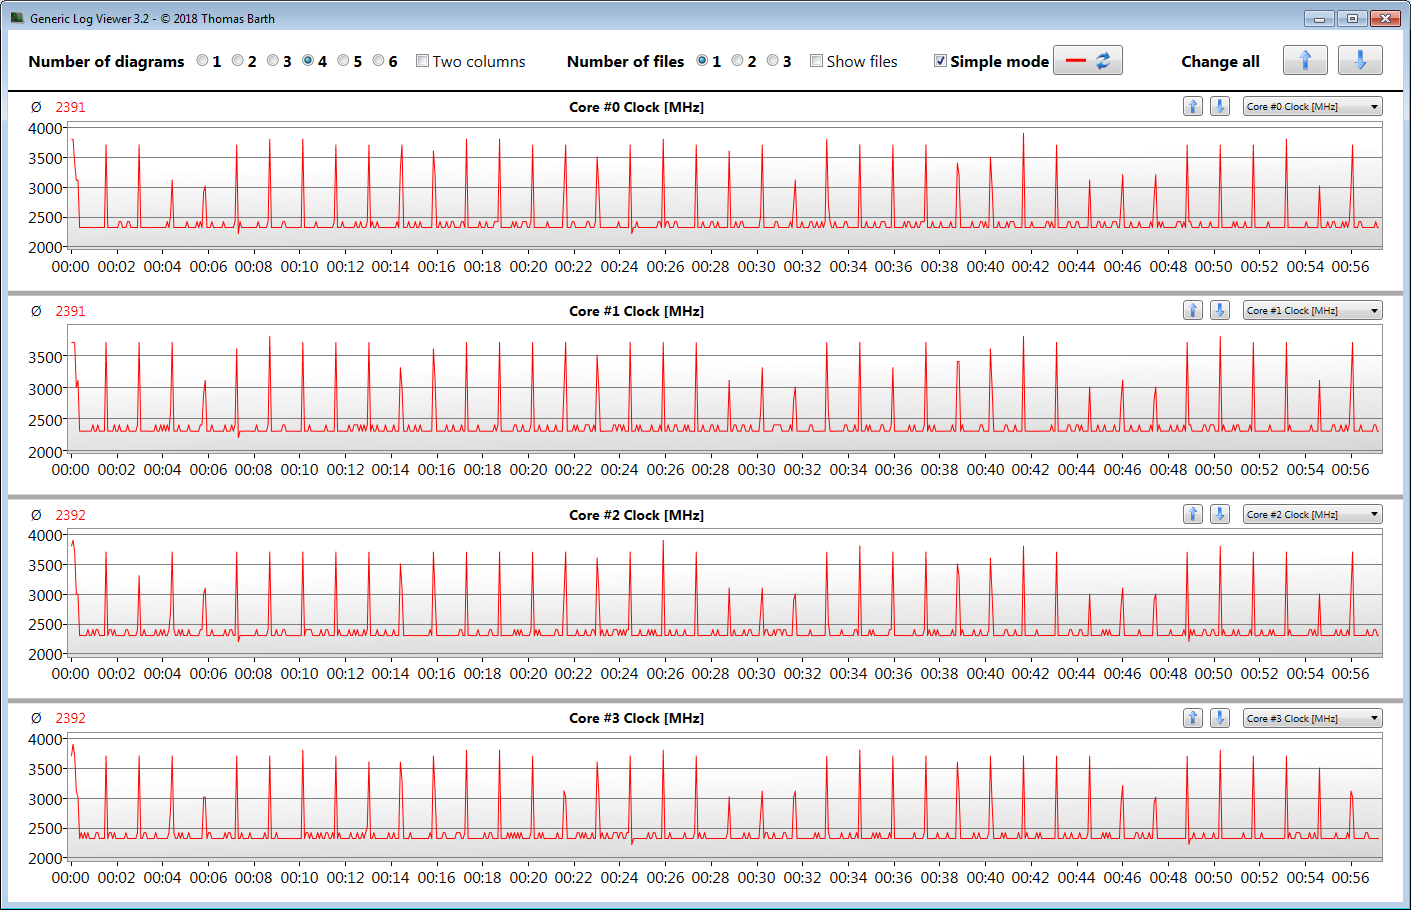
The Core i5-8265U quad-core processor built into the E490 represents Intel's current mid-range CPU from the ULV segment. This model is based on Intel's Whiskey Lake architecture and has a TDP of 15 watts. Lenovo allows increasing this up to 25 watts. The processor strikes a good figure in all the usual application areas and should satisfy the demands of most users. It runs at a basic clock speed of 1.6 GHz, which can be increased via Turbo to 3.7 GHz (all four cores), 3.8 GHz (two cores), and 3.9 GHz (single core).
During the multi-thread tests of the Cinebench benchmarks that we performed, the processor runs at 3 to 3.3 GHz for a short time. After that, the speed drops to 2 to 2.2 GHz. The single-thread tests are run at 3.7 to 3.9 GHz. The behavior is similar in mains and battery operation.
There is no difference between the Whiskey Lake and the Kaby Lake architecture. Thus the Pro-MHz performance is identical. However, the optimized manufacturing process of Whiskey Lake permits higher clock speeds. So the higher operating speeds of the 8265U should ensure a better performance in the CPU tests compared to the predecessor (Core i5-8250U). However, the 8265U of the E490 is only able to gain an advantage in the single-thread tests compared to the 8250U of the E480. In the multi-thread tests, the E480 is slightly ahead. So the i5-8265U is unable to use its Turbo in multi-thread applications to the same extent as the i5-8250U of the E480.
We evaluate whether the Turbo is also used for longer periods by running the multi-thread test of the Cinebench R15 benchmarks in a constant loop for at least 30 minutes. The results drop slightly from the first to the second run and then remain at a constant level. The Turbo is used at a low level.
The Cinebench R15 loop confirms the results of the rest of the CPU tests: The E490 offers a slightly lower multi-thread performance than its predecessor. During the CB15 loop, the Core i5-8265U processor runs at slightly lower speeds than the Core i5-8250U processor built into the ThinkPad E480.
| Geekbench 3 | |
| 32 Bit Multi-Core Score | |
| Average Intel Core i5-8265U (12198 - 14499, n=6) | |
| Lenovo ThinkPad E490-20N8000RGE | |
| HP ProBook 445 G6 | |
| 32 Bit Single-Core Score | |
| Average Intel Core i5-8265U (3470 - 3842, n=6) | |
| Lenovo ThinkPad E490-20N8000RGE | |
| HP ProBook 445 G6 | |
| Mozilla Kraken 1.1 - Total | |
| Lenovo ThinkPad E485-20KU000NGE (Edge 42.17134.1.0) | |
| HP ProBook 445 G6 (Edge 44) | |
| Lenovo ThinkPad E480-20KNCTO1WW (Edge 41.16299.15.0) | |
| Dell Latitude 14 5495 (Edge) | |
| Dell Latitude 3490 (Edge) | |
| Acer TravelMate 2410-G2-MG-82E6 | |
| Lenovo ThinkPad E490-20N8000RGE (Edge 44) | |
| Average Intel Core i5-8265U (851 - 1245, n=25) | |
| Acer TravelMate X3410-M-866T (Microsoft Edge 44.17763.1.0) | |
| Acer TravelMate X3410-M-50DD (Edge) | |
| Lenovo ThinkPad E480-20KQS00000 (Edge) | |
| HP ProBook 440 G6-5TK01EA (EDGE: 42.17134.1.0) | |
| Average of class Office (391 - 1297, n=75, last 2 years) | |
| Octane V2 - Total Score | |
| Average of class Office (49011 - 122119, n=19, last 2 years) | |
| HP ProBook 440 G6-5TK01EA (EDGE: 42.17134.1.0) | |
| Lenovo ThinkPad E480-20KQS00000 (Edge) | |
| Lenovo ThinkPad E490-20N8000RGE (Edge 44) | |
| Average Intel Core i5-8265U (12842 - 35563, n=23) | |
| Dell Latitude 3490 (Edge) | |
| Lenovo ThinkPad E480-20KNCTO1WW (Edge 41.16299.15.0) | |
| Dell Latitude 14 5495 (Edge) | |
| HP ProBook 445 G6 (Edge 44) | |
| Acer TravelMate X3410-M-50DD (Edge) | |
| Lenovo ThinkPad E485-20KU000NGE (Edge 42.17134.1.0) | |
| Acer TravelMate X3410-M-866T (Microsoft Edge 44.17763.1.0) | |
| Speedometer 2.0 - Result 2.0 | |
| Average of class Office (173 - 640, n=17, last 2 years) | |
| Lenovo ThinkPad E490-20N8000RGE (Edge 44) | |
| Average Intel Core i5-8265U (52.6 - 57.9, n=4) | |
| HP ProBook 445 G6 (Edge 44) | |
| Lenovo ThinkPad E485-20KU000NGE (Edge 42.17134.1.0) | |
| JetStream 1.1 - 1.1 Total | |
| HP ProBook 440 G6-5TK01EA (EDGE: 42.17134.1.0) | |
| Lenovo ThinkPad E480-20KQS00000 (Edge) | |
| Lenovo ThinkPad E490-20N8000RGE (Edge 44) | |
| Acer TravelMate X3410-M-866T (Microsoft Edge 44.17763.1.0) | |
| Dell Latitude 3490 (Edge) | |
| Acer TravelMate 2410-G2-MG-82E6 | |
| Average Intel Core i5-8265U (193.7 - 244, n=19) | |
| Lenovo ThinkPad E480-20KNCTO1WW (Edge 41.16299.15.0) | |
| Acer TravelMate X3410-M-50DD (Edge) | |
* ... smaller is better
System Performance
The 14-inch notebook does not lack system performance. The very good results in the PC-Mark benchmarks also confirm this. The built-in hardware ensures a smooth and fast-running system. The processor offers more than enough computing performance for applications from the office or Internet areas. You can achieve a slight increase in the overall performance by adding a second working memory module, since this would activate the dual-channel mode.
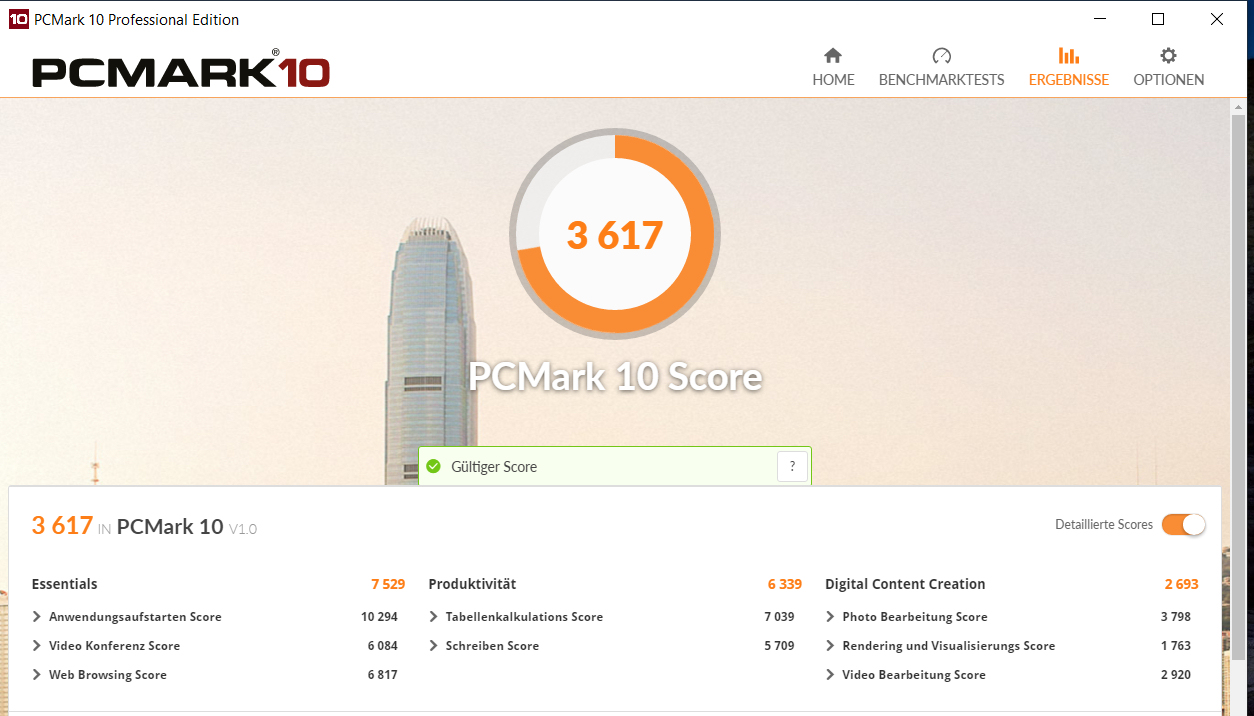
| PCMark 7 Score | 5926 points | |
| PCMark 8 Home Score Accelerated v2 | 3666 points | |
| PCMark 8 Creative Score Accelerated v2 | 4449 points | |
| PCMark 8 Work Score Accelerated v2 | 4637 points | |
| PCMark 10 Score | 3617 points | |
Help | ||
Storage Solution
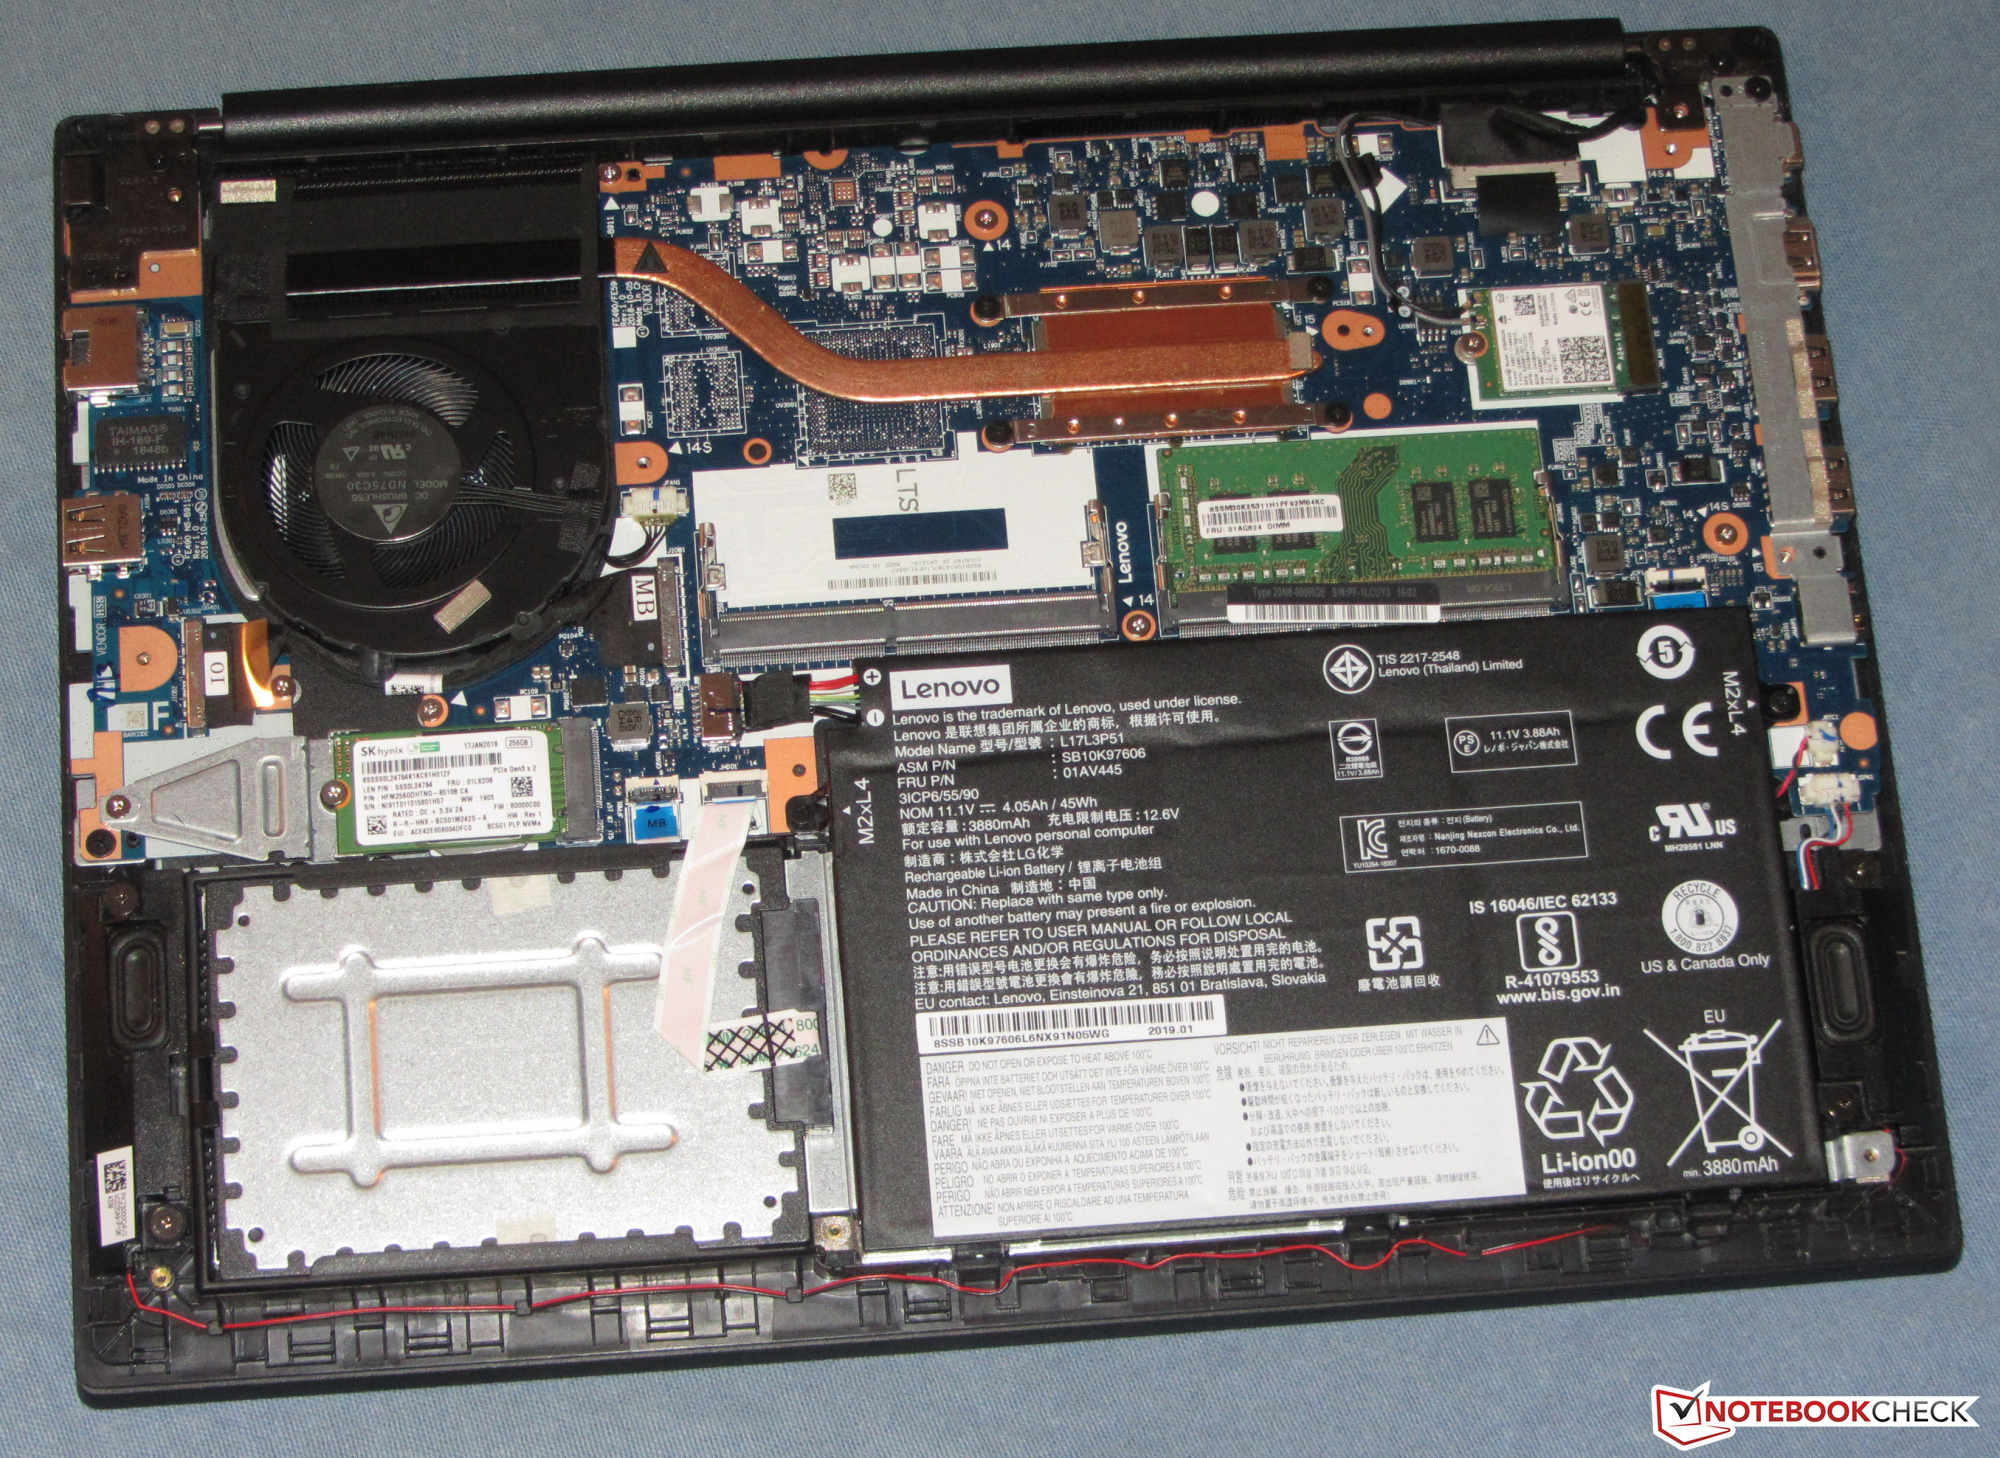
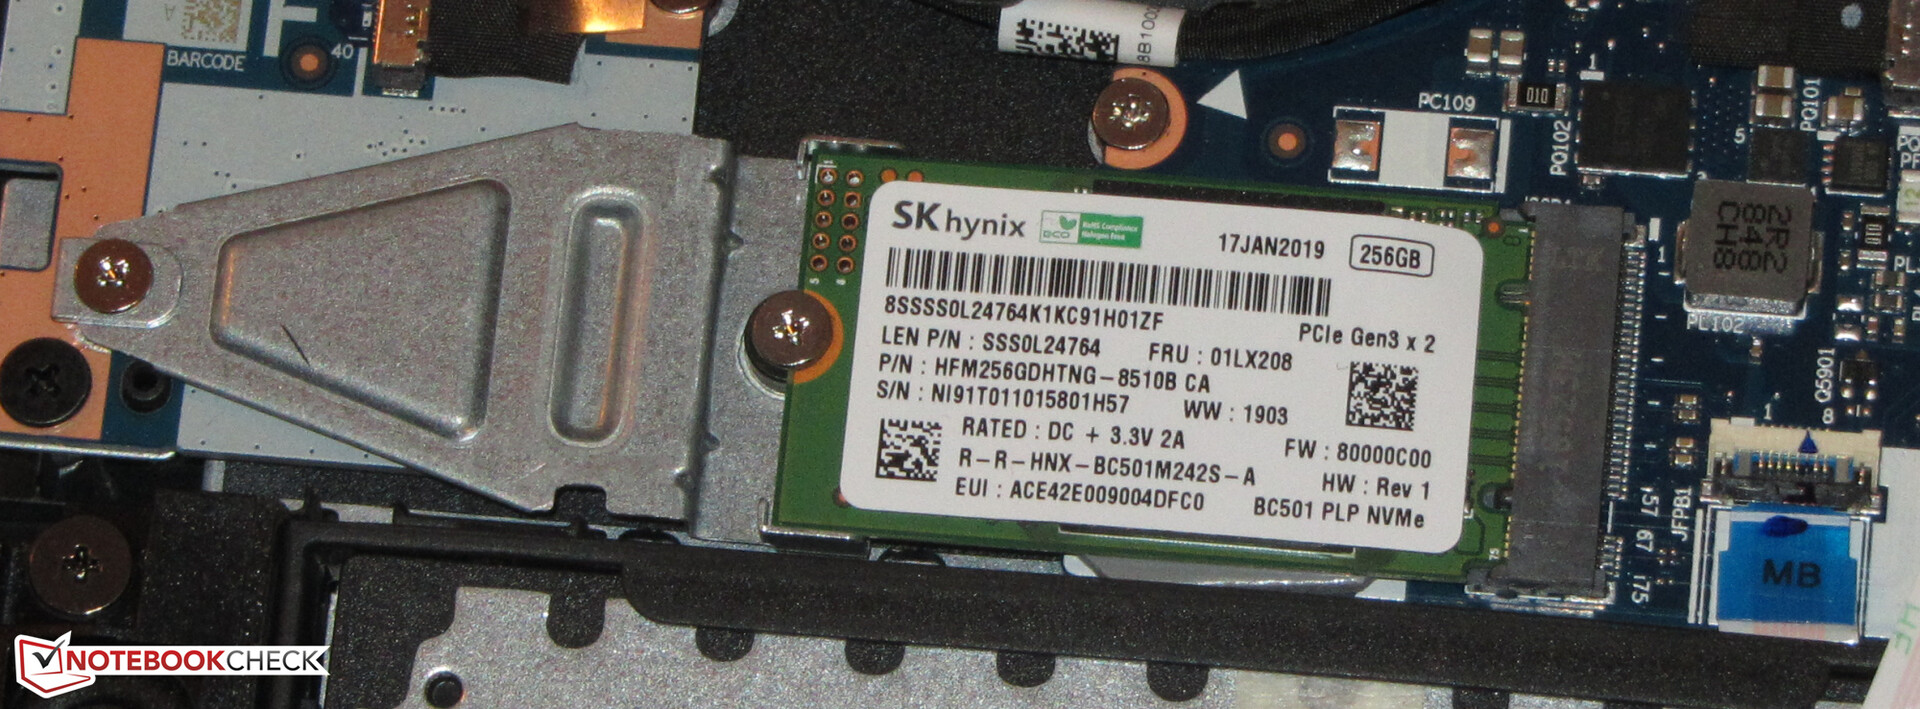
Lenovo has used an NVMe SSD from SK Hynix. This is an M.2-2242 model with an overall capacity of 256 GB. Of that, about 213 GB can still be used in the state of delivery. The remaining storage space is used by the Windows installation and the recovery partition. Although the transfer rates of the SSD turn out well, it does not belong to the top models among the NVMe SSDs. NVMe SSDs can achieve higher transfer rates than SATA-III models (600 Mbps max.), since they are connected via PCI Express 3.0.
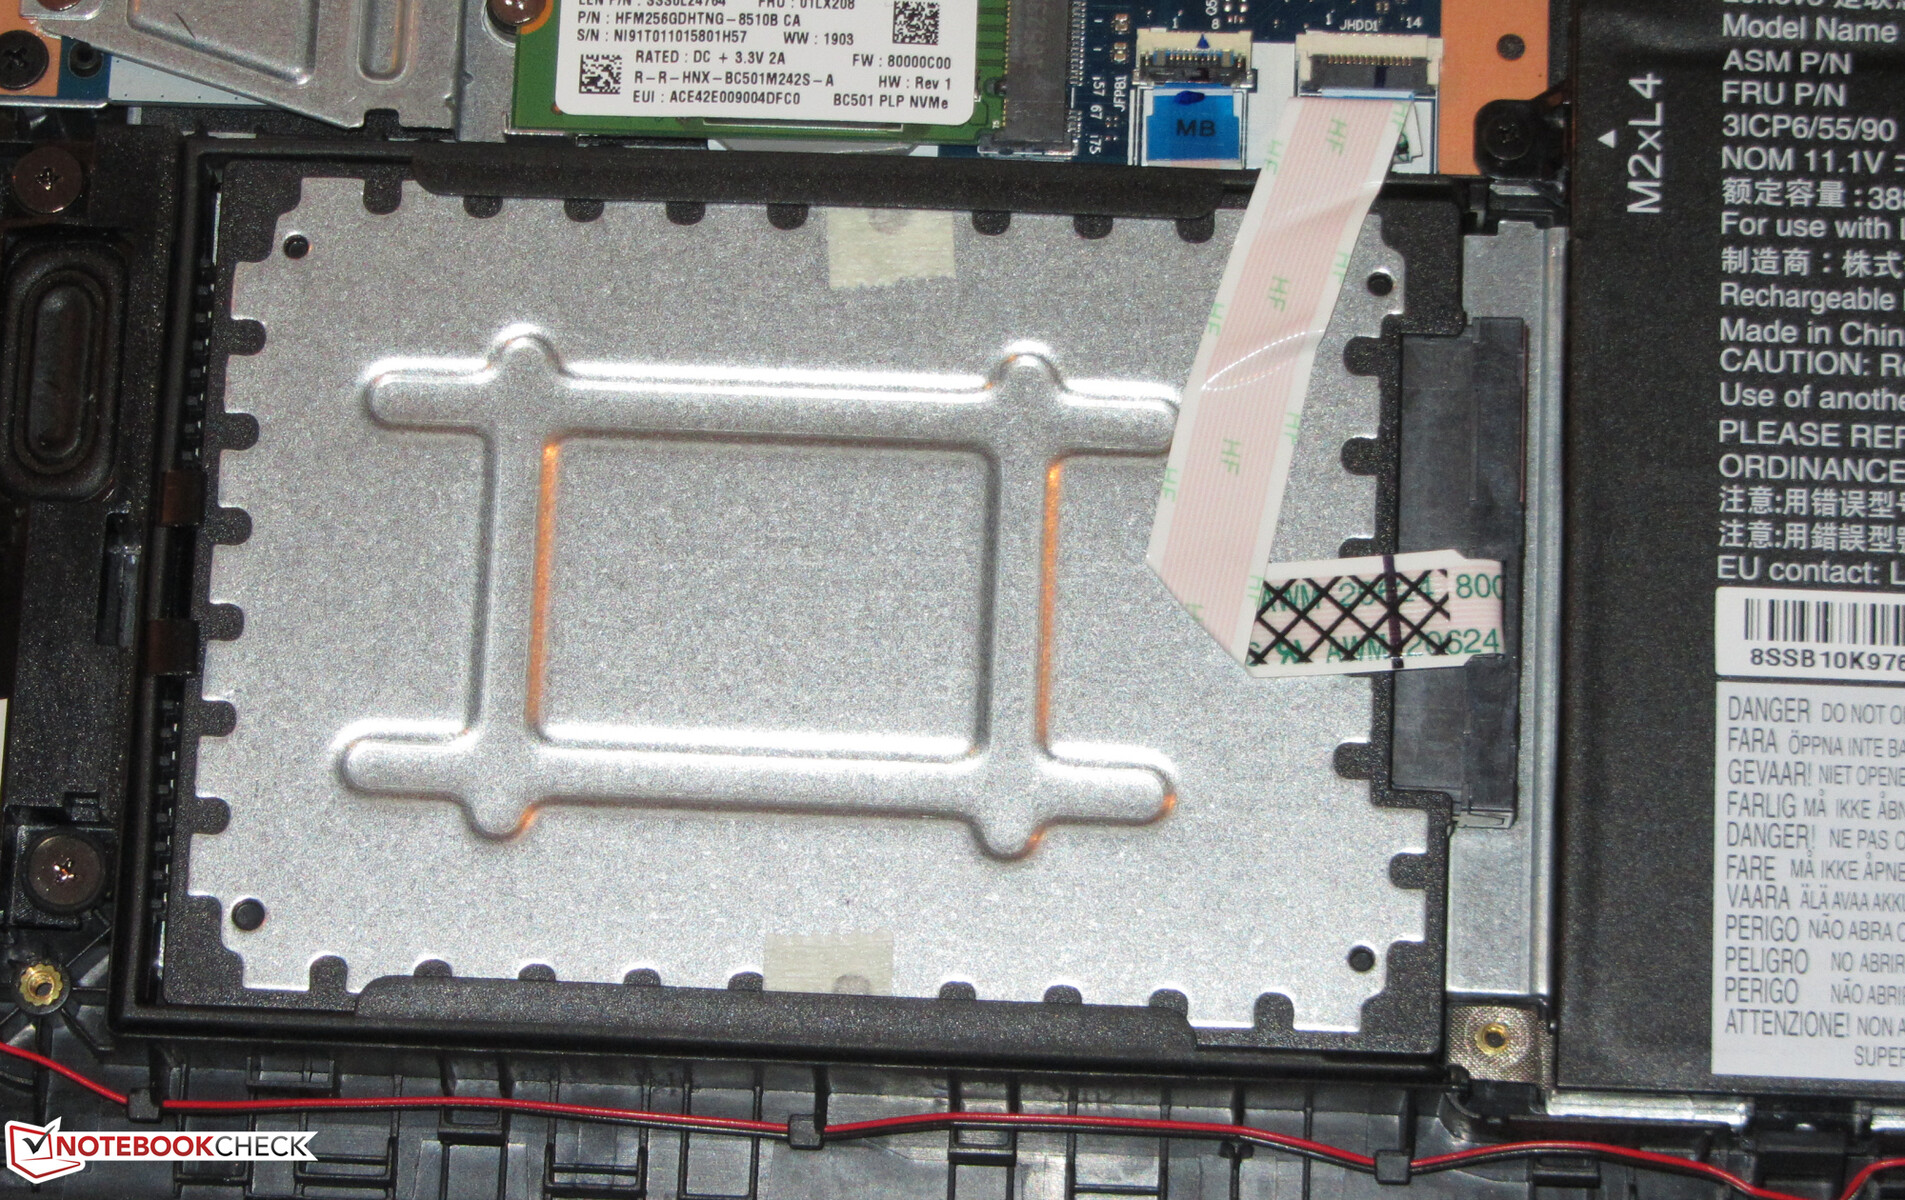
Inside the notebook is an additional empty SATA-III slot, including the frame to install a 2.5-inch hard drive.
Another note: The ThinkPad E480 model that was made available to us had a fairly lame NVMe SSD from Toshiba on board. This SSD is also used in the ThinkPad E490 series as Lenovo's database of replacement parts tells us. Those who want to avoid this SSD if possible, should check which SSD is used before buying a E490 model.

| Lenovo ThinkPad E490-20N8000RGE SK hynix BC501 HFM256GDHTNG | Lenovo ThinkPad E480-20KNCTO1WW Toshiba KBG30ZMT128G | HP ProBook 440 G6-5TK01EA Toshiba XG5 KXG50ZNV512G | HP ProBook 445 G6 SK Hynix BC501 NVMe 256 GB | Dell Latitude 3490 SK hynix SC311 M.2 | Acer TravelMate 2410-G2-MG-82E6 SK Hynix HFS256G39TND-N210A | Lenovo ThinkPad E480-20KQS00000 Lenovo LENSE20256GMSP34MEAT2TA | Lenovo ThinkPad E485-20KU000NGE Samsung PM961 MZVLW256HEHP | Average SK hynix BC501 HFM256GDHTNG | |
|---|---|---|---|---|---|---|---|---|---|
| CrystalDiskMark 5.2 / 6 | -49% | 19% | -4% | -41% | -53% | 13% | 15% | -3% | |
| Write 4K (MB/s) | 110.7 | 81.4 -26% | 117.6 6% | 110.4 0% | 71.7 -35% | 79.1 -29% | 120.3 9% | 72.2 -35% | 116.4 ? 5% |
| Read 4K (MB/s) | 41.02 | 33.74 -18% | 32.61 -21% | 39.46 -4% | 28.66 -30% | 23.41 -43% | 43.48 6% | 35.25 -14% | 40.1 ? -2% |
| Write Seq (MB/s) | 757 | 129 -83% | 527 -30% | 808 7% | 415.9 -45% | 259 -66% | 986 30% | 1412 87% | 773 ? 2% |
| Read Seq (MB/s) | 1037 | 905 -13% | 2181 110% | 1130 9% | 500 -52% | 474 -54% | 1395 35% | 1523 47% | 1099 ? 6% |
| Write 4K Q32T1 (MB/s) | 359 | 107.2 -70% | 508 42% | 260.8 -27% | 278 -23% | 80.3 -78% | 250 -30% | 102.1 -72% | 290 ? -19% |
| Read 4K Q32T1 (MB/s) | 402.4 | 197.1 -51% | 352.1 -12% | 308 -23% | 252.9 -37% | 331.7 -18% | 491.5 22% | 170.9 -58% | 342 ? -15% |
| Write Seq Q32T1 (MB/s) | 833 | 128.9 -85% | 526 -37% | 816 -2% | 502 -40% | 259.9 -69% | 1047 26% | 1429 72% | 818 ? -2% |
| Read Seq Q32T1 (MB/s) | 1635 | 906 -45% | 3135 92% | 1783 9% | 553 -66% | 548 -66% | 1781 9% | 3204 96% | 1648 ? 1% |
Graphics Card
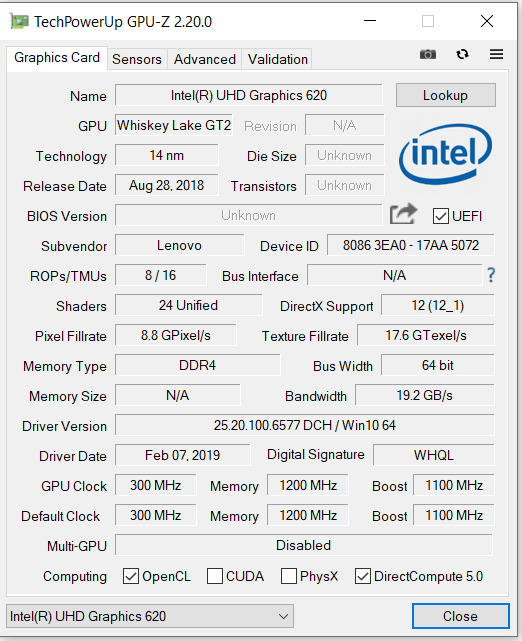
Our test unit does not offer a dedicated GPU. Instead, Intel's UHD Graphics 620 graphics core is responsible for the graphics output. Users who need significantly more graphics performance can choose a E490 model that is equipped with a Radeon RX-550X graphics core. We will publish a review of such a model shortly. As an alternative, you could get a ThinkPad E495 model, whose integrated Vega GPUs offer a lot more performance than those from Intel.
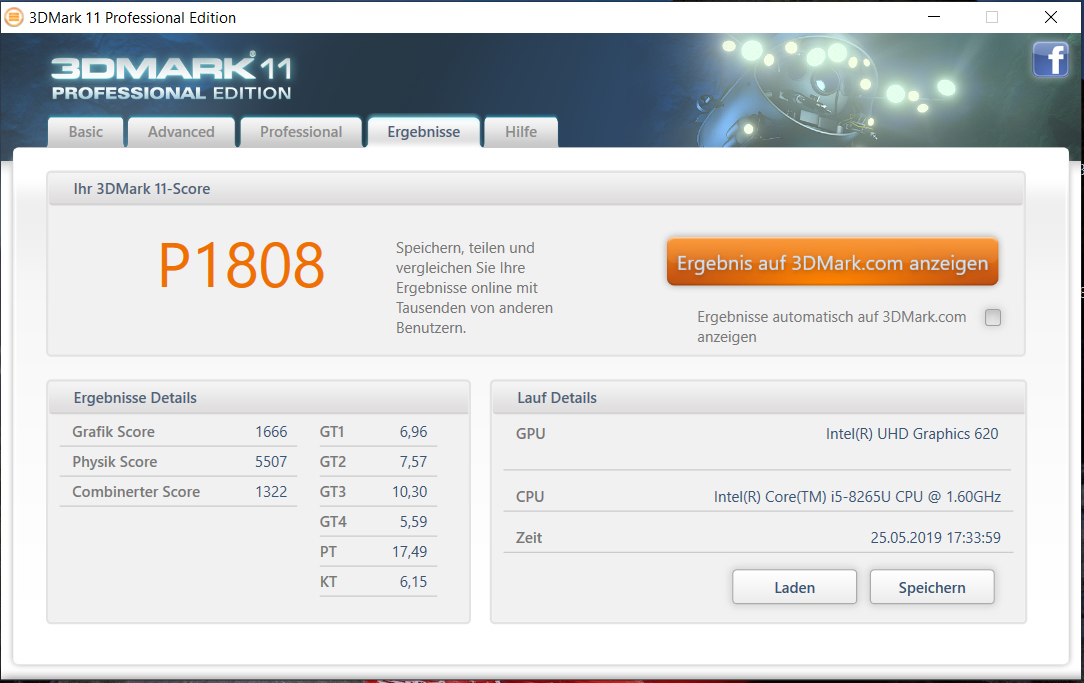
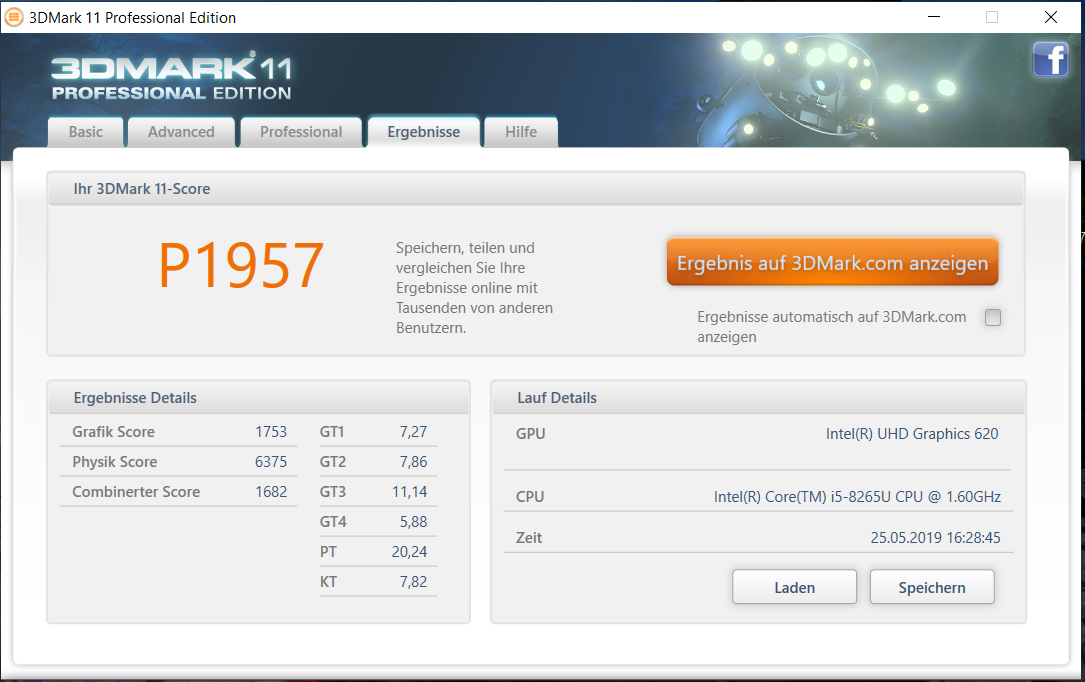
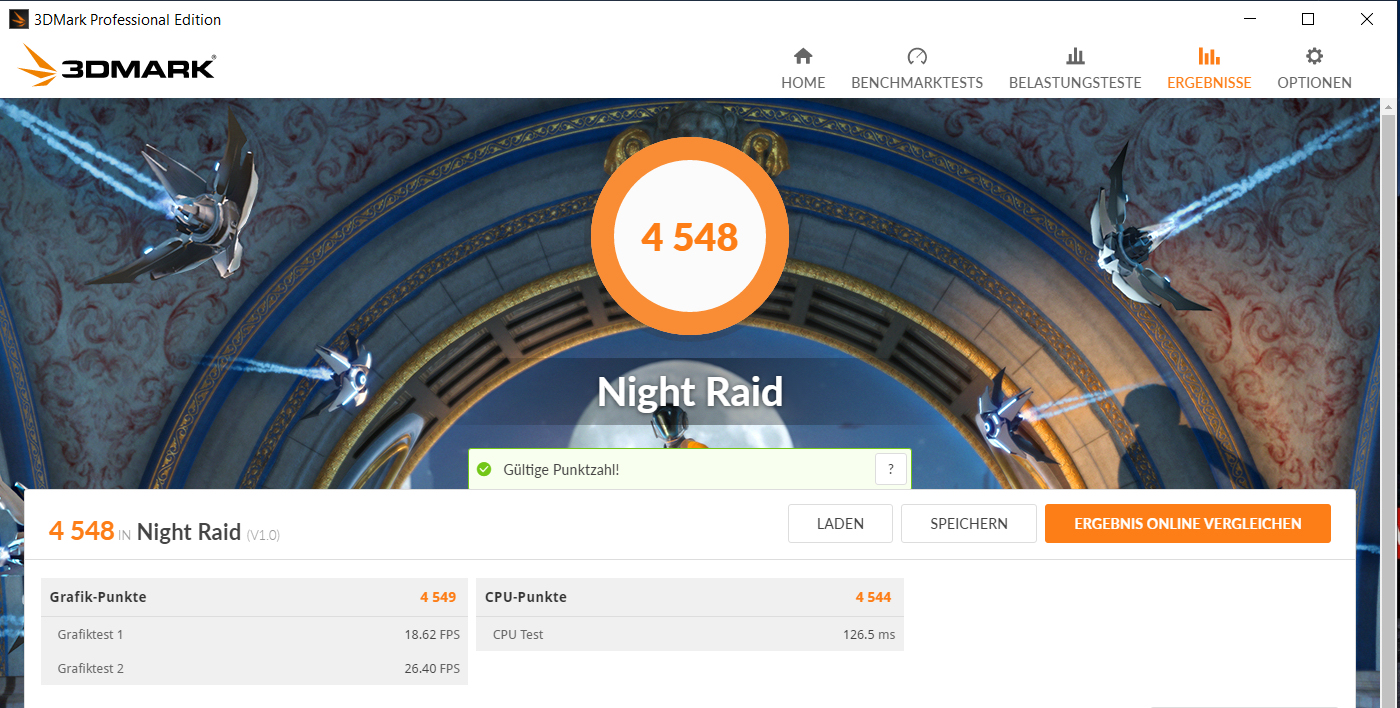
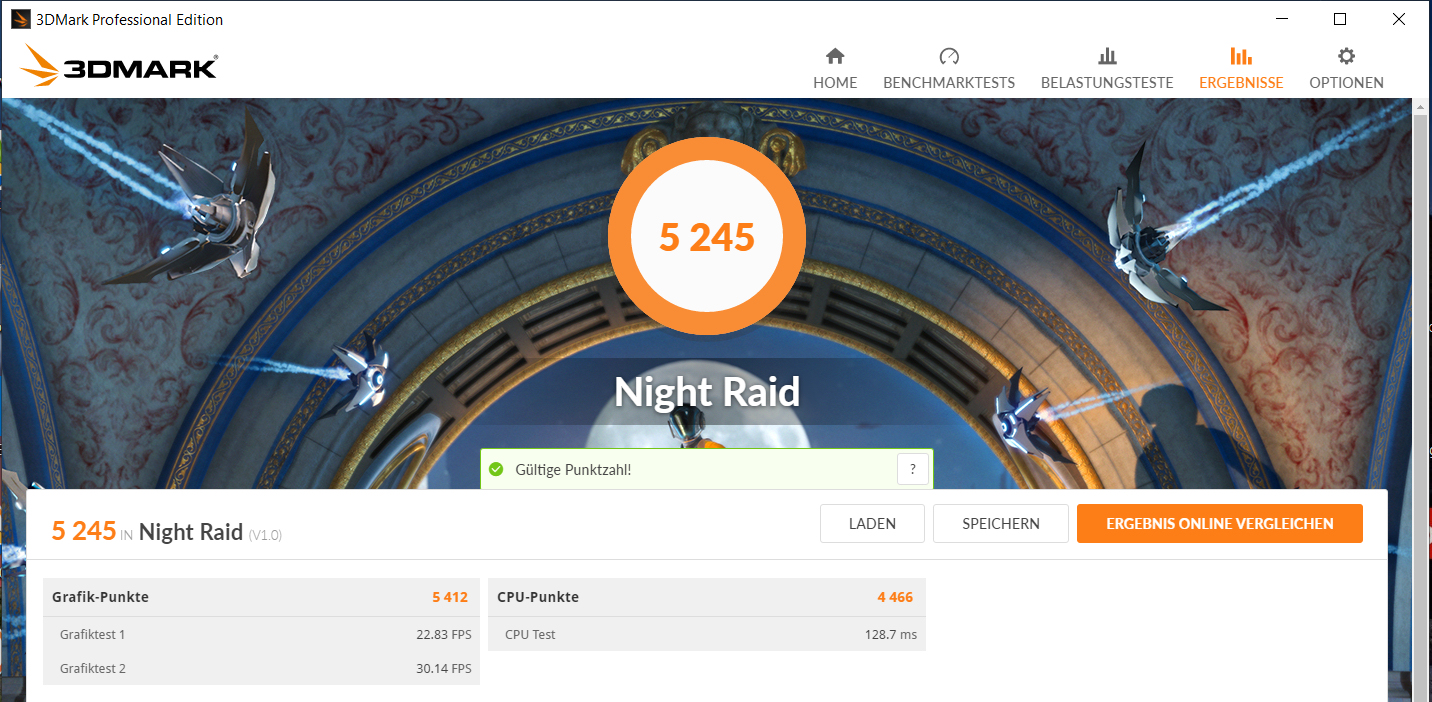
Intel's graphics core supports DirectX 12 and runs at speeds of up to 1100 MHz. The results in the 3D-Mark benchmarks range at normal levels for this GPU. There is no drop in graphics performance in battery operation, and the results are at the same level as during mains operation. By activating the dual-channel mode (i.e., adding a second working memory module), the graphics performance would increase, since the graphics core could then be used more fully. We also ran several 3D-Mark benchmarks in active dual-channel mode and added the results in the comparison charts.
The decoder integrated into the GPU takes some load off the processor when playing videos, so using streaming services should not be a problem.
| 3DMark 06 Standard Score | 10006 points | |
| 3DMark 11 Performance | 1808 points | |
| 3DMark Ice Storm Standard Score | 55934 points | |
| 3DMark Cloud Gate Standard Score | 7662 points | |
| 3DMark Fire Strike Score | 984 points | |
| 3DMark Time Spy Score | 399 points | |
Help | ||
Gaming Performance
The hardware of the Lenovo E490 is quite capable of bringing some games to the screen smoothly. This goes for games that only have moderate demands on the hardware or those that are a few years old, such as "Team Fortress 2," "Dota 2 Reborn," and "Diablo 3." You have to be content, however, with low resolutions and low quality settings. By activating the dual-channel mode, you can achieve an increase in the frame rates, but you would have to install a second working memory module for this.
| low | med. | high | ultra | |
|---|---|---|---|---|
| BioShock Infinite (2013) | 53.1 | 29.3 | 24 | 7.8 |
| The Witcher 3 (2015) | 14.9 | 9.4 | 5.3 | 3 |
| Dota 2 Reborn (2015) | 60.5 | 38 | 18.4 | 16.4 |
| BioShock Infinite - 1280x720 Very Low Preset | |
| Lenovo ThinkPad E490-20N90004GE | |
| Lenovo ThinkPad E480-20KQS00000 | |
| Acer TravelMate X3410-M-50DD | |
| HP ProBook 445 G6 | |
| Dell Latitude 14 5495 | |
| Lenovo ThinkPad E485-20KU000NGE | |
| Lenovo ThinkPad E490-20N8000RGE (Dual-Channel) | |
| Average Intel UHD Graphics 620 (18.3 - 90.2, n=187) | |
| HP ProBook 440 G6-5TK01EA | |
| Lenovo ThinkPad E490-20N8000RGE | |
| Dell Latitude 3490 | |
| Acer TravelMate X3410-M-866T | |
| Lenovo ThinkPad E480-20KNCTO1WW | |
| Dota 2 Reborn - 1280x720 min (0/3) fastest | |
| Average of class Office (32.2 - 171.3, n=73, last 2 years) | |
| Lenovo ThinkPad E490-20N90004GE | |
| Lenovo ThinkPad E490-20N8000RGE (Dual-Channel) | |
| Average Intel UHD Graphics 620 (42.4 - 90, n=92) | |
| HP ProBook 440 G6-5TK01EA | |
| Lenovo ThinkPad E490-20N8000RGE | |
Emissions - Quiet or silent
Noise Emissions
Over the whole load range, the Lenovo ThinkPad does not produce particularly much noise. Generally, the fan is turned off during idle operation and there is complete silence. Under load, the fan hardly revs up. During the stress test, we measure a noise level of only 30.9 dB(A), and even then, you cannot really hear the fan.
Noise level
| Idle |
| 29.4 / 29.4 / 29.4 dB(A) |
| Load |
| 30.2 / 30.9 dB(A) |
 | ||
30 dB silent 40 dB(A) audible 50 dB(A) loud |
||
min: | ||
| Lenovo ThinkPad E490-20N8000RGE i5-8265U, UHD Graphics 620 | Lenovo ThinkPad E480-20KNCTO1WW i5-8250U, UHD Graphics 620 | Lenovo ThinkPad E485-20KU000NGE R5 2500U, Vega 8 | Lenovo ThinkPad E490-20N90004GE i7-8565U, Radeon RX 550X (Laptop) | HP ProBook 440 G6-5TK01EA i7-8565U, UHD Graphics 620 | HP ProBook 445 G6 R5 2500U, Vega 8 | Dell Latitude 3490 i5-8250U, UHD Graphics 620 | Acer TravelMate 2410-G2-MG-82E6 i5-8550U, GeForce MX130 | Average Intel UHD Graphics 620 | Average of class Office | |
|---|---|---|---|---|---|---|---|---|---|---|
| Noise | -2% | -5% | -4% | -3% | -10% | -13% | -15% | -4% | 3% | |
| off / environment * (dB) | 29.4 | 29.1 1% | 29.4 -0% | 29.3 -0% | 29.4 -0% | 30.5 -4% | 29.8 -1% | 30.3 -3% | 29 ? 1% | 24.2 ? 18% |
| Idle Minimum * (dB) | 29.4 | 29.1 1% | 29.4 -0% | 29.3 -0% | 29.4 -0% | 30.5 -4% | 29.8 -1% | 30.8 -5% | 29.1 ? 1% | 24.4 ? 17% |
| Idle Average * (dB) | 29.4 | 29.1 1% | 29.4 -0% | 29.3 -0% | 29.4 -0% | 30.5 -4% | 29.8 -1% | 30.8 -5% | 29.1 ? 1% | 24.6 ? 16% |
| Idle Maximum * (dB) | 29.4 | 30.3 -3% | 31.2 -6% | 29.3 -0% | 30.2 -3% | 31.6 -7% | 29.8 -1% | 30.8 -5% | 29.7 ? -1% | 25.4 ? 14% |
| Load Average * (dB) | 30.2 | 31.8 -5% | 32.7 -8% | 34.2 -13% | 31.8 -5% | 36.7 -22% | 39.1 -29% | 42.7 -41% | 33.5 ? -11% | 33.7 ? -12% |
| Load Maximum * (dB) | 30.9 | 33.8 -9% | 35.3 -14% | 34.2 -11% | 33.1 -7% | 37 -20% | 44.3 -43% | 39.7 -28% | 36.1 ? -17% | 41 ? -33% |
| Witcher 3 ultra * (dB) | 34.2 |
* ... smaller is better
Temperature
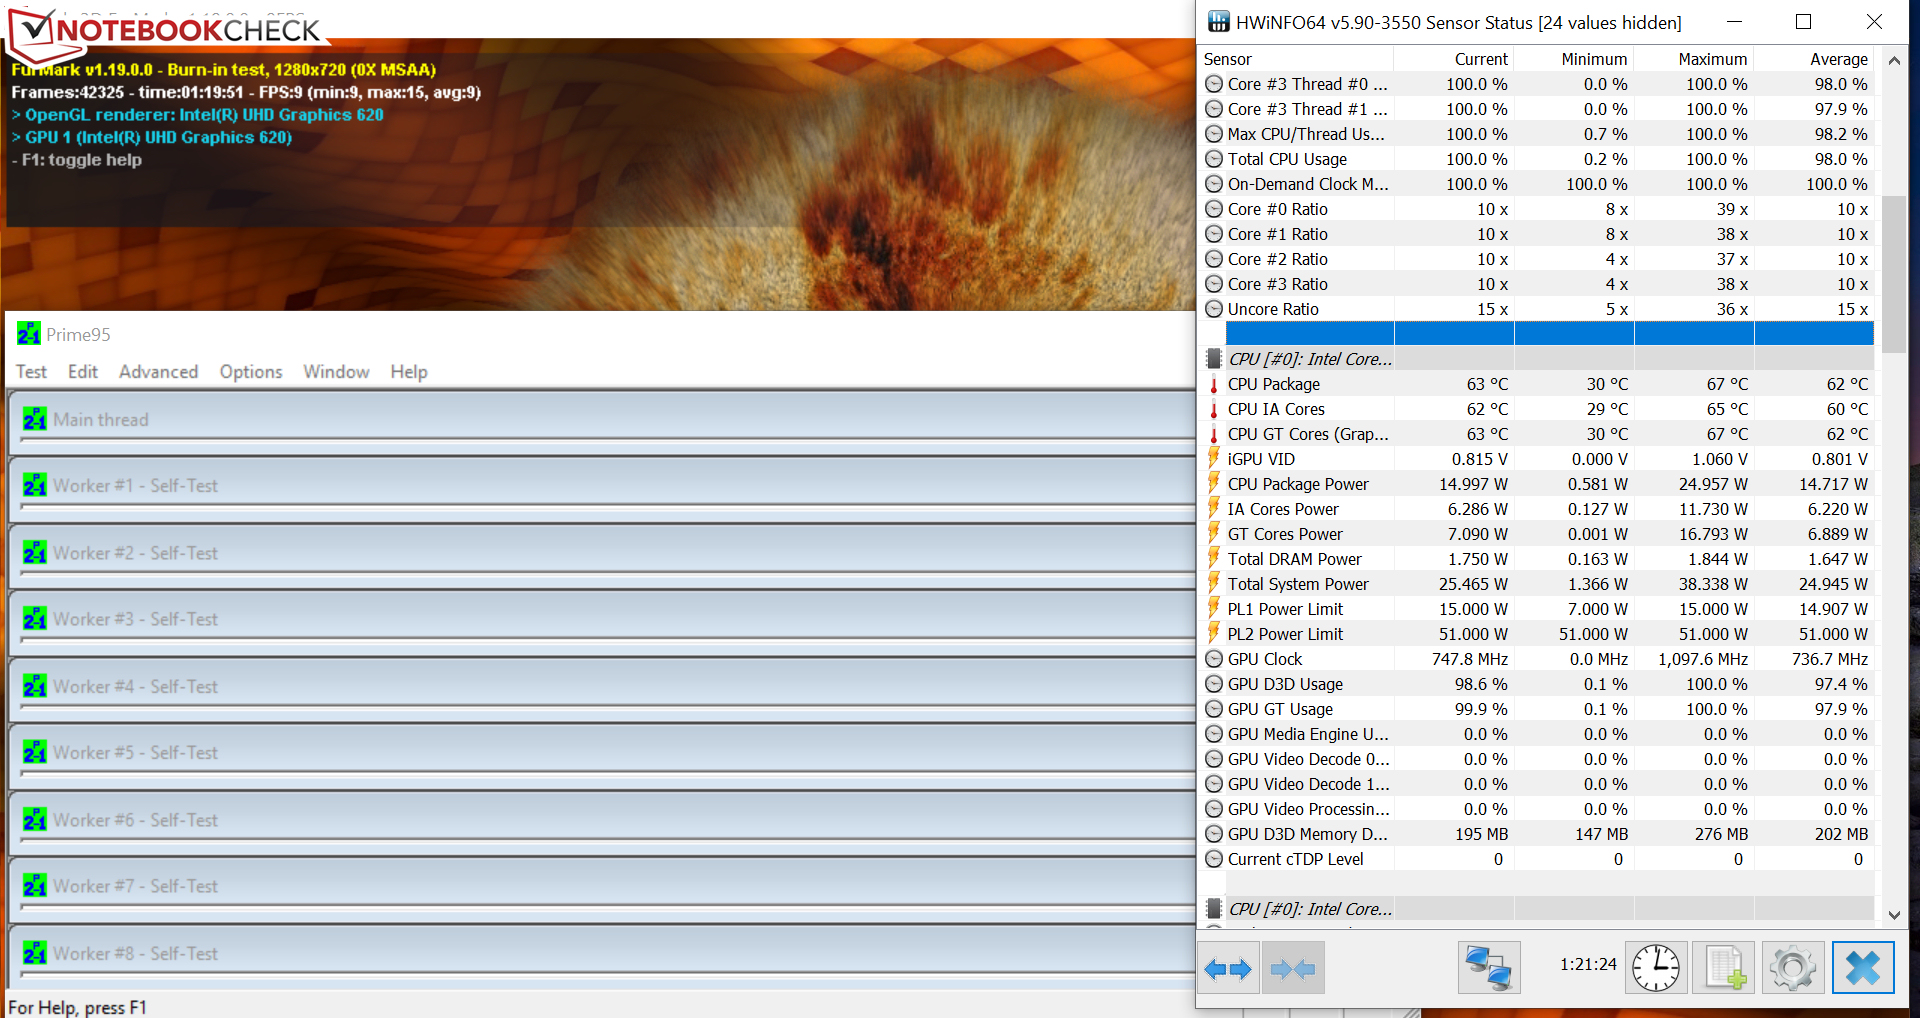
The ThinkPad laptop handles our stress test (Prime95 and FurMark run for at least one hour) in different ways in mains and in battery operation. When the laptop is plugged in, the processor runs at 3 - 3.3 GHz for several seconds, before it is throttled to 1 - 1.1 GHz. The graphics core runs at 750 - 950 MHz. In battery operation, the clock speeds are 2 - 2.2 GHz (CPU) and 450 MHz (GPU). The stress test is an extreme scenario that does not occur during everyday operation. With this test, we evaluate whether the system still remains stable during full load.
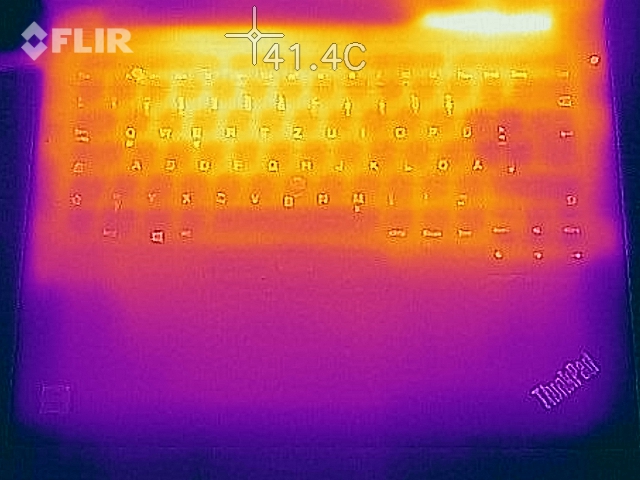
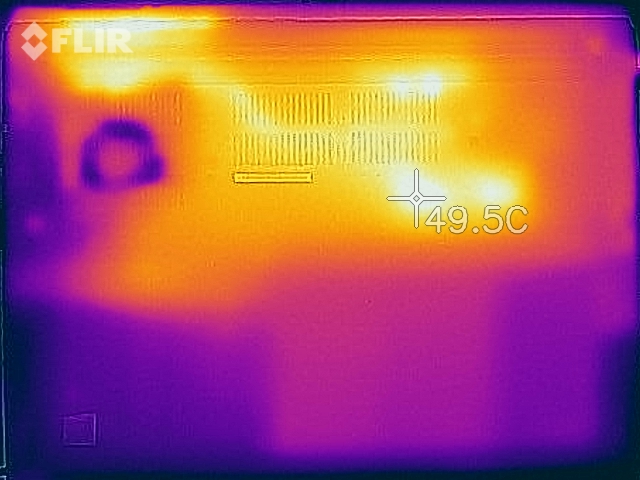
The 14-inch notebook does not get very warm. During the stress test, we register temperatures above 40 °C (104 °F) at some measurement spots on the case bottom. In that case, you might not want to work with the device on your lap. However, the values turn out significantly lower during everyday operation.
(+) The maximum temperature on the upper side is 39.9 °C / 104 F, compared to the average of 34.3 °C / 94 F, ranging from 21.2 to 62.5 °C for the class Office.
(±) The bottom heats up to a maximum of 45 °C / 113 F, compared to the average of 36.8 °C / 98 F
(+) In idle usage, the average temperature for the upper side is 24.2 °C / 76 F, compared to the device average of 29.5 °C / 85 F.
(+) The palmrests and touchpad are cooler than skin temperature with a maximum of 26.8 °C / 80.2 F and are therefore cool to the touch.
(±) The average temperature of the palmrest area of similar devices was 27.5 °C / 81.5 F (+0.7 °C / 1.3 F).
| Lenovo ThinkPad E490-20N8000RGE i5-8265U, UHD Graphics 620 | Lenovo ThinkPad E480-20KNCTO1WW i5-8250U, UHD Graphics 620 | Lenovo ThinkPad E485-20KU000NGE R5 2500U, Vega 8 | Lenovo ThinkPad E490-20N90004GE i7-8565U, Radeon RX 550X (Laptop) | HP ProBook 440 G6-5TK01EA i7-8565U, UHD Graphics 620 | HP ProBook 445 G6 R5 2500U, Vega 8 | Dell Latitude 3490 i5-8250U, UHD Graphics 620 | Acer TravelMate 2410-G2-MG-82E6 i5-8550U, GeForce MX130 | Average Intel UHD Graphics 620 | Average of class Office | |
|---|---|---|---|---|---|---|---|---|---|---|
| Heat | 8% | -11% | -22% | -2% | -8% | -2% | -10% | -4% | -4% | |
| Maximum Upper Side * (°C) | 39.9 | 36.7 8% | 42.3 -6% | 53.1 -33% | 38.3 4% | 36 10% | 46.6 -17% | 47.3 -19% | 41.1 ? -3% | 40.6 ? -2% |
| Maximum Bottom * (°C) | 45 | 42.8 5% | 45.2 -0% | 63.8 -42% | 50.5 -12% | 43 4% | 48.8 -8% | 47.8 -6% | 44.3 ? 2% | 42.8 ? 5% |
| Idle Upper Side * (°C) | 24.7 | 23.4 5% | 28.8 -17% | 25.4 -3% | 24.6 -0% | 29.6 -20% | 23.5 5% | 26.7 -8% | 26.8 ? -9% | 27.2 ? -10% |
| Idle Bottom * (°C) | 25.8 | 22.8 12% | 30.7 -19% | 28.1 -9% | 25.4 2% | 31.9 -24% | 22.9 11% | 27.8 -8% | 27.7 ? -7% | 28.4 ? -10% |
* ... smaller is better
Speakers
The stereo speakers are placed on the bottom of the device. They produce an average sound that you can also listen to for longer time periods without hurting your ears. For a better sound experience, we recommend using headphones or external speakers.
Power Management - The E490 shows some endurance
Power Consumption
The notebook does not show any abnormal behavior in terms of its power consumption. During idle operation, we measure a maximum power consumption of 6.57 watts, which is a good value. In the beginning of the stress test, the consumption rises up to 43.6 watts. However, the value drops to about 28 watts after a few seconds, since the CPU is throttled significantly. Over the whole load range, the power consumption of the E490 is at a similar level as that of its predecessor model. The included USB Type-C charger is rated at 65 watts.
| Off / Standby | |
| Idle | |
| Load |
|
Key:
min: | |
| Lenovo ThinkPad E490-20N8000RGE i5-8265U, UHD Graphics 620 | Lenovo ThinkPad E480-20KNCTO1WW i5-8250U, UHD Graphics 620 | Lenovo ThinkPad E485-20KU000NGE R5 2500U, Vega 8 | Lenovo ThinkPad E490-20N90004GE i7-8565U, Radeon RX 550X (Laptop) | HP ProBook 440 G6-5TK01EA i7-8565U, UHD Graphics 620 | HP ProBook 445 G6 R5 2500U, Vega 8 | Dell Latitude 3490 i5-8250U, UHD Graphics 620 | Acer TravelMate 2410-G2-MG-82E6 i5-8550U, GeForce MX130 | Average Intel UHD Graphics 620 | Average of class Office | |
|---|---|---|---|---|---|---|---|---|---|---|
| Power Consumption | -2% | -51% | -88% | -8% | -31% | -26% | -37% | -24% | -43% | |
| Idle Minimum * (Watt) | 2.76 | 3.5 -27% | 6.2 -125% | 6.8 -146% | 2.98 -8% | 4.8 -74% | 3.2 -16% | 3.5 -27% | 3.81 ? -38% | 4.44 ? -61% |
| Idle Average * (Watt) | 5.96 | 5.3 11% | 8.6 -44% | 9.4 -58% | 5.4 9% | 6.9 -16% | 5.5 8% | 5.9 1% | 6.94 ? -16% | 7.38 ? -24% |
| Idle Maximum * (Watt) | 6.57 | 6.1 7% | 9.7 -48% | 12.4 -89% | 7.9 -20% | 9.8 -49% | 8.1 -23% | 8.2 -25% | 8.75 ? -33% | 8.59 ? -31% |
| Load Average * (Watt) | 28.2 | 30 -6% | 37.4 -33% | 57.2 -103% | 34.5 -22% | 35 -24% | 40.8 -45% | 57.3 -103% | 35 ? -24% | 43 ? -52% |
| Load Maximum * (Watt) | 43.6 | 42.3 3% | 44.8 -3% | 63.1 -45% | 43.3 1% | 39.7 9% | 68.1 -56% | 57.9 -33% | 47.5 ? -9% | 64.5 ? -48% |
* ... smaller is better
Battery Life
In our realistic WLAN test, the E490 achieves a runtime of 8:05 h. Using a script, we simulate the load when rendering websites. The "Balanced" power profile is active and the display brightness is adjusted to about 150 cd/m². In our video test, the 14-inch notebook lasts for 11:27 h. We run the Big Buck Bunny short movie (H.264-coding, 1920x1080 pixels) in a constant loop. The "Power Saving" profile is active, the Wi-Fi modules are deactivated, and the display brightness is lowered to 150 cd/m².
Overall, the runtimes of the Lenovo computer turn out very well and are at the same level as those of the ThinkPad E480. With one exception though: In our video test, the E490 lasts about 4 hours longer on a battery charge. We trace back the cause for this massive increase to the new driver version that is used in the E490. So it is not impossible that the iGPU models of the E480 would also achieve similar runtimes when using the driver.
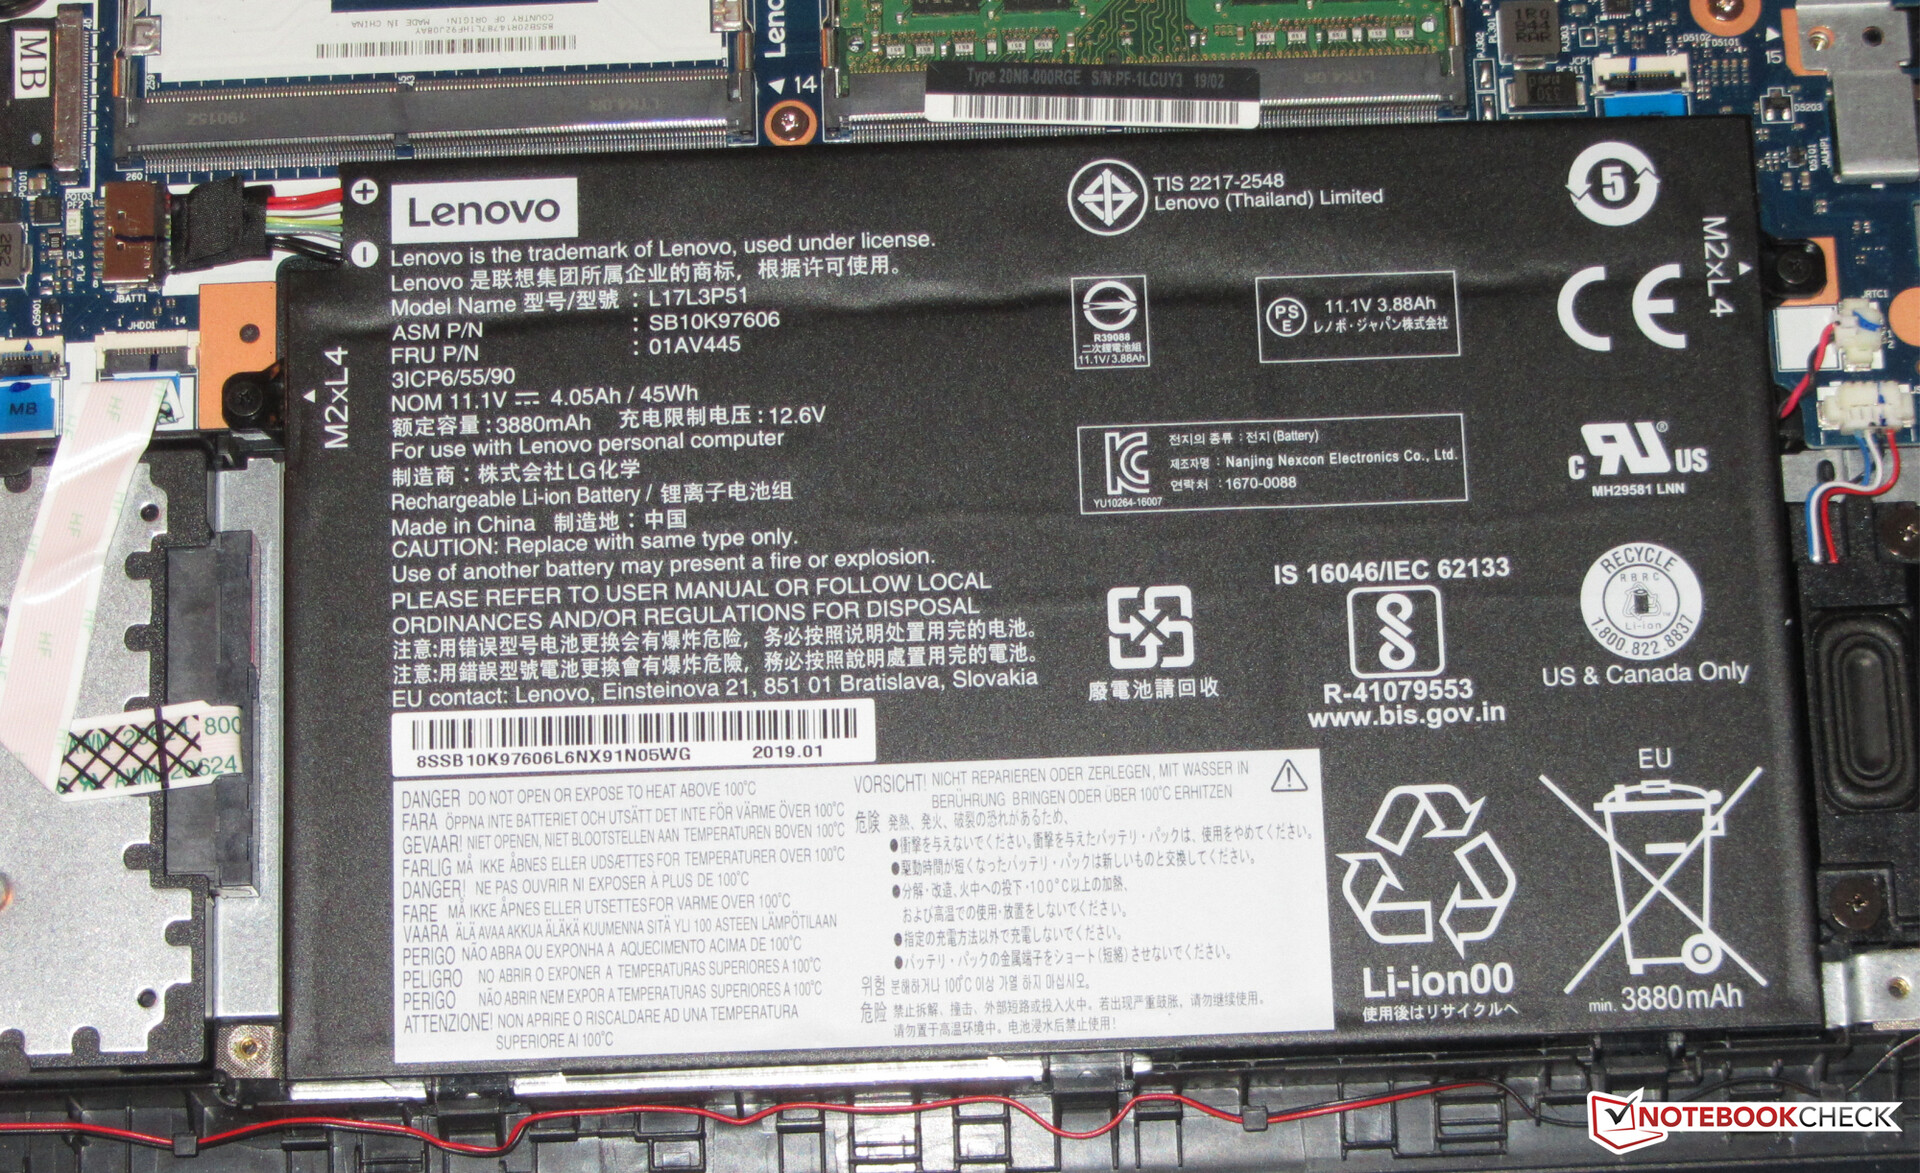
| Lenovo ThinkPad E490-20N8000RGE i5-8265U, UHD Graphics 620, 45 Wh | Lenovo ThinkPad E480-20KNCTO1WW i5-8250U, UHD Graphics 620, 45 Wh | Lenovo ThinkPad E490-20N90004GE i7-8565U, Radeon RX 550X (Laptop), 45 Wh | Lenovo ThinkPad E485-20KU000NGE R5 2500U, Vega 8, 45 Wh | HP ProBook 440 G6-5TK01EA i7-8565U, UHD Graphics 620, 45 Wh | HP ProBook 445 G6 R5 2500U, Vega 8, 45 Wh | Dell Latitude 3490 i5-8250U, UHD Graphics 620, 56 Wh | Acer TravelMate 2410-G2-MG-82E6 i5-8550U, GeForce MX130, 48 Wh | Average of class Office | |
|---|---|---|---|---|---|---|---|---|---|
| Battery runtime | -10% | -19% | -44% | -2% | -37% | 43% | -12% | 28% | |
| Reader / Idle (h) | 17.7 | 18.4 4% | 14.4 -19% | 9.1 -49% | 17.1 -3% | 10.4 -41% | 23.7 ? 34% | ||
| H.264 (h) | 11.5 | 7.2 -37% | 8.2 -29% | 5.7 -50% | 7.6 -34% | 4.8 -58% | 8.9 -23% | 15 ? 30% | |
| WiFi v1.3 (h) | 8.1 | 8.3 2% | 7 -14% | 5.4 -33% | 8.4 4% | 5.9 -27% | 11.6 43% | 7.4 -9% | 12.9 ? 59% |
| Load (h) | 2 | 1.8 -10% | 1.7 -15% | 1.1 -45% | 2.5 25% | 1.6 -20% | 1.9 -5% | 1.807 ? -10% |
Pros
Cons
Verdict
The ThinkPad E490 fulfills most demands put on a mobile work horse: it offers sufficient performance for applications from the office and Internet areas, runs quietly or remains silent over the whole load range, brings excellent input devices, and offers a very good battery life. It lacks a keyboard illumination and working memory operating in dual-channel mode. If you need those, you would need to choose another model variant.
The device shares the same build with its predecessor. Only the processor has changed, and the E490 models are equipped with Whiskey Lake processors. However, the Core i5-8265U processor used in our test unit does not offer an increased performance overall compared to the Core i5-8250U processor of the ThinkPad E480.
The ThinkPad E490 is a successful 14-inch office notebook, that can be purchased at a suitable price.
An NVMe SSD ensures a quick and smoothly running system. Replacing the SSD with a faster and higher-capacity model should be doable. In addition, you also have the option to add a 2.5-inch hard drive into the notebook. The frame and SATA-III slot for this are already there. Both options would require removal of the case bottom, which is easy to do.
The matte IPS display pleases with stable viewing angles and a good contrast. The display brightness only reaches our target value (300 cd/m²) with some effort. The display is unable to score points with its color reproduction.
The ThinkPad E490 left a very good impression overall. We do not see a real reason to prefer it over the ThinkPad E480, so if you find a good deal on that, you can just get the ThinkPad E480. However, this statement goes only for the iGPU models of the E480/E490.
Update September 16th: The rating drops from 89% to 86% due to our rating update from v6 to v7. For more information, please see this article.
Lenovo ThinkPad E490-20N8000RGE
- 09/16/2019 v7 (old)
Sascha Mölck

