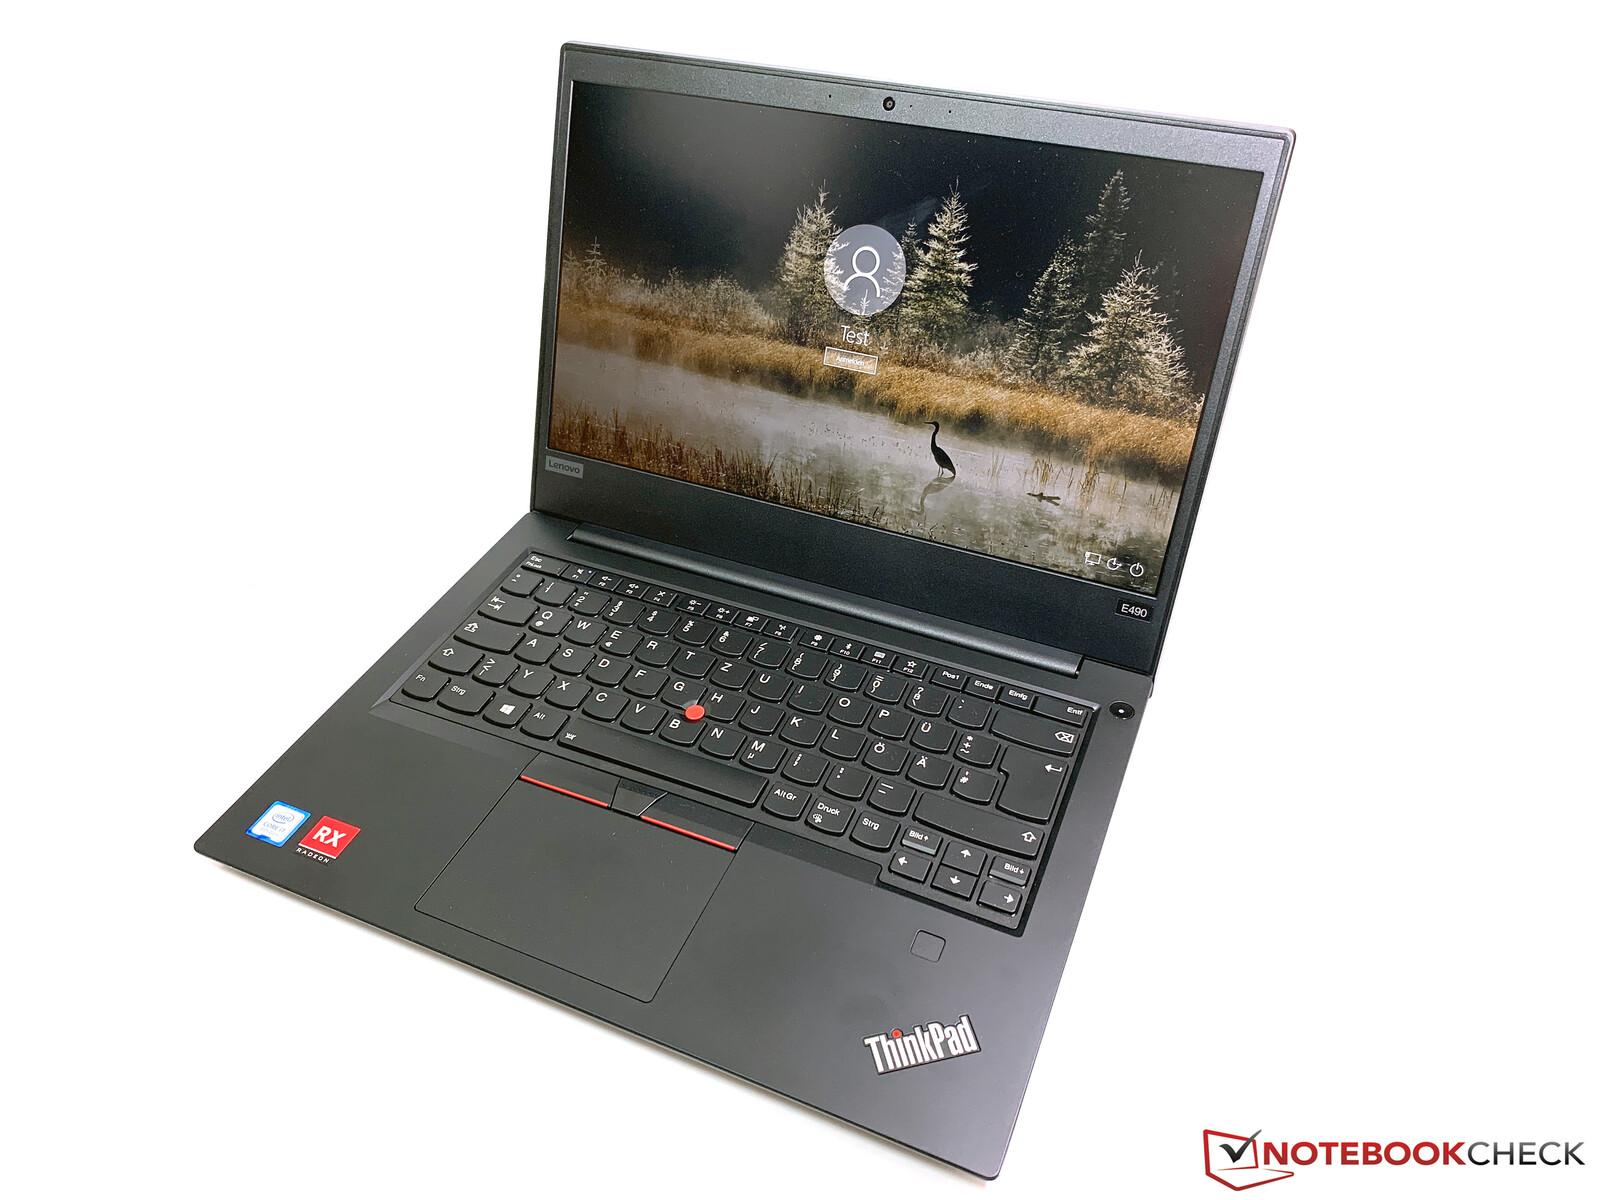
Lenovo ThinkPad E490 Office Laptop in review: The Radeon GPU is too much for the cooling solution

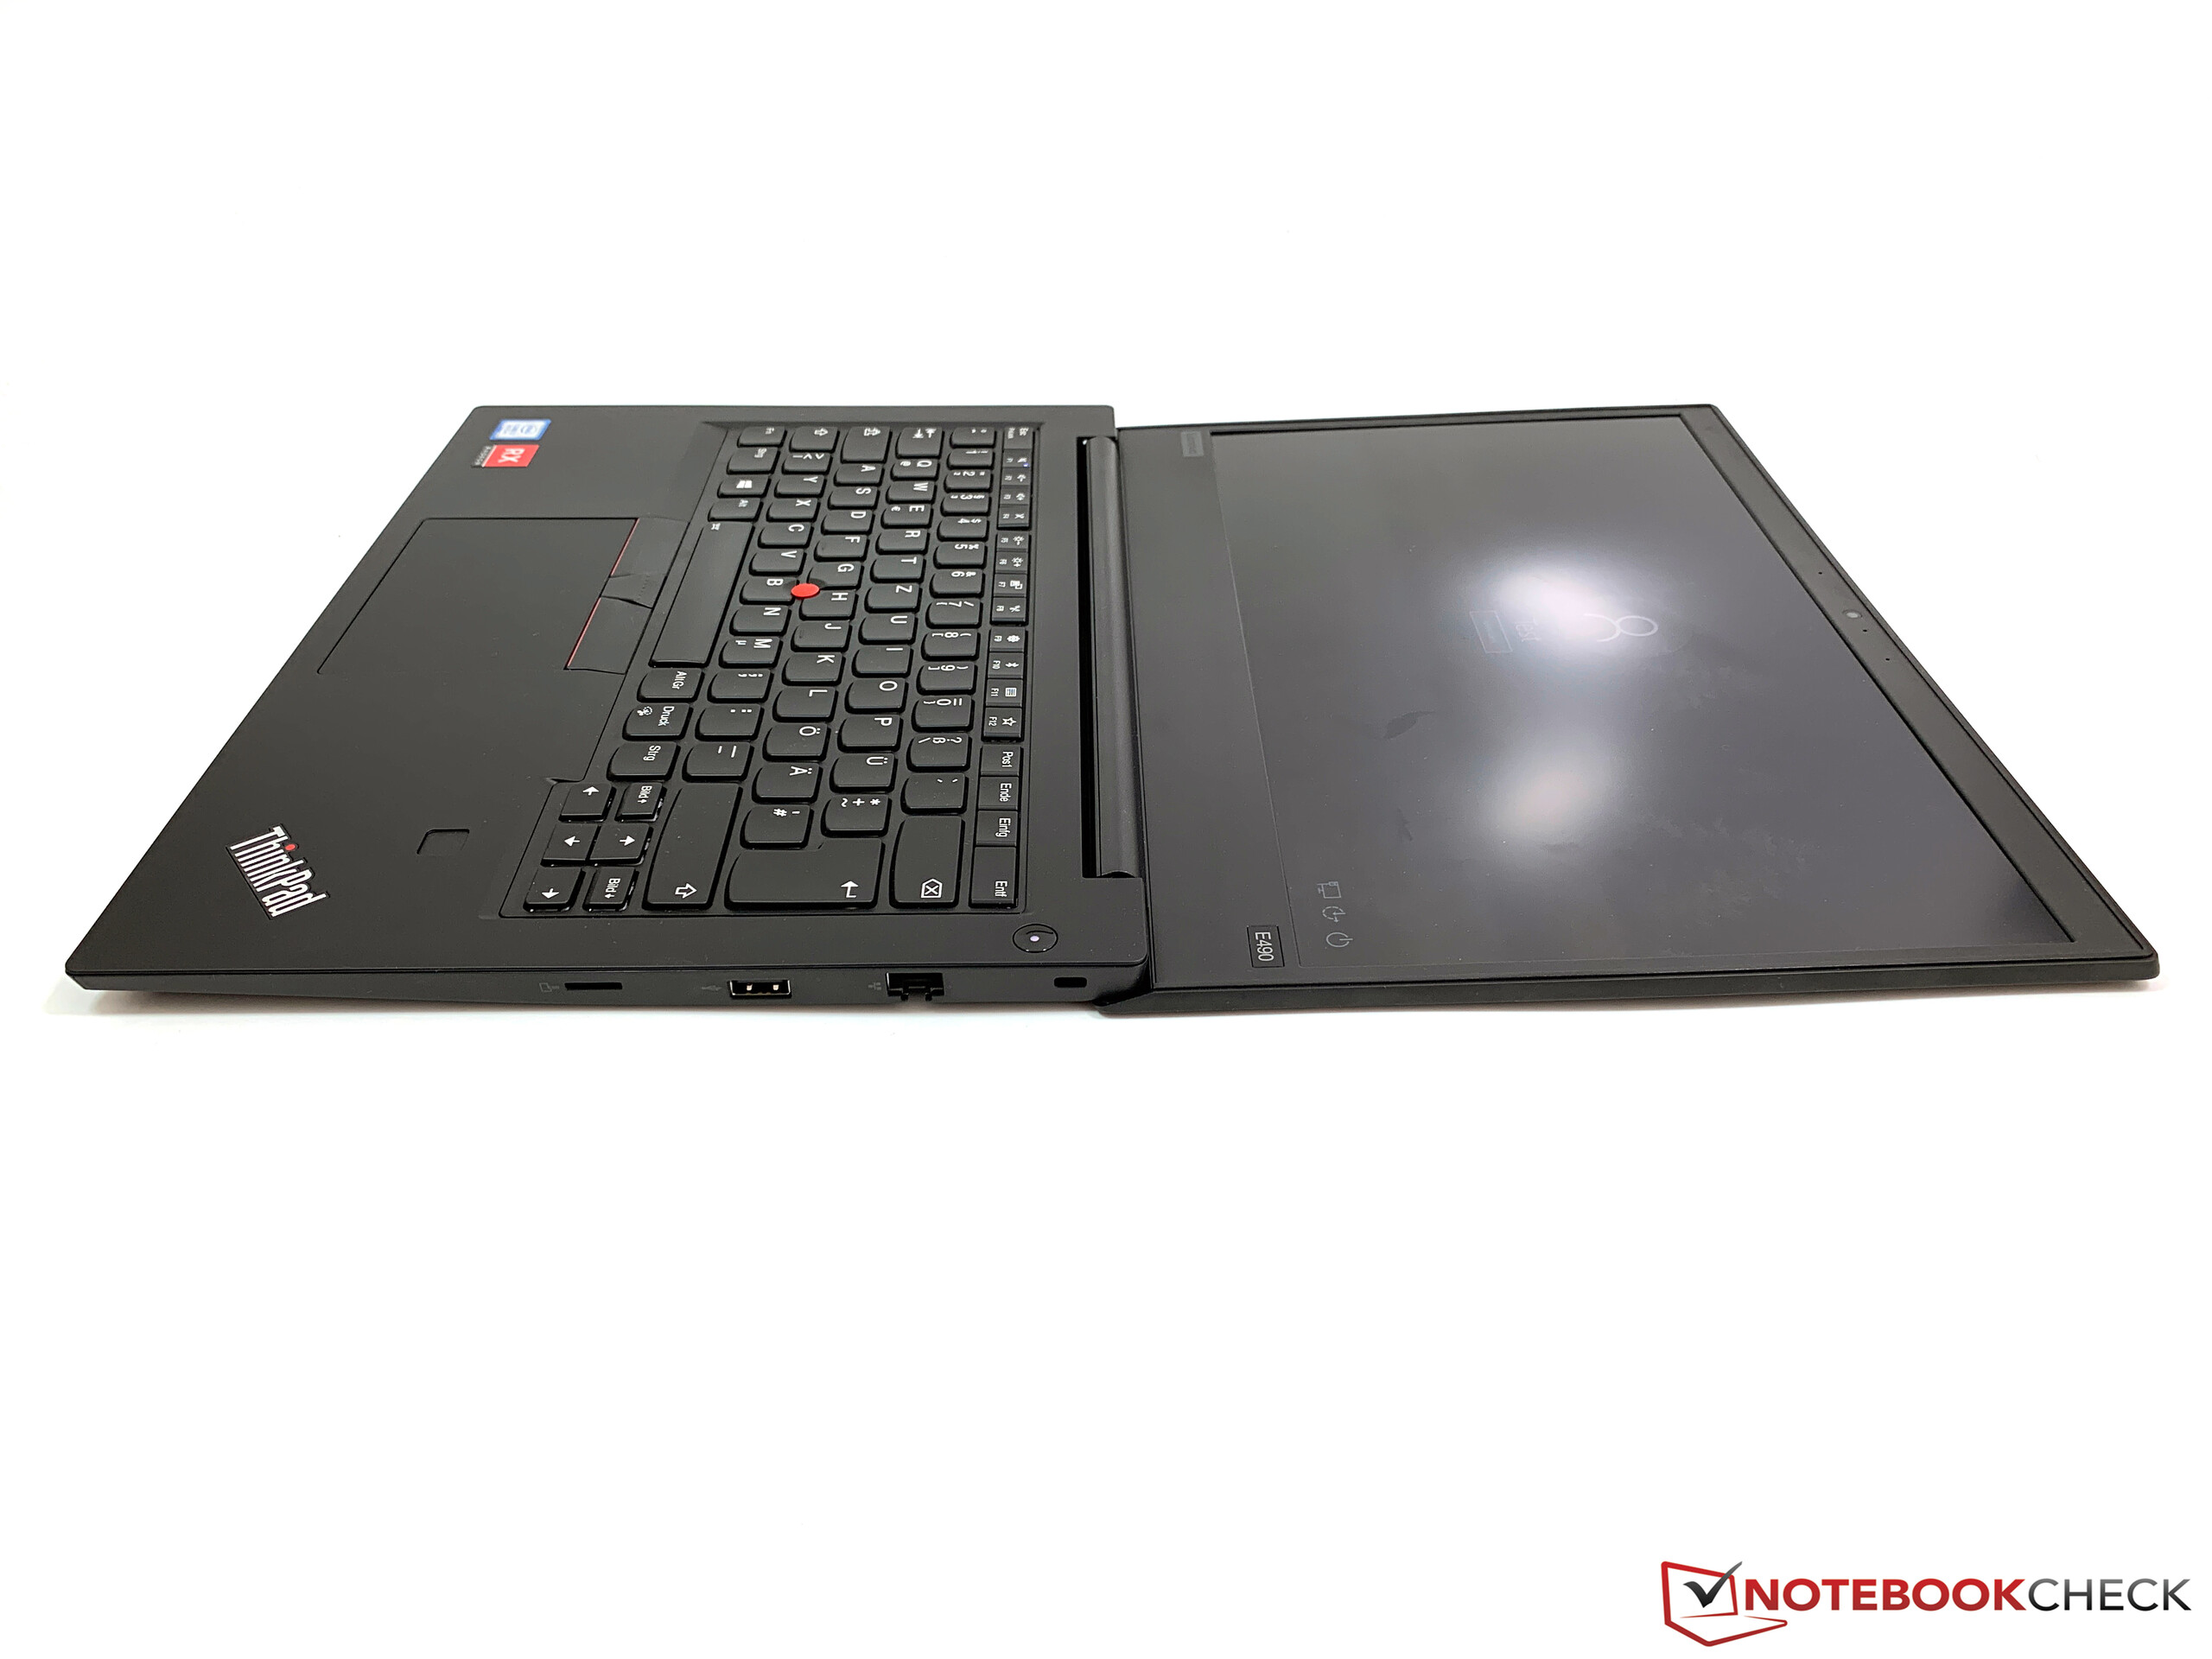
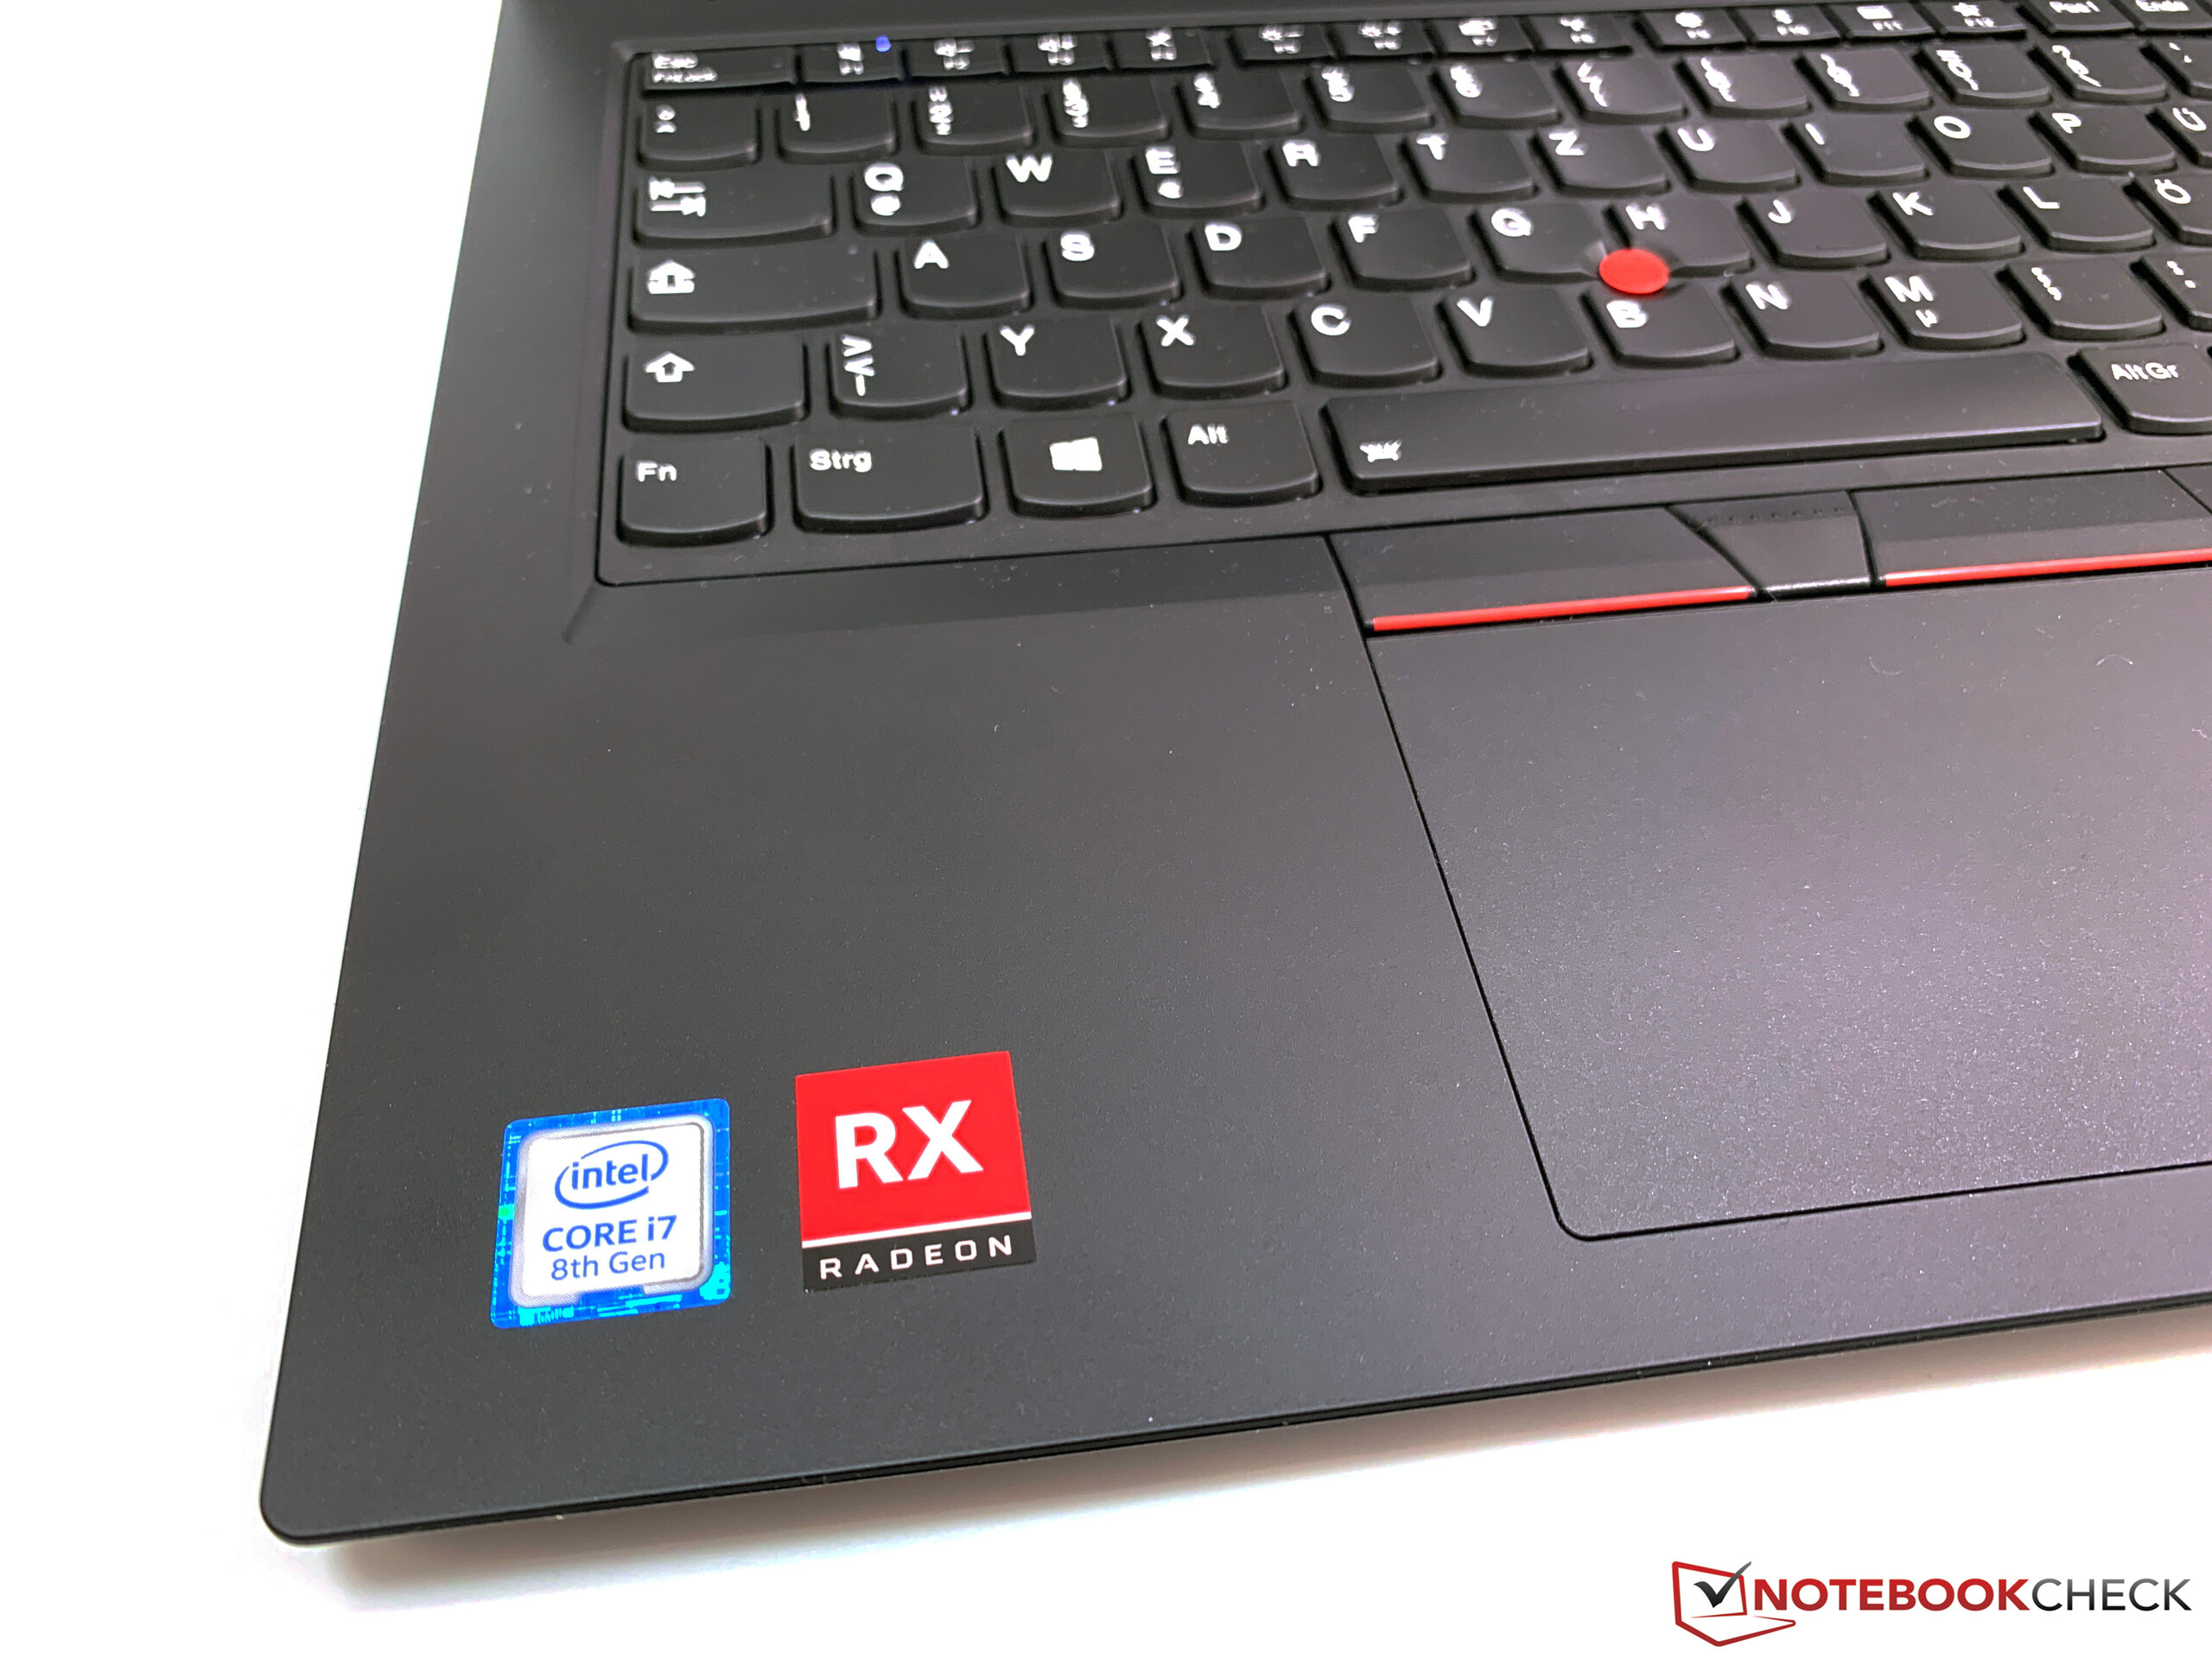
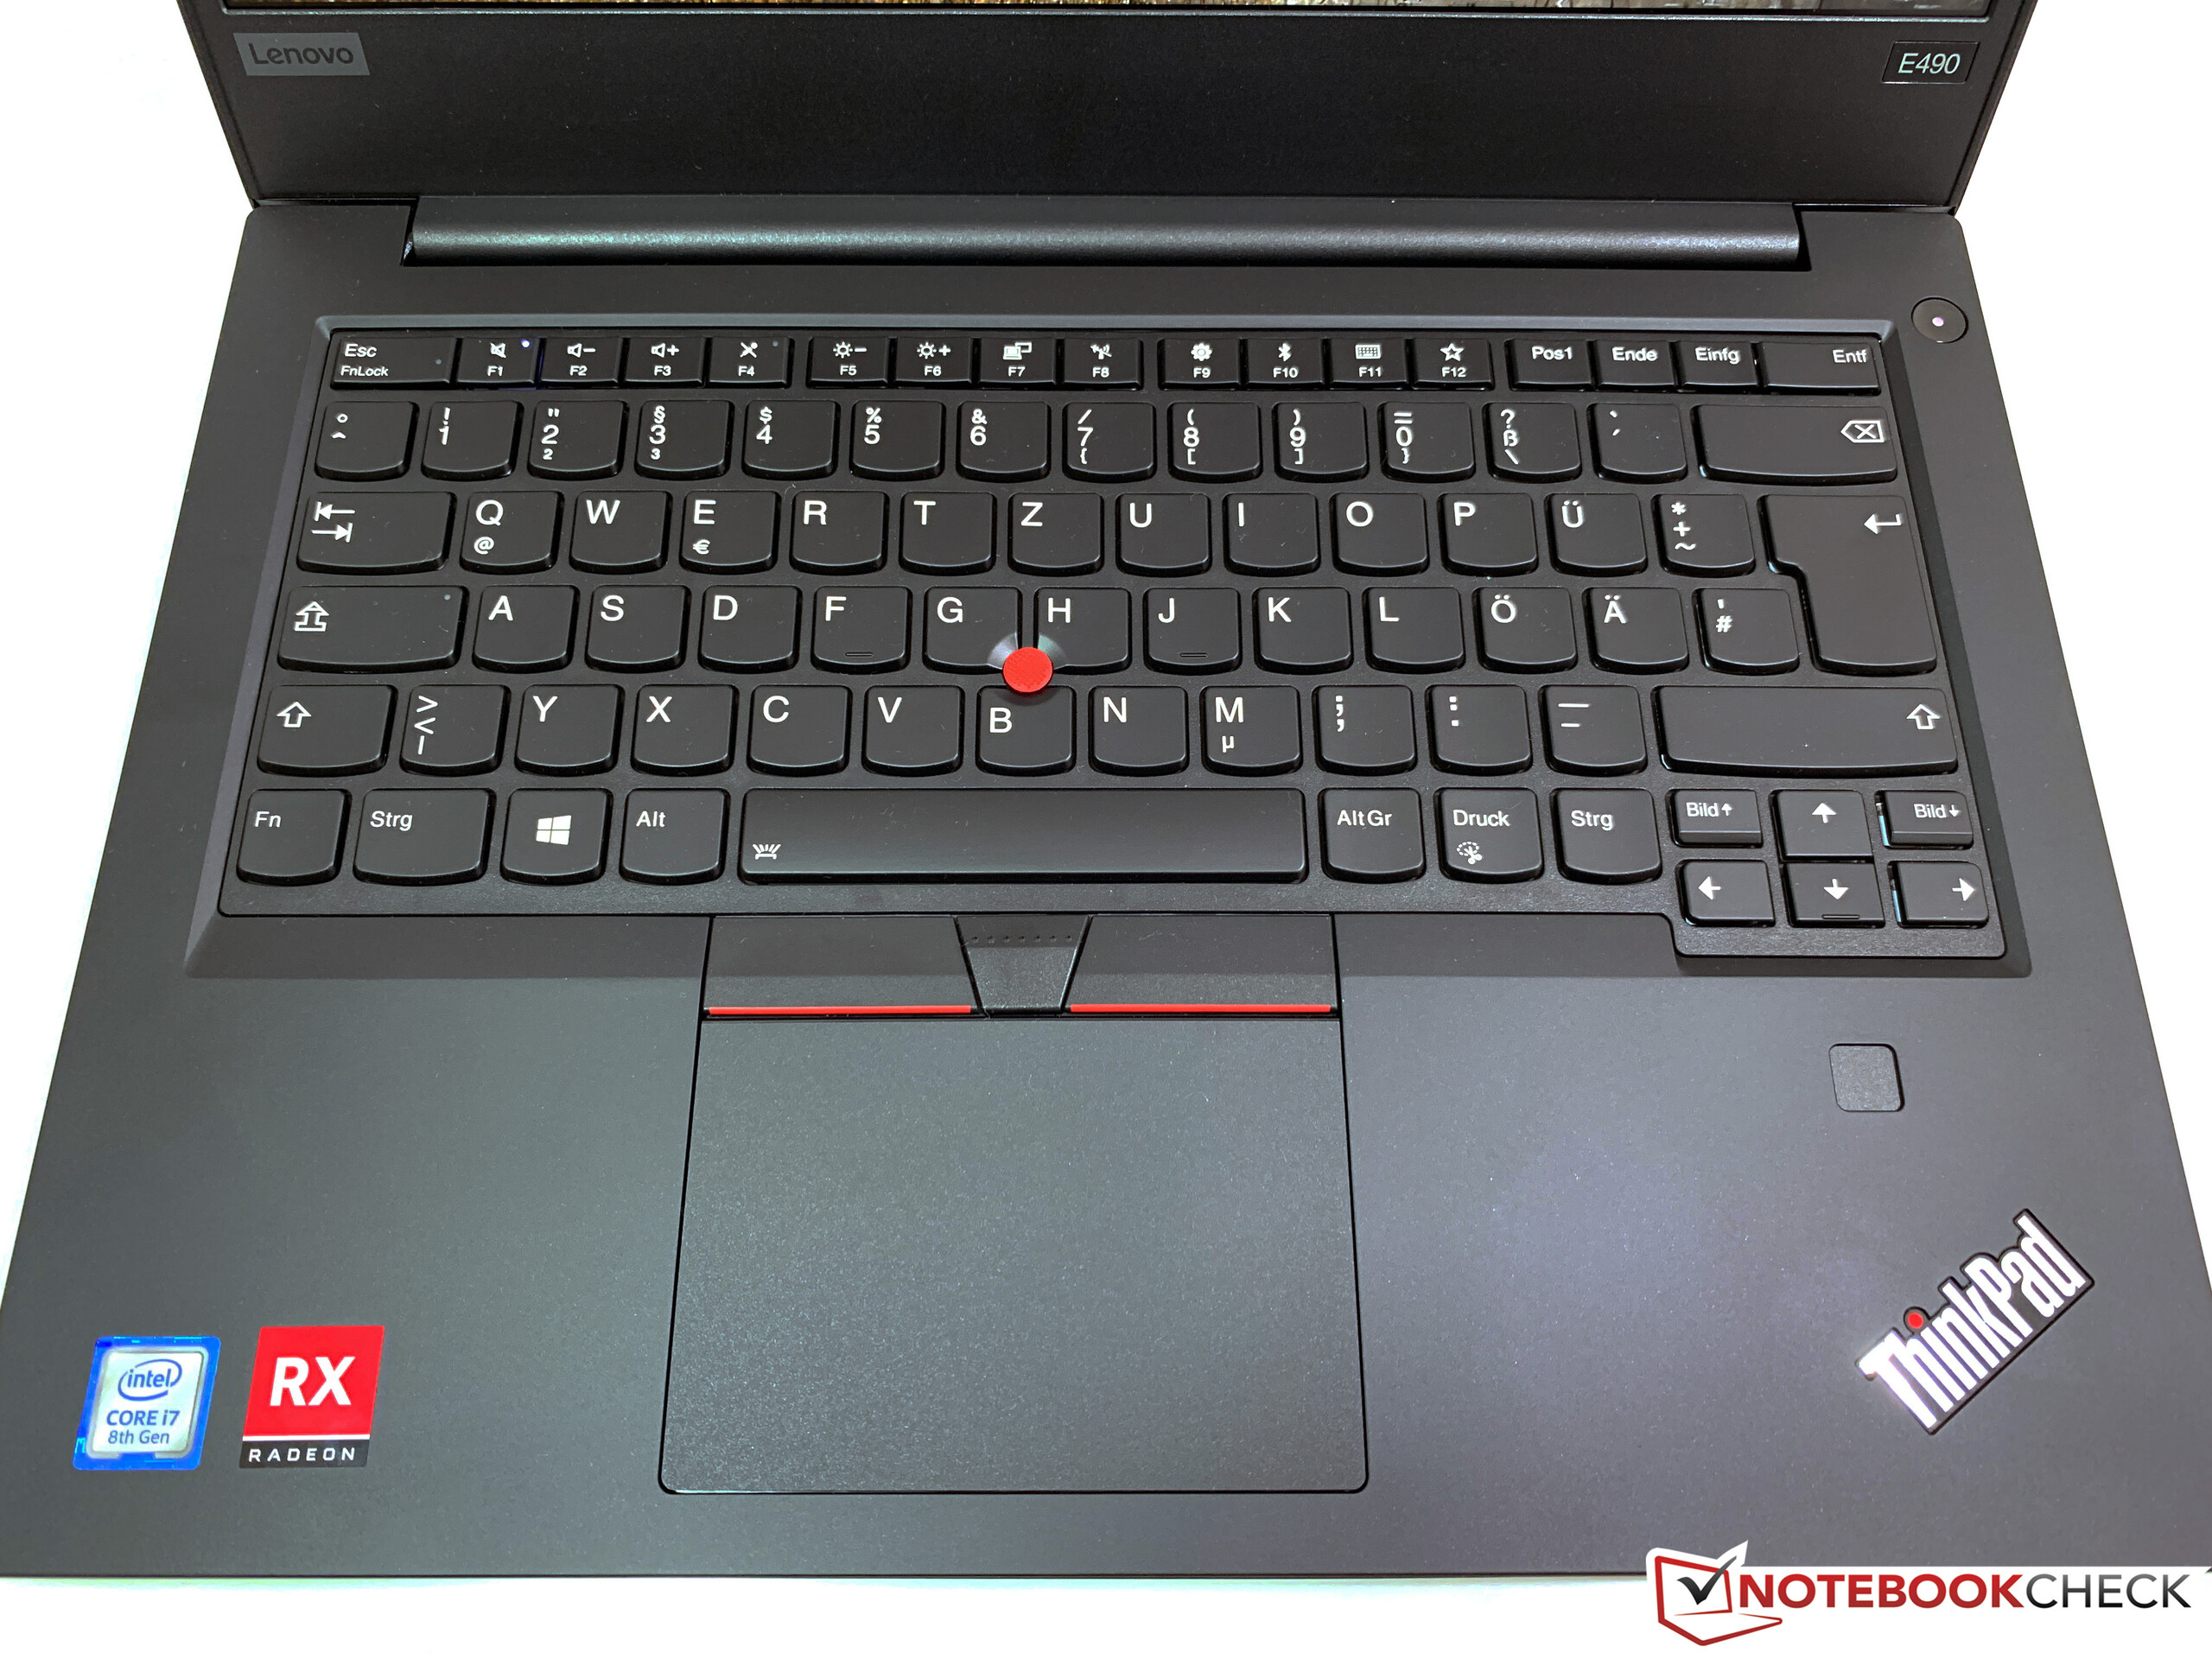
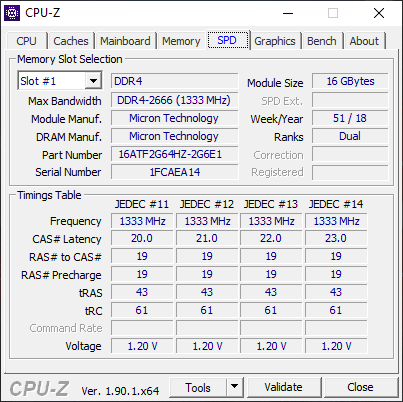
Lenovo has already launched the new ThinkPad E14, but you can still get the ThinkPad E490 from many retailers and it is also interesting as a used device. The E490 (our test unit has the designation 20N90004GE) is also available with a dedicated Radeon GPU. In addition, you get a Core i7 processor, 16 GB RAM, and a 512 GB SSD. The case and the input devices are identical to the old ThinkPad E480, so we refer to our reviews of the E480 and the E490 with the integrated GPU for more details on these sections.
Rating | Date | Model | Weight | Height | Size | Resolution | Price |
|---|---|---|---|---|---|---|---|
| 84.6 % v7 (old) | 05 / 2020 | Lenovo ThinkPad E490-20N90004GE i7-8565U, Radeon RX 550X (Laptop) | 1.9 kg | 19.9 mm | 14.00" | 1920x1080 | |
| 84.2 % v7 (old) | 09 / 2019 | Lenovo ThinkPad E495-20NE000JGE R5 3500U, Vega 8 | 1.8 kg | 19.9 mm | 14.00" | 1920x1080 | |
| 86.3 % v6 (old) | 03 / 2019 | HP ProBook 440 G6-5TK01EA i7-8565U, UHD Graphics 620 | 1.6 kg | 18 mm | 14.00" | 1920x1080 | |
| 85.6 % v7 (old) | 04 / 2020 | Schenker VIA 14 i5-10210U, UHD Graphics 620 | 1.1 kg | 16.5 mm | 14.00" | 1920x1080 | |
| 84.5 % v7 (old) | 03 / 2020 | Lenovo ThinkPad E14 20RA001MGE i5-10210U, UHD Graphics 620 | 1.6 kg | 17.9 mm | 14.00" | 1920x1080 |
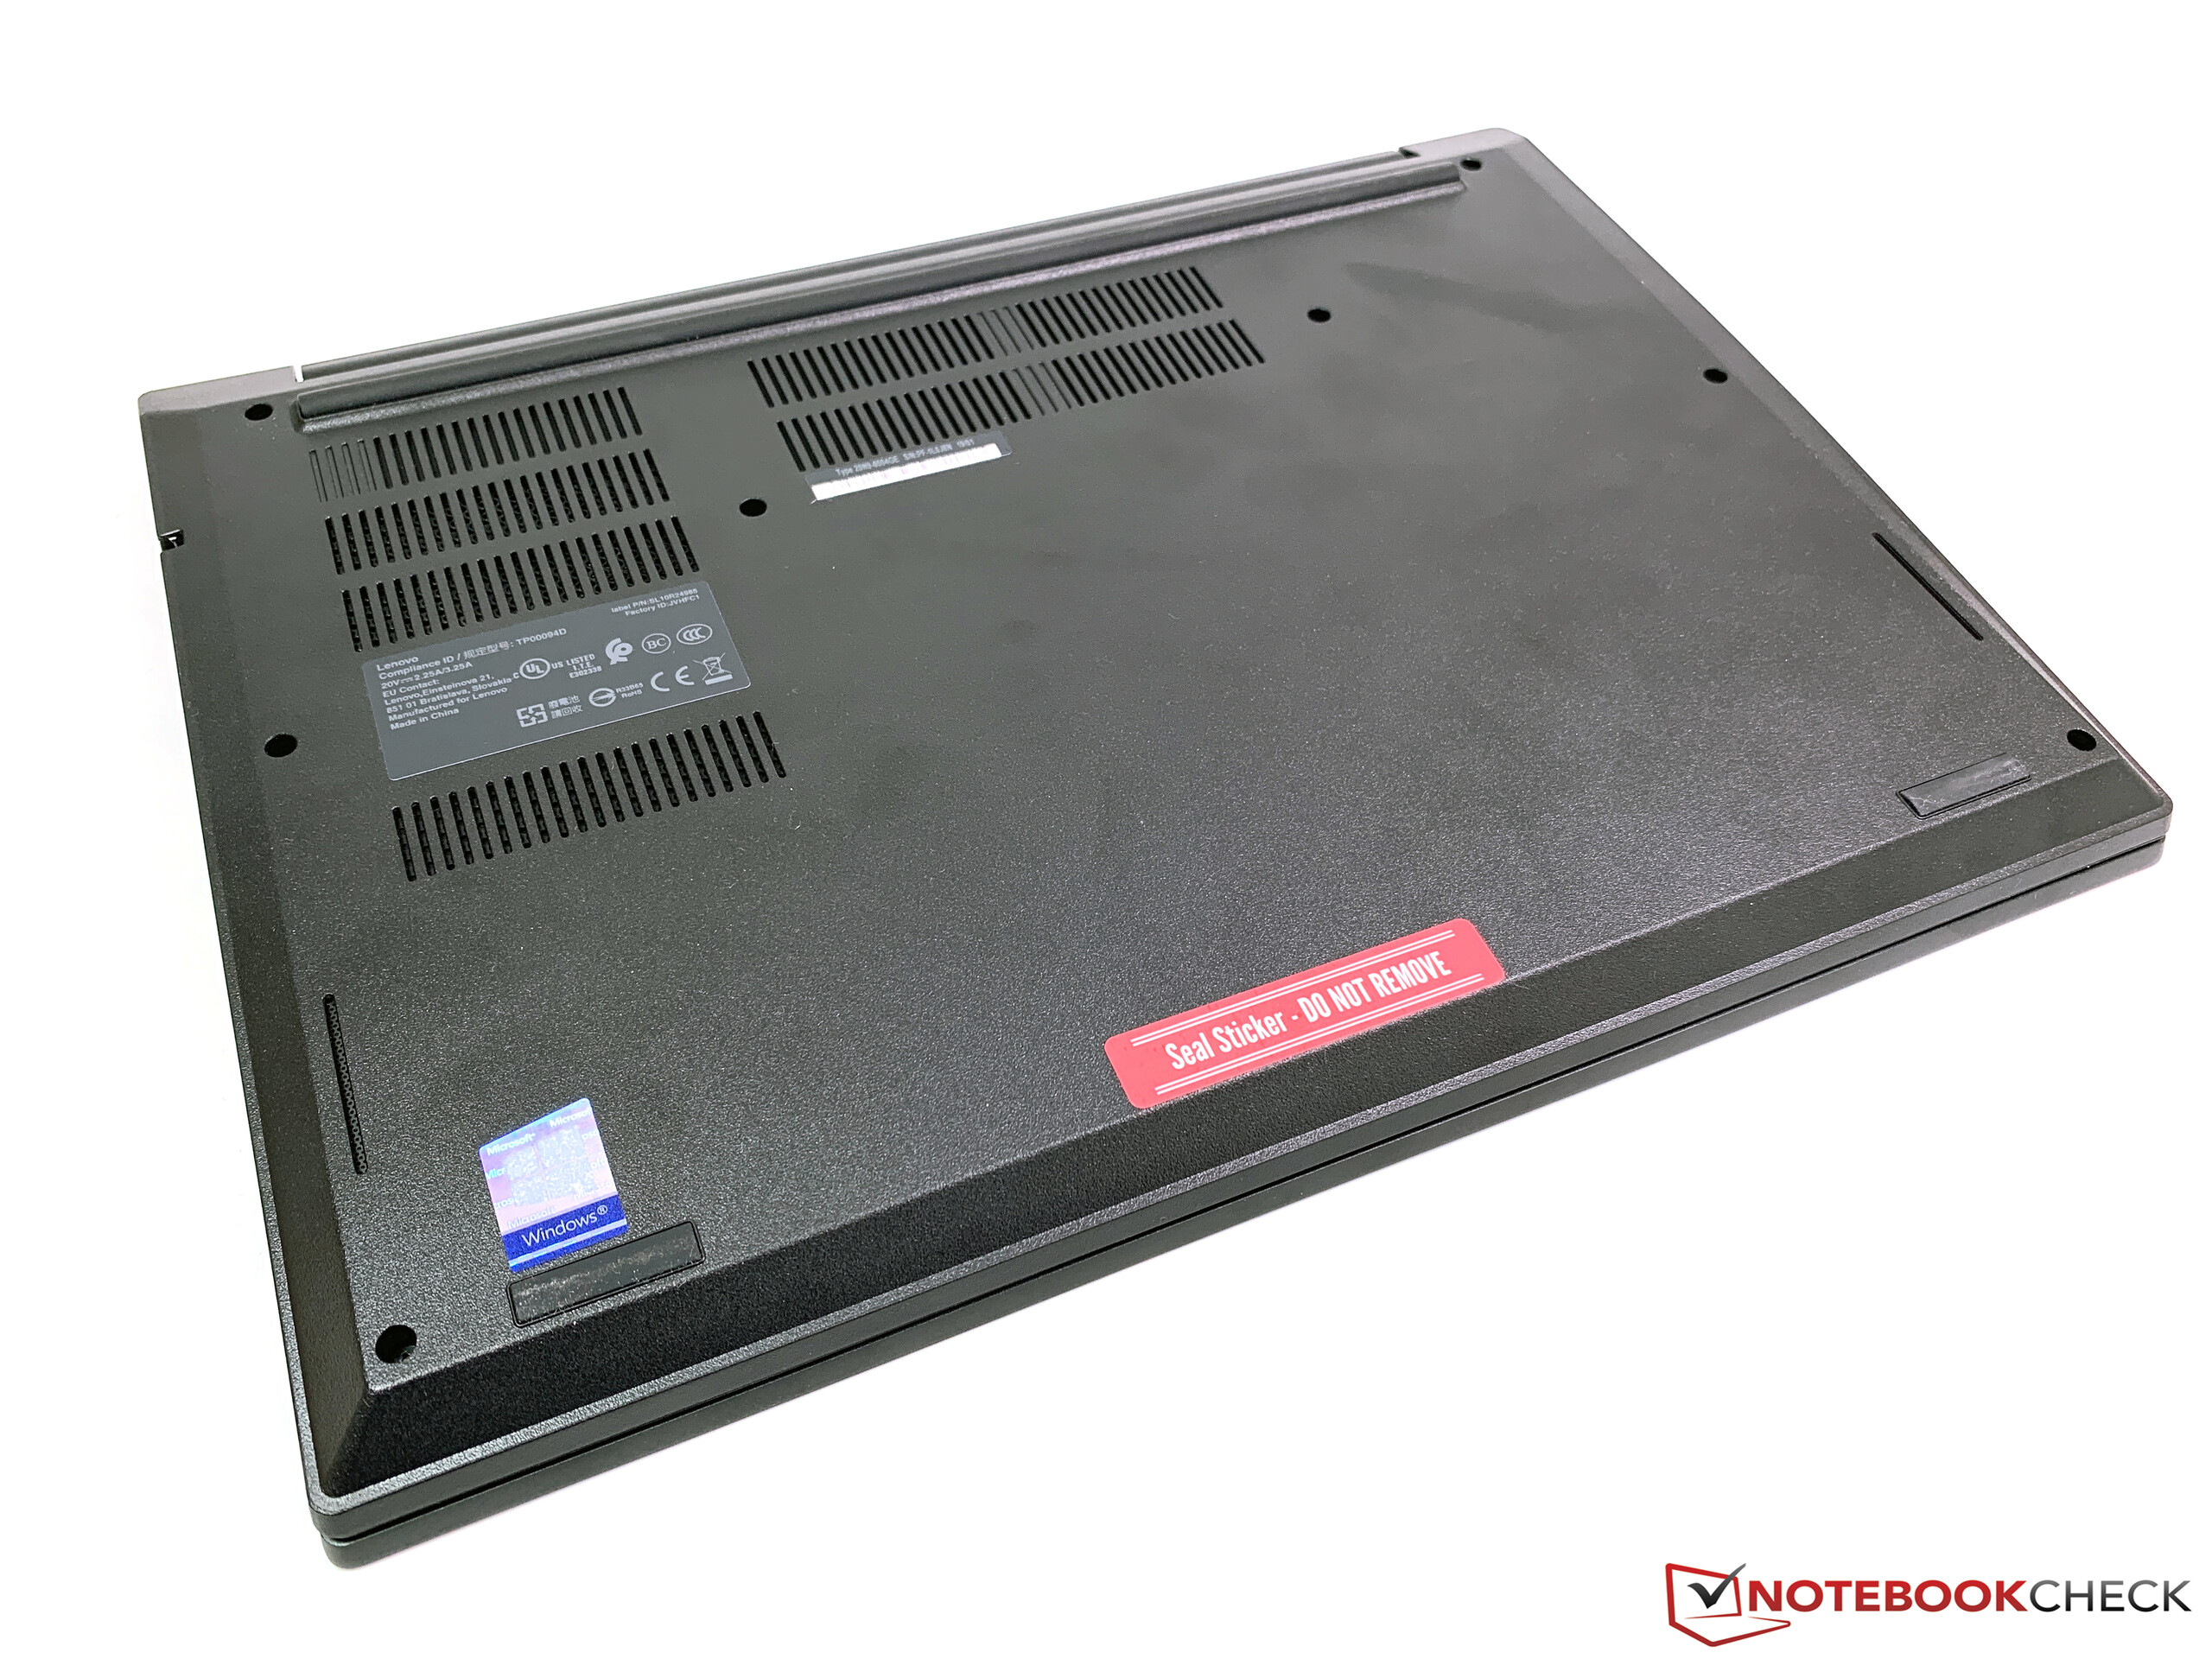
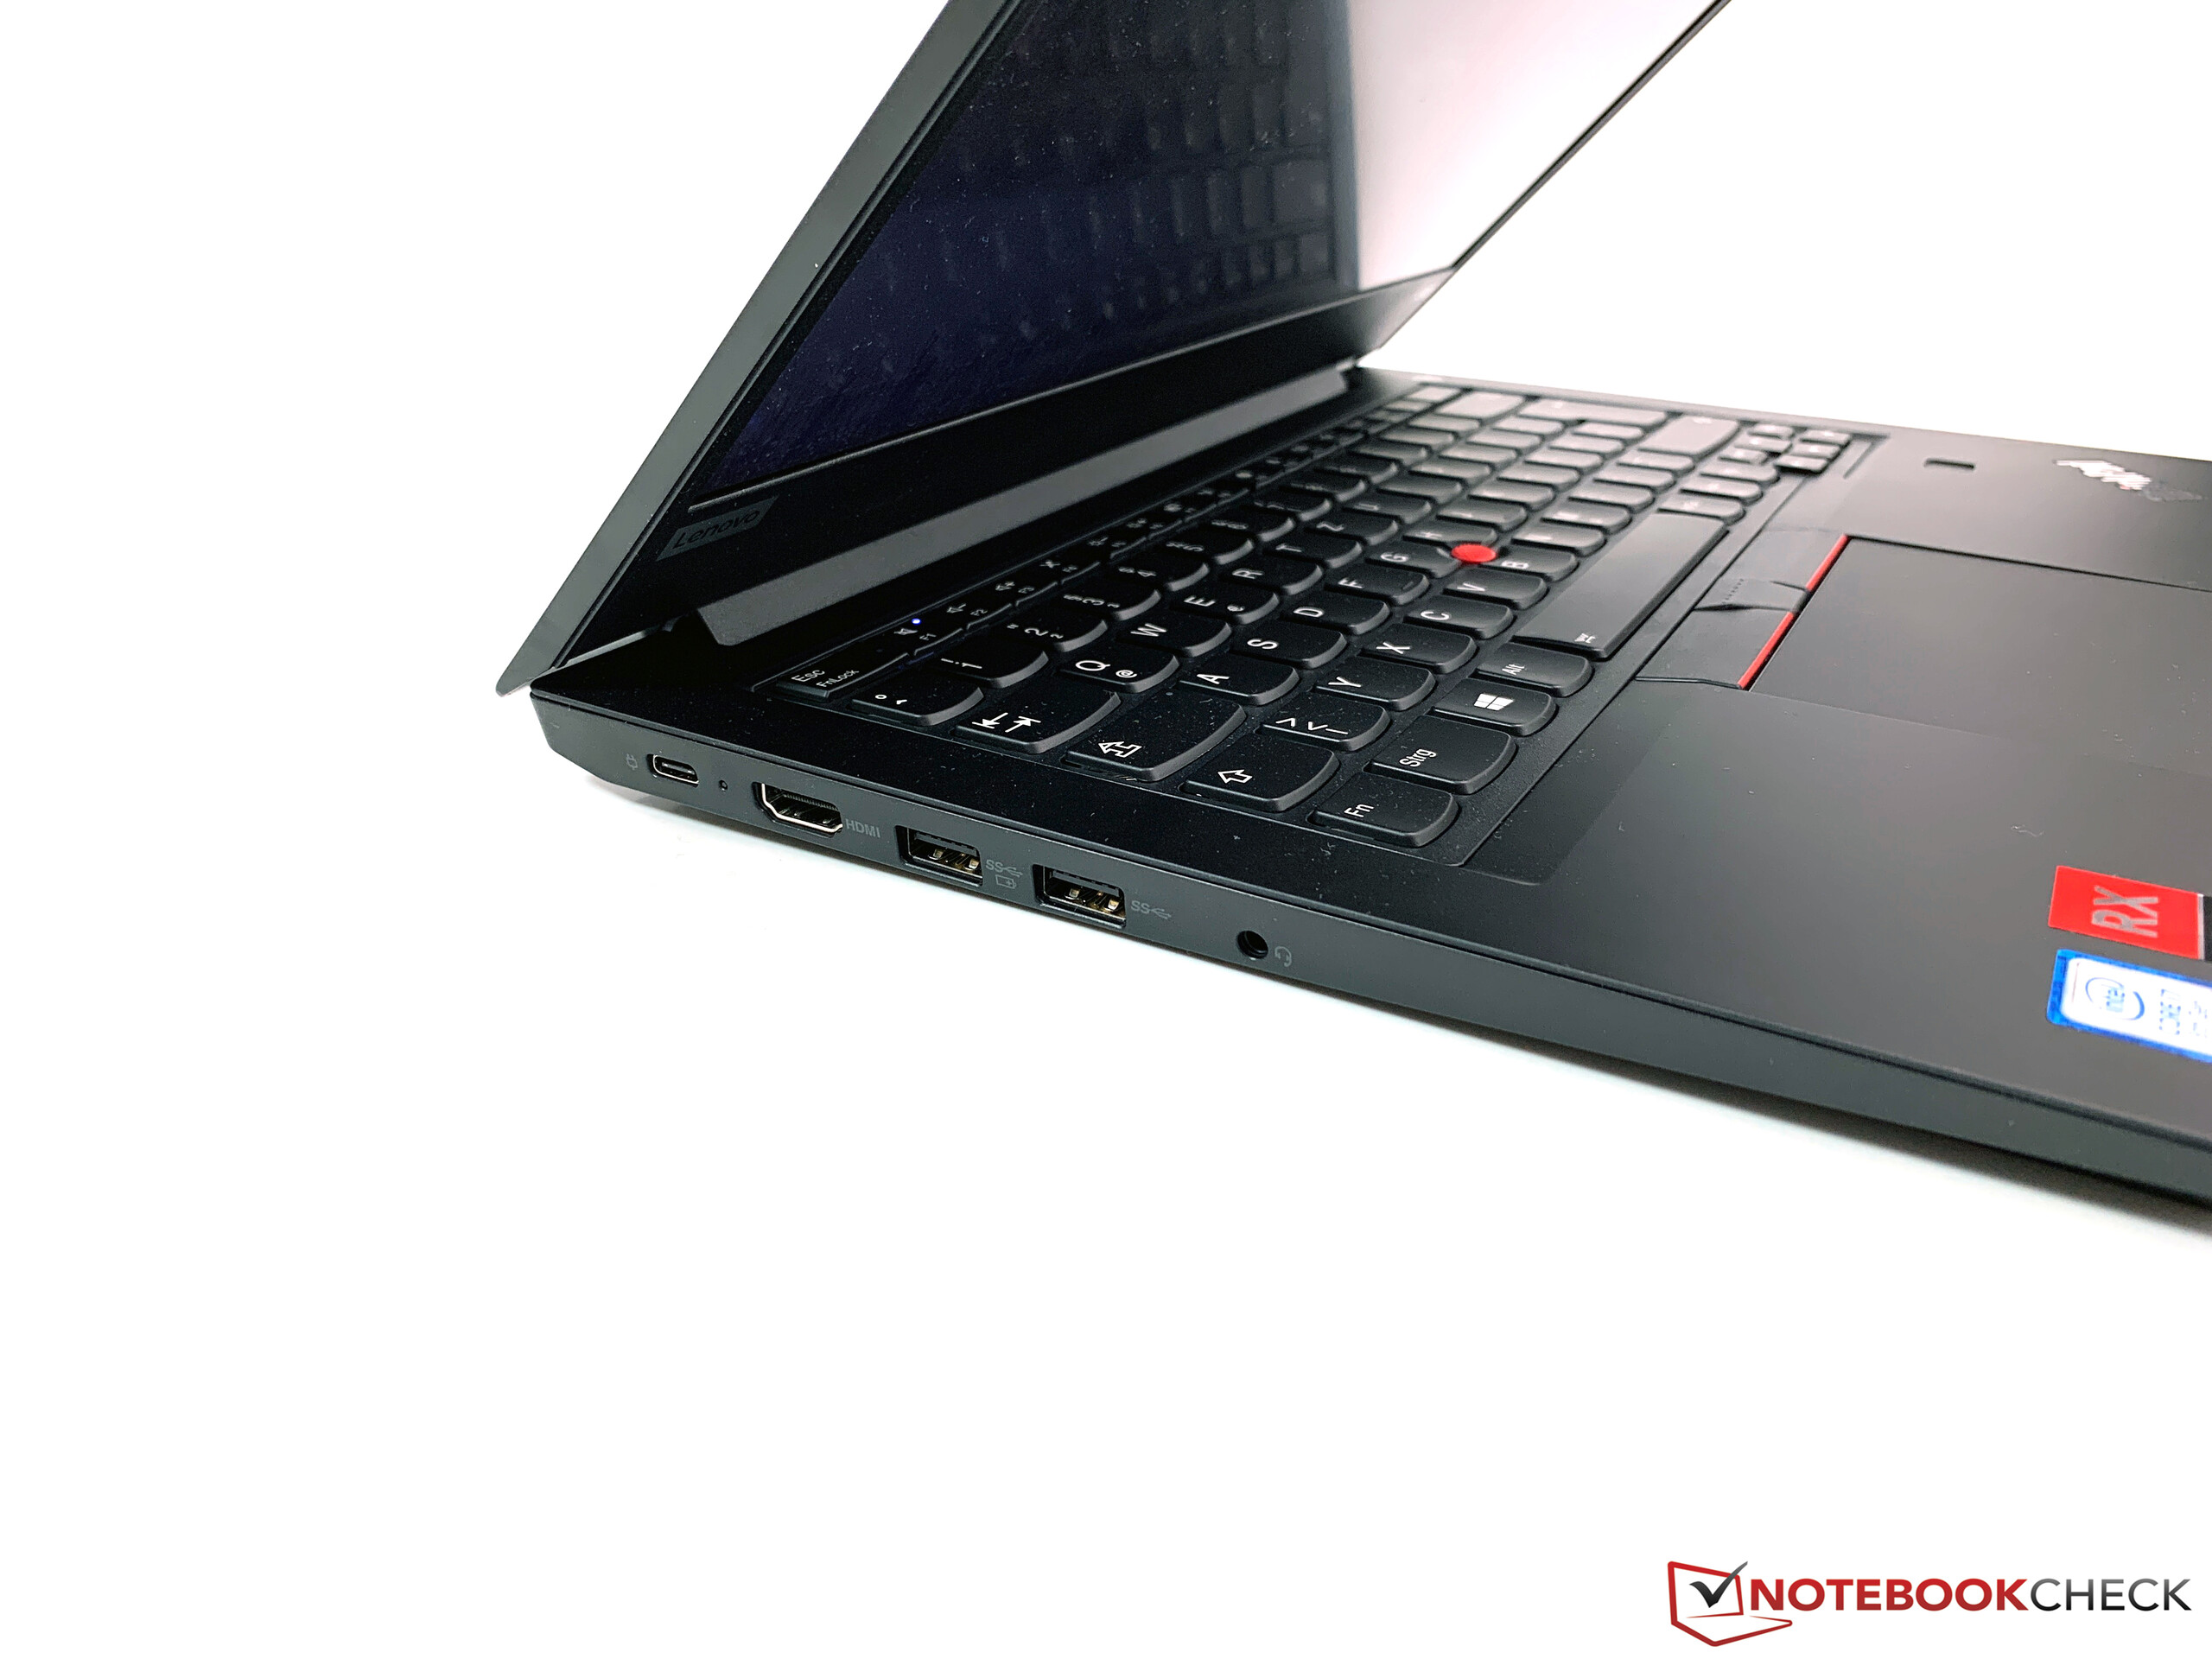
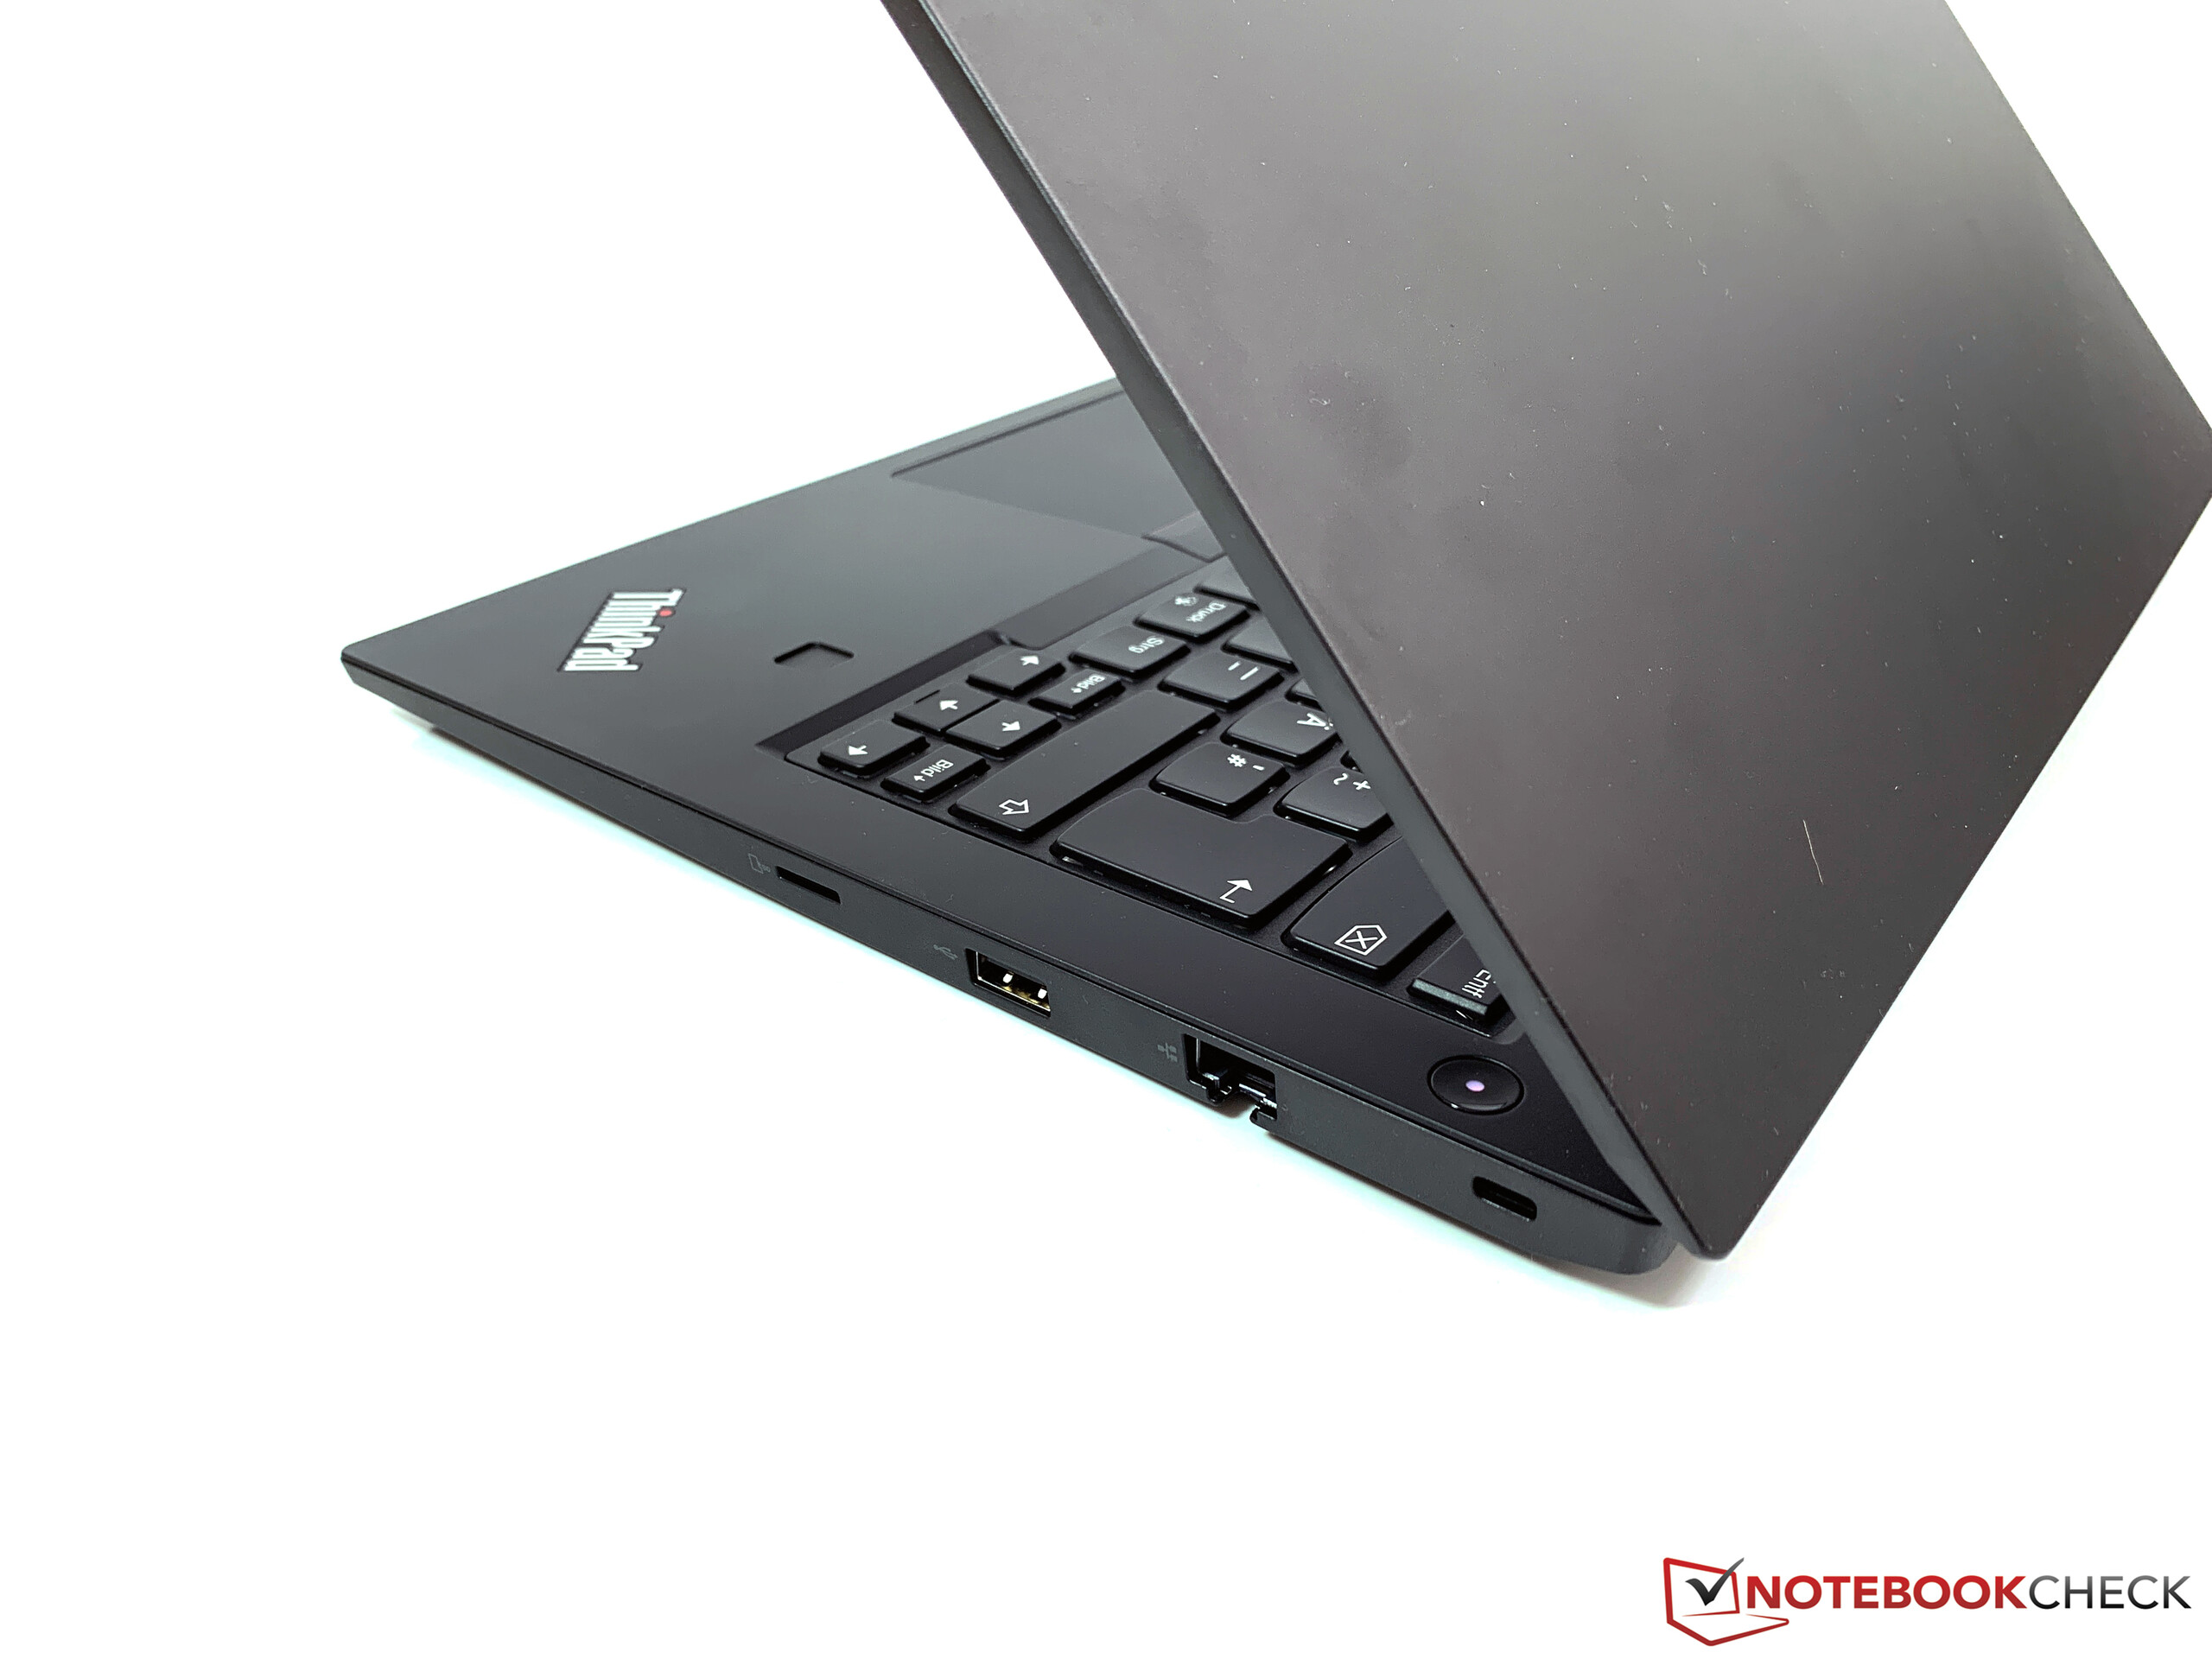
Case & Connectivity


| SD Card Reader | |
| average JPG Copy Test (av. of 3 runs) | |
| Lenovo ThinkPad E495-20NE000JGE (Toshiba Exceria Pro M501) | |
| Schenker VIA 14 | |
| HP ProBook 440 G6-5TK01EA (Toshiba Exceria Pro SDXC 64 GB UHS-II) | |
| Lenovo ThinkPad E490-20N90004GE (Toshiba Exceria Pro M501) | |
| Average of class Office (19.8 - 198.5, n=22, last 2 years) | |
| maximum AS SSD Seq Read Test (1GB) | |
| Lenovo ThinkPad E495-20NE000JGE (Toshiba Exceria Pro M501) | |
| Schenker VIA 14 (Toshiba Exceria pro M501 64 GB UHS-II) | |
| Lenovo ThinkPad E490-20N90004GE (Toshiba Exceria Pro M501) | |
| HP ProBook 440 G6-5TK01EA (Toshiba Exceria Pro SDXC 64 GB UHS-II) | |
| Average of class Office (27.4 - 249, n=21, last 2 years) | |
Display – Dark IPS screen
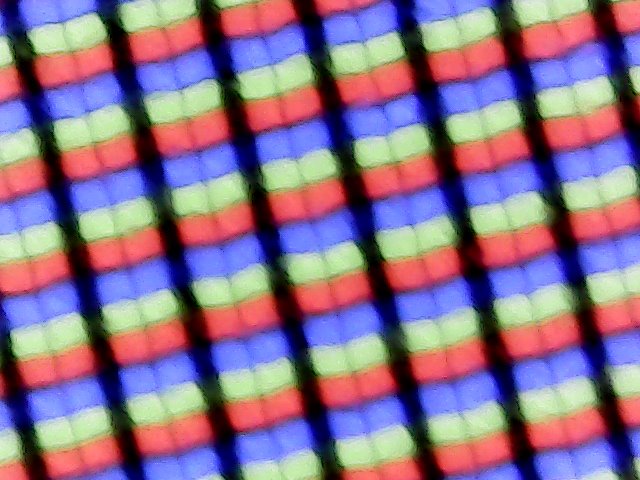
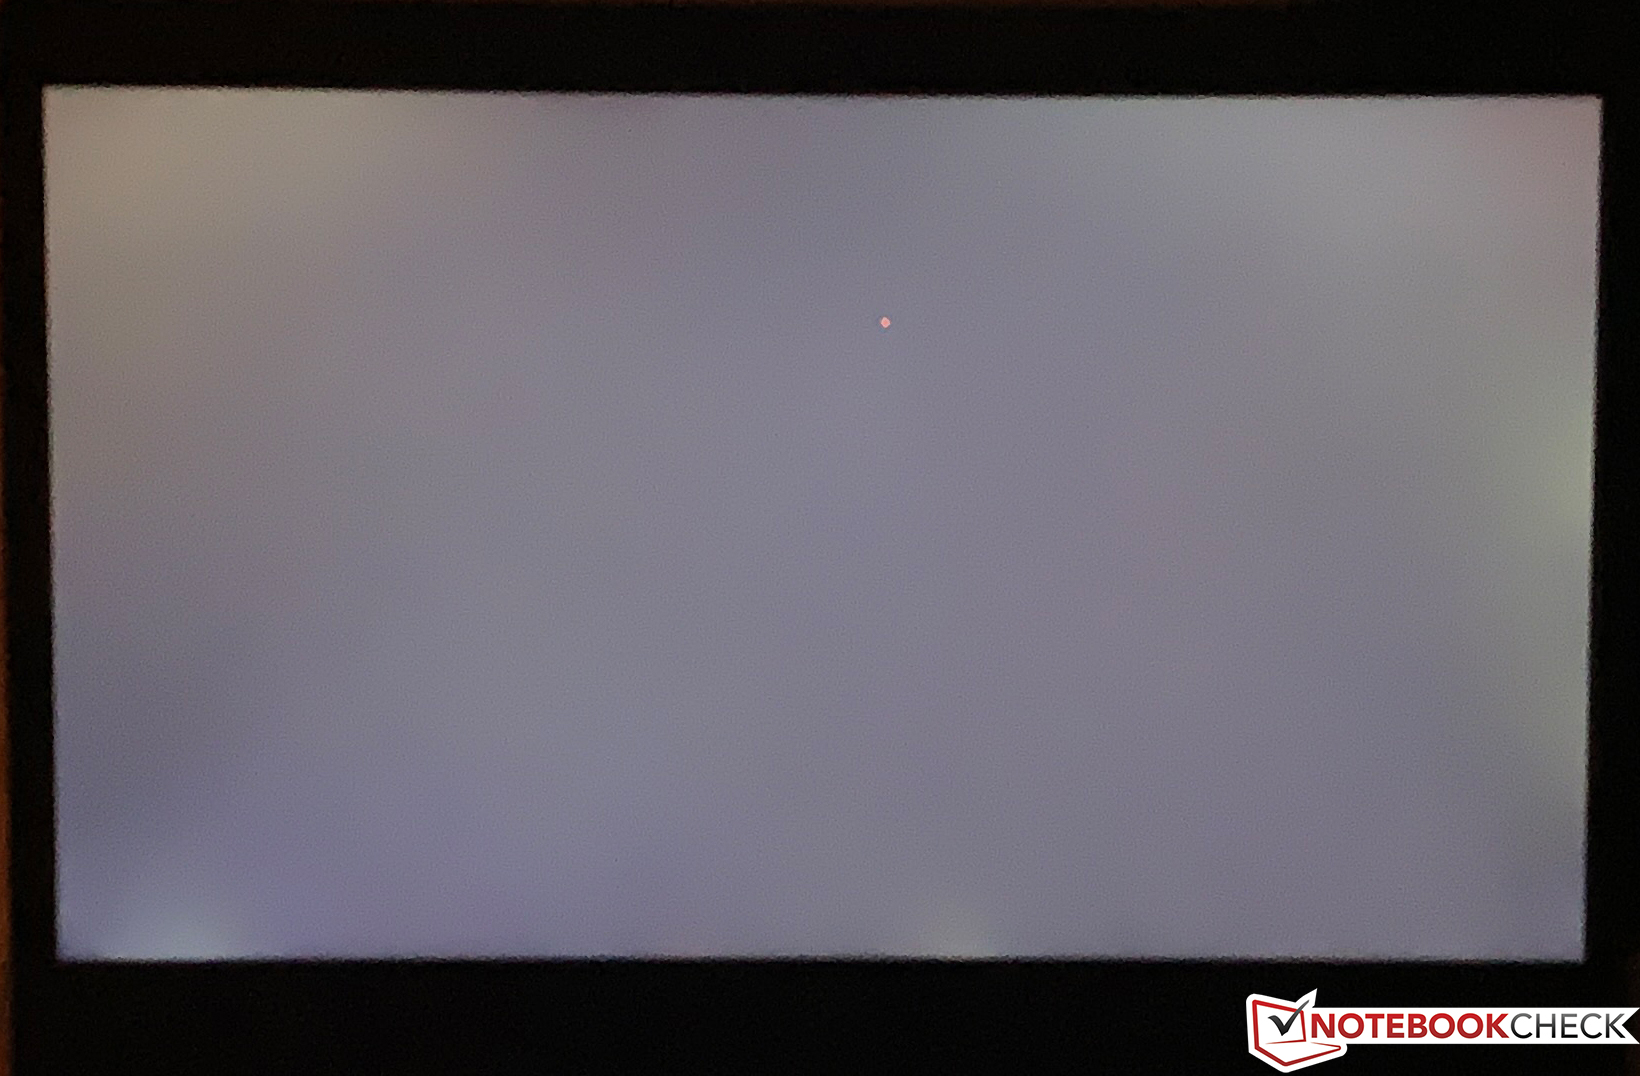
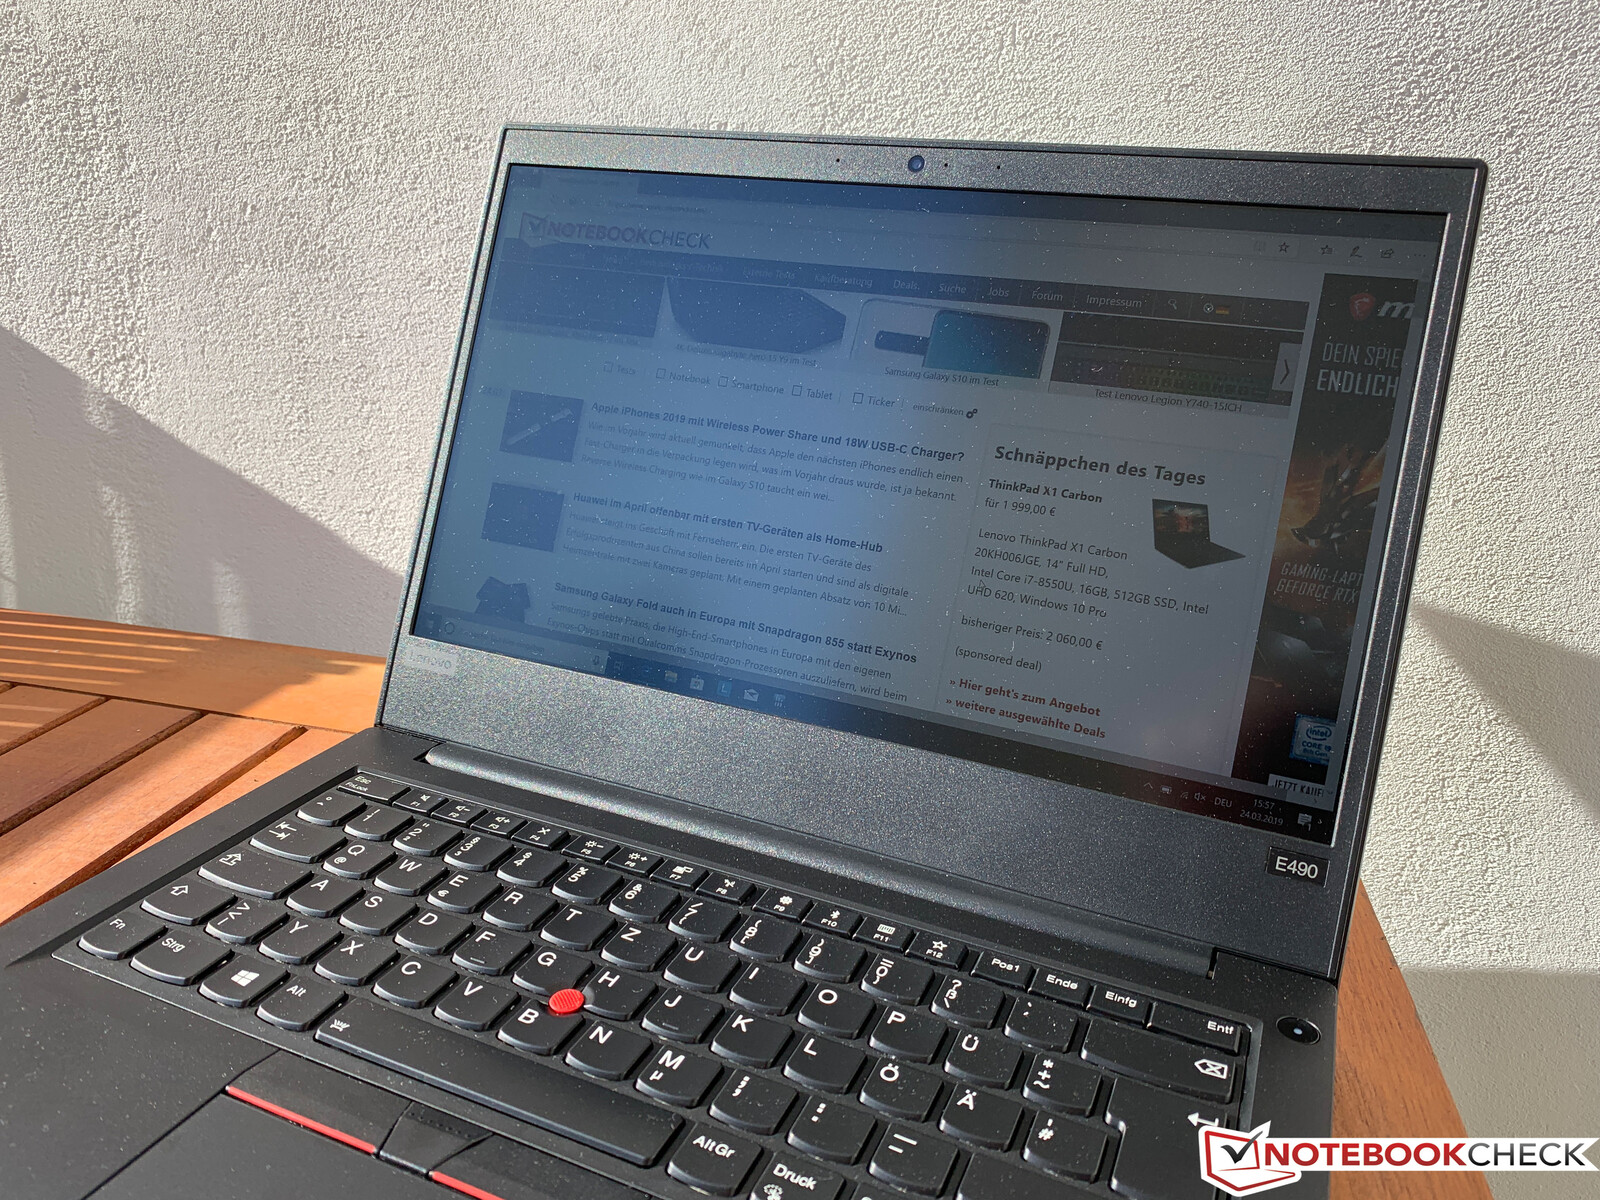
Lenovo uses 1080p screens from different suppliers for its 14-inch ThinkPads, and the customer does not have any influence over the exact model. Our test unit, for example, is equipped with a panel from AU Optronics, and the brightness is inferior compared to the BOE panel in the ThinkPad E14. However, there is at least no PWM flickering.
With an average luminance of around 260 cd/m², the E490 is still sufficiently bright and also slightly above the advertised luminance. The subjective picture impression is okay and bright areas do not appear too grainy. Our test unit did not suffer from heavy backlight bleeding, either.
| |||||||||||||||||||||||||
Brightness Distribution: 85 %
Center on Battery: 278 cd/m²
Contrast: 1463:1 (Black: 0.19 cd/m²)
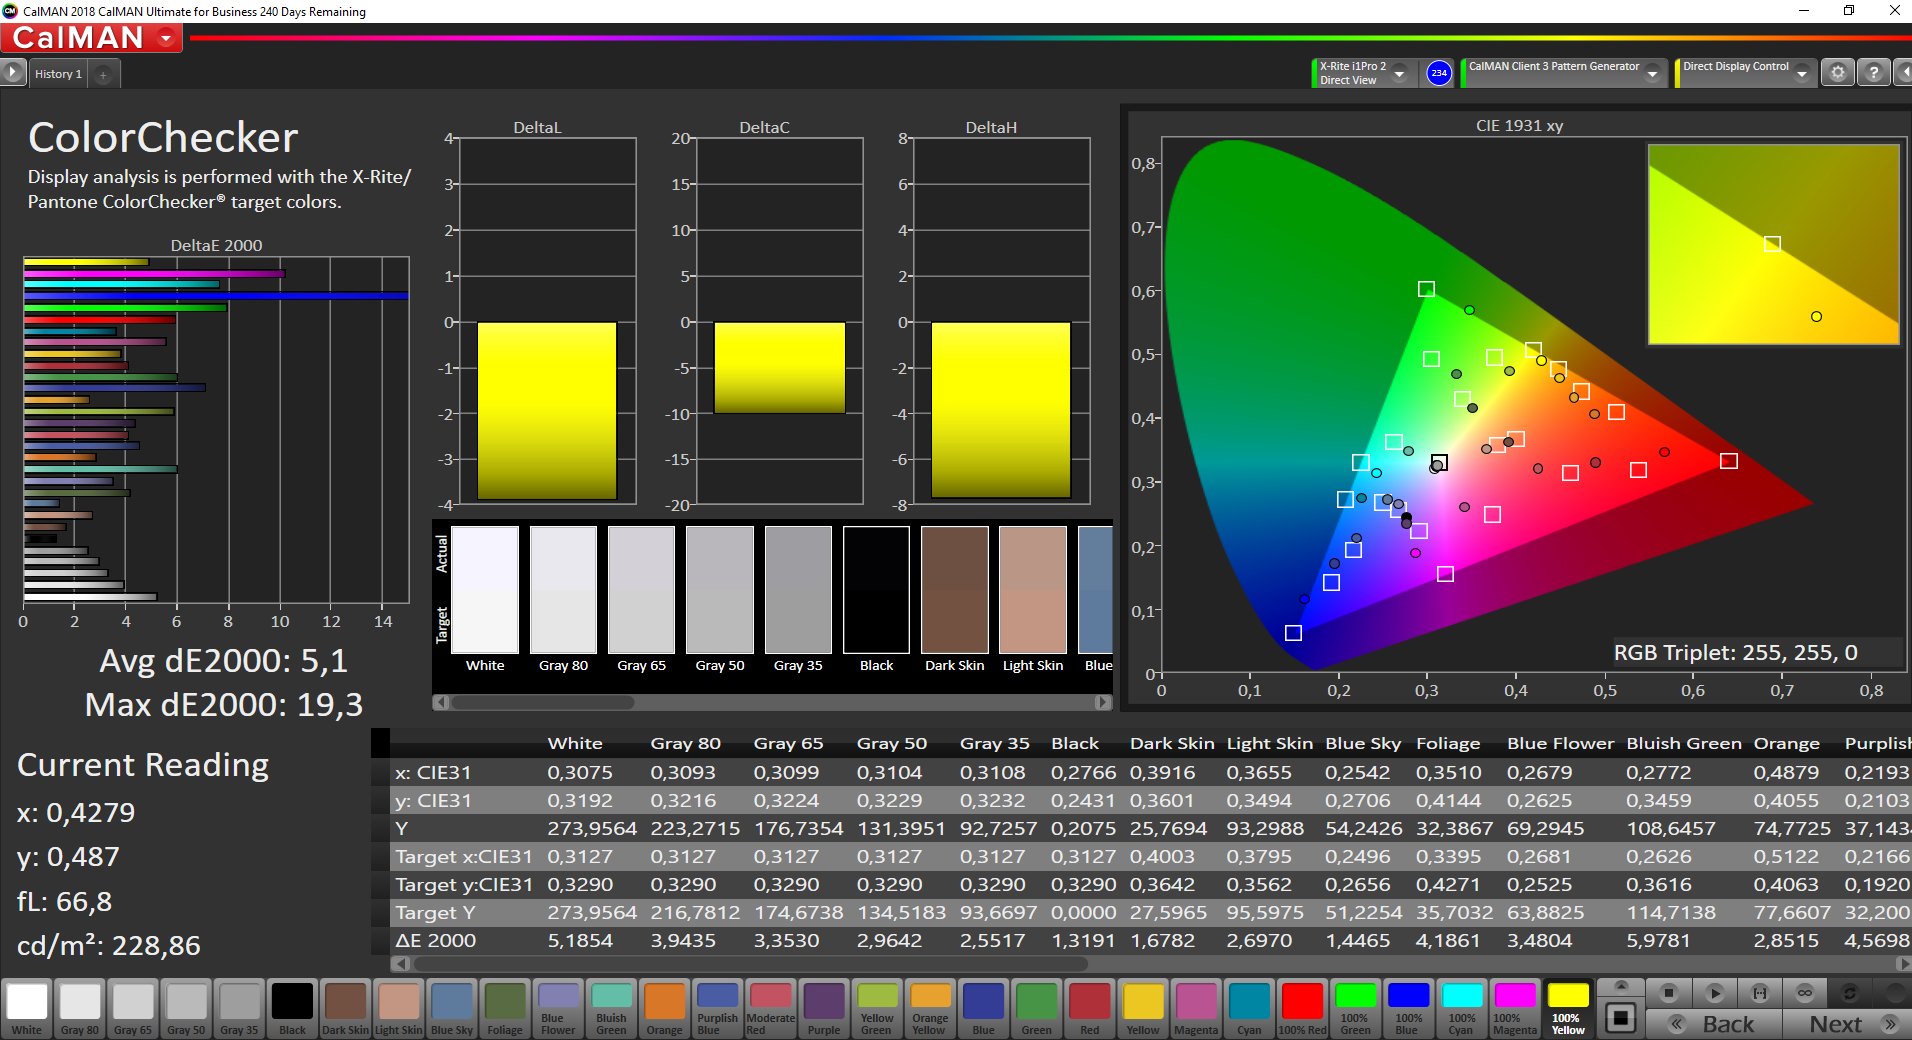
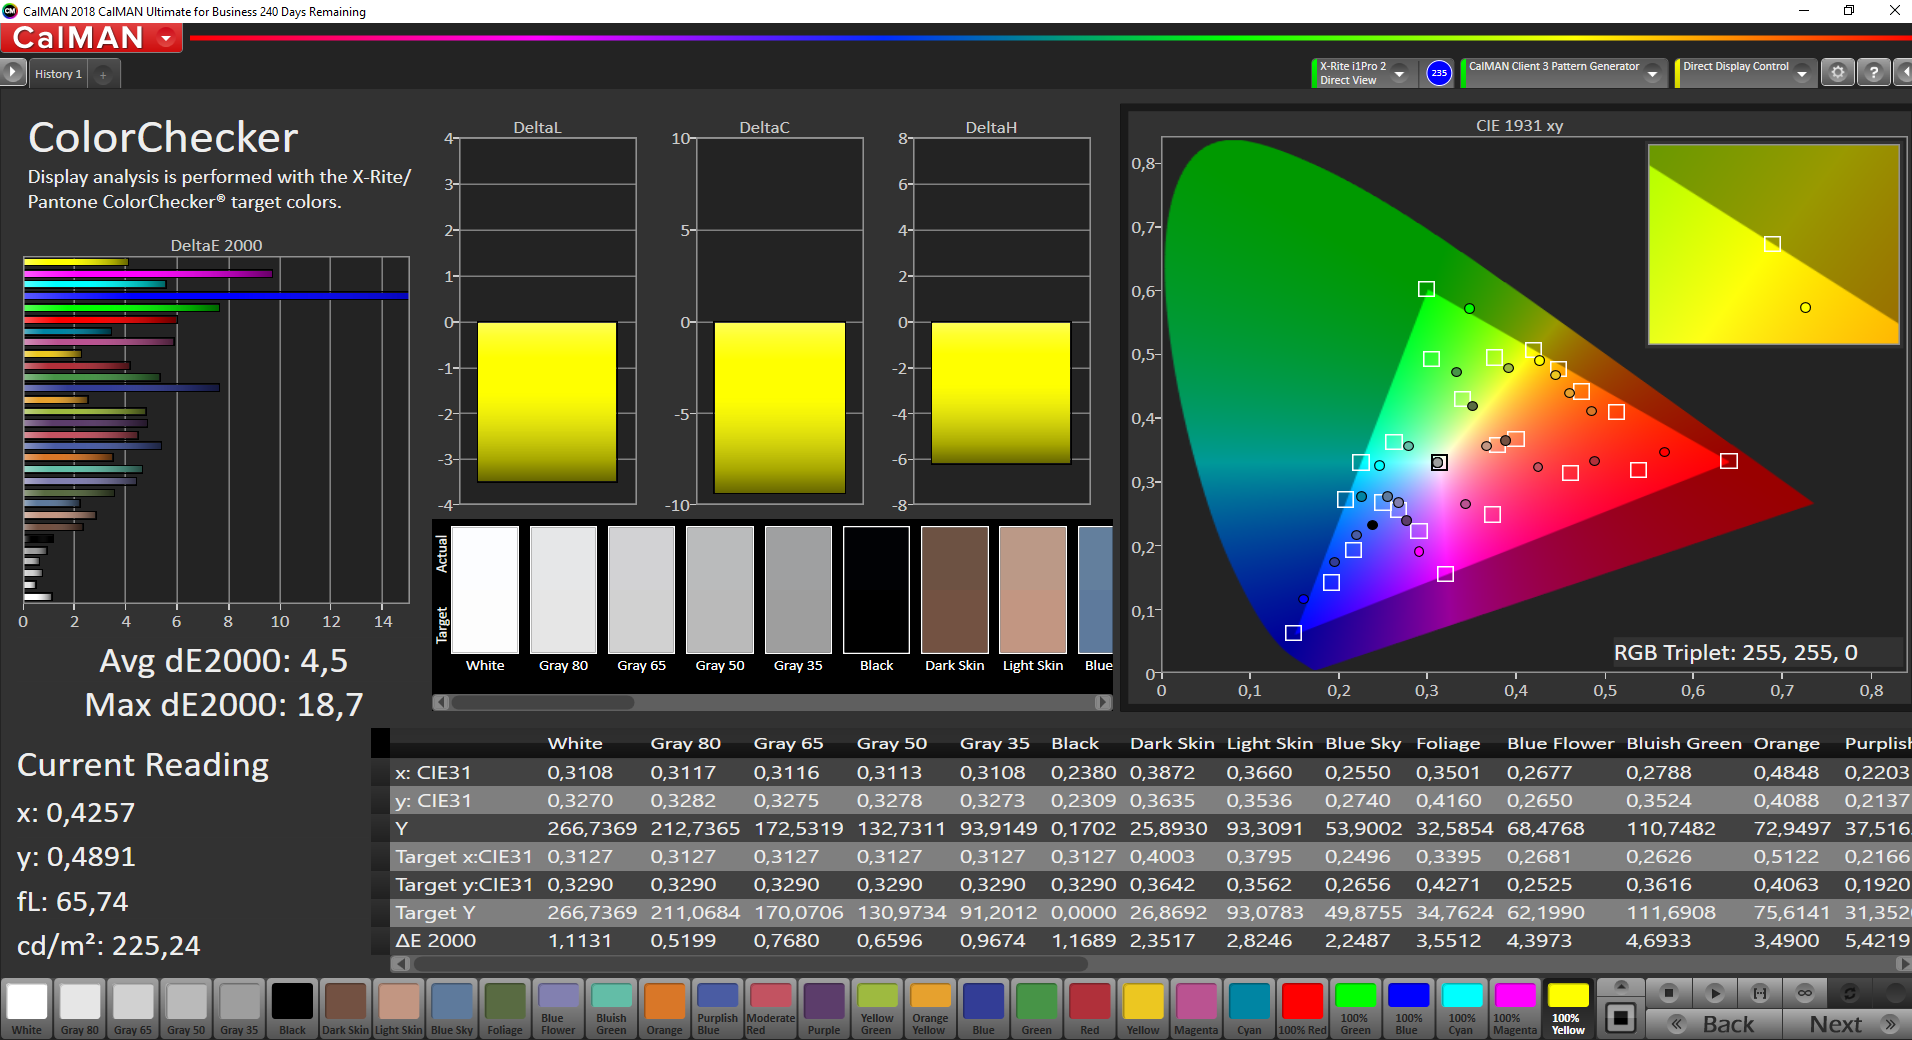
ΔE ColorChecker Calman: 5.1 | ∀{0.5-29.43 Ø4.73}
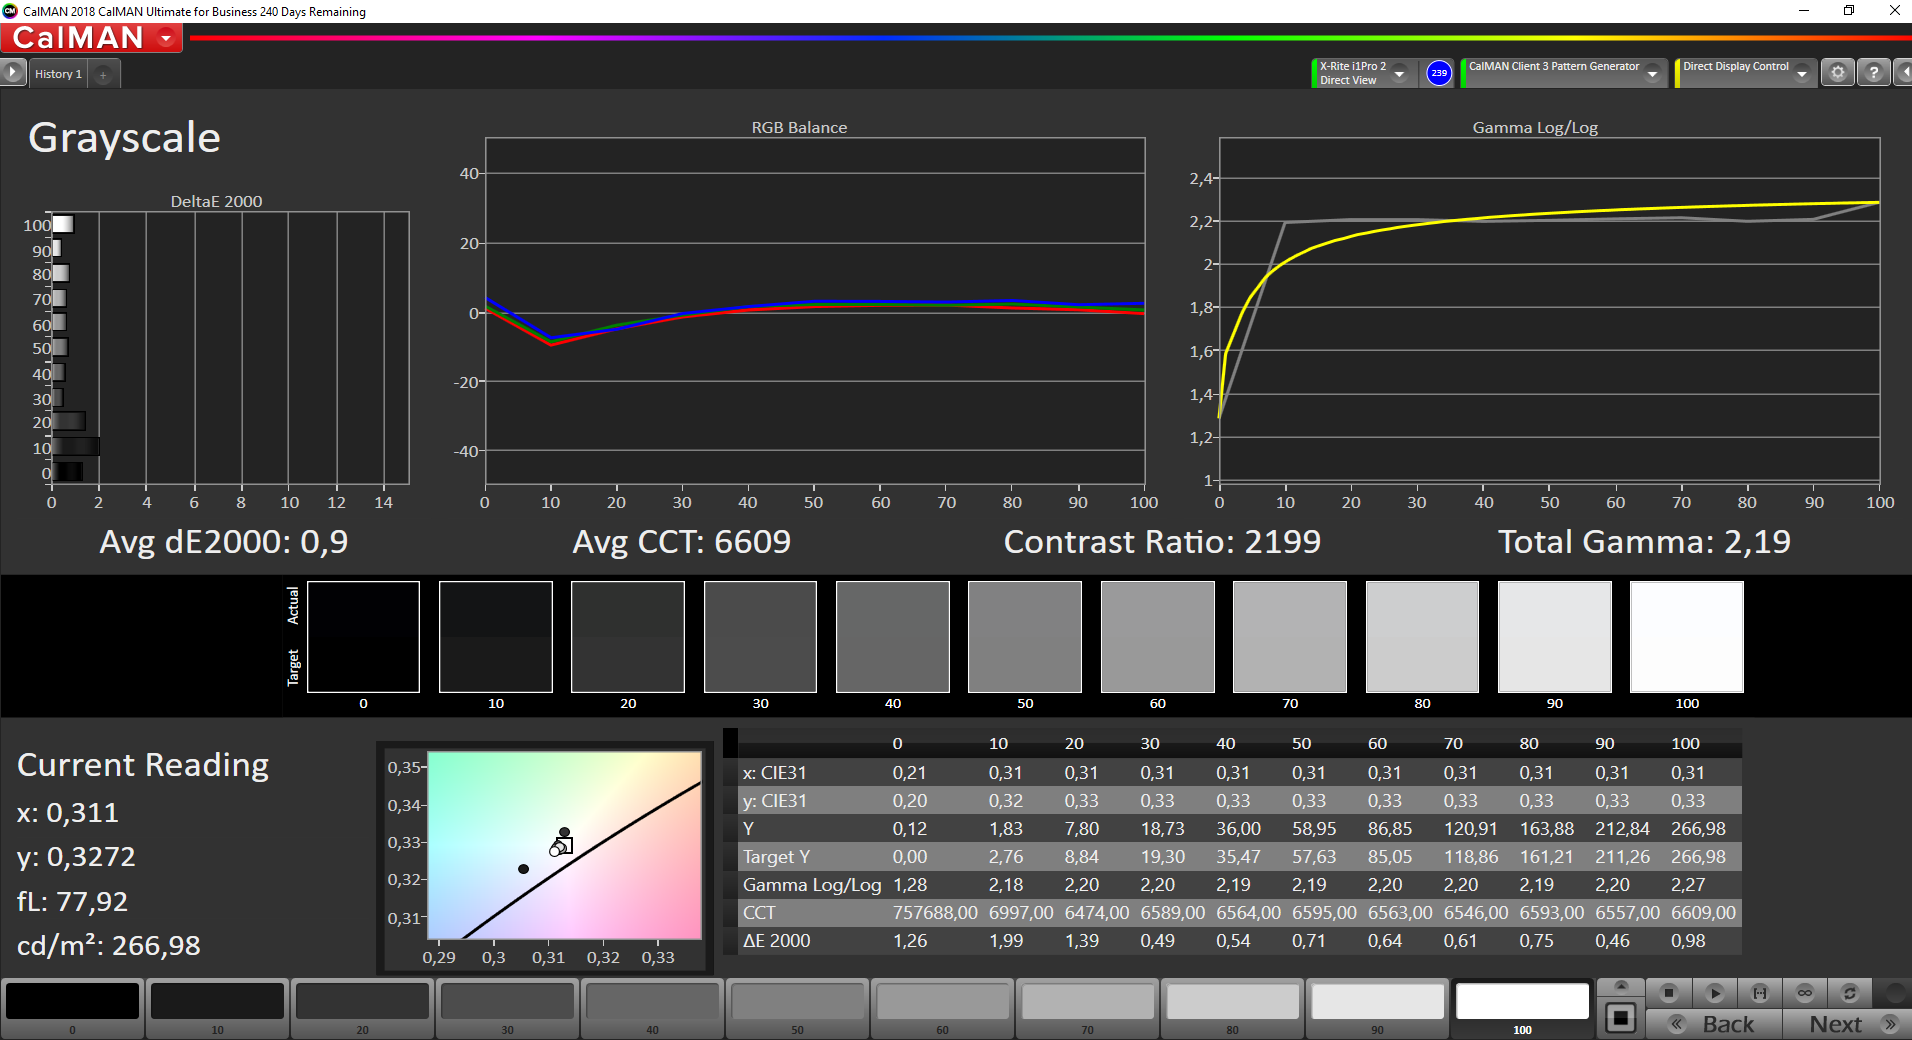
calibrated: 4.5
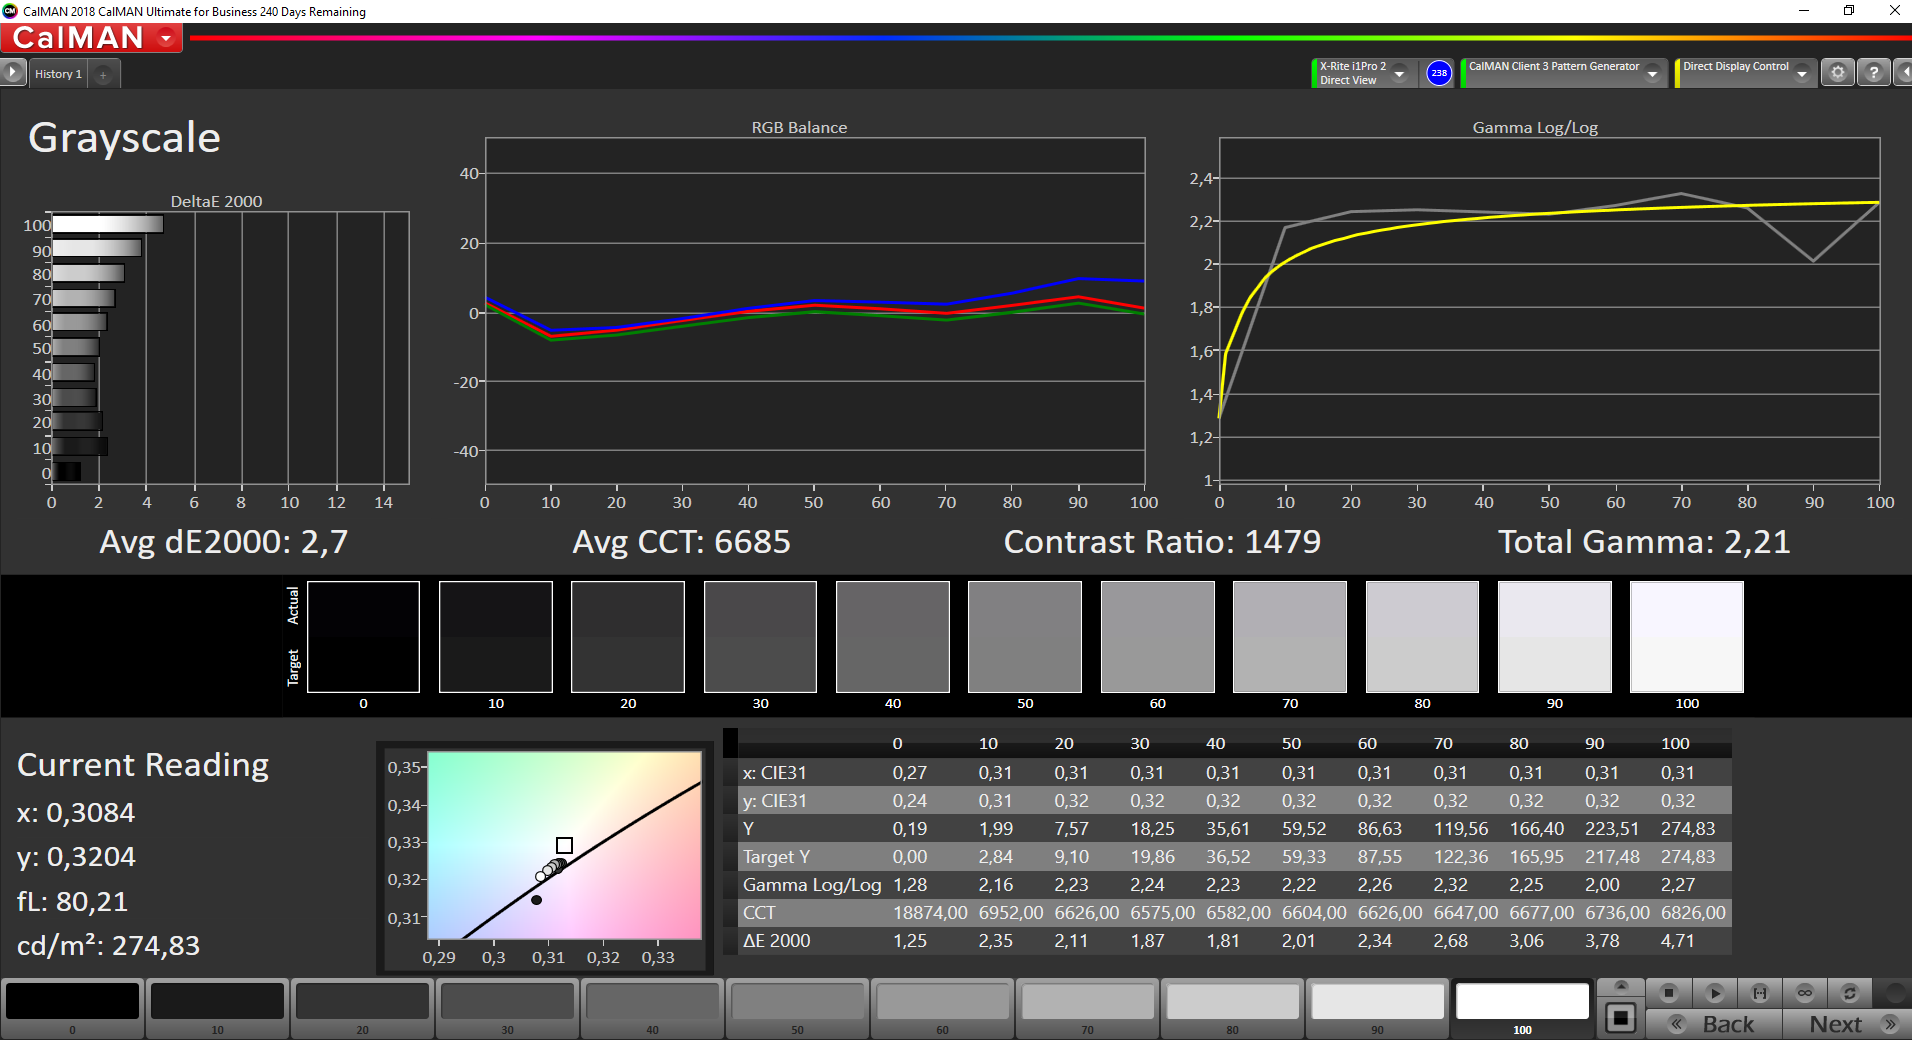
ΔE Greyscale Calman: 2.7 | ∀{0.09-98 Ø4.97}
58.4% sRGB (Argyll 1.6.3 3D)
37.1% AdobeRGB 1998 (Argyll 1.6.3 3D)
40.27% AdobeRGB 1998 (Argyll 3D)
58.6% sRGB (Argyll 3D)
38.98% Display P3 (Argyll 3D)
Gamma: 2.21
CCT: 6685 K
| Lenovo ThinkPad E490-20N90004GE B140HAN04.2, IPS, 1920x1080, 14" | Lenovo ThinkPad E495-20NE000JGE N140HCA-EAC, IPS, 1920x1080, 14" | HP ProBook 440 G6-5TK01EA LG Philips, LGD05F1, IPS, 1920x1080, 14" | Schenker VIA 14 B140HAN06.2, a-Si AHVA-IPS LED, 1920x1080, 14" | Lenovo ThinkPad E14 20RA001MGE NV140FHM-N48, IPS LED, 1920x1080, 14" | |
|---|---|---|---|---|---|
| Display | 9% | -2% | 76% | 3% | |
| Display P3 Coverage (%) | 38.98 | 42.37 9% | 38.08 -2% | 69.8 79% | 40.31 3% |
| sRGB Coverage (%) | 58.6 | 63.5 8% | 57.2 -2% | 99.6 70% | 60 2% |
| AdobeRGB 1998 Coverage (%) | 40.27 | 43.8 9% | 39.37 -2% | 71.6 78% | 41.65 3% |
| Response Times | 2% | 7% | -28% | -25% | |
| Response Time Grey 50% / Grey 80% * (ms) | 44 ? | 40.8 ? 7% | 41.6 ? 5% | 60.8 ? -38% | 52 ? -18% |
| Response Time Black / White * (ms) | 30 ? | 30.8 ? -3% | 27.2 ? 9% | 35.2 ? -17% | 39.2 ? -31% |
| PWM Frequency (Hz) | 25000 ? | 1250 ? | |||
| Screen | 1% | -13% | 36% | -1% | |
| Brightness middle (cd/m²) | 278 | 241 -13% | 256 -8% | 335 21% | 305 10% |
| Brightness (cd/m²) | 257 | 230 -11% | 238 -7% | 309 20% | 292 14% |
| Brightness Distribution (%) | 85 | 75 -12% | 85 0% | 84 -1% | 89 5% |
| Black Level * (cd/m²) | 0.19 | 0.17 11% | 0.23 -21% | 0.17 11% | 0.17 11% |
| Contrast (:1) | 1463 | 1418 -3% | 1113 -24% | 1971 35% | 1794 23% |
| Colorchecker dE 2000 * | 5.1 | 4.7 8% | 6.2 -22% | 2.3 55% | 5.9 -16% |
| Colorchecker dE 2000 max. * | 19.3 | 19.7 -2% | 18.2 6% | 5 74% | 18.4 5% |
| Colorchecker dE 2000 calibrated * | 4.5 | 4.2 7% | 5.2 -16% | 1 78% | 4.6 -2% |
| Greyscale dE 2000 * | 2.7 | 2.6 4% | 3.8 -41% | 3.9 -44% | 4.4 -63% |
| Gamma | 2.21 100% | 2.12 104% | 2.5 88% | 2.19 100% | 2.05 107% |
| CCT | 6685 97% | 6507 100% | 6643 98% | 6556 99% | 6921 94% |
| Color Space (Percent of AdobeRGB 1998) (%) | 37.1 | 40.3 9% | 36.1 -3% | 65.5 77% | 38.2 3% |
| Color Space (Percent of sRGB) (%) | 58.4 | 63.3 8% | 56.9 -3% | 99.6 71% | 59.6 2% |
| Total Average (Program / Settings) | 4% /
2% | -3% /
-8% | 28% /
36% | -8% /
-3% |
* ... smaller is better
Display Response Times
| ↔ Response Time Black to White | ||
|---|---|---|
| 30 ms ... rise ↗ and fall ↘ combined | ↗ 17.2 ms rise | 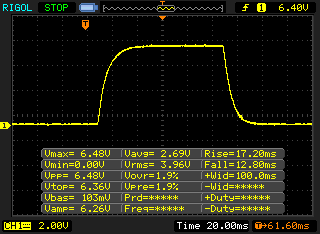 |
| ↘ 12.8 ms fall | ||
| The screen shows slow response rates in our tests and will be unsatisfactory for gamers. In comparison, all tested devices range from 0.1 (minimum) to 240 (maximum) ms. » 80 % of all devices are better. This means that the measured response time is worse than the average of all tested devices (19.9 ms). | ||
| ↔ Response Time 50% Grey to 80% Grey | ||
| 44 ms ... rise ↗ and fall ↘ combined | ↗ 22 ms rise | 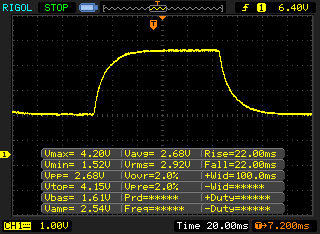 |
| ↘ 22 ms fall | ||
| The screen shows slow response rates in our tests and will be unsatisfactory for gamers. In comparison, all tested devices range from 0.165 (minimum) to 636 (maximum) ms. » 73 % of all devices are better. This means that the measured response time is worse than the average of all tested devices (31.1 ms). | ||
Screen Flickering / PWM (Pulse-Width Modulation)
| Screen flickering / PWM not detected | 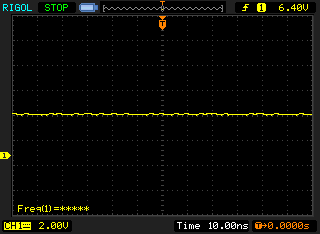 | ||
In comparison: 52 % of all tested devices do not use PWM to dim the display. If PWM was detected, an average of 7791 (minimum: 5 - maximum: 343500) Hz was measured. | |||
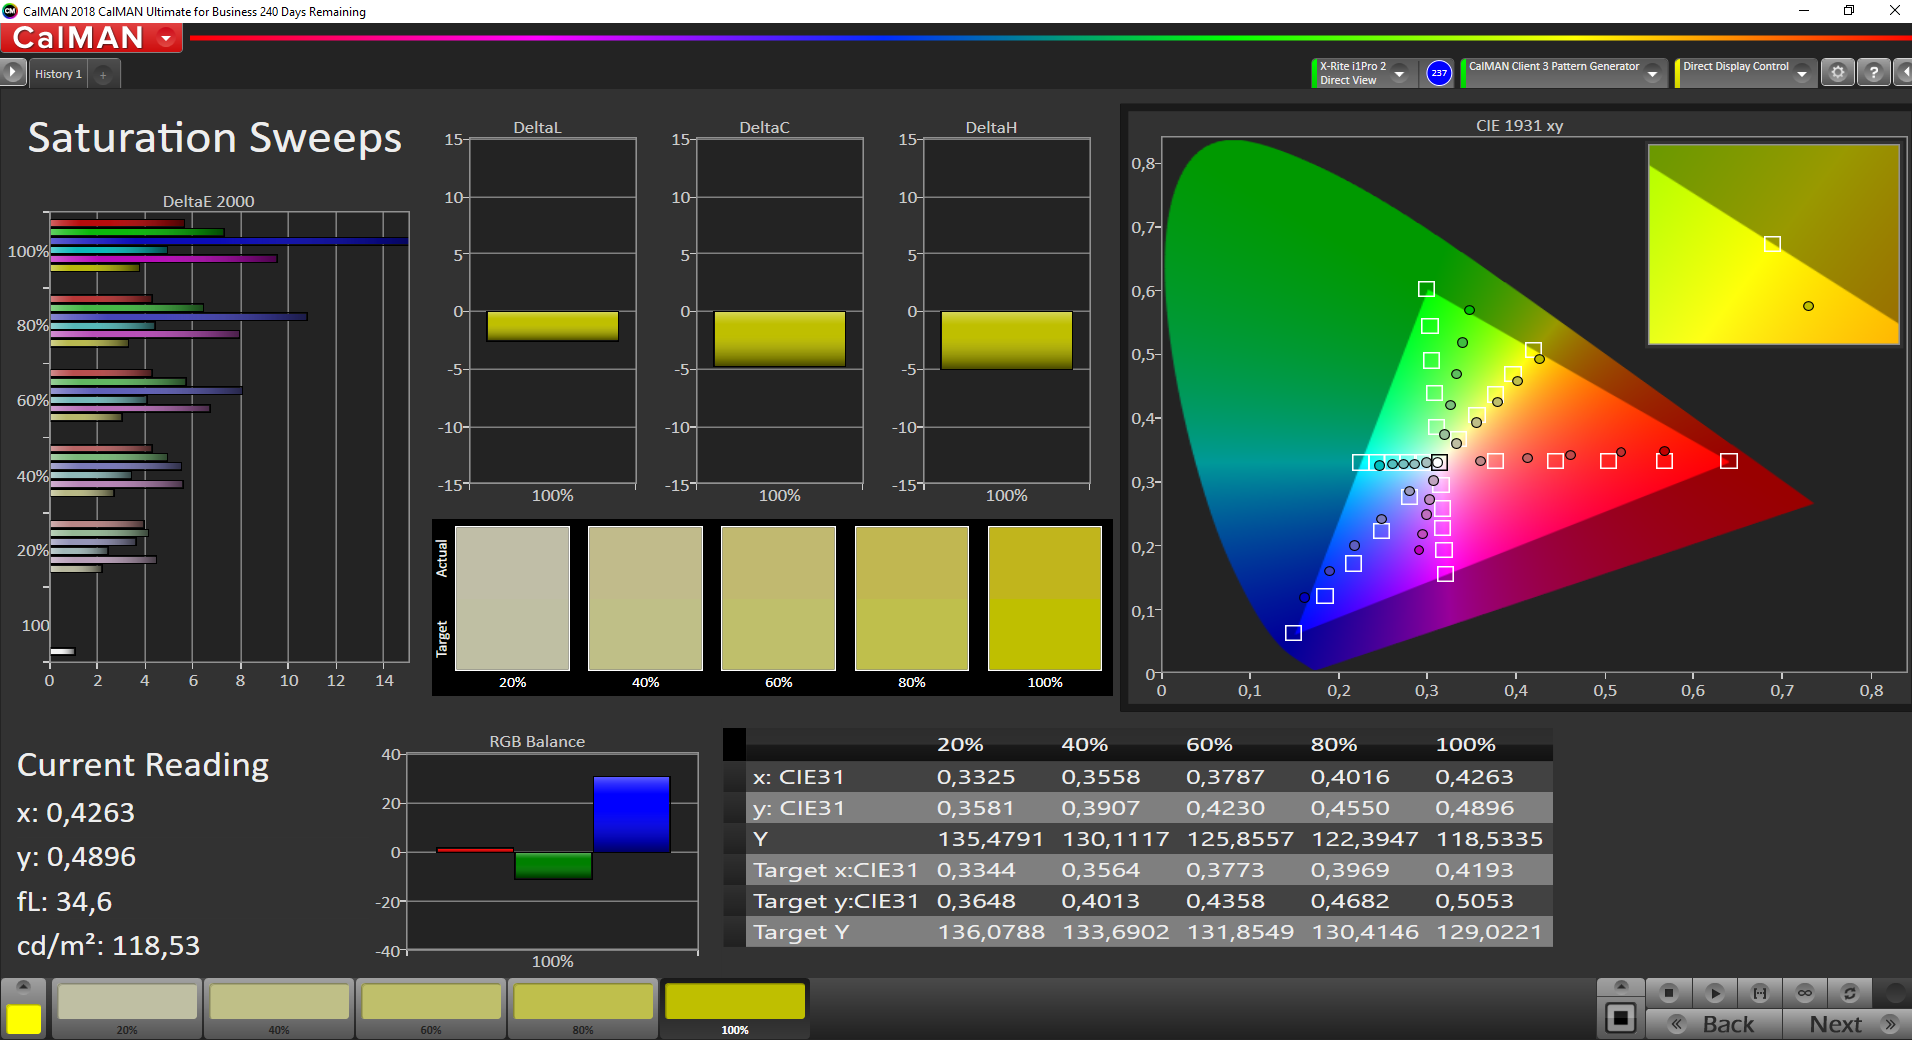
The grayscale performance is pretty decent out of the box and there is no annoying color cast. A look at the color accuracy reveals that this is an inexpensive IPS panel. Because of the high color deviations and the limited color gamut, this screen is not suited for any serious picture or video-editing, even after our calibration.
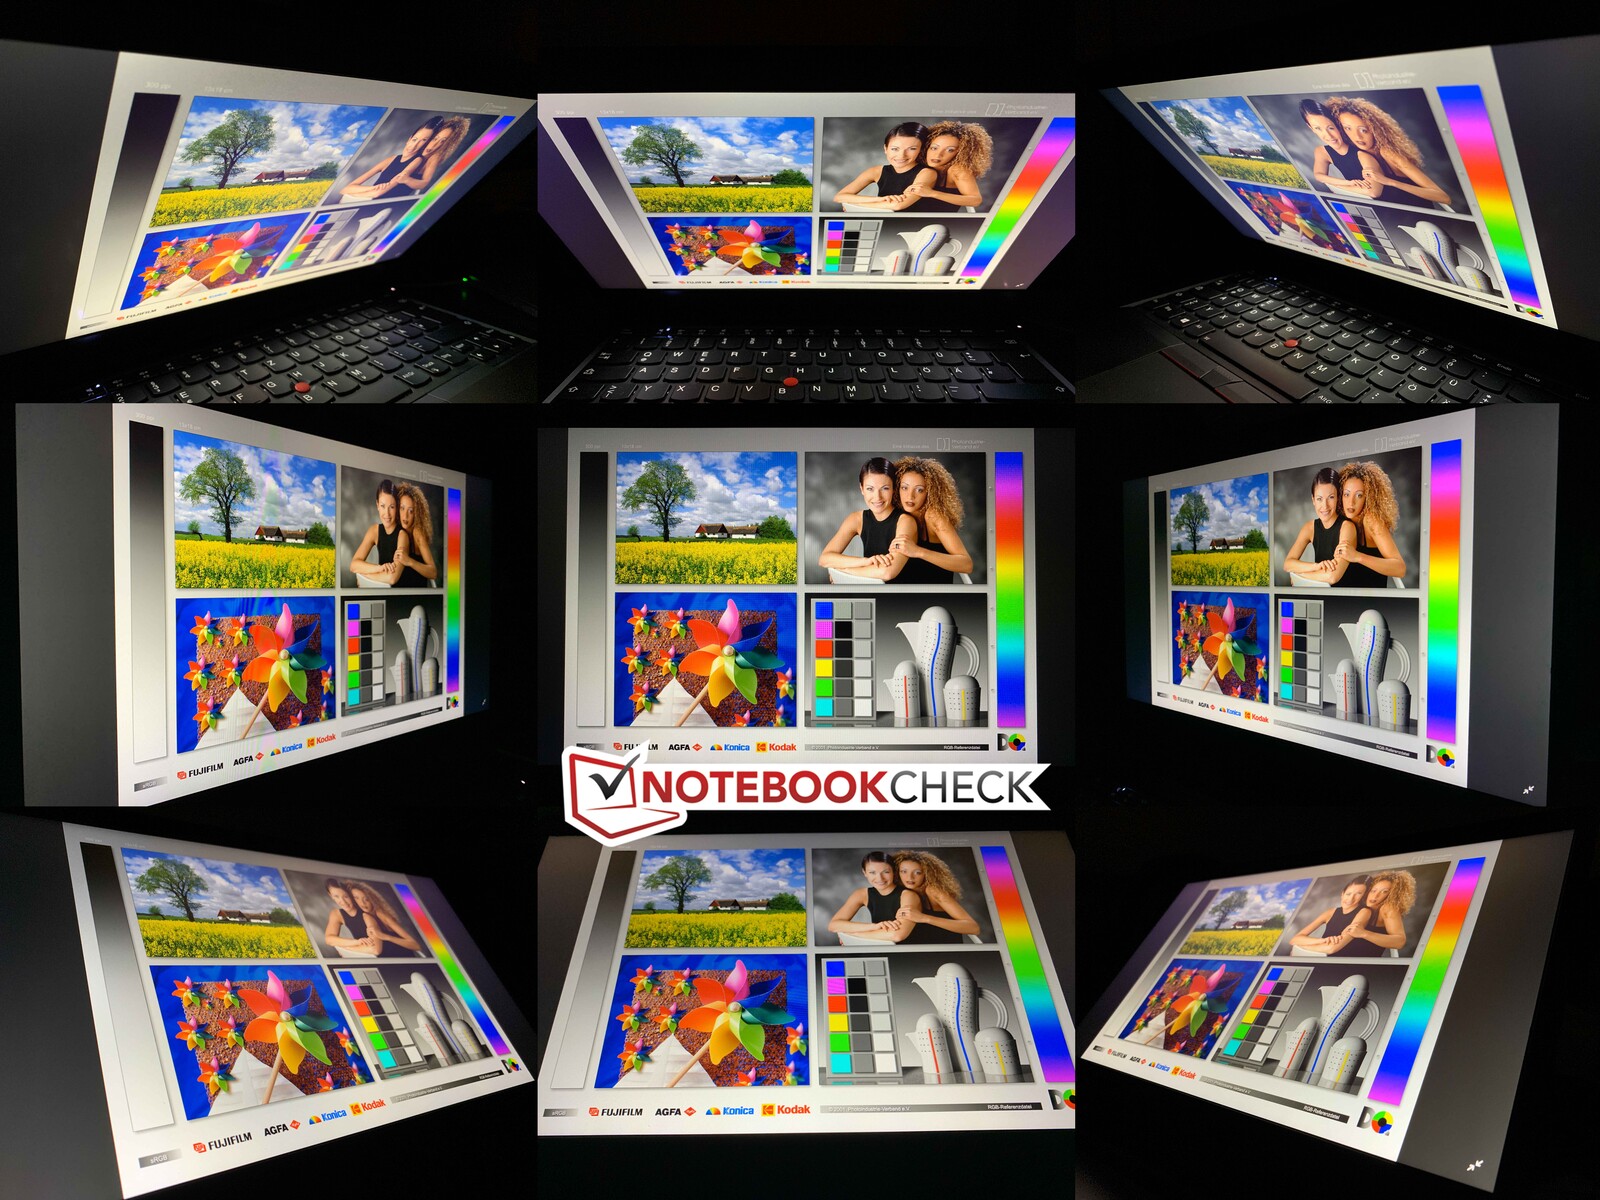
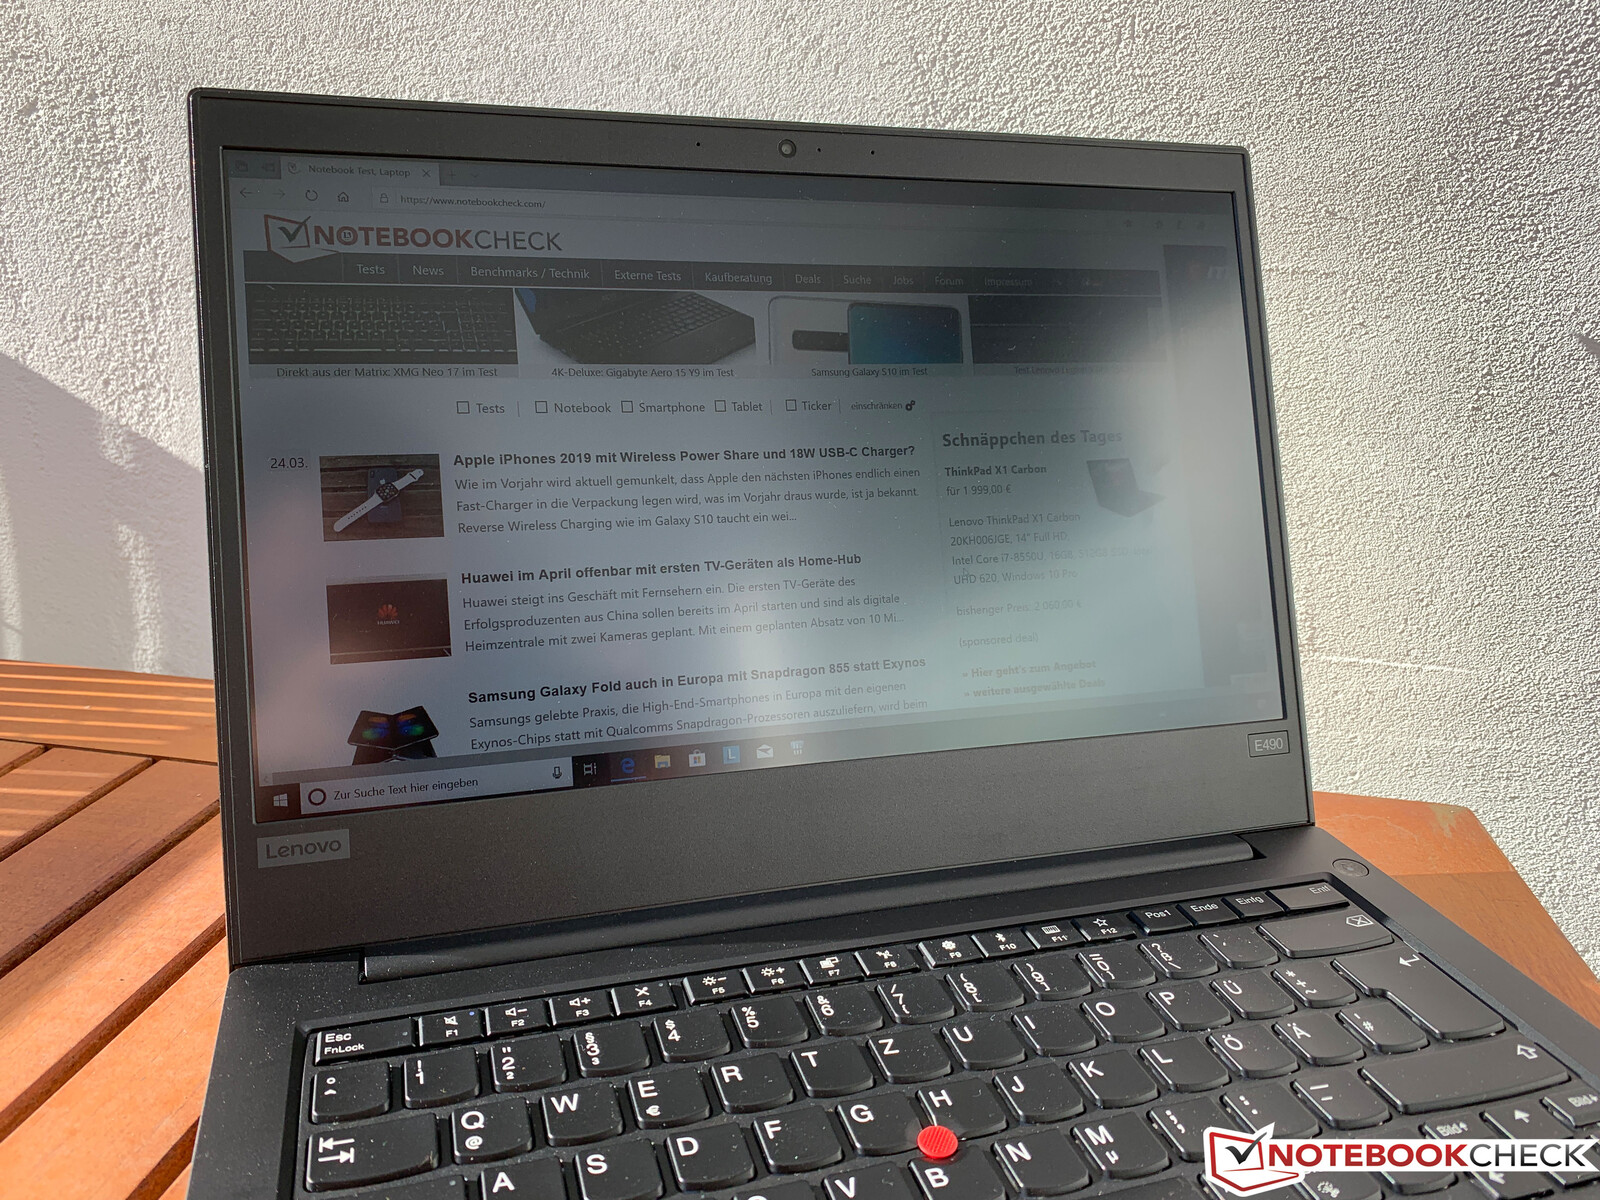
The viewing-angle stability of the IPS screen is good, but a brighter panel would be better outdoors, despite the matte display surface.

Performance
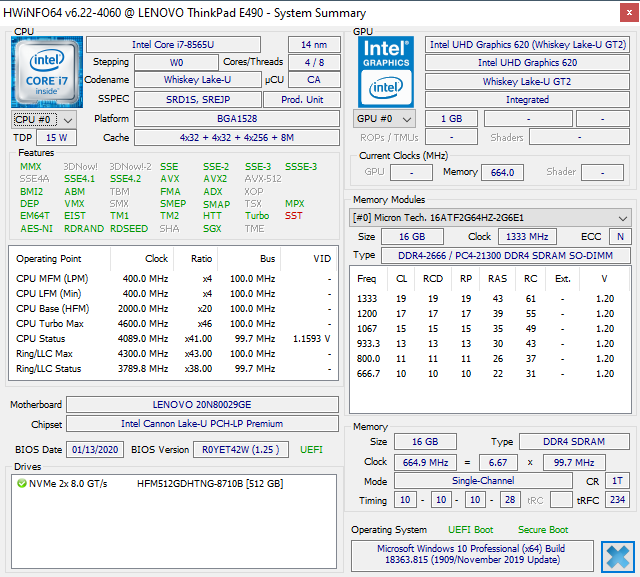
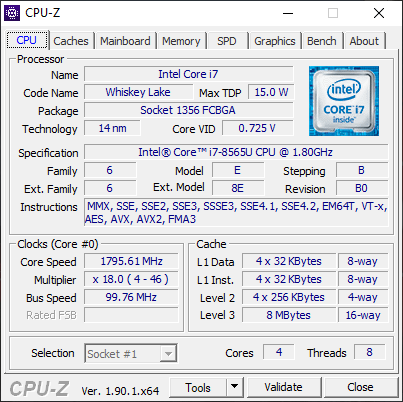
Processor – E490 with Core i7
The Core i7-8565U in the ThinkPad E490 performs very well. The TDP is rated at 25 Watts, but this level cannot be maintained for sustained workloads. During our Cinebench loop, the performance drops slightly. All in all, the E490 is still clearly ahead of the new ThinkPad E14 with the Core i5-10210U, while the ThinkPad E495 with the AMD Ryzen CPU is ahead and offers stable performance. The CPU performance is not reduced on battery power.
Cinebench R15: CPU Single 64Bit | CPU Multi 64Bit
Blender: v2.79 BMW27 CPU
7-Zip 18.03: 7z b 4 -mmt1 | 7z b 4
Geekbench 5.5: Single-Core | Multi-Core
HWBOT x265 Benchmark v2.2: 4k Preset
R Benchmark 2.5: Overall mean
| Cinebench R20 / CPU (Single Core) | |
| Average of class Office (345 - 816, n=73, last 2 years) | |
| Lenovo ThinkPad E14 20RA001MGE | |
| Average Intel Core i7-8565U (342 - 472, n=20) | |
| Lenovo ThinkPad E490-20N90004GE | |
| Schenker VIA 14 | |
| Lenovo ThinkPad E495-20NE000JGE | |
| Cinebench R20 / CPU (Multi Core) | |
| Average of class Office (648 - 8840, n=73, last 2 years) | |
| Lenovo ThinkPad E490-20N90004GE | |
| Lenovo ThinkPad E495-20NE000JGE | |
| Average Intel Core i7-8565U (954 - 1645, n=20) | |
| Lenovo ThinkPad E14 20RA001MGE | |
| Schenker VIA 14 | |
| Cinebench R15 / CPU Single 64Bit | |
| Average of class Office (99.5 - 312, n=75, last 2 years) | |
| HP ProBook 440 G6-5TK01EA | |
| Lenovo ThinkPad E490-20N90004GE | |
| Average Intel Core i7-8565U (138.3 - 193, n=51) | |
| Lenovo ThinkPad E14 20RA001MGE | |
| Schenker VIA 14 | |
| Lenovo ThinkPad E495-20NE000JGE | |
| Cinebench R15 / CPU Multi 64Bit | |
| Average of class Office (250 - 3380, n=75, last 2 years) | |
| Schenker VIA 14 | |
| Lenovo ThinkPad E495-20NE000JGE | |
| Lenovo ThinkPad E490-20N90004GE | |
| Average Intel Core i7-8565U (452 - 815, n=52) | |
| HP ProBook 440 G6-5TK01EA | |
| Lenovo ThinkPad E14 20RA001MGE | |
| Blender / v2.79 BMW27 CPU | |
| Lenovo ThinkPad E490-20N90004GE | |
| Schenker VIA 14 | |
| Lenovo ThinkPad E14 20RA001MGE | |
| HP ProBook 440 G6-5TK01EA | |
| Average Intel Core i7-8565U (687 - 1175, n=22) | |
| Lenovo ThinkPad E495-20NE000JGE | |
| Average of class Office (158 - 1940, n=74, last 2 years) | |
| 7-Zip 18.03 / 7z b 4 -mmt1 | |
| Average of class Office (3387 - 6469, n=75, last 2 years) | |
| HP ProBook 440 G6-5TK01EA | |
| Average Intel Core i7-8565U (2029 - 5923, n=23) | |
| Schenker VIA 14 | |
| Lenovo ThinkPad E14 20RA001MGE | |
| Lenovo ThinkPad E495-20NE000JGE | |
| Lenovo ThinkPad E490-20N90004GE | |
| 7-Zip 18.03 / 7z b 4 | |
| Average of class Office (7098 - 76886, n=75, last 2 years) | |
| Average Intel Core i7-8565U (10531 - 24847, n=23) | |
| HP ProBook 440 G6-5TK01EA | |
| Lenovo ThinkPad E495-20NE000JGE | |
| Lenovo ThinkPad E14 20RA001MGE | |
| Schenker VIA 14 | |
| Lenovo ThinkPad E490-20N90004GE | |
| Geekbench 5.5 / Single-Core | |
| Average of class Office (811 - 2128, n=71, last 2 years) | |
| Average Intel Core i7-8565U (1108 - 1163, n=2) | |
| Lenovo ThinkPad E490-20N90004GE | |
| Schenker VIA 14 | |
| Lenovo ThinkPad E14 20RA001MGE | |
| Geekbench 5.5 / Multi-Core | |
| Average of class Office (1483 - 16999, n=71, last 2 years) | |
| Schenker VIA 14 | |
| Lenovo ThinkPad E490-20N90004GE | |
| Lenovo ThinkPad E14 20RA001MGE | |
| Average Intel Core i7-8565U (2839 - 3308, n=2) | |
| HWBOT x265 Benchmark v2.2 / 4k Preset | |
| Average of class Office (2.21 - 26, n=74, last 2 years) | |
| Average Intel Core i7-8565U (3.24 - 5.5, n=22) | |
| HP ProBook 440 G6-5TK01EA | |
| Lenovo ThinkPad E14 20RA001MGE | |
| Lenovo ThinkPad E495-20NE000JGE | |
| Schenker VIA 14 | |
| Lenovo ThinkPad E490-20N90004GE | |
| R Benchmark 2.5 / Overall mean | |
| Average Intel Core i7-8565U (0.682 - 0.851, n=2) | |
| Lenovo ThinkPad E14 20RA001MGE | |
| Schenker VIA 14 | |
| Lenovo ThinkPad E490-20N90004GE | |
| Average of class Office (0.4098 - 0.888, n=74, last 2 years) | |
* ... smaller is better
System Performance
Thanks to the combination of quad-core processor and the fast NVMe-SSD from Toshiba (512 GB), you can enjoy a very good subjective performance impression. All inputs are quickly executed and there are basically no waiting times. The device also performs well in the synthetic benchmarks and can even benefit from the dedicated GPU. The SSD is not one of the fastest drives (only attached via PCIe-x2), but there are no limitations for everyday office tasks.
| PCMark 8 Home Score Accelerated v2 | 4704 points | |
| PCMark 8 Creative Score Accelerated v2 | 5792 points | |
| PCMark 8 Work Score Accelerated v2 | 5256 points | |
| PCMark 10 Score | 4533 points | |
Help | ||

GPU Performance – Radeon RX 550X
The Radeon RX 550X is noticeably faster than the integrated Intel UHD Graphics of the processor. The clock of the Radeon RX 550X goes up to 1176 MHz (core) and 1500 MHz (memory), respectively. The size of the video memory is 2 GB (GDDR5). The dGPU is also much faster than the AMD iGPU of the ThinkPad E495. So if you need the additional GPU performance, you are better off with the combination E490 + dGPU. However, the GPU performance is reduced by around 40% on battery power.
| 3DMark 06 Standard Score | 21483 points | |
| 3DMark Vantage P Result | 14409 points | |
| 3DMark 11 Performance | 5565 points | |
| 3DMark Cloud Gate Standard Score | 10371 points | |
| 3DMark Fire Strike Score | 3258 points | |
| 3DMark Time Spy Score | 1167 points | |
Help | ||
Gaming Performance
It is possible to play some games with the E490, but you will have to reduce the details or the resolution in modern titles. The 3DMark stress test (Fire Strike) is easily passed at 99.1%, so the performance is stable even during longer sessions.
| low | med. | high | ultra | |
|---|---|---|---|---|
| BioShock Infinite (2013) | 165.7 | 101.5 | 83.8 | 29.1 |
| The Witcher 3 (2015) | 62.3 | 39 | 20.2 | 12.5 |
| Dota 2 Reborn (2015) | 74.8 | 69.6 | 52.1 | 49.1 |
| Rise of the Tomb Raider (2016) | 65.7 | 39.8 | 20.2 | |
| Battlefield 1 (2016) | 69.1 | 52.2 | 23.8 | |
| For Honor (2017) | 75.7 | 26.5 | 25.3 | 16.3 |
| Ghost Recon Wildlands (2017) | 46.9 | 20.5 | 13.6 | |
| X-Plane 11.11 (2018) | 11 | 9.57 | 9.23 | |
| Far Cry 5 (2018) | 47 | 21 | 18 | 15 |
Emissions & Energy
System Noise
The fan is usually deactivated during light workloads. If you stress the system more, the fan will often fluctuate between 32 and 34 dB(A), which can be a bit annoying. We did not hear any other electronic sounds (like coil whine).
Noise level
| Idle |
| 29.3 / 29.3 / 29.3 dB(A) |
| HDD |
| 30.2 dB(A) |
| Load |
| 34.2 / 34.2 dB(A) |
 | ||
30 dB silent 40 dB(A) audible 50 dB(A) loud |
||
min: | ||
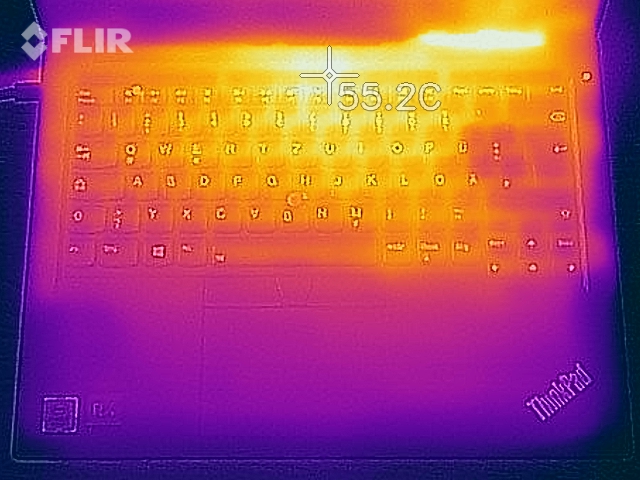
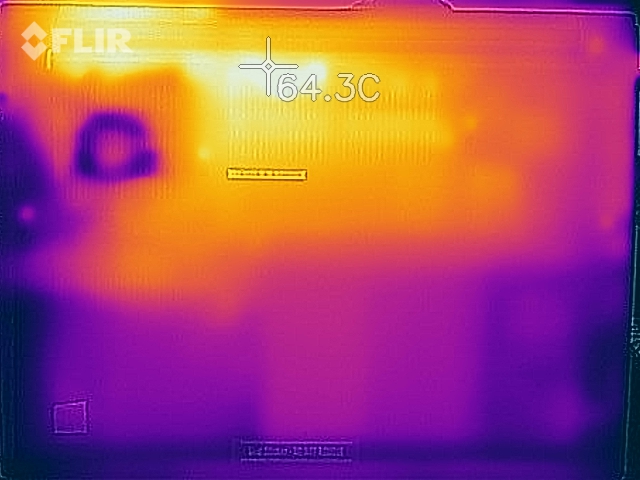
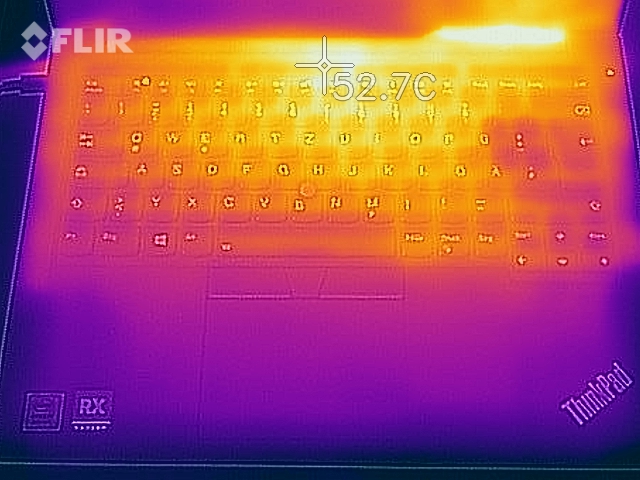
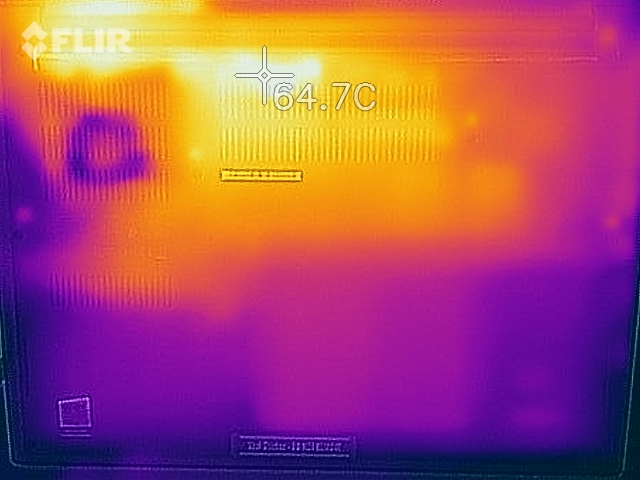
Temperature – ThinkPad gets pretty hot
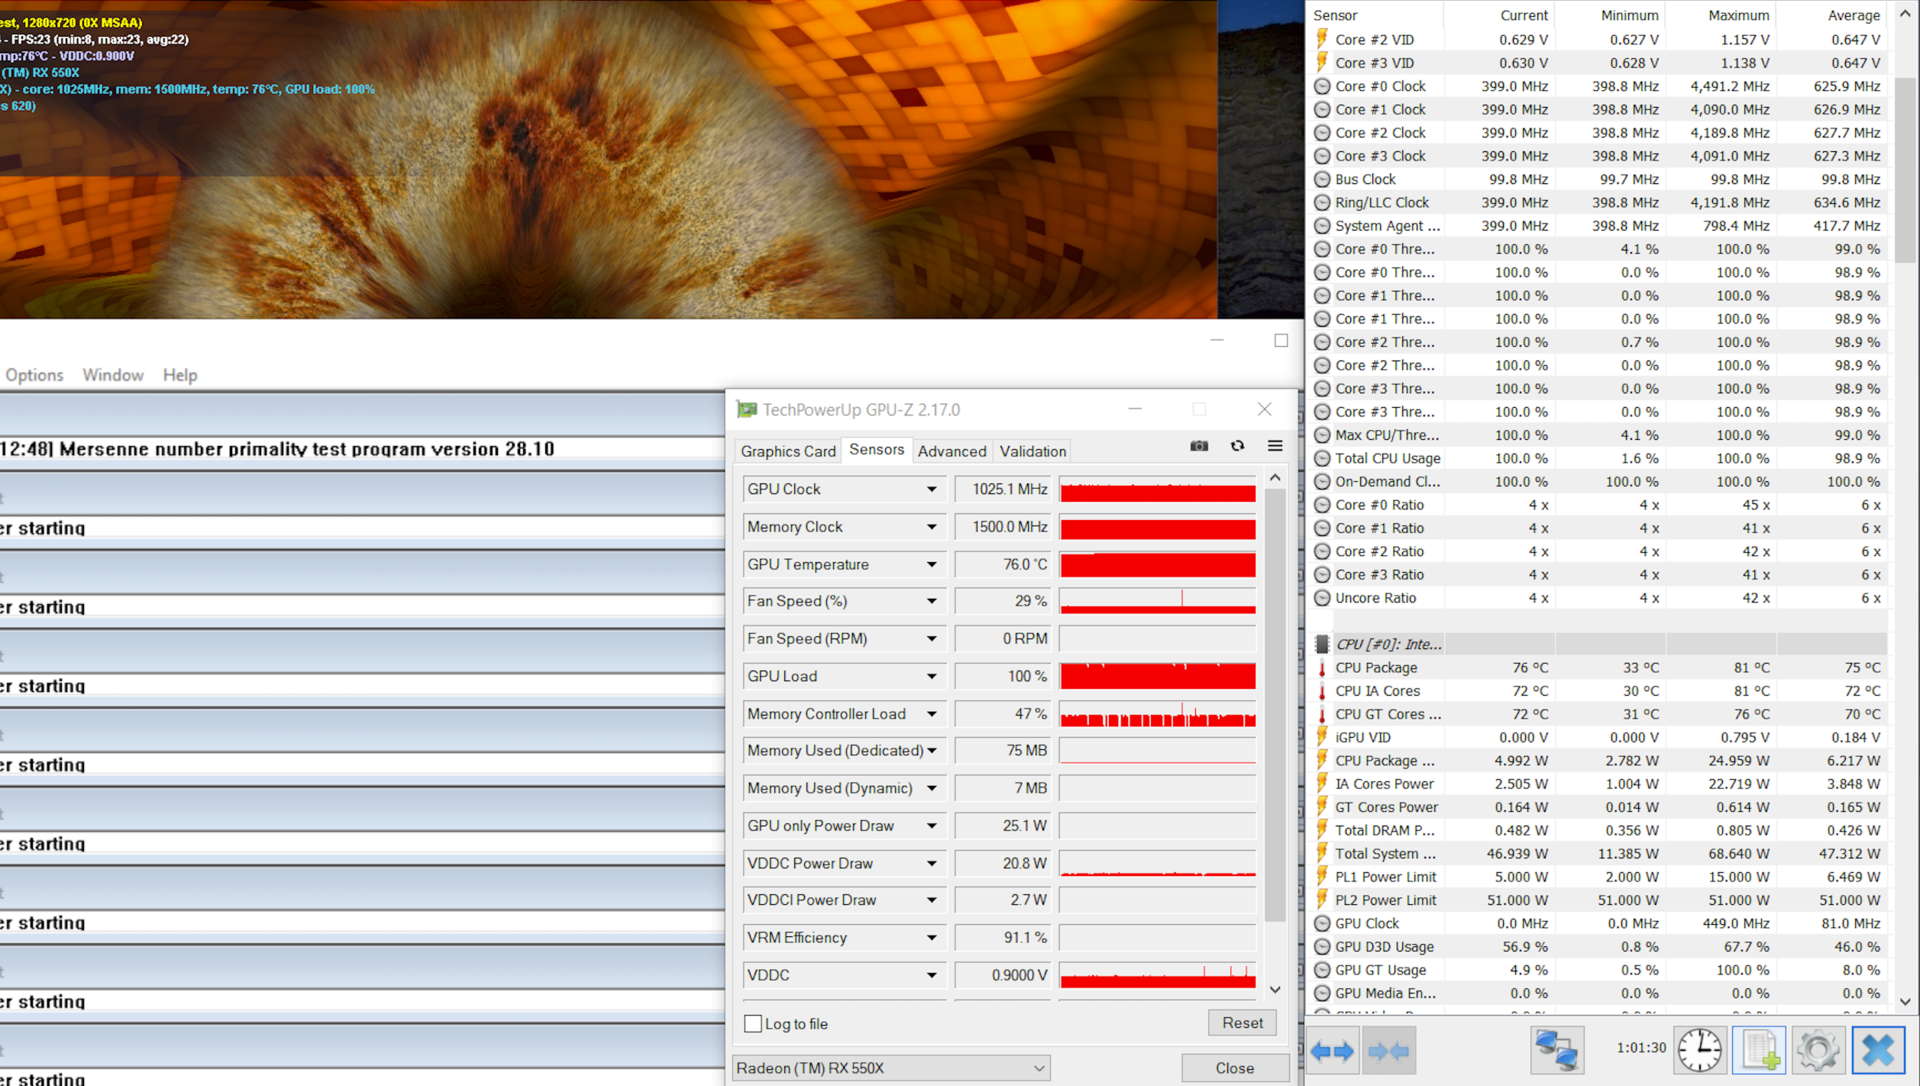
A look at the surface temperatures under load – and not just in our stress test but also in our The Witcher 3 test – clearly shows that the cooling solution cannot handle the additional heat from the dGPU. 50 °C at the top and 60 °C at the bottom of the base unit is a lot, so you should always place the device on a solid surface when under load.
The GPU is clearly prioritized during the stress test (~1100 MHz), and the processor is heavily throttled and only runs at 4x 400 MHz (5 Watts). The performance is not affected immediately after the stress test.
(-) The maximum temperature on the upper side is 53.1 °C / 128 F, compared to the average of 34.3 °C / 94 F, ranging from 21.2 to 62.5 °C for the class Office.
(-) The bottom heats up to a maximum of 63.8 °C / 147 F, compared to the average of 36.8 °C / 98 F
(+) In idle usage, the average temperature for the upper side is 24.5 °C / 76 F, compared to the device average of 29.5 °C / 85 F.
(±) Playing The Witcher 3, the average temperature for the upper side is 37.7 °C / 100 F, compared to the device average of 29.5 °C / 85 F.
(+) The palmrests and touchpad are cooler than skin temperature with a maximum of 29.4 °C / 84.9 F and are therefore cool to the touch.
(±) The average temperature of the palmrest area of similar devices was 27.5 °C / 81.5 F (-1.9 °C / -3.4 F).
Speakers
Lenovo ThinkPad E490-20N90004GE audio analysis
(-) | not very loud speakers (71.5 dB)
Bass 100 - 315 Hz
(±) | reduced bass - on average 13.5% lower than median
(-) | bass is not linear (15.7% delta to prev. frequency)
Mids 400 - 2000 Hz
(±) | higher mids - on average 6.5% higher than median
(±) | linearity of mids is average (10.2% delta to prev. frequency)
Highs 2 - 16 kHz
(+) | balanced highs - only 3.1% away from median
(±) | linearity of highs is average (12.1% delta to prev. frequency)
Overall 100 - 16.000 Hz
(±) | linearity of overall sound is average (23.4% difference to median)
Compared to same class
» 65% of all tested devices in this class were better, 8% similar, 26% worse
» The best had a delta of 7%, average was 21%, worst was 53%
Compared to all devices tested
» 70% of all tested devices were better, 6% similar, 24% worse
» The best had a delta of 4%, average was 24%, worst was 134%
HP ProBook 440 G6-5TK01EA audio analysis
(±) | speaker loudness is average but good (78.1 dB)
Bass 100 - 315 Hz
(-) | nearly no bass - on average 17.2% lower than median
(±) | linearity of bass is average (12.1% delta to prev. frequency)
Mids 400 - 2000 Hz
(+) | balanced mids - only 3.3% away from median
(+) | mids are linear (6.7% delta to prev. frequency)
Highs 2 - 16 kHz
(±) | higher highs - on average 5.7% higher than median
(±) | linearity of highs is average (7.1% delta to prev. frequency)
Overall 100 - 16.000 Hz
(±) | linearity of overall sound is average (20.8% difference to median)
Compared to same class
» 48% of all tested devices in this class were better, 9% similar, 42% worse
» The best had a delta of 7%, average was 21%, worst was 53%
Compared to all devices tested
» 56% of all tested devices were better, 8% similar, 36% worse
» The best had a delta of 4%, average was 24%, worst was 134%
Power Consumption
The idle power consumption of the E490 is a bit high, especially considering the dark display. We can see a maximum consumption of around 64W under load, but this value quickly drops to ~50 W and then 40 W over the course of the stress test. The included 65 W power adapter is therefore completely sufficient.
| Off / Standby | |
| Idle | |
| Load |
|
Key:
min: | |
Battery Runtime
Our Wi-Fi test runs for almost 7 hours on the ThinkPad E490. This is not a bad result, but all the other comparison devices still manage longer runtimes. You will drain the battery after around 100 minutes under maximum load.
Pros
Cons
Verdict – Radeon GPU is too much for the E490
The ThinkPad E490 with the dedicated AMD graphics cards offers a noticeable bump in GPU performance, so the business laptop can also handle some light gaming. However, you will have to live with high surface temperatures in return. Up to 60 °C is a lot and shows that the cooling solution is insufficient. The fan is still comparatively quiet, so it seems Lenovo accepts high temperatures in favor of a quieter device. Users should be aware of the temperatures and not put the device on the lap under load.
More GPU performance but also higher temperatures: The ThinkPad E490 is a decent choice if you want to play some games after your work is done.
Otherwise, there are the same advantages and disadvantages of the E490 and E495, respectively. The biggest highlight of the ThinkPad is definitely the excellent keyboard, but the display is a bit of a lottery due to different panel suppliers. If you do not want to play games, we recommend you look at the ThinkPad E495 or the new ThinkPad E14 with the iGPU.
Lenovo ThinkPad E490-20N90004GE
- 05/18/2020 v7 (old)
Andreas Osthoff
Price comparison
