Reviews for the Intel Core i7-8565U processor
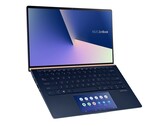
Asus ZenBook 14 UX434FL Laptop Review: ScreenPad Is Here To Stay
This Asus Ultrabook is unlike any other competing model in its size class due to its integrated secondary display. Though awesome from a conceptual standpoint, we go over some hidden drawbacks that potential owners should know about.
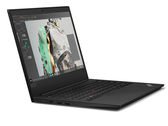
Intel Core i7-8565U, NVIDIA GeForce MX250, 14", 1.3 kgLenovo ThinkPad E490 Office Laptop in review: The Radeon GPU is too much for the cooling solution
The ThinkPad E490 is available with an optional dedicated GPU. Similar to the predecessor, however, the cooling solution struggles with the additional heat, and even multiple BIOS updates did not change that.
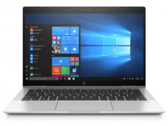
Intel Core i7-8565U, AMD Radeon RX 550X (Laptop), 14", 1.9 kgHP EliteBook x360 1030 G4 Review: Convertible with limited viewing angles
The HP EliteBook x360 G4 is based on its predecessor but offers a rather interesting touchscreen. It has a matte surface but is very difficult to read due to HP's screen protection technology. Find out what else the convertible has to offer in our review.
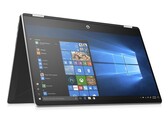
Intel Core i7-8565U, UHD Graphics 620, 13.3", 1.3 kgHP Pavilion x360 15 2019 Convertible Review: Don't Buy This Configuration
The Pavilion series is supposed to be HP's entry-level lineup of affordable laptops. This particular configuration, however, is egregiously bad because its high asking price does not reflect the low-end 768p touchscreen.
Intel Core i7-8565U, UHD Graphics 620, 15.6", 1.9 kgLenovo ThinkPad P53s laptop review: With ultrabook processor and Quadro graphics
Based on the ThinkPad T590, Lenovo presents the comparatively low-cost ThinkPad P53s workstation. The configuration and maintenance options are somewhat limited, but everything else remains solid as usual. In this review we'll clarify the details of what buyers can expect.
Intel Core i7-8565U, NVIDIA Quadro P520, 15.6", 1.9 kgLenovo ThinkPad P43s-20RH001FGE: NVIDIA Quadro P520, 14.00", 1.5 kg
Review » Lenovo ThinkPad P43s laptop review: The mobile workstation's display and performance disappoint
HP ZBook 15u G6 6TP54EA: AMD Radeon Pro WX 3200, 15.60", 1.6 kg
Review » HP ZBook 15u G6 Laptop Review: High-contrast 4K screen shortens battery life
HP EliteBook x360 830 G6: Intel UHD Graphics 620, 13.30", 1.5 kg
Review » HP EliteBook x360 830 G6 Laptop Review: HP Convertible impresses in almost every way
HP ZBook 14u G6 6TP71EA: AMD Radeon Pro WX 3200, 14.00", 1.5 kg
Review » HP ZBook 14u G6 laptop review: The mobile workstation has problems with performance
Lenovo IdeaPad S540-15IWL 81SW0015GE: NVIDIA GeForce GTX 1650 Max-Q, 15.60", 1.9 kg
Review » Lenovo IdeaPad S540-15IWL Review: A great all-rounder with only one real weakness
Asus ZenBook 15 UX534FT-DB77: NVIDIA GeForce GTX 1650 Max-Q, 15.60", 1.7 kg
Review » Asus ZenBook 15 UX534F Laptop Review: Look Like an Ultrabook, Play Like a Gamer
Lenovo ThinkPad T590-20N40009GE: NVIDIA GeForce MX250, 15.60", 1.8 kg
Review » Lenovo ThinkPad T590 laptop review: The 4K display offers excellent image quality but requires a lot of energy
HP Spectre x360 13-ap0312ng: Intel UHD Graphics 620, 13.30", 1.3 kg
Review » HP Spectre x360 13 Review: classy convertible foiled by its display
Lenovo ThinkPad X1 Carbon 2019-20QES01L00: Intel UHD Graphics 620, 14.00", 1.1 kg
Review » Lenovo ThinkPad X1 Carbon 2019 with Full HD laptop review: Brighter and longer battery life
Lenovo ThinkPad T490-20N30000GE: NVIDIA GeForce MX250, 14.00", 1.5 kg
Review » Lenovo ThinkPad T490 Review: The WQHD HDR panel convinces in the test, but makes only limited sense in an office laptop
HP Envy 13-aq0003ng: NVIDIA GeForce MX250, 13.30", 1.2 kg
Review » HP Envy 13 Review: A well-rounded subnotebook with a good number of features
Dell Inspiron 7390 2-in-1: Intel UHD Graphics 620, 13.30", 1.4 kg
Review » Dell Inspiron 7390 2-in-1 Black Edition Convertible Review
Lenovo ThinkPad X1 Yoga 2019-20QGS00A00: Intel UHD Graphics 620, 14.00", 1.3 kg
Review » Lenovo ThinkPad X1 Yoga 2019 Laptop Review: Aluminum Unibody & Great Speakers
Asus VivoBook S15 S532F: NVIDIA GeForce MX250, 15.60", 1.8 kg
Review » ScreenPad 2.0 Debut: Asus VivoBook S15 S532FL Laptop Review
MSI PS63 Modern 8SC: NVIDIA GeForce GTX 1650 Max-Q, 15.60", 1.7 kg
Review » A true all-rounder: MSI PS63 Modern 8SC Laptop in Review
Lenovo ThinkPad T590-20N4002VGE: NVIDIA GeForce MX250, 15.60", 1.9 kg
Review » Lenovo ThinkPad T590 business laptop review: Large & lightweight, but bad screen
Lenovo IdeaPad S940-14IWL: Intel UHD Graphics 620, 14.00", 1.2 kg
Review » Lenovo IdeaPad S940 Laptop Review: Slimmer, Lighter, Sleeker
Lenovo Ideapad S340-14IWL-81N70056GE: NVIDIA GeForce MX230, 14.00", 1.6 kg
Review » Lenovo IdeaPad S340 (i7-8565U, MX230) Laptop Review
Lenovo ThinkPad X390 Yoga-20NQS05R00: Intel UHD Graphics 620, 13.30", 1.3 kg
Review » Lenovo ThinkPad X390 Yoga (i7, FHD) Convertible Review
Huawei Matebook 13-53010FYW: Intel UHD Graphics 620, 13.00", 1.3 kg
Review » Huawei MateBook 13 (i7, UHD Graphics 620) Laptop Review
Acer Swift 3 SF314-55G-768V: NVIDIA GeForce MX250, 14.00", 1.5 kg
Review » Acer Swift 3 SF314 (i7-8565U, MX250) Laptop Review
Dell Inspiron 15 5000 5584: Intel UHD Graphics 620, 15.60", 1.9 kg
Review » Dell Inspiron 15 5000 5584 (i7-8565U) Laptop Review
Lenovo ThinkPad E590-20NB0012GE: AMD Radeon RX 550X (Laptop), 15.60", 1.9 kg
Review » Lenovo ThinkPad E590 (i7, RX 550X, SSD, FHD) Laptop Review
Lenovo ThinkPad T490-20N3S02L00: NVIDIA GeForce MX250, 14.00", 1.5 kg
Review » Lenovo ThinkPad T490 (i7, MX250, Low Power FHD) Laptop Review
Dell Inspiron 17 3780: AMD Radeon 520, 17.30", 2.8 kg
Review » Dell Inspiron 17 3000 3780 (i7-8565U, Radeon 520) Laptop Review
Huawei MateBook 14 KLV-W29: NVIDIA GeForce MX250, 14.00", 1.5 kg
Review » Huawei MateBook 14 (i7-8565U, GeForce MX250) Laptop Review
Asus ZenBook S13 UX392FN: NVIDIA GeForce MX150, 13.90", 1.1 kg
Review » Asus ZenBook S13 UX392FN (i7-8565U, GeForce MX150) Laptop Review
LG Gram 17Z990-R.AAS7U1: Intel UHD Graphics 620, 17.00", 1.3 kg
Review » LG Gram 17Z990 (i7-8565U. WQXGA) Laptop Review
Acer Aspire 5 A515-52G-723L: NVIDIA GeForce MX250, 15.60", 1.8 kg
Review » Acer Aspire 5 A515-52G (i7-8565U, GeForce MX250, SSD, FHD) Laptop Review
Asus Zenbook 14 UX433FN-A6023T: NVIDIA GeForce MX150, 14.00", 1.2 kg
Review » ASUS ZenBook 14 UX433FN (Core i7-8565U, MX150, SSD, FHD) Laptop Review
Lenovo ThinkPad E590-20NC0003GE: Intel UHD Graphics 620, 15.60", 1.9 kg
Review » Lenovo ThinkPad E590 (i7-8565U, UHD 620, FHD) Laptop Review
HP ProBook 450 G6-5TJ93EA: NVIDIA GeForce MX130, 15.60", 2 kg
Review » HP ProBook 450 G6 (Core i7-8565U, GeForce MX130) Laptop Review
Aorus Gaming Box RTX 2070: NVIDIA GeForce RTX 2070 (Desktop), 13.30", 2.3 kg
Review » Aorus RTX 2070 Gaming Box with Dell XPS 13 9380 Review
HP ProBook 440 G6-5TK01EA: Intel UHD Graphics 620, 14.00", 1.6 kg
Review » HP ProBook 440 G6 (i7, 512 GB, FHD) Laptop Review
Dell Inspiron 13 7380: Intel UHD Graphics 620, 13.30", 1.4 kg
Review » Dell Inspiron 13 7380 (Core i7-8565U, SSD, FHD) Laptop Review
Dell XPS 13 9380 i7 4K: Intel UHD Graphics 620, 13.30", 1.2 kg
Review » Dell XPS 13 9380 (i7-8565U, 4K UHD) Laptop Review
Acer Swift 5 SF515-51T-76B6: Intel UHD Graphics 620, 15.60", 1 kg
Review » Acer Swift 5 SF515-51T (i7-8565U, SSD, FHD) Laptop Review
Asus ZenBook 15 UX533FD: NVIDIA GeForce GTX 1050 Max-Q, 15.60", 1.6 kg
Review » Asus ZenBook 15 (i7-8565U, GTX1050 Max-Q) Laptop Review
MSI PS63 Modern 8RC: NVIDIA GeForce GTX 1050 Max-Q, 15.60", 1.7 kg
Review » MSI PS63 Modern 8RC (Core i7-8565U, GTX 1050 Max-Q) Laptop Review
Dell Inspiron 17-7786: NVIDIA GeForce MX150, 17.30", 2.8 kg
Review » Dell Inspiron 17-7786 (i7-8565U, 16 GB, 17-inch Touch, MX 150) Convertible Review
Tuxedo InfinityBook Pro 14: Intel UHD Graphics 620, 14.00", 1.4 kg
Review » Tuxedo InfinityBook Pro 14 (i7-8565U, SSD, FHD) Laptop Review
Huawei MateBook 13 i7: NVIDIA GeForce MX150, 13.00", 1.3 kg
Review » Huawei MateBook 13 (i7-8565U, GeForce MX150) Laptop Review
Dell Inspiron 13 7386: Intel UHD Graphics 620, 13.30", 1.5 kg
Review » Dell Inspiron 13 7386 2-in-1 Black Edition (i7-8565U, 16 GB RAM, 512 GB SSD) Convertible Review
Lenovo Yoga S730-13IWL: Intel UHD Graphics 620, 13.30", 1.1 kg
Review » Lenovo Yoga S730-13IWL (FHD, Core i7-8565U) Laptop Review
Razer Blade Stealth i7-8565U: NVIDIA GeForce MX150, 13.30", 1.3 kg
Review » Razer Blade Stealth (i7-8565U, GeForce MX150) Laptop Review
Dell Inspiron 14 5000 5482 2-in-1: Intel UHD Graphics 620, 14.00", 1.8 kg
Review » Dell Inspiron 14 5000 5482 2-in-1 (i7-8565U) Convertible Review
Dell Inspiron 15 7000 2-in-1 Black Edition: NVIDIA GeForce MX150, 15.60", 2.1 kg
Review » Dell Inspiron 15 7000 2-in-1 Black Edition (i7-8565U, MX150) Convertible Review
Asus ZenBook 14 UX433FA: Intel UHD Graphics 620, 14.00", 1.2 kg
Review » Asus ZenBook 14 UX433F (i7-8565U) Laptop Review
HP Spectre x360 13-ap0312ng: Intel UHD Graphics 620, 13.30", 1.3 kg
External Review » HP Spectre x360 13-ap0312ng
Lenovo Yoga S730-81J00060EN: Intel UHD Graphics 620, 13.30", 1.1 kg
External Review » Lenovo Yoga S730-81J00060EN
Lenovo ThinkPad X1 Yoga 2019-20QF00AEMH: Intel UHD Graphics 620, 14.00", 1.4 kg
External Review » Lenovo ThinkPad X1 Yoga 2019-20QF00AEMH
Huawei MateBook 14 KLV-W29: NVIDIA GeForce MX250, 14.00", 1.5 kg
External Review » Huawei MateBook 14 KLV-W29
Lenovo IdeaPad S540-15IWL-81SW002AGE: NVIDIA GeForce GTX 1650 Mobile, 15.60", 1.8 kg
External Review » Lenovo IdeaPad S540-15IWL-81SW002AGE
HP Pavilion 15-cs1006ur: NVIDIA GeForce GTX 1050 Ti Mobile, 15.60", 1.9 kg
External Review » HP Pavilion 15-cs1006ur
MSI PS42 Modern 8RA-280XES: NVIDIA GeForce MX250, 14.00", 1.2 kg
External Review » MSI PS42 Modern 8RA-280XES
Lenovo Yoga S940-14IWL-81Q7003WGE: Intel UHD Graphics 620, 14.00", 1.2 kg
External Review » Lenovo Yoga S940-14IWL-81Q7003WGE
Lenovo Yoga 730-15IWL-81JS007VMH: NVIDIA GeForce GTX 1050 Mobile, 15.60", 1.9 kg
External Review » Lenovo Yoga 730-15IWL-81JS007VMH
HP Spectre x360 13-ap0017nl: Intel UHD Graphics 620, 13.30", 1.3 kg
External Review » HP Spectre x360 13-ap0017nl
HP Envy 13-aq0044nr: Intel UHD Graphics 620, 13.30", 1.2 kg
External Review » HP Envy 13-aq0044nr
HP Envy 13-aq0004np: Intel UHD Graphics 620, 13.30", 1.2 kg
External Review » HP Envy 13-aq0004np
Lenovo ThinkPad X1 Carbon 2019-20QES01L00: Intel UHD Graphics 620, 14.00", 1.1 kg
External Review » Lenovo ThinkPad X1 Carbon 2019-20QES01L00
Asus ZenBook Flip 13 UX362FA-EL206T: Intel UHD Graphics 620, 13.30", 1.3 kg
External Review » Asus ZenBook Flip 13 UX362FA-EL206T
Asus VivoBook S15 S530FA-EJ335T: Intel UHD Graphics 620, 15.60", 1.8 kg
External Review » Asus VivoBook S15 S530FA-EJ335T
Asus R521FA-EJ545: Intel UHD Graphics 620, 15.60", 1.8 kg
External Review » Asus R521FA-EJ545
Asus ZenBook 13 UX333FA-A3283: Intel UHD Graphics 620, 13.30", 1.1 kg
External Review » Asus ZenBook 13 UX333FA-A3283
Lenovo ThinkPad X1 Carbon G7-20QD00L1MH: Intel UHD Graphics 620, 14.00", 1.1 kg
External Review » Lenovo ThinkPad X1 Carbon G7-20QD00L1MH
Lenovo Ideapad S540-15IWL-81NE0040GE: NVIDIA GeForce MX250, 15.60", 2 kg
External Review » Lenovo Ideapad S540-15IWL-81NE0040GE
HP Pavilion x360 14-dh0007ns: Intel UHD Graphics 620, 14.00", 1.6 kg
External Review » HP Pavilion x360 14-dh0007ns
HP 15-dw0020ns: Intel UHD Graphics 620, 15.60", 1.8 kg
External Review » HP 15-dw0020ns
Asus ZenBook 15 UX533FD-A8107T: NVIDIA GeForce GTX 1050 Mobile, 15.60", 1.7 kg
External Review » Asus ZenBook 15 UX533FD-A8107T
HP 15-da1017ns: NVIDIA GeForce MX130, 15.60", 1.8 kg
External Review » HP 15-da1017ns
HP 15-dw0019ns: Intel UHD Graphics 620, 15.60", 1.8 kg
External Review » HP 15-dw0019ns
Medion Akoya S6445-MD61354: Intel UHD Graphics 620, 15.60", 1.8 kg
External Review » Medion Akoya S6445-MD61354
Asus ZenBook 13 UX334FL-A4137T: NVIDIA GeForce MX250, 13.30", 1.2 kg
External Review » Asus ZenBook 13 UX334FL-A4137T
Asus ZenBook 15 UX534FT-DB77: NVIDIA GeForce GTX 1650 Max-Q, 15.60", 1.7 kg
External Review » Asus ZenBook 15 UX534FT-DB77
Acer TravelMate P6 TMP614-51TG-792V: NVIDIA GeForce MX250, 14.00", 1.2 kg
External Review » Acer TravelMate P6 TMP614-51TG-792V
Acer TravelMate X5 TMX514-51-7411: Intel UHD Graphics 620, 14.00", 1 kg
External Review » Acer TravelMate X5 TMX514-51-7411
HP 15-DA1071NS: Intel UHD Graphics 620, 15.60", 1.8 kg
External Review » HP 15-DA1071NS
Asus VivoBook S15 S532FA-BN024T: Intel UHD Graphics 620, 15.60", 1.8 kg
External Review » Asus VivoBook S15 S532FA-BN024T
Acer Swift 3 SF314-55G-78U1: Intel UHD Graphics 620, 14.00", 1.4 kg
External Review » Acer Swift 3 SF314-55G-78U1
Asus ZenBook 15 UX534FT-A8145T: NVIDIA GeForce GTX 1650 Max-Q, 15.60", 1.7 kg
External Review » Asus ZenBook 15 UX534FT-A8145T
HP Pavilion x360 14-dh0226ng: NVIDIA GeForce MX250, 14.00", 1.6 kg
External Review » HP Pavilion x360 14-dh0226ng
HP Elite Dragonfly-8MK81EA: Intel UHD Graphics 620, 13.30", 1 kg
External Review » HP Elite Dragonfly-8MK81EA
Lenovo ThinkPad X1 Yoga 2019-20QGS00A00: Intel UHD Graphics 620, 14.00", 1.3 kg
External Review » Lenovo ThinkPad X1 Yoga 2019-20QGS00A00
Asus ZenBook S13 UX392FA-AB021T: Intel UHD Graphics 620, 13.90", 1.1 kg
External Review » Asus ZenBook S13 UX392FA-AB021T
Lenovo ThinkBook 13s-IWL-20R90072GE: Intel UHD Graphics 620, 13.30", 1.3 kg
External Review » Lenovo ThinkBook 13s-IWL-20R90072GE
Asus ExpertBook P5440FA, i7-8565U: Intel UHD Graphics 620, 14.00", 1.2 kg
External Review » Asus ExpertBook P5440FA, i7-8565U
Asus VivoBook S15 S512FL-BQ279T: NVIDIA GeForce MX250, 15.60", 1.8 kg
External Review » Asus VivoBook S15 S512FL-BQ279T
Asus VivoBook S15 S532FL-BN010T: NVIDIA GeForce MX250, 15.60", 1.8 kg
External Review » Asus VivoBook S15 S532FL-BN010T
HP EliteBook 840 G6-7KN32EA: Intel UHD Graphics 620, 14.00", 1.5 kg
External Review » HP EliteBook 840 G6-7KN32EA
Asus ZenBook Flip 13 UX362FA-EL232T: Intel UHD Graphics 620, 13.30", 1.3 kg
External Review » Asus ZenBook Flip 13 UX362FA-EL232T
Lenovo Ideapad L340-15IWL-81LG005GGE: NVIDIA GeForce MX230, 15.60", 2.1 kg
External Review » Lenovo Ideapad L340-15IWL-81LG005GGE
Asus VivoBook 14 X403, i7-8565U: Intel UHD Graphics 620, 14.00", 1.3 kg
External Review » Asus VivoBook 14 X403, i7-8565U
HP ZBook 15u G6 6TP54EA: AMD Radeon Pro WX 3200, 15.60", 1.6 kg
External Review » HP ZBook 15u G6 6TP54EA
Xiaomi RedmiBook 14 2019, i7-8565U: NVIDIA GeForce MX250, 14.00", 1.5 kg
External Review » Xiaomi RedmiBook 14 2019, i7-8565U
MSI PS63 Modern 8M-071ES: Intel UHD Graphics 620, 15.60", 1.6 kg
External Review » MSI PS63 Modern 8M-071ES
Lenovo ThinkBook 14s-IWL-20RM0002US: AMD Radeon RX 540X, 14.00", 1.5 kg
External Review » Lenovo ThinkBook 14s-IWL-20RM0002US
Asus ZenBook RX533FN-A8059T: NVIDIA GeForce MX150, 15.60", 1.6 kg
External Review » Asus ZenBook RX533FN-A8059T
HP Envy 13-AQ0007no: Intel UHD Graphics 620, 13.30", 1.2 kg
External Review » HP Envy 13-AQ0007no
HP Pavilion x360 14-dh0006ns: Intel UHD Graphics 620, 14.00", 1.6 kg
External Review » HP Pavilion x360 14-dh0006ns
Lenovo Yoga S940-14IWL-496: Intel UHD Graphics 620, 14.00", 1.2 kg
External Review » Lenovo Yoga S940-14IWL-496
Acer Spin 3 SP314-53N-77AJ: Intel UHD Graphics 620, 14.00", 1.7 kg
External Review » Acer Spin 3 SP314-53N-77AJ
Lenovo ThinkPad X1 Yoga G4-20QF0024GE: Intel UHD Graphics 620, 14.00", 1.4 kg
External Review » Lenovo ThinkPad X1 Yoga G4-20QF0024GE
HP Envy 13-aq0002ng: Intel UHD Graphics 620, 13.30", 1.2 kg
External Review » HP Envy 13-aq0002ng
HP Envy 13-aq0004ns: Intel UHD Graphics 620, 13.30", 1.2 kg
External Review » HP Envy 13-aq0004ns
Acer Swift 3 SF314-56G-79D1: NVIDIA GeForce MX250, 14.00", 1.6 kg
External Review » Acer Swift 3 SF314-56G-79D1
Asus ZenBook 14 UX431FL-AN012T: NVIDIA GeForce MX250, 14.00", 1.5 kg
External Review » Asus ZenBook 14 UX431FL-AN012T
Acer TravelMate P6 TMP614-51T-737H: Intel UHD Graphics 620, 14.00", 1.2 kg
External Review » Acer TravelMate P6 TMP614-51T-737H
Dell Inspiron 15 7590 2-in-1: NVIDIA GeForce MX250, 15.60", 2 kg
External Review » Dell Inspiron 15 7590 2-in-1
Dell Precision 3540-98XY8: AMD Radeon Pro WX 2100, 15.60", 1.8 kg
External Review » Dell Precision 3540-98XY8
Dell Inspiron 7390 2-in-1: Intel UHD Graphics 620, 13.30", 1.4 kg
External Review » Dell Inspiron 7390 2-in-1
Asus VivoBook S15 S532F: NVIDIA GeForce MX250, 15.60", 1.8 kg
External Review » Asus VivoBook S15 S532F
VAIO SX12-VJS121X0211A: Intel UHD Graphics 620, 12.50", 0.9 kg
External Review » VAIO SX12-VJS121X0211A
HP Envy 13-aq0003ng: NVIDIA GeForce MX250, 13.30", 1.2 kg
External Review » HP Envy 13-aq0003ng
Lenovo ThinkPad T590-20N4000DPB: Intel UHD Graphics 620, 15.60", 1.8 kg
External Review » Lenovo ThinkPad T590-20N4000DPB
Dell Inspiron 13 7386-3MVN4: Intel UHD Graphics 620, 13.30", 1.5 kg
External Review » Dell Inspiron 13 7386-3MVN4
HP Spectre x360 13-ap0018nf: Intel UHD Graphics 620, 13.30", 1.4 kg
External Review » HP Spectre x360 13-ap0018nf
Asus ZenBook Pro 14 UX480FD-BE010T: NVIDIA GeForce GTX 1050 Mobile, 14.00", 1.6 kg
External Review » Asus ZenBook Pro 14 UX480FD-BE010T
MSI PS42 Modern 8MO-023ES: Intel UHD Graphics 620, 14.00", 1.2 kg
External Review » MSI PS42 Modern 8MO-023ES
MSI PS63 Modern 8SC-054ES: NVIDIA GeForce GTX 1650 Mobile, 15.60", 1.6 kg
External Review » MSI PS63 Modern 8SC-054ES
Dell Vostro 15 3580: Intel UHD Graphics 620, 15.60", 2.2 kg
External Review » Dell Vostro 15 3580
Asus VivoBook 15 X512FL-EJ205T: NVIDIA GeForce MX250, 15.60", 1.8 kg
External Review » Asus VivoBook 15 X512FL-EJ205T
HP Spectre x360 13-ap0101tu: Intel UHD Graphics 620, 13.30", 1.3 kg
External Review » HP Spectre x360 13-ap0101tu
Acer Aspire 5 A515-54G-7895: NVIDIA GeForce MX250, 15.60", 1.8 kg
External Review » Acer Aspire 5 A515-54G-7895
Asus ZenBook 14 UX433FN-A6096T: NVIDIA GeForce MX150, 14.00", 1.3 kg
External Review » Asus ZenBook 14 UX433FN-A6096T
Lenovo ThinkPad T490s-20NX000EMC: Intel UHD Graphics 620, 14.00", 1.4 kg
External Review » Lenovo ThinkPad T490s-20NX000EMC
Lenovo IdeaPad S940-14IWL: Intel UHD Graphics 620, 14.00", 1.2 kg
External Review » Lenovo IdeaPad S940-14IWL
Asus VivoBook S14 F403FA-EB114T: Intel UHD Graphics 620, 14.00", 1.3 kg
External Review » Asus VivoBook S14 F403FA-EB114T
Lenovo ThinkPad X390-20Q0003VGE: Intel UHD Graphics 620, 13.30", 1.3 kg
External Review » Lenovo ThinkPad X390-20Q0003VGE
Asus ZenBook 14 UX434FL, i7-8565U: NVIDIA GeForce MX250, 14.00", 1.3 kg
External Review » Asus ZenBook 14 UX434FL, i7-8565U
Lenovo ThinkPad T490-20N2004AGE: Intel UHD Graphics 620, 14.00", 1.5 kg
External Review » Lenovo ThinkPad T490-20N2004AGE
Lenovo ThinkPad T490-20N20049GE: Intel UHD Graphics 620, 14.00", 1.5 kg
External Review » Lenovo ThinkPad T490-20N20049GE
HP Envy x360 15m-dr0012dx: Intel UHD Graphics 620, 15.60", 2.1 kg
External Review » HP Envy x360 15m-dr0012dx
Acer Aspire 5 A515-52G-78V3: NVIDIA GeForce MX130, 15.60", 1.9 kg
External Review » Acer Aspire 5 A515-52G-78V3
MSI PS63 8RC-031NL: NVIDIA GeForce GTX 1050 Max-Q, 15.60", 1.6 kg
External Review » MSI PS63 8RC-031NL
Asus ZenBook Edition 30 UX334FL, i7-8565U: NVIDIA GeForce MX250, 13.30", 1.3 kg
External Review » Asus ZenBook Edition 30 UX334FL, i7-8565U
Asus VivoBook S14 S431FL, i7-8565U: NVIDIA GeForce MX250, 14.00", 1.4 kg
External Review » Asus VivoBook S14 S431FL, i7-8565U
Asus VivoBook S15 S531FL, i7-8565U: NVIDIA GeForce MX250, 15.60", 1.8 kg
External Review » Asus VivoBook S15 S531FA, i7-8565U
Dell Inspiron 15 3580, i7-8565U: AMD Radeon 520, 15.60", 2.3 kg
External Review » Dell Inspiron 15-3580, i7-8565U
Asus ZenBook 15 UX534FT, i7-8565U: NVIDIA GeForce GTX 1650 Max-Q, 15.60", 1.7 kg
External Review » Asus ZenBook 15 UX534FT, i7-8565U
HP Envy 13-aq0005ng: NVIDIA GeForce MX250, 13.30", 1.2 kg
External Review » HP Envy 13-aq0005ng
Lenovo ThinkPad X390 Yoga-20NQS05R00: Intel UHD Graphics 620, 13.30", 1.3 kg
External Review » Lenovo ThinkPad X390 Yoga-20NQS05R00
LG Gram 17Z990-R.AAS7U1: Intel UHD Graphics 620, 17.00", 1.3 kg
External Review » LG Gram 17Z990-R.AAS7U1
Medion Akoya S6445-30025466: Intel UHD Graphics 620, 15.60", 1.8 kg
External Review » Medion Akoya S6445-30025466
Asus ZenBook S13 UX392FN-AB006T: NVIDIA GeForce MX150, 13.90", 1.1 kg
External Review » Asus ZenBook S13 UX392FN-AB006T
Acer Aspire 5 A515-52-78YZ: Intel UHD Graphics 620, 15.60", 1.8 kg
External Review » Acer Aspire 5 A515-52-78YZ
MSI PS63 8SC-003NL: NVIDIA GeForce GTX 1650 Max-Q, 15.60", 1.6 kg
External Review » MSI PS63 8SC-003NL
Acer TravelMate X5 TMX514-51T-703H: Intel UHD Graphics 620, 14.00", 1 kg
External Review » Acer TravelMate X5 TMX514-51T-703H
Asus Pro B9440FA-GV0004R: Intel UHD Graphics 620, 14.00", 1.1 kg
External Review » Asus Pro B9440FA-GV0004R
MSI PS63 Modern 8RC-013ES: NVIDIA GeForce GTX 1050 Mobile, 15.60", 1.6 kg
External Review » MSI PS63 Modern 8RC-013ES
Asus ZenBook S13 UX392FN-AB006R: NVIDIA GeForce MX150, 13.90", 1.1 kg
External Review » Asus ZenBook S13 UX392FN-AB006R
Lenovo ThinkPad E590-20NB0012GE: AMD Radeon RX 550X (Laptop), 15.60", 1.9 kg
External Review » Lenovo ThinkPad E590-20NB0012GE
Trekstor Vaio SX14-VJS141C11L: Intel UHD Graphics 620, 14.00", 1 kg
External Review » Trekstor Vaio SX14-VJS141C11L
Acer Swift 3 SF314-55G-71NF: NVIDIA GeForce MX130, 14.00", 1.4 kg
External Review » Acer Swift 3 SF314-55G-71NF
Huawei MateBook X Pro 2019, i7-8565U: NVIDIA GeForce MX250, 13.90", 1.3 kg
External Review » Huawei MateBook X Pro 2019, i7-8565U
Acer Swift 5 SF515-51T-75A1: Intel UHD Graphics 620, 15.60", 1 kg
External Review » Acer Swift 5 SF515-51T-75A1
Acer Swift 3 SF314-56G-78GZ: NVIDIA GeForce MX150, 14.00", 1.6 kg
External Review » Acer Swift 3 SF314-56G-78GZ
HP Pavilion x360 15-cr0004tx: AMD Radeon 530, 15.60", 2 kg
External Review » HP Pavilion x360 15-cr0004tx
HP Spectre x360 15-df0000: NVIDIA GeForce MX150, 15.60", 2.2 kg
External Review » HP Spectre x360 15-df0000
Asus Zenbook 15 UX533FD-90NB0JX3-M01280: NVIDIA GeForce GTX 1050 Ti Max-Q, 15.60", 1.7 kg
External Review » Asus Zenbook 15 UX533FD-90NB0JX3-M01280
Huawei MateBook 14-KLV-W29B: NVIDIA GeForce MX250, 14.00", 1.5 kg
External Review » Huawei MateBook 14-KLV-W29B
Acer Aspire 5 A515-52G-73ML: NVIDIA GeForce MX130, 15.60", 1.8 kg
External Review » Acer Aspire 5 A515-52G-73ML
Acer Swift 5 SF515-51T-73HQ: Intel UHD Graphics 620, 15.60", 1 kg
External Review » Acer Swift 5 SF515-51T-73HQ
MSI PS63 Modern 8M-080CZ: Intel UHD Graphics 620, 15.60", 1.6 kg
External Review » MSI PS63 Modern 8M-080CZ
Asus ZenBook 13 UX333FA-A3076T: Intel UHD Graphics 620, 13.30", 1.1 kg
External Review » Asus ZenBook 13 UX333FA-A3076T
HP Pavilion x360 14-cd1042tx: Intel UHD Graphics 620, 14.00", 1.6 kg
External Review » HP Pavilion x360 14-cd1042tx
Lenovo Ideapad S340-14IWL-81N70056GE: NVIDIA GeForce MX230, 14.00", 1.6 kg
External Review » Lenovo Ideapad S340-14IWL-81N70056GE
Acer Swift 5 SF514-53T-75UE: Intel UHD Graphics 620, 14.00", 1 kg
External Review » Acer Swift 5 SF514-53T-75UE
MSI PS63 Modern 8RC-009GB: NVIDIA GeForce GTX 1050 Max-Q, 15.60", 1.6 kg
External Review » MSI PS63 Modern 8RC-009GB
Asus ZenBook 15 UX533FD: NVIDIA GeForce GTX 1050 Max-Q, 15.60", 1.6 kg
External Review » Asus ZenBook 15 UX533FD
HP Spectre x360 13-ap0003ns: Intel UHD Graphics 620, 13.30", 1.3 kg
External Review » HP Spectre x360 13-ap0003ns
HP 15-da1016ns: NVIDIA GeForce MX130, 15.60", 1.8 kg
External Review » HP 15-da1016ns
Huawei Matebook 13-53010FYW: Intel UHD Graphics 620, 13.00", 1.3 kg
External Review » Huawei Matebook 13-53010FYW
MSI PS63 Modern-091: NVIDIA GeForce GTX 1050 Ti Mobile, 15.60", 1.7 kg
External Review » MSI PS63 Modern-091
HP Spectre x360 13-ap0900nz: Intel UHD Graphics 620, 13.30", 1.3 kg
External Review » HP Spectre x360 13-ap0900nz
Lenovo ThinkPad X1 Carbon G7: Intel UHD Graphics 620, 14.00", 1.1 kg
External Review » Lenovo ThinkPad X1 Carbon G7
Lenovo Yoga S940-14IWL: Intel UHD Graphics 620, 13.90", 1.2 kg
External Review » Lenovo Yoga S940-14IWL
Acer Swift 5 SF515-51T-7828: Intel UHD Graphics 620, 15.60", 1 kg
External Review » Acer Swift 5 SF515-51T-7828
Samsung Notebook 9 Pro 13 inch 2019: Intel UHD Graphics 620, 13.30", 1.3 kg
External Review » Samsung Notebook 9 Pro 13 inch 2019
LG Gram 14 14T990-U.AAS8U1, 2-in-1: Intel UHD Graphics 620, 14.00", 1.2 kg
External Review » LG Gram 14 14T990-U.AAS8U1, 2-in-1
Asus Zenbook Pro 14 UX480FD-BE624T: NVIDIA GeForce GTX 1050 Max-Q, 14.00", 1.6 kg
External Review » Asus Zenbook Pro 14 UX480FD-BE624T
Asus ZenBook S13 UX392FN: NVIDIA GeForce MX150, 13.90", 1.1 kg
External Review » Asus ZenBook S13 UX392FN
HP Pavilion 13-an0001ns: Intel UHD Graphics 620, 13.30", 1.3 kg
External Review » HP Pavilion 13-an0001ns
Dell XPS 13 9380 i7 4K: Intel UHD Graphics 620, 13.30", 1.2 kg
External Review » Dell XPS 13 9380 i7 4K
MSI PS63 Modern 8RC: NVIDIA GeForce GTX 1050 Max-Q, 15.60", 1.7 kg
External Review » MSI PS63 Modern 8RC
Huawei MateBook 13 i7: NVIDIA GeForce MX150, 13.00", 1.3 kg
External Review » Huawei MateBook 13 i7
Dell XPS 13 9380 2019 FHD: Intel UHD Graphics 620, 13.30", 1.2 kg
External Review » Dell XPS 13 9380
Lenovo Yoga S730-13-81J0000AMX: Intel UHD Graphics 620, 13.30", 1.1 kg
External Review » Lenovo Yoga S730-13-81J0000AMX
Dell Inspiron 14 5000 5482 2-in-1: Intel UHD Graphics 620, 14.00", 1.8 kg
External Review » Dell Inspiron 14 5000 5482 2-in-1
Asus ZenBook 14 UX433FN-A5104T: NVIDIA GeForce MX150, 14.00", 1.1 kg
External Review » Asus ZenBook 14 UX433FN-A5104T
Dell Inspiron 15 7586-2379: NVIDIA GeForce MX150, 15.60", 2 kg
External Review » Dell Inspiron 15 7586-2379
HP Spectre x360 13-ap0001ns: Intel UHD Graphics 620, 13.30", 1.4 kg
External Review » HP Spectre x360 13-ap0001ns
HP Pavilion 15-cs1001ns: NVIDIA GeForce GTX 1050 Mobile, 15.60", 1.9 kg
External Review » HP Pavilion 15-cs1001ns
Acer Swift 5 SF515-51T-76B6: Intel UHD Graphics 620, 15.60", 1 kg
External Review » Acer Swift 5 SF515-51T-70UX
Acer Aspire 5 A515-52G-71LD: NVIDIA GeForce MX150, 15.60", 2.2 kg
External Review » Acer Aspire 5 A515-52G-71LD
Asus ZenBook 14 UX433FA: Intel UHD Graphics 620, 14.00", 1.2 kg
External Review » Asus ZenBook 14 UX433FA
Asus ZenBook 13 UX333FN-A3064T: NVIDIA GeForce MX150, 13.30", 1.1 kg
External Review » Asus ZenBook 13 UX333FN-A3064T
Acer Swift 5 SF515-51T-73Q7: Intel UHD Graphics 620, 15.60", 1 kg
External Review » Acer Swift 5 SF515-51T-73Q7
Dell Inspiron 17 7786-PKCJ3, 2-in-1: NVIDIA GeForce MX150, 17.30", 2.9 kg
External Review » Dell Inspiron 17 7786-PKCJ3, 2-in-1
Dell Inspiron 15 7580-4CDV1: NVIDIA GeForce MX150, 15.60", 2.2 kg
External Review » Dell Inspiron 15 7580-4CDV1
Asus Zenbook 14 UX433FA-A6102T: Intel UHD Graphics 620, 14.00", 1.2 kg
External Review » Asus Zenbook 14 UX433FA-A6102T
Razer Blade Stealth i7-8565U: NVIDIA GeForce MX150, 13.30", 1.3 kg
External Review » Razer Blade Stealth i7-8565U
Huawei MateBook 13, i7: NVIDIA GeForce MX150, 13.30", 1.3 kg
External Review » Huawei MateBook 13, i7
LG Gram 17Z990-R.AAS8U1: Intel UHD Graphics 620, 17.00", 1.3 kg
External Review » LG Gram 17Z990-R.AAS8U1
Dell Inspiron 15 7000 2-in-1 Black Edition: NVIDIA GeForce MX150, 15.60", 2.1 kg
External Review » Dell Inspiron 15 7000 2-in-1 Black Edition
Dell Inspiron 14 5482-VC58K: NVIDIA GeForce MX130, 14.00", 1.8 kg
External Review » Dell Inspiron 14 5482-VC58K
Asus ZenBook 14 UX433FN: NVIDIA GeForce MX150, 14.00", 1.1 kg
External Review » Asus ZenBook 14 UX433FN
Asus ZenBook 15 UX533FD: NVIDIA GeForce GTX 1050 Max-Q, 15.60", 1.6 kg
External Review » Asus ZenBook 15 UX533FD
Asus ZenBook Pro 14 UX480FD-BE027T: NVIDIA GeForce GTX 1050 Mobile, 14.10", 1.6 kg
External Review » Asus ZenBook Pro 14 UX480FD-BE027T
Asus ZenBook Flip 13 UX362FA: Intel UHD Graphics 620, 13.30", 1.3 kg
External Review » Asus ZenBook Flip 13 UX362FA
Asus ZenBook Flip 15 UX562FD: NVIDIA GeForce GTX 1050 Max-Q, 15.60", 1.9 kg
External Review » Asus ZenBook Flip 15 UX562FD
Asus ZenBook 14 UX434FL-DB77: NVIDIA GeForce MX250, 14.00", 1.3 kg
» Asus ScreenPad 2.0 is so much better than before, but it could still use some work
Lenovo ThinkPad E490-20N90004GE: AMD Radeon RX 550X (Laptop), 14.00", 1.9 kg
» The ThinkPad E490 with the Radeon GPU is much faster, but also gets very hot
HP EliteBook x360 1030 G4 7YL44EA: Intel UHD Graphics 620, 13.30", 1.3 kg
» HP EliteBook x360 1030 G4: When security hampers productivity
HP Pavilion x360 15-dq0065cl: Intel UHD Graphics 620, 15.60", 1.9 kg
» We wasted $1000 on a HP Pavilion x360 15 so you don't have to
Lenovo ThinkPad E490-20N90004GE: AMD Radeon RX 550X (Laptop), 14.00", 1.9 kg
» Caution: Hot – ThinkPad E490 & E590 have arrived