Dell Inspiron 7390 2-in-1 Black Edition Convertible Review
Not to be confused with Dell’s high-end business-grade Latitude 7390 2-in-1, the Dell Inspiron 7390 2-in-1 (also called the “Inspiron 13 7000 2-in-1 Black Edition”) is a consumer-grade convertible positioned to compete directly with the likes of Lenovo’s Yoga convertibles and the HP Envy x360 line. It’s a direct follow-up to the Inspiron 7386 2-in-1 that we reviewed earlier this year, which disappointed us in a few crucial ways.
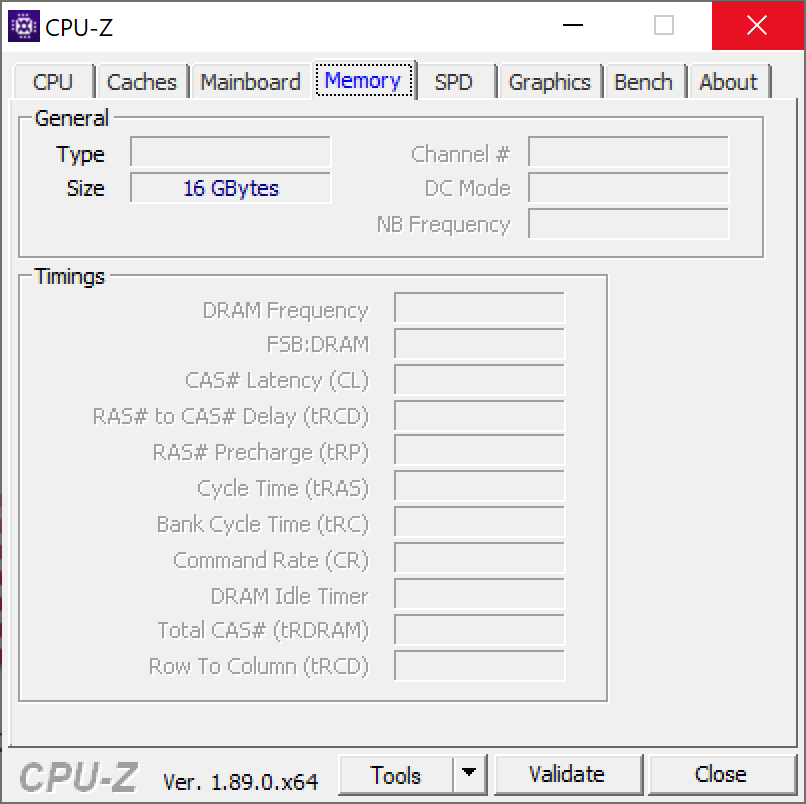
Confusing model naming schemes aside, the 7390 ($1249 currently) is very similar to its predecessor. For starters, the basic specs look the same: the device is still powered by an Intel Core i7-8565U, 16 GB LPDDR3 RAM, and a 512 GB M.2 NVMe SSD. The display remains a 13.3” glossy 4K touchscreen, and it’s still fully constructed from what appears to be the exact same aluminum.
There are a few major differences, however, starting with a completely new hinge design, some different specific components, and what appears to be a better cooling system—so hopefully we’ll discover that some of our previous complaints have been addressed. Let’s find out!
Case
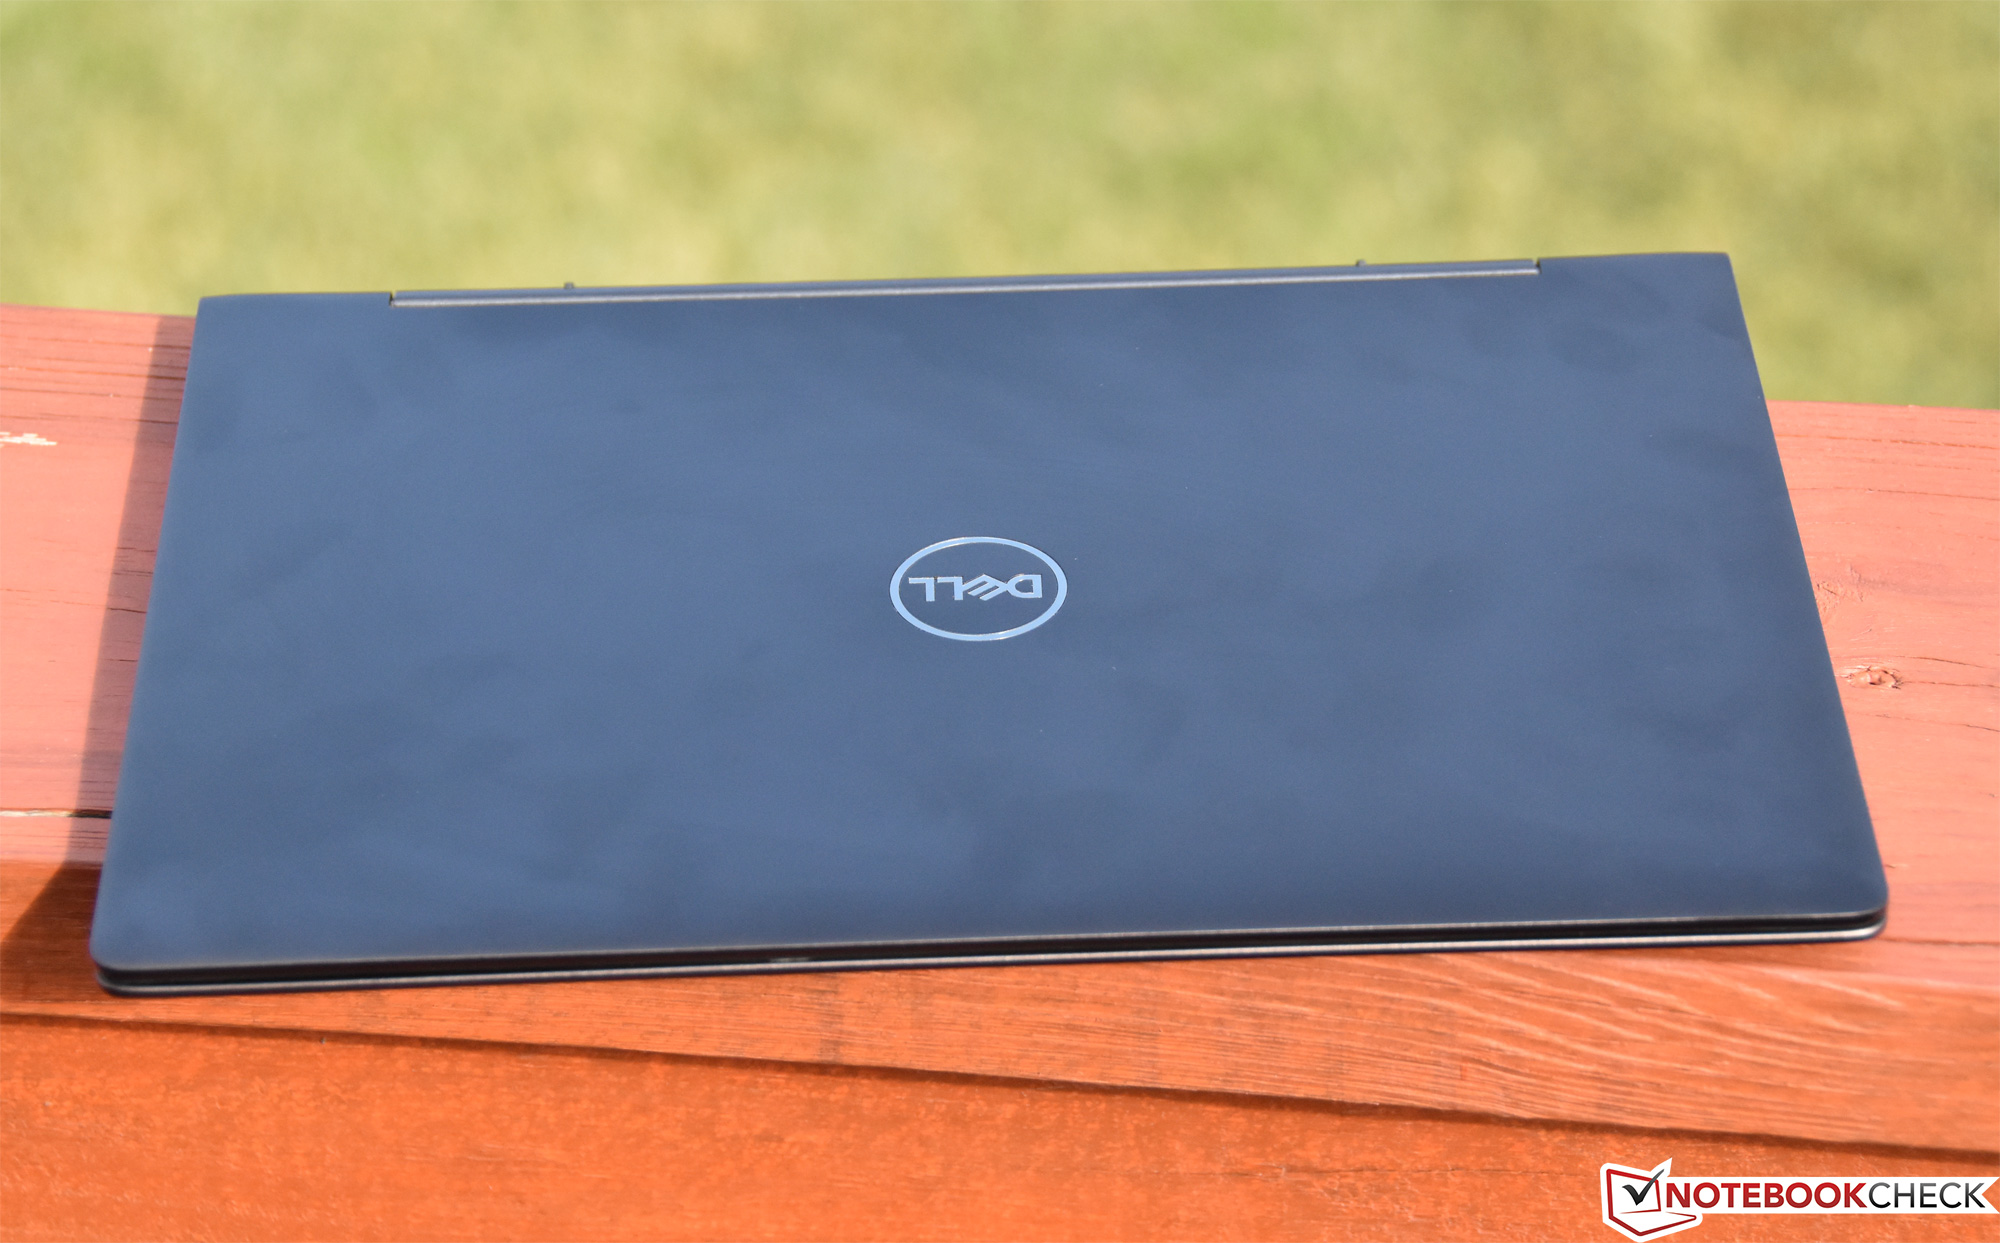
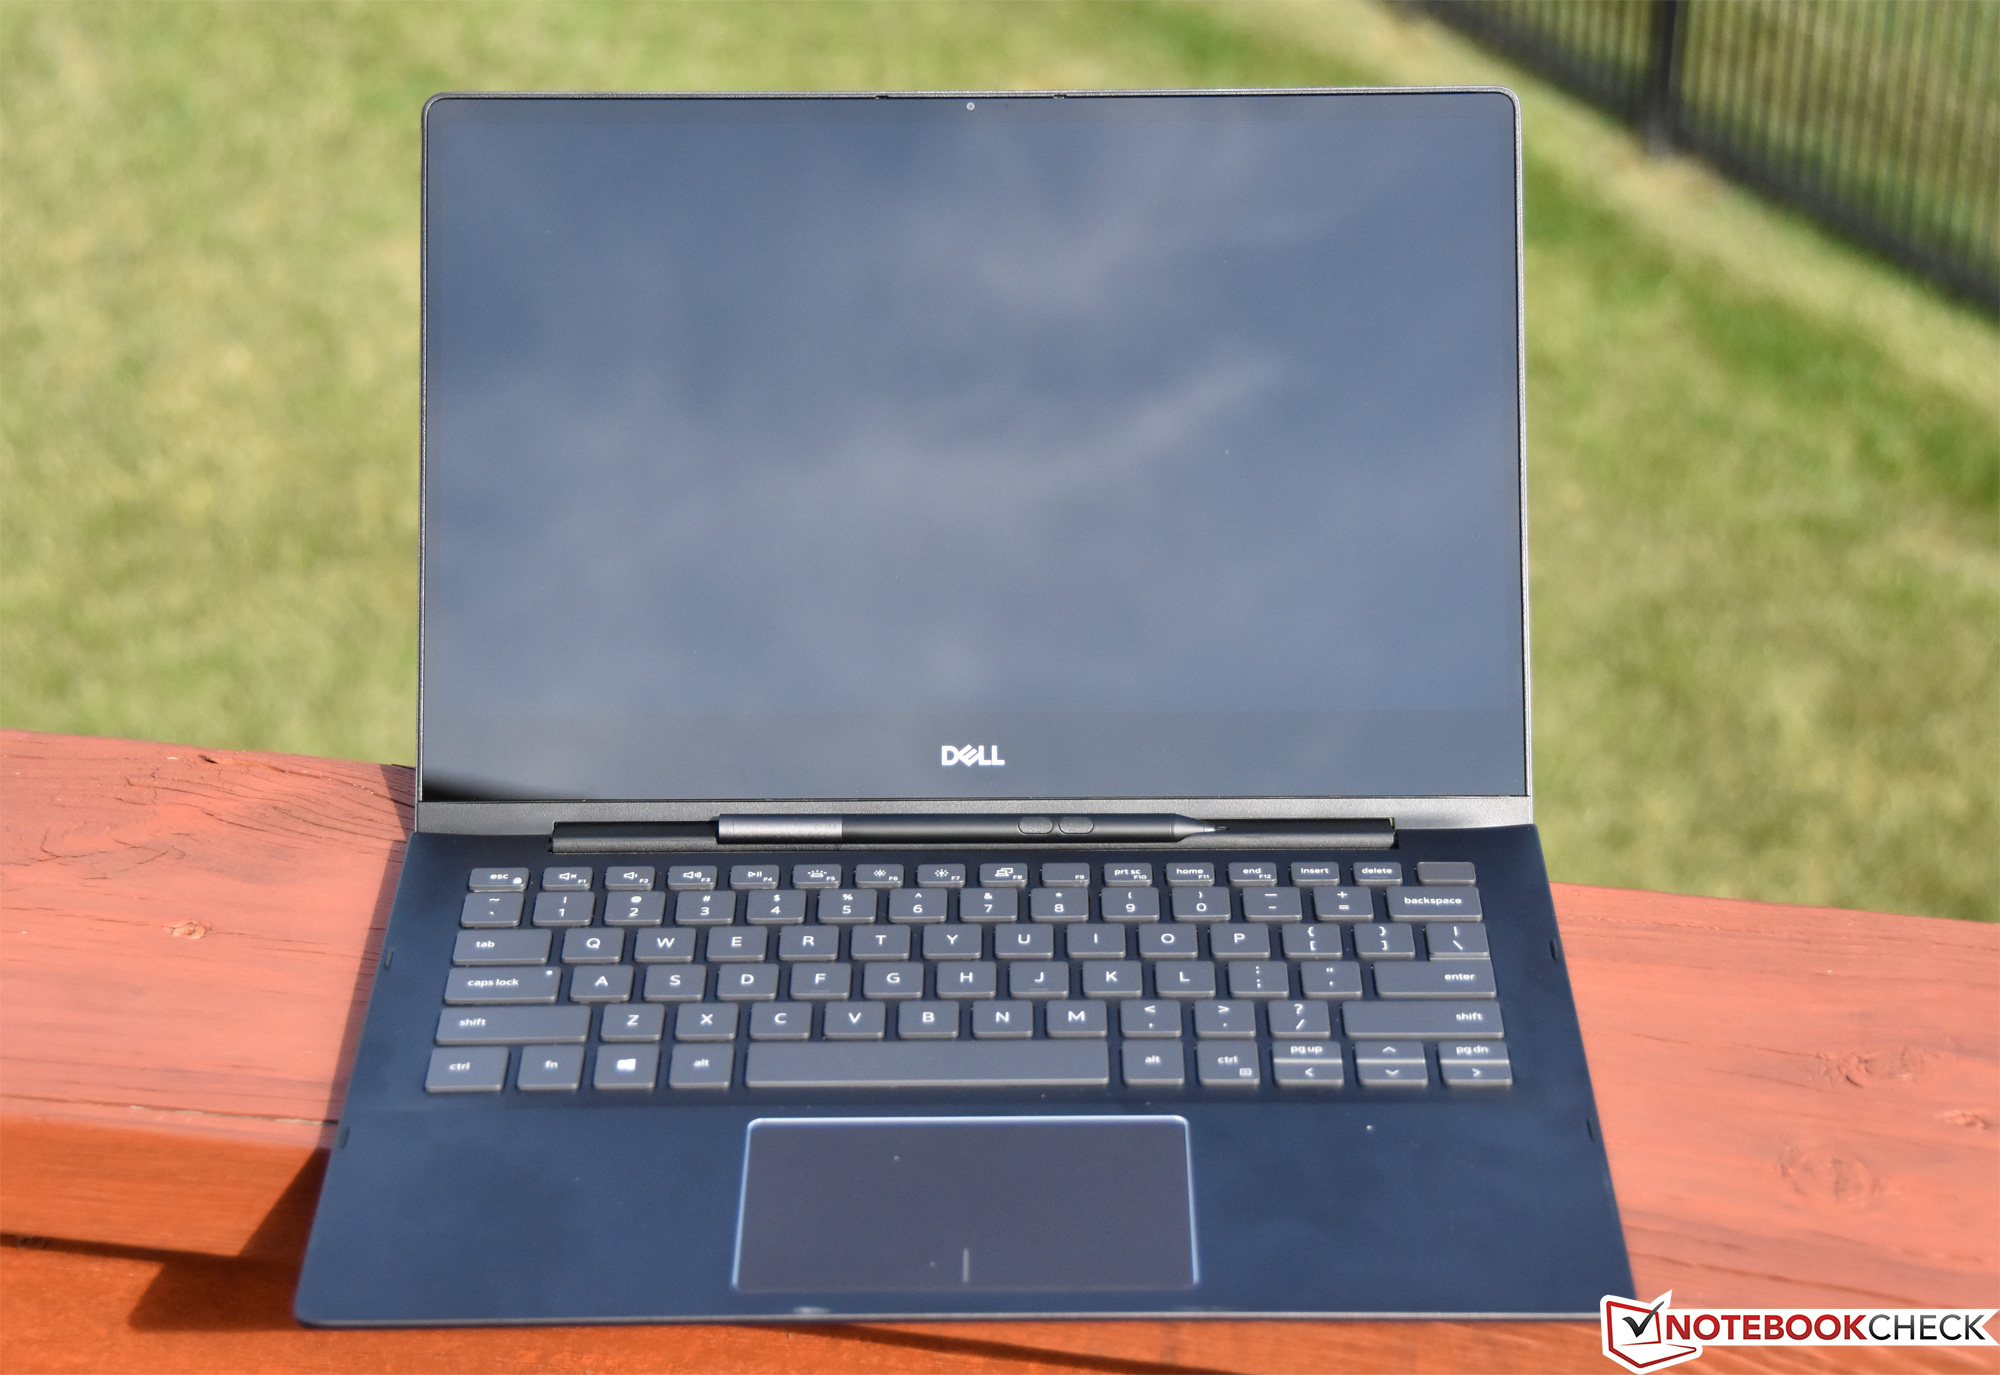
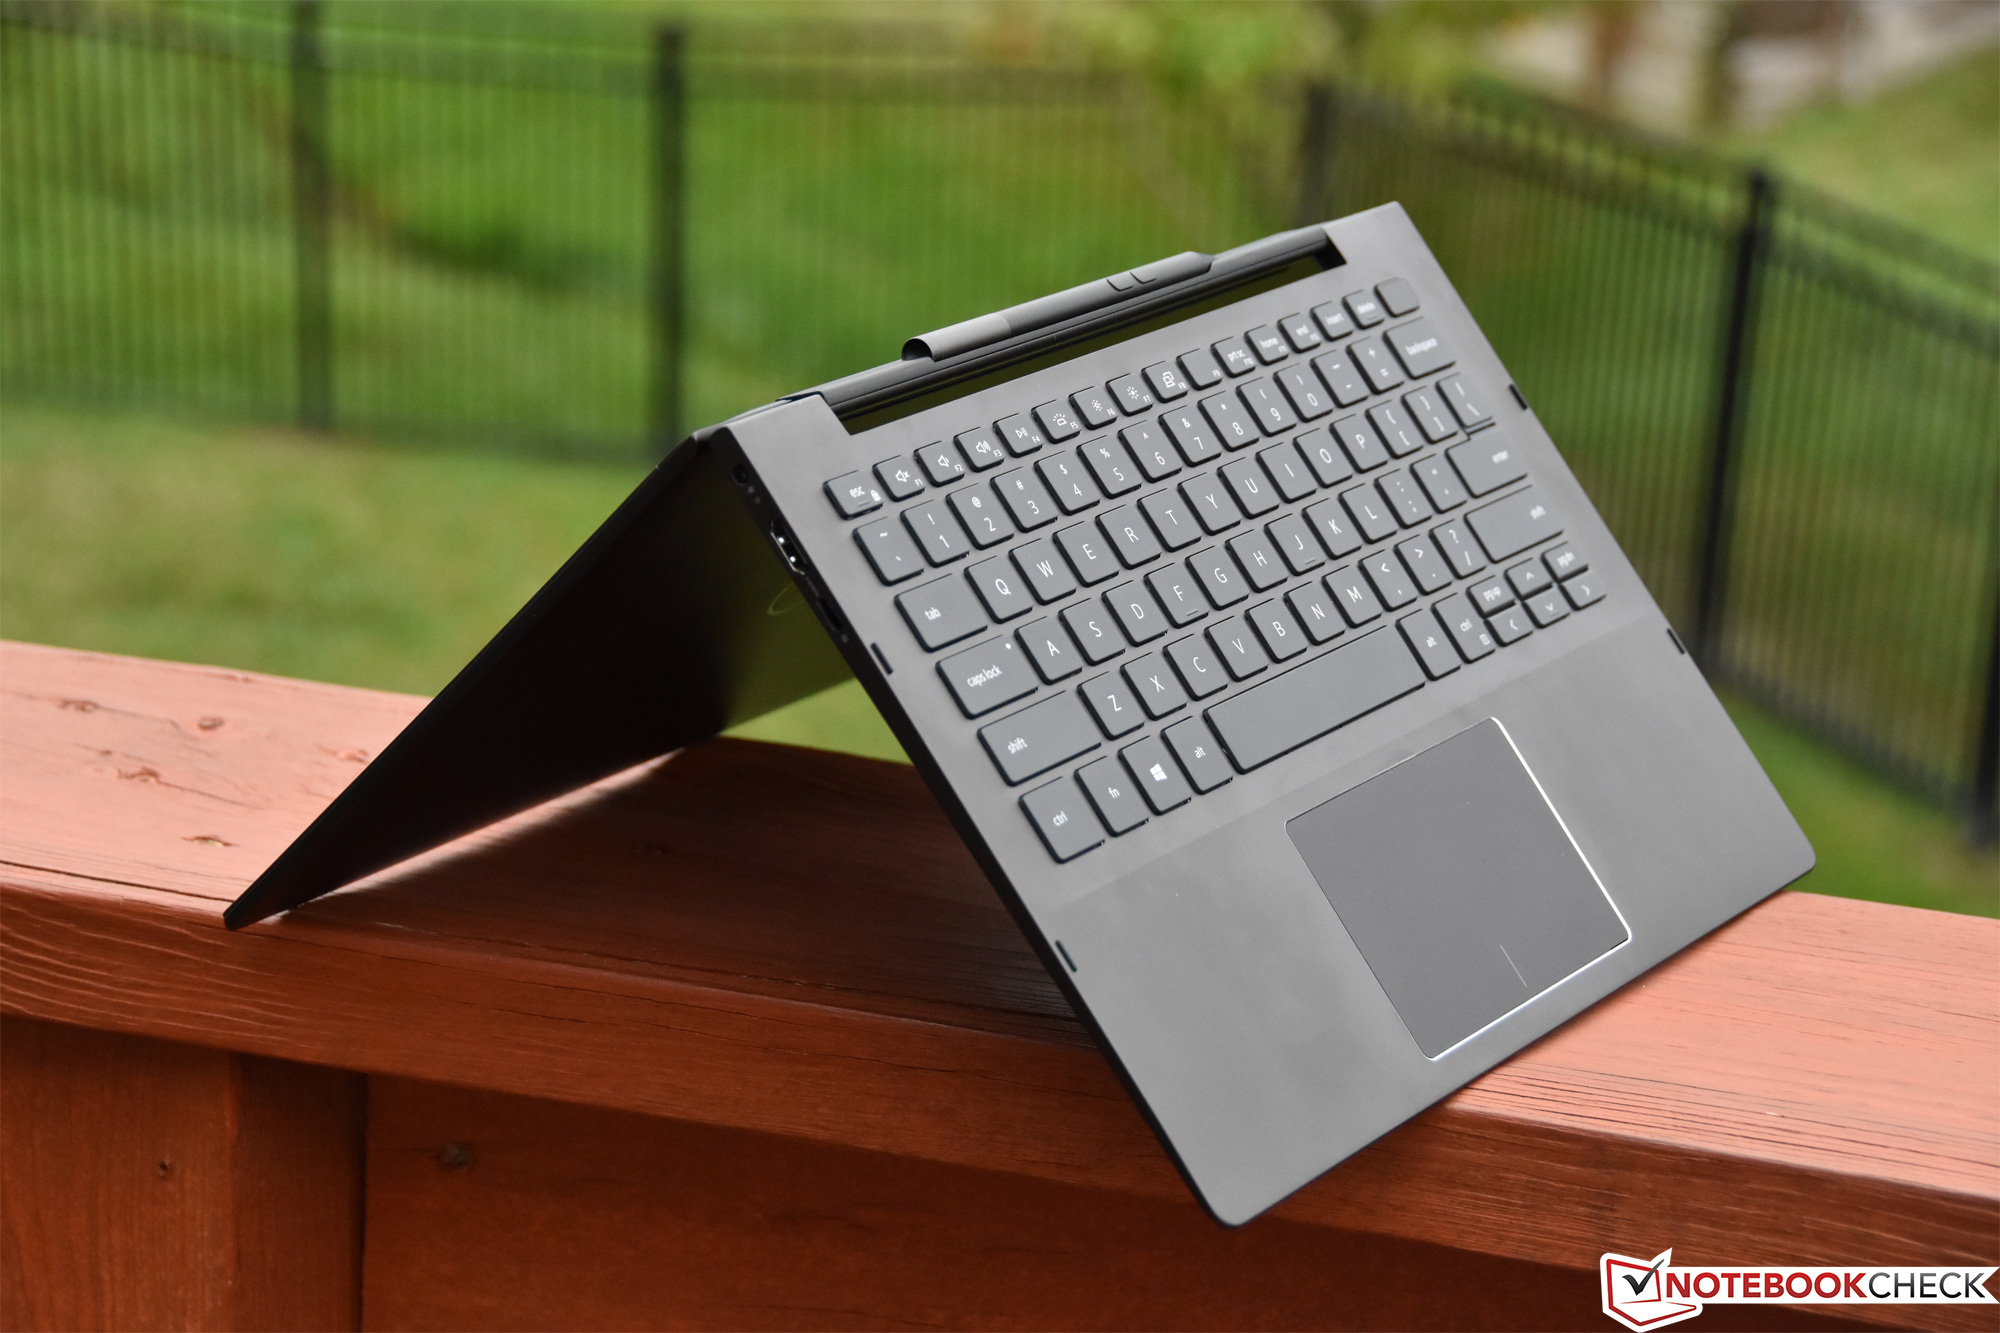
Case materials are still identical to those of the previous Inspiron 7386, with a dark grey-colored stamped aluminum lining the entire exterior—with the exception of the plastic hinge cover, which blends in fairly well. It’s practically monochromatic in its styling, with the keyboard keys blending into the surrounding surfaces and only a couple of shiny highlights—the touchpad border and the Dell logo in the center of the lid—drawing any sort of attention. This isn’t a criticism, however; it almost looks more professional for it.
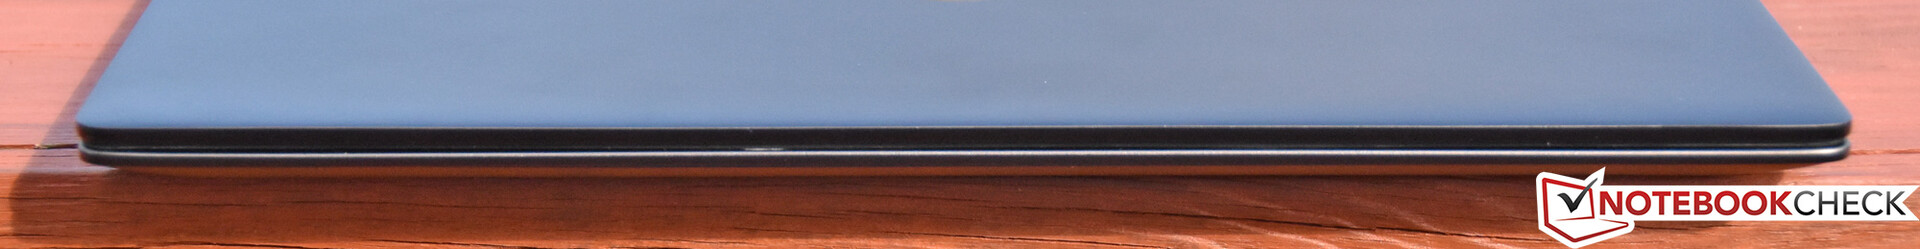
As before, the case seems sturdy in context with its relative thinness, with only a bit of flex noticeable in the center of the base unit under moderate pressure. The display resists twisting better than most other machines this size, and pressure from the back only produces minor artifacts on the panel.
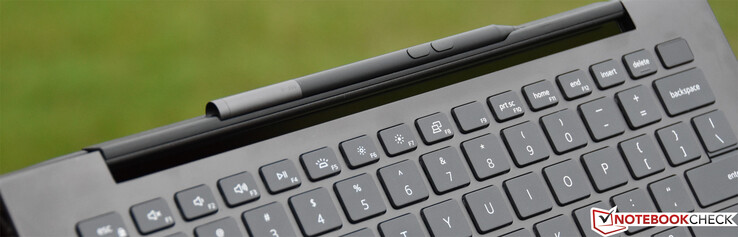
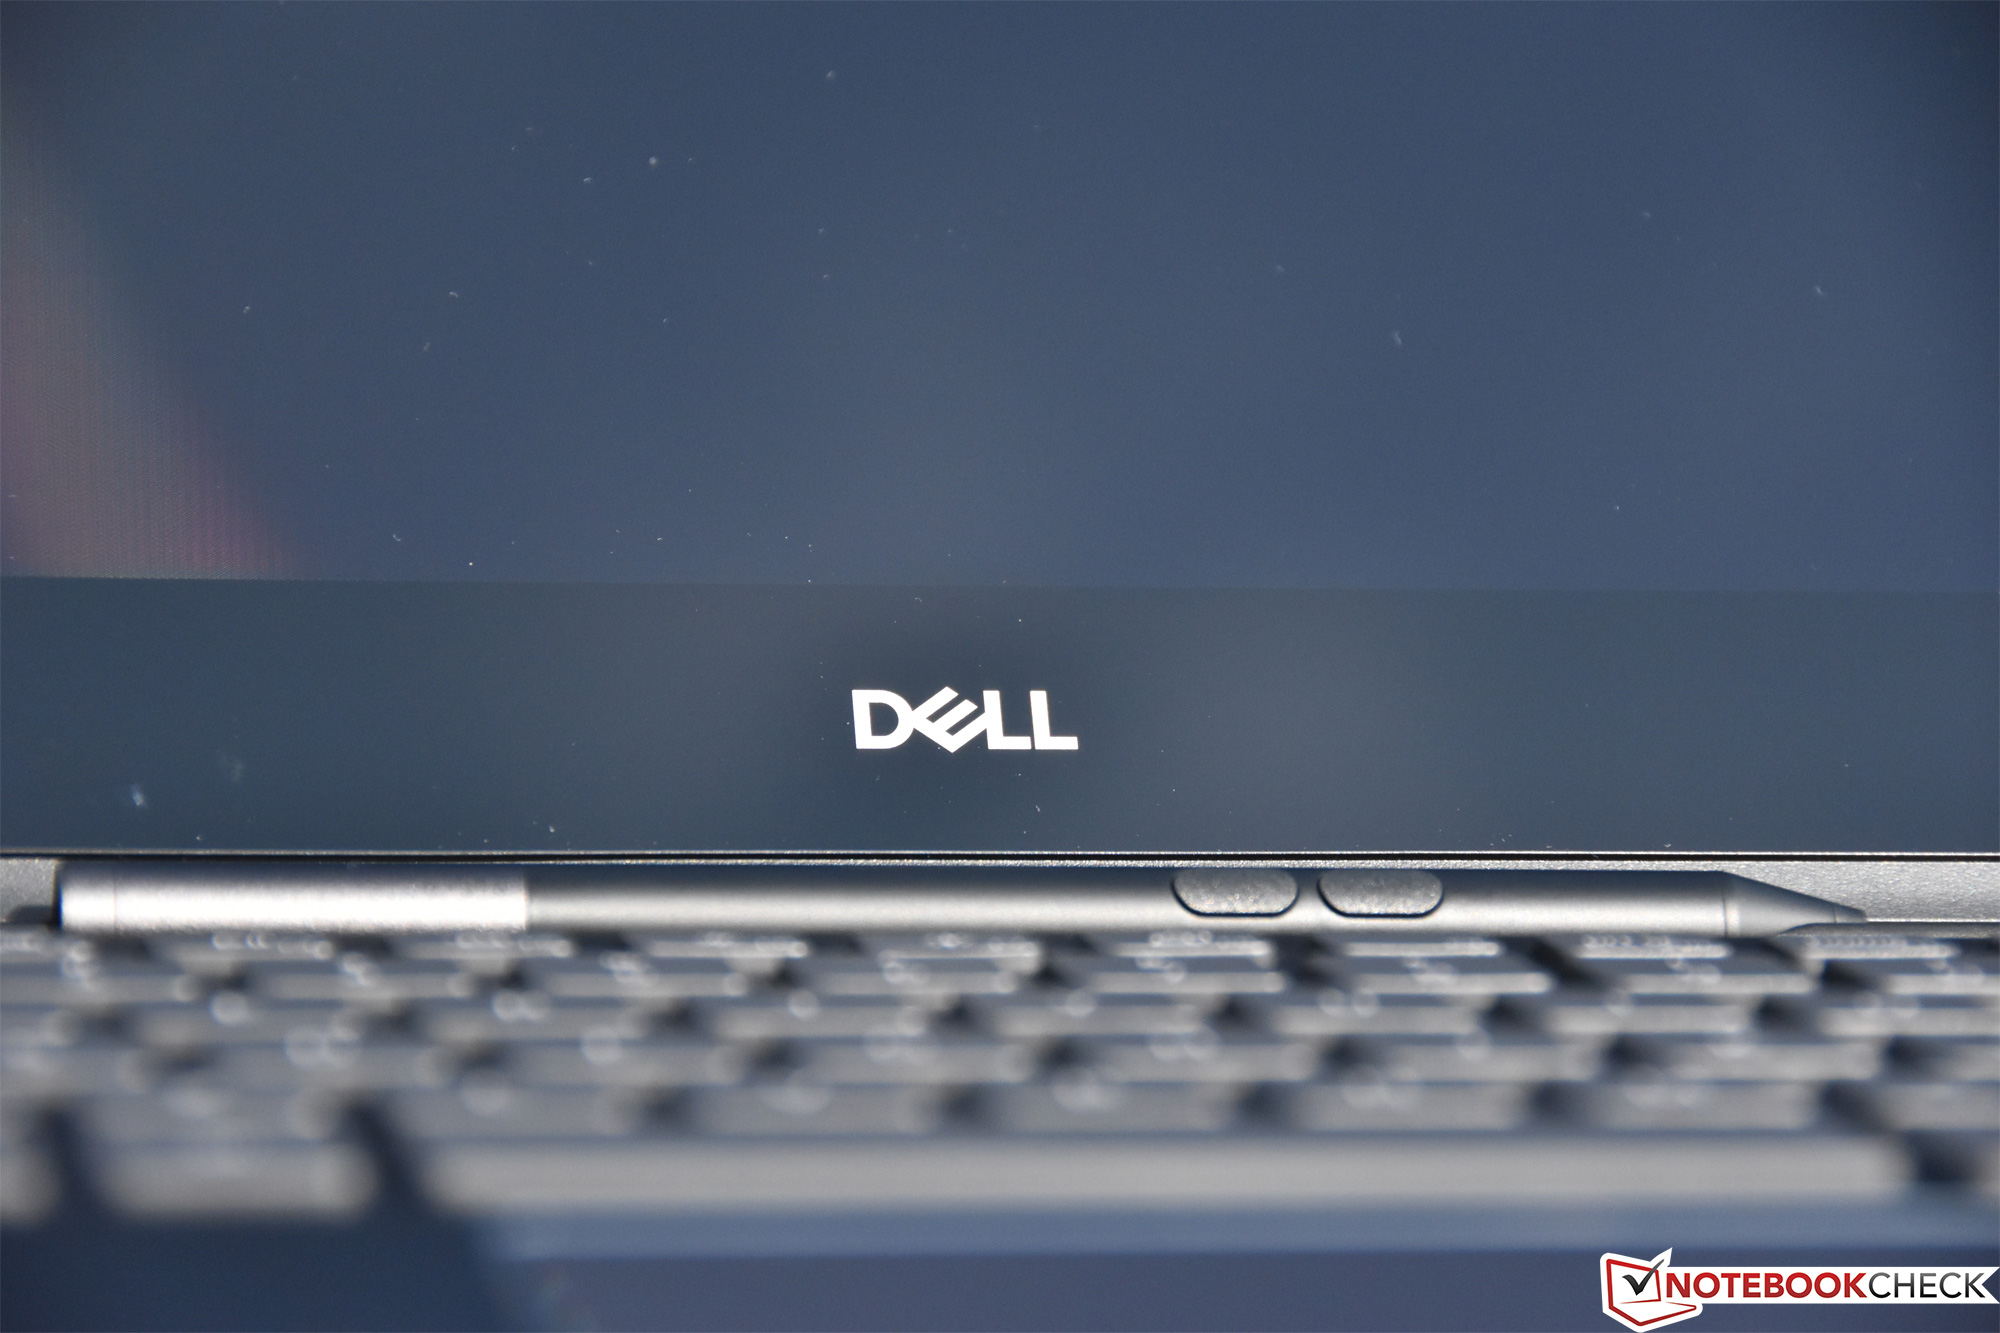
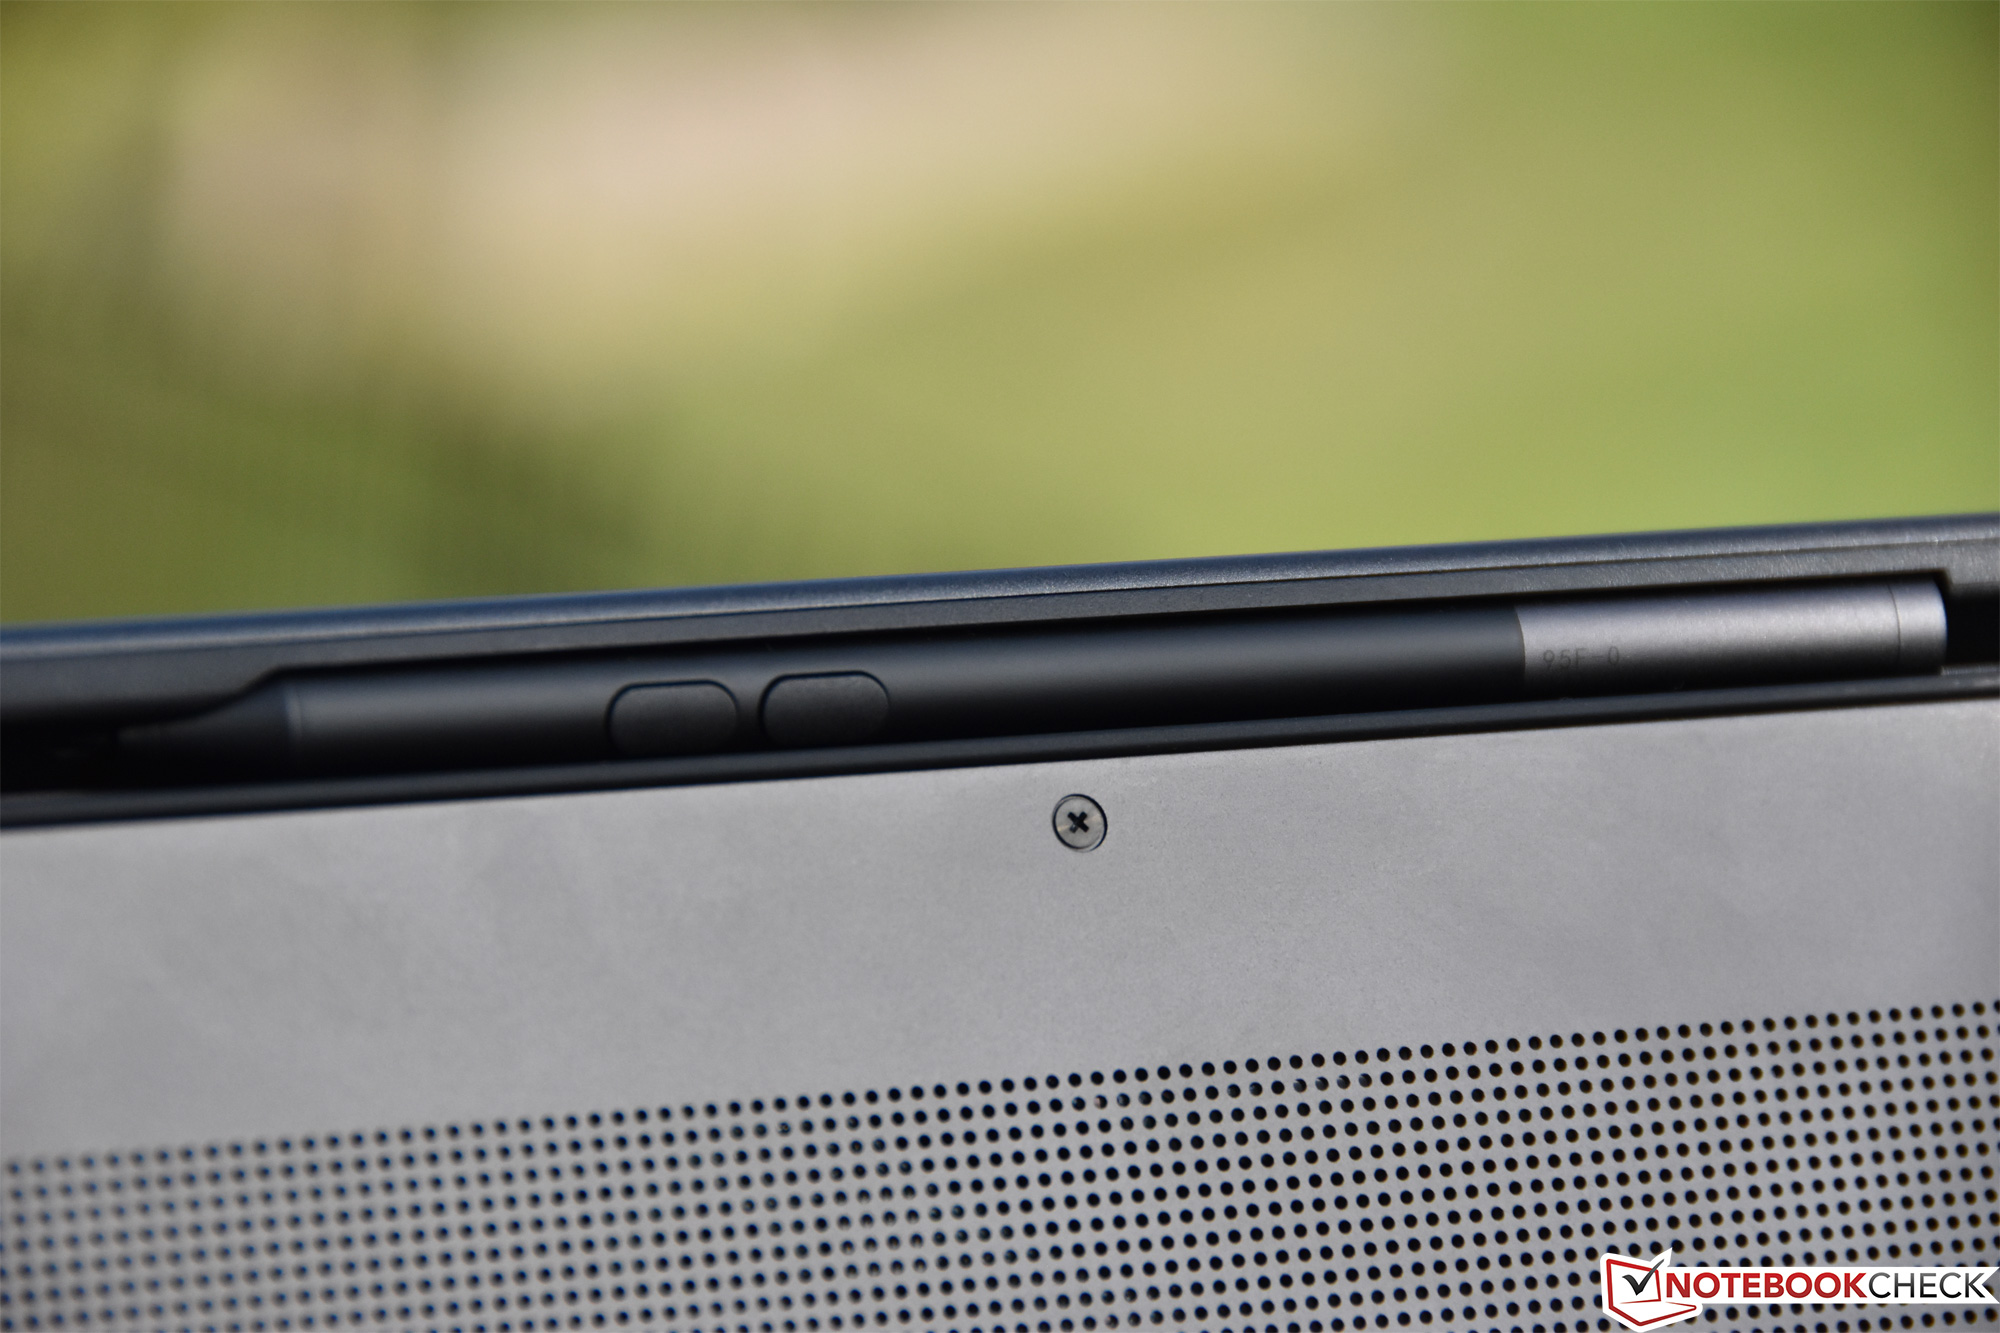
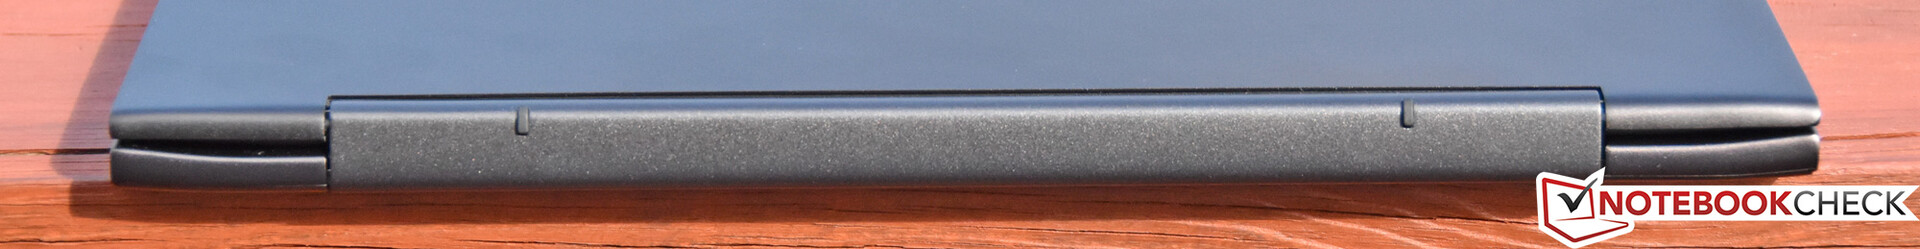
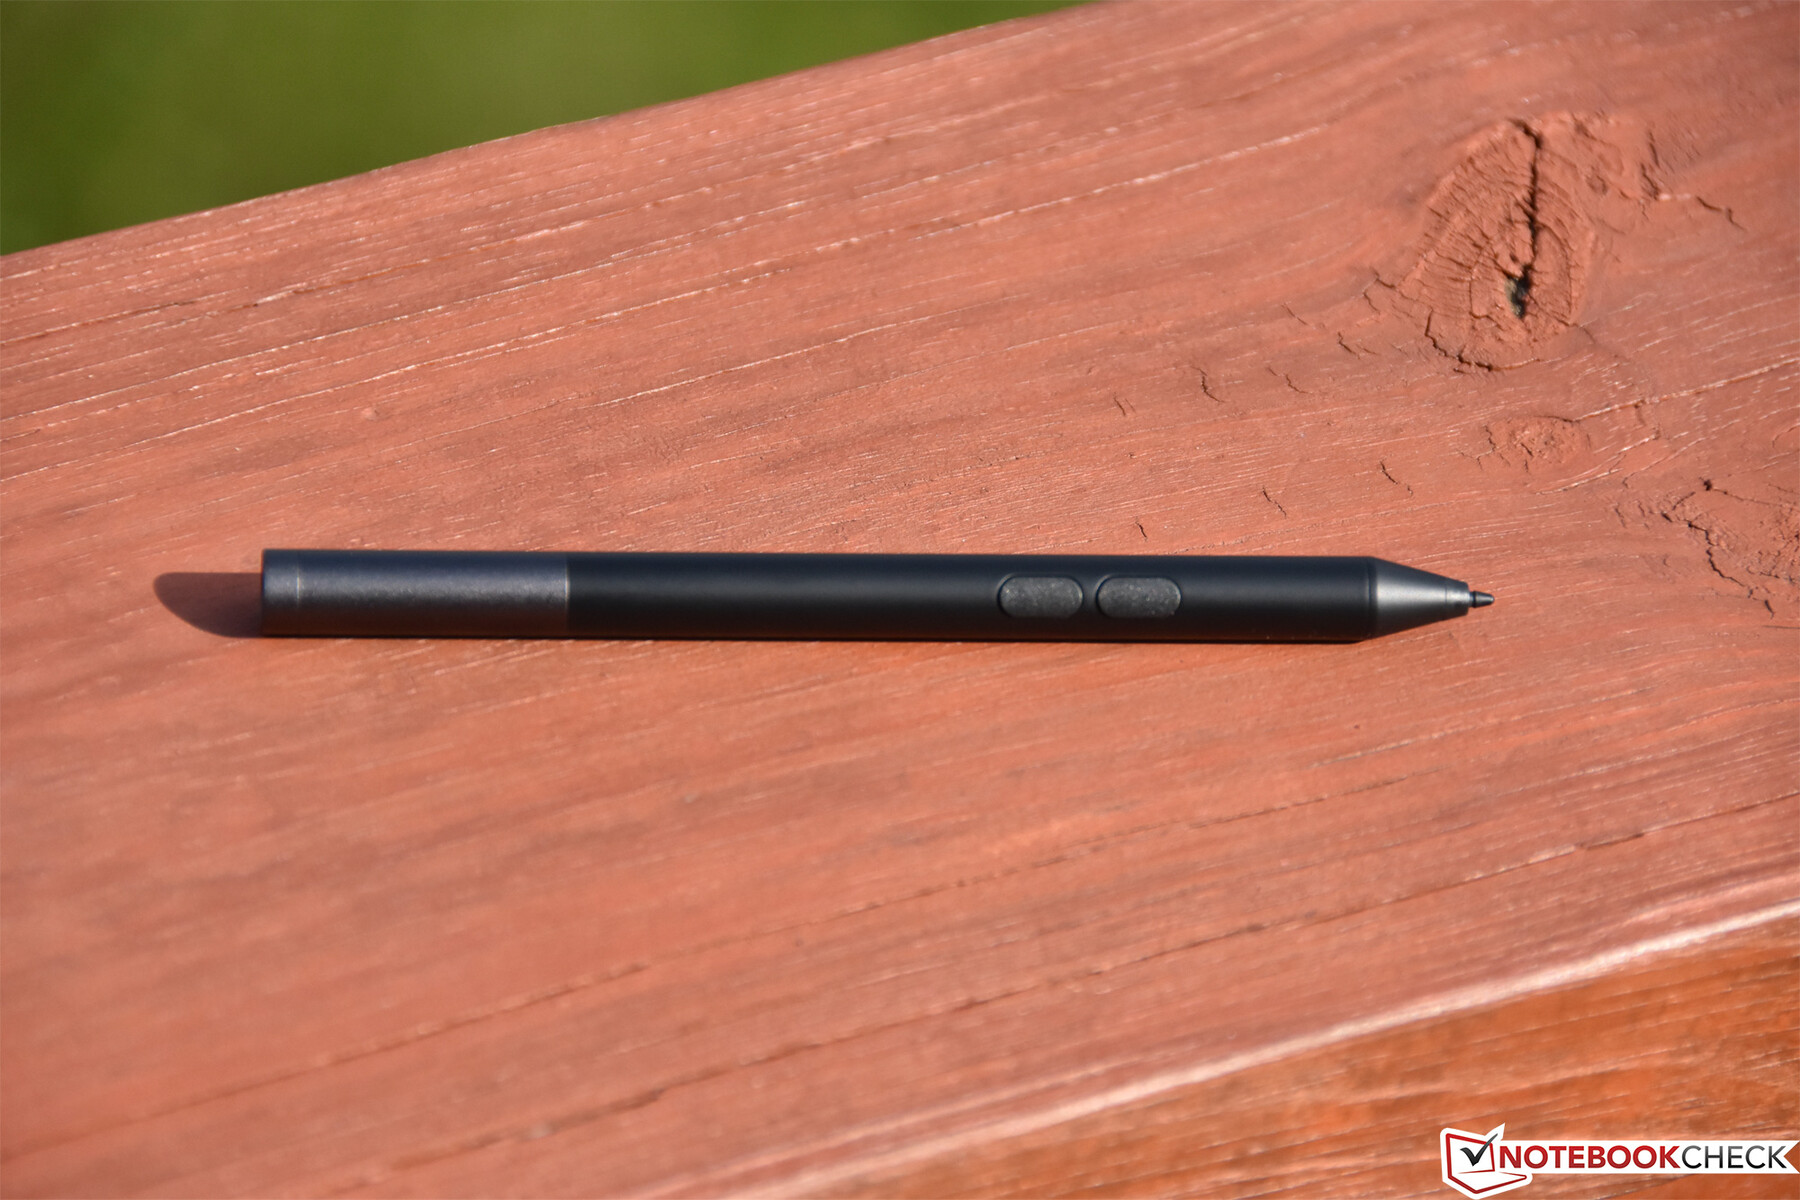
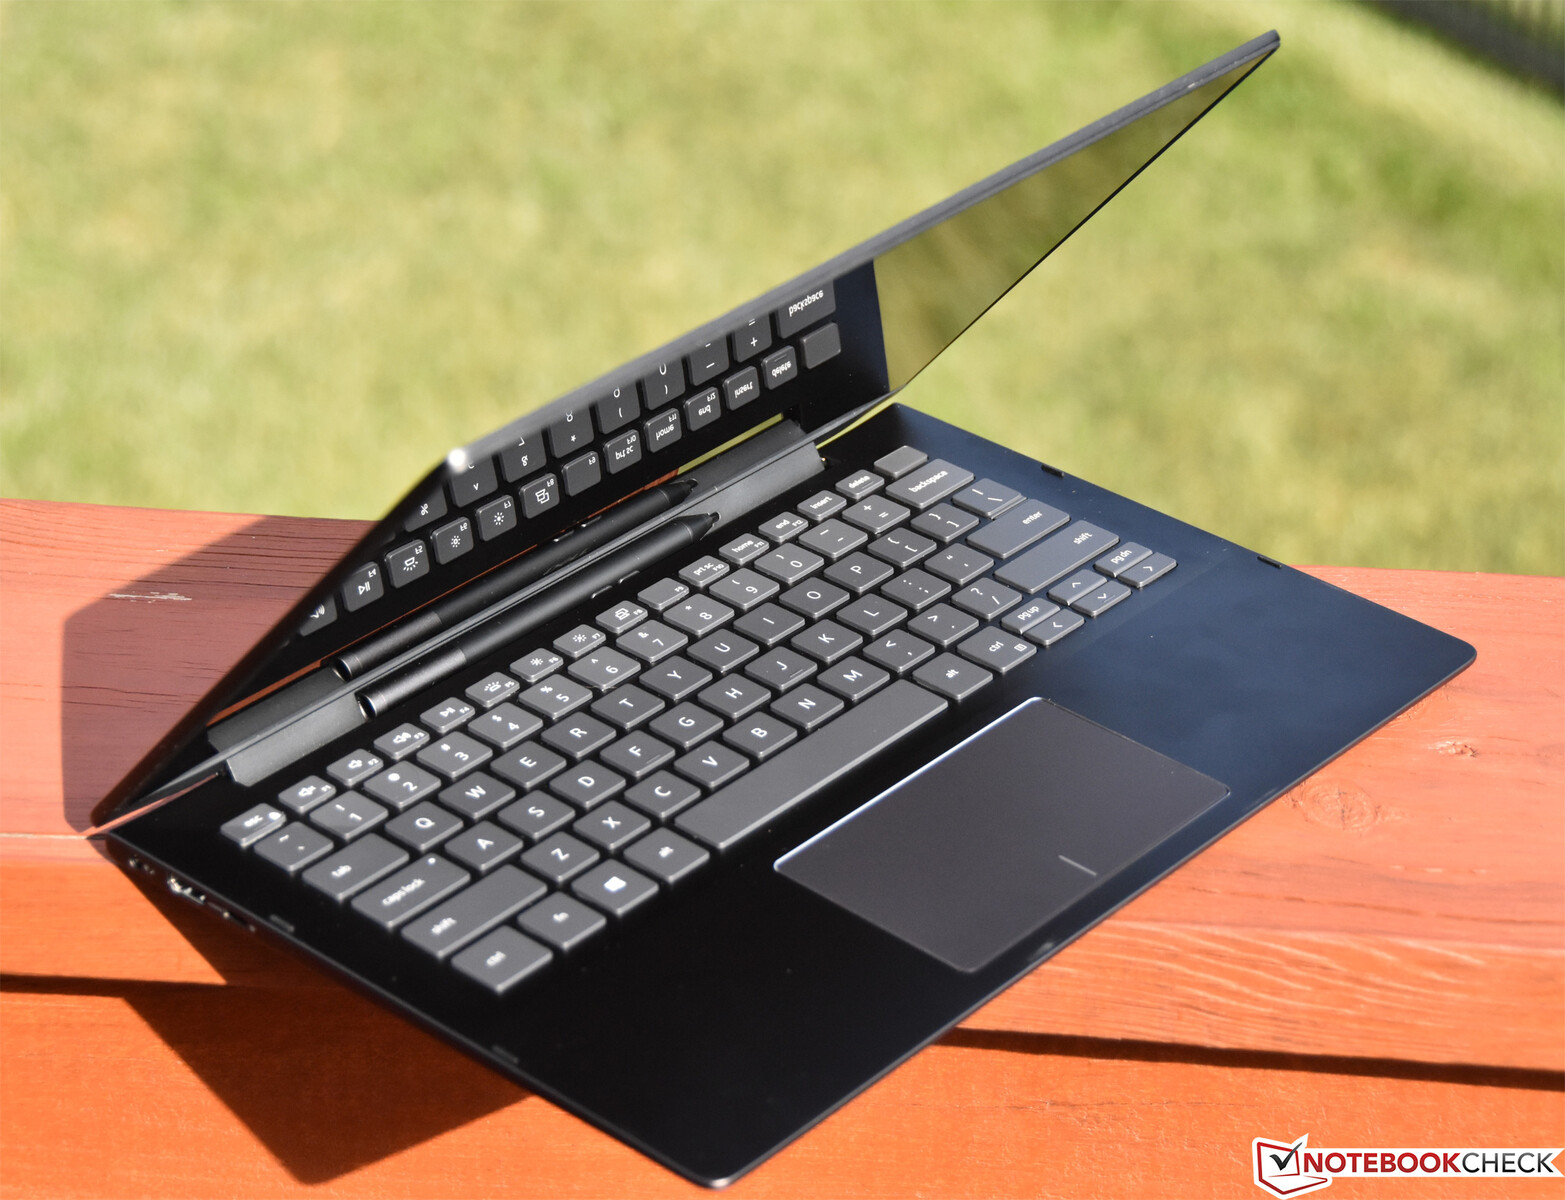
The biggest change in design is the central hinge (replacing the two hinges of the 7386), which is cleverly constructed with a storage cavity for a full-sized Dell Active Pen—Dell refers to this as a Pen Garage. Since the hinge sits back from the base unit about half an inch, the unit can close normally while storing the pen securely in this spot. The groove is also equipped with reasonably strong magnets to help guide the pen into place and keep it snug during transit. It’s probably the best storage solution we’ve seen to date for a full-sized stylus, and we applaud Dell for the innovative concept.
Apart from this, however, the hinge is stiff enough that the unit still requires two hands to open. It suppresses vibrations fairly well, but the high-gloss finish of the display still exacerbates regular tiny undulations while on the go.
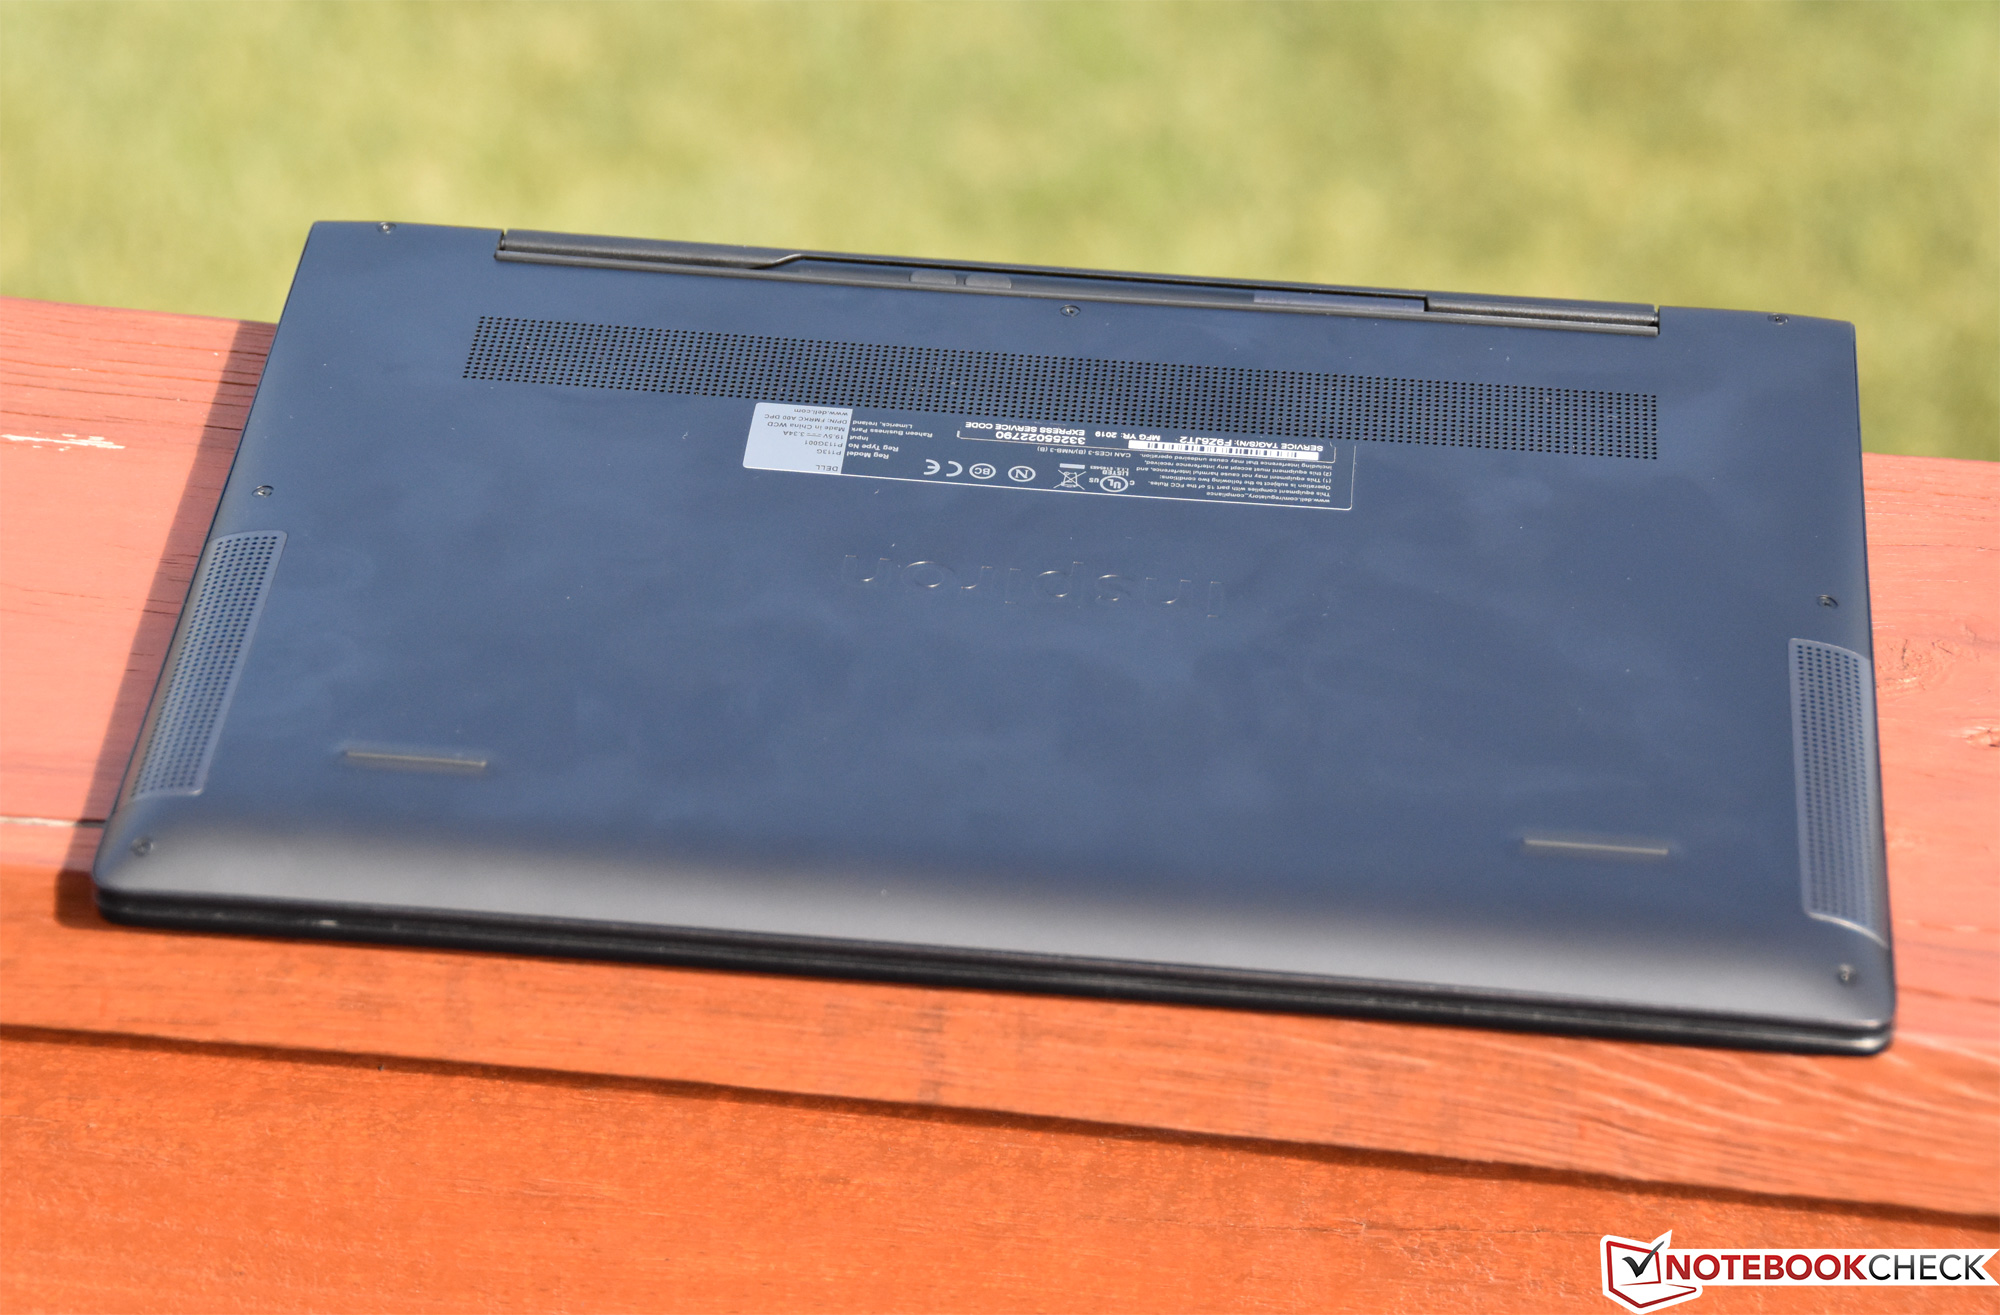
The Inspiron 7390 2-in-1 weighs in at 1.392 kg, which is on the heavier side for a machine of its size, but is still a bit lighter than that of the 7386 (1.45 kg). The footprint has also shrunk notably, down to 307 x 215 mm (from 322 x 224 mm). In conjunction with its thickness of just 15 mm, the device is roughly the same size as the HP Envy x360 13-ar0601ng. The Envy, while also constructed from aluminum, is nearly 100 grams lighter at just around 1.3 kg—but the gain in portability is offset equivalently by a tangible loss in durability (as the HP Envy can be easily twisted and suffers from a higher degree of case flex than the Inspiron).
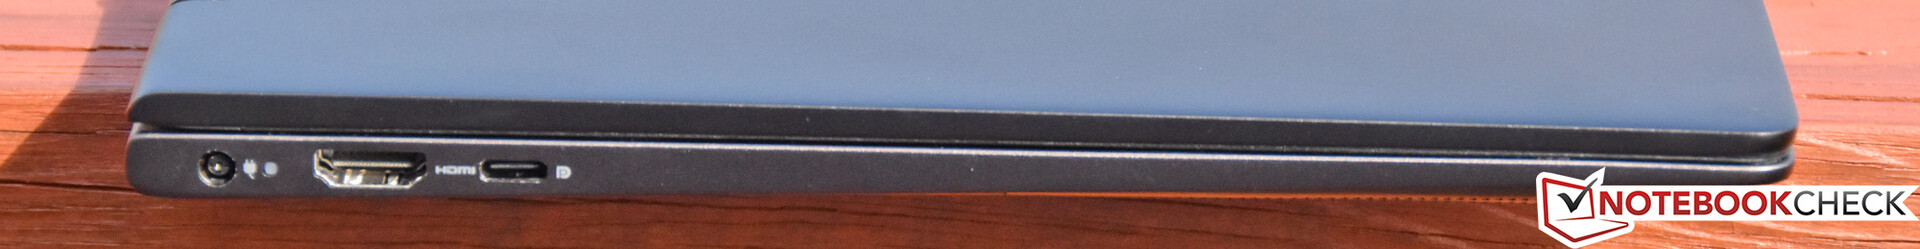
Connectivity
Ports are identical to that of the Inspiron 7386, so sadly, we still have no Thunderbolt 3 as an option. The charging port is, fortunately, at least separate from the others, so it doesn’t consume one of the only two USB ports available on the system (one of which is Type-C and the other Type-A). Port spacing is comfortable fortunately, and all ports are on the left and right sides of the machine making for convenient connections.
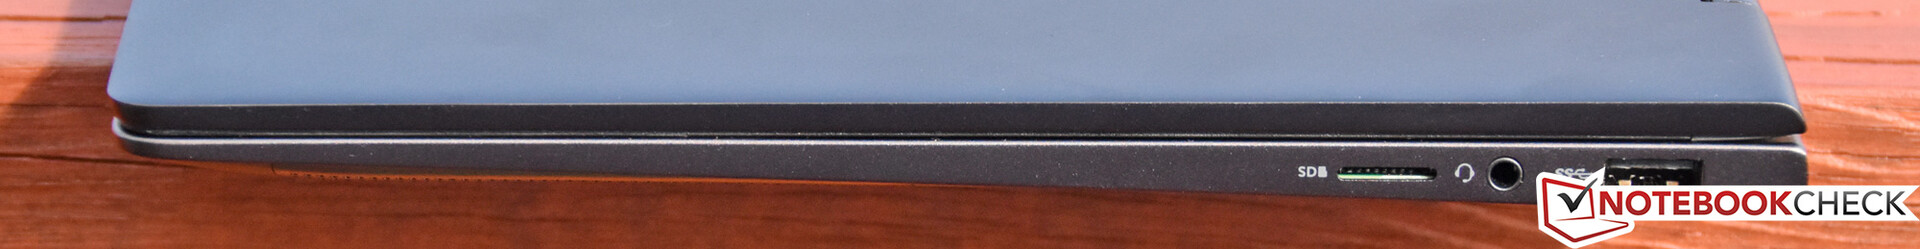
SD Card Reader
Another item that hasn’t changed is the microSD card reader, and it’s slow. We measure just 28.3 MB/s and 20.8 MB/s read/write speeds using our standard benchmark card, almost 1/3 of the average speeds and 1/7 that of the Latitude 7400 2-in-1’s lightning fast reader.
| SD Card Reader | |
| average JPG Copy Test (av. of 3 runs) | |
| Dell Latitude 7400 2-in-1 (Toshiba Exceria Pro M501 UHS-II) | |
| Lenovo ThinkPad X390 Yoga-20NQS05R00 (Toshiba Exceria Pro M501) | |
| HP Envy x360 13-ar0601ng (Toshiba Exceria Pro M501 microSDXC 64GB) | |
| Average of class Convertible (28.1 - 197, n=23, last 2 years) | |
| Dell Inspiron 7390 2-in-1 (Toshiba Exceria Pro M501 UHS-II) | |
| maximum AS SSD Seq Read Test (1GB) | |
| Dell Latitude 7400 2-in-1 (Toshiba Exceria Pro M501 UHS-II) | |
| Average of class Convertible (28.9 - 254, n=22, last 2 years) | |
| HP Envy x360 13-ar0601ng (Toshiba Exceria Pro M501 microSDXC 64GB) | |
| Lenovo ThinkPad X390 Yoga-20NQS05R00 (Toshiba Exceria Pro M501) | |
| Dell Inspiron 13 7386 (Toshiba Exceria Pro M501 microSDXC 64GB) | |
| Dell Inspiron 7390 2-in-1 (Toshiba Exceria Pro M501 UHS-II) | |
Communication
Fortunately, the Intel Wireless-AC 9560 is among the best WLAN adapters currently available, and it performs admirably in the Inspiron 7390 2-in-1. Our measurements of 637 Mb/s and 589 Mb/s receive/transmit are right in line with other similarly-equipped notebooks.
Security (business devices)
The Inspiron 7390 2-in-1 retains the fingerprint sensor + power button combo, though the keyboard has been reorganized a bit to accommodate the power button in line with the rest of the keys; it’s now situated in the upper-rightmost corner, eliminating the need for a separate round power button above the keyboard. During our time with the machine, the fingerprint sensor was quick and painless in operation.
The machine also includes a TPM 2.0 chip, but it isn’t usable unless the operating system is first upgraded to Windows 10 Pro.
Accessories
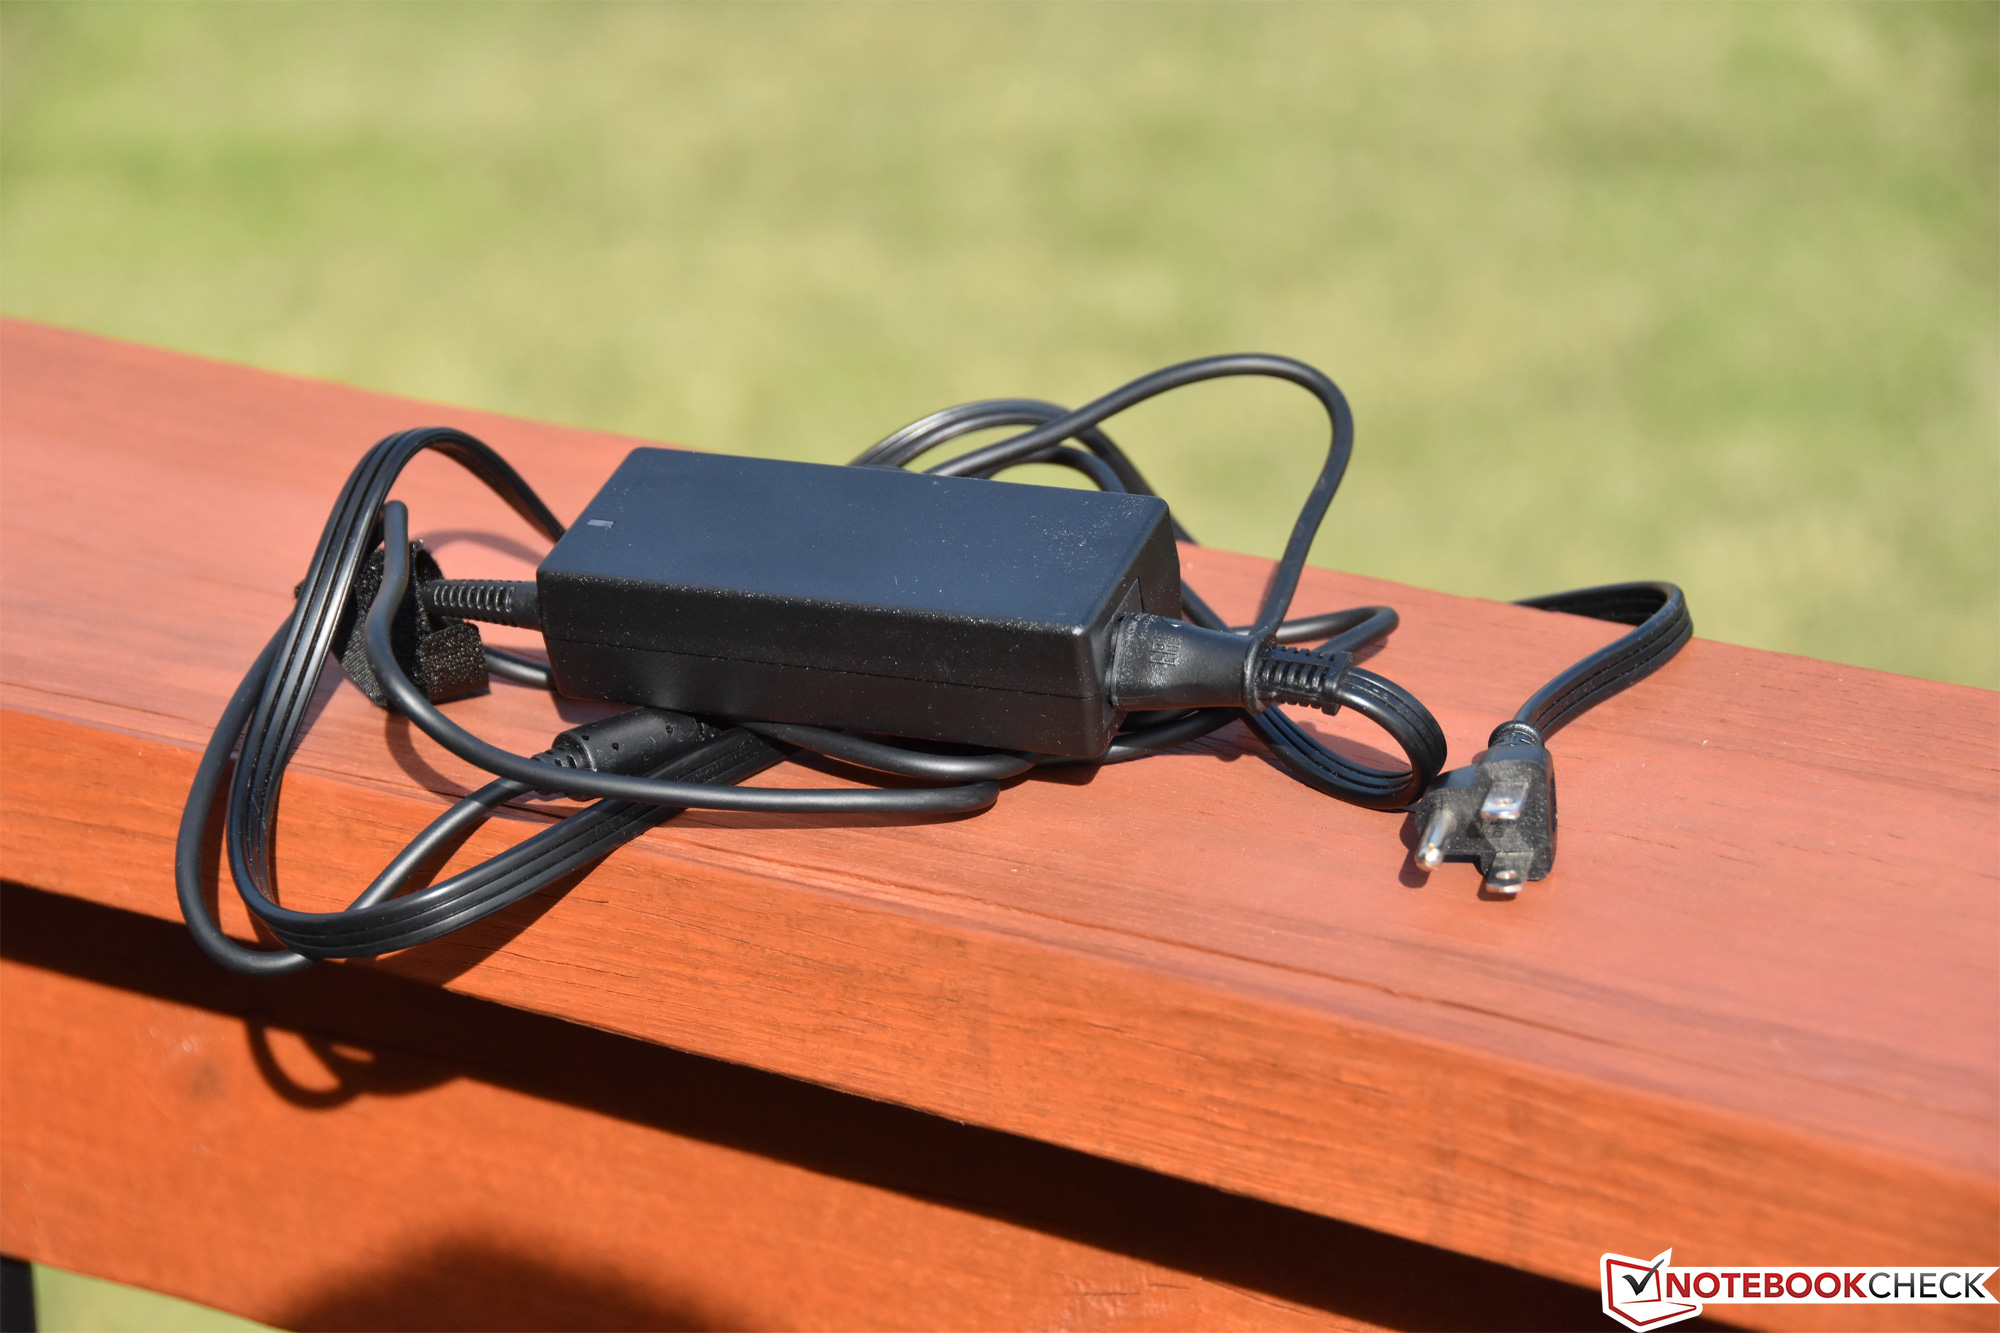
The Inspiron 7390 2-in-1 includes a Dell Active Pen (MSRP $50) alongside the typical 65 W AC adapter.
Maintenance
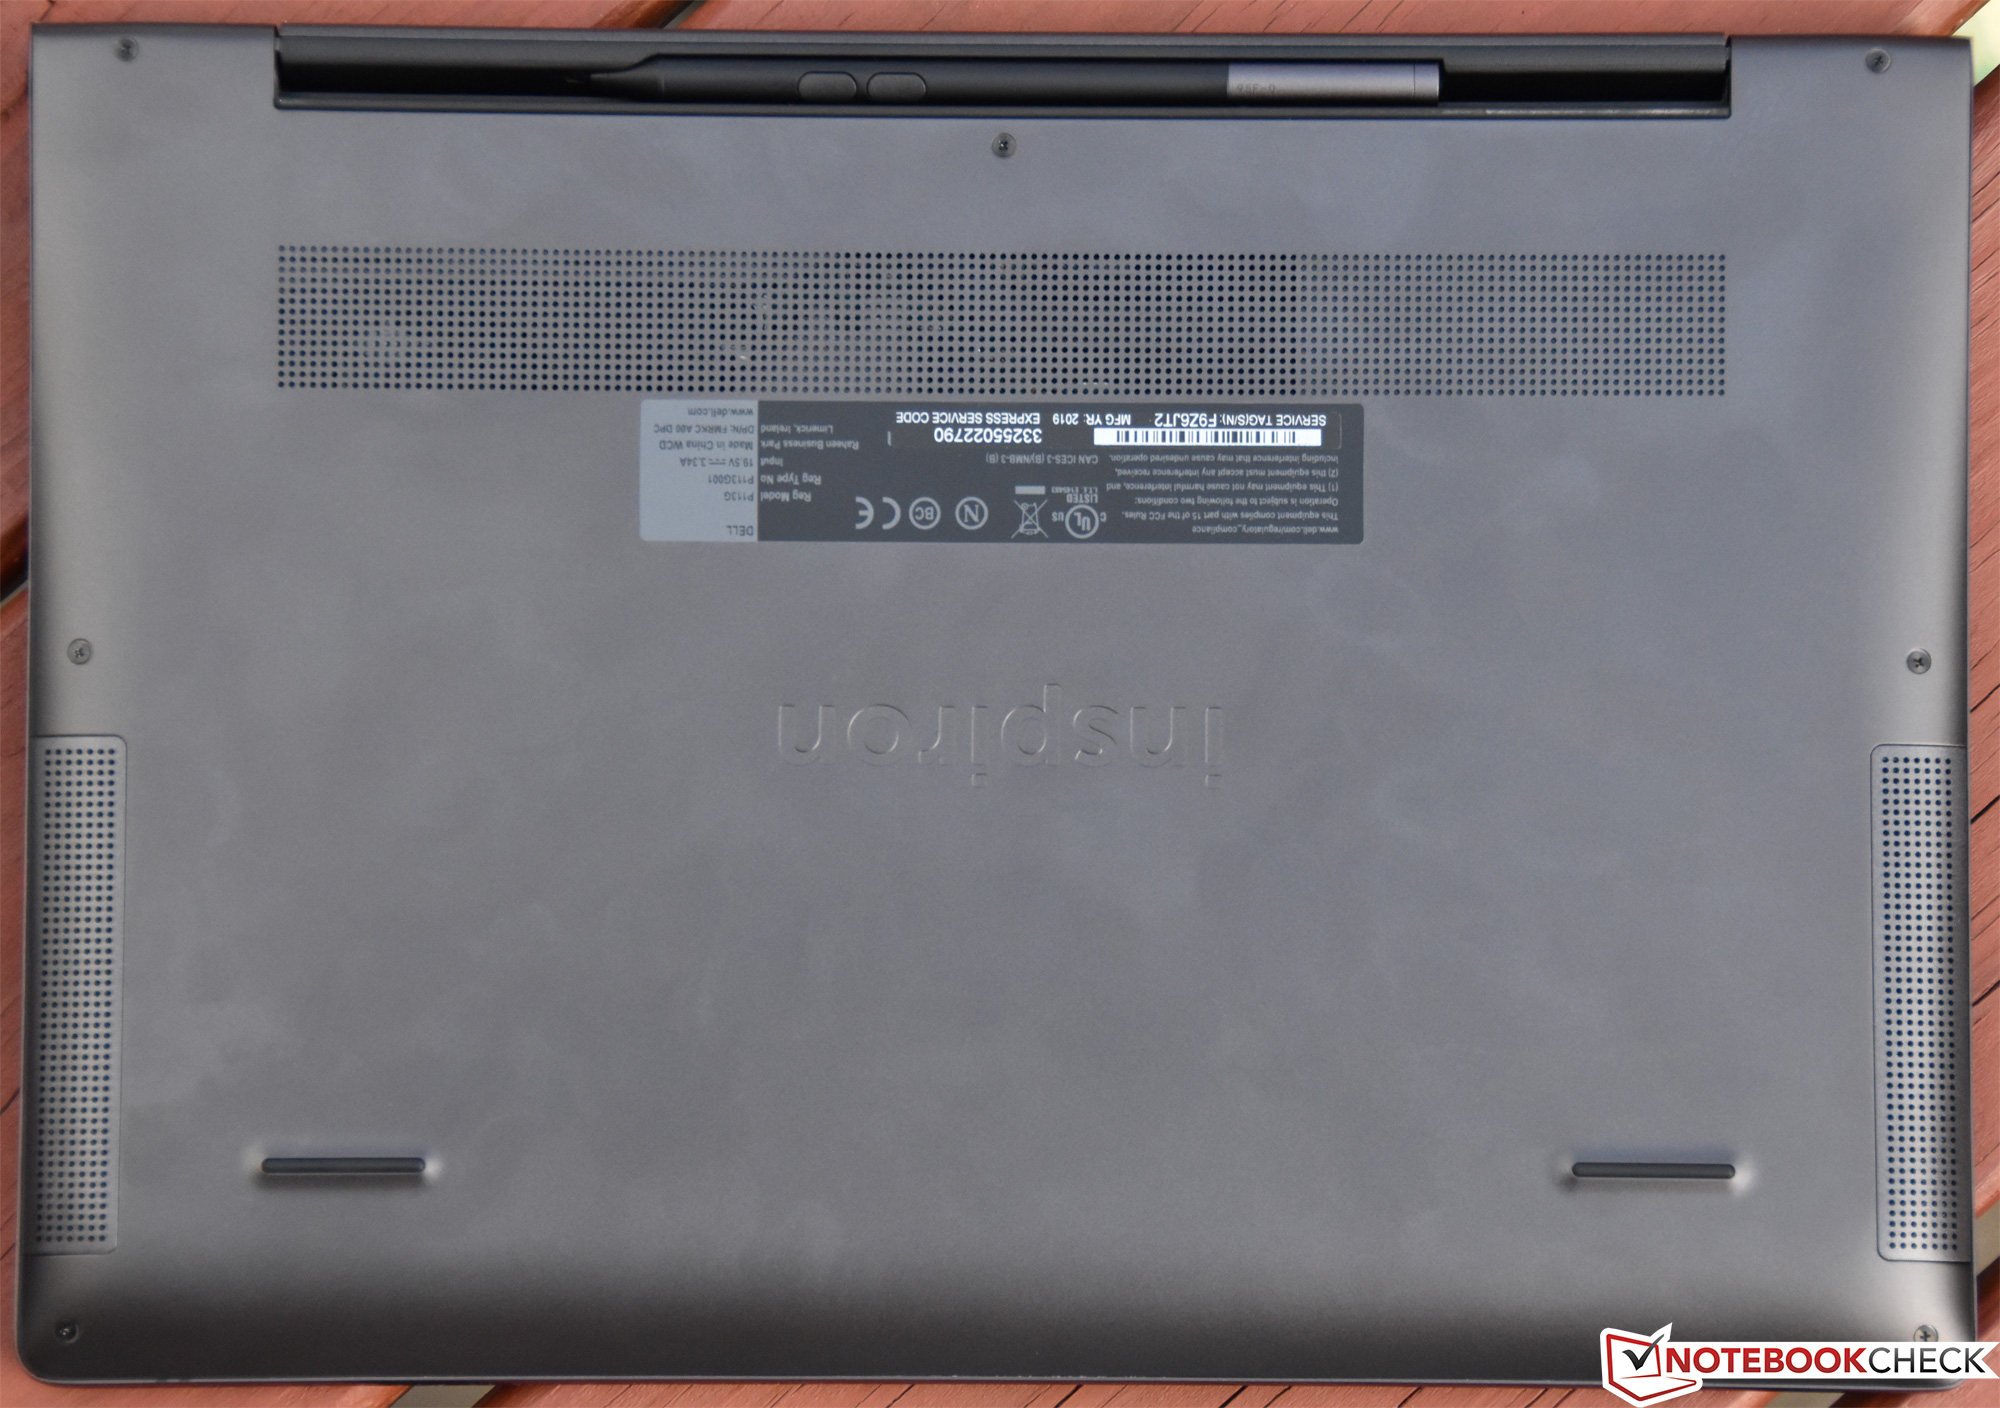
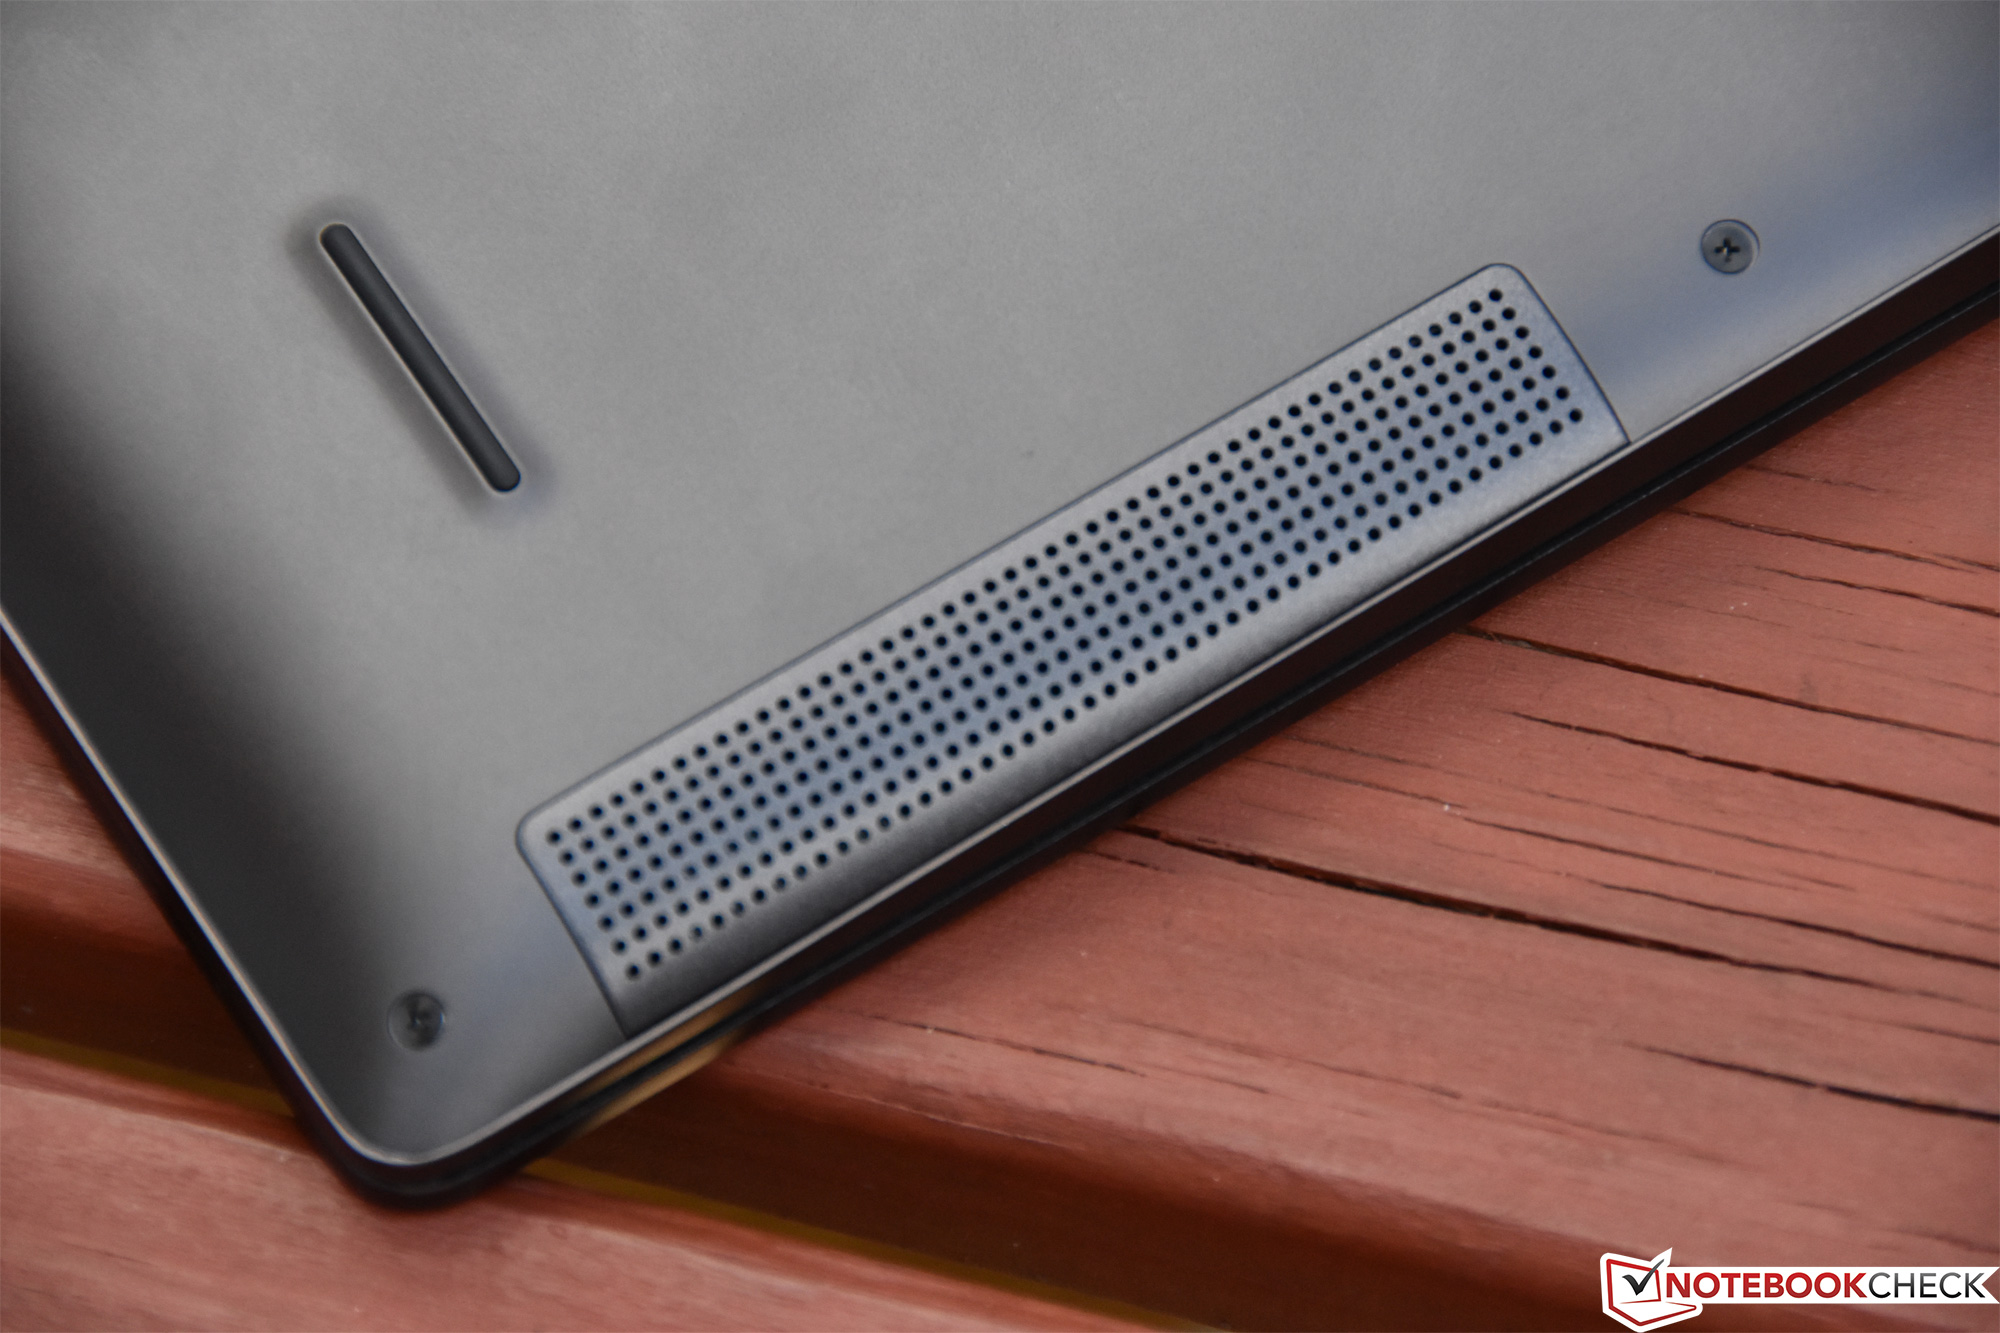
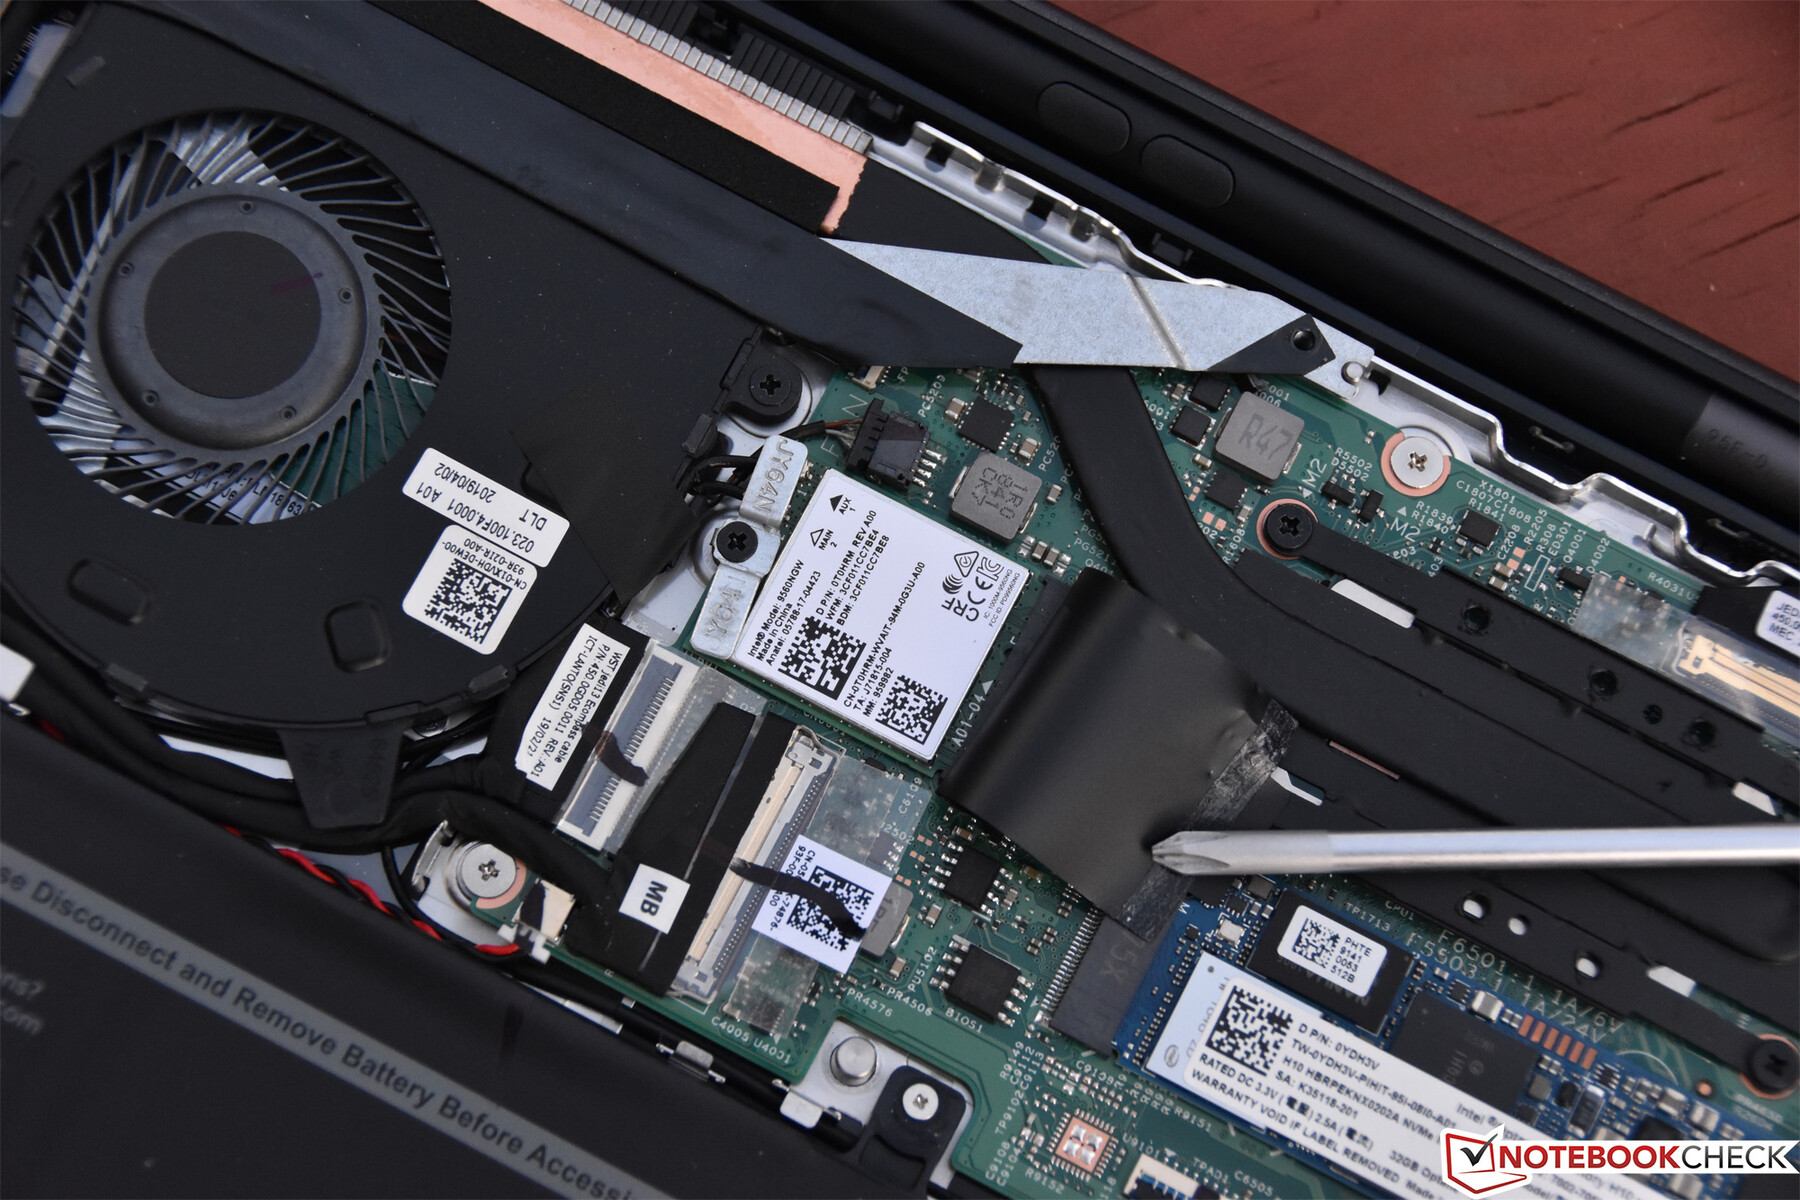
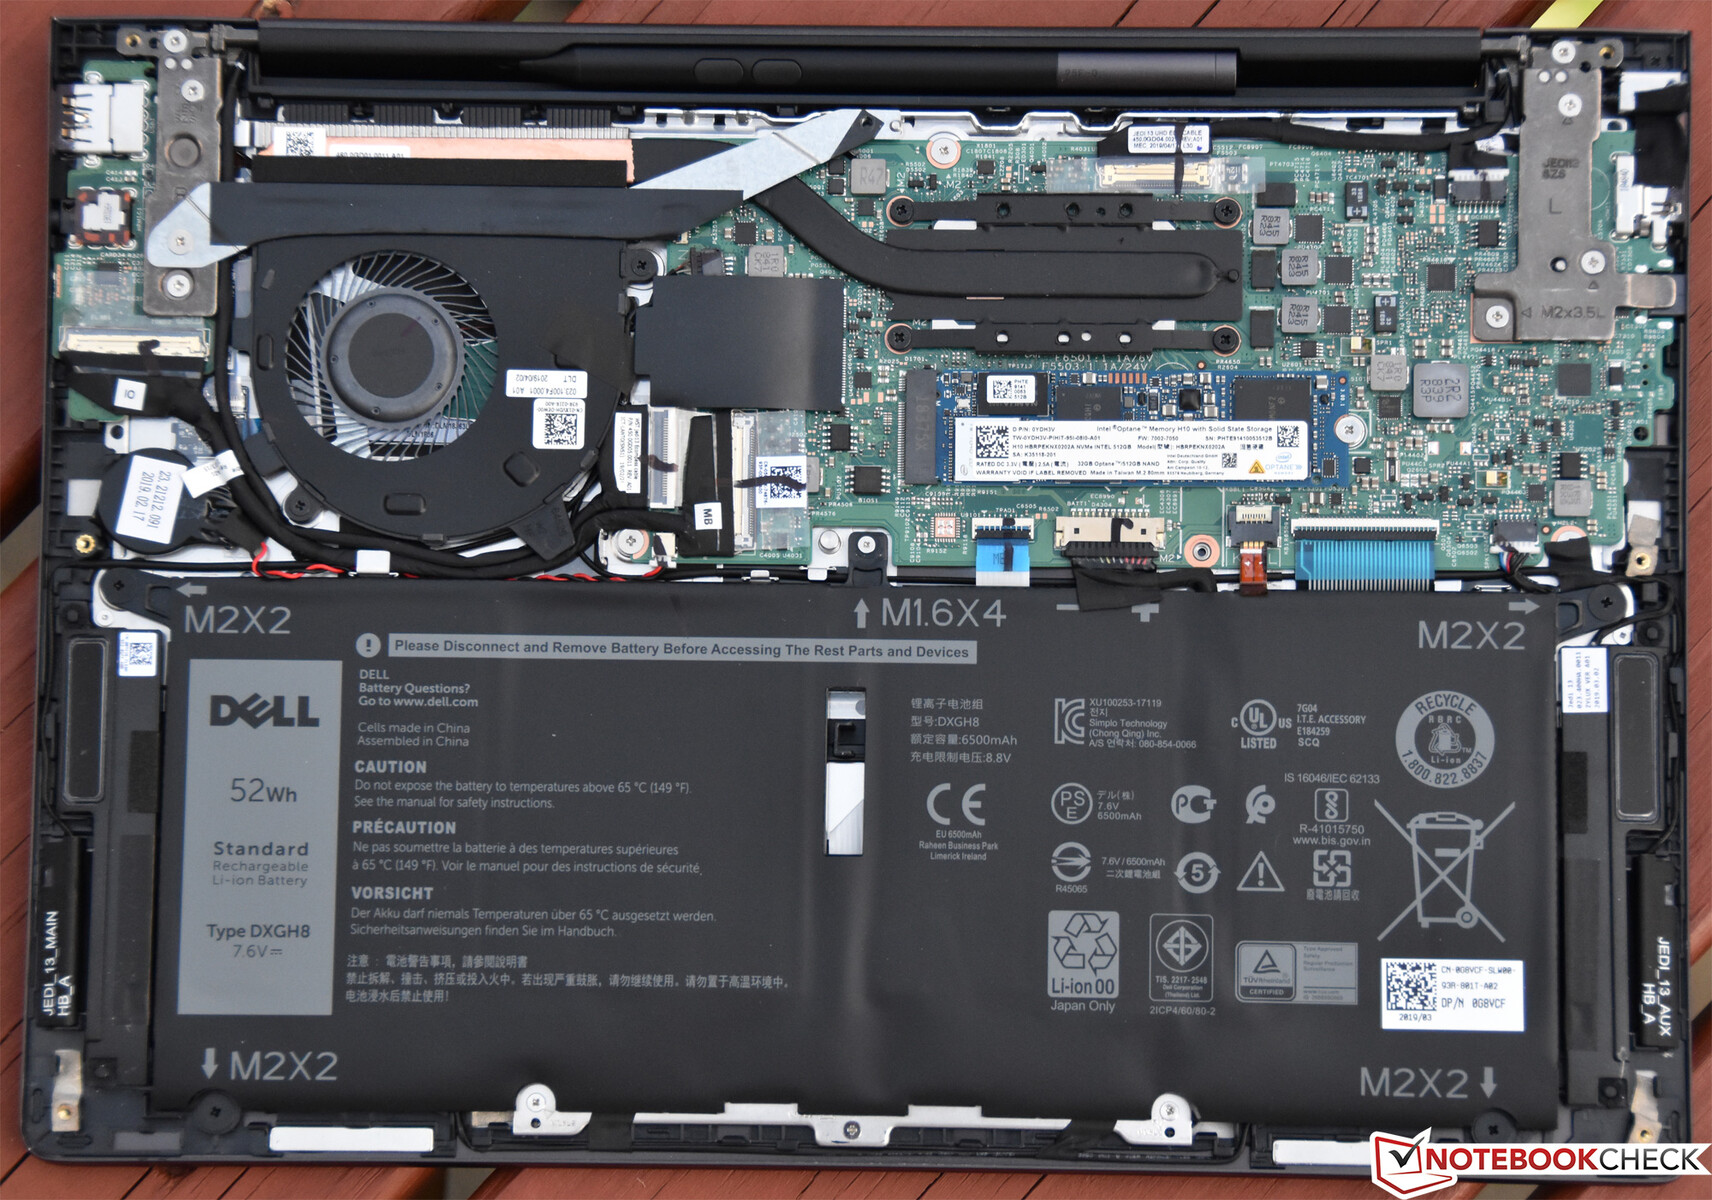
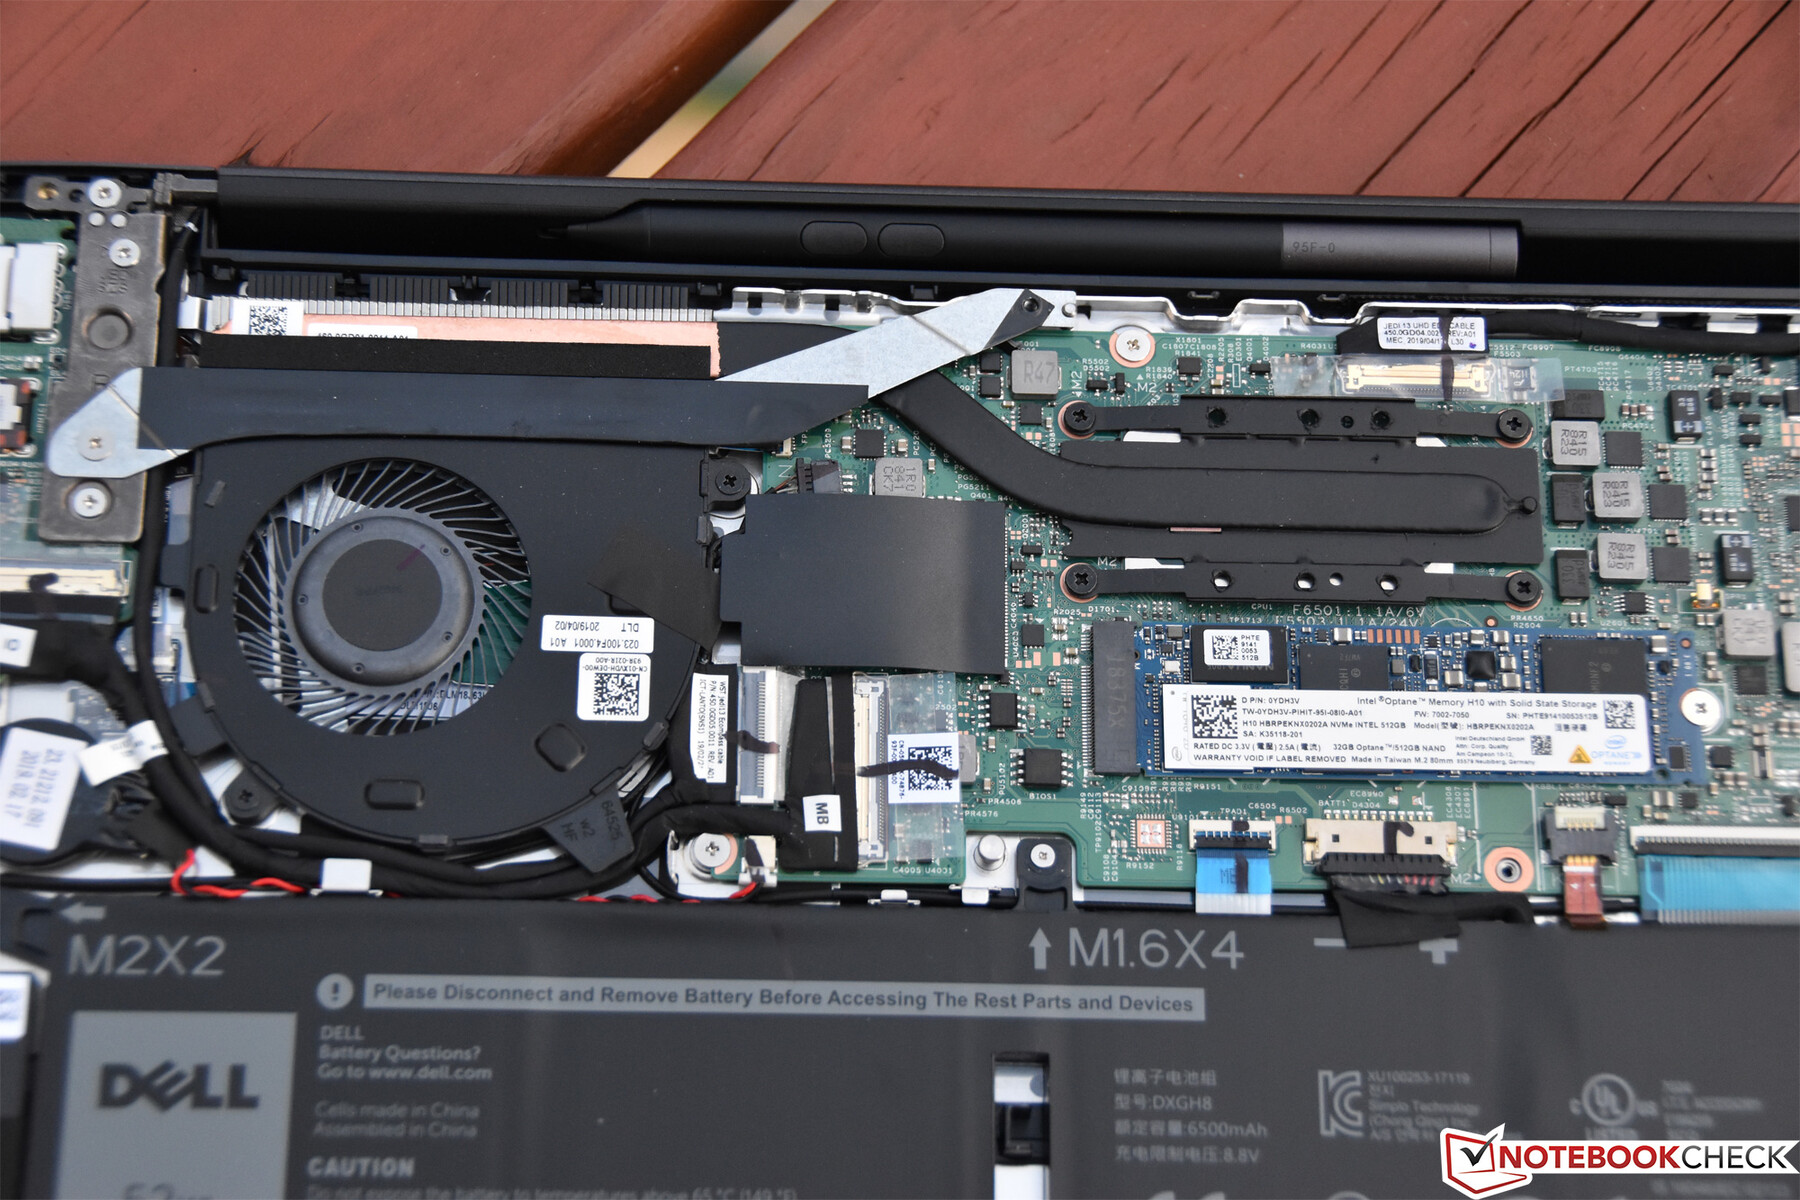
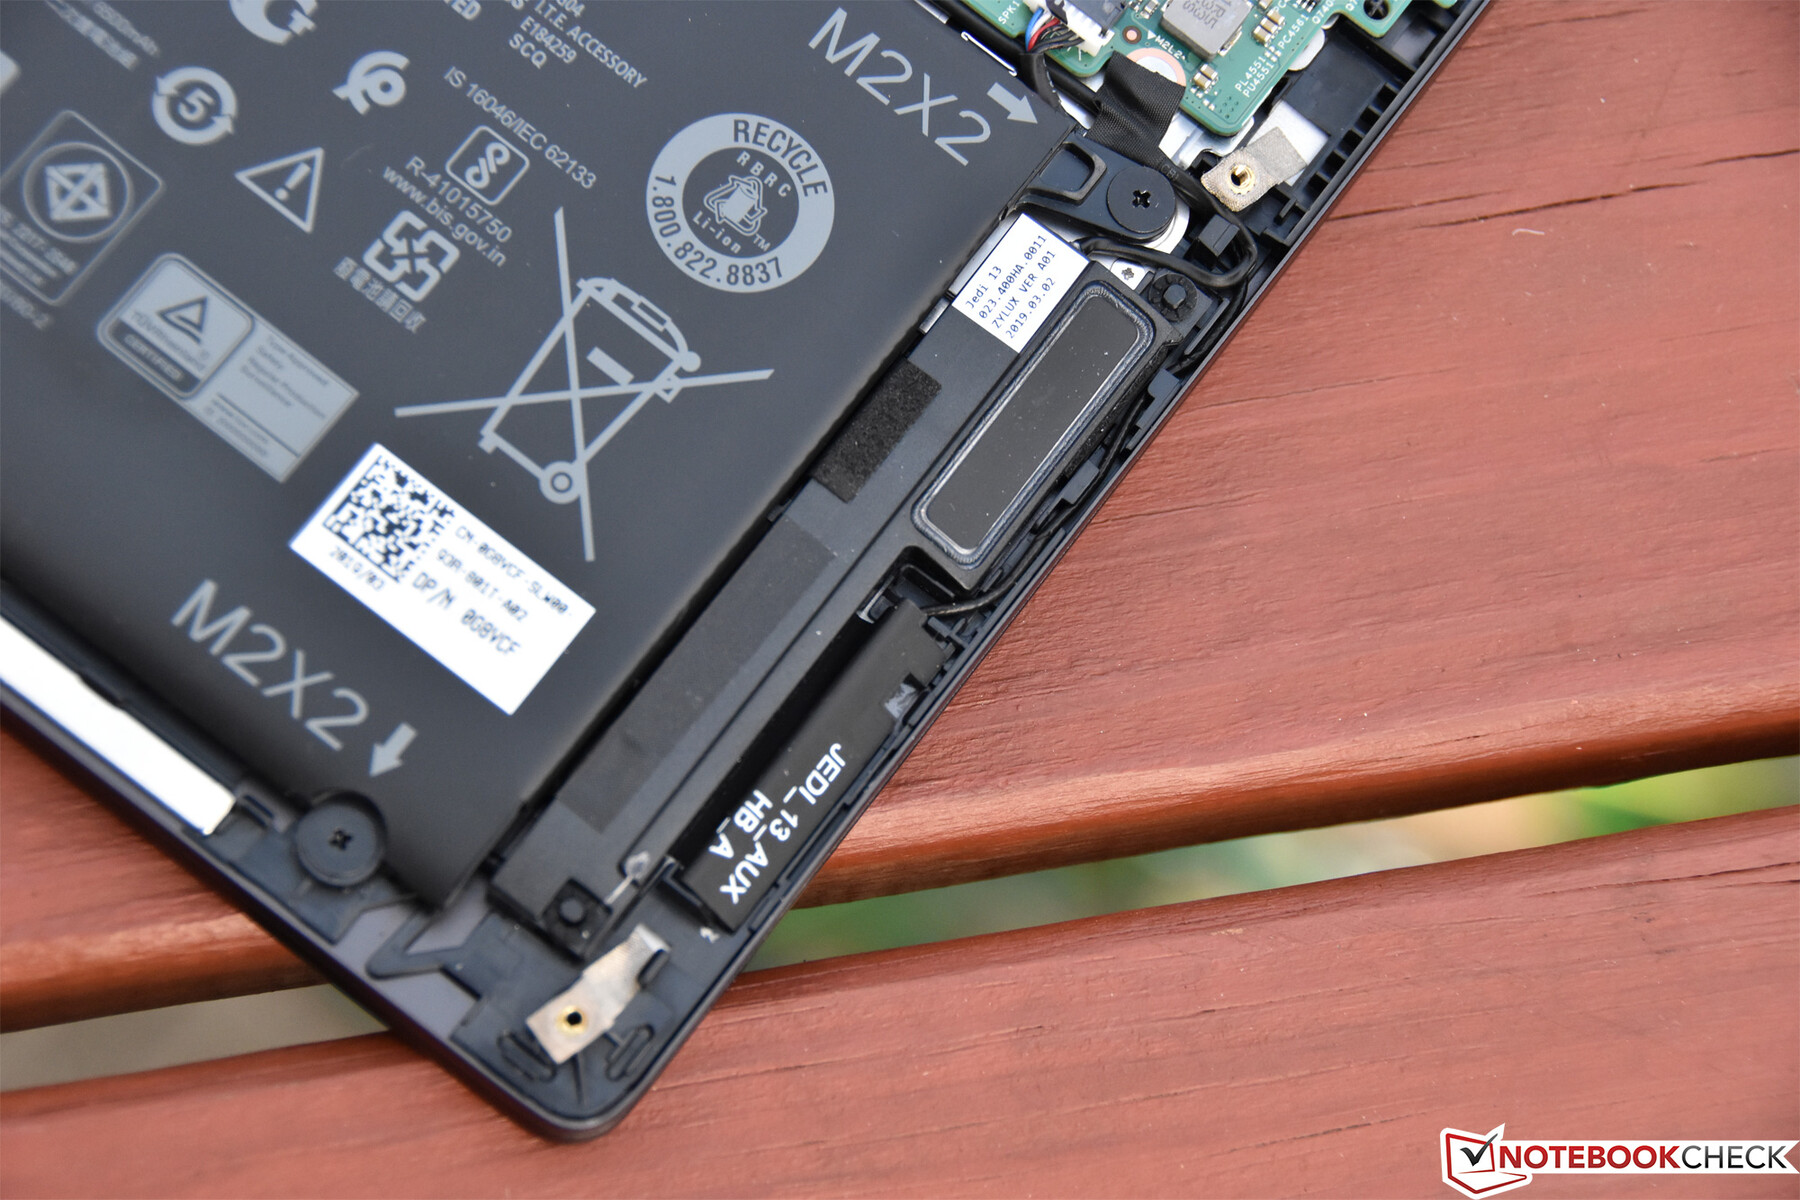
Seven Torx screws secure the bottom panel to the machine, along with a series of perimeter clips. Removal of the panel isn’t too much trouble, but users will need to be very careful not to damage the plastic speaker grills on either side, as they’re quite fragile in comparison to the otherwise metal case. Using a plastic pry tool and avoiding the speakers altogether is a good strategy for this.
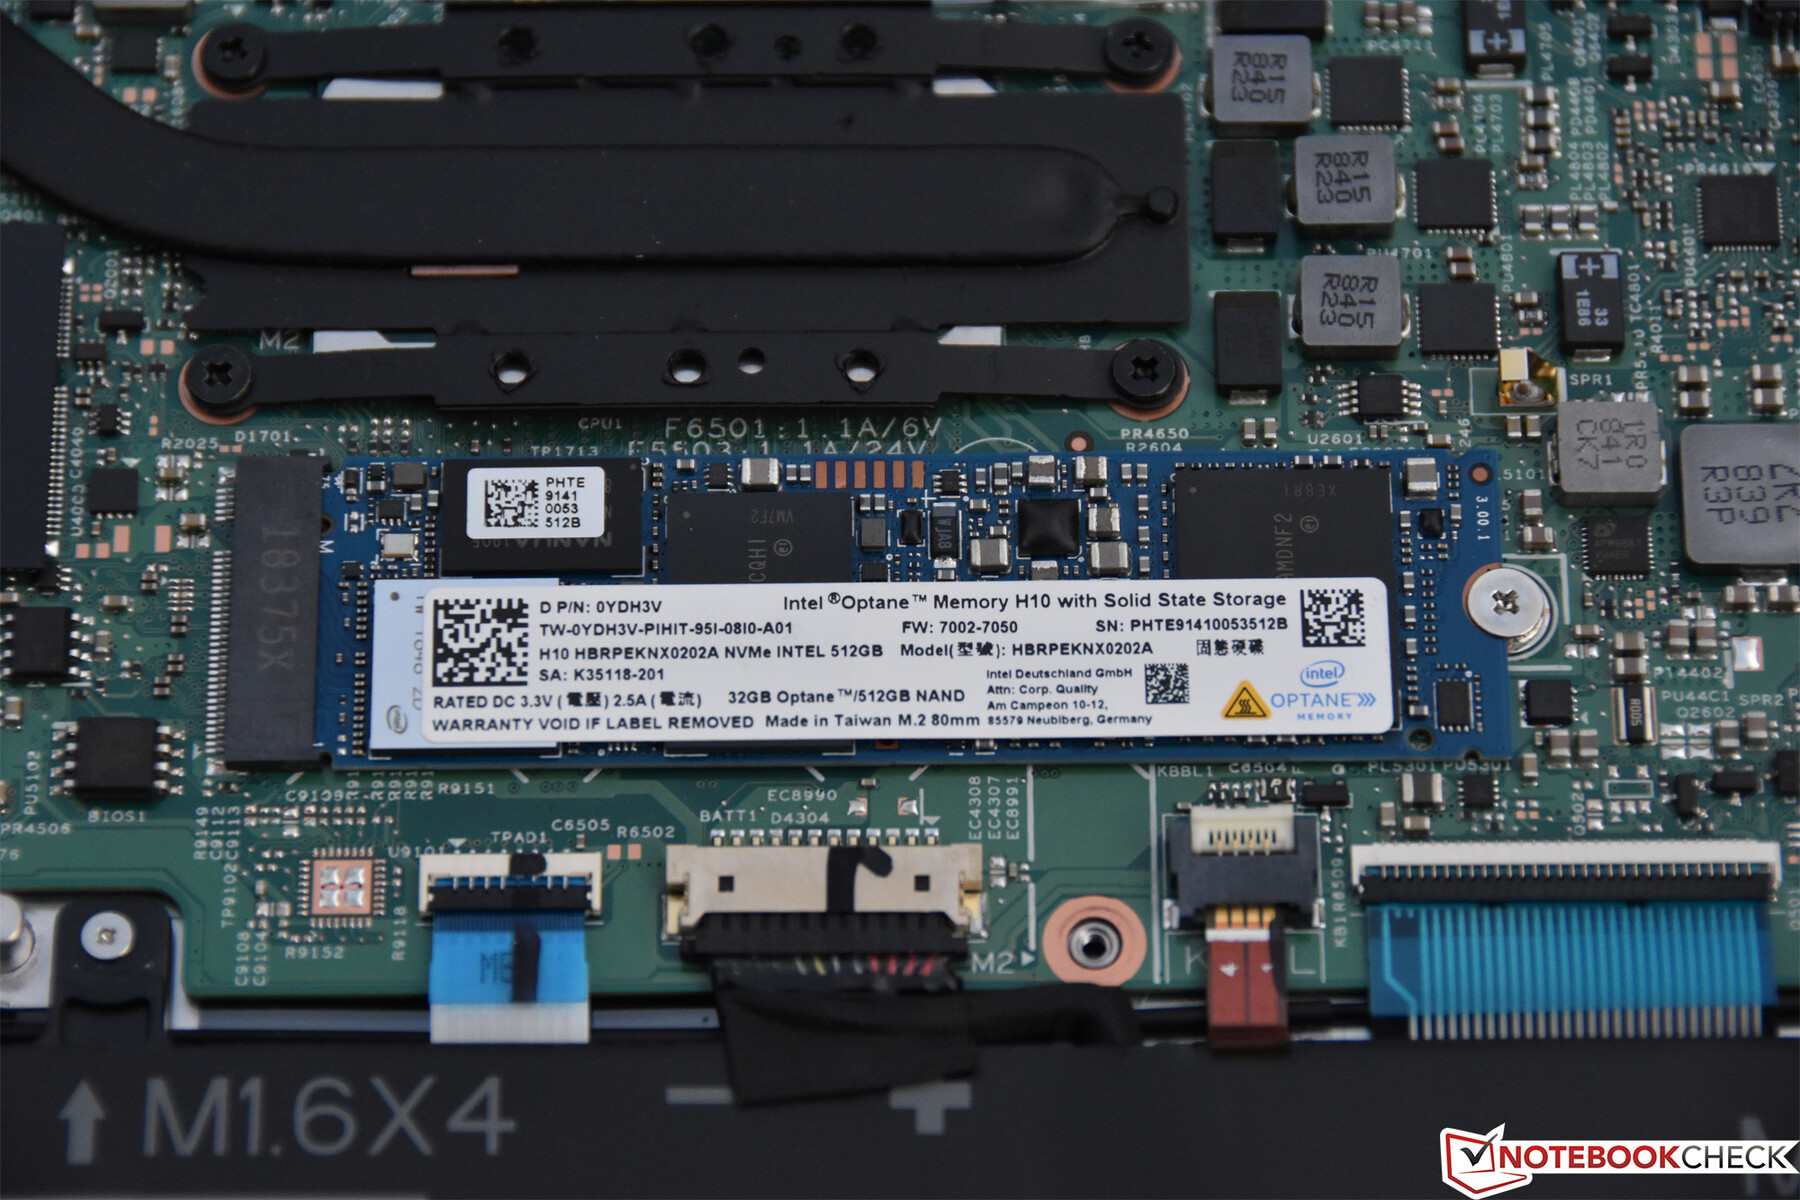
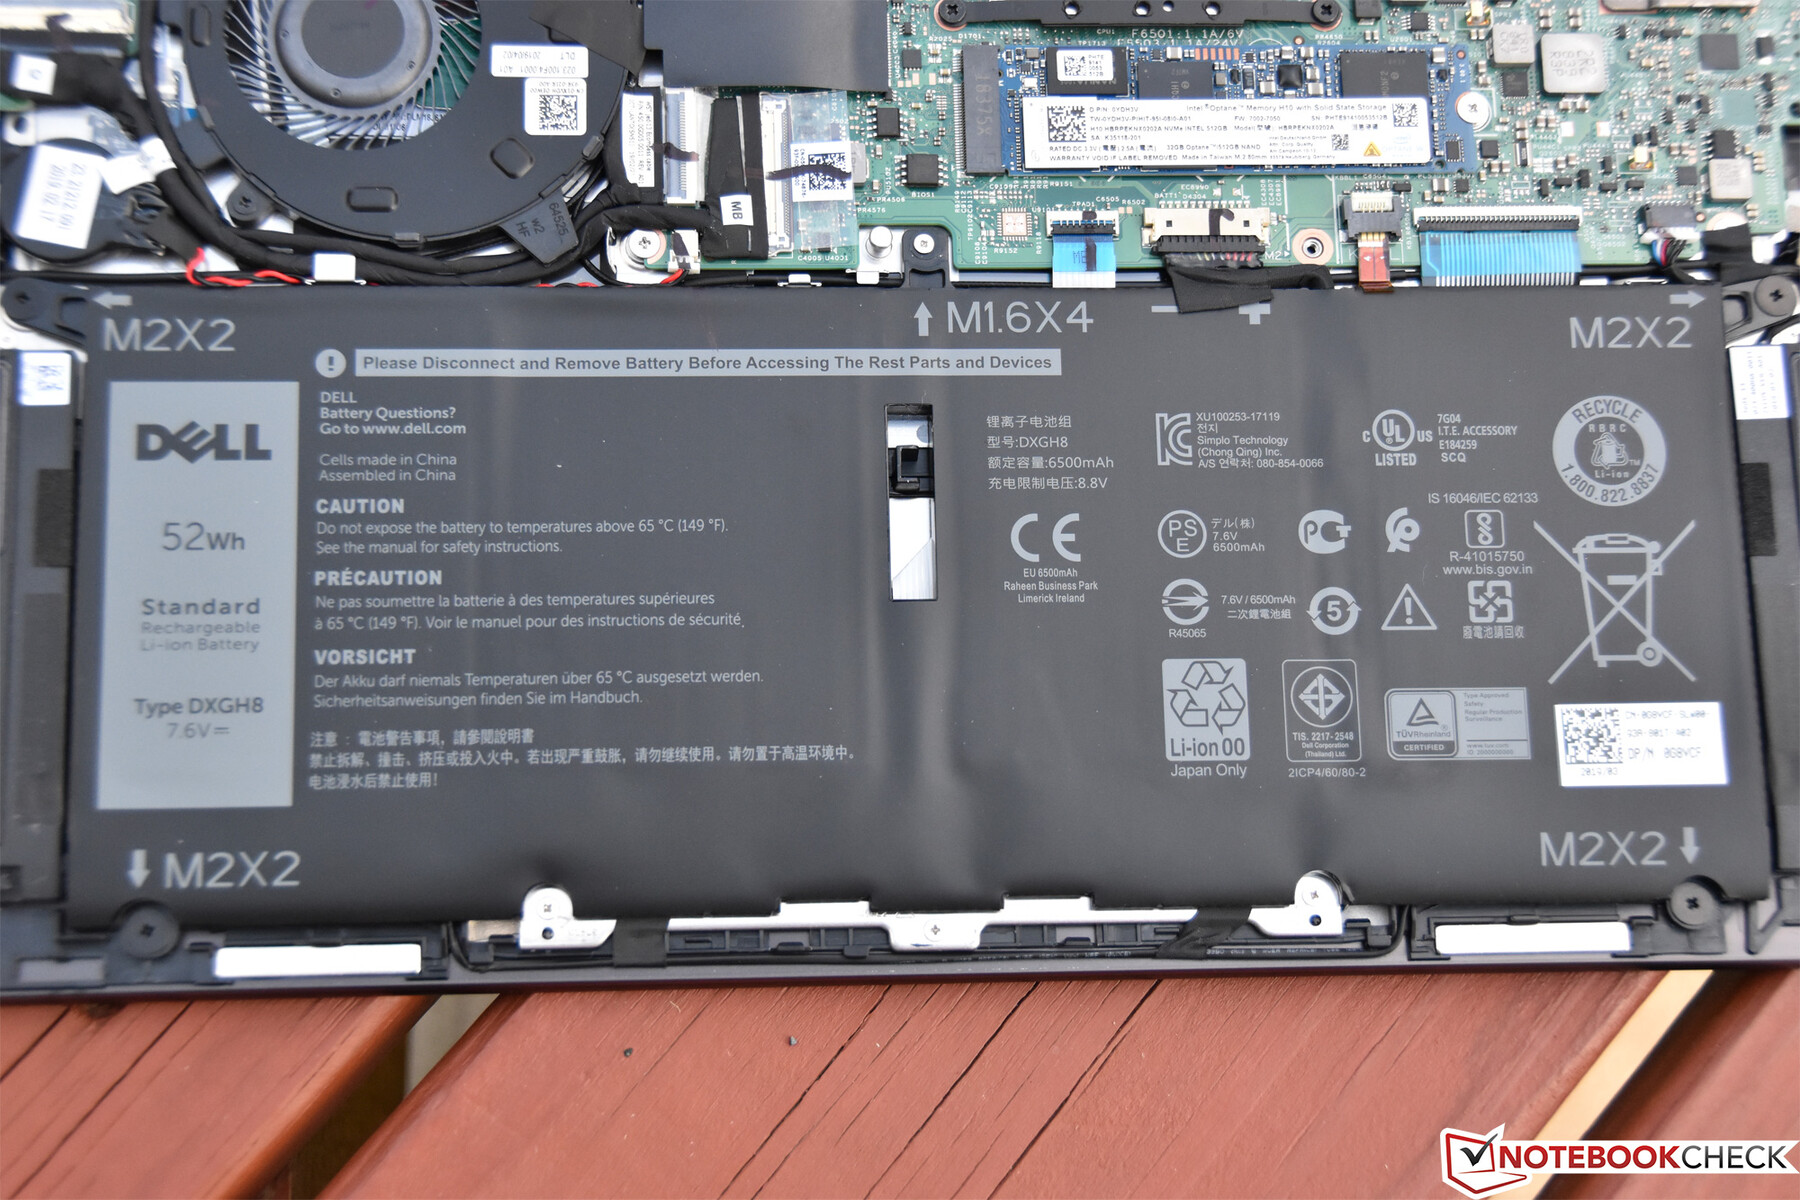
Once inside, the NVMe SSD, heatsink/fan, WLAN adapter, battery, and CMOS battery are all easily replaceable. The LPDDR3 RAM is soldered to the board and cannot be replaced or upgraded.
Warranty
Dell includes a 1-year mail-in warranty with the Inspiron 7390 2-in-1. Typical turnaround times for this service are 3 to 5 business days after the machine is shipped to the depot. Warranty upgrades to on-site service and longer terms, as well as Accidental Damage policies, are available during purchase for an added cost.
Input Devices
Keyboard
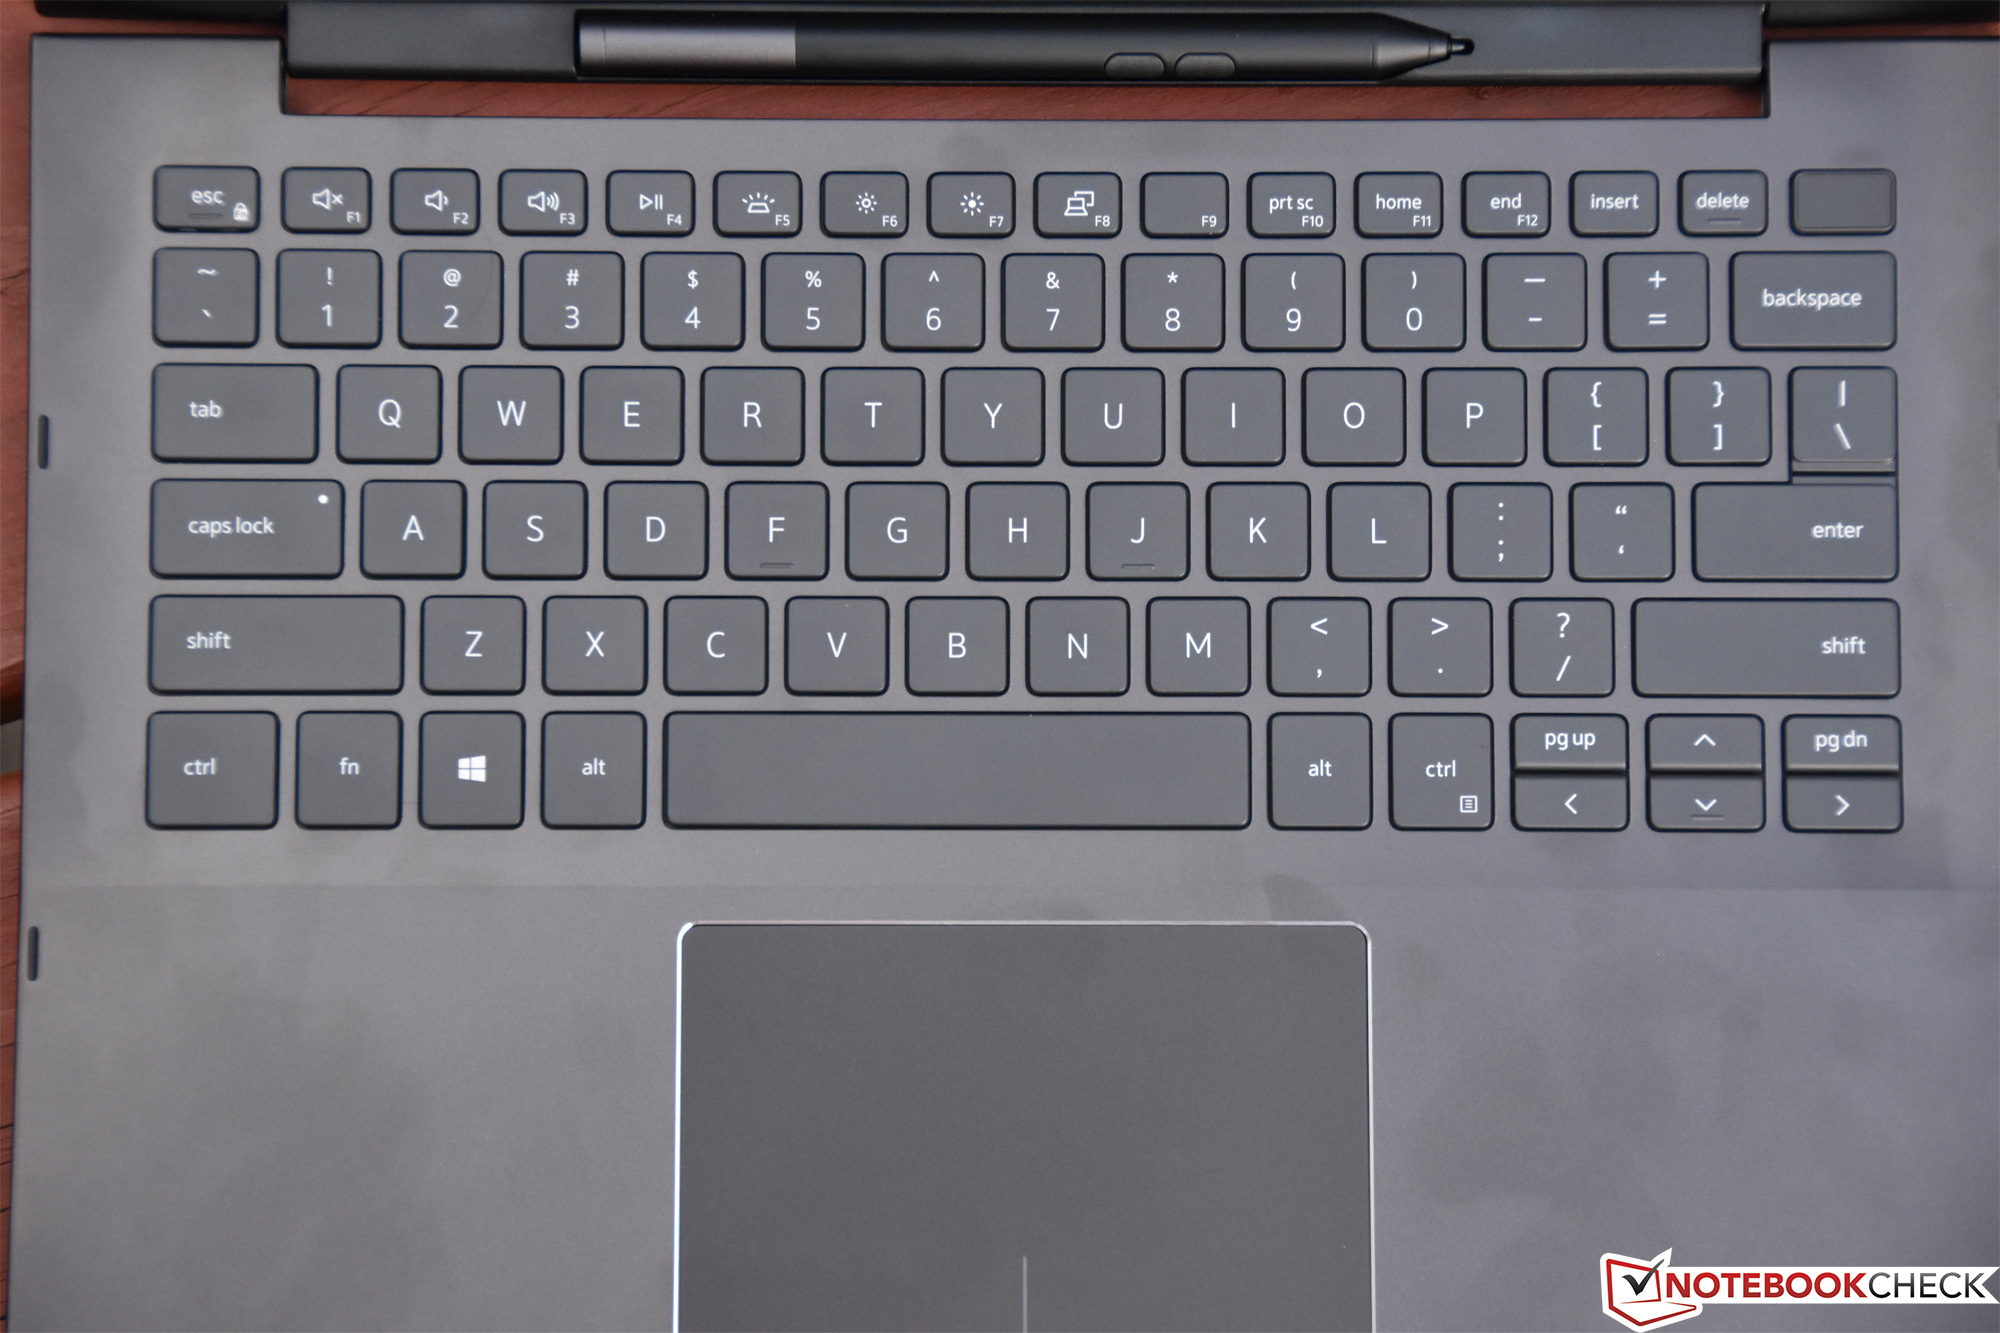
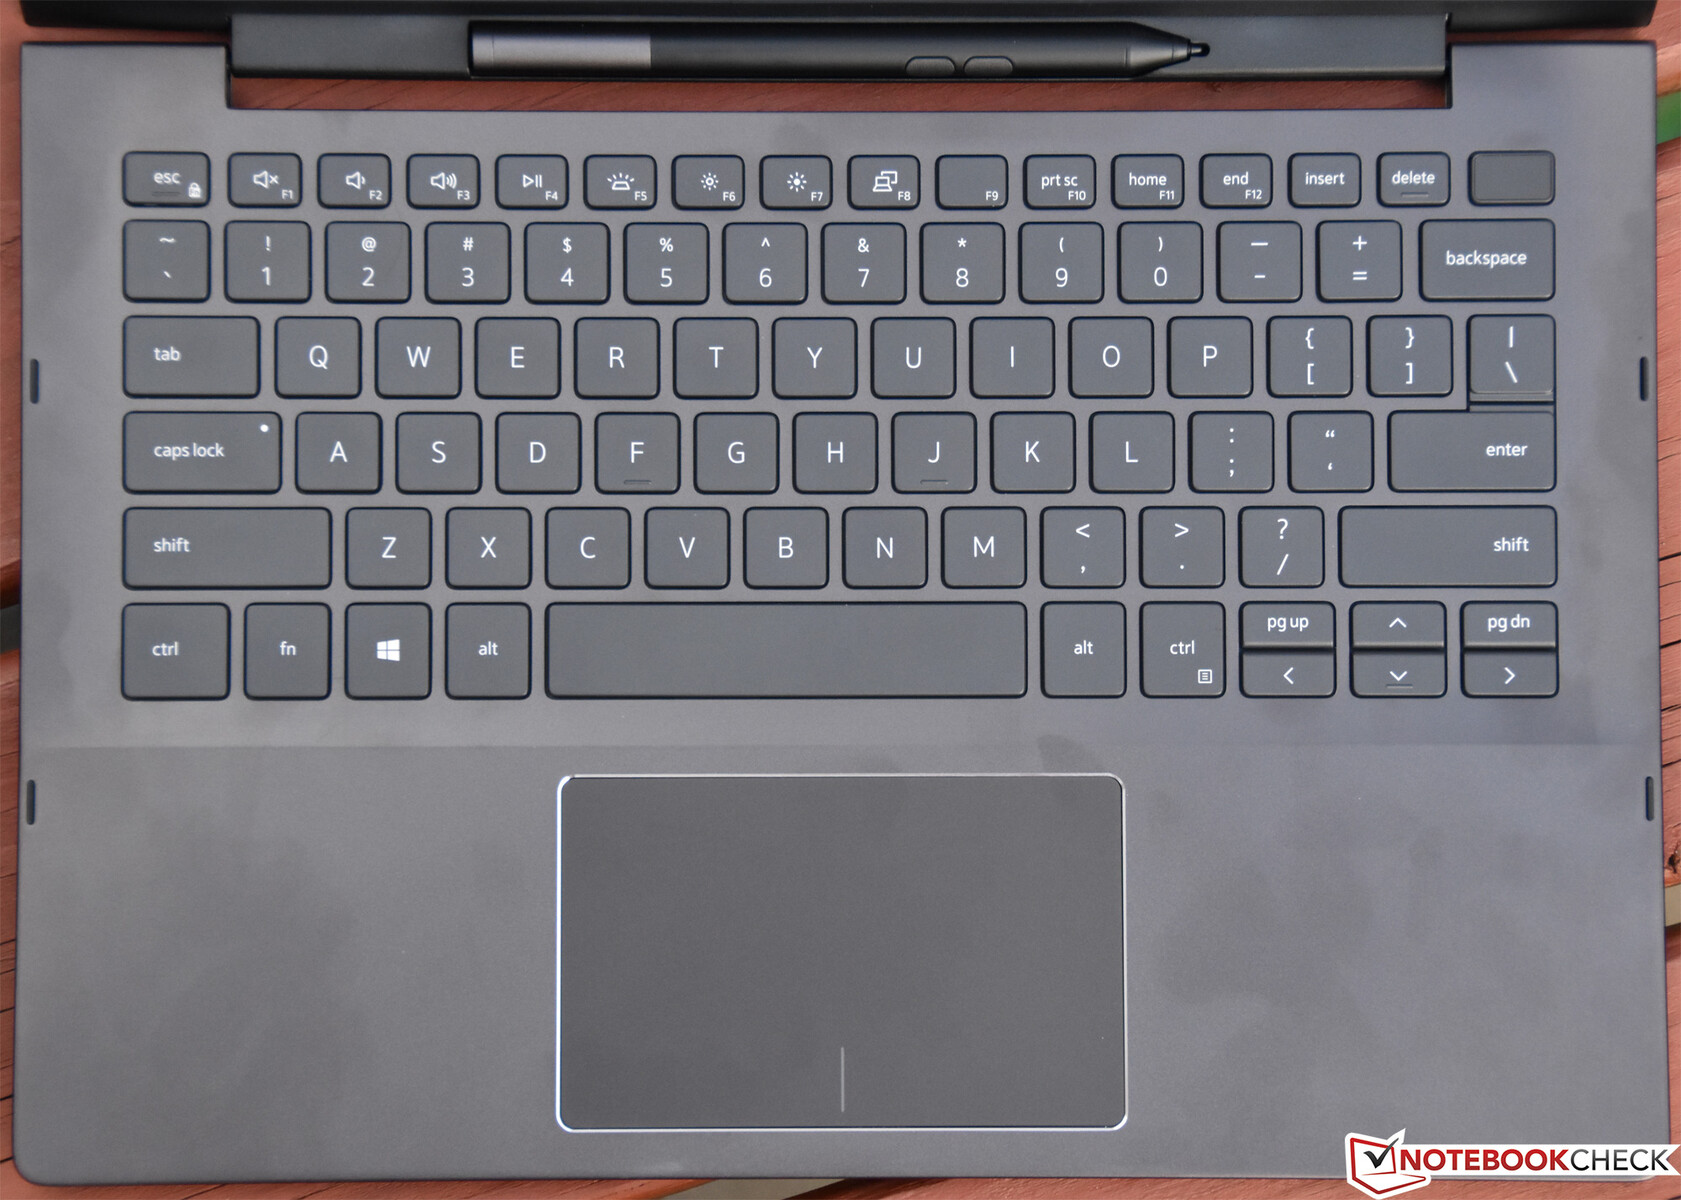
While we prefer the Inspiron 7390 2-in-1’s keyboard layout to that of its predecessor—it separates the PgUp/PgDown keys and reorganizes the function key line to accommodate the power button as the 12th key—the keyboard overall is still a bit spongy compared to superior options such as those found on the XPS and Latitude series. Actuation force is on the higher side, and while feedback is good, the stop on each keypress is somewhat soft, leading to a less decisive typing experience and one which might become a bit tiresome after long periods of operation.
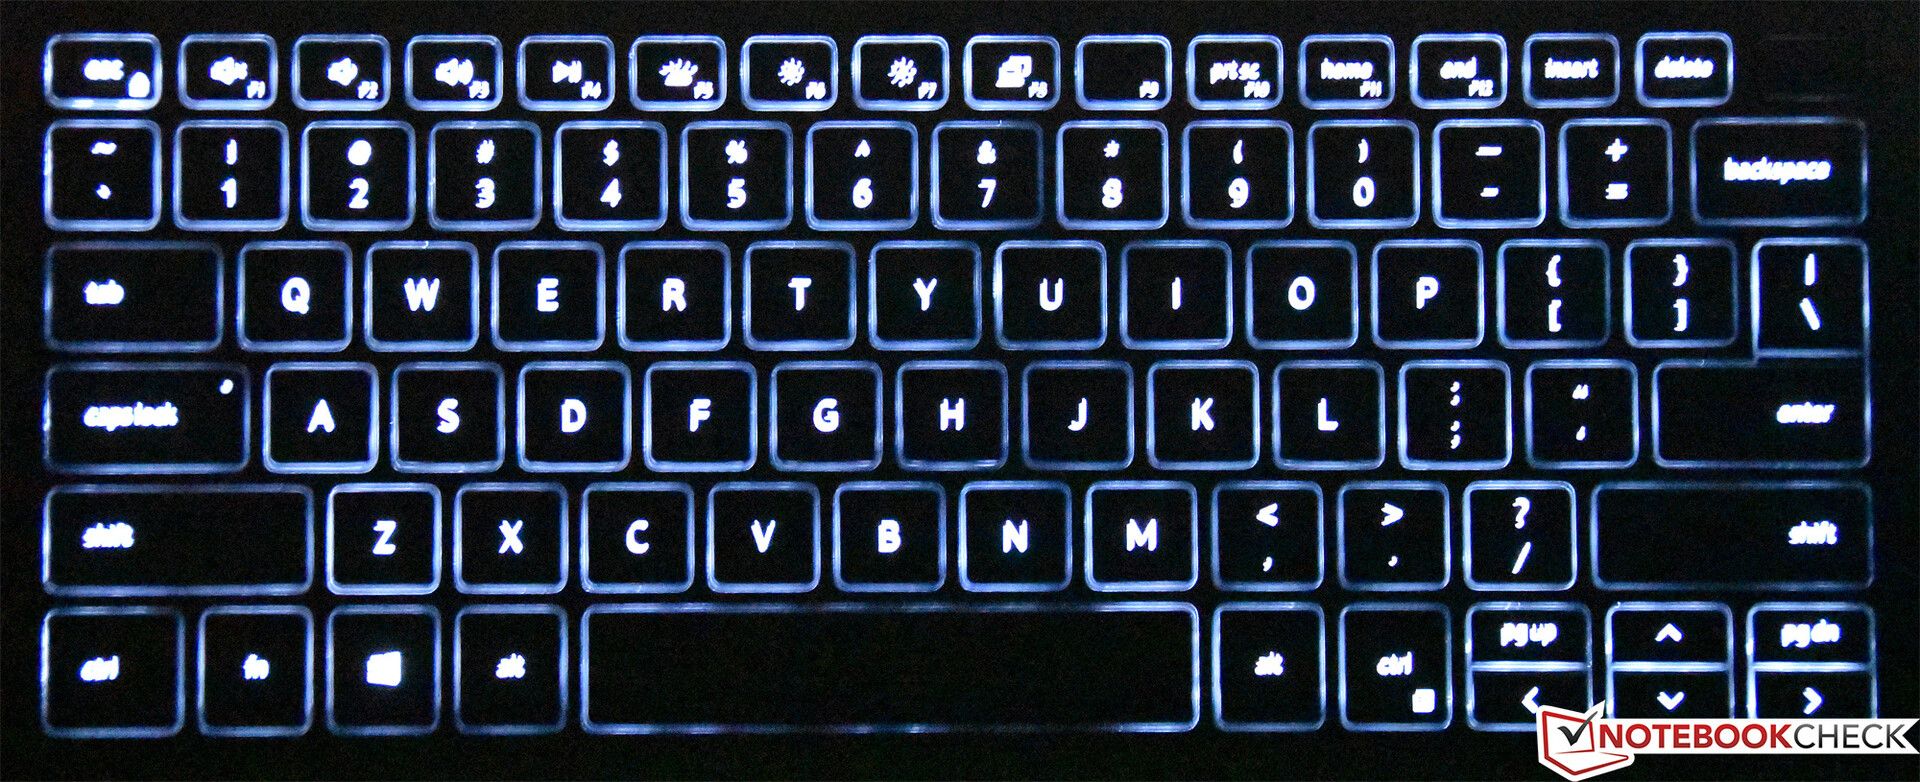
In spite of these quibbles, the keyboard is nevertheless quite good overall, with organization and spacing both comfortable and very little key clatter. Visibility is good thanks to the dark backgrounds and white lettering. The keyboard incorporates a backlight with three total brightness settings: Off, Low, and High.

Touchpad and Touchscreen
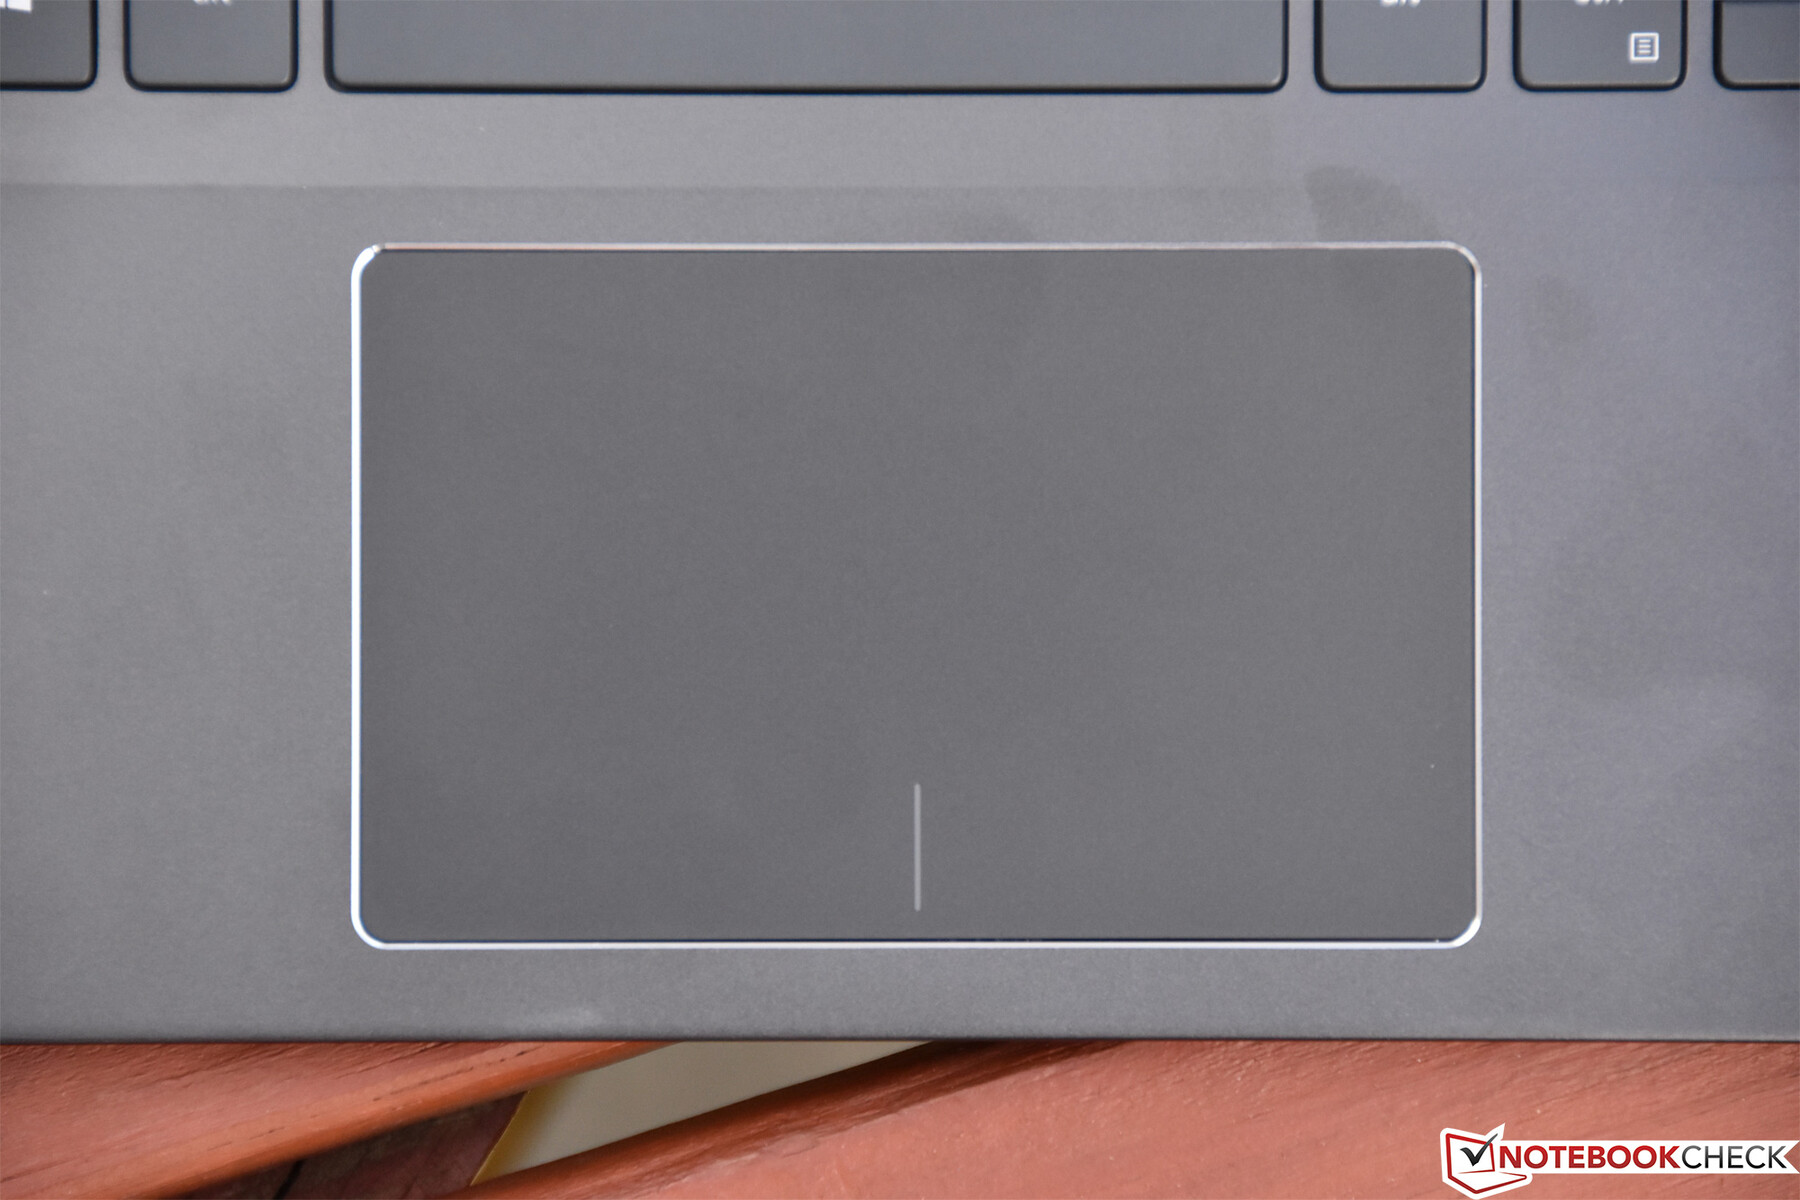
The large touchpad measures 106 x 65 mm and supports Microsoft Precision drivers for lag-free and consistent operation. Multi-finger gestures are reproduced flawlessly and pointer movement is both accurate and reliable even around the perimeter of the pad. The surface is plastic, which isn’t as comfortable as the higher-end glass touchpads found on such models as the XPS series, but finger gliding is nonetheless effortless—provided your fingers are dry. The sole complaint here is the integrated buttons, which generally work as intended, but which require far too much activation force to engage. The initial travel of the buttons is effortful and smooth, before finally terminating in a detectable click. The process is probably twice as arduous as that of depressing a Latitude’s physical touchpad buttons, and far more fatiguing than operating the better clickpads out there (such as those on the Yogas, Spectres, and XPS machines). Users will therefore very likely find themselves commandeering a wireless mouse after spending some time with the Inspiron 7390 2-in-1.
The touchscreen features 10-point multitouch and operates as well as we’d expect. It supports 2048 levels of pressure sensitivity and works seamlessly in conjunction with the included Dell Active Pen.
Display
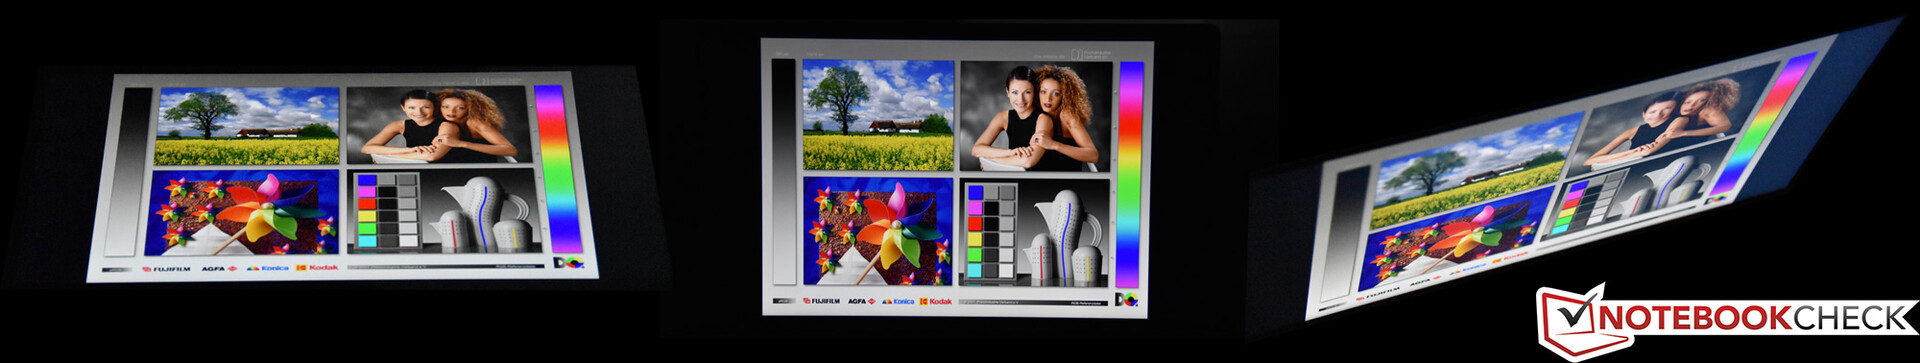
The only display option for the Inspiron 7390 2-in-1 Black Edition is a 13.3-inch 4K/UHD (3840x2160) resolution touchscreen with a glossy finish. The display features a narrow bezel and subjectively good color and contrast, as well as minimal backlight bleed (only a small amount along the bottom border is noticeable). There’s also no detectable graininess, though that’s generally only a problem with anti-glare displays. The narrow bezels around the perimeter of the display make for a pleasantly high-end appearance.
A quick side note: brightness, by default, is lowered while running on battery power due to a feature called EcoPower. In previous years, Dell referred to this as DBC (Dynamic Backlight Control). The feature is not adjustable from within the OS. However, there are a plethora of options within the fancy new UEFI Setup Menu (colloquially referred to as BIOS Setup by many), and one of them is an option, under the Video heading, to disable EcoPower. Bear in mind that doing so will reduce the battery runtimes, but probably not by a substantial amount.

| |||||||||||||||||||||||||
Brightness Distribution: 94 %
Center on Battery: 329.8 cd/m²
Contrast: 1268:1 (Black: 0.26 cd/m²)
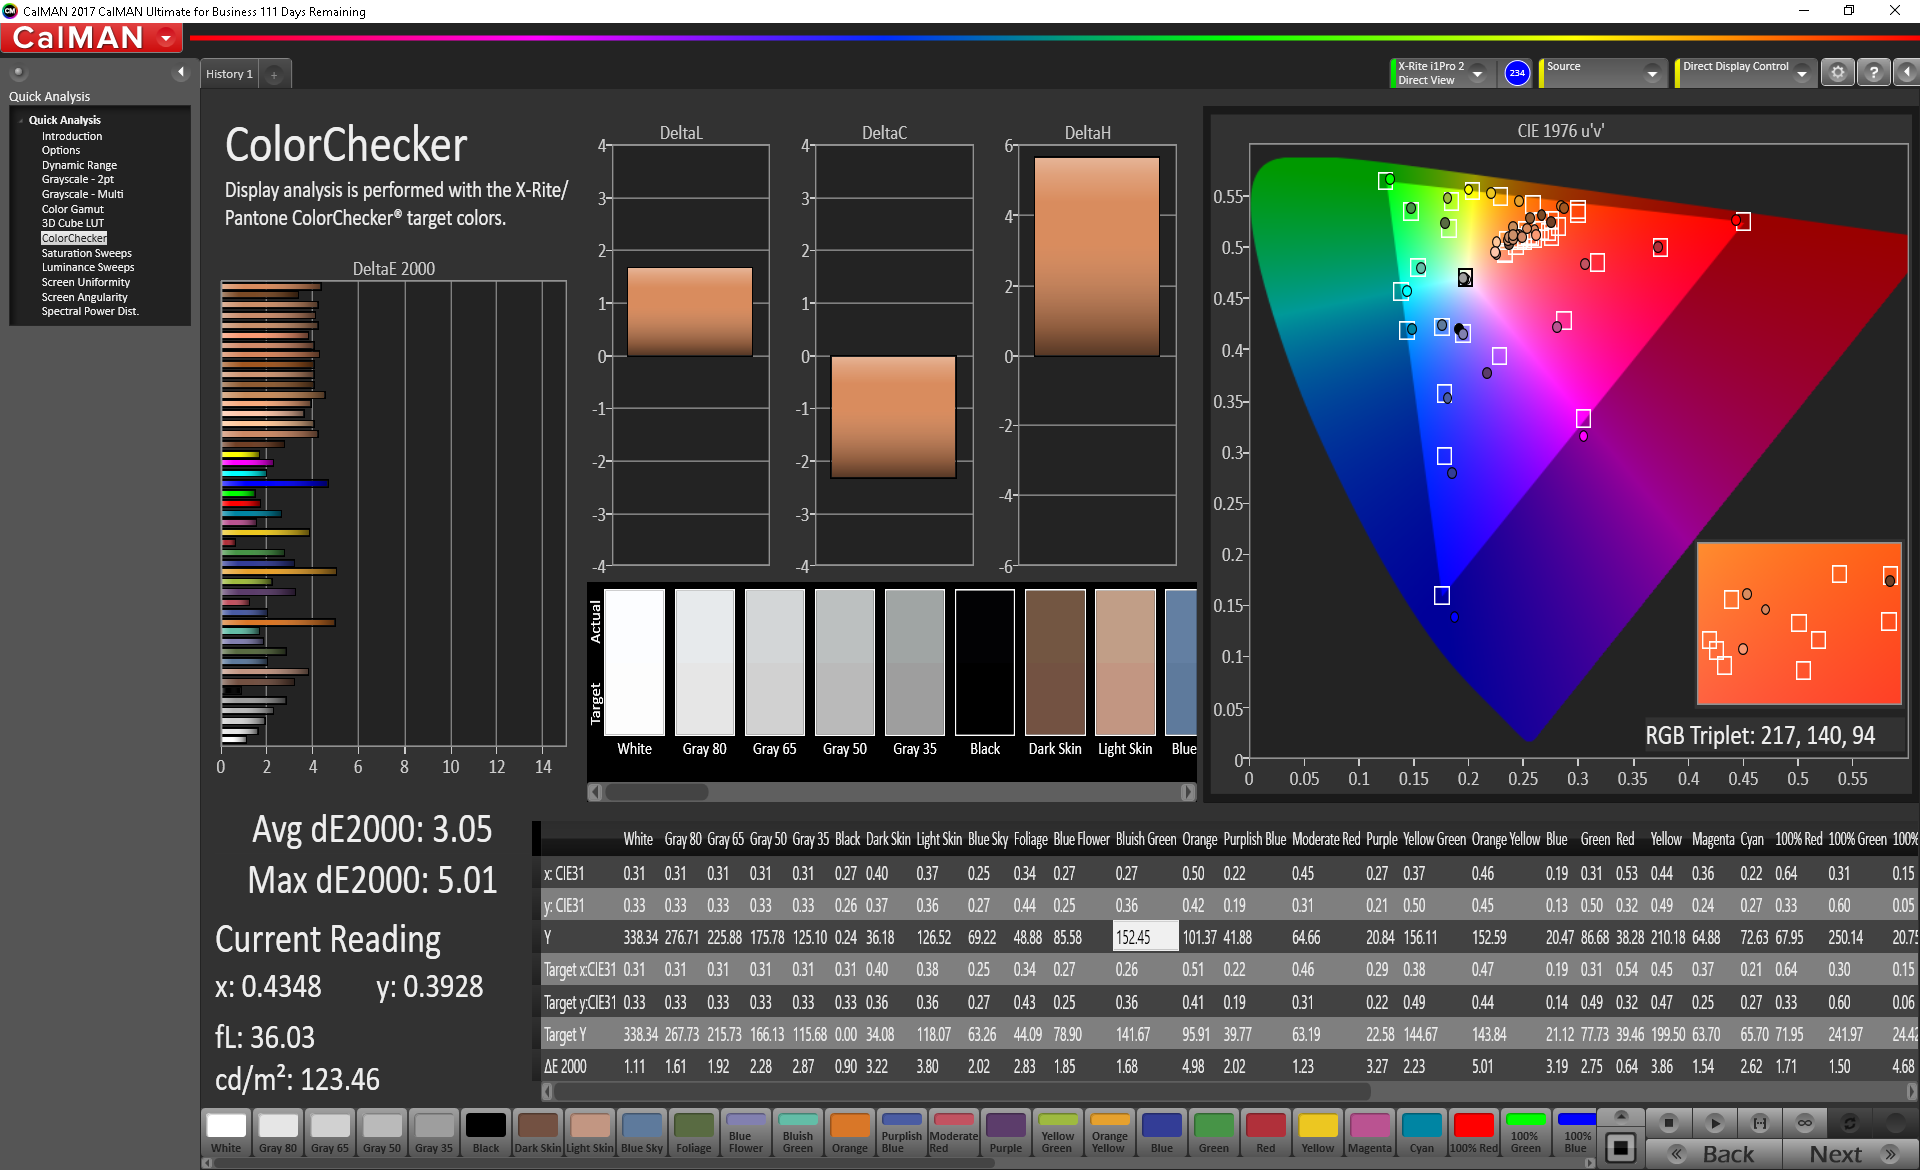
ΔE ColorChecker Calman: 3.05 | ∀{0.5-29.43 Ø4.72}
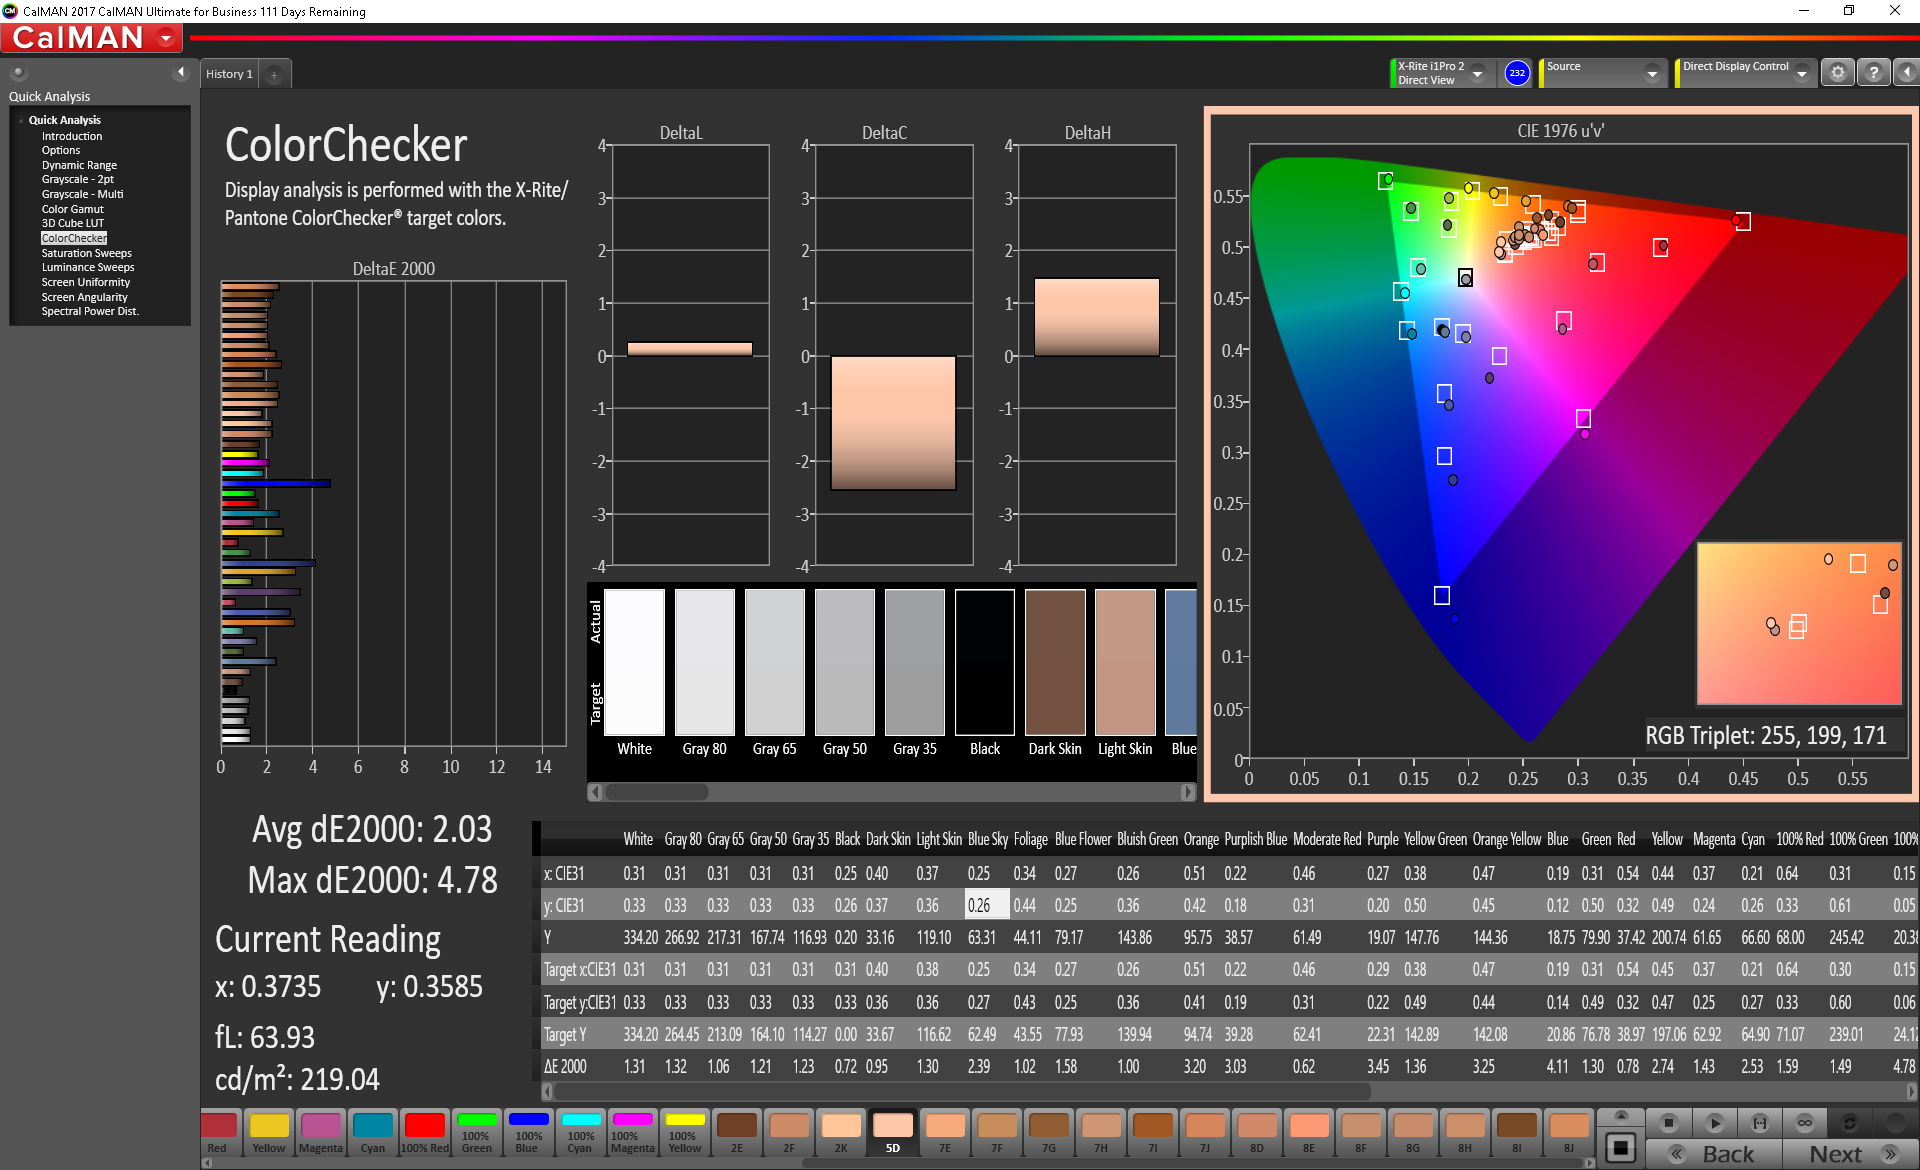
calibrated: 2.03
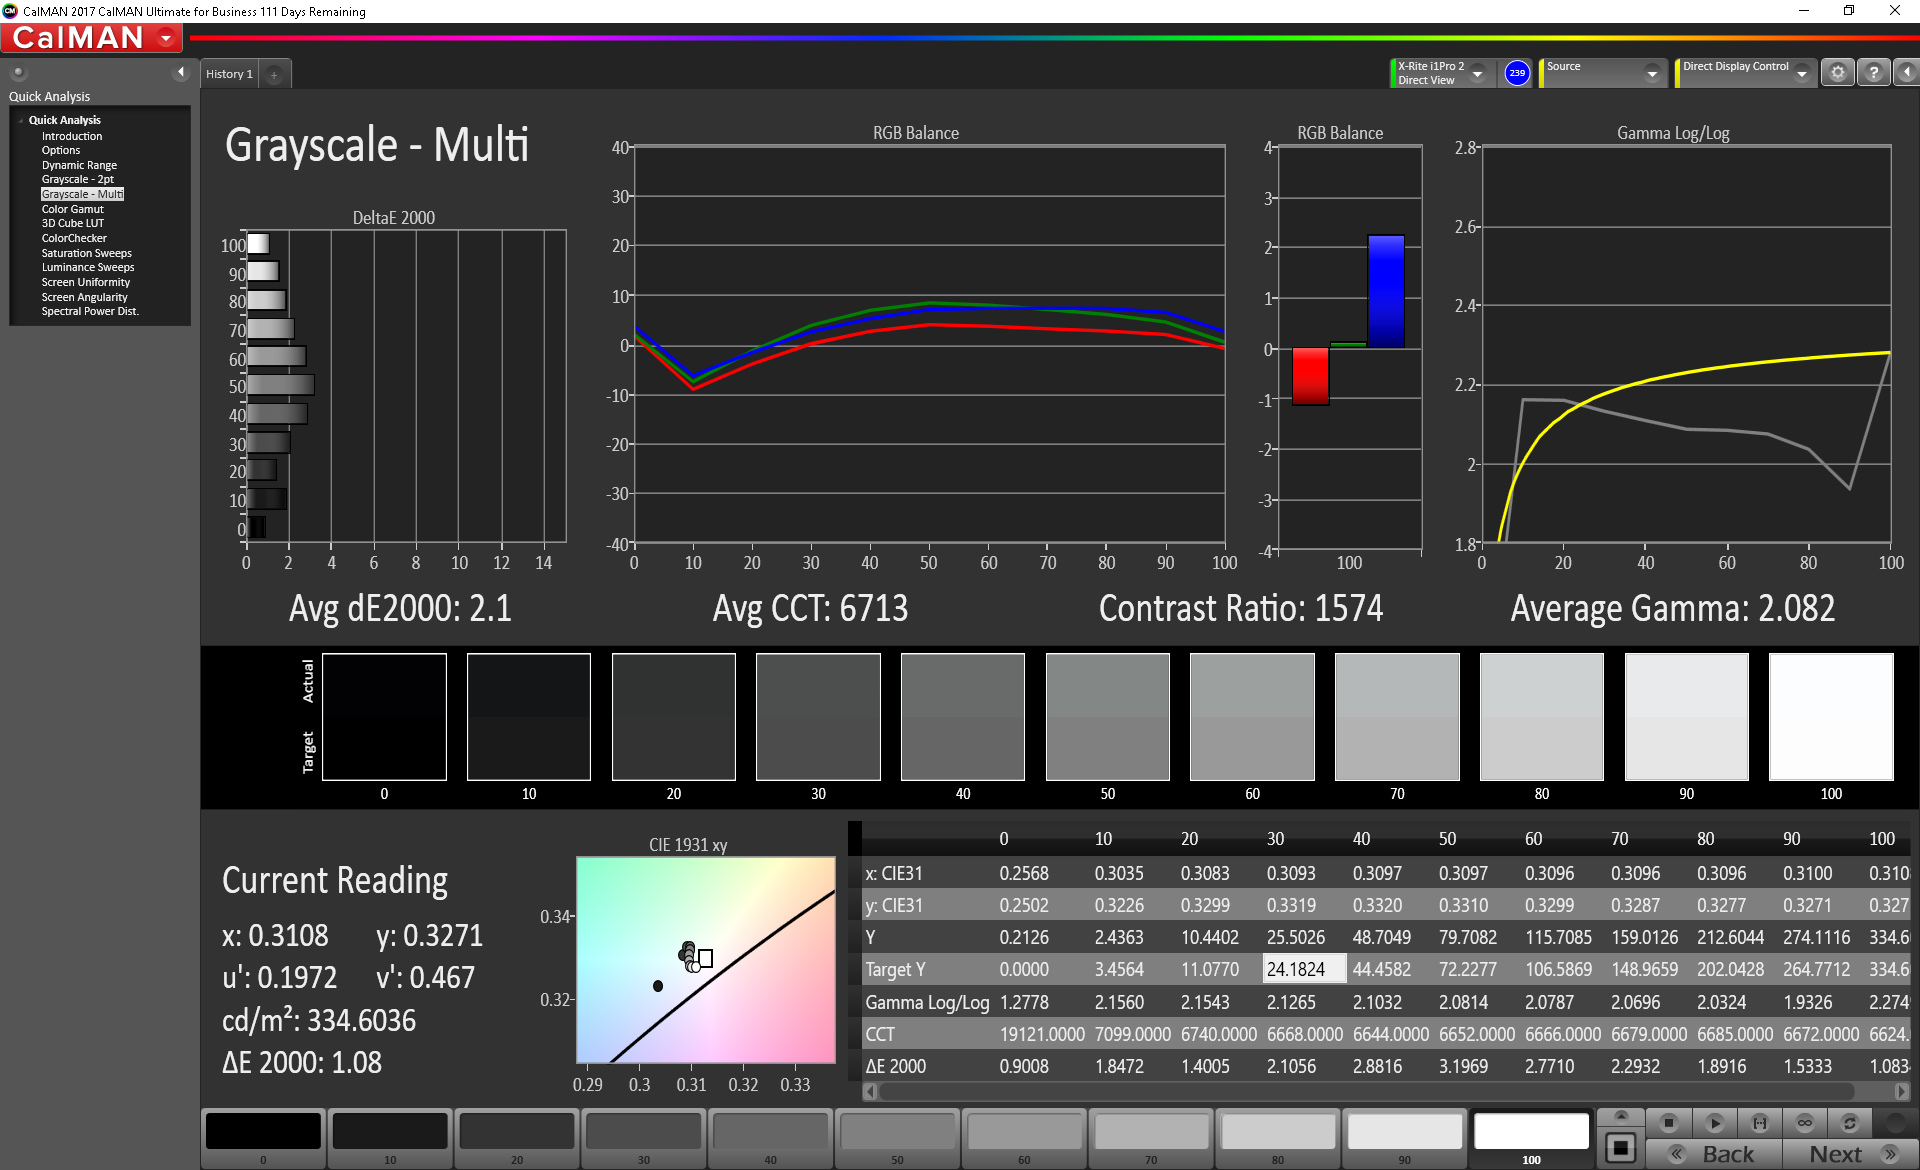
ΔE Greyscale Calman: 2.1 | ∀{0.09-98 Ø4.97}
94% sRGB (Argyll 1.6.3 3D)
61% AdobeRGB 1998 (Argyll 1.6.3 3D)
66.5% AdobeRGB 1998 (Argyll 3D)
94.2% sRGB (Argyll 3D)
65.6% Display P3 (Argyll 3D)
Gamma: 2.082
CCT: 6713 K
| Dell Inspiron 7390 2-in-1 AUO252B, IPS, 13.3", 3840x2160 | Lenovo ThinkPad X1 Yoga 2019-20QGS00A00 B140HAN05.8, IPS LED, 14", 1920x1080 | HP Envy x360 13-ar0601ng InfoVision, M133NVF3 R2, IPS, 120 Hz, 13.3", 1920x1080 | Lenovo ThinkPad X390 Yoga-20NQS05R00 LP133WF7-SPA1, IPS LED, 13.3", 1920x1080 | Dell Latitude 7400 2-in-1 SHP14A2, IPS, 14", 1920x1080 | Dell Inspiron 13 7386 Chi Mei CMN1385 / 133DCE / Dell 3GRT6, IPS, 13.3", 3840x2160 | |
|---|---|---|---|---|---|---|
| Display | 3% | -4% | 1% | 5% | 5% | |
| Display P3 Coverage (%) | 65.6 | 67.1 2% | 63 -4% | 65.2 -1% | 68.6 5% | 68.2 4% |
| sRGB Coverage (%) | 94.2 | 98.2 4% | 90.8 -4% | 97 3% | 99.6 6% | 99.8 6% |
| AdobeRGB 1998 Coverage (%) | 66.5 | 68.9 4% | 63.8 -4% | 67.3 1% | 70 5% | 70 5% |
| Response Times | -2% | 40% | 7% | 0% | 10% | |
| Response Time Grey 50% / Grey 80% * (ms) | 56.4 ? | 61.6 ? -9% | 35 ? 38% | 59.2 ? -5% | 56 ? 1% | 57 ? -1% |
| Response Time Black / White * (ms) | 37.6 ? | 35.2 ? 6% | 22 ? 41% | 30.8 ? 18% | 38 ? -1% | 30 ? 20% |
| PWM Frequency (Hz) | 4065 ? | 1667 ? | 26000 ? | |||
| Screen | -14% | -5% | -32% | -0% | -11% | |
| Brightness middle (cd/m²) | 329.8 | 372 13% | 633 92% | 319 -3% | 277.2 -16% | 318 -4% |
| Brightness (cd/m²) | 325 | 368 13% | 675 108% | 306 -6% | 263 -19% | 278 -14% |
| Brightness Distribution (%) | 94 | 88 -6% | 75 -20% | 90 -4% | 83 -12% | 81 -14% |
| Black Level * (cd/m²) | 0.26 | 0.22 15% | 0.55 -112% | 0.15 42% | 0.2 23% | 0.18 31% |
| Contrast (:1) | 1268 | 1691 33% | 1151 -9% | 2127 68% | 1386 9% | 1767 39% |
| Colorchecker dE 2000 * | 3.05 | 4.6 -51% | 3.12 -2% | 6.1 -100% | 2.1 31% | 2.91 5% |
| Colorchecker dE 2000 max. * | 5.01 | 7.8 -56% | 6.37 -27% | 9.7 -94% | 5.91 -18% | 6.11 -22% |
| Colorchecker dE 2000 calibrated * | 2.03 | 0.9 56% | 1.83 10% | 1 51% | 1.03 49% | 2.91 -43% |
| Greyscale dE 2000 * | 2.1 | 5.9 -181% | 3.89 -85% | 8.6 -310% | 3.4 -62% | 4.37 -108% |
| Gamma | 2.082 106% | 2.58 85% | 2.39 92% | 2.62 84% | 2.241 98% | 2.26 97% |
| CCT | 6713 97% | 6516 100% | 6476 100% | 6613 98% | 6030 108% | 6448 101% |
| Color Space (Percent of AdobeRGB 1998) (%) | 61 | 62.7 3% | 59 -3% | 61.9 1% | 64 5% | 70 15% |
| Color Space (Percent of sRGB) (%) | 94 | 97.8 4% | 91 -3% | 96.8 3% | 100 6% | 93 -1% |
| Total Average (Program / Settings) | -4% /
-9% | 10% /
1% | -8% /
-21% | 2% /
1% | 1% /
-5% |
* ... smaller is better
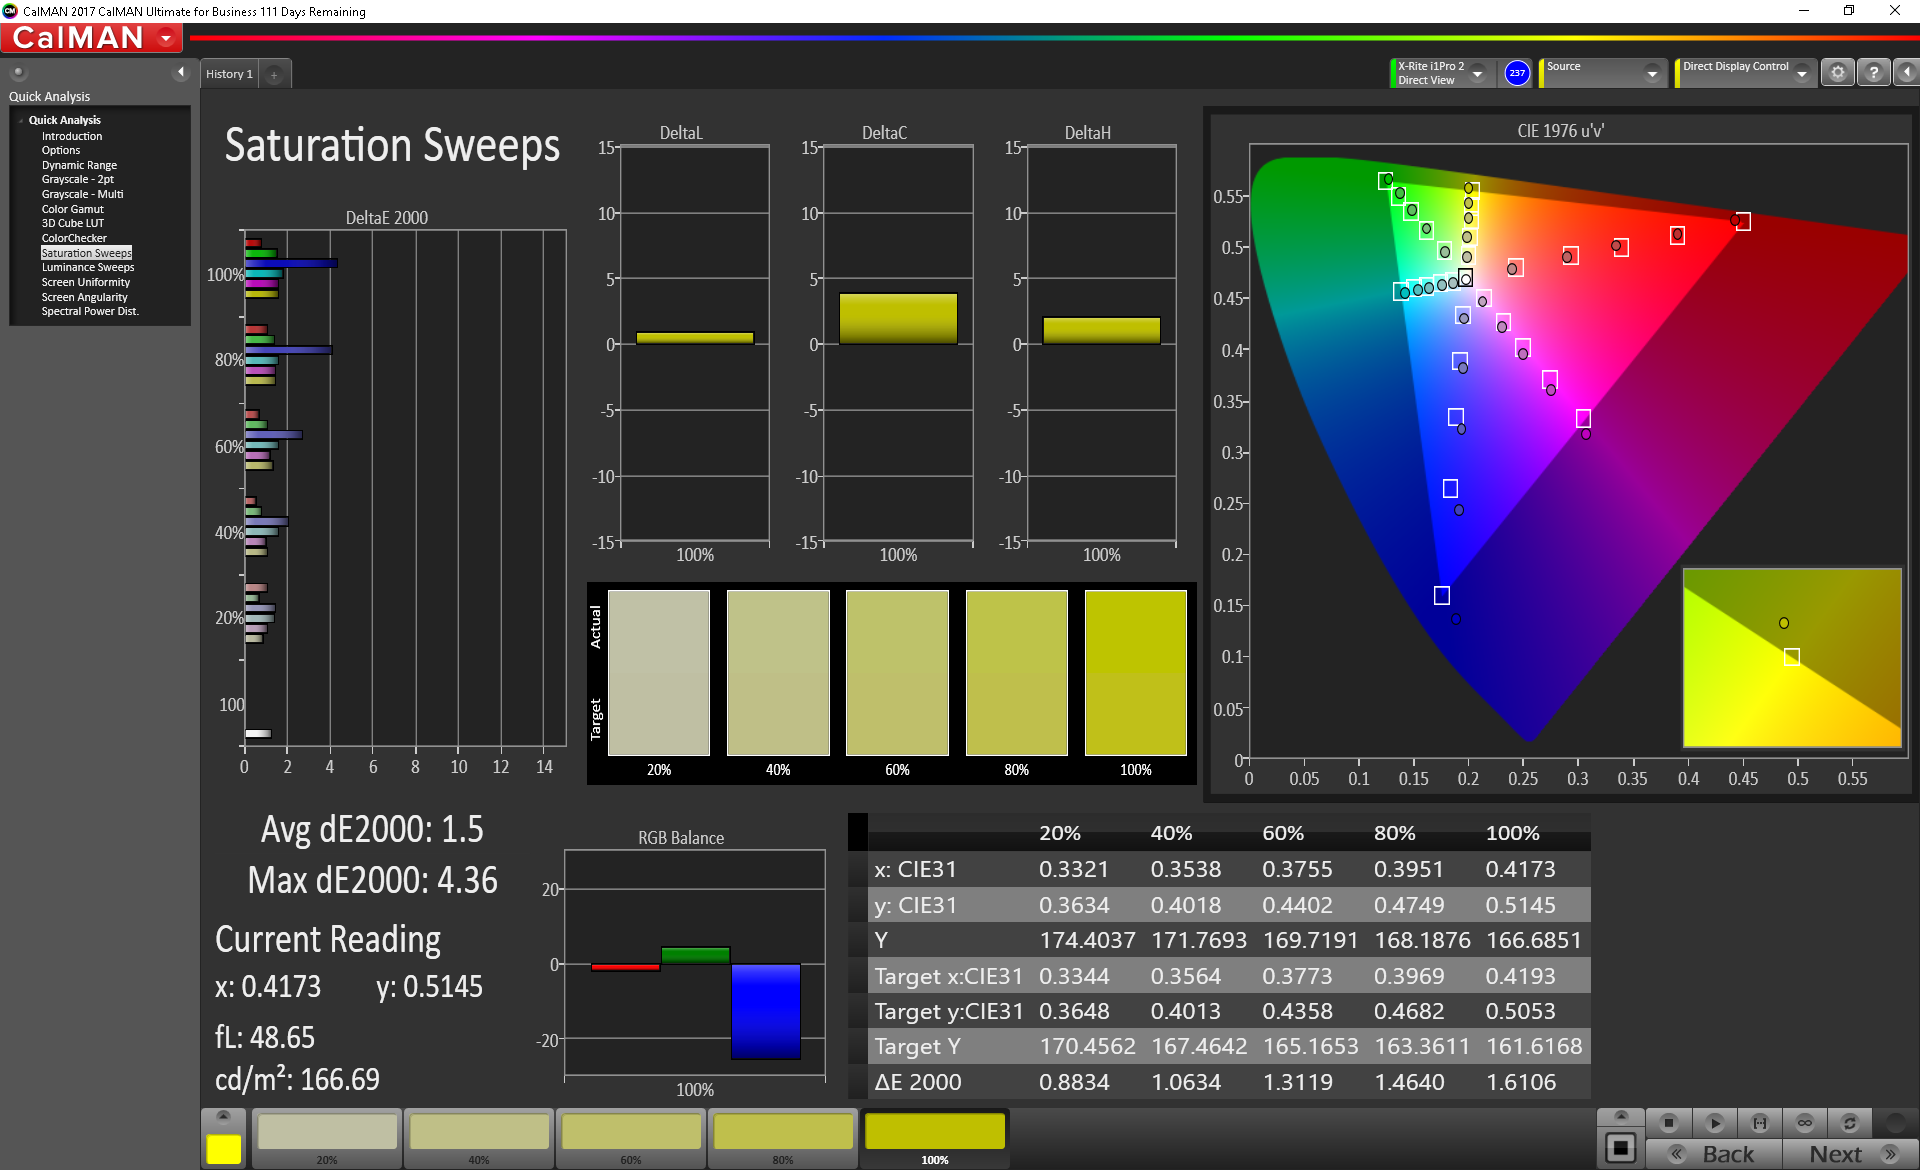
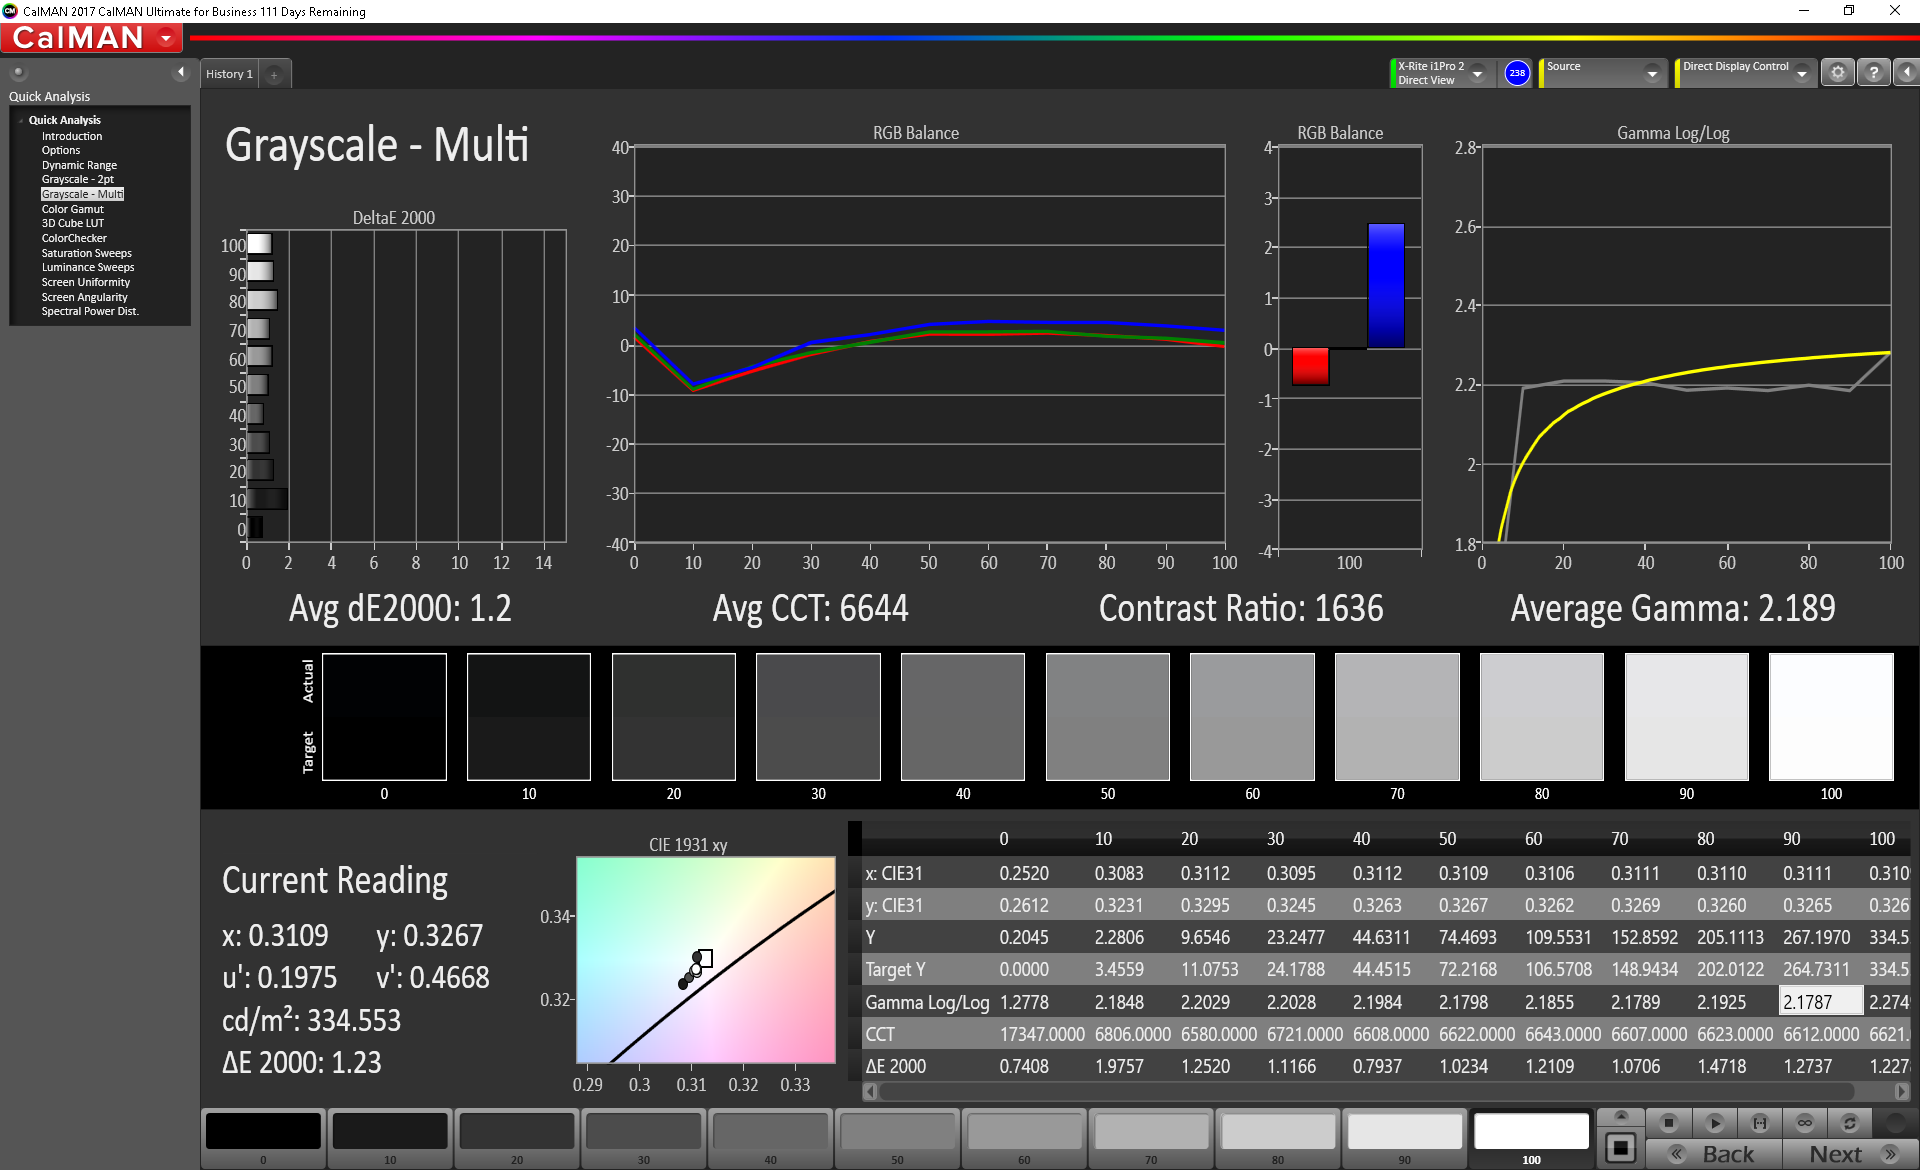
We measure 325 cd/m² average brightness from the AUO panel, which is brighter than the 278 cd/m² from the Inspiron 7386 previously. Contrast, alongside the black level of 0.26 cd/m², is a comparably lower 1268:1, but that’s still very good. We also detect a more consistent brightness across the panel—a distribution of 94% versus the 81% of the predecessor. Most machines fall into this same range of values, with only the HP Envy x360 13 massively outstripping the competition with a stunning 675 cd/m² brightness.
Our color spectrum measurements reveal 94% coverage of sRGB and 61% of AdobeRGB, which is about average for this class of machine.

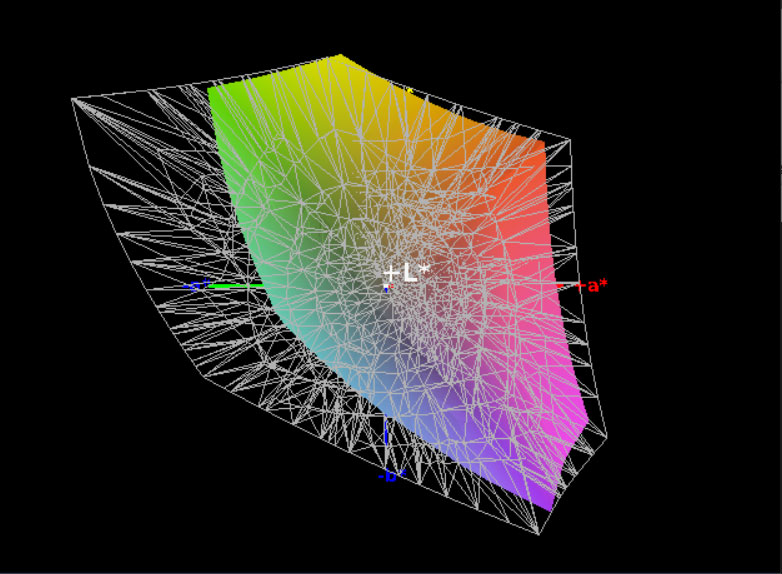
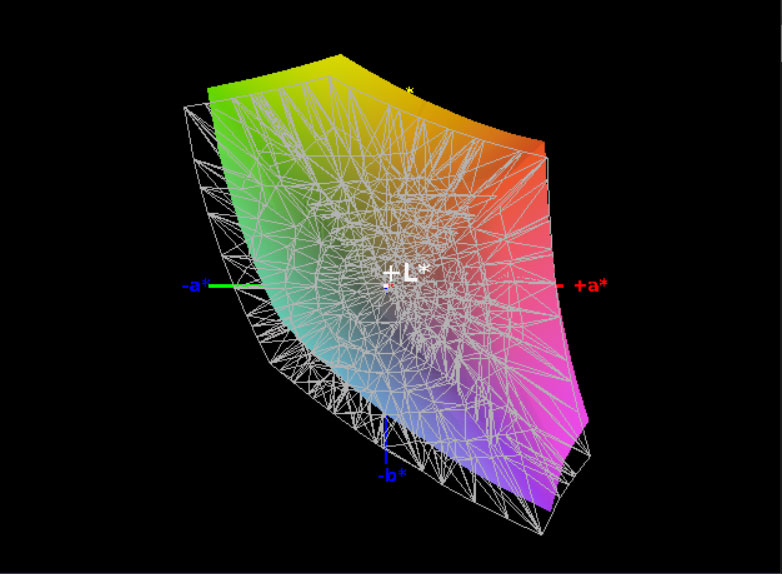
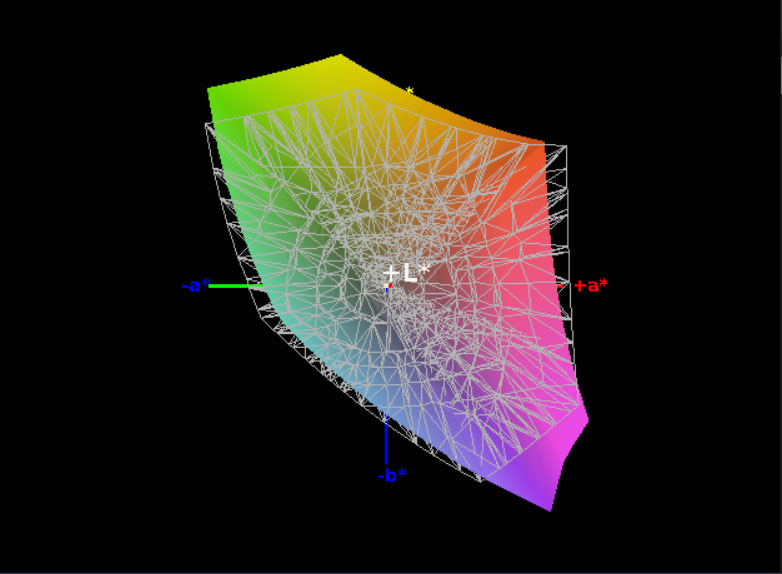

Color accuracy is also very good overall, with average ColorChecker and Greyscale DeltaE values of 3.05/2.1, respectively, out of the box. Post-calibration, these numbers drop even further to 2.03/1.2. The Total Gamma reading of 2.082 and CCT Average of 6713 are also within a few percentage points of ideal values (2.2 and 6500, respectively).

Display Response Times
| ↔ Response Time Black to White | ||
|---|---|---|
| 37.6 ms ... rise ↗ and fall ↘ combined | ↗ 20.4 ms rise | 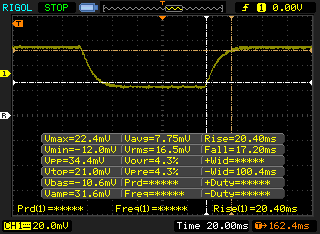 |
| ↘ 17.2 ms fall | ||
| The screen shows slow response rates in our tests and will be unsatisfactory for gamers. In comparison, all tested devices range from 0.1 (minimum) to 240 (maximum) ms. » 95 % of all devices are better. This means that the measured response time is worse than the average of all tested devices (19.8 ms). | ||
| ↔ Response Time 50% Grey to 80% Grey | ||
| 56.4 ms ... rise ↗ and fall ↘ combined | ↗ 27.6 ms rise | 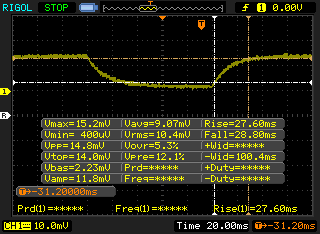 |
| ↘ 28.8 ms fall | ||
| The screen shows slow response rates in our tests and will be unsatisfactory for gamers. In comparison, all tested devices range from 0.165 (minimum) to 636 (maximum) ms. » 93 % of all devices are better. This means that the measured response time is worse than the average of all tested devices (31 ms). | ||
Screen Flickering / PWM (Pulse-Width Modulation)
| Screen flickering / PWM not detected | 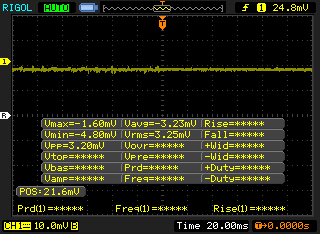 | ||
In comparison: 52 % of all tested devices do not use PWM to dim the display. If PWM was detected, an average of 7753 (minimum: 5 - maximum: 343500) Hz was measured. | |||
We measure no PWM from the display. Response times—as is typical with IPS displays—are on the slower side, but this machine isn’t meant for gaming.
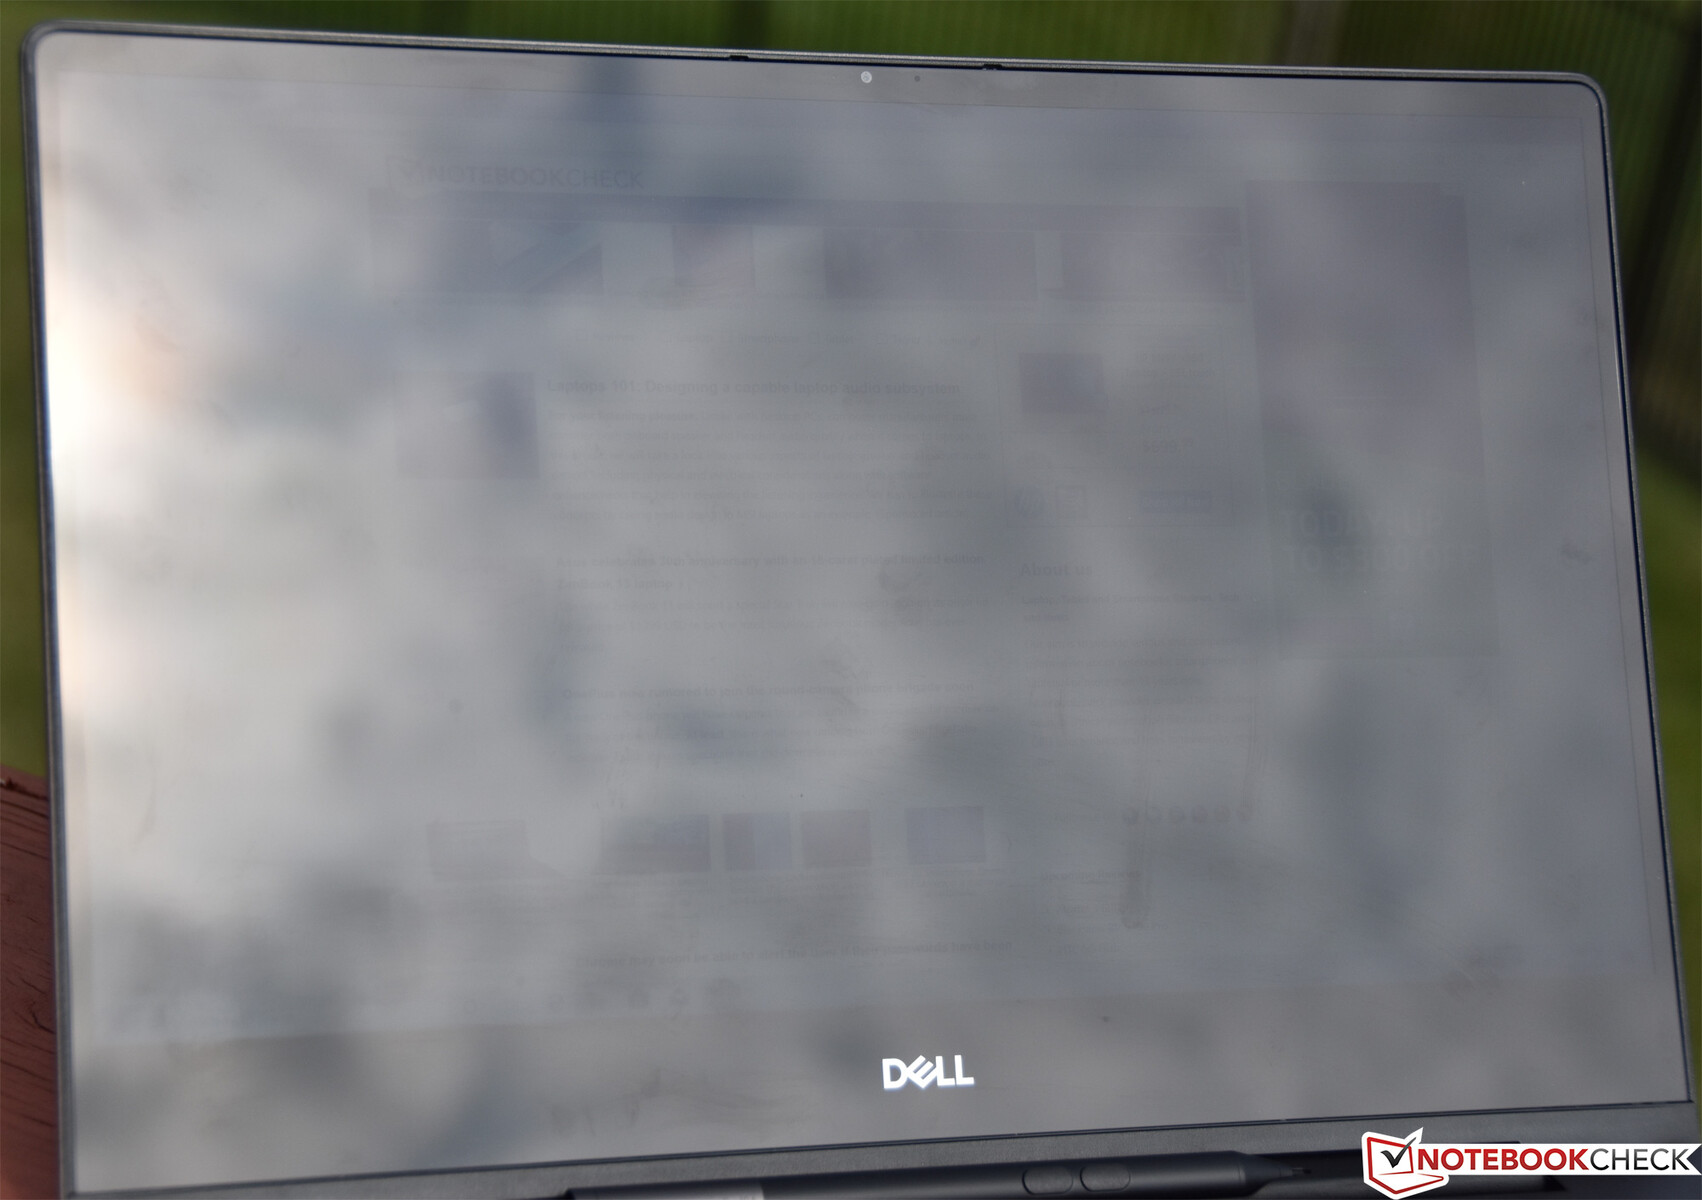
Outdoors, the machine struggles mightily thanks to its extremely high-gloss, edge-to-edge display finish. Viewing angles, apart from the obvious concerns surrounding glare, are as strong as that of any IPS panel.
Performance
There are currently only two configurations shown for the Dell Inspiron 7390 2-in-1, and they vary only in terms of storage options: the first incorporates 256 GB of NVMe SSD storage, and the second doubles that number to 512 GB. The two options are only $50 apart in terms of price: the first is $1,199 and the second $1,249.
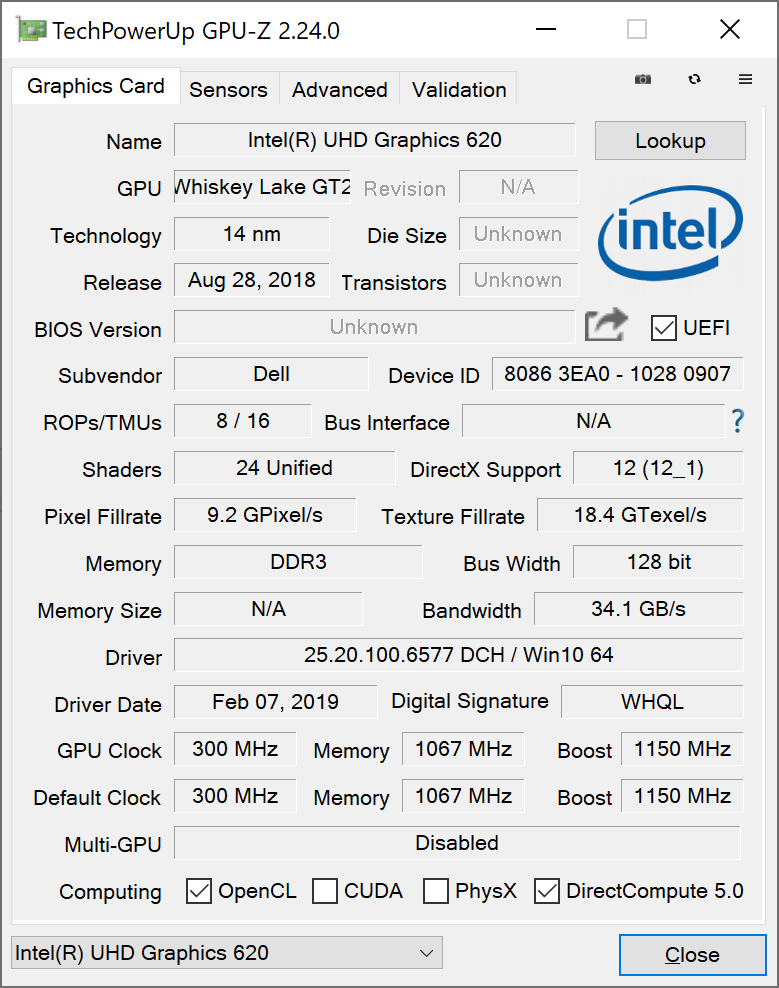
The rest of the specifications are the same across both configurations: 4K UHD display, Intel Core i7-8565U CPU, and 16 GB of LPDDR3-2133 MHz RAM. To repeat ourselves from earlier, like most thin notebooks and convertibles, the RAM in the Inspiron 7390 is not upgradeable; it’s soldered to the board. The storage drive, on the other hand, is easily removable/replaceable if higher capacities are desired. There are no dedicated graphics options available for this machine.
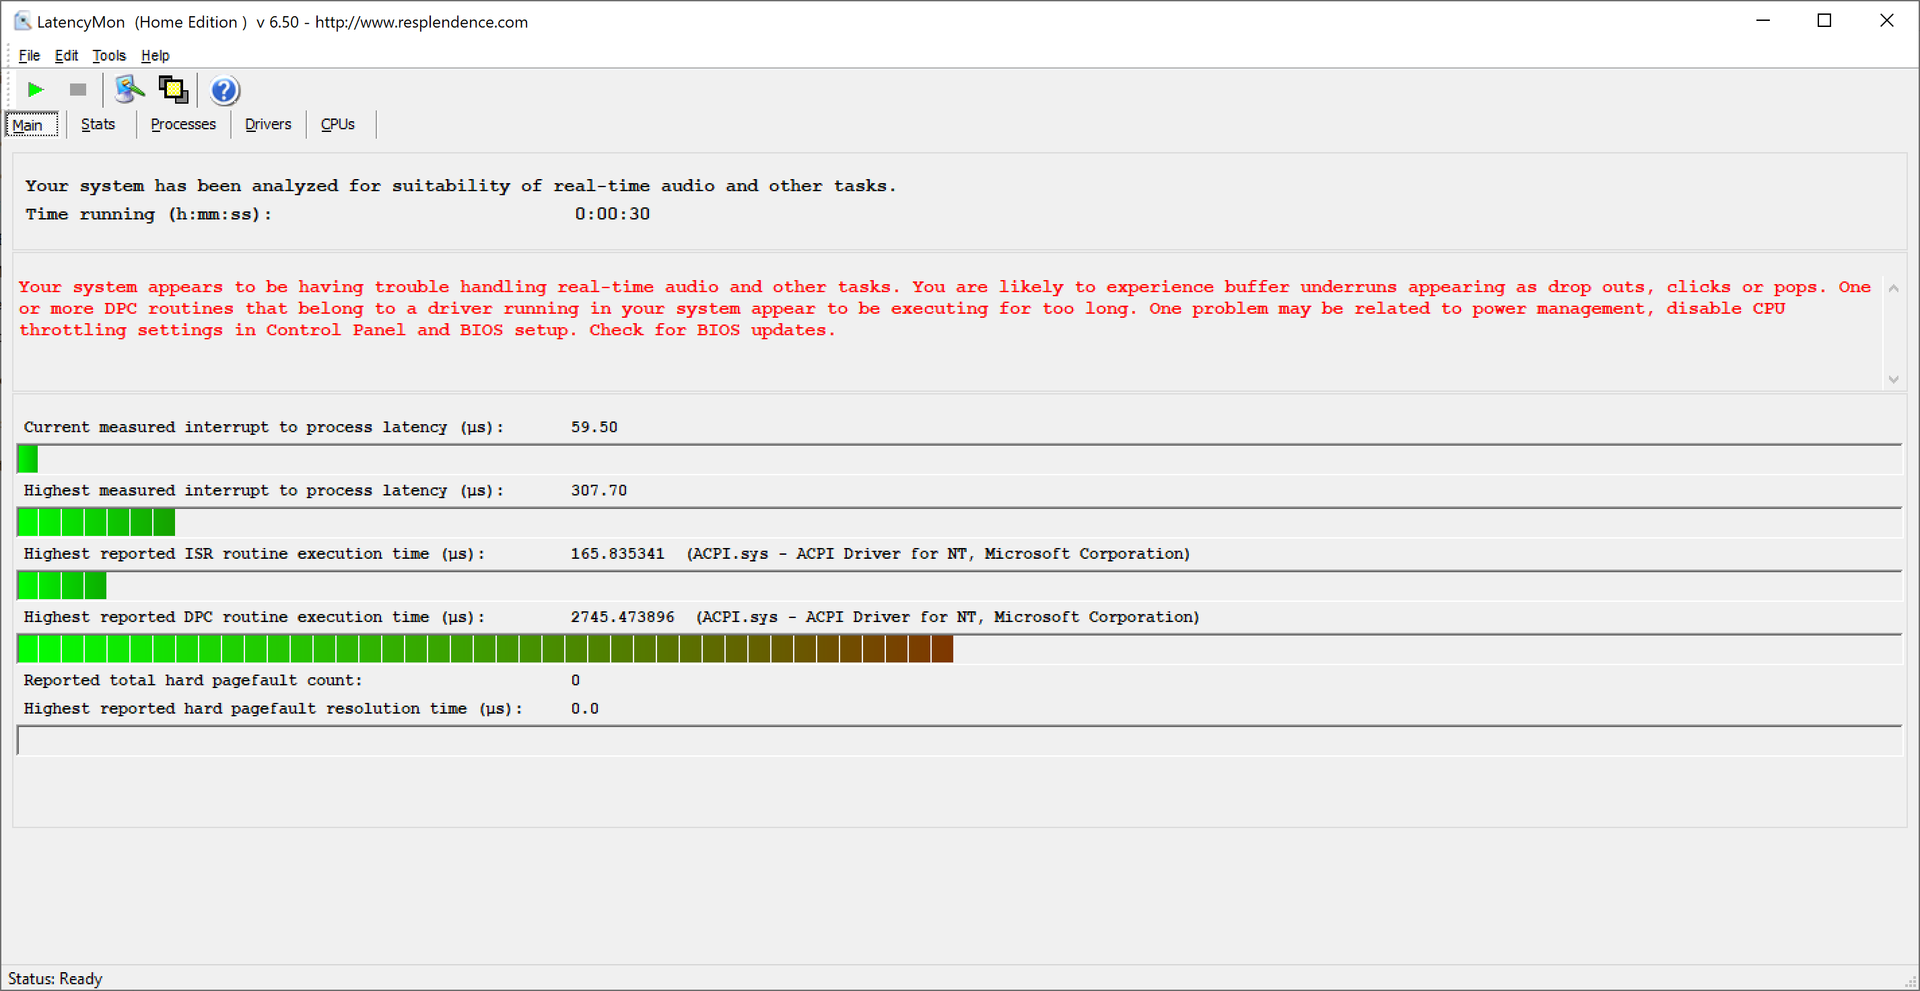
No drop in performance was detected while running on battery power; a secondary run of 3DMark 11 produced roughly the same score as before. LatencyMon warns of occasional spikes in DPC Latencies, and the problems aren’t resolved even with wireless radios disabled. However, the spikes seem to be few and far between and so aren’t likely to manifest much in real-world use.
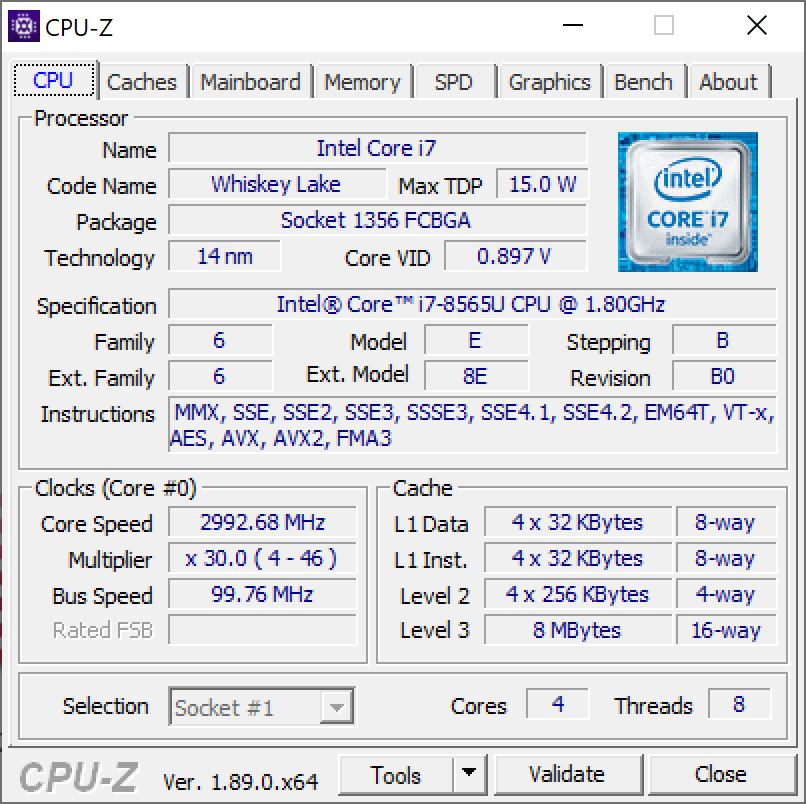
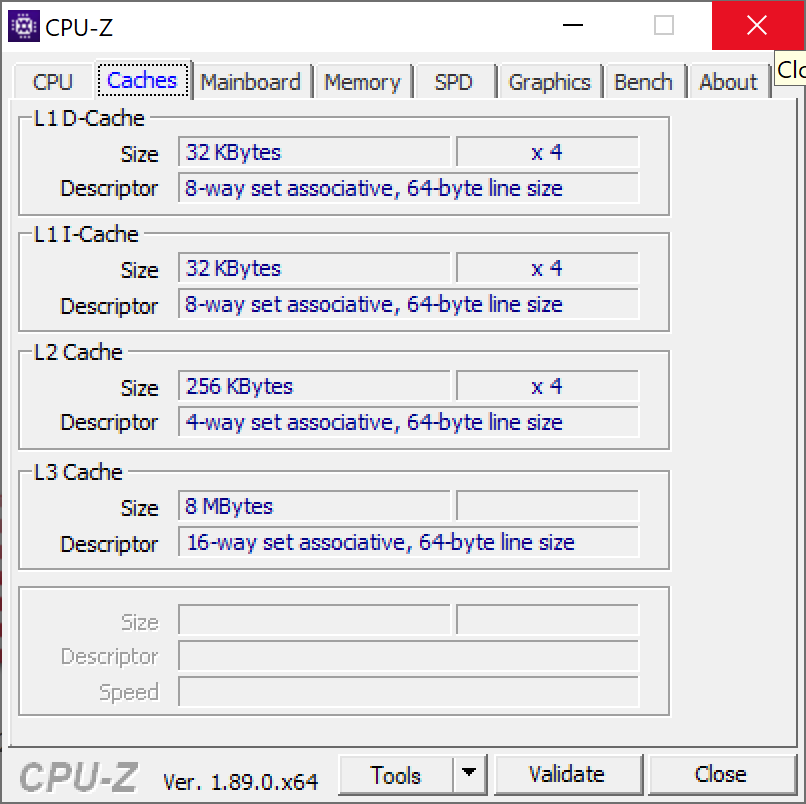
Processor
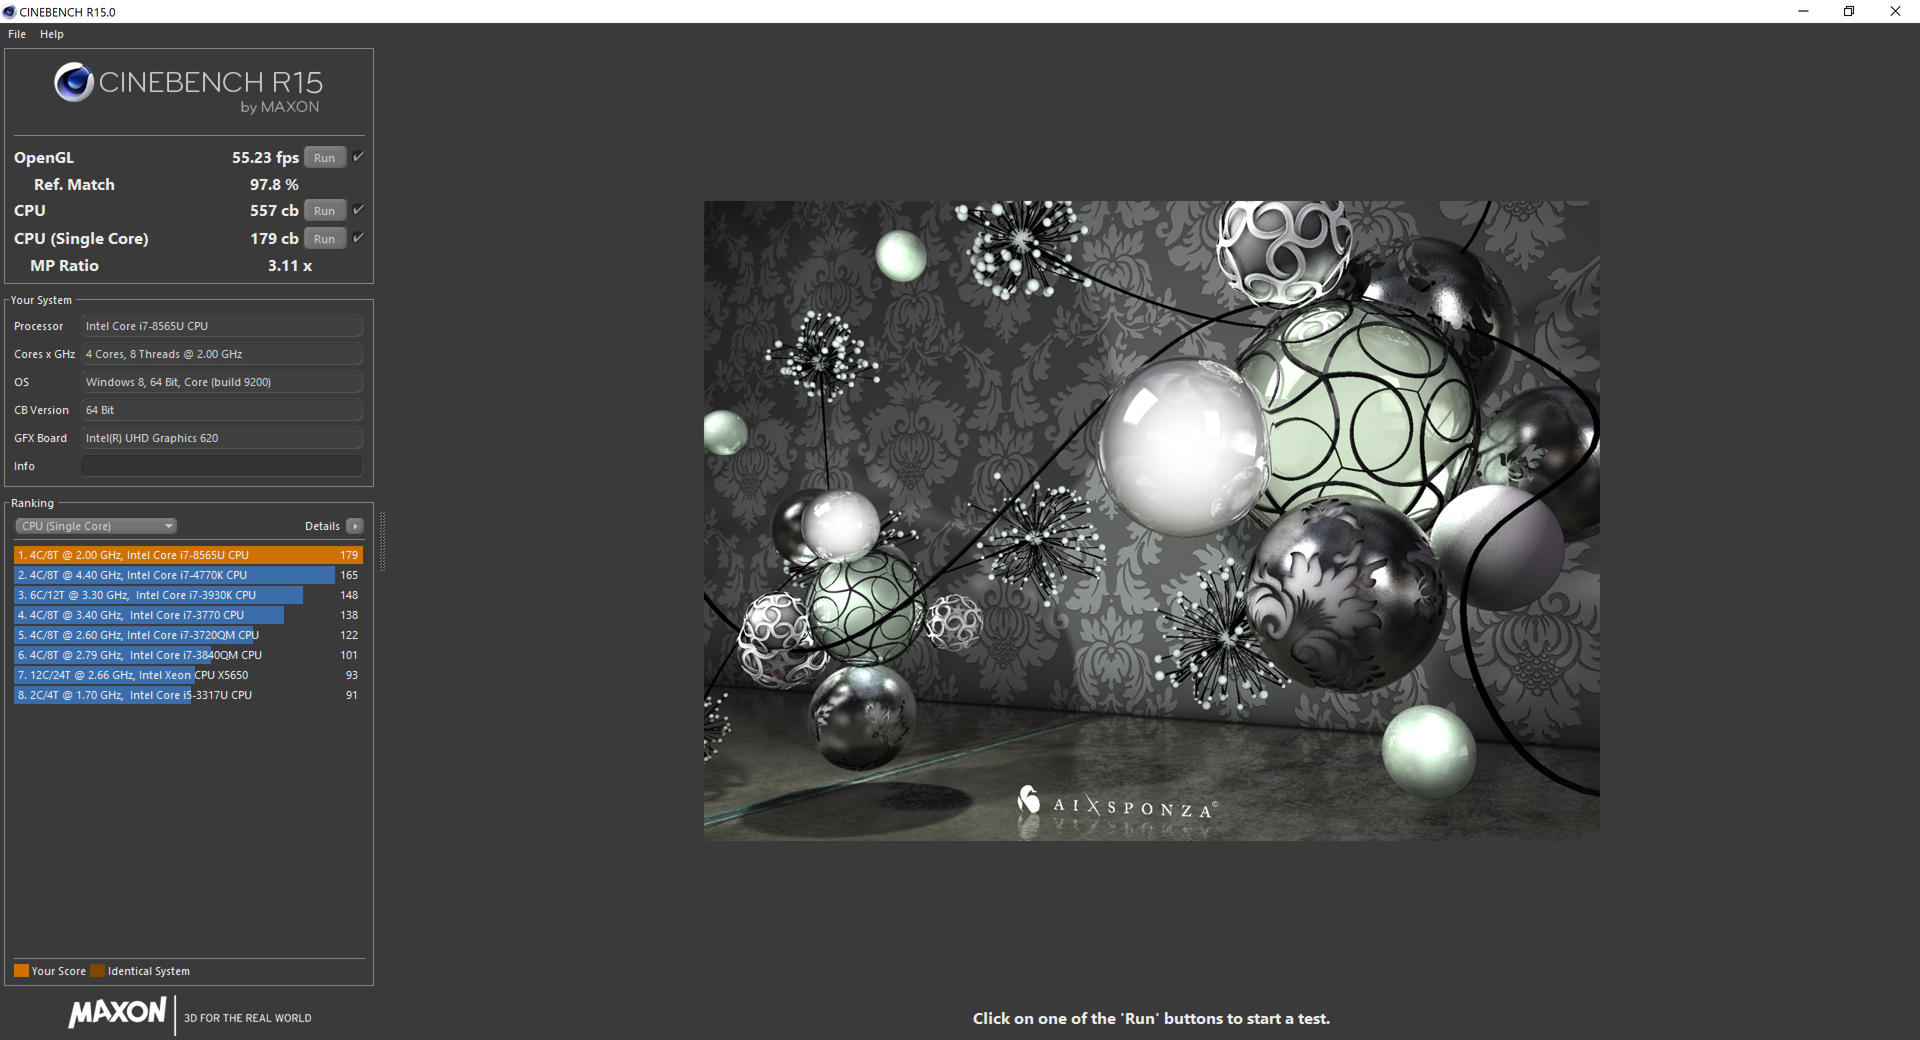
The Intel Core i7-8565U CPU is a quad-core SoC from the Whiskey Lake generation featuring a 15 W TDP and built using a further improved 14nm process (14nm++). Clock rates range from the base rate of 1.8 GHz all the way to 4.6 GHz (single-core) and 4.1 GHz (2 to 4 cores). The CPU features Thermal Velocity Boost on top of the typical Turbo Boost functionality, though it remains to be seen whether such functionality really plays out when accompanied by such a small case.
This is actually the exact same chip that powered our Inspiron 7386 2-in-1 review unit, though this time the case design (and possibly the firmware and cooling system) have been tweaked/improved. The result, as shown in our tests, is improved performance (in most cases) by around 6 to 7% in both single- and multi-core operations, even under sustained load conditions. We record a score of 179 in Cinebench R15 single-CPU and 557 in multi-CPU, the former of which is slightly above the average for this CPU, and the latter slightly below.
For sake of comparison, we’ve also included the new Lenovo ThinkBook 13s in our charts, which helps to illustrate the relative disappointment we share in the overall utility of a newer quad-core i7 CPU in conjunction with these thin cases and tiny cooling systems. Even in our normal Cinebench R15 scoring routines, where the OpenGL and single-core tests take place first, the ThinkBook manages to match the score of our Inspiron 7390, and that’s in spite of the fact that it’s powered by a supposedly weaker (and cheaper) Core i5-8265U SoC. Lenovo has configured the TDP higher than the 15 W default, however, allowing it to peak at 25 W for 30 seconds before dropping back to 18 W for the remainder of computing loads. As a result of this, the ThinkBook 13s obliterates even the initial burst values we witness from our TVB-capable Inspiron, with a score of 655 eclipsing the Inspiron’s 589, and scores thereafter (runs 4+) in the 550 range, well above the 500-510 values we receive from the Dell over the long term.
What this means is that a Core i5 with cTDP Up configured by the OEM seems to be able to outperform a vanilla Core i7 under similar power scenarios (15 W vs. 18 W). Despite the improved performance of the Inspiron 7390 over the previous 7386, then, this once again calls into question the value of a 15 W Core i7 Whiskey Lake CPU in an ultraportable chassis with limited cooling and power provisions, with or without TVB involved.
System Performance
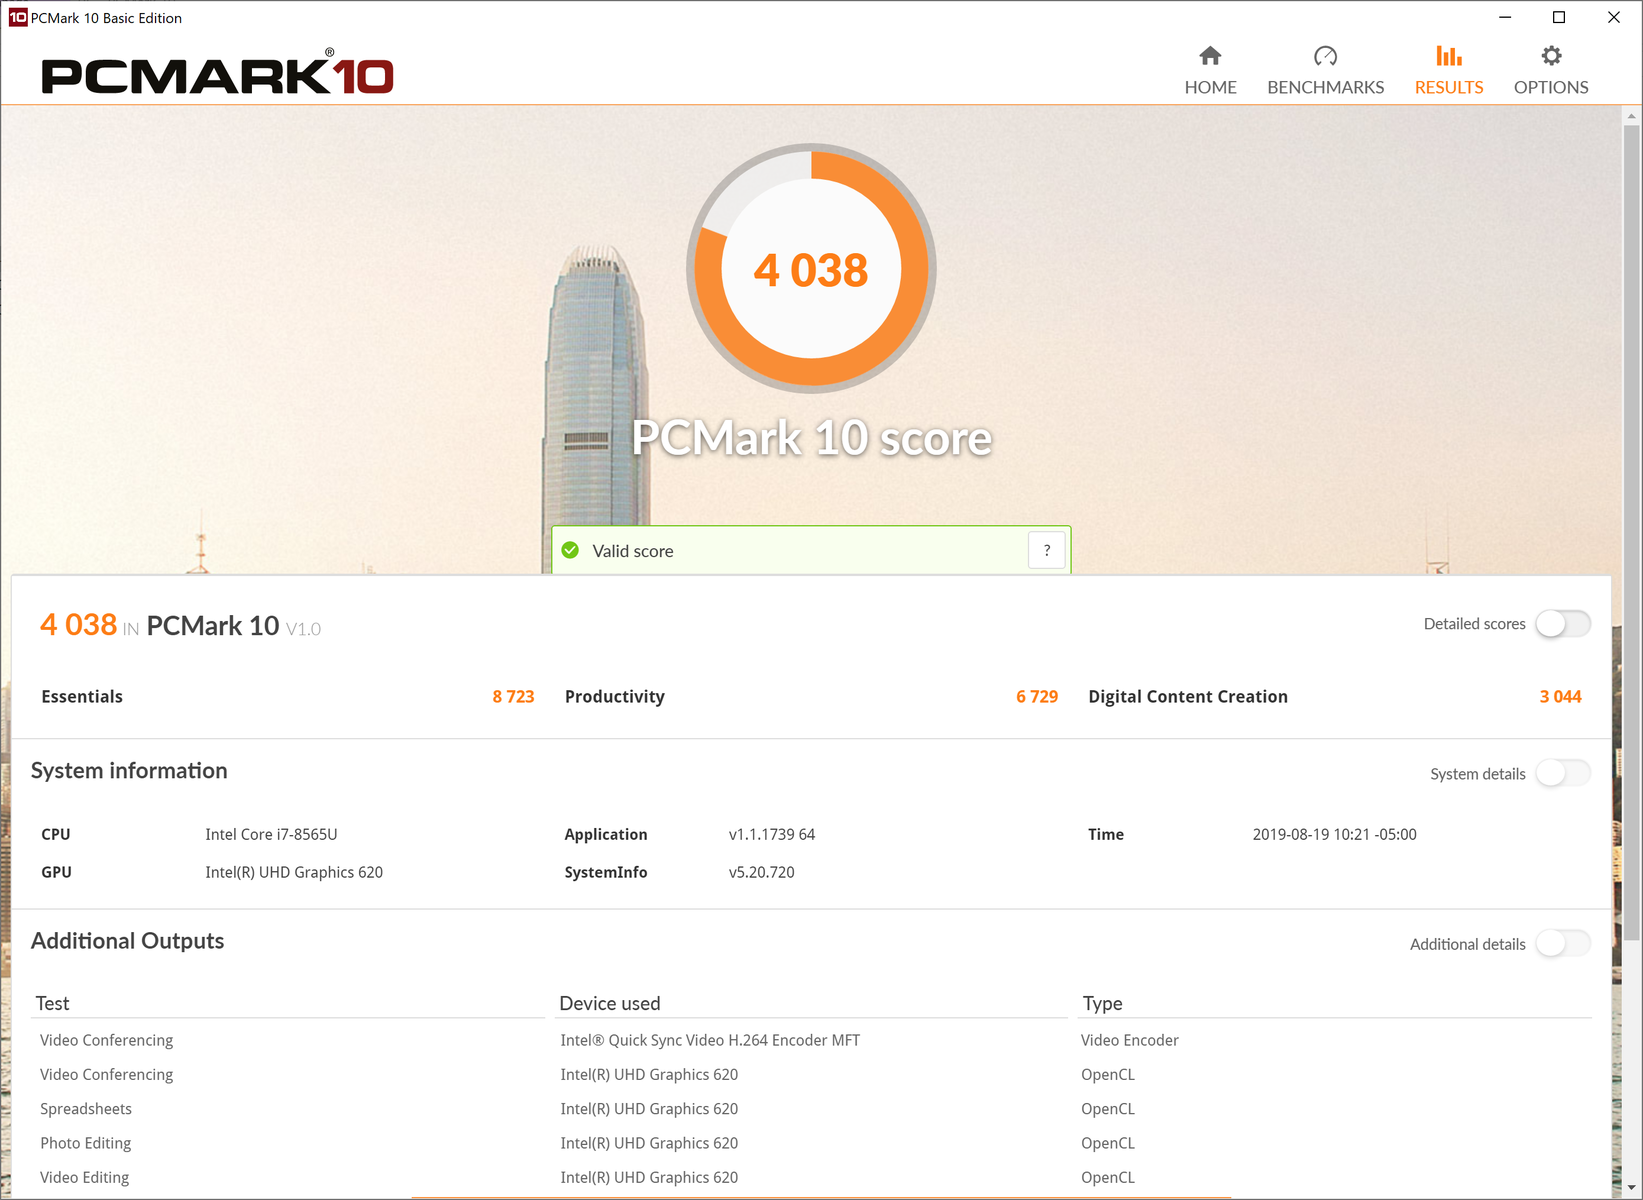
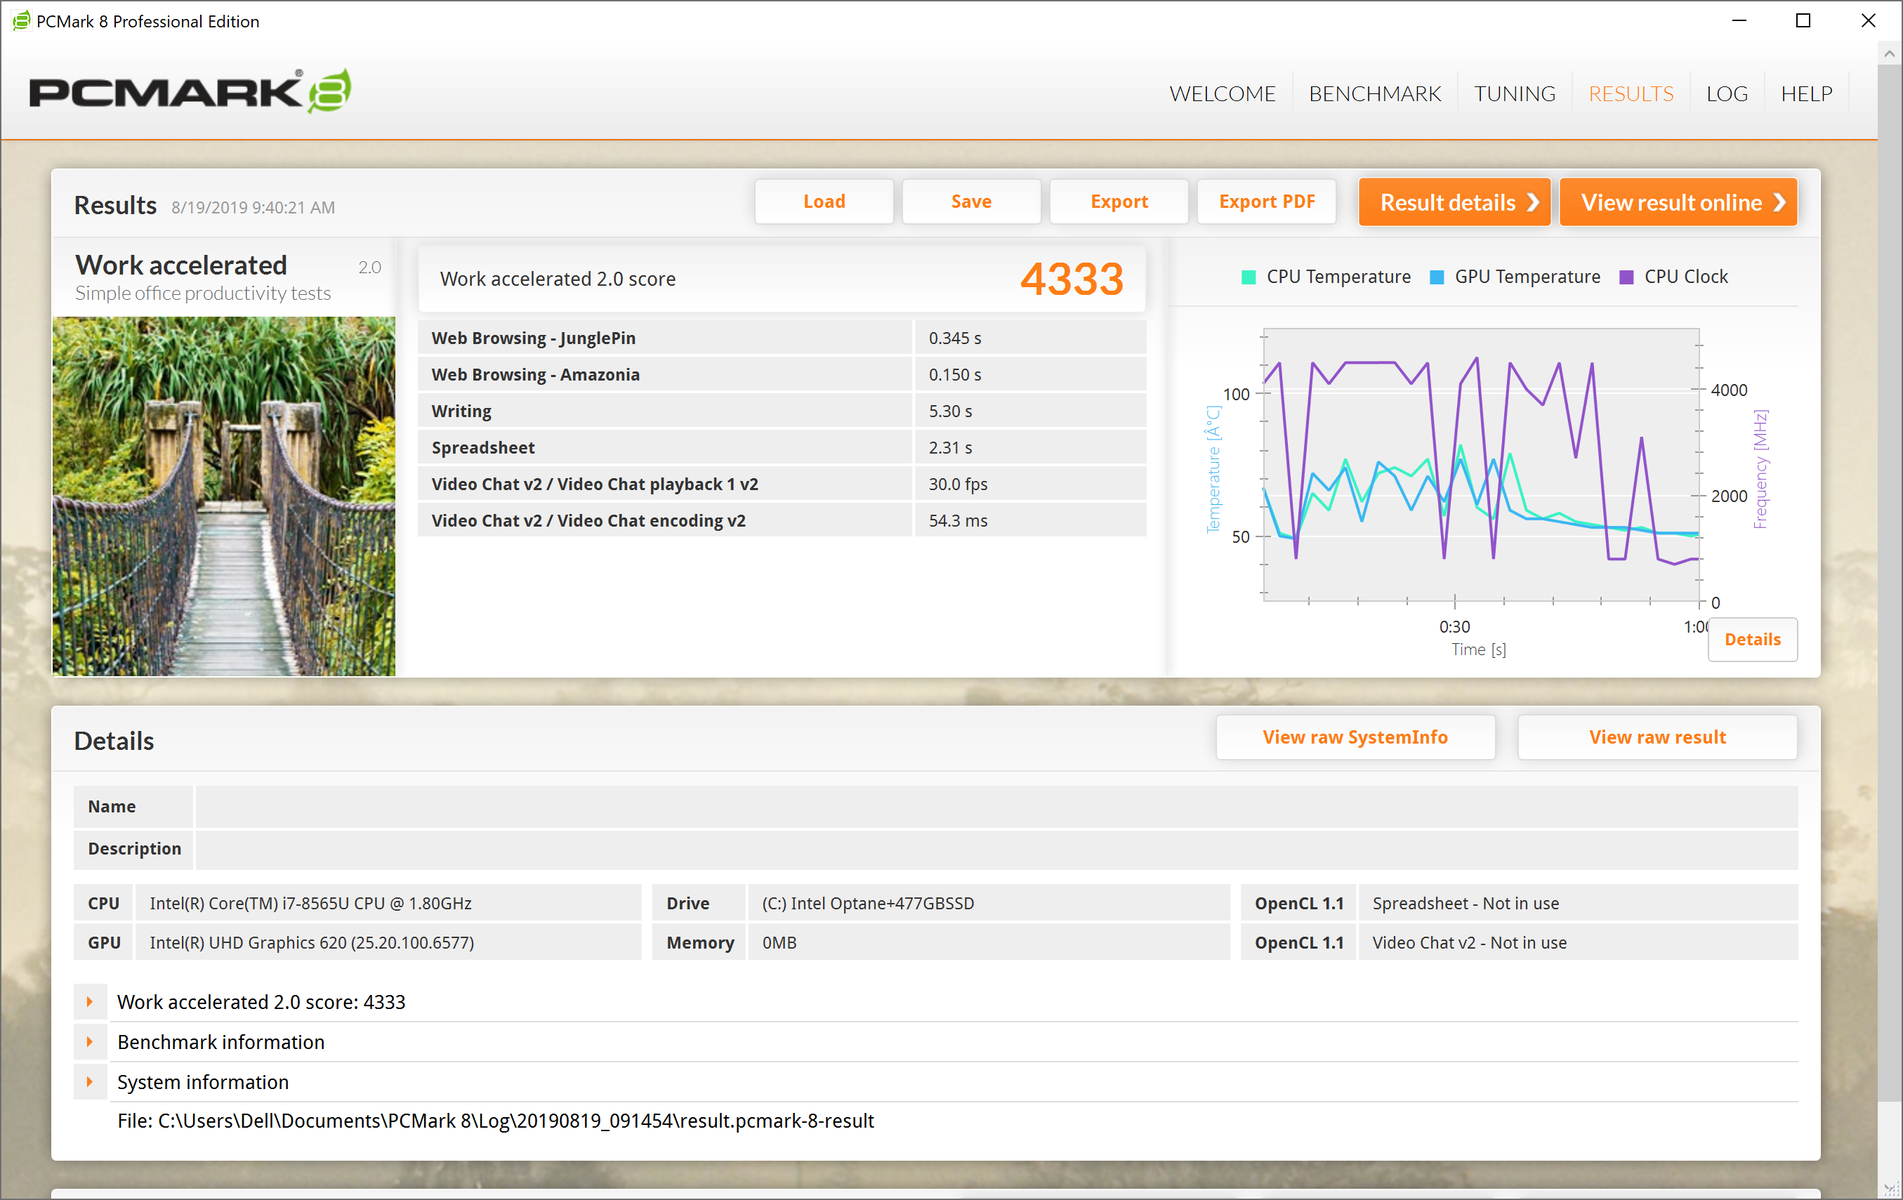
Most likely thanks to its marginally improved CPU performance and faster storage speeds, the Inspiron 7390 2-in-1 edges out the 7386 in synthetic general system performance benchmarks, and places within a few percentage points of the top of the field across the board. For example, its score of 4038 in PCMark 10 is roughly 9% above the Inspiron 7386, and 3% above the average for machines equipped with this CPU. Only the Dell Latitude 7400 2-in-1 and the two Lenovo Yogas manage higher scores, and only by 3 – 6%.
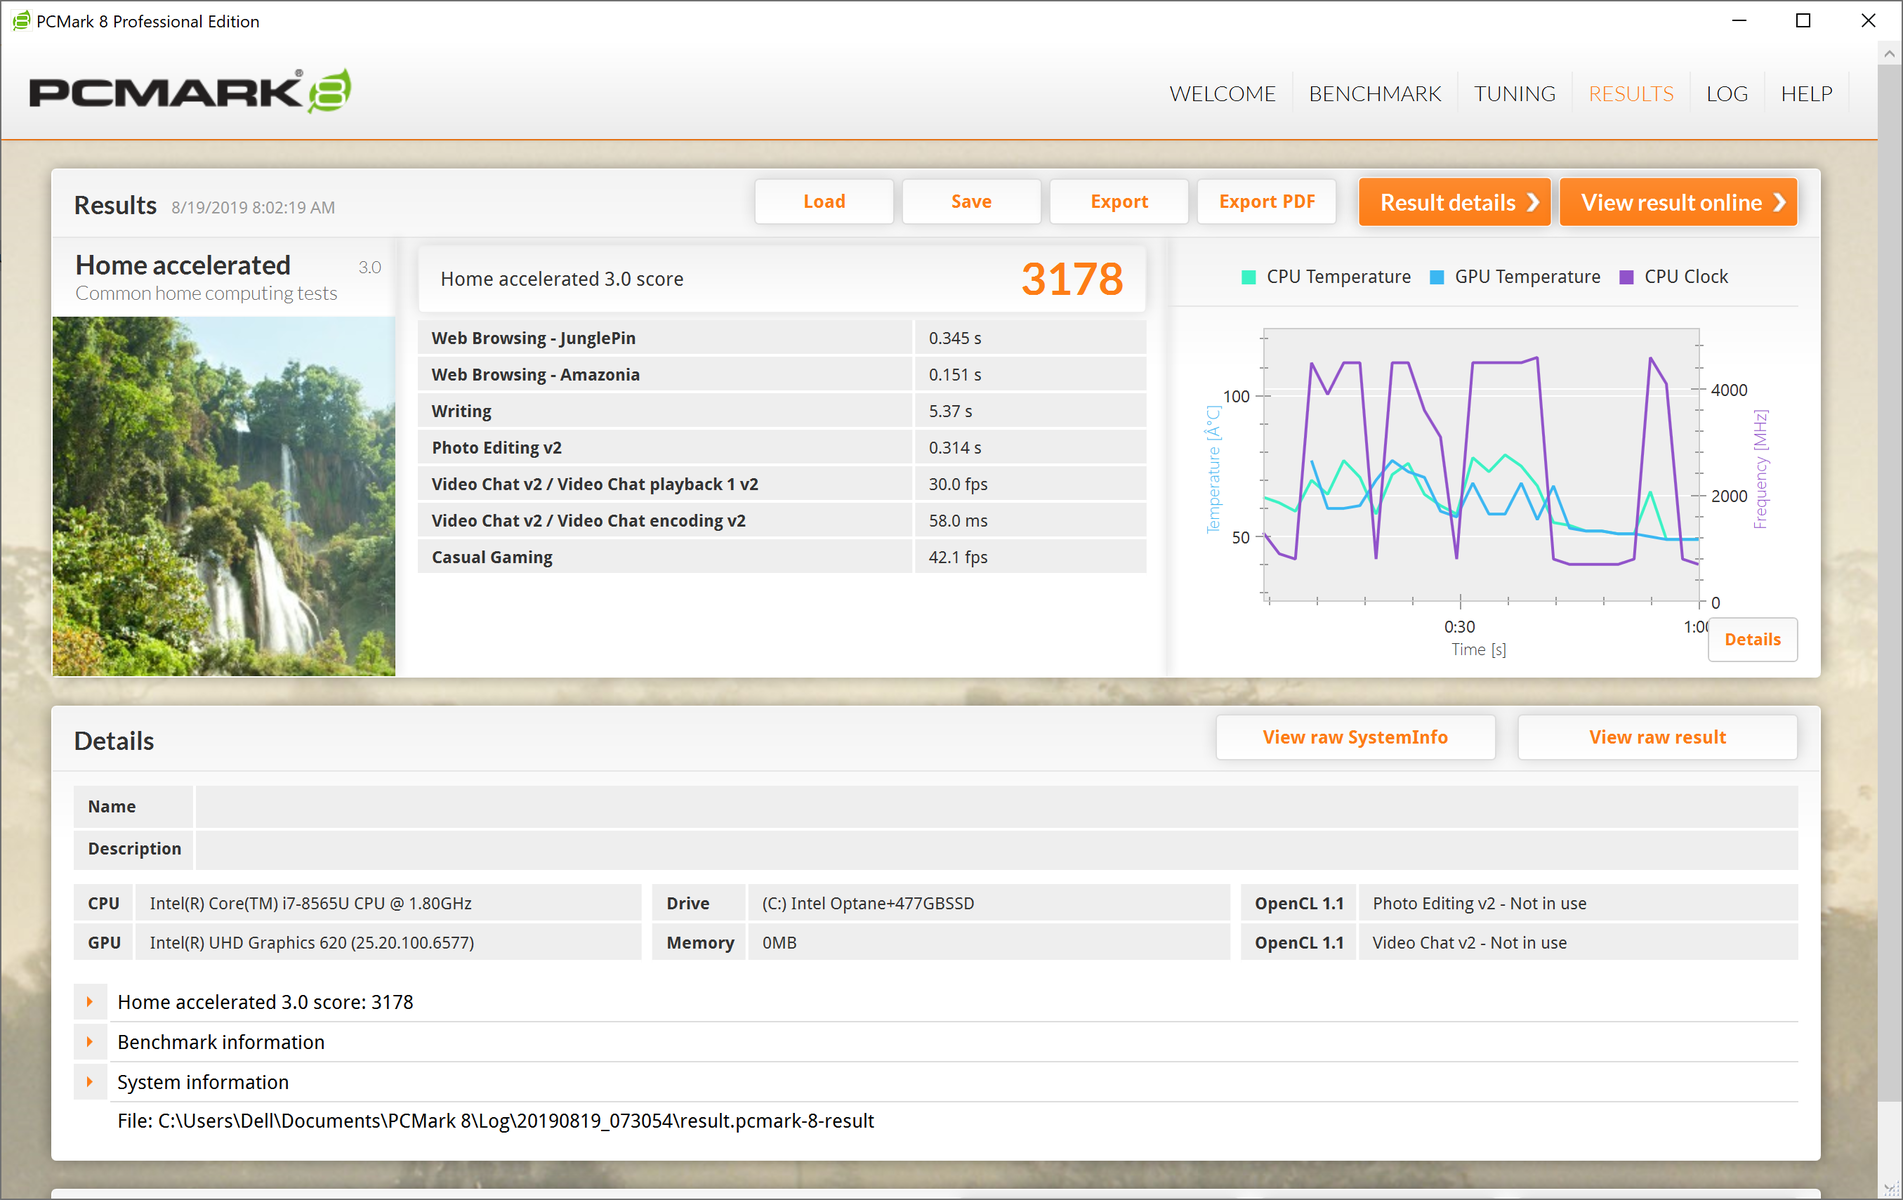
| PCMark 8 Home Score Accelerated v2 | 3178 points | |
| PCMark 8 Work Score Accelerated v2 | 4333 points | |
| PCMark 10 Score | 4038 points | |
Help | ||
Storage Devices
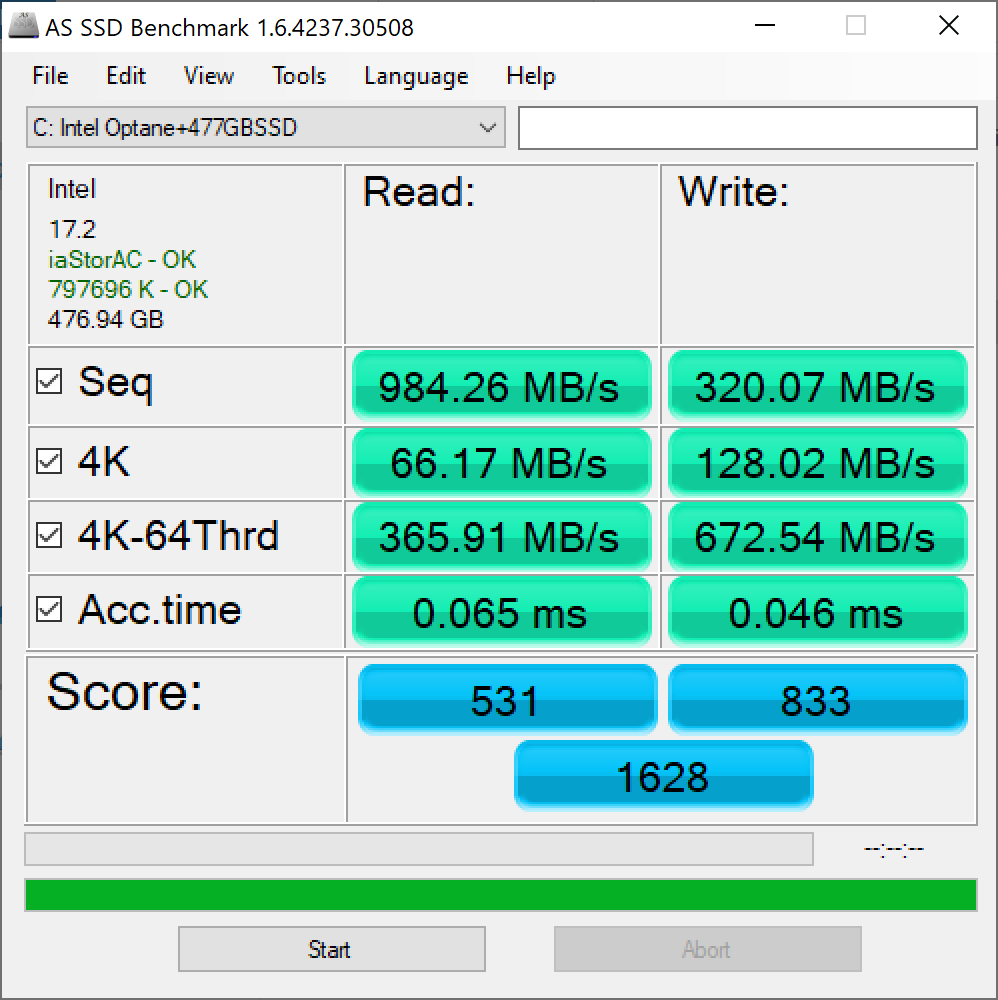
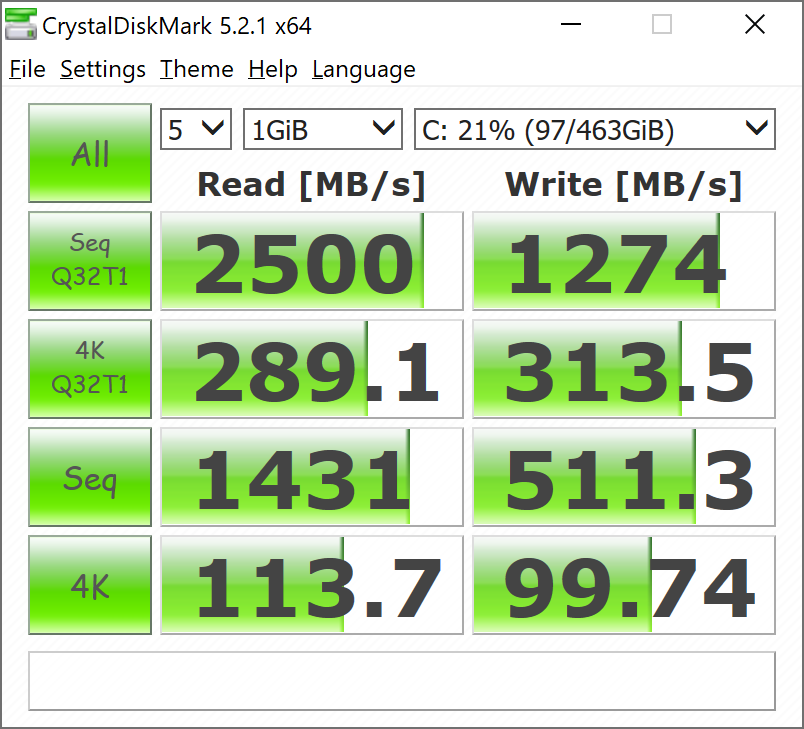
Although it’s confusingly presented on the configuration page at Dell’s website, the 512 GB of storage included in our review unit (the $1249 config currently) is indeed 100% NVMe storage, not some Frankenstein’s monster hybrid of NVMe caching alongside a standard SATA SSD. True, it’s only running across two lanes (x2 speed), but the speeds we receive in our benchmarks are still mostly fast. We record 2500 MB/s and 1274 MB/s in CrystalDiskMark 5.2 Read/Write Seq Q32T1 respectively, and good 4K Q32T1 scores of 289.1 MB/s and 313.5 MB/s alongside them. AS SSD sees lower sequential performance speeds of 984.26 MB/s and 320.07 MB/s Read/Write, but only the X1 Yoga and Latitude 7400 fare substantially better here.
There is also currently an option for $50 less for half the storage (256 GB NVMe), and again, users can easily upgrade the drive post-purchase, provided they have a Torx bit handy and a bit of patience.
| Dell Inspiron 7390 2-in-1 Intel Optane Memory H10 with Solid State Storage 32GB + 512GB HBRPEKNX0202A(L/H) | Lenovo ThinkPad X1 Yoga 2019-20QGS00A00 WDC PC SN720 SDAPNTW-512G | HP Envy x360 13-ar0601ng SK Hynix BC501 HFM512GDJTNG | Dell Latitude 7400 2-in-1 Toshiba XG6 KXG60ZNV512G | Dell Inspiron 13 7386 SK Hynix BC501 HFM512GDJTNG | |
|---|---|---|---|---|---|
| AS SSD | 154% | 14% | -14% | 31% | |
| Seq Read (MB/s) | 984 | 2888 193% | 1412 43% | 2289 133% | 1122 14% |
| Seq Write (MB/s) | 320.1 | 2381 644% | 540 69% | 1163 263% | 619 93% |
| 4K Read (MB/s) | 66.2 | 45.66 -31% | 32.24 -51% | 22.29 -66% | 39.58 -40% |
| 4K Write (MB/s) | 128 | 162.4 27% | 74.7 -42% | 28.92 -77% | 108.5 -15% |
| 4K-64 Read (MB/s) | 365.9 | 1276 249% | 567 55% | 415.6 14% | 776 112% |
| 4K-64 Write (MB/s) | 673 | 1432 113% | 700 4% | 199.5 -70% | 671 0% |
| Access Time Read * (ms) | 0.065 | 0.088 -35% | 0.049 25% | 0.122 -88% | 0.045 31% |
| Access Time Write * (ms) | 0.046 | 0.023 50% | 0.048 -4% | 0.143 -211% | 0.033 28% |
| Score Read (Points) | 531 | 1610 203% | 741 40% | 667 26% | 928 75% |
| Score Write (Points) | 833 | 1832 120% | 829 0% | 345 -59% | 841 1% |
| Score Total (Points) | 1628 | 4245 161% | 1913 18% | 1300 -20% | 2228 37% |
| Copy ISO MB/s (MB/s) | 1810 | 521 | 1767 | ||
| Copy Program MB/s (MB/s) | 498.3 | 253.1 | 379.4 | ||
| Copy Game MB/s (MB/s) | 921 | 392.9 | 1055 | ||
| CrystalDiskMark 5.2 / 6 | 78% | -18% | -1% | -17% | |
| Write 4K (MB/s) | 99.7 | 194.3 95% | 88.3 -11% | 35.06 -65% | 97.4 -2% |
| Read 4K (MB/s) | 113.7 | 51.2 -55% | 34.84 -69% | 23.64 -79% | 38.05 -67% |
| Write Seq (MB/s) | 511 | 1773 247% | 740 45% | 1537 201% | 656 28% |
| Read Seq (MB/s) | 1431 | 2512 76% | 985 -31% | 1782 25% | 1043 -27% |
| Write 4K Q32T1 (MB/s) | 313.5 | 431.7 38% | 313.7 0% | 100.3 -68% | 331.5 6% |
| Read 4K Q32T1 (MB/s) | 289.1 | 539 86% | 243.1 -16% | 62.7 -78% | 253.8 -12% |
| Write Seq Q32T1 (MB/s) | 1274 | 2538 99% | 846 -34% | 2698 112% | 879 -31% |
| Read Seq Q32T1 (MB/s) | 2500 | 3489 40% | 1783 -29% | 1073 -57% | 1639 -34% |
| Write 4K Q8T8 (MB/s) | 867 | 305.7 | |||
| Read 4K Q8T8 (MB/s) | 1315 | 698 | |||
| Total Average (Program / Settings) | 116% /
122% | -2% /
1% | -8% /
-9% | 7% /
10% |
* ... smaller is better

GPU and Gaming Performance
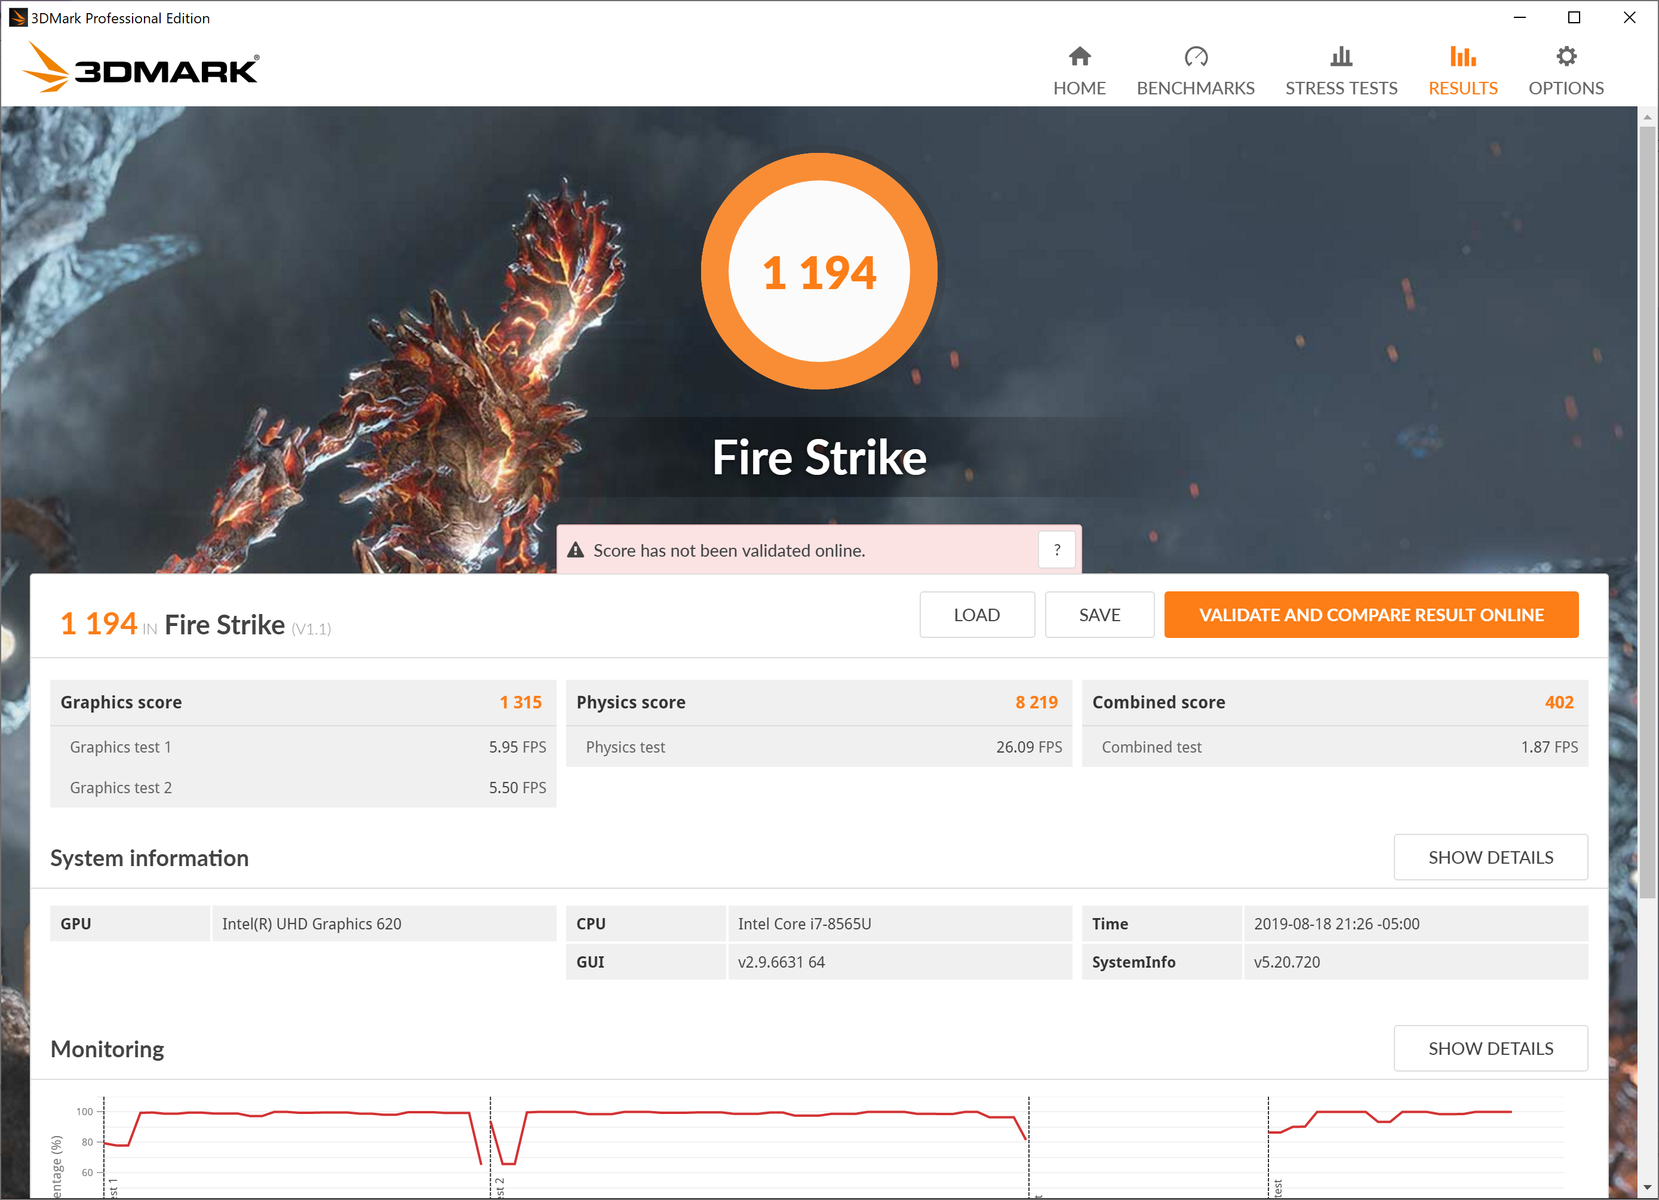
With its mere integrated Intel UHD Graphics 620, the Inspiron 7390 2-in-1 is far from a gaming machine. 3DMark Fire Strike scores our test unit 1315 points, and Cloud Gate reports 9879 points. Both of these are, interestingly enough, actually a smidge (2% and 5% respectively) below the scores of the Inspiron 7386, but neither machine fares particularly well, of course.
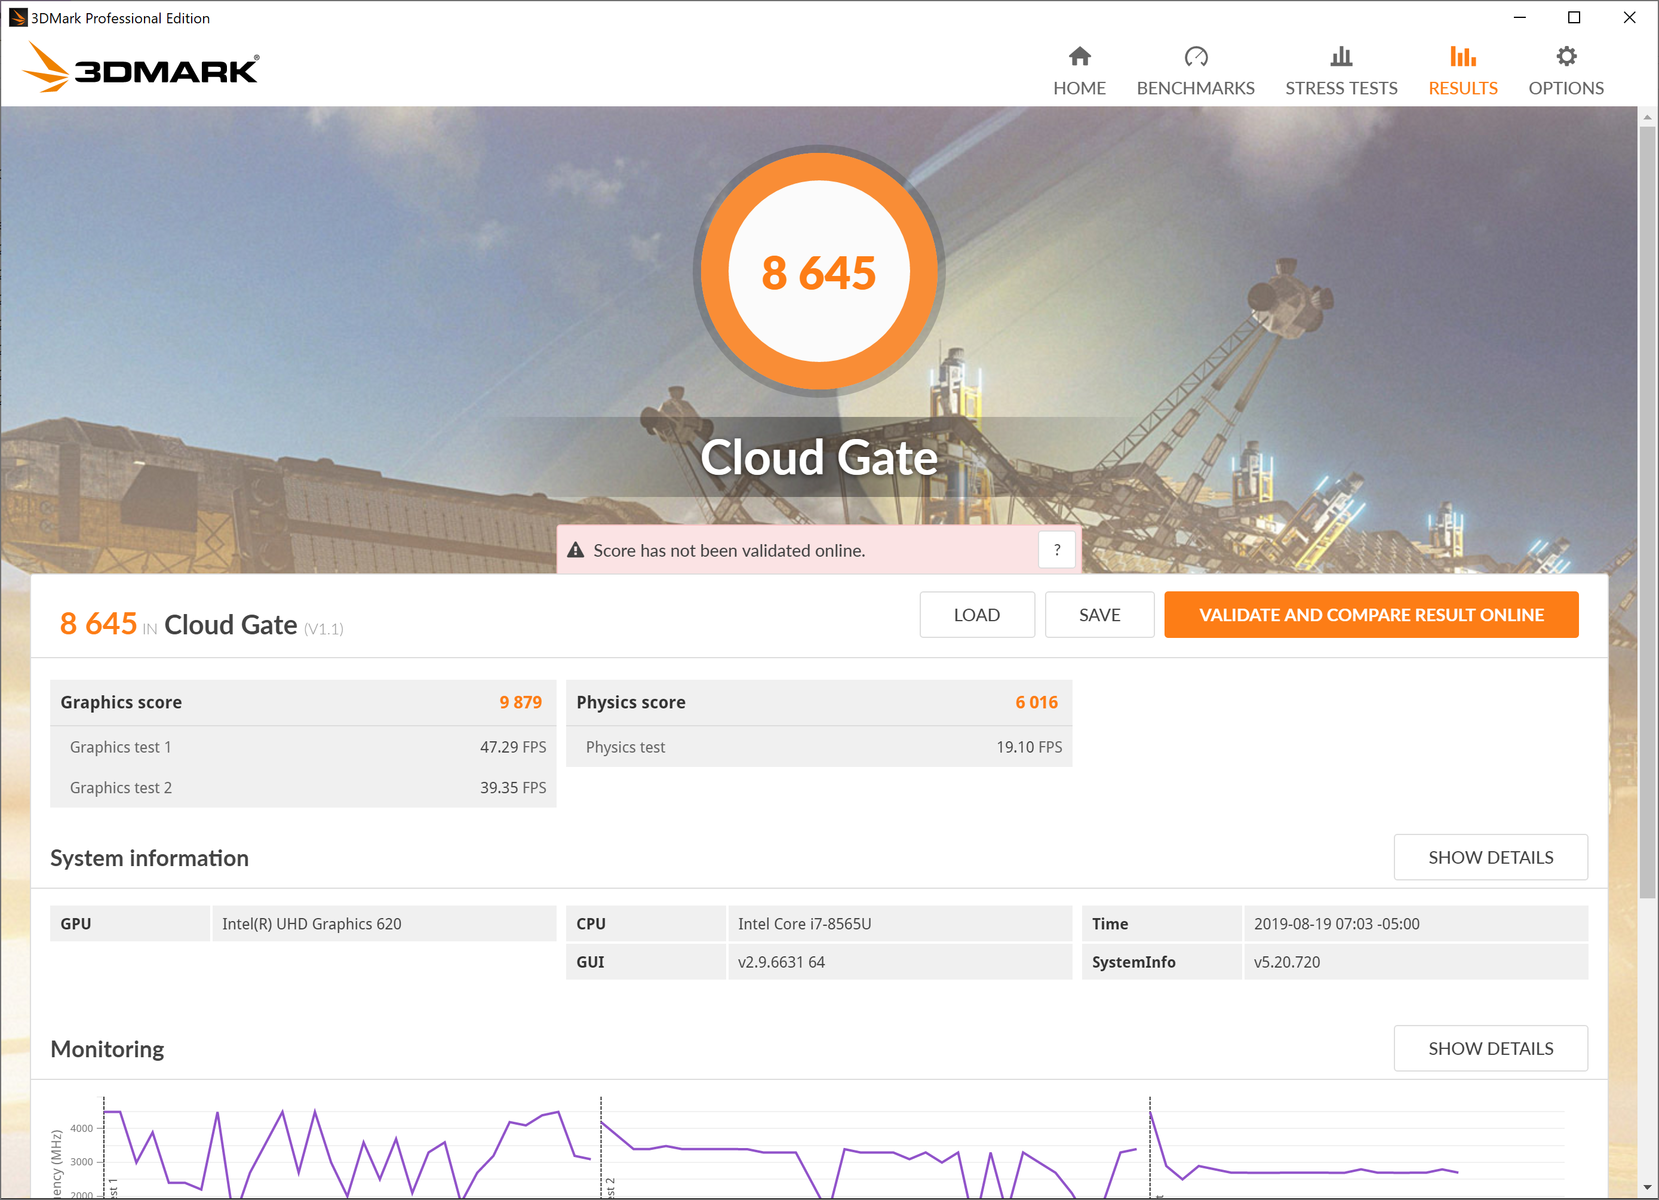
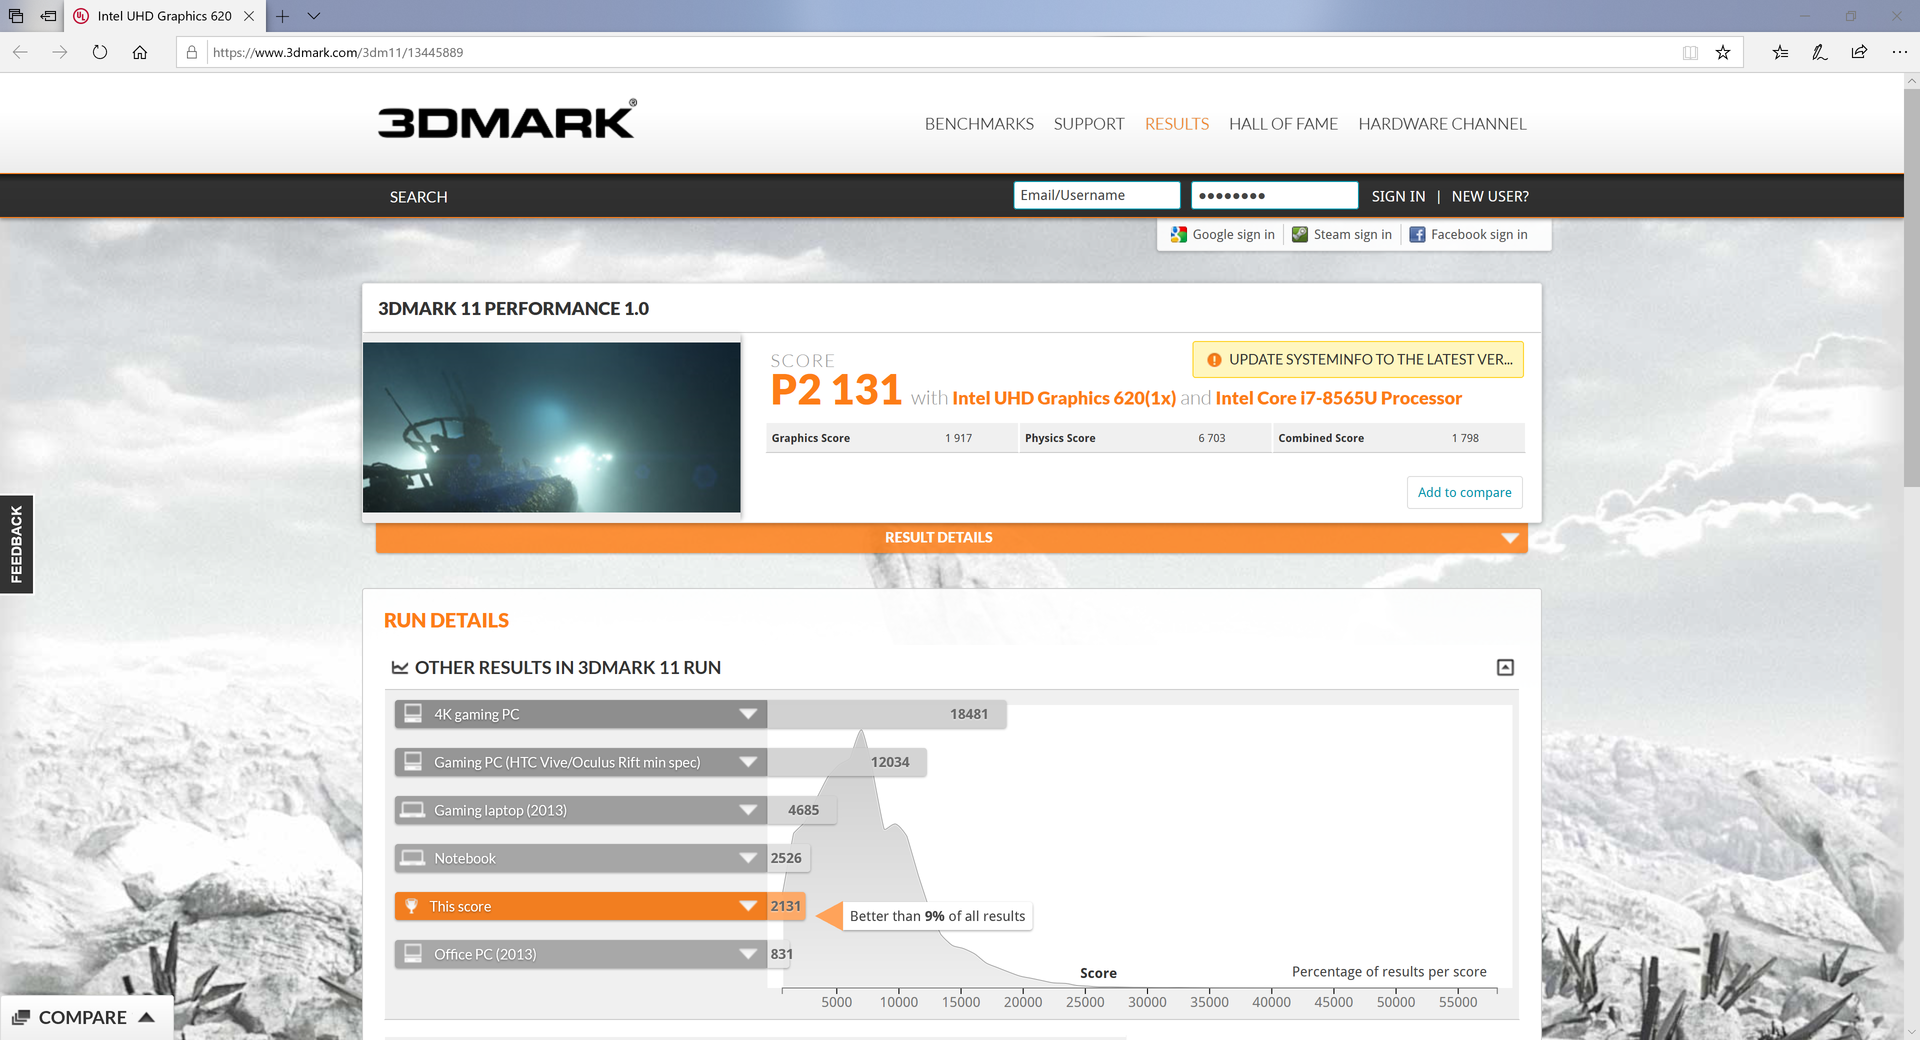
| 3DMark 11 Performance | 2131 points | |
| 3DMark Cloud Gate Standard Score | 8645 points | |
| 3DMark Fire Strike Score | 1194 points | |
Help | ||
Older games like BioShock: Infinite are playable on lower settings at reasonable frame rates, but more demanding titles will be completely unplayable under most conditions.
| Metro: Last Light | |
| 1024x768 Low (DX10) AF:4x | |
| Dell Inspiron 7390 2-in-1 | |
| Average Intel UHD Graphics 620 (23.3 - 41, n=5) | |
| 1366x768 Medium (DX10) AF:4x | |
| Dell Inspiron 7390 2-in-1 | |
| Average Intel UHD Graphics 620 (16.4 - 28, n=4) | |
| 1366x768 High (DX11) AF:16x | |
| Dell Inspiron 7390 2-in-1 | |
| Average Intel UHD Graphics 620 (13 - 16, n=3) | |
| 1920x1080 Very High (DX11) AF:16x | |
| Dell Inspiron 7390 2-in-1 | |
| Average Intel UHD Graphics 620 (6 - 8, n=3) | |
| Rise of the Tomb Raider | |
| 1024x768 Lowest Preset | |
| HP Envy x360 13-ar0601ng | |
| Lenovo ThinkPad X390 Yoga-20NQS05R00 | |
| Average Intel UHD Graphics 620 (10.4 - 110.7, n=82) | |
| Dell Inspiron 7390 2-in-1 | |
| Lenovo ThinkPad X1 Yoga 2019-20QGS00A00 | |
| 1366x768 Medium Preset AF:2x | |
| Lenovo ThinkPad X390 Yoga-20NQS05R00 | |
| Dell Inspiron 7390 2-in-1 | |
| Average Intel UHD Graphics 620 (6.5 - 49.3, n=62) | |
| 1920x1080 High Preset AA:FX AF:4x | |
| HP Envy x360 13-ar0601ng | |
| Average Intel UHD Graphics 620 (4.9 - 32, n=42) | |
| Dell Inspiron 7390 2-in-1 | |
| 1920x1080 Very High Preset AA:FX AF:16x | |
| Dell Inspiron 7390 2-in-1 | |
| Average Intel UHD Graphics 620 (3 - 14.5, n=11) | |
| low | med. | high | ultra | |
|---|---|---|---|---|
| BioShock Infinite (2013) | 64 | 33 | 29 | 10 |
| Metro: Last Light (2013) | 35 | 28 | 16 | 8 |
| Rise of the Tomb Raider (2016) | 21 | 13 | 7 | 6 |
Emissions
System Noise
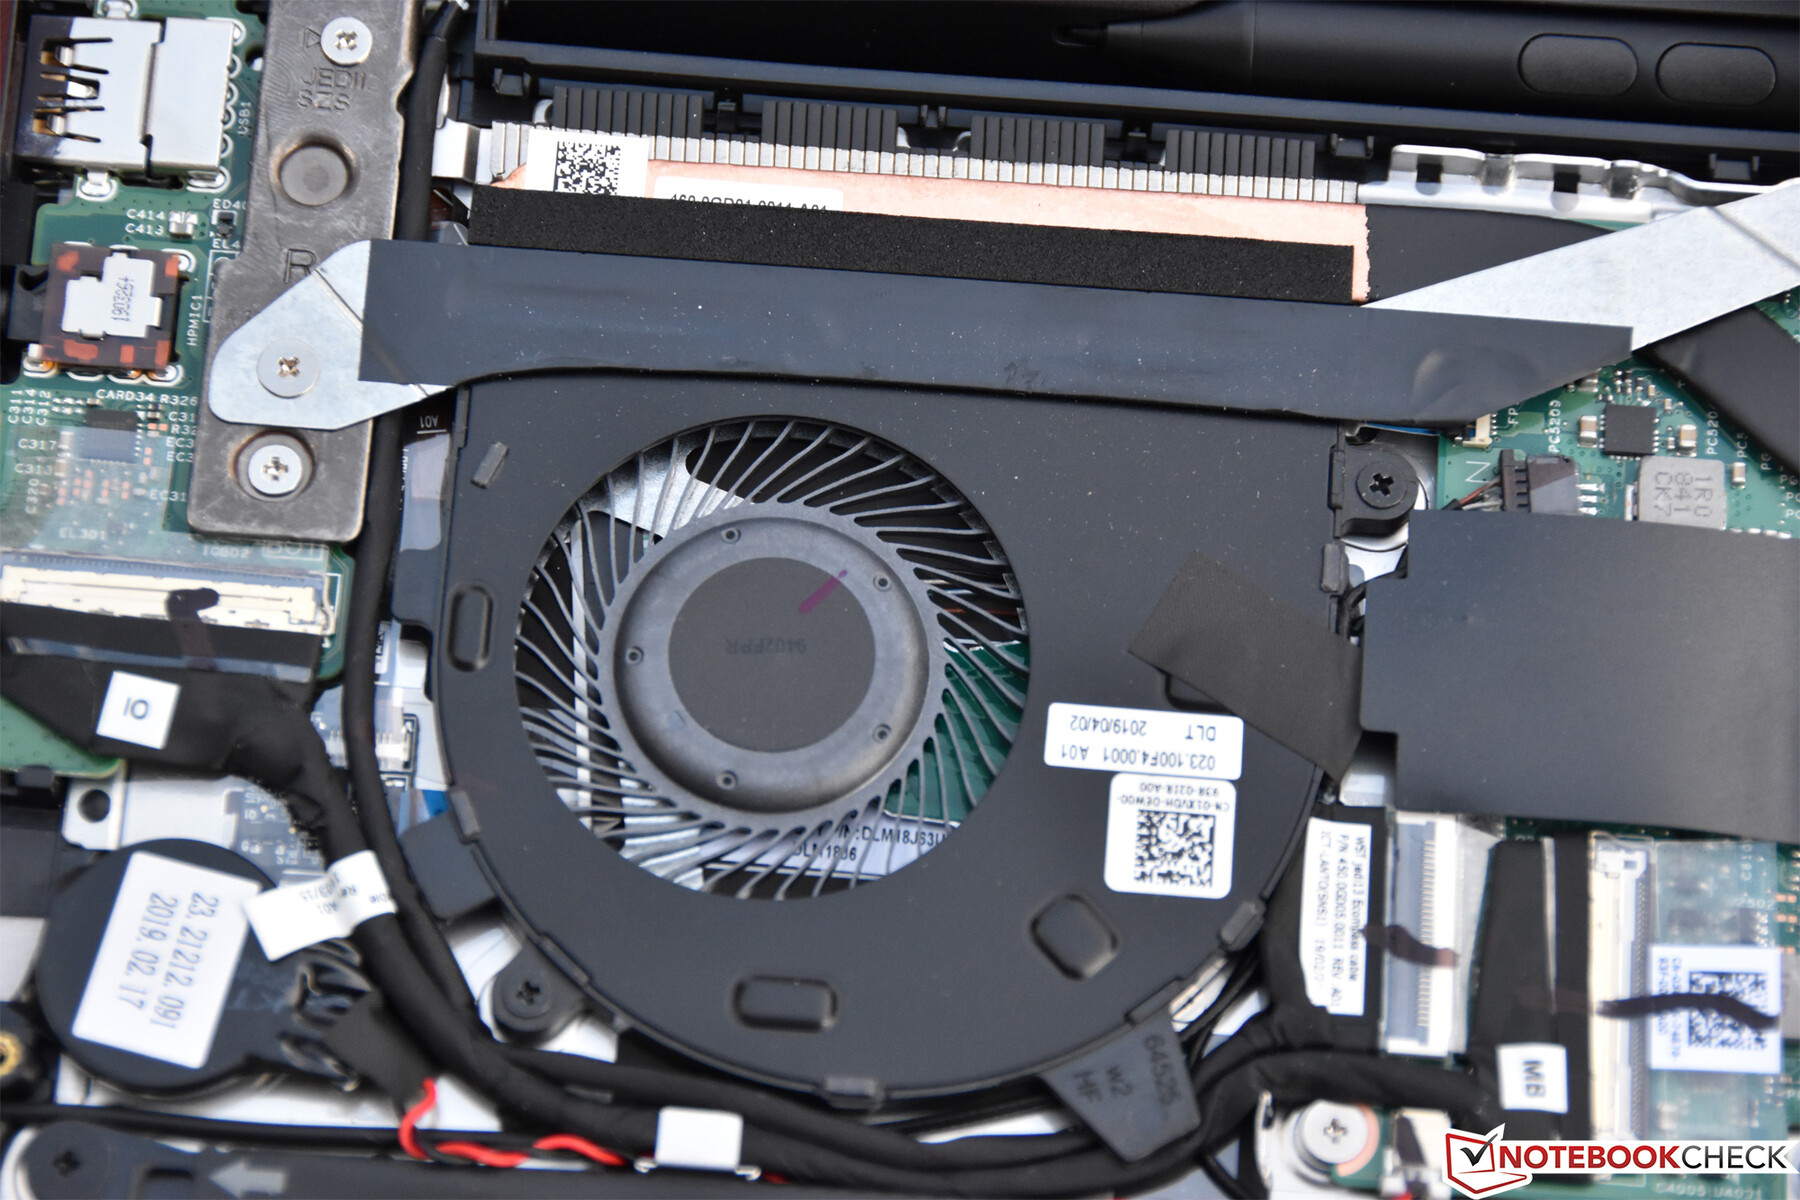
As is generally the case with today’s super-efficient ultraportables, the Inspiron 7390 2-in-1 is fully silent while idling. We noticed no electrical noise from our unit either, so in a quiet room, it’s a perfect companion. Under load, however, it does get to be pretty loud for a small convertible; we measure 37.3 dB(A) Load Average and 44.4 dB(A) Load Maximum values, levels which are, for the most part, above that of the competitors in today’s comparison field. For what it’s worth, that’s a lot louder than the 7386 ever registered on our equipment, which probably explains why we see better CPU performance from the 7390.
We didn’t notice any disruptive pulsing from the fan during normal use, whether browsing the internet or watching videos.
| Dell Inspiron 7390 2-in-1 UHD Graphics 620, i7-8565U, Intel Optane Memory H10 with Solid State Storage 32GB + 512GB HBRPEKNX0202A(L/H) | Lenovo ThinkPad X1 Yoga 2019-20QGS00A00 UHD Graphics 620, i7-8565U, WDC PC SN720 SDAPNTW-512G | HP Envy x360 13-ar0601ng Vega 10, R7 3700U, SK Hynix BC501 HFM512GDJTNG | Lenovo ThinkPad X390 Yoga-20NQS05R00 UHD Graphics 620, i7-8565U, Intel SSD Pro 7600p SSDPEKKF512G8L | Dell Latitude 7400 2-in-1 UHD Graphics 620, i7-8665U, Toshiba XG6 KXG60ZNV512G | Dell Inspiron 13 7386 UHD Graphics 620, i7-8565U, SK Hynix BC501 HFM512GDJTNG | |
|---|---|---|---|---|---|---|
| Noise | 3% | -9% | 2% | 10% | 0% | |
| off / environment * (dB) | 28.2 | 29.3 -4% | 30.5 -8% | 29.2 -4% | 28.2 -0% | 30.3 -7% |
| Idle Minimum * (dB) | 28.2 | 29.3 -4% | 32.2 -14% | 29.2 -4% | 28.2 -0% | 30.4 -8% |
| Idle Average * (dB) | 28.2 | 29.3 -4% | 32.2 -14% | 29.2 -4% | 28.2 -0% | 30.4 -8% |
| Idle Maximum * (dB) | 28.2 | 31.1 -10% | 32.2 -14% | 29.2 -4% | 28.3 -0% | 30.4 -8% |
| Load Average * (dB) | 37.3 | 32.7 12% | 40.8 -9% | 35 6% | 28.2 24% | 34.3 8% |
| Load Maximum * (dB) | 44.4 | 32.7 26% | 41.9 6% | 35 21% | 28.8 35% | 34.2 23% |
* ... smaller is better
Noise level
| Idle |
| 28.2 / 28.2 / 28.2 dB(A) |
| Load |
| 37.3 / 44.4 dB(A) |
 | ||
30 dB silent 40 dB(A) audible 50 dB(A) loud |
||
min: | ||
Temperature
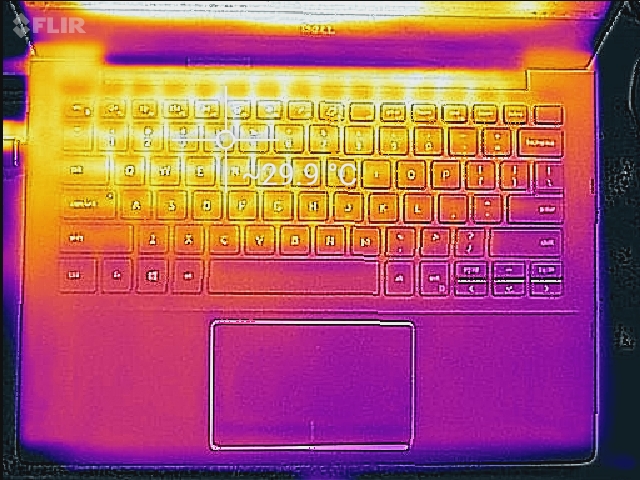
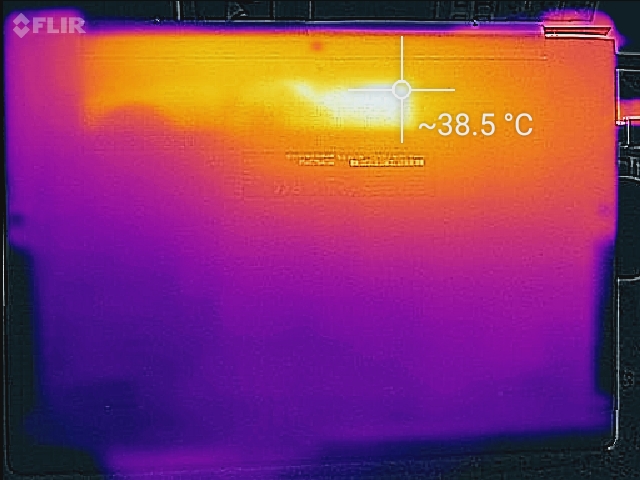
While idling, the Inspiron 7390 2-in-1’s fan is completely off, but the case does noticeably heat up, too. We measure an average of 32.5 °C on the underside, which is around 10 °C higher than room temperature—quite a disparity. There’s a warm spot of 38 °C in the center top of the machine, too, though fortunately it’s not along the sides where the user’s legs are likely to be positioned. The top side only registers an average of 28.1 °C, which is still a bit warm, but nothing like the bottom.
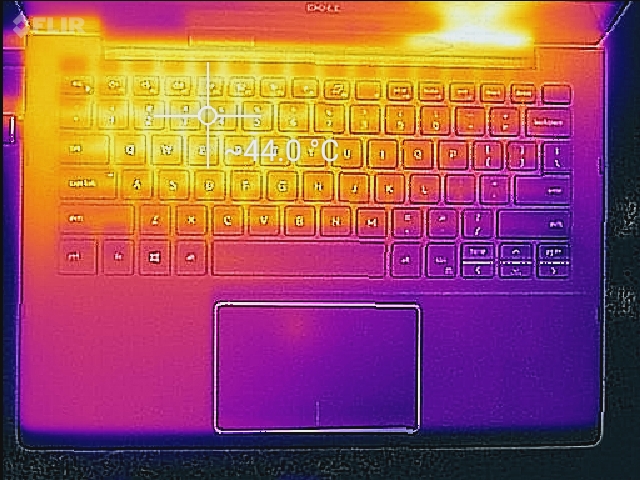
Under load, the device can get pretty toasty. We see average temperatures of 35.6 °C and 39.4 °C on top/bottom with hot spots of 42 °C and 46.6 °C. That’s uncomfortable to the touch, so as usual, it’s a good idea not to stress the machine while resting it on your lap.
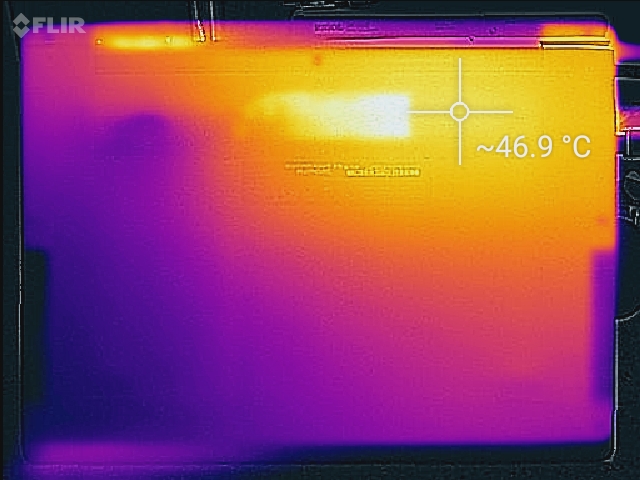
(±) The maximum temperature on the upper side is 42 °C / 108 F, compared to the average of 35.4 °C / 96 F, ranging from 19.6 to 60 °C for the class Convertible.
(-) The bottom heats up to a maximum of 46.6 °C / 116 F, compared to the average of 36.9 °C / 98 F
(+) In idle usage, the average temperature for the upper side is 28.1 °C / 83 F, compared to the device average of 30.3 °C / 87 F.
(+) The palmrests and touchpad are reaching skin temperature as a maximum (32.8 °C / 91 F) and are therefore not hot.
(-) The average temperature of the palmrest area of similar devices was 28 °C / 82.4 F (-4.8 °C / -8.6 F).
Stress Test
Speaking of stress, as always, our synthetic stress testing employs both Prime95 and FurMark, separately and simultaneously, to explore each machine’s performance limits under heavy computing loads.
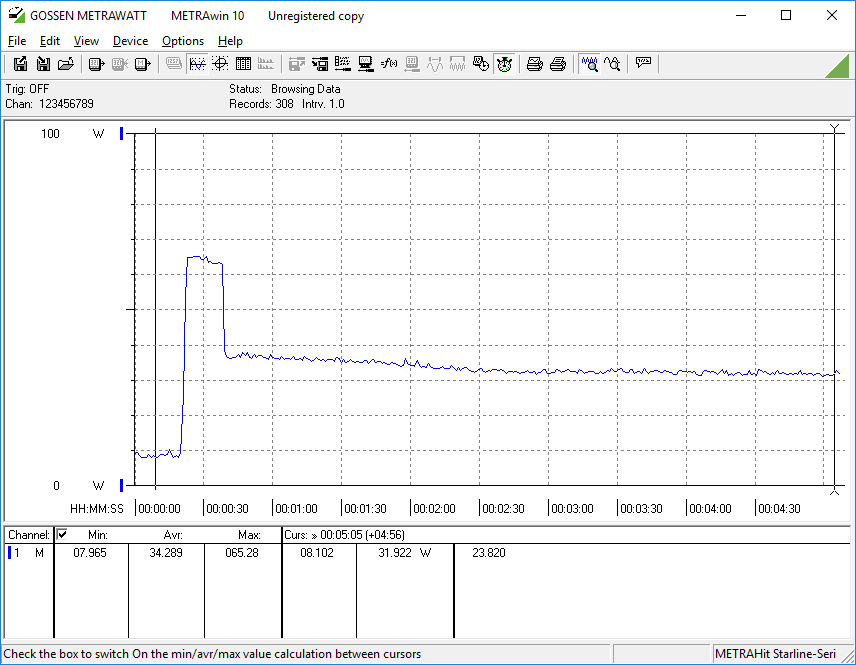
Under CPU stress, we see a brief precious few seconds of high turbo frequencies before the laptop quickly settles down into the 2.1 GHz – 2.3 GHz range permanently, but not before chip temperatures register a blistering 101 °C. At the final resting point, they eventually subside into the low 70s C, which is much more sustainable—but the device never again attempts higher clock rates until stress ceases and it cools down to idle levels again.
GPU stress follows similar trends, but with a slower increase in core temperatures (up to a max of 85 °C this time) and initial clock rates near 1150 MHz persisting for around 40 seconds before a drop down to 1000 MHz permanently thereafter.
Combined CPU and GPU stress sees CPU throttling and clearly prioritized GPU operation. The CPU remains locked at 1 – 1.1 GHz while the GPU manages to eke out 750 – 800 MHz frequencies. Temperatures remain stable at 67/68 °C.
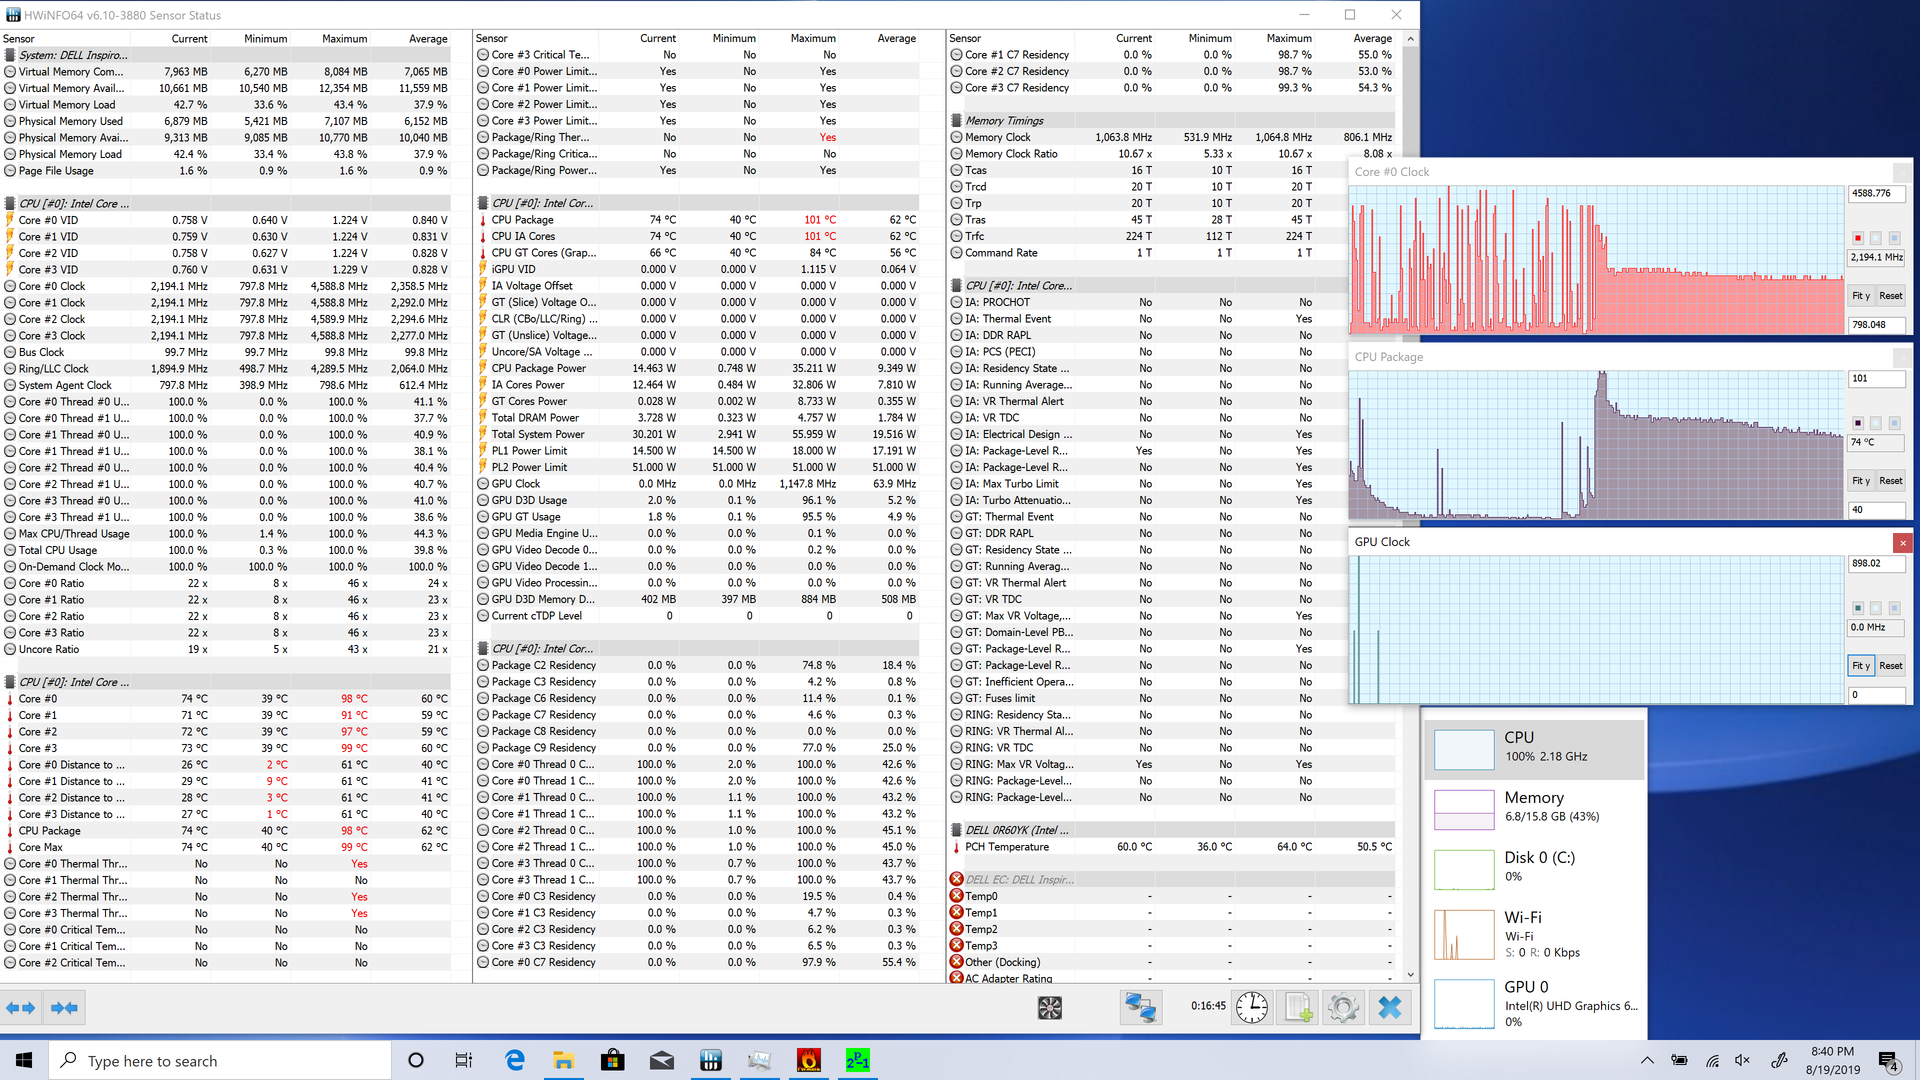
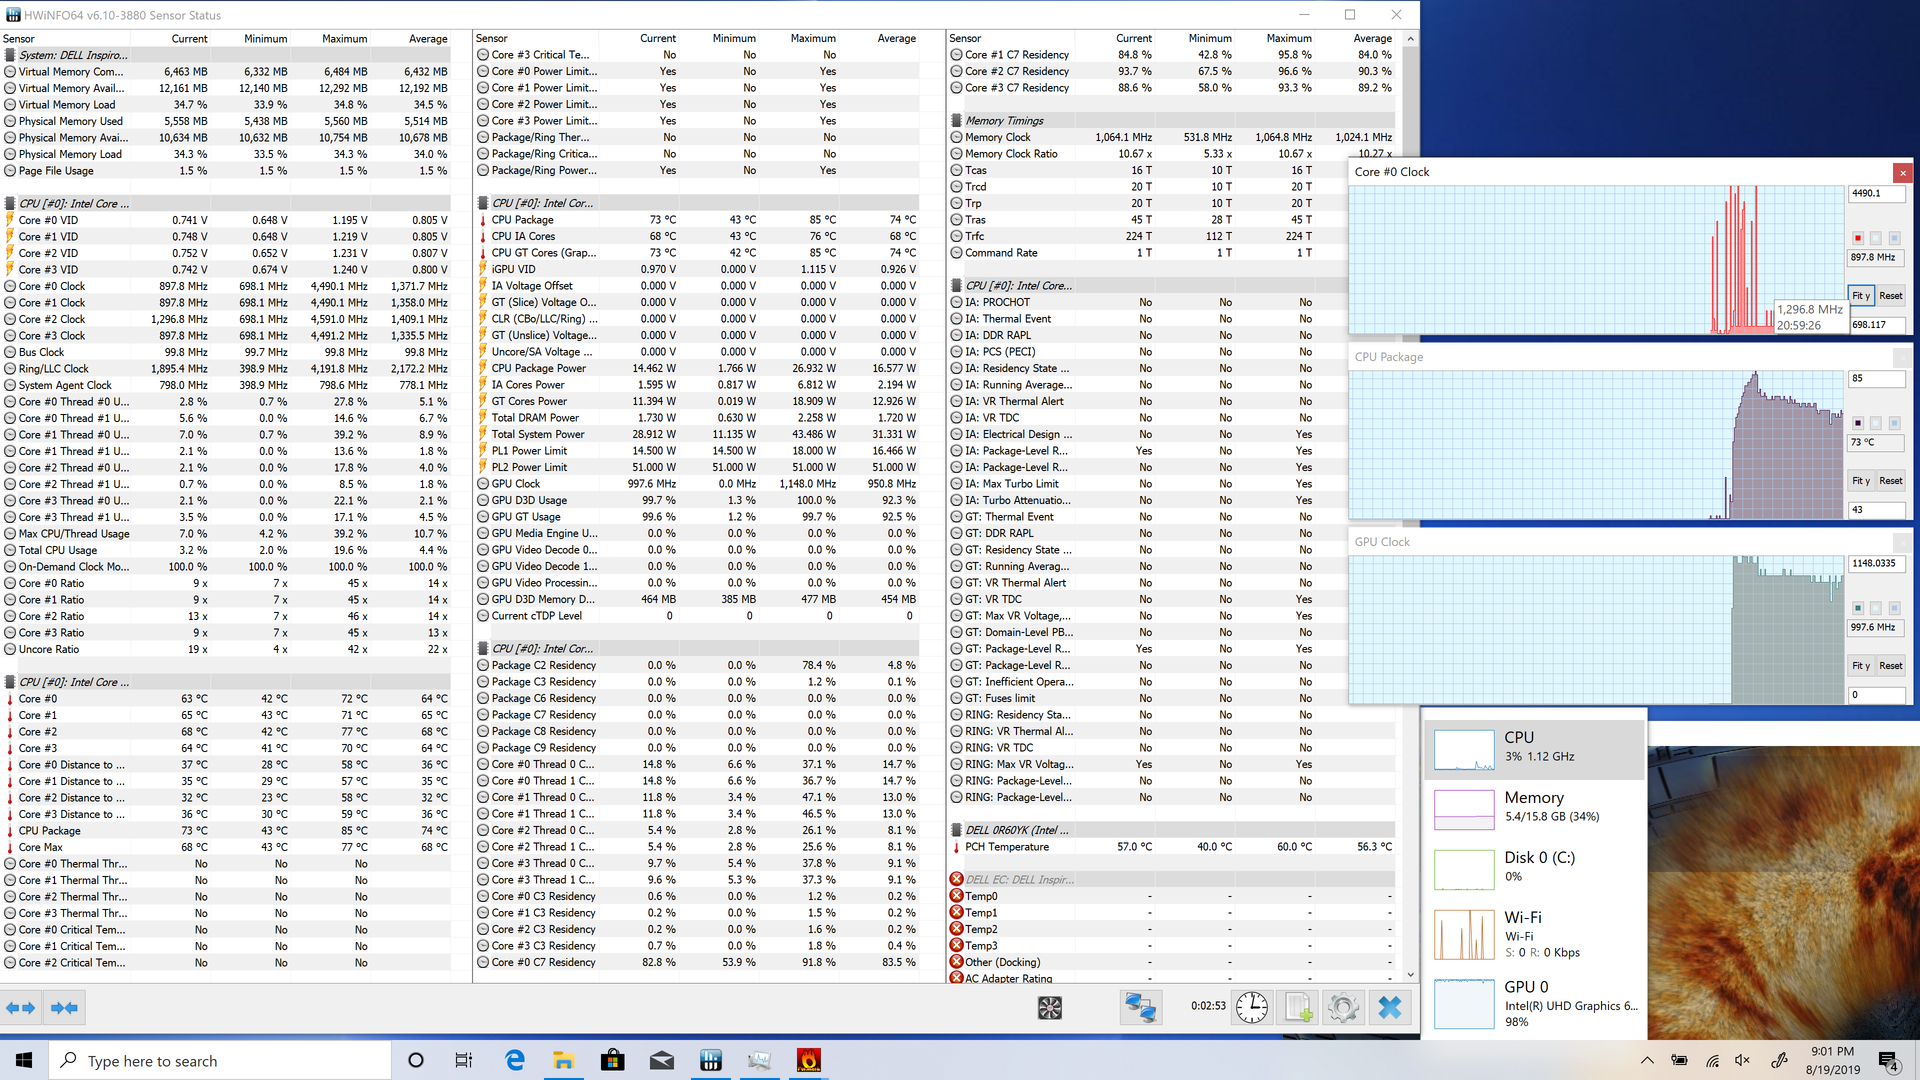
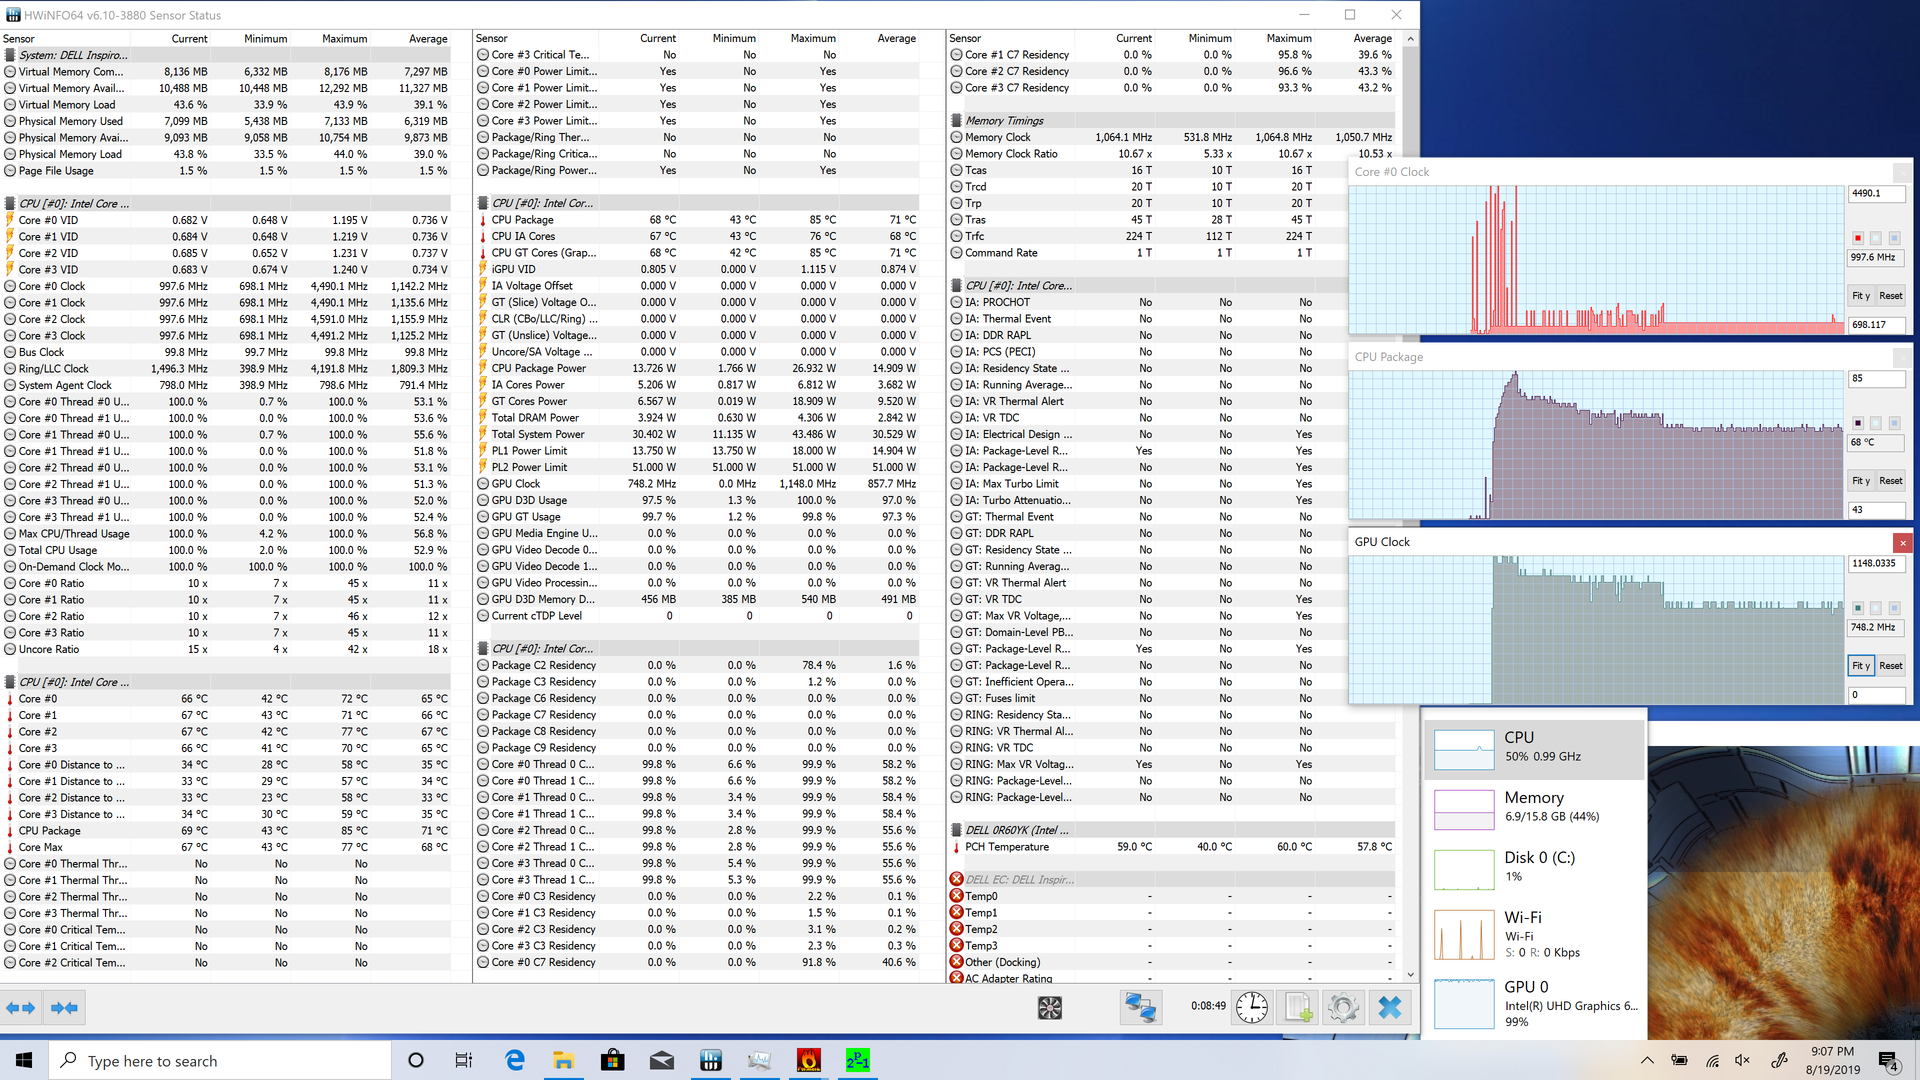
| CPU Clock (GHz) | GPU Clock (MHz) | Average CPU Temperature (°C) | Average GPU Temperature (°C) | |
| Prime95 Stress | 2.2 | - | 70 | - |
| FurMark Stress | - | 1000 | - | 67 |
| Prime95 + FurMark Stress | 1.0 | 750 | 67 | 67 |
Speakers
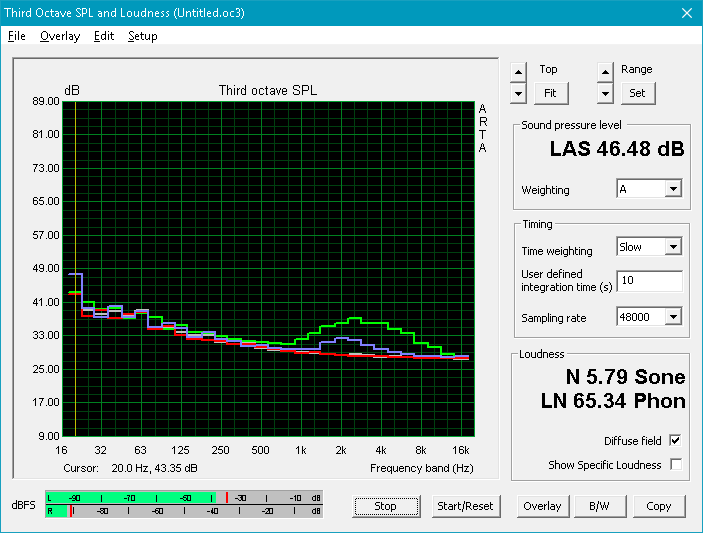
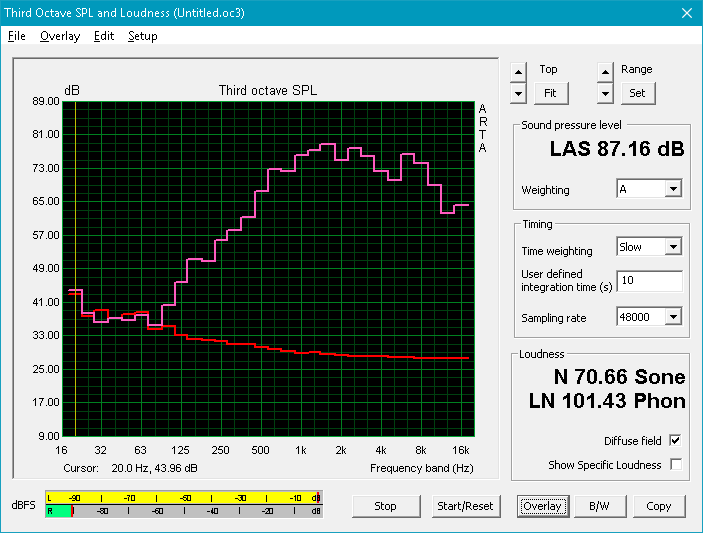
If there’s one word to describe the Inspiron 7390’s speakers, it’s loud; we record a max level of 87.16 dB, which is well above most competitors. They’re also pretty tinny, as the minute size of the laptop might lead you to expect, leaving very little room for sizable drivers. There’s almost no bass present at all, but the sound remains fairly clear, without distortion or noteworthy case vibration, at even higher volumes. Balance of the mids could be better, and the overall shape of the sound benefits from a bit of tweaking within the included MaxxAudio Pro post-processing software, but only so much can be done. For extended multimedia consumption, a good external Bluetooth speaker can’t be beat.
Dell Inspiron 7390 2-in-1 audio analysis
(+) | speakers can play relatively loud (87.2 dB)
Bass 100 - 315 Hz
(-) | nearly no bass - on average 20.3% lower than median
(±) | linearity of bass is average (9.5% delta to prev. frequency)
Mids 400 - 2000 Hz
(±) | higher mids - on average 5.1% higher than median
(±) | linearity of mids is average (7.6% delta to prev. frequency)
Highs 2 - 16 kHz
(+) | balanced highs - only 3.6% away from median
(±) | linearity of highs is average (8.2% delta to prev. frequency)
Overall 100 - 16.000 Hz
(±) | linearity of overall sound is average (21% difference to median)
Compared to same class
» 56% of all tested devices in this class were better, 10% similar, 34% worse
» The best had a delta of 6%, average was 20%, worst was 57%
Compared to all devices tested
» 58% of all tested devices were better, 7% similar, 35% worse
» The best had a delta of 4%, average was 23%, worst was 134%
Dell Latitude 7400 2-in-1 audio analysis
(+) | speakers can play relatively loud (82.9 dB)
Bass 100 - 315 Hz
(-) | nearly no bass - on average 17.3% lower than median
(±) | linearity of bass is average (11.7% delta to prev. frequency)
Mids 400 - 2000 Hz
(+) | balanced mids - only 2% away from median
(+) | mids are linear (5.3% delta to prev. frequency)
Highs 2 - 16 kHz
(+) | balanced highs - only 2.9% away from median
(±) | linearity of highs is average (7.3% delta to prev. frequency)
Overall 100 - 16.000 Hz
(±) | linearity of overall sound is average (17.3% difference to median)
Compared to same class
» 33% of all tested devices in this class were better, 8% similar, 59% worse
» The best had a delta of 6%, average was 20%, worst was 57%
Compared to all devices tested
» 32% of all tested devices were better, 8% similar, 59% worse
» The best had a delta of 4%, average was 23%, worst was 134%
Energy Management
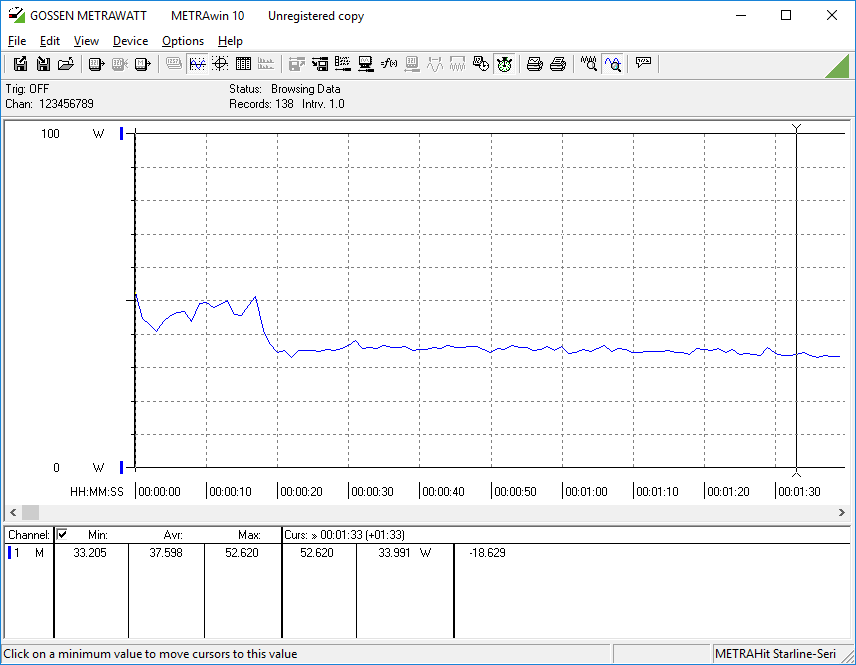
Power Consumption
The 7390 2-in-1’s power efficiency has been greatly improved over the Inspiron 7386, at least, while idling. We measure load average and maximum values of 7.5 W and 7.8 W, down from 12.2 and 12.7 previously on the 7386. That’s also below most of the competition, though the Latitude 7400 2-in-1 is the runaway winner in this race (thanks to its super-efficient FHD display panel).
| Off / Standby | |
| Idle | |
| Load |
|
Key:
min: | |
| Dell Inspiron 7390 2-in-1 i7-8565U, UHD Graphics 620, Intel Optane Memory H10 with Solid State Storage 32GB + 512GB HBRPEKNX0202A(L/H), IPS, 3840x2160, 13.3" | Lenovo ThinkPad X1 Yoga 2019-20QGS00A00 i7-8565U, UHD Graphics 620, WDC PC SN720 SDAPNTW-512G, IPS LED, 1920x1080, 14" | HP Envy x360 13-ar0601ng R7 3700U, Vega 10, SK Hynix BC501 HFM512GDJTNG, IPS, 120 Hz, 1920x1080, 13.3" | Lenovo ThinkPad X390 Yoga-20NQS05R00 i7-8565U, UHD Graphics 620, Intel SSD Pro 7600p SSDPEKKF512G8L, IPS LED, 1920x1080, 13.3" | Dell Latitude 7400 2-in-1 i7-8665U, UHD Graphics 620, Toshiba XG6 KXG60ZNV512G, IPS, 1920x1080, 14" | Dell Inspiron 13 7386 i7-8565U, UHD Graphics 620, SK Hynix BC501 HFM512GDJTNG, IPS, 3840x2160, 13.3" | |
|---|---|---|---|---|---|---|
| Power Consumption | 3% | 19% | 2% | 22% | -26% | |
| Idle Minimum * (Watt) | 4.6 | 3.8 17% | 3.2 30% | 3.46 25% | 2.6 43% | 6.5 -41% |
| Idle Average * (Watt) | 7.5 | 6.1 19% | 2.8 63% | 5.88 22% | 4.3 43% | 12.2 -63% |
| Idle Maximum * (Watt) | 7.8 | 9.1 -17% | 12.4 -59% | 9.12 -17% | 5.5 29% | 12.7 -63% |
| Load Average * (Watt) | 37.6 | 38.6 -3% | 24.2 36% | 45.6 -21% | 32 15% | 39 -4% |
| Load Maximum * (Watt) | 65.3 | 64.5 1% | 50 23% | 65.9 -1% | 78.8 -21% | 39 40% |
* ... smaller is better
Battery Life
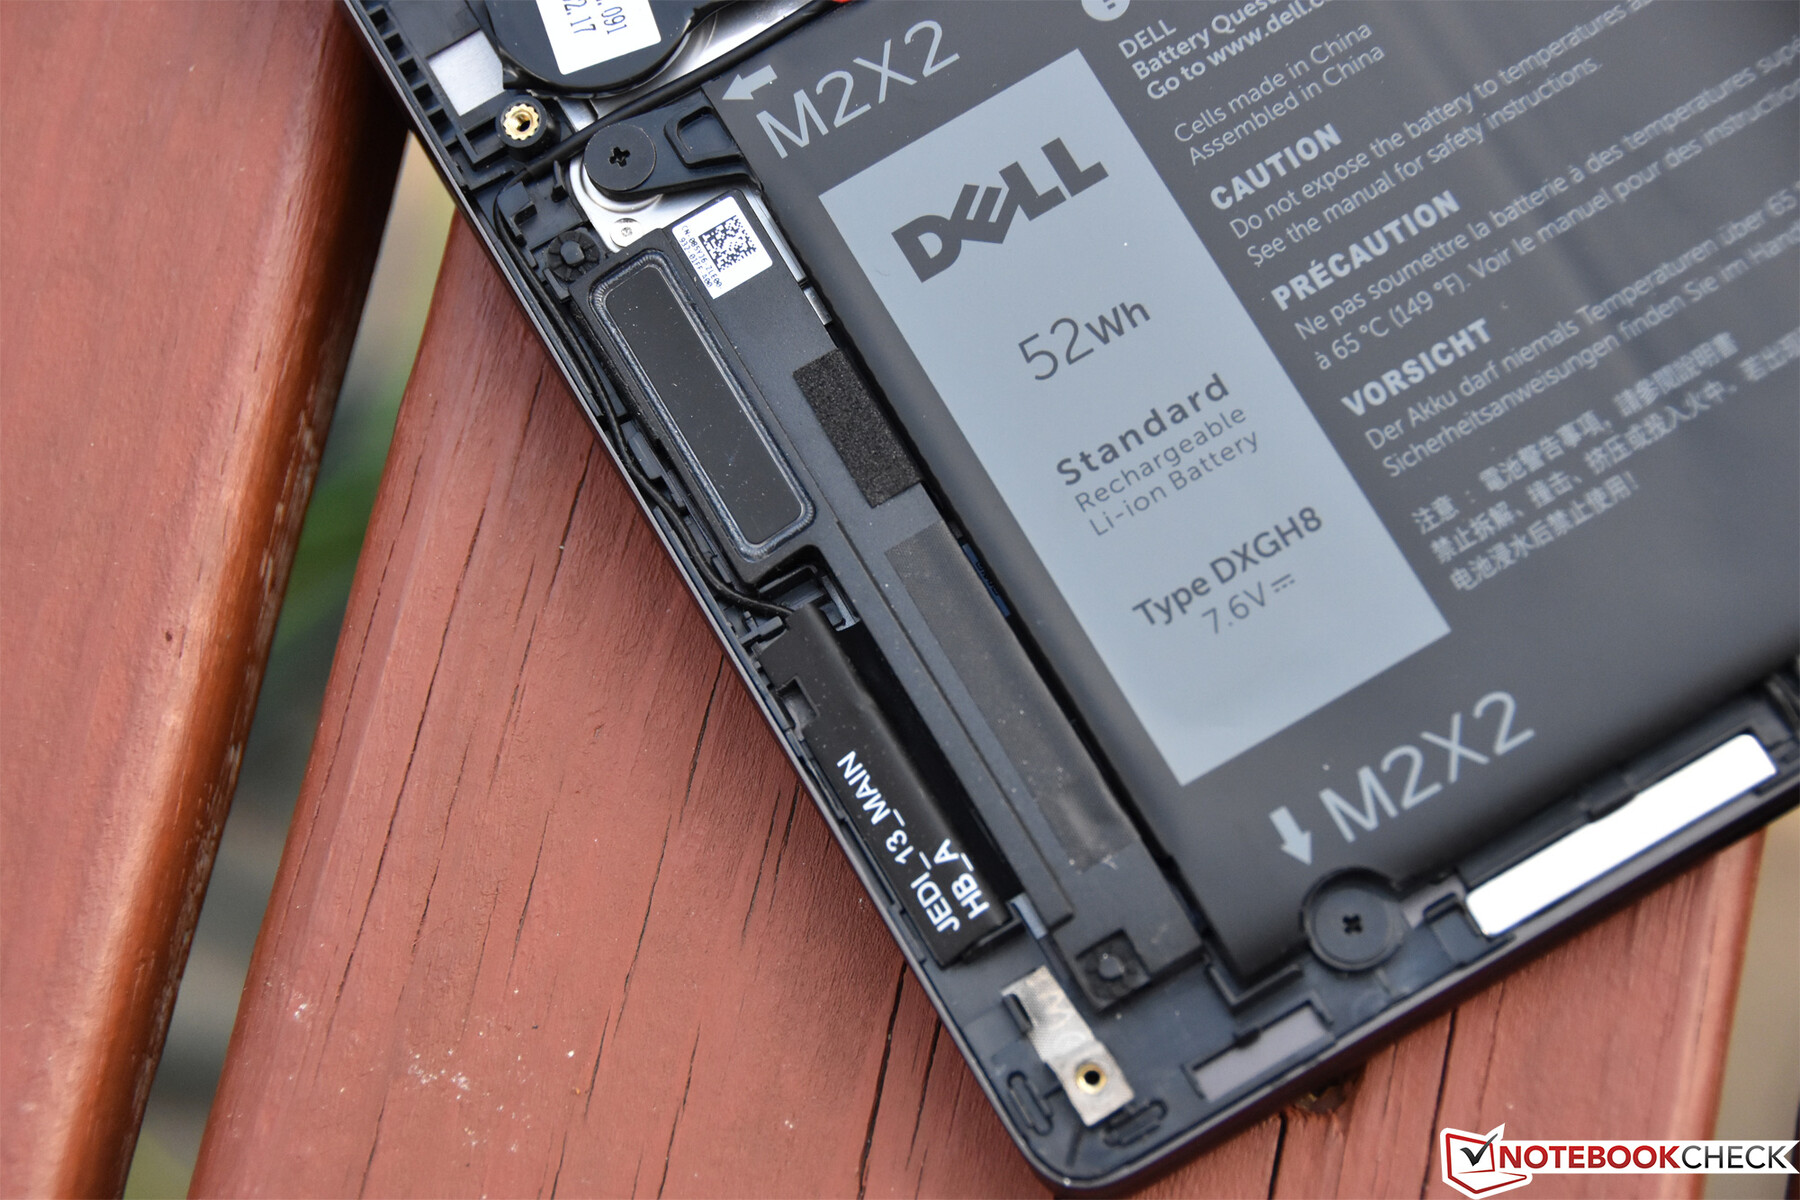
Thanks to both a much larger battery (52 Wh vs. 38 Wh) and the lower power consumption numbers we measured above, the Inspiron 7390 2-in-1 manages much longer battery runtimes than its predecessor. In our standardized Wi-Fi web surfing benchmark, we recorded 6 hours and 37 minutes of total runtime—still short of other competitors, but at least in reasonable territory. Bear in mind that, apart from the Inspiron 7386, the 7390 is the only other machine in this table that incorporates a UHD display (the rest are FHD)—so that surely plays a large part in the discrepancy here. It’s too bad that there isn’t an FHD option for the Inspiron 7390 or we might see numbers closer to the two Yogas; the Latitude 7400, meanwhile, boasts a massive 78 Wh battery alongside its FHD display—so naturally it leaves the rest of the competitors in the dust.

| Dell Inspiron 7390 2-in-1 i7-8565U, UHD Graphics 620, 52 Wh | Lenovo ThinkPad X1 Yoga 2019-20QGS00A00 i7-8565U, UHD Graphics 620, 51 Wh | HP Envy x360 13-ar0601ng R7 3700U, Vega 10, 53 Wh | Lenovo ThinkPad X390 Yoga-20NQS05R00 i7-8565U, UHD Graphics 620, 50 Wh | Dell Latitude 7400 2-in-1 i7-8665U, UHD Graphics 620, 78 Wh | Dell Inspiron 13 7386 i7-8565U, UHD Graphics 620, 38 Wh | |
|---|---|---|---|---|---|---|
| Battery runtime | 2% | -0% | -3% | 85% | -39% | |
| Reader / Idle (h) | 12.7 | 10.5 -17% | 6.7 -47% | |||
| WiFi v1.3 (h) | 6.6 | 9 36% | 7.3 11% | 8.2 24% | 12.2 85% | 3.9 -41% |
| Load (h) | 2.1 | 1.4 -33% | 2.2 5% | 1.5 -29% | 1.5 -29% |
Pros
Cons
Verdict
The $1249 (as configured) Dell Inspiron 7390 2-in-1 Black Edition might not look much different from its predecessor, but it actually addresses a few of the biggest complaints we had about the Inspiron 7386 2-in-1. Chief among these are idle power consumption, which has dropped by nearly half, and battery life, which is 40% longer than before. We also detected no coil whine from our review unit, and the screen is a bit brighter than before. Even CPU performance is also a notch above where it was previously, despite the fact that both machines are powered by the same chip.
Beyond that, the UHD display is attractive, with fairly good color reproduction and calibration out of the box, and the redesigned power button (with integrated fingerprint reader) and keyboard layout works well in our opinion. The construction and case design is good for its class, and it seems a bit sturdier than some of the thinner metal competitors. Finally, Dell’s clever new hinge design, which incorporates a magnetic cavity for the included Dell Active Pen, is one of the better storage solutions we’ve seen for a full-sized stylus.
The Inspiron 7390 2-in-1 improves on its predecessor in a variety of ways—most notably, much better battery life and even better performance. Despite a few complaints regarding the input devices and questionable value of the Core i7 CPU, it represents a serious alternative to competitors from manufacturers like Lenovo and HP.
Still, some of the same complaints remain. Performance is still underwhelming in context with the results posted by cTDP Up competitors like Lenovo’s ThinkBook 13s, which are actually better. Port selection is thin, and the lack of Thunderbolt 3 and a Kensington Lock port will bother some users. The keyboard is reasonably good, but feedback and actuation force could be better. Likewise, the integrated touchpad buttons require far too much force to engage and become rather exhausting to operate after a while. Finally, while the display is certainly nice, it would have been good to have an FHD option, which would have greatly boosted battery life—and the real estate likely wouldn’t be missed by most users.
Some direct competitors worth considering include the ThinkPad X1 Yoga, HP Envy x360 13, ThinkPad X390 Yoga, and—on the pricier side—the Latitude 7400 2-in-1. Apart from the niggles about the input devices and lamentations surrounding higher-priced chips hardly pulling their weight, though, the Inspiron 7390 2-in-1 now looks like a reasonable alternative to the popular Yoga and x360 series convertibles that towered above its predecessor.
Dell Inspiron 7390 2-in-1
- 08/23/2019 v6 (old)
Steve Schardein
Price comparison
