Hot Ice: Dell XPS 13 7390 2-in-1 Core i3 Laptop Review
(October 25, 2019 update: Dell had previously stated in guidelines that the XPS 13 7390 2-in-1 series would incorporate GORE aerogel for cooling as found on the XPS 15 9575 series. The manufacturer has corrected the error to confirm that the XPS 13 7390 2-in-1 does *not* have GORE aerogel cooling. Mentions of GORE have been removed from this page as a result.)
Dell unveiled its first generation XPS 13 9365 2-in-1 convertible at CES 2017. While the model was praised for its visual design, it ultimately left a lot of users disappointed in terms of performance because of its slower 4.5 W Core Y CPUs. The system was essentially an expensive souped-up netbook instead of the proper 2-in-1 Ultrabook that it was marketed to be.
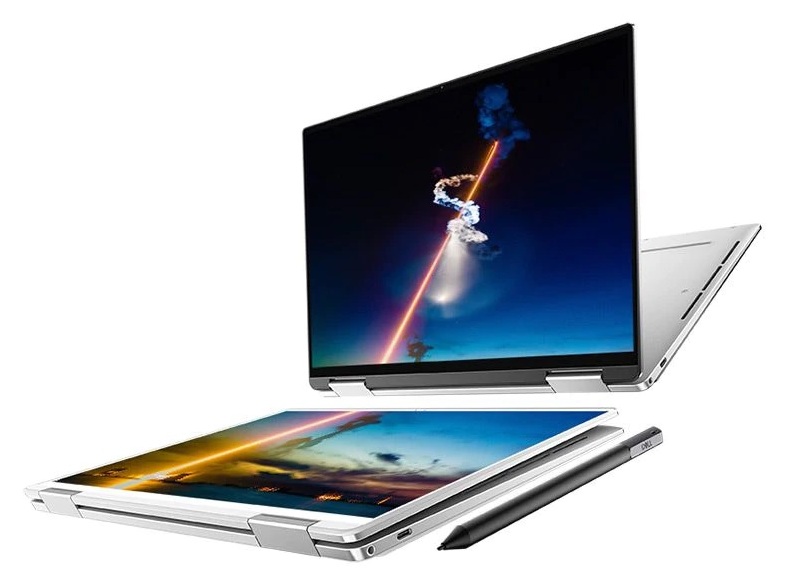
Fast-forward to Computex 2019 where Dell unveiled its second generation XPS 13 7390 2-in-1 to replace the aforementioned 2017 model. The redesigned chassis holds a lot of "world first" features for its size class including vapor chamber cooling, MagLev keyboard keys, and a 13.4-inch 16:10 display all powered by Intel's brand new 10th gen 15 W Ice Lake-U processor. It's an ambitious endeavor similar in vein to last year's Kaby Lake-G-powered XPS 15 9575 2-in-1.
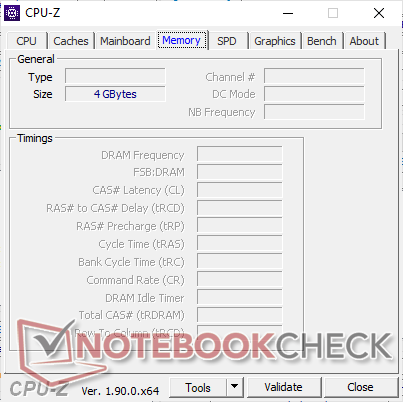
Current SKUs range from the Core i3-1005G1 CPU, integrated UHD Graphics G1 GPU, FHD (1200p) touchscreen, 4 GB LPDDR4 RAM, and 256 GB SSD option for $1000 USD up to the Core i7-1065G7 CPU, integrated Iris Plus Graphics GPU, 4K (2400p) touchscreen, 32 GB LPDDR4x RAM, and a 1 TB NVMe SSD for $2600 USD. Our test unit today is the least expensive Core i3 FHD configuration to see what an entry-level Ice Lake-U SKU is capable of. Expect a separate review on the highest-end Core i7 4K configuration at a later date for a direct comparison between the two.
Competitors to the XPS 13 7390 2-in-1 include other flagship convertibles or 2-in-1s like the HP Spectre x360 13, HP EliteBook x360 1040, Asus ZenBook Flip 14, Lenovo Yoga C930, Samsung Notebook 9 Pen, and the Microsoft Surface Book 2. This particular XPS convertible family is one of the first to be Intel Athena certified.
More Dell XPS reviews:
Case
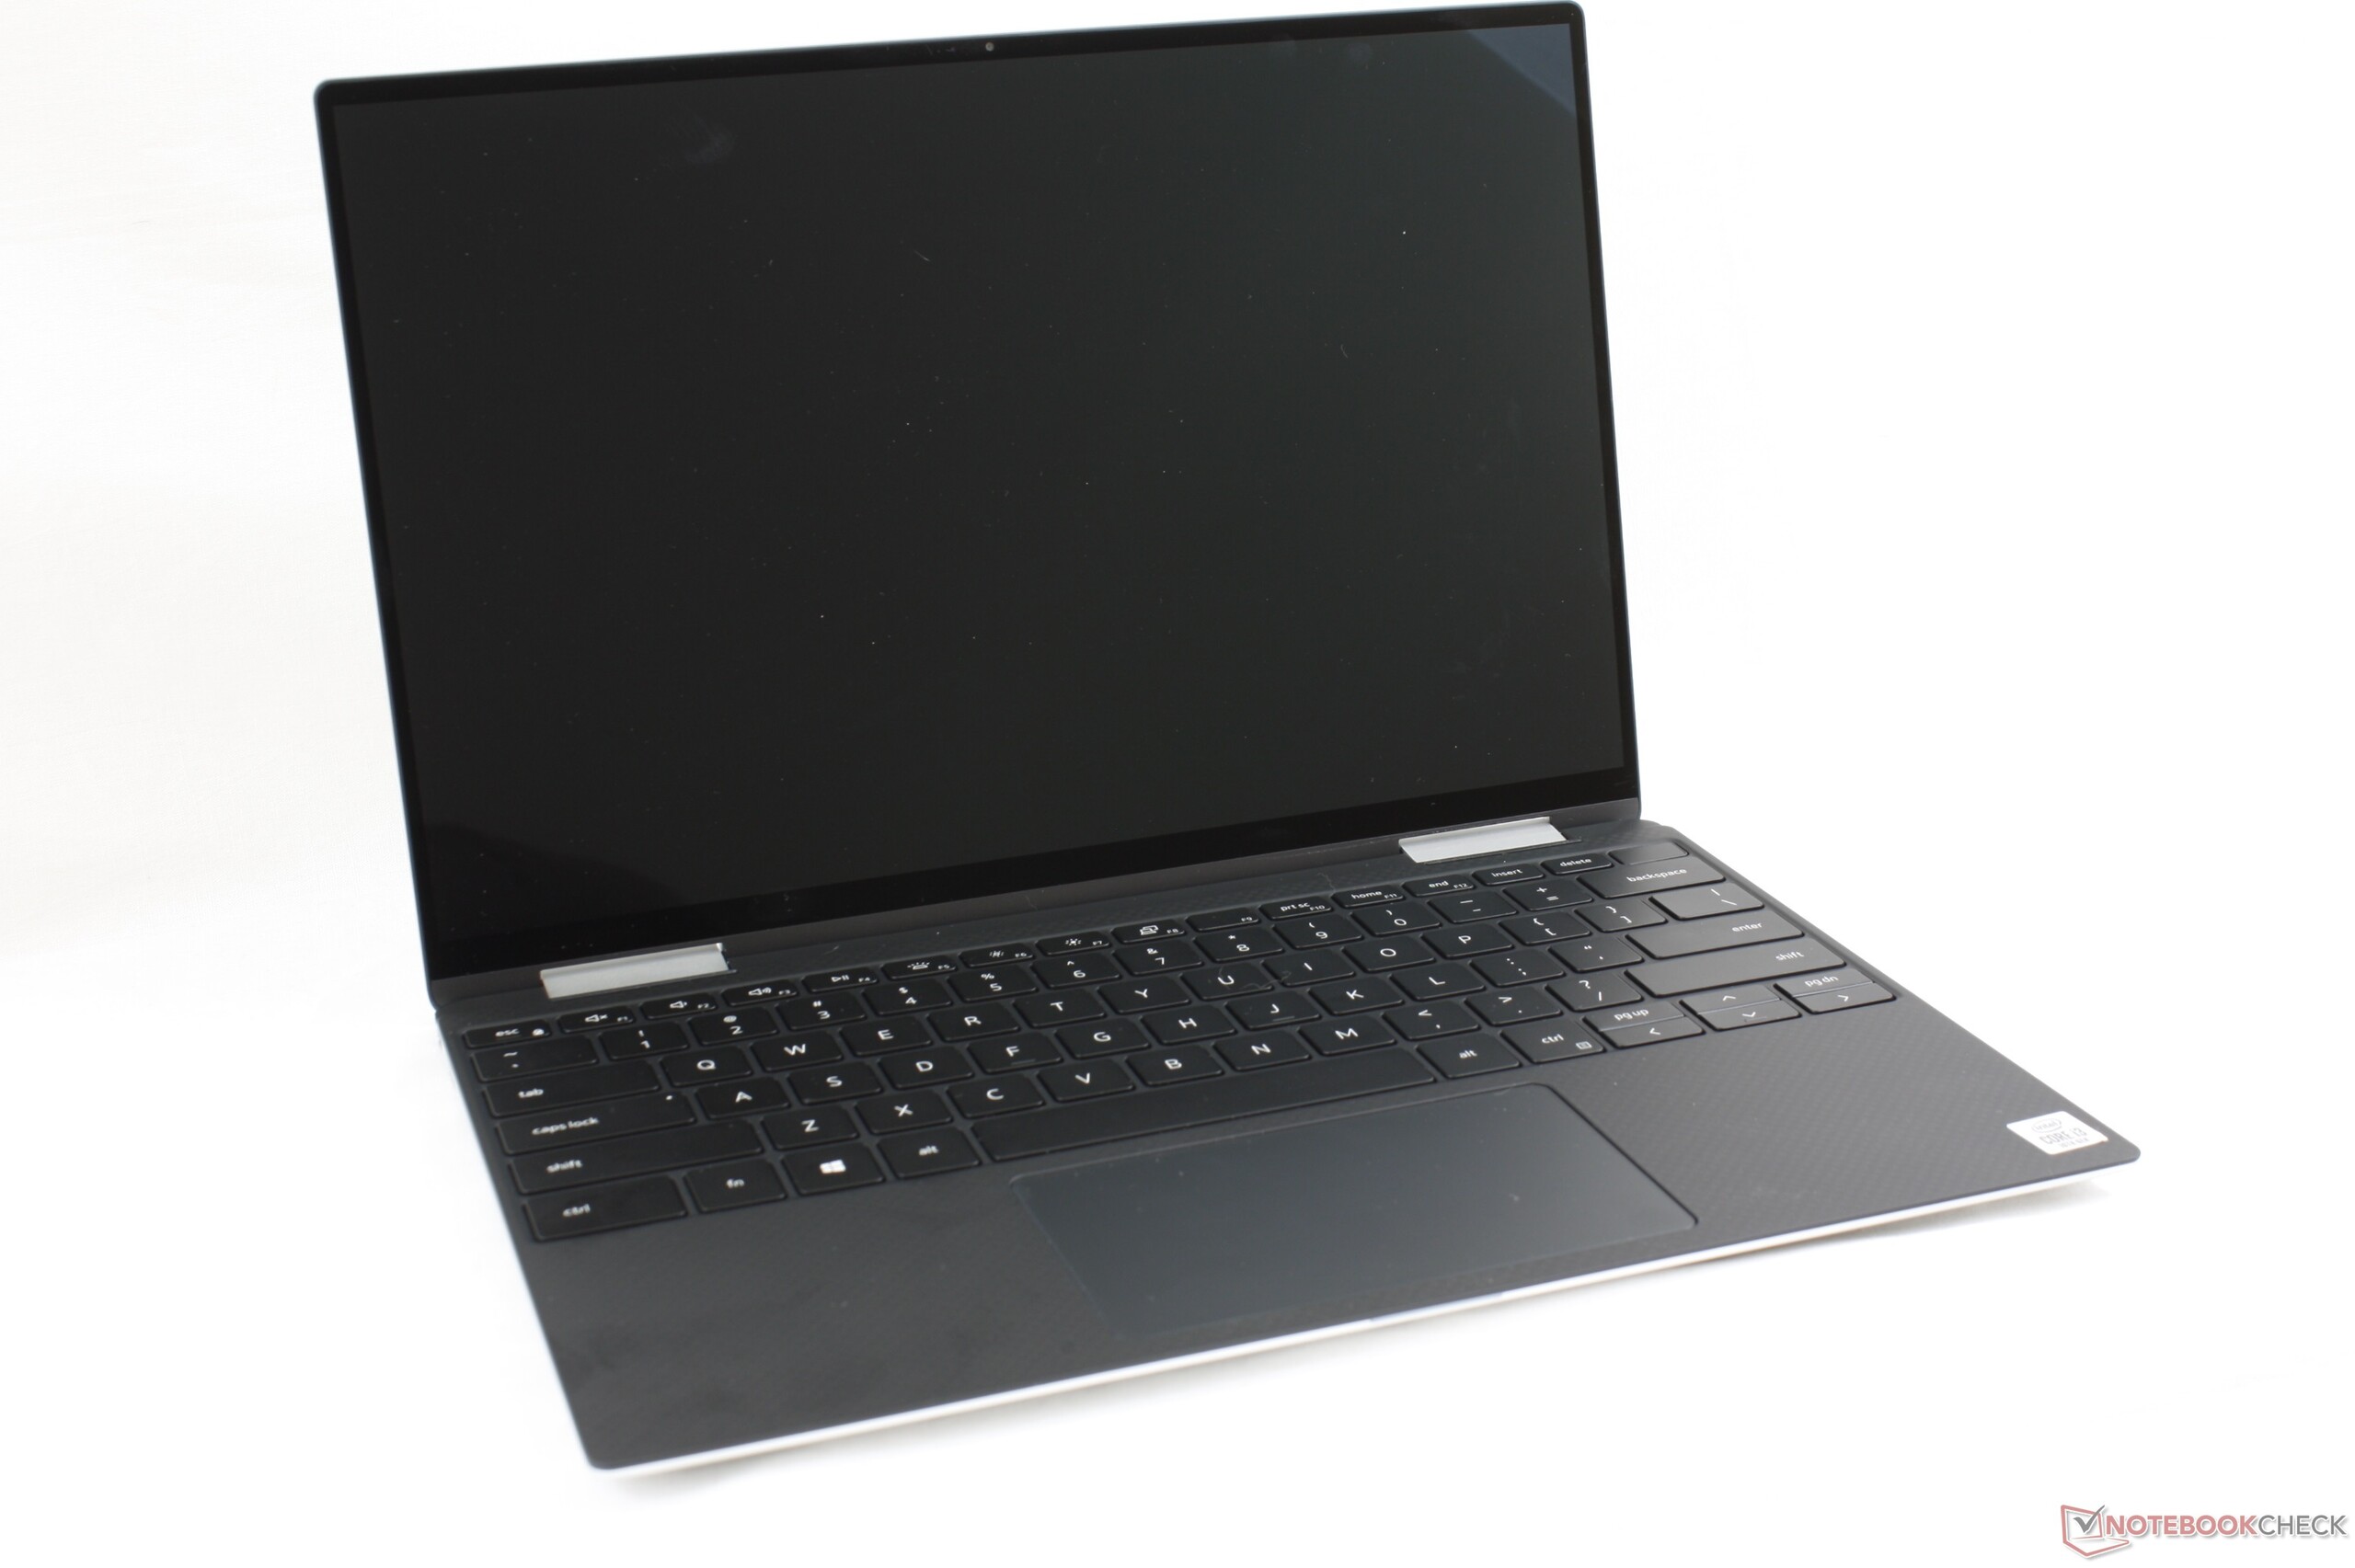
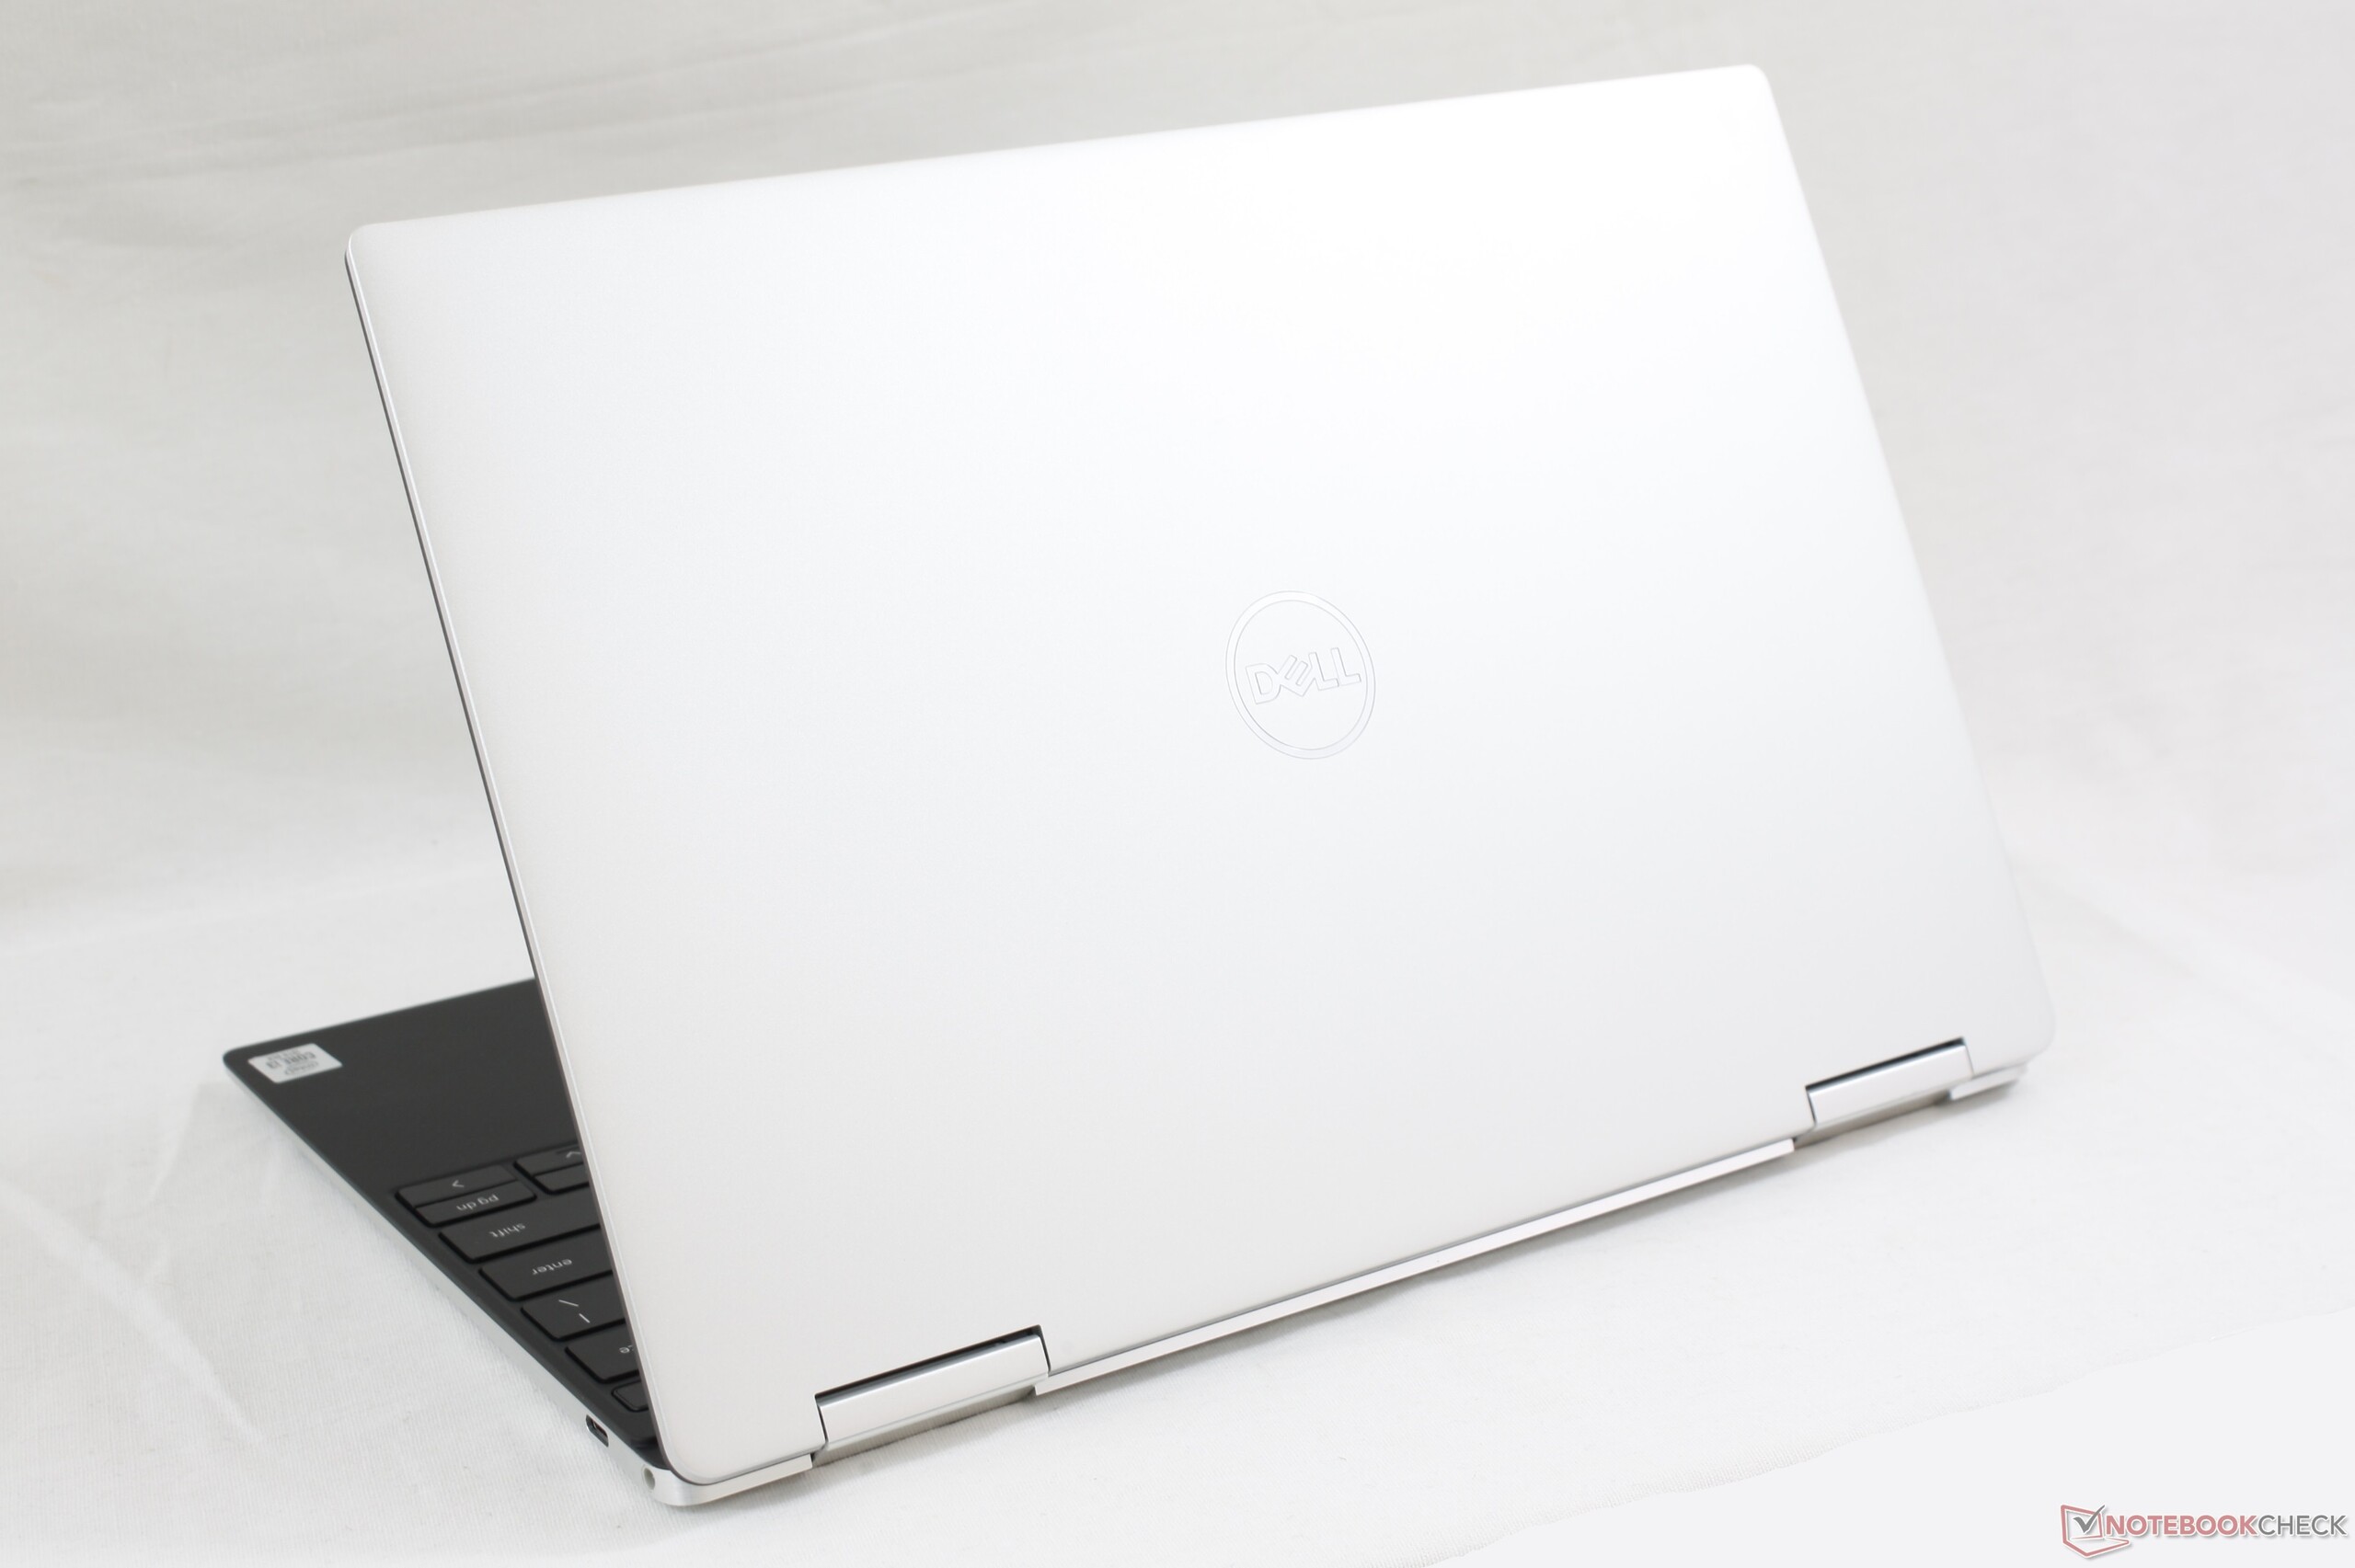
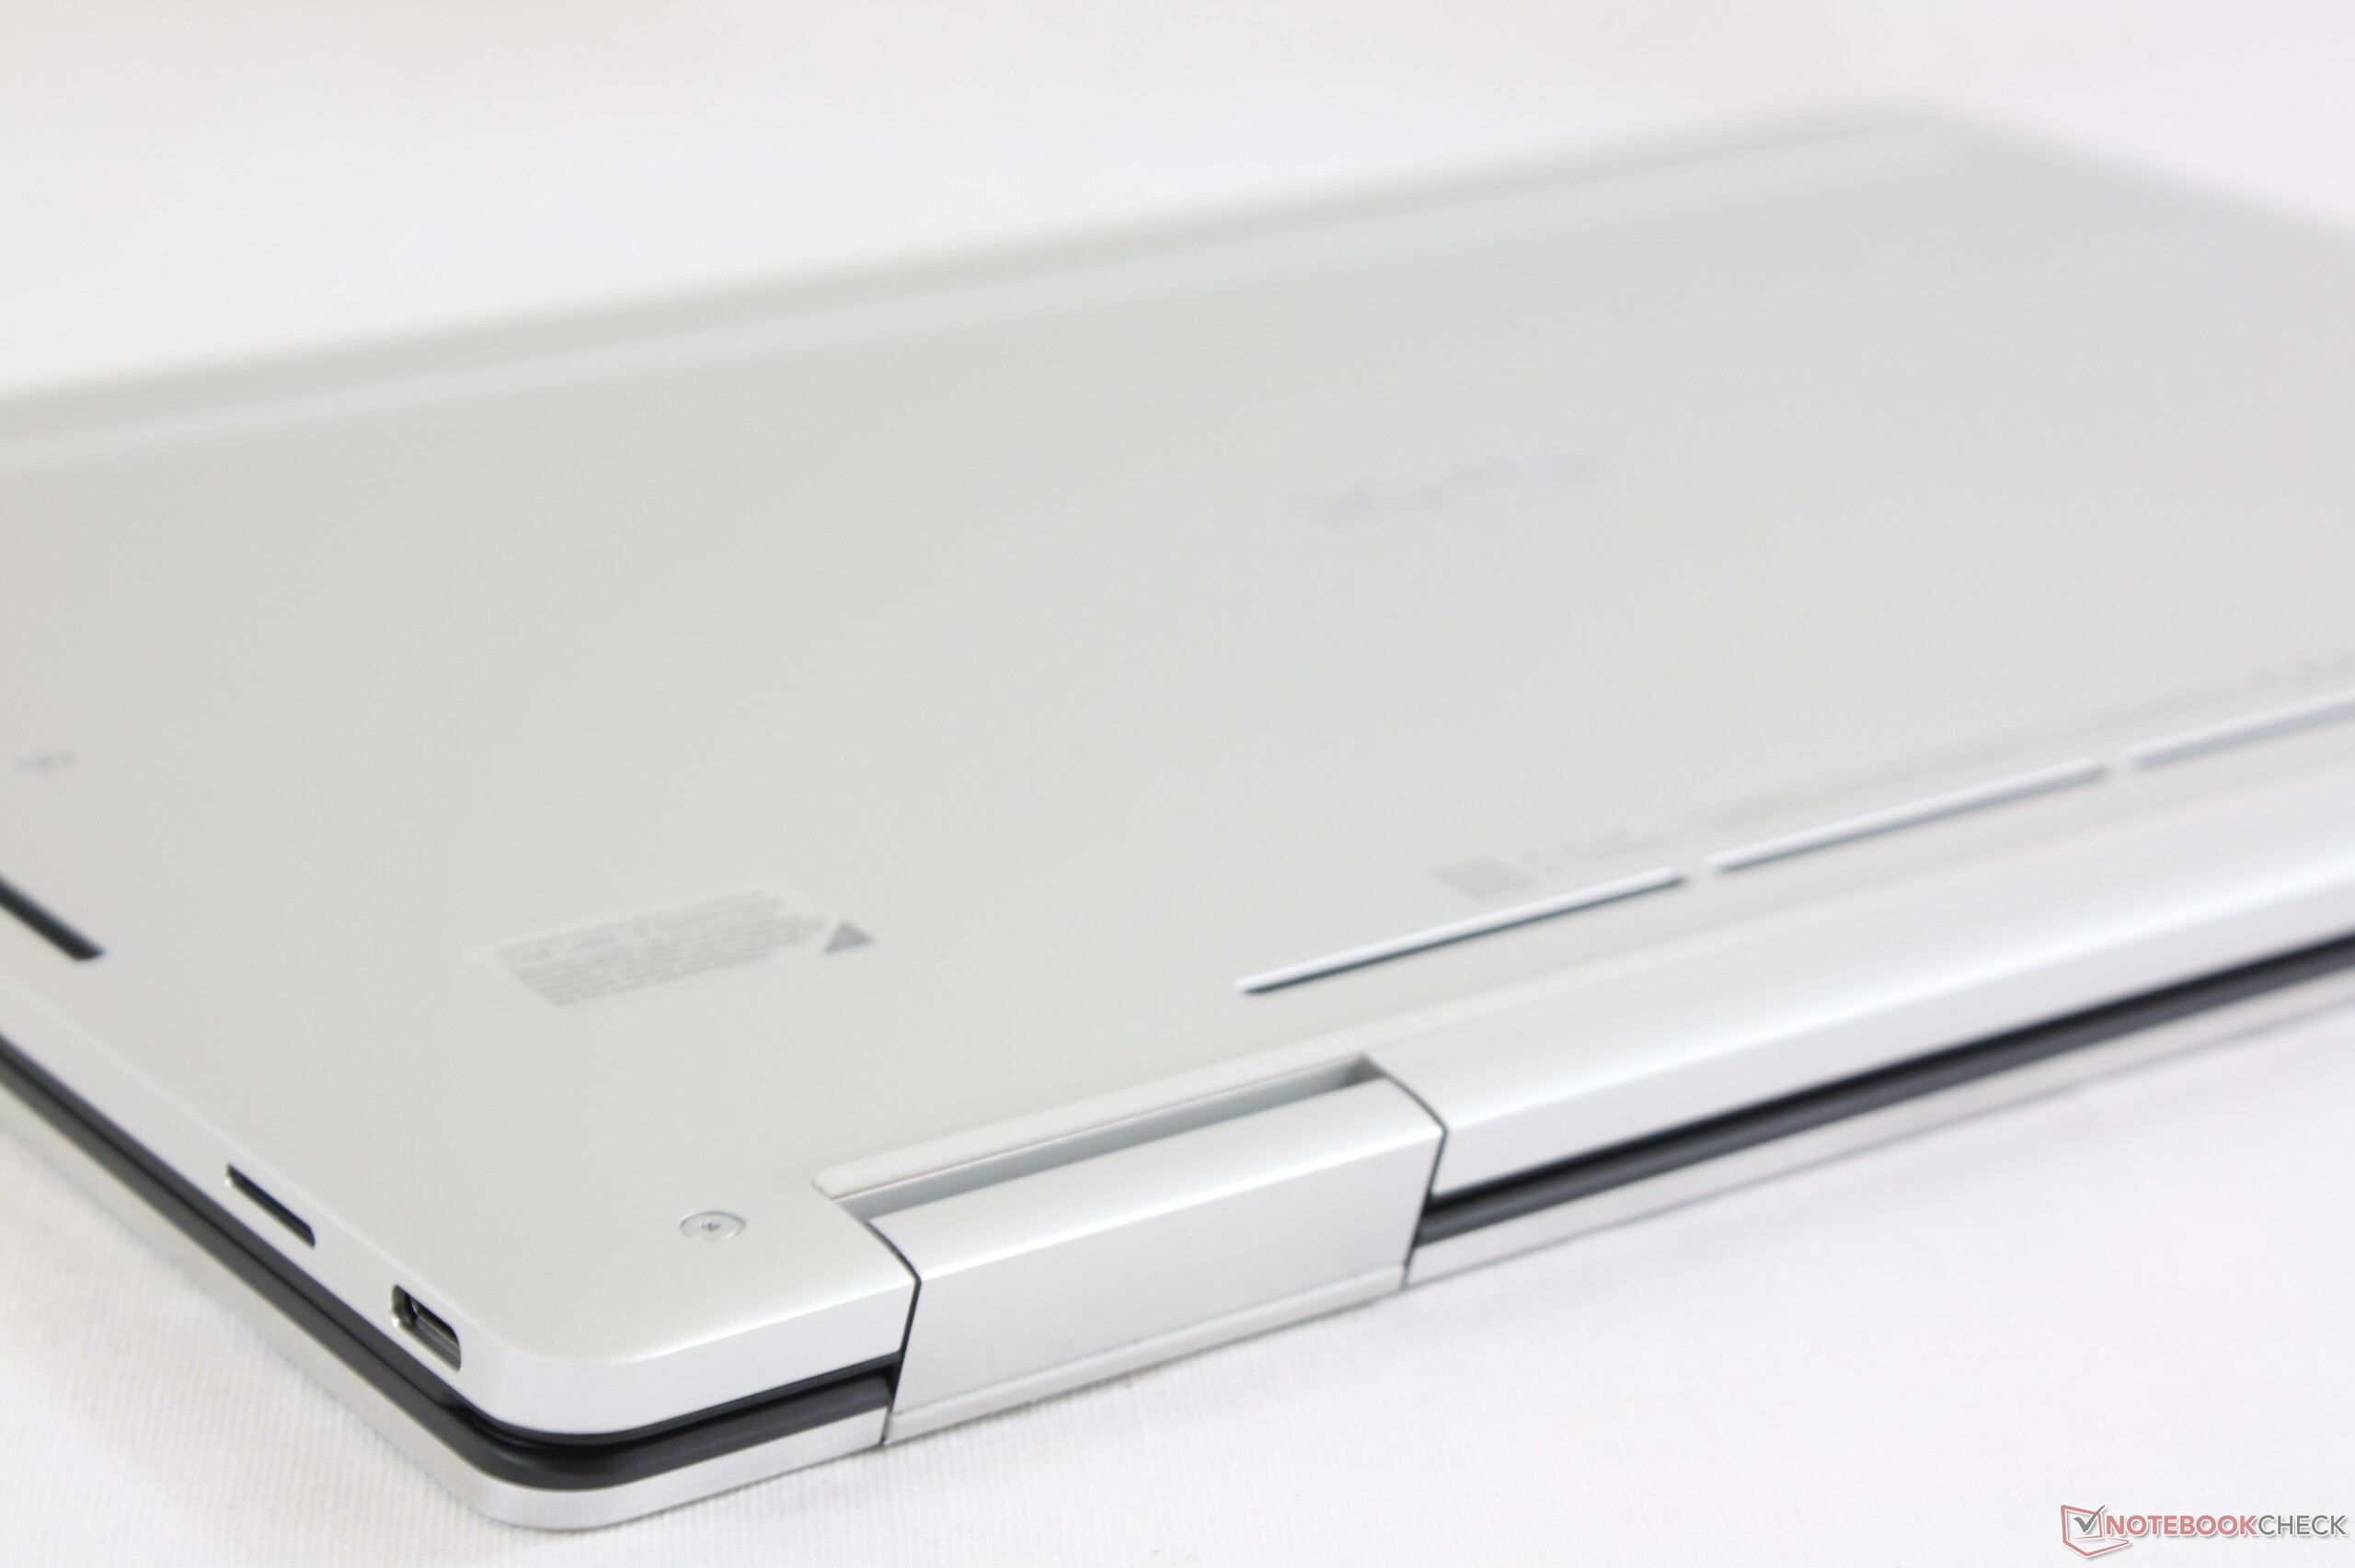
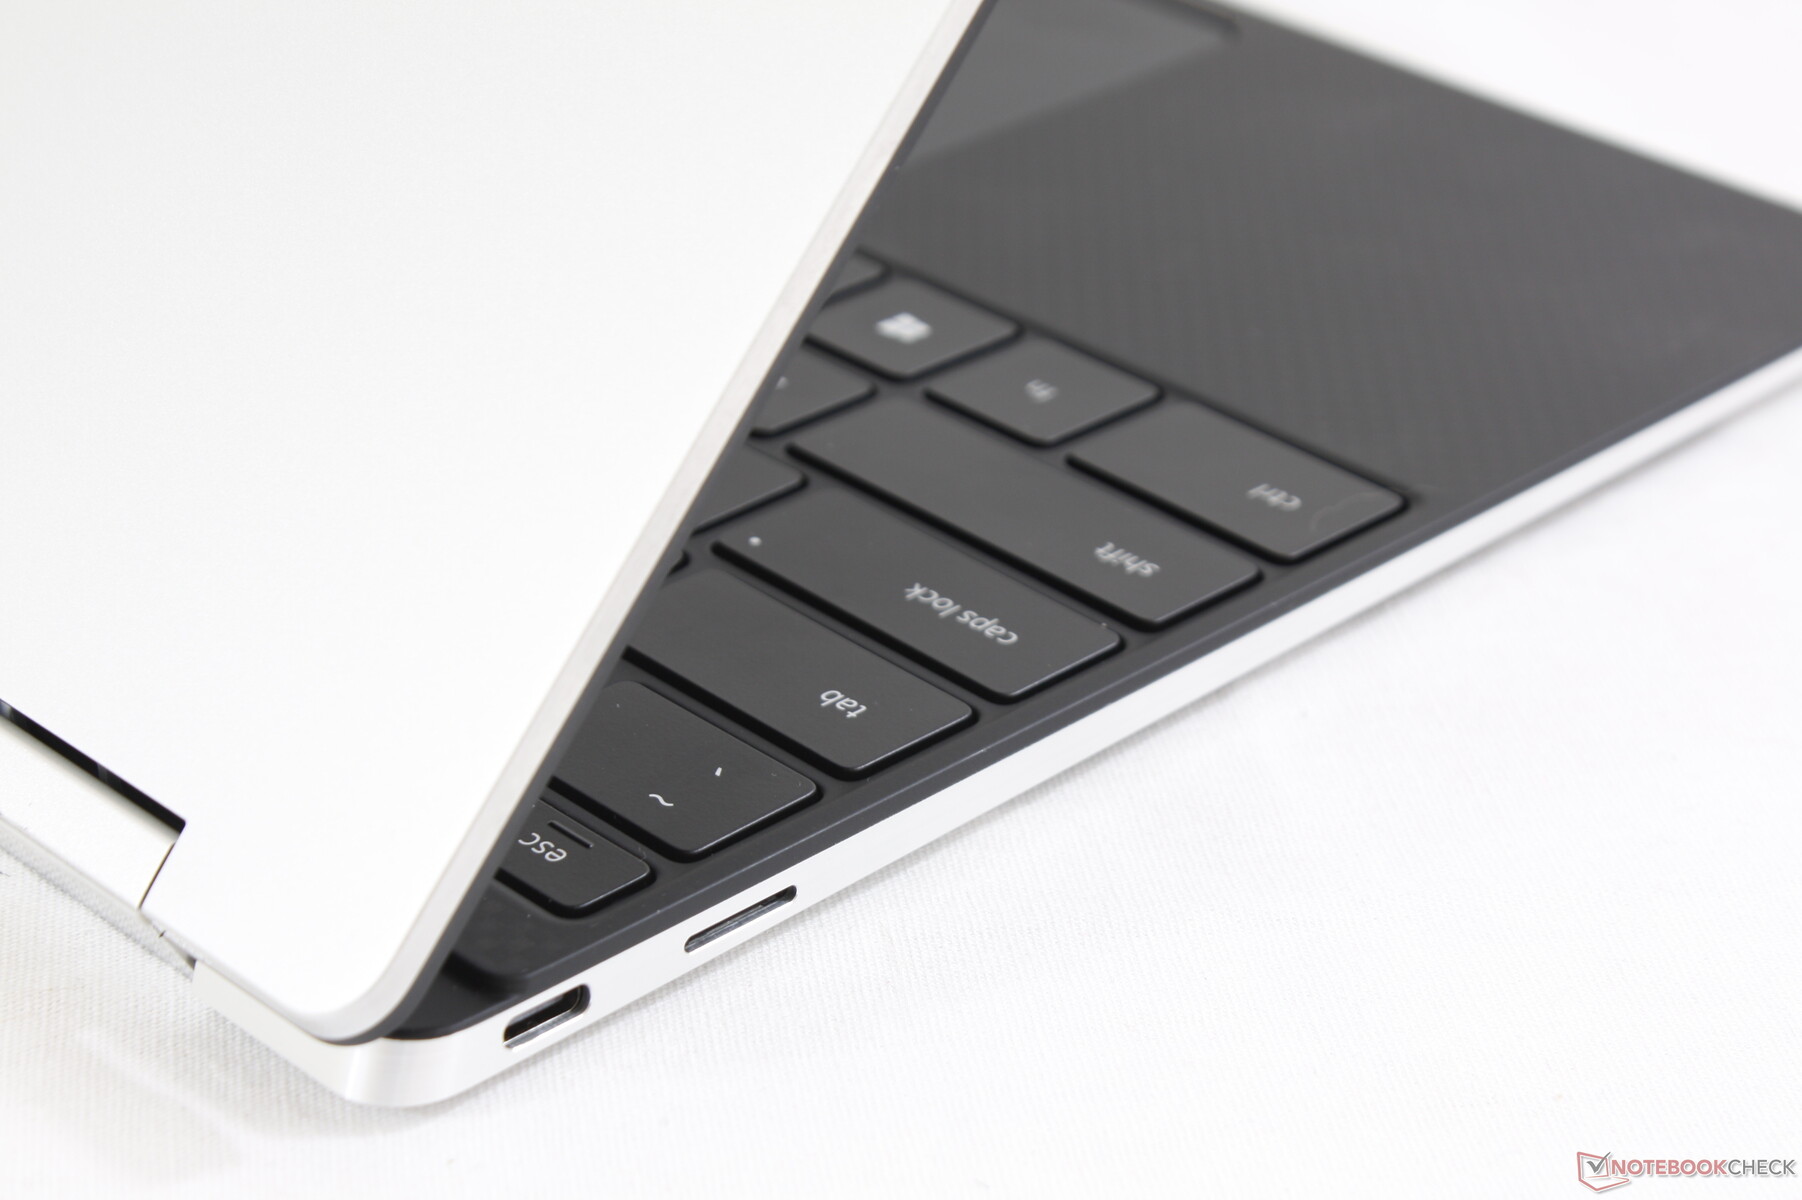
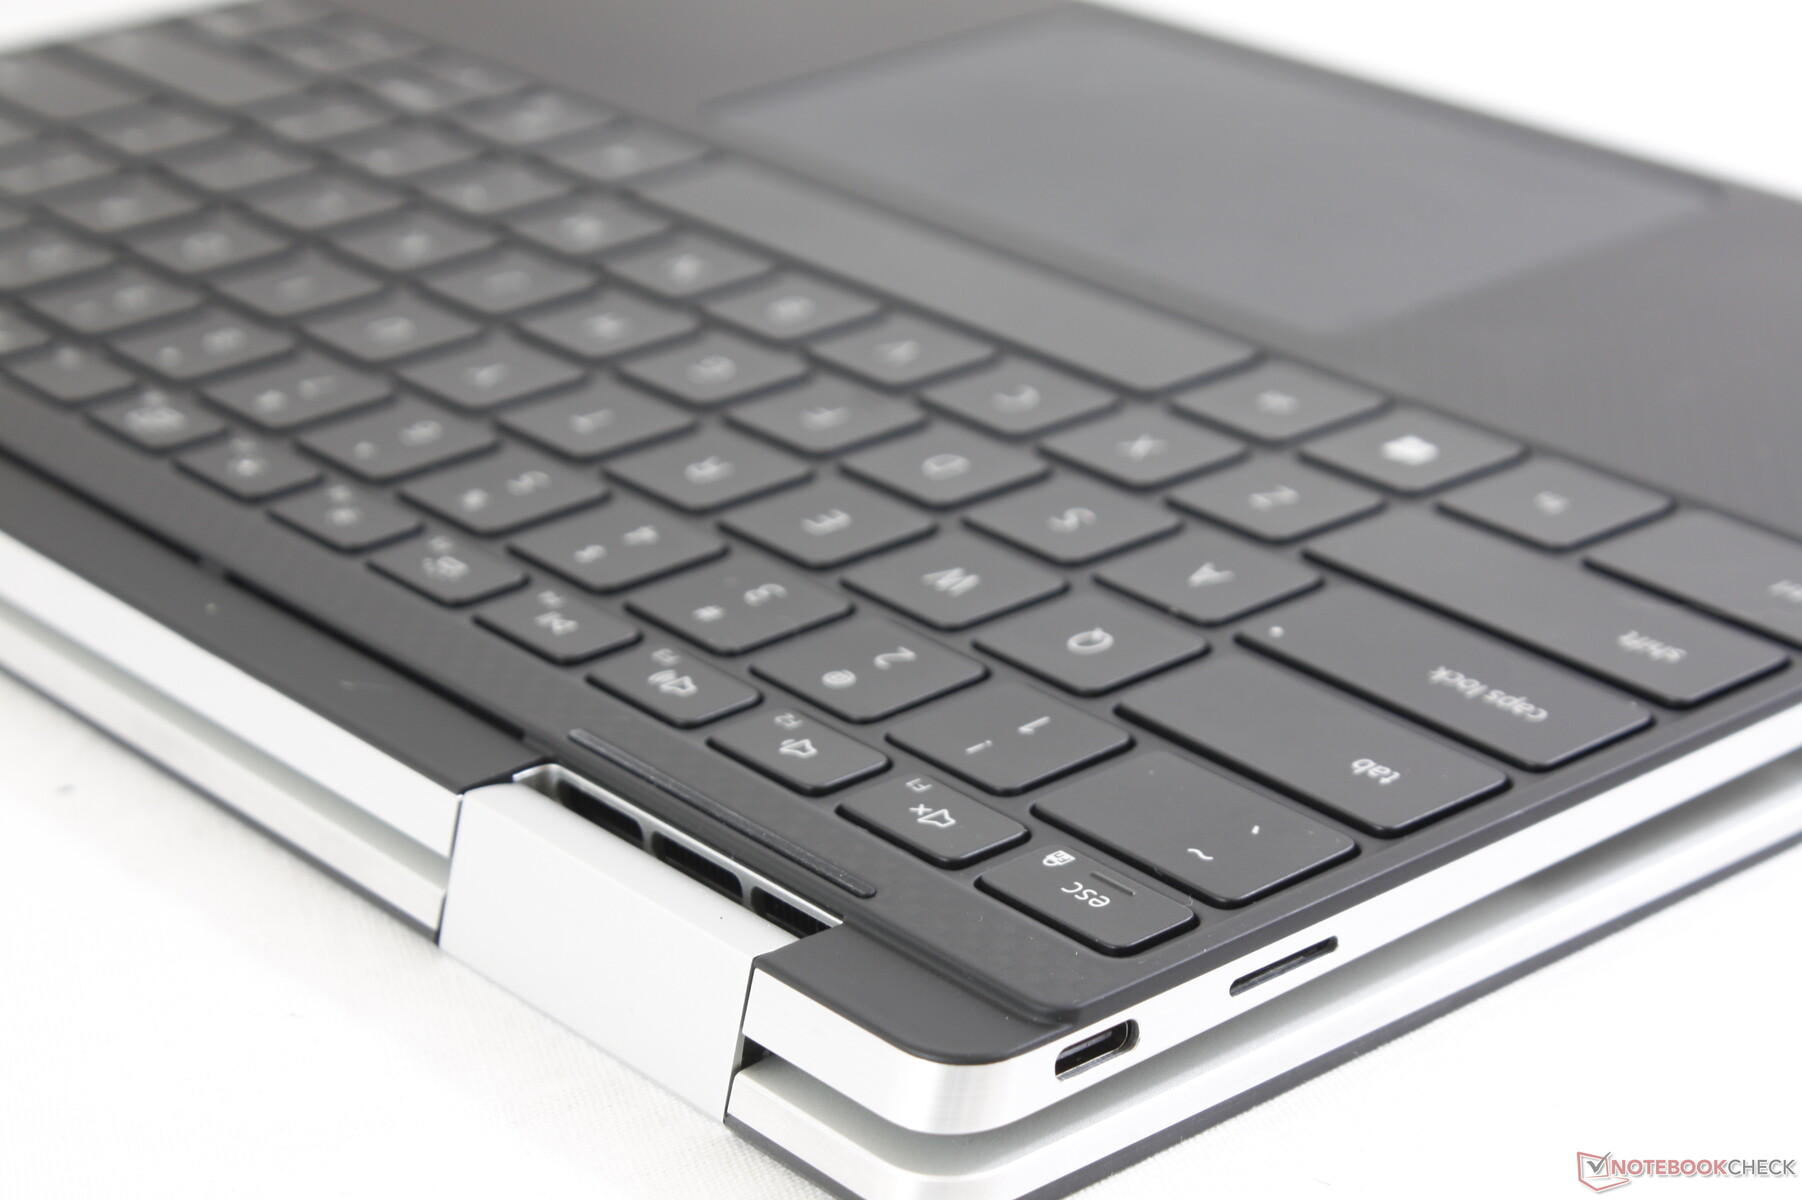
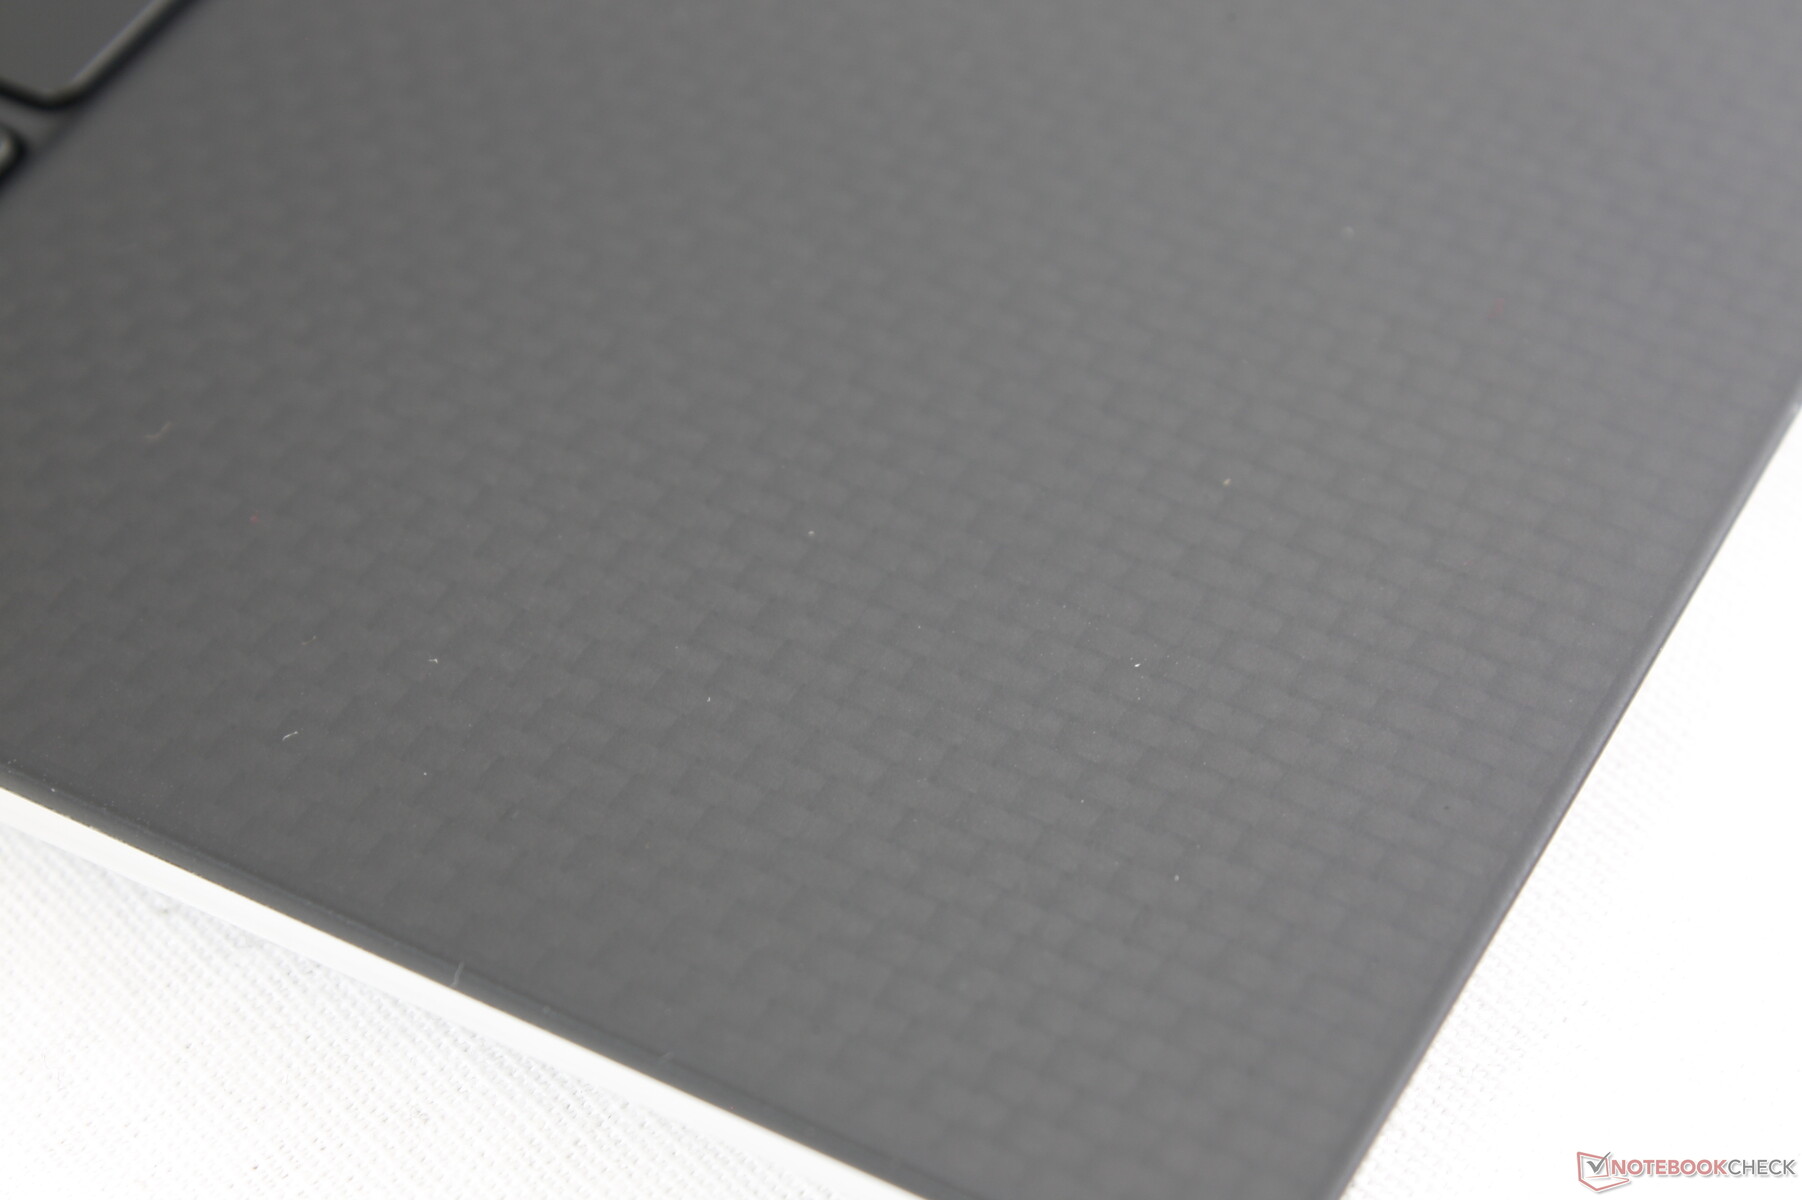
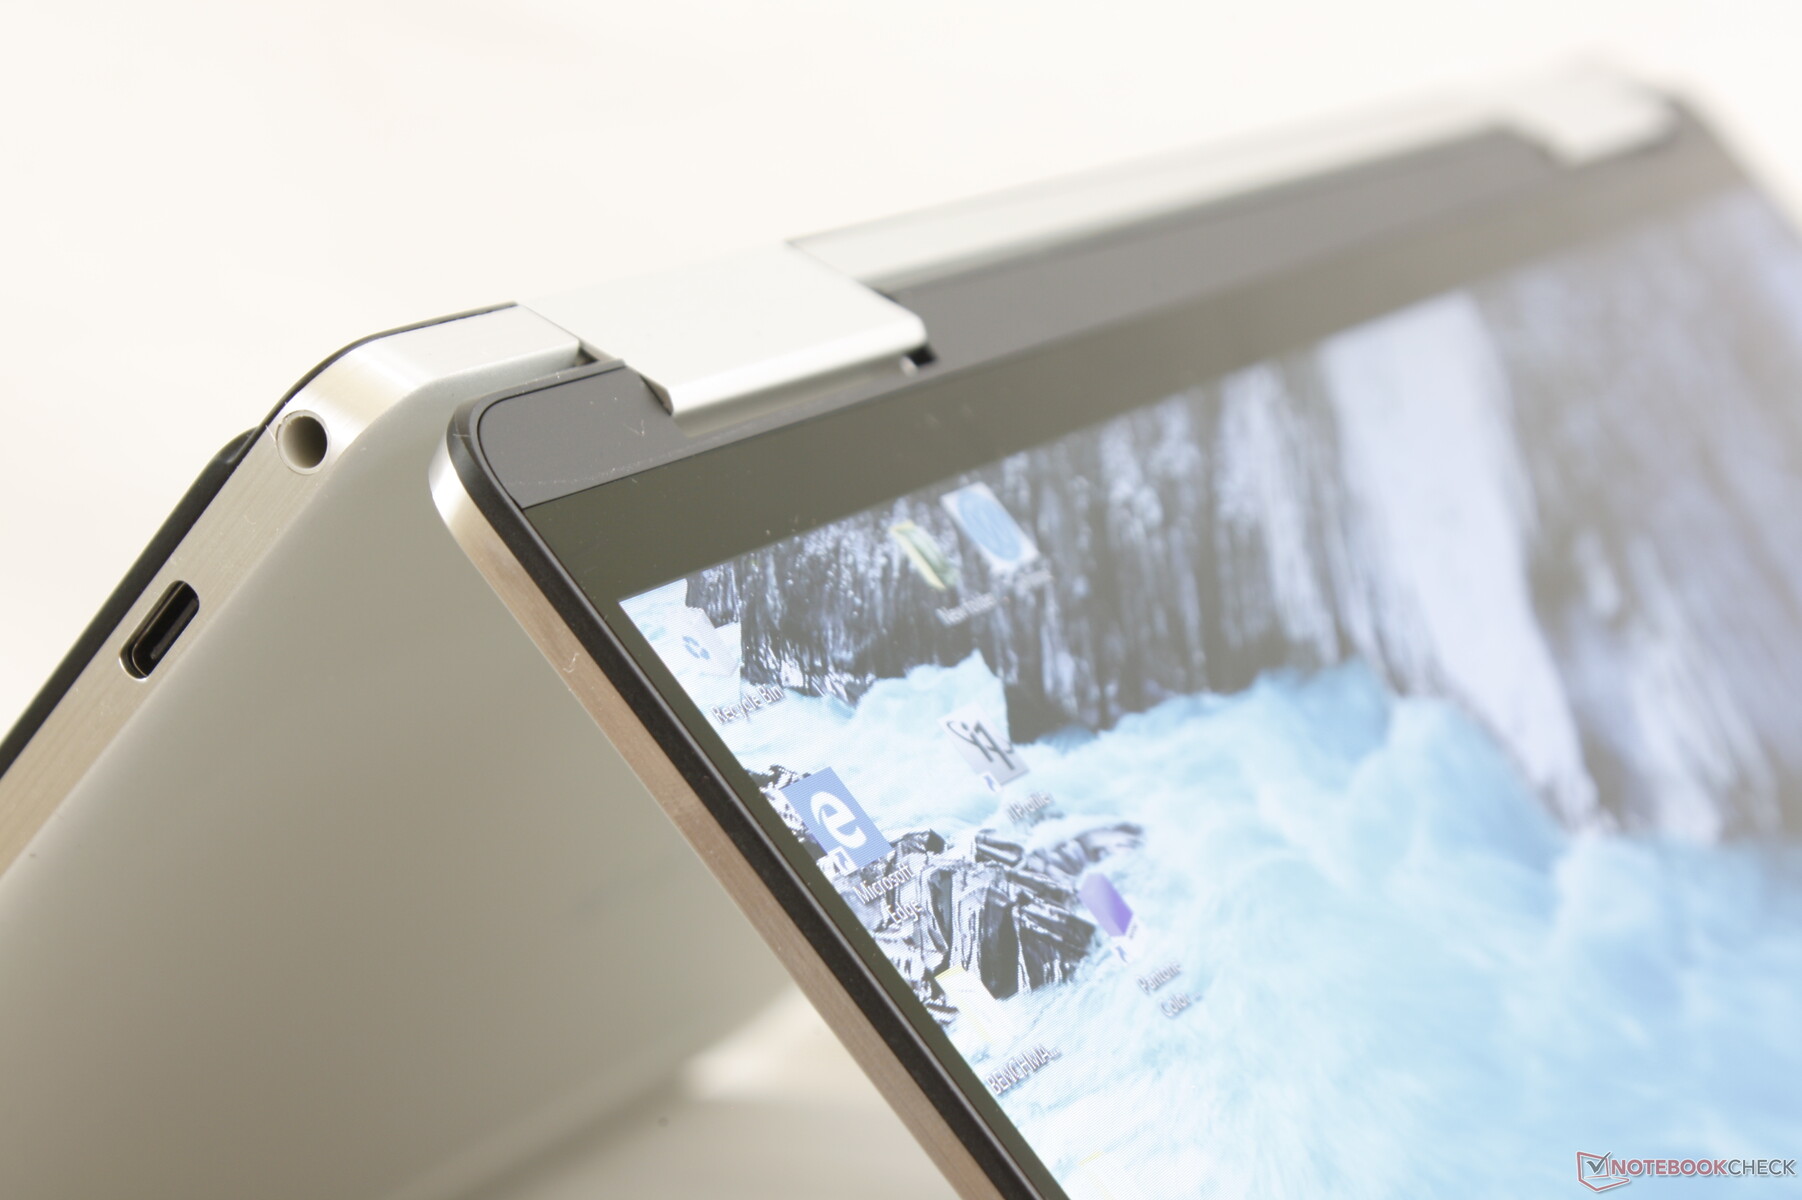
The chassis can be best described as a smaller version of the Dell XPS 15 9575 convertible since it takes more than a few design cues from its bigger sibling. The MagLev keyboard and overall skeleton have more in common with the XPS 15 9575 rather than the XPS 13 clamshell or XPS 13 9365 convertible. Even so, the classic materials and textures of the XPS series remain including the smooth gray aluminum outer lid with either black carbon fiber or white fiberglass palm rests depending on the color option.
Just because a system looks like an XPS doesn't mean that it's as strong as one. The XPS 13 7390 2-in-1 feels more fragile than its immediate peers and not noticeably any better or worse than the original XPS 13 9365 as far as rigidity is concerned. Its materials seem thinner, its surfaces more flexible, and its base more susceptible to twisting and creaking. The differences are thankfully just minor at worst, but they're notable nonetheless. Competing convertibles like the HP Spectre x360 13 or HP EliteBook x360 1040 G5 feel stiffer and more rigid overall while being less prone to fingerprints.
The one design aspect we can always appreciate about XPS laptops is the stiffness of the lids despite the very narrow bezels. Unlike the more flexible lids of the Samsung Notebook 9, LG Gram, Lenovo Yoga C930, or Asus ZenBook Flip, the display of the XPS 13 convertible is firmer and less prone to twisting. The hinges, while reliable, do not offer uniform resistance across the entire 360-degree range as they become slightly weaker at the 160 to 180-degree range.
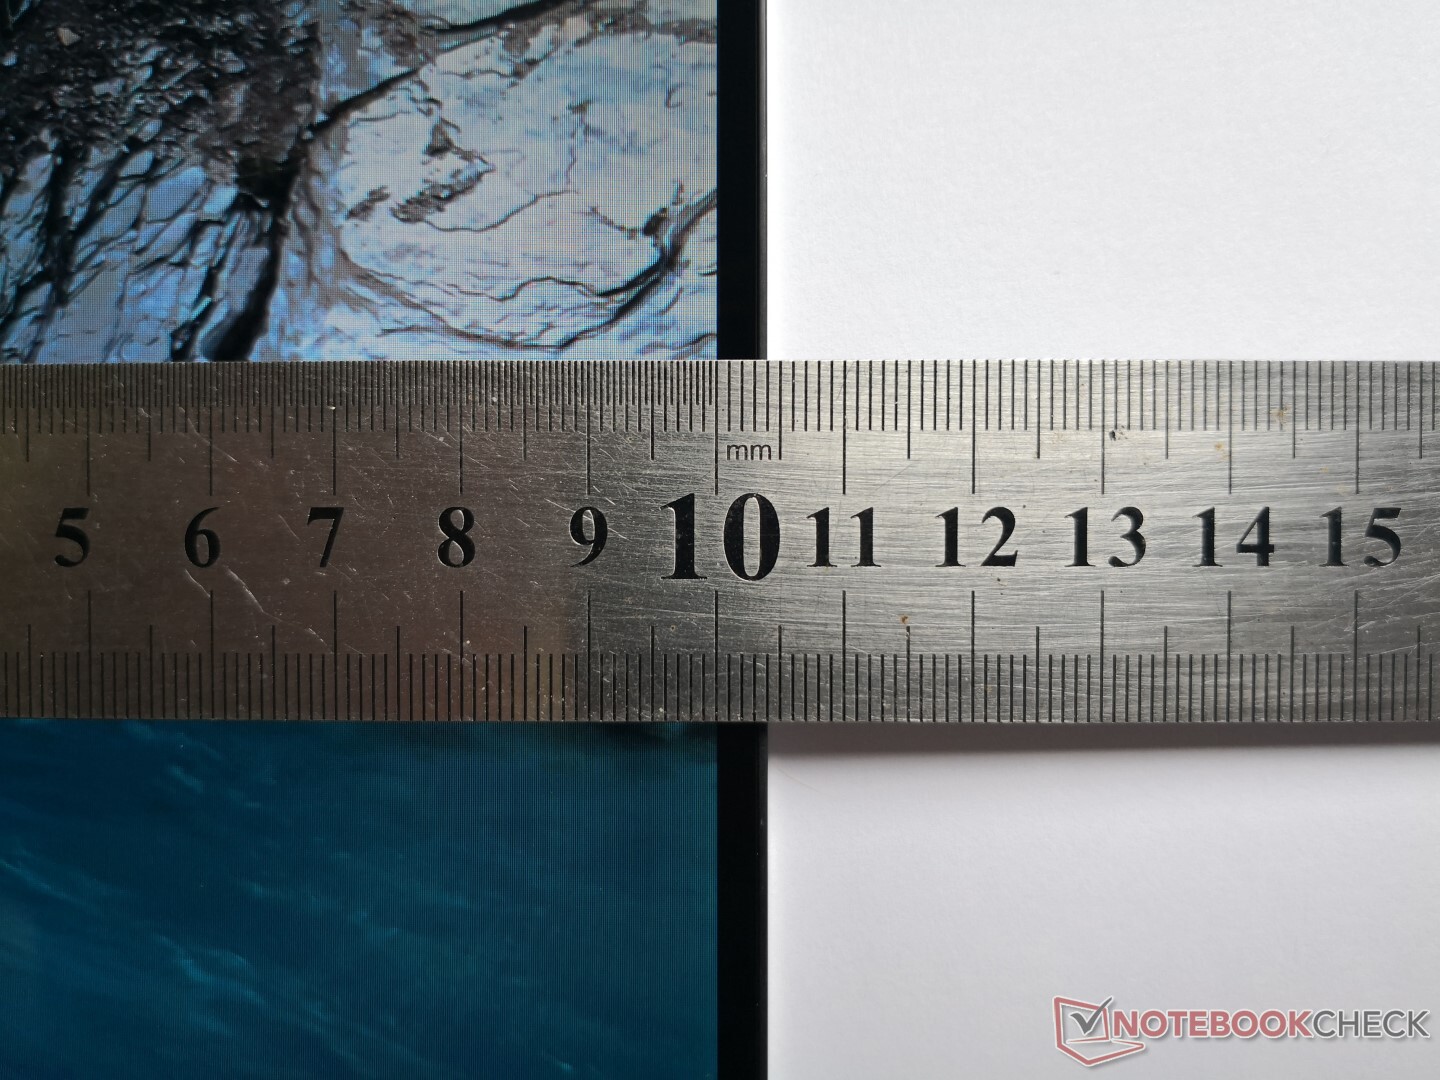
At 1.3 kg, the XPS 13 7390 convertible is almost 100 g heavier than both the original XPS 13 9365 convertible and regular XPS 13 9380 clamshell. Dimensions are also just slightly thicker than the XPS 13 9365 in order to properly support a 15 W CPU and make room for the active cooling solution. Most notable is the fact that the Dell manages to be smaller than the latest 13.3-inch HP Spectre x360 13 while offering a larger 13.4-inch display.
Connectivity
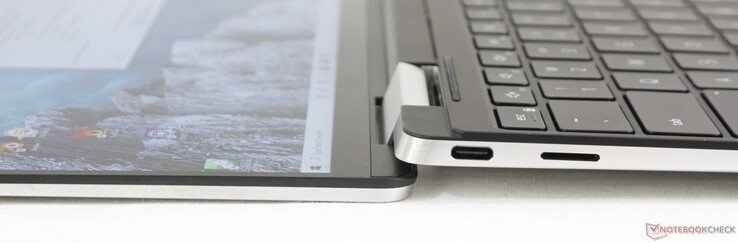
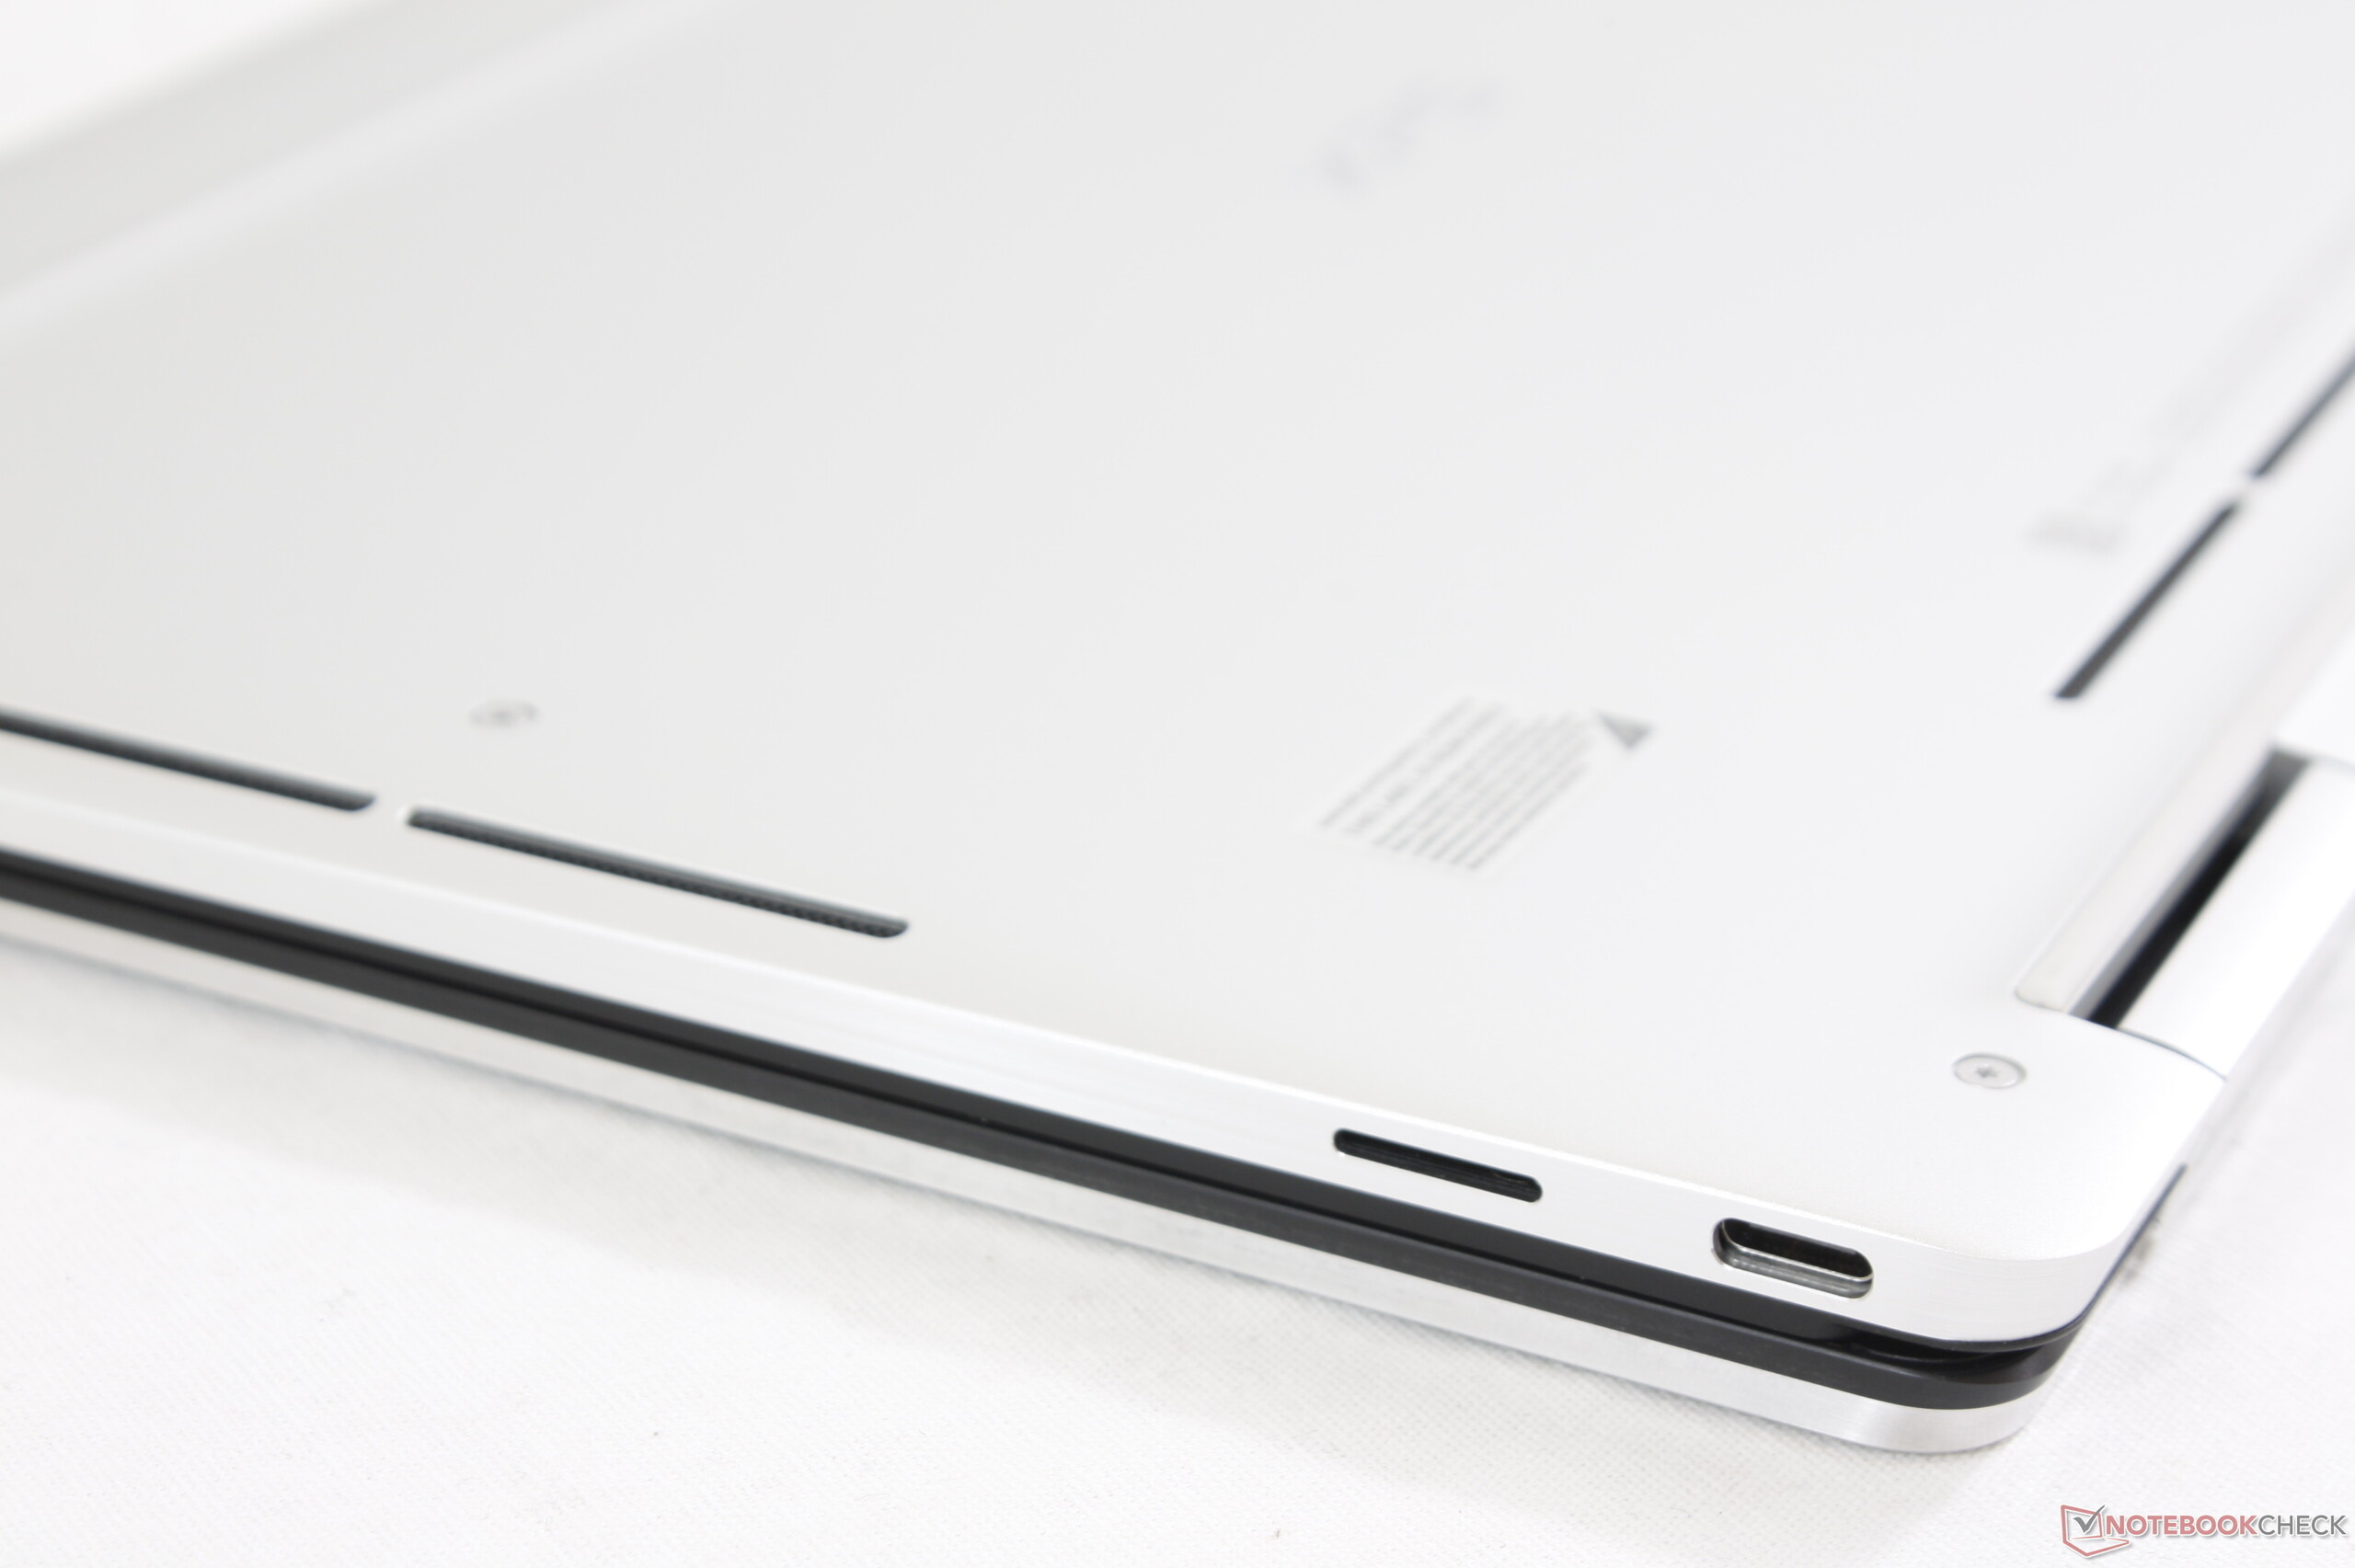
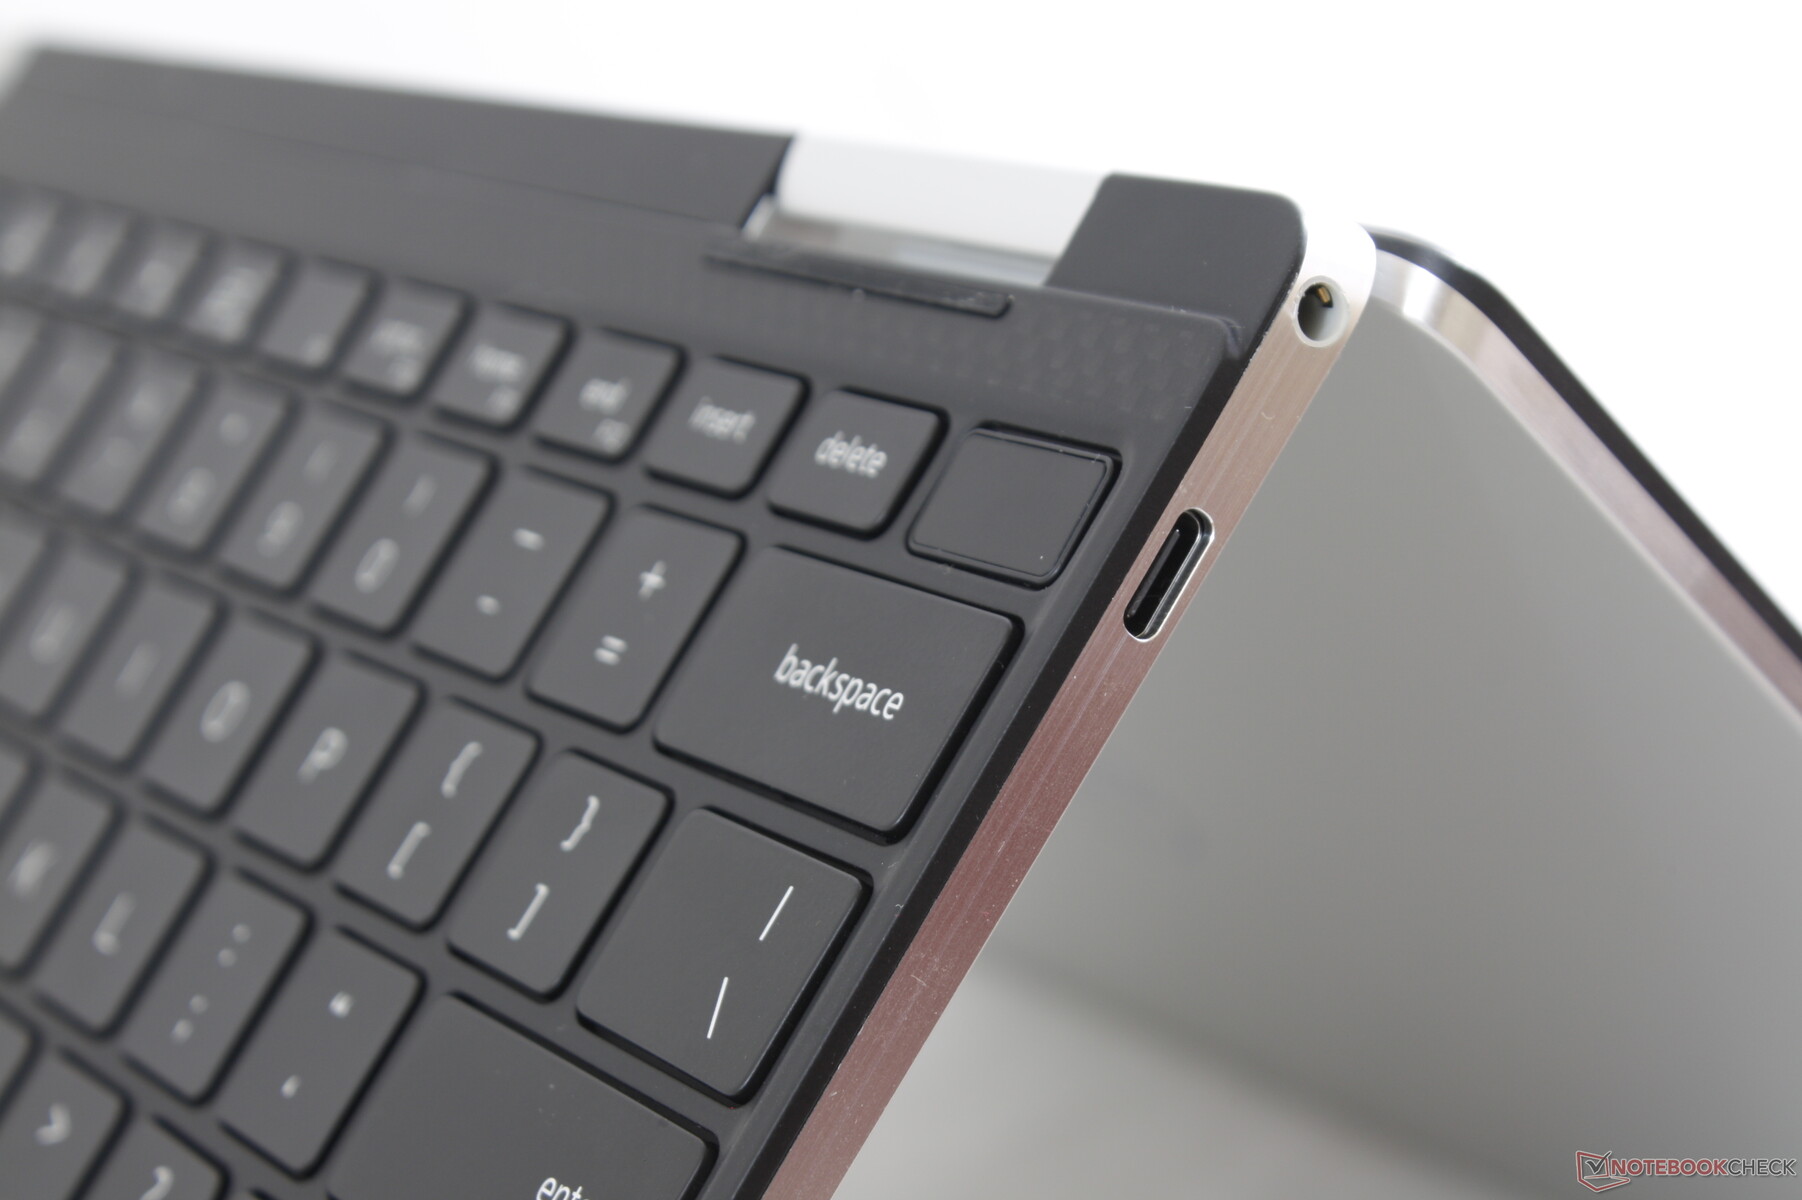
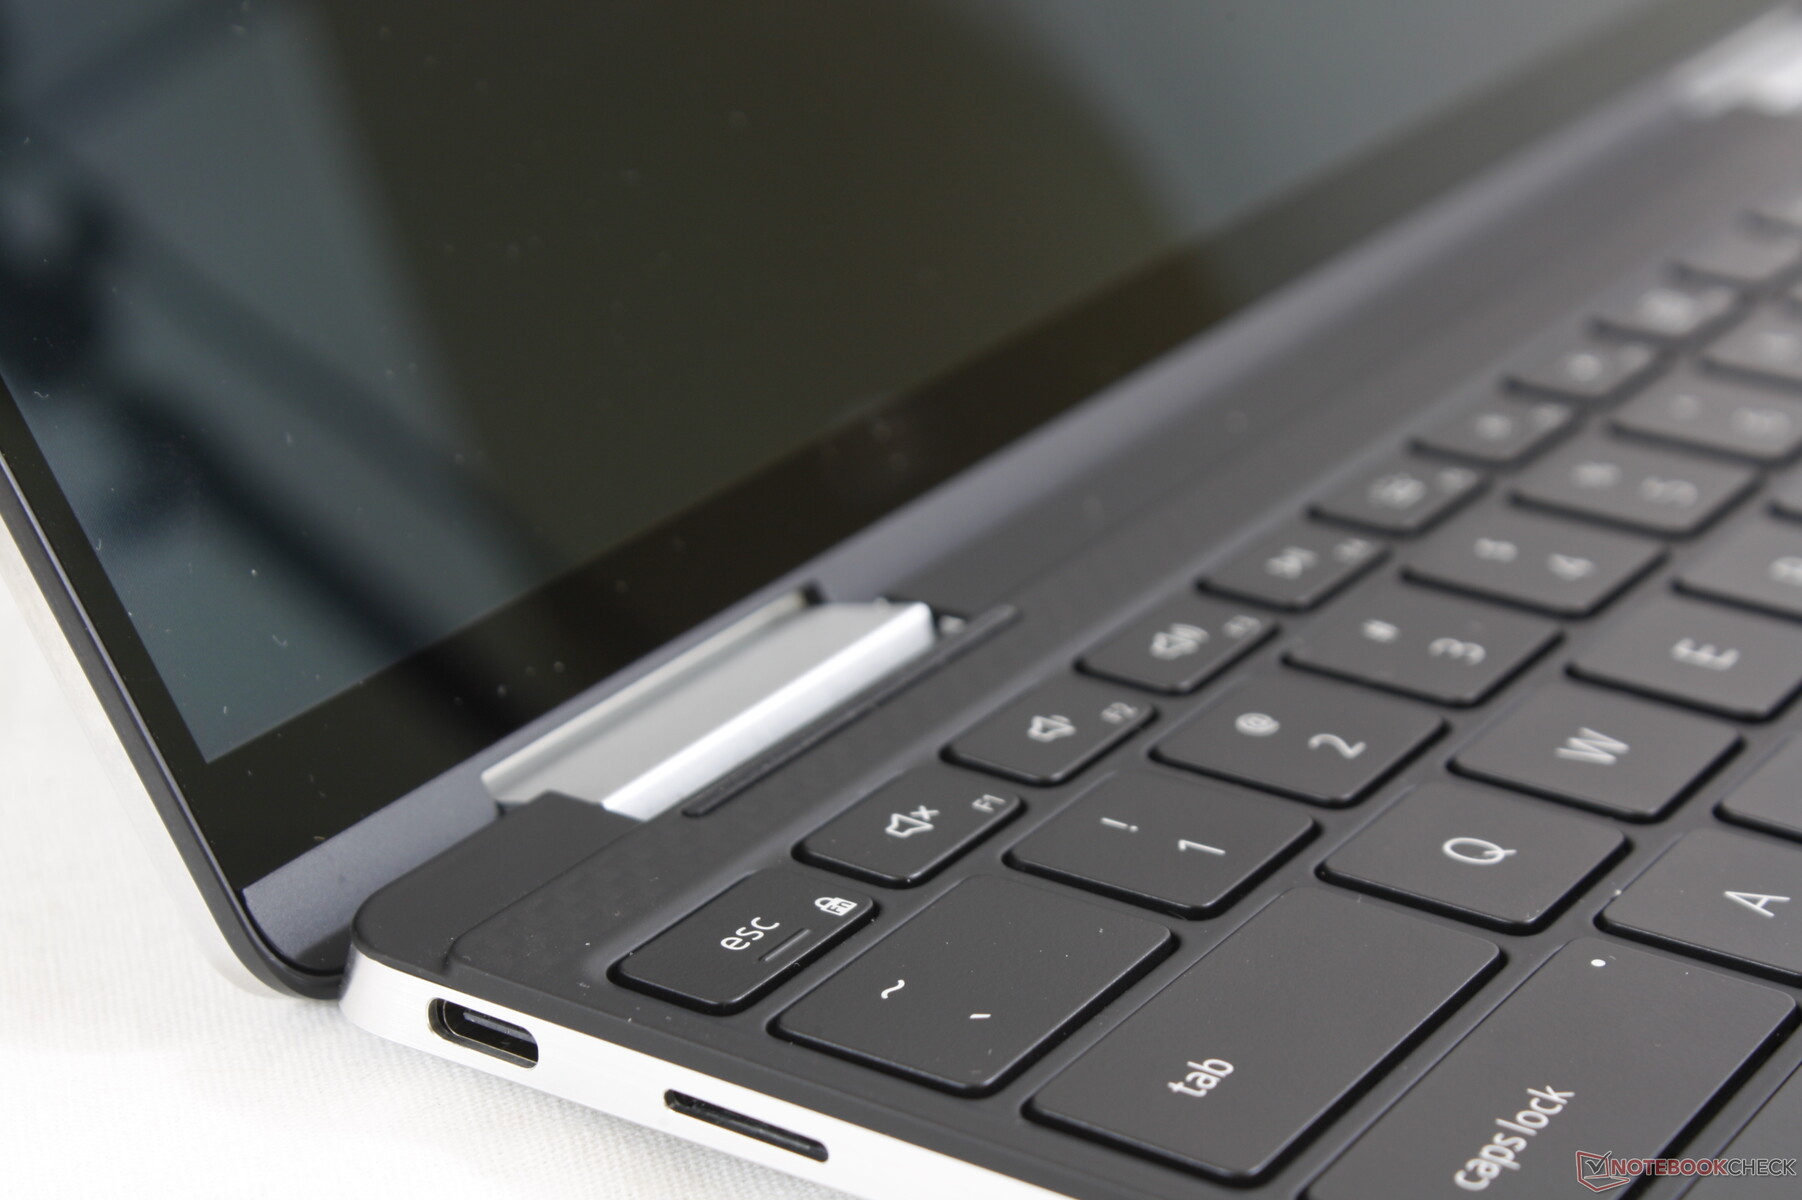
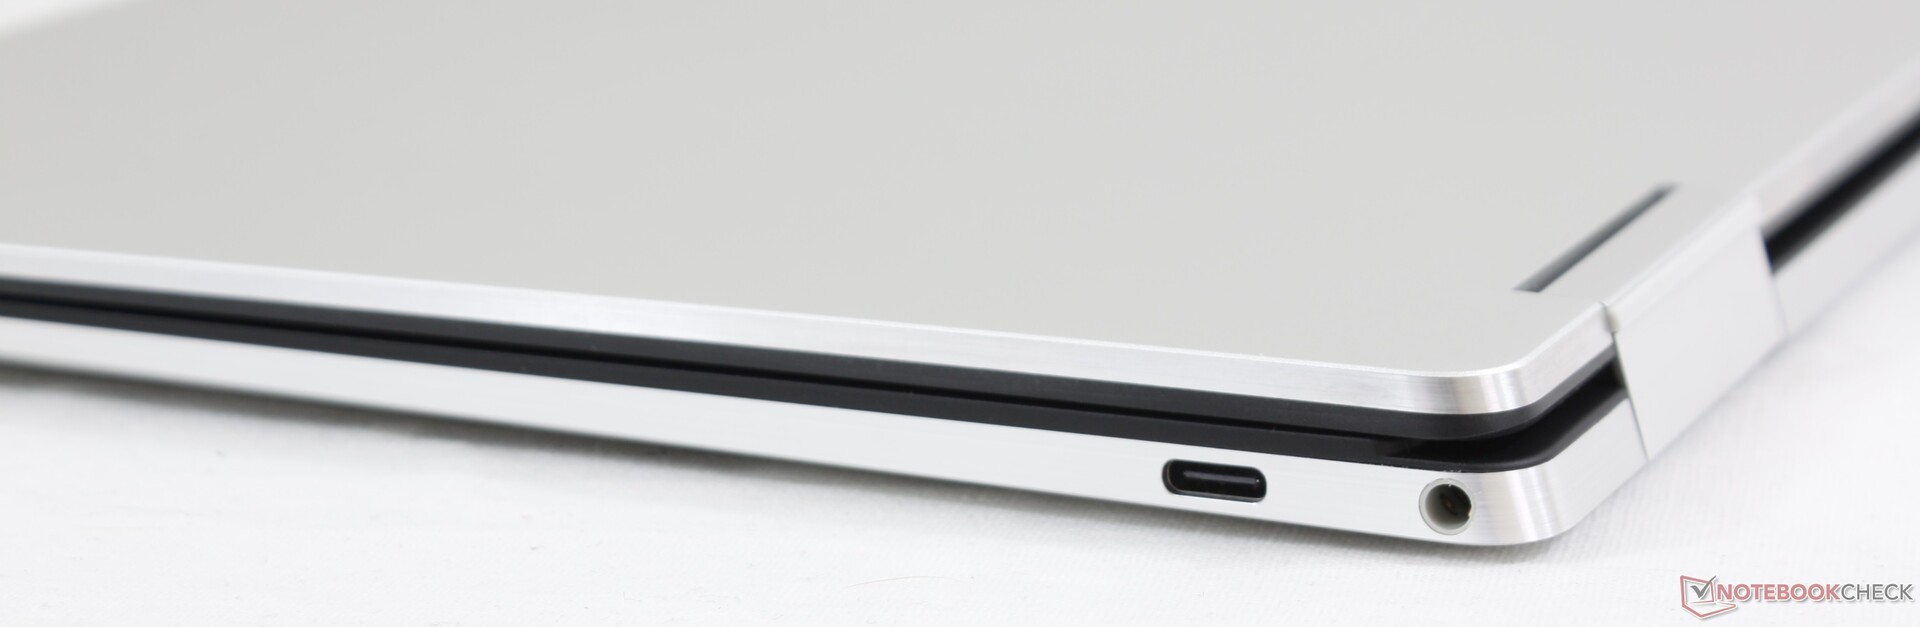
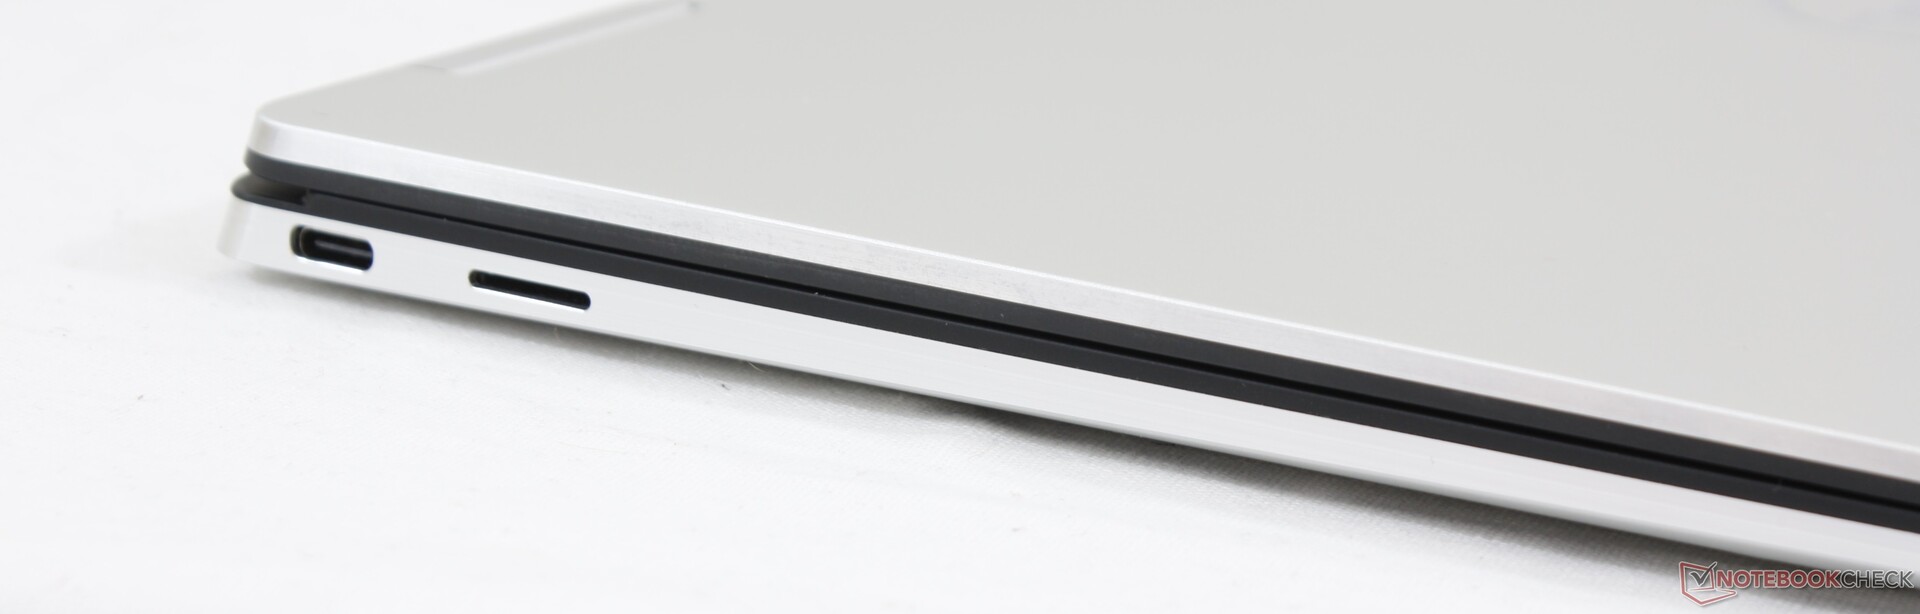
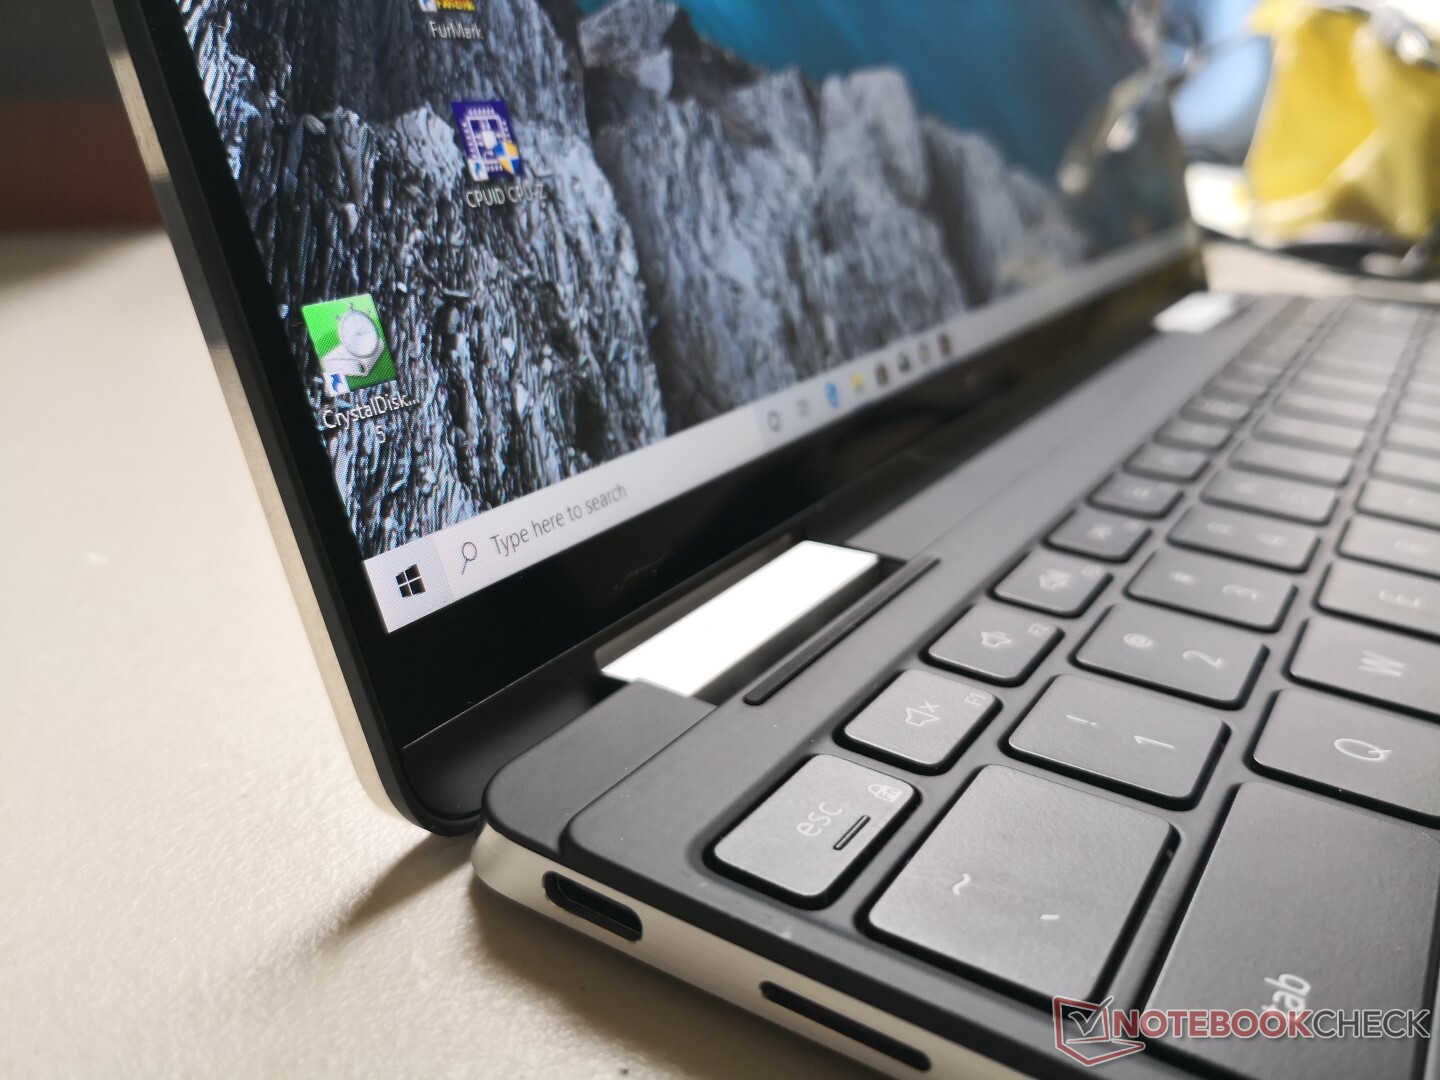
Port options are identical to the XPS 13 9380 clamshell less one USB Typr-C port and the Noble Lock. Both USB ports can be used to recharge the system and both are compatible with Thunderbolt 3 (PCIe x4) devices including eGPU docks.
It's worth noting here that we encountered an issue on the right USB Type-C port. When connecting an external HDD drive to the right port, our HDD would power up momentarily before automatically powering down to suggest that the port is experiencing power delivery issues. Connecting a less demanding external mouse or keyboard to the same port, however, seems to work just fine. The left USB port would would perform normally on our unit.
SD Card Reader
The spring-loaded MicroSD reader is fast with transfer rates of over 200 MB/s from our UHS-II test card. Moving 1 GB of images from our card to desktop takes about 6 to 7 seconds.
A fully inserted MicroSD protrudes by about 1 mm for safe transporting. The process of actually inserting the card is a bit difficult because the slot tends to tilt or bend the card during insertion.
| SD Card Reader | |
| average JPG Copy Test (av. of 3 runs) | |
| Dell XPS 13 9380 2019 (Toshiba Exceria Pro SDXC 64 GB UHS-II) | |
| Dell XPS 13 7390 2-in-1 Core i3 (Toshiba Exceria Pro M501 64 GB UHS-II) | |
| HP Spectre x360 13-ap0312ng (Toshiba Exceria Pro M501 64 GB UHS-II) | |
| Dell XPS 13-9365 2-in-1 (Toshiba THN-M401S0640E2) | |
| maximum AS SSD Seq Read Test (1GB) | |
| Dell XPS 13 7390 2-in-1 Core i3 (Toshiba Exceria Pro M501 64 GB UHS-II) | |
| HP Spectre x360 13-ap0312ng (Toshiba Exceria Pro M501 64 GB UHS-II) | |
| Dell XPS 13 9380 2019 (Toshiba Exceria Pro SDXC 64 GB UHS-II) | |
| Dell XPS 13-9365 2-in-1 (Toshiba THN-M401S0640E2) | |
Communication
By definition, Intel Athena laptops must carry Wi-Fi 6 connectivity and so all XPS 13 7390 2-in-1 SKUs come standard with the Killer AX1650s for theoretical transfer rates of up to 2.4 Gbps. Most other laptops are limited to "only" 1.73 Gbps Wi-Fi 5 speeds. In practice, users are unlikely to notice any differences between the two Wi-Fi generations around the home or office and we experienced no connectivity issues during our time with the unit.
Transfer rates can be faster than what we've recorded below since our server is limited by a 1 Gbps line. Even so, transmit rates are slightly slower than expected likely due to the general difficulty of maintaining consistent maximum transfer rates. You're going to need a Wi-Fi 6 router if you wish to exploit all the advantages of the new standard.
| Networking | |
| iperf3 transmit AX12 | |
| HP Spectre x360 13-ap0312ng | |
| Dell XPS 13 9380 2019 | |
| Dell XPS 13 7390 2-in-1 Core i3 | |
| Dell XPS 13-9365 2-in-1 | |
| iperf3 receive AX12 | |
| Dell XPS 13 7390 2-in-1 Core i3 | |
| HP Spectre x360 13-ap0312ng | |
| Dell XPS 13 9380 2019 | |
| Dell XPS 13-9365 2-in-1 | |
Maintenance
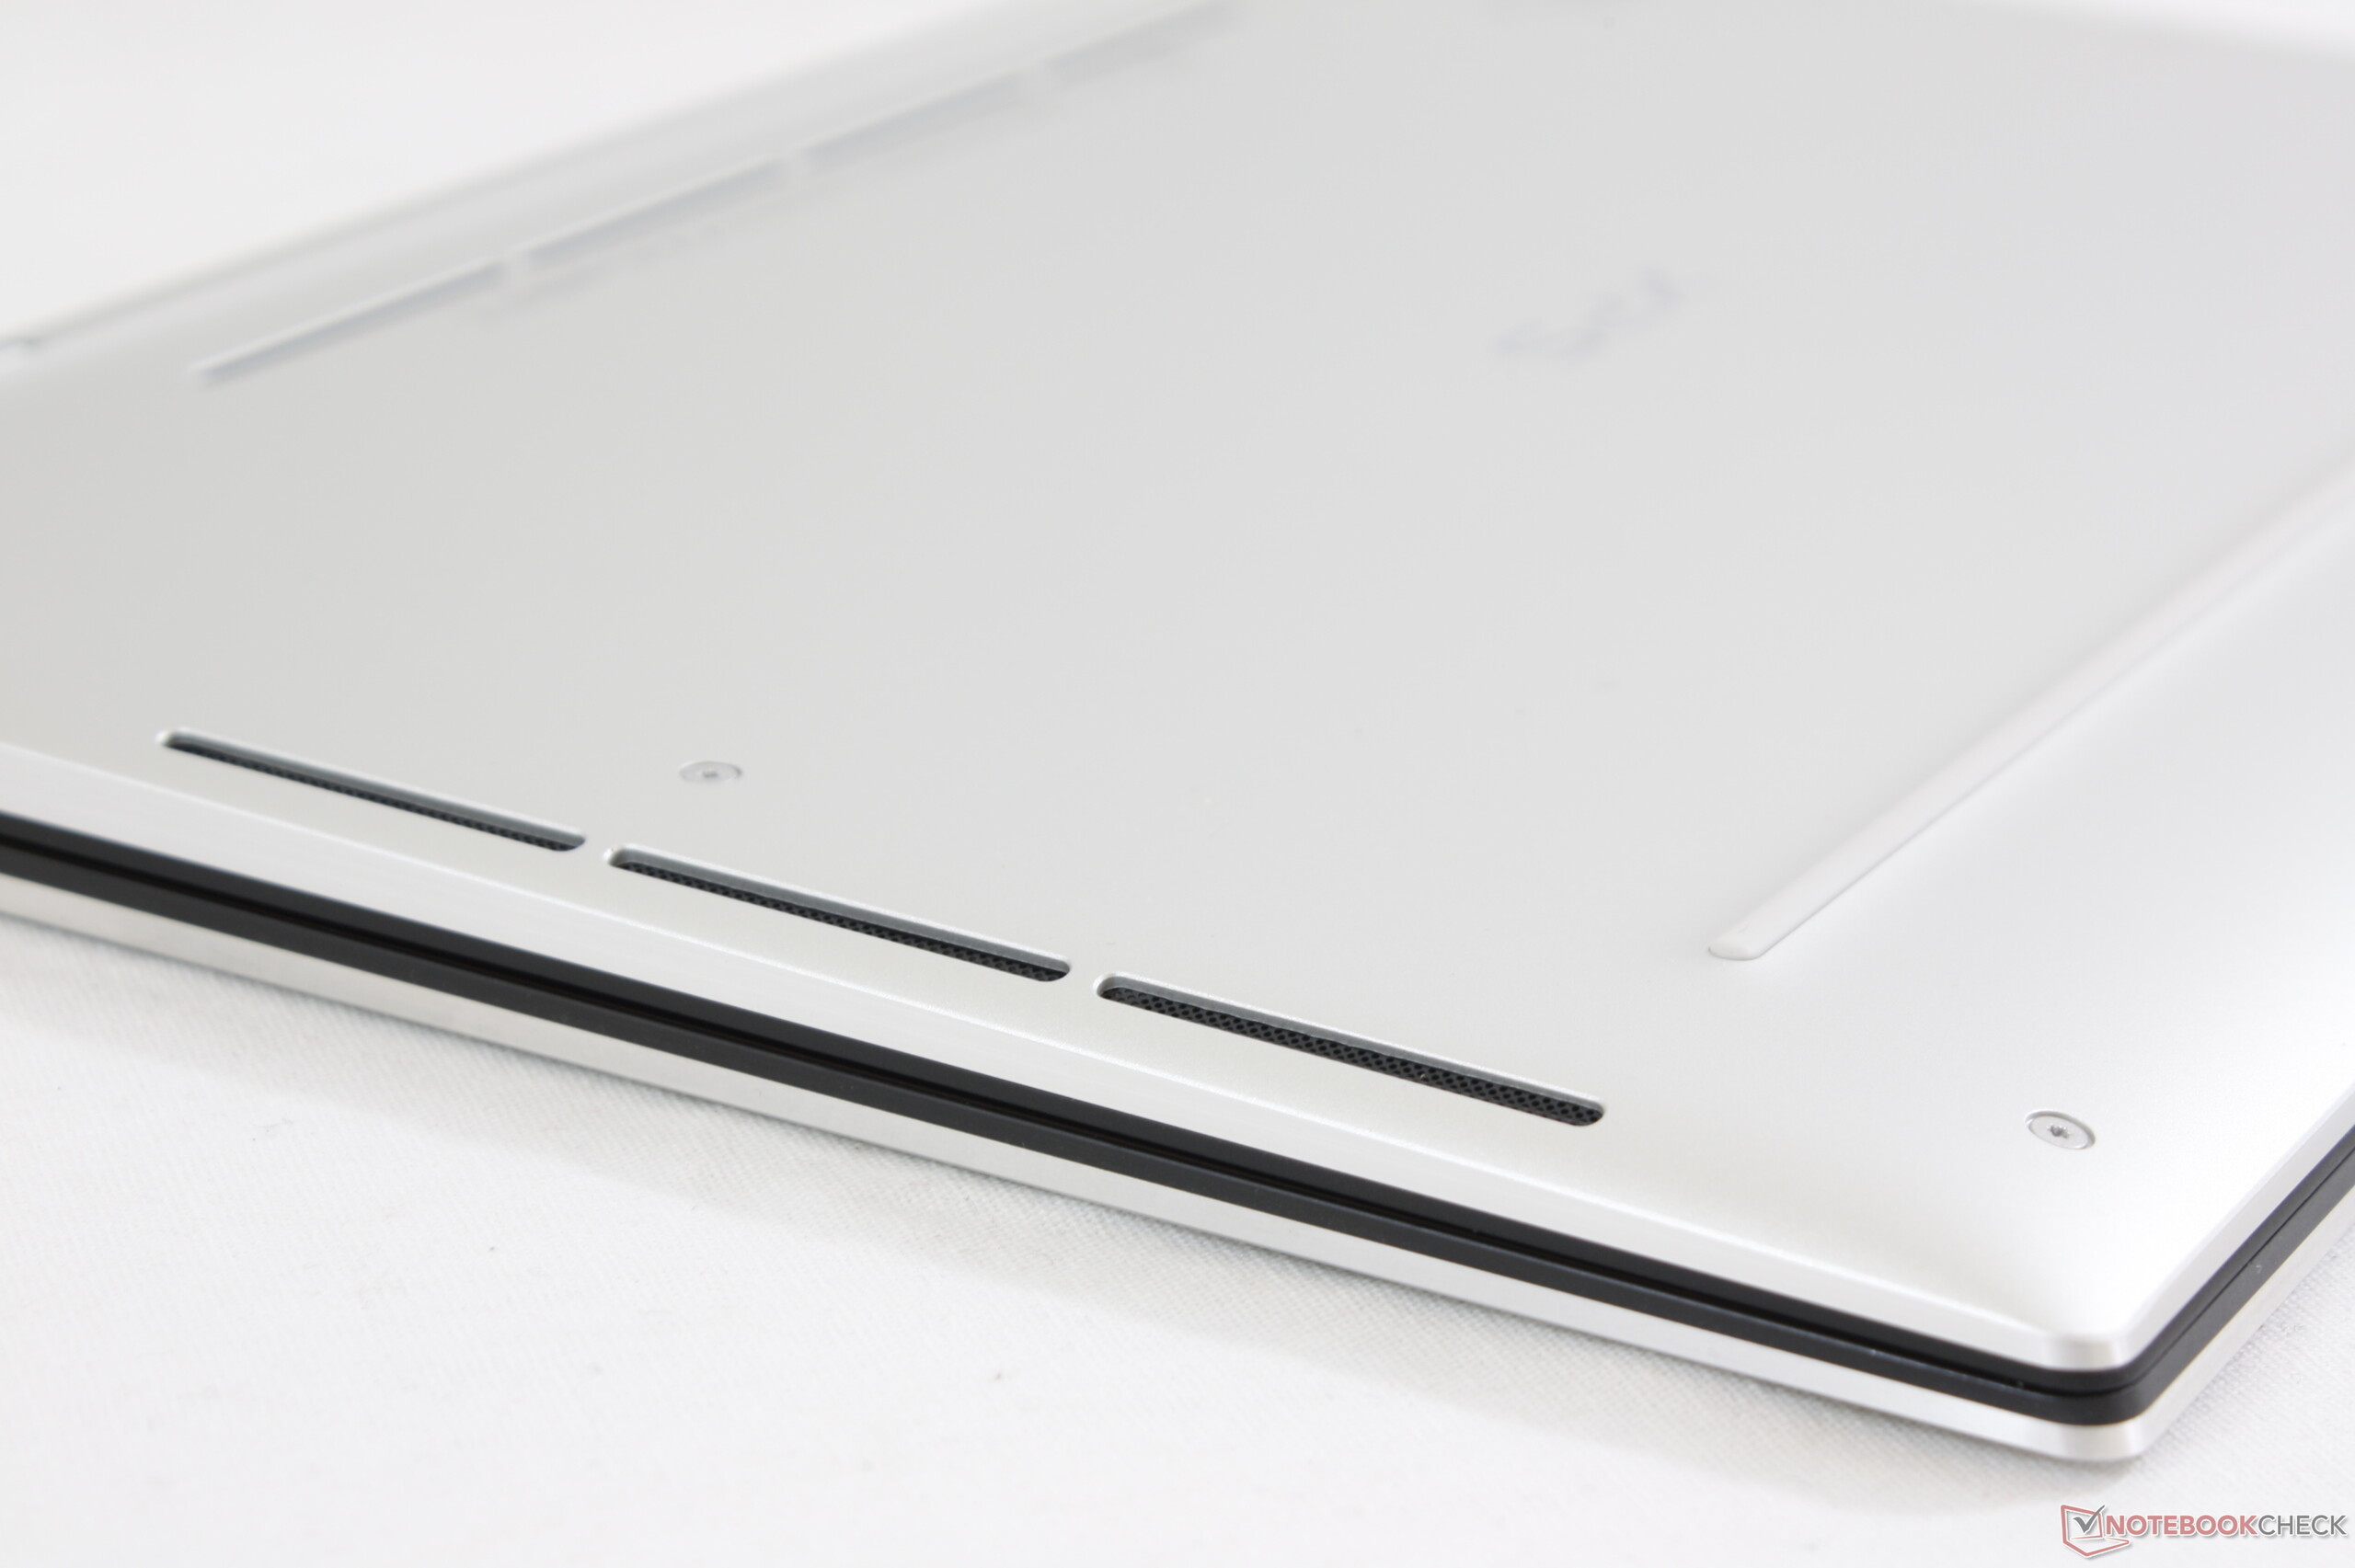
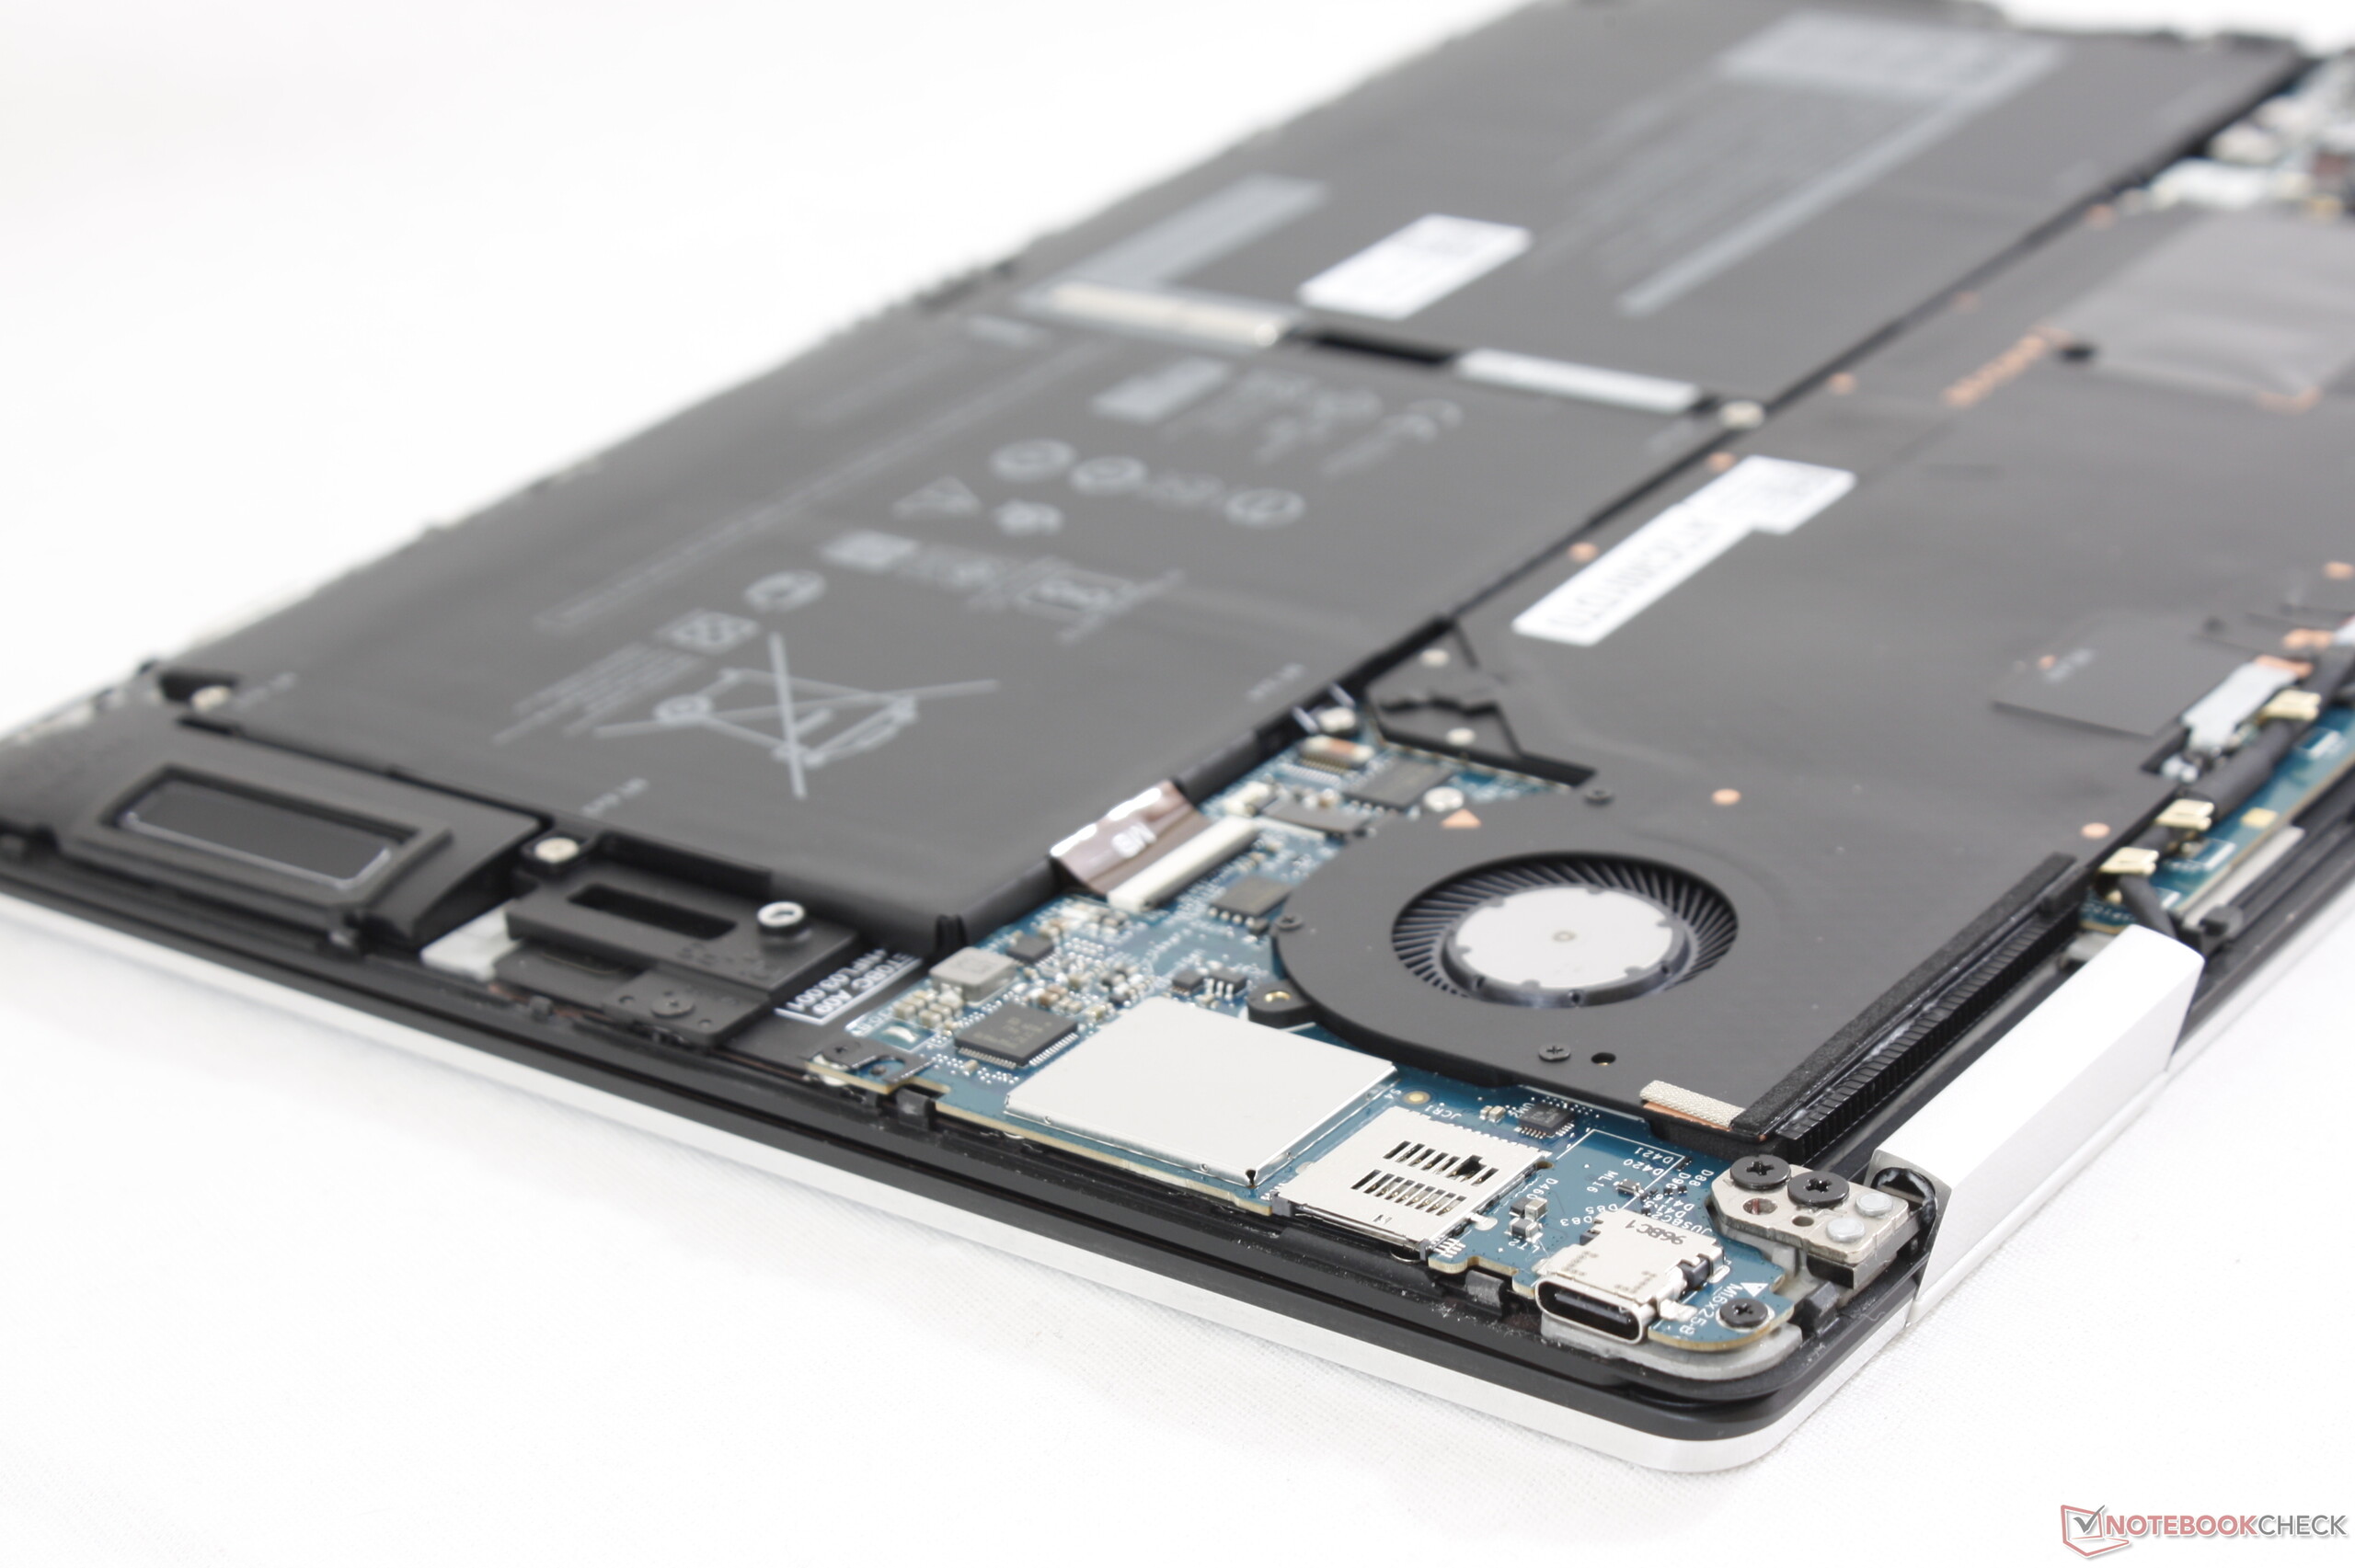
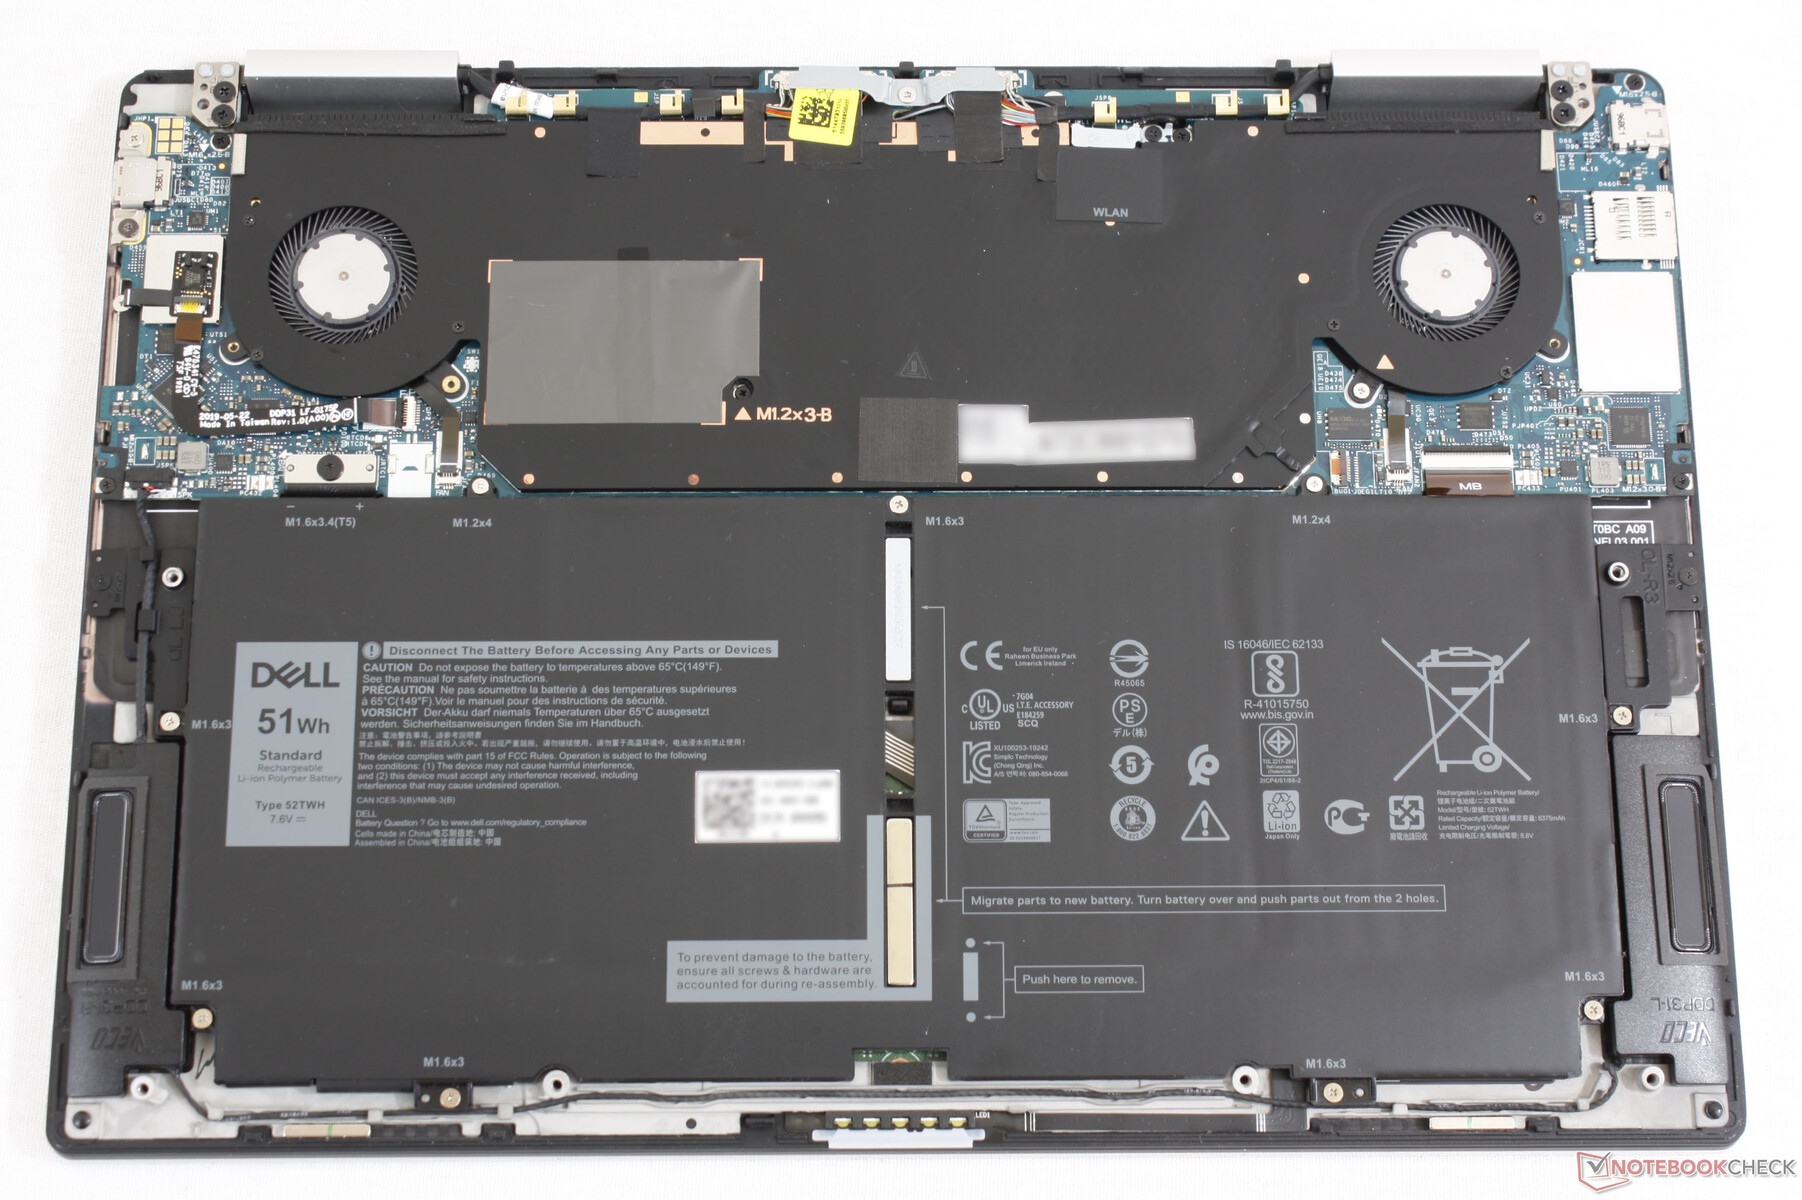
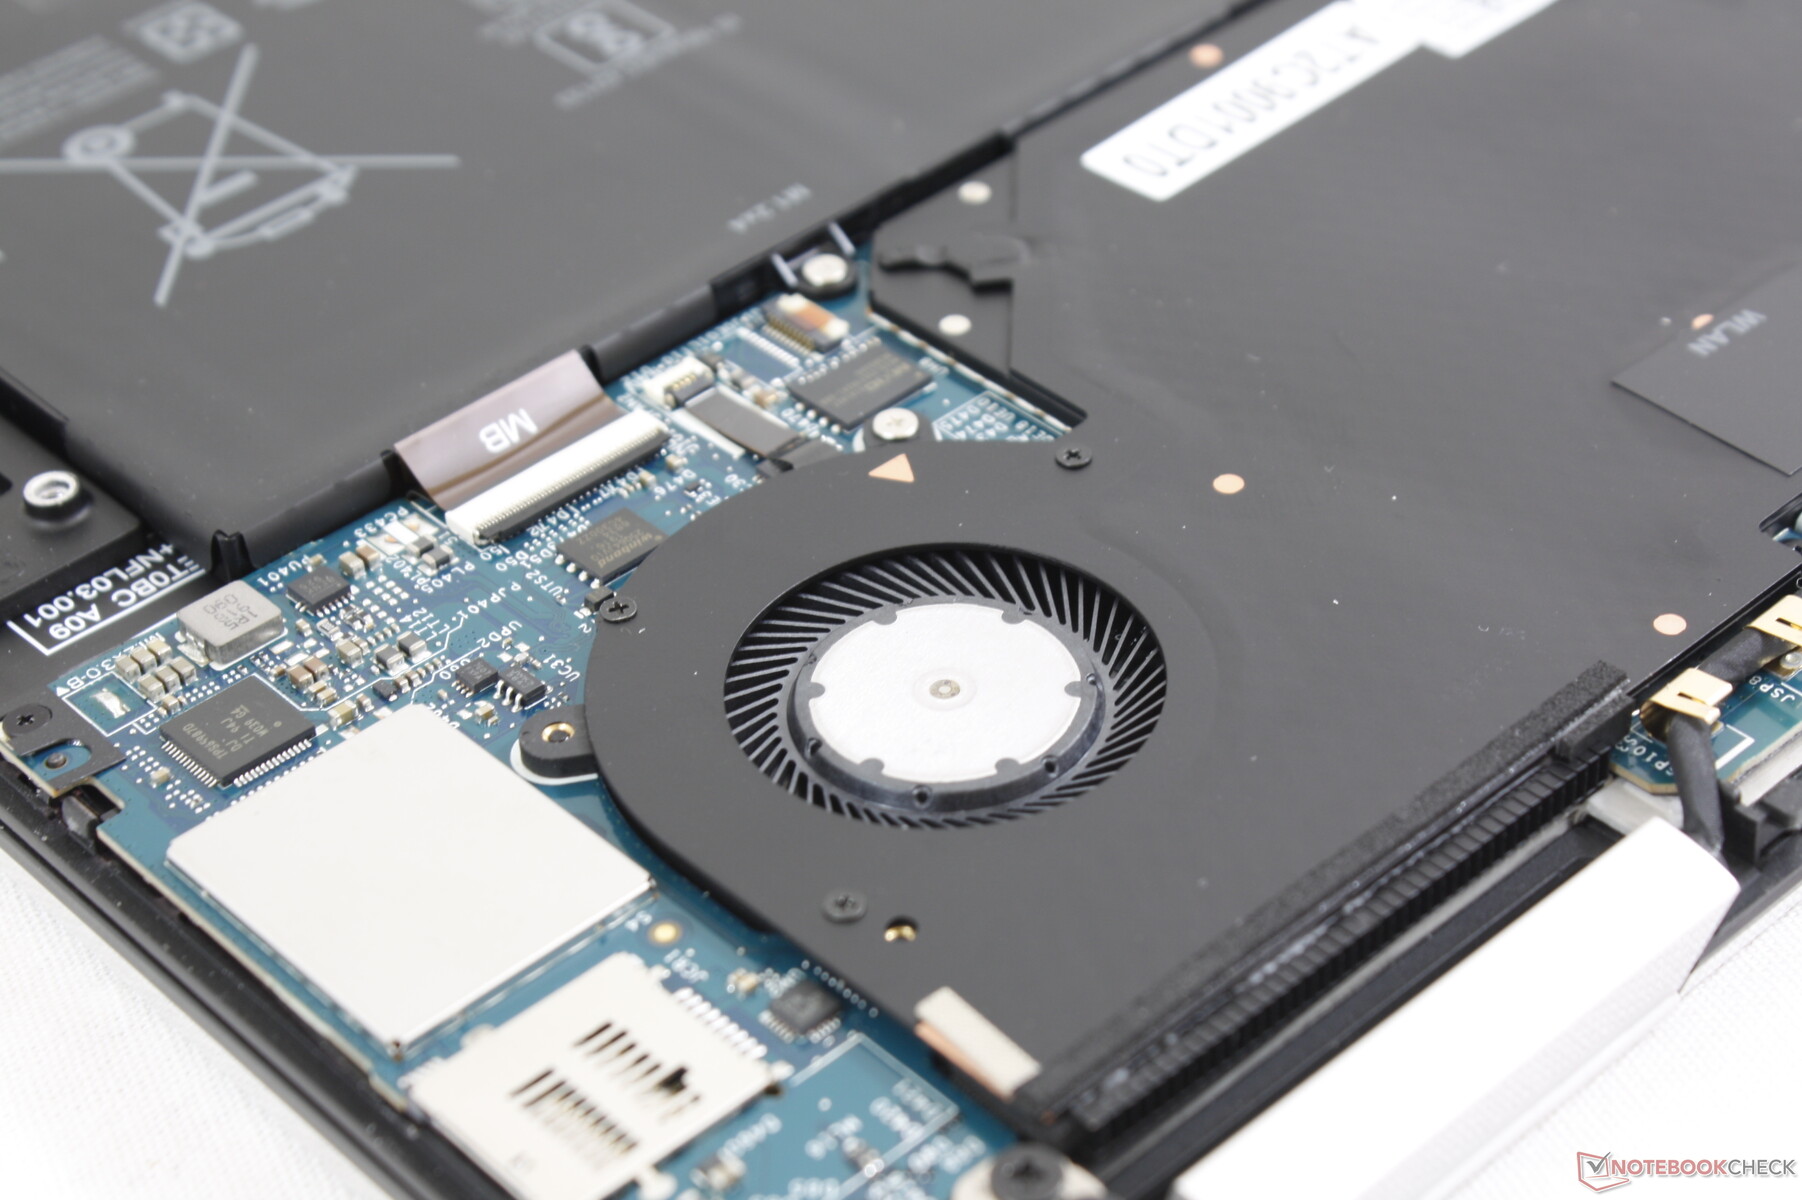
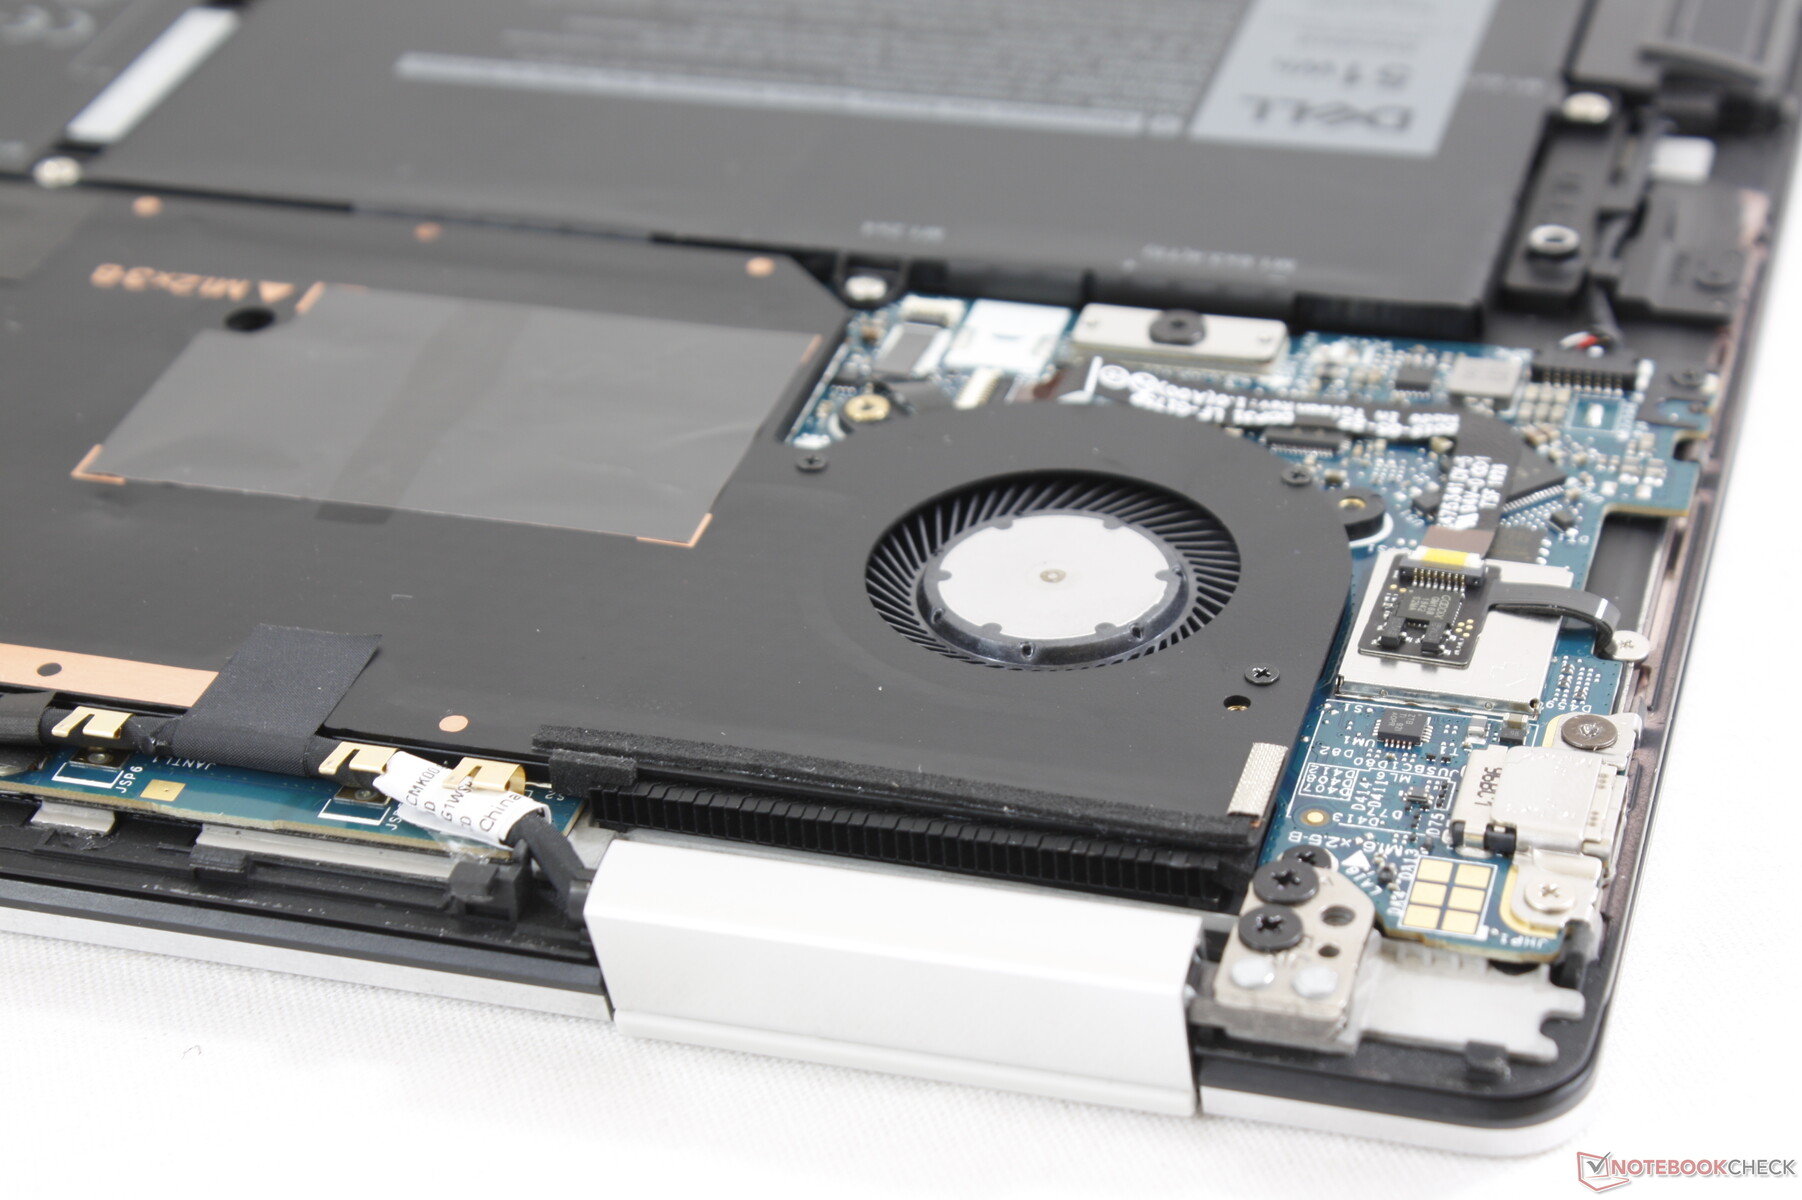
The bottom panel is secured by eight T5 torx screws. It's pretty clear that Dell is discouraging users from tampering with the system because the bottom panel is very sharp around its edges and it's therefore more difficult to remove when compared to the clamshell XPS 13. Once inside, there is nothing to upgrade since the RAM, WLAN, and even SSD are all soldered.
Accessories and Warranty
There are no included extras outside of a USB Type-C to USB Type-A adapter. The active stylus as shown in all the promotional images is therefore a separate purchase. A velvet cleaning cloth would have been a nice addition since surfaces will inevitably attract grime.
Dell offers more warranty options than most other OEMs at up to 4 years of accidental damage protection.
Input Devices
Keyboard
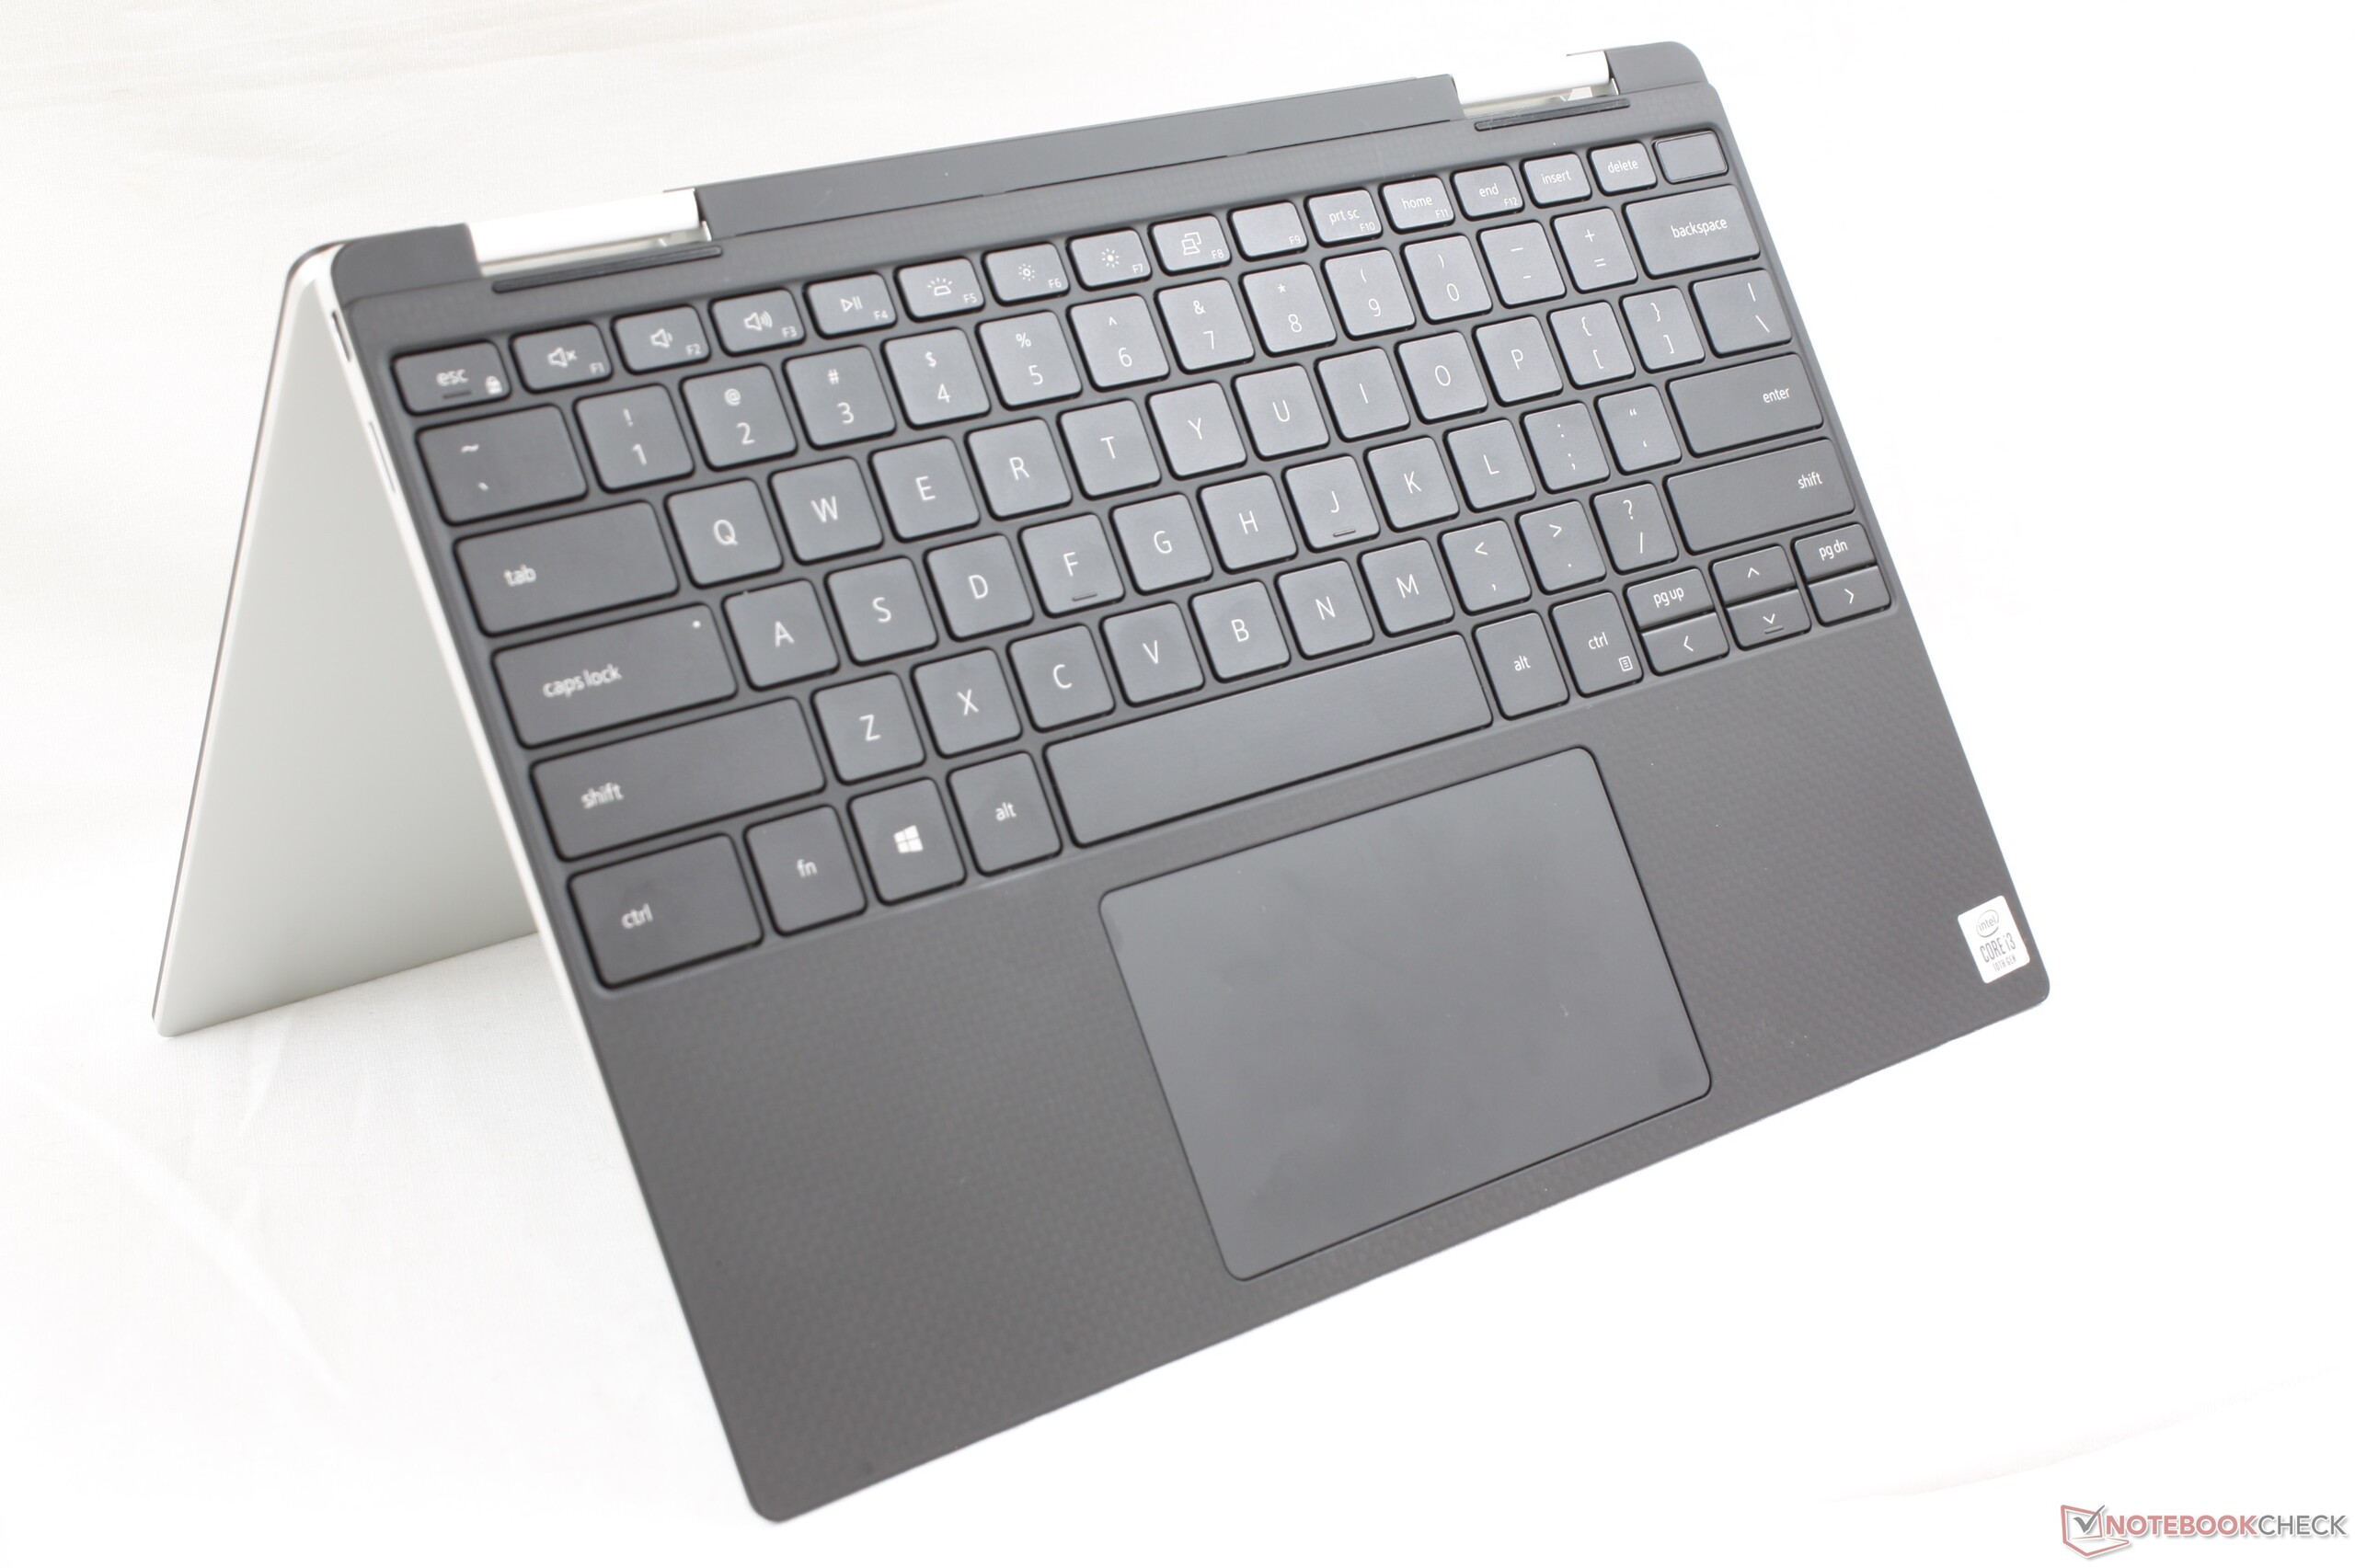
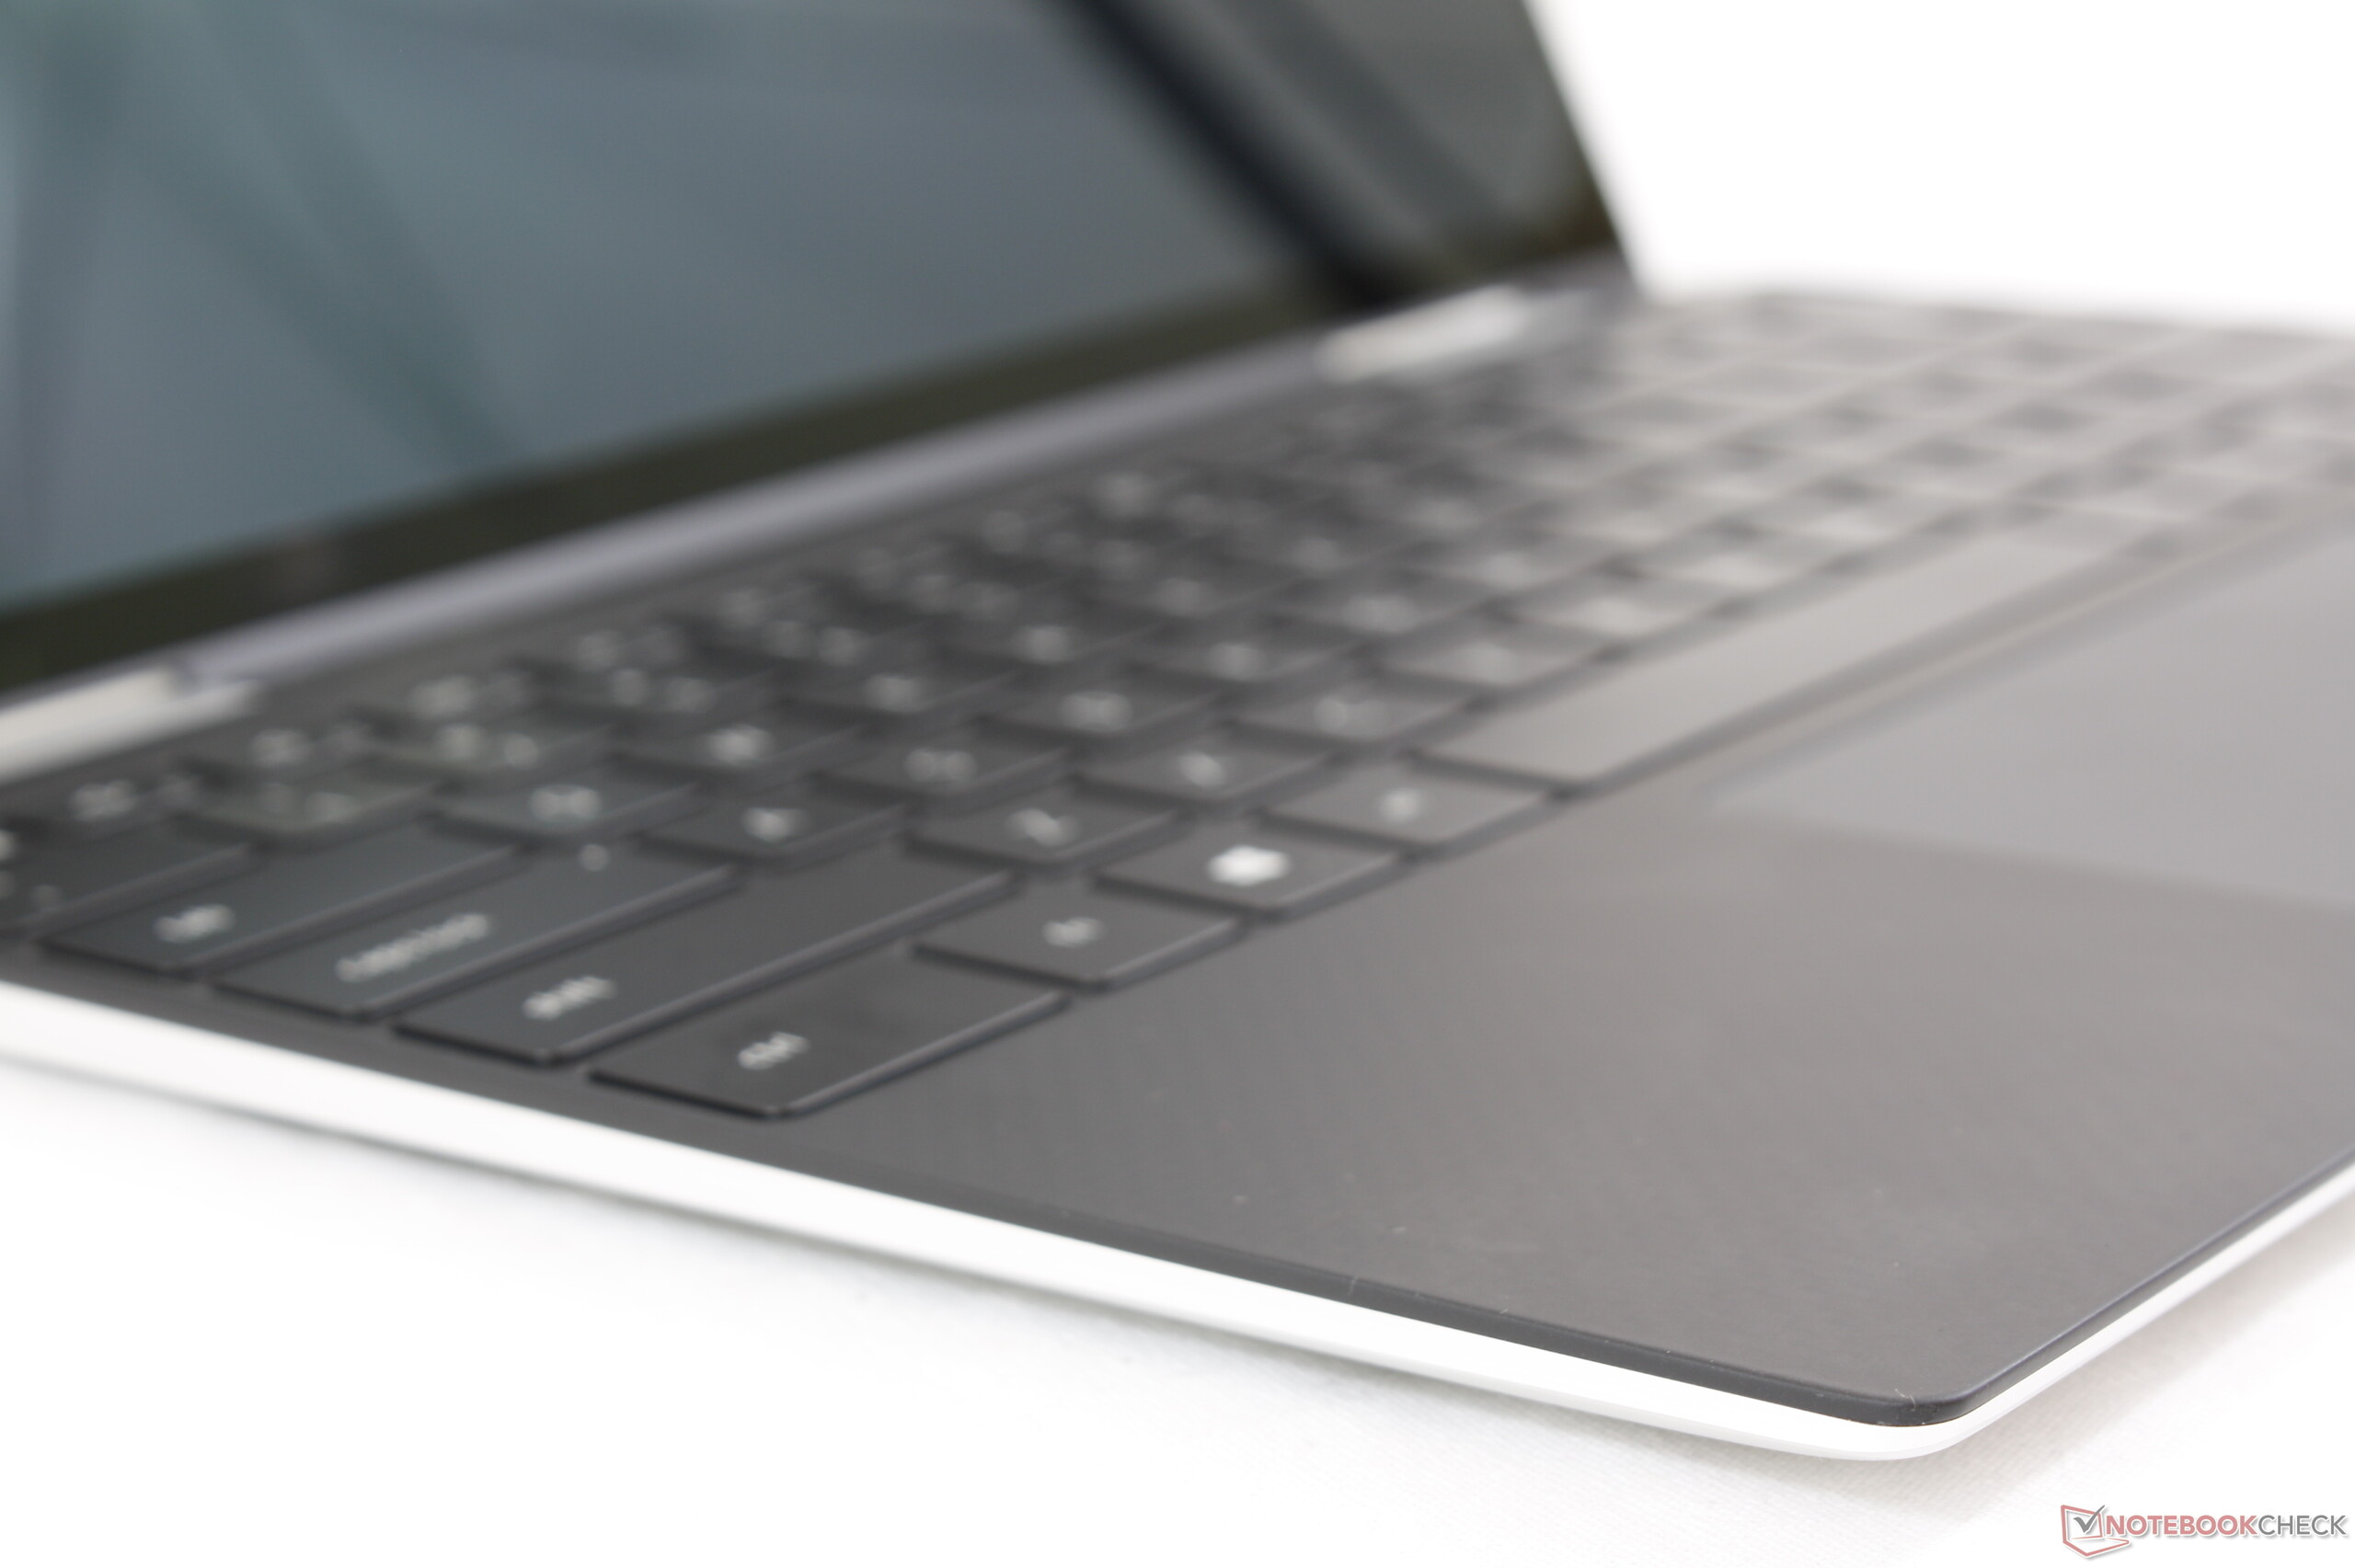
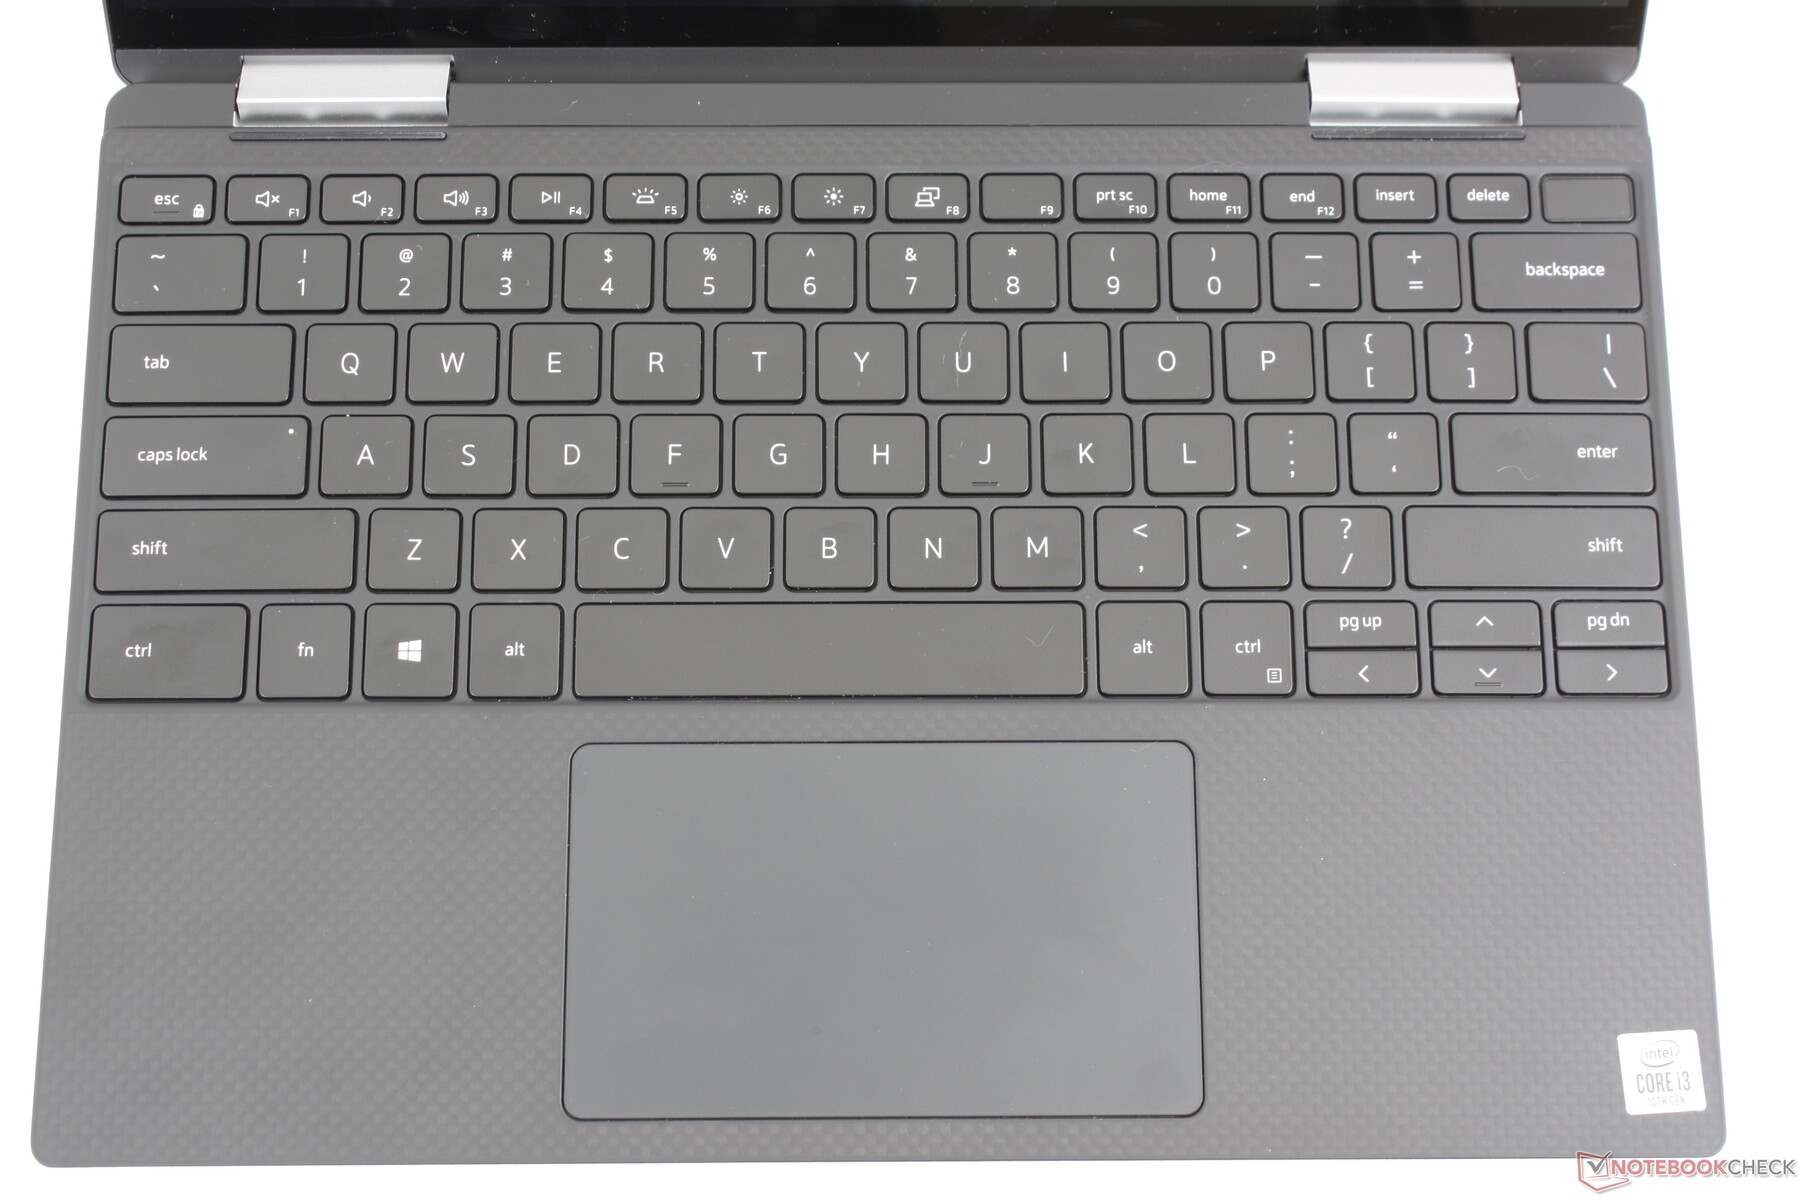
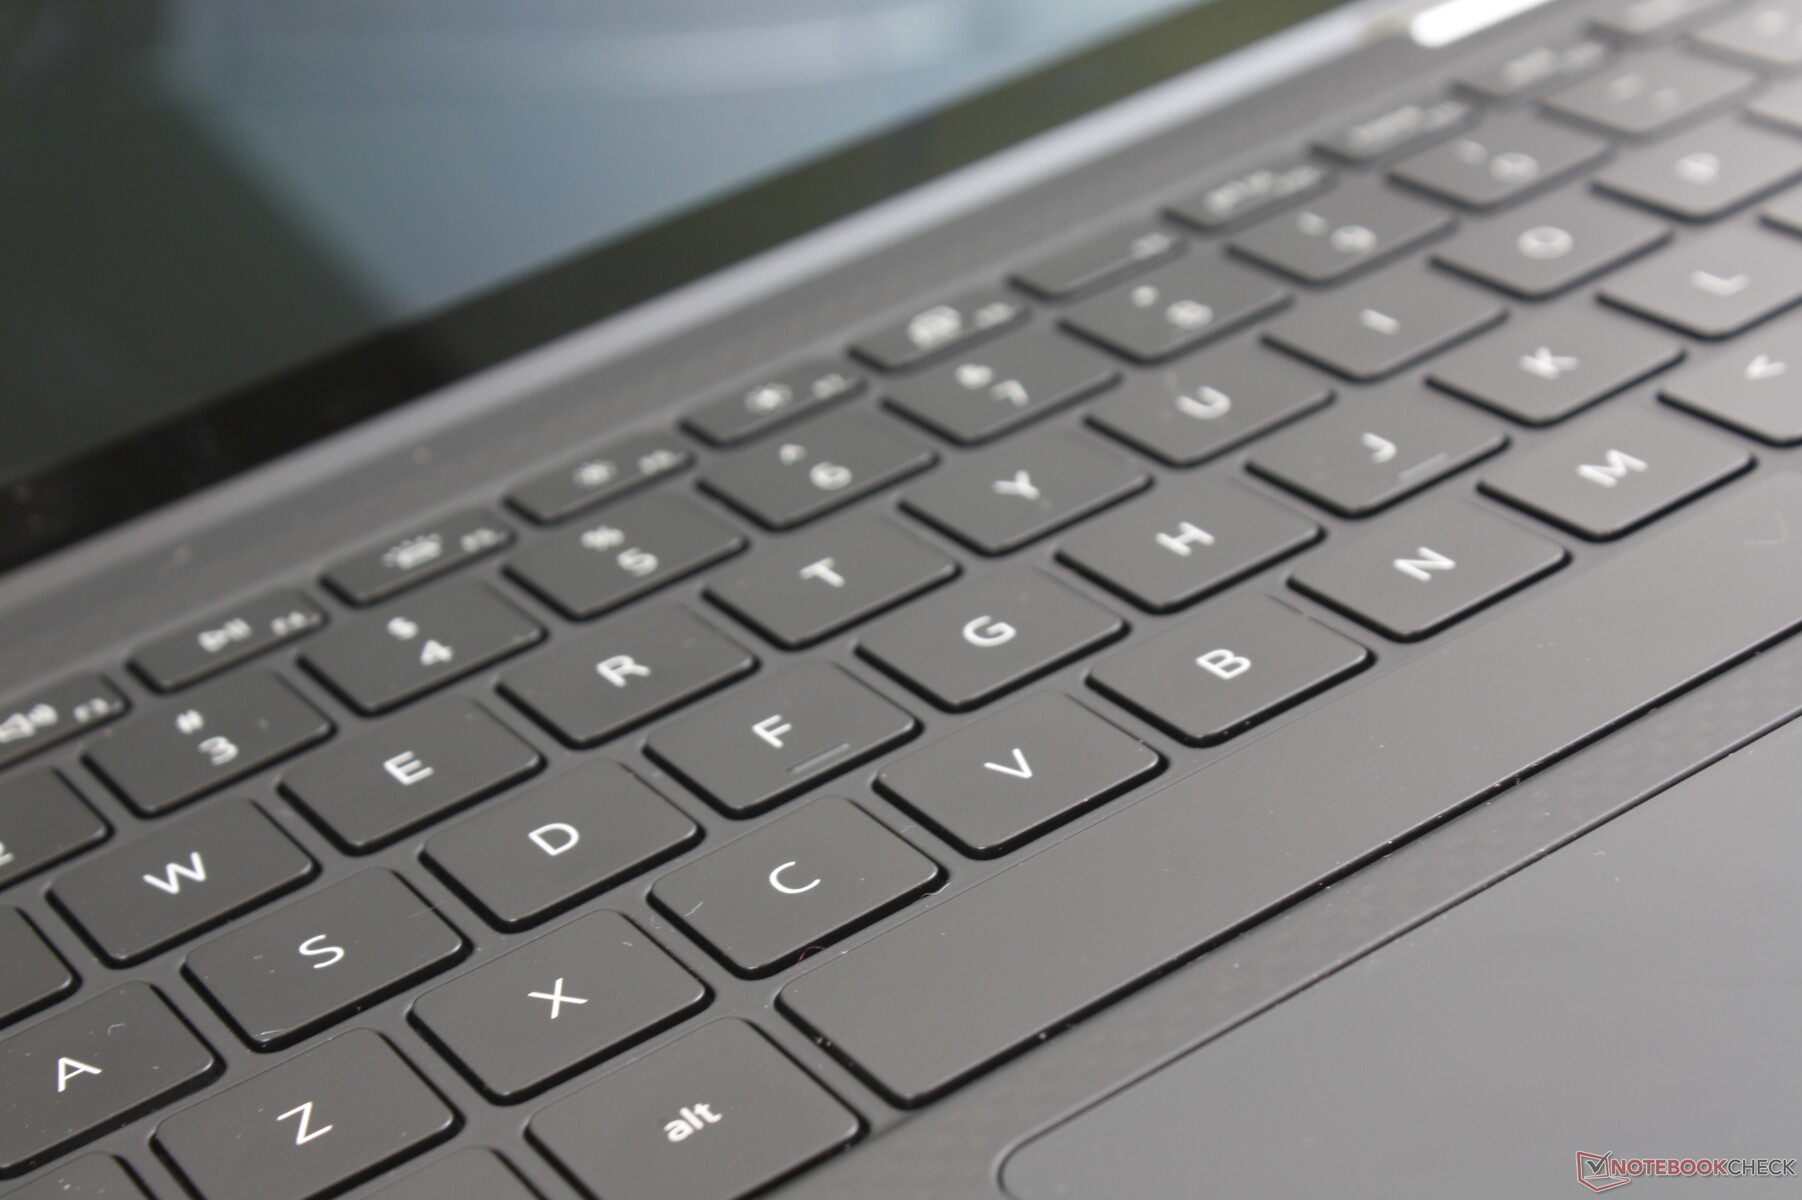
Dell has opted to integrate its unique MagLev keyboard from the XPS 15 9575 series for a very different typing experience when compared to the traditional membrane-based keyboards of other XPS 13 laptops. Travel is much shallower with crisper key feedback than what most Ultrabooks tend to offer. MagLev technology relies on magnets for improved uniformity, longevity, and tactile feedback without requiring deeper key depth. If you've ever typed on an XPS 15 9575 or Apple MacBook Air, then you'll have a good idea of what it feels like typing on the XPS 13 7390 2-in-1.
The MagLev keys aren't necessarily better or worse than membrane keys from a practical day-to-day perspective. It's simply different and so users will either love or hate the feel of the keys. The XPS 13 7390 2-in-1 will likely satisfy hardcore MacBook typists while others who may be accustomed to typing on a classic clamshell XPS 13 may find the sudden change to MagLev jarring.
Touchpad
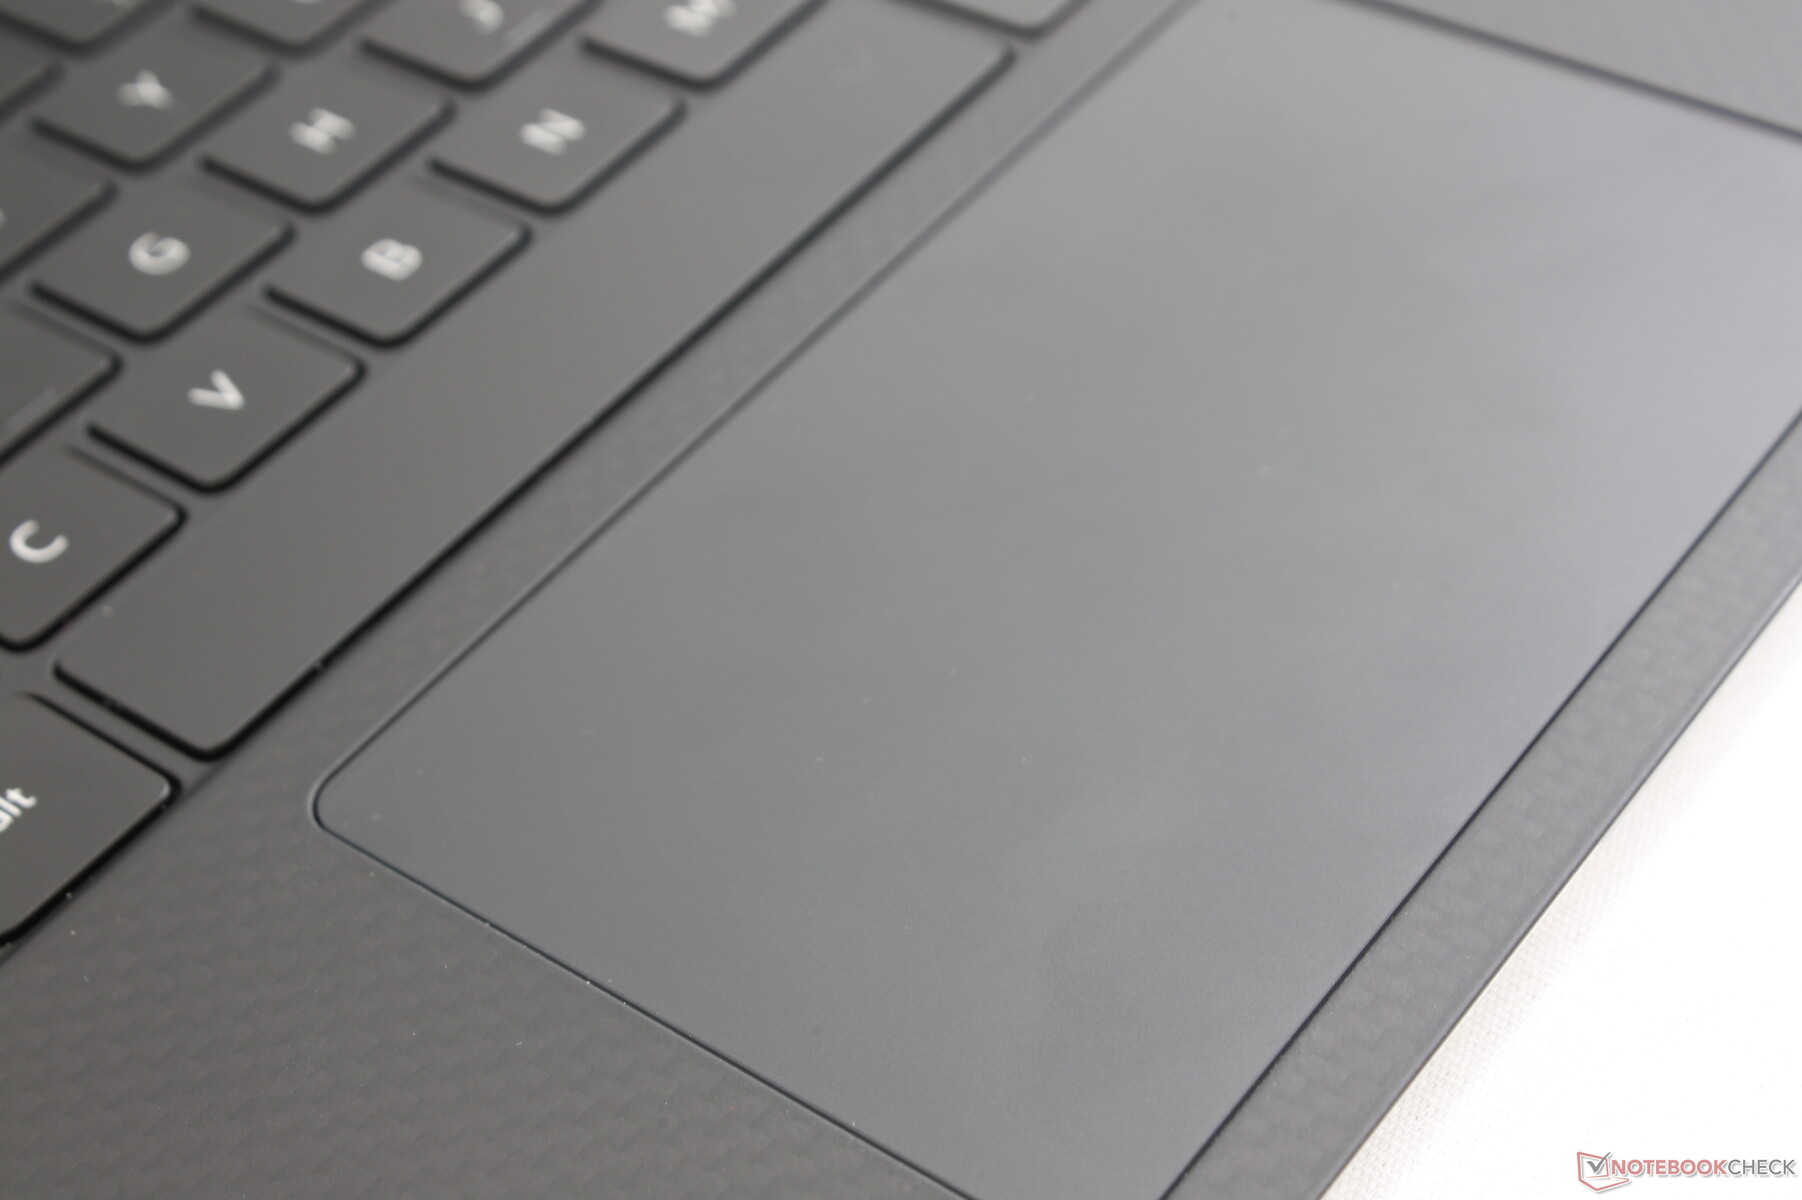
The Precision-enabled clickpad (~11.3 x 6.8 cm) is larger than on both the outgoing XPS 13 9365 2-in-1 (~10.5 x 6 cm) and on the XPS 13 9380 (~10.5 x 5 cm). Gliding slowly or quickly across the clickpad surface results in smooth motions with no jumping or cursor twitching and only minimal sticking.
The integrated mouse keys are not as ergonomic to use. Clatter is loud with only light-moderate feedback from the very shallow travel. Simple multi-touch actions like drag and dropping or text highlighting are less accurate and more jumpy to use as a result especially when compared to Dell's Latitude laptops which tend to have dedicated mouse buttons.
Display
One of the key differences that separate the XPS 13 7390 2-in-1 from other XPS 13 models is its display. This is the first XPS laptop with a 16:10 screen to imply "work first, multimedia second" in order to attract more office users. It's also the first 13.4-inch laptop in our database and so its Sharp LQ134N1 IPS panel can be found on no other consumer laptop as of this writing.
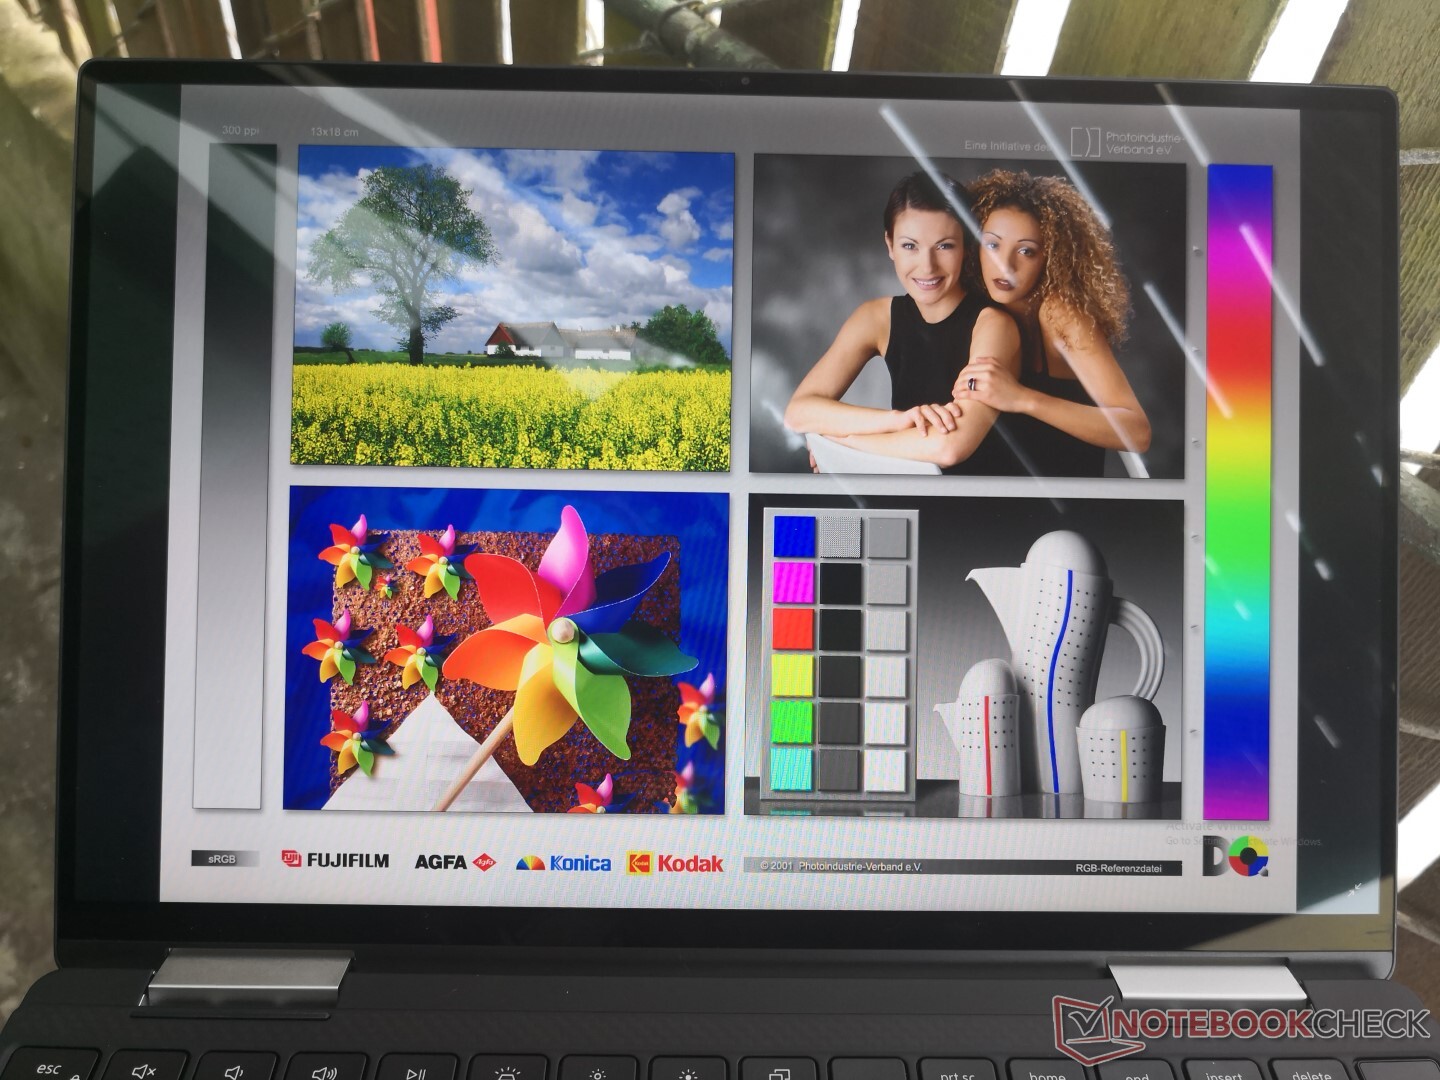
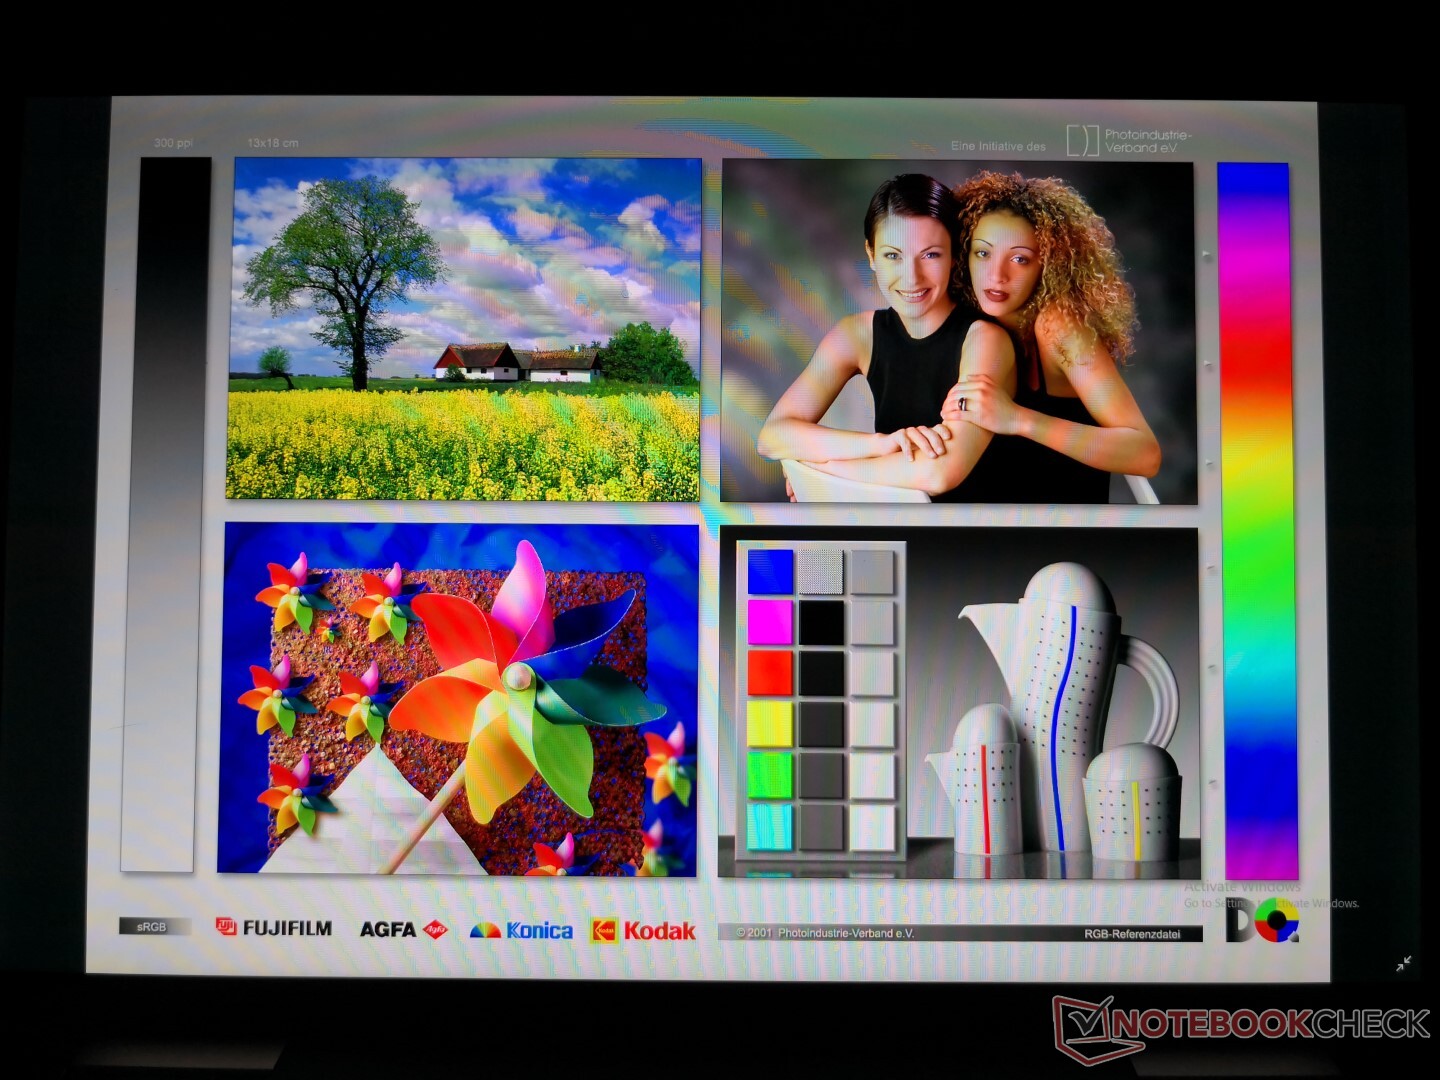
Display quality is impressive especially when considering that this is the least expensive FHD configuration. The panel is very bright by over two times some competing convertibles like the HP Spectre x360 13 or Lenovo Yoga C930. It manages to be over 40 percent and 10 percent brighter than the XPS 13 9380 and MacBook Pro 13, respectively. The only notable subnotebook to offer an even brighter display is the latest HP EliteBook x360 1040 13 and its 1000-nit display option.
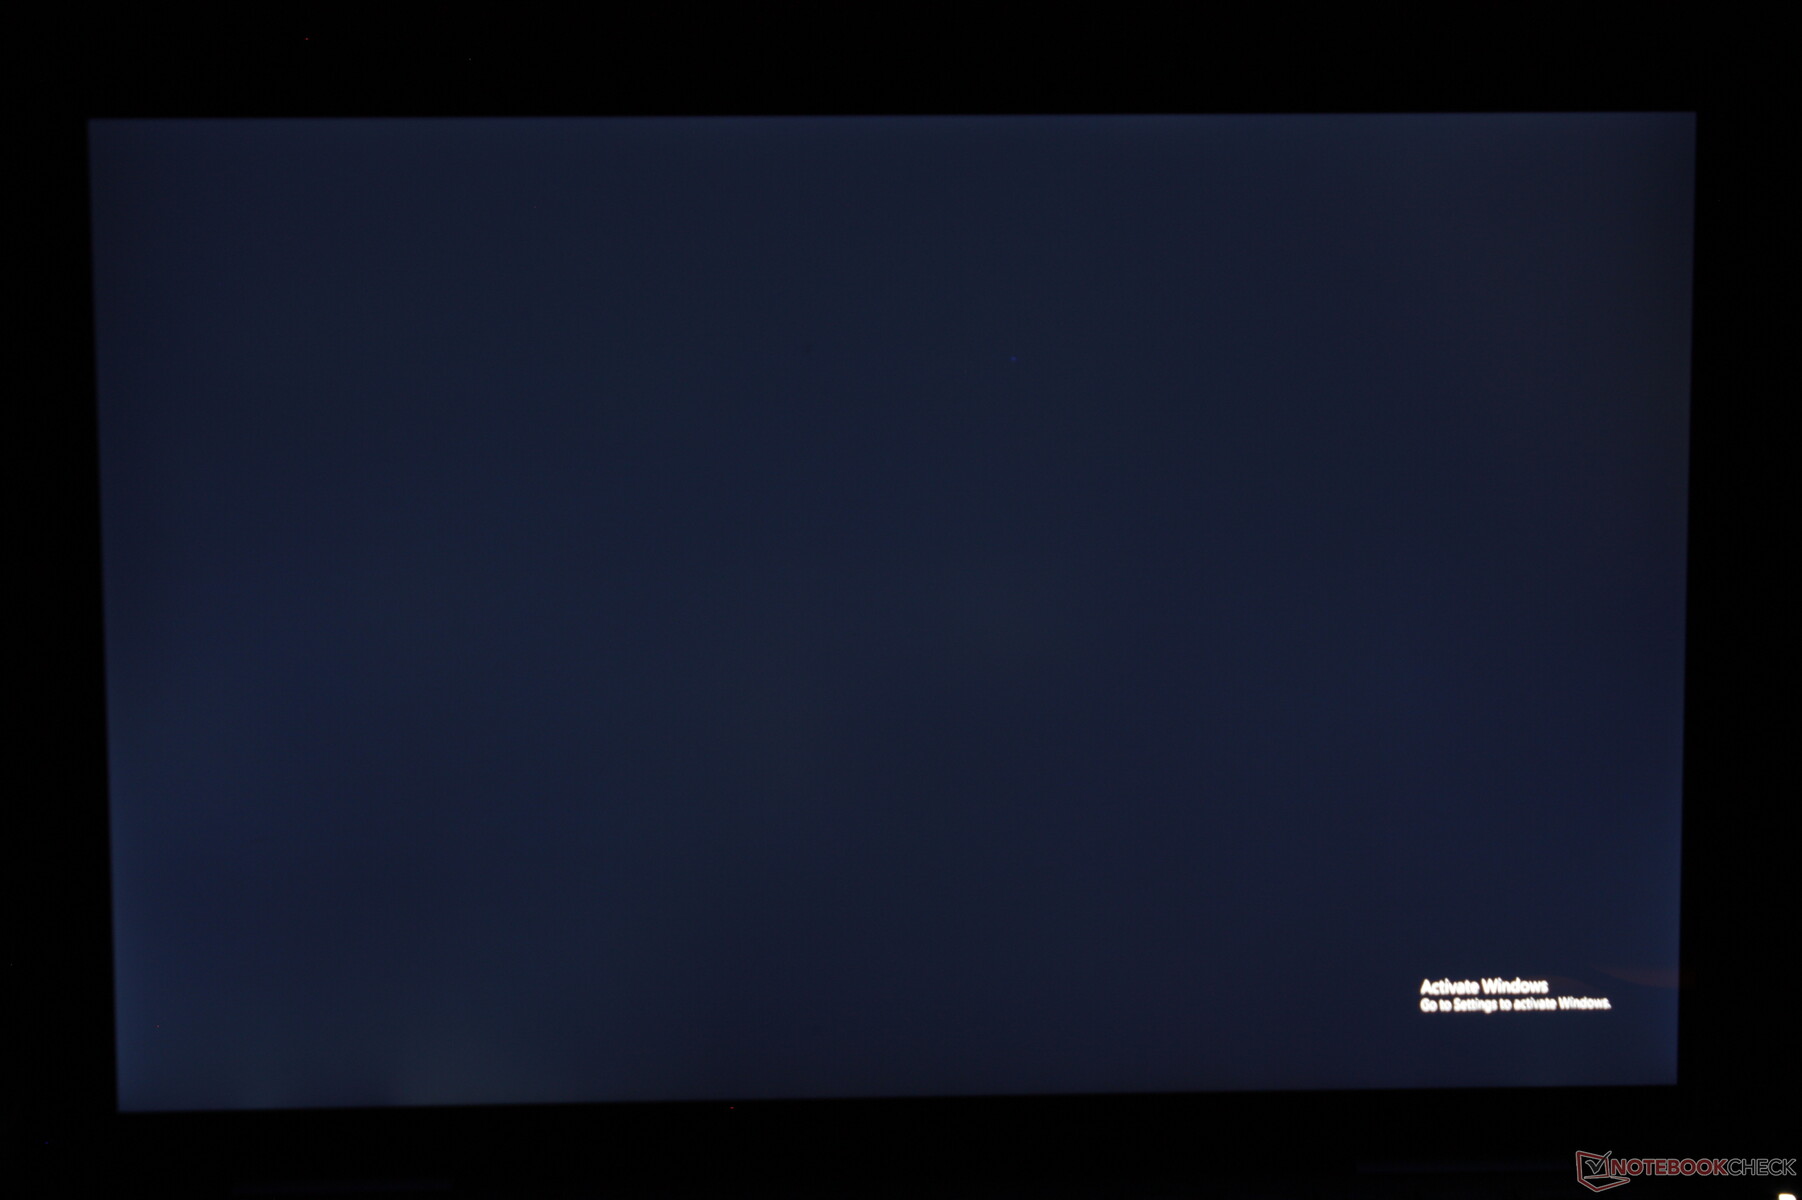
Aside from brightness, colors are also more accurate than we were anticipating even before any calibration attempts. The very high contrast ratio and grain-free glossy Gorilla Glass overlay help make colors pop for a more stunning visual experience when compared to something like a cheaper Dell Inspiron, Asus VivoBook, or HP Envy. We're able to notice some slight uneven backlight bleeding along the bottom edge of our unit that's thankfully difficult to see on most occasions.
Our main criticisms about the display are the relatively slow response times for more noticeable ghosting and the lack of any high refresh rate options unlike on the aforementioned HP. Although these features typically target gamers, there's no arguing that they also enhance the smoothness and responsiveness of a laptop.
| |||||||||||||||||||||||||
Brightness Distribution: 88 %
Center on Battery: 576.3 cd/m²
Contrast: 1746:1 (Black: 0.33 cd/m²)
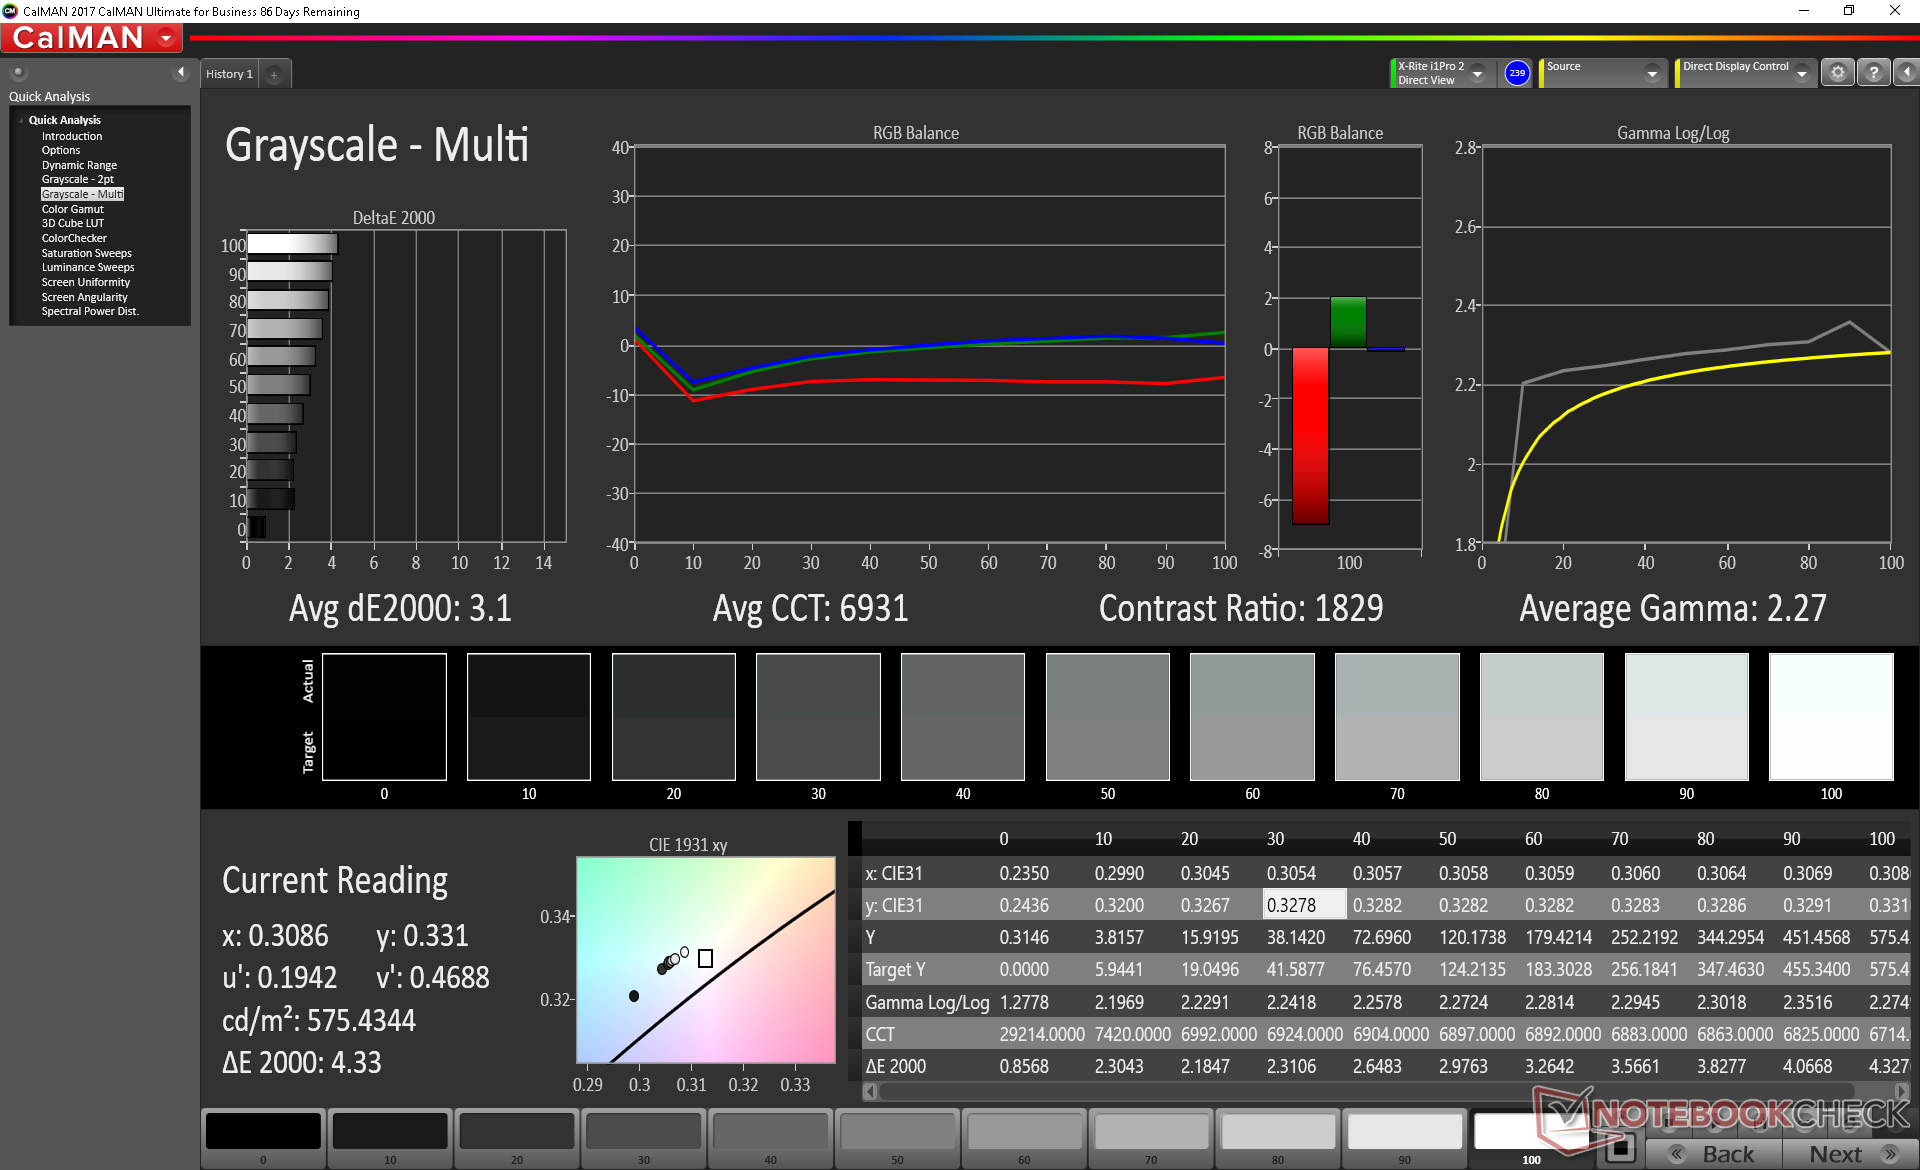
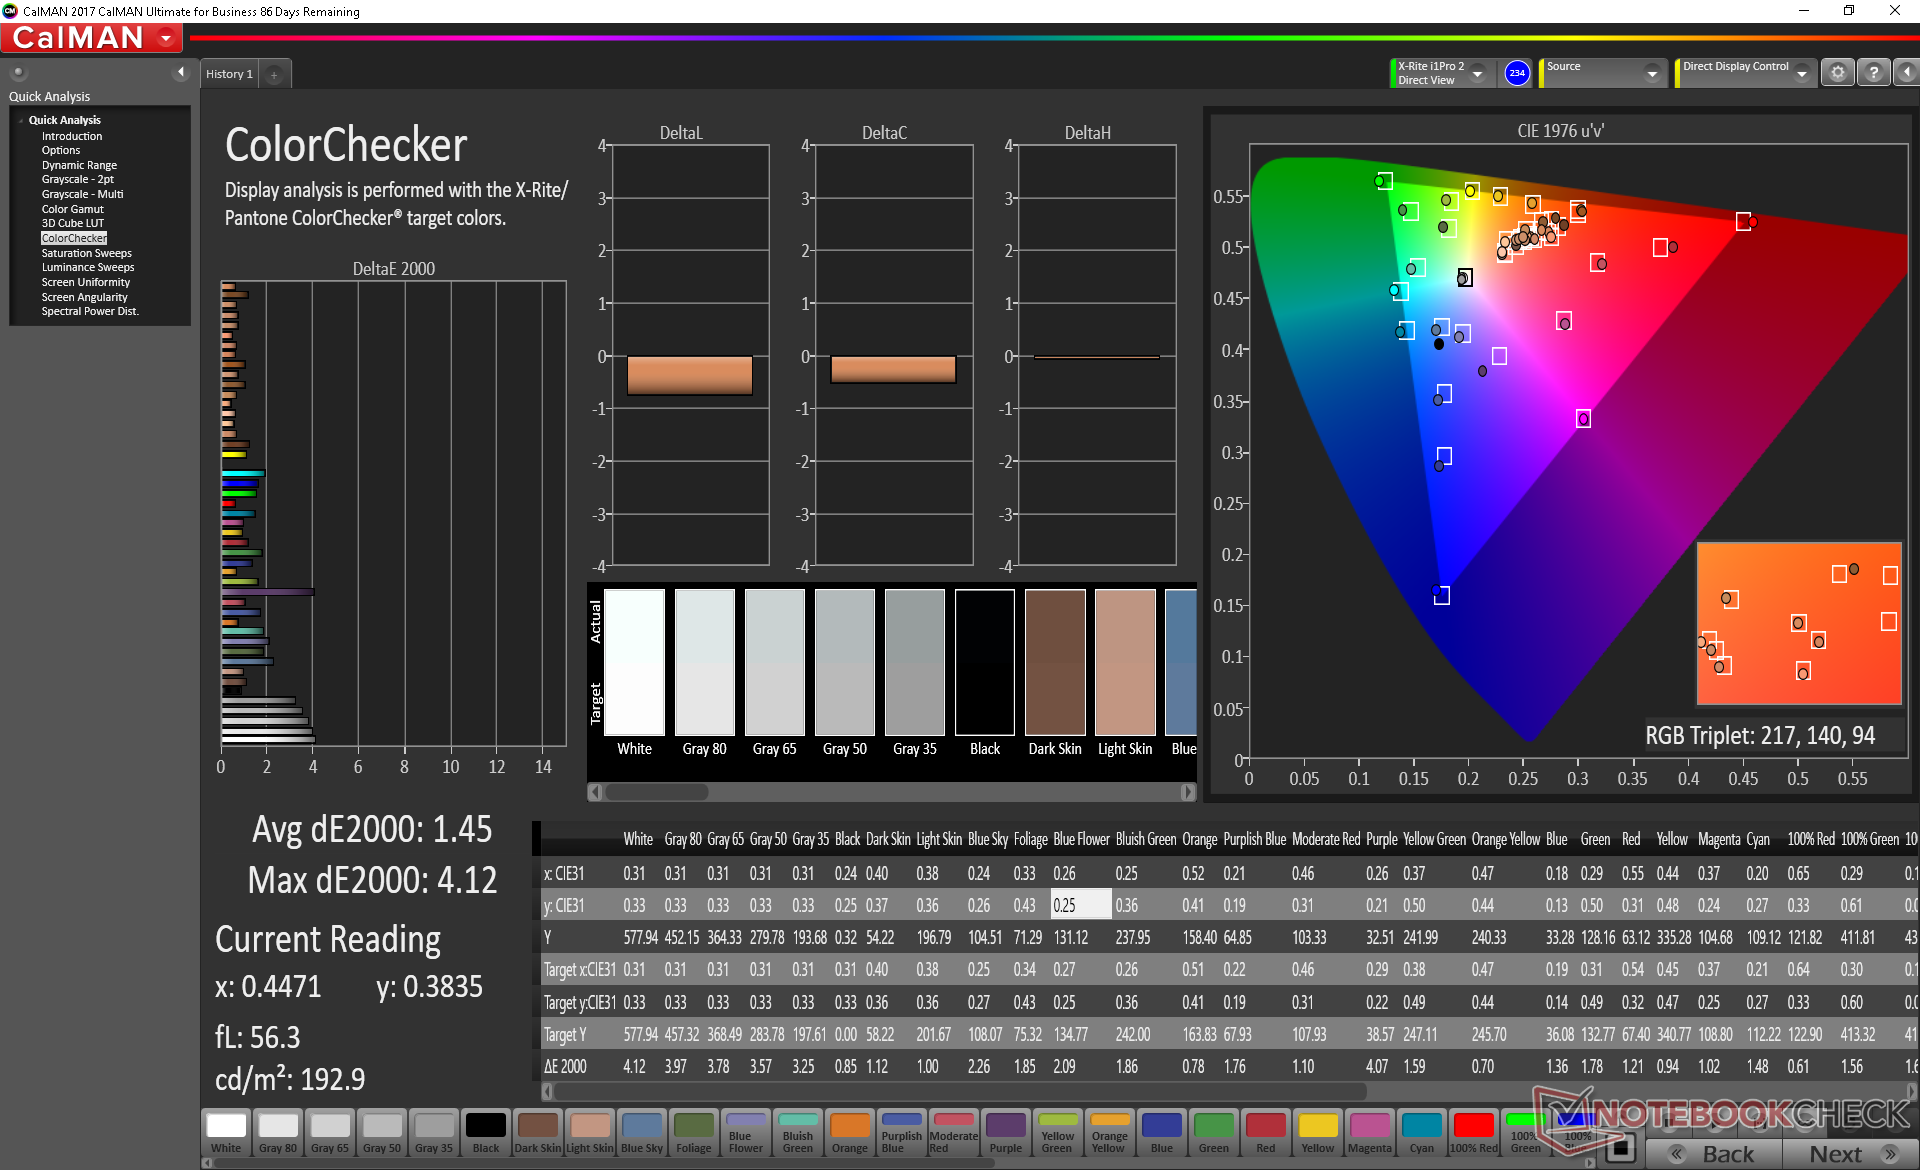
ΔE ColorChecker Calman: 1.45 | ∀{0.5-29.43 Ø4.73}
calibrated: 1.19
ΔE Greyscale Calman: 3.1 | ∀{0.09-98 Ø4.97}
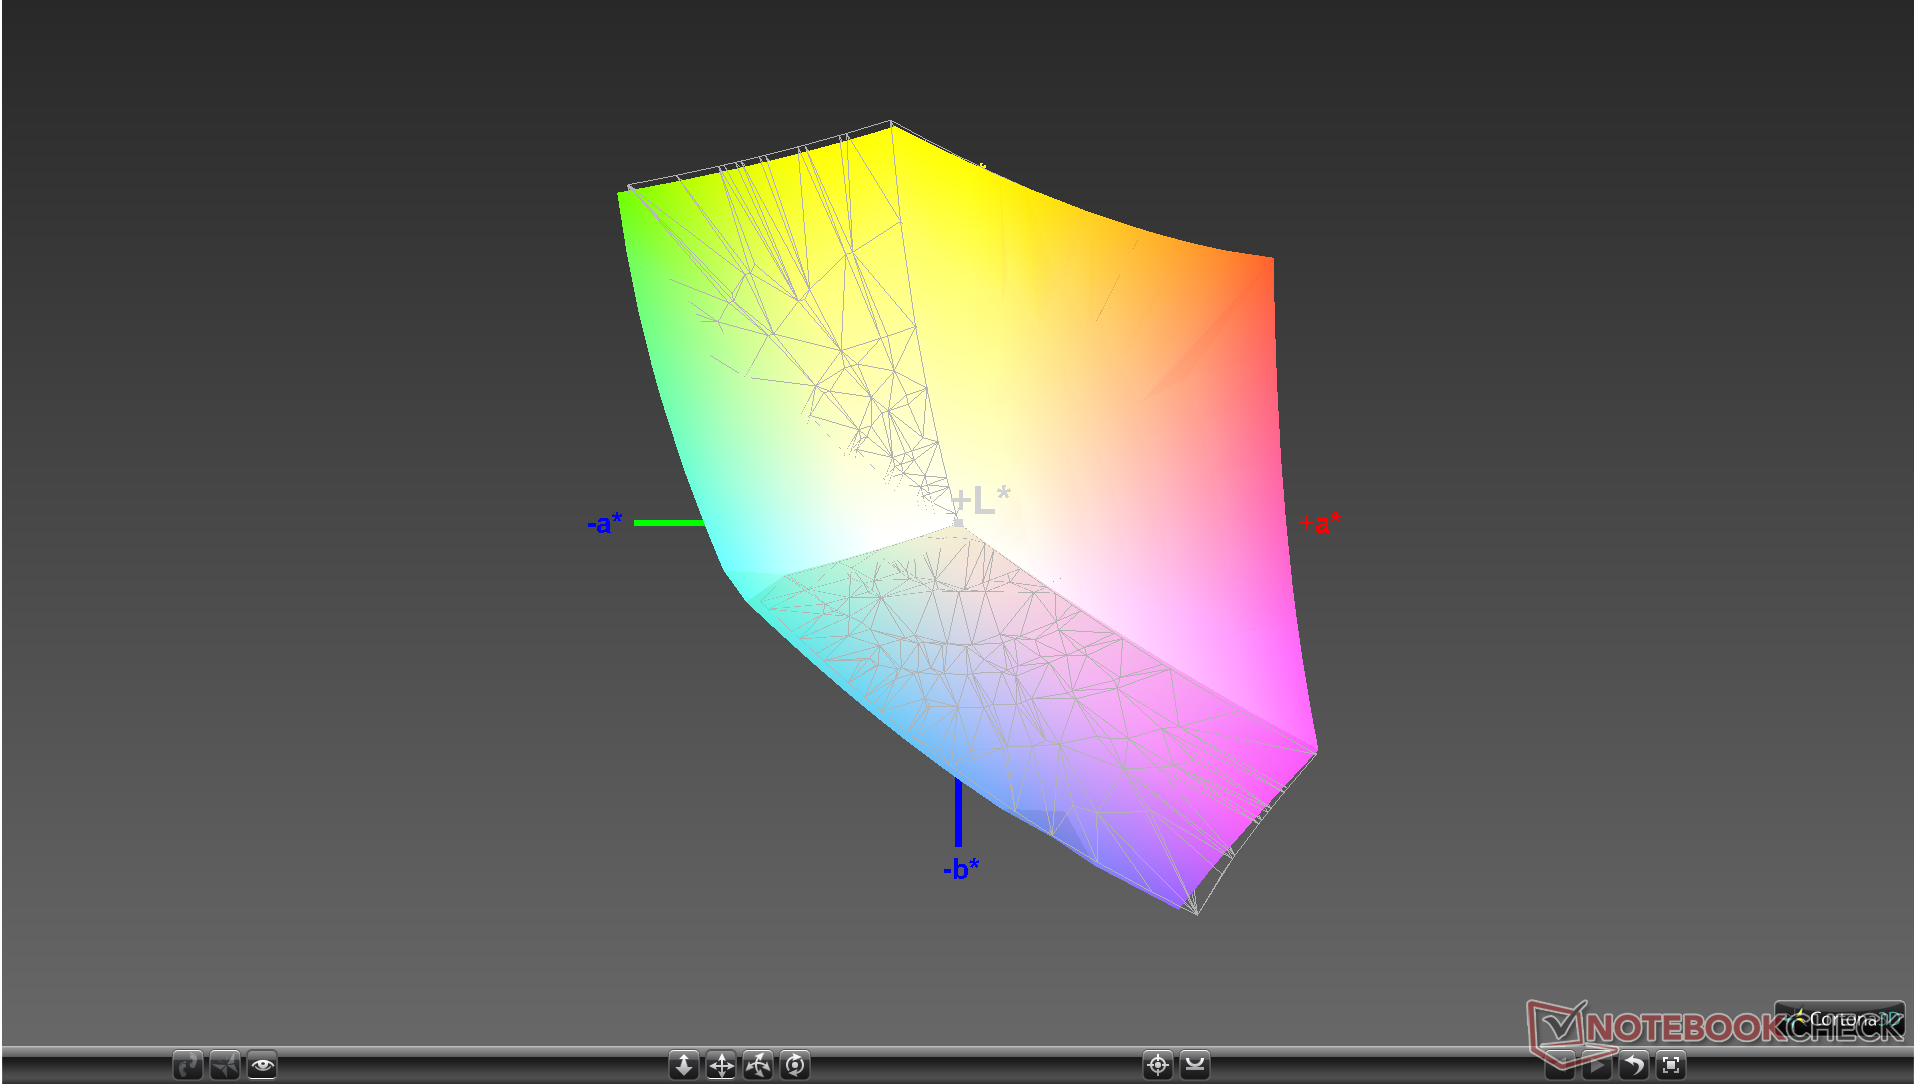
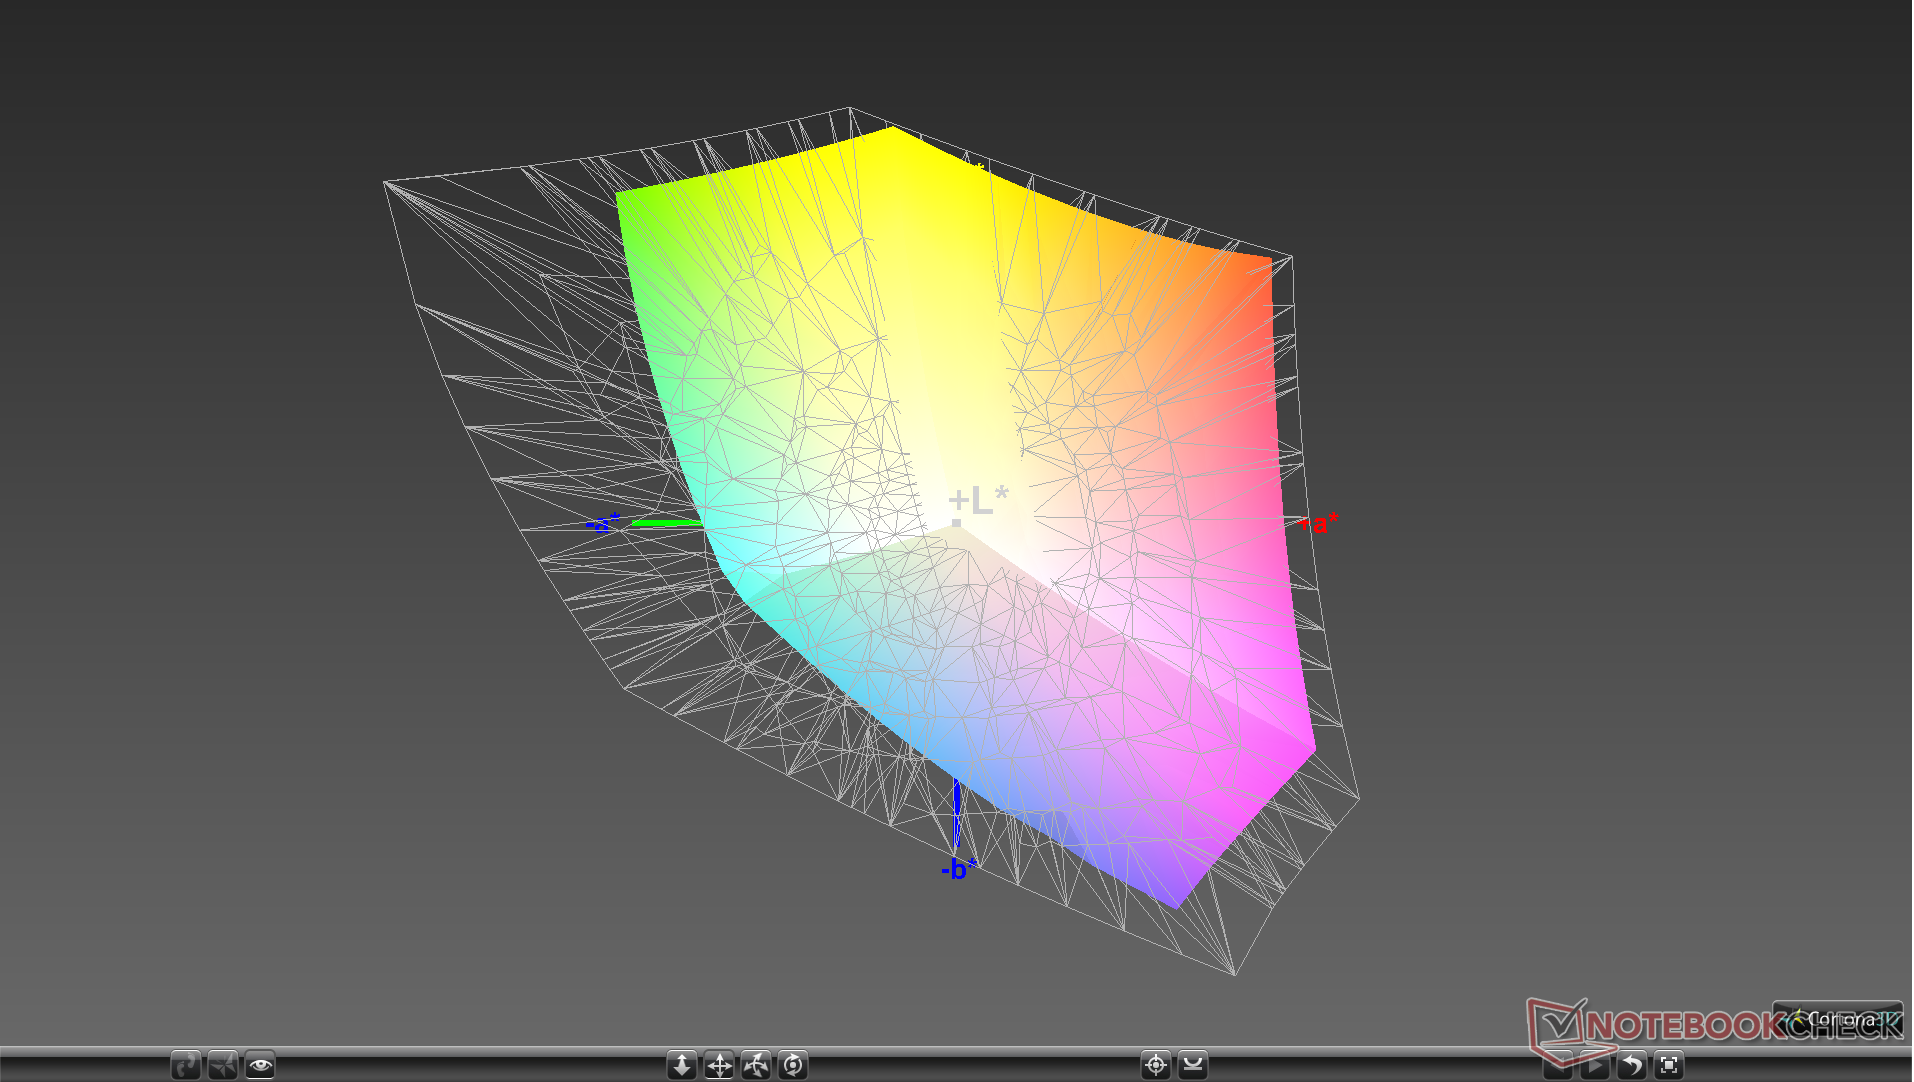
98.5% sRGB (Argyll 1.6.3 3D)
64.2% AdobeRGB 1998 (Argyll 1.6.3 3D)
70.4% AdobeRGB 1998 (Argyll 3D)
98.2% sRGB (Argyll 3D)
68.6% Display P3 (Argyll 3D)
Gamma: 2.27
CCT: 6931 K
| Dell XPS 13 7390 2-in-1 Core i3 Sharp LQ134N1, IPS, 13.4", 1920x1200 | Dell XPS 13 9380 2019 ID: AUO 282B B133ZAN Dell: 90NTH, IPS, 13.3", 3840x2160 | Dell XPS 13-9365 2-in-1 IPS, 13.3", 1920x1080 | HP Spectre x360 13-ap0312ng M133NVF3, IPS, 13.3", 1920x1080 | Lenovo Yoga C930-13IKB 81C4 AUO B139HAN03_0, IPS, 13.9", 1920x1080 | Asus ZenBook S13 UX392FN Tianma XM, IPS, 13.9", 1920x1080 | |
|---|---|---|---|---|---|---|
| Display | -6% | -30% | -9% | -8% | -2% | |
| Display P3 Coverage (%) | 68.6 | 64.7 -6% | 47.32 -31% | 63 -8% | 62.7 -9% | 67.5 -2% |
| sRGB Coverage (%) | 98.2 | 93.1 -5% | 71.1 -28% | 89.8 -9% | 92.6 -6% | 95.8 -2% |
| AdobeRGB 1998 Coverage (%) | 70.4 | 65.3 -7% | 48.83 -31% | 64.1 -9% | 64.7 -8% | 69 -2% |
| Response Times | -17% | -1% | 39% | 25% | 12% | |
| Response Time Grey 50% / Grey 80% * (ms) | 46 ? | 58 ? -26% | 48 ? -4% | 29.2 ? 37% | 34.4 ? 25% | 47.2 ? -3% |
| Response Time Black / White * (ms) | 33.6 ? | 36 ? -7% | 32.8 ? 2% | 20 ? 40% | 25.6 ? 24% | 24.8 ? 26% |
| PWM Frequency (Hz) | 2525 ? | 1042 ? | 1000 ? | |||
| Screen | -43% | -86% | -60% | -103% | -11% | |
| Brightness middle (cd/m²) | 576.3 | 404 -30% | 322.6 -44% | 272 -53% | 312 -46% | 466 -19% |
| Brightness (cd/m²) | 555 | 389 -30% | 306 -45% | 298 -46% | 295 -47% | 462 -17% |
| Brightness Distribution (%) | 88 | 85 -3% | 91 3% | 84 -5% | 87 -1% | 90 2% |
| Black Level * (cd/m²) | 0.33 | 0.37 -12% | 0.19 42% | 0.39 -18% | 0.43 -30% | 0.33 -0% |
| Contrast (:1) | 1746 | 1092 -37% | 1698 -3% | 697 -60% | 726 -58% | 1412 -19% |
| Colorchecker dE 2000 * | 1.45 | 3.72 -157% | 7.7 -431% | 4.3 -197% | 7.6 -424% | 1.93 -33% |
| Colorchecker dE 2000 max. * | 4.12 | 7.38 -79% | 11.1 -169% | 9 -118% | 15.06 -266% | 4.26 -3% |
| Colorchecker dE 2000 calibrated * | 1.19 | 2.06 -73% | 2.4 -102% | 1.96 -65% | 1.99 -67% | |
| Greyscale dE 2000 * | 3.1 | 4.44 -43% | 7.9 -155% | 4.4 -42% | 8.8 -184% | 1.7 45% |
| Gamma | 2.27 97% | 2.34 94% | 2.88 76% | 1.97 112% | 2.01 109% | 2.15 102% |
| CCT | 6931 94% | 7095 92% | 7044 92% | 5825 112% | 6874 95% | 6382 102% |
| Color Space (Percent of AdobeRGB 1998) (%) | 64.2 | 60 -7% | 44.1 -31% | 58.9 -8% | 59.1 -8% | 62.2 -3% |
| Color Space (Percent of sRGB) (%) | 98.5 | 93 -6% | 69.9 -29% | 89.8 -9% | 92.3 -6% | 95.7 -3% |
| Total Average (Program / Settings) | -22% /
-33% | -39% /
-64% | -10% /
-38% | -29% /
-69% | -0% /
-6% |
* ... smaller is better
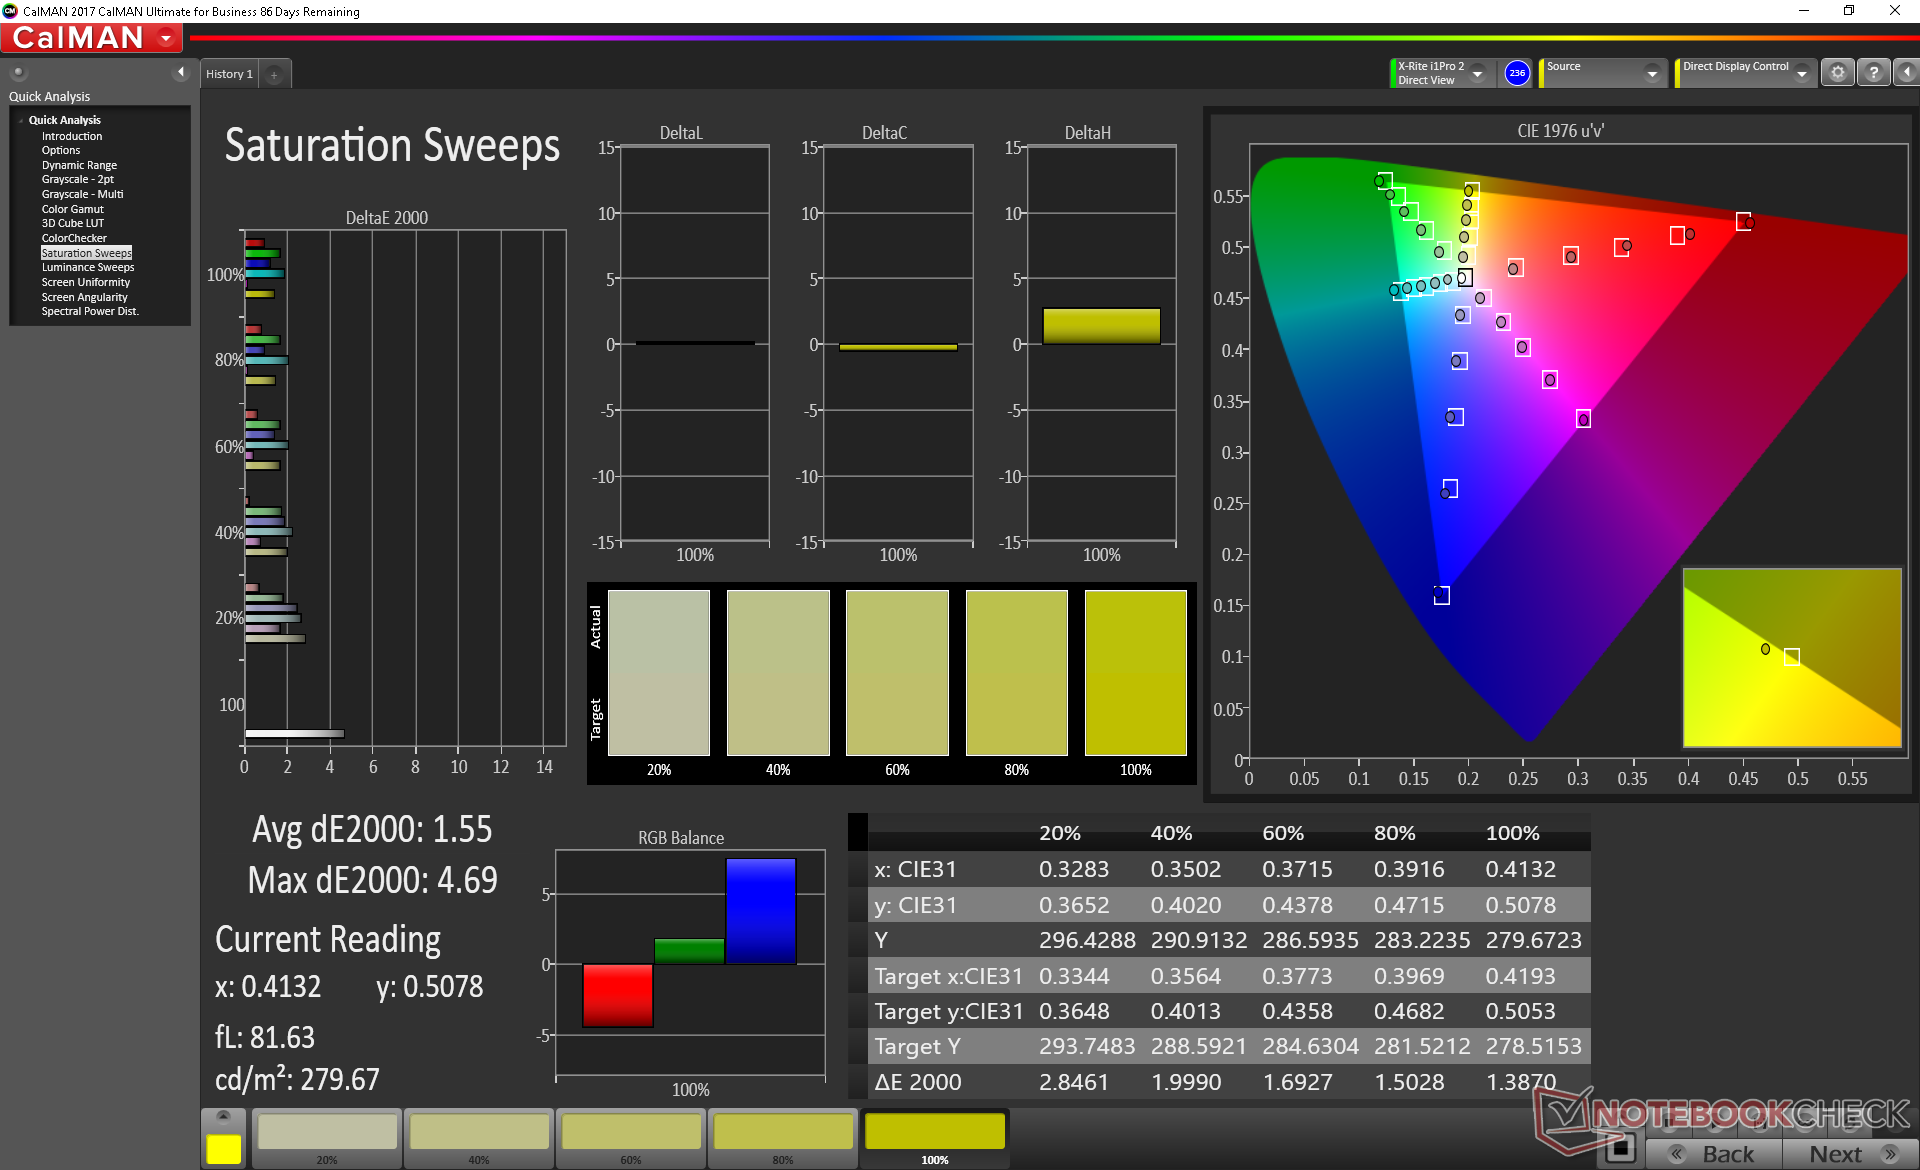
The base FHD display covers sRGB almost in its entirety whereas the 4K UHD SKU promises 90 percent DCI-P3. Colors are much deeper than what was offered on the 2017 XPS 13 and comparable to other flagship Ultrabooks like the HP Spectre x360 13 or Asus ZenBook 13.
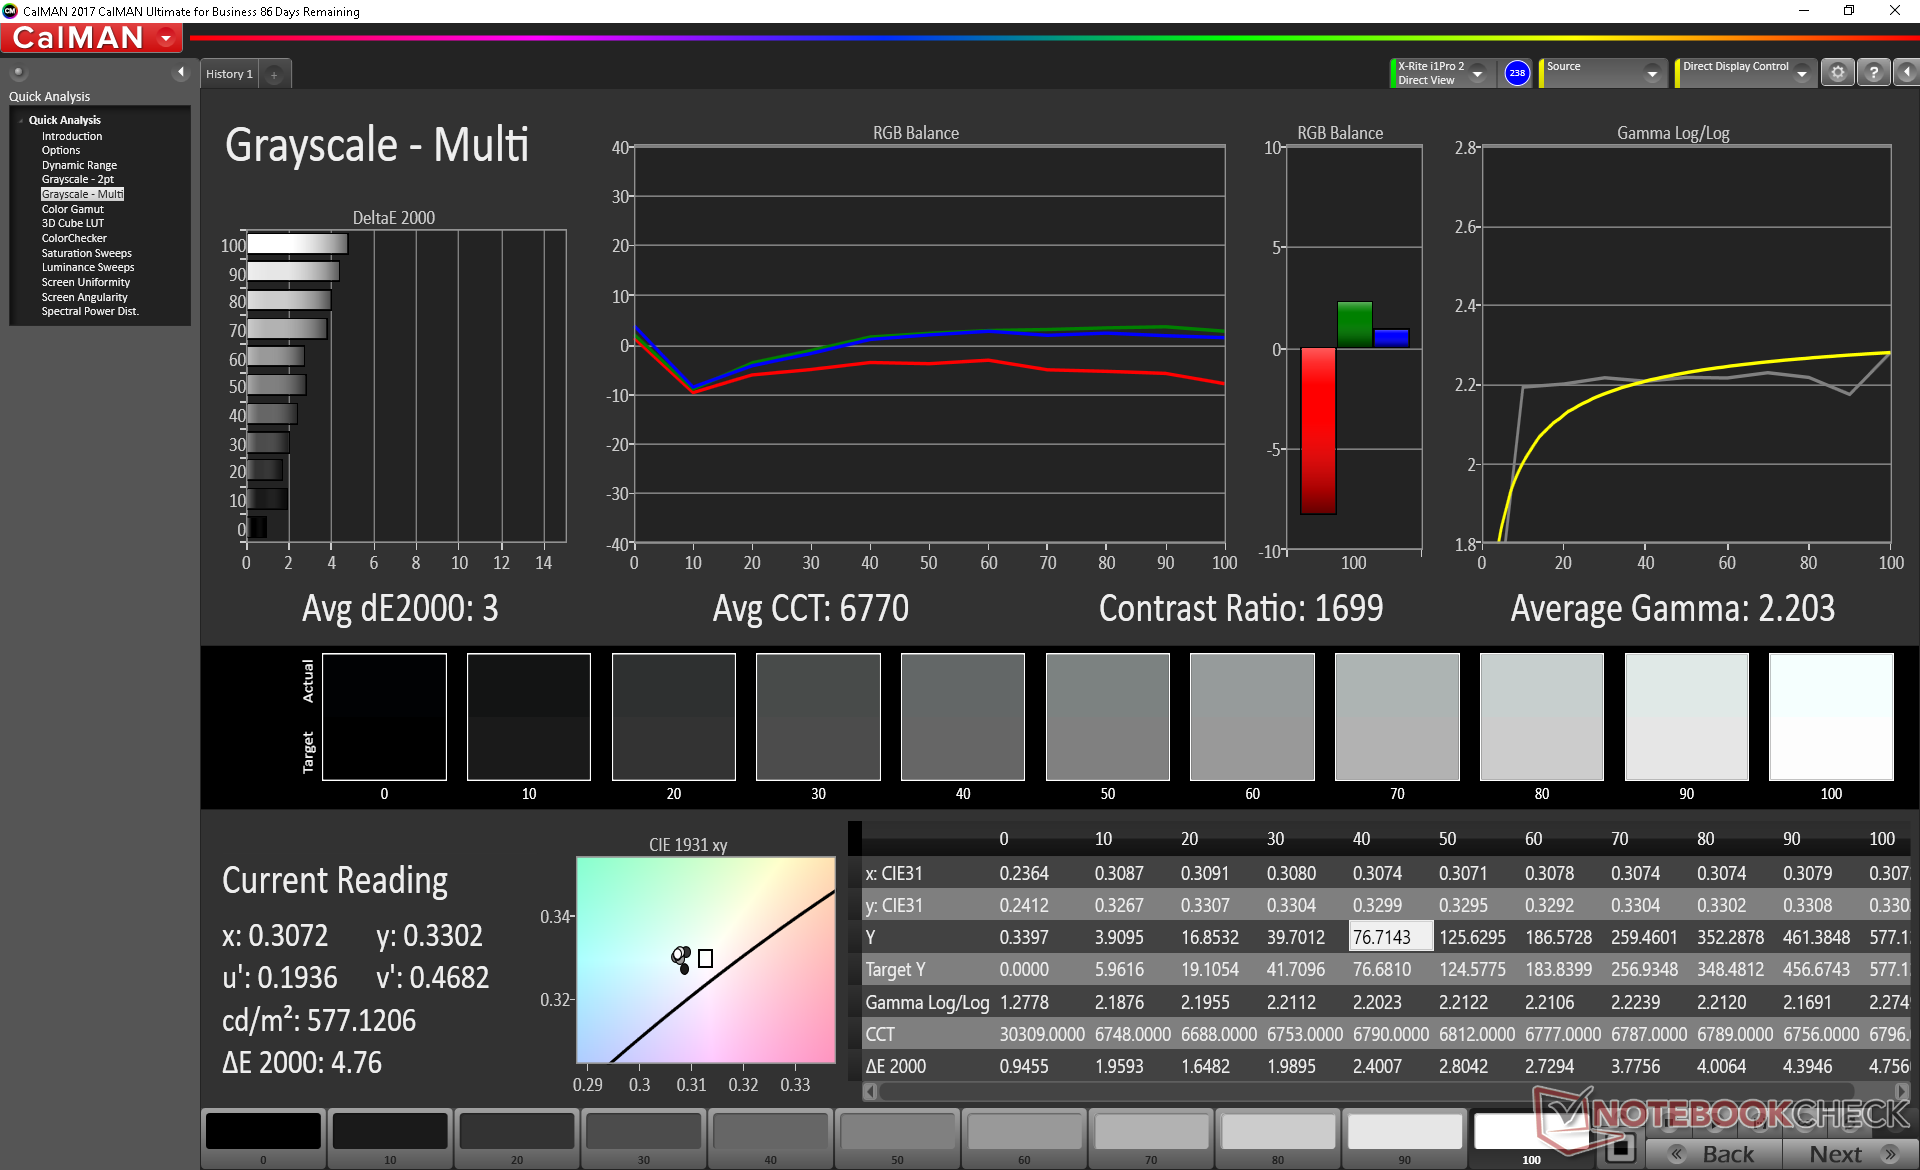
Further measurements with an X-Rite colorimeter reveal a very accurate display out of the box with grayscale and color DeltaE values of just 3.1 and 1.68, respectively. If we are to nitpick, color temperature is slightly on the cool side and purple is represented a bit less accurately than others. Attempting to calibrate the display even further ourselves results in only the most minor of improvements meaning that an end-user calibration is not necessary.


Display Response Times
| ↔ Response Time Black to White | ||
|---|---|---|
| 33.6 ms ... rise ↗ and fall ↘ combined | ↗ 19.2 ms rise | 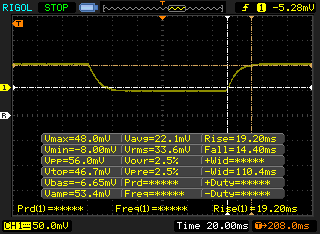 |
| ↘ 14.4 ms fall | ||
| The screen shows slow response rates in our tests and will be unsatisfactory for gamers. In comparison, all tested devices range from 0.1 (minimum) to 240 (maximum) ms. » 90 % of all devices are better. This means that the measured response time is worse than the average of all tested devices (19.9 ms). | ||
| ↔ Response Time 50% Grey to 80% Grey | ||
| 46 ms ... rise ↗ and fall ↘ combined | ↗ 23.2 ms rise | 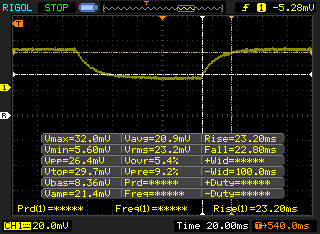 |
| ↘ 22.8 ms fall | ||
| The screen shows slow response rates in our tests and will be unsatisfactory for gamers. In comparison, all tested devices range from 0.165 (minimum) to 636 (maximum) ms. » 79 % of all devices are better. This means that the measured response time is worse than the average of all tested devices (31.1 ms). | ||
Screen Flickering / PWM (Pulse-Width Modulation)
| Screen flickering / PWM detected | 2525 Hz | ≤ 25 % brightness setting | 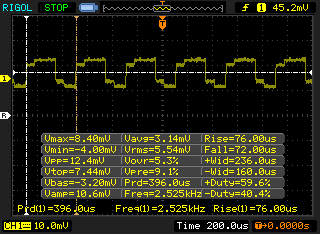 |
The display backlight flickers at 2525 Hz (worst case, e.g., utilizing PWM) Flickering detected at a brightness setting of 25 % and below. There should be no flickering or PWM above this brightness setting. The frequency of 2525 Hz is quite high, so most users sensitive to PWM should not notice any flickering. In comparison: 52 % of all tested devices do not use PWM to dim the display. If PWM was detected, an average of 7791 (minimum: 5 - maximum: 343500) Hz was measured. | |||
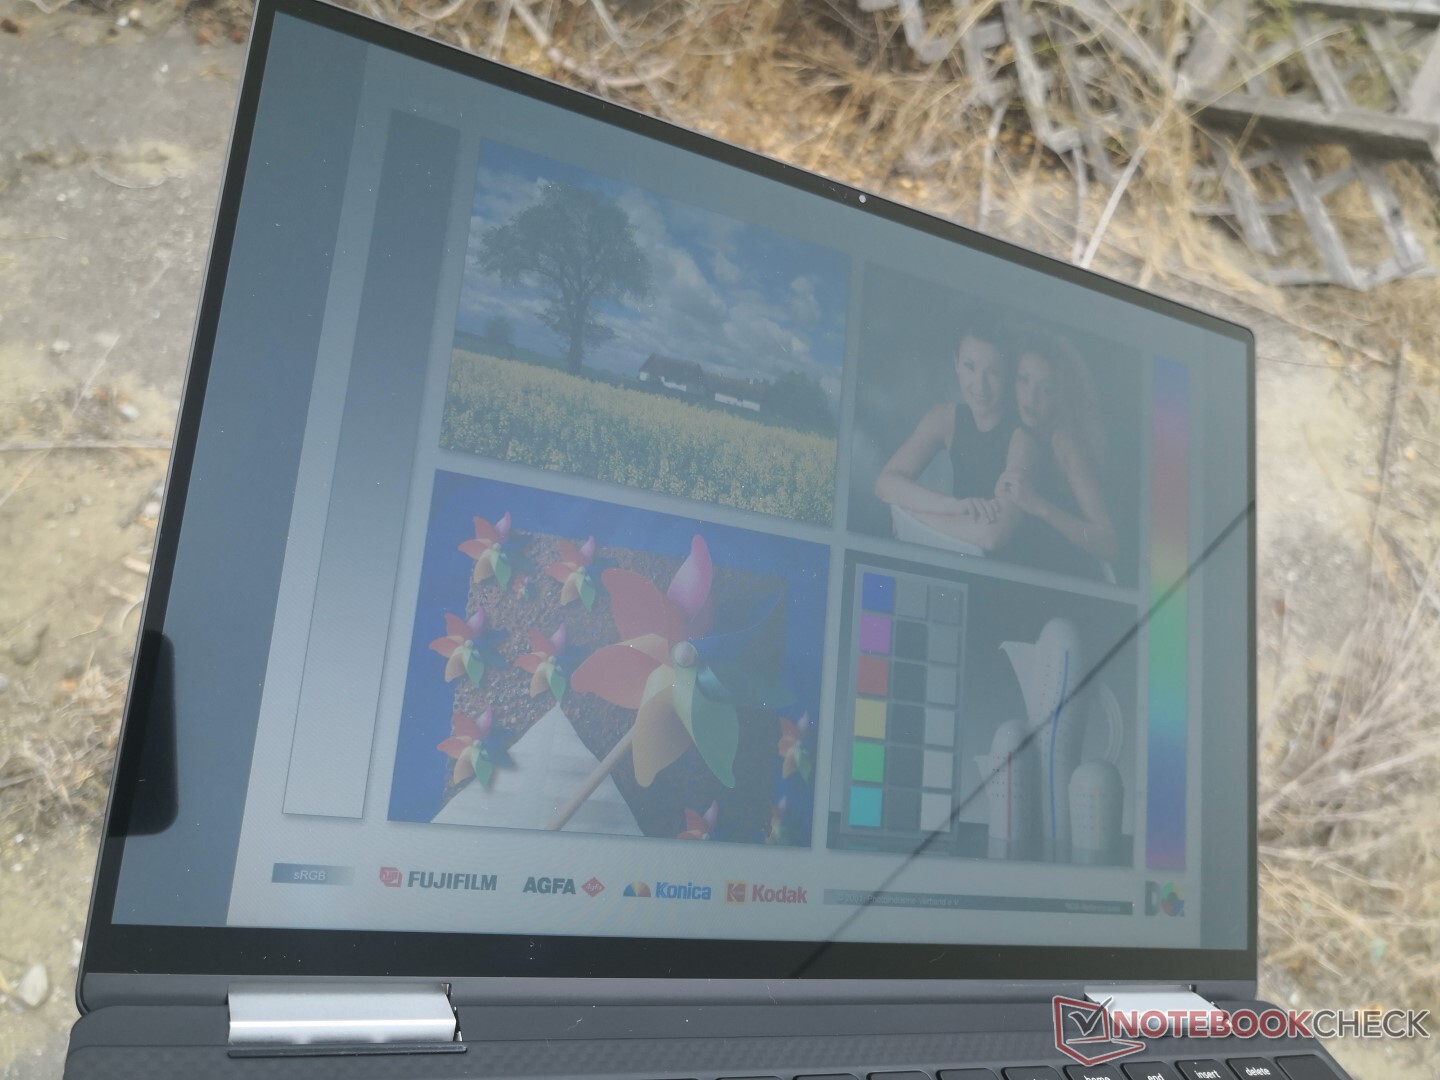
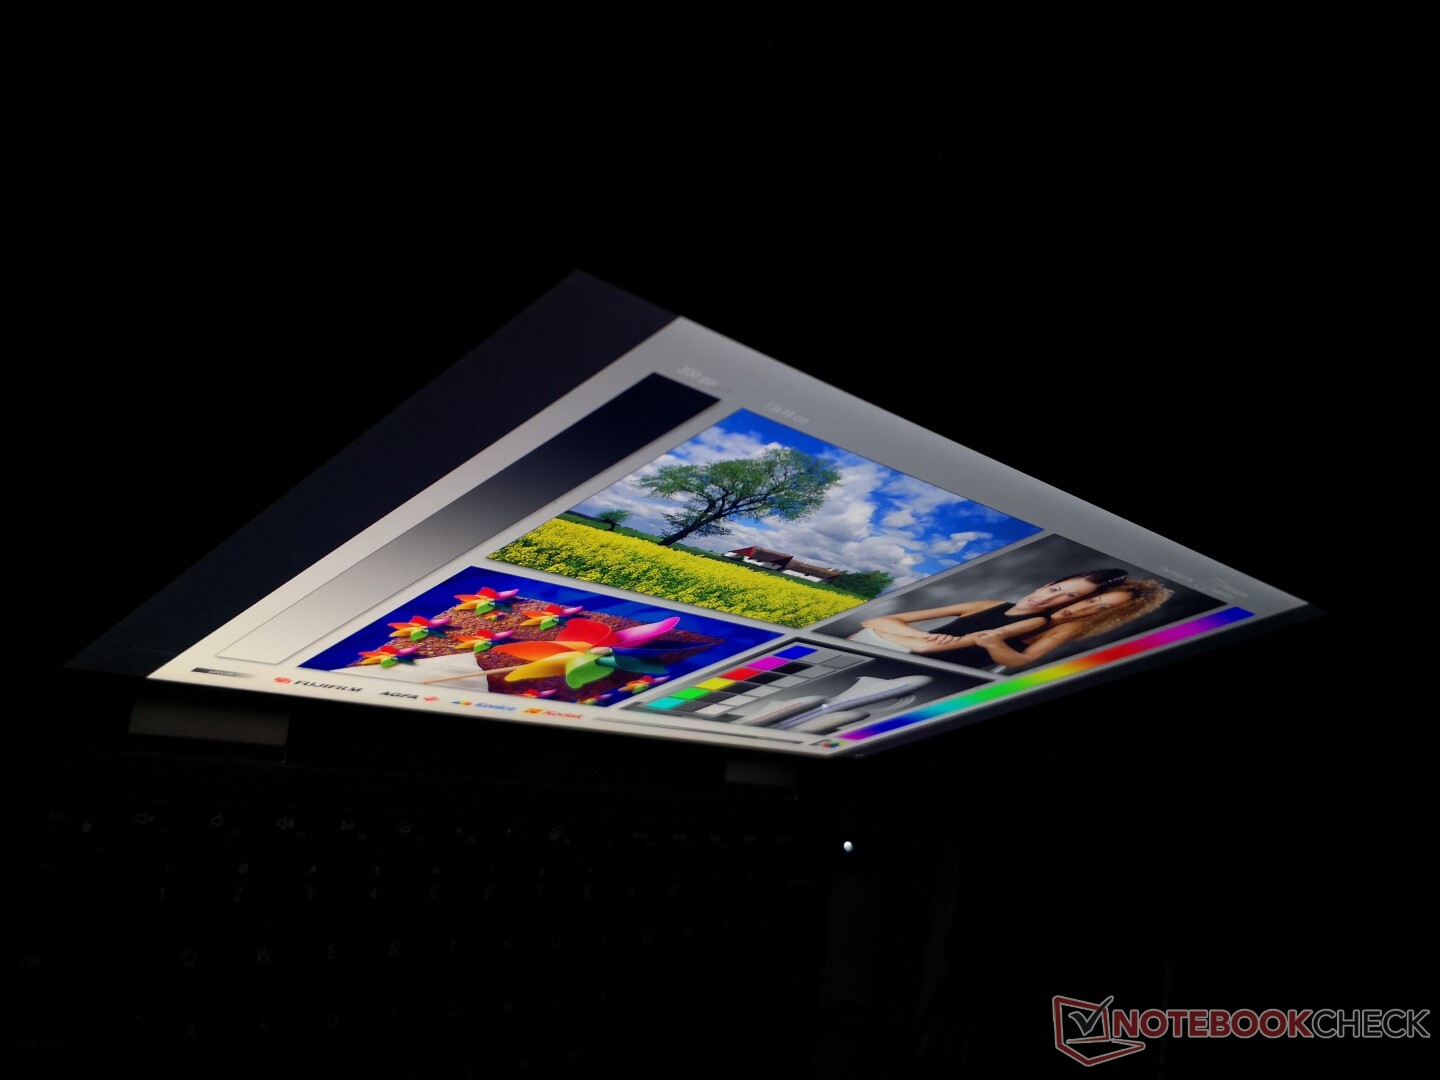
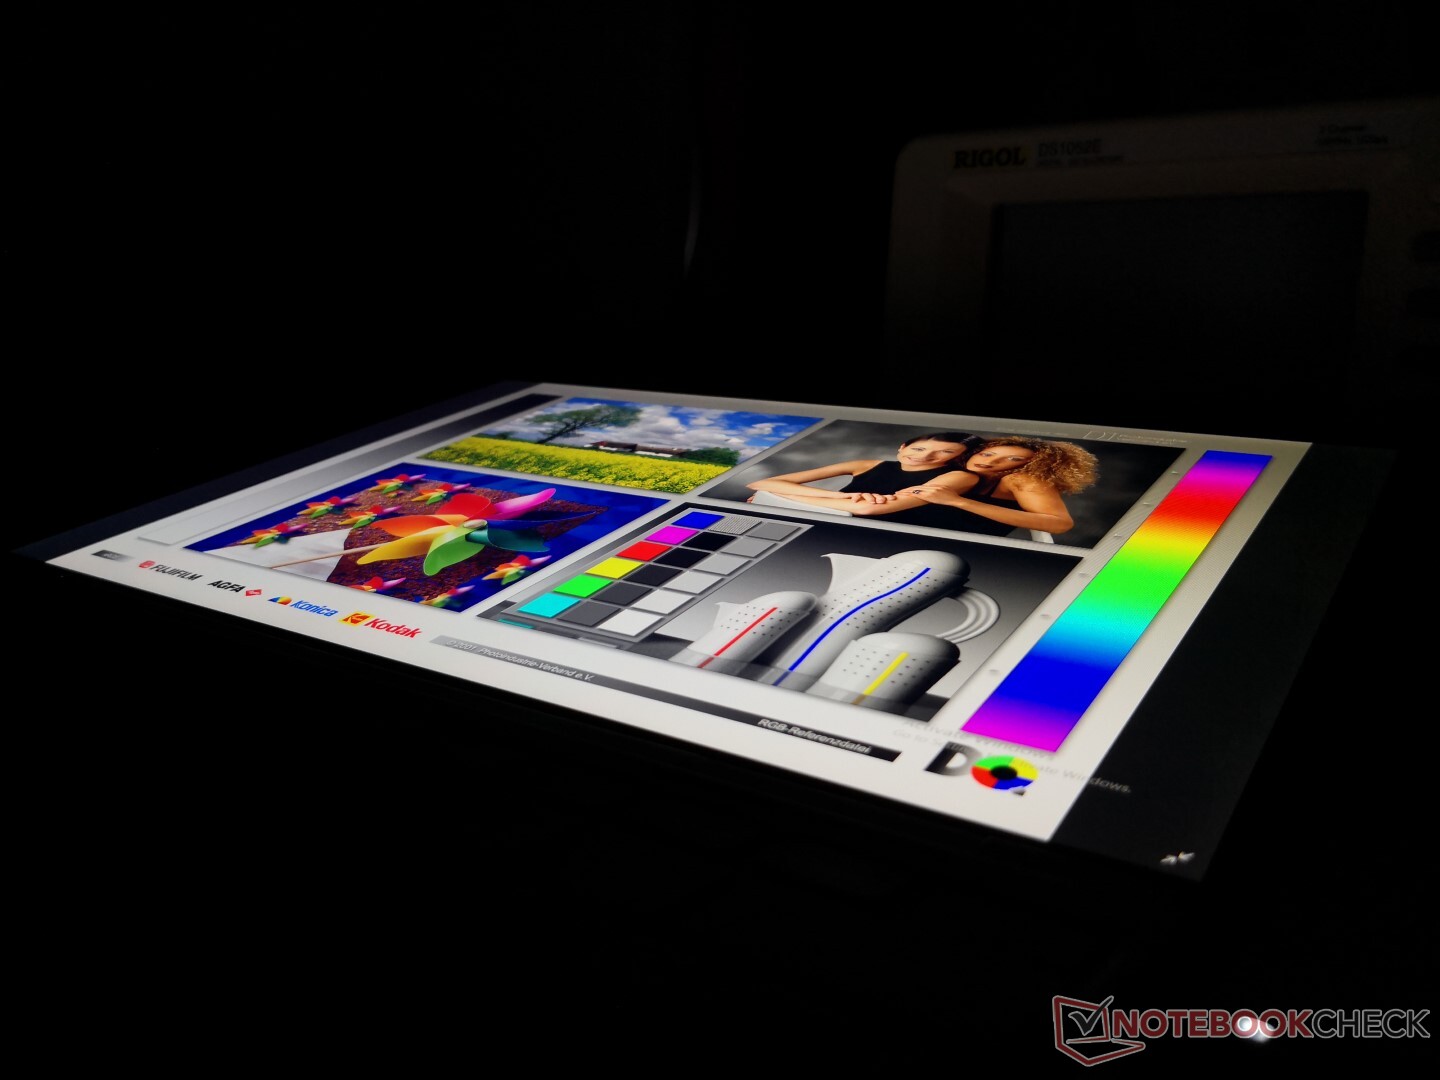
Outdoor visibility is above average because of the bright backlight. Maximum brightness will not drop if running on batteries and so you're able to utilize the 600-nit panel to its fullest when on the go. We recommend a higher text scaling because some glare will still be present on the glossy screen. Viewing angles are very wide with only minimal changes to colors or contrast when viewing from unrealistically extreme angles.

Performance
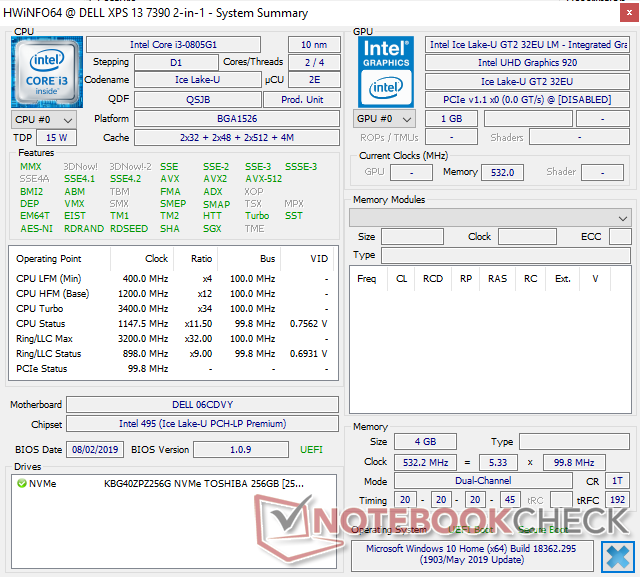
Much like how the XPS 15 9575 2-in-1 was designed specifically with Kaby Lake-G in mind, the XPS 13 7390 2-in-1 was designed specifically as an Intel Ice Lake-U product. You'd have to go for the traditional XPS 13 7390 clamshell instead if you want Comet Lake-U.
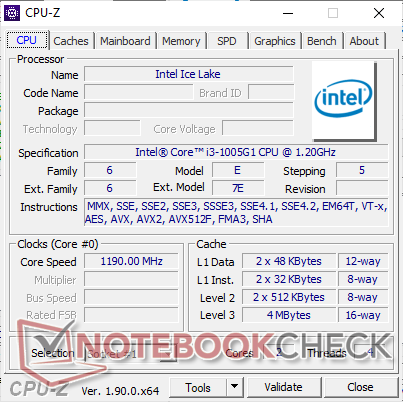
The 10 nm Core i3-1005G1 in our test unit is the lowest-end Ice Lake-U processor designed to replace the 14 nm Whiskey Lake-U Core i3-8145U. Similarly, its integrated UHD Graphics G1 should be direct step up from the last generation UHD Graphics 620. Moving up to the highest-end XPS 13 7390 2-in-1 SKU with the quad-core Core i7-1065G7 and Iris Pro Graphics should bring a large boost to CPU power and an even larger boost to GPU power.
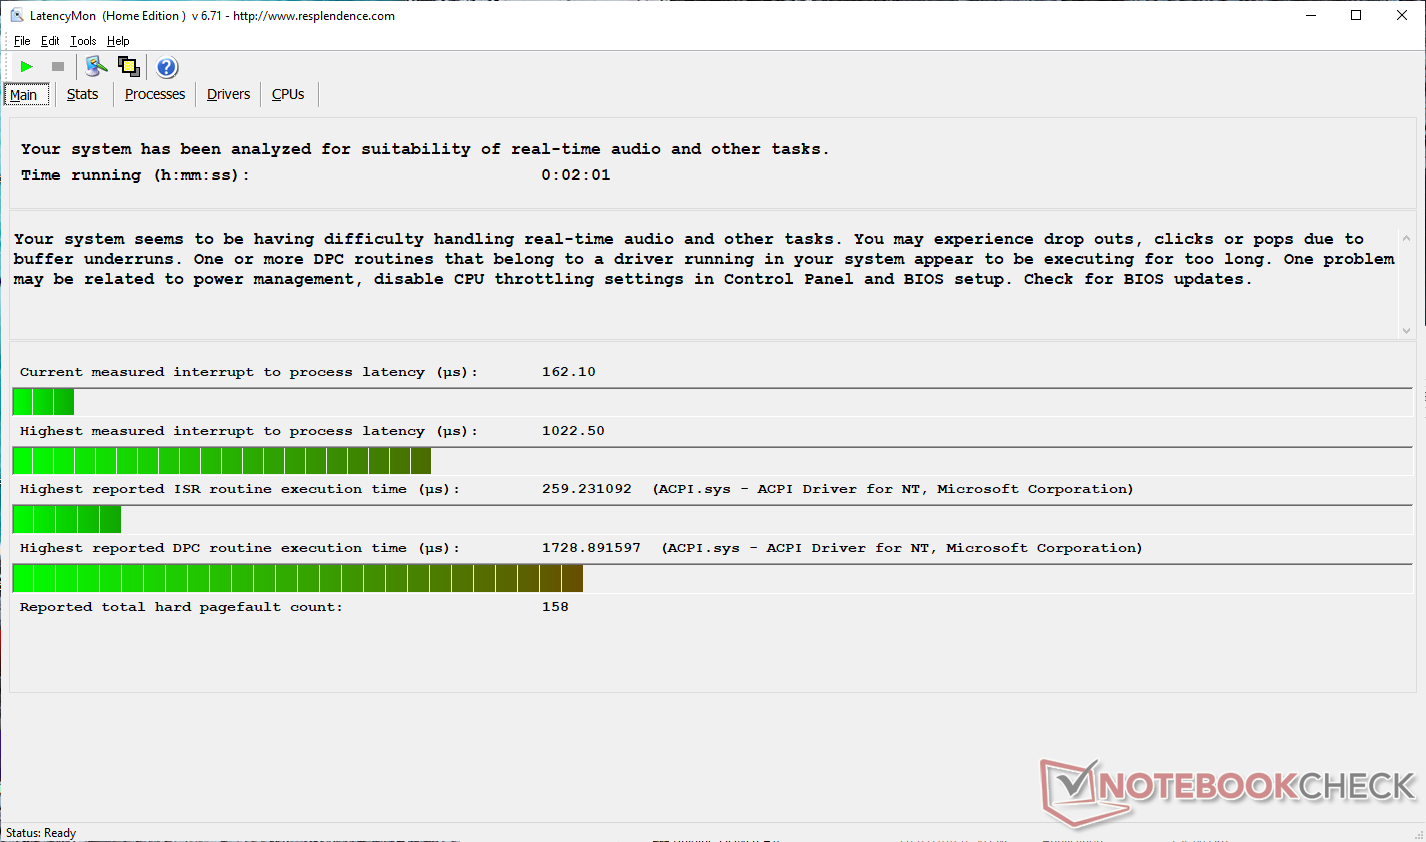
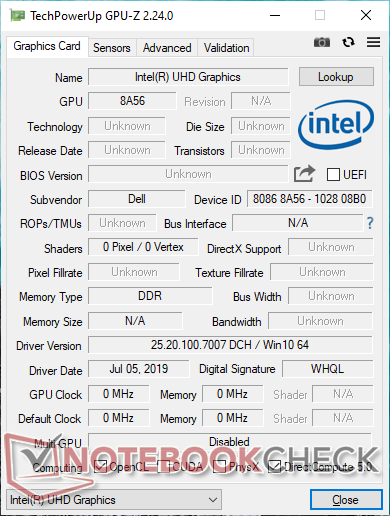
GPU-Z shows no details about the integrated GPU since it only recently launched. Meanwhile, LatencyMon shows DPC latency issues even when wireless is disabled. This has been a recurring issue on the XPS series and the new XPS 13 2-in-1 is unfortunately no different.
Processor
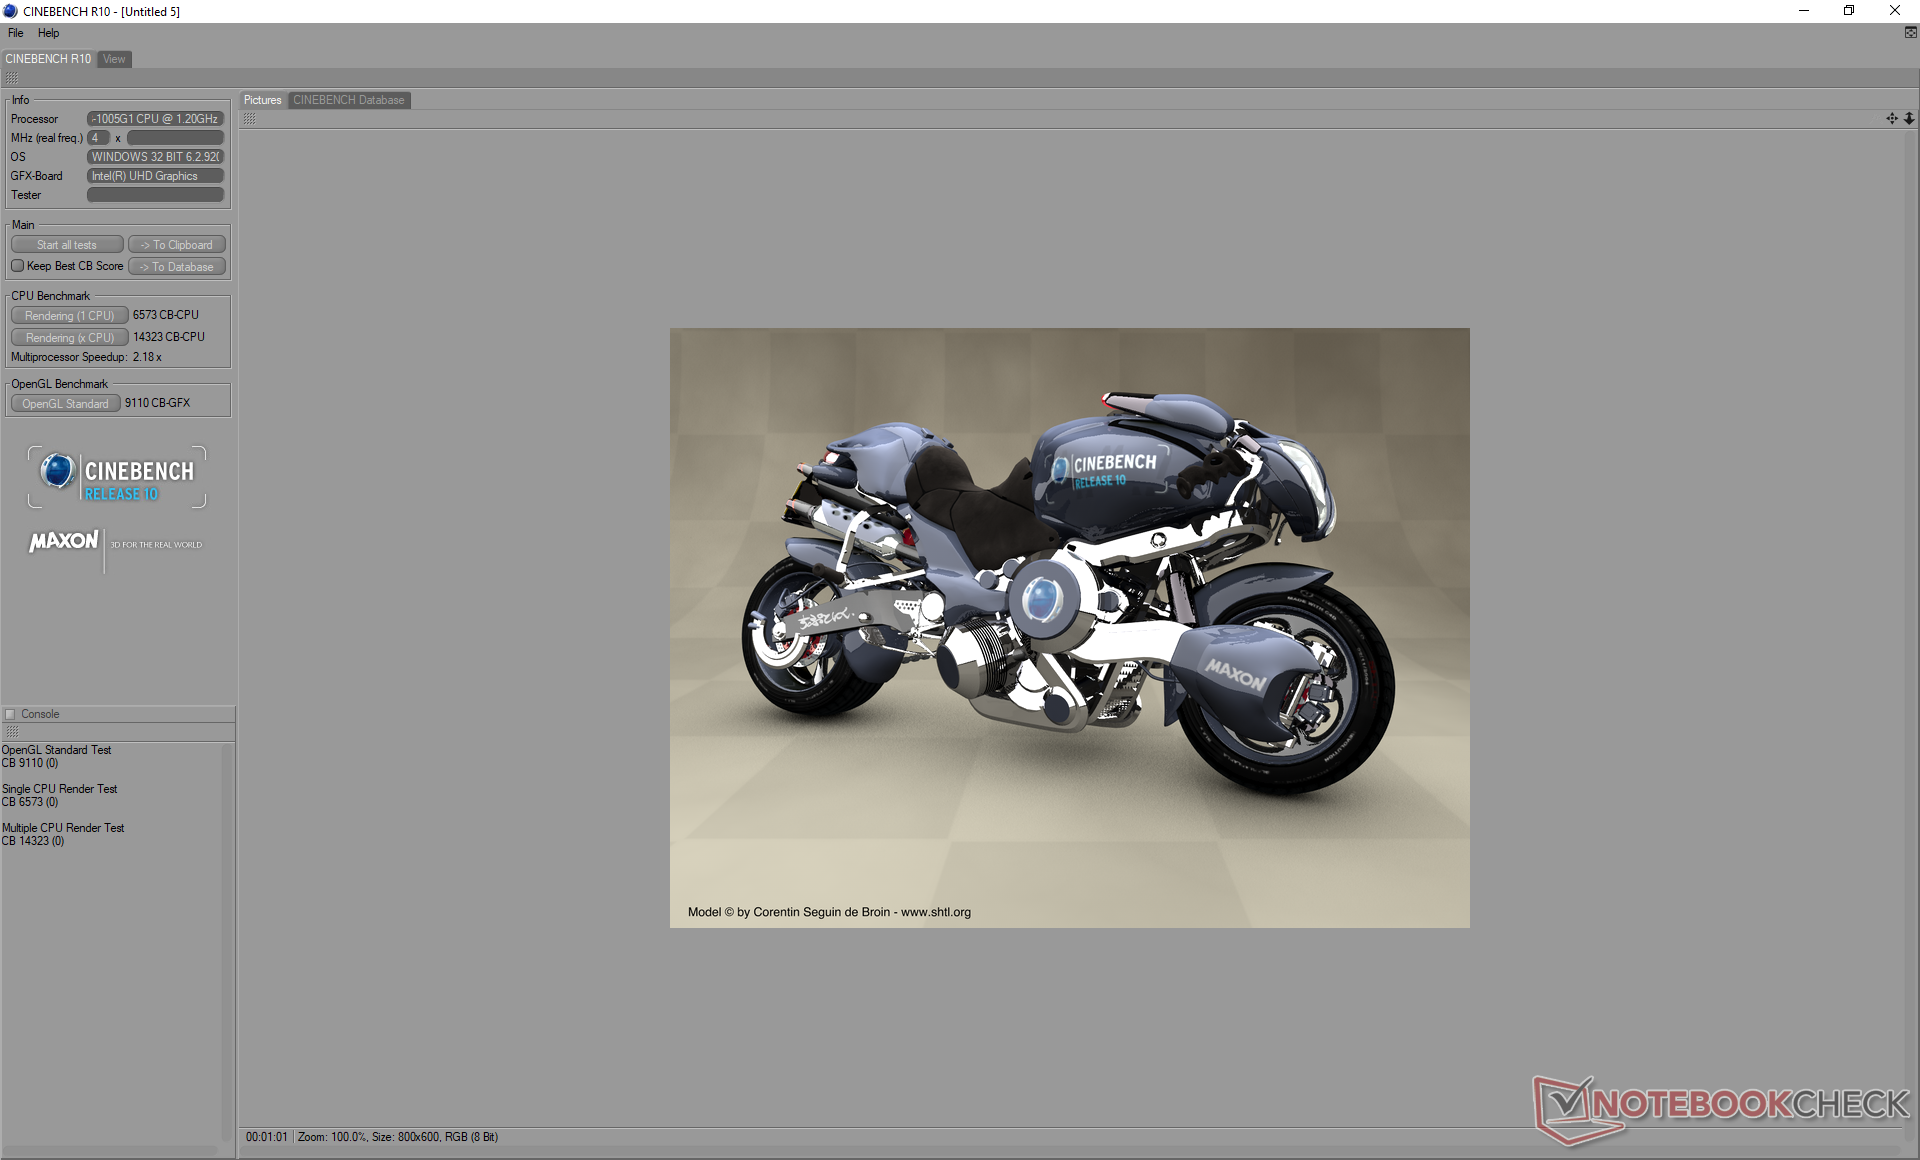
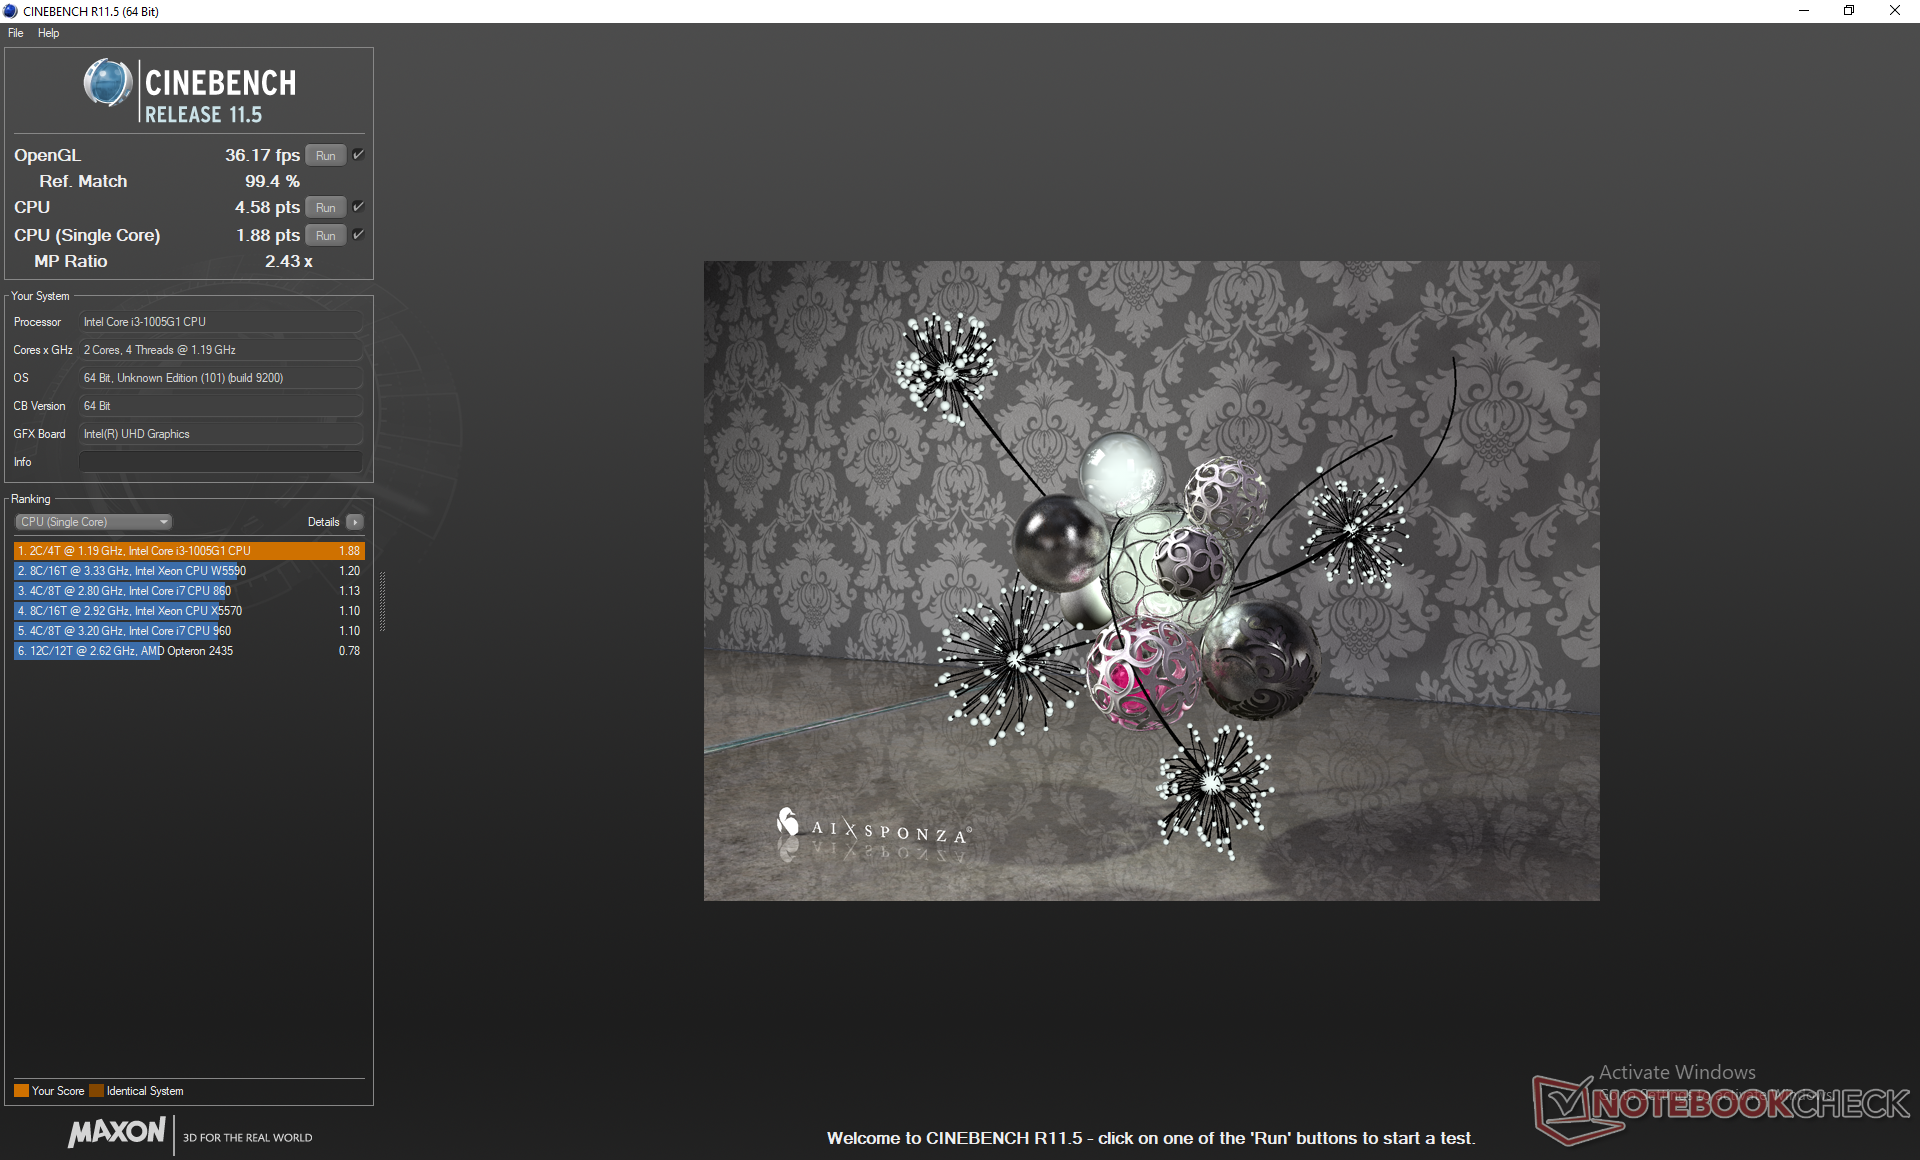
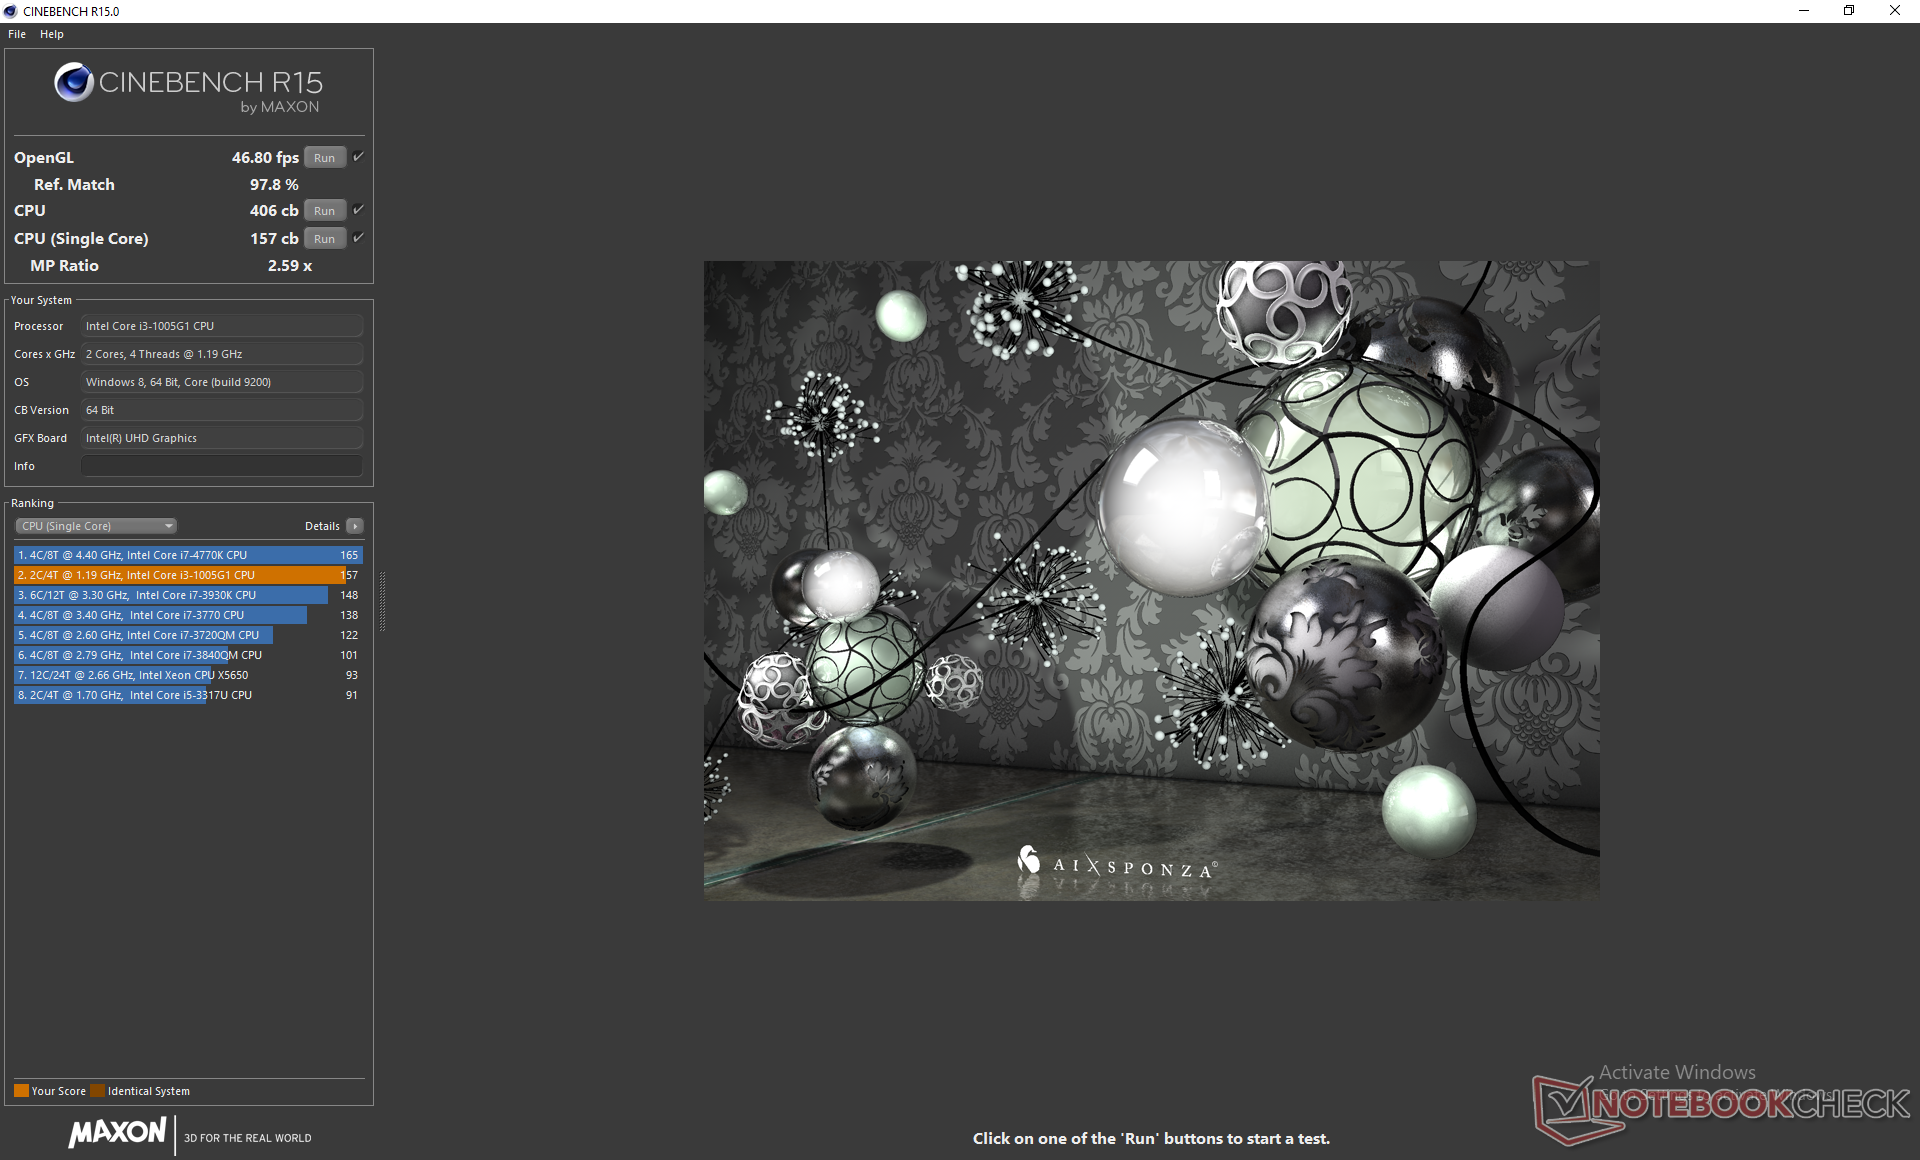
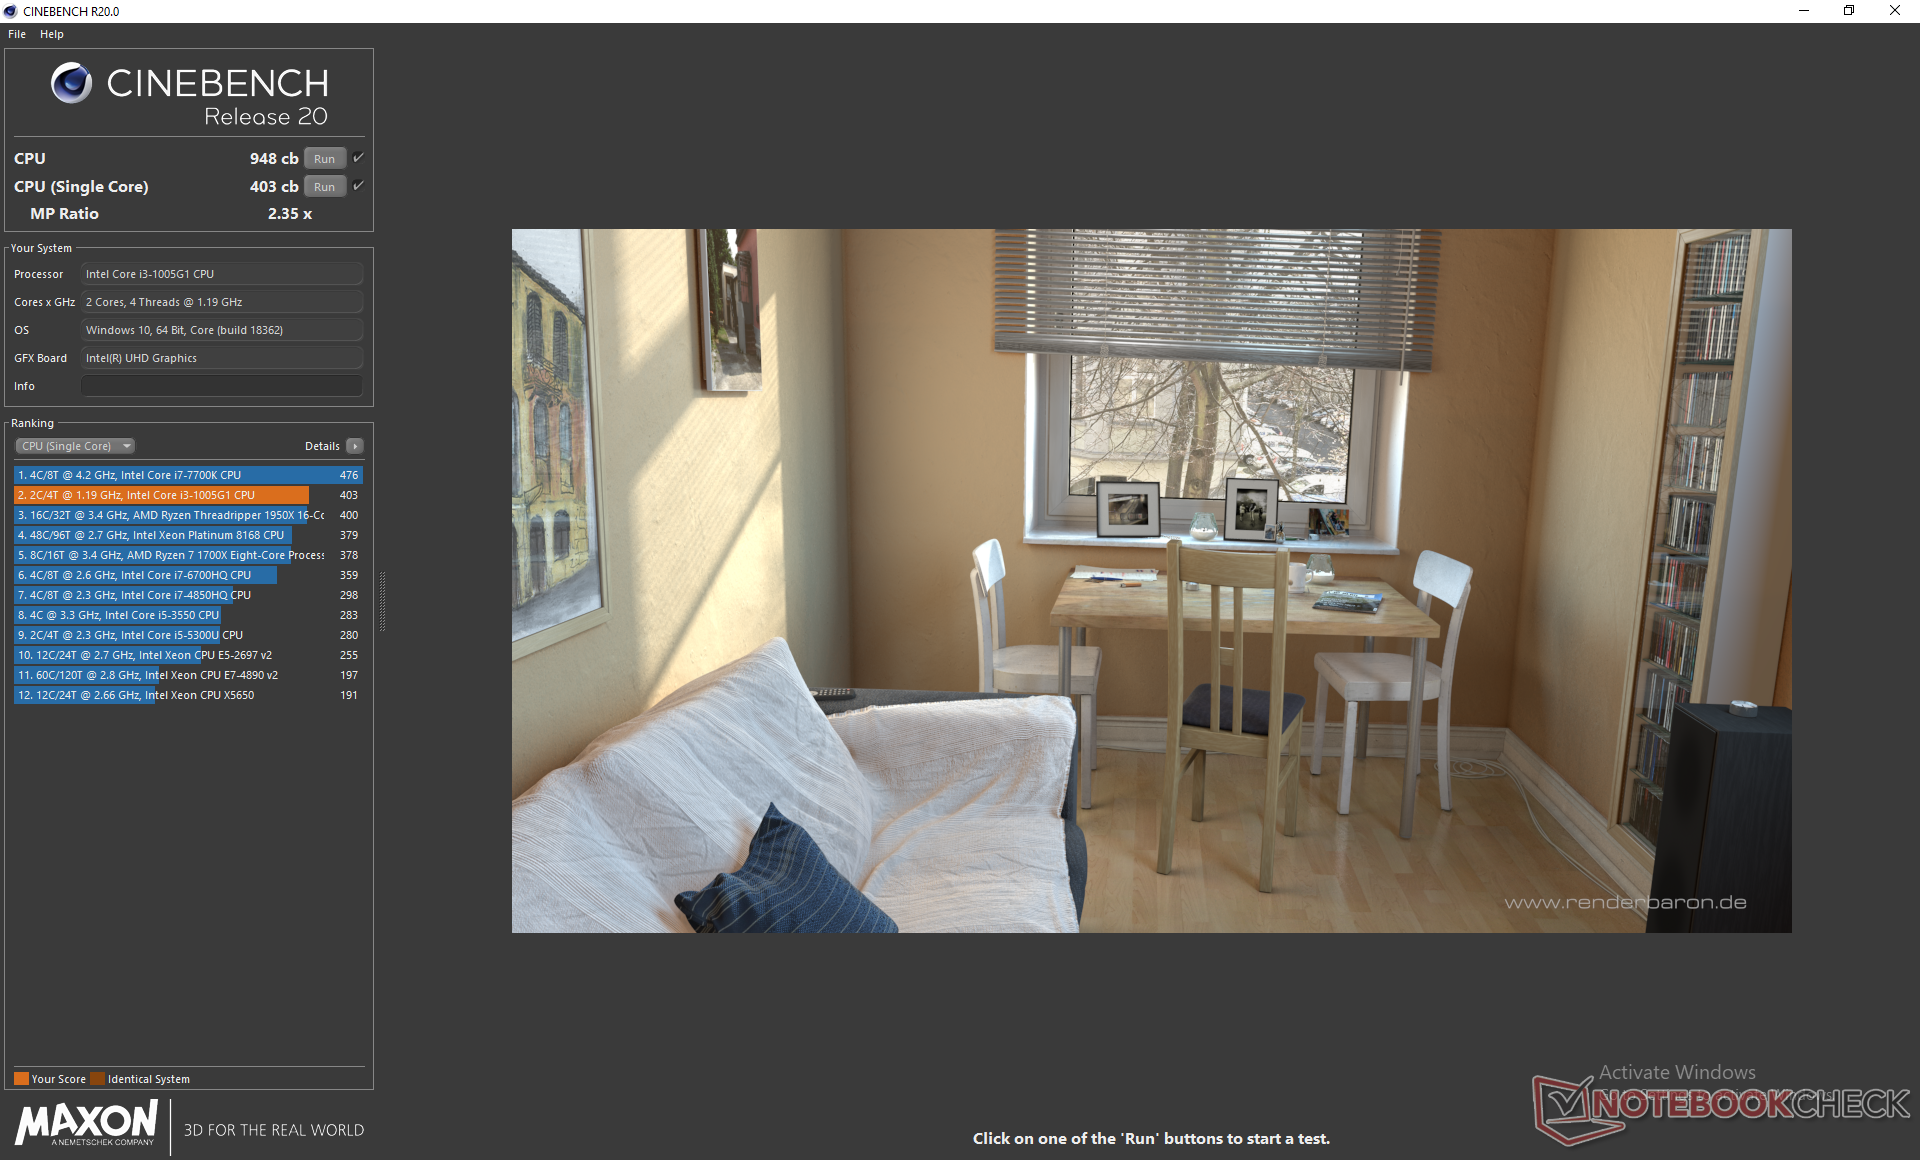
Raw multi-thread performance is about 10 to 15 percent faster than the Core i3-8145U it replaces and roughly on par with the entry-level Ryzen 3 2300U in the Dell Inspiron 15 3585. Core i3 laptops tend to throttle less than pricier Core i7 alternatives over long periods of stress since the Core i3 processor has lower maximum Turbo Boost clock rates. Since the CPU performance delta between it and a Whiskey Lake-U Core i3 is so narrow, however, it's the larger power savings and higher performance-per-Watt that are more desirable.
See our dedicated page on the Core i3-1005G1 for more technical information and benchmarks. We'll be comparing it to the higher-end Core i7-1065G7 XPS SKU at a later date.
| wPrime 2.10 - 1024m | |
| Lenovo Thinkpad 13-20J1001BUS | |
| Dell XPS 13-9365 2-in-1 | |
| Lenovo V330-15IKB | |
| Acer Swift 3 SF314-55-31N8 | |
| Dell XPS 13 7390 2-in-1 Core i3 | |
* ... smaller is better
System Performance
PCMark benchmarks lie right in between the budget Acer Swift 3 with Core i3-8145U and higher-end Ultrabooks like the HP Spectre x360 13 and Dell's own XPS 13 9380 powered by Core i7 CPUs. Performance is closer to what a last generation flagship Core i7 was able to offer but in a Core i3 package instead.
We experienced no noticeable software issues during our time with the test unit. Nonetheless, we observed some major hardware issues that we will note in our Verdict.

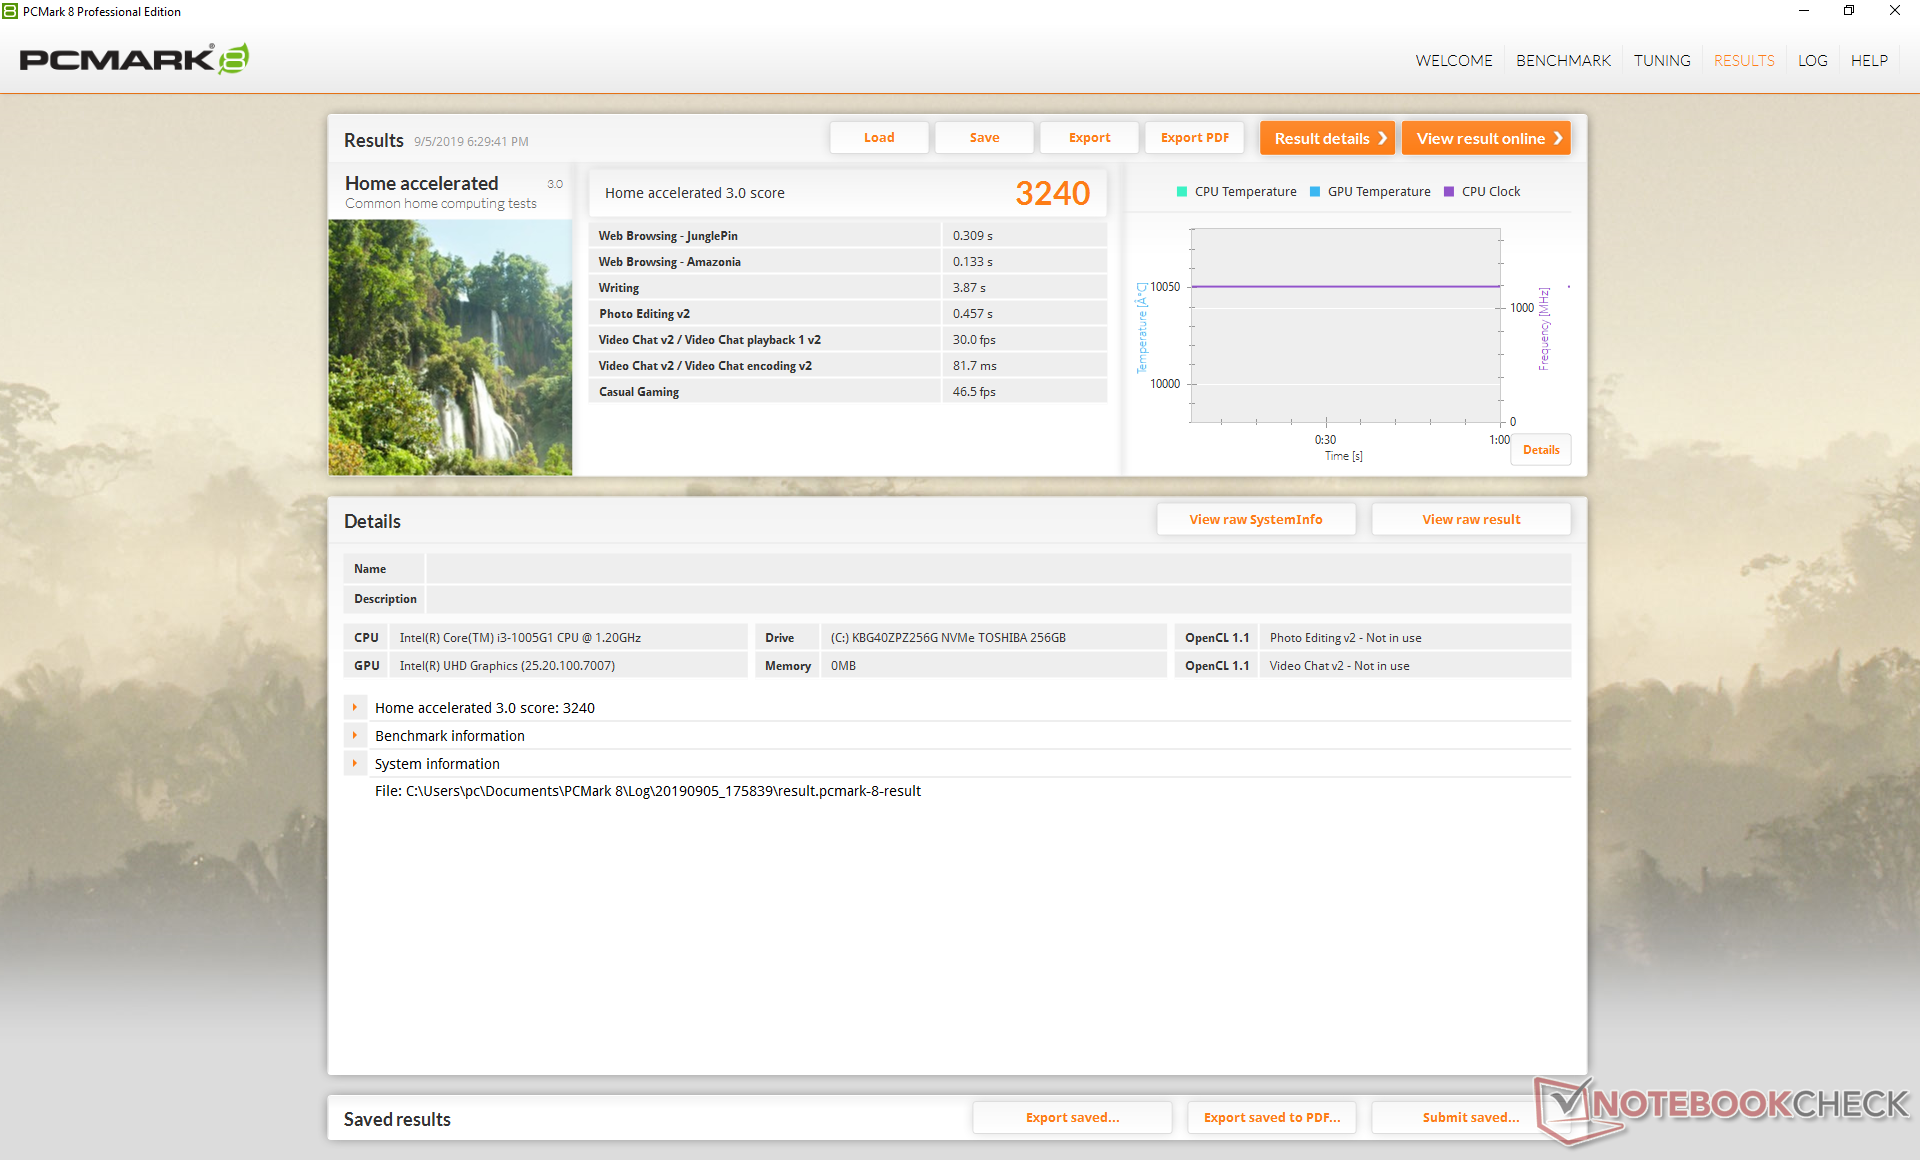
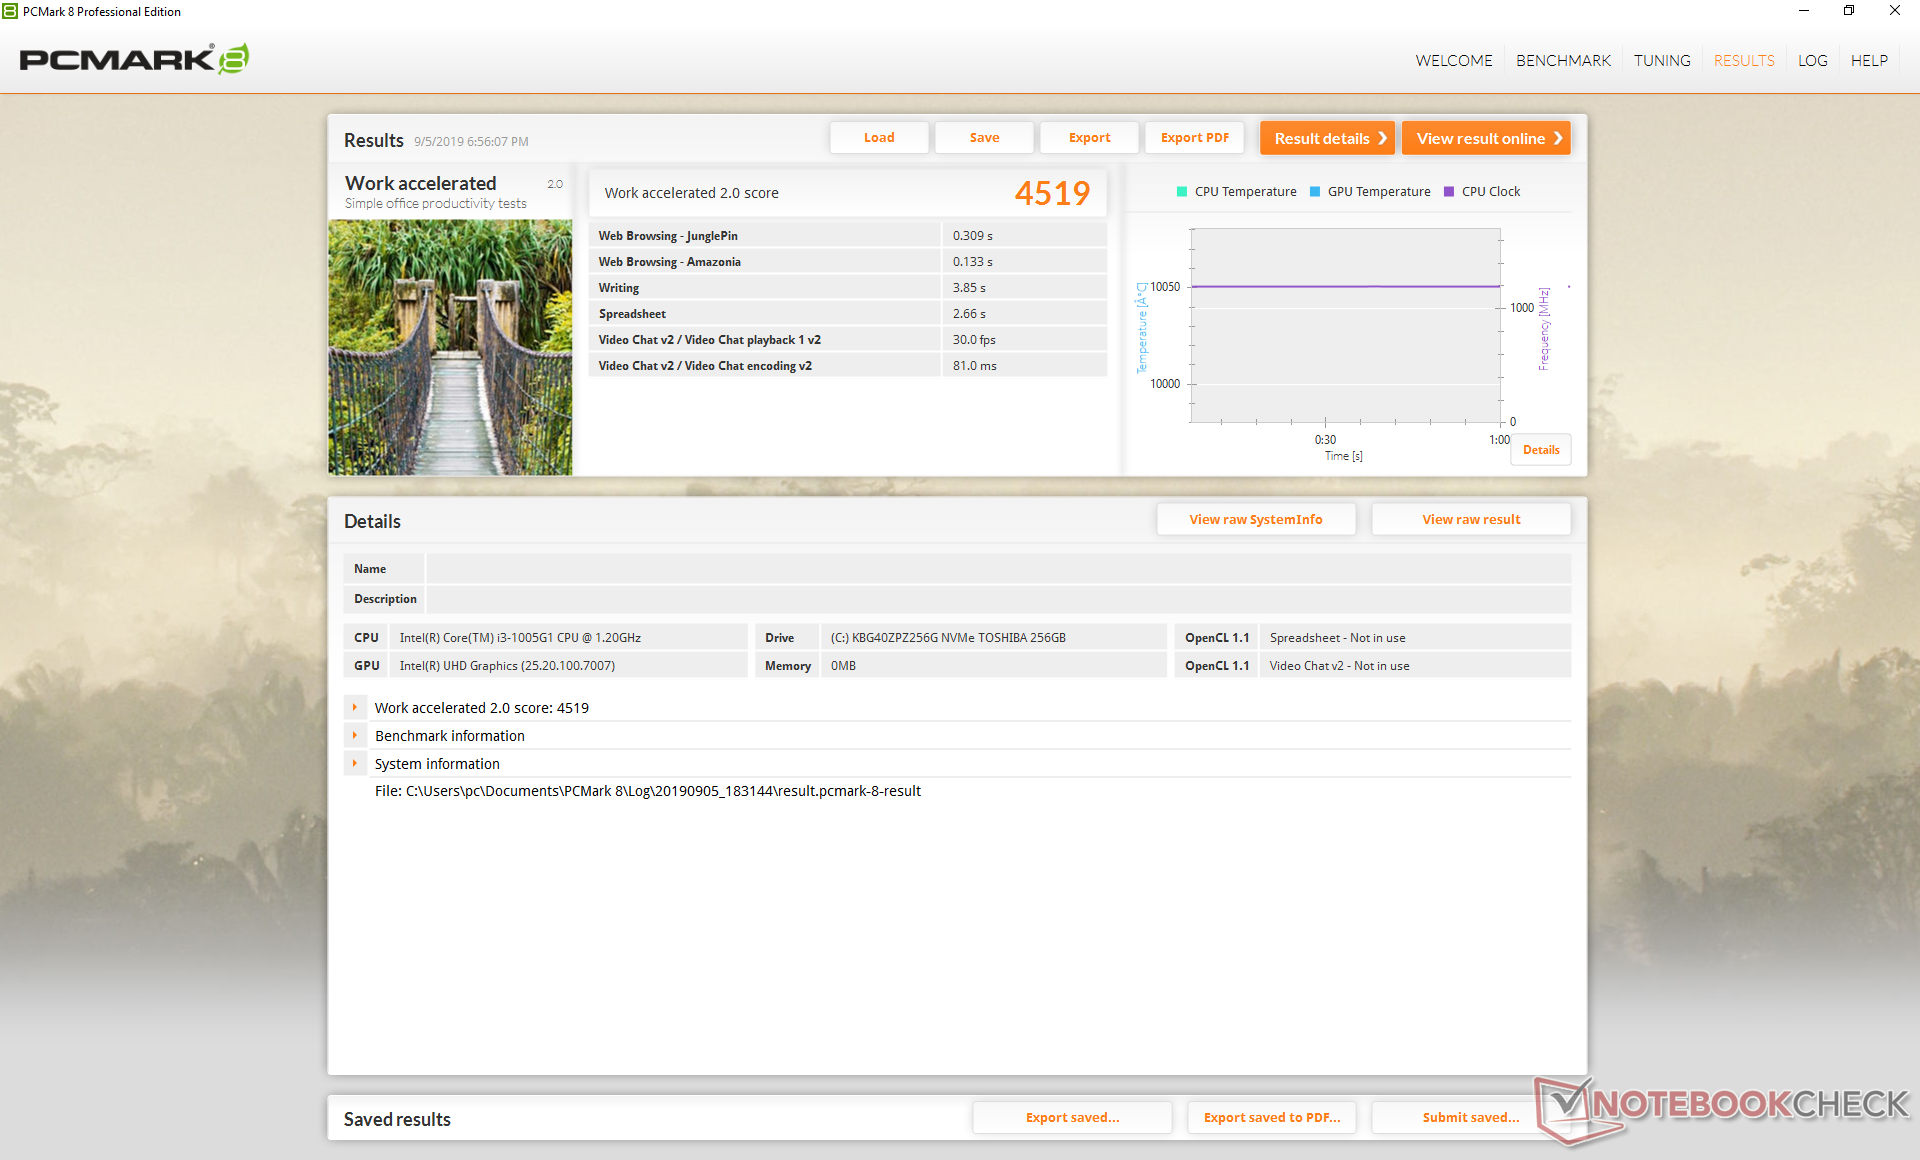
| PCMark 8 Home Score Accelerated v2 | 3240 points | |
| PCMark 8 Work Score Accelerated v2 | 4519 points | |
| PCMark 10 Score | 3562 points | |
Help | ||
Storage Devices
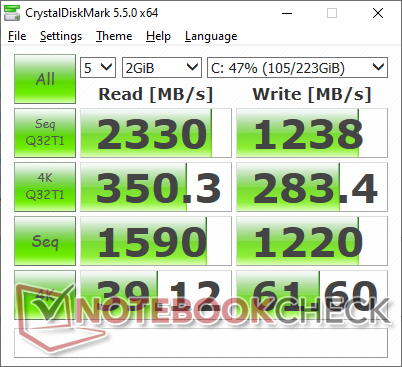
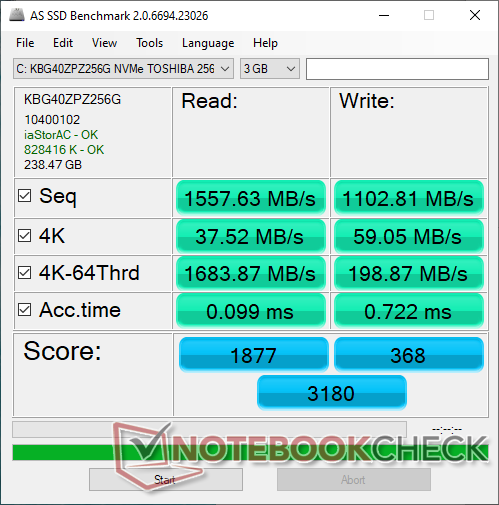
Dell has upgraded from the Toshiba THNSN5256GPUK on the 2017 XPS 13 9365 2-in-1 to the Toshiba KBG40ZPZ256G for this 2019 iteration. Keep in mind that XPS laptops tend to carry SSDs from SK Hynix and Samsung as well depending on region and storage capacity. All SKUs promise soldered PCIe x4 SSDs meaning you'll have to choose carefully or risk being stuck with an undersized primary drive.
Sequential read and write rates are average as far as NVMe SSDs go at about 1500 MB/s and 1100 MB/s, respectively, according to AS SSD. For what it's worth, Toshiba advertises a theoretical sequential read and write of up to 2200 MB/s and 1400 MB/s, respectively, for its BG4 model. Access write time is strangely slower than expected at 0.722 ms compared to 0.05 seconds or lower on most other NVMe SSDs even after several retests.
See our table of HDDs and SSDs for more comparisons.
| Dell XPS 13 7390 2-in-1 Core i3 Toshiba BG4 KBG40ZPZ256G | Dell XPS 13 9380 2019 SK hynix PC401 HFS256GD9TNG | Asus ZenBook S13 UX392FN WDC PC SN520 SDAPNUW-512G | Microsoft Surface Pro 6, Core i7, 512 GB Toshiba KBG30ZPZ512G | Dell XPS 13-9365 2-in-1 Toshiba NVMe THNSN5256GPUK | Dell Latitude 7300-P99G Samsung SSD PM981 MZVLB512HAJQ | |
|---|---|---|---|---|---|---|
| AS SSD | 11% | 86% | -25% | 5% | 144% | |
| Seq Read (MB/s) | 1558 | 2035 31% | 1224 -21% | 1154 -26% | 1283 -18% | 2749 76% |
| Seq Write (MB/s) | 1103 | 658 -40% | 907 -18% | 393.6 -64% | 735 -33% | 1367 24% |
| 4K Read (MB/s) | 37.52 | 39.74 6% | 41.46 11% | 34.42 -8% | 37.69 0% | 49.94 33% |
| 4K Write (MB/s) | 59 | 105.7 79% | 126.2 114% | 68.9 17% | 96.9 64% | 137.6 133% |
| 4K-64 Read (MB/s) | 1684 | 461 -73% | 1021 -39% | 494.1 -71% | 586 -65% | 987 -41% |
| 4K-64 Write (MB/s) | 198.9 | 300.1 51% | 1251 529% | 171.3 -14% | 204.7 3% | 1465 637% |
| Access Time Read * (ms) | 0.099 | 0.061 38% | 0.053 46% | 0.213 -115% | 0.045 55% | 0.042 58% |
| Access Time Write * (ms) | 0.722 | 0.051 93% | 0.027 96% | 0.3 58% | 0.037 95% | 0.029 96% |
| Score Read (Points) | 1877 | 704 -62% | 1185 -37% | 644 -66% | 752 -60% | 1312 -30% |
| Score Write (Points) | 368 | 471 28% | 1468 299% | 280 -24% | 375 2% | 1739 373% |
| Score Total (Points) | 3180 | 1479 -53% | 3250 2% | 1225 -61% | 1495 -53% | 3662 15% |
| Copy ISO MB/s (MB/s) | 677 | 893 32% | 1404 107% | 985 45% | 950 40% | 2761 308% |
| Copy Program MB/s (MB/s) | 298.4 | 287.9 -4% | 402.4 35% | 143.1 -52% | 263.8 -12% | 622 108% |
| Copy Game MB/s (MB/s) | 496.1 | 618 25% | 902 82% | 676 36% | 726 46% | 1584 219% |
* ... smaller is better

GPU Performance
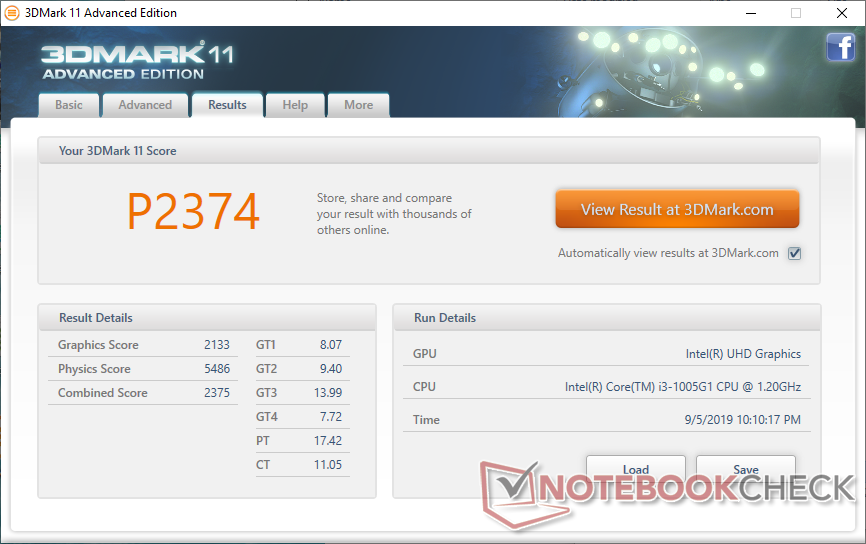
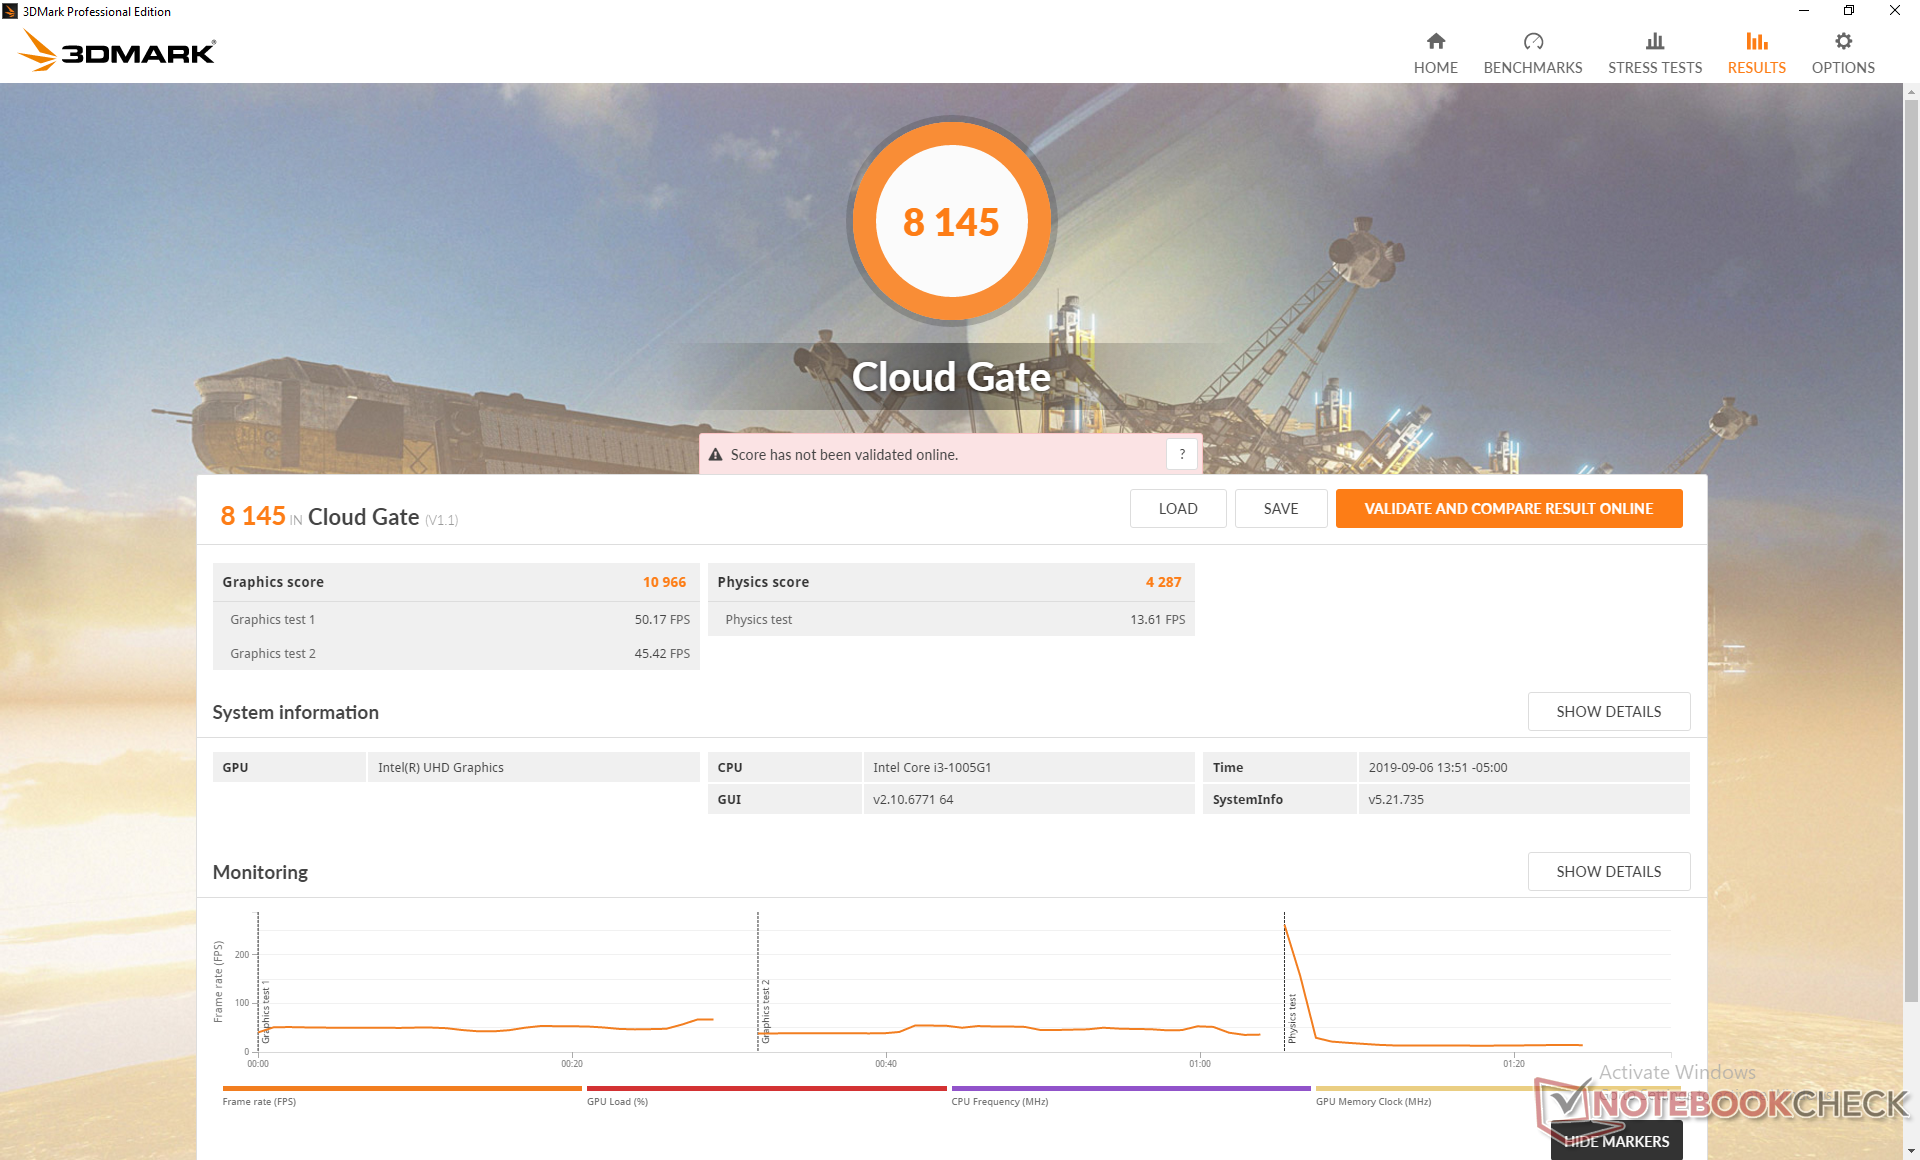
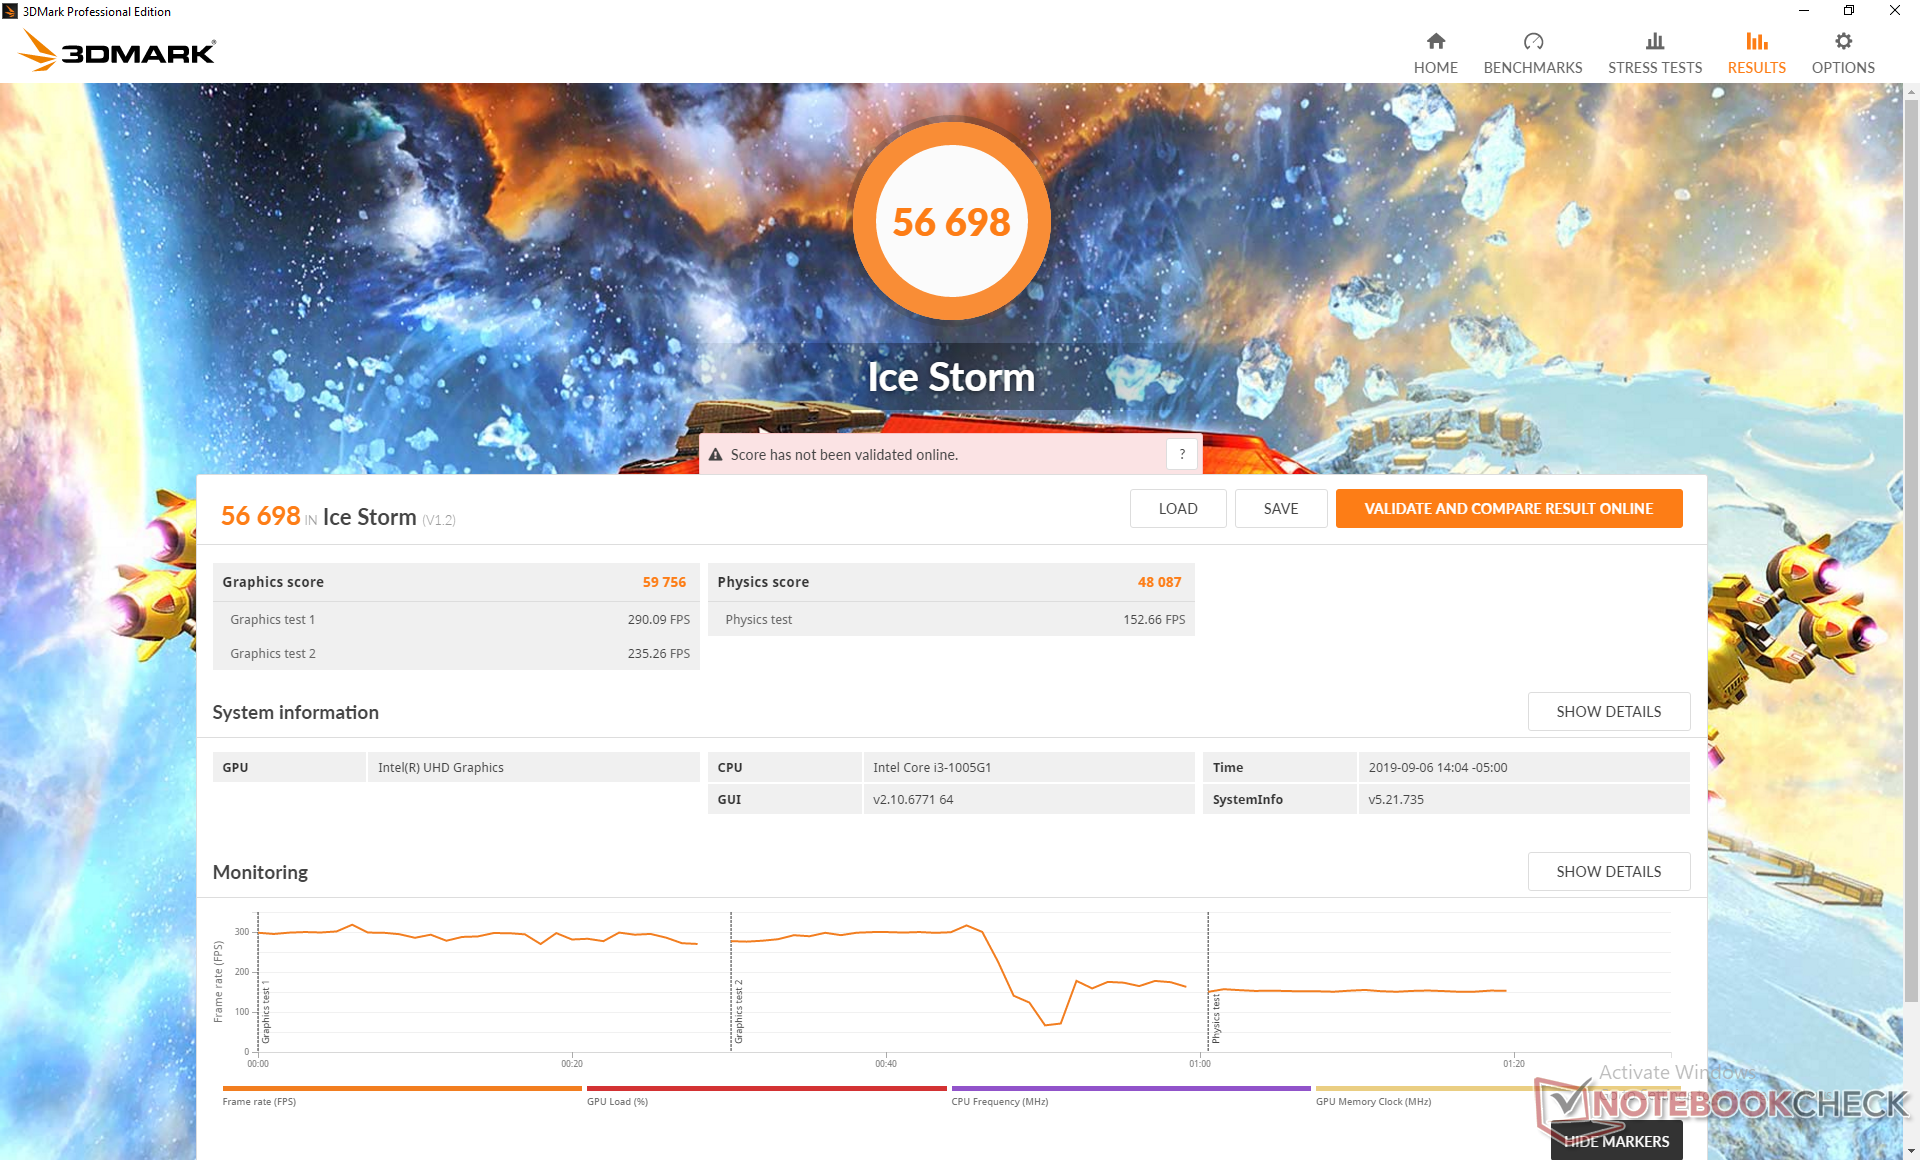
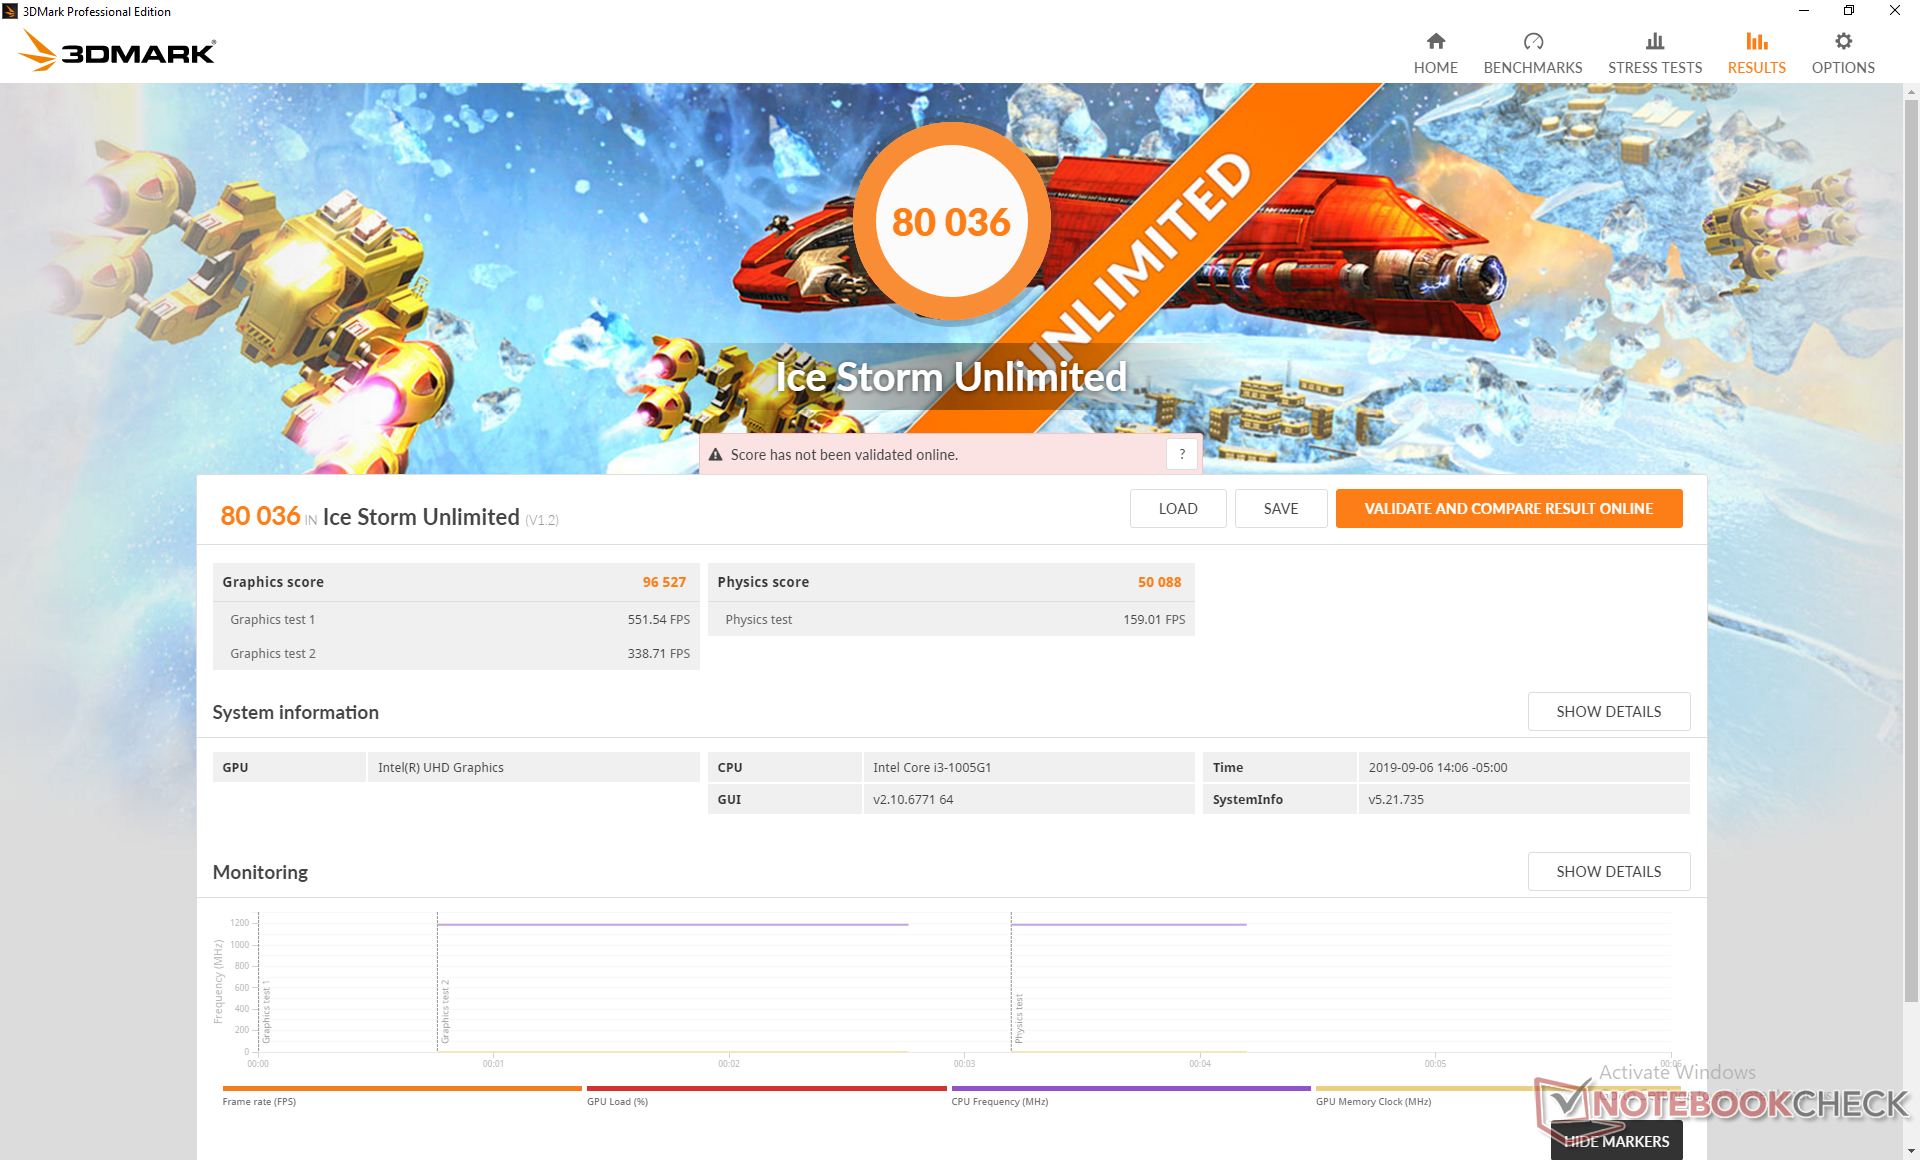
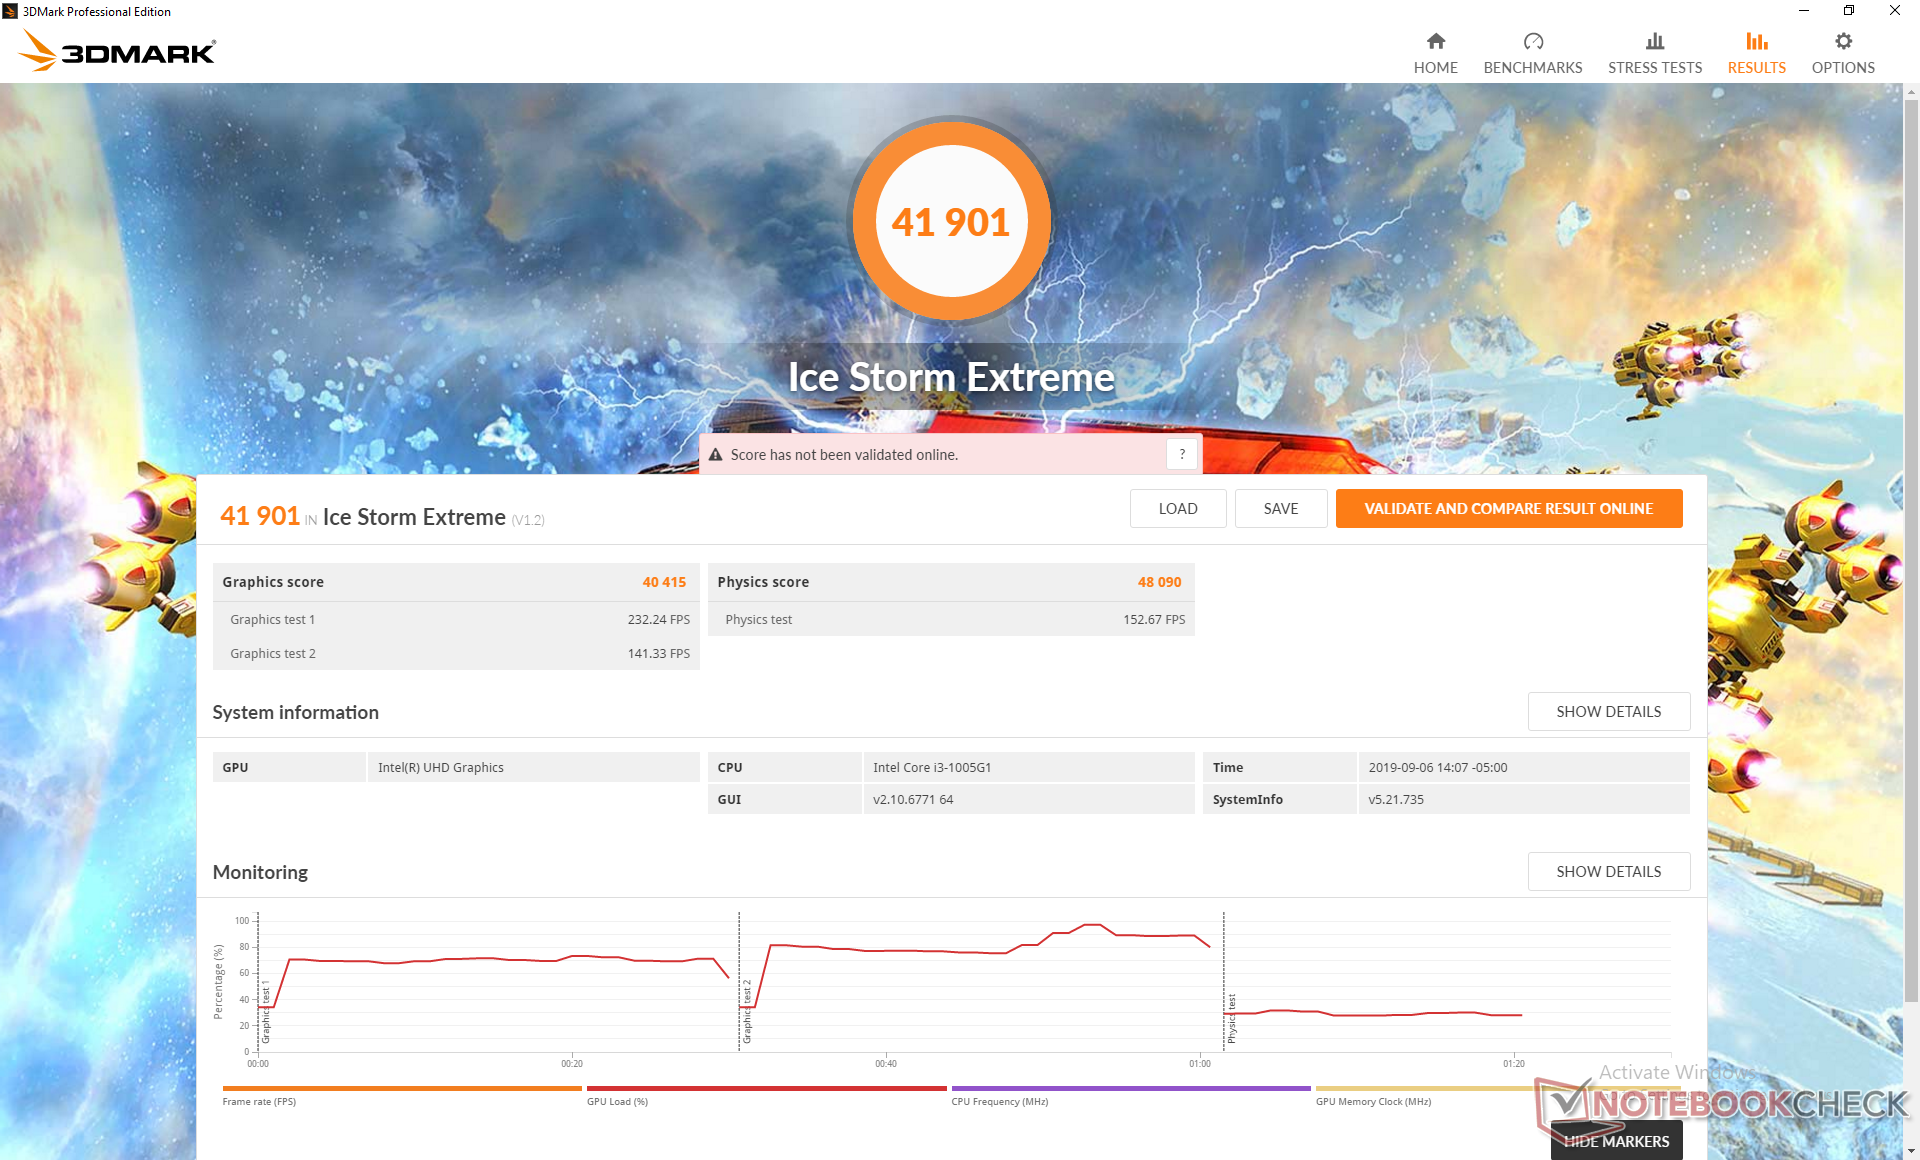
3DMark benchmarks reveal the integrated UHD Graphics G1 of our Core i3 Ice Lake-U to be about 14 percent faster than the UHD Graphics 620 of the last generation Core i7-8565U as found on the XPS 13 9380. Though this may seem disappointing, the performance advantage is greater when compared to the UHD Graphics 620 of the last generation Core i3-8145U where we're able to measure a graphics boost of about 50 to 80 percent. In other words, user can expect the same GPU potential as a Kaby Lake-R or Whiskey Lake-U Core i7 CPU from an Ice Lake-U Core i3 CPU. Moving up to the Core i7-1065G7 configuration with its integrated Iris Pro Graphics will offer even more graphics power that we expect to be roughly comparable to the competing AMD Radeon RX Vega 10.
See our dedicated page on the UHD Graphics G1 for more technical information and benchmark comparisons.

| 3DMark 06 Standard Score | 11753 points | |
| 3DMark 11 Performance | 2374 points | |
| 3DMark Ice Storm Standard Score | 56698 points | |
| 3DMark Cloud Gate Standard Score | 8145 points | |
| 3DMark Fire Strike Score | 1443 points | |
Help | ||
| low | med. | high | ultra | |
|---|---|---|---|---|
| StarCraft II: Heart of the Swarm (2013) | 60.5 | 40.5 | 18.9 | |
| BioShock Infinite (2013) | 82.6 | 40 | 34.8 | 11.7 |
| The Witcher 3 (2015) | 29.7 | 19.1 | 10.4 | 5.4 |
| Overwatch (2016) | 71.4 | 52.3 | 23.5 | |
| Rocket League (2017) | 69.5 | 42.2 | 22.8 |
Emissions
System Noise
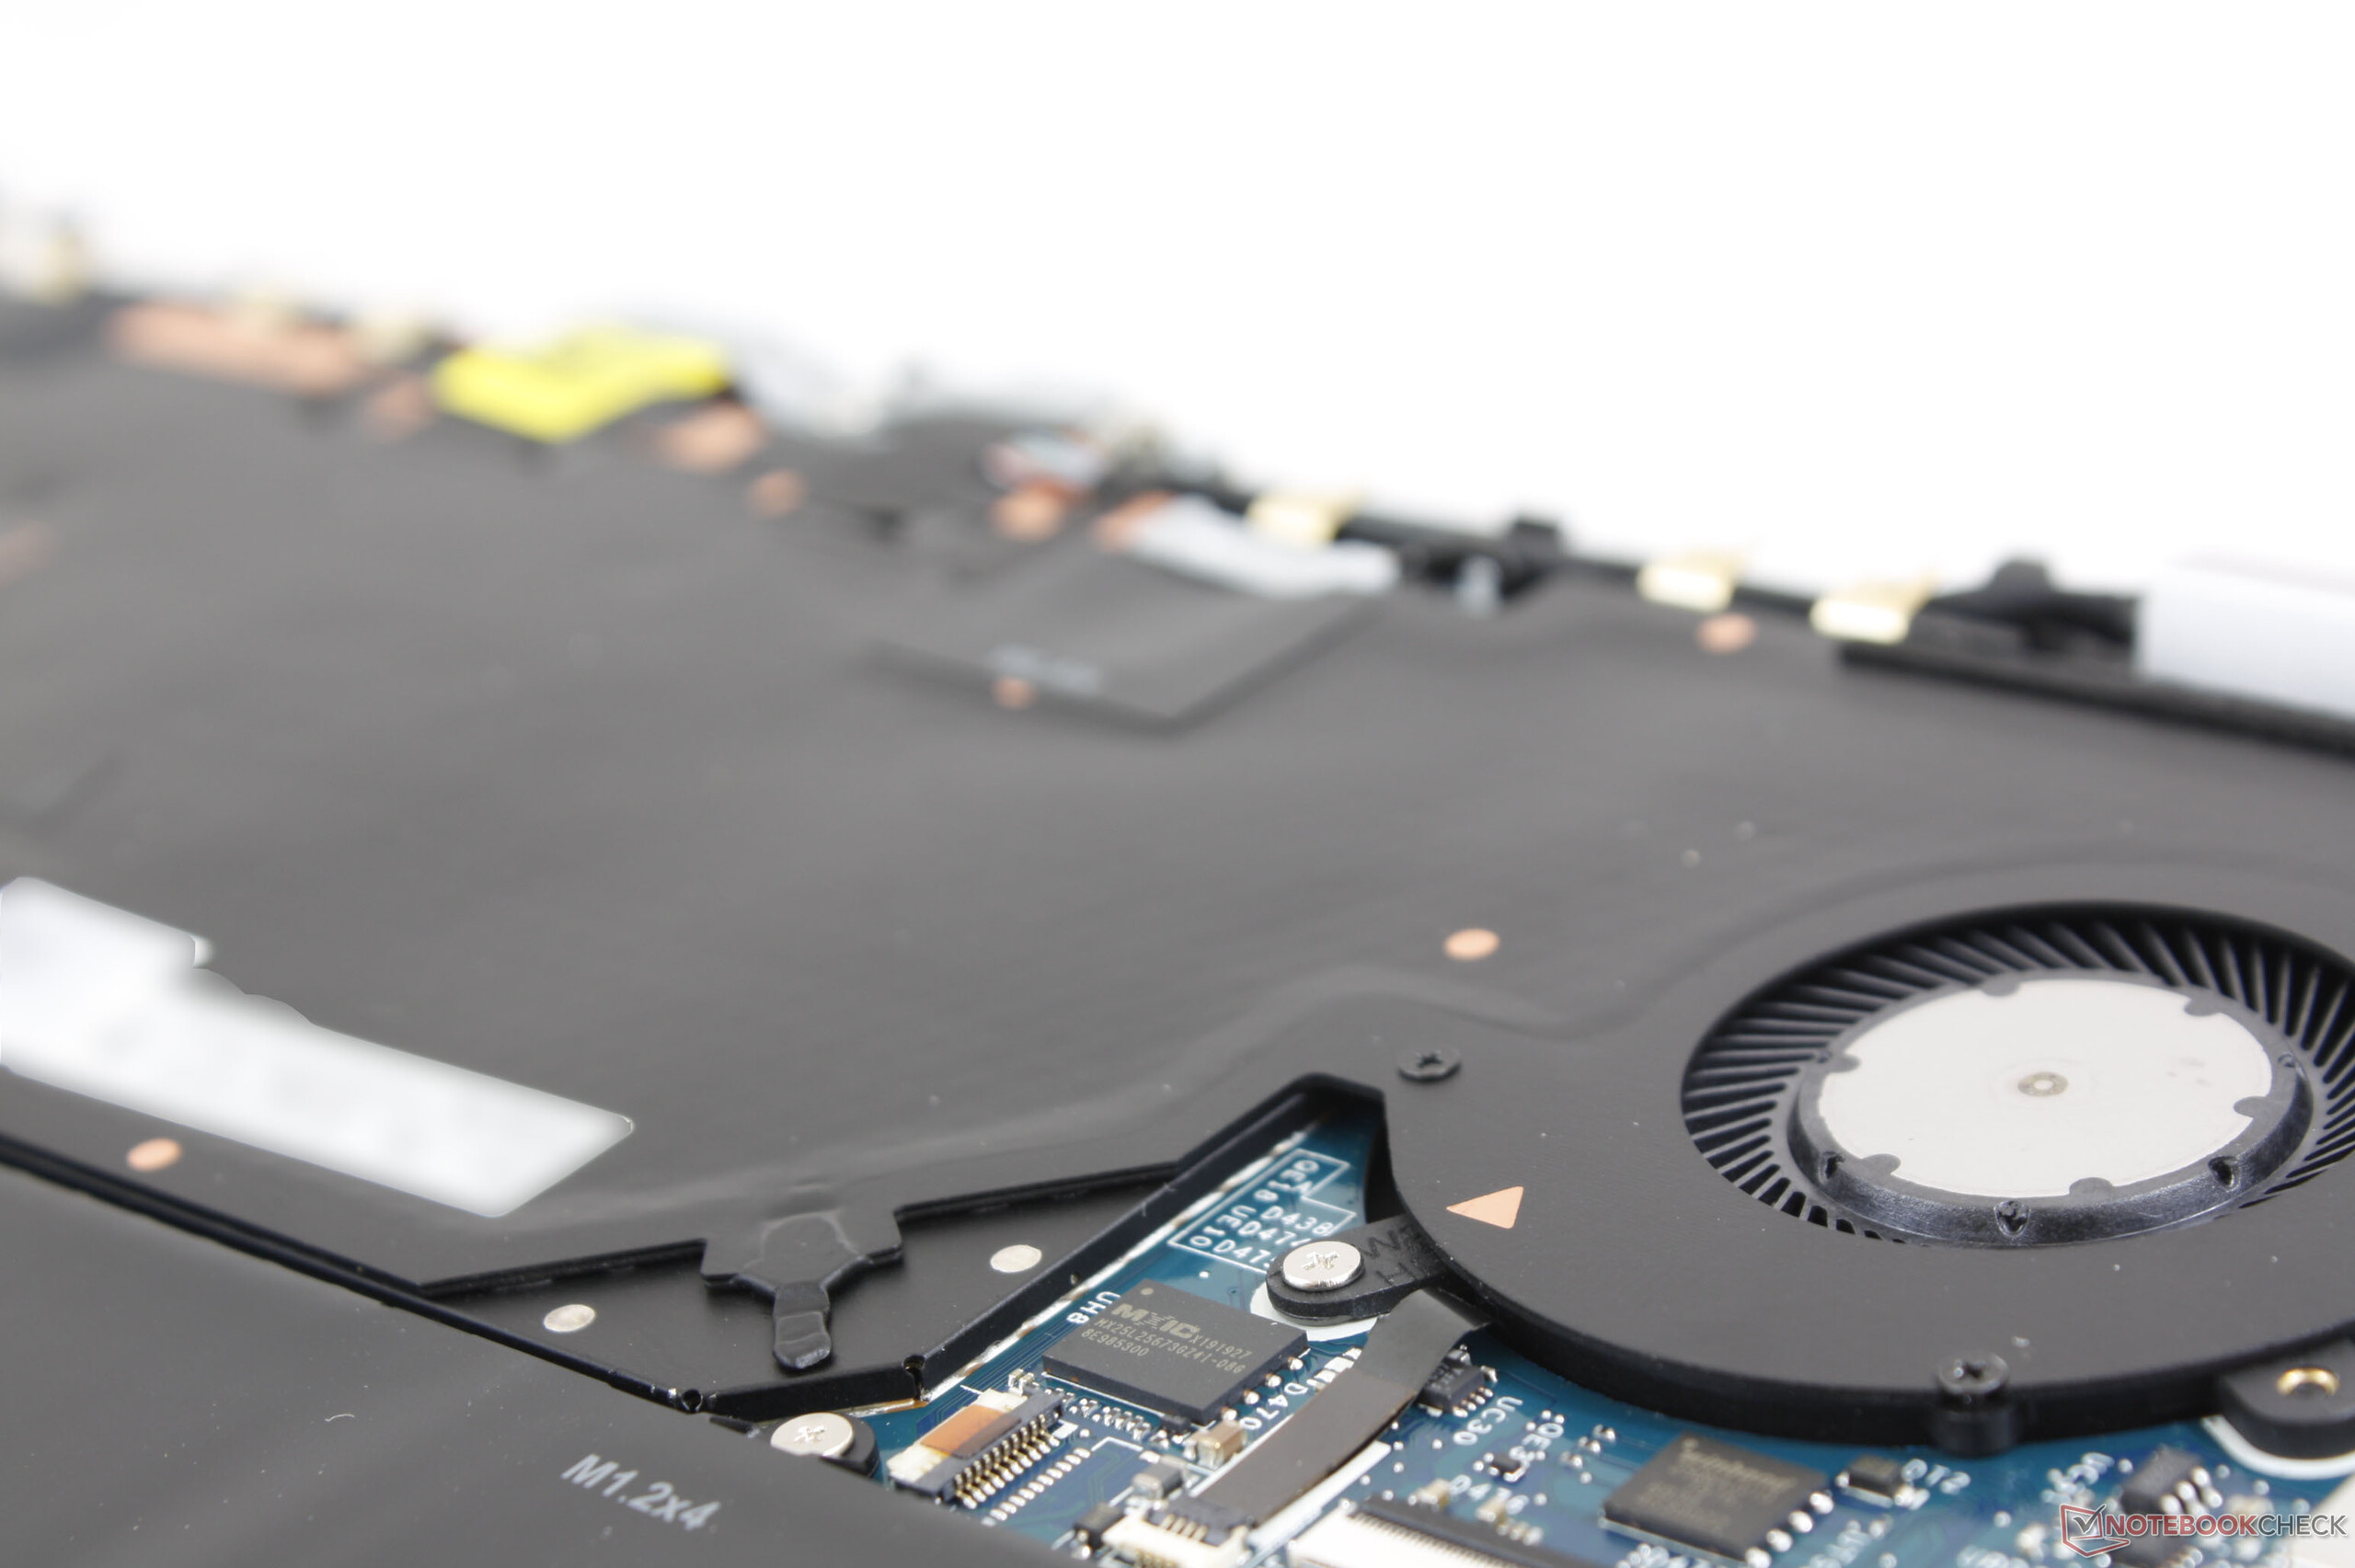
Whereas the first generation XPS 13 9365 2-in-1 was passively cooled, the second generation XPS 13 7390 2-in-1 houses dual fans and a vapor chamber cooler between them. Vapor chamber cooling can be found on some gaming laptops like the Razer Blade 15 or Asus ROG G752VY because it allows for better cooling per unit volume than copper heat pipes alone. The new XPS convertible is the first for its subnotebook category to use this approach.
Fan noise when idling, browsing, or video streaming remains silent despite having an active cooling solution. At worst, fan noise may jump to 32 dB(A) during these low to low-medium loads which is still only barely audible and never distracting. This low 30 dB(A) range is not uncommon on most other Ultrabooks with integrated graphics.
When gaming or running other very demanding loads, fan noise will slowly but steadily climb in a step-wise manner to 33.5 dB(A), 34.9 dB(A), 39.2 dB(A), and then finally 43.5 dB(A). The low 40 dB(A) range is loud enough to be distracting in quieter classrooms meaning you probably shouldn't be running heavy loads for long periods in noise-sensitive areas.
We're able to notice slight electronic noise or coil whine when placing an ear near the keyboard keys. It's fortunately minor enough to be easily ignored and not be worrisome.
| Dell XPS 13 7390 2-in-1 Core i3 UHD Graphics G1 (Ice Lake 32 EU), i3-1005G1, Toshiba BG4 KBG40ZPZ256G | Dell XPS 13 9380 2019 UHD Graphics 620, i5-8265U, SK hynix PC401 HFS256GD9TNG | Dell XPS 13-9365 2-in-1 HD Graphics 615, i7-7Y75, Toshiba NVMe THNSN5256GPUK | HP Spectre x360 13-ap0312ng UHD Graphics 620, i7-8565U, Toshiba XG5 KXG50ZNV512G | Lenovo Yoga C930-13IKB 81C4 UHD Graphics 620, i5-8550U, SK hynix PC401 HFS256GD9TNG | Asus ZenBook S13 UX392FN GeForce MX150, i7-8565U, WDC PC SN520 SDAPNUW-512G | |
|---|---|---|---|---|---|---|
| Noise | -4% | 1% | 1% | -5% | ||
| off / environment * (dB) | 28 | 30.4 -9% | 29.2 -4% | 27.9 -0% | 28.1 -0% | |
| Idle Minimum * (dB) | 28 | 30.4 -9% | 29.2 -4% | 27.9 -0% | 28.1 -0% | |
| Idle Average * (dB) | 28 | 30.4 -9% | 29.2 -4% | 27.9 -0% | 28.1 -0% | |
| Idle Maximum * (dB) | 28 | 30.4 -9% | 30.4 -9% | 29.3 -5% | 29 -4% | |
| Load Average * (dB) | 31.7 | 31.7 -0% | 31 2% | 32 -1% | 41.1 -30% | |
| Load Maximum * (dB) | 43.5 | 38.1 12% | 32.1 26% | 39.3 10% | 41.1 6% | |
| Witcher 3 ultra * (dB) | 41.1 |
* ... smaller is better
Noise level
| Idle |
| 28 / 28 / 28 dB(A) |
| Load |
| 31.7 / 43.5 dB(A) |
 | ||
30 dB silent 40 dB(A) audible 50 dB(A) loud |
||
min: | ||
Temperature
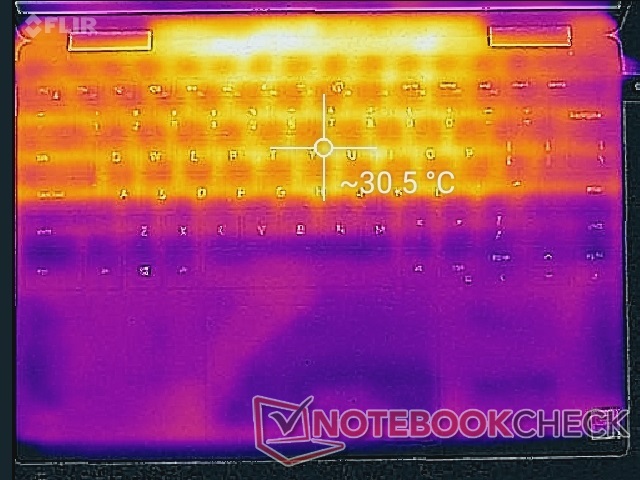
When idling, hot spots plateau at about 30 C and 33 C on the top and bottom sides, respectively, as shown by our temperature maps below. It's interesting to note that there is a steep and distinct transition between the warmer surfaces and cooler surfaces across the center of the keyboard which is atypical of a laptop.
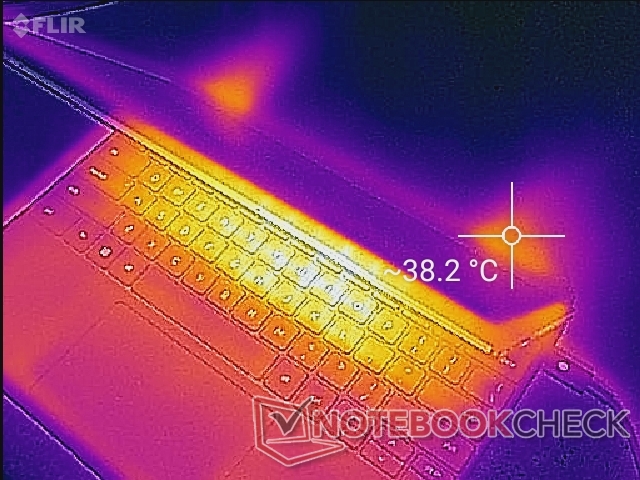
When under extreme loads for an extended period, hot spots can become as warm as 50 C on both the top and bottom sides of the laptop. Perhaps by coincidence, we observed the same results on the original XPS 13 9365 2-in-1 as well. The front quadrants of the chassis remain cool no matter the onscreen load since the battery occupies most of this volume.
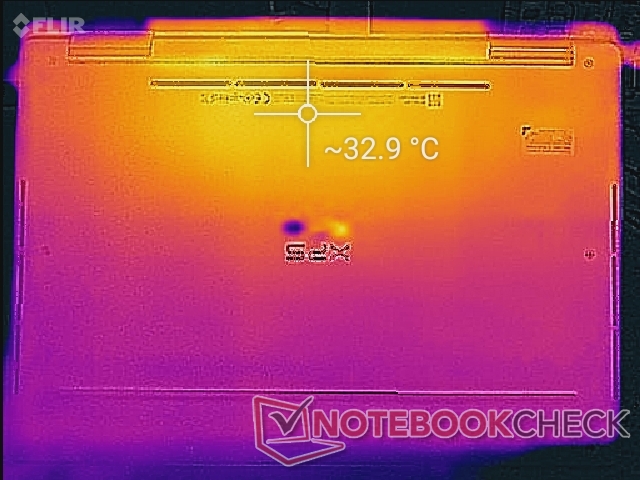


(-) The maximum temperature on the upper side is 50 °C / 122 F, compared to the average of 35.4 °C / 96 F, ranging from 19.6 to 60 °C for the class Convertible.
(-) The bottom heats up to a maximum of 47 °C / 117 F, compared to the average of 36.9 °C / 98 F
(+) In idle usage, the average temperature for the upper side is 28.8 °C / 84 F, compared to the device average of 30.3 °C / 87 F.
(+) The palmrests and touchpad are cooler than skin temperature with a maximum of 31 °C / 87.8 F and are therefore cool to the touch.
(-) The average temperature of the palmrest area of similar devices was 28 °C / 82.4 F (-3 °C / -5.4 F).
Stress Test
We stress the system with synthetic loads to identify for any potential throttling issues. When running Prime95, clock rates jump to 3.4 GHz for the first minute or so until core temperature reaches a blistering 100 C. Thereafter, clock rates drop slightly to the 3.1 to 3.3 GHz range while core temperatures continue to hover at 99 C. On paper, the Intel Core i3-1005G1 offers a maximum Turbo Boost clock rate of 3.4 GHz and so it's good to see that this Dell system is doing its best to maintain the maximum potential of the processor. Nonetheless, it's not comforting to have any processor running above 90 C for long periods. Running this same test on the HP EliteBook x360 1040 with the Core i7-8650U results in a cooler core temperature of "only" 73 C albeit at slower clock rates.
Running both Prime95 and FurMark simultaneously results in lower core temperatures from 75 C to 86 C and a slower operating clock rate range between 2.3 GHz and 2.4 GHz. Clock rates may periodically dip even further to 1.6 GHz for short periods. Our findings have us concerned about the Core i7-1065G7 SKU. If the XPS 13 7390 2-in-1 can just barely run the Core i3 at its maximum potential, then how will it deal with the even faster Core i7-1065G7? We'll have to check and compare once we get our hands on the Core i7 configuration at a later date.
Running on battery power appears to limit CPU performance just slightly. A 3DMark Cloud Gate test on batteries returns Physics and Graphics scores of 4026 and 10811 points, respectively, compared to 4287 and 10966 points when on mains.
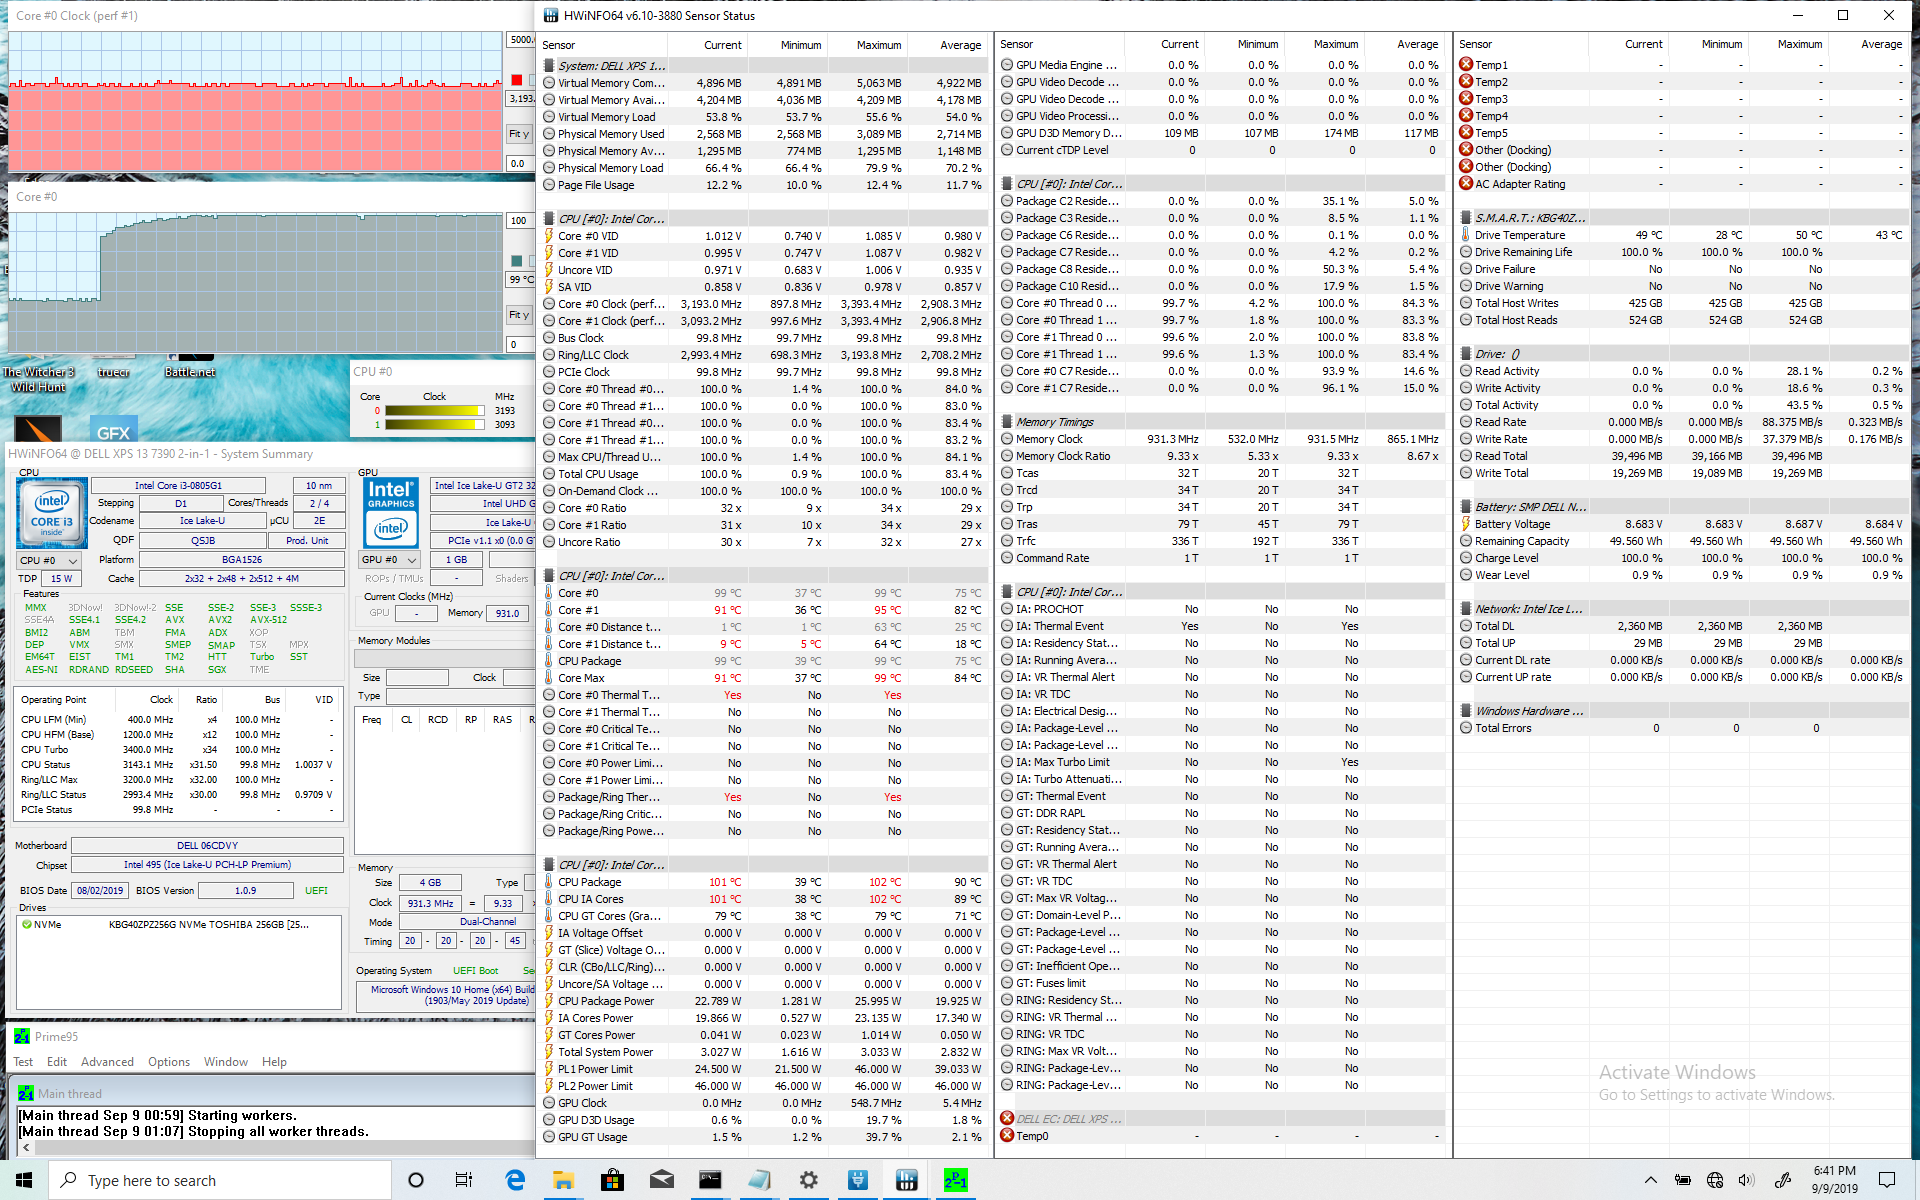
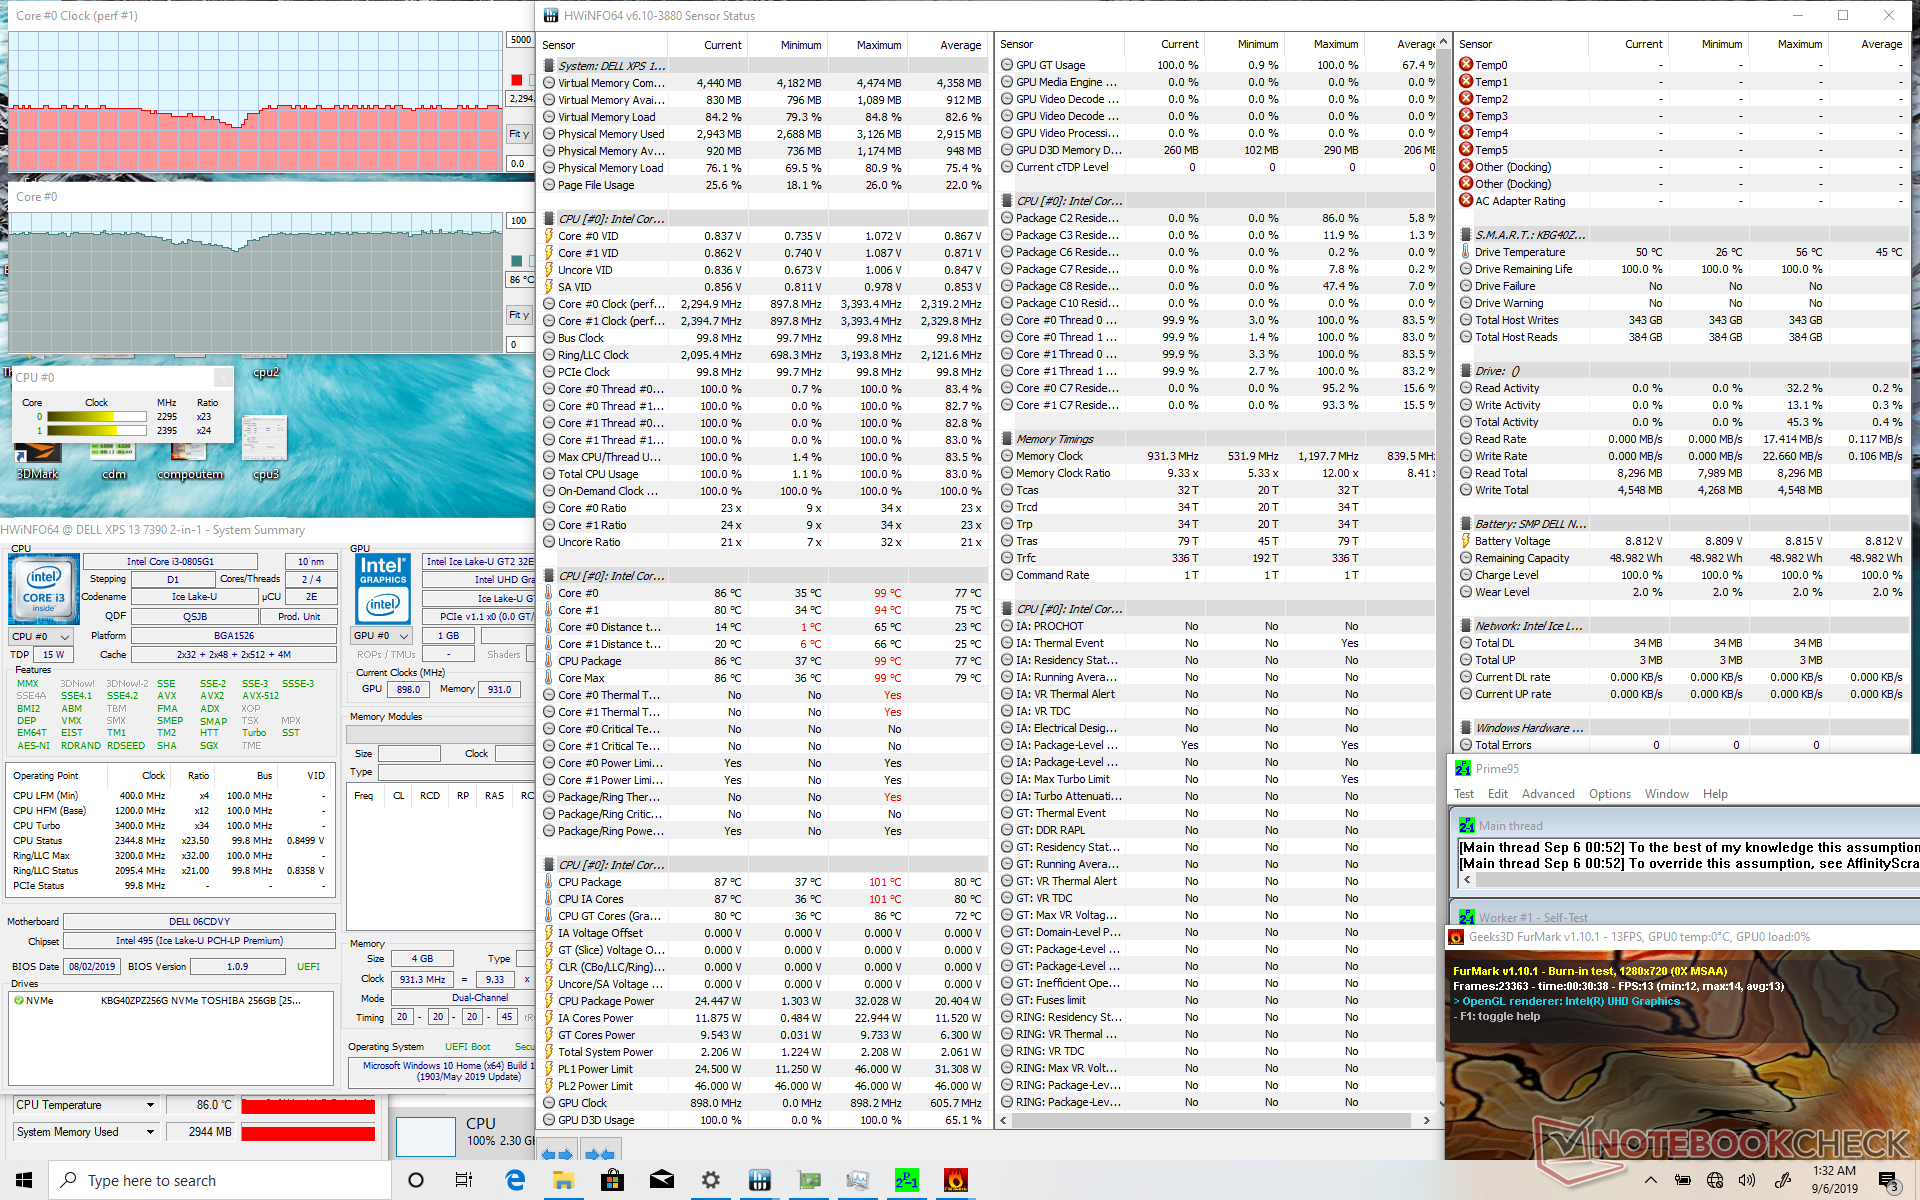
| CPU Clock (GHz) | GPU Clock (MHz) | Average CPU Temperature (°C) | |
| System Idle | -- | -- | 37 |
| Prime95 Stress | 3.1 - 3.3 | -- | 99 |
| Prime95 + FurMark Stress | 1.6 - 2.4 | -- | 75 - 86 |
Speakers
A pair of 2 W speakers are positioned underneath the front corners of the palm rests. Unfortunately on our test unit, the left speaker seems to be faulty as it would introduce heavy static whenever there is audio playback. We'll have to revisit this section when we can get our hands on a Core i7 SKU.

Energy Management
Power Consumption
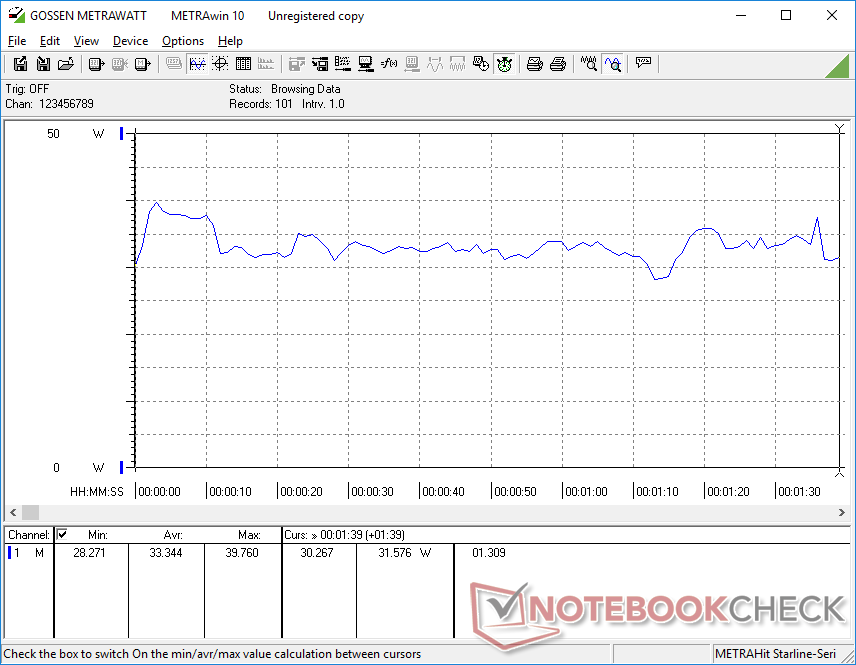
The Dell system is especially power efficient during low loads. Idling on desktop demands only 3 W to 8 W to be similar to competitors even though its display is significantly brighter. Jumping from minimum brightness to maximum brightness increases power consumption by only 2.5 to 3 W whereas the similarly bright Samsung Notebook 9 NP900X3N on Outdoor Mode would consume about twice as much.
Gaming loads will draw an average of 33 W to be comparable to 13.3-inch Ultrabooks with last generation Whiskey Lake-U or Kaby Lake-R CPUs. This is perhaps unsurprising since its integrated GPU performs roughly the same as the UHD Graphics 620 series.
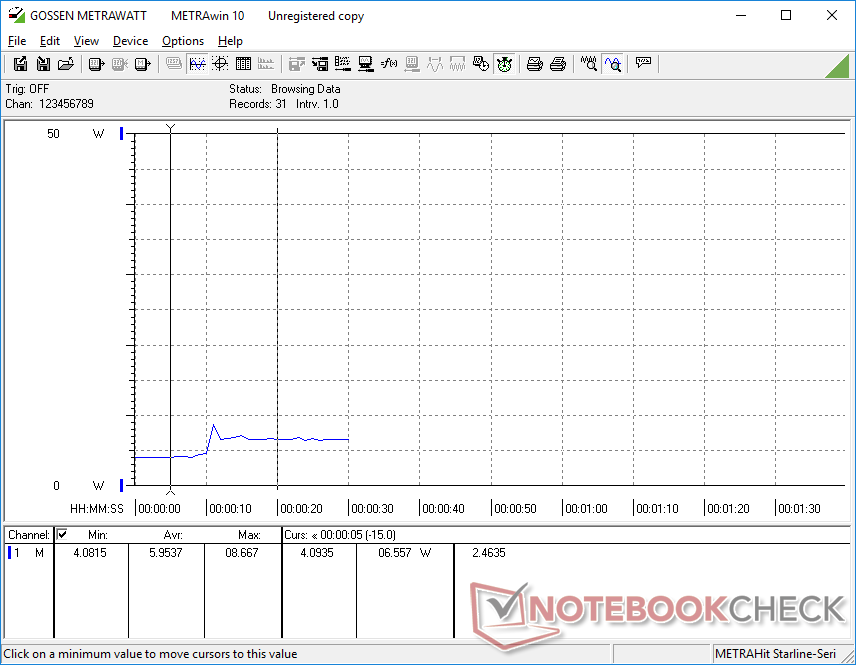
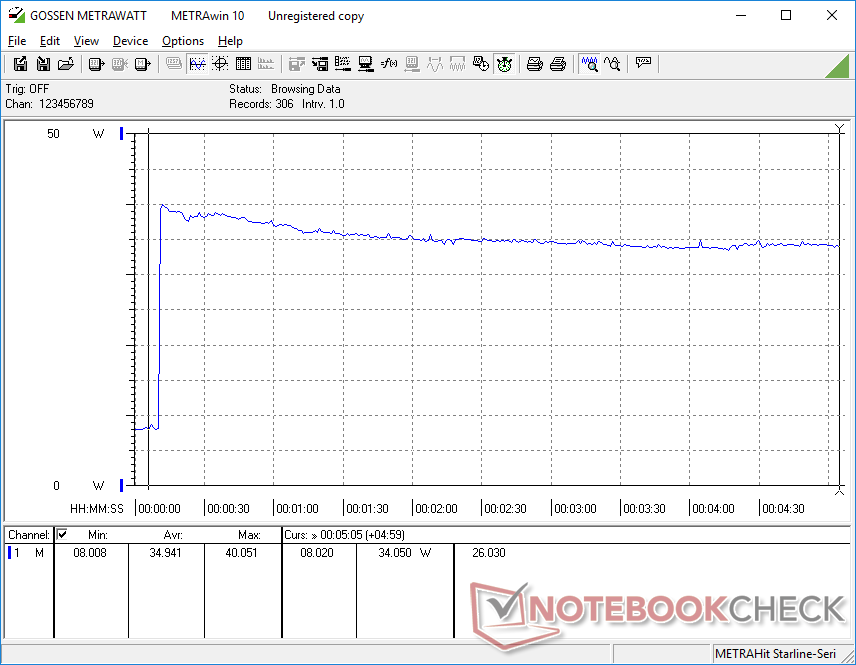
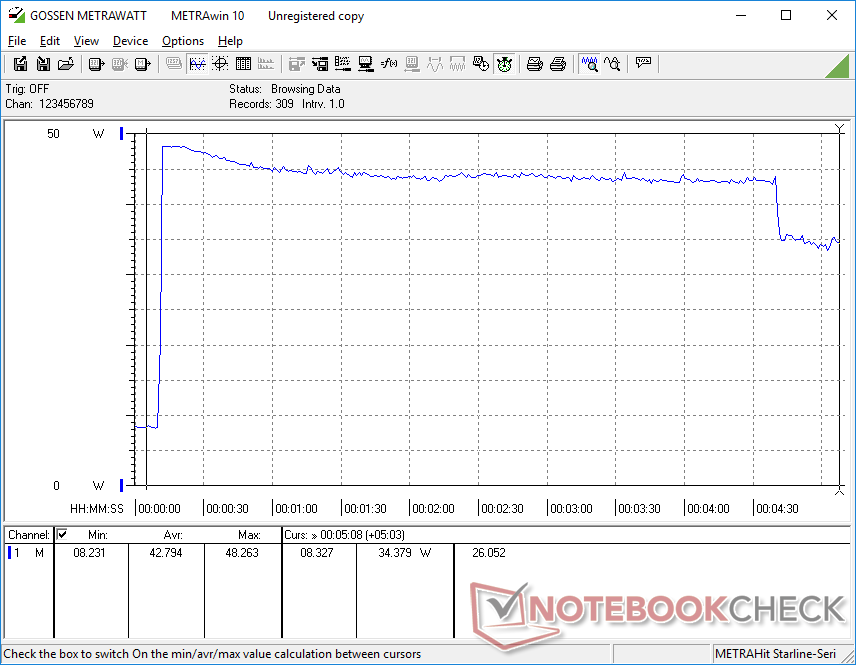
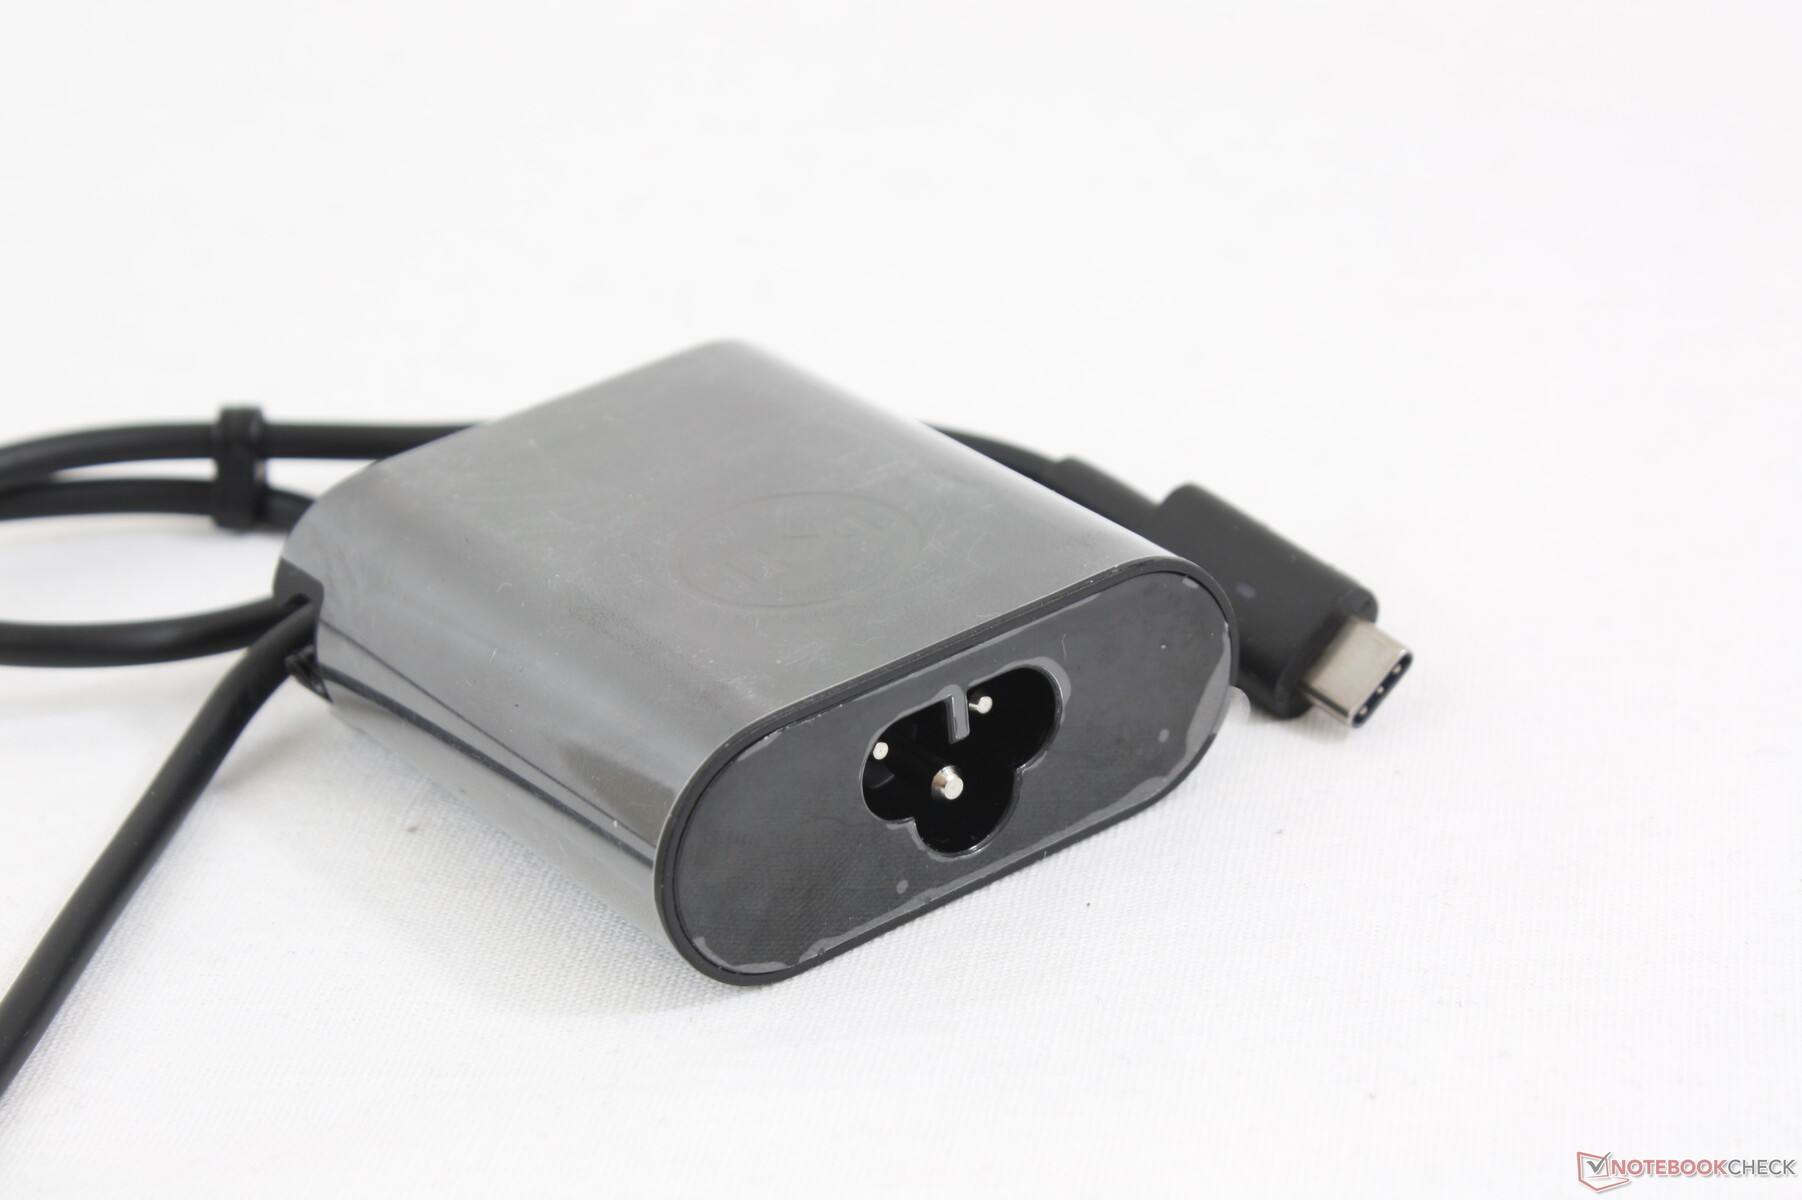
We're able to record a maximum consumption spike of 48.3 W from the very small (~6.0 x 5.5 x 2.3 cm) 45 W AC adapter when running both Prime95 and FurMark simultaneously. This comsumption rate falls steadily over time to the 34 W to 40 W range as shown by our graphs below likely in an attempt to keep thermals in check. While such a behavior is not uncommon on Core U series CPUs, the decline appears to be shallower and steadier on this Core i3 CPU to align with our stress test and CineBench loop test observations above.
| Off / Standby | |
| Idle | |
| Load |
|
Key:
min: | |
| Dell XPS 13 7390 2-in-1 Core i3 i3-1005G1, UHD Graphics G1 (Ice Lake 32 EU), Toshiba BG4 KBG40ZPZ256G, IPS, 1920x1200, 13.4" | Dell XPS 13 9380 2019 i5-8265U, UHD Graphics 620, SK hynix PC401 HFS256GD9TNG, IPS, 3840x2160, 13.3" | Dell XPS 13-9365 2-in-1 i7-7Y75, HD Graphics 615, Toshiba NVMe THNSN5256GPUK, IPS, 1920x1080, 13.3" | HP Spectre x360 13-ap0312ng i7-8565U, UHD Graphics 620, Toshiba XG5 KXG50ZNV512G, IPS, 1920x1080, 13.3" | Lenovo Yoga C930-13IKB 81C4 i5-8550U, UHD Graphics 620, SK hynix PC401 HFS256GD9TNG, IPS, 1920x1080, 13.9" | Asus ZenBook S13 UX392FN i7-8565U, GeForce MX150, WDC PC SN520 SDAPNUW-512G, IPS, 1920x1080, 13.9" | |
|---|---|---|---|---|---|---|
| Power Consumption | -35% | 26% | -19% | -38% | -31% | |
| Idle Minimum * (Watt) | 3 | 4.8 -60% | 3.1 -3% | 4.32 -44% | 3.4 -13% | 3.4 -13% |
| Idle Average * (Watt) | 5.4 | 8.6 -59% | 4.3 20% | 6.84 -27% | 7.5 -39% | 6.3 -17% |
| Idle Maximum * (Watt) | 7.3 | 10.4 -42% | 4.9 33% | 8.64 -18% | 11.8 -62% | 10.4 -42% |
| Load Average * (Watt) | 33.4 | 37.9 -13% | 24.3 27% | 31.8 5% | 47.7 -43% | 51 -53% |
| Load Maximum * (Watt) | 48.3 | 48.5 -0% | 22.8 53% | 53 -10% | 63.2 -31% | 62.7 -30% |
| Witcher 3 ultra * (Watt) | 39 |
* ... smaller is better
Battery Life
Battery capacity has been upped from 46 Wh on the 2017 XPS 13 9365 2-in-1 to 51 Wh on this latest model. WLAN runtimes still aren't as good as the original likely due to the larger display size and the more demanding 15 W Core U-class CPU of our system, but results are very long nonetheless and comparable to the XPS 13 9380 clamshell. Expect almost 9 hours of real-world browsing use when on the Balanced power profile and with the display set to 150 nits (25 percent).
Recharging takes about 1.5 to 2 hours with the included AC adapter. Note that this same adapter can be used to charge USB Type-C smartphones, tablets, Switch consoles, and even other laptops to make it a versatile charger when traveling.
| Dell XPS 13 7390 2-in-1 Core i3 i3-1005G1, UHD Graphics G1 (Ice Lake 32 EU), 51 Wh | Dell XPS 13 9380 2019 i5-8265U, UHD Graphics 620, 52 Wh | Dell XPS 13-9365 2-in-1 i7-7Y75, HD Graphics 615, 46 Wh | HP Spectre x360 13-ap0312ng i7-8565U, UHD Graphics 620, 61 Wh | Lenovo Yoga C930-13IKB 81C4 i5-8550U, UHD Graphics 620, 60 Wh | Asus ZenBook S13 UX392FN i7-8565U, GeForce MX150, 50 Wh | |
|---|---|---|---|---|---|---|
| Battery runtime | -17% | 2% | 3% | 25% | -16% | |
| Reader / Idle (h) | 35.7 | 17.2 -52% | 16.2 -55% | 28.5 -20% | ||
| WiFi v1.3 (h) | 8.9 | 8.3 -7% | 11.4 28% | 8.9 0% | 11.1 25% | 8.4 -6% |
| Load (h) | 2.2 | 2.4 9% | 2.9 32% | 2.3 5% | 1.7 -23% |
Pros
Cons
Verdict
Enthusiasts will inevitably cry foul about the soldered components of the XPS 13 7390 2-in-1. Though it's definitely a bummer that key specs like RAM, WLAN, or even storage aren't serviceable or user-upgradeable, Dell is targeting an audience where such features aren't potential deal breakers. The XPS 13 convertible aims to gobble up the 2-in-1 market where detachables like the Surface Pro are already very limited in terms of upgradeability.
The best aspect of Dell's convertible is its display rather than the fancy new Intel Ice Lake-U CPU. The display on even the least expensive Core i3 SKU is objectively better than the displays of many other flagship Ultrabooks costing hundreds more. It's noticeably brighter, better calibrated out of the box, and even roomier than what most users are accustomed to because of the taller 16:10 aspect ratio. If you've ever wanted a 13-inch convertible laptop for travel and outdoor use, then this system would be your best bet simply because of how much brighter the display can be when compared to the competition.
As for the Core i3-1005G1, its raw CPU horsepower is only slightly better than the Core i3-8145U while offering the integrated graphics performance of the Core i7-8565U all in a more efficient 10 nm design. The gen-to-gen upgrade is marginal in this regard, but it's still leagues better than what the older XPS 13 9365 series was ever able to offer with the Core 7Y54 or Core 7Y75.
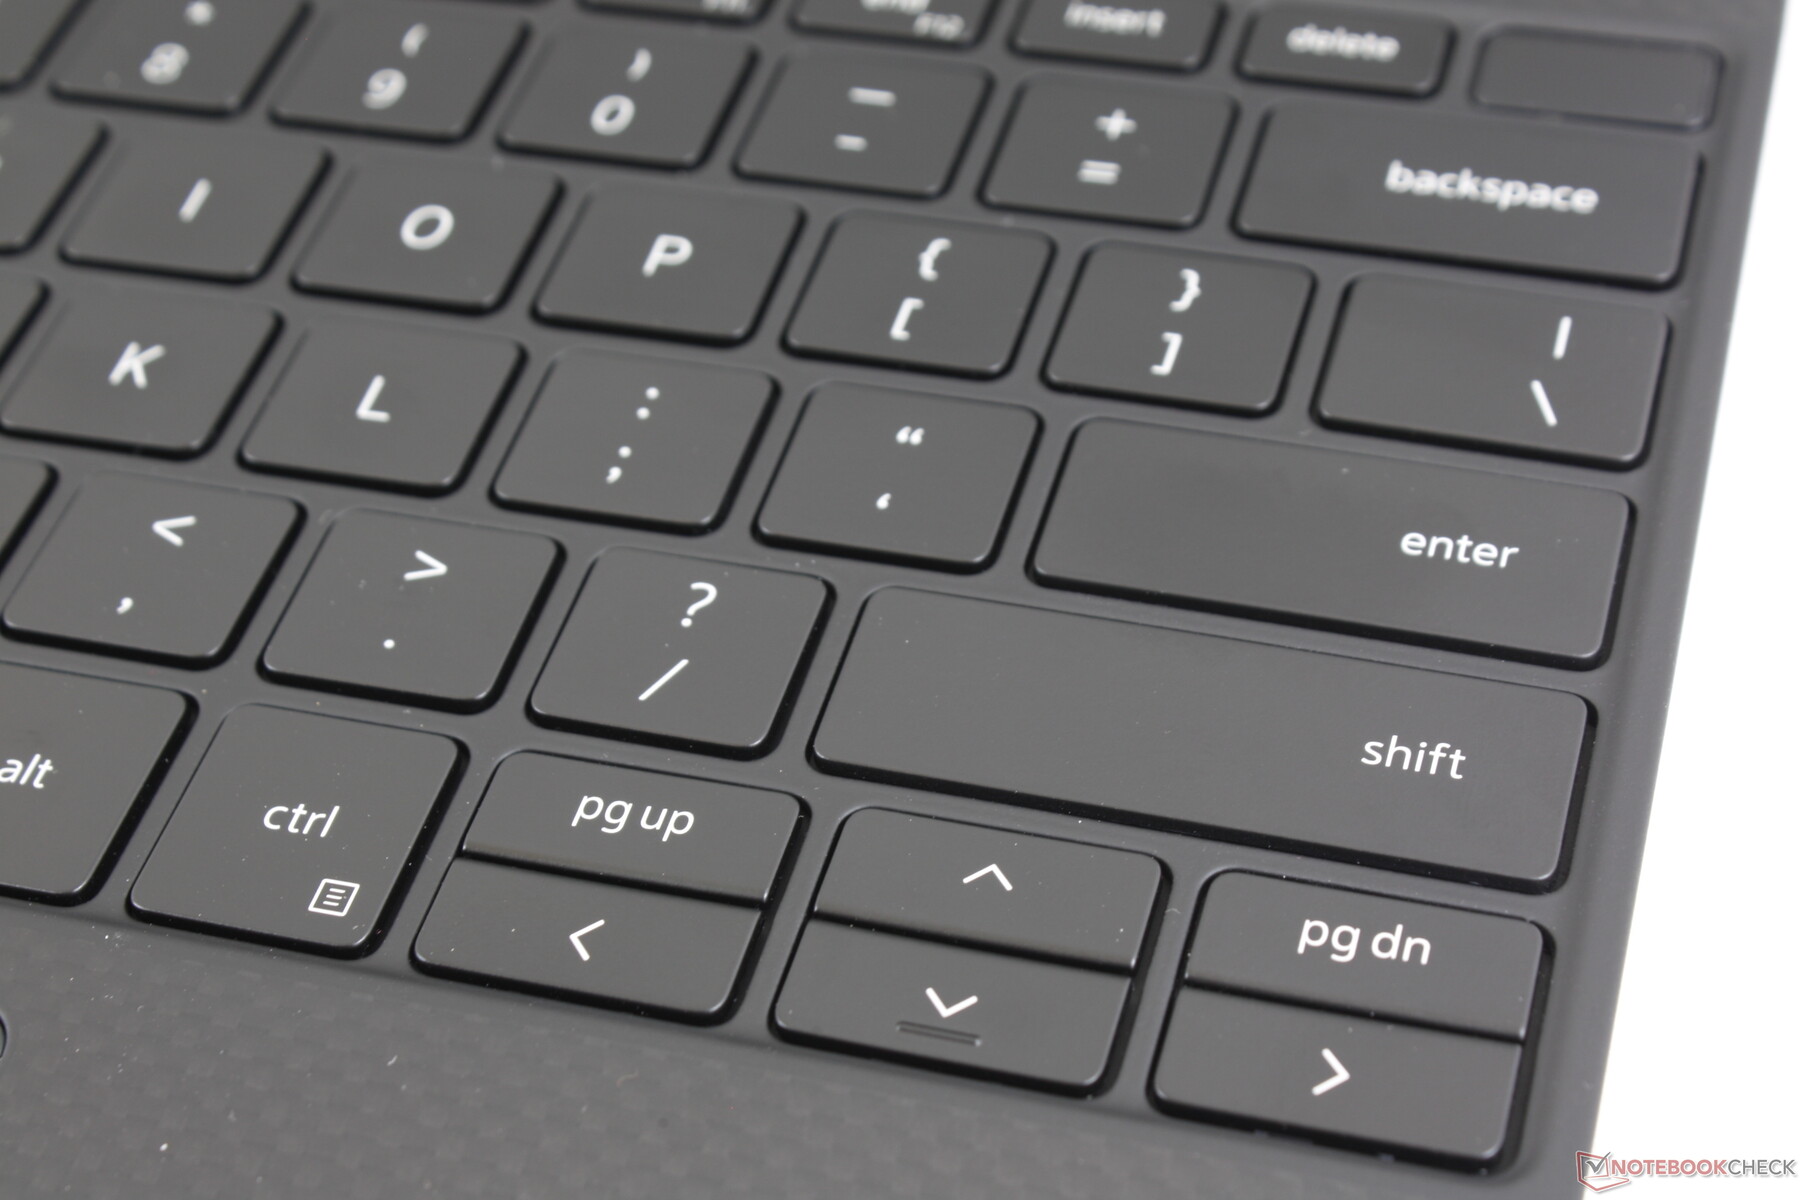
Most of our complaints are relatively minor that add up to noticeable annoyances. The cramped Arrow keys, fingerprint-loving surfaces, slow white-black response times, DPC latency problems, and lack of higher refresh rate and WWAN options all prevent the Dell from being the "ultimate" subnotebook convertible. A few features from the 2017 model like the Noble Lock, IR camera, and removable storage have all been dropped. Furthermore, running the CPU at full load will entail a core temperature of 99 C which already has us concerned about the performance of the Core i7 configurations. The closest alternative to the Dell that users may want to consider would be the 14-inch HP EliteBook x360 1040 G5 which is the only subnotebook we know of to offer WWAN, a super-bright 120 Hz display, user-upgradeable storage, and several more port options than the Dell all in a package that's nearly as small.
Since we experienced a couple of hardware-related problems on this retail unit, we highly recommend buyers to check for any abnormalities immediately upon purchasing. The distorted speakers and USB Type-C power problems are serious issues that we can only hope are due to our bad luck rather than something more profuse.
The 13.4-inch XPS 13 7390 2-in-1 is a significant upgrade from the 2017 XPS 13 9365 in nearly every sense of the word. Its biggest surprise isn't the new processor, but the well-calibrated display that is noticeably brighter than what most other Ultrabooks have to offer. If you're willing to go a little bigger, however, the 14-inch HP EliteBook x360 1040 G5 can do almost everything the XPS 2-in-1 can but with better upgradeability and more connectivity.
Dell XPS 13 7390 2-in-1 Core i3
- 09/10/2019 v7 (old)
Allen Ngo
Price comparison
