Dell XPS 13 7390 Core i7-10710U Laptop Review: Faster Than The Core i5 XPS 15
After a short delay, the Dell XPS 13 7390 clamshell with Intel's latest 10th gen Core i7-10710U processor has finally begun shipping. Dell was first out of the gate with an Intel Core i7 Ice Lake offering earlier last month and now it is first again with with Intel's Core i7 Comet Lake-U CPU. This particular processor is notable for being the first hexa-core CPU in the 15 W Core U series whereas all previous Core U CPUs had a maximum of just two or four physical cores.
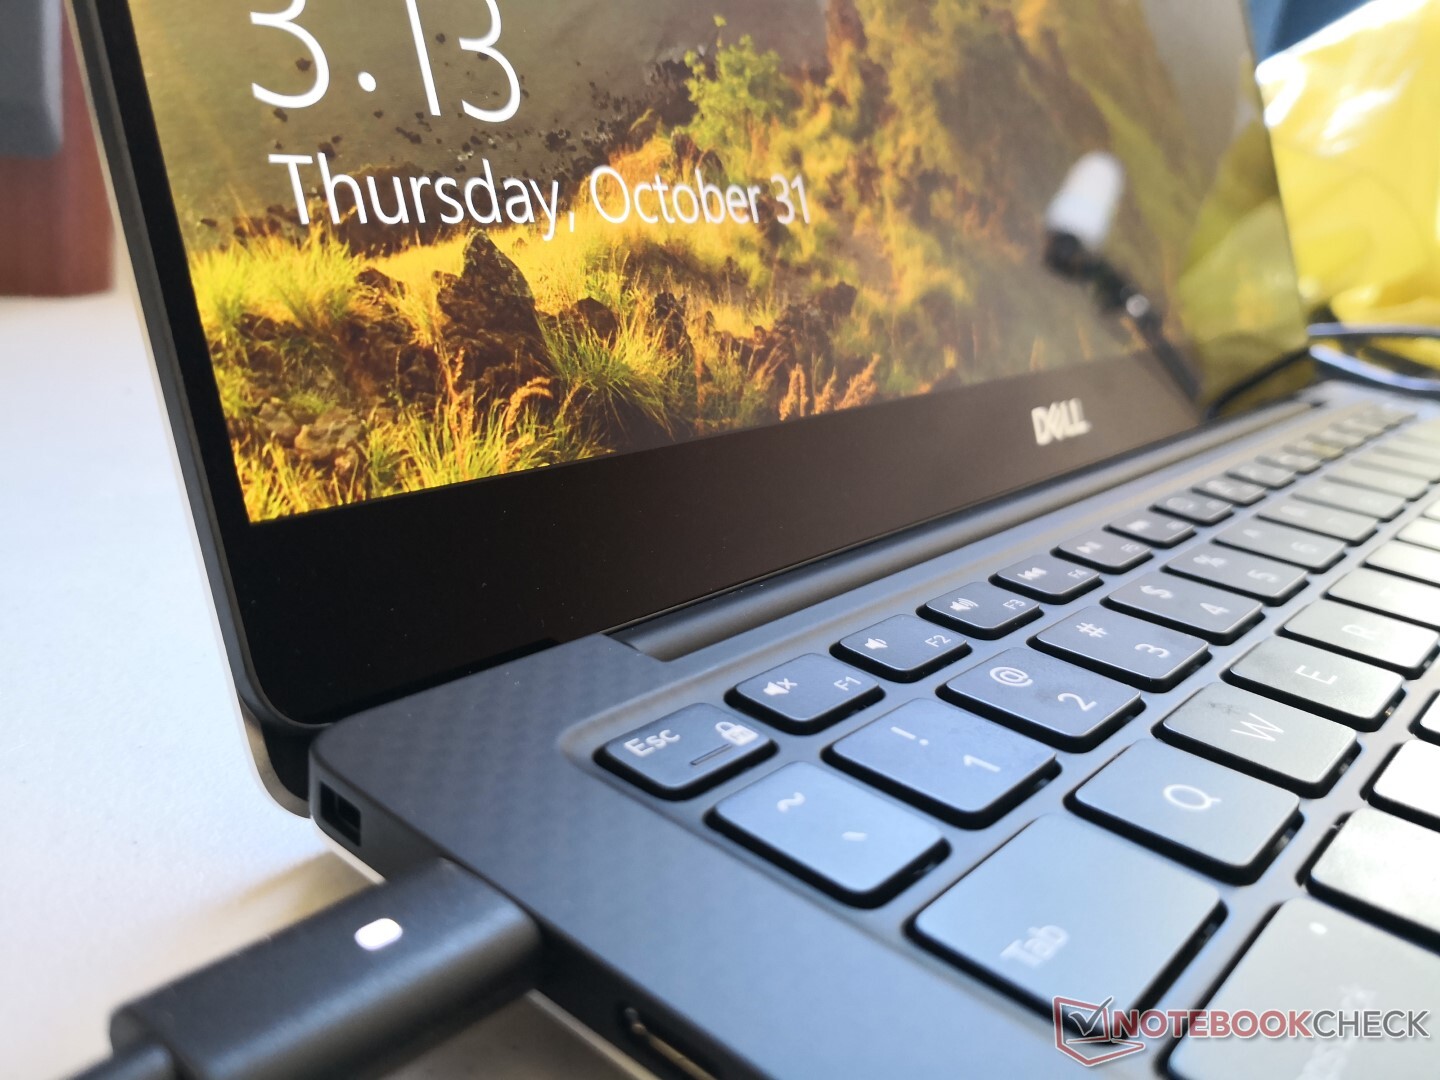
Other than the CPU swap, the chassis here remains identical to the XPS 13 models that have come before it. The change in model name (7390 vs. 9390) was also announced earlier this year as detailed here. We therefore recommend checking out our existing reviews on the XPS 13 9380 and XPS 13 9370 to learn more about the keyboard, display, ports, and other physical features of the XPS 13. This review will instead focus on the new Core i7-10710U and how much of a performance boost users can expect.
More Dell XPS reviews:
Rating | Date | Model | Weight | Height | Size | Resolution | Price |
|---|---|---|---|---|---|---|---|
| 85.9 % v7 (old) | 11 / 2019 | Dell XPS 13 7390 Core i7-10710U i7-10710U, UHD Graphics 620 | 1.2 kg | 11.6 mm | 13.30" | 3840x2160 | |
| 86.6 % v6 (old) | 05 / 2019 | Asus ZenBook S13 UX392FN i7-8565U, GeForce MX150 | 1.1 kg | 12.9 mm | 13.90" | 1920x1080 | |
| 82.7 % v7 (old) | 11 / 2019 | Acer Swift 3 SF314-41-R8HZ R5 3500U, Vega 8 | 1.5 kg | 18 mm | 14.00" | 1920x1080 | |
| 84.1 % v6 (old) | 06 / 2019 | Lenovo Yoga 530-14ARR-81H9000VGE R7 2700U, Vega 10 | 1.7 kg | 17.6 mm | 14.00" | 1920x1080 | |
| 87.7 % v6 (old) | 02 / 2019 | Dell XPS 13 9380 i7 4K i7-8565U, UHD Graphics 620 | 1.2 kg | 11.6 mm | 13.30" | 3840x2160 |
Case
SD Card Reader
| SD Card Reader | |
| average JPG Copy Test (av. of 3 runs) | |
| Dell XPS 13 9380 i7 4K (Toshiba Exceria Pro M501 64 GB UHS-II) | |
| Dell XPS 13 7390 2-in-1 Core i3 (Toshiba Exceria Pro M501 64 GB UHS-II) | |
| Dell XPS 13 7390 Core i7-10710U (Toshiba Exceria Pro M501 64 GB UHS-II) | |
| Dell XPS 13 7390 2-in-1 Core i7 (Toshiba Exceria Pro M501 64 GB UHS-II) | |
| maximum AS SSD Seq Read Test (1GB) | |
| Dell XPS 13 9380 i7 4K (Toshiba Exceria Pro M501 64 GB UHS-II) | |
| Dell XPS 13 7390 2-in-1 Core i3 (Toshiba Exceria Pro M501 64 GB UHS-II) | |
| Dell XPS 13 7390 Core i7-10710U (Toshiba Exceria Pro M501 64 GB UHS-II) | |
| Dell XPS 13 7390 2-in-1 Core i7 (Toshiba Exceria Pro M501 64 GB UHS-II) | |
Communication
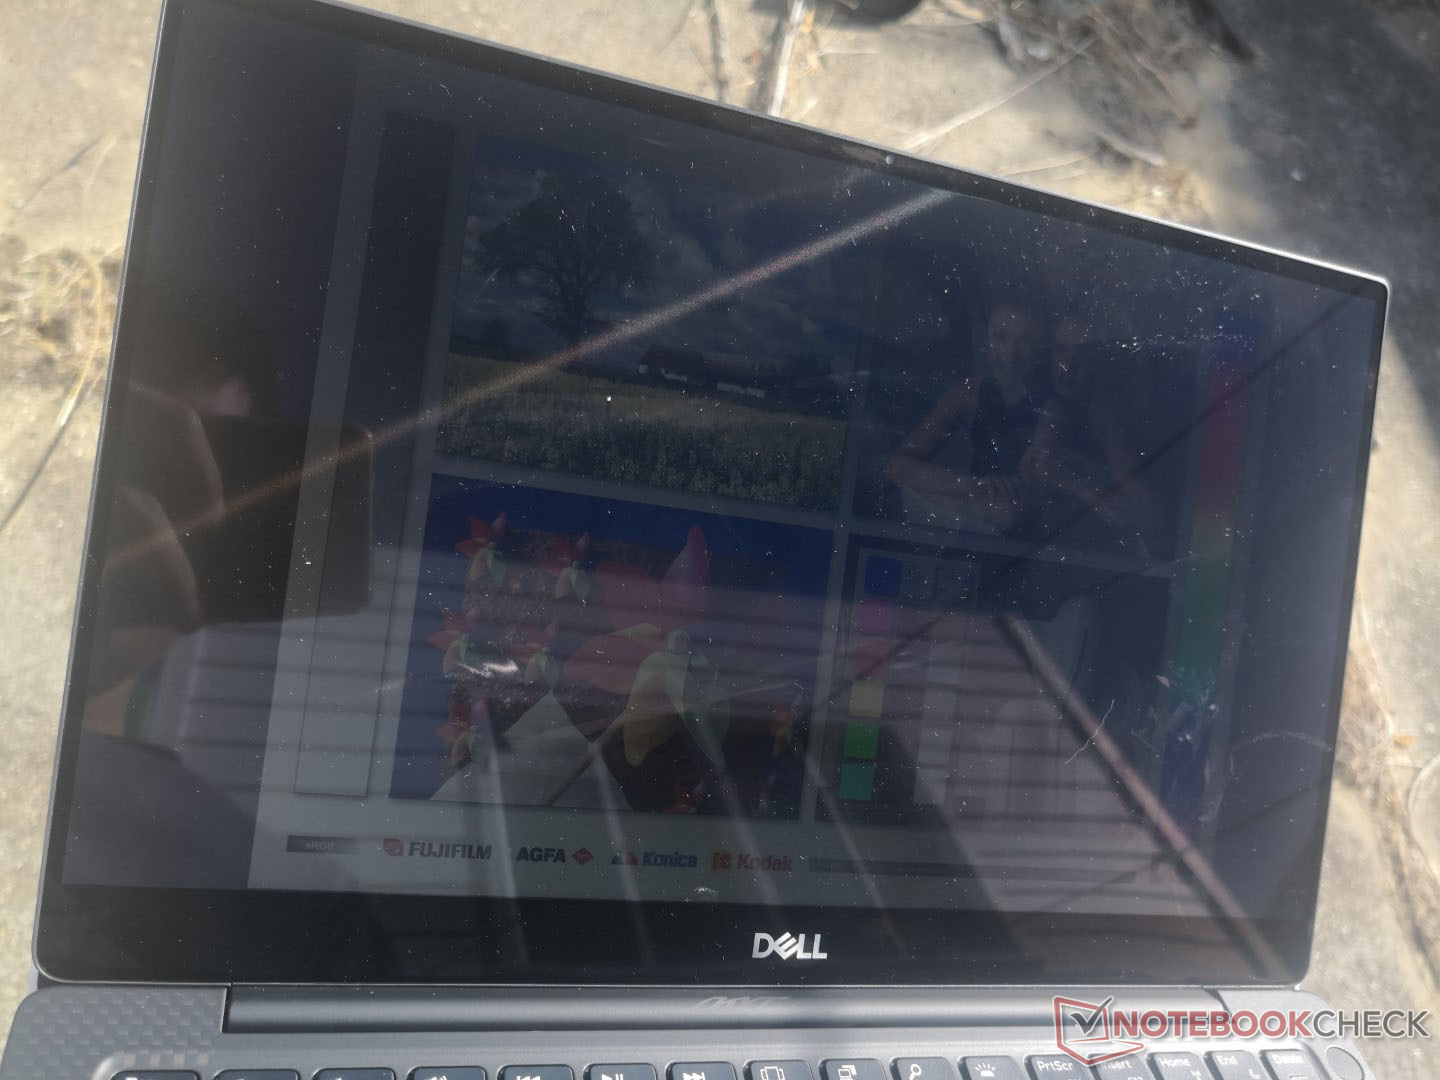
Display
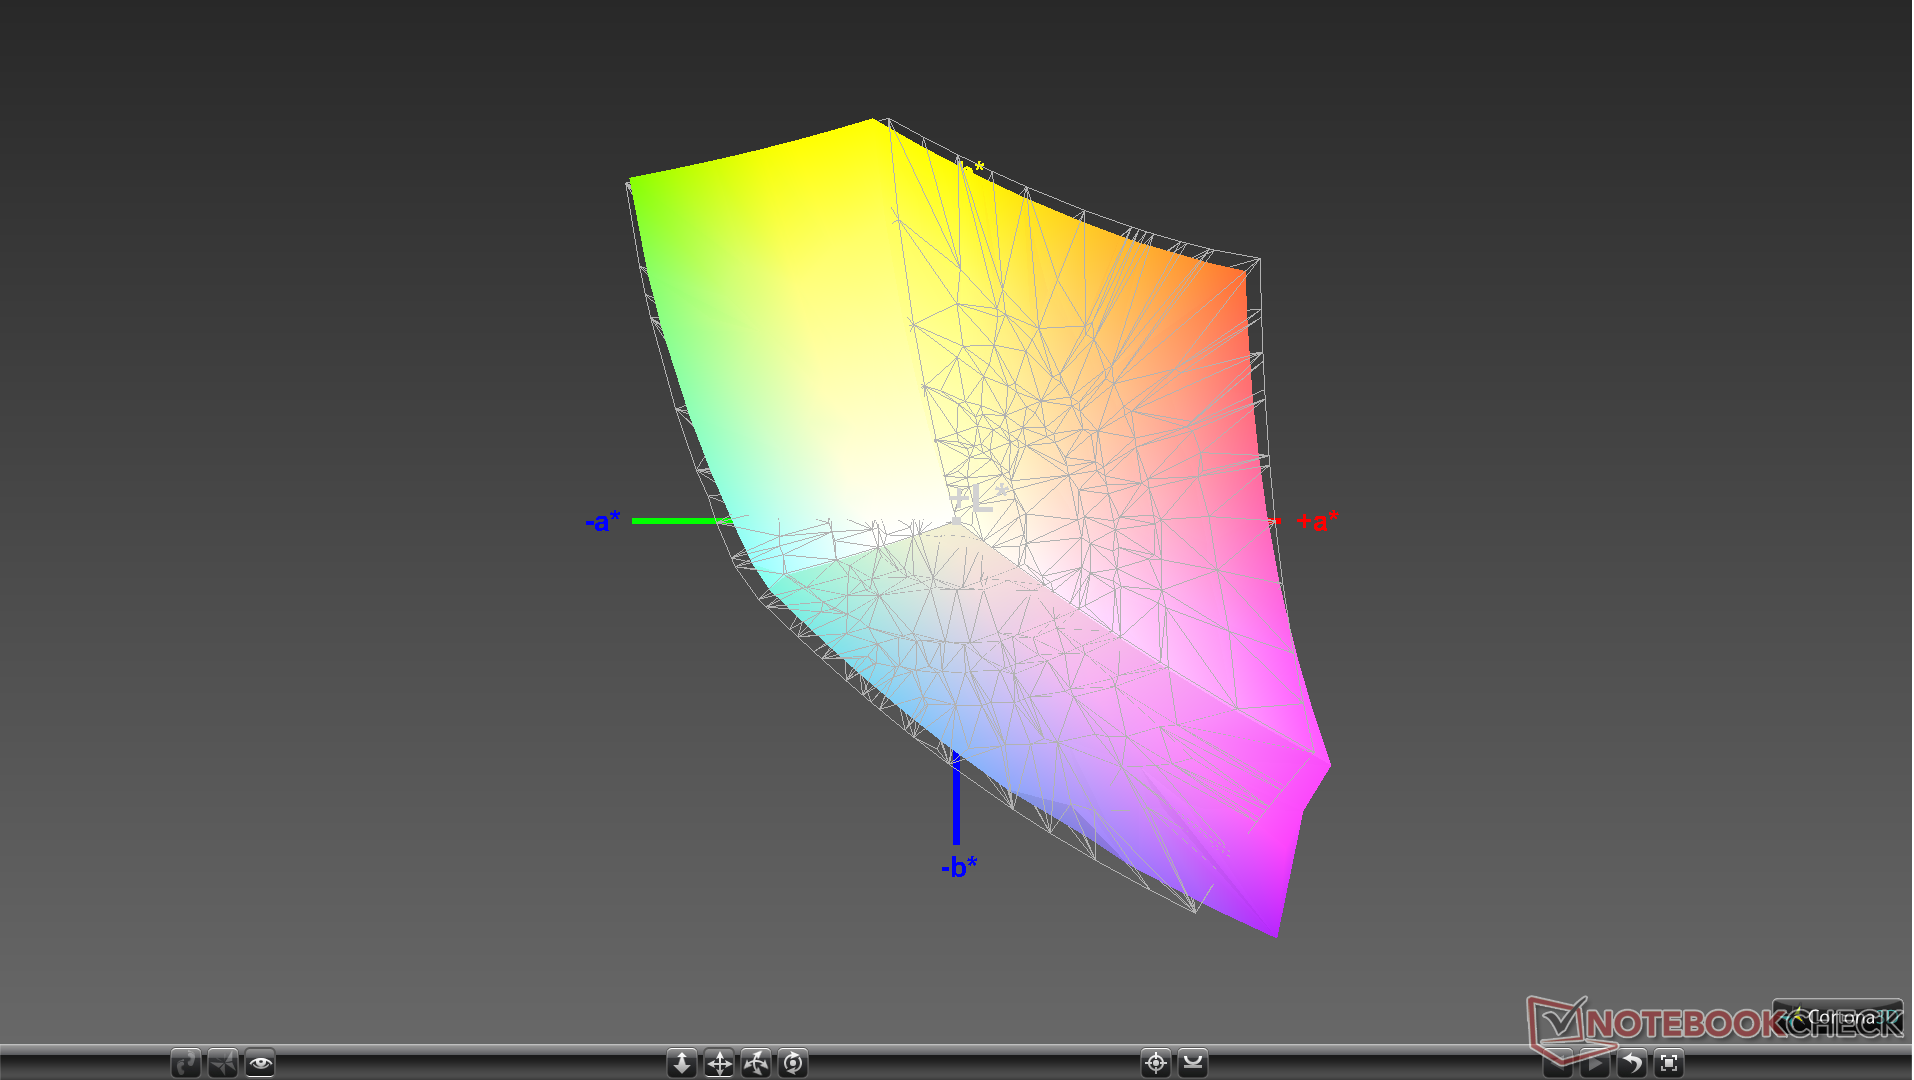
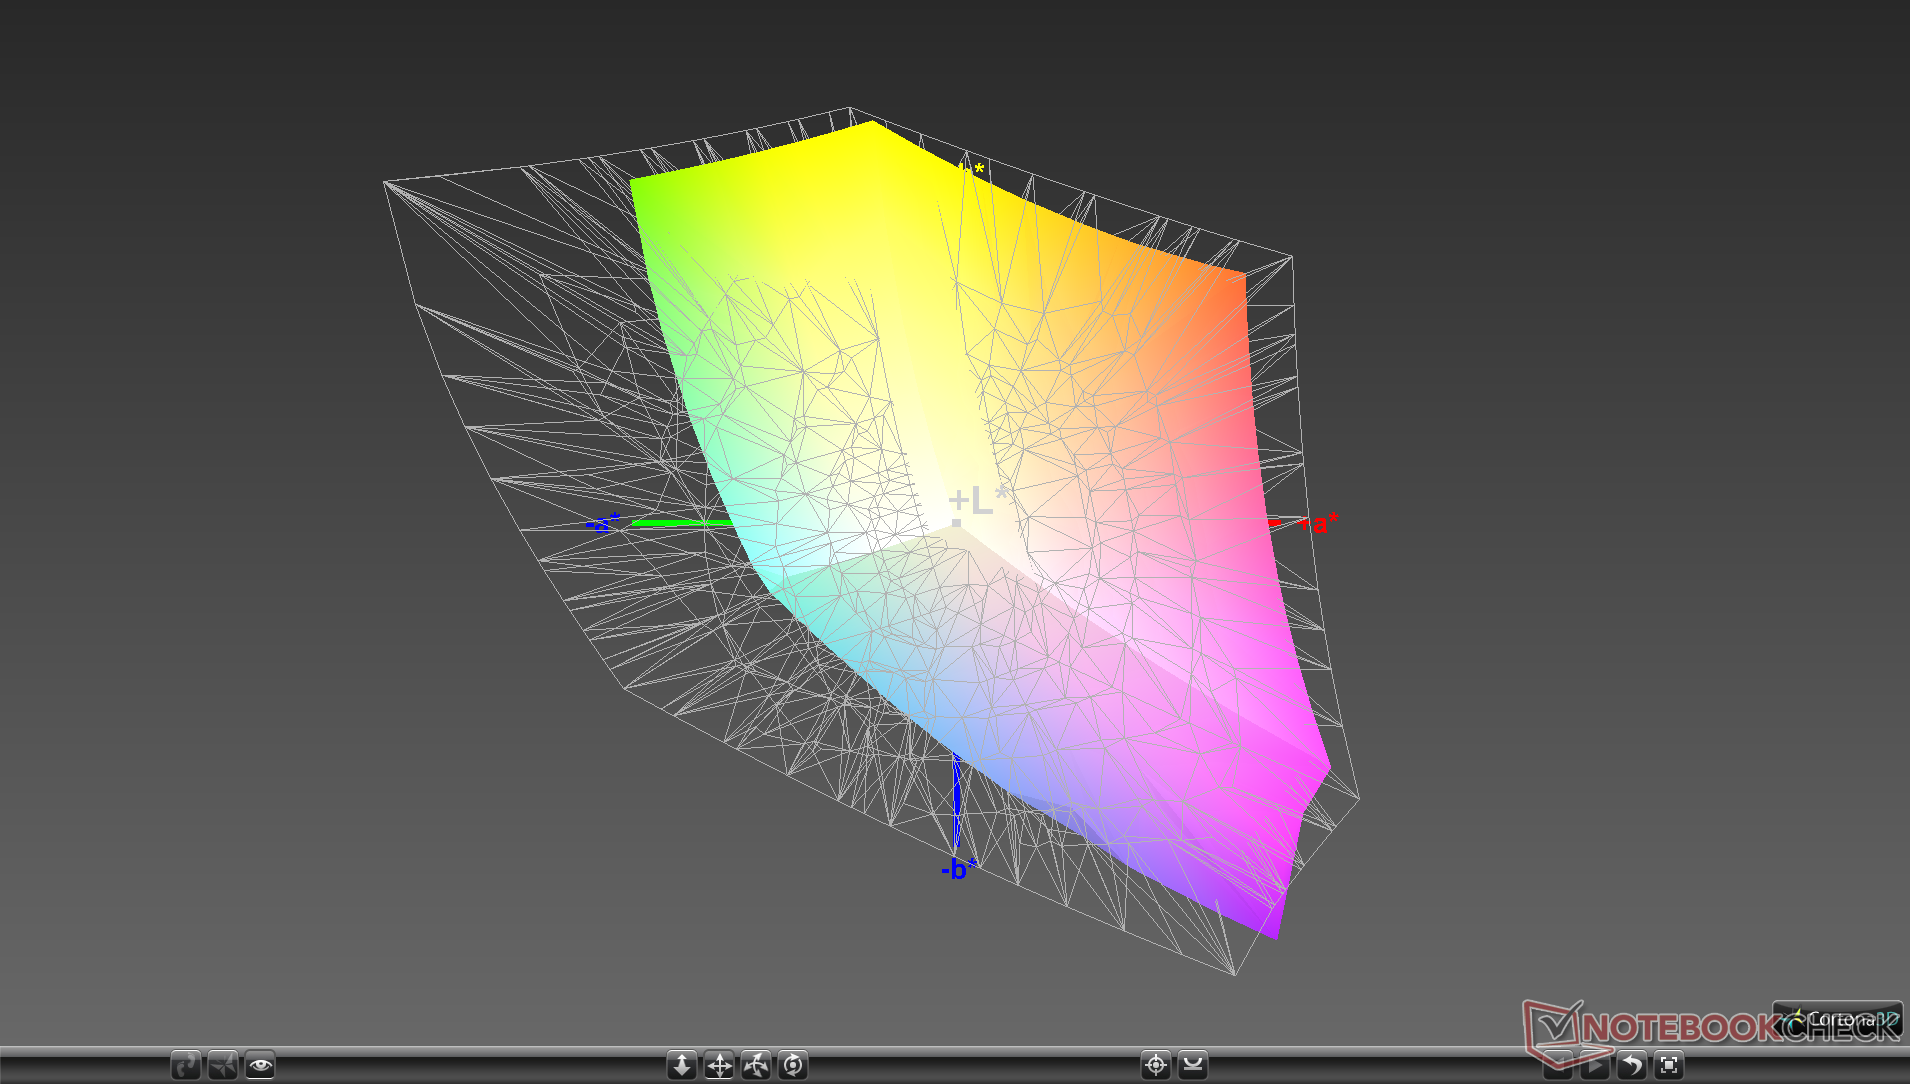
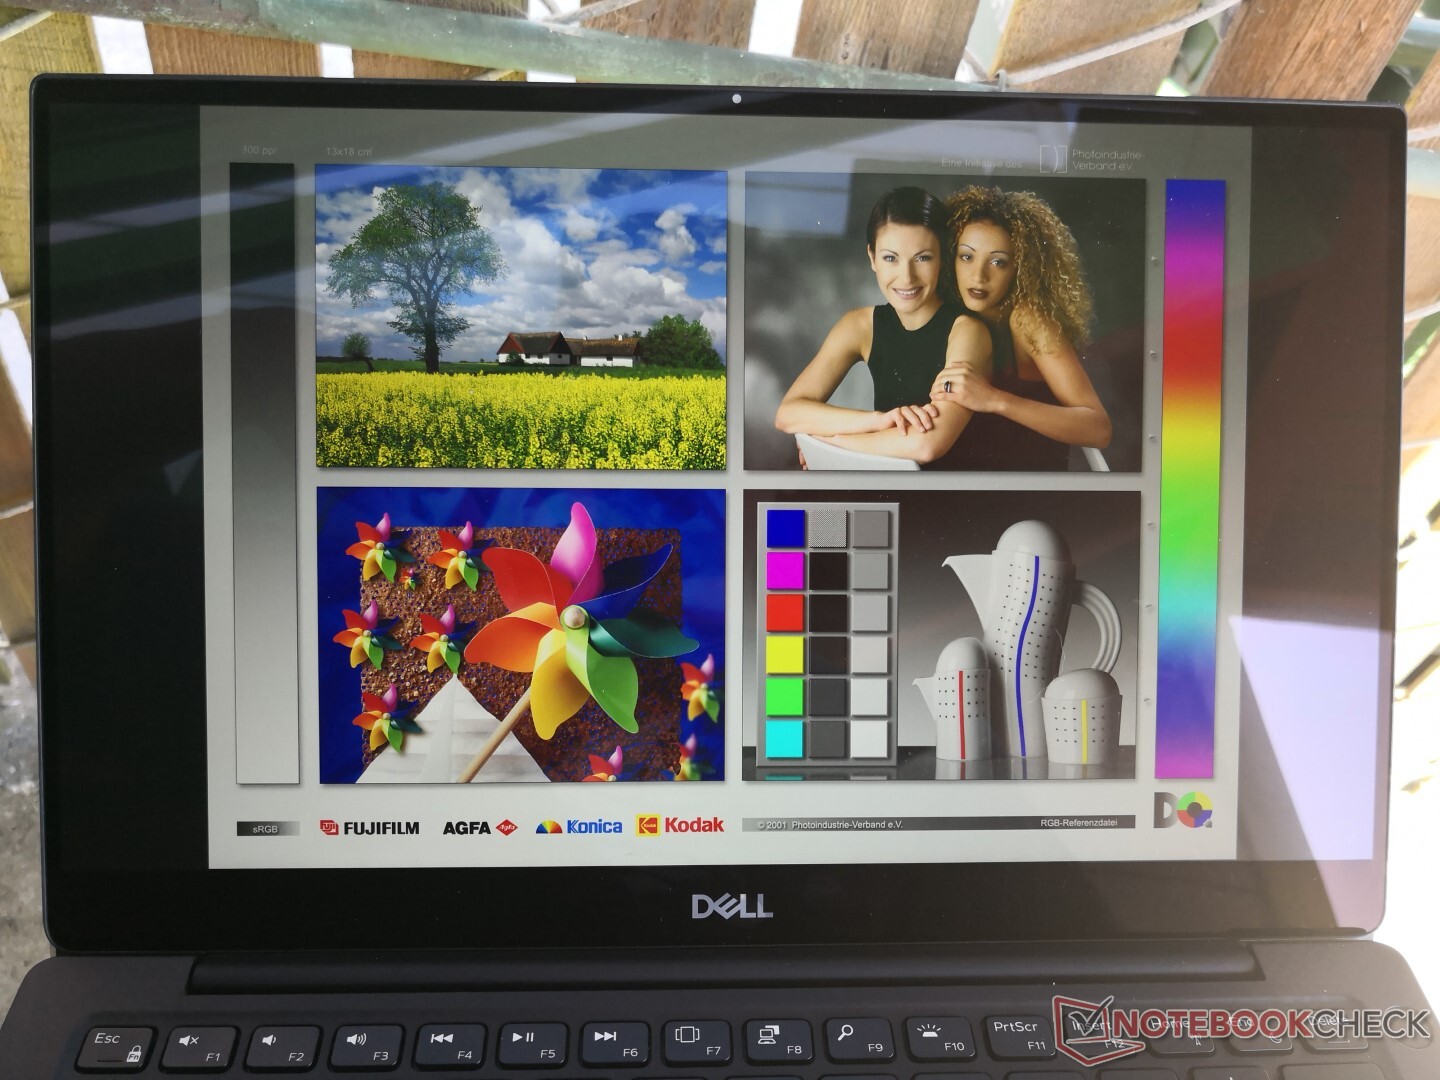
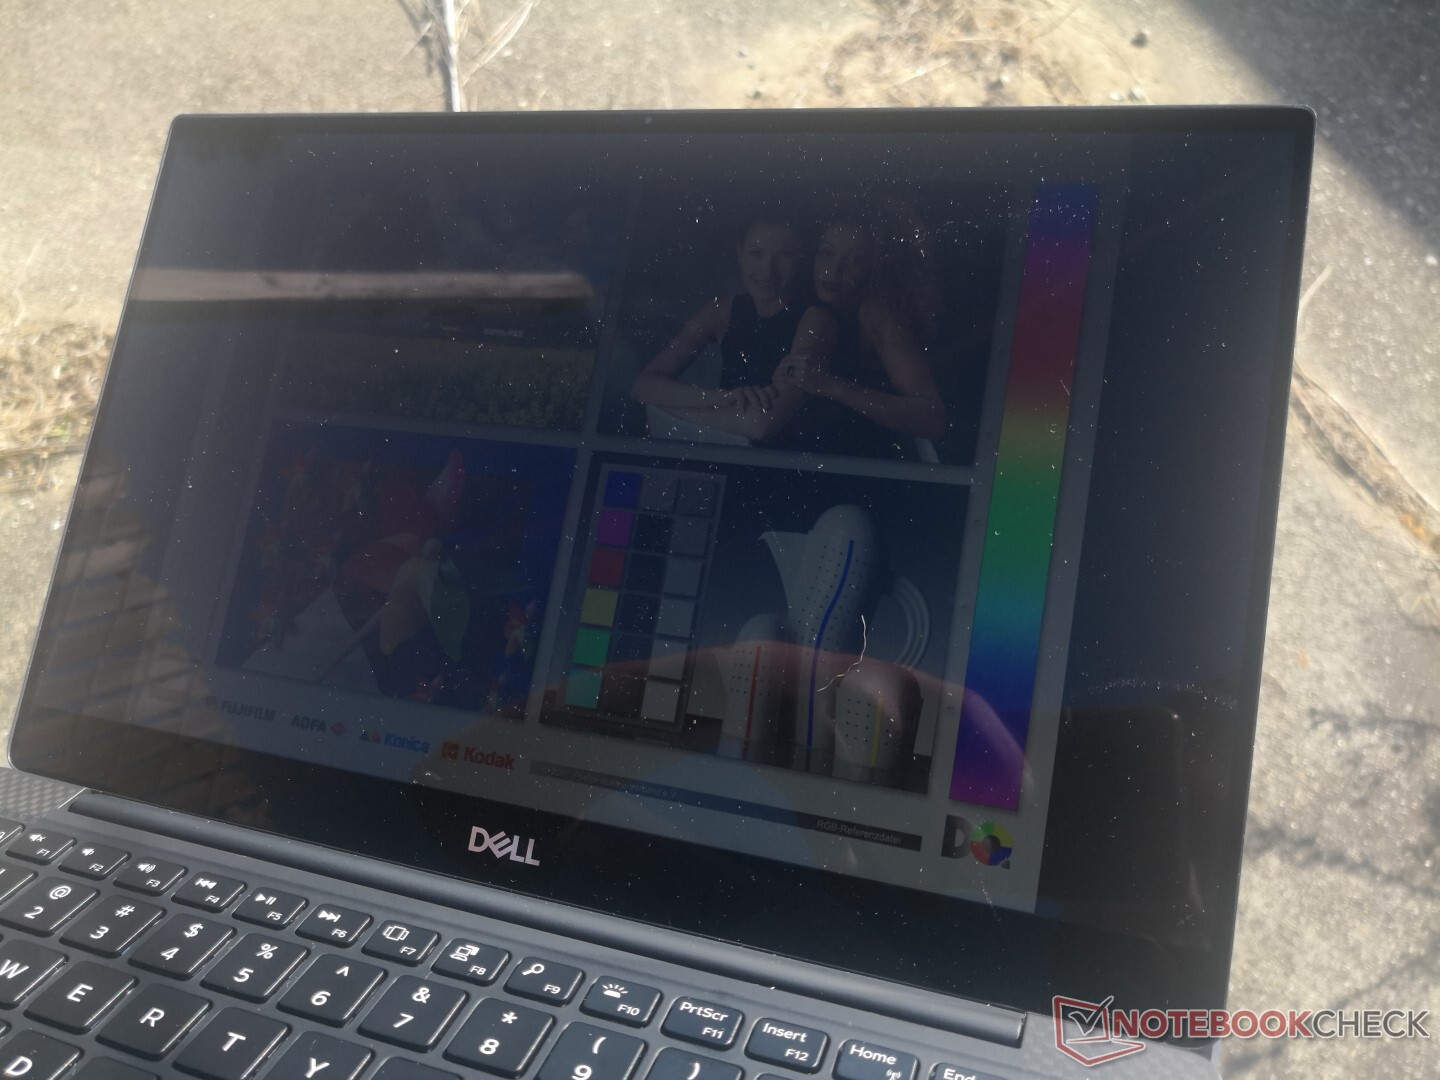
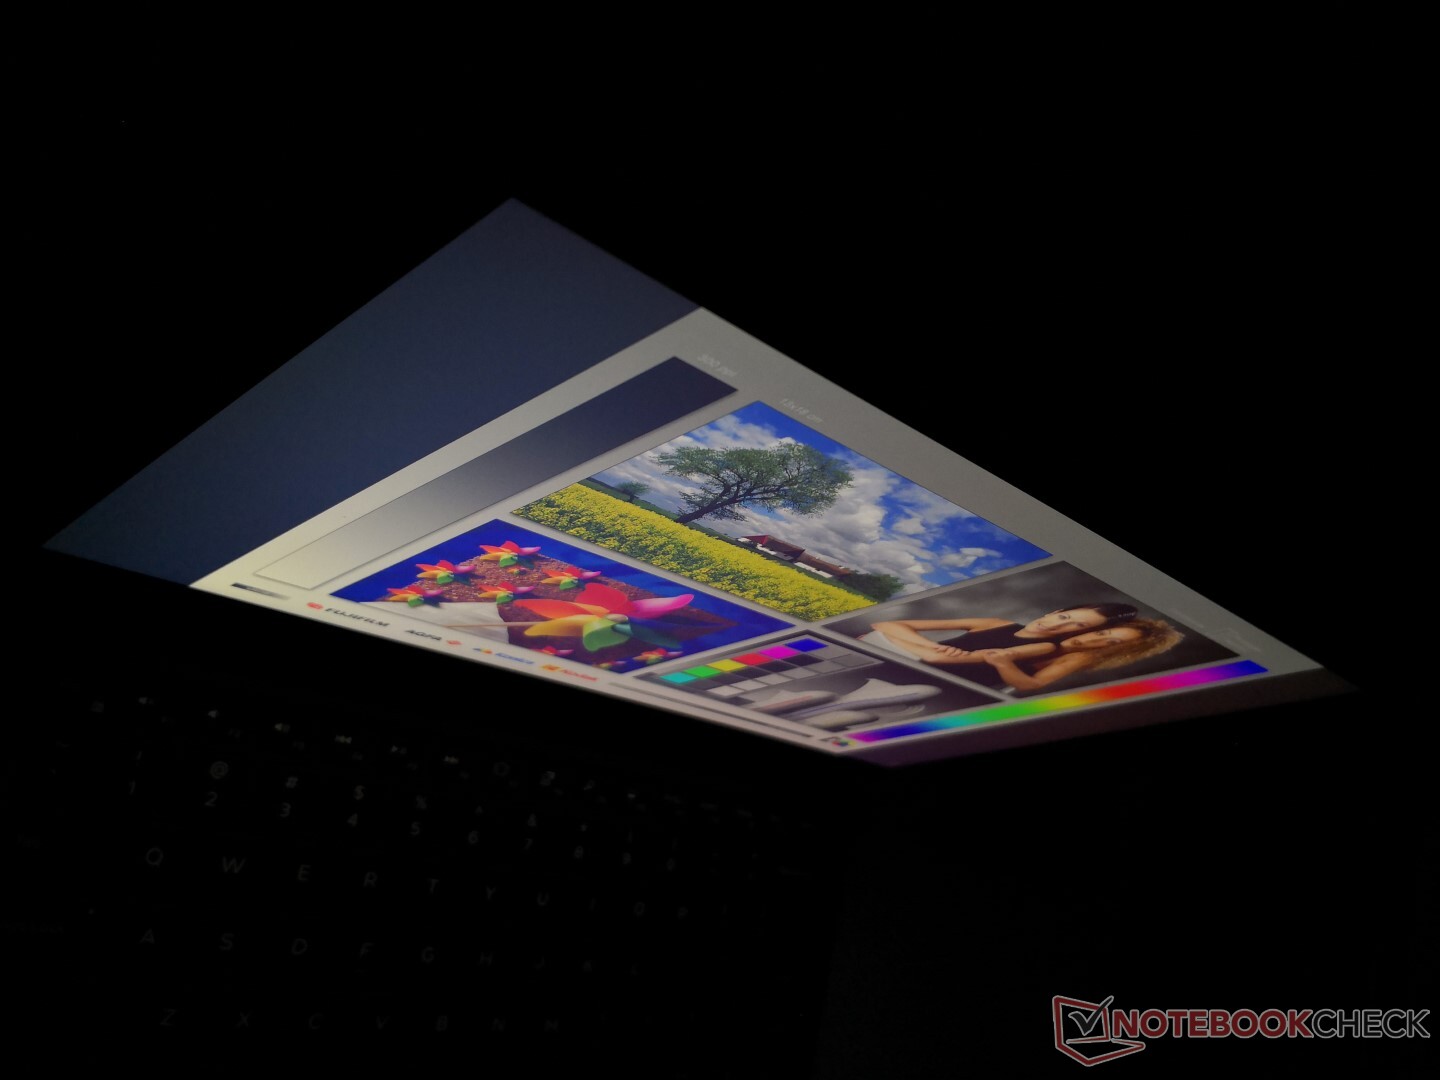
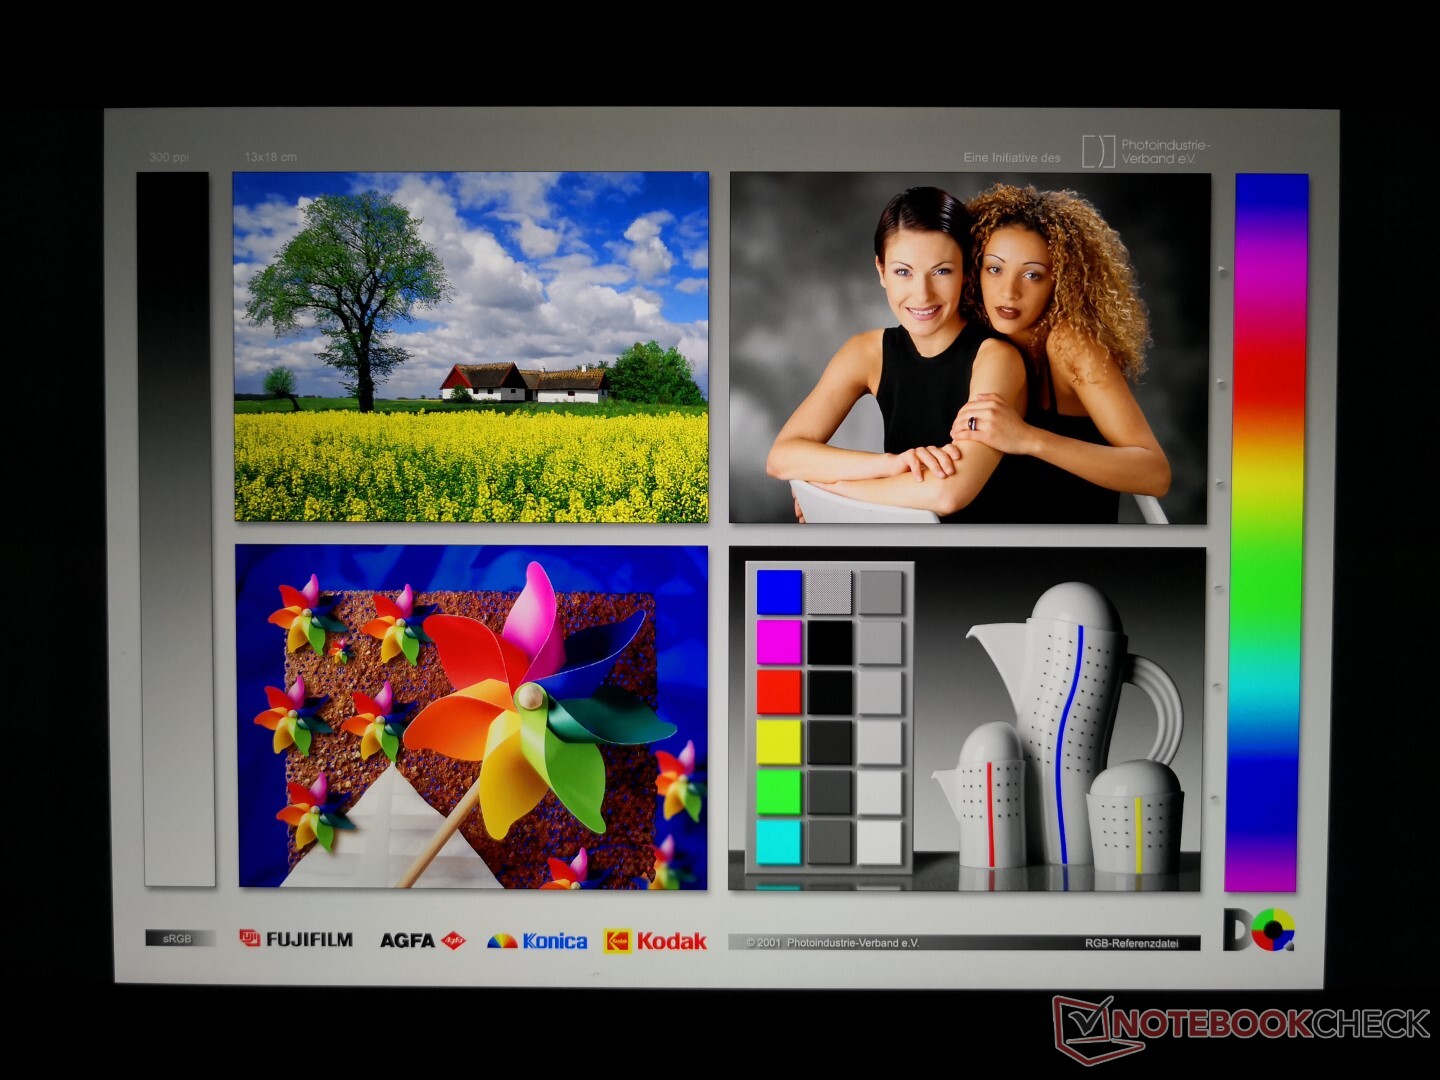
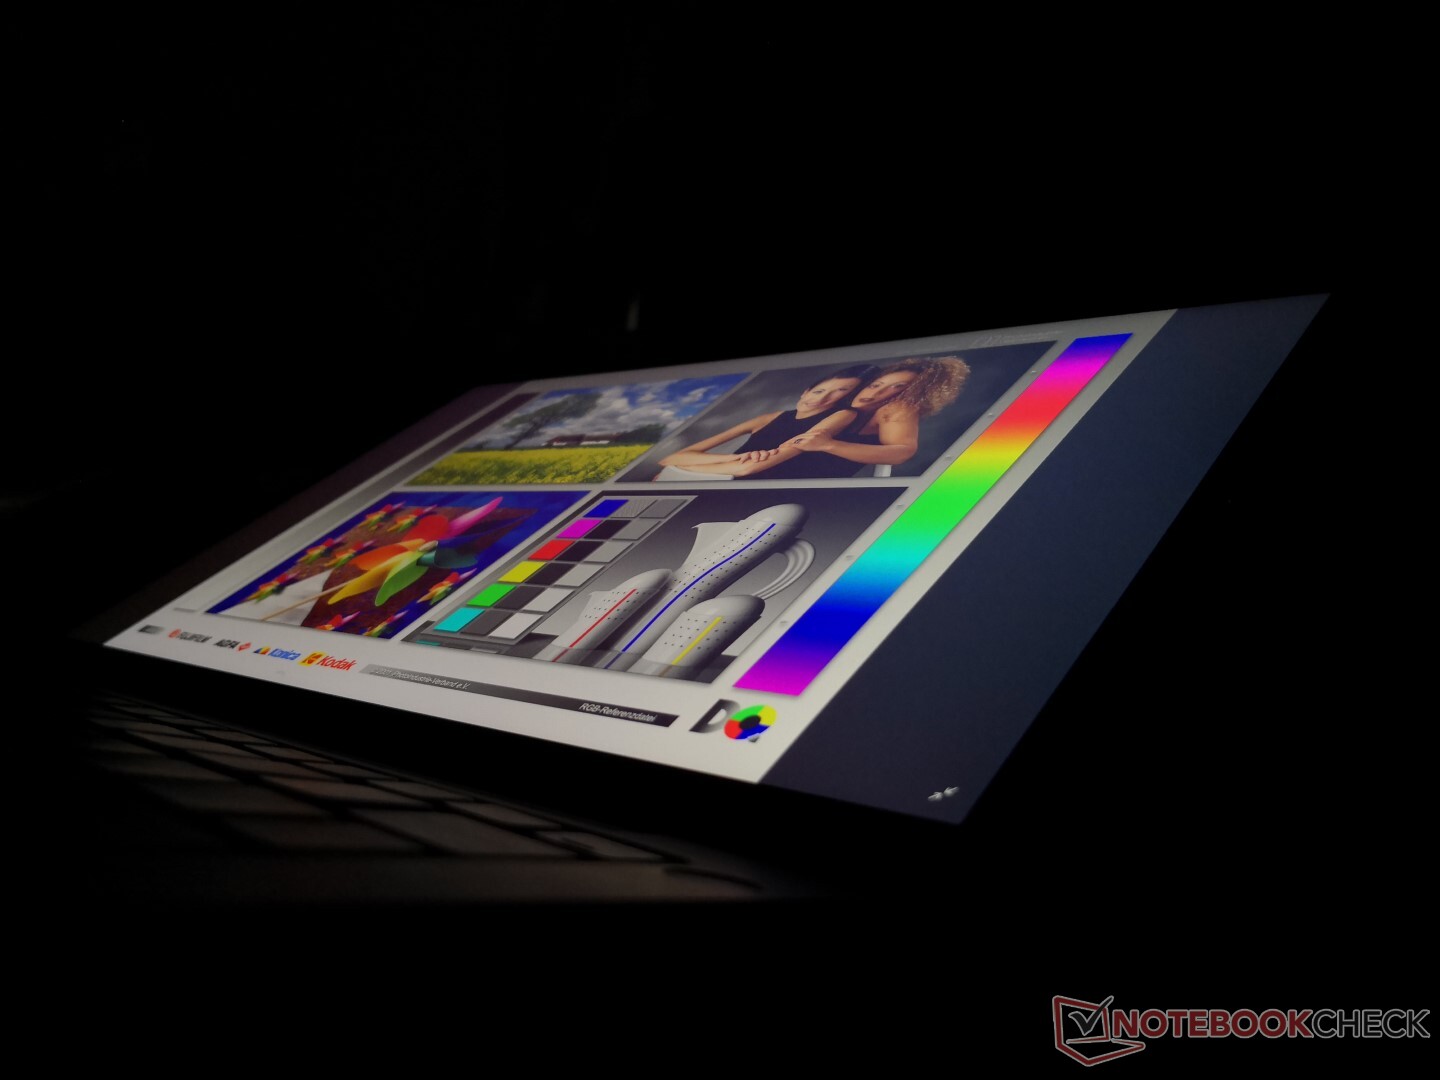
Dell has equipped our Comet Lake-U unit with the same 4K UHD AU Optronics B133ZAN IPS panel as found on the XPS 13 9380 series. Thus, innate characteristics like color coverage, response times, and contrast ratios are almost the same between them.
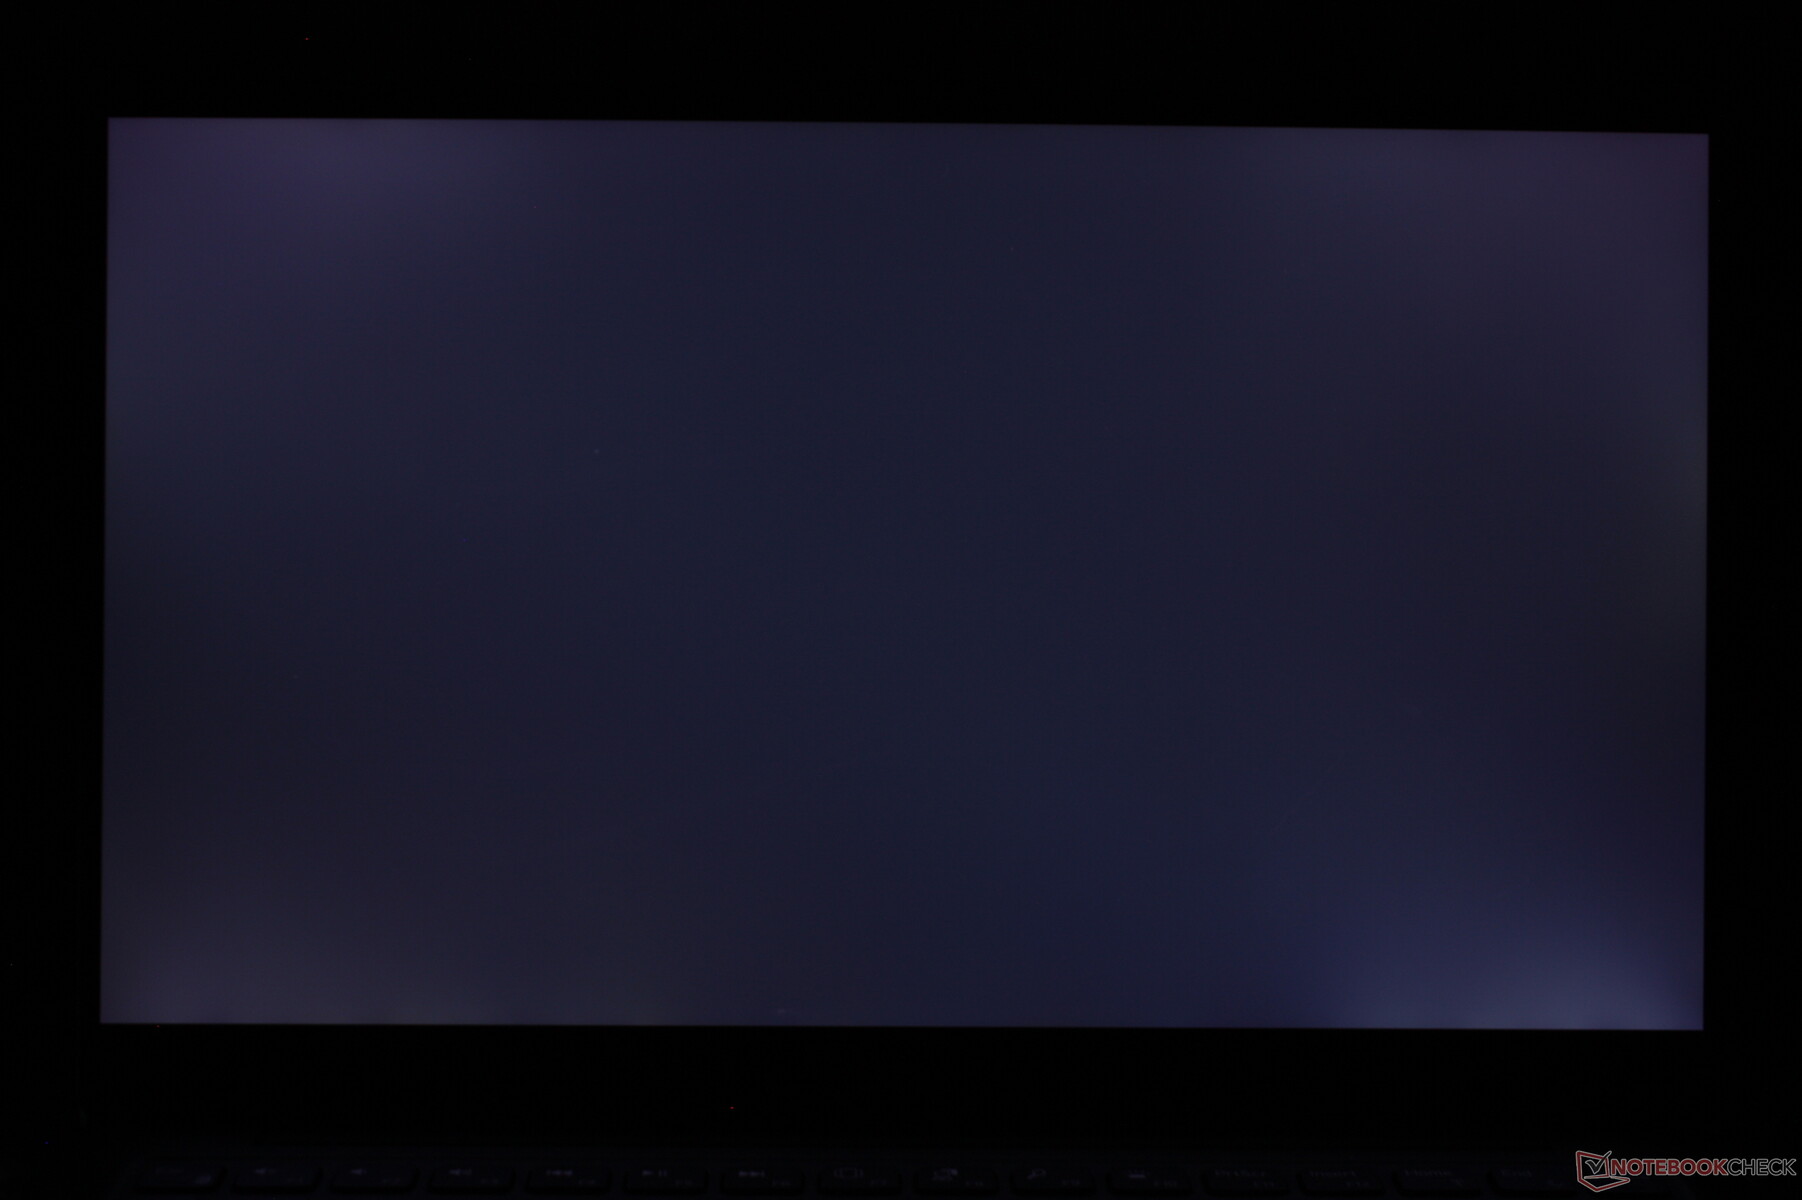
Uneven backlight bleeding, however, is slightly worse this time around. Our picture shows moderate bleeding from the corners of the screen that becomes noticeable when viewing videos with black borders.
Maximum brightness drops to about 300 nits from 400 nits when disconnected from an outlet. Unlike on most other laptops, this power-saving behavior can only be toggled via the XPS 13 BIOS.

| |||||||||||||||||||||||||
Brightness Distribution: 89 %
Center on Battery: 311.7 cd/m²
Contrast: 1047:1 (Black: 0.39 cd/m²)
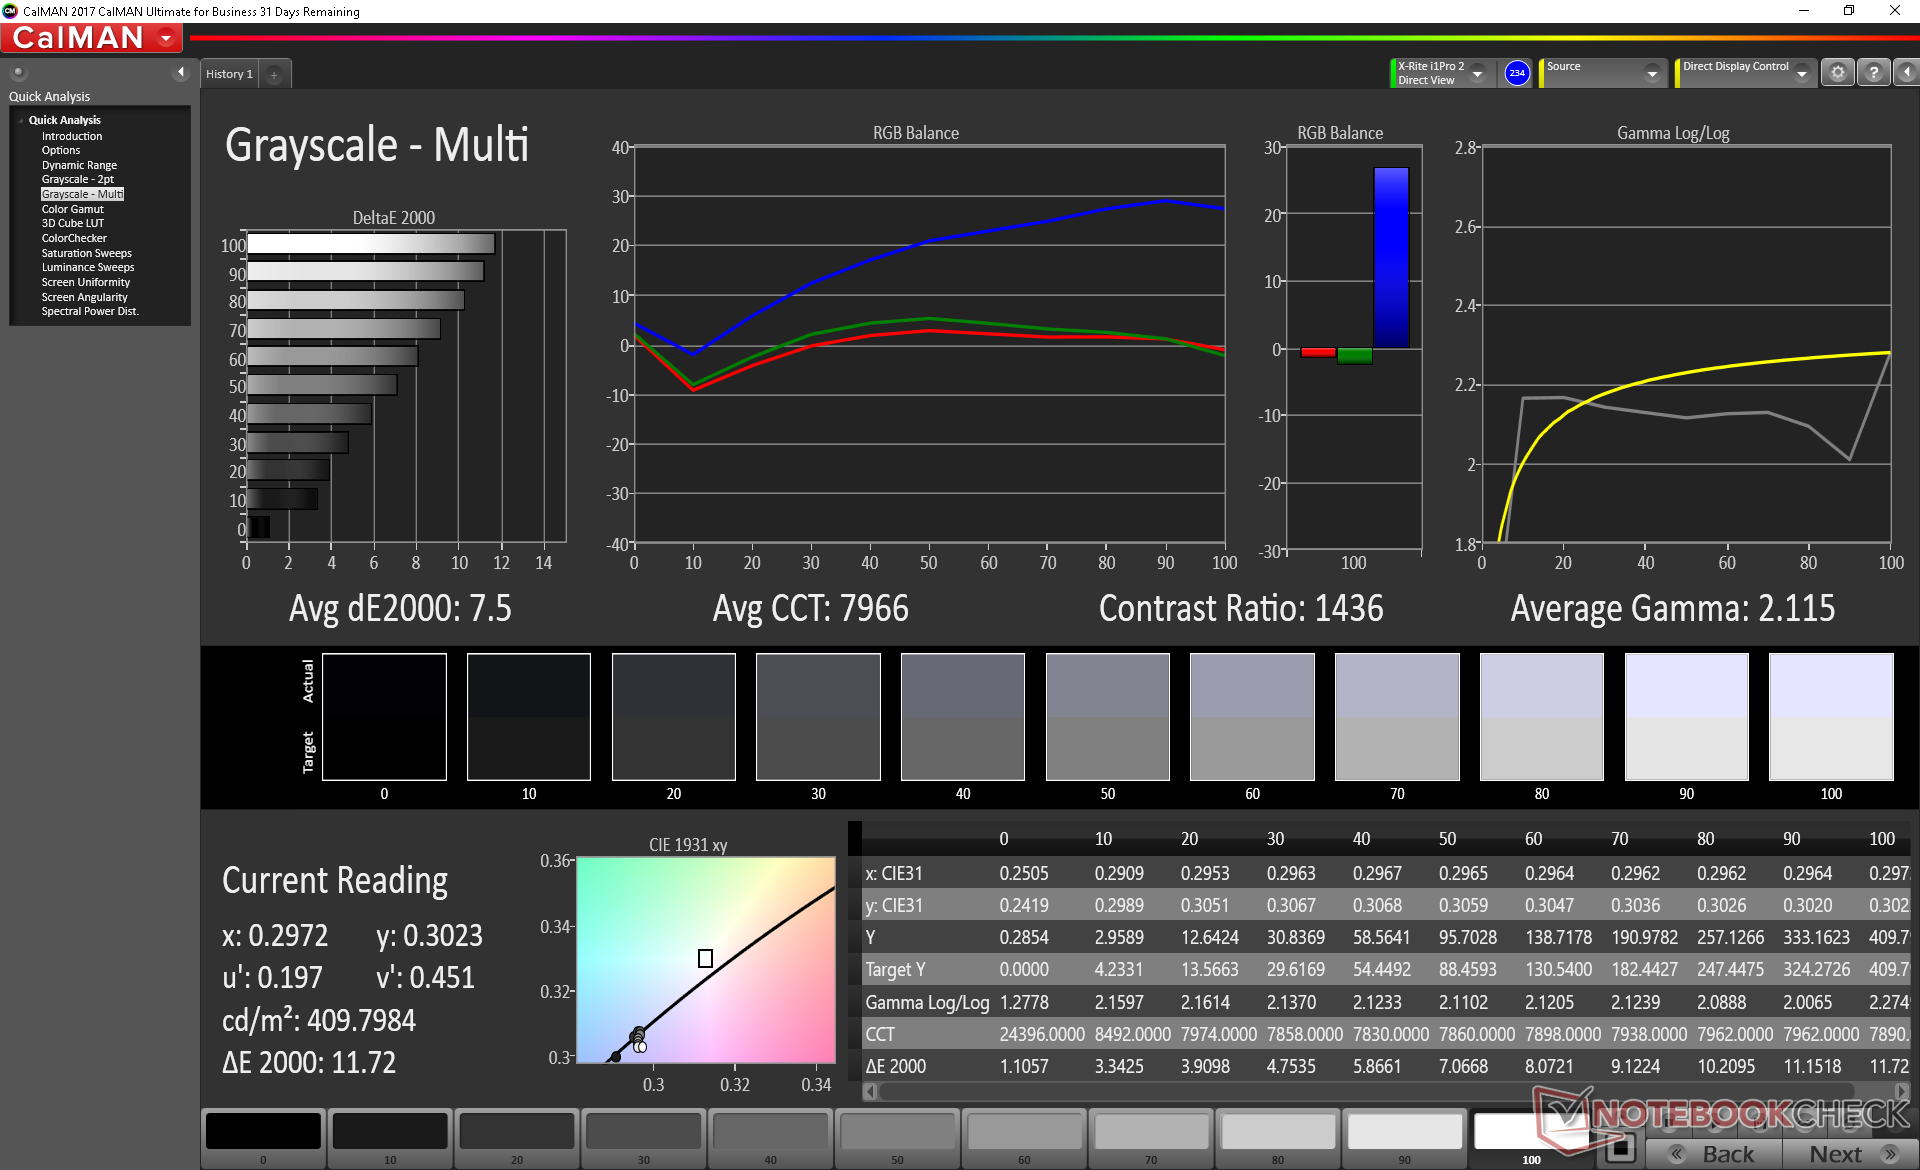
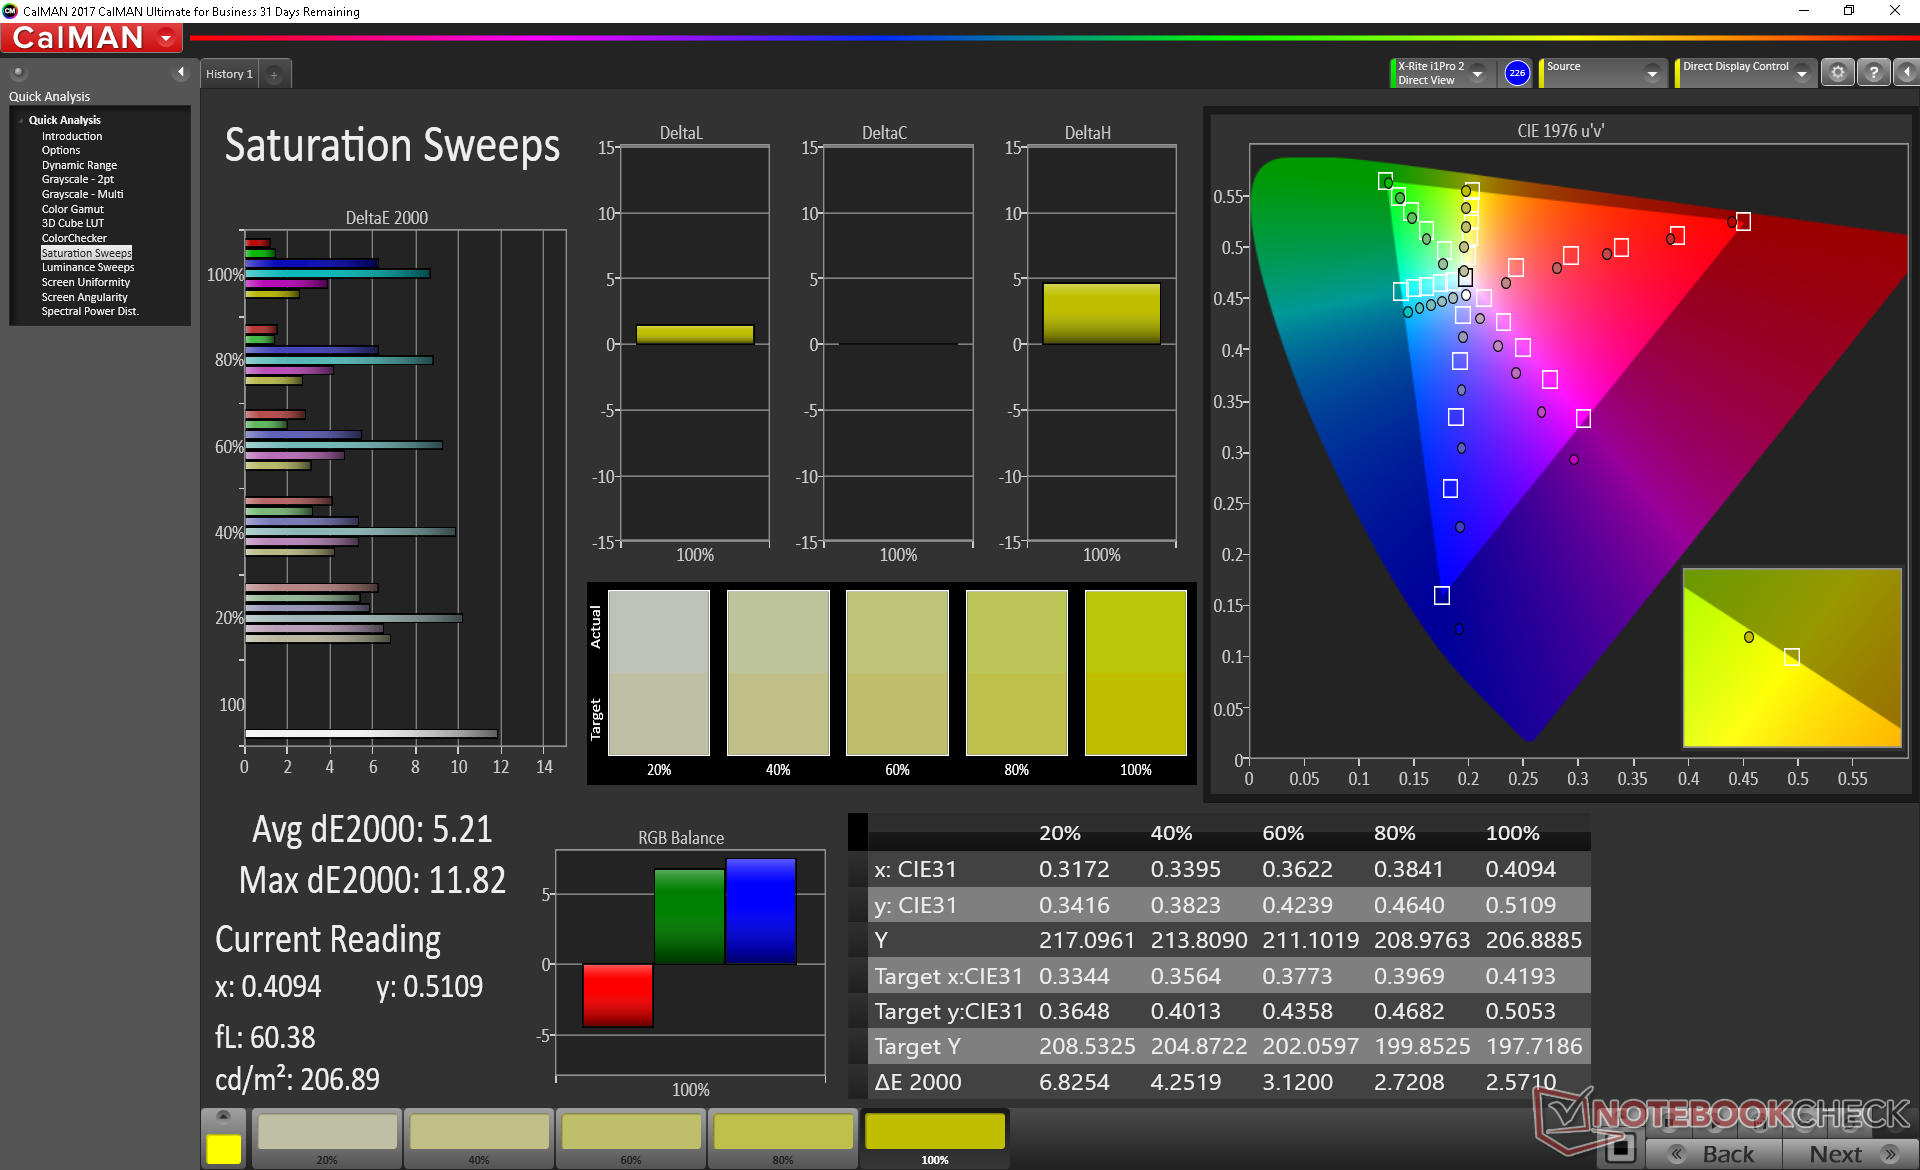
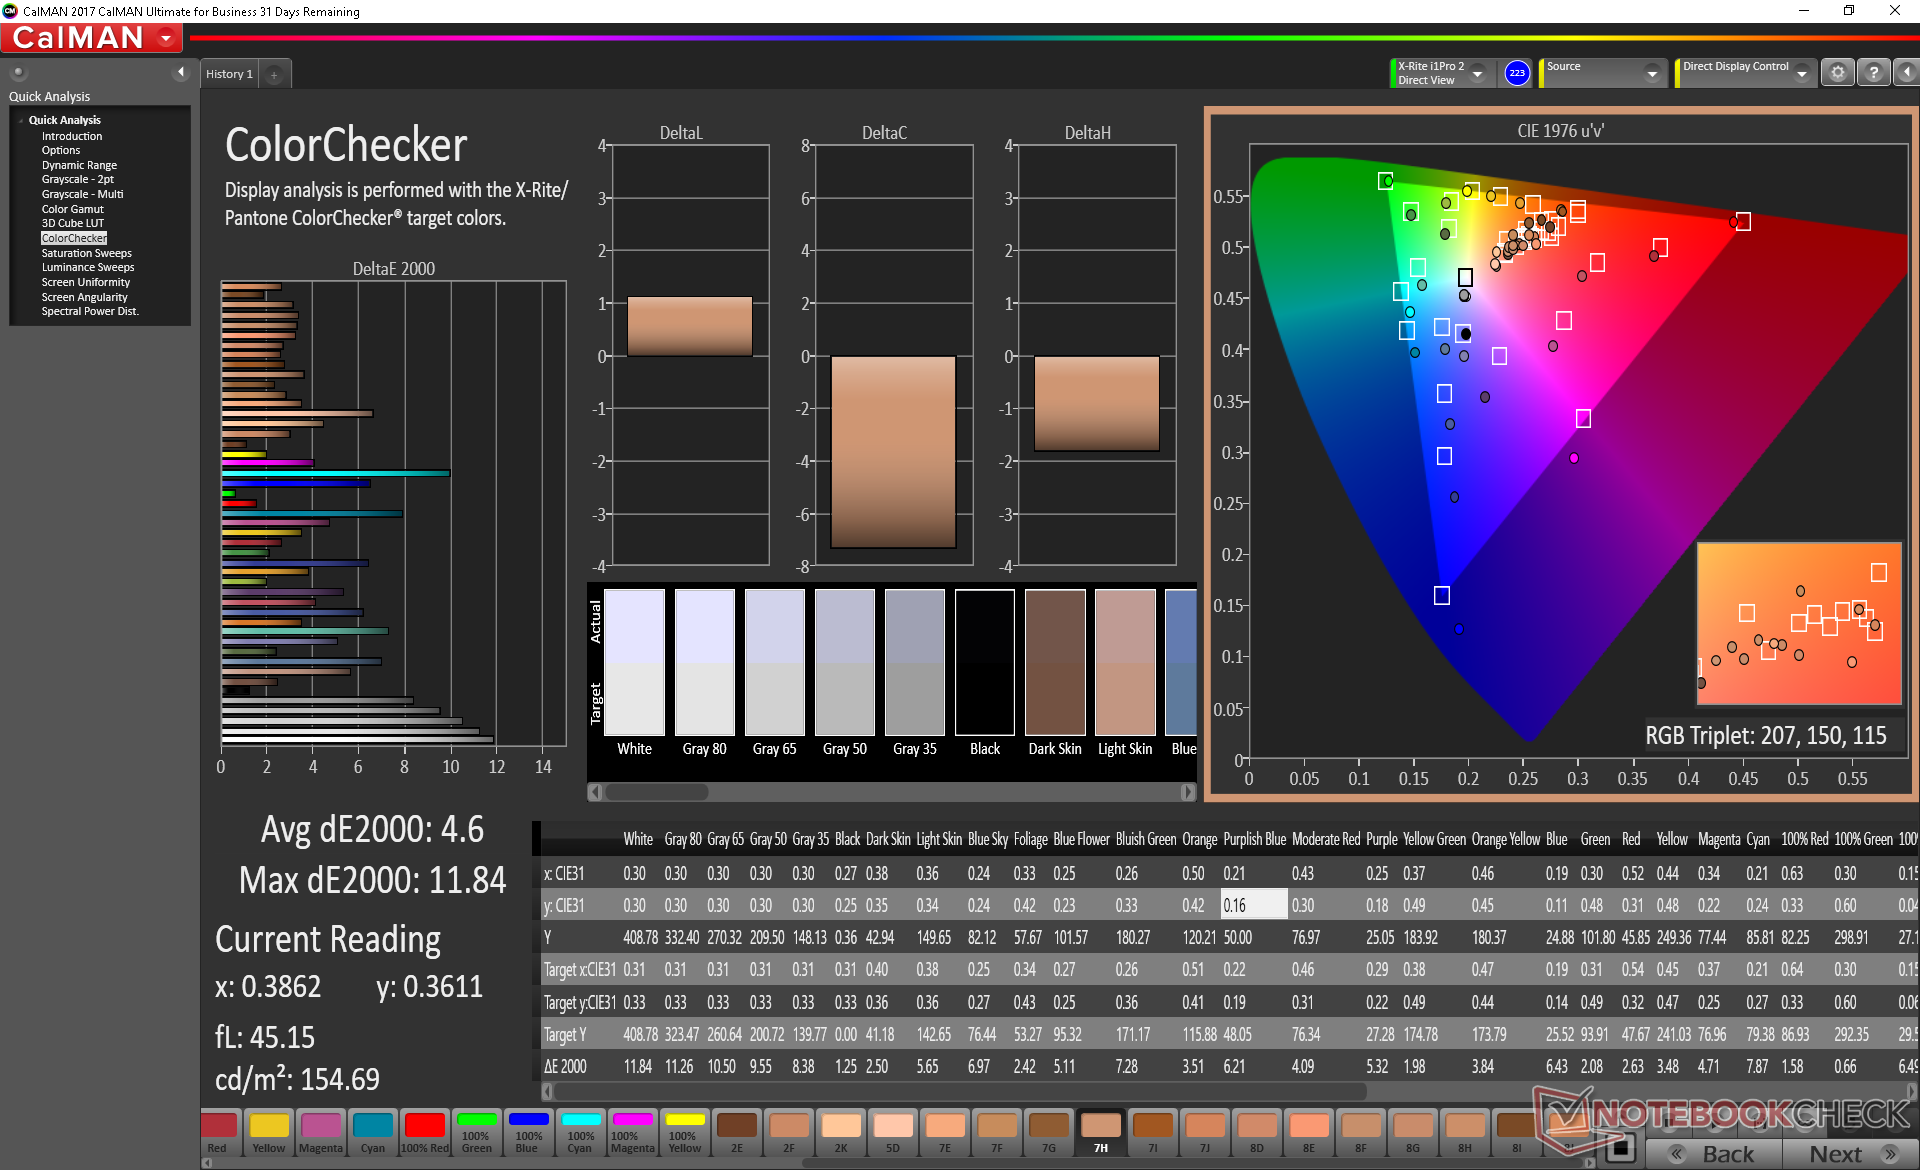
ΔE ColorChecker Calman: 4.6 | ∀{0.5-29.43 Ø4.71}
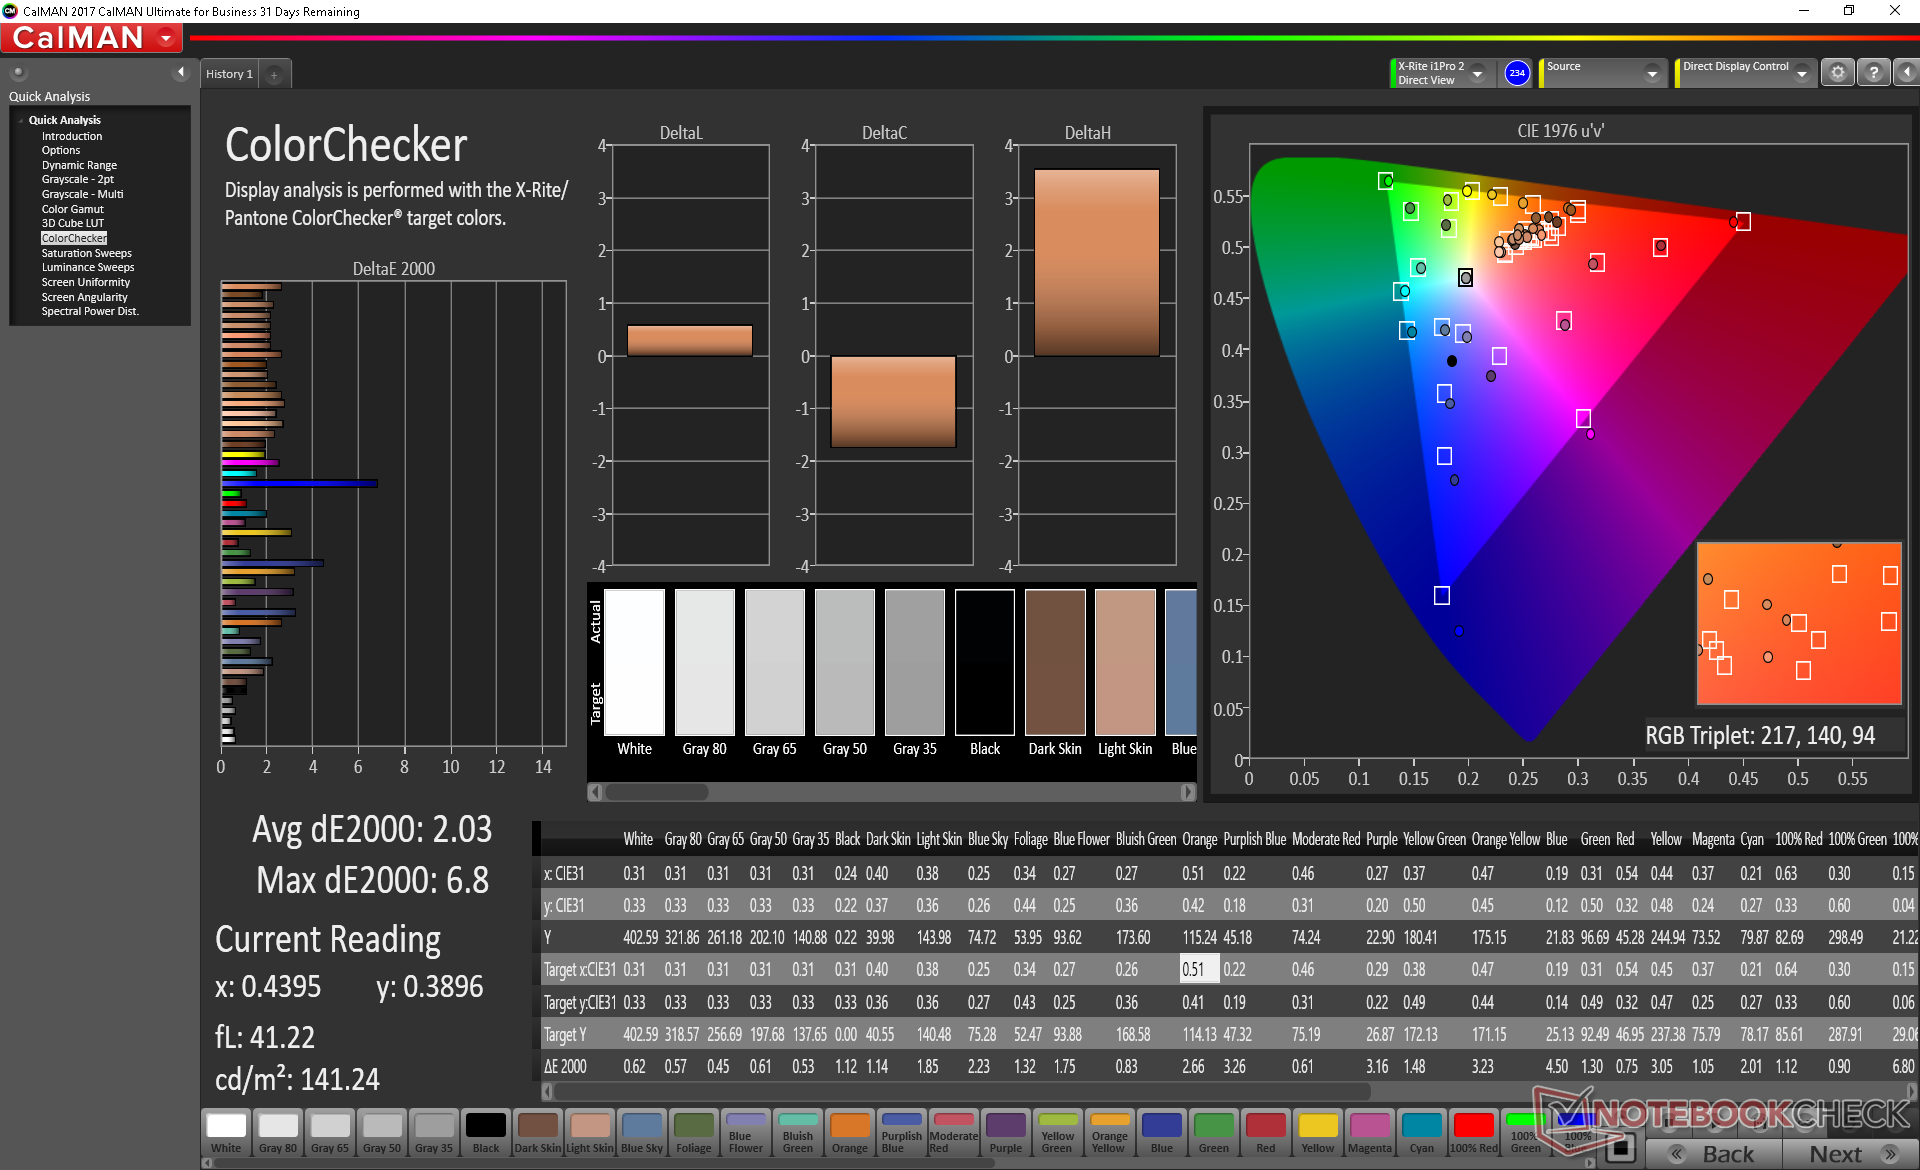
calibrated: 2.03
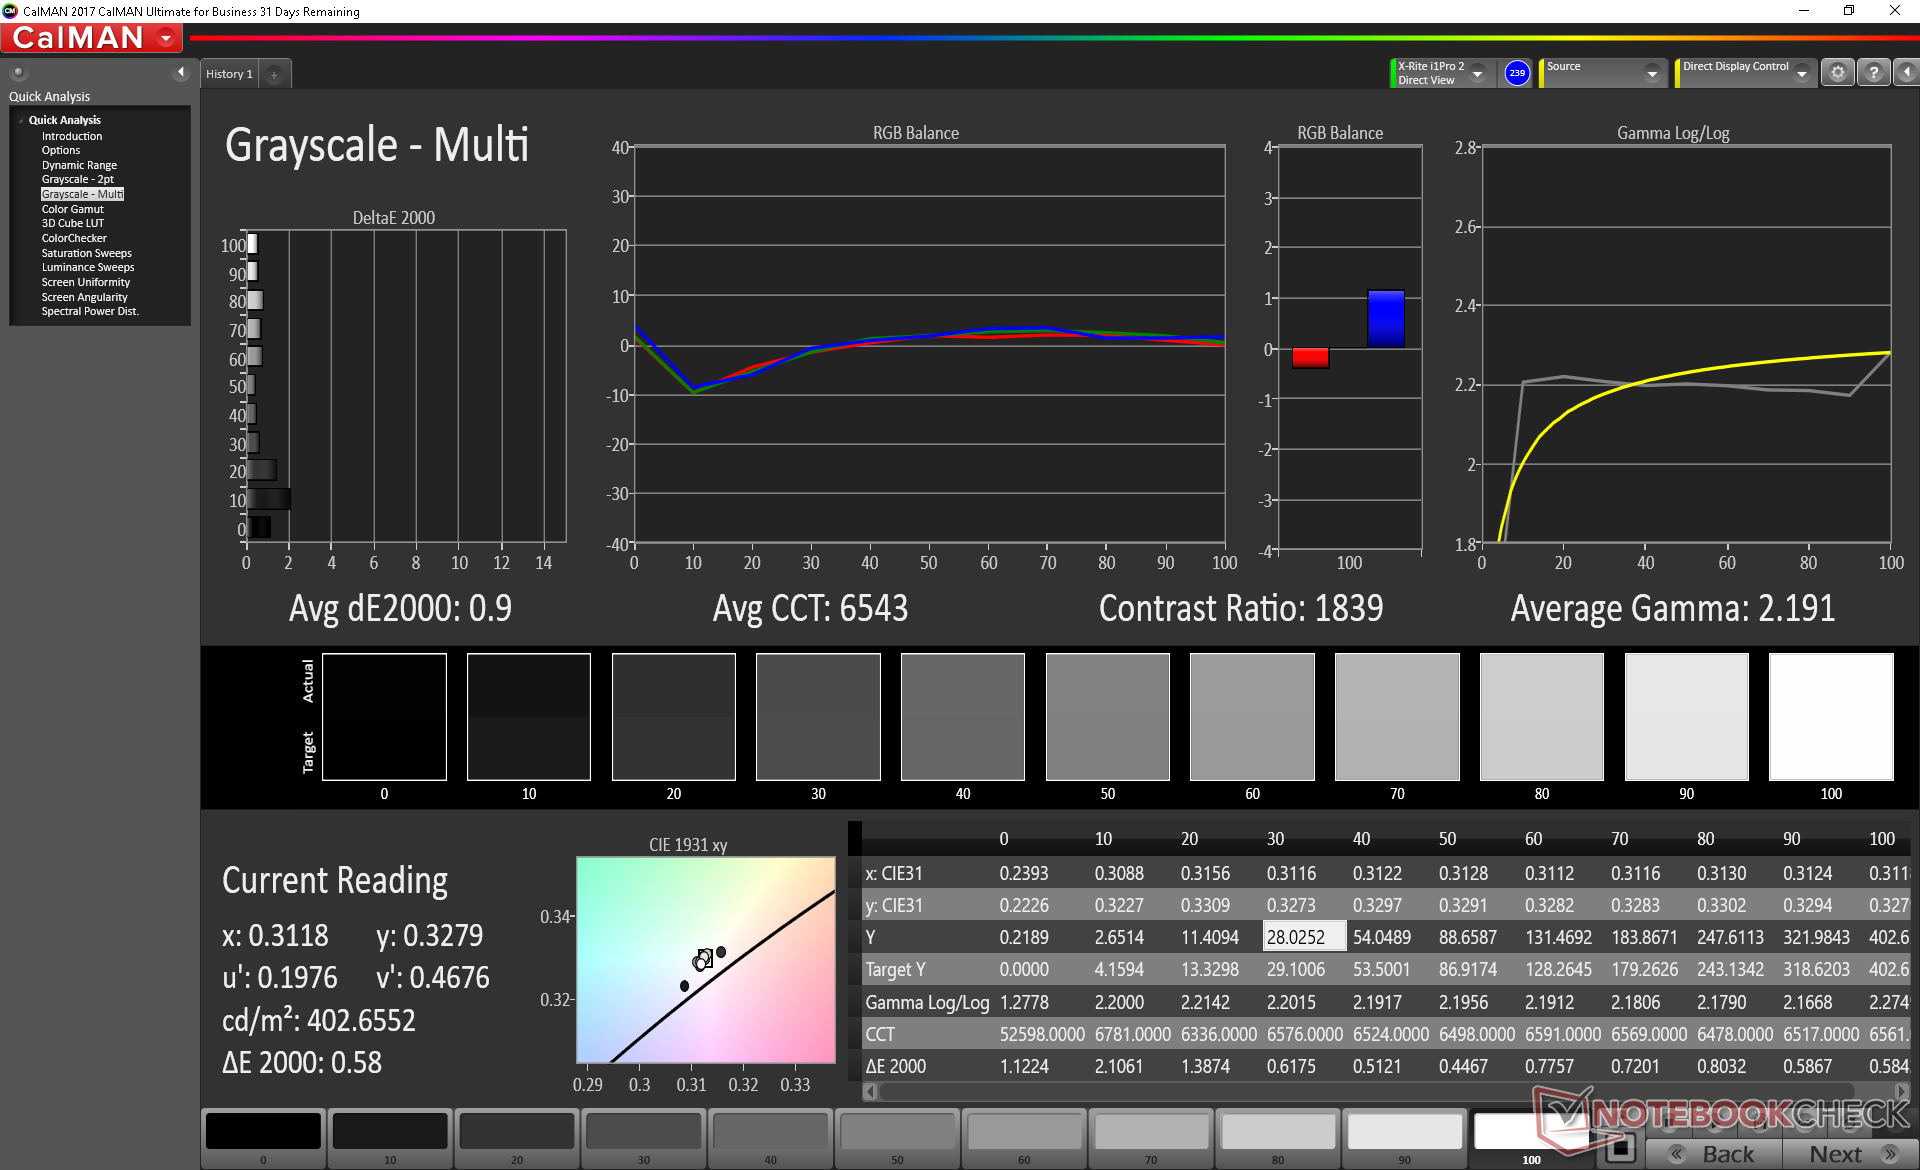
ΔE Greyscale Calman: 7.5 | ∀{0.09-98 Ø4.96}
93.5% sRGB (Argyll 1.6.3 3D)
59.5% AdobeRGB 1998 (Argyll 1.6.3 3D)
64.3% AdobeRGB 1998 (Argyll 3D)
93.7% sRGB (Argyll 3D)
63.4% Display P3 (Argyll 3D)
Gamma: 2.12
CCT: 7966 K
| Dell XPS 13 7390 Core i7-10710U AU Optronics B133ZAN, Dell P/N: 90NTH, IPS, 13.3", 3840x2160 | Dell XPS 13 7390 2-in-1 Core i7 Sharp LQ134N1, IPS, 13.4", 1920x1200 | Dell XPS 13 9380 i7 4K ID: AUO 282B B133ZAN Dell: 90NTH, IPS, 13.3", 3840x2160 | Dell XPS 13 9380 2019 ID: AUO 282B B133ZAN Dell: 90NTH, IPS, 13.3", 3840x2160 | Dell XPS 13 9370 i7 UHD ID: Sharp SHP148B, Name: LQ133D1, Dell P/N: 8XDHY, IPS, 13.3", 3840x2160 | Dell XPS 13 i5-8250U ID: Sharp SHP144A, Name: LQ133Z1, IGZO IPS, 13.3", 3200x1800 | |
|---|---|---|---|---|---|---|
| Display | 9% | 1% | 1% | 7% | 0% | |
| Display P3 Coverage (%) | 63.4 | 69.9 10% | 64.8 2% | 64.7 2% | 68.9 9% | 63.9 1% |
| sRGB Coverage (%) | 93.7 | 99.2 6% | 93.6 0% | 93.1 -1% | 98.4 5% | 91.7 -2% |
| AdobeRGB 1998 Coverage (%) | 64.3 | 71.5 11% | 65.8 2% | 65.3 2% | 69.5 8% | 65.7 2% |
| Response Times | 11% | -20% | -10% | -33% | 28% | |
| Response Time Grey 50% / Grey 80% * (ms) | 51.6 ? | 47.6 ? 8% | 64.8 ? -26% | 58 ? -12% | 69.6 ? -35% | 29 ? 44% |
| Response Time Black / White * (ms) | 33.6 ? | 29.2 ? 13% | 38 ? -13% | 36 ? -7% | 44 ? -31% | 30 ? 11% |
| PWM Frequency (Hz) | 2500 ? | 3759 ? | 19500 ? | |||
| Screen | 30% | 21% | 9% | 18% | 1% | |
| Brightness middle (cd/m²) | 408.2 | 549.8 35% | 428.3 5% | 404 -1% | 478.5 17% | 361 -12% |
| Brightness (cd/m²) | 399 | 520 30% | 414 4% | 389 -3% | 466 17% | 303 -24% |
| Brightness Distribution (%) | 89 | 86 -3% | 88 -1% | 85 -4% | 86 -3% | 72 -19% |
| Black Level * (cd/m²) | 0.39 | 0.39 -0% | 0.27 31% | 0.37 5% | 0.43 -10% | 0.33 15% |
| Contrast (:1) | 1047 | 1410 35% | 1586 51% | 1092 4% | 1113 6% | 1094 4% |
| Colorchecker dE 2000 * | 4.6 | 2.12 54% | 2.69 42% | 3.72 19% | 3.09 33% | 5.26 -14% |
| Colorchecker dE 2000 max. * | 11.84 | 3.66 69% | 6.19 48% | 7.38 38% | 5.94 50% | 7.79 34% |
| Colorchecker dE 2000 calibrated * | 2.03 | 1.37 33% | 2.01 1% | 2.06 -1% | 2.06 -1% | |
| Greyscale dE 2000 * | 7.5 | 2.6 65% | 3.7 51% | 4.44 41% | 2.4 68% | 5.69 24% |
| Gamma | 2.12 104% | 2.3 96% | 2.1 105% | 2.34 94% | 2.063 107% | 1.63 135% |
| CCT | 7966 82% | 6884 94% | 6706 97% | 7095 92% | 6883 94% | 6499 100% |
| Color Space (Percent of AdobeRGB 1998) (%) | 59.5 | 65.4 10% | 60.4 2% | 60 1% | 69.47 17% | 59 -1% |
| Color Space (Percent of sRGB) (%) | 93.5 | 99.7 7% | 93.5 0% | 93 -1% | 98.36 5% | 92 -2% |
| Total Average (Program / Settings) | 17% /
24% | 1% /
12% | 0% /
5% | -3% /
10% | 10% /
4% |
* ... smaller is better
Display Response Times
| ↔ Response Time Black to White | ||
|---|---|---|
| 33.6 ms ... rise ↗ and fall ↘ combined | ↗ 17.2 ms rise | 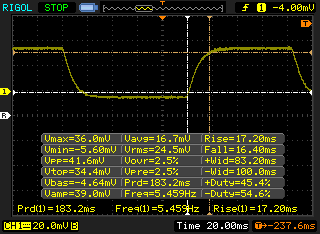 |
| ↘ 16.4 ms fall | ||
| The screen shows slow response rates in our tests and will be unsatisfactory for gamers. In comparison, all tested devices range from 0.1 (minimum) to 240 (maximum) ms. » 90 % of all devices are better. This means that the measured response time is worse than the average of all tested devices (19.8 ms). | ||
| ↔ Response Time 50% Grey to 80% Grey | ||
| 51.6 ms ... rise ↗ and fall ↘ combined | ↗ 26.4 ms rise | 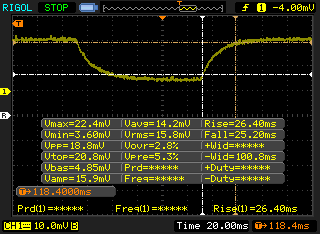 |
| ↘ 25.2 ms fall | ||
| The screen shows slow response rates in our tests and will be unsatisfactory for gamers. In comparison, all tested devices range from 0.165 (minimum) to 636 (maximum) ms. » 88 % of all devices are better. This means that the measured response time is worse than the average of all tested devices (30.9 ms). | ||
Screen Flickering / PWM (Pulse-Width Modulation)
| Screen flickering / PWM not detected | 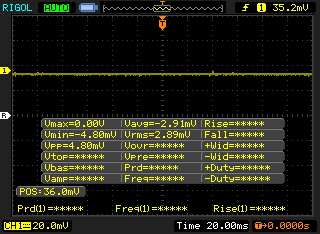 | ||
In comparison: 52 % of all tested devices do not use PWM to dim the display. If PWM was detected, an average of 7744 (minimum: 5 - maximum: 343500) Hz was measured. | |||
Performance
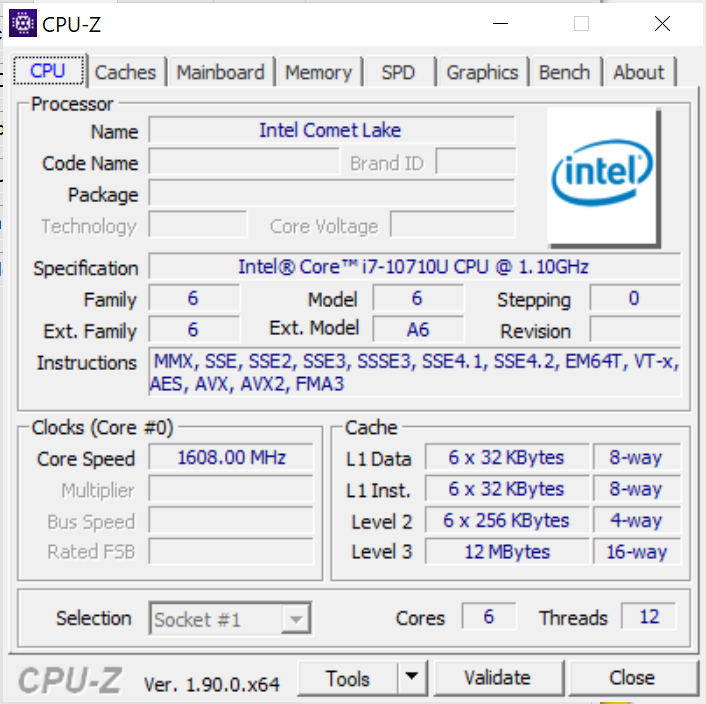
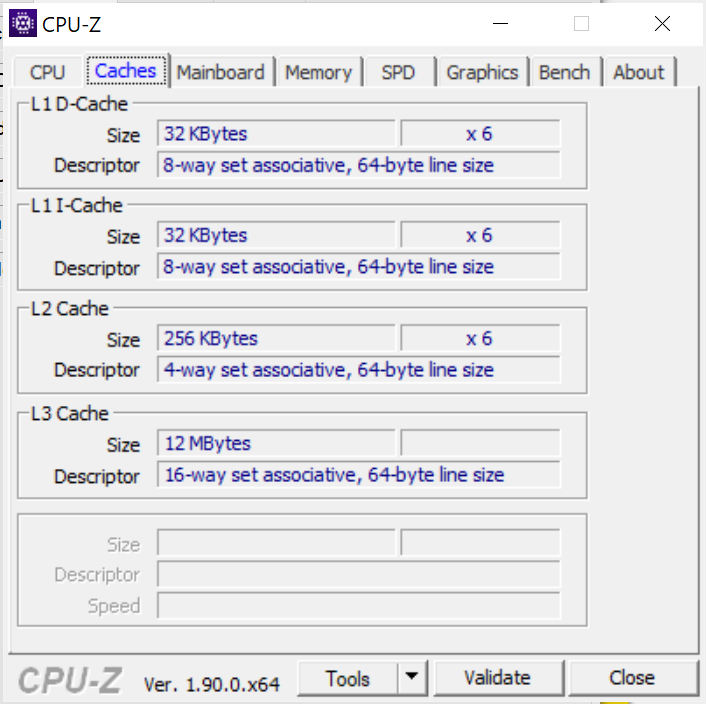
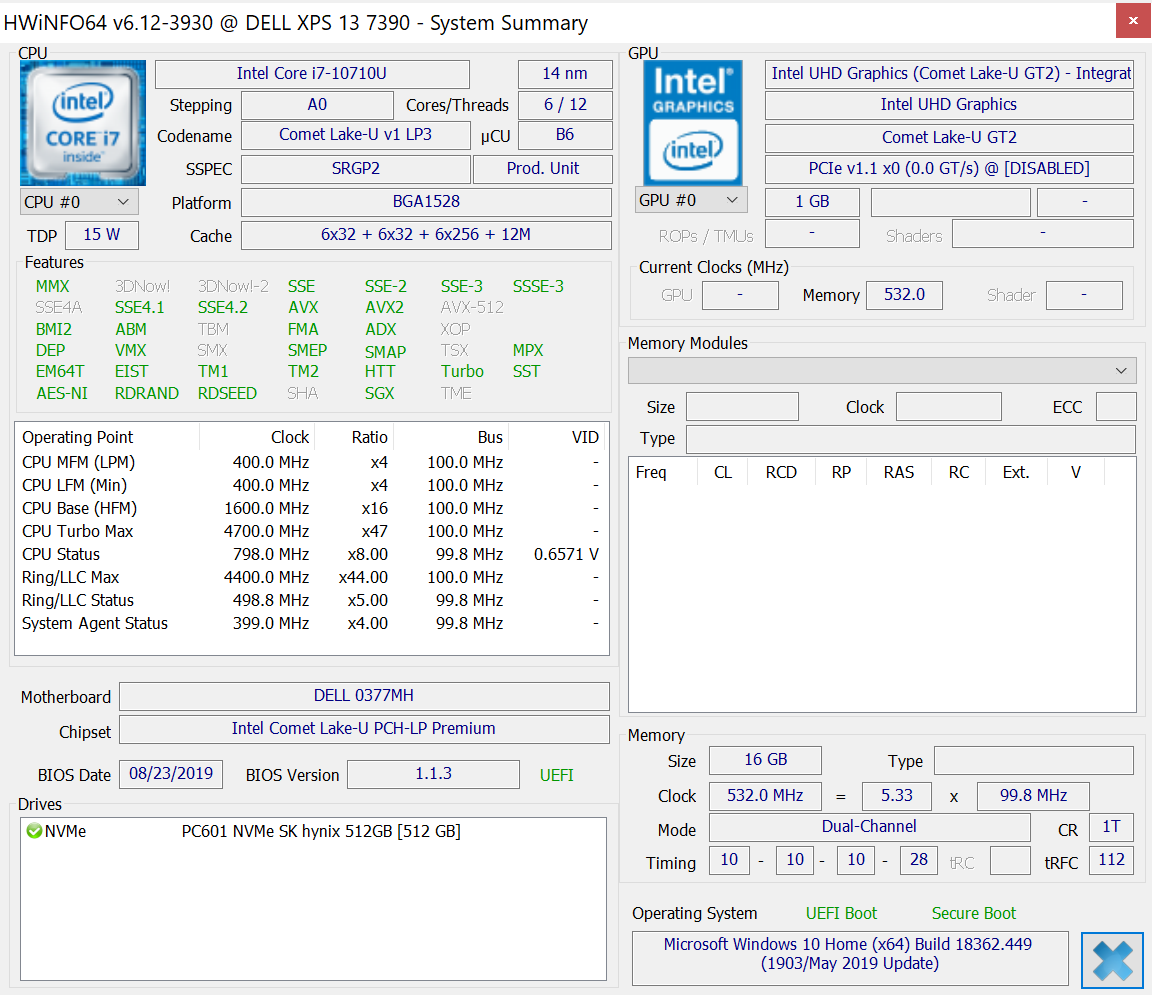
Much like the jump from dual-core Kaby Lake to quad-core Kaby Lake-R, the hexa-core Comet Lake-U adds two more physical cores for a total of 12 threads under the same 15 W to 25 W power envelope. Intel has even managed to up the single-core Turbo Boost frequency every-so-slightly from 4.6 GHz on the Core i7-8565U to 4.7 GHz on the Core i7-10710U. Note that only the Core i7 SKU is hexa-core as the lesser Core i5-10210U Comet Lake-U option is quad-core.
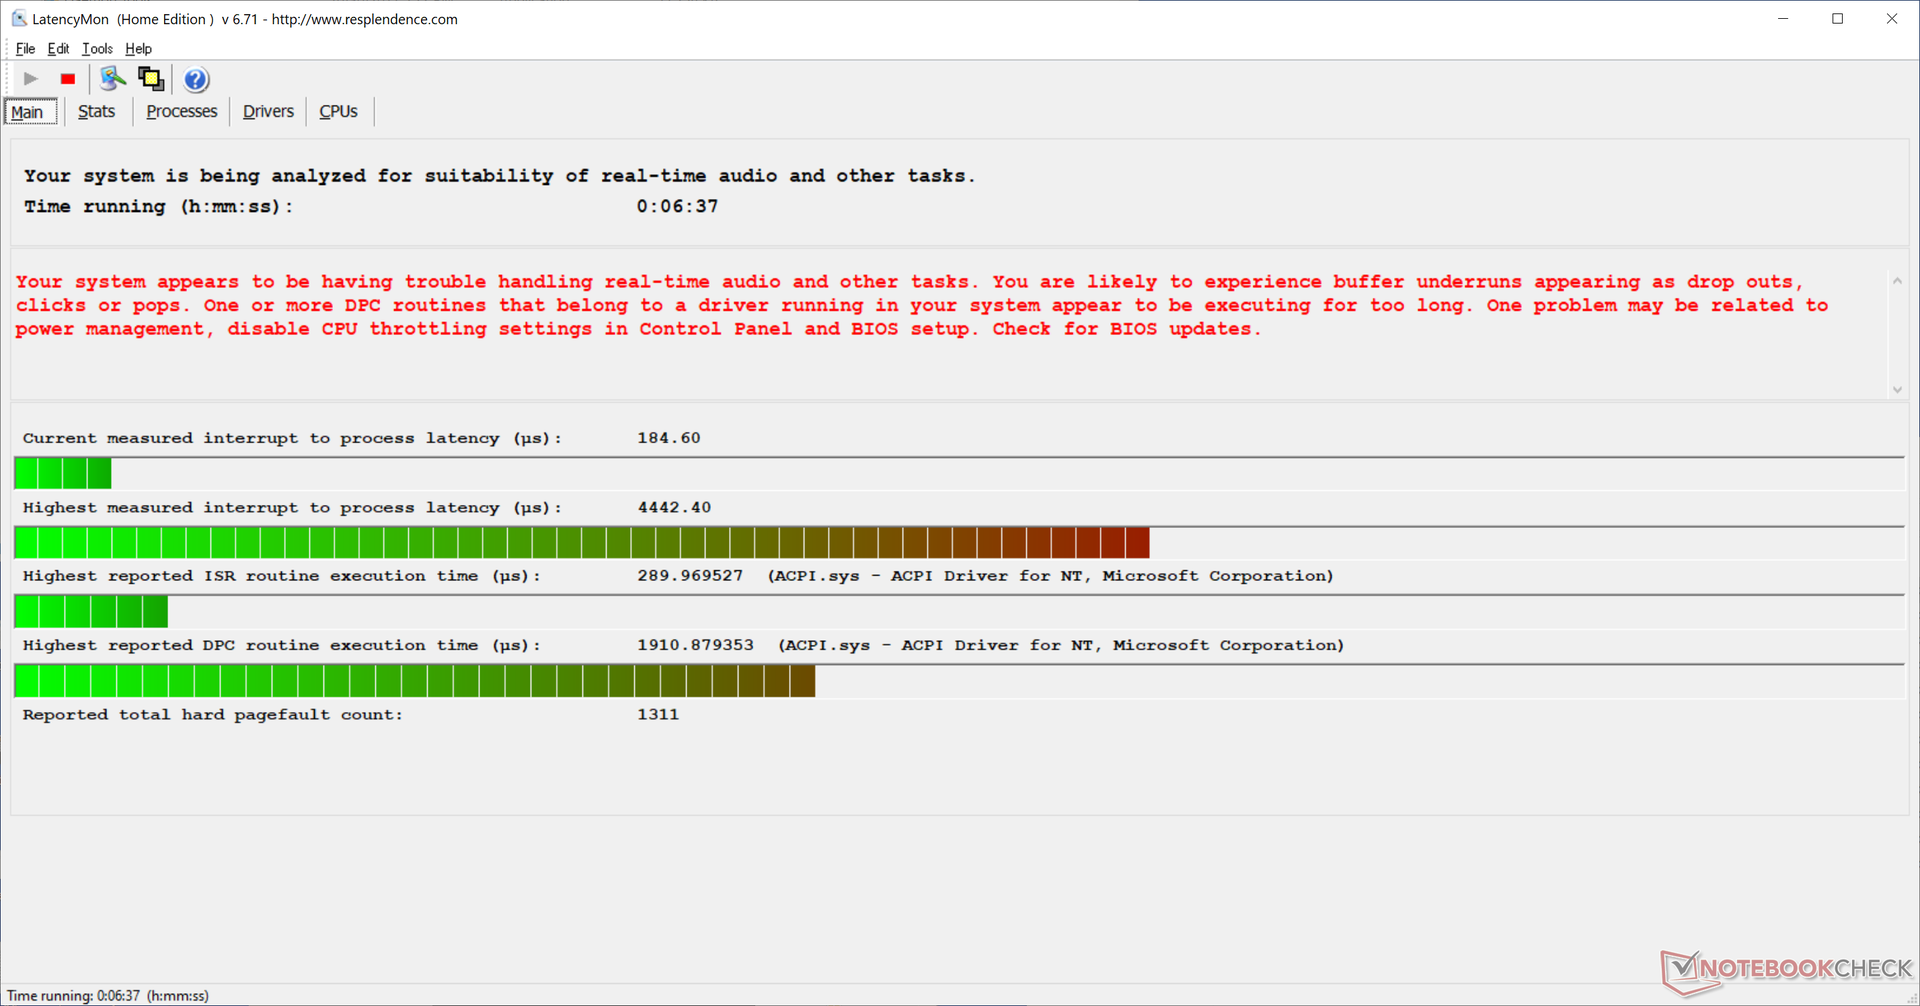
As expected, the XPS 13 still suffers from DPC latency issues just like many of its older siblings.
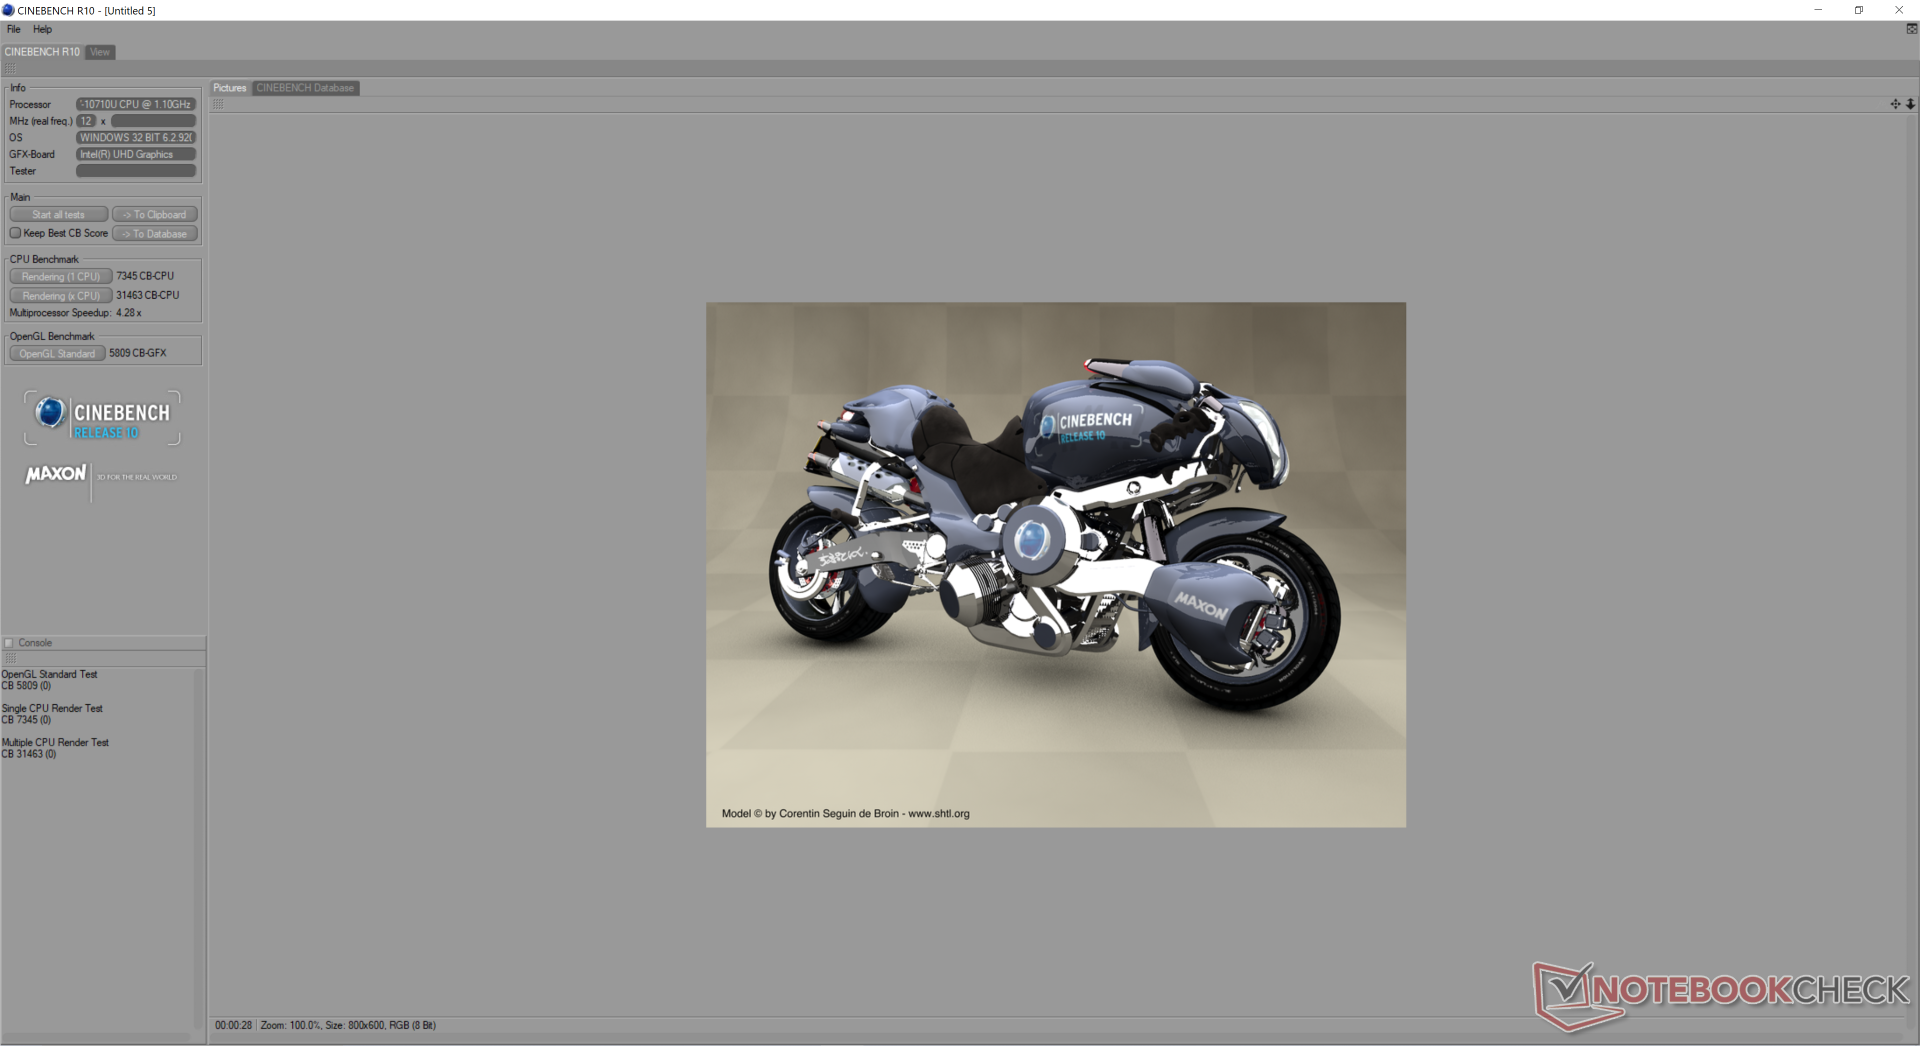
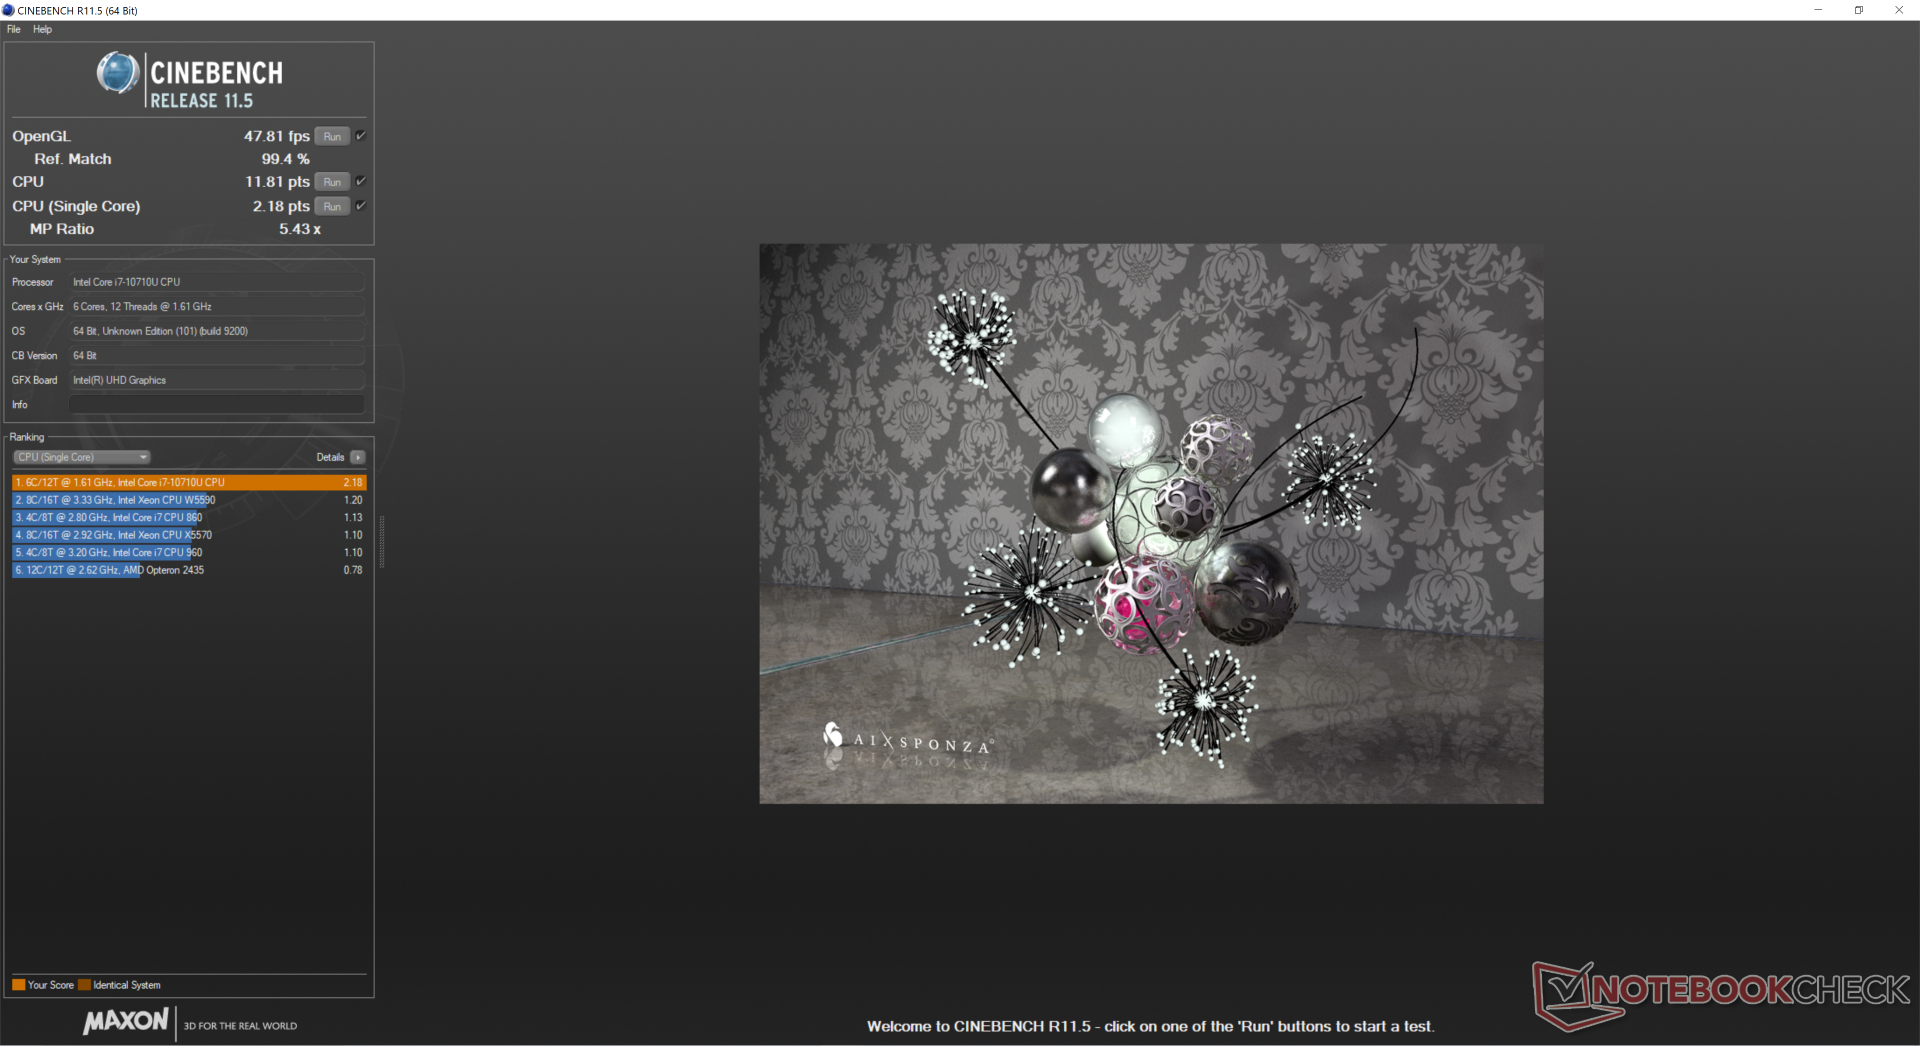
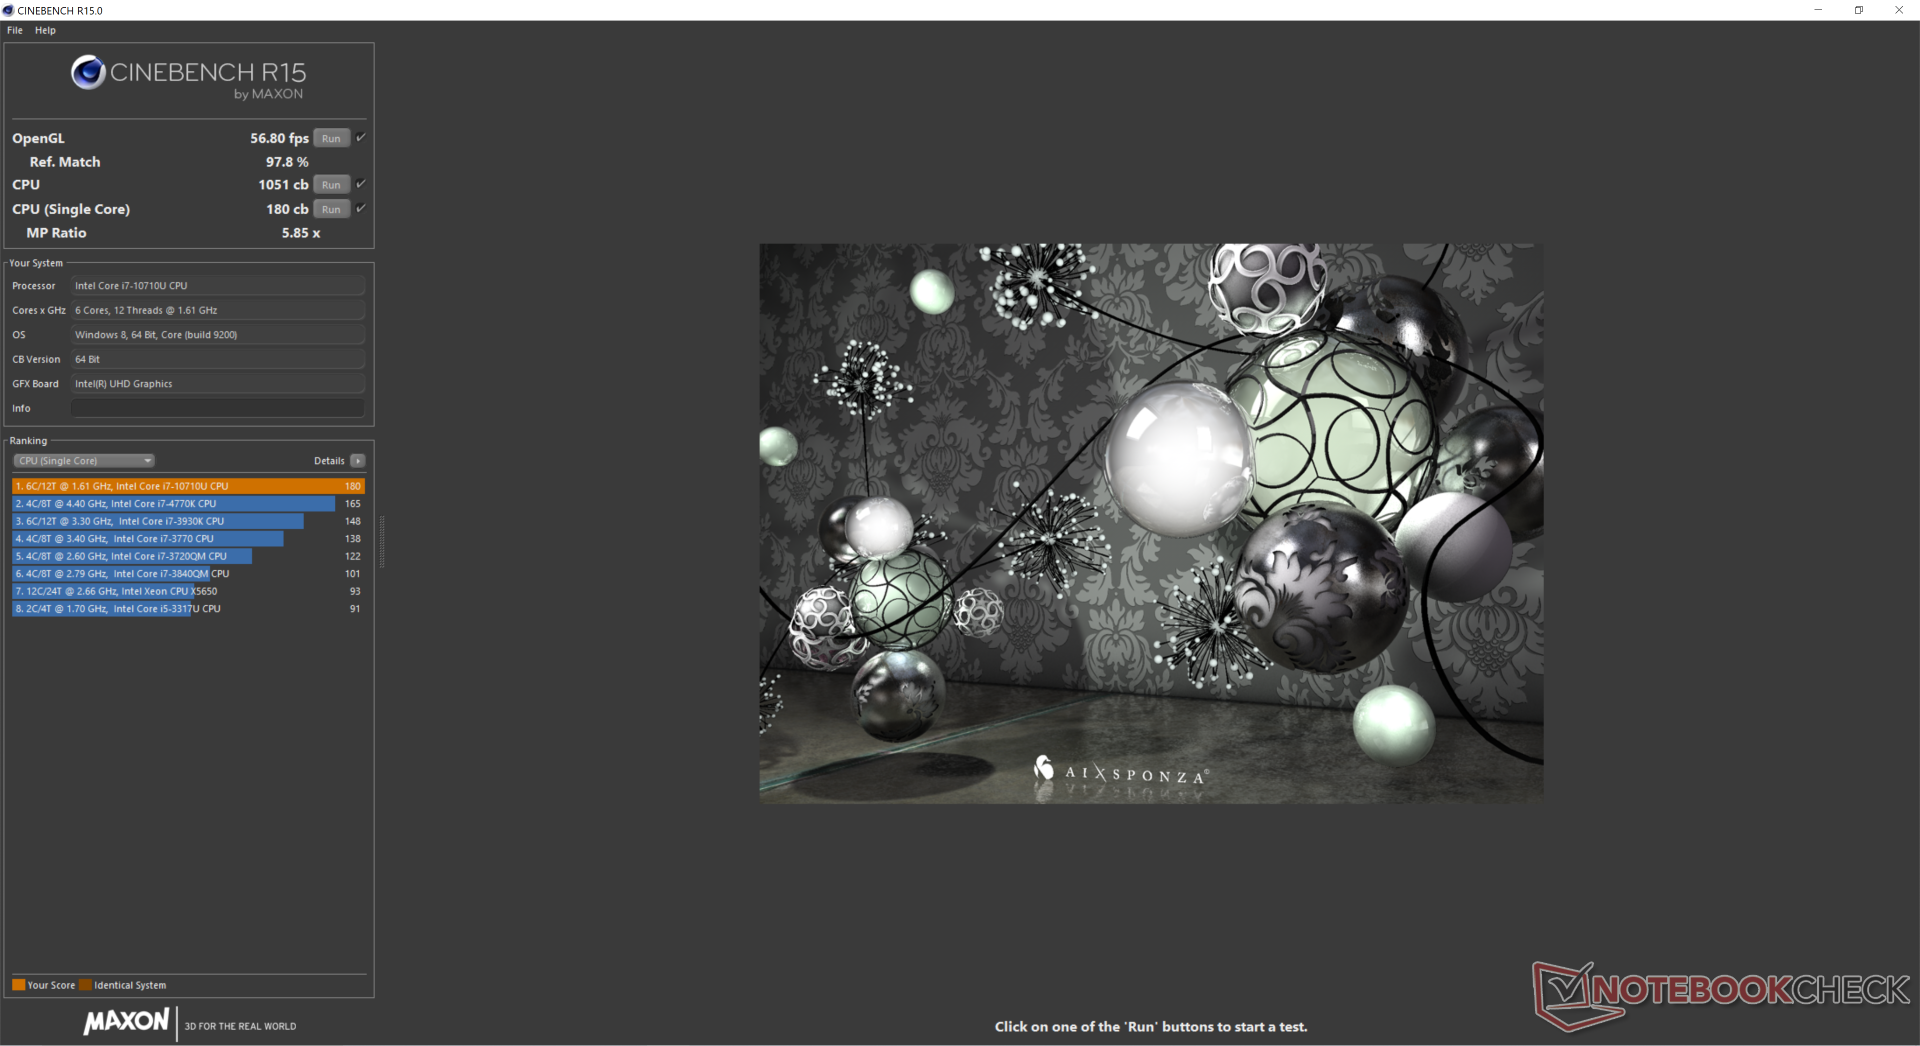
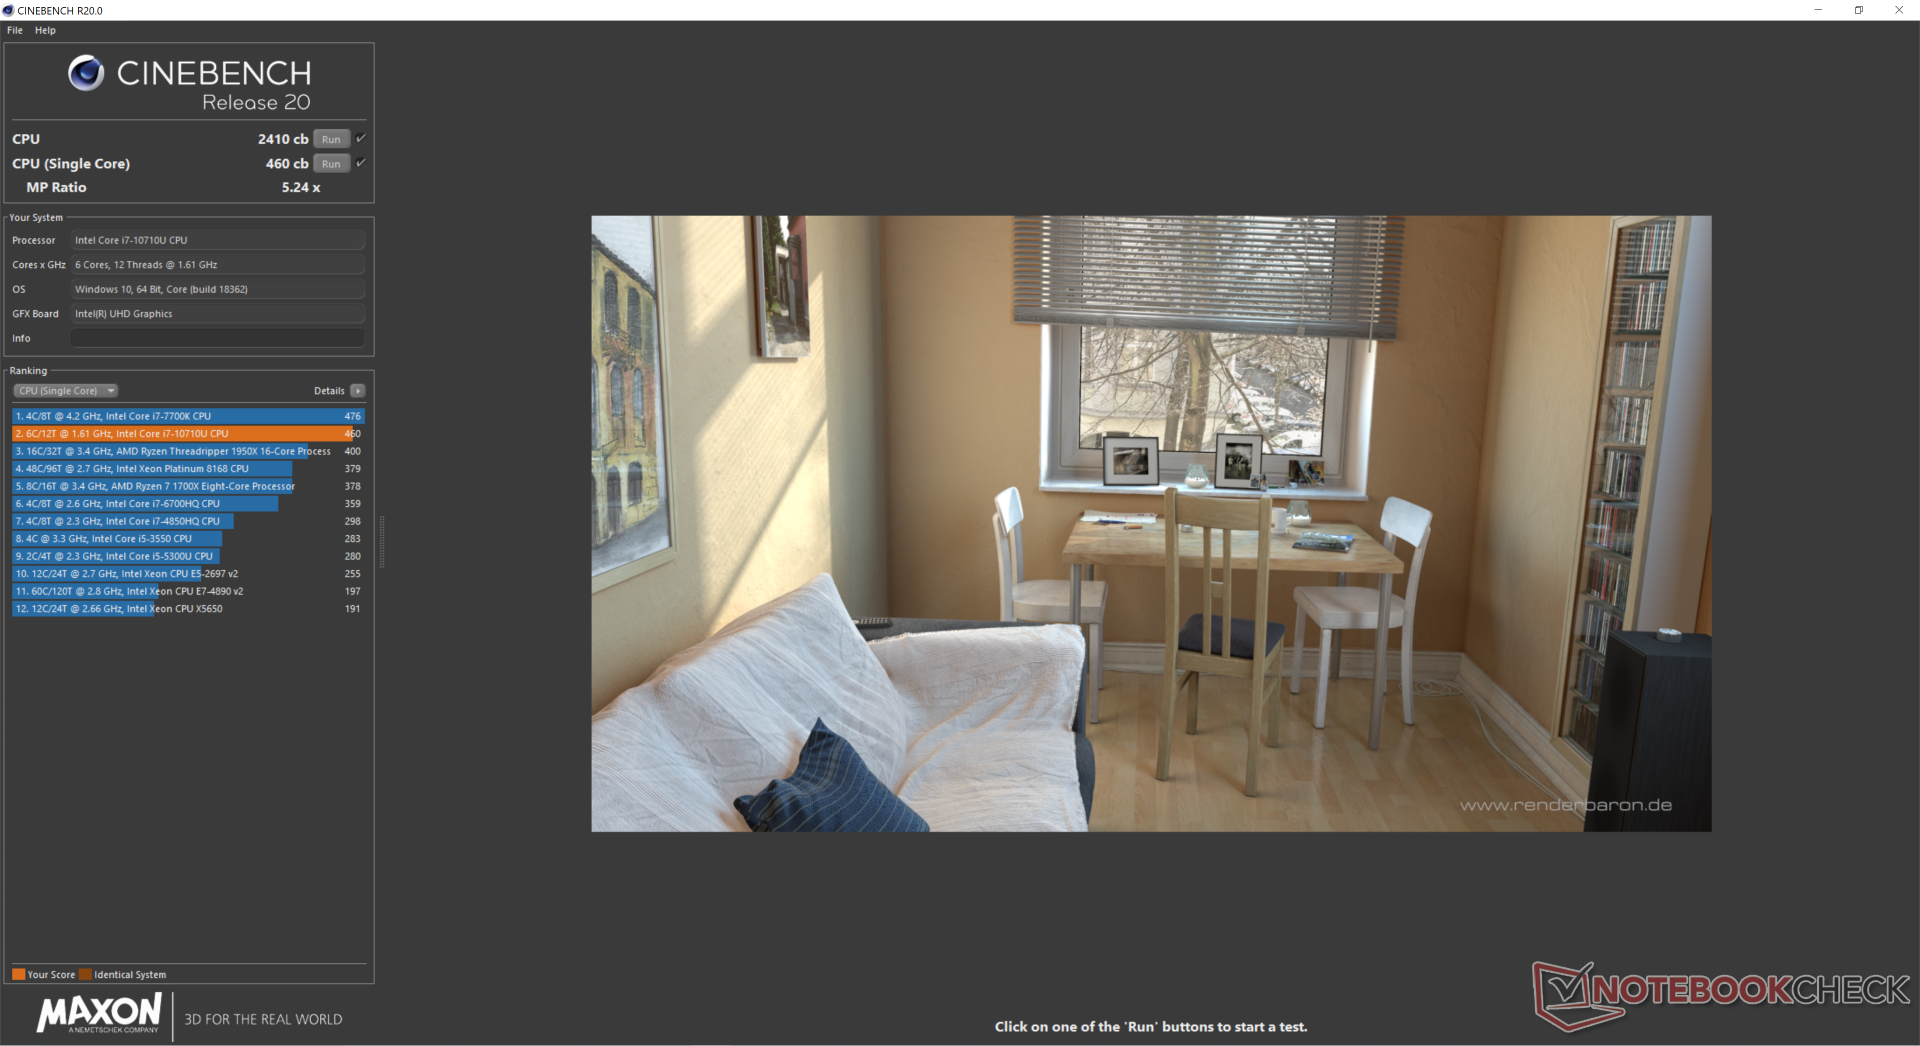
Processor
CPU performance is impressive at first glance because of the very fast but short-lived multi-core Turbo Boost potential of the hexa-core CPU. As illustrated by our graph below, running CineBench R15 Multi-Thread in a loop results in high initial scores before performance eventually falters over time in order to keep thermals in check. While this behavior is normal for ULV CPUs, the extent to which this occurs is more extreme on the hexa-core XPS 13 7390. The highest and lowest scores recorded on our hexa-core unit, for example, came out to be 1062 points and 689 points, respectively, compared to 637 points and 581 points on the older XPS 13 9370 with the Core i7-8550U CPU. This means that the hexa-core XPS 13 7390 is at its best when short bursts of high CPU performance is desired.
See our dedicated pages on the Core i7-10710U for more technical information and benchmark comparisons.
* ... smaller is better
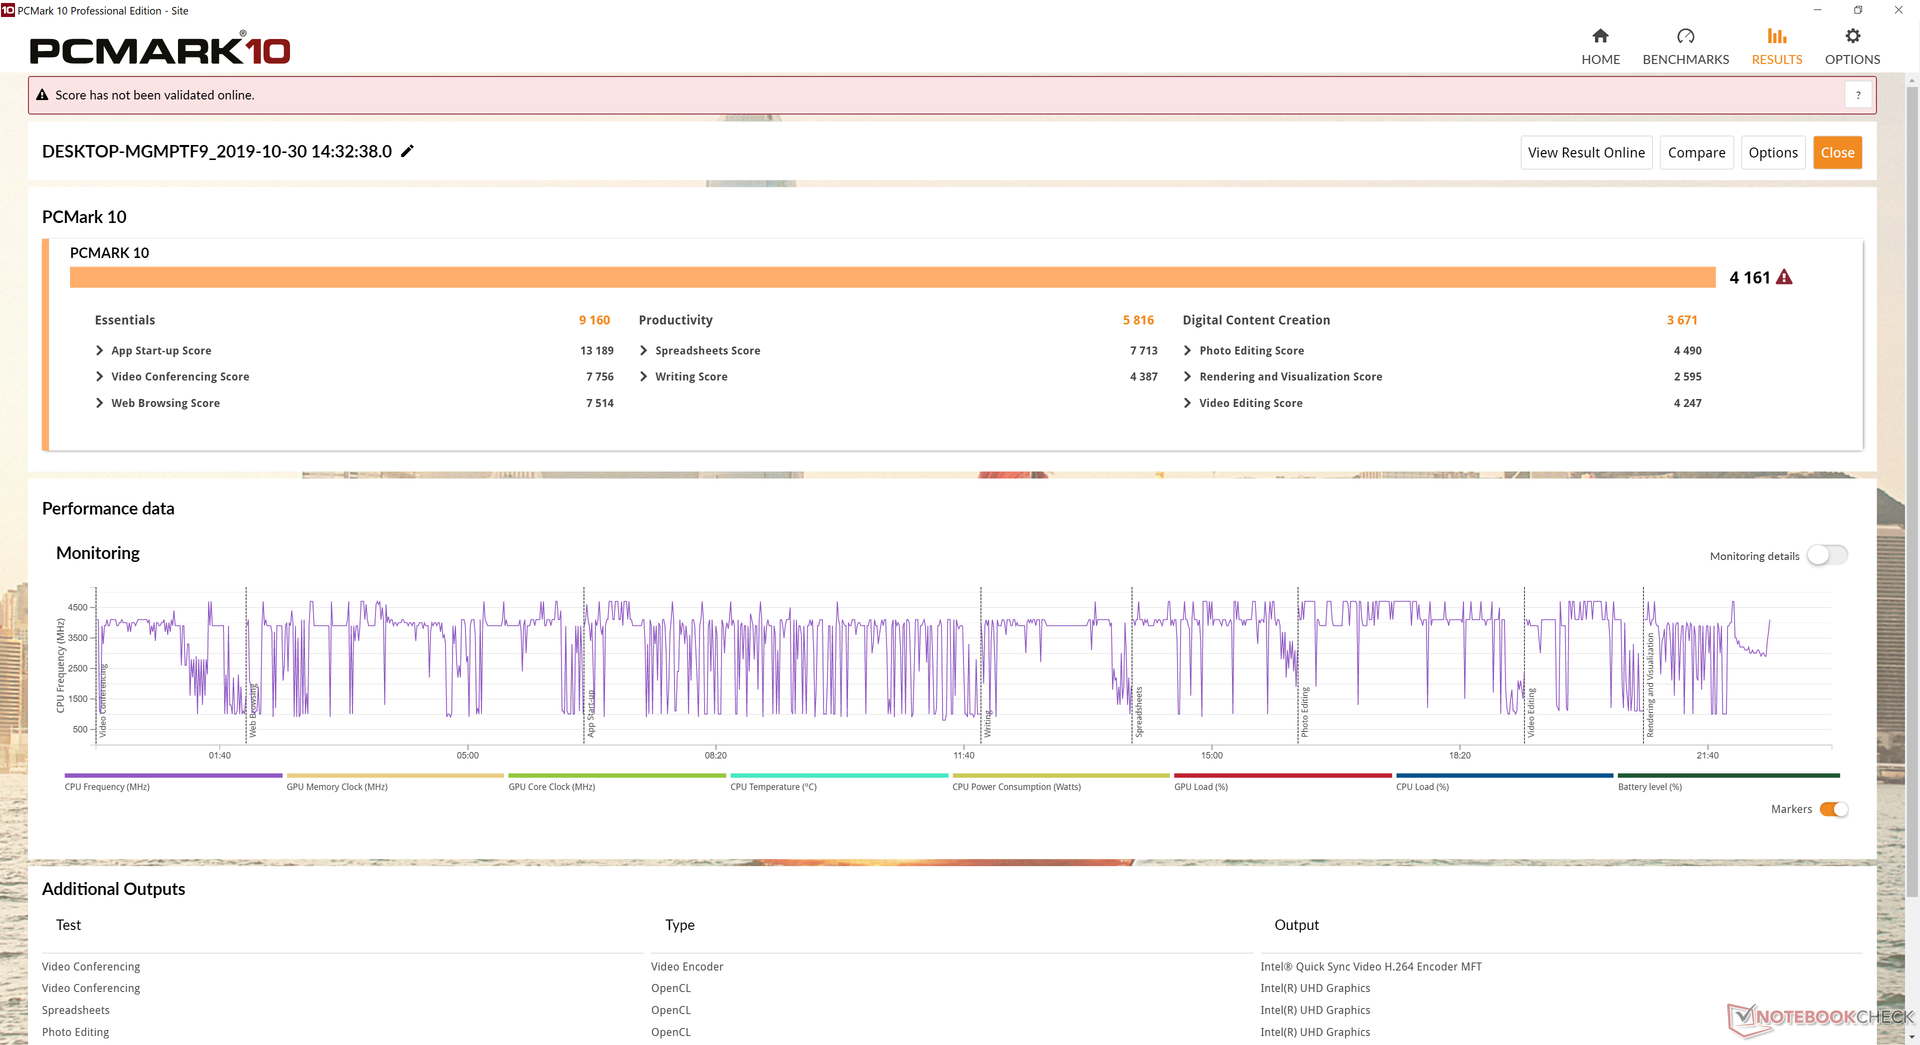
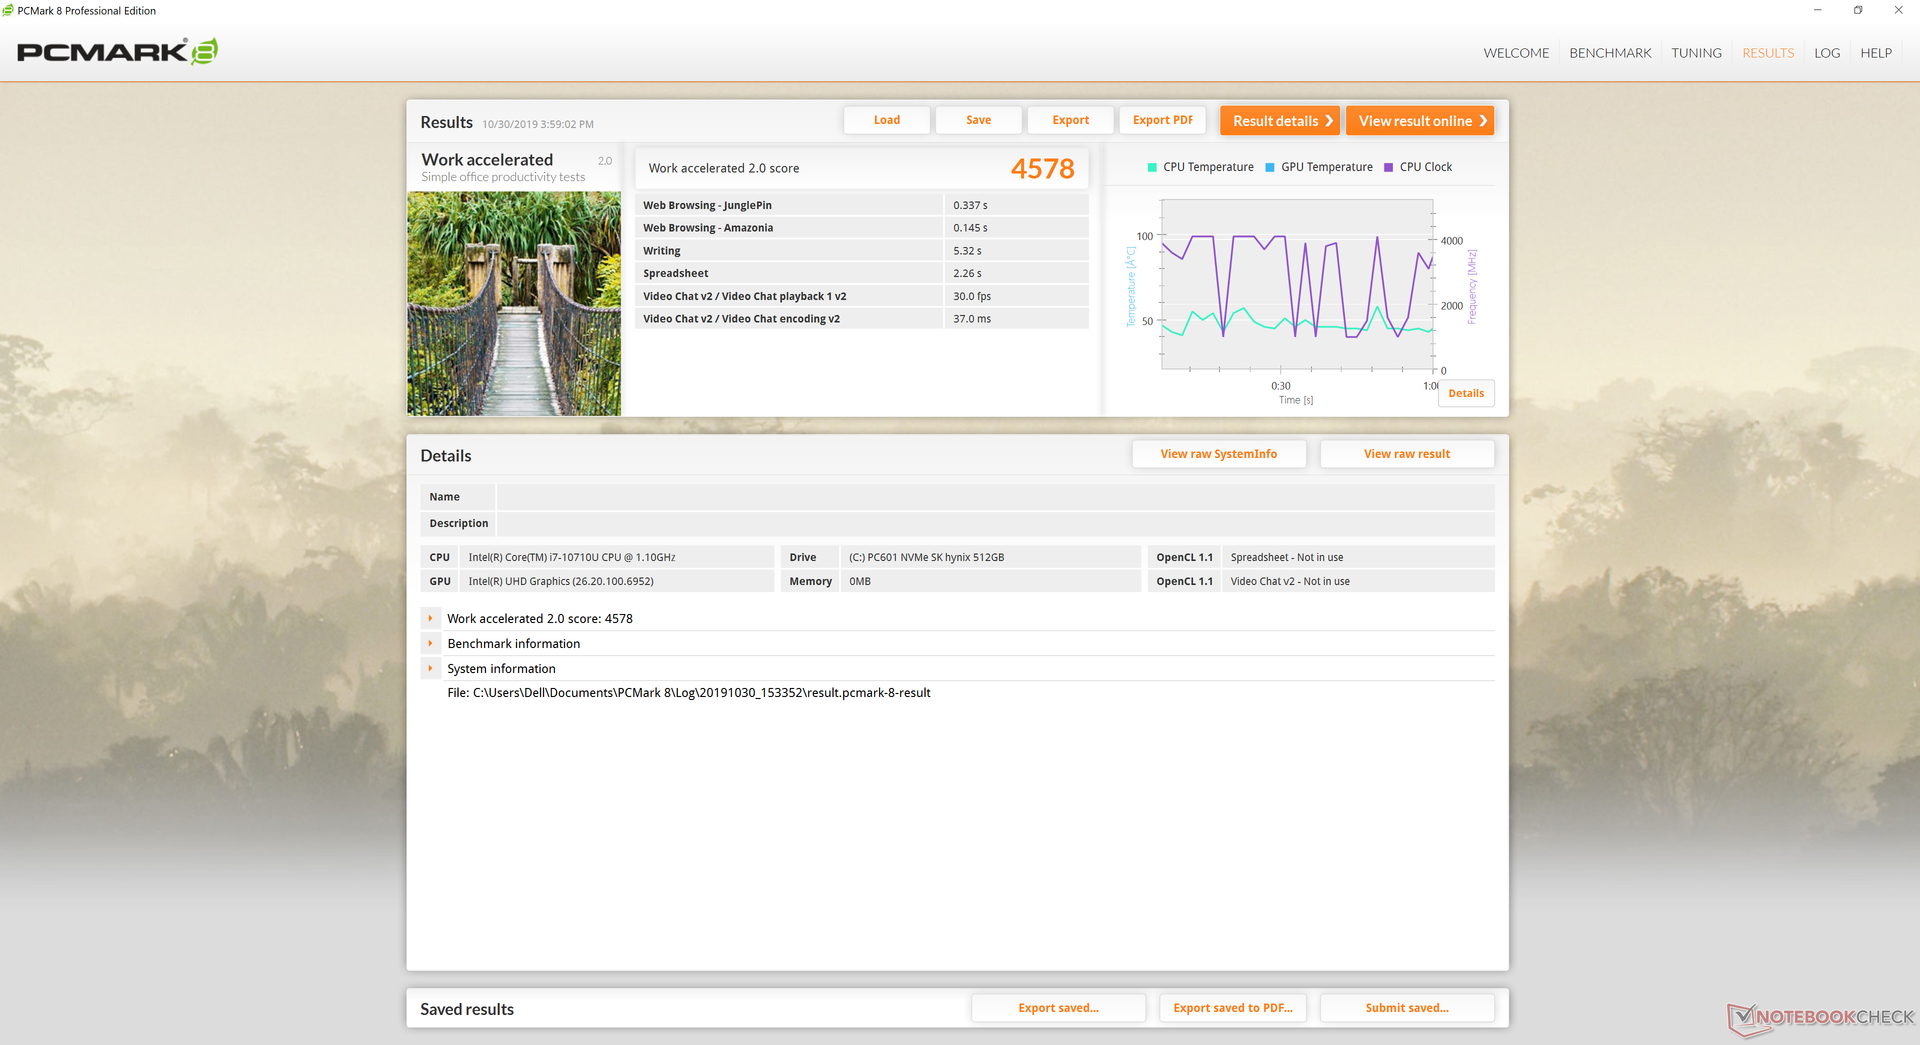
System Performance
PCMark benchmarks rank our Comet Lake-U-powered XPS 13 7390 behind the Ice Lake-U-powered XPS 13 7390 2-in-1 despite the faster CPU performance of the former. It's likely that the significantly more powerful Iris Plus GPU of the Core i7-1065G7 was enough to propel the XPS 13 7390 2-in-1 over its clamshell sibling.
We experienced no software or hardware issues during our time with the unit. We recommend users become familiar with the Dell Power Manager app as key functions like power profiles, performance level, and battery health can all be accessed here.
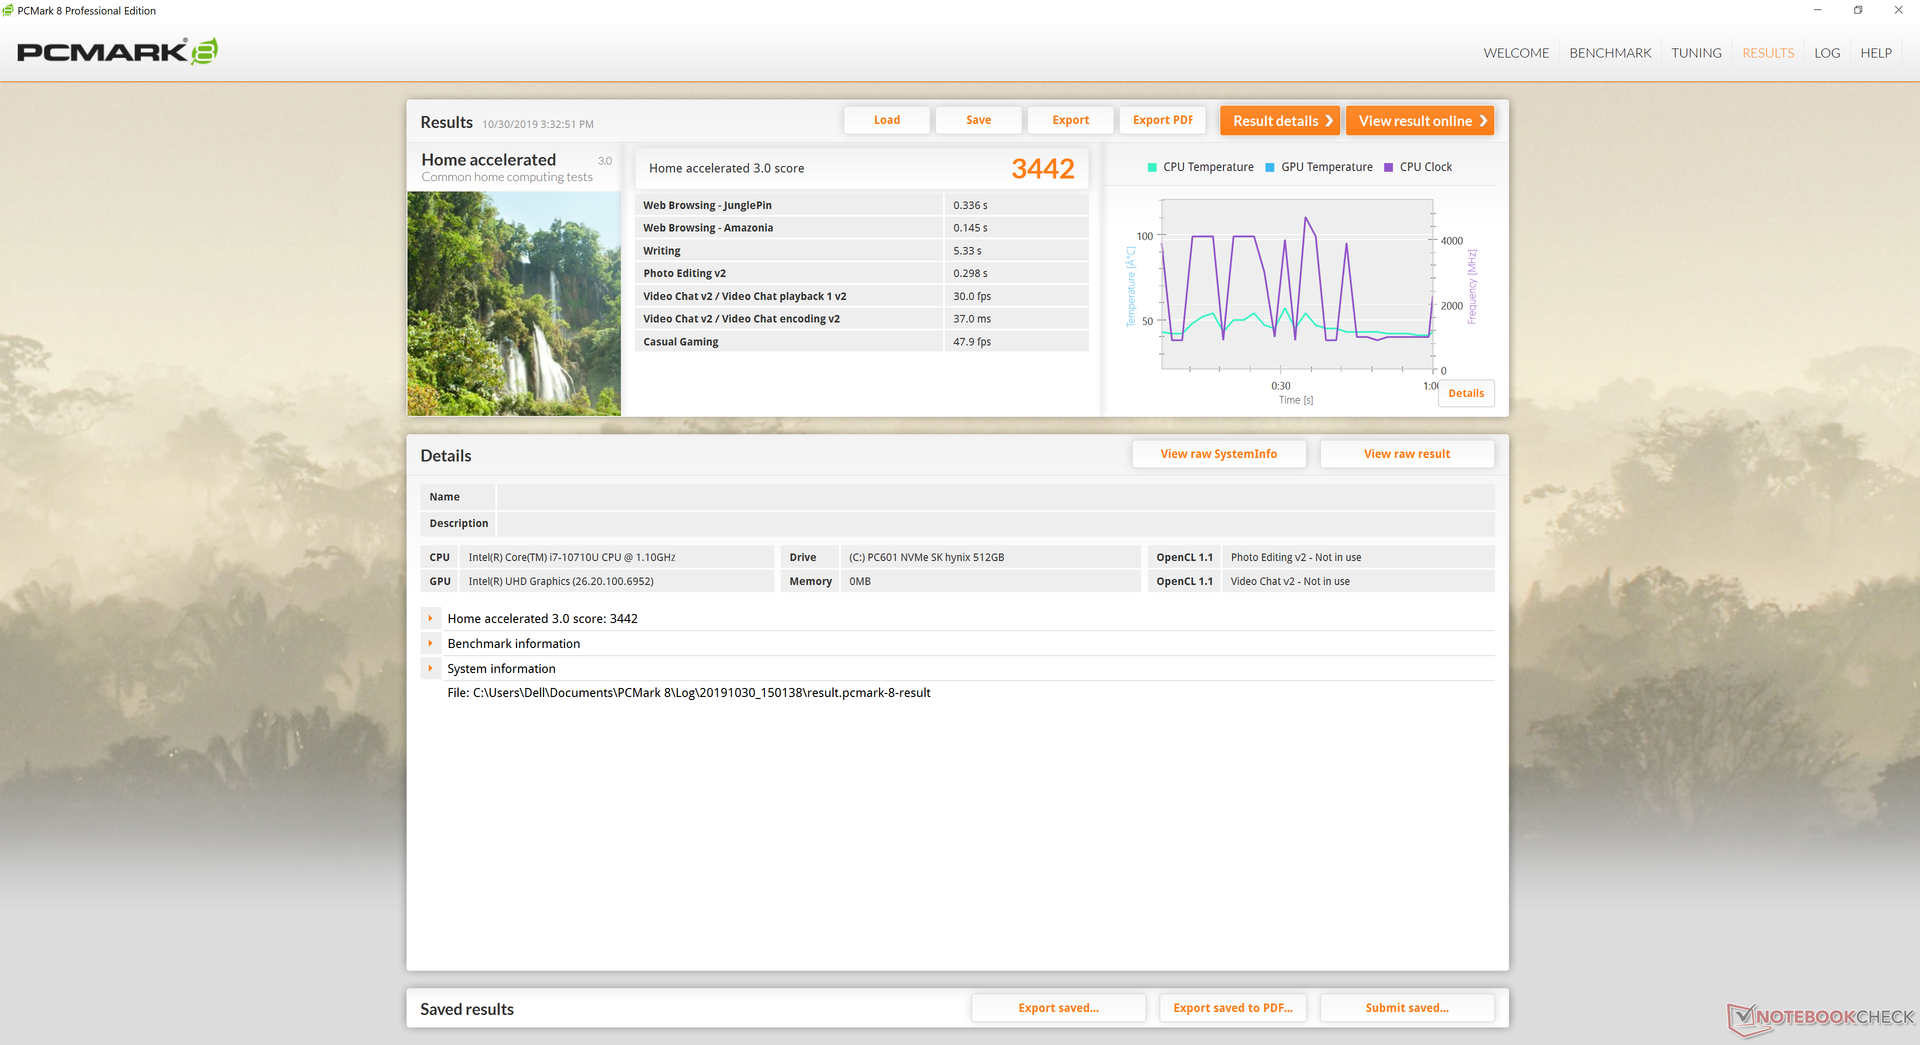
| PCMark 8 Home Score Accelerated v2 | 3442 points | |
| PCMark 8 Work Score Accelerated v2 | 4578 points | |
| PCMark 10 Score | 4161 points | |
Help | ||
Storage Devices
Dell sources their SSDs from multiple suppliers for all their laptops. We've personally tested XPS 13 units equipped with Samsung, Toshiba, or SK Hynix and so it's a safe bet that your next XPS purchase will house one of these three manufacturers. Our XPS 13 7390 uses the newer SK Hynix PC601 SSD in contrast to the SK Hynix PC401 on last year's XPS 13 9380.
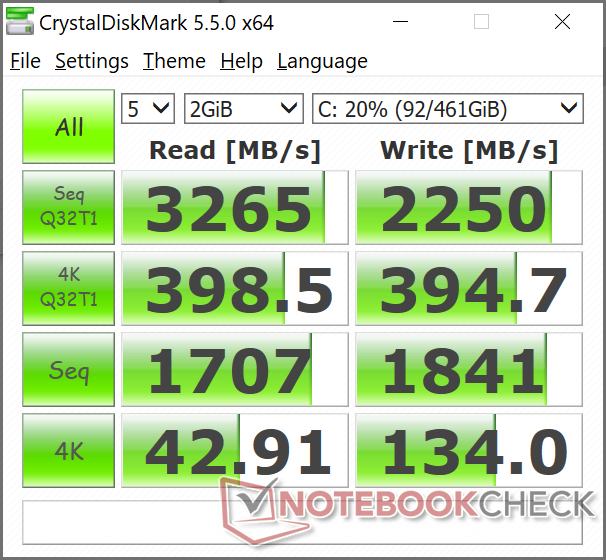
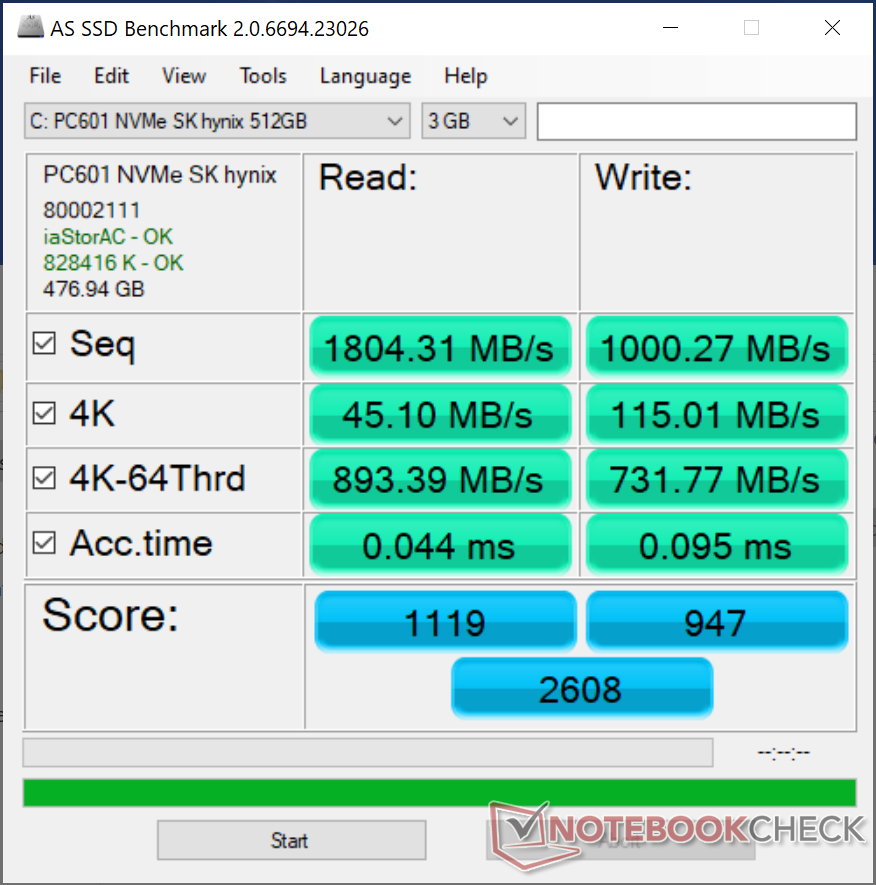
| Dell XPS 13 7390 Core i7-10710U SK Hynix PC601 NVMe 512 GB | Dell XPS 13 7390 2-in-1 Core i7 Toshiba BG4 KBG40ZPZ512G | Dell XPS 13 7390 2-in-1 Core i3 Toshiba BG4 KBG40ZPZ256G | Dell XPS 13 9380 i7 4K Samsung SSD PM981 MZVLB512HAJQ | Dell XPS 13 9380 2019 SK hynix PC401 HFS256GD9TNG | Dell XPS 13 9370 i7 UHD Toshiba XG5 KXG50ZNV512G | |
|---|---|---|---|---|---|---|
| AS SSD | -53% | -69% | 44% | -29% | -23% | |
| Seq Read (MB/s) | 1804 | 1801 0% | 1558 -14% | 1981 10% | 2035 13% | 2205 22% |
| Seq Write (MB/s) | 1000 | 1125 13% | 1103 10% | 1473 47% | 658 -34% | 435.8 -56% |
| 4K Read (MB/s) | 45.1 | 39.7 -12% | 37.52 -17% | 53.3 18% | 39.74 -12% | 29.36 -35% |
| 4K Write (MB/s) | 115 | 67 -42% | 59 -49% | 127.4 11% | 105.7 -8% | 107.4 -7% |
| 4K-64 Read (MB/s) | 893 | 1253 40% | 1684 89% | 1179 32% | 461 -48% | 678 -24% |
| 4K-64 Write (MB/s) | 732 | 209 -71% | 198.9 -73% | 2105 188% | 300.1 -59% | 444.8 -39% |
| Access Time Read * (ms) | 0.044 | 0.069 -57% | 0.099 -125% | 0.036 18% | 0.061 -39% | 0.059 -34% |
| Access Time Write * (ms) | 0.095 | 0.625 -558% | 0.722 -660% | 0.029 69% | 0.051 46% | 0.055 42% |
| Score Read (Points) | 1119 | 1472 32% | 1877 68% | 1430 28% | 704 -37% | 926 -17% |
| Score Write (Points) | 947 | 388 -59% | 368 -61% | 2379 151% | 471 -50% | 596 -37% |
| Score Total (Points) | 2608 | 2583 -1% | 3180 22% | 4526 74% | 1479 -43% | 1911 -27% |
| Copy ISO MB/s (MB/s) | 1515 | 1293 -15% | 677 -55% | 1294 -15% | 893 -41% | 585 -61% |
| Copy Program MB/s (MB/s) | 535 | 560 5% | 298.4 -44% | 503 -6% | 287.9 -46% | 570 7% |
| Copy Game MB/s (MB/s) | 1211 | 927 -23% | 496.1 -59% | 1148 -5% | 618 -49% | 503 -58% |
* ... smaller is better

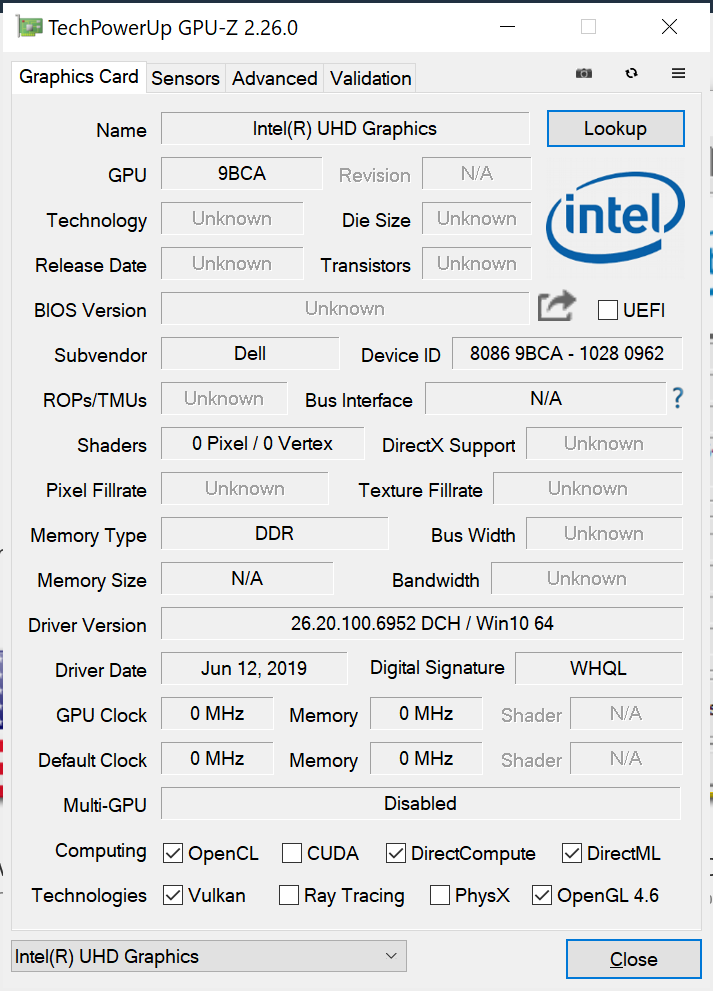
GPU Performance
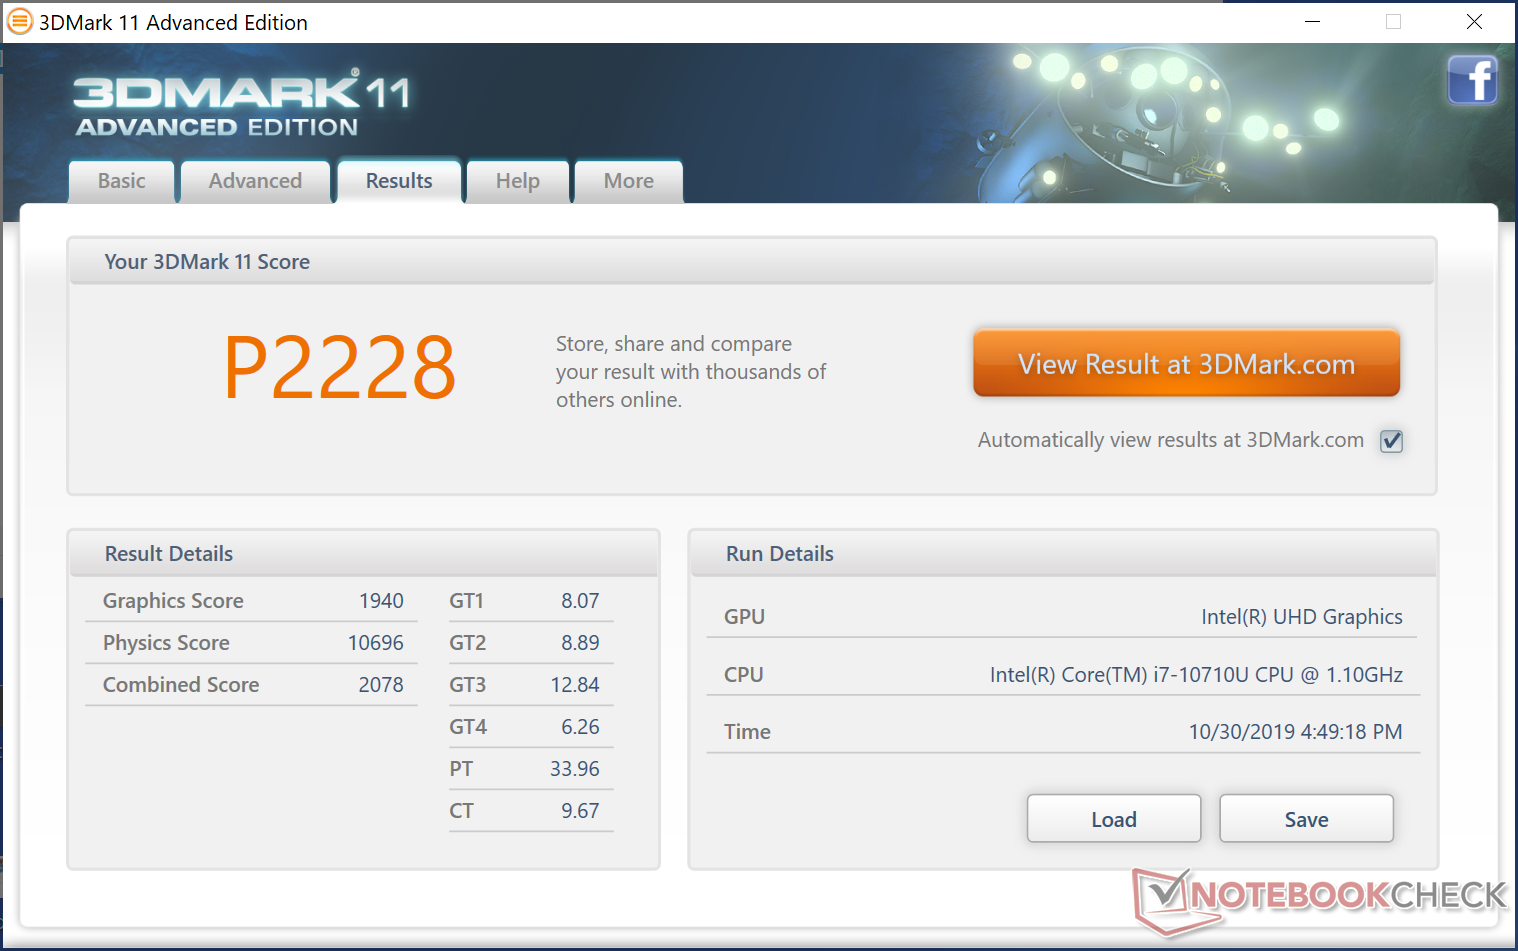
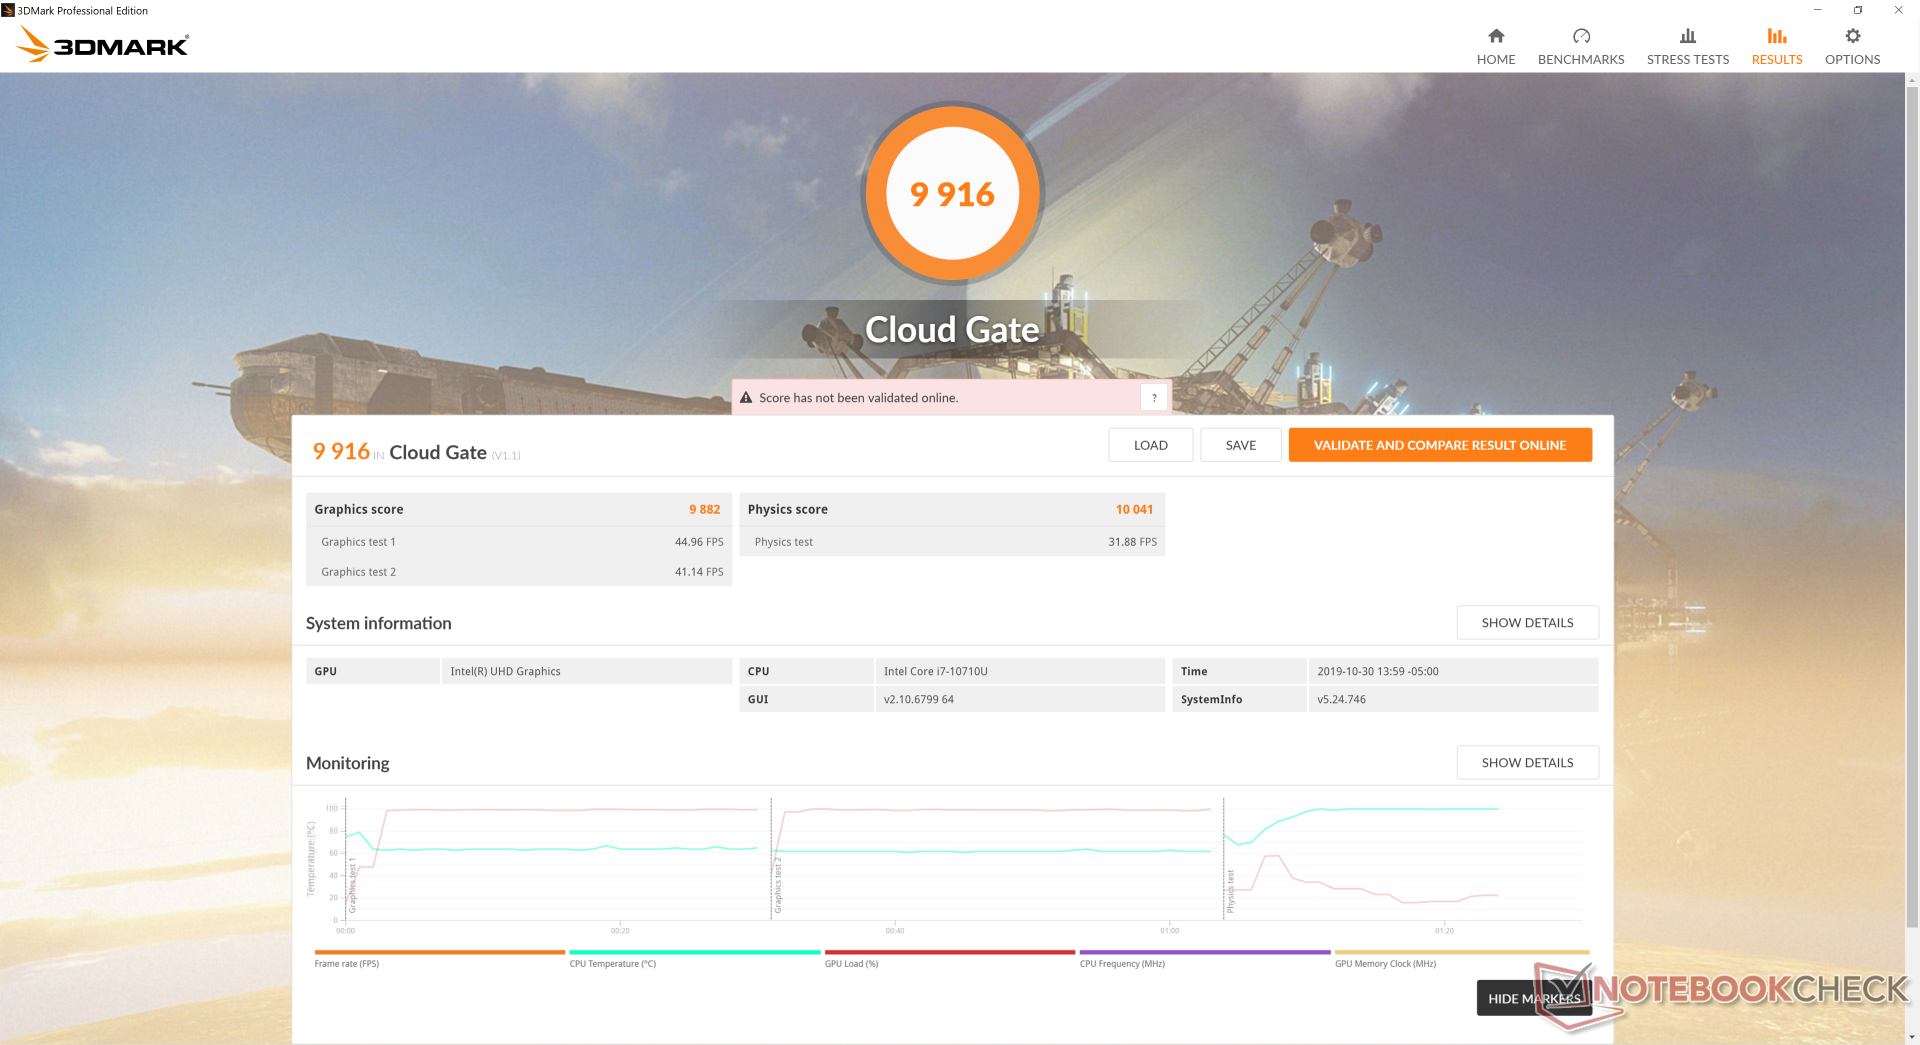
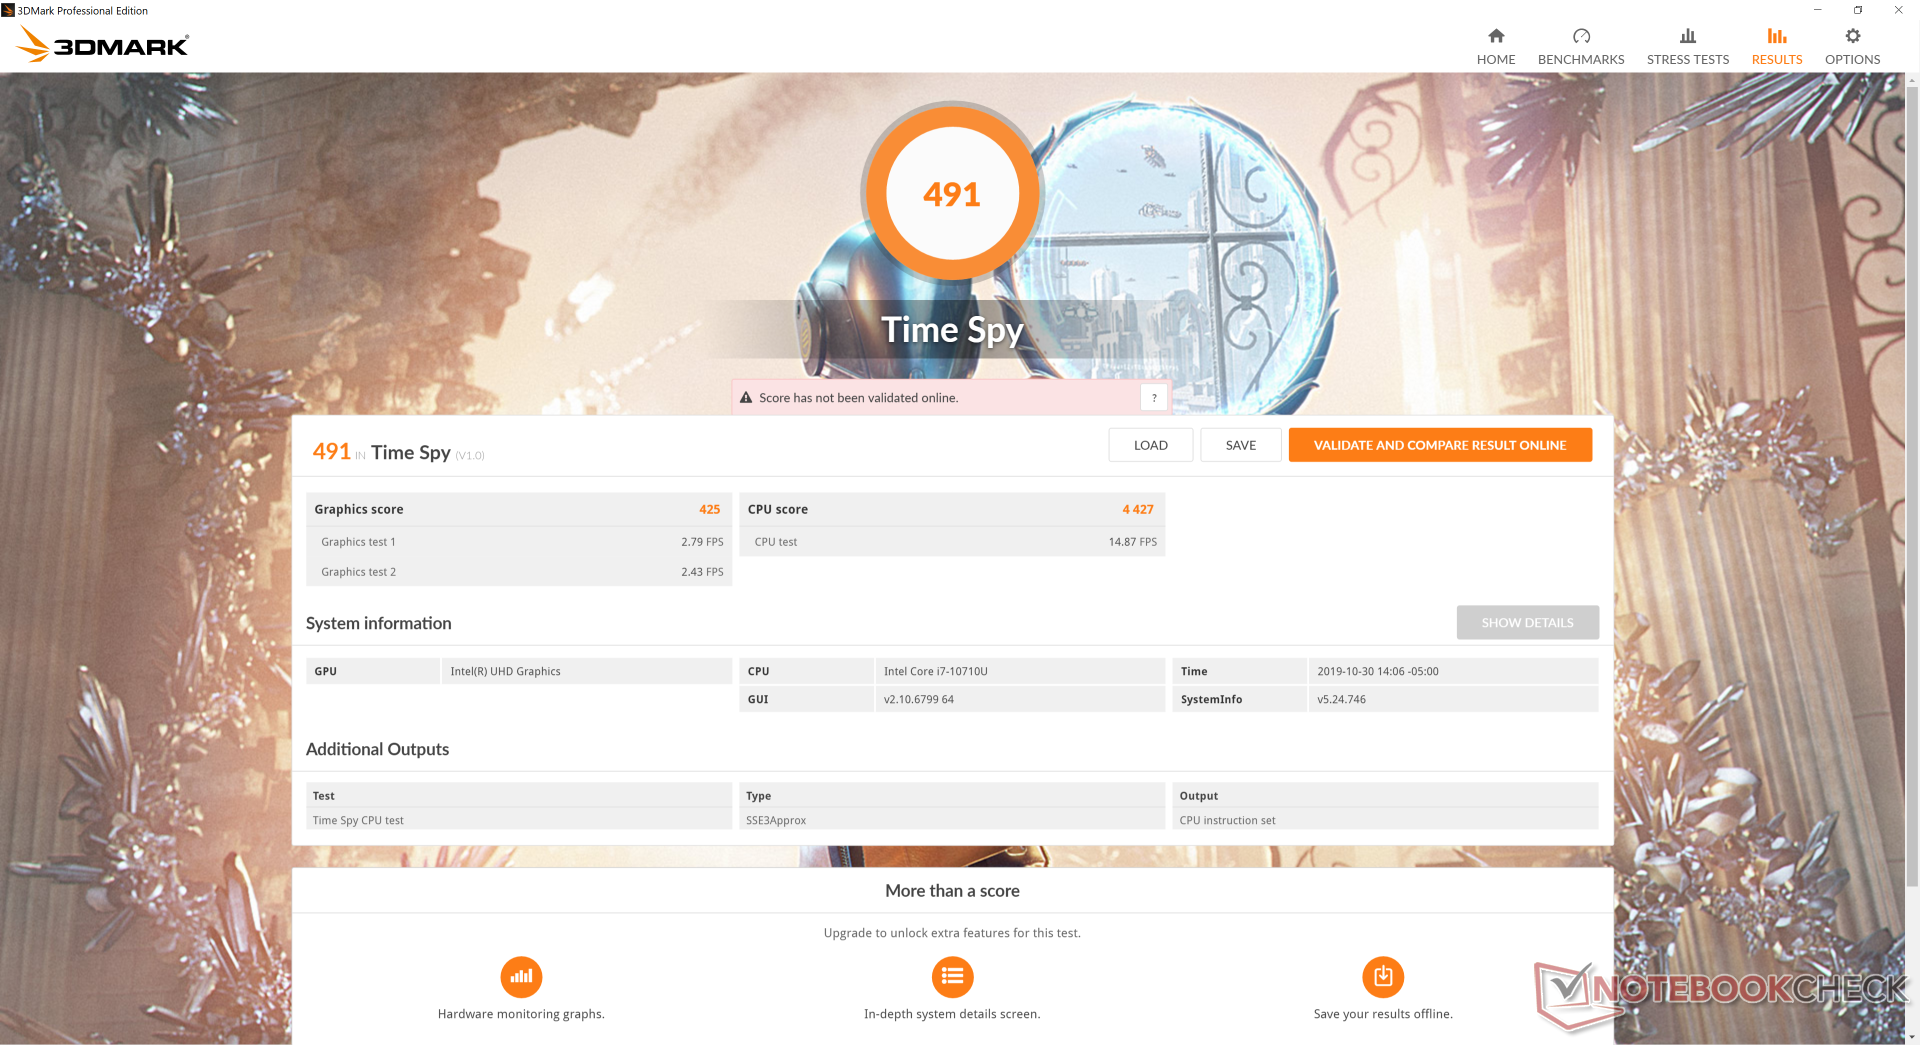
The integrated UHD Graphics 620 has not changed from the previous generation. While Fire Strike and Time Spy Graphics scores are each 19 percent higher than the average UHD Graphics 620 in our database, that's not really saying much since this particular GPU is years old. You'll have to opt for an Ultrabook with the Core i7-1065G7, Ryzen 7 3700U, or GeForce MX150/MX250 if you want more GPU horsepower.
| 3DMark 06 Standard Score | 14158 points | |
| 3DMark 11 Performance | 2228 points | |
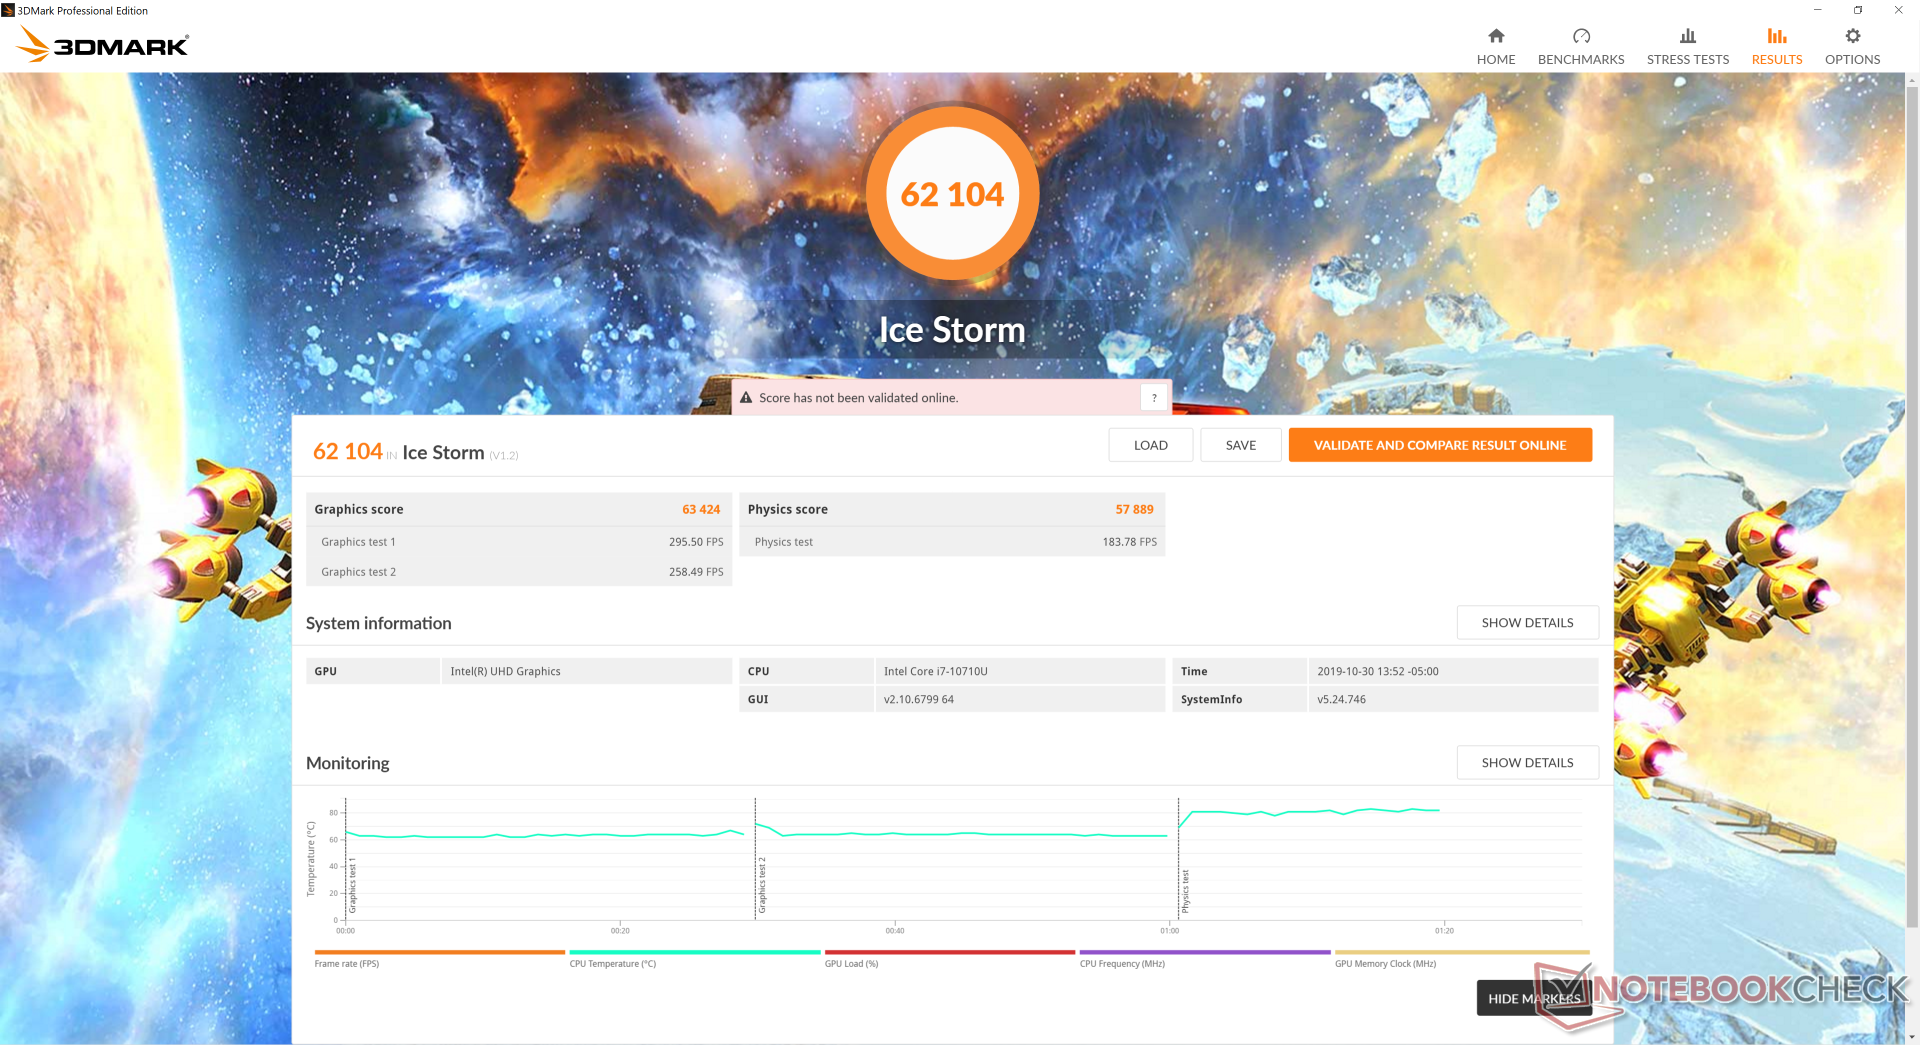
| 3DMark Ice Storm Standard Score | 62104 points | |
| 3DMark Cloud Gate Standard Score | 9916 points | |
| 3DMark Fire Strike Score | 1237 points | |
| 3DMark Time Spy Score | 491 points | |
Help | ||
| low | med. | high | ultra | |
|---|---|---|---|---|
| BioShock Infinite (2013) | 85.3 | 42 | 35.8 | 11.2 |
| The Witcher 3 (2015) | 19.7 | |||
| Rocket League (2017) | 76.2 | 36.6 | 23 | |
| Shadow of the Tomb Raider (2018) | 15 |
Emissions
System Noise
Nothing has changed about the cooling solution and so fan behavior is not unlike what we experienced on the XPS 13 9380. At worst, fan noise will be steady at about 31.1 to 33.7 dB(A) against a background of 28 dB(A) when video streaming or during heavy web browsing. Fan noise can be up to 46.5 dB(A) when the CPU is at 100 percent utilization.
We're able to notice slight coil whine or electronic noise when placing an ear on the keyboard keys.
| Dell XPS 13 7390 Core i7-10710U UHD Graphics 620, i7-10710U, SK Hynix PC601 NVMe 512 GB | Dell XPS 13 7390 2-in-1 Core i7 Iris Plus Graphics G7 (Ice Lake 64 EU), i7-1065G7, Toshiba BG4 KBG40ZPZ512G | Dell XPS 13 7390 2-in-1 Core i3 UHD Graphics G1 (Ice Lake 32 EU), i3-1005G1, Toshiba BG4 KBG40ZPZ256G | Dell XPS 13 9380 i7 4K UHD Graphics 620, i7-8565U, Samsung SSD PM981 MZVLB512HAJQ | Dell XPS 13 9380 2019 UHD Graphics 620, i5-8265U, SK hynix PC401 HFS256GD9TNG | Dell XPS 13 9370 i7 UHD UHD Graphics 620, i5-8550U, Toshiba XG5 KXG50ZNV512G | |
|---|---|---|---|---|---|---|
| Noise | 2% | 2% | -3% | -2% | 2% | |
| off / environment * (dB) | 28 | 28.1 -0% | 28 -0% | 28.4 -1% | 30.4 -9% | 28 -0% |
| Idle Minimum * (dB) | 28 | 28.1 -0% | 28 -0% | 29.4 -5% | 30.4 -9% | 28 -0% |
| Idle Average * (dB) | 28 | 28.1 -0% | 28 -0% | 29.4 -5% | 30.4 -9% | 28 -0% |
| Idle Maximum * (dB) | 28 | 28.1 -0% | 28 -0% | 29.4 -5% | 30.4 -9% | 28 -0% |
| Load Average * (dB) | 33.7 | 31.7 6% | 31.7 6% | 34.6 -3% | 31.7 6% | 32.5 4% |
| Load Maximum * (dB) | 46.5 | 43.4 7% | 43.5 6% | 46.8 -1% | 38.1 18% | 42.2 9% |
| Witcher 3 ultra * (dB) | 43.4 |
* ... smaller is better
Noise level
| Idle |
| 28 / 28 / 28 dB(A) |
| Load |
| 33.7 / 46.5 dB(A) |
 | ||
30 dB silent 40 dB(A) audible 50 dB(A) loud |
||
min: | ||
Temperature
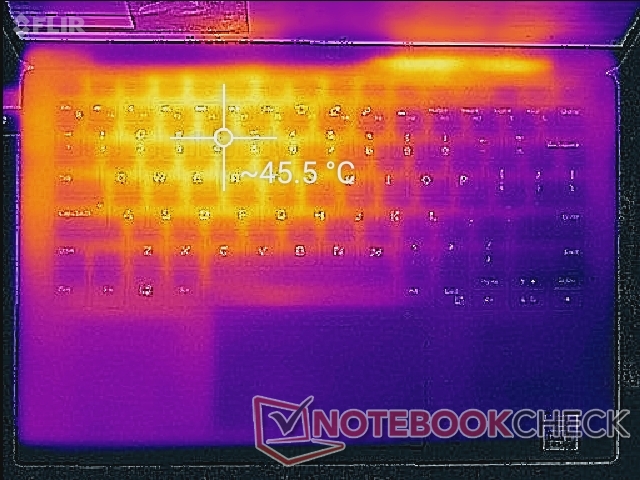
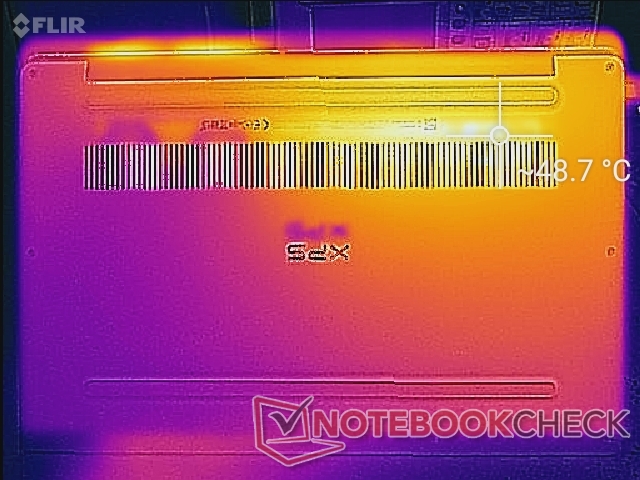
Surface temperatures are nearly identical to what we discovered on the XPS 13 9380 with the quad-core Whiskey Lake-U CPU. In other words, users are reaping the benefits of the Comet Lake-U CPU without any higher temperatures commonly associated with increased performance.
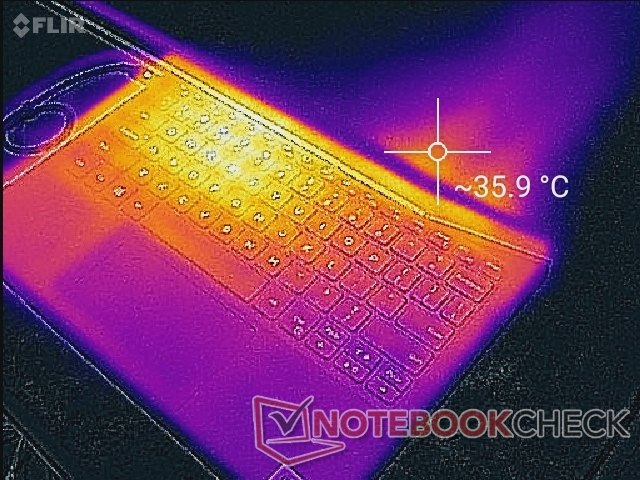
(±) The maximum temperature on the upper side is 44.6 °C / 112 F, compared to the average of 35.9 °C / 97 F, ranging from 21.4 to 59 °C for the class Subnotebook.
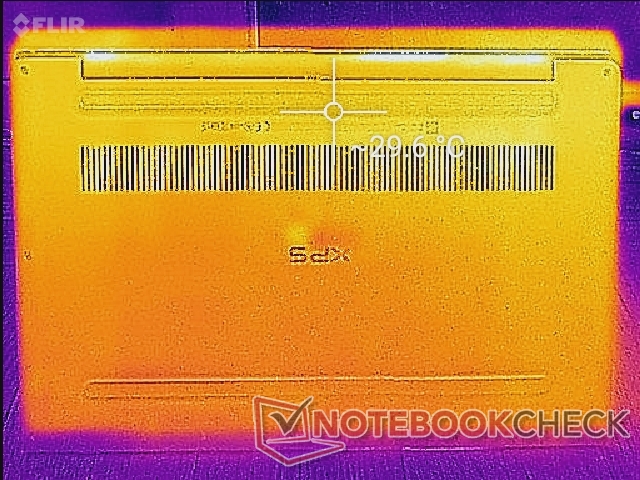
(-) The bottom heats up to a maximum of 49.2 °C / 121 F, compared to the average of 39.2 °C / 103 F
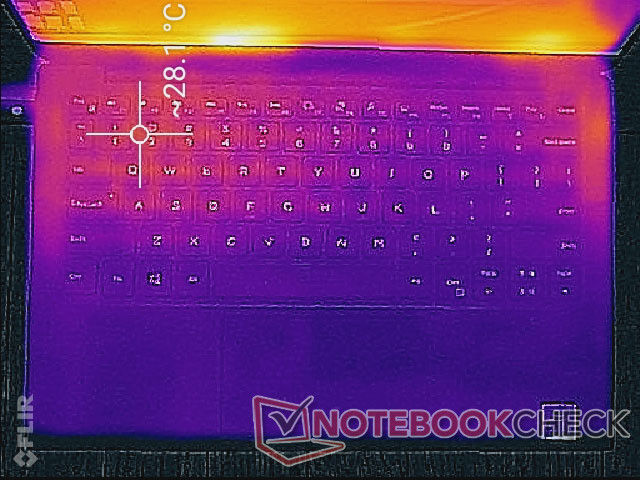
(+) In idle usage, the average temperature for the upper side is 26.6 °C / 80 F, compared to the device average of 30.8 °C / 87 F.
(+) The palmrests and touchpad are cooler than skin temperature with a maximum of 31.4 °C / 88.5 F and are therefore cool to the touch.
(-) The average temperature of the palmrest area of similar devices was 28.2 °C / 82.8 F (-3.2 °C / -5.7 F).
Stress Test
We stress the system with synthetic loads in order to identify for any potential throttling or stability issues. When running Prime95, the CPU can be observed boosting up to 4 GHz for the first few seconds before falling and stabilizing at the 3.0 to 3.1 GHz range. Core temperature would also be stable at about 95 C during this period. After about 1.5 minutes, clock rates and temperature drop to cycle between 1.7 GHz to 2.5 GHz and 64 C to 80 C, respectively, since the CPU is unable to sustain consistent maximum Turbo Boost indefinitely as discovered during our CineBench R15 Multi-Thread loop test. Running both Prime95 and FurMark results in similar clock rate and temperature cycling behavior as shown by the screenshots and table below.
While most laptops with ULV CPUs experience performance dips when subjected to extreme stress, the wide-ranging cycling behavior as observed on this XPS 13 unit is uncommon. Dell's unique approach has its pros and cons; while the CPU can occasionally reach higher clock rates than usual when under stress, performance can also become inconsistent on a moment-to-moment basis.
Running on battery power will limit CPU performance. A Fire Strike run on batteries returns Physics and Graphics scores of 12325 and 1333 points, respectively, compared to 14847 and 1339 points when on mains.
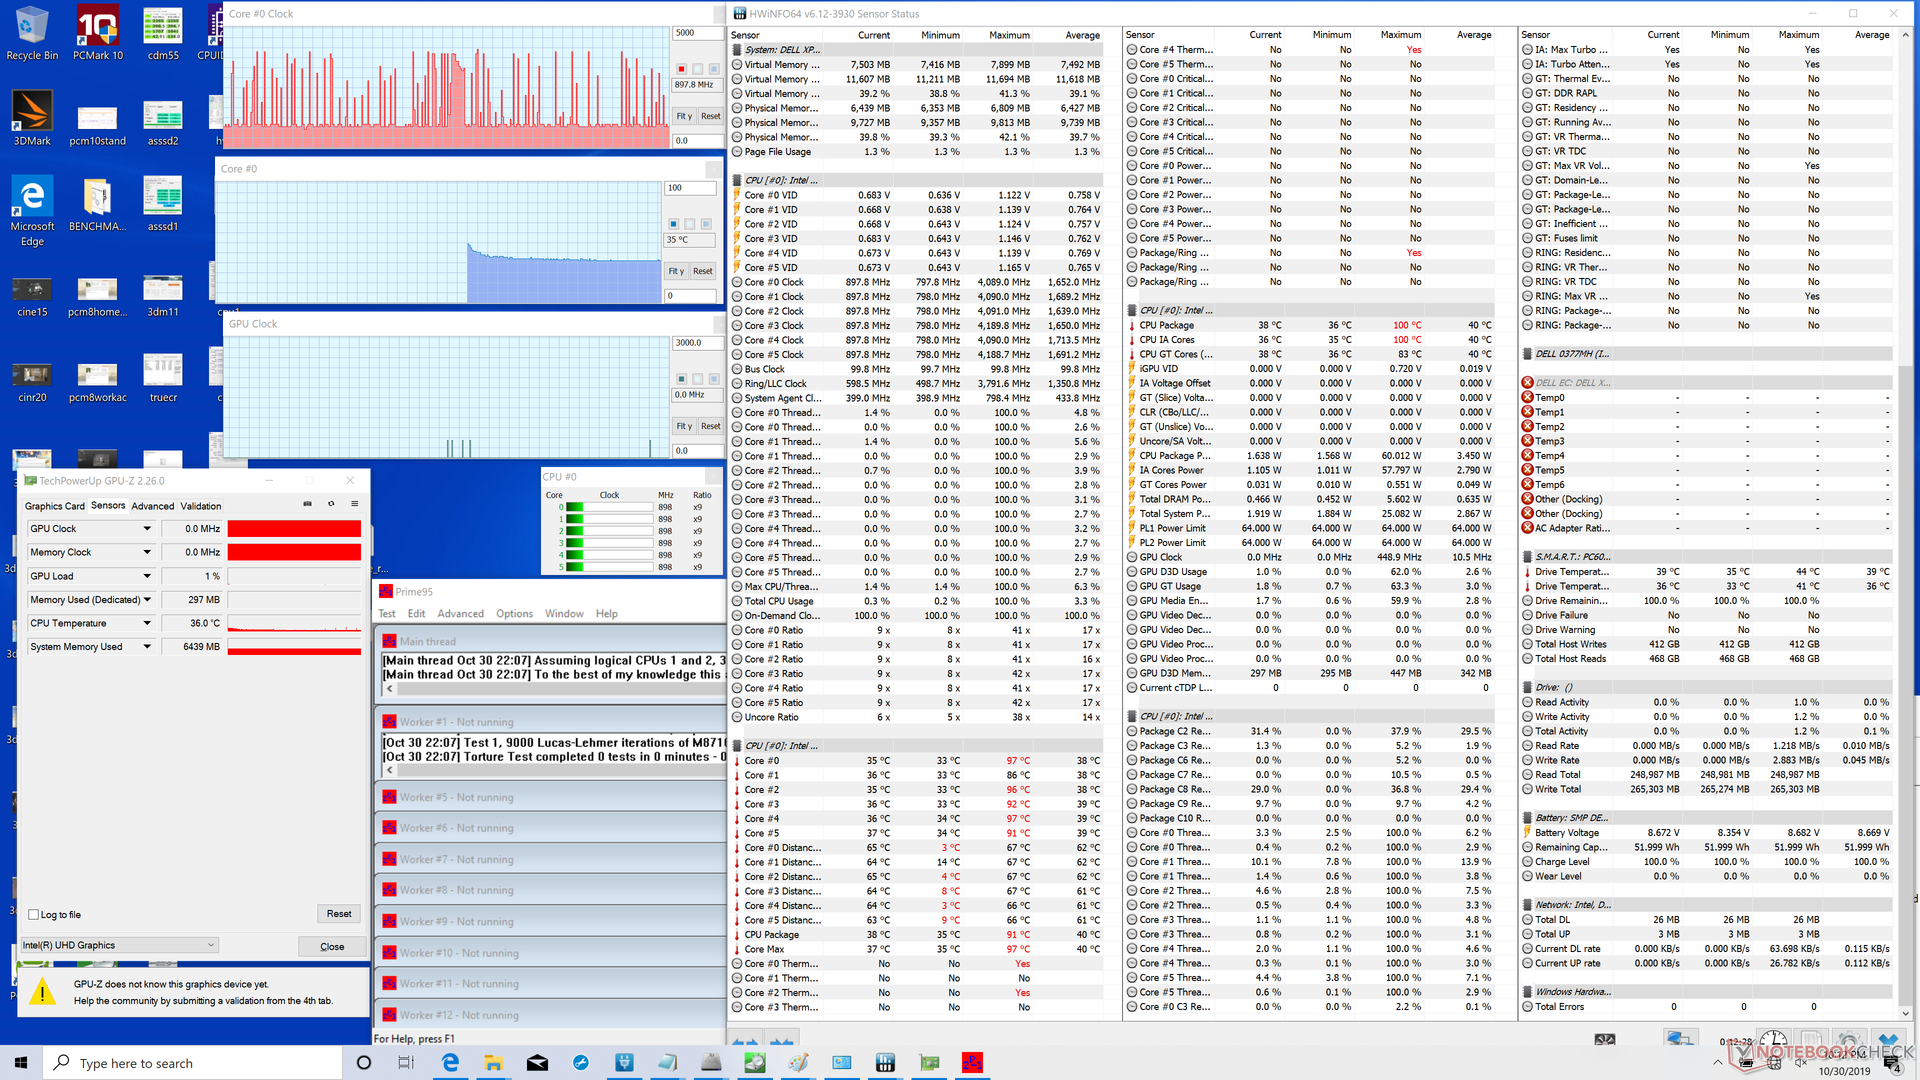
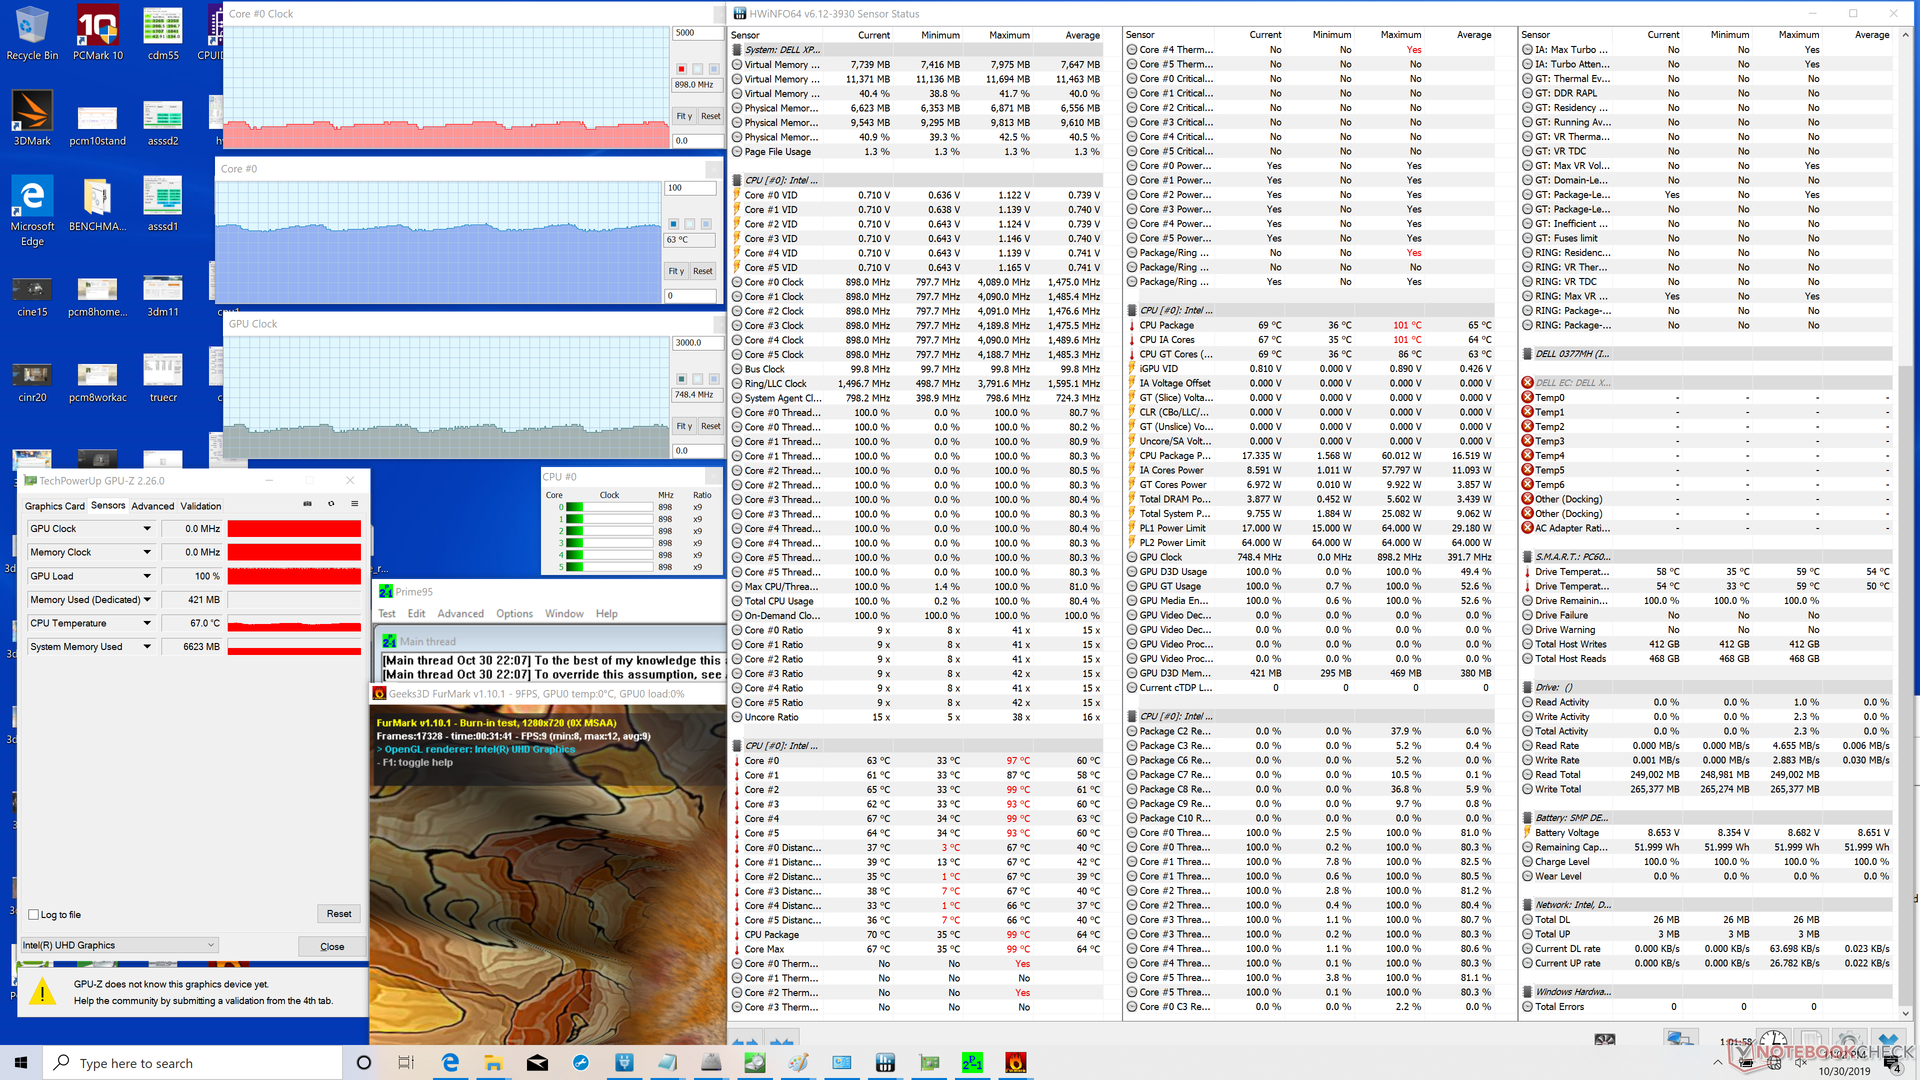

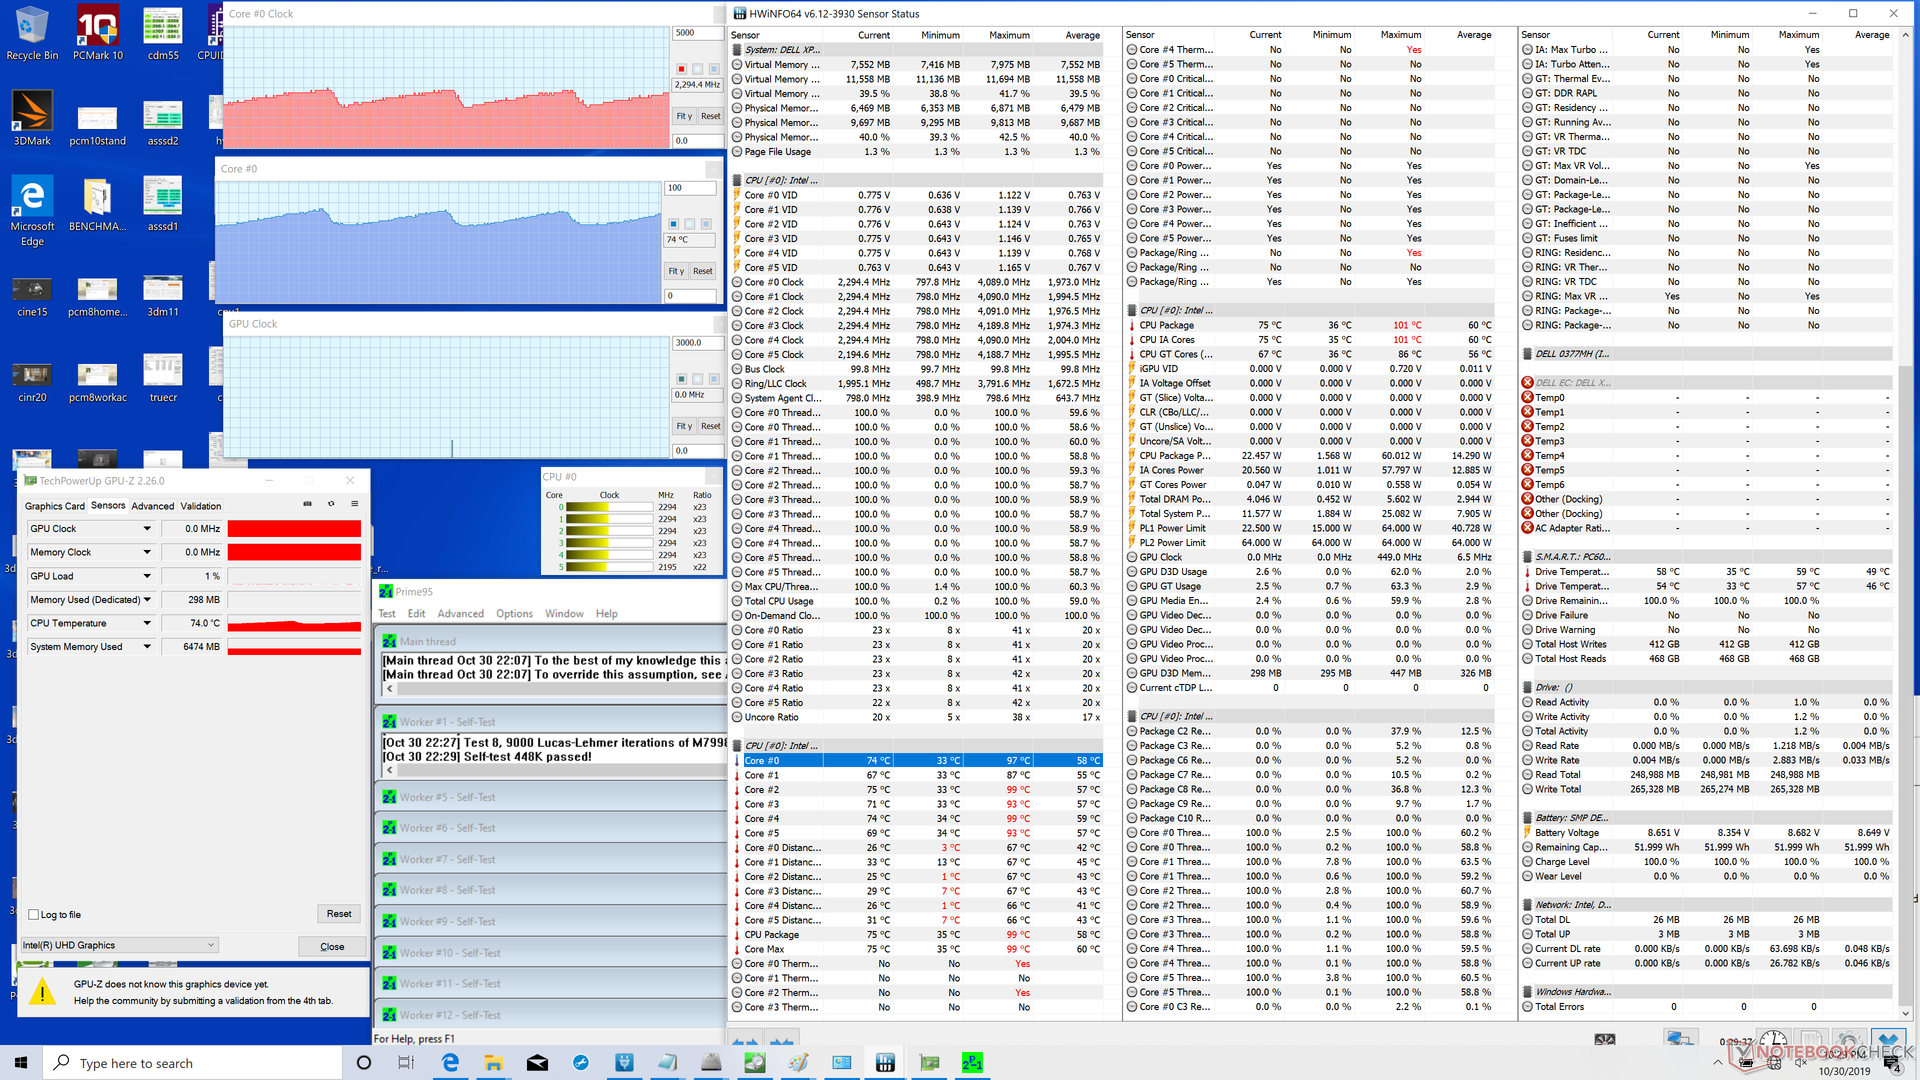
| CPU Clock (GHz) | GPU Clock (MHz) | CPU Temperature (°C) | |
| System Idle | -- | -- | 35 |
| Prime95 Stress | 1.8 - 2.5 | -- | 64 - 80 |
| Prime95 + FurMark Stress | 0.8 - 1.1 | 650 - 850 | 60 - 66 |
Energy Management
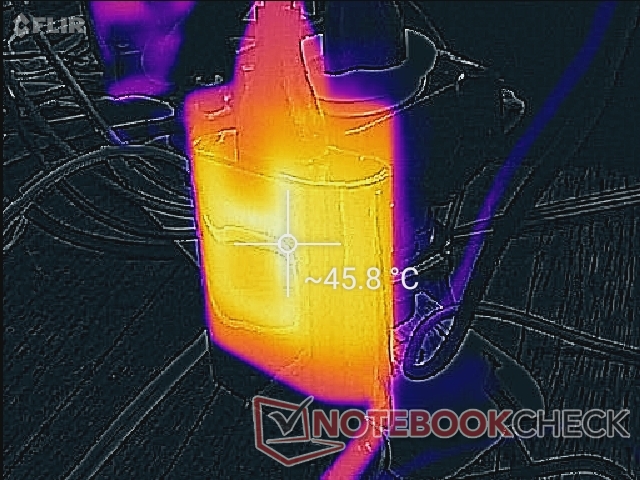
Power Consumption
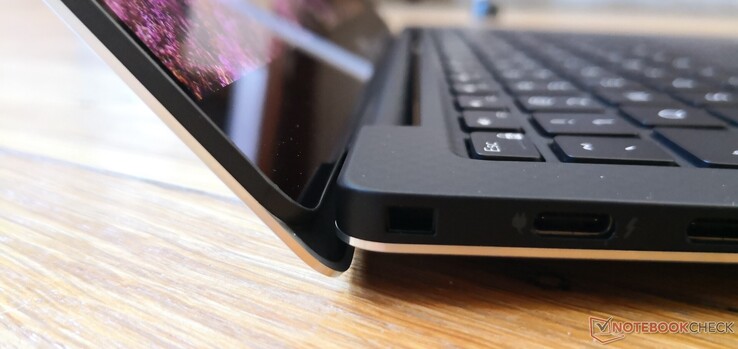
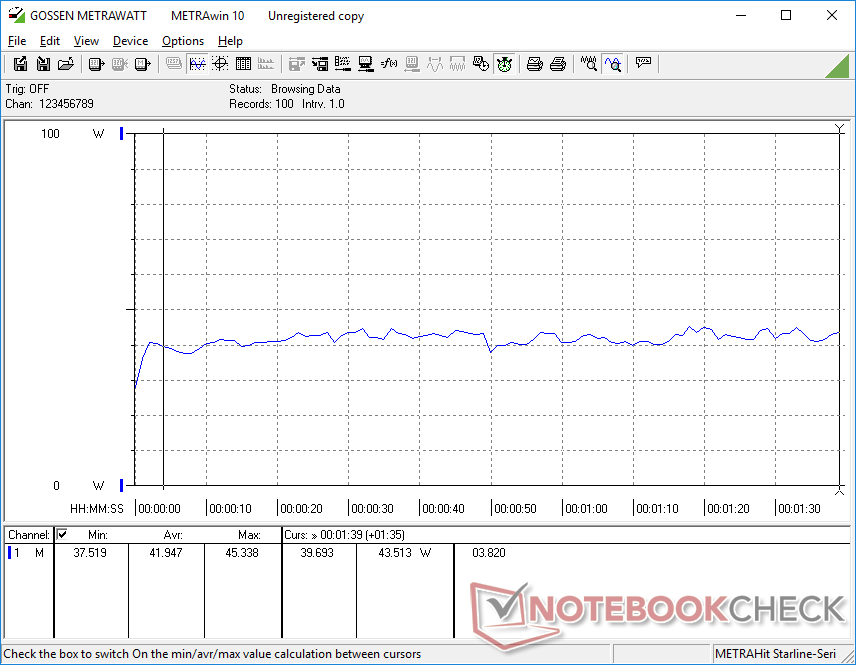
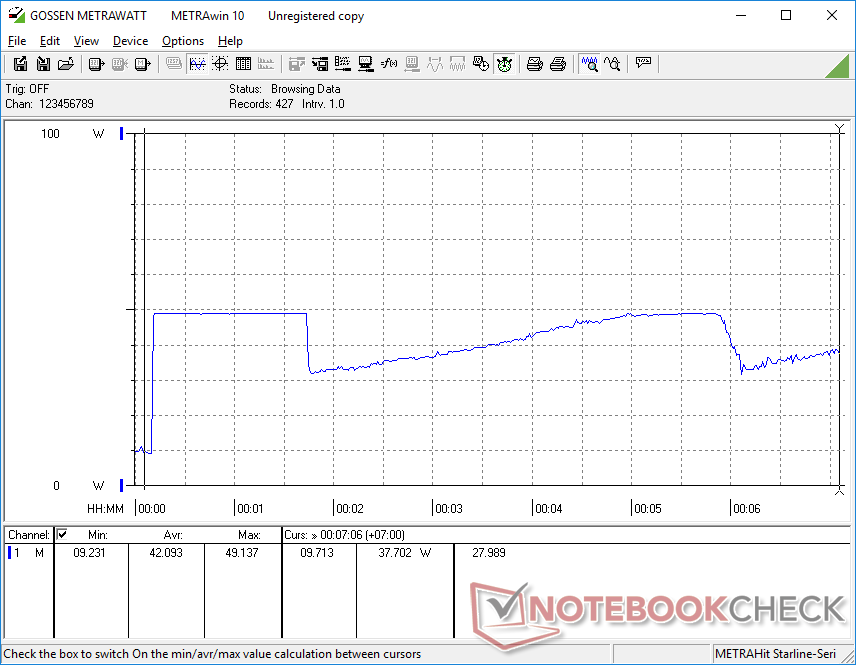
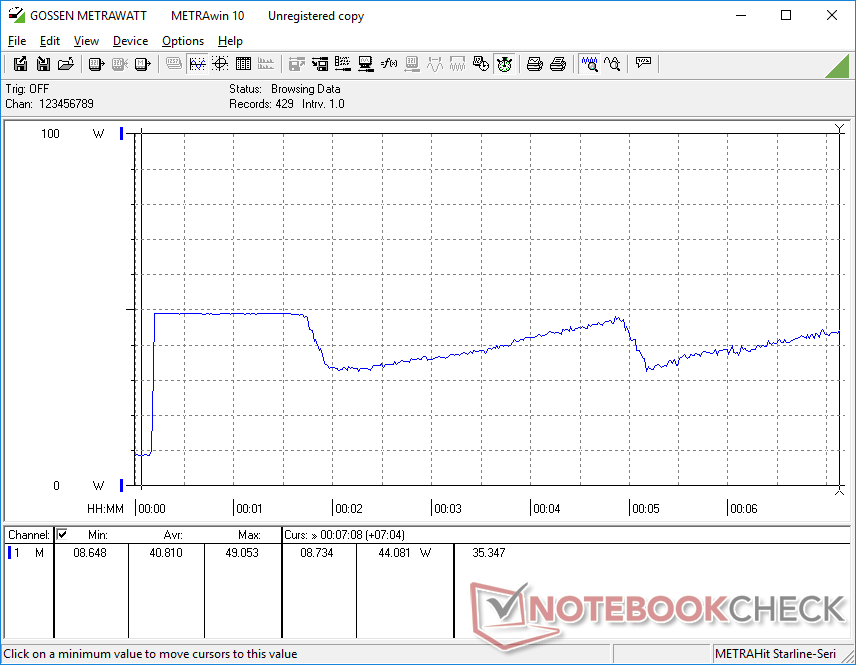
Average power consumption is very close to what we observed on both the last generation XPS 13 9380 and XPS 13 9370 each with 4K UHD panels. After all, they each ship with the same small (~6.0 x 5.5 x 2.3 cm) 45 W USB Type-C AC adapter that can also be used to recharge USB Type-C devices and compatible laptops with USB Type-C PD. Nonetheless, power consumption will cycle when under extreme processing stress as shown by our graphs below.
| Off / Standby | |
| Idle | |
| Load |
|
Key:
min: | |
| Dell XPS 13 7390 Core i7-10710U i7-10710U, UHD Graphics 620, SK Hynix PC601 NVMe 512 GB, IPS, 3840x2160, 13.3" | Dell XPS 13 7390 2-in-1 Core i7 i7-1065G7, Iris Plus Graphics G7 (Ice Lake 64 EU), Toshiba BG4 KBG40ZPZ512G, IPS, 1920x1200, 13.4" | Dell XPS 13 7390 2-in-1 Core i3 i3-1005G1, UHD Graphics G1 (Ice Lake 32 EU), Toshiba BG4 KBG40ZPZ256G, IPS, 1920x1200, 13.4" | Dell XPS 13 9380 i7 4K i7-8565U, UHD Graphics 620, Samsung SSD PM981 MZVLB512HAJQ, IPS, 3840x2160, 13.3" | Dell XPS 13 9380 2019 i5-8265U, UHD Graphics 620, SK hynix PC401 HFS256GD9TNG, IPS, 3840x2160, 13.3" | Dell XPS 13 9370 i7 UHD i5-8550U, UHD Graphics 620, Toshiba XG5 KXG50ZNV512G, IPS, 3840x2160, 13.3" | |
|---|---|---|---|---|---|---|
| Power Consumption | 20% | 22% | -7% | -2% | -3% | |
| Idle Minimum * (Watt) | 4.7 | 2.6 45% | 3 36% | 5.2 -11% | 4.8 -2% | 5 -6% |
| Idle Average * (Watt) | 8.3 | 5.3 36% | 5.4 35% | 8.6 -4% | 8.6 -4% | 8.3 -0% |
| Idle Maximum * (Watt) | 9 | 7 22% | 7.3 19% | 10.5 -17% | 10.4 -16% | 8.8 2% |
| Load Average * (Watt) | 42 | 43.1 -3% | 33.4 20% | 44.2 -5% | 37.9 10% | 46.4 -10% |
| Load Maximum * (Watt) | 49 | 49 -0% | 48.3 1% | 47.5 3% | 48.5 1% | 48.6 1% |
| Witcher 3 ultra * (Watt) | 43.1 |
* ... smaller is better
Battery Life
Perhaps as a direct consequence of having similar power consumption behavior as the older XPS 13 9380 and 9370 series, battery life on the new Comet Lake-U option is about the same as its older siblings. Users can expect just over 8 hours of real-world WLAN use before needing to recharge.
| Dell XPS 13 7390 Core i7-10710U i7-10710U, UHD Graphics 620, 52 Wh | Dell XPS 13 7390 2-in-1 Core i7 i7-1065G7, Iris Plus Graphics G7 (Ice Lake 64 EU), 51 Wh | Dell XPS 13 7390 2-in-1 Core i3 i3-1005G1, UHD Graphics G1 (Ice Lake 32 EU), 51 Wh | Dell XPS 13 9380 i7 4K i7-8565U, UHD Graphics 620, 52 Wh | Dell XPS 13 9380 2019 i5-8265U, UHD Graphics 620, 52 Wh | Dell XPS 13 9370 i7 UHD i5-8550U, UHD Graphics 620, 52 Wh | |
|---|---|---|---|---|---|---|
| Battery runtime | 7% | 6% | -8% | -1% | -7% | |
| WiFi v1.3 (h) | 8.4 | 9 7% | 8.9 6% | 7.7 -8% | 8.3 -1% | 7.8 -7% |
| Reader / Idle (h) | 35.7 | 17.2 | 13.7 | |||
| Load (h) | 2.2 | 2.4 | 1.8 |
Pros
Cons
Verdict
Do you really need a hexa-core processor for a subnotebook? If your intention is to use for the XPS 13 mostly for web browsing, video streaming, word processing, or other light office tasks that the series was initially designed for, then the older quad-core Core i7-8565U will be enough. PCMark 10 scores are so close between the XPS 13 7390 and XPS 13 9380 that it becomes hard to justify the price premium for owning a hexa-core XPS 13 especially since most users won't feel the difference during day-to-day loads.
On the other hand, power users who want to exploit the two additional cores of Comet Lake-U will be happy to find that the raw multi-thread performance boost over Whiskey Lake-U is quite significant even after accounting for the unsteady cycling clock rates and limited maximum Turbo Boost sustainability. If you frequently run programs that can benefit from additional threads or want to connect eGPU docking stations to your XPS 13, then the hexa-core Core i7-10710U SKU would be worthwhile.
The hexa-core XPS 13 7390 is for power users who want the performance of a baseline Core i5 XPS 15 in a smaller 13.3-inch package. The system is able to offer increased performance without any noticeable drawbacks to battery life, surface temperatures, power consumption, or fan noise.
Dell XPS 13 7390 Core i7-10710U
- 05/15/2020 v7 (old)
Allen Ngo
Price comparison
