Dell G7 15 7590 Laptop Review: Alienware Performance for Less
The Dell G7 7590 is a successor to last year's G7 7588 with updated 9th gen Coffee Lake-H CPUs, Turing GPUs, and a brand new chassis design. As an upper mid-range gaming machine, the G7 sits between the budget G3 and pricier flagship Alienware series.
Current SKUs range from the quad-core Core i5-9300H CPU, GeForce GTX 1650 GPU, and 60 Hz 1080p display for $980 up to the Core i9-9980H, RTX 2080 Max-Q, and 4K UHD OLED for $2280 USD. These higher-end components can also be found on the Alienware series meaning that the G7 7590 can offer enthusiast-level performance at lower prices. Our test unit today is the middle SKU with the Core i7-9750H, RTX 2060 GPU, and 1080p144 display retailing for about $1500 USD.
Competitors to the G7 7590 include other 15.6-inch mid-range gaming laptops like the Lenovo Legion Y740-15, Asus Strix Scar III G531, Aorus 15, Acer Predator Helios, and the MSI GL65.
More Dell reviews:
Rating | Date | Model | Weight | Height | Size | Resolution | Price |
|---|---|---|---|---|---|---|---|
| 82.3 % v7 (old) | 10 / 2019 | Dell G7 7590 i7-9750H, GeForce RTX 2060 Mobile | 2.5 kg | 19.9 mm | 15.60" | 1920x1080 | |
| 80.8 % v7 (old) | 10 / 2019 | MSI GL65 9SEK i7-9750H, GeForce RTX 2060 Mobile | 2.3 kg | 27.5 mm | 15.60" | 1920x1080 | |
| 85.5 % v6 (old) | 06 / 2019 | Aorus 15-SA i7-9750H, GeForce GTX 1660 Ti Mobile | 2.1 kg | 24.4 mm | 15.60" | 1920x1080 | |
| 84.5 % v6 (old) | 08 / 2018 | Dell G7 15-7588 i7-8750H, GeForce GTX 1060 Max-Q | 2.6 kg | 24.95 mm | 15.60" | 1920x1080 |
Case
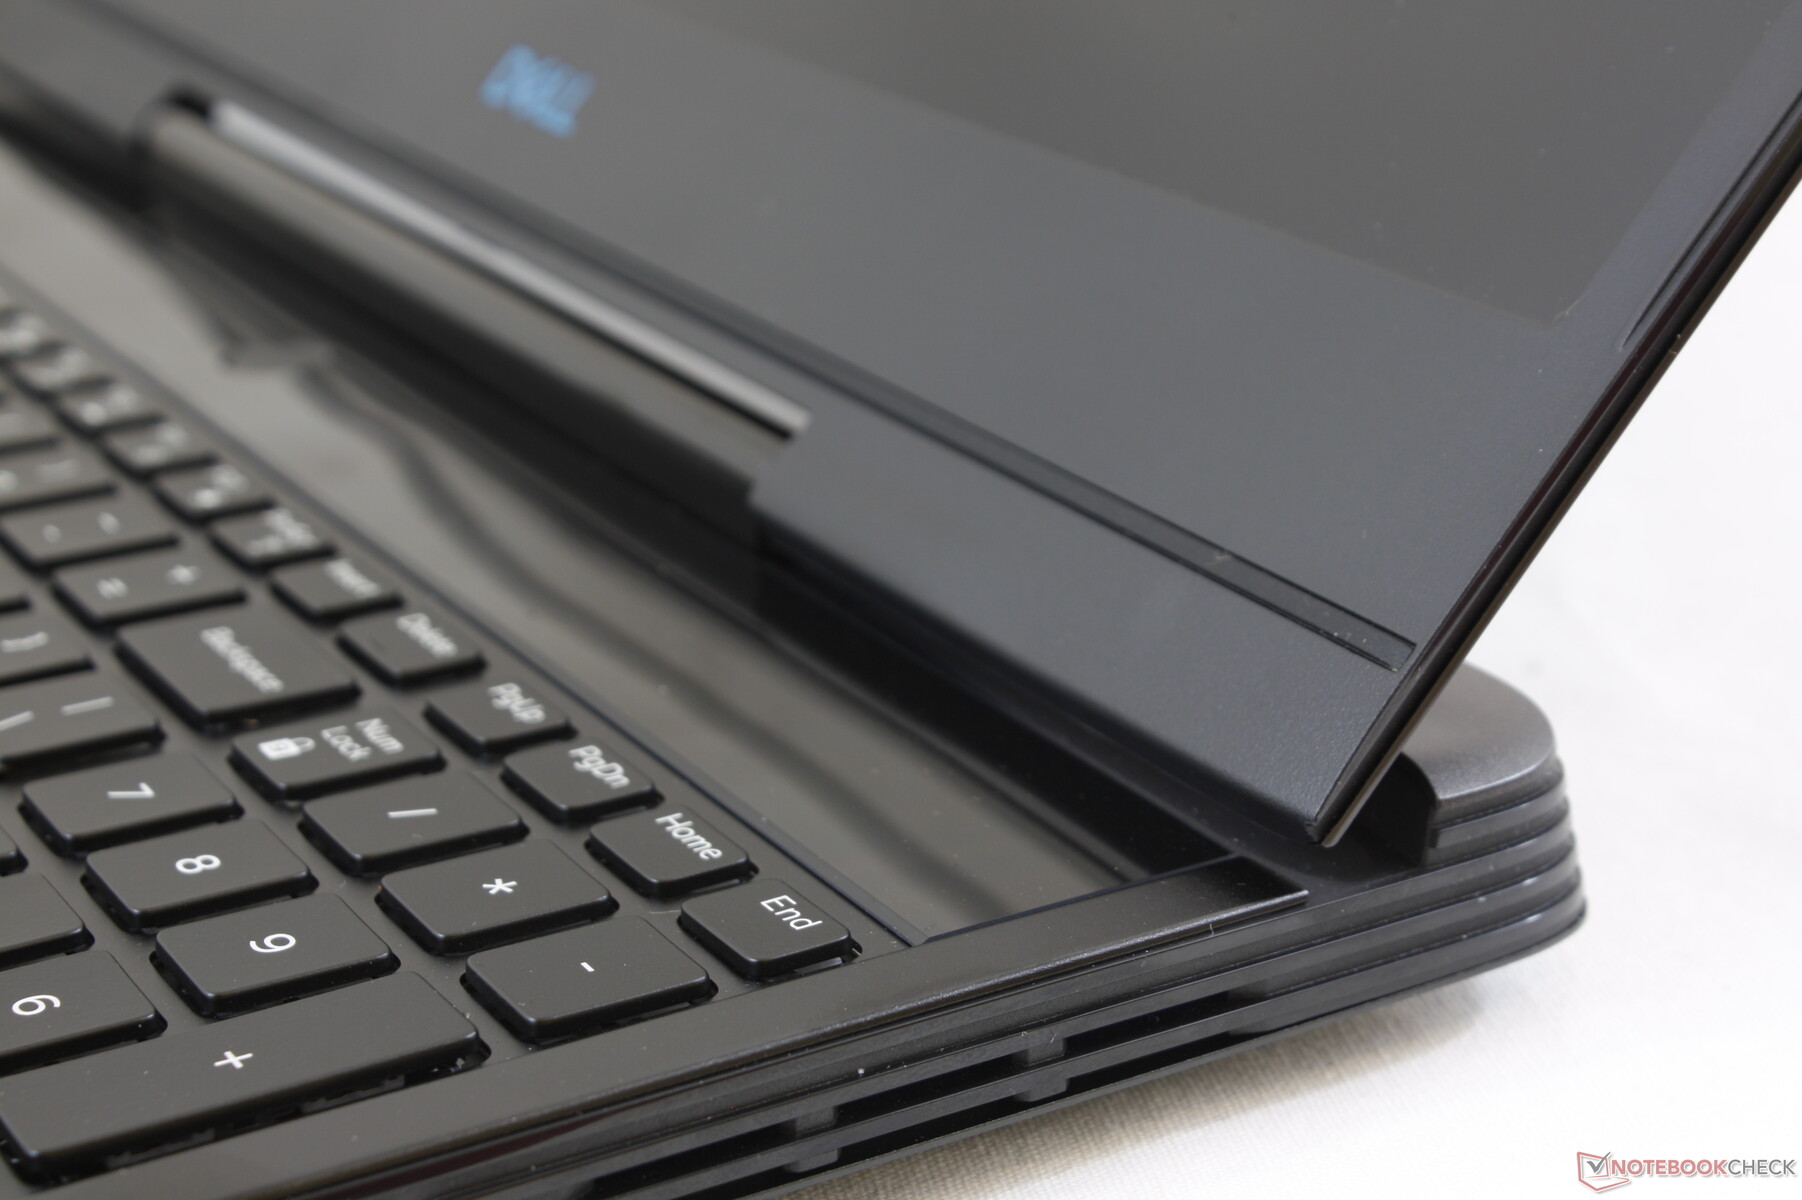
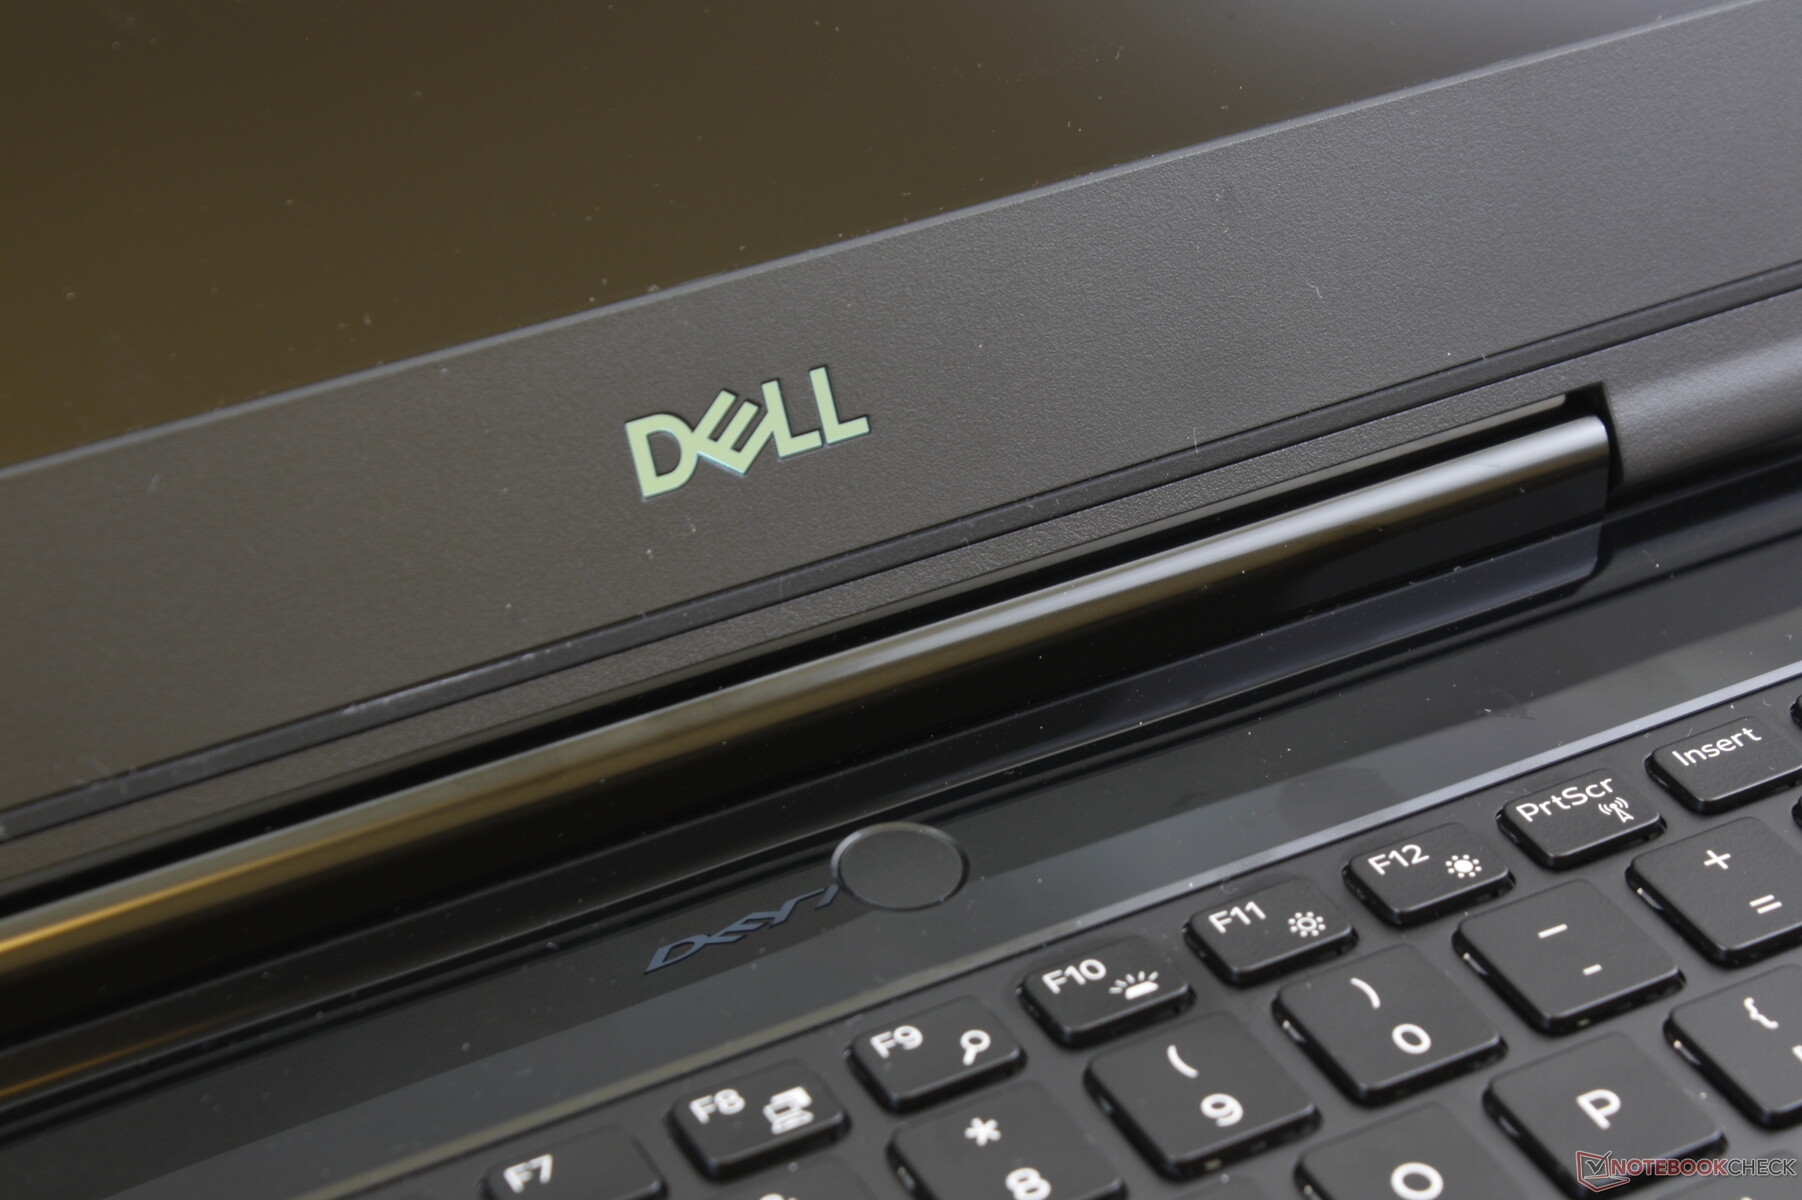
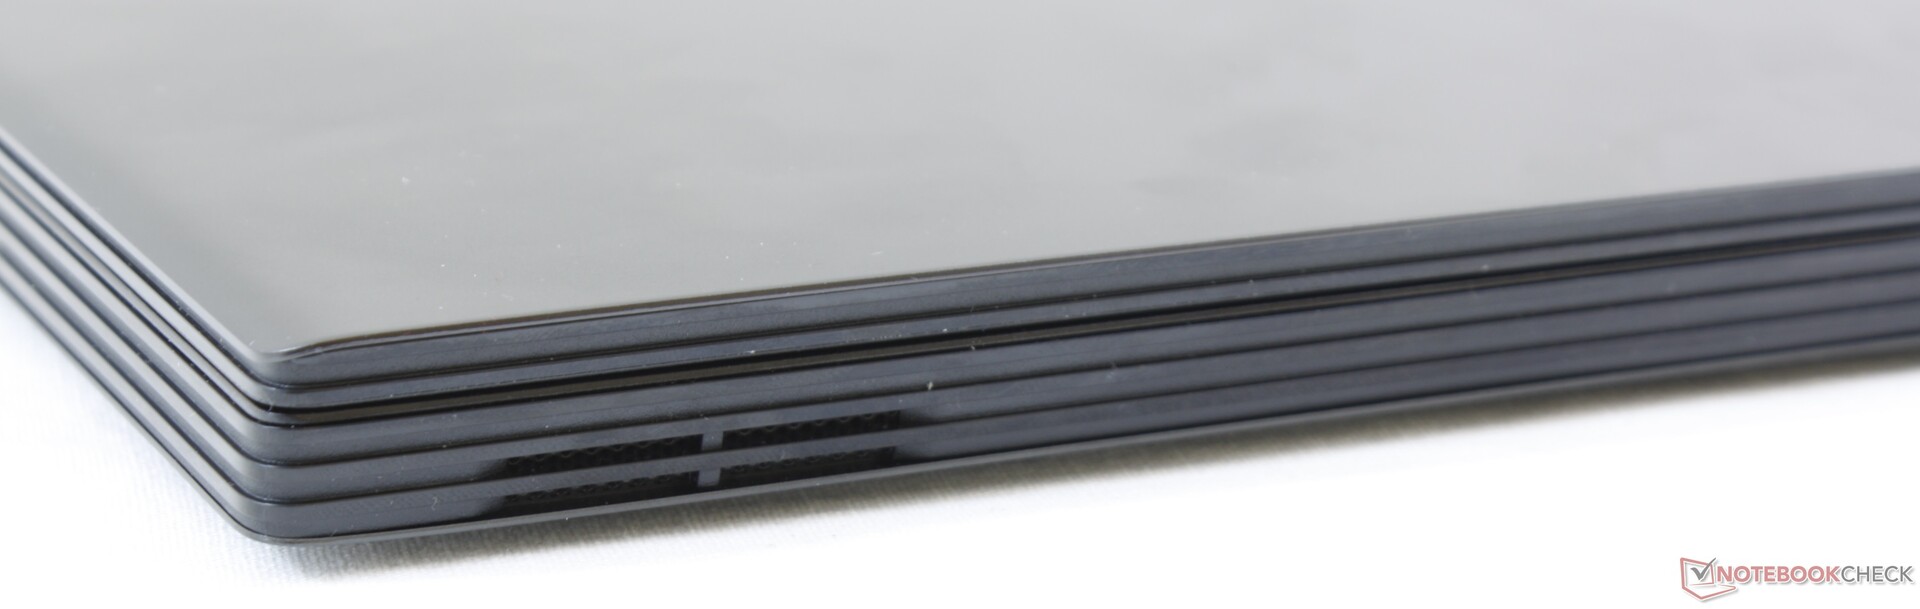
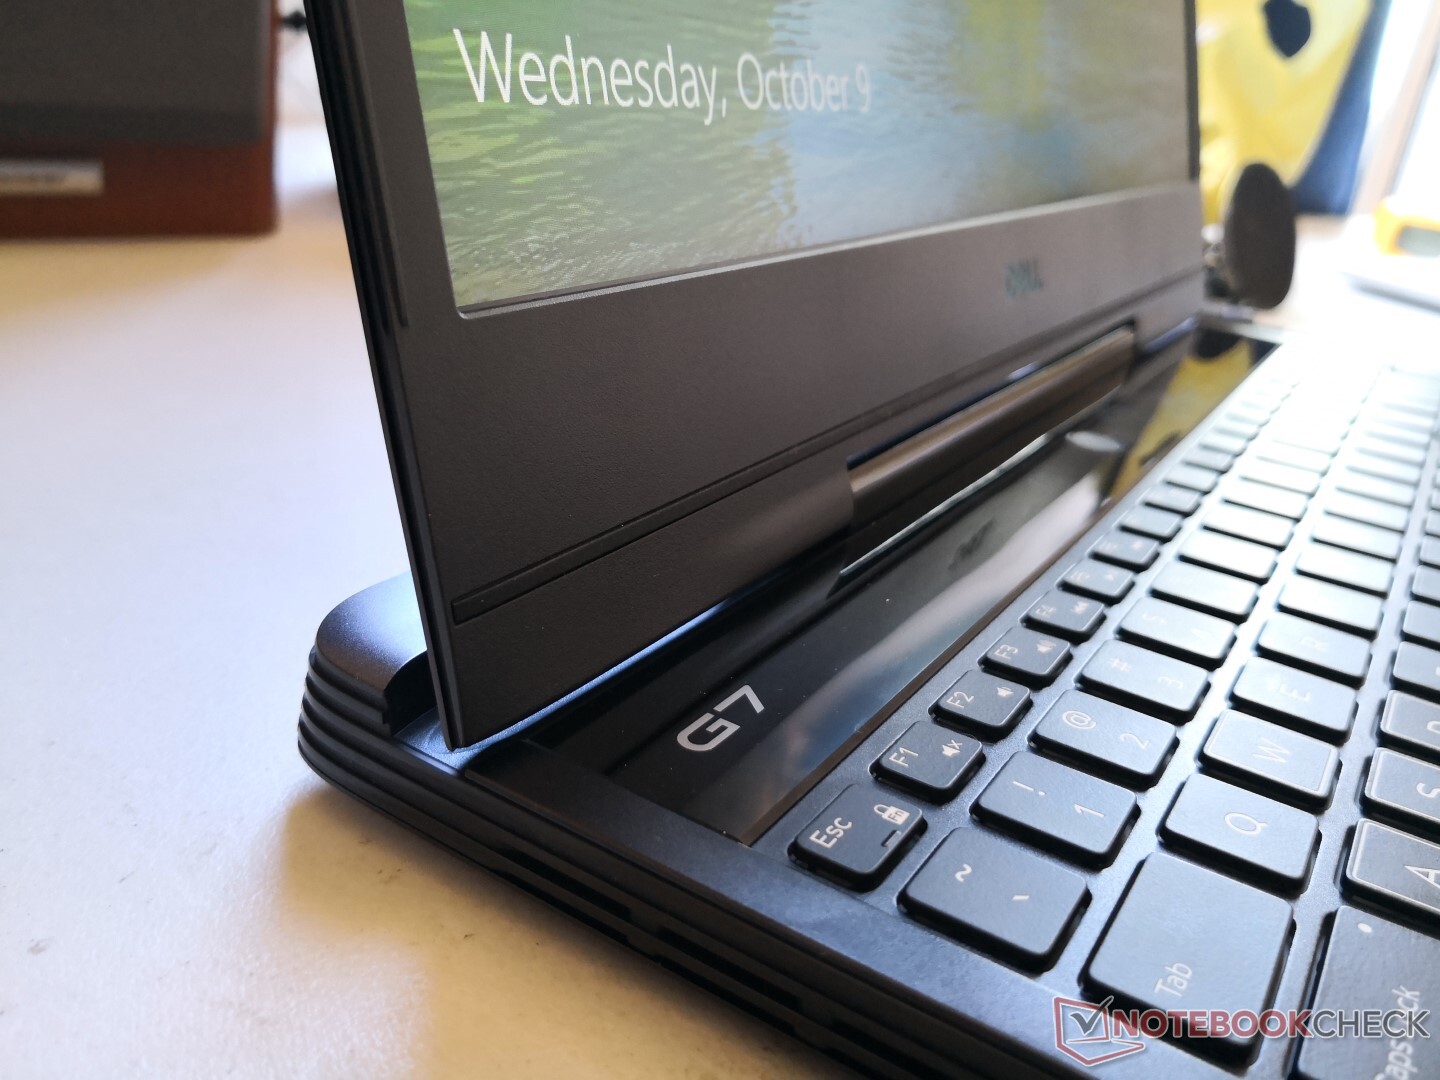
Visually, the chassis is a huge improvement over last year's G7 7588. Gone are the thick white plastics in favor of slimmer and flatter metal surfaces. The base is firm and it doesn't creak or twist when attempting to bend its corners unlike on the MSI GL65 or Lenovo Legion Y740. Its keyboard center is also very resistant to warping and pressure.
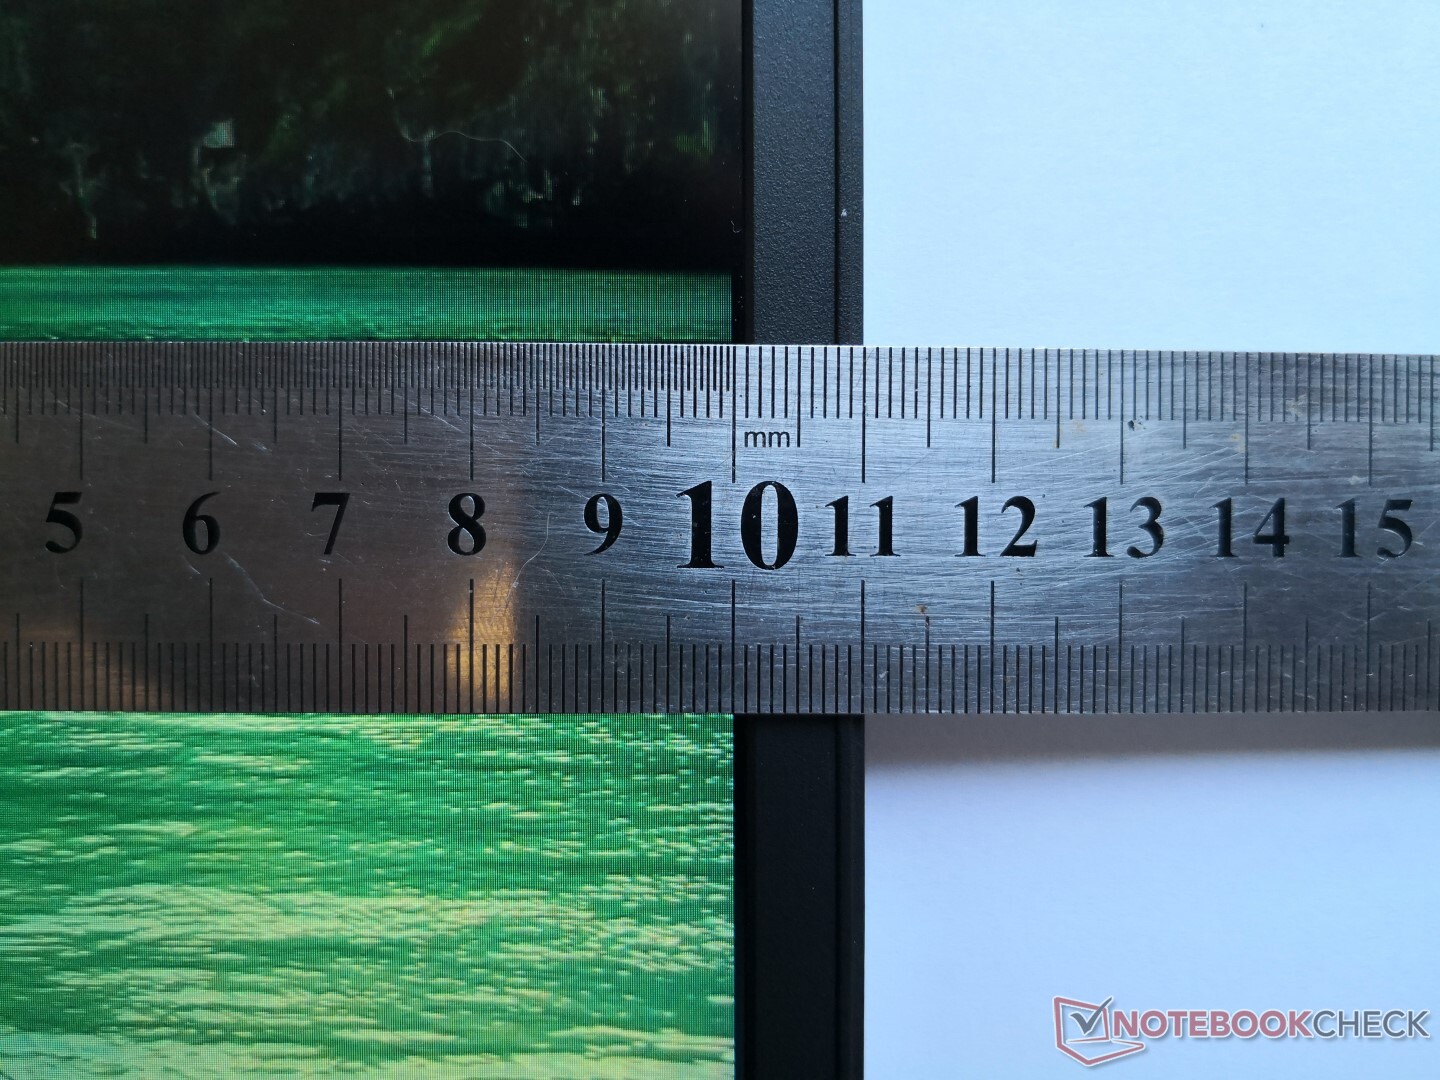
Lid rigidity is the weakest aspect of the chassis. The narrower bezels look nice, but the lid is more prone to flexing than we would like to see. Adjusting the display angle will cause slight creaking of the hinges. Systems like the XPS 15 or Asus Strix Scar III have shown that it's possible to have narrow bezels without sacrificing lid rigidity.
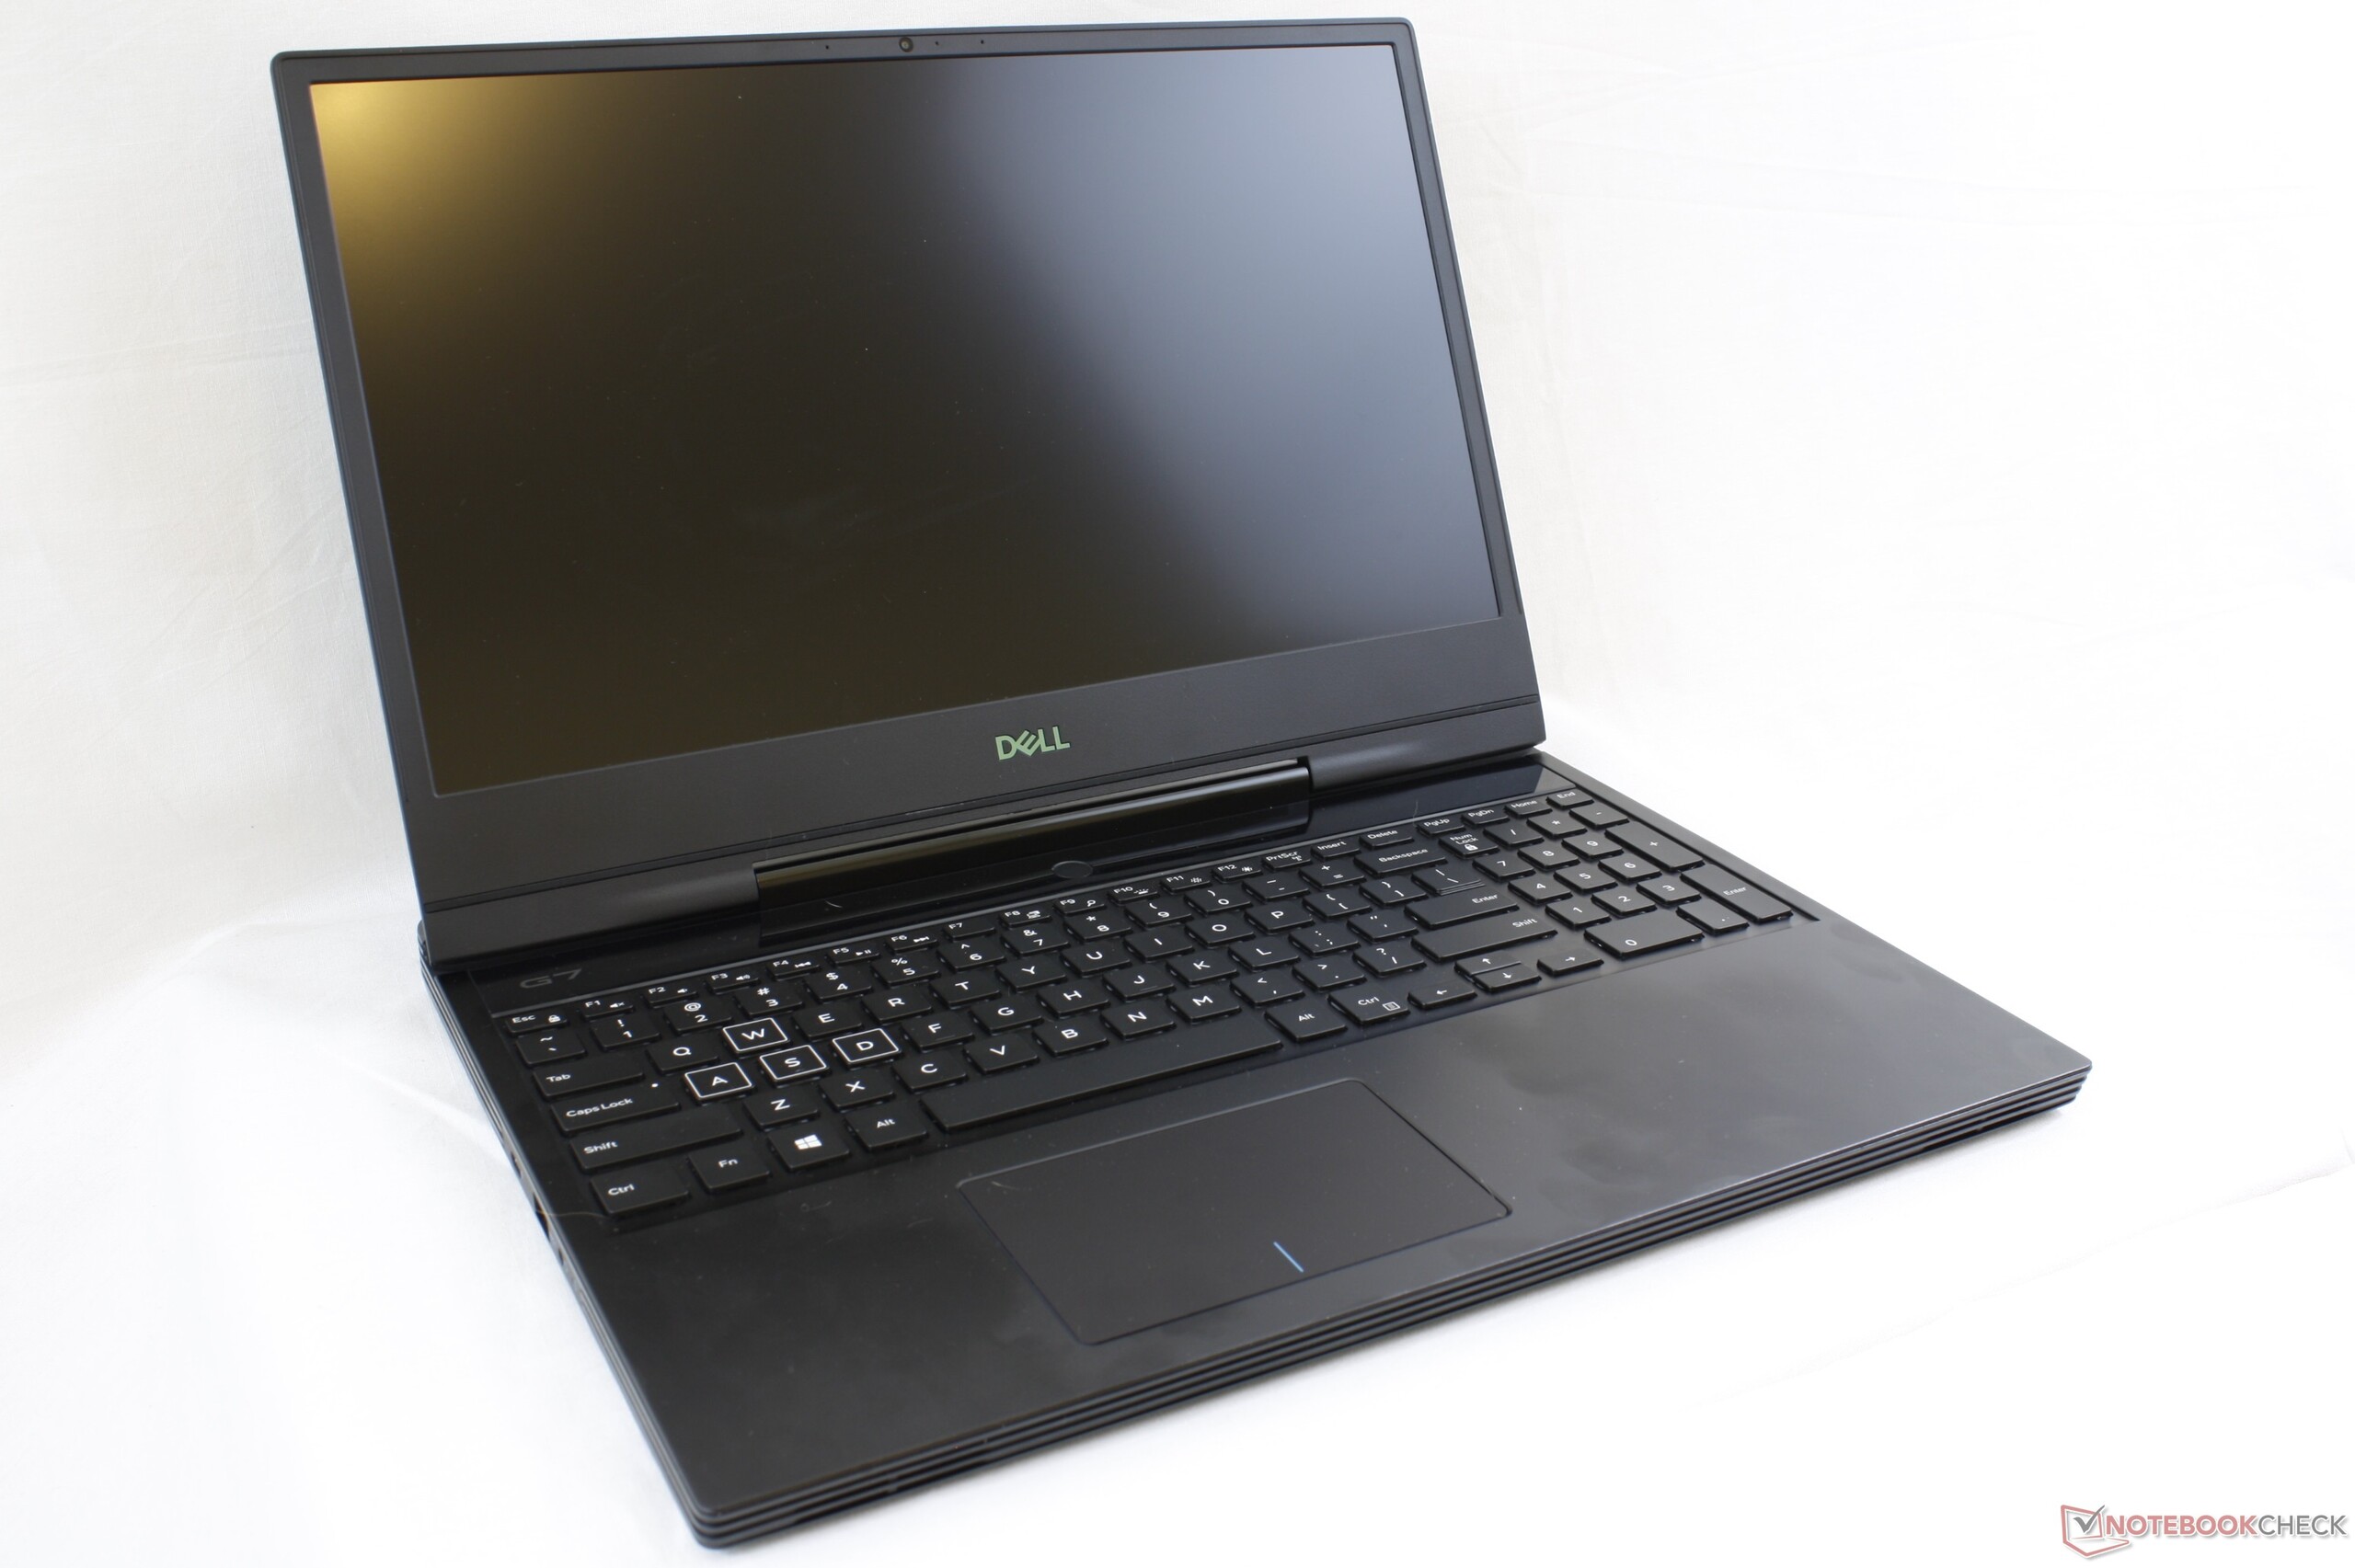

The narrower bezels of the G7 7590 when compared to the G7 7588 have allowed the chassis to be over 25 mm shorter for a noticeably smaller footprint. Overall dimensions are thinner than many mid-range competitors including the Lenovo Legion Y740-15 and Asus Strix Scar III G531 while being slightly heavier by 100 to 200 grams each.
Connectivity
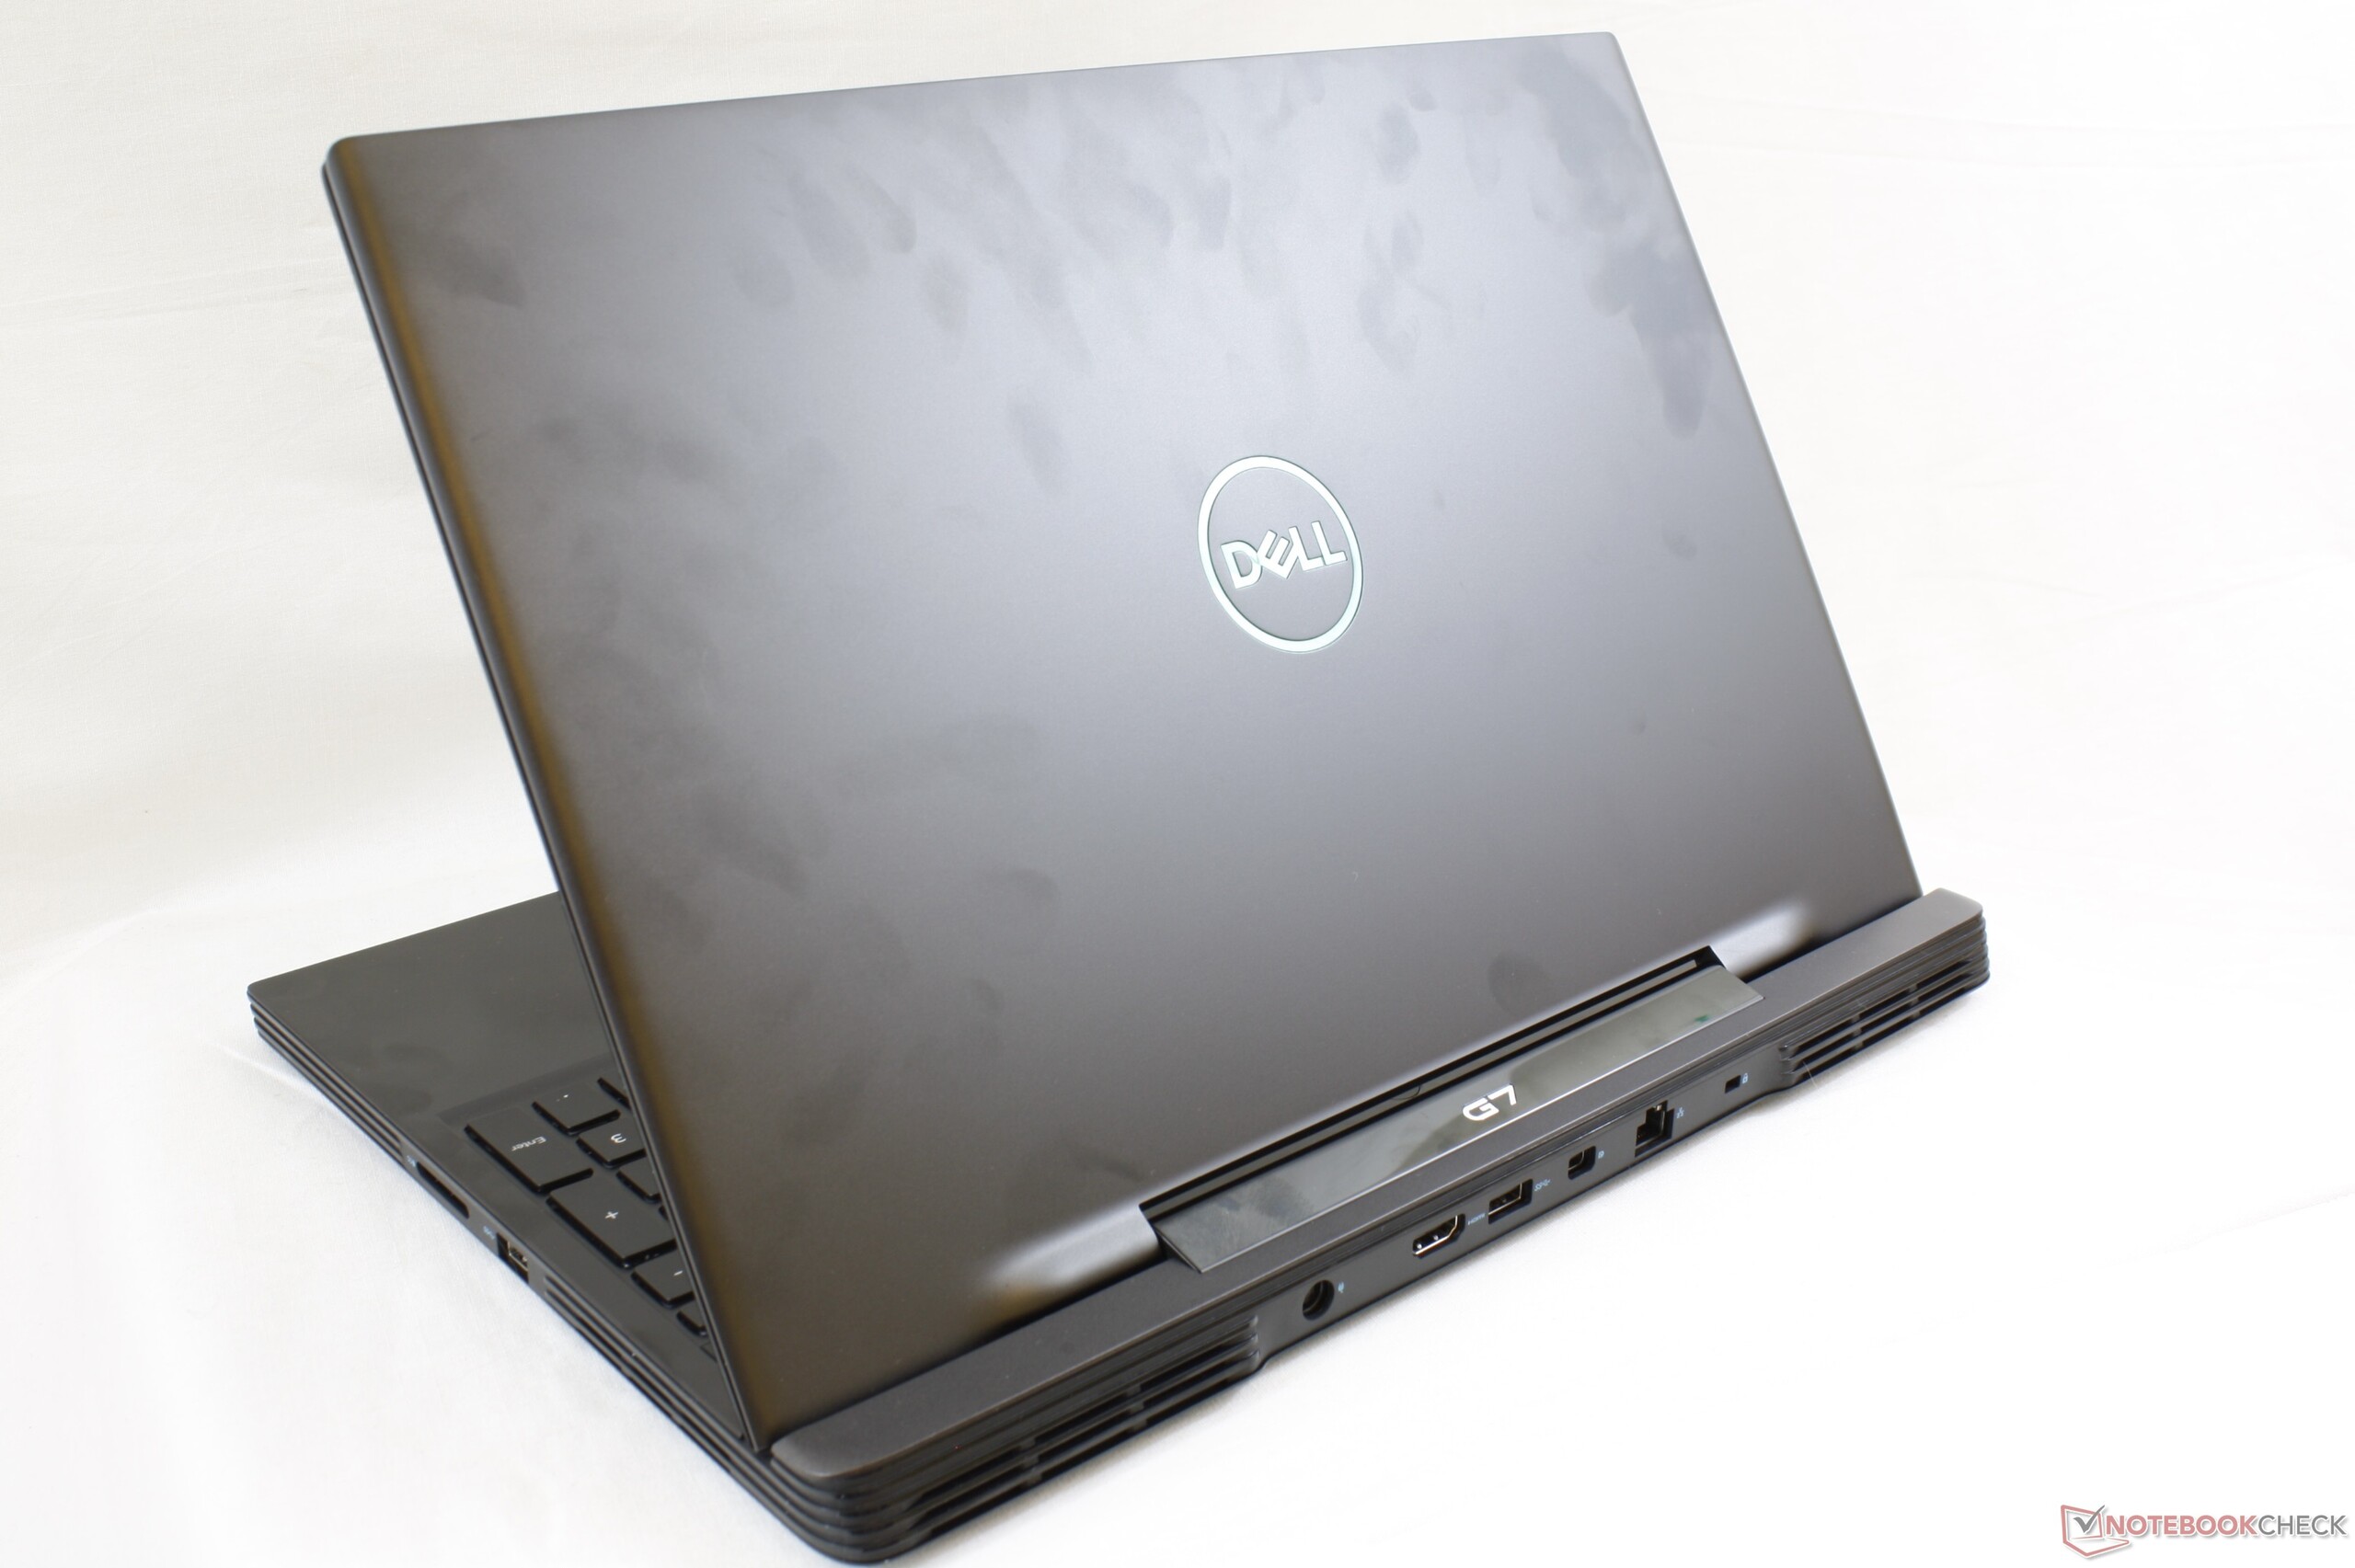
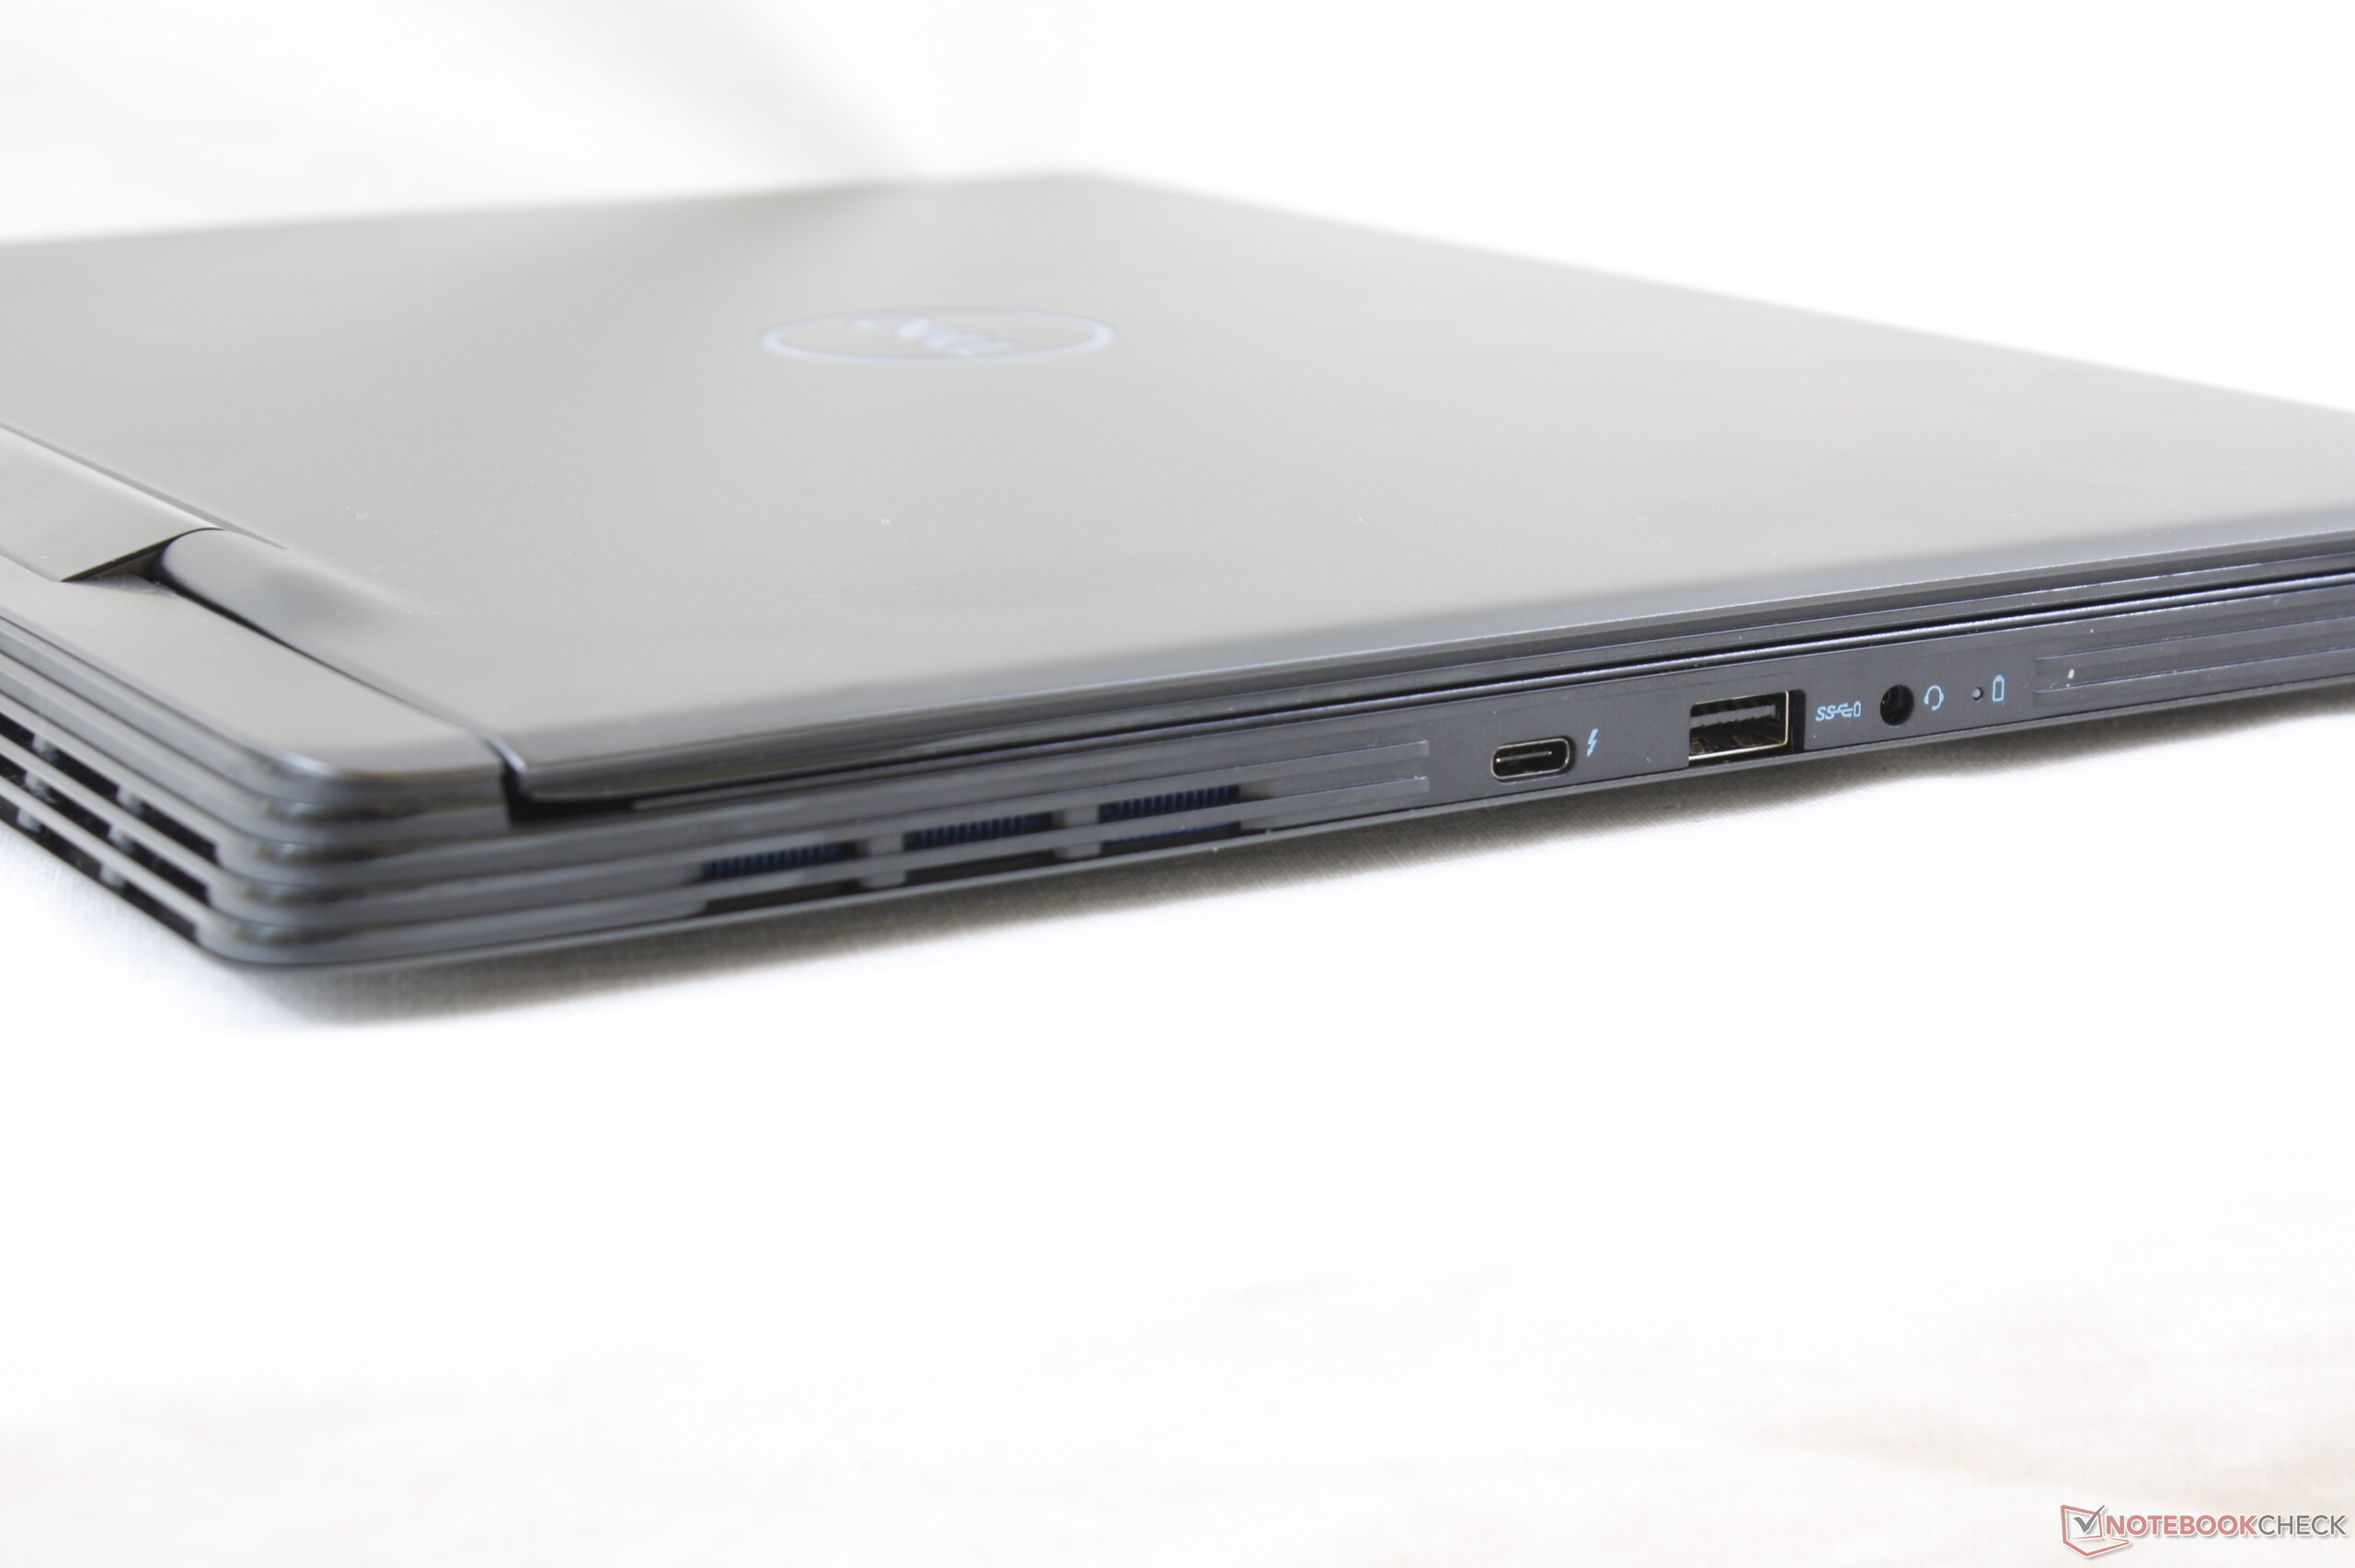
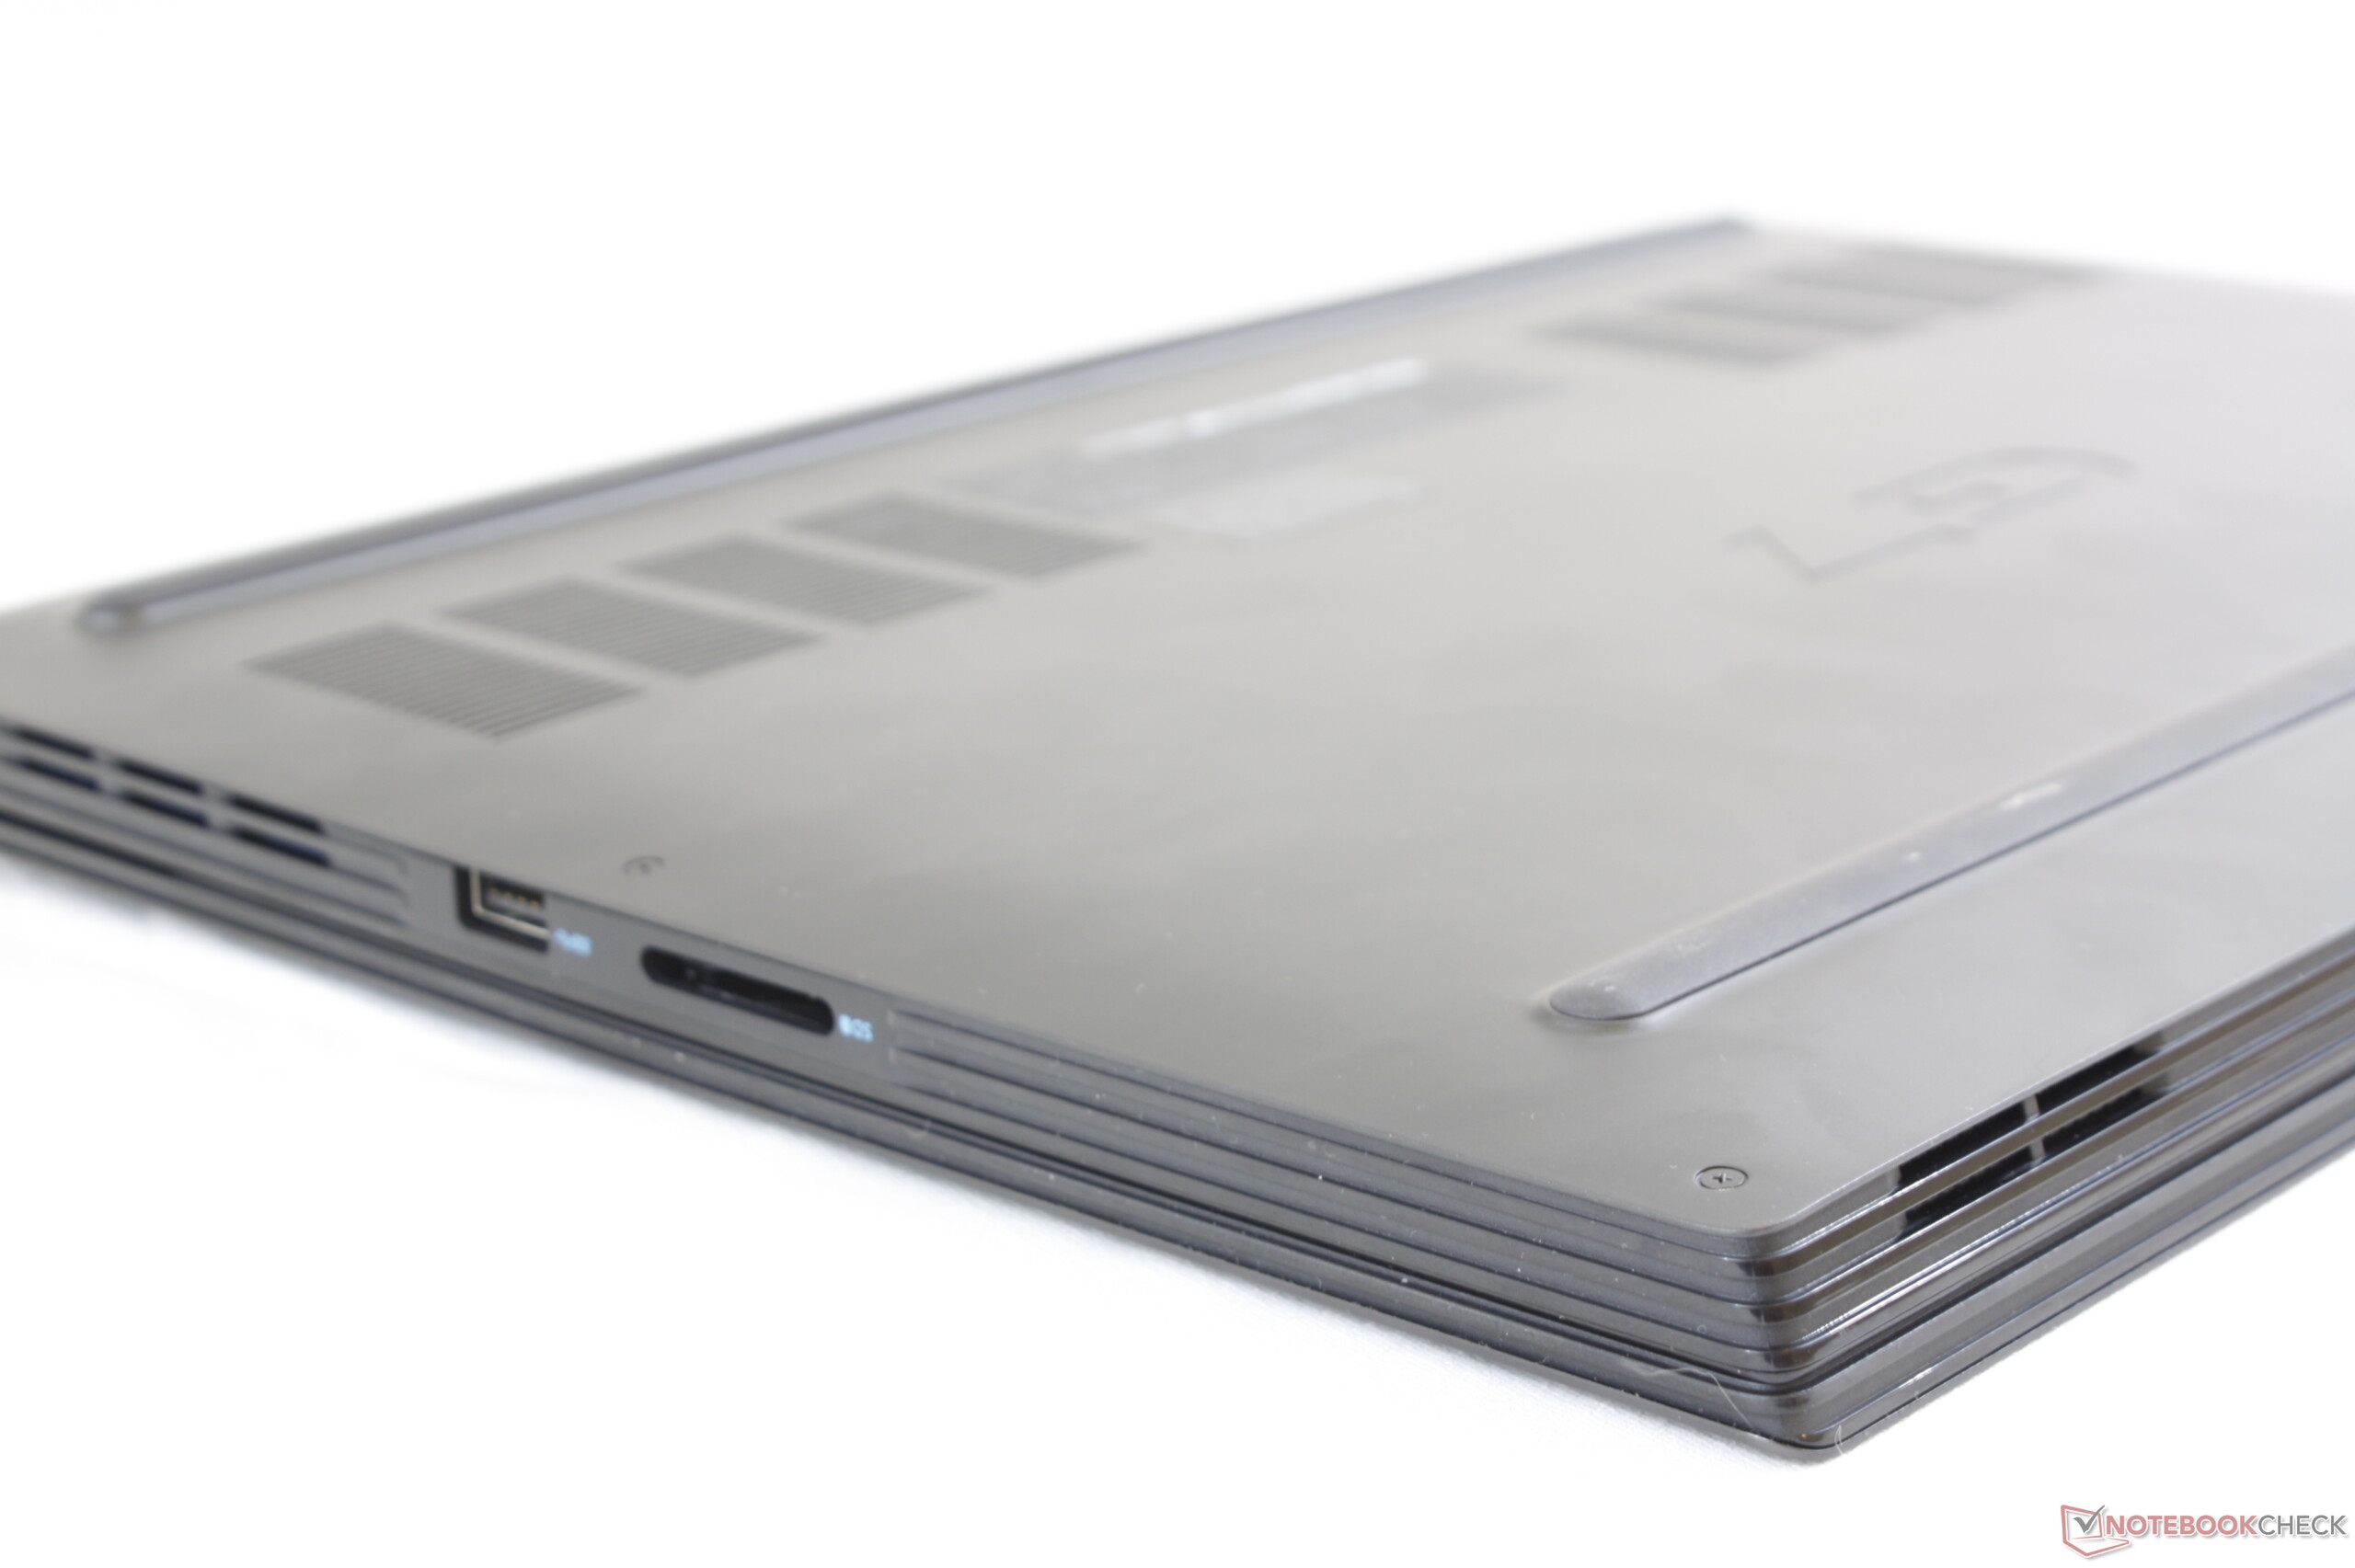
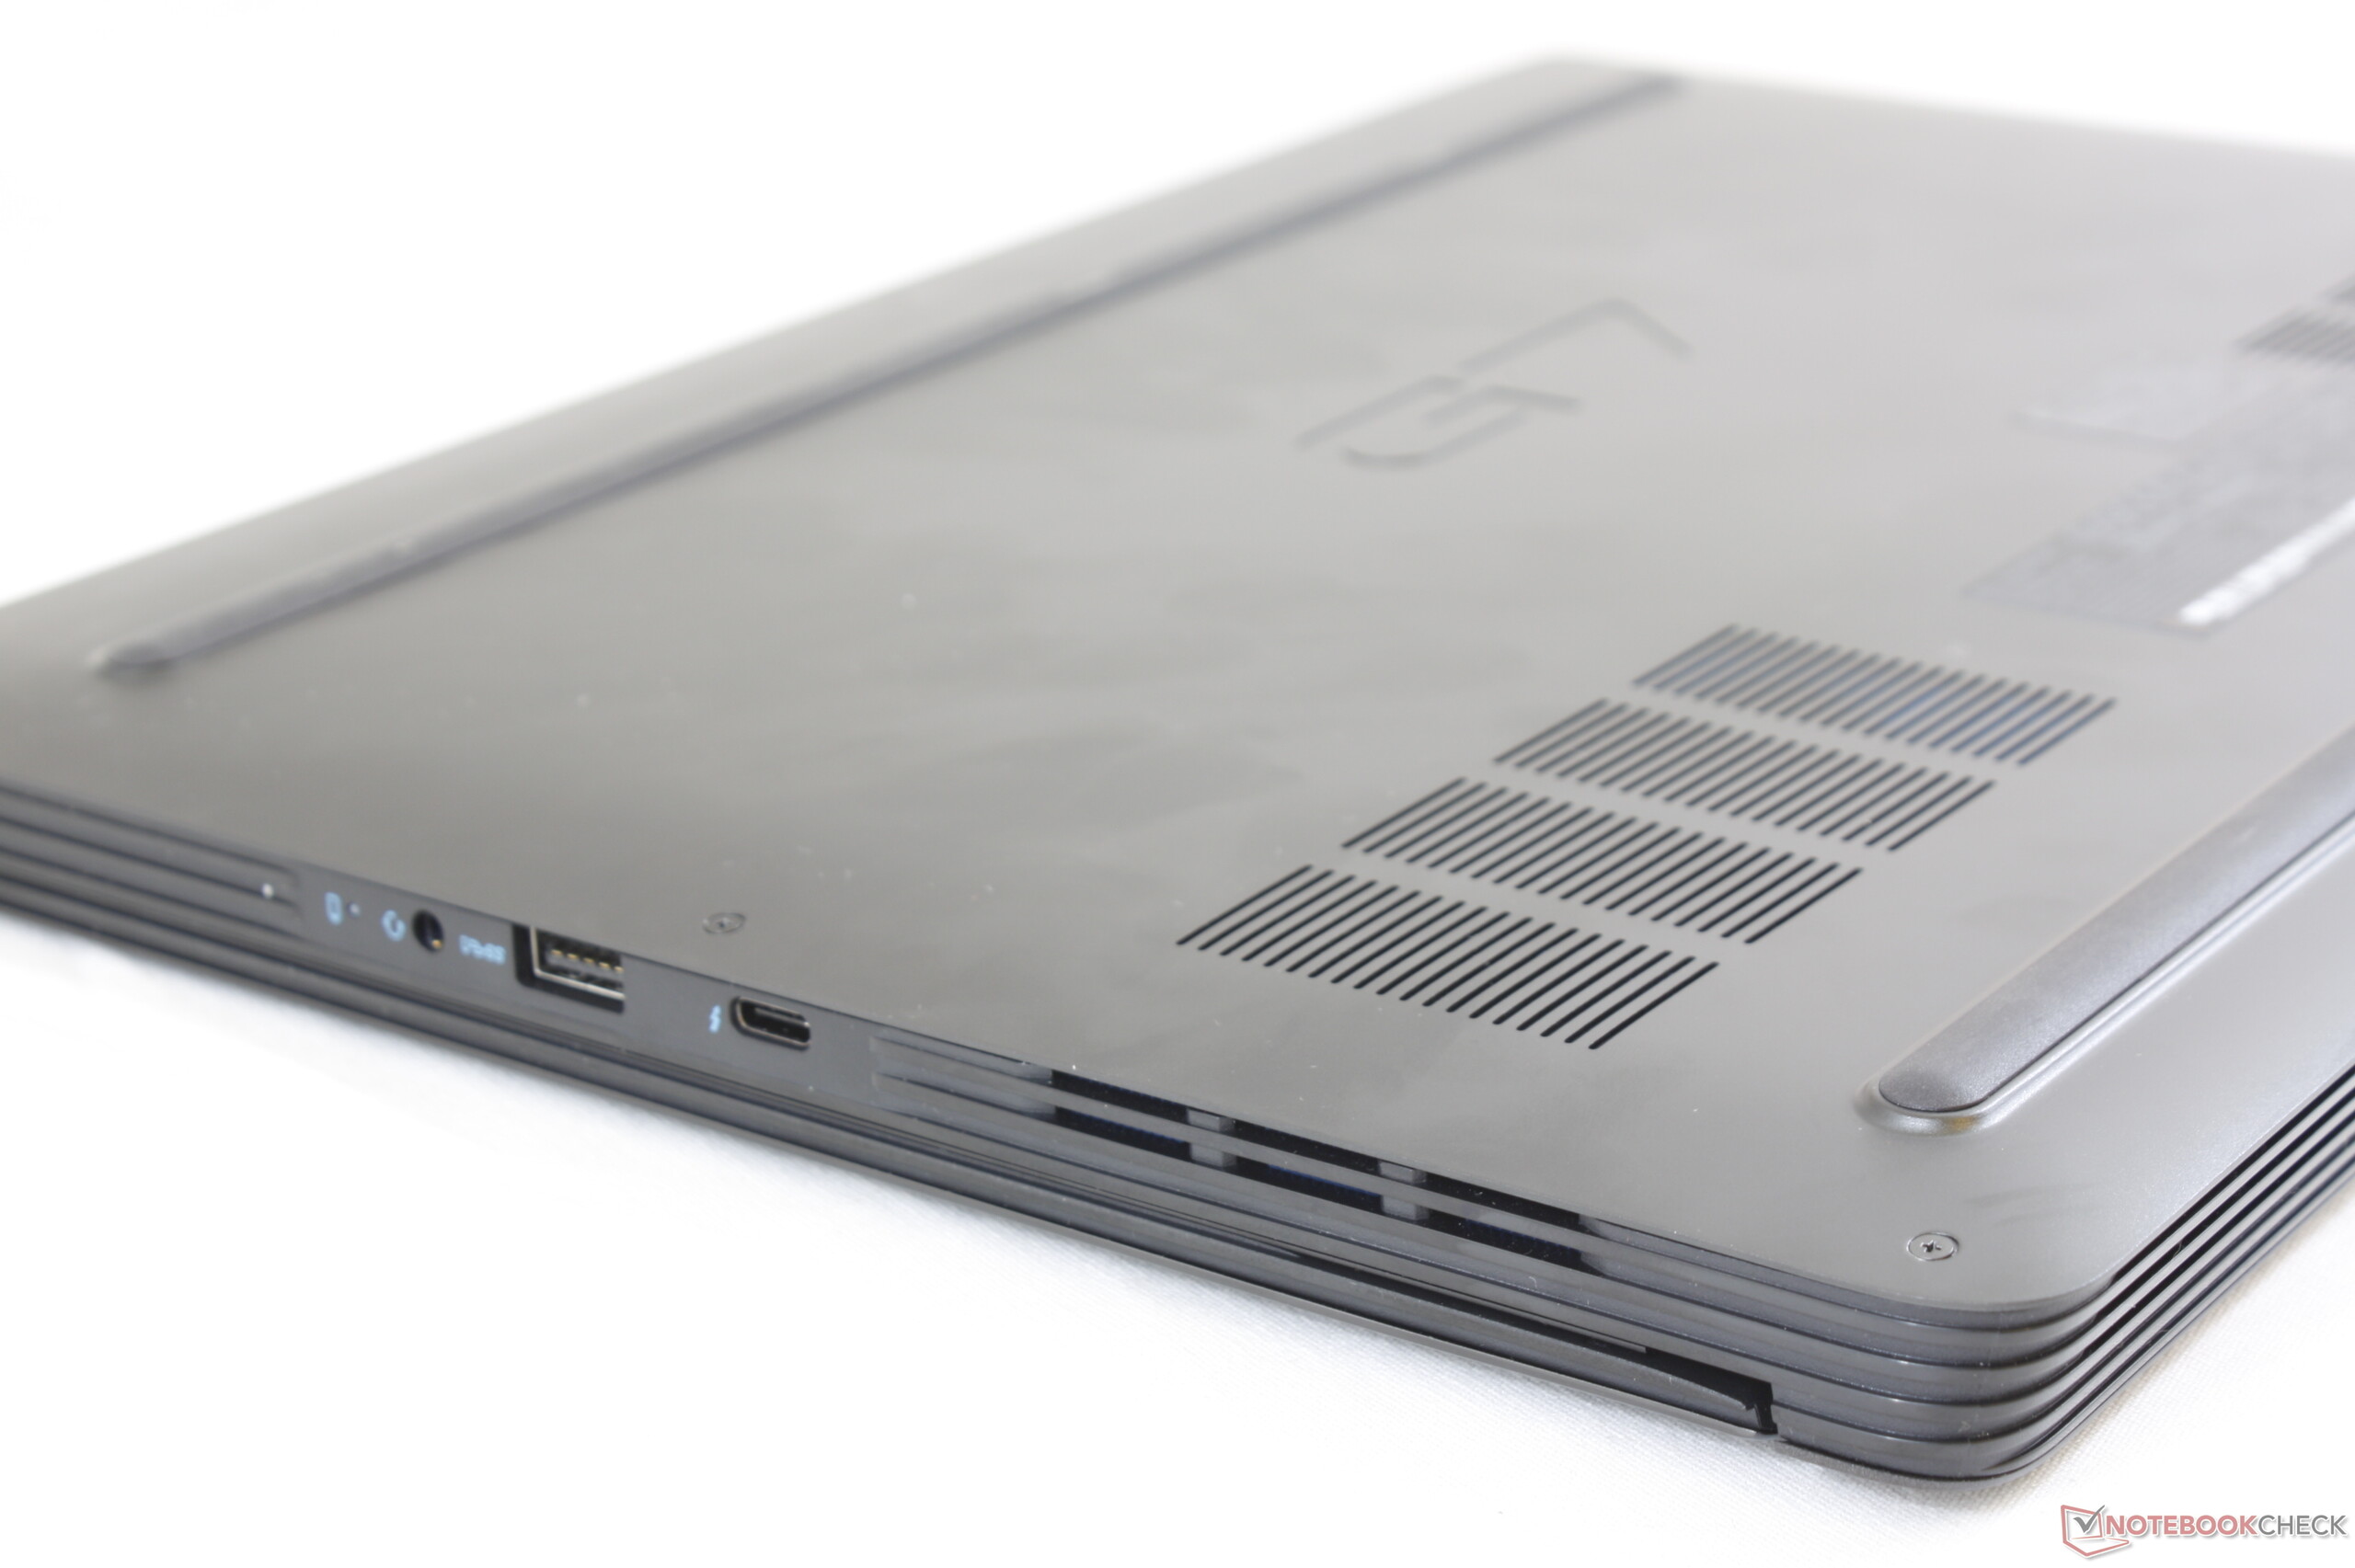
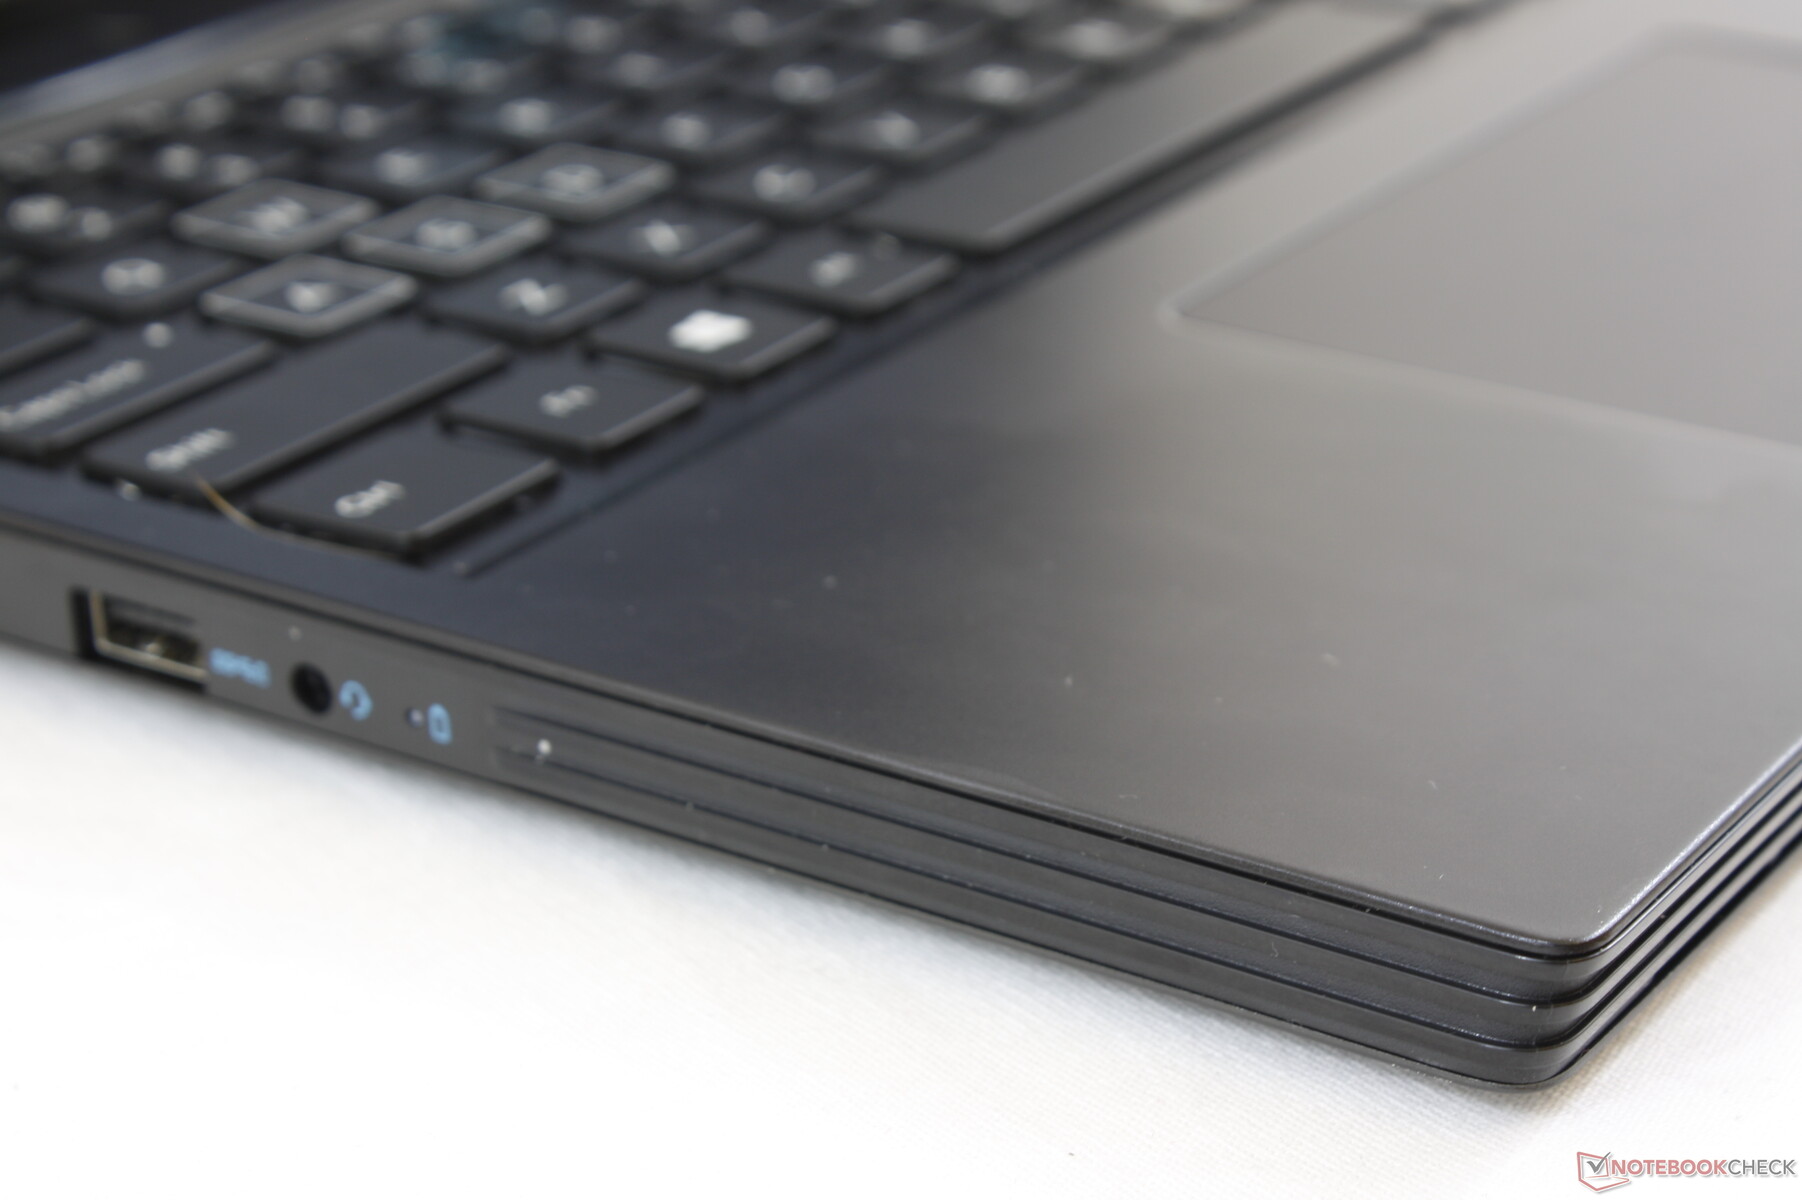
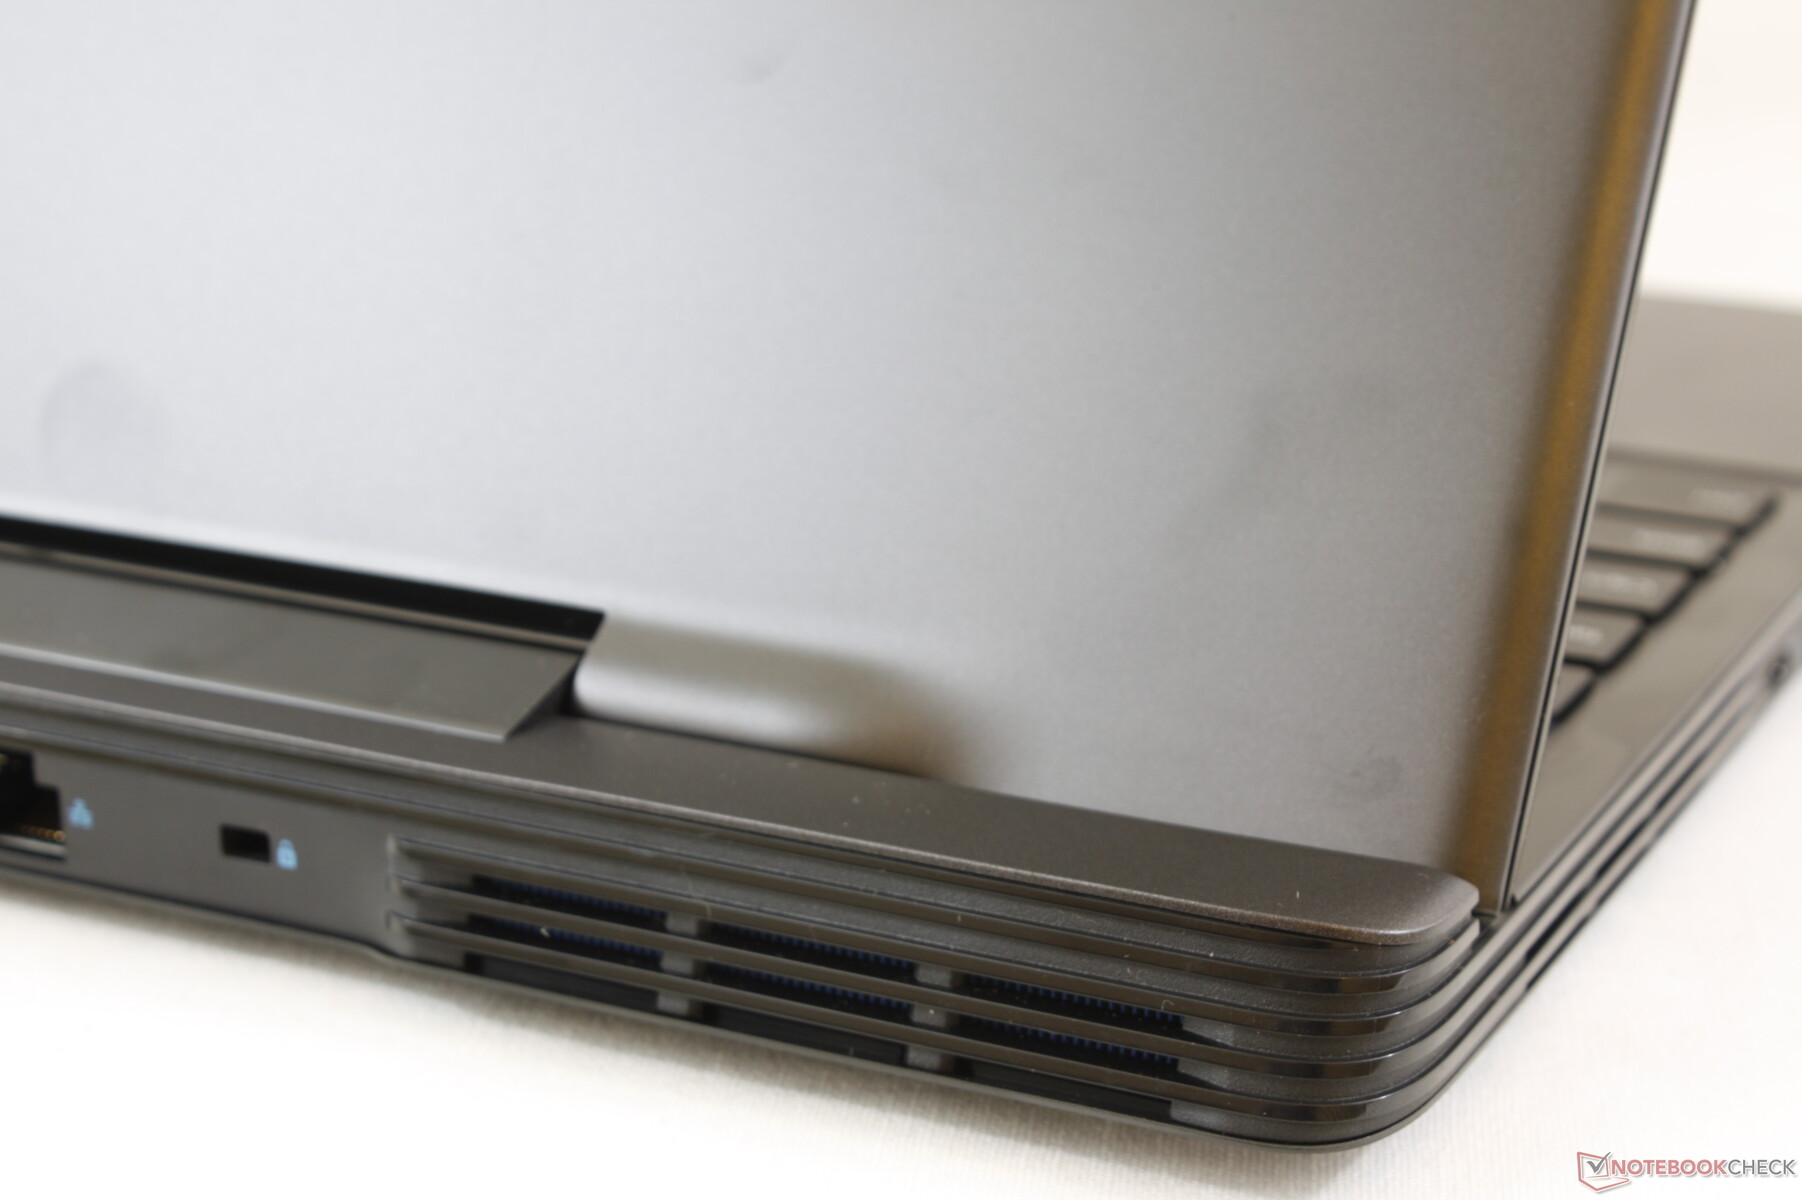
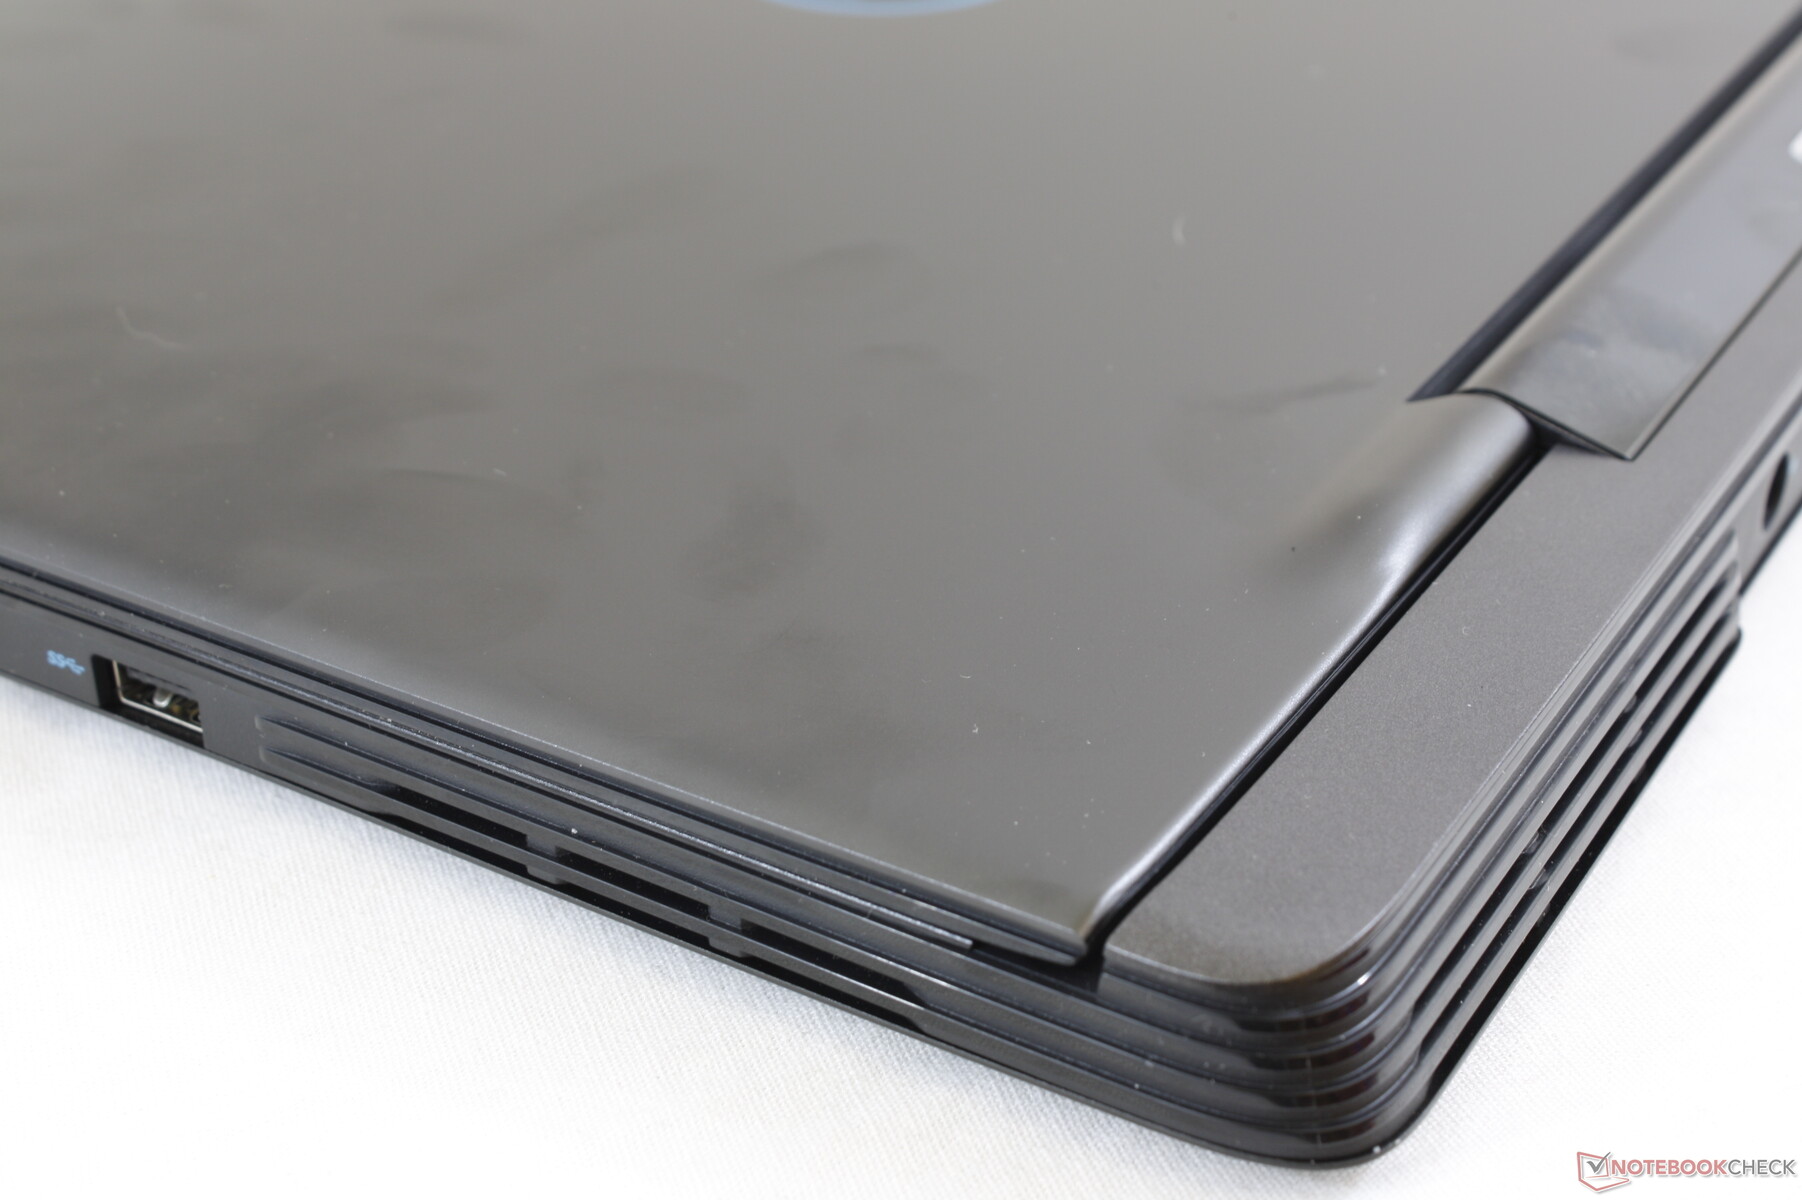
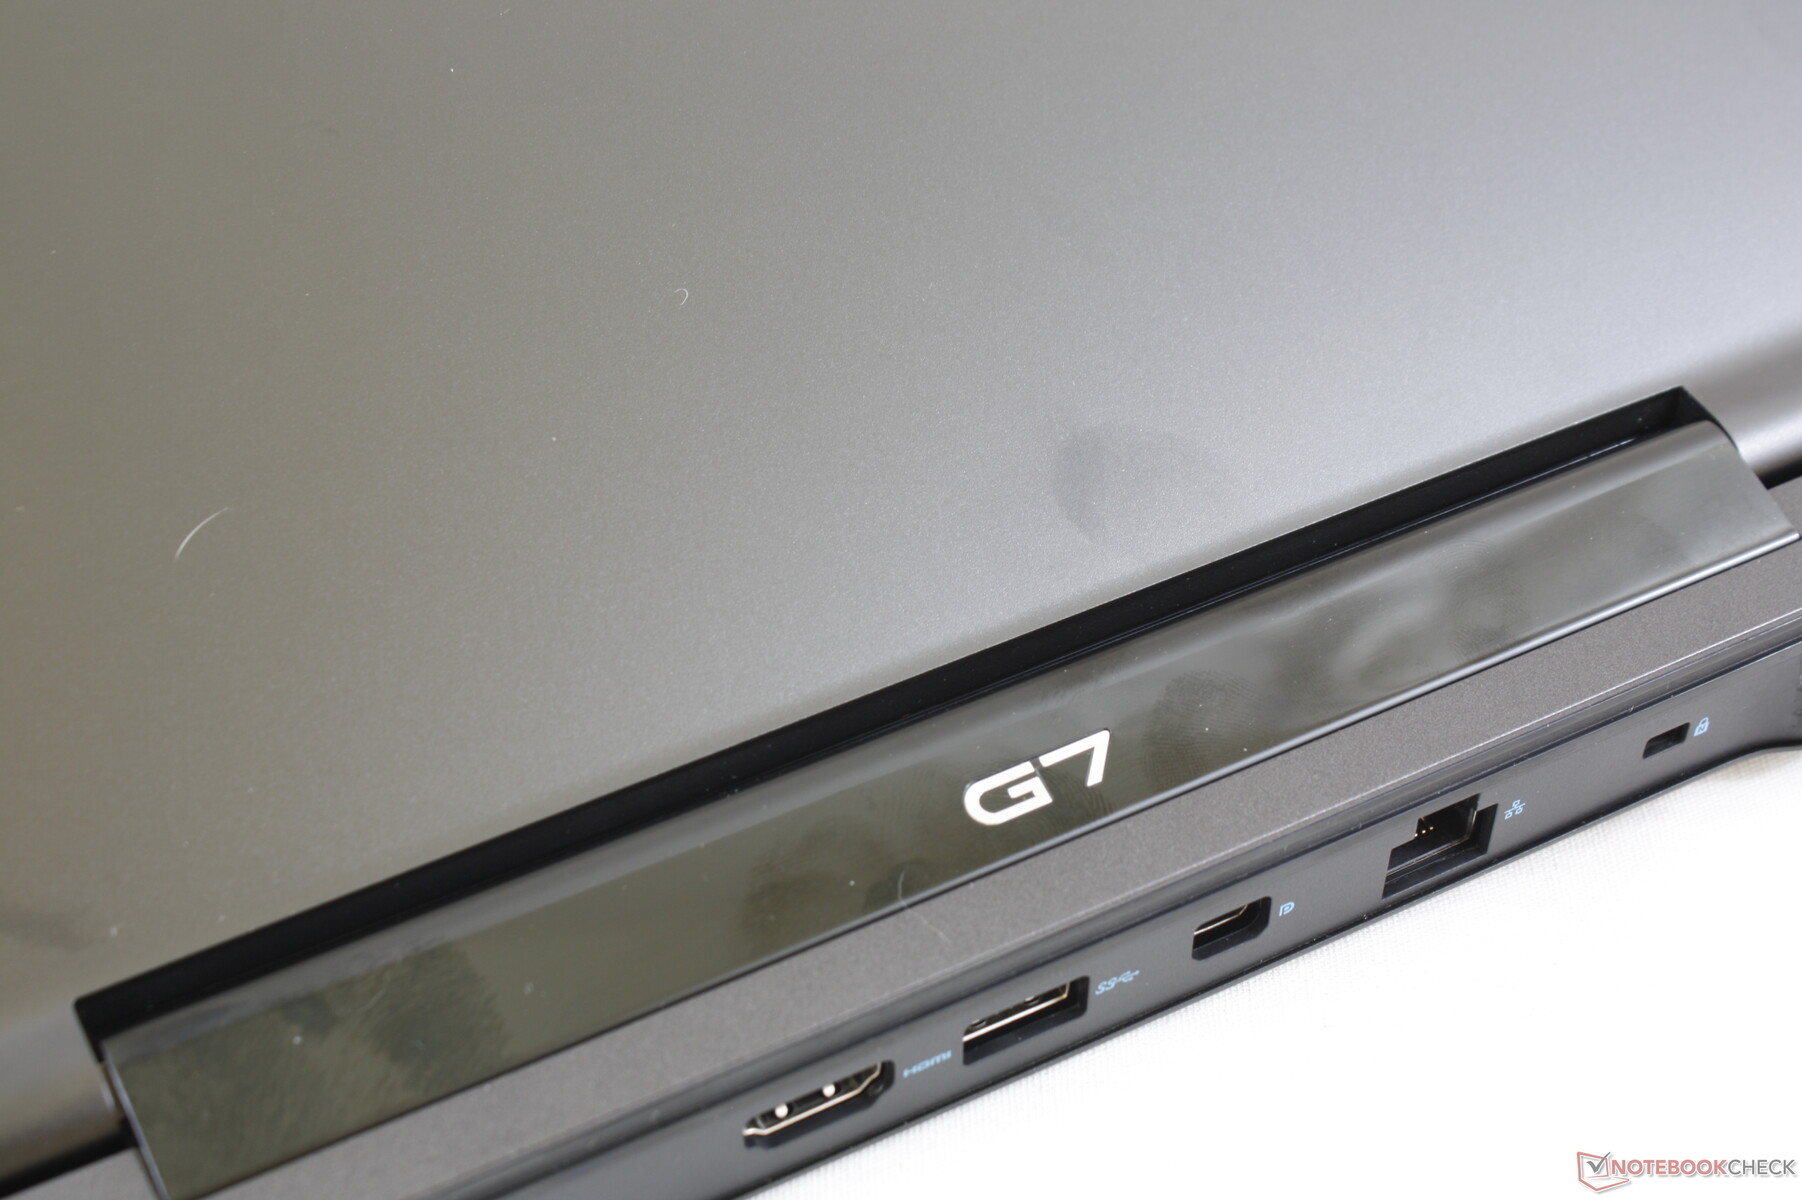
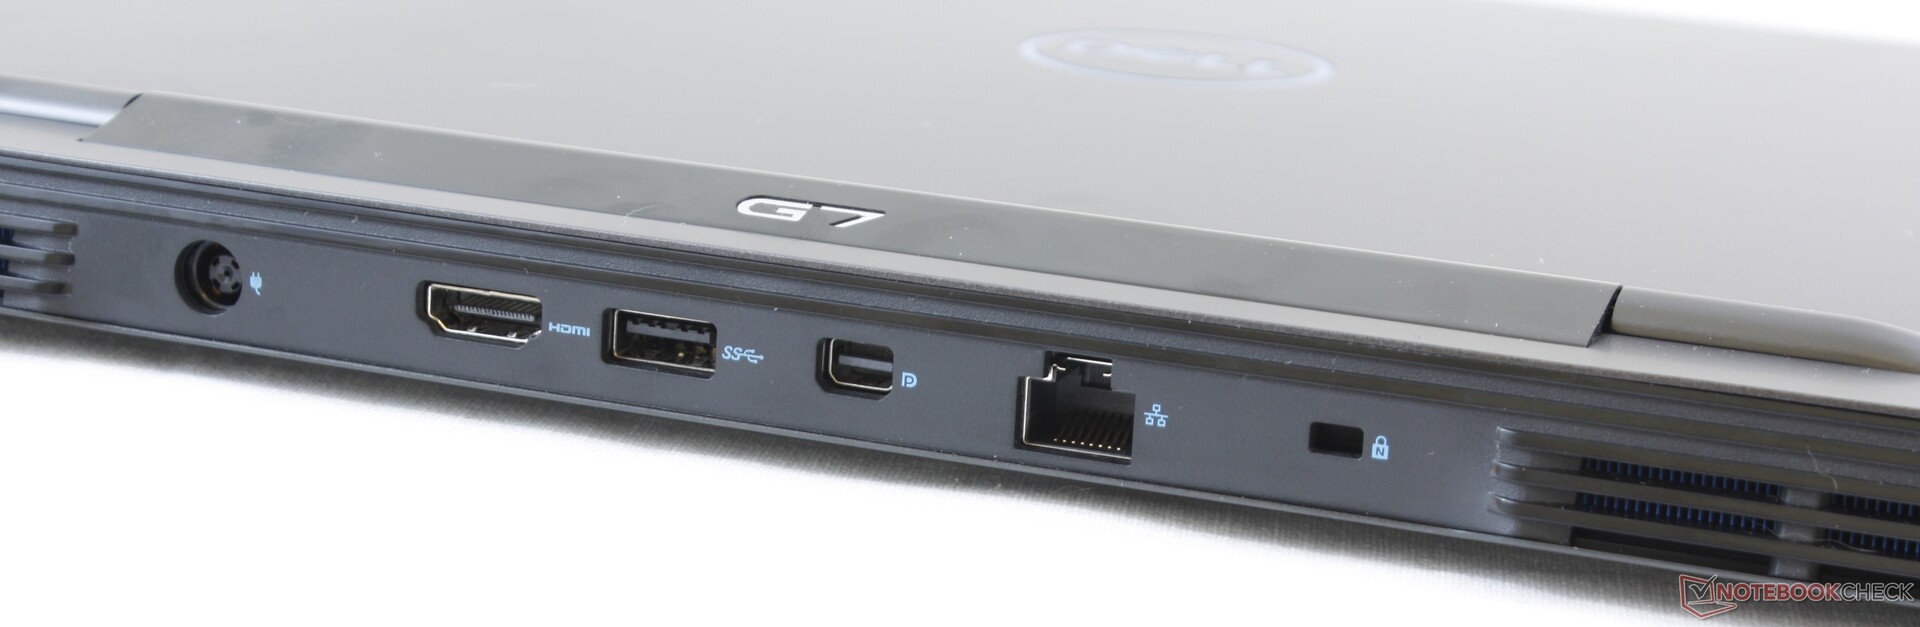
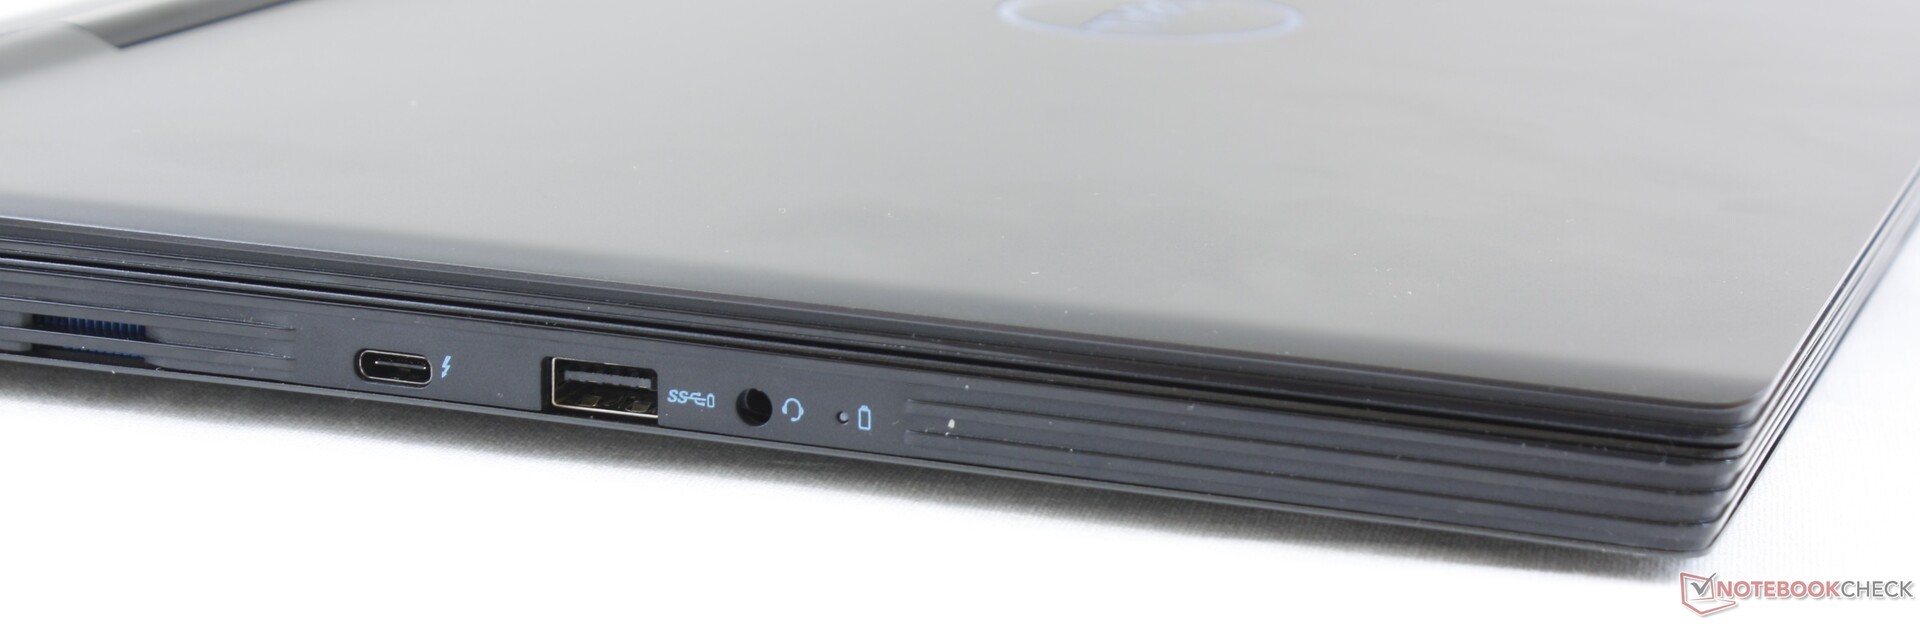
Port positioning has changed dramatically when compared to the G7 7588 or even the newer G3 3590. For better or worse, most ports are now along the rear edge of the chassis instead of the left- and right-hand sides. Otherwise, the system includes all ports found on the G7 7588 plus an extra dedicated mini-DisplayPort port.
Note that both Mini-DisplayPort and Thunderbolt 3 are supported only on SKUs with the GeForce RTX 2060 GPU or higher.
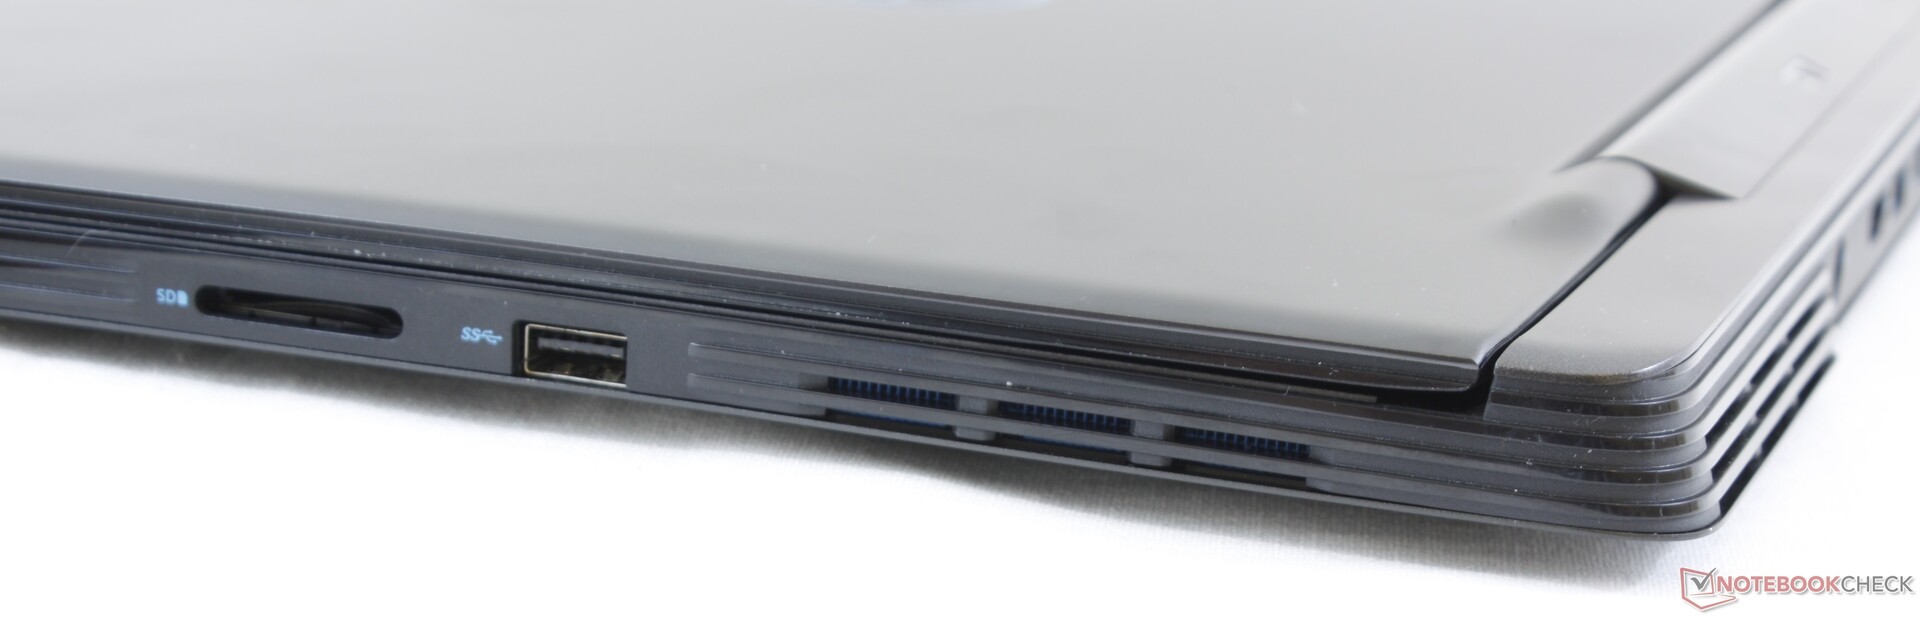
SD Card Reader
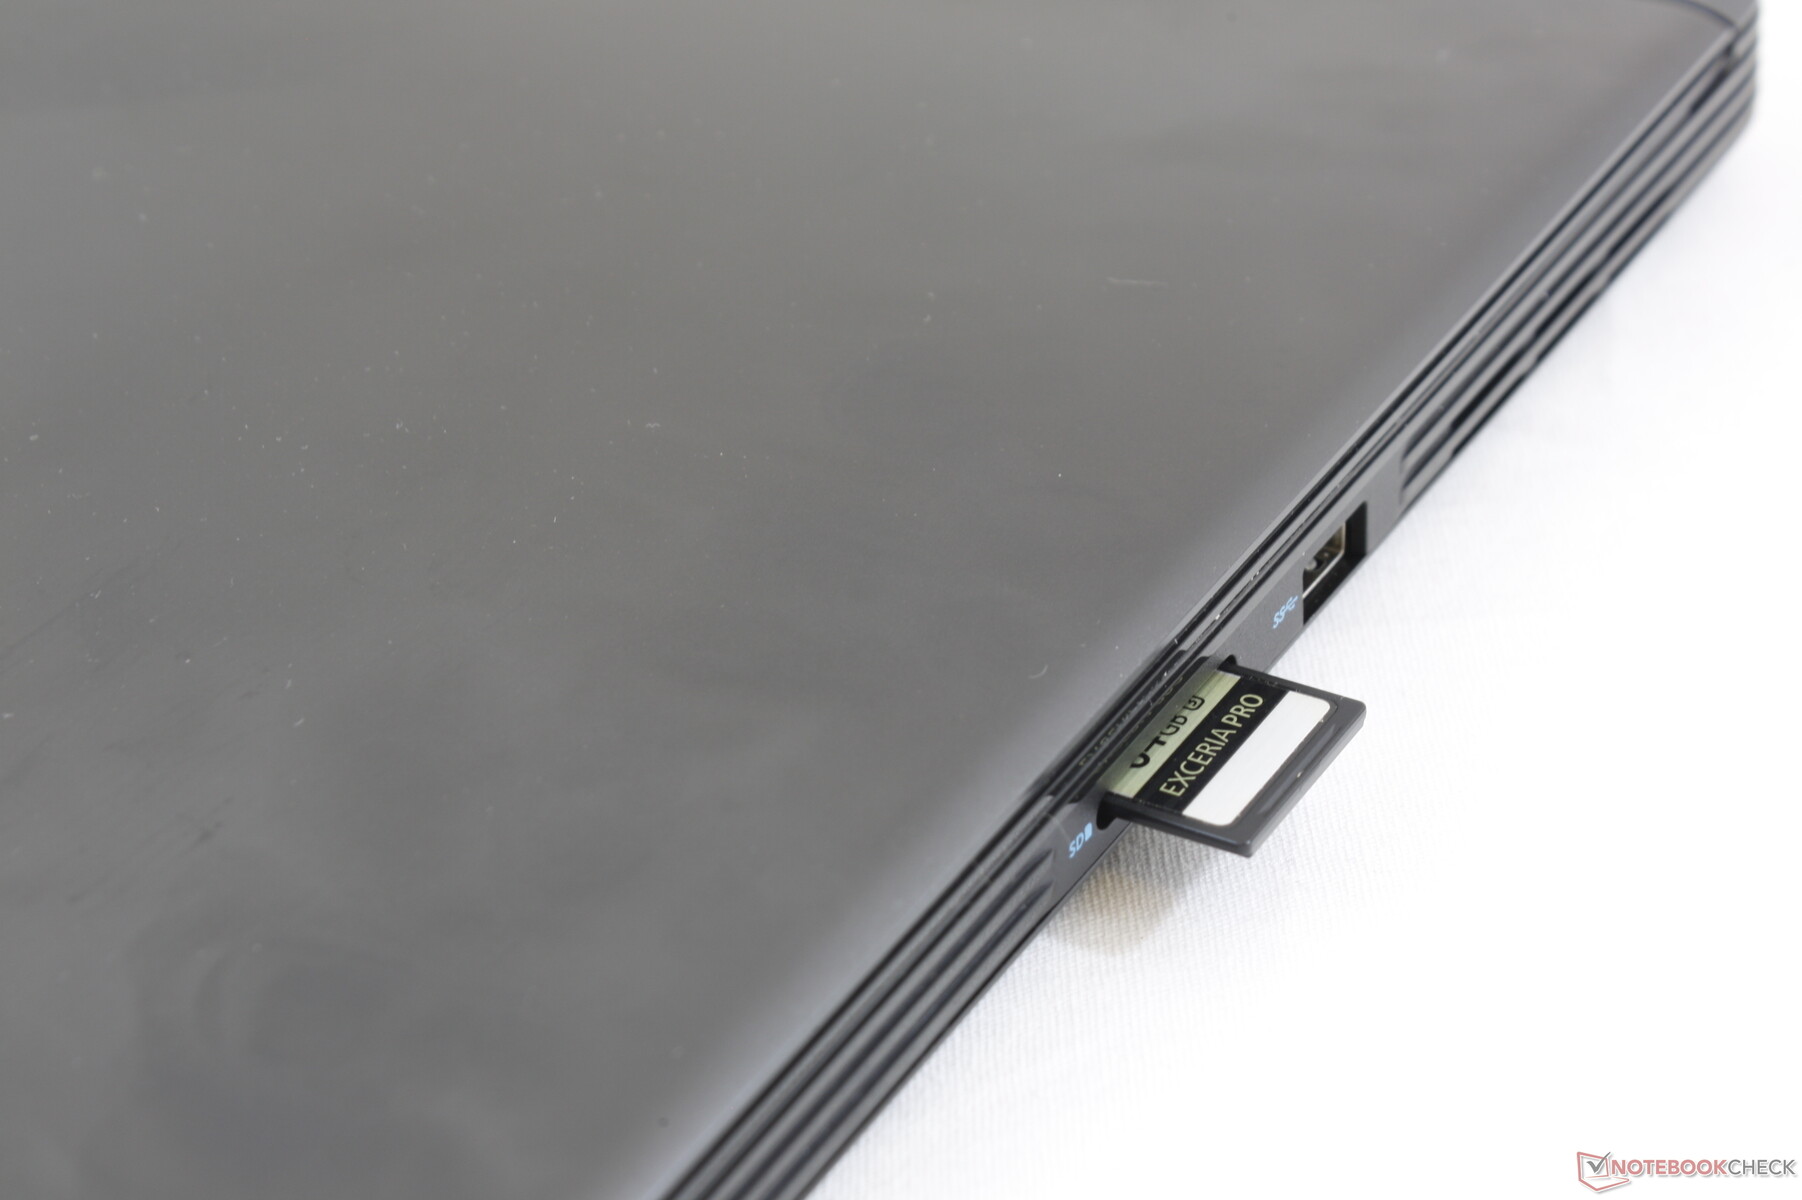
Transfer rates from the integrated card reader continue to be very slow at just 31.4 MB/s. Transferring 1 GB of pictures from our UHS-II card to desktop takes about 45 seconds compared to just 6 to 7 seconds on the XPS 15. Note that the card reader is not spring-loaded and so a fully inserted SD card will still protrude by over half its length for unsafe transporting.
| SD Card Reader | |
| average JPG Copy Test (av. of 3 runs) | |
| Dell XPS 15 7590 i5 iGPU FHD (Toshiba Exceria Pro SDXC 64 GB UHS-II) | |
| Dell XPS 13 7390 2-in-1 Core i7 (Toshiba Exceria Pro M501 64 GB UHS-II) | |
| MSI GL65 9SEK (Toshiba Exceria Pro SDXC 64 GB UHS-II) | |
| Dell G7 7590 (Toshiba Exceria Pro SDXC 64 GB UHS-II) | |
| Dell G3 3590 (Toshiba Exceria Pro SDXC 64 GB UHS-II) | |
| maximum AS SSD Seq Read Test (1GB) | |
| Dell XPS 15 7590 i5 iGPU FHD (Toshiba Exceria Pro SDXC 64 GB UHS-II) | |
| Dell XPS 13 7390 2-in-1 Core i7 (Toshiba Exceria Pro M501 64 GB UHS-II) | |
| Dell G7 7590 (Toshiba Exceria Pro SDXC 64 GB UHS-II) | |
| Dell G3 3590 (Toshiba Exceria Pro SDXC 64 GB UHS-II) | |
| MSI GL65 9SEK (Toshiba Exceria Pro SDXC 64 GB UHS-II) | |
Communication
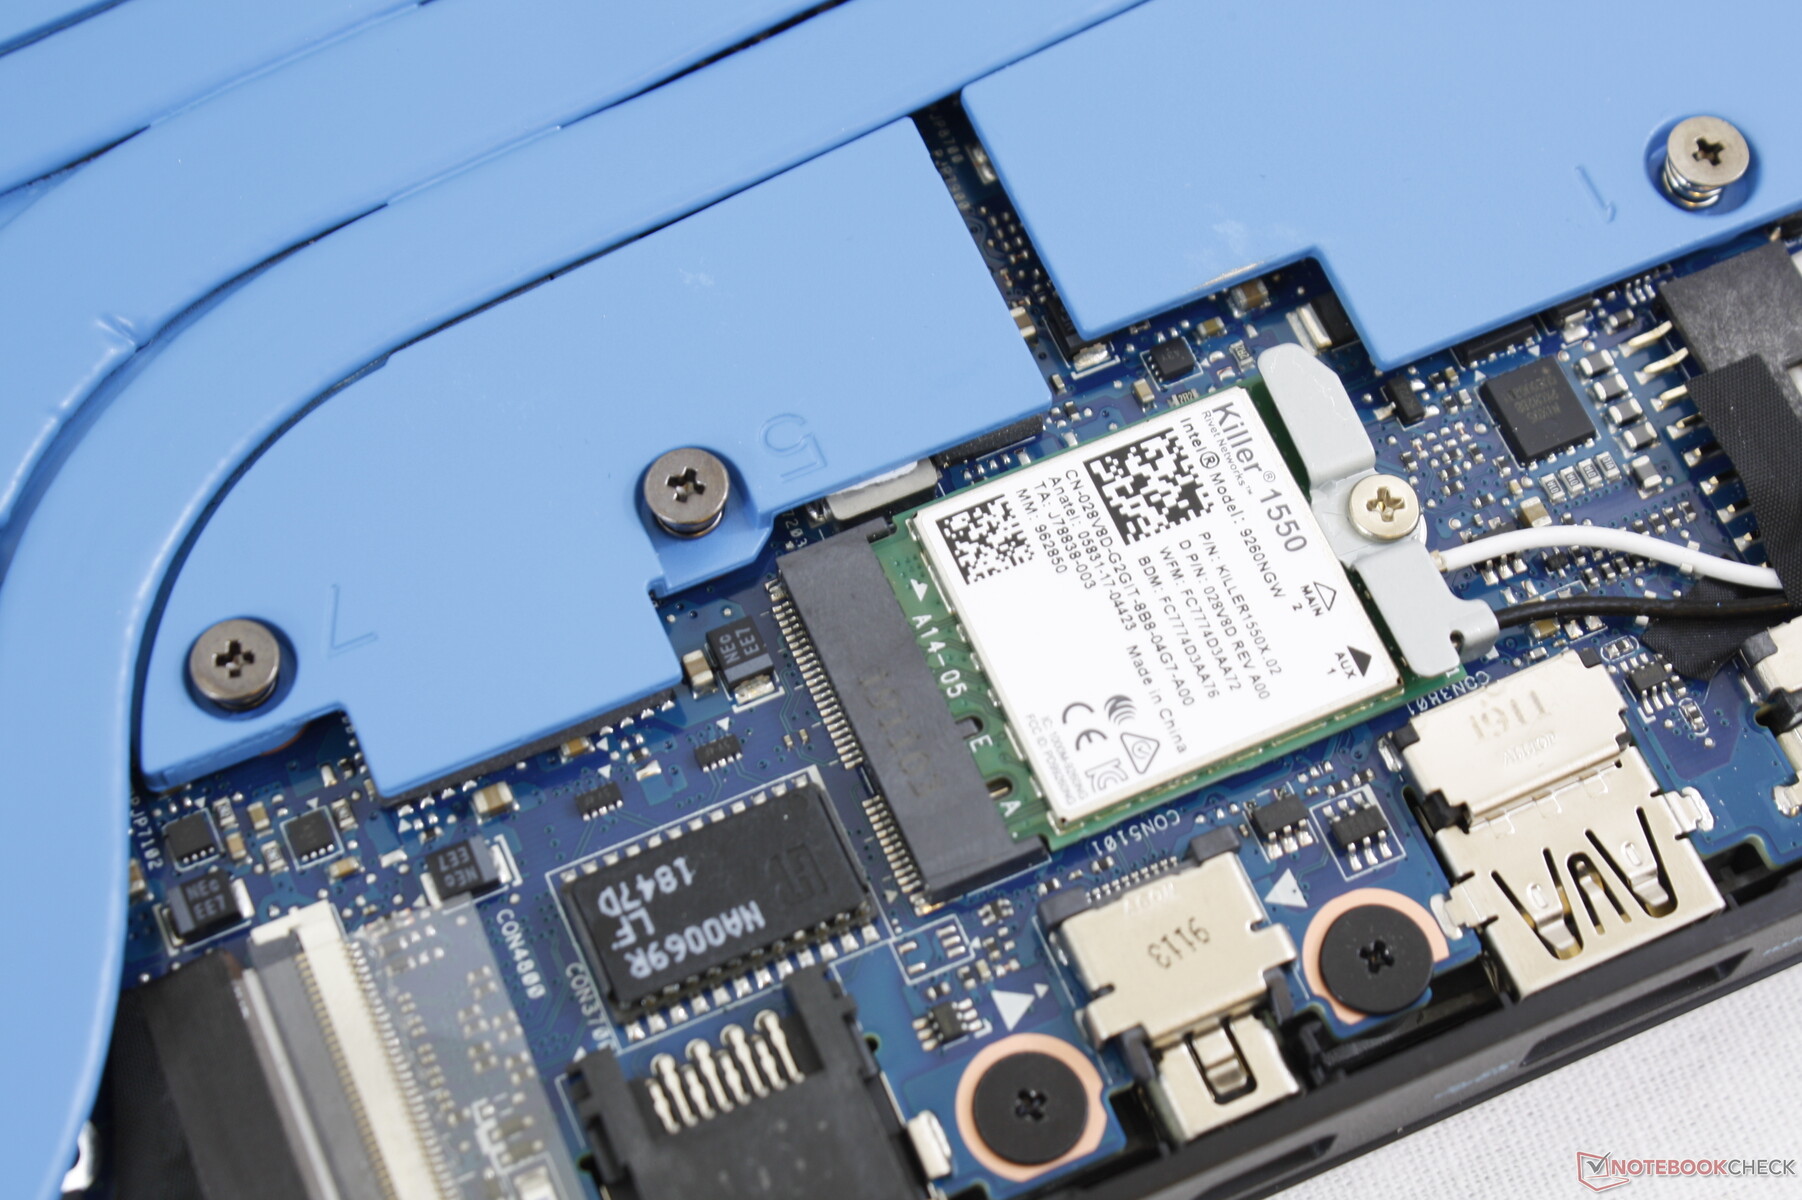
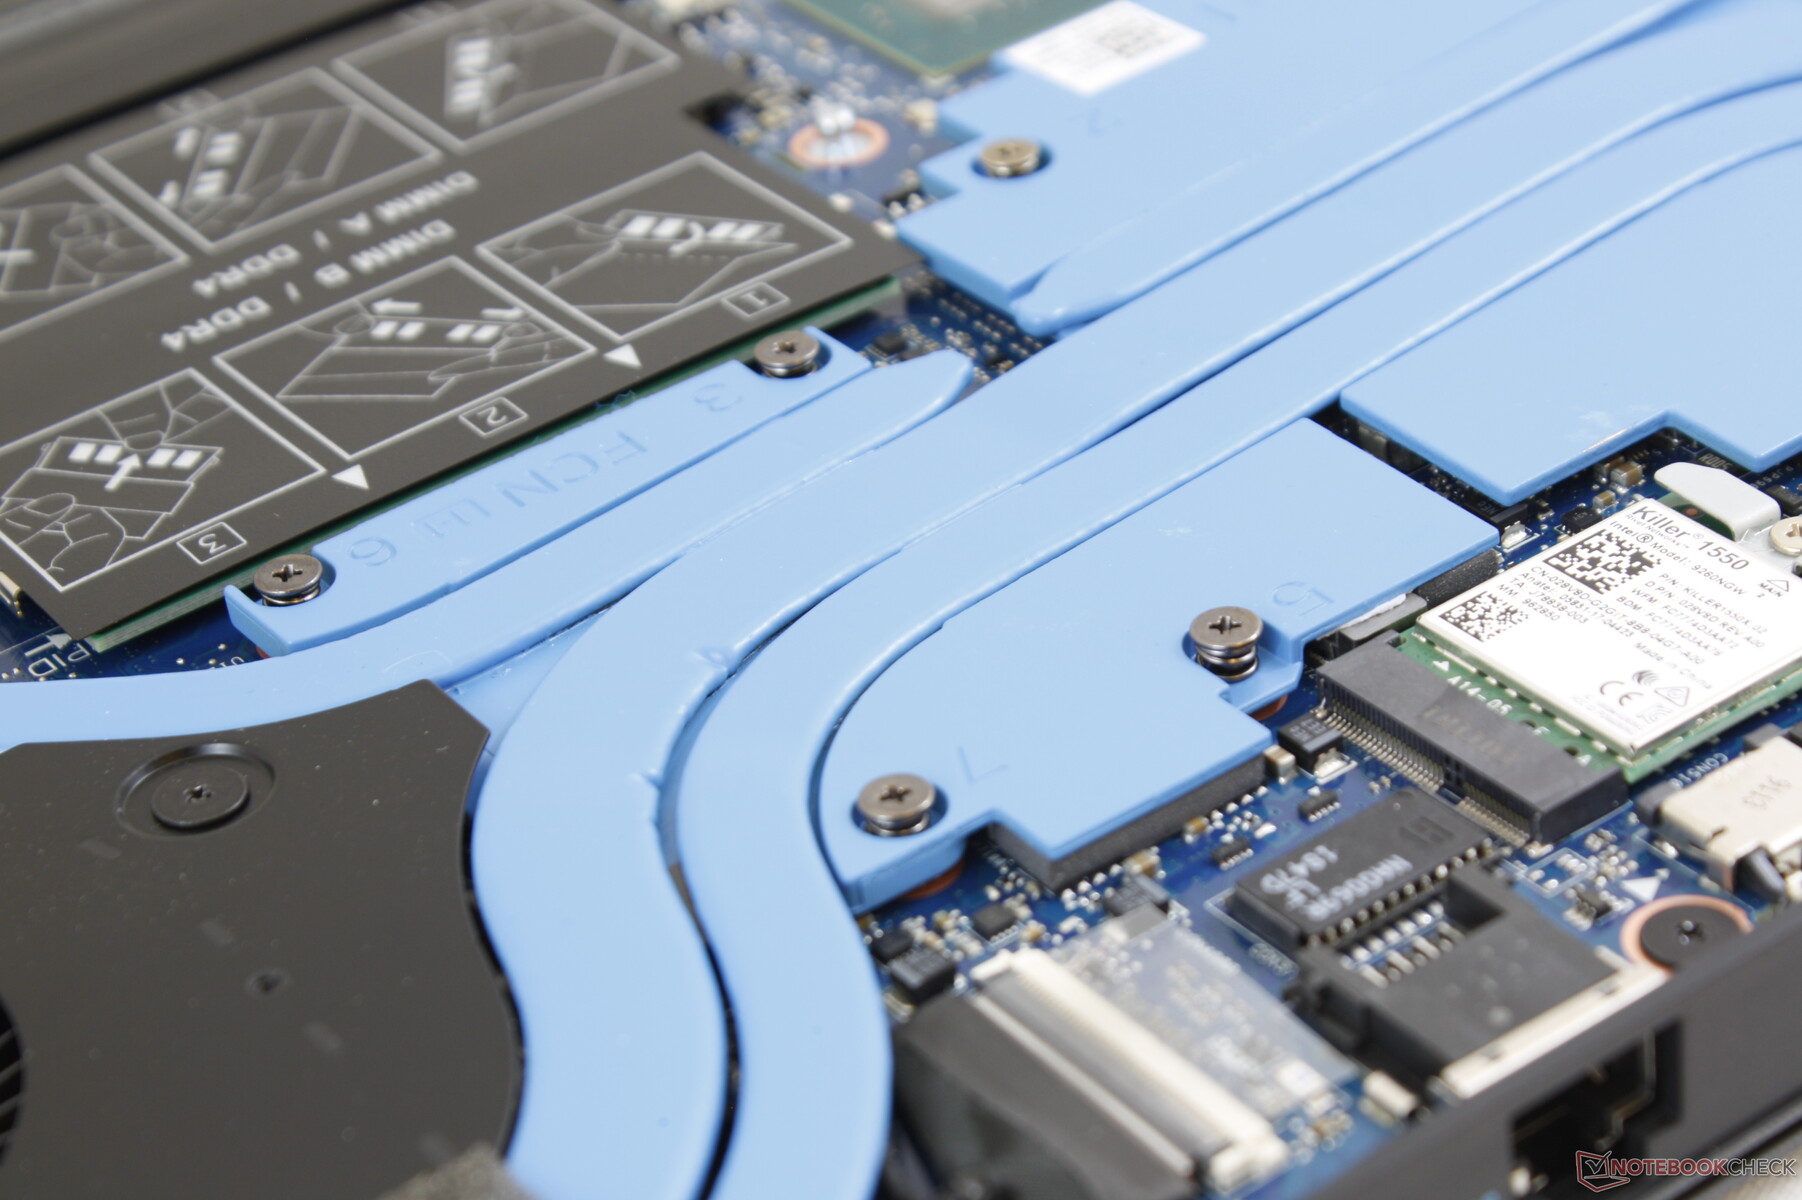
Lower-end GTX SKUs ship with a generic 802.11ac 2x2 WLAN module while higher-end RTX SKUs ship with the Killer 1550. The main advantages of the latter are mostly software related as Killer wireless supports several gaming-centric features. Raw performance will otherwise be nearly the same between them including their integration of Bluetooth 5.
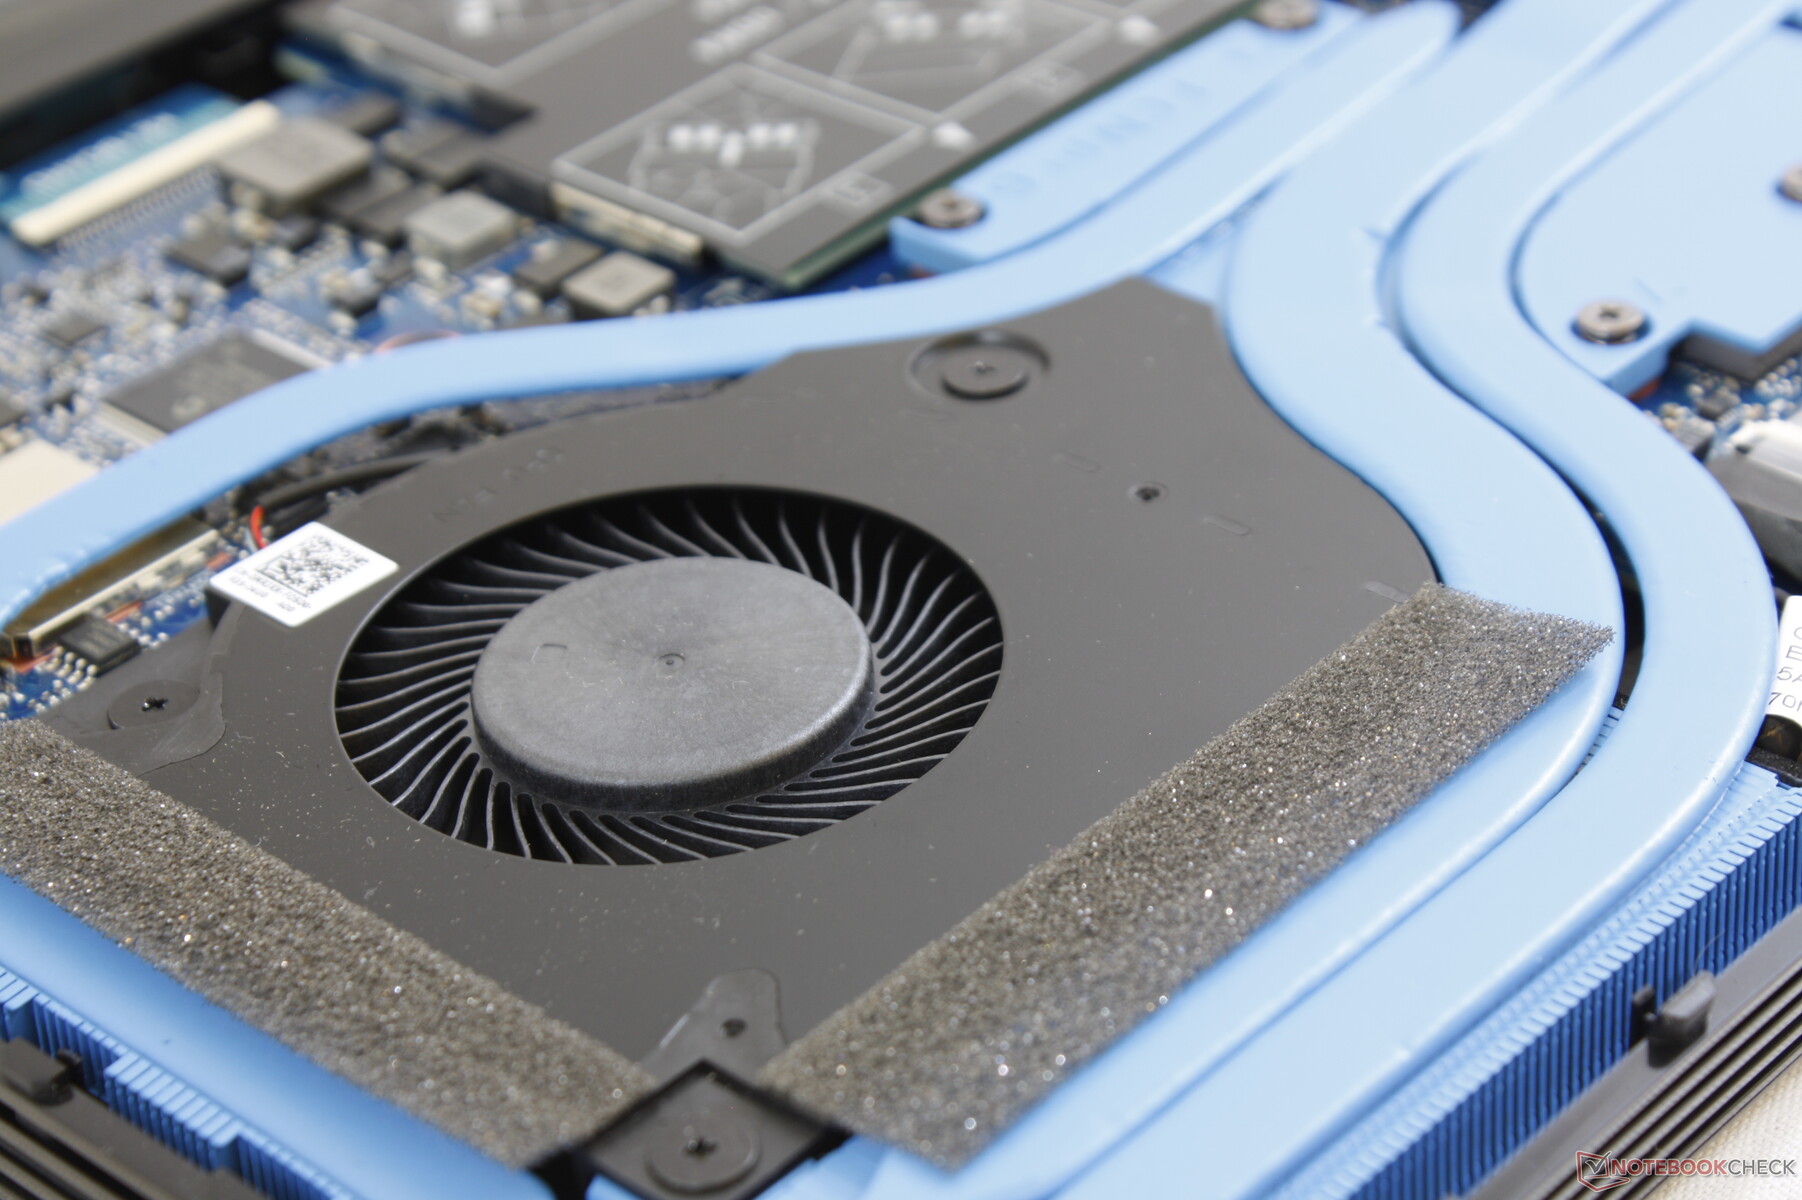
Maintenance
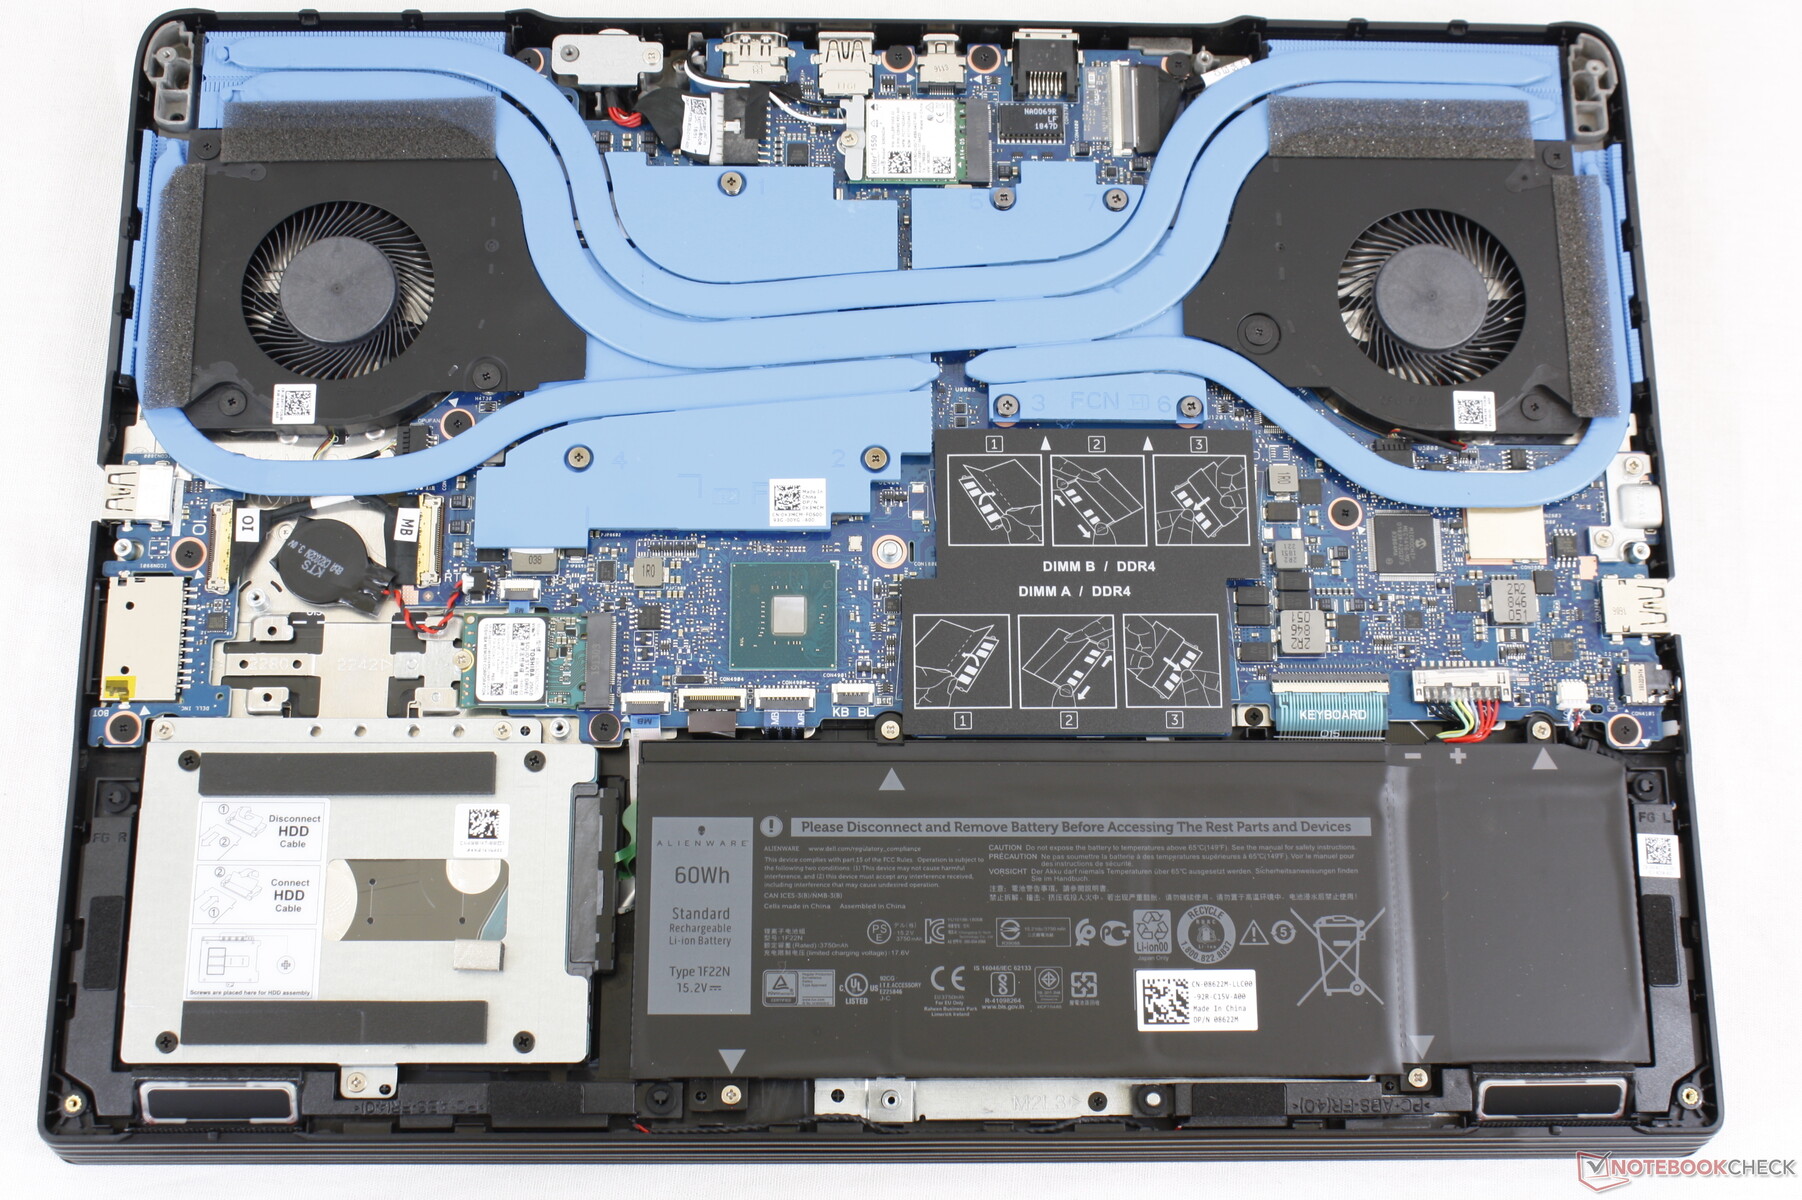
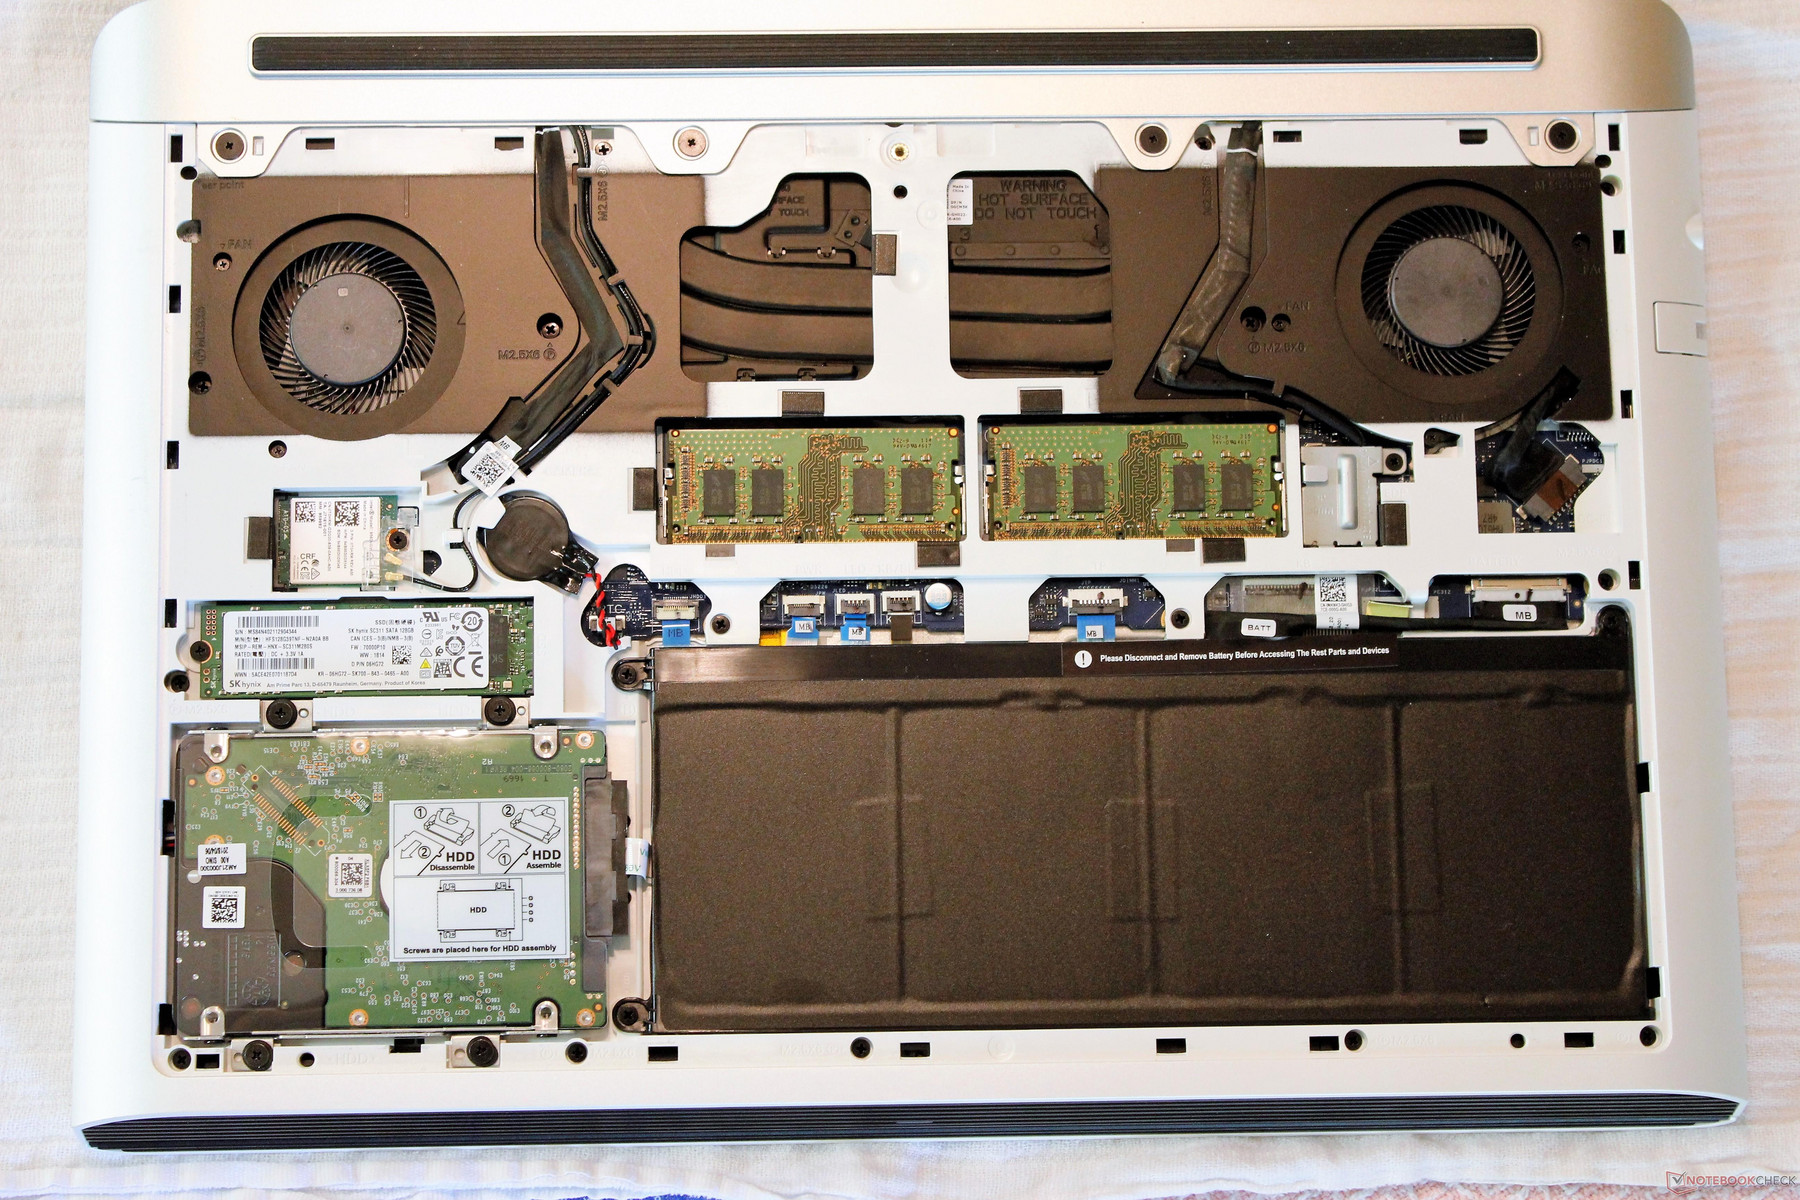
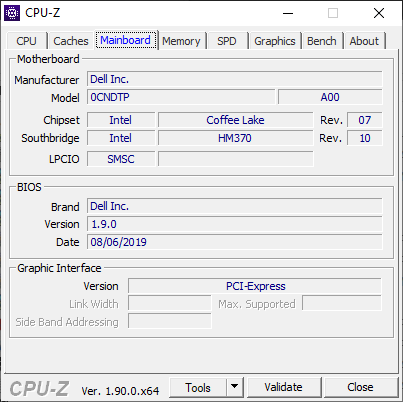
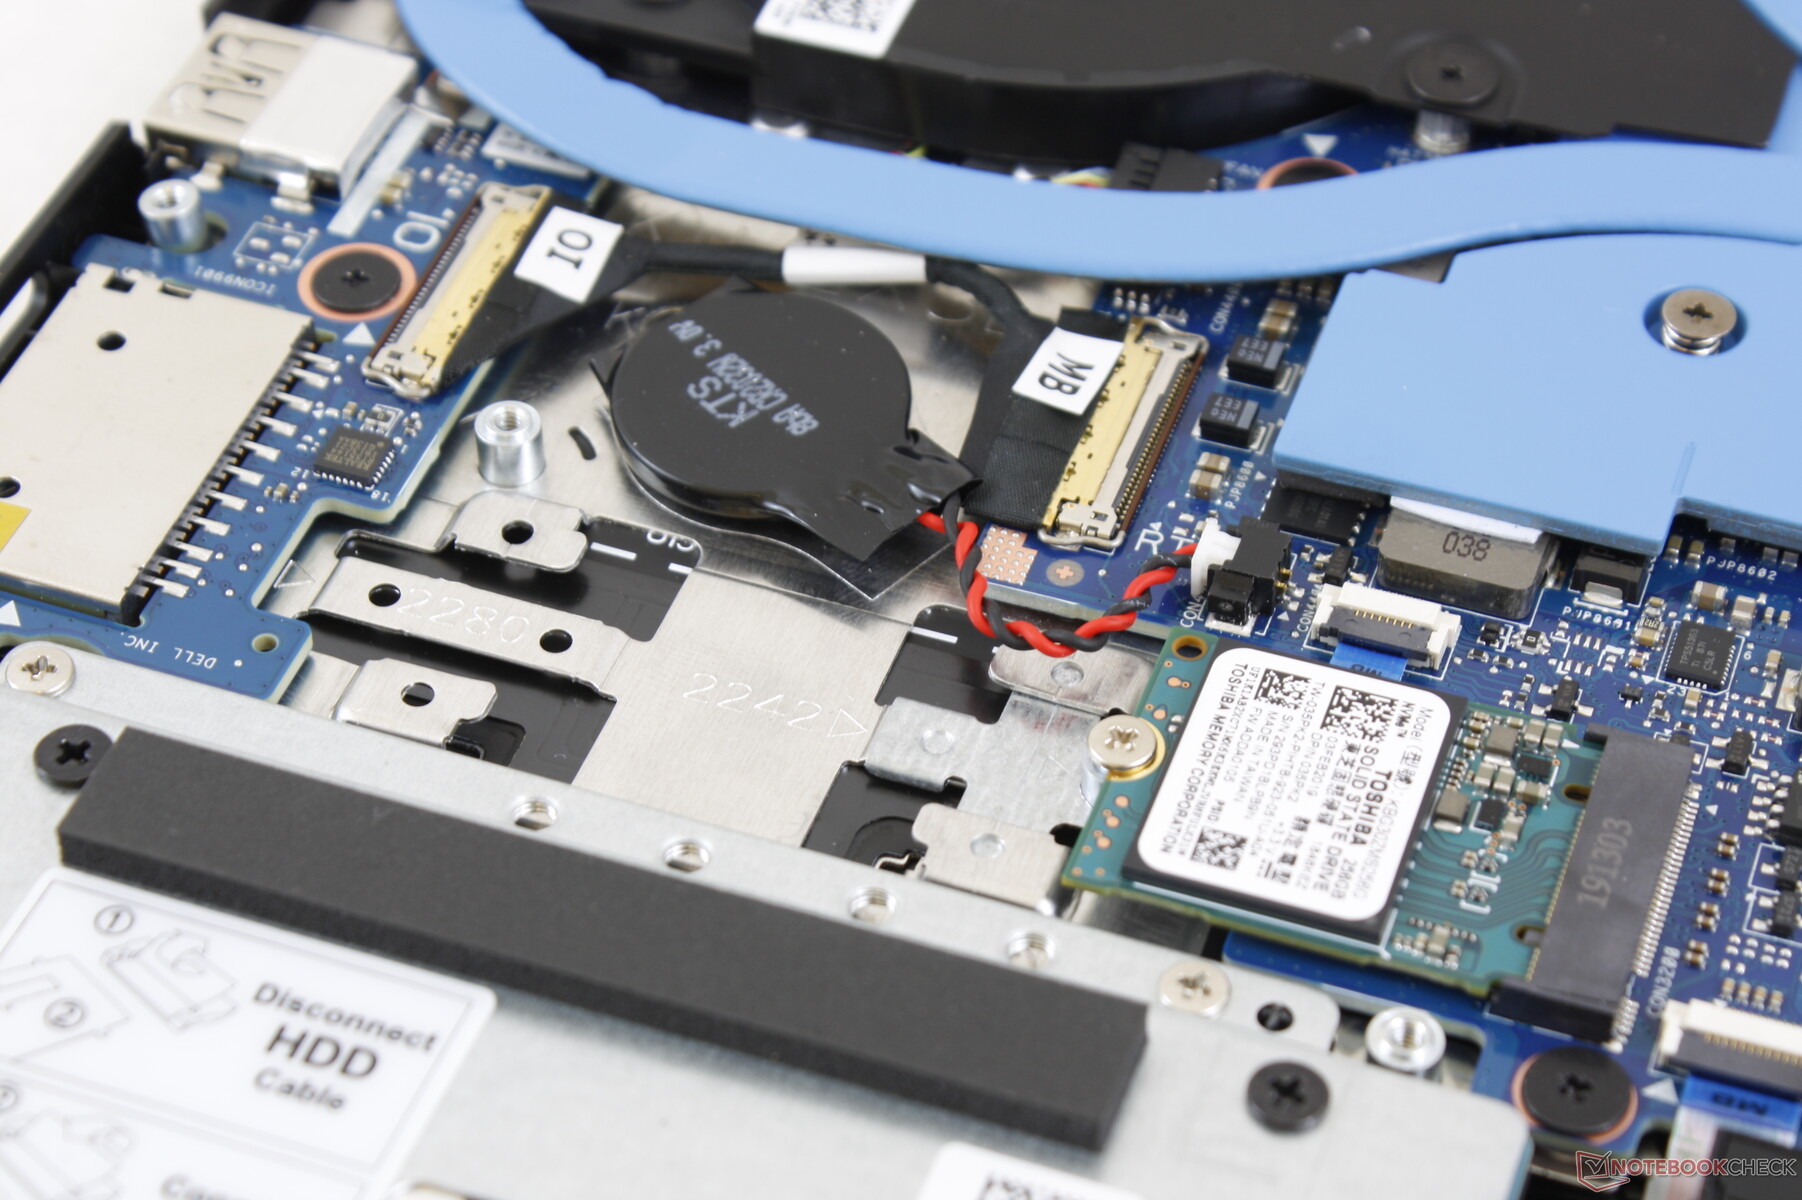
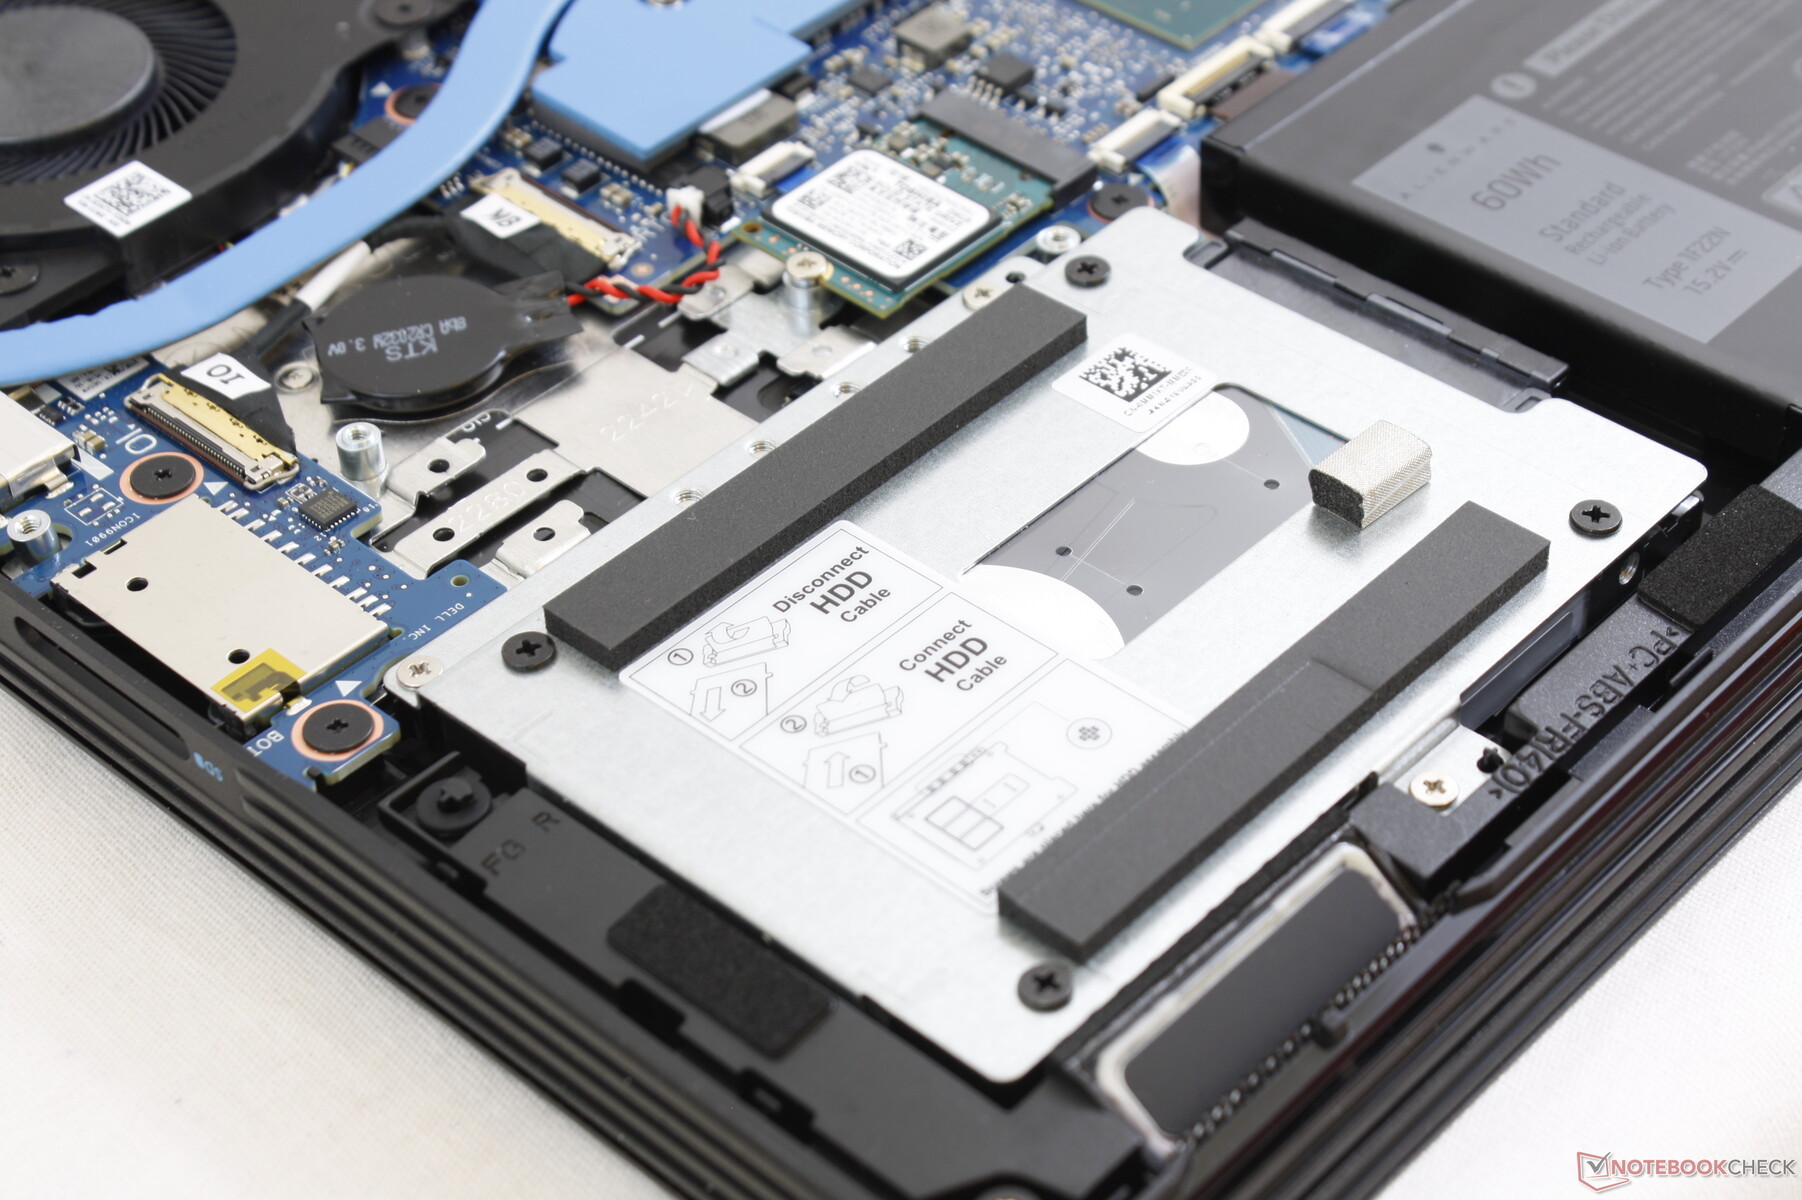
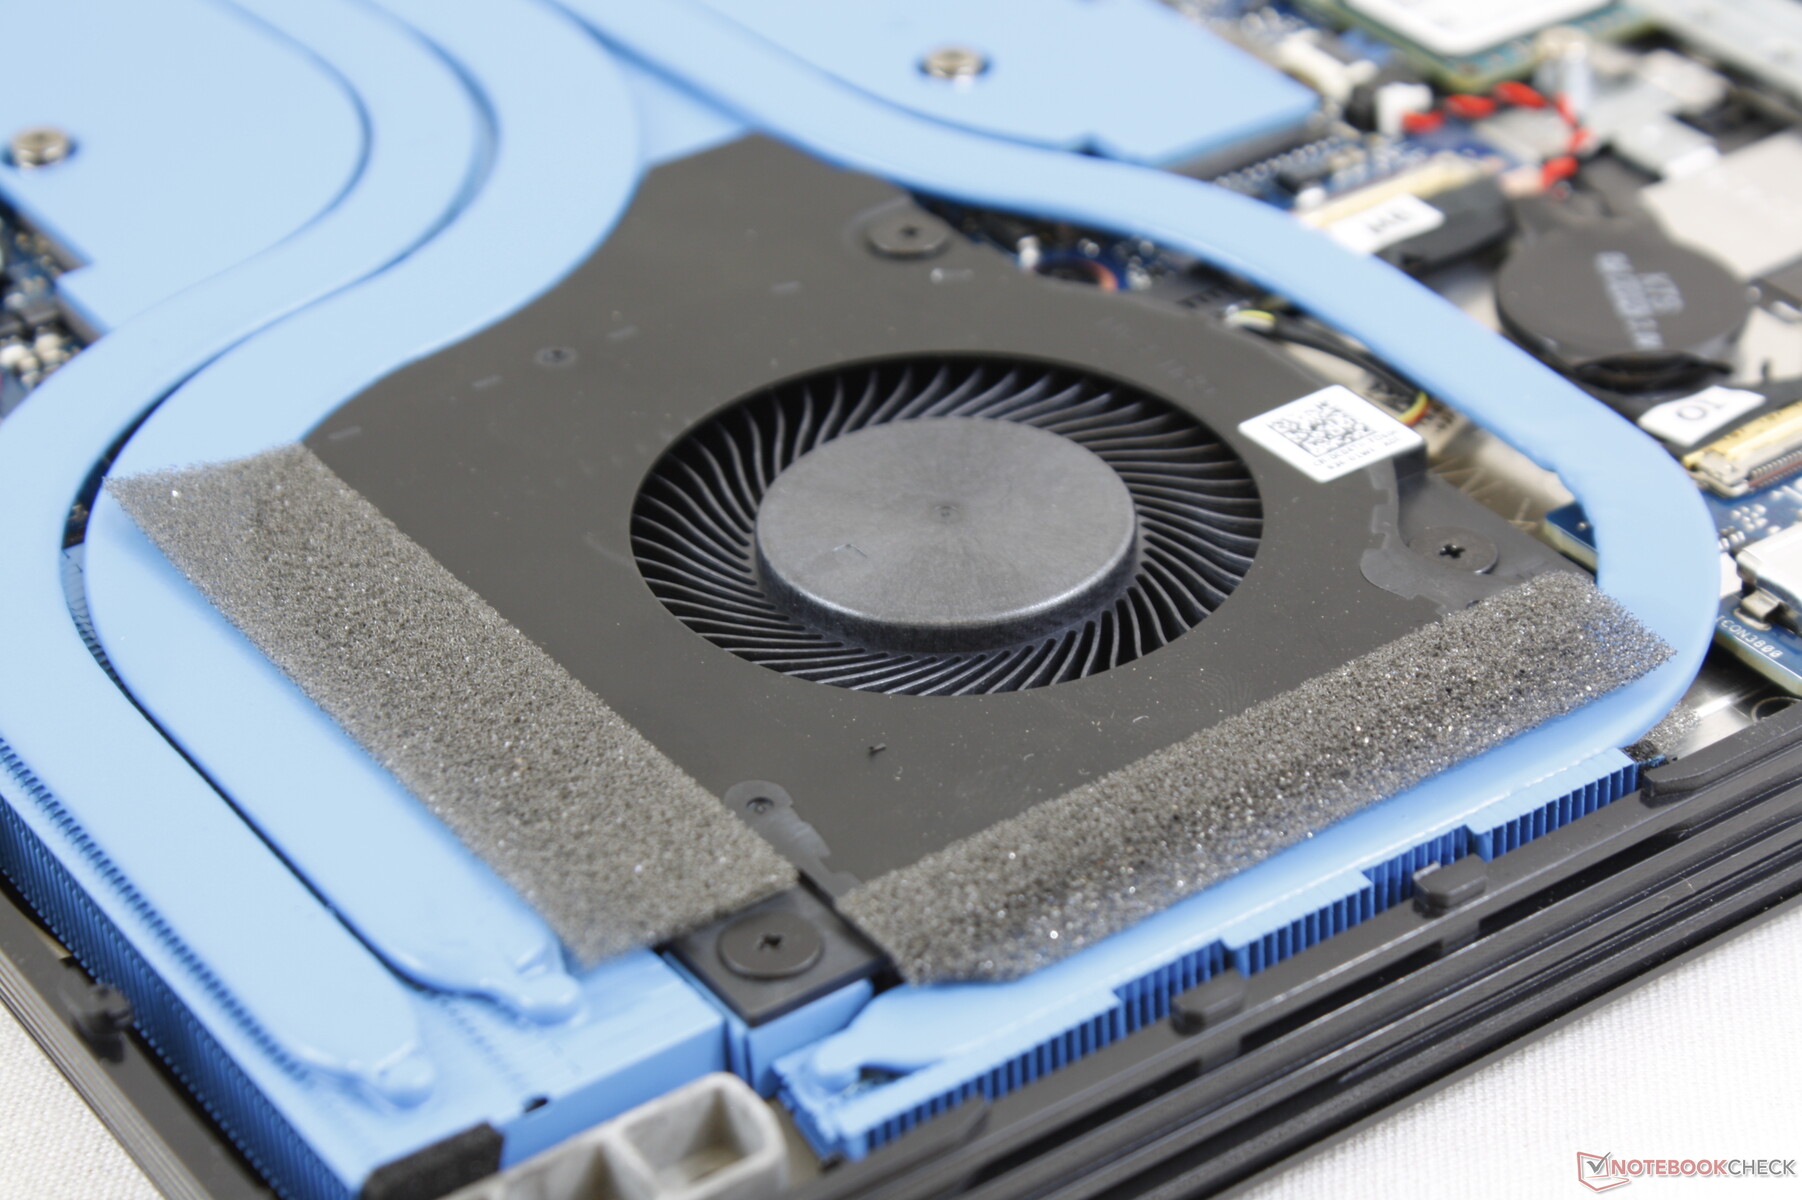
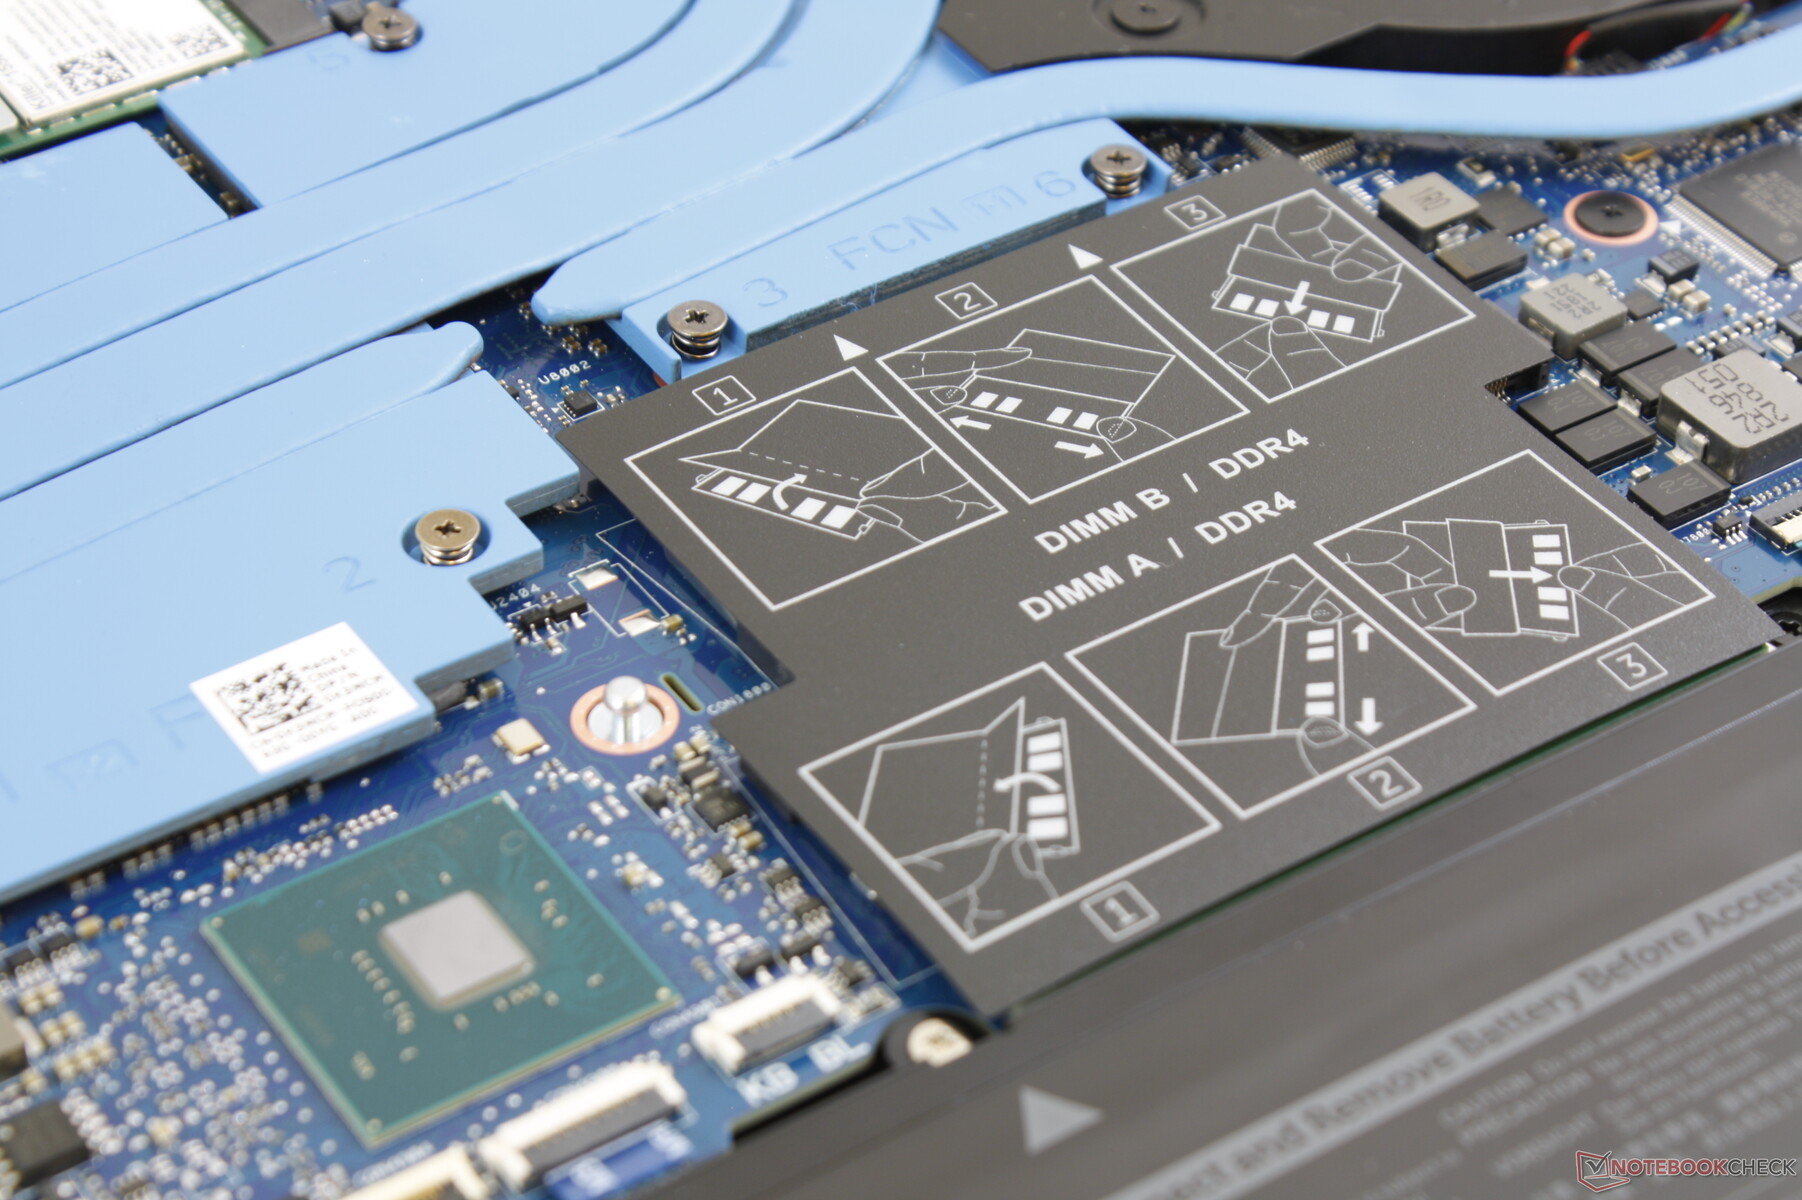
The bottom panel comes off more easily than on the G3 3590 as only a Philips screwdriver is required with no sharp edge needed. Users get direct access to both batteries, both M.2 + 2.5-inch SATA III bays, both SODIMM slots, and the WLAN module. When compared to the older G7 7588, the G7 7590 lacks the internal metal reinforcement for a more standard "open" motherboard layout.
Accessories and Warranty
There are no included extras in the box other than the usual paper manuals. Meanwhile, warranty options are extensive as one would expect from Dell. Users can extend the base one-year limited warranty to four years with optional accidental damage protection services.
Input Devices
Keyboard
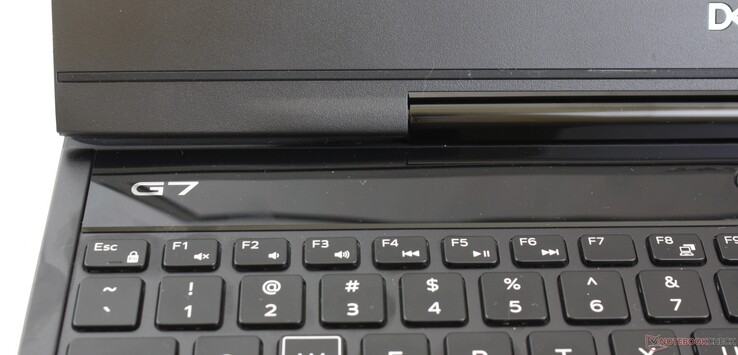
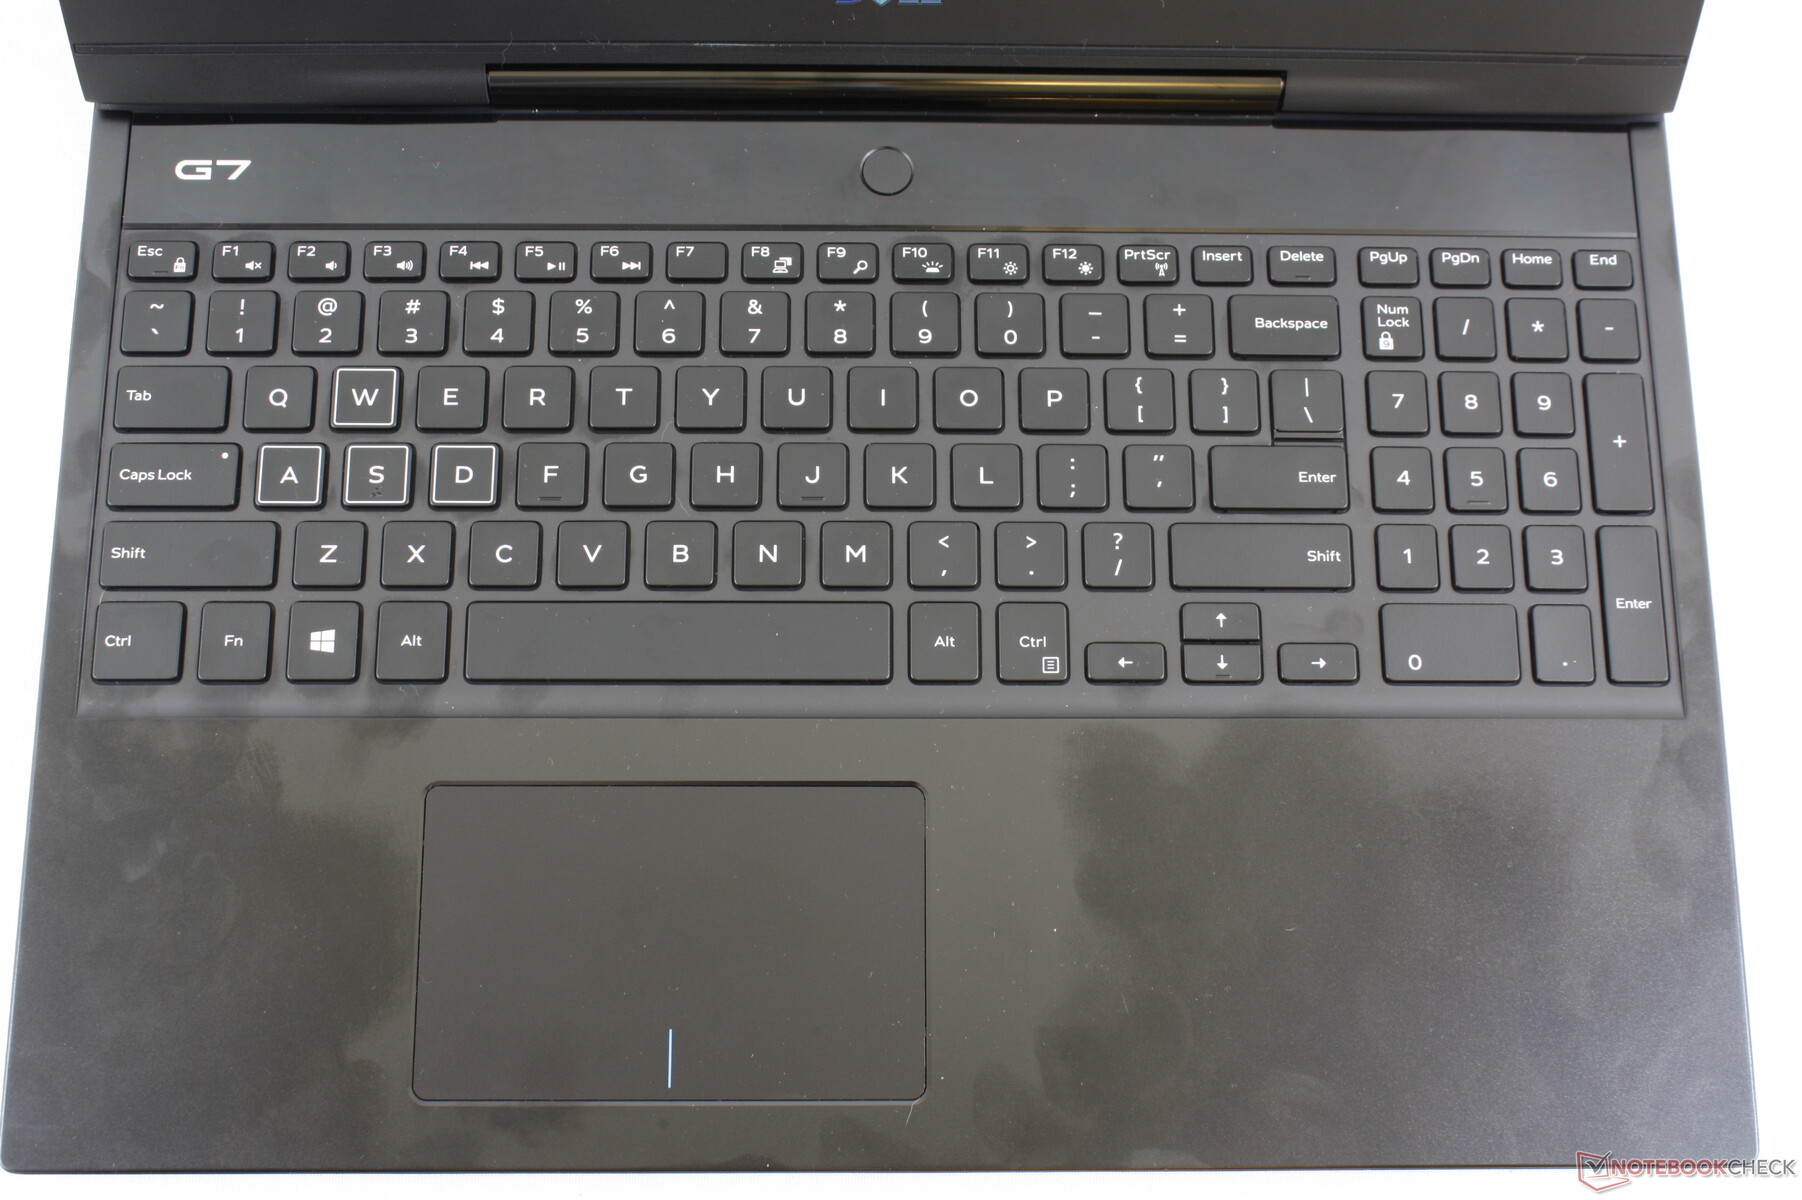
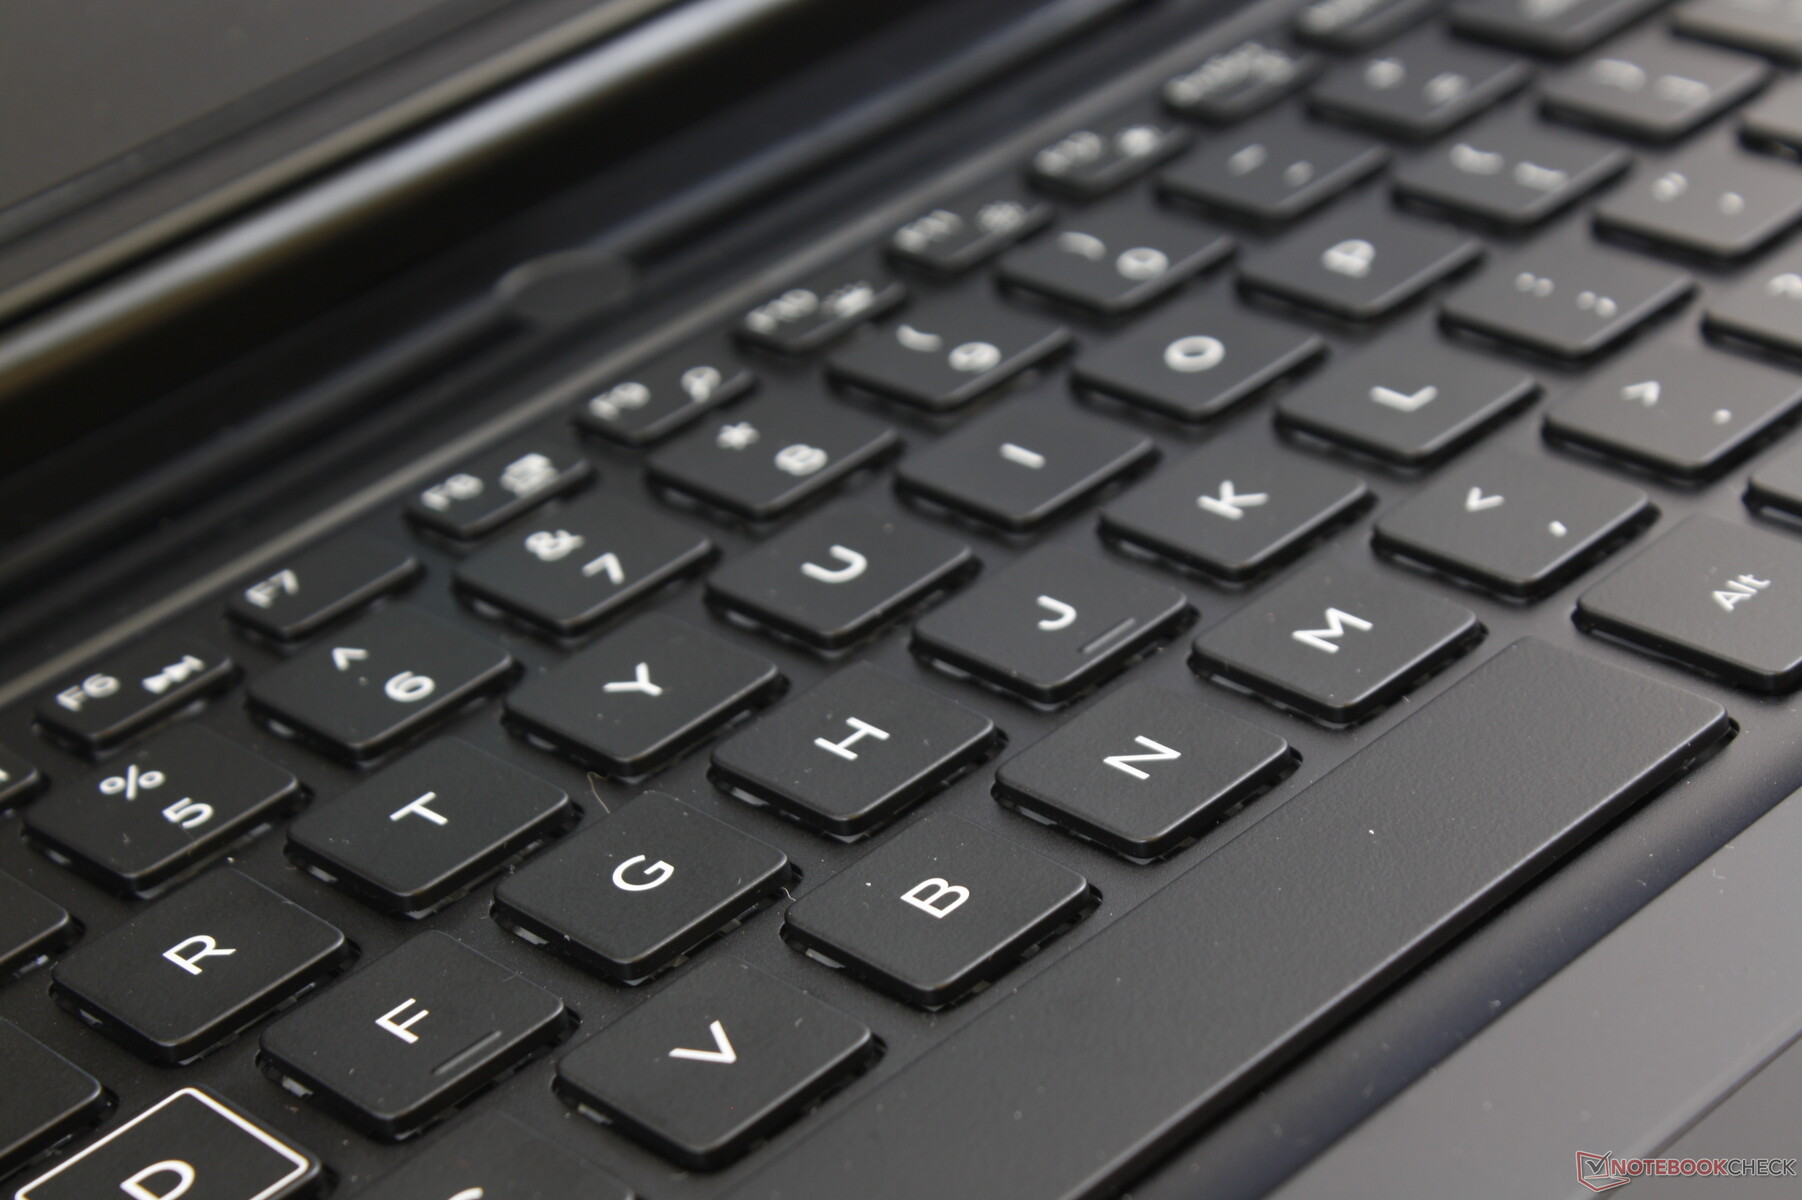
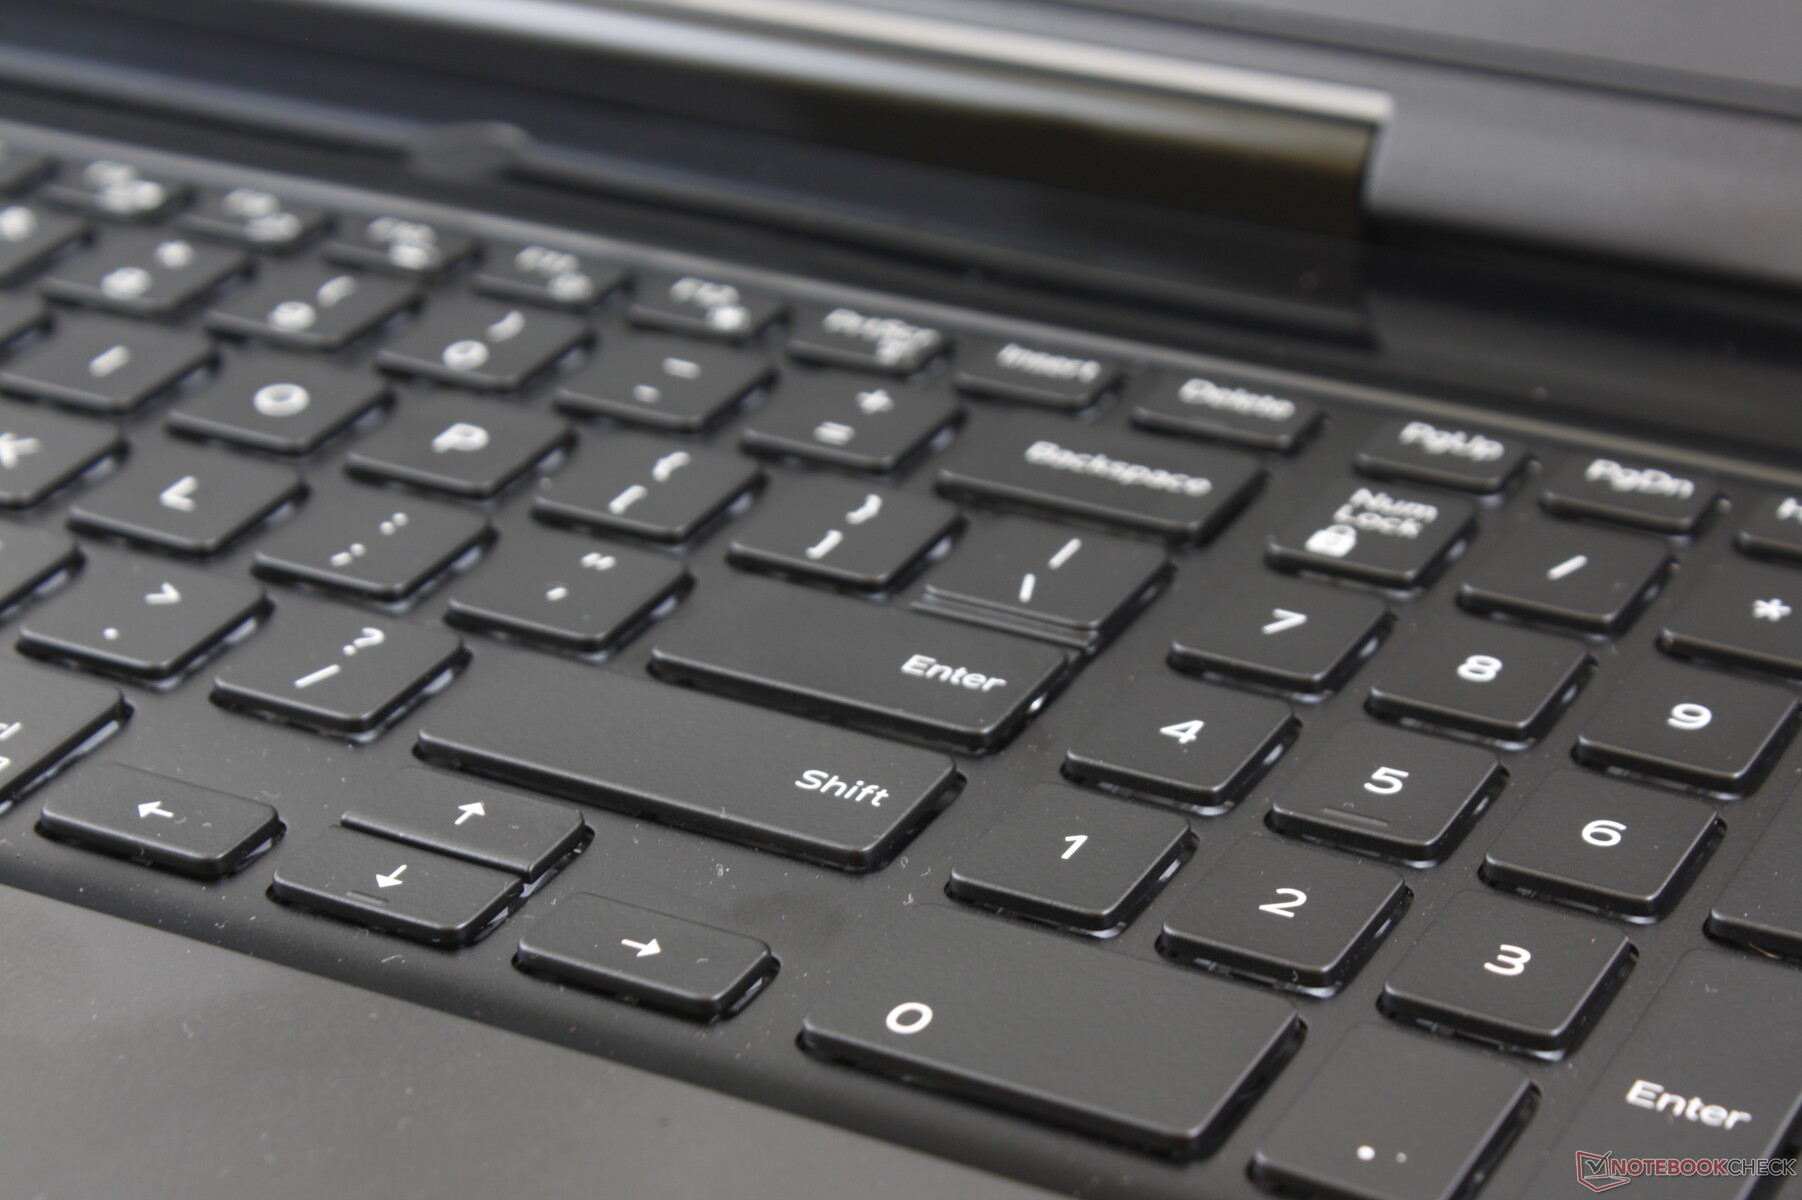
When compared to the keyboard on the G3 15 3590 that's still fresh in our memory, the keyboard keys on the G7 15 7590 are both crisper in feedback and quieter in clatter. The QWERTY keys in particular feel slightly firmer than the SteelSeries keys on most MSI laptops for a more desktop-like typing experience. The main issue is that feedback is not uniform across all keys; the Enter key, Arrow keys, and NumPad keys are comparatively softer. Still, we find it easier to type on the G7 7590 than the XPS 15 due to the deeper key travel of the former.
Two keyboard backlight options are available ranging from single-zone RGB lighting to quad-zone RGB lighting. Dell is reserving the more desirable per-key RGB option for its Alienware series only.
Touchpad
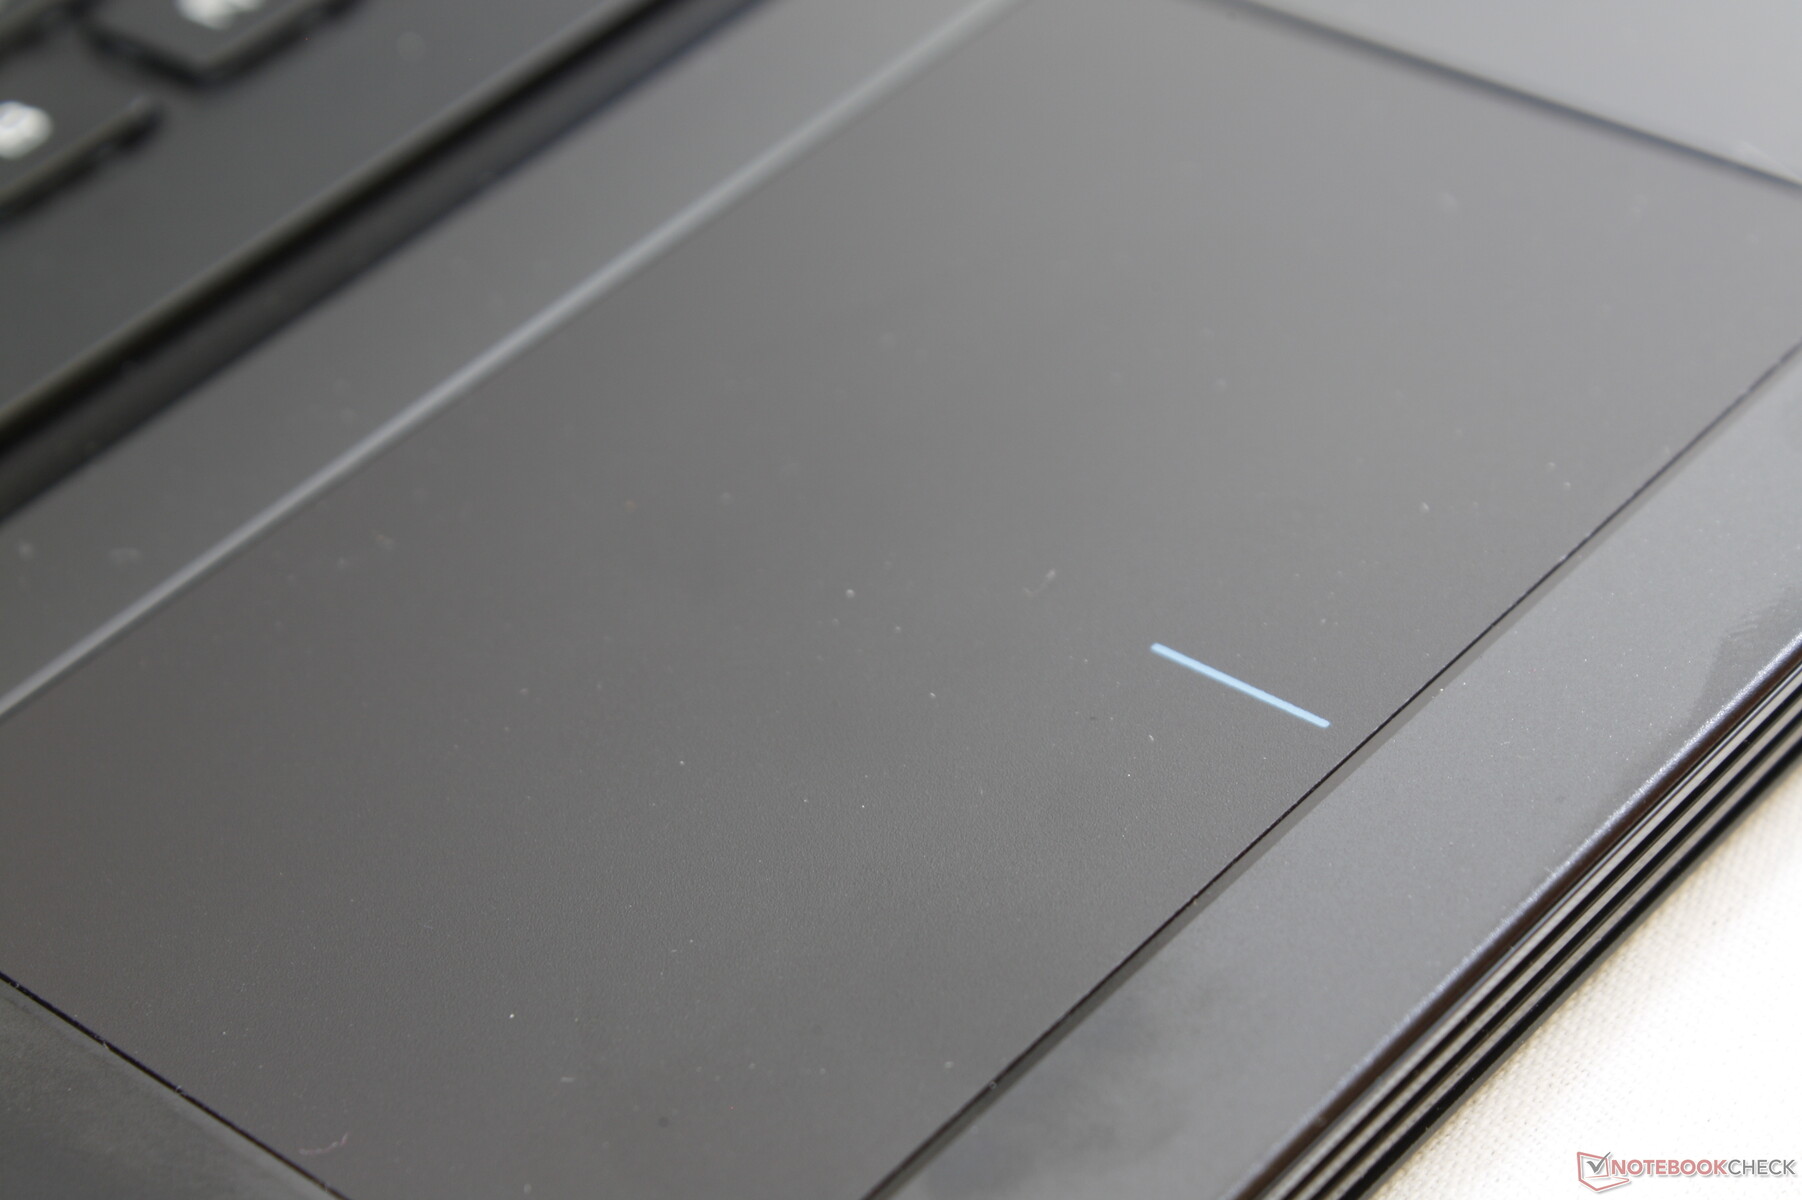
The clickpad (10.5 x 6.5 cm) is smaller than the clickpads on the XPS 15 (10.5 x 8.5 cm) and cheaper G3 3590 (~10.5 x 8 cm). Its surface is slightly rougher than the surrounding palm rests for improved traction at both slow and fast speeds. There is a small level of stickiness when gliding very slowly for more accurate cursor movement.
The integrated mouse clicks are shallow in travel and with a satisfactory audible click. Feedback, however, is on the weak side and could have been firmer or deeper.
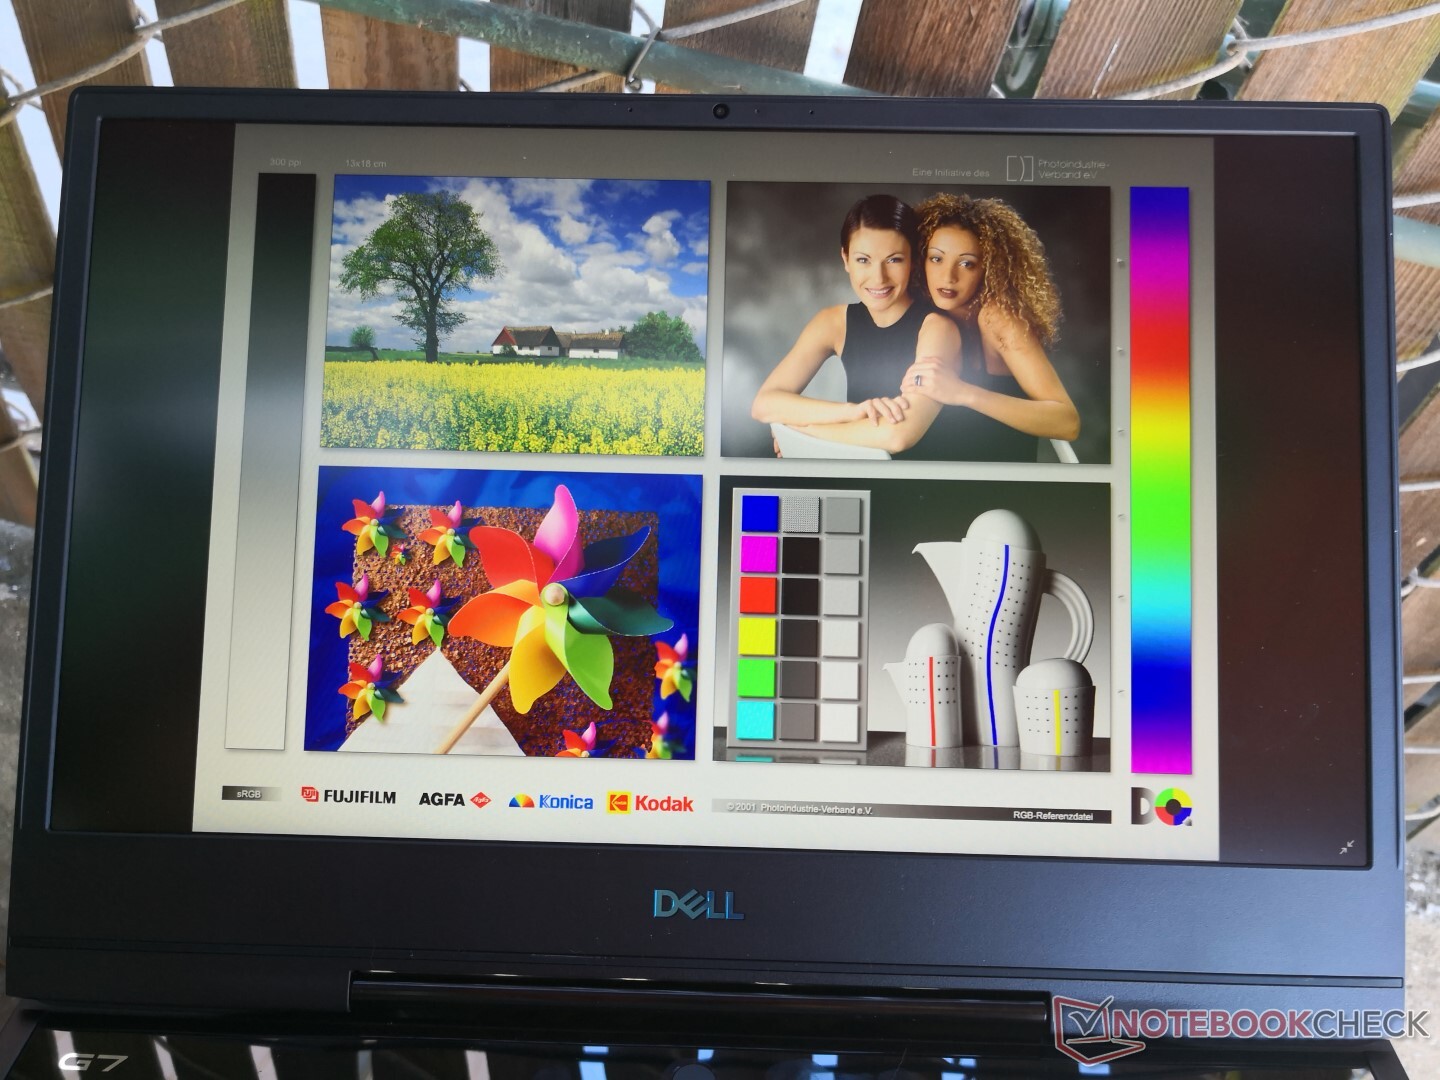
Display
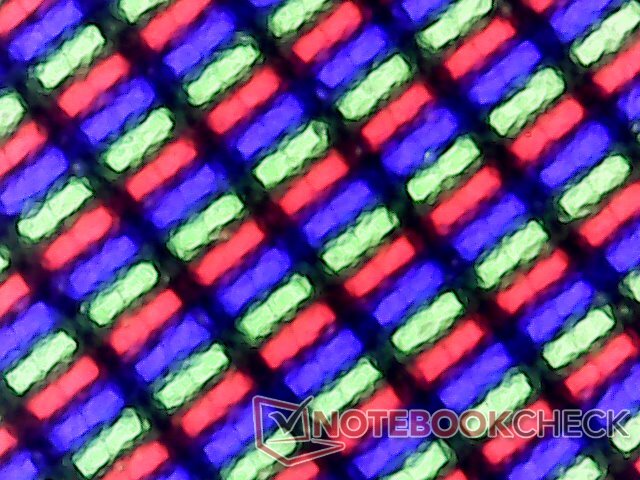
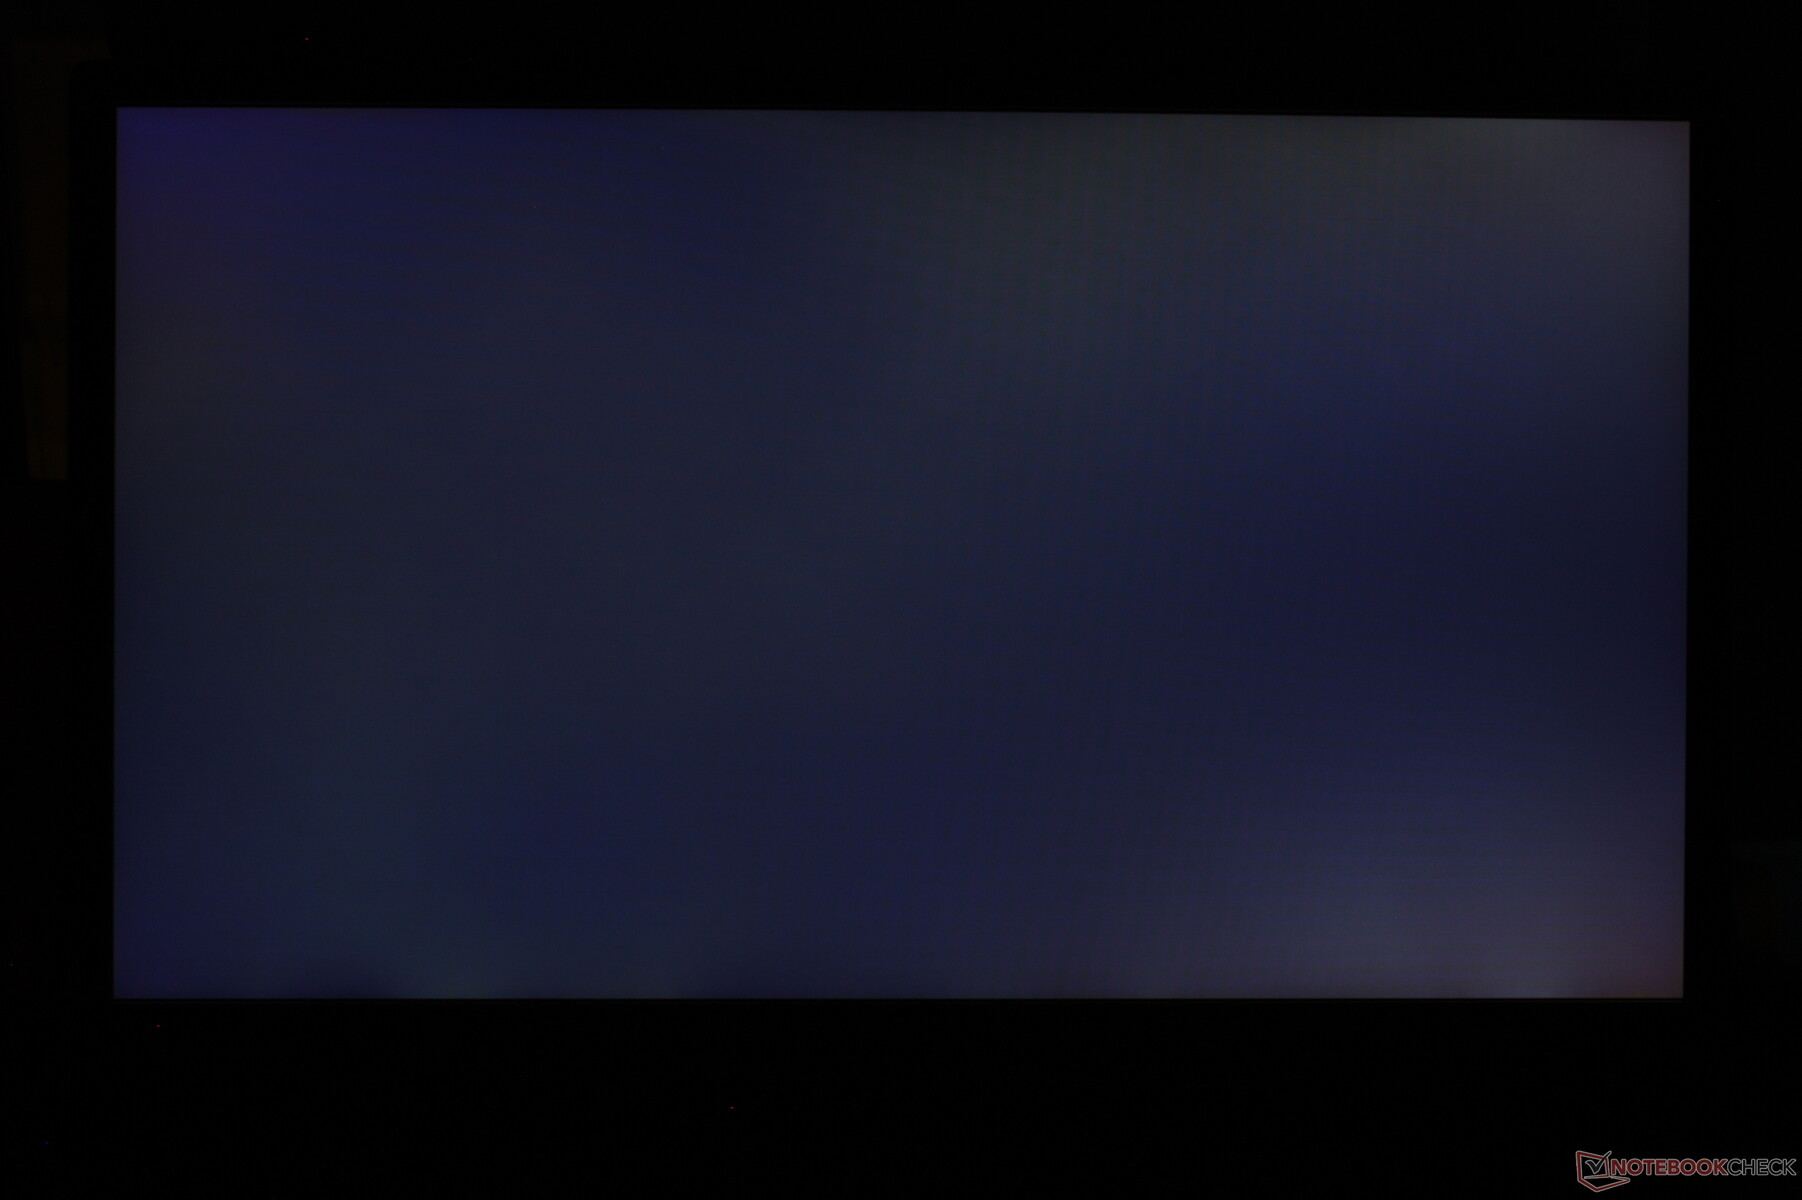
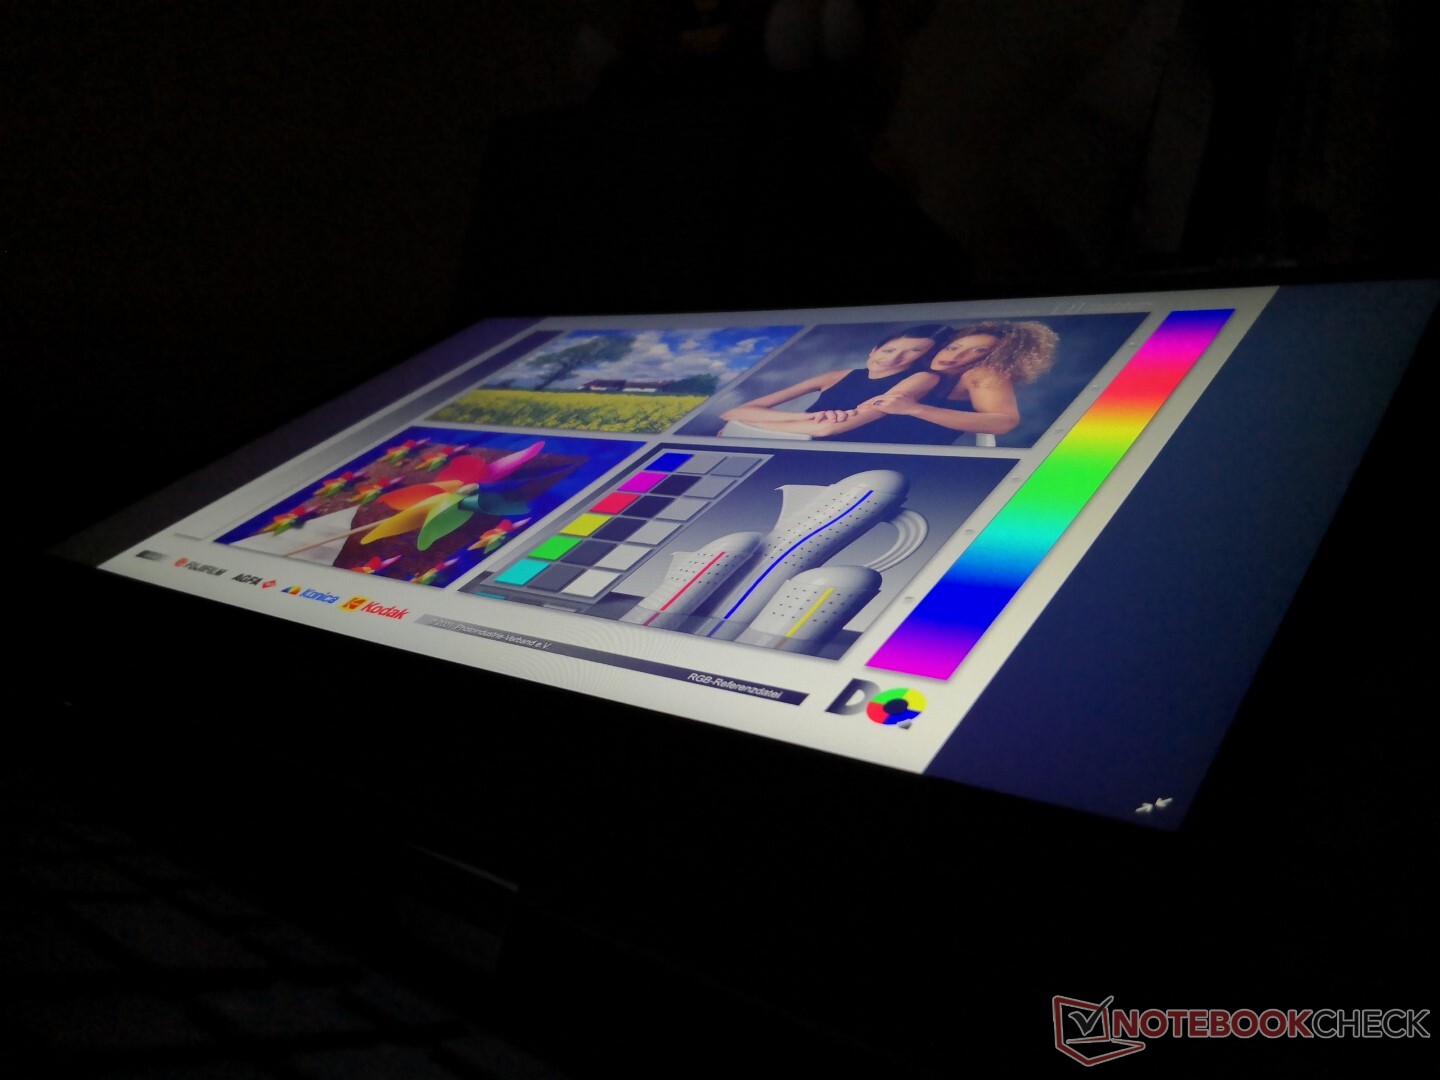
Display options include 1080p60 IPS, 1080p144 IPS, 1080p240 IPS, and 2160p60 OLED. Our unit uses the same matte 1080p144 AU Optronics B156HAN panel as found on the Dell G5 15 5590 and Alienware m15 R1 for a similar visual experience between them. Innate characteristics like contrast ratio, color coverage, and the fast black-white response times are therefore not unlike what we measured on the aforementioned G5 or Alienware. The most disappointing aspect of the display is the low contrast ratio as it becomes apparent during darkened scenes where blacks appear grayer than they should be.
Note that the measurements below reflect only the 1080p144 AU Optronics panel and not the 1080p240 or OLED options. However, we're willing to bet that the OLED panel would be very similar to what you'd find on the XPS 15 7590 series.
| |||||||||||||||||||||||||
Brightness Distribution: 91 %
Center on Battery: 330.5 cd/m²
Contrast: 465:1 (Black: 0.71 cd/m²)
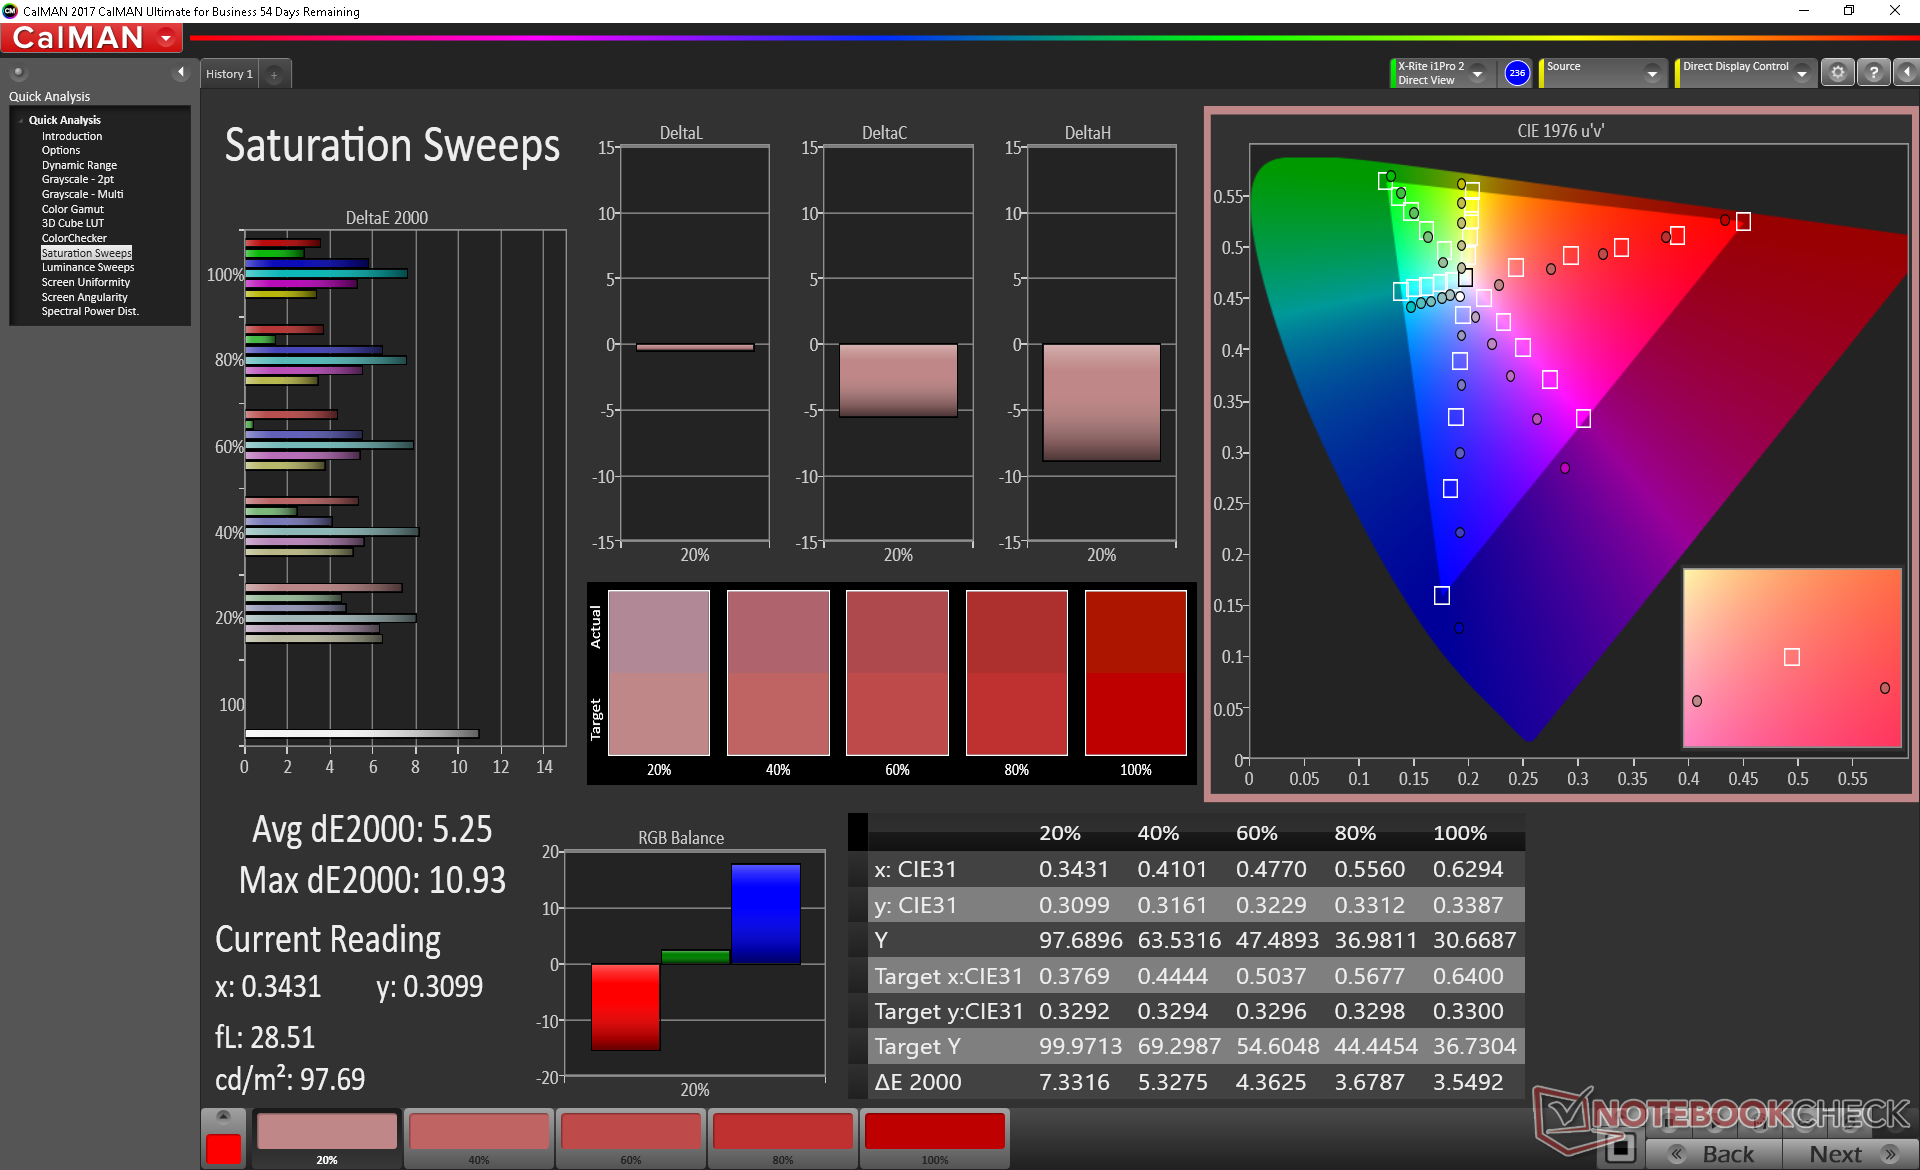
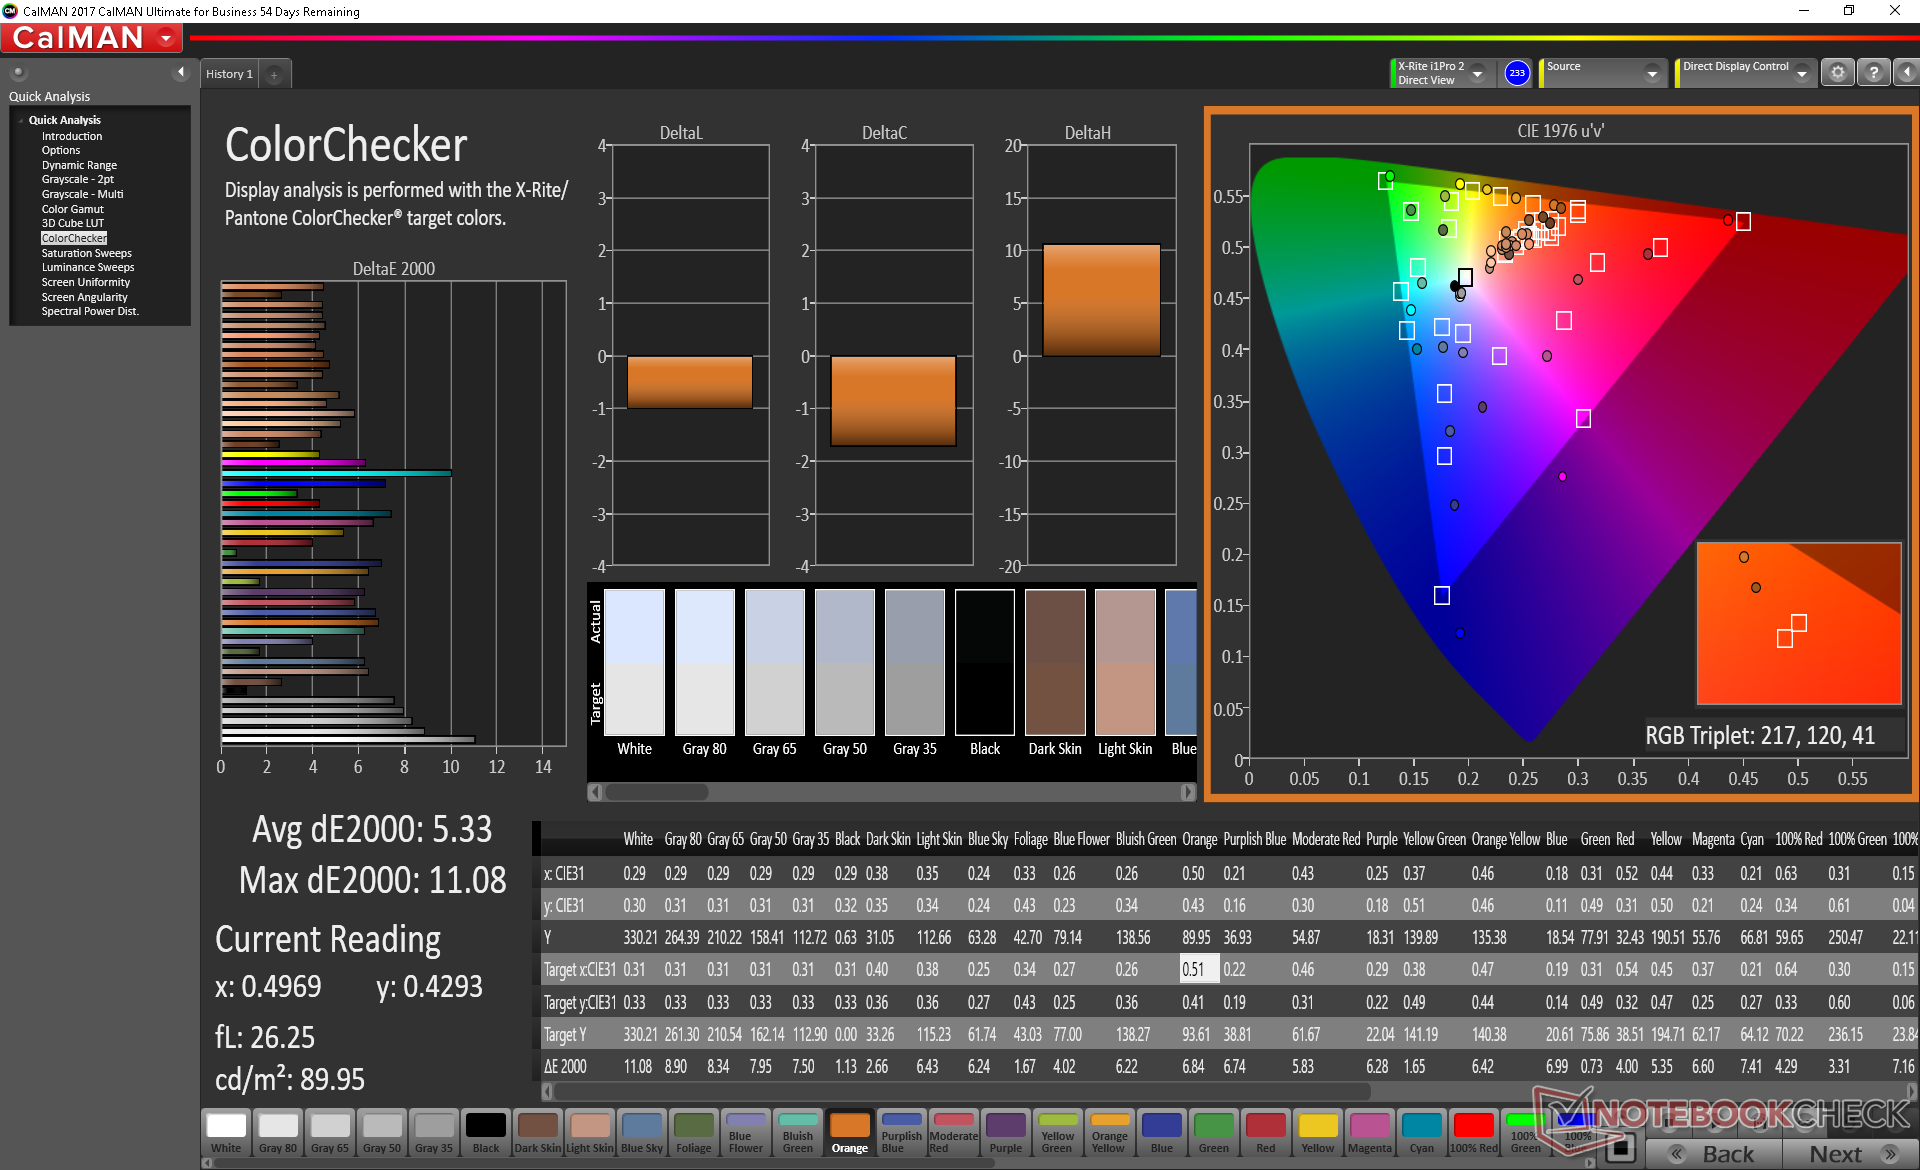
ΔE ColorChecker Calman: 5.33 | ∀{0.5-29.43 Ø4.72}
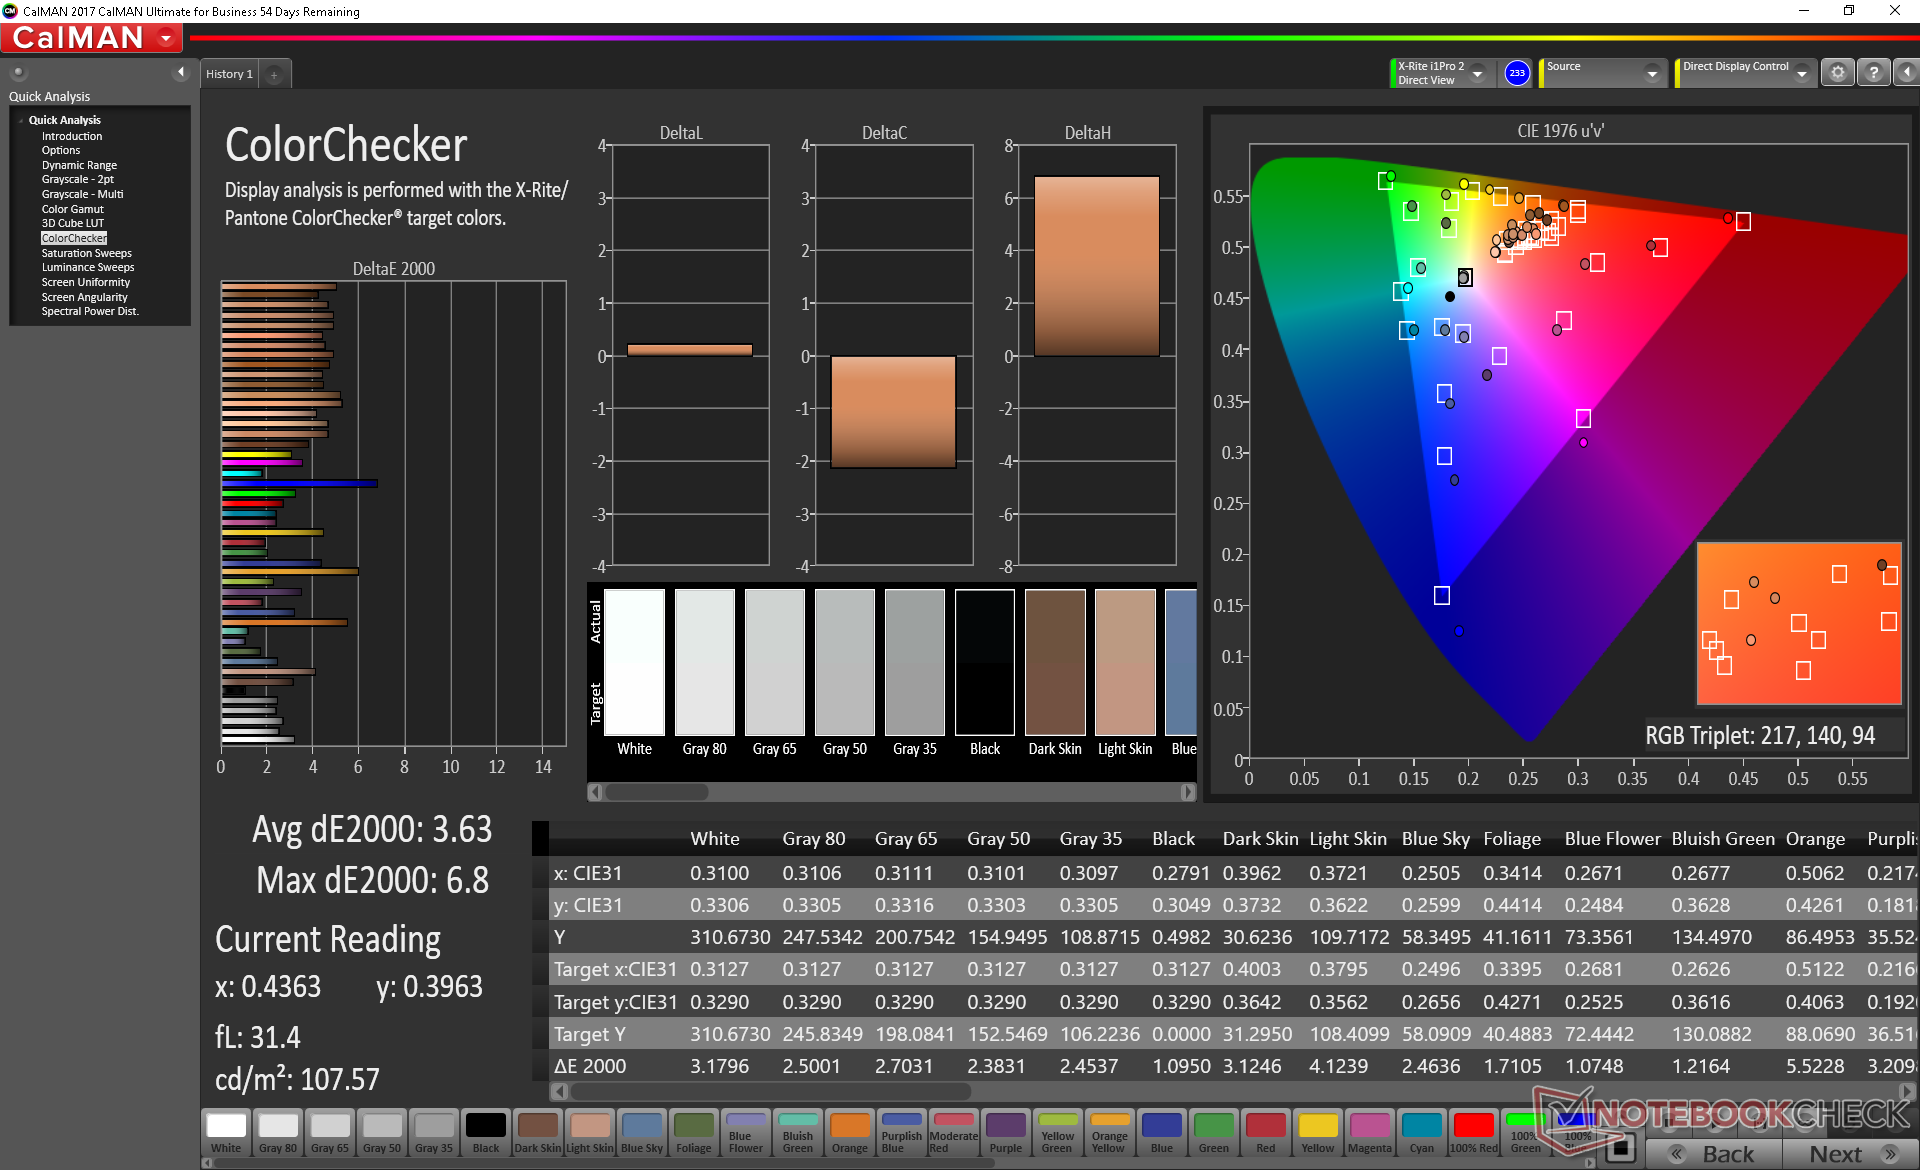
calibrated: 3.63
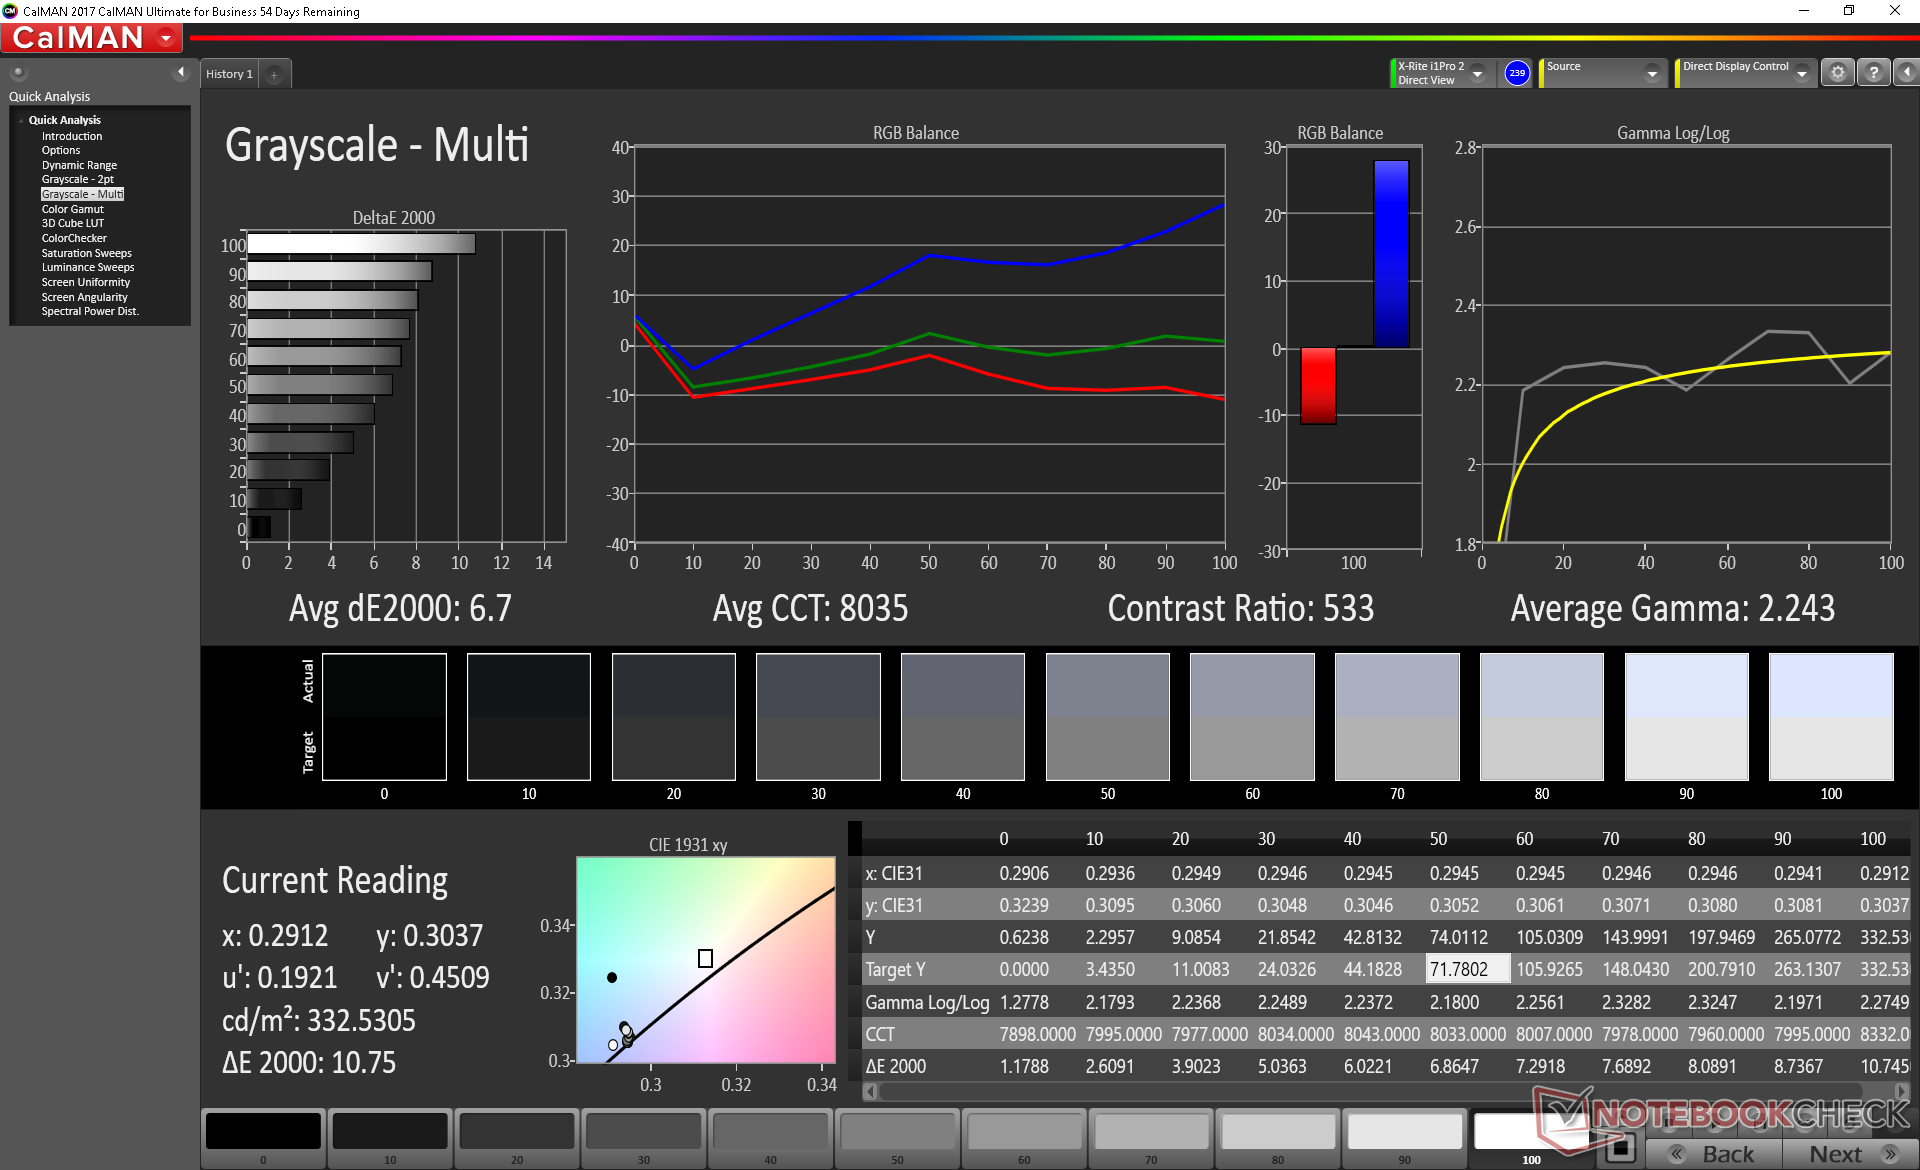
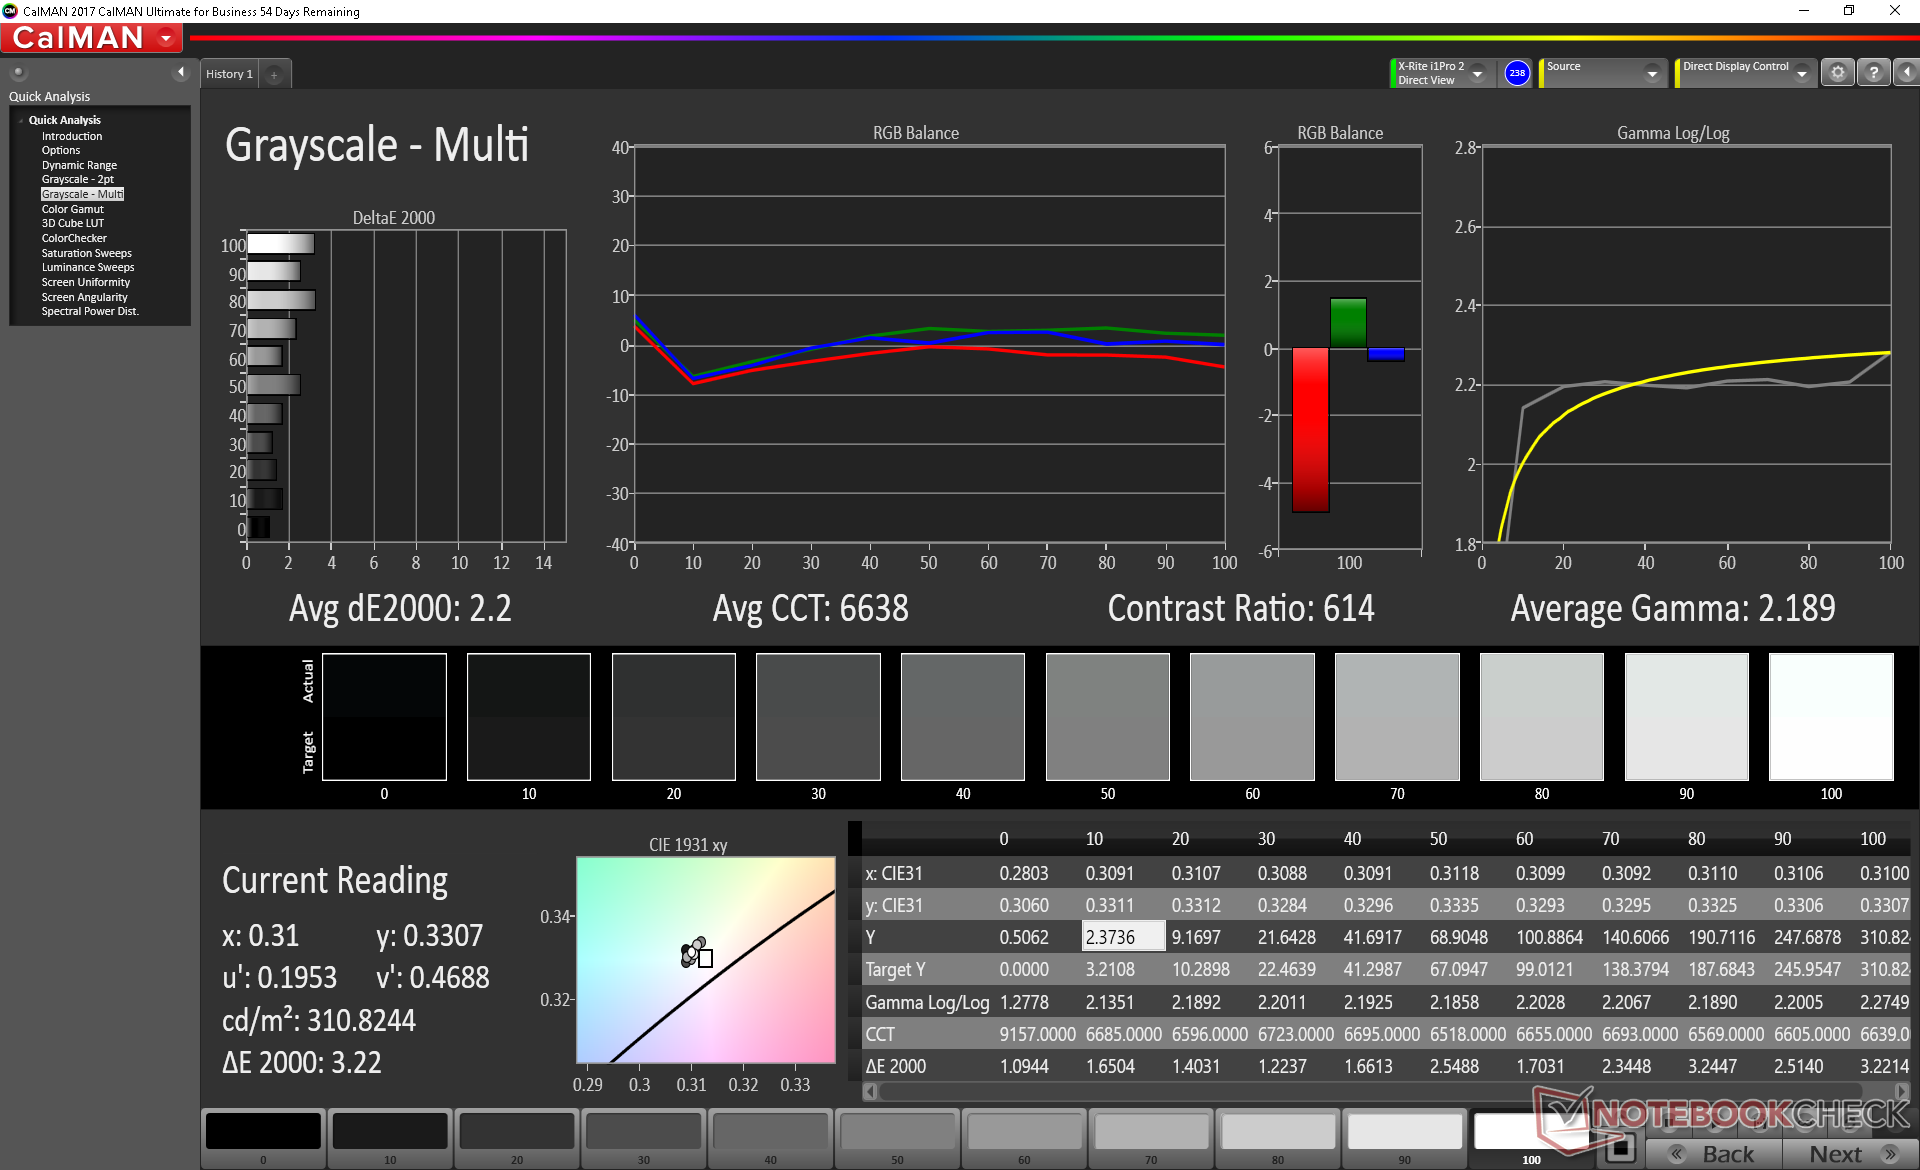
ΔE Greyscale Calman: 6.7 | ∀{0.09-98 Ø4.97}
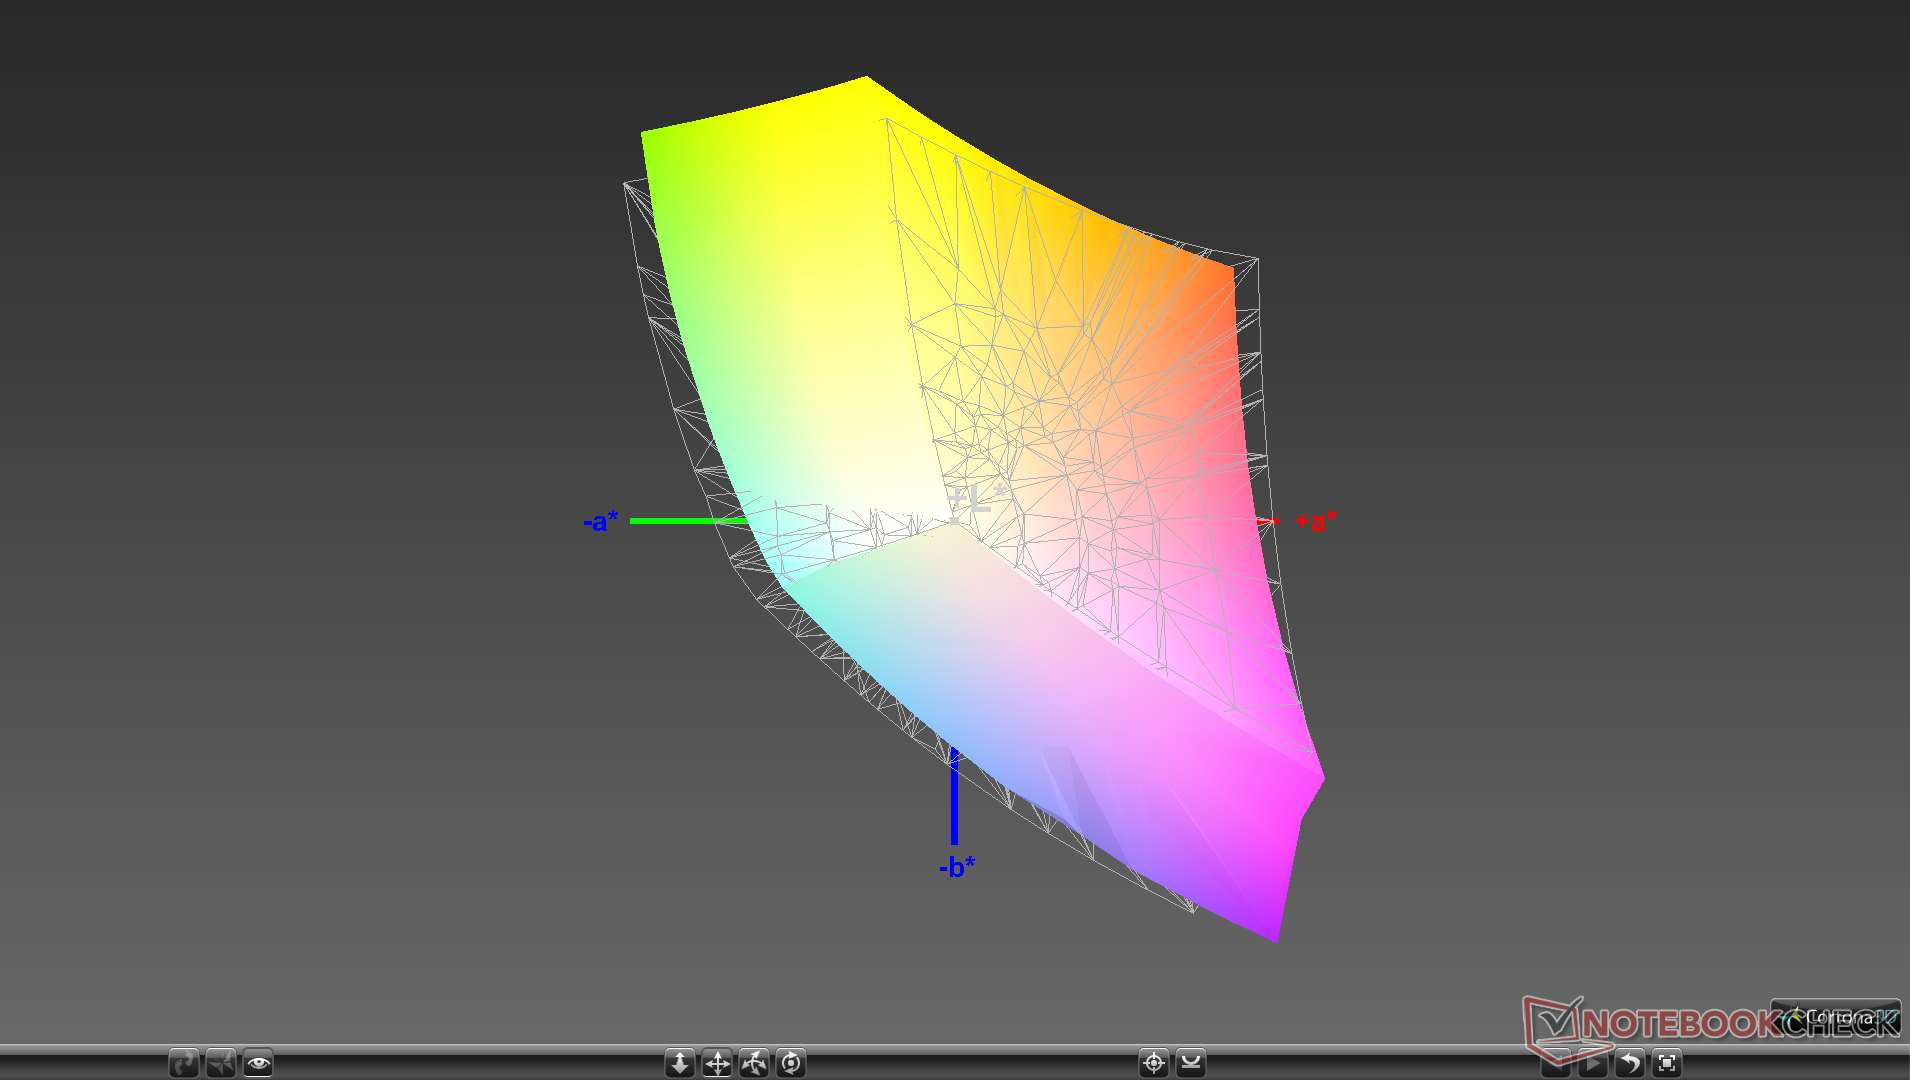
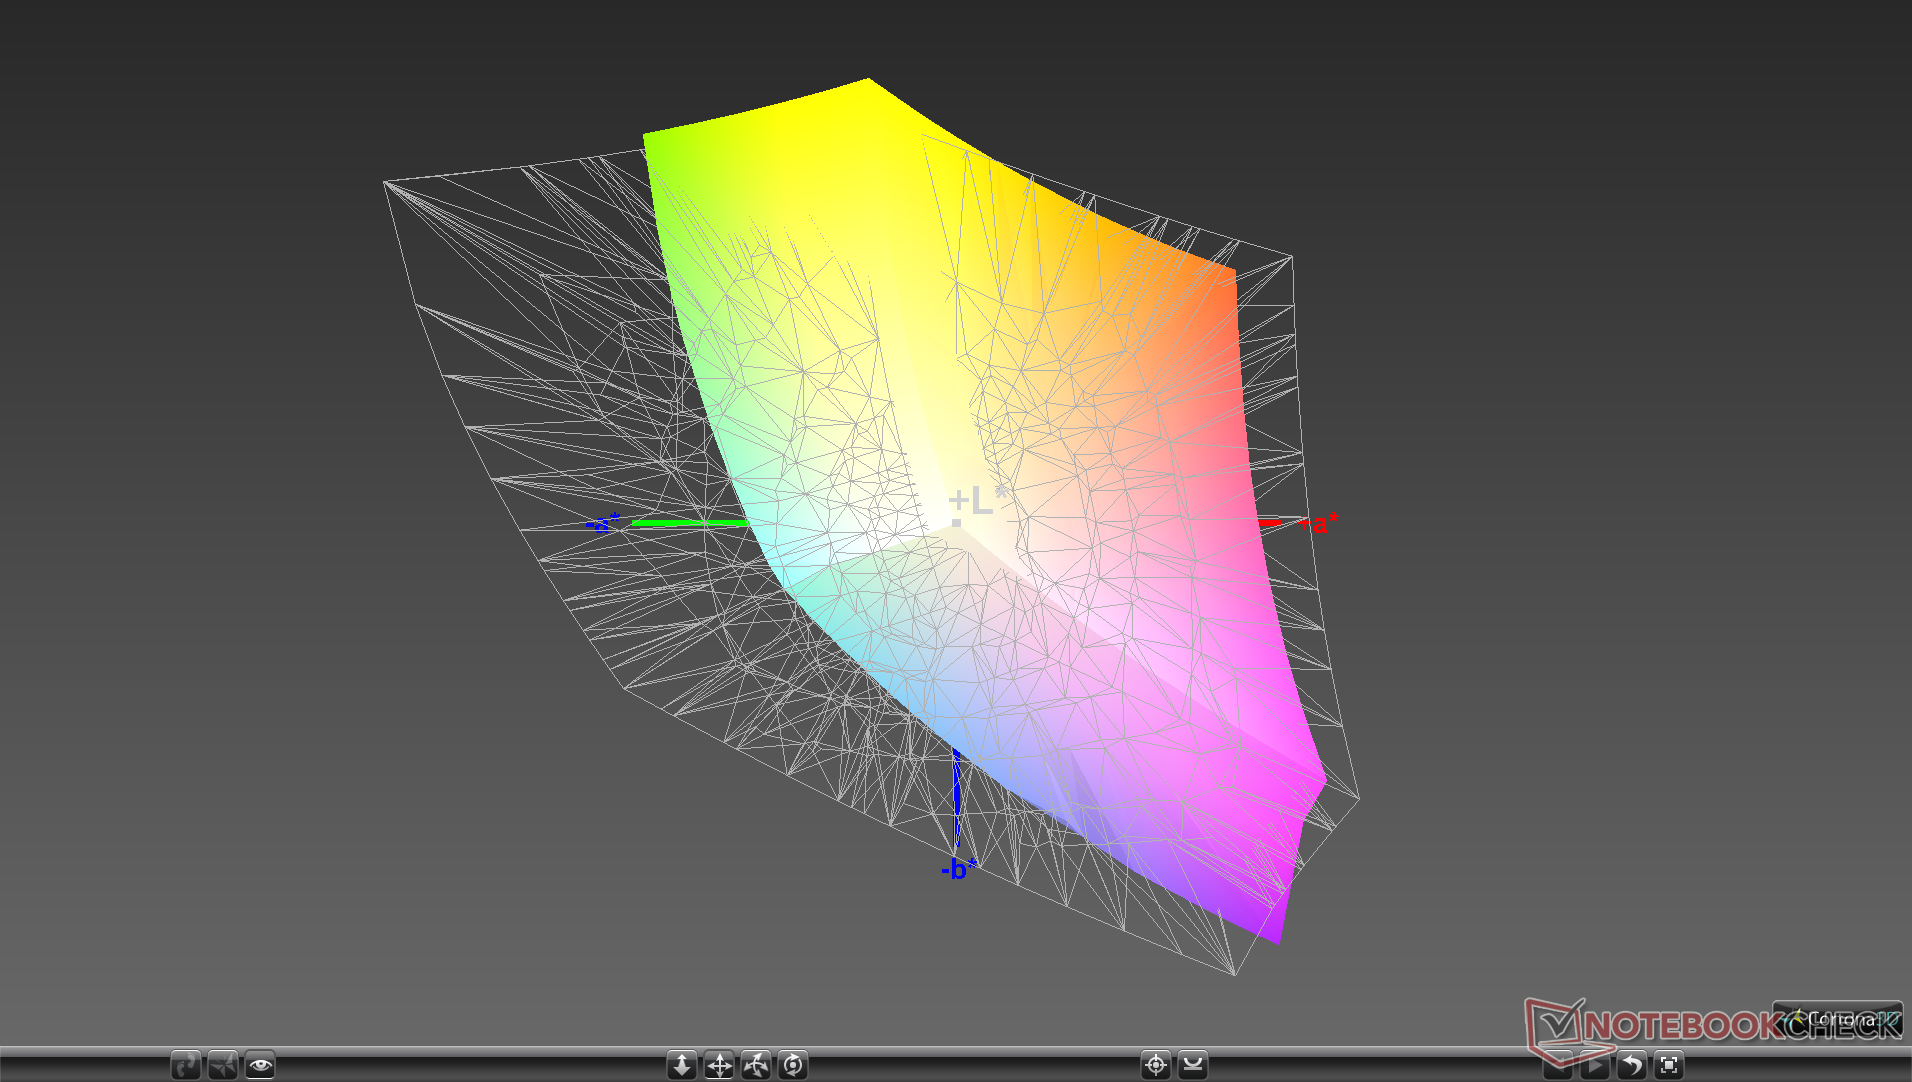
89.5% sRGB (Argyll 1.6.3 3D)
58.3% AdobeRGB 1998 (Argyll 1.6.3 3D)
65.3% AdobeRGB 1998 (Argyll 3D)
90% sRGB (Argyll 3D)
64.4% Display P3 (Argyll 3D)
Gamma: 2.24
CCT: 8035 K
| Dell G7 7590 AU Optronics B156HAN, IPS, 15.6", 1920x1080 | Lenovo Legion Y740-15ICHg LP156WFG-SPB2, IPS, 15.6", 1920x1080 | HP Omen X 2S 15-dg0075cl AU Optronics AUO82ED, IPS, 15.6", 1920x1080 | Asus Strix Scar III G531GW-AZ062T Sharp LQ156M1JW09 (SHP14D3), IPS, 15.6", 1920x1080 | Dell G3 3590 BOE NV15N3D, IPS, 15.6", 1920x1080 | Alienware m15 R2 P87F Sharp LQ156M1, IPS, 15.6", 1920x1080 | Dell G7 15-7588 LG Philips LGD053F, IPS, 15.6", 1920x1080 | |
|---|---|---|---|---|---|---|---|
| Display | 0% | 3% | 5% | -36% | 3% | -40% | |
| Display P3 Coverage (%) | 64.4 | 63.5 -1% | 66.2 3% | 66.2 3% | 40.13 -38% | 65.3 1% | 37.82 -41% |
| sRGB Coverage (%) | 90 | 92.4 3% | 92.3 3% | 97.1 8% | 59.8 -34% | 95.1 6% | 56.2 -38% |
| AdobeRGB 1998 Coverage (%) | 65.3 | 64.7 -1% | 67.2 3% | 67.6 4% | 41.47 -36% | 65.9 1% | 39.2 -40% |
| Response Times | -26% | -3% | 7% | -209% | 2% | -158% | |
| Response Time Grey 50% / Grey 80% * (ms) | 14 ? | 18.8 ? -34% | 15.2 ? -9% | 15 ? -7% | 46 ? -229% | 16.4 ? -17% | 38.8 ? -177% |
| Response Time Black / White * (ms) | 11.2 ? | 13.2 ? -18% | 10.8 ? 4% | 9 ? 20% | 32.4 ? -189% | 8.8 ? 21% | 26.8 ? -139% |
| PWM Frequency (Hz) | 250 ? | 200 ? | 23810 ? | ||||
| Screen | 24% | 26% | 21% | 0% | 14% | -21% | |
| Brightness middle (cd/m²) | 330.5 | 320.4 -3% | 324.8 -2% | 309 -7% | 276.2 -16% | 324.2 -2% | 250.9 -24% |
| Brightness (cd/m²) | 324 | 298 -8% | 316 -2% | 284 -12% | 261 -19% | 304 -6% | 246 -24% |
| Brightness Distribution (%) | 91 | 85 -7% | 84 -8% | 88 -3% | 86 -5% | 90 -1% | 89 -2% |
| Black Level * (cd/m²) | 0.71 | 0.42 41% | 0.26 63% | 0.42 41% | 0.24 66% | 0.38 46% | 0.34 52% |
| Contrast (:1) | 465 | 763 64% | 1249 169% | 736 58% | 1151 148% | 853 83% | 738 59% |
| Colorchecker dE 2000 * | 5.33 | 3.21 40% | 4.96 7% | 3.99 25% | 5.56 -4% | 5.01 6% | 7.34 -38% |
| Colorchecker dE 2000 max. * | 11.08 | 5.54 50% | 8.95 19% | 8.3 25% | 23.45 -112% | 12.7 -15% | 28.66 -159% |
| Colorchecker dE 2000 calibrated * | 3.63 | 2.36 35% | 3.23 11% | 1.12 69% | 5.23 -44% | 1.64 55% | 4.42 -22% |
| Greyscale dE 2000 * | 6.7 | 3.6 46% | 5 25% | 5.43 19% | 2.8 58% | 7.9 -18% | 6.8 -1% |
| Gamma | 2.24 98% | 2.27 97% | 2.21 100% | 2.57 86% | 2.37 93% | 2.35 94% | 2.164 102% |
| CCT | 8035 81% | 6503 100% | 7742 84% | 7767 84% | 6710 97% | 8455 77% | 6780 96% |
| Color Space (Percent of AdobeRGB 1998) (%) | 58.3 | 59 1% | 59.8 3% | 63 8% | 37.8 -35% | 60.8 4% | 36 -38% |
| Color Space (Percent of sRGB) (%) | 89.5 | 92 3% | 91.8 3% | 97 8% | 59 -34% | 95.5 7% | 56 -37% |
| Total Average (Program / Settings) | -1% /
13% | 9% /
18% | 11% /
16% | -82% /
-33% | 6% /
11% | -73% /
-42% |
* ... smaller is better
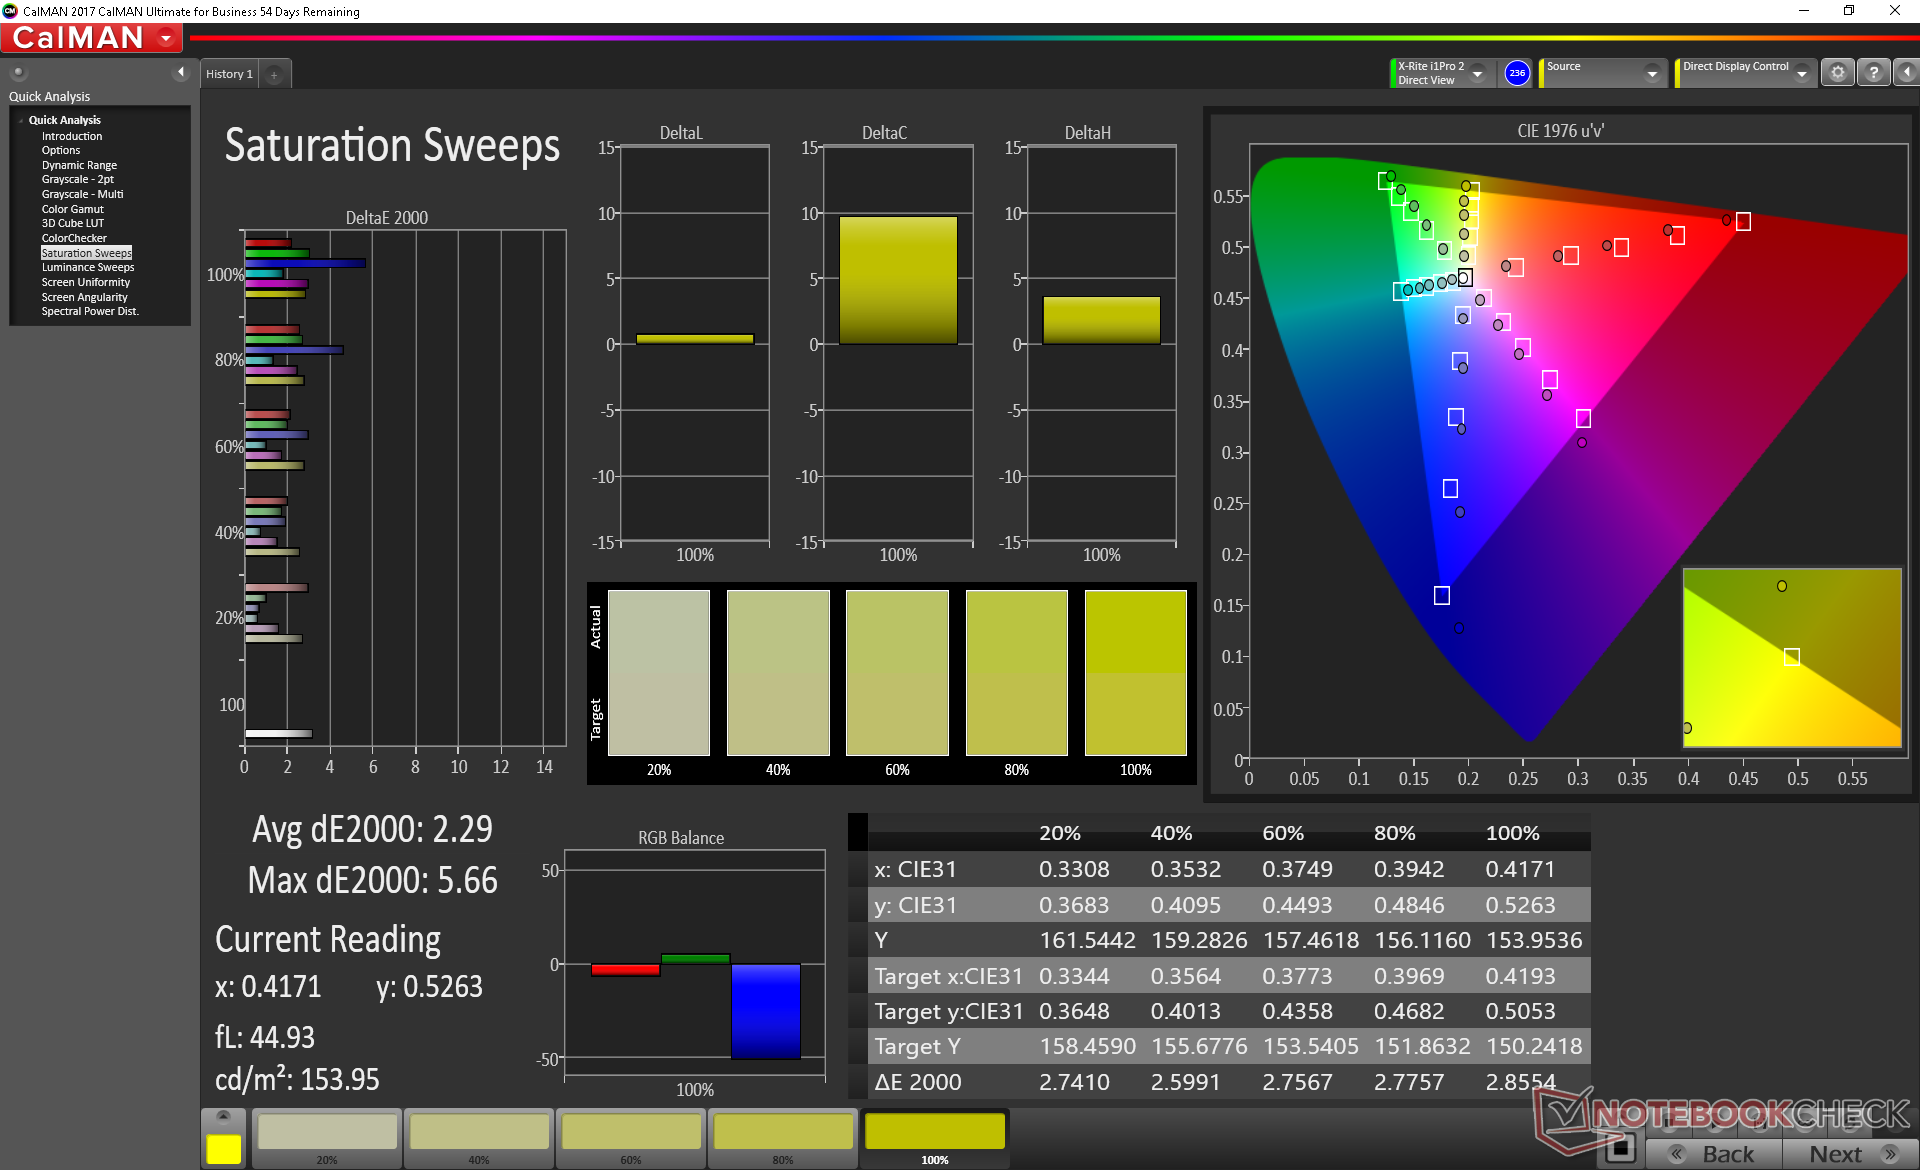
Color space covers approximately 90 percent and 58 percent of the sRGB and AdobeRGB standards, respectively, not unlike most other mid-range to high-end gaming panels. This is a significant improvement over the much narrower gamuts of both the less expensive BOE panel of the G3 3590 and the LG Philips panel of the older G7 7588. The higher-end 4K UHD OLED option will offer even deeper colors than any current 144 Hz or 240 Hz 1080p laptop panel.
Further measurements with an X-Rite colorimeter show poor calibration out of the box. Color temperature in particular is far too cool and so colors suffer as a result. Our calibration attempt improves grayscale significantly from an average DeltaE of 6.7 to 2.2. We recommend an end-user calibration if possible to get the most out of the display or users can also apply our ICM profile above.
Display Response Times
| ↔ Response Time Black to White | ||
|---|---|---|
| 11.2 ms ... rise ↗ and fall ↘ combined | ↗ 6 ms rise | 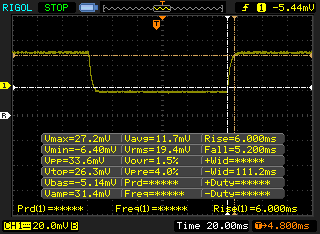 |
| ↘ 5.2 ms fall | ||
| The screen shows good response rates in our tests, but may be too slow for competitive gamers. In comparison, all tested devices range from 0.1 (minimum) to 240 (maximum) ms. » 30 % of all devices are better. This means that the measured response time is better than the average of all tested devices (19.8 ms). | ||
| ↔ Response Time 50% Grey to 80% Grey | ||
| 14 ms ... rise ↗ and fall ↘ combined | ↗ 7.2 ms rise | 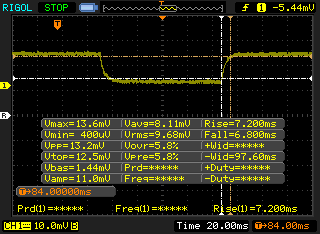 |
| ↘ 6.8 ms fall | ||
| The screen shows good response rates in our tests, but may be too slow for competitive gamers. In comparison, all tested devices range from 0.165 (minimum) to 636 (maximum) ms. » 28 % of all devices are better. This means that the measured response time is better than the average of all tested devices (31 ms). | ||
Screen Flickering / PWM (Pulse-Width Modulation)
| Screen flickering / PWM not detected | 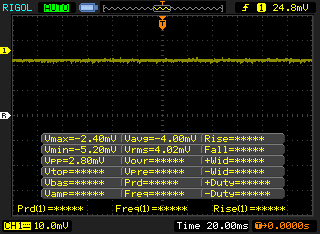 | ||
In comparison: 52 % of all tested devices do not use PWM to dim the display. If PWM was detected, an average of 7763 (minimum: 5 - maximum: 343500) Hz was measured. | |||
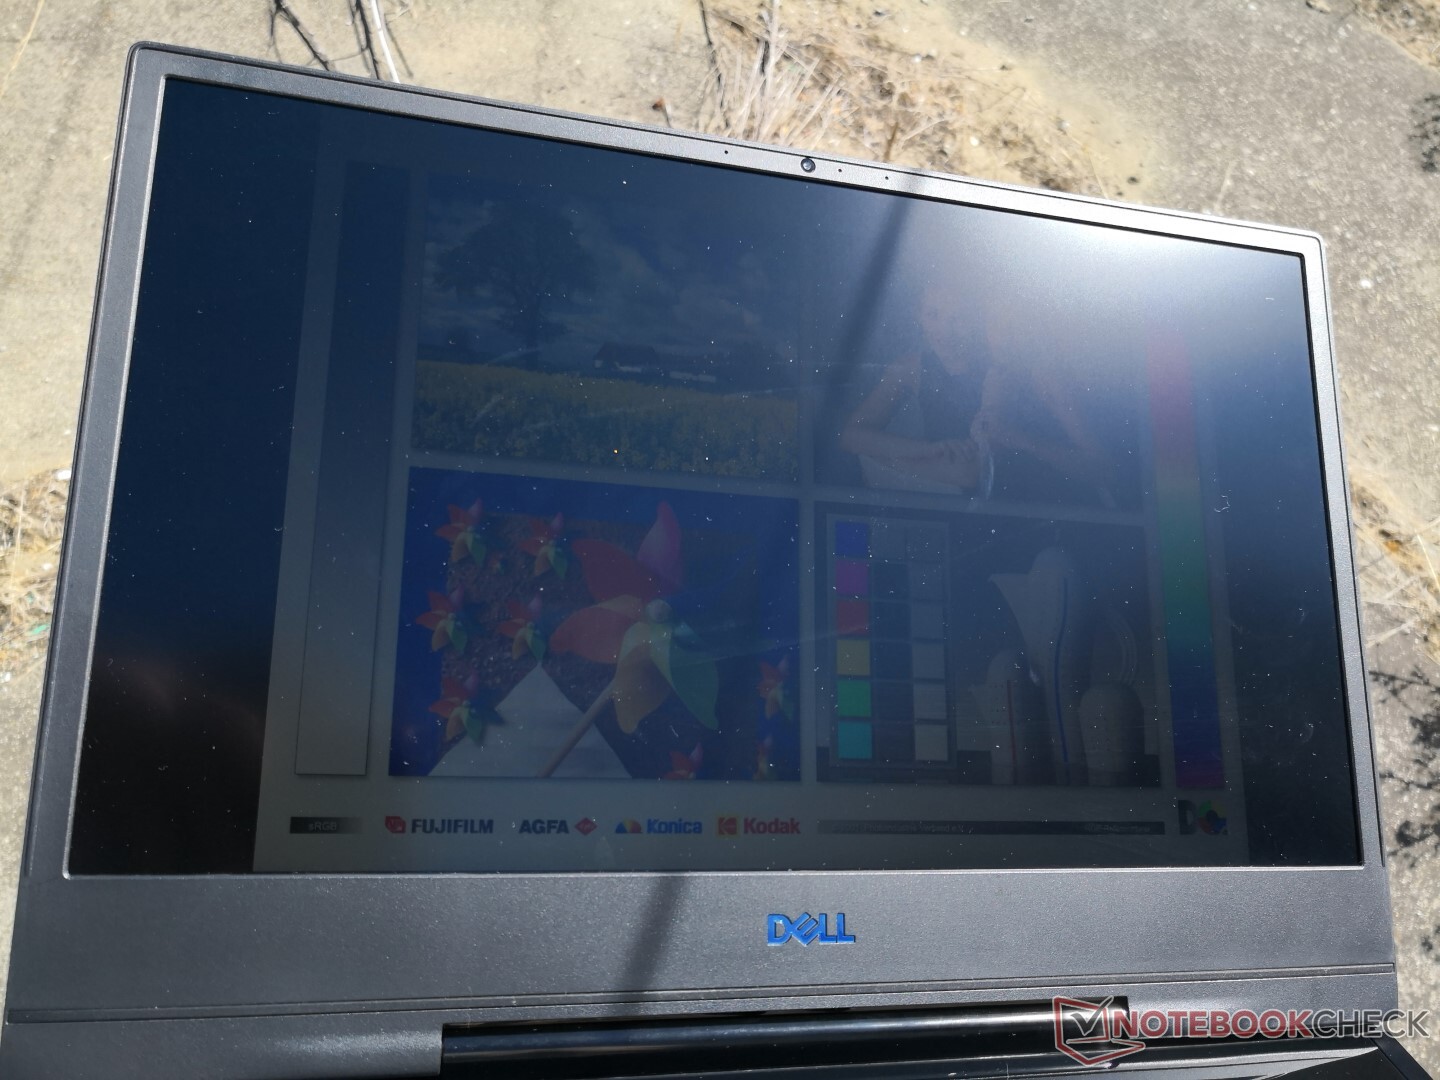
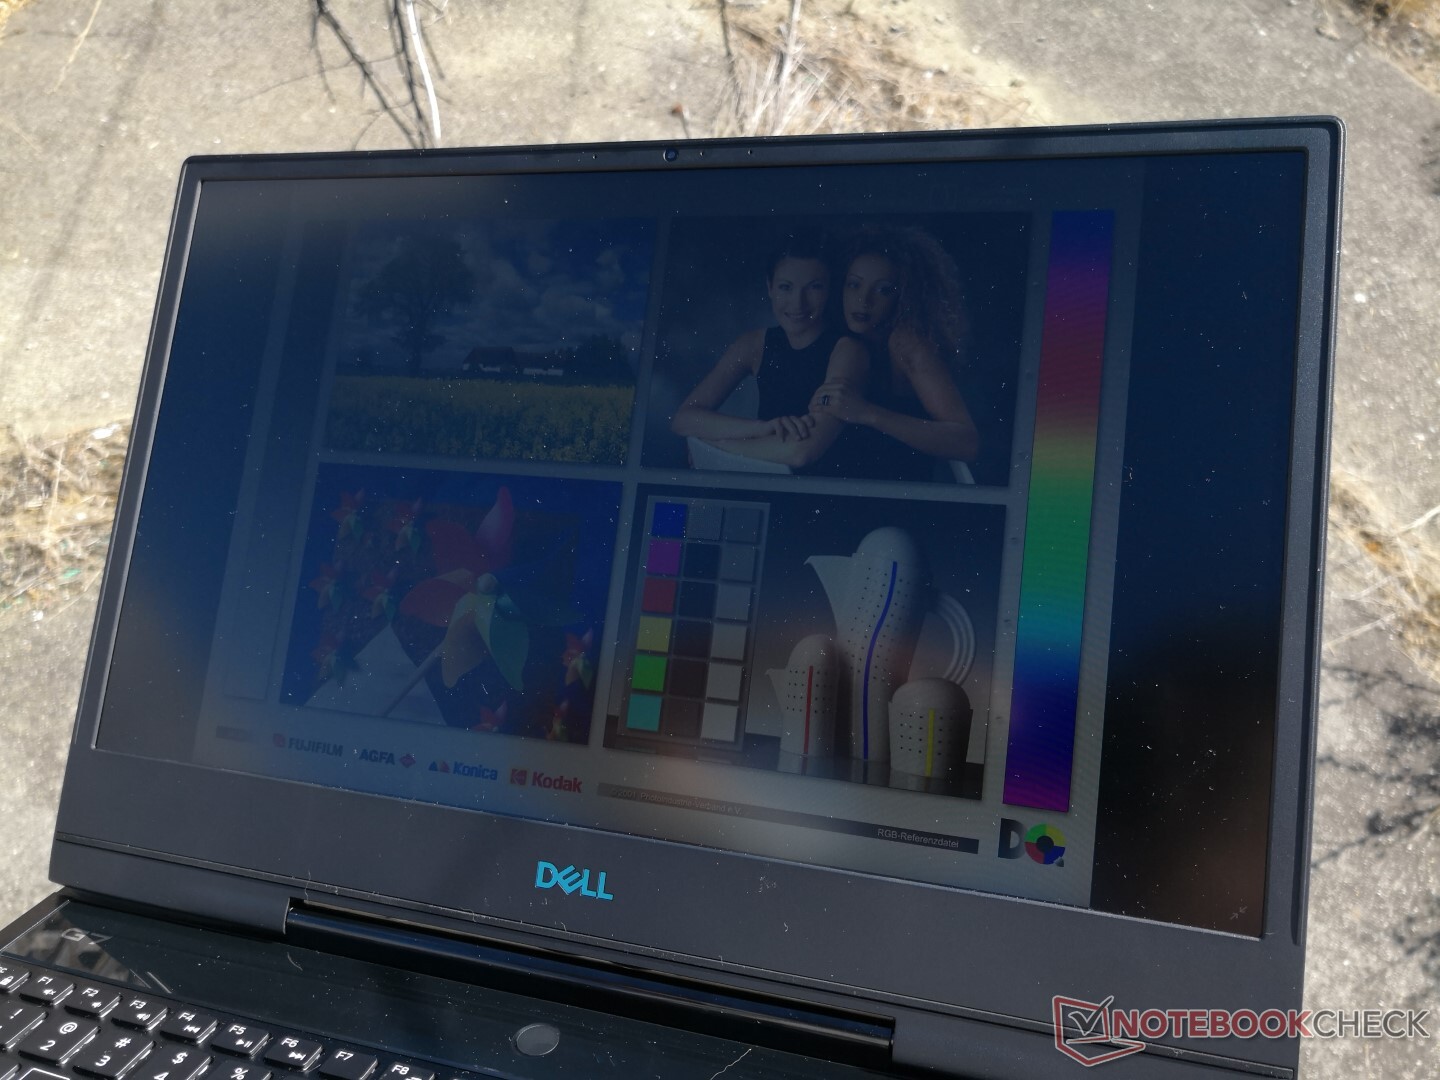
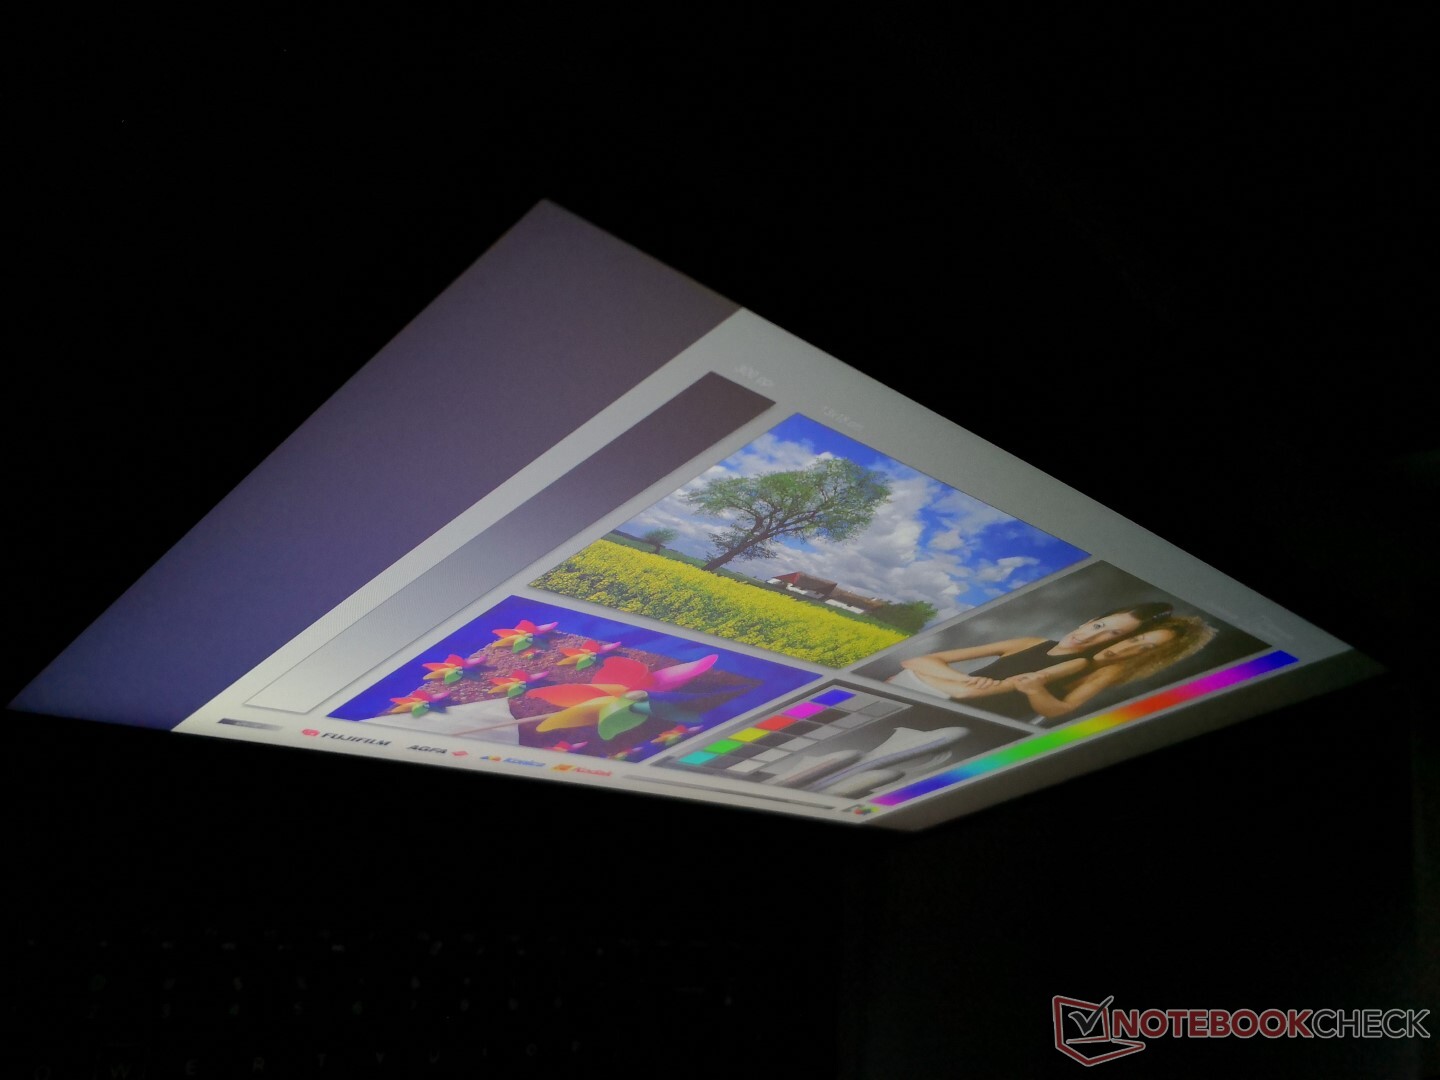
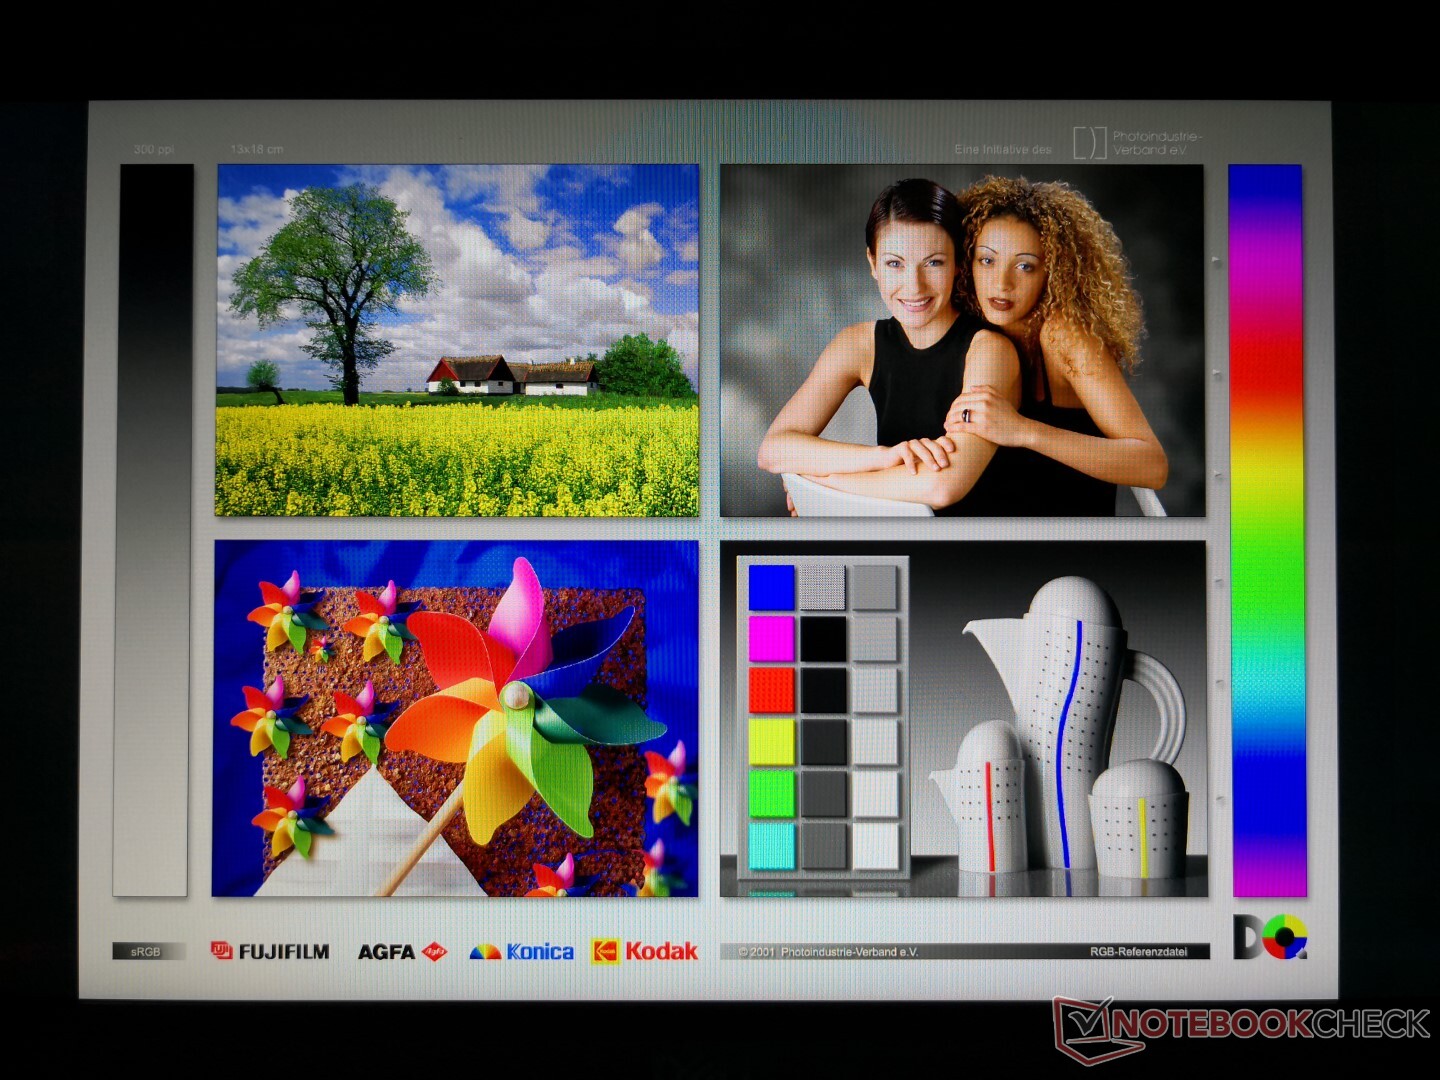
Outdoor visibility is better than on last year's G7 7588 since the display is now brighter. Even so, the G7 series is not designed to be used outdoors frequently. More traditional flagship consumer laptops like the MacBook Pro 15 or Dell's own XPS 15 have even brighter displays. Meanwhile, viewing angles are wide but with more noticeable contrast degradation than we've come to expect from IPS.
Performance
Because of the wide range of Core i5 to Core i9 and GeForce GTX 1650 to RTX 2080 Max-Q options, the G7 7590 can perform as slow as a budget gaming laptop to as fast as an enthusiast offering. All SKUs come with Optimus as standard and so there are no G-Sync features.
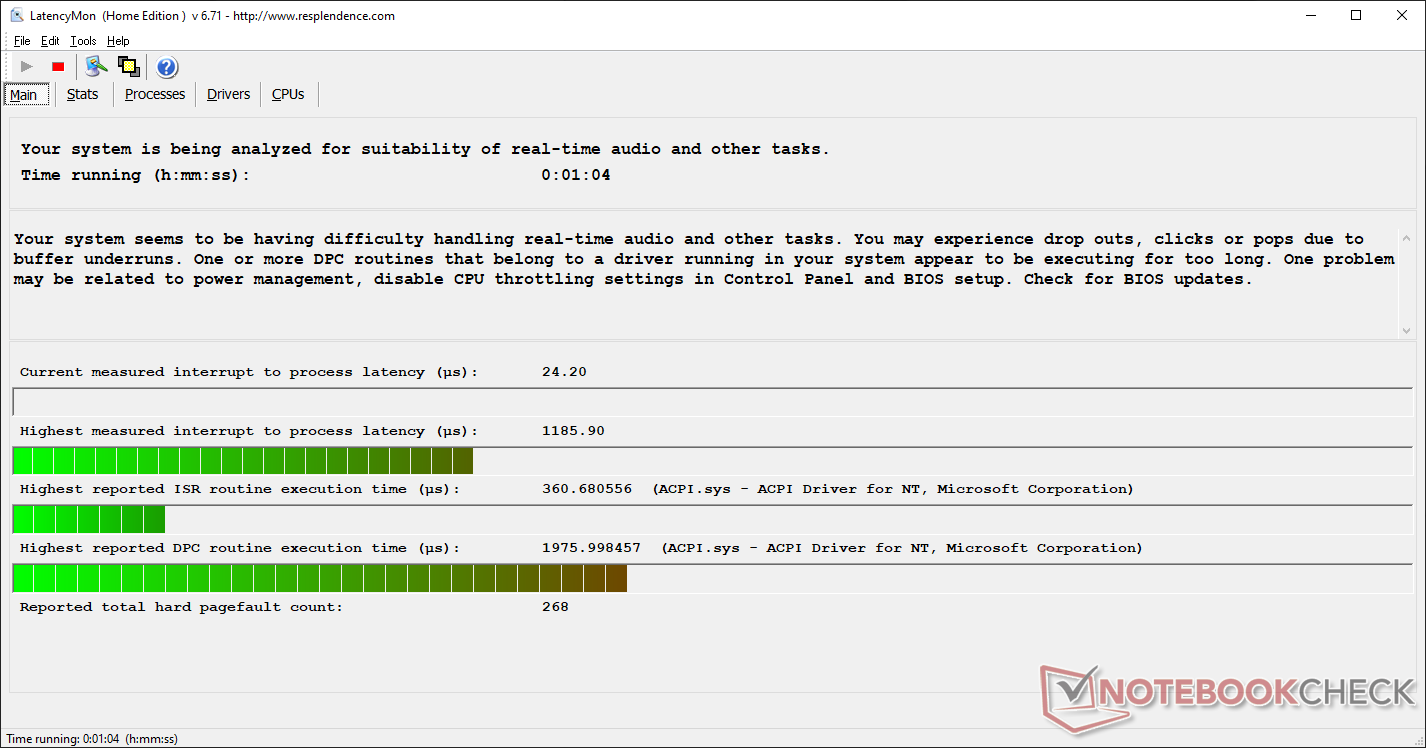
LatencyMon shows DPC latency issues even when wireless is disabled. This seems to be an ongoing problem with many of Dell's laptops.
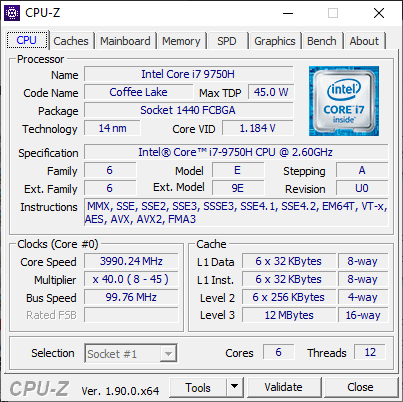
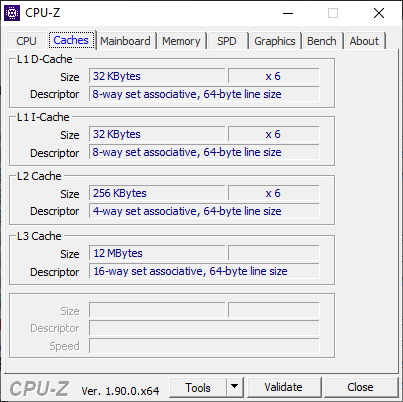
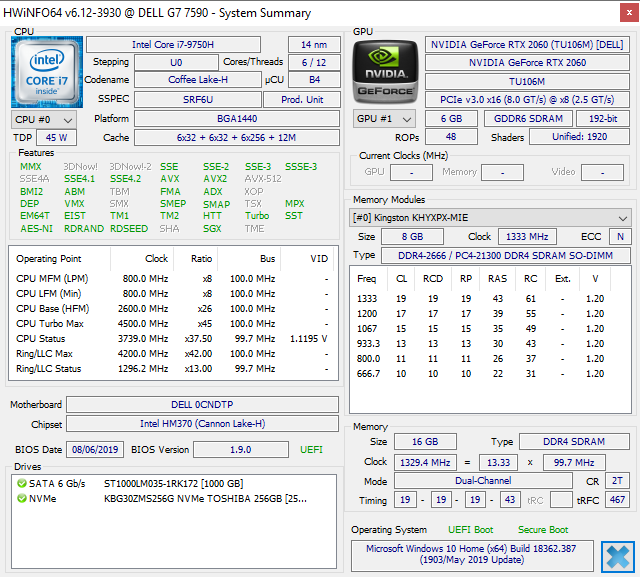
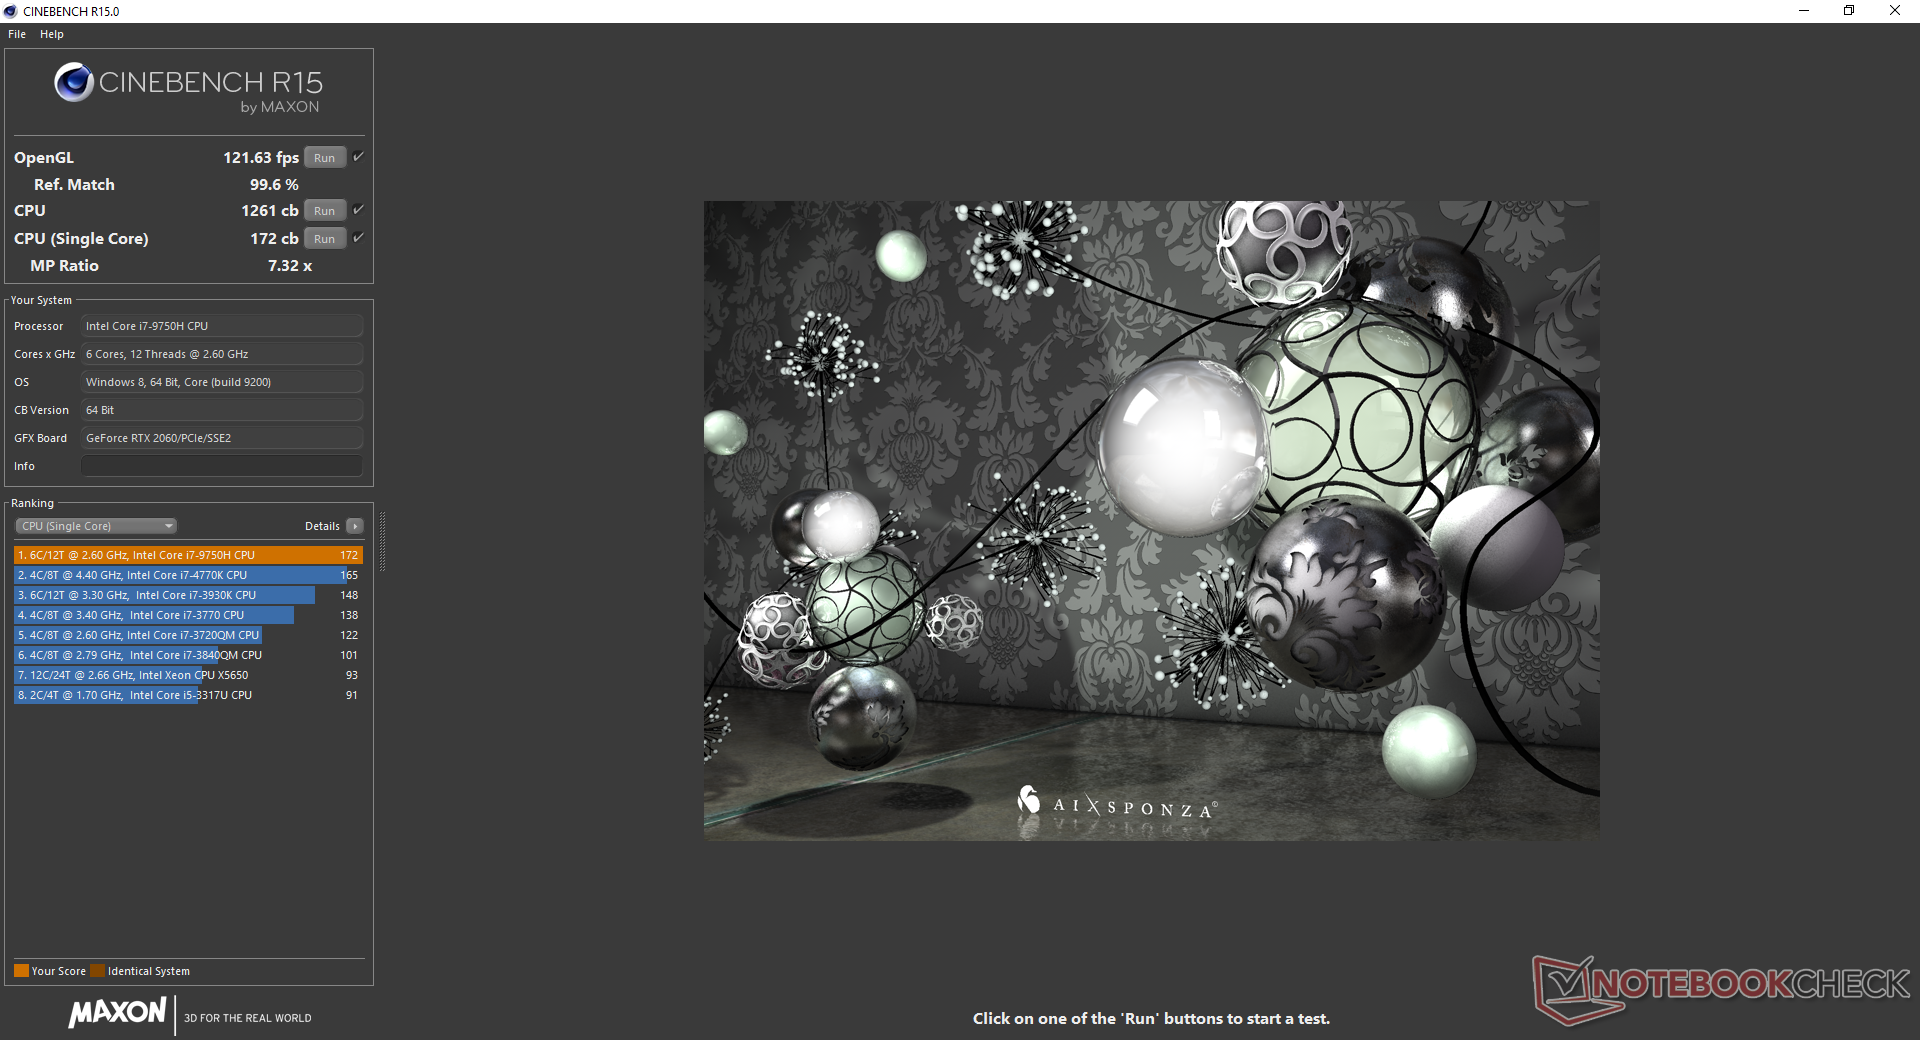
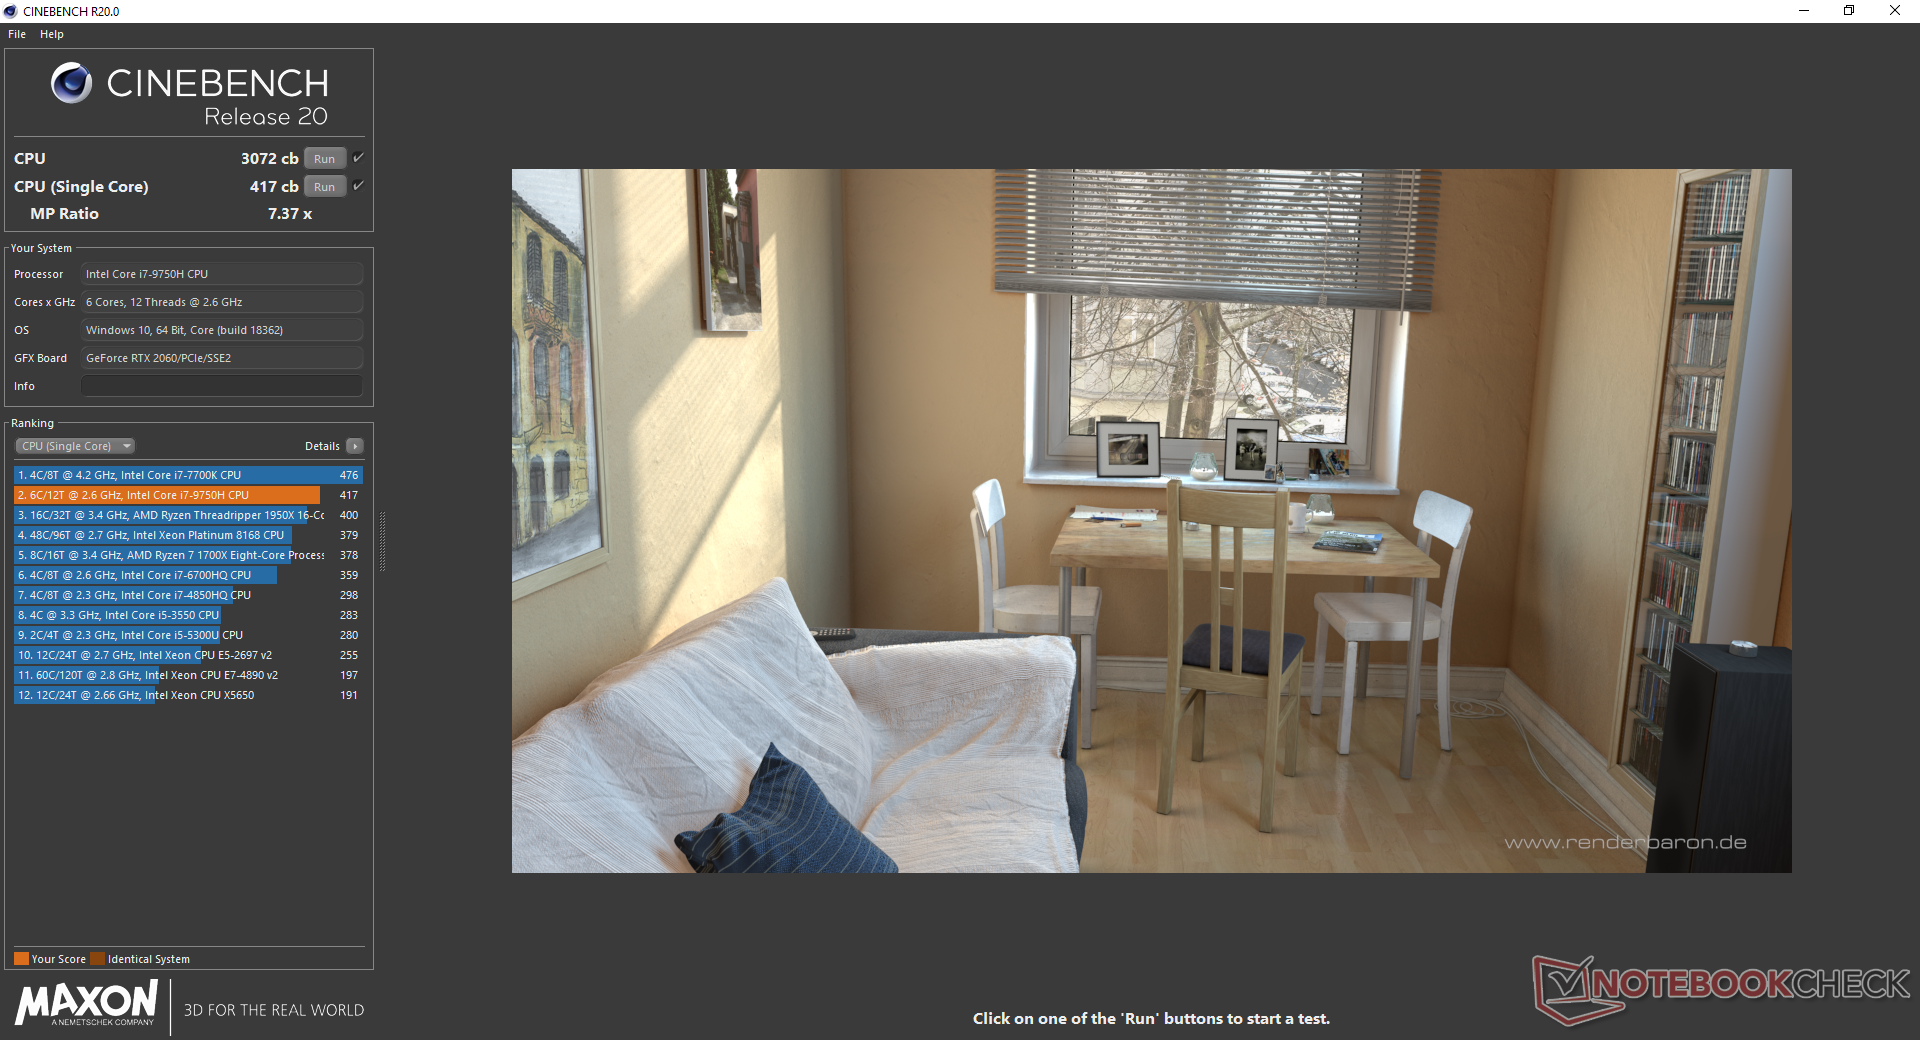
Processor
While we've become very familiar with the Core i7-9750H by now, the CPU in the G7 7590 impresses with its ability to maintain very high Turbo Boost clock rates for longer than other laptops. Running CineBench R15 Multi-Thread in a loop shows no dip in performance over time in contrast to the Asus Strix Scar III G531GW or HP Omen X 2S 15 each equipped with the same Core i7 processor as shown by the comparison graph below. Users can expect performance to be consistently above the Core i5-8300H, i5-9300H, or i7-7700HQ by about 50 to 60 percent.
See our dedicated page on the Core i7-9750H for more technical information and benchmark comparisons.
System Performance
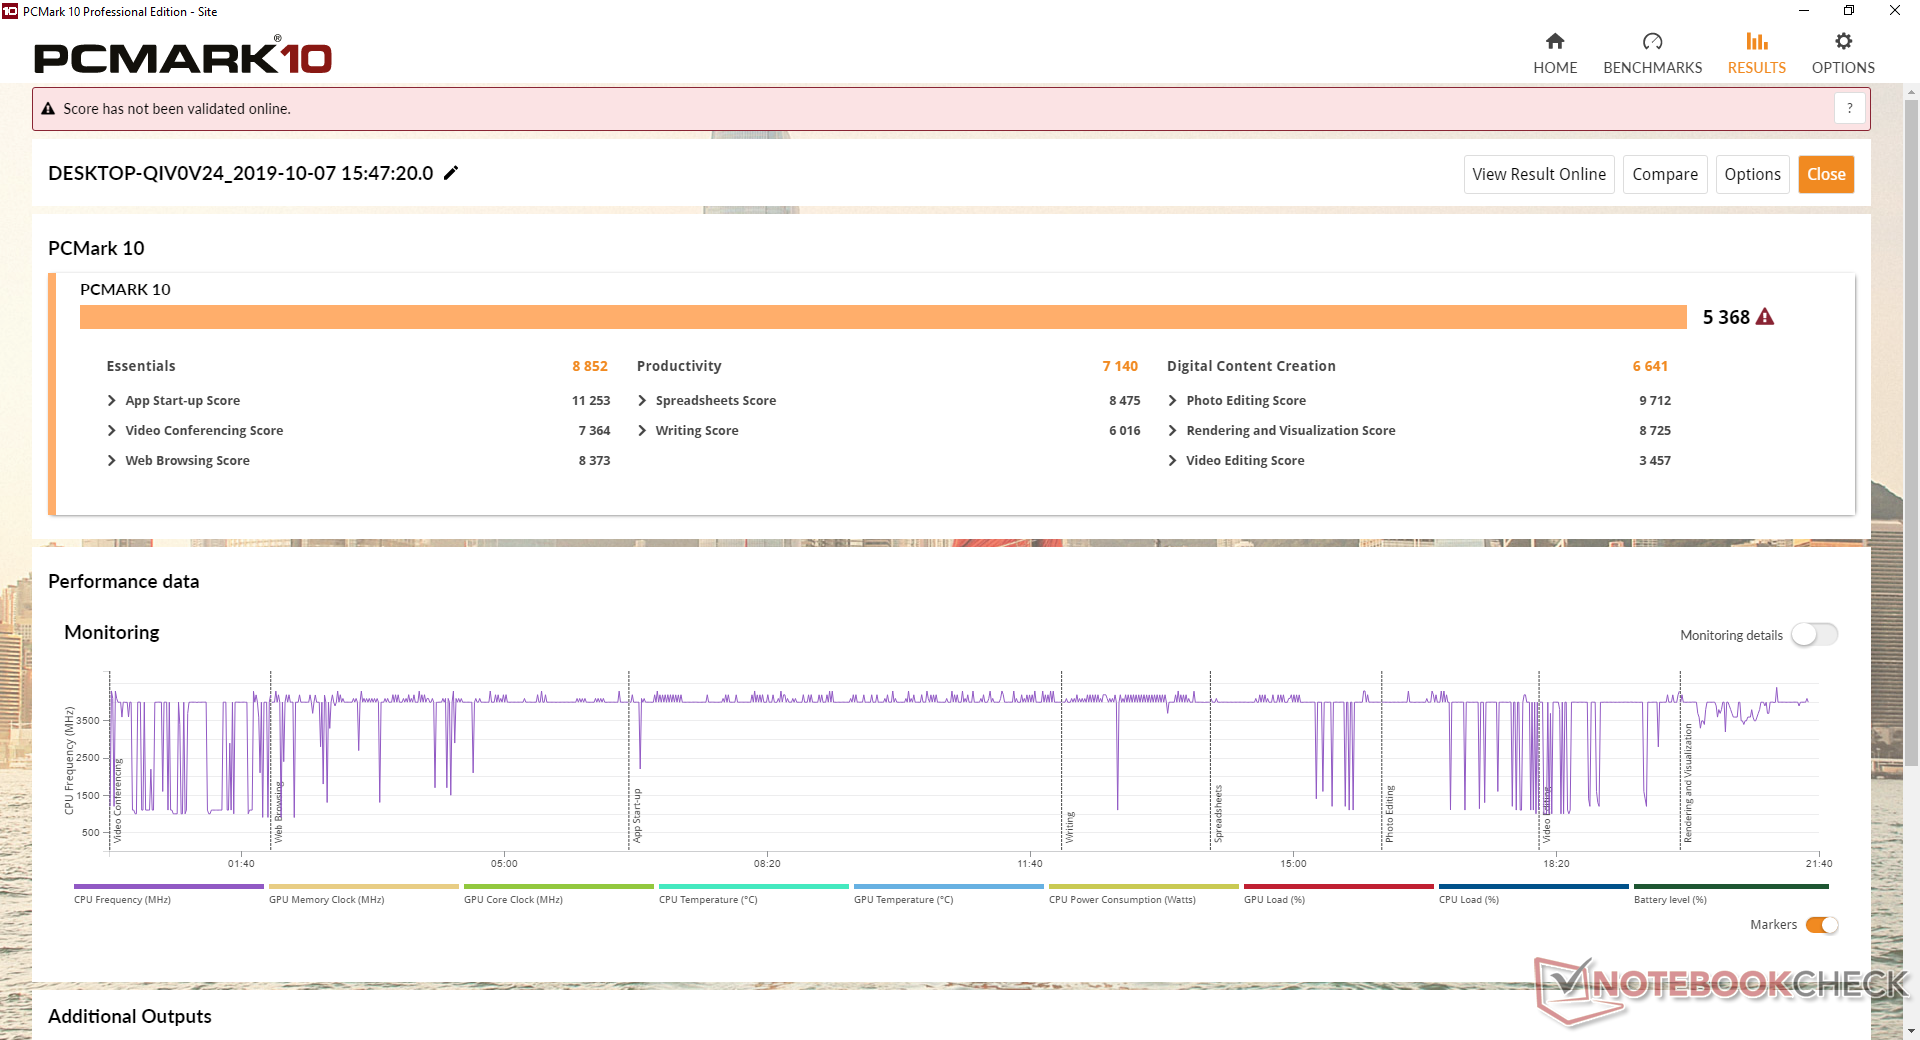
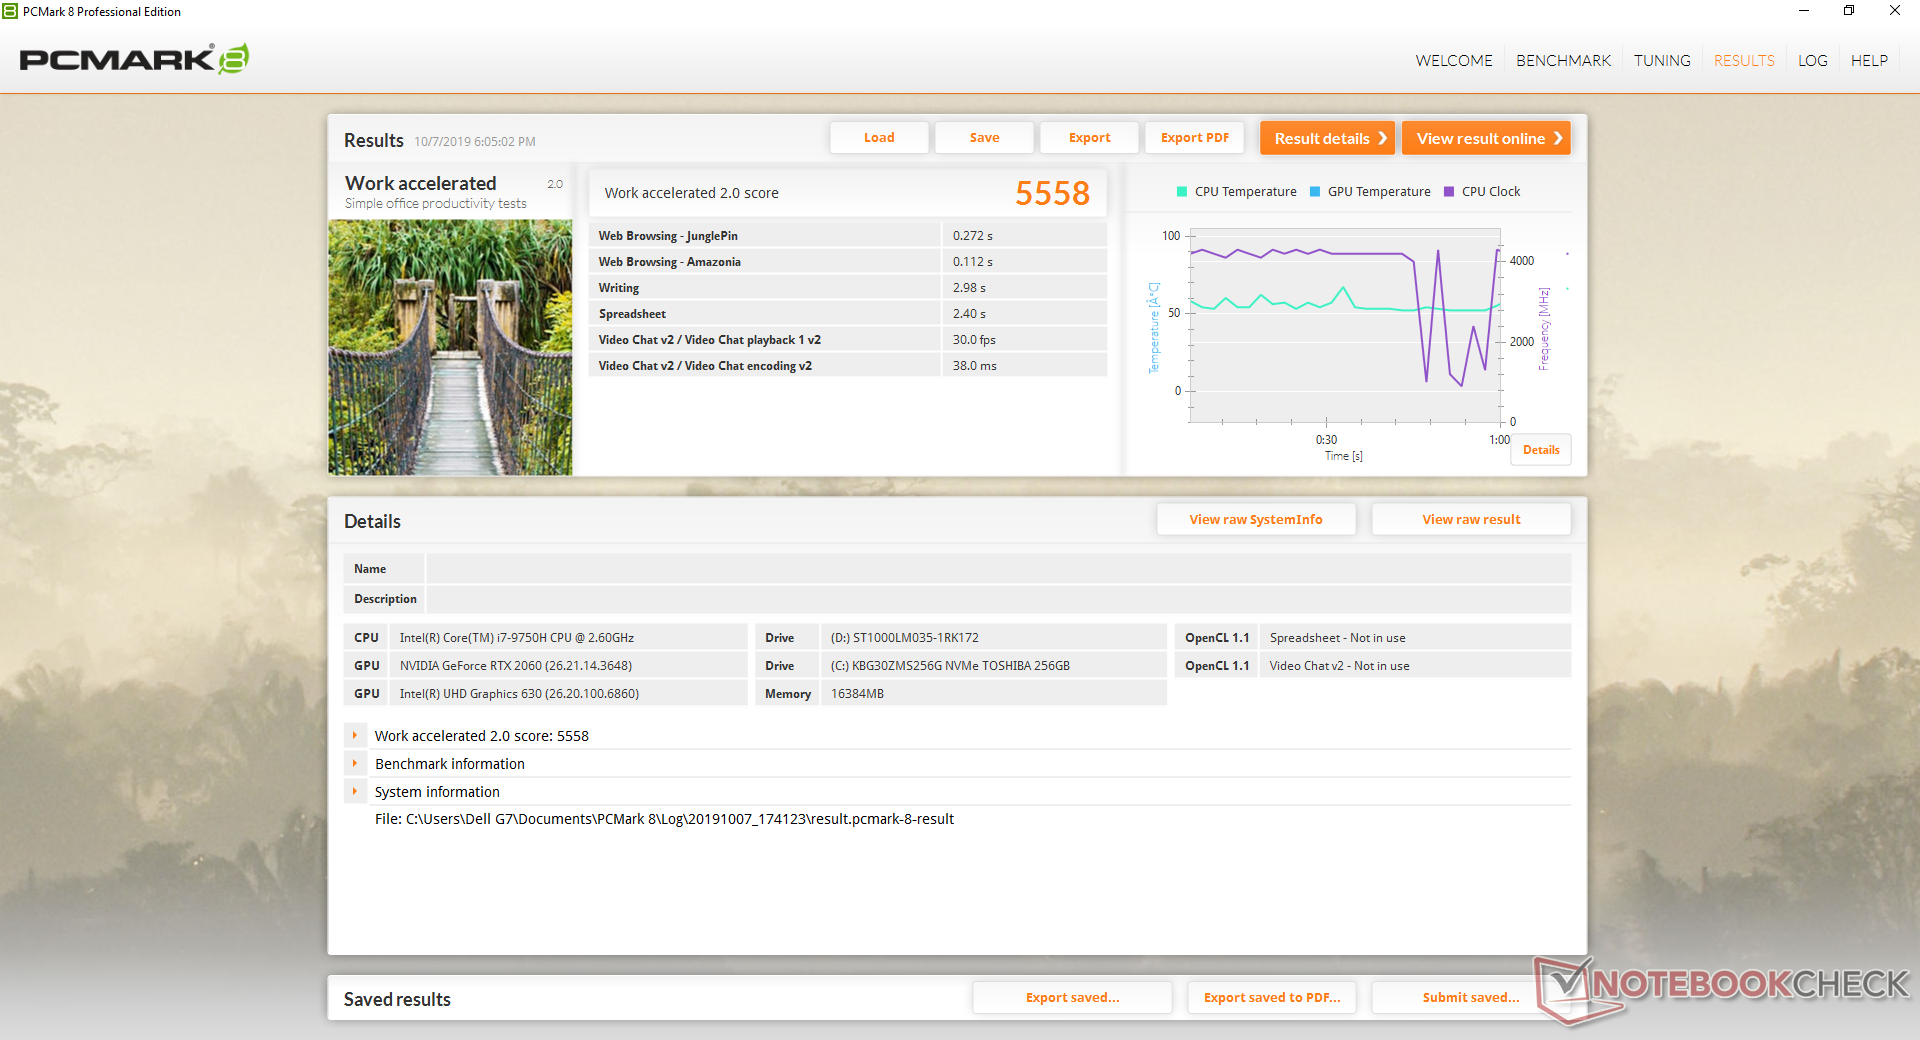
PCMark benchmarks show the G7 7590 consistently outperforming its G7 7588 predecessor. The differences, however, are quite small at just a few percentage points at most to show that day-to-day applications like browsing or video playback will feel almost same between them in terms of responsiveness.
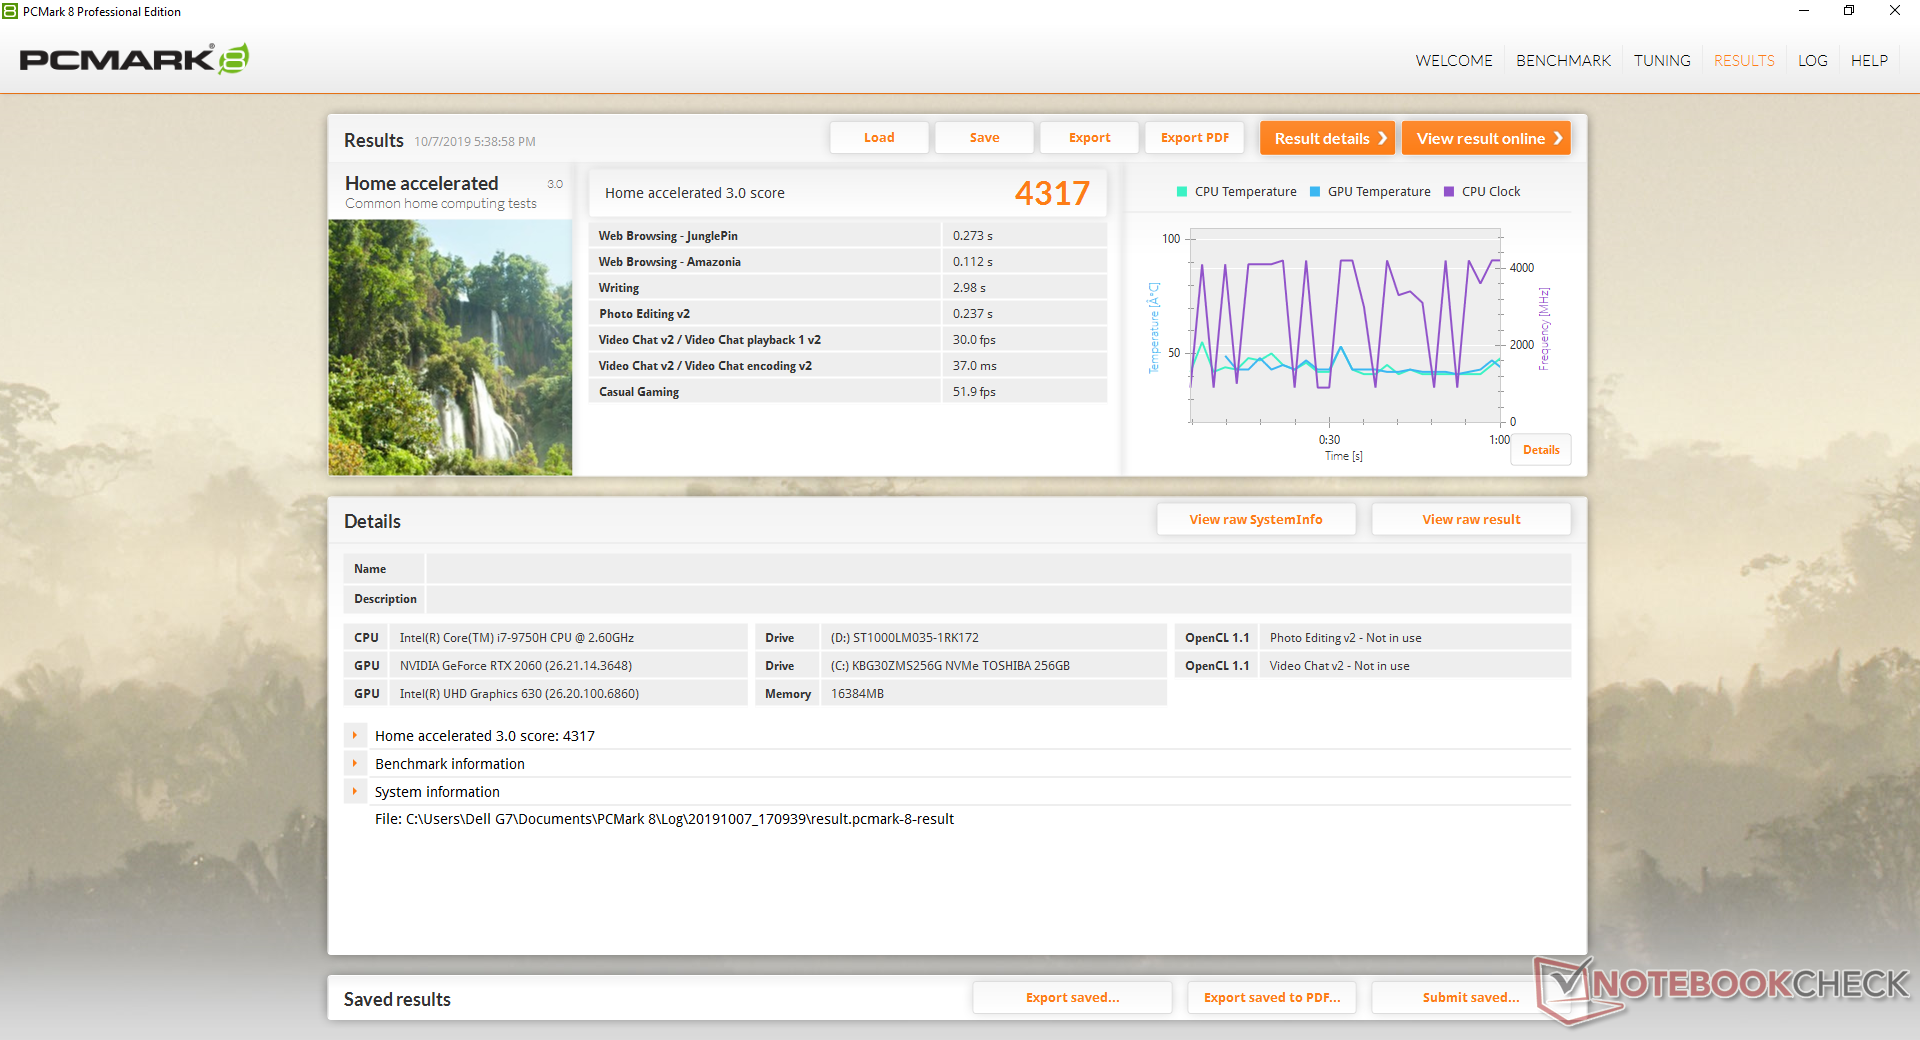
| PCMark 8 Home Score Accelerated v2 | 4317 points | |
| PCMark 8 Work Score Accelerated v2 | 5558 points | |
| PCMark 10 Score | 5368 points | |
Help | ||
Storage Devices
In contrast to the SATA-based SK Hynix SC311 SSD on last year's G7 7588, the G7 7590 ships with an NVMe SSD from the Toshbia BG3 series. Sequential read rates top out at about 1000 MB/s compared to just half that on the SK Hynix. Sequential write rates, however, are slow at just 200 MB/s compared to 1500 to 2500 MB/s on pricier NVMe SSDs like the Samsing PM981 or WDC PC SN720. We recommend a low-medium capacity M.2 SSD and a high capacity secondary HDD if you want to keep costs low. Some gaming laptops like the Razer Blade 15 Advanced Model may not include secondary options at all.
See our table of HDDs and SSDs for more benchmark comparisons.
| Dell G7 7590 Toshiba BG3 KBG30ZMS256G | Lenovo Legion Y740-15ICHg Samsung SSD PM981 MZVLB256HAHQ | HP Omen X 2S 15-dg0075cl WDC PC SN720 SDAPNTW-1T00 | Asus Strix Scar III G531GW-AZ062T Intel SSD 660p SSDPEKNW512G8 | Dell G3 3590 Toshiba BG4 KBG40ZNS128G | |
|---|---|---|---|---|---|
| AS SSD | 301% | 436% | 118% | -26% | |
| Seq Read (MB/s) | 1013 | 1953 93% | 2105 108% | 1163 15% | 1174 16% |
| Seq Write (MB/s) | 203.8 | 1629 699% | 2493 1123% | 919 351% | 186 -9% |
| 4K Read (MB/s) | 29.57 | 33.2 12% | 25.01 -15% | 48.88 65% | 34.01 15% |
| 4K Write (MB/s) | 71.4 | 88.1 23% | 108.7 52% | 90.1 26% | 69.4 -3% |
| 4K-64 Read (MB/s) | 332.1 | 757 128% | 1604 383% | 323.8 -2% | 424 28% |
| 4K-64 Write (MB/s) | 152.9 | 1501 882% | 1593 942% | 403.8 164% | 68.8 -55% |
| Access Time Read * (ms) | 0.183 | 0.077 58% | 0.046 75% | 0.24 -31% | 0.168 8% |
| Access Time Write * (ms) | 0.248 | 0.043 83% | 0.102 59% | 0.046 81% | 0.94 -279% |
| Score Read (Points) | 463 | 985 113% | 1840 297% | 489 6% | 575 24% |
| Score Write (Points) | 245 | 1752 615% | 1951 696% | 586 139% | 157 -36% |
| Score Total (Points) | 913 | 3230 254% | 4743 419% | 1332 46% | 987 8% |
| Copy ISO MB/s (MB/s) | 263.6 | 1872 610% | 2250 754% | 1269 381% | 215.7 -18% |
| Copy Program MB/s (MB/s) | 213.8 | 478.2 124% | 896 319% | 452.8 112% | 108.2 -49% |
| Copy Game MB/s (MB/s) | 188 | 1165 520% | 1854 886% | 755 302% | 165.9 -12% |
* ... smaller is better

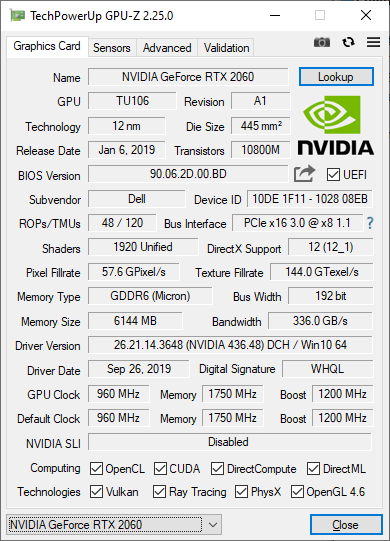
GPU Performance
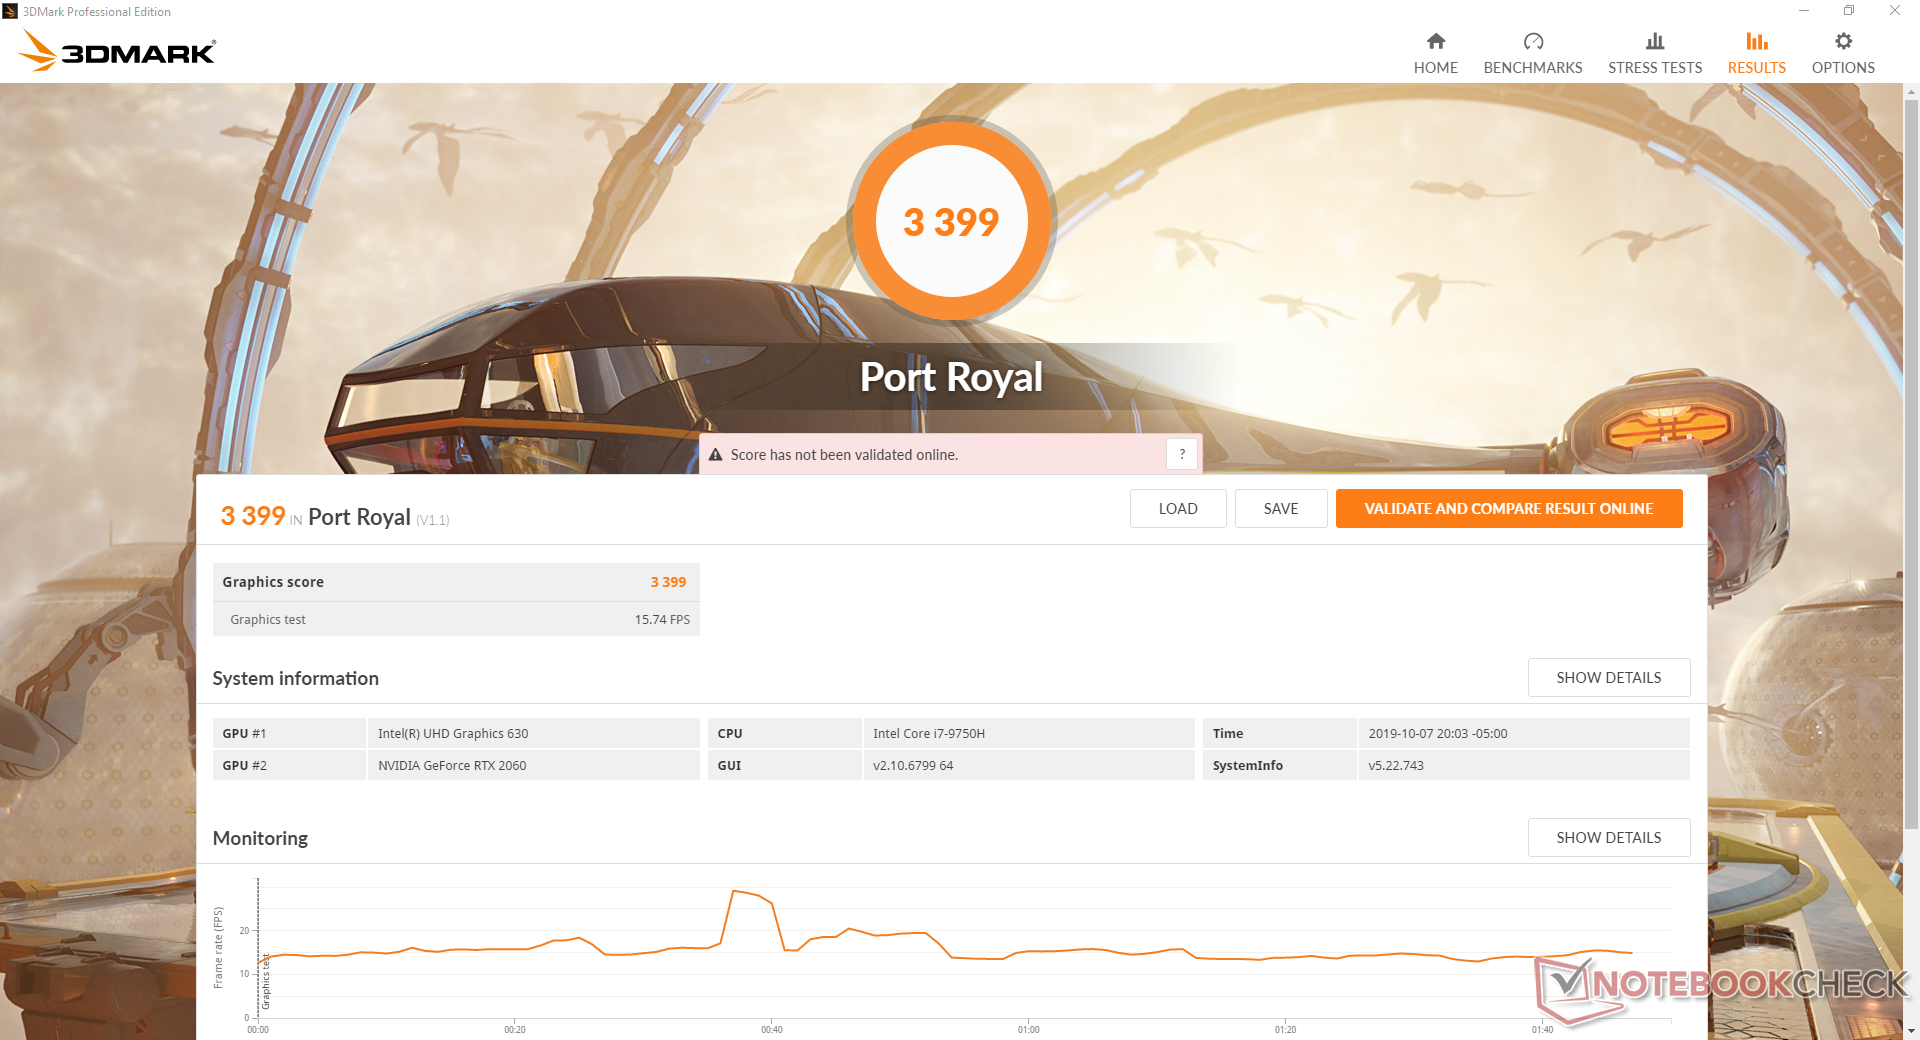
The mobile GeForce RTX 2060 is about 20 to 25 percent slower than the desktop RTX 2060. Expect overall performance to be most similar to the mobile GTX 1070 but with added support for DLSS and real-time ray-tracing. If these latter features are of value, then we recommend investing in the mobile RTX 2070 Max-Q or 2080 Max-Q instead as enabling ray-tracing will impact frame rates.
Remember to enable DX12 if possible as Nvidia Turing has been optimized for DX12 games. Mobile RTX 2060 performance is approximately 40 percent and 70 percent faster than the GTX 1060 Max-Q when running DX 11 and DX12 titles, respectively.
All the latest games run like butter at native 1080p despite the wide performance deficit between mobile RTX 2060 and desktop RTX 2060. Idling on Witcher 3 shows no recurring frame dips to suggest no interrupting background activity when gaming. See our dedicated page on the mobile RTX 2060 for more technical information and gaming benchmark comparisons.
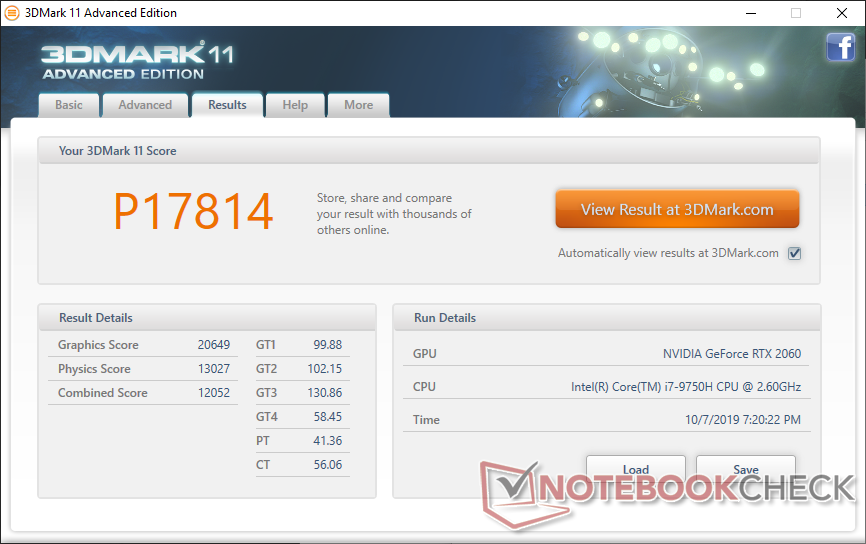
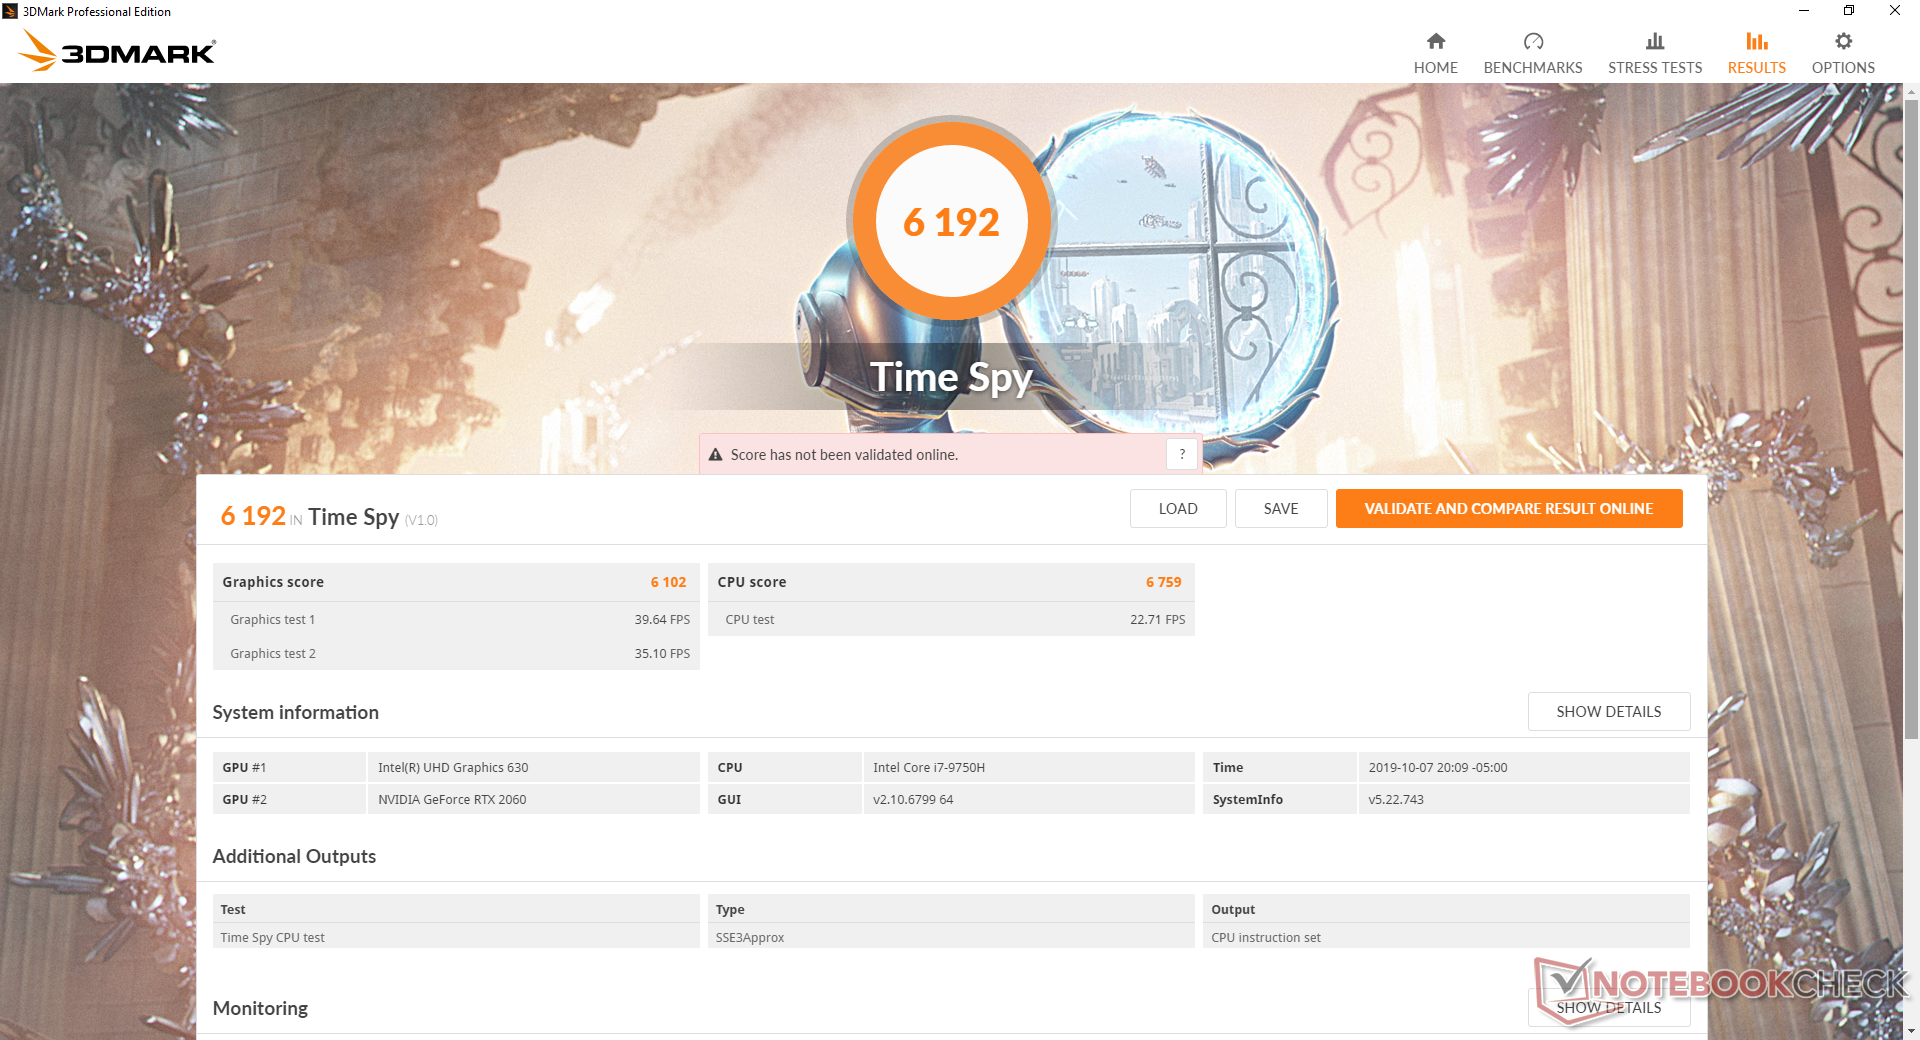
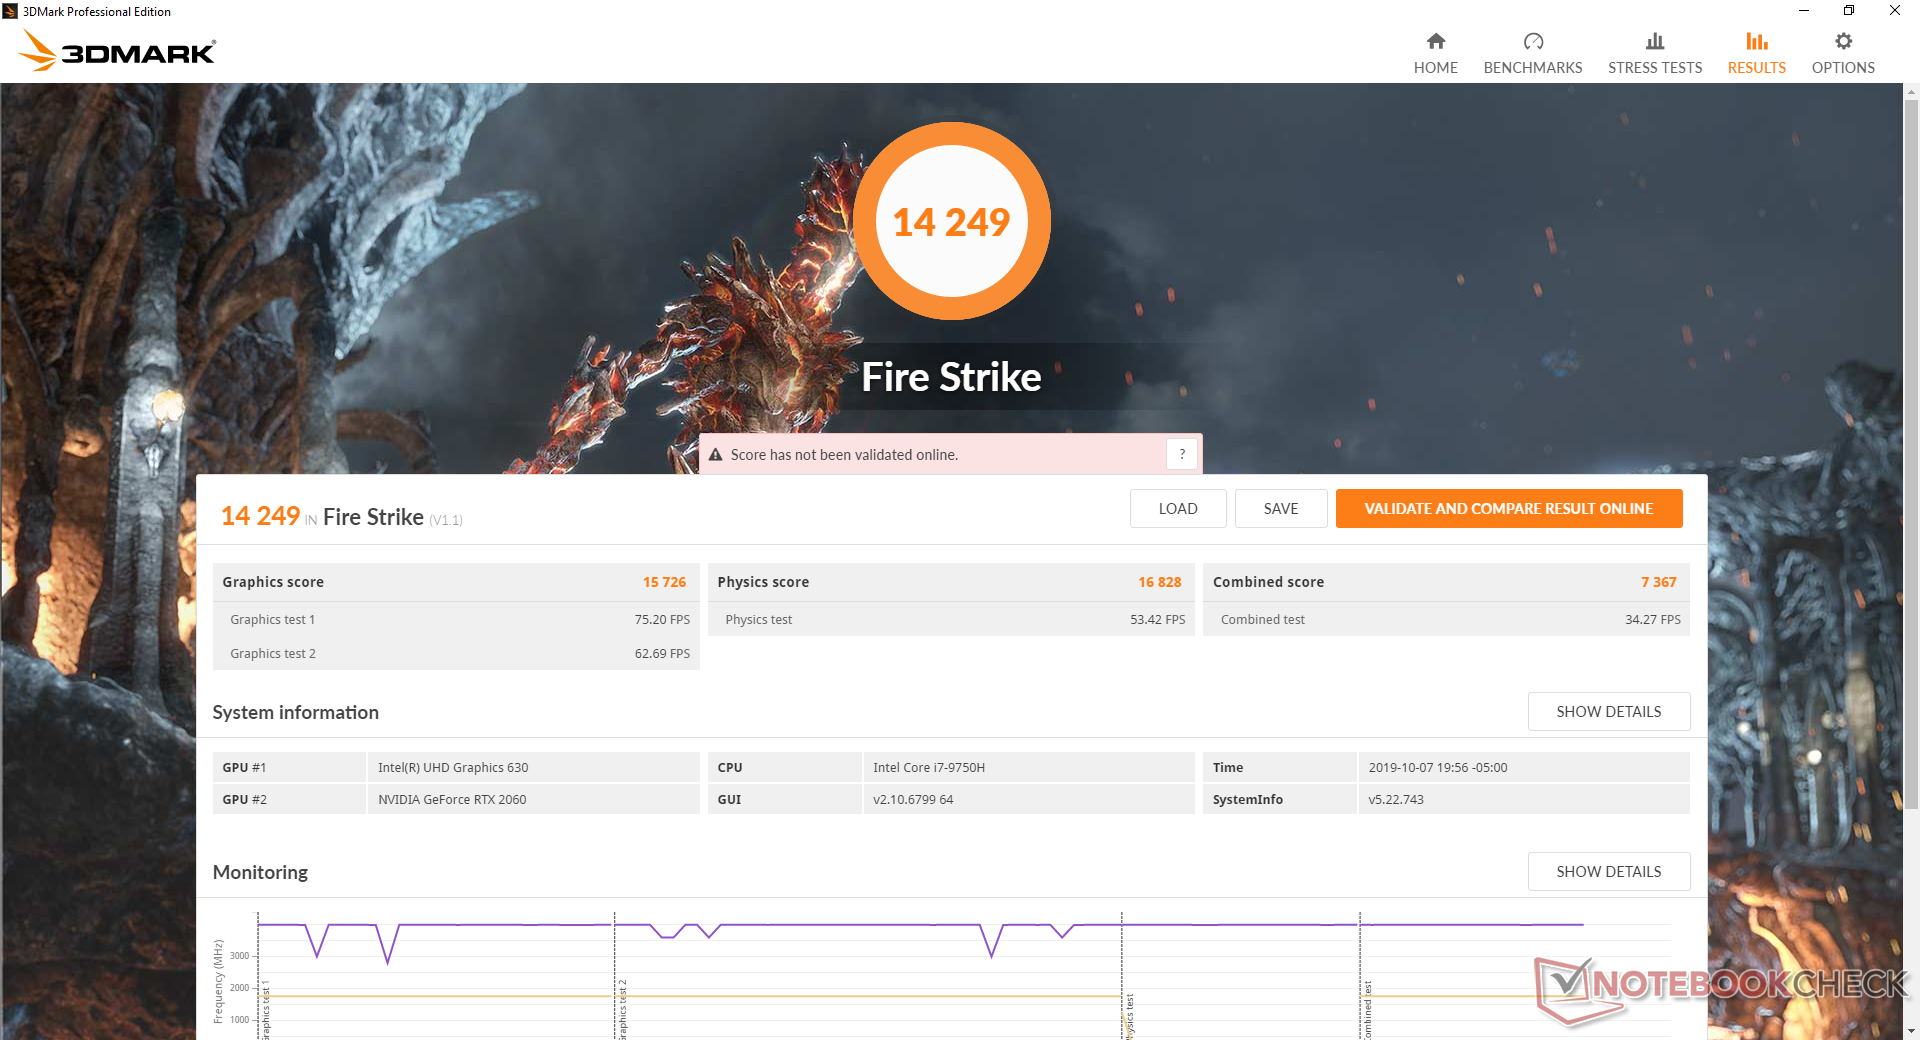
| 3DMark 11 Performance | 17814 points | |
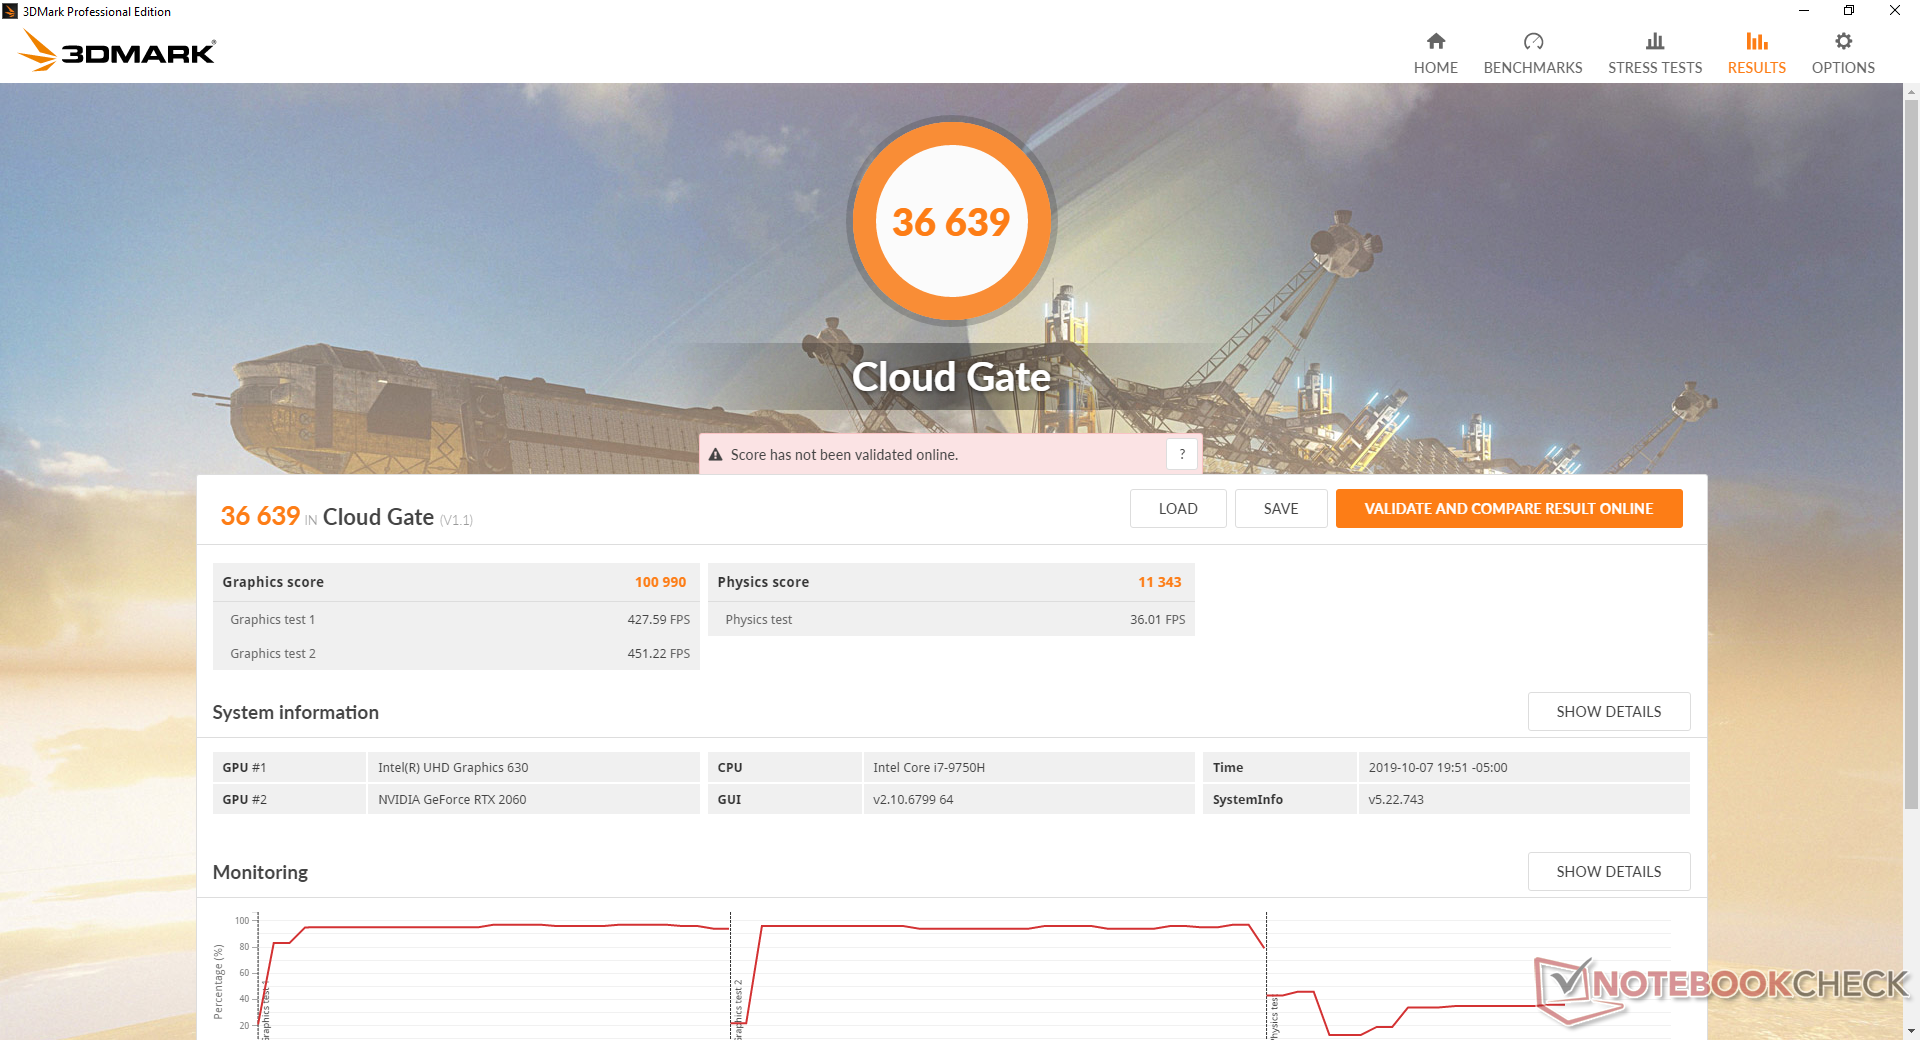
| 3DMark Cloud Gate Standard Score | 36639 points | |
| 3DMark Fire Strike Score | 14249 points | |
| 3DMark Time Spy Score | 6192 points | |
Help | ||
| low | med. | high | ultra | |
|---|---|---|---|---|
| BioShock Infinite (2013) | 323.1 | 285.3 | 266.3 | 141.5 |
| The Witcher 3 (2015) | 288 | 185.7 | 113.4 | 62.4 |
| Shadow of the Tomb Raider (2018) | 126 | 91 | 84 | 75 |
Emissions
System Noise
System nose is ever-present at a minimum of 29.5 dB(A) against a background of 28.4 dB(A) because of the spinning HDD. The laptop can range from barely audible to extremely loud depending on the Dell Power Manager setting. If simply web browsing or video streaming, we recommend setting the system to Quiet to keep fan noise under 33.5 dB(A).
Ultra Performance mode can cause the fans to pulse to very high speeds. Running Witcher 3 induces a constant fan noise of 51.5 dB(A) to be just as loud or even louder than the Alienware m15 R2. Note that this mode is necessary for sustaining the very high Turbo Boost clock rates recorded in our CineBench loop test above.
We can notice no coil whine or electronic noise from our unit.
| Dell G7 7590 GeForce RTX 2060 Mobile, i7-9750H, Toshiba BG3 KBG30ZMS256G | Lenovo Legion Y740-15ICHg GeForce RTX 2070 Max-Q, i7-8750H, Samsung SSD PM981 MZVLB256HAHQ | HP Omen X 2S 15-dg0075cl GeForce RTX 2070 Max-Q, i7-9750H, WDC PC SN720 SDAPNTW-1T00 | Asus Strix Scar III G531GW-AZ062T GeForce RTX 2070 Mobile, i7-9750H, Intel SSD 660p SSDPEKNW512G8 | Dell G3 3590 GeForce GTX 1650 Mobile, i5-9300H, Toshiba BG4 KBG40ZNS128G | Alienware m15 R2 P87F GeForce RTX 2080 Max-Q, i7-9750H, 2x Toshiba XG6 KXG60ZNV512G (RAID 0) | |
|---|---|---|---|---|---|---|
| Noise | 4% | -1% | -2% | 4% | -10% | |
| off / environment * (dB) | 28.4 | 28 1% | 29 -2% | 30 -6% | 28.4 -0% | 28.3 -0% |
| Idle Minimum * (dB) | 29.5 | 32.6 -11% | 30.5 -3% | 30.6 -4% | 29.2 1% | 28.5 3% |
| Idle Average * (dB) | 29.6 | 32.7 -10% | 31.5 -6% | 30.6 -3% | 29.4 1% | 28.5 4% |
| Idle Maximum * (dB) | 29.6 | 32.7 -10% | 31.5 -6% | 37.7 -27% | 29.4 1% | 49 -66% |
| Load Average * (dB) | 45 | 33.3 26% | 40.6 10% | 36.5 19% | 39 13% | 49 -9% |
| Witcher 3 ultra * (dB) | 51.5 | 41.6 19% | 49.5 4% | 52.1 -1% | 49.5 4% | 49 5% |
| Load Maximum * (dB) | 53 | 45.2 15% | 53.4 -1% | 48.1 9% | 49.7 6% | 55 -4% |
* ... smaller is better
Noise level
| Idle |
| 29.5 / 29.6 / 29.6 dB(A) |
| Load |
| 45 / 53 dB(A) |
 | ||
30 dB silent 40 dB(A) audible 50 dB(A) loud |
||
min: | ||
Temperature
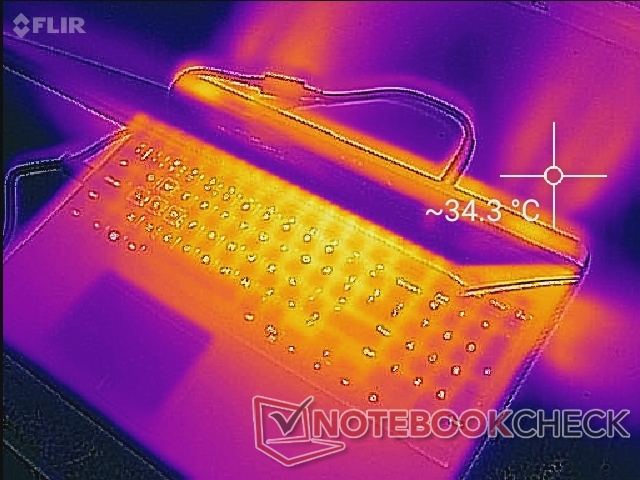
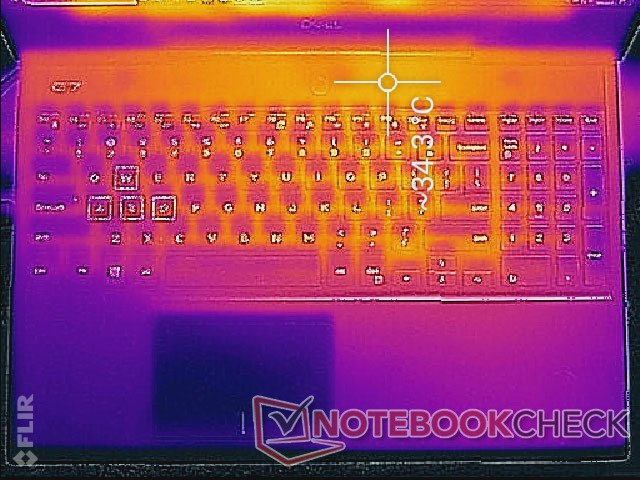
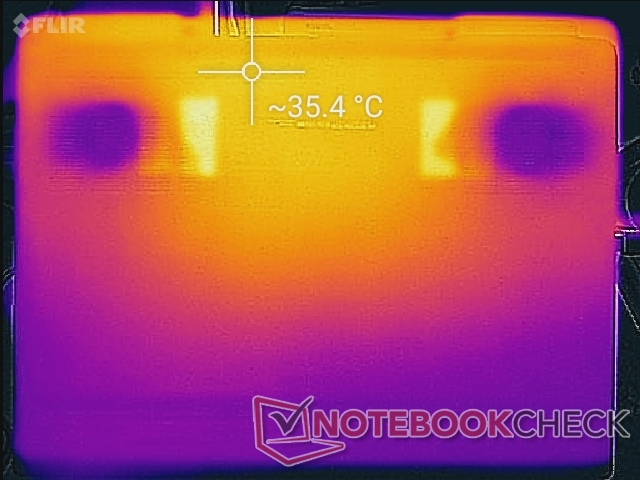
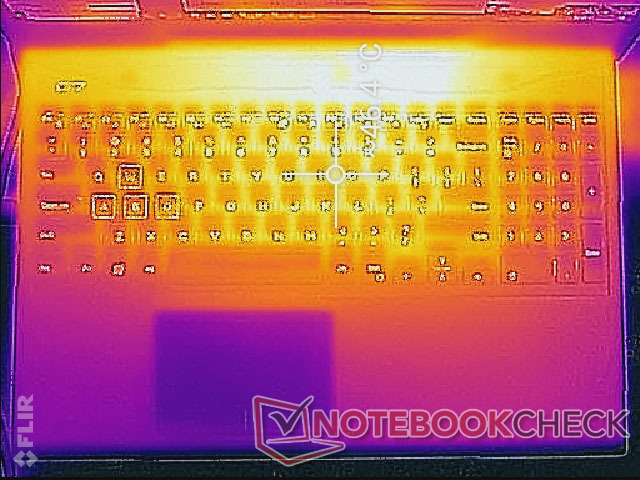
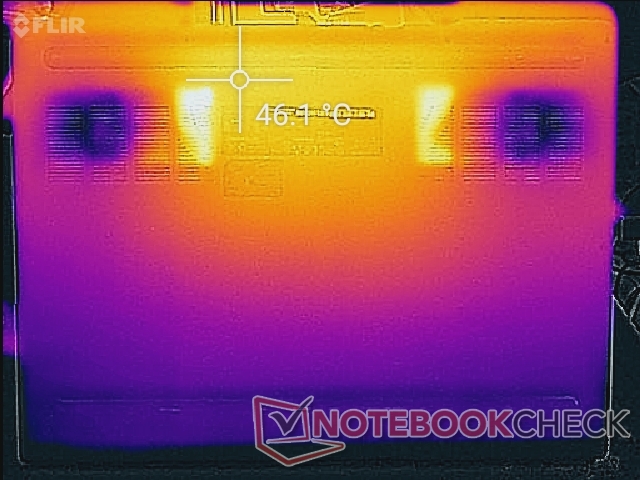
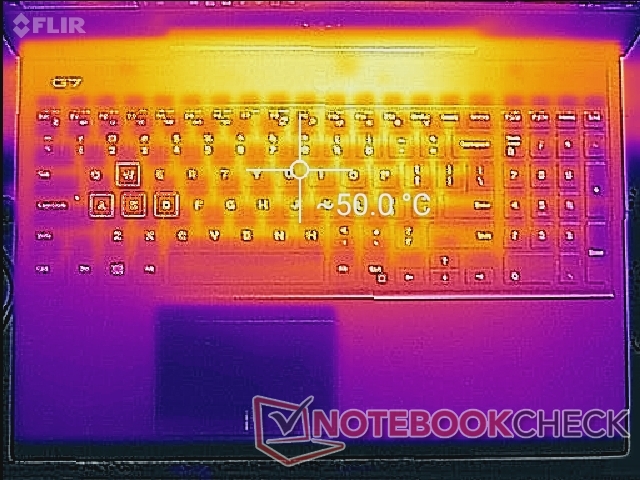
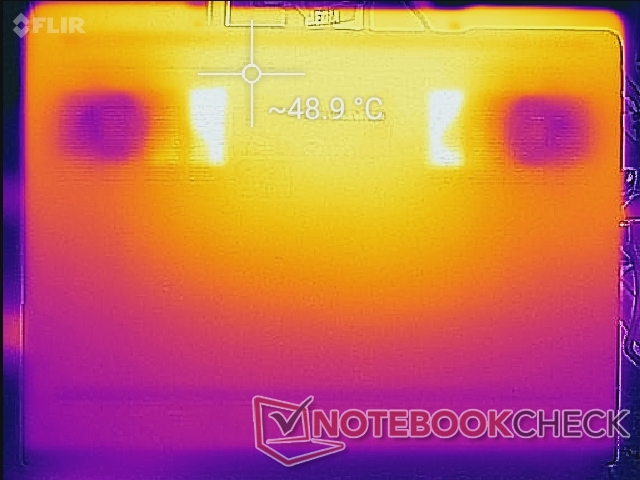
Surface temperatures when idling can range from 26 C on the clickpad to 34 C near the rear of the unit. When gaming, the hot spots can reach as high as 46 C to 50 C as shown by our temperature maps below. These spots are near the center of the keyboard away from the WASD keys and NumPad keys. The chassis could have benefited from more ventilation openings on the bottom much like on the MSI GL65 to reduce surface temperatures.
(-) The maximum temperature on the upper side is 52 °C / 126 F, compared to the average of 40.4 °C / 105 F, ranging from 21.2 to 68.8 °C for the class Gaming.
(-) The bottom heats up to a maximum of 48.8 °C / 120 F, compared to the average of 43.2 °C / 110 F
(+) In idle usage, the average temperature for the upper side is 30.7 °C / 87 F, compared to the device average of 33.9 °C / 93 F.
(-) Playing The Witcher 3, the average temperature for the upper side is 39.5 °C / 103 F, compared to the device average of 33.9 °C / 93 F.
(+) The palmrests and touchpad are reaching skin temperature as a maximum (35.4 °C / 95.7 F) and are therefore not hot.
(-) The average temperature of the palmrest area of similar devices was 28.8 °C / 83.8 F (-6.6 °C / -11.9 F).
Stress Test
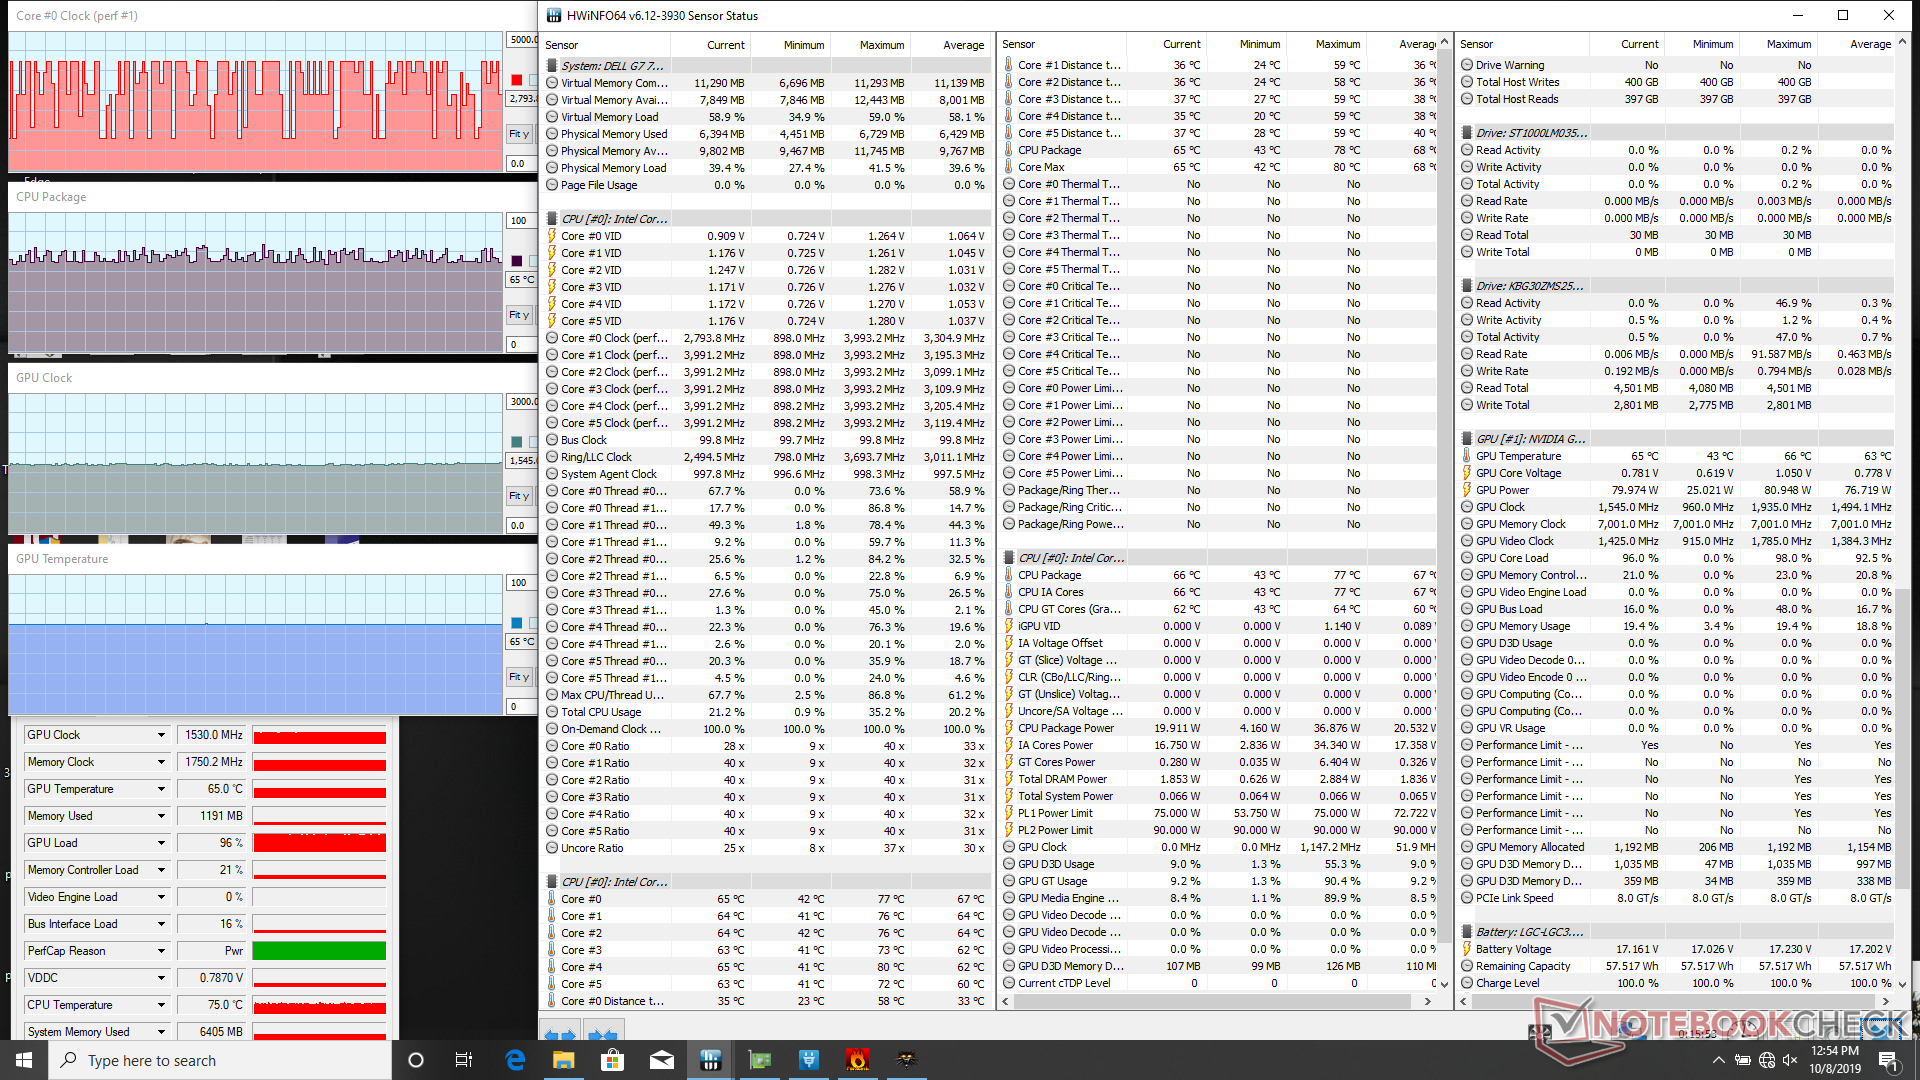
We stress the laptop with synthetic loads in order to identify for any potential throttling or stability issues. When running Prime95 to stress the CPU, clock rates jump to a steady 4 GHz and they maintain this speed throughout to mirror our CineBench loop test observations above. The drawback, however, is a very high core temperature of >94 C. In comparison, the Razer Blade 15 Base Model with the same i7-9750H CPU would spike to 4 GHz for only a few of seconds before falling to a steady 2.8 GHz and a cooler core temperature of 70 C.
Running both Prime95 and FurMark simultaneously causes the CPU and GPU to stabilize at 79 C and 70 C, respectively. Temperatures become even cooler in the mid 60 C range when gaming as shown by our table below. These results are unsurprising since the G7 7590 is able to support more demanding Core i9 and RTX 2080 Max-Q options and so it must be able to run lower-end processors with high temperature overheads. Expect warmer temperatures if configuring the model with more demanding Core i9 and/or RTX 2080 Max-Q GPUs.
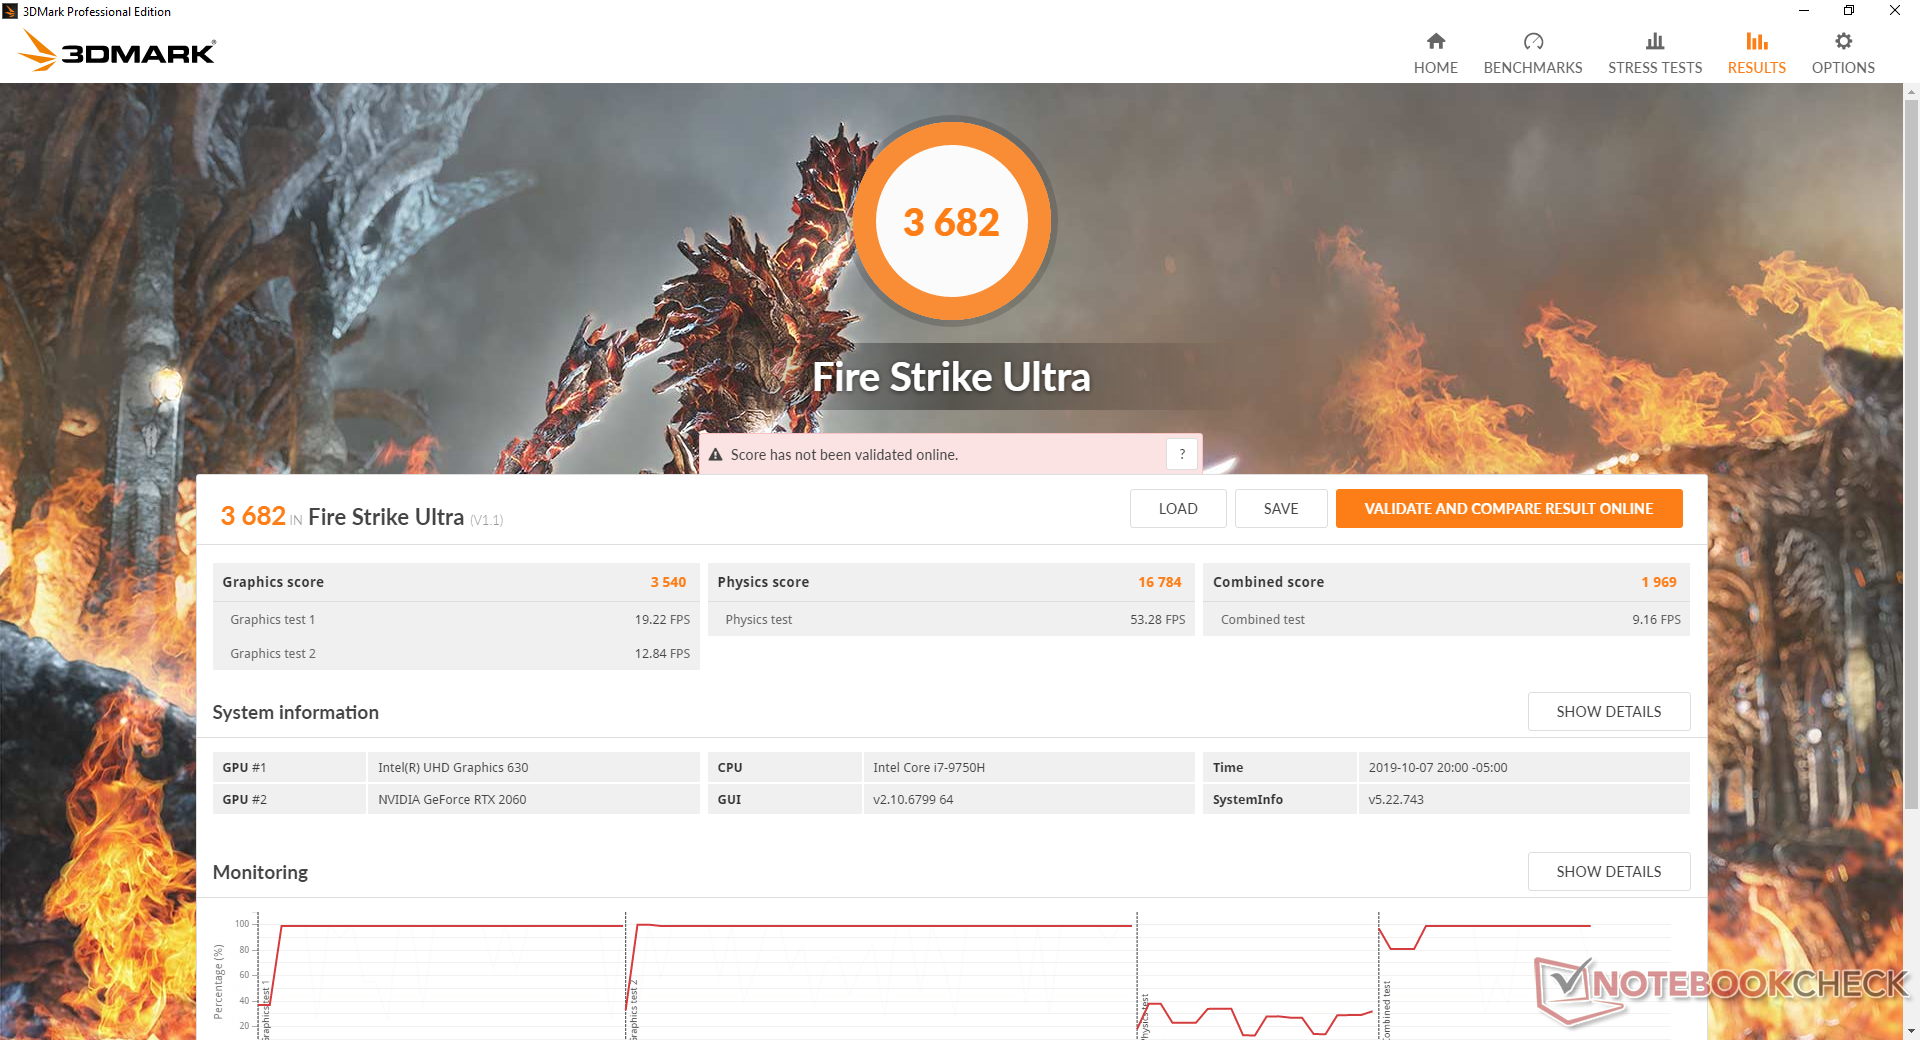
Running on battery power will limit performance tremendously even when set to Ultra Performance via the Dell Power Manager software. A Fire Strike run on batteries returns Physics and Graphics scores of just 6676 and 1442 points, respectively, compared to 16828 and 15726 points when on mains.
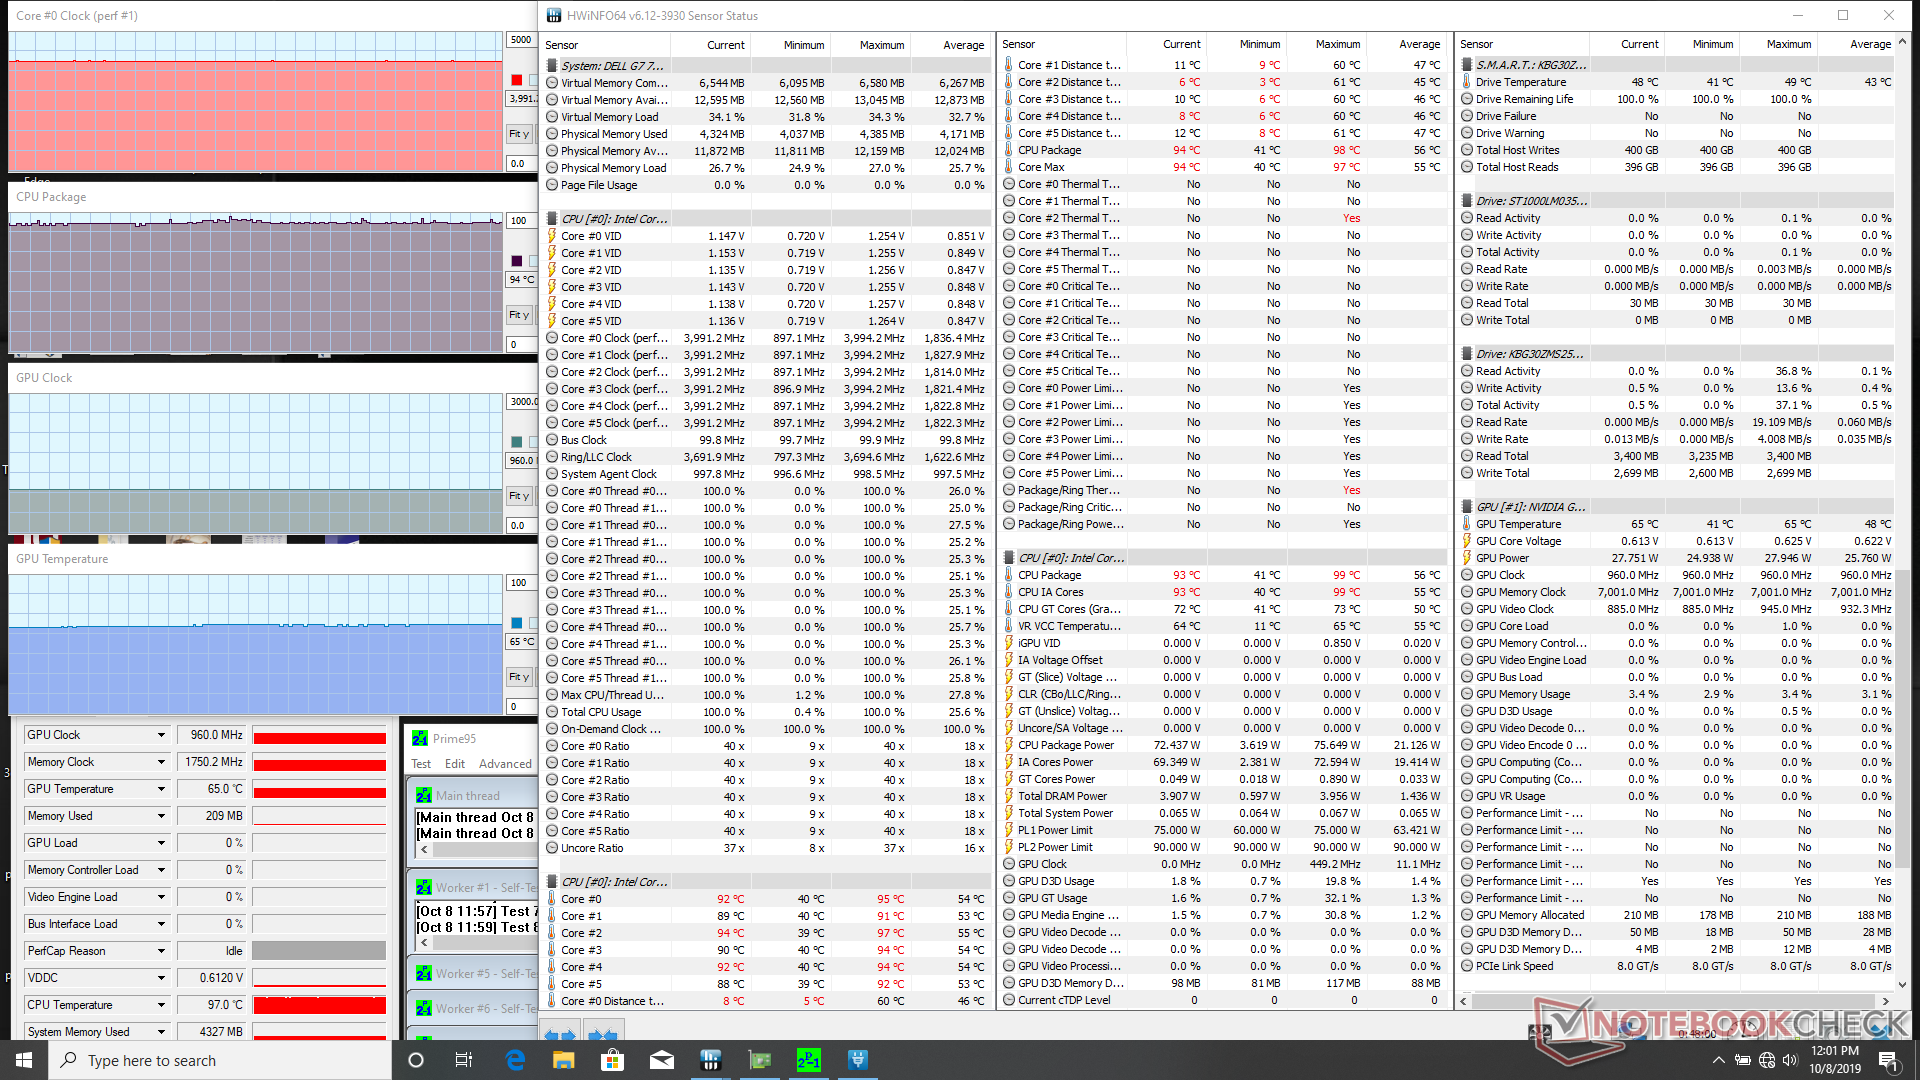
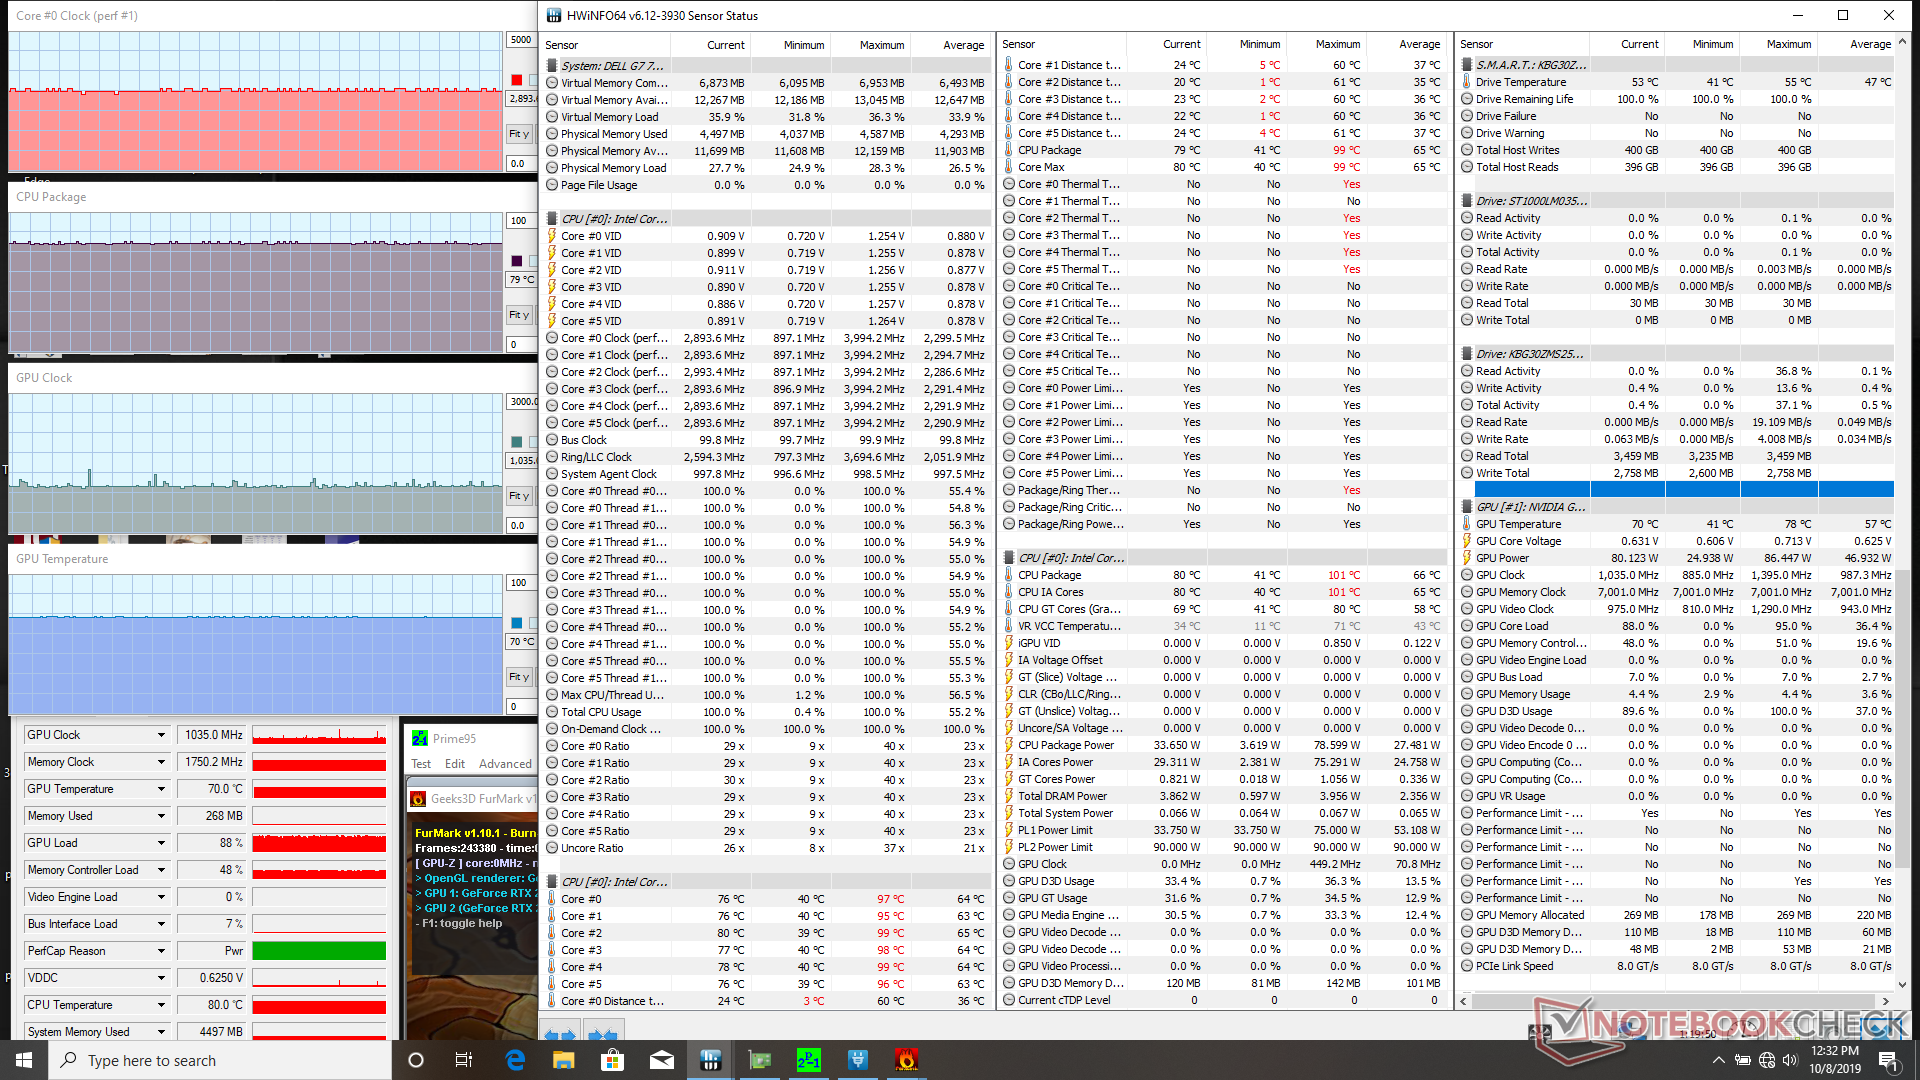
| CPU Clock (GHz) | GPU Clock (MHz) | Average CPU Temperature (°C) | Average GPU Temperature (°C) | |
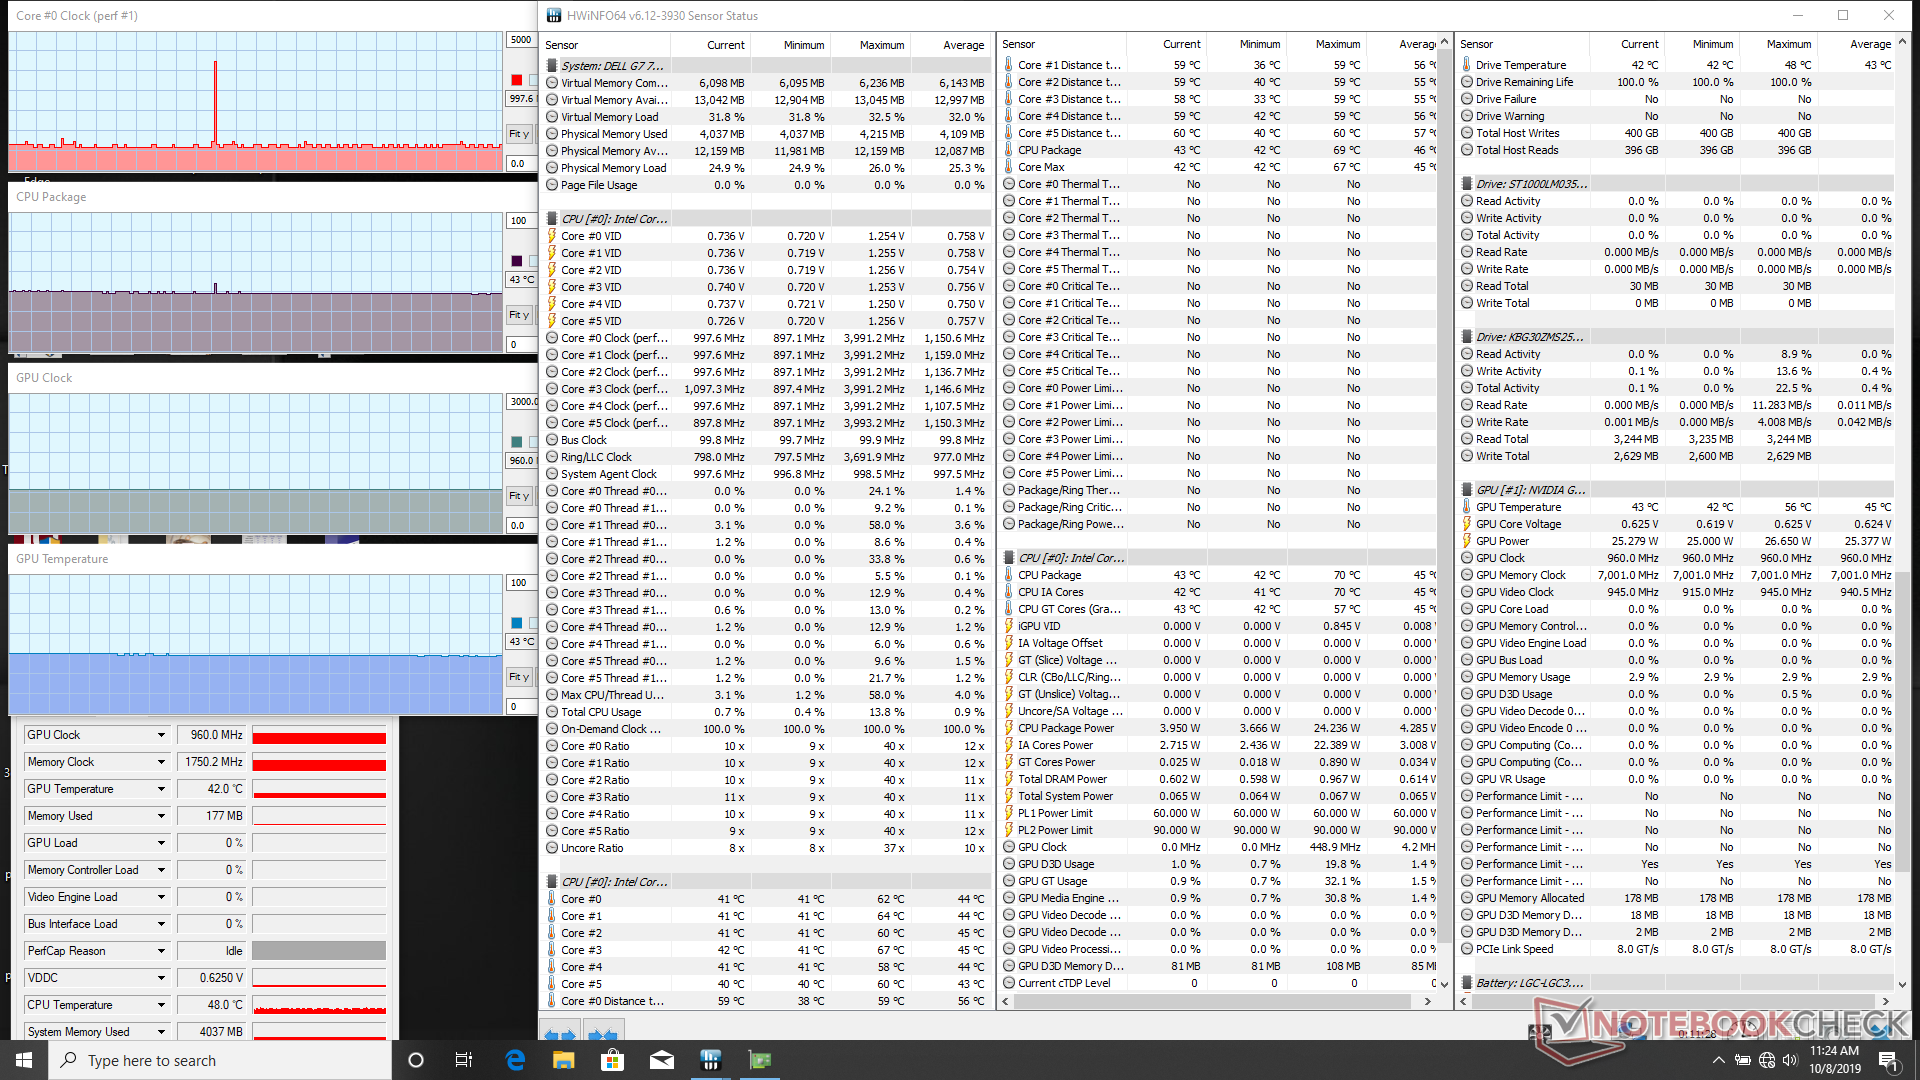
| System Idle | -- | -- | 43 | 43 |
| Prime95 Stress | 4.0 | -- | 94 | 65 |
| Prime95 + FurMark Stress | 2.7 - 2.8 | 1035 | 79 | 70 |
| Witcher 3 Stress | 1.2 - 4 | 1530 | ~65 | 65 |
Speakers
The integrated speakers lack bass and are heavy in treble. We expected more from an upper mid-range gaming laptop especially when some multimedia laptops like the Spectre x360 15 can offer more balanced audio playback. On the bright side, the speakers are quite loud at maximum volume (~89 dB(A)) and with surprisingly no vibrations on the palm rests.


Dell G7 7590 audio analysis
(+) | speakers can play relatively loud (89.8 dB)
Bass 100 - 315 Hz
(-) | nearly no bass - on average 22.8% lower than median
(±) | linearity of bass is average (8.6% delta to prev. frequency)
Mids 400 - 2000 Hz
(±) | higher mids - on average 5.7% higher than median
(±) | linearity of mids is average (7.3% delta to prev. frequency)
Highs 2 - 16 kHz
(+) | balanced highs - only 4.6% away from median
(±) | linearity of highs is average (9.3% delta to prev. frequency)
Overall 100 - 16.000 Hz
(±) | linearity of overall sound is average (21.9% difference to median)
Compared to same class
» 79% of all tested devices in this class were better, 6% similar, 16% worse
» The best had a delta of 6%, average was 18%, worst was 132%
Compared to all devices tested
» 63% of all tested devices were better, 7% similar, 30% worse
» The best had a delta of 4%, average was 23%, worst was 134%
Apple MacBook 12 (Early 2016) 1.1 GHz audio analysis
(+) | speakers can play relatively loud (83.6 dB)
Bass 100 - 315 Hz
(±) | reduced bass - on average 11.3% lower than median
(±) | linearity of bass is average (14.2% delta to prev. frequency)
Mids 400 - 2000 Hz
(+) | balanced mids - only 2.4% away from median
(+) | mids are linear (5.5% delta to prev. frequency)
Highs 2 - 16 kHz
(+) | balanced highs - only 2% away from median
(+) | highs are linear (4.5% delta to prev. frequency)
Overall 100 - 16.000 Hz
(+) | overall sound is linear (10.2% difference to median)
Compared to same class
» 7% of all tested devices in this class were better, 2% similar, 91% worse
» The best had a delta of 5%, average was 18%, worst was 53%
Compared to all devices tested
» 5% of all tested devices were better, 1% similar, 94% worse
» The best had a delta of 4%, average was 23%, worst was 134%
Energy Management
Power Consumption
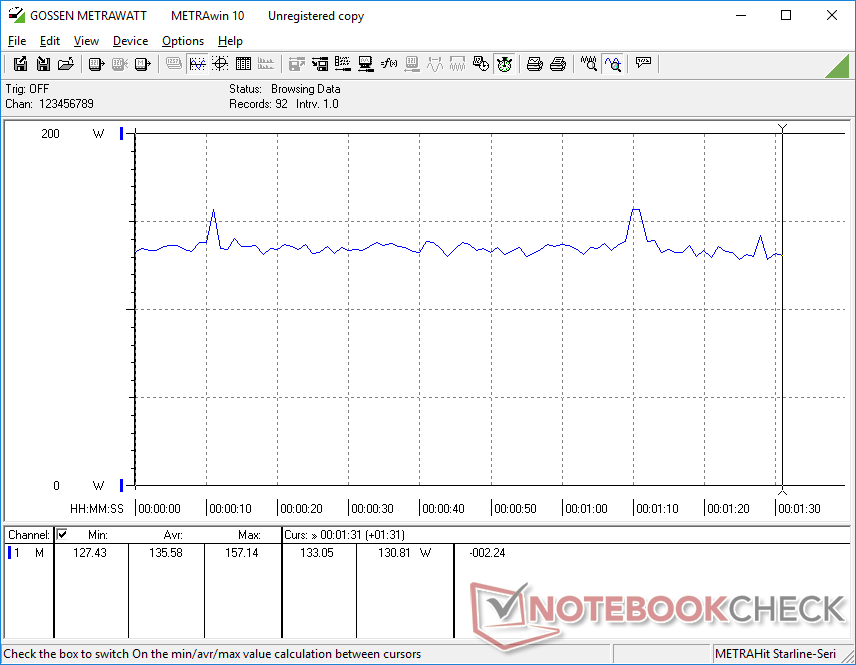
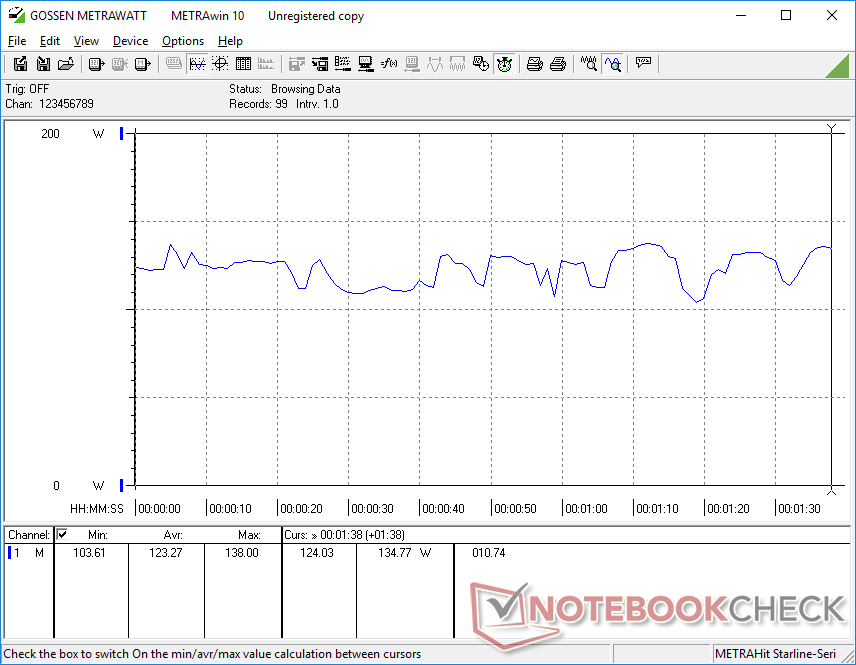
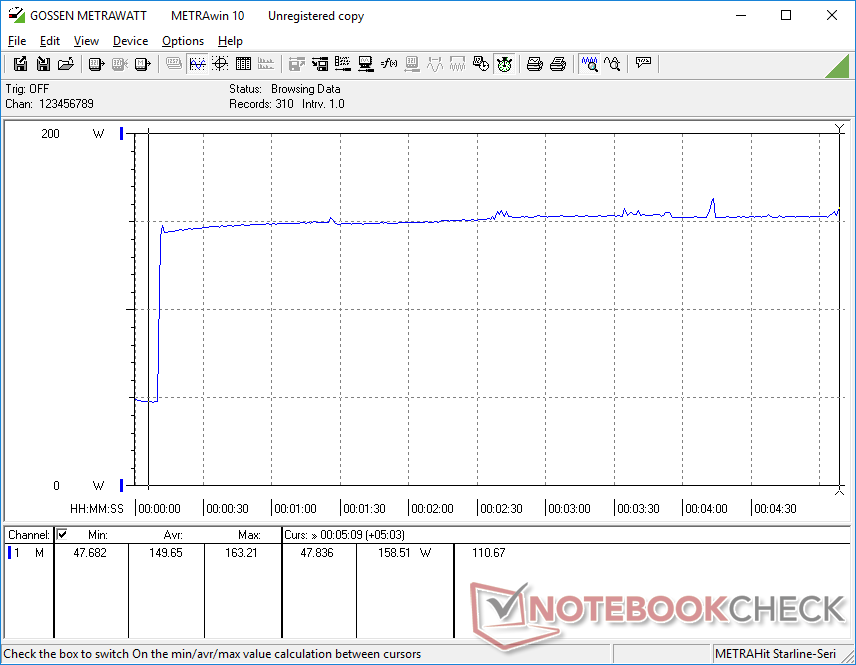
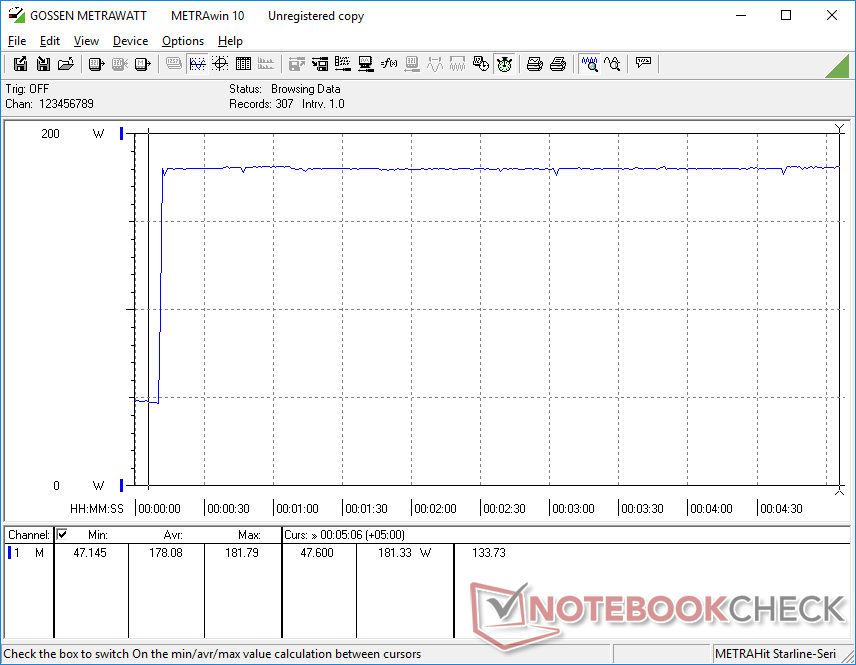
The system draws 136 W compared to 116 W on the older G7 15 7588 when running Witcher 3. Even so, the 17 percent increase in power consumption is a small price to pay for the comparatively larger 40 to 70 percent gain in graphics performance. The very high consumption of 46 W when idling on desktop means it will be important to become familiar with all the system power settings to increase battery life. Dell Power Manager, for example, has more power settings than what Windows Power Options has to offer.
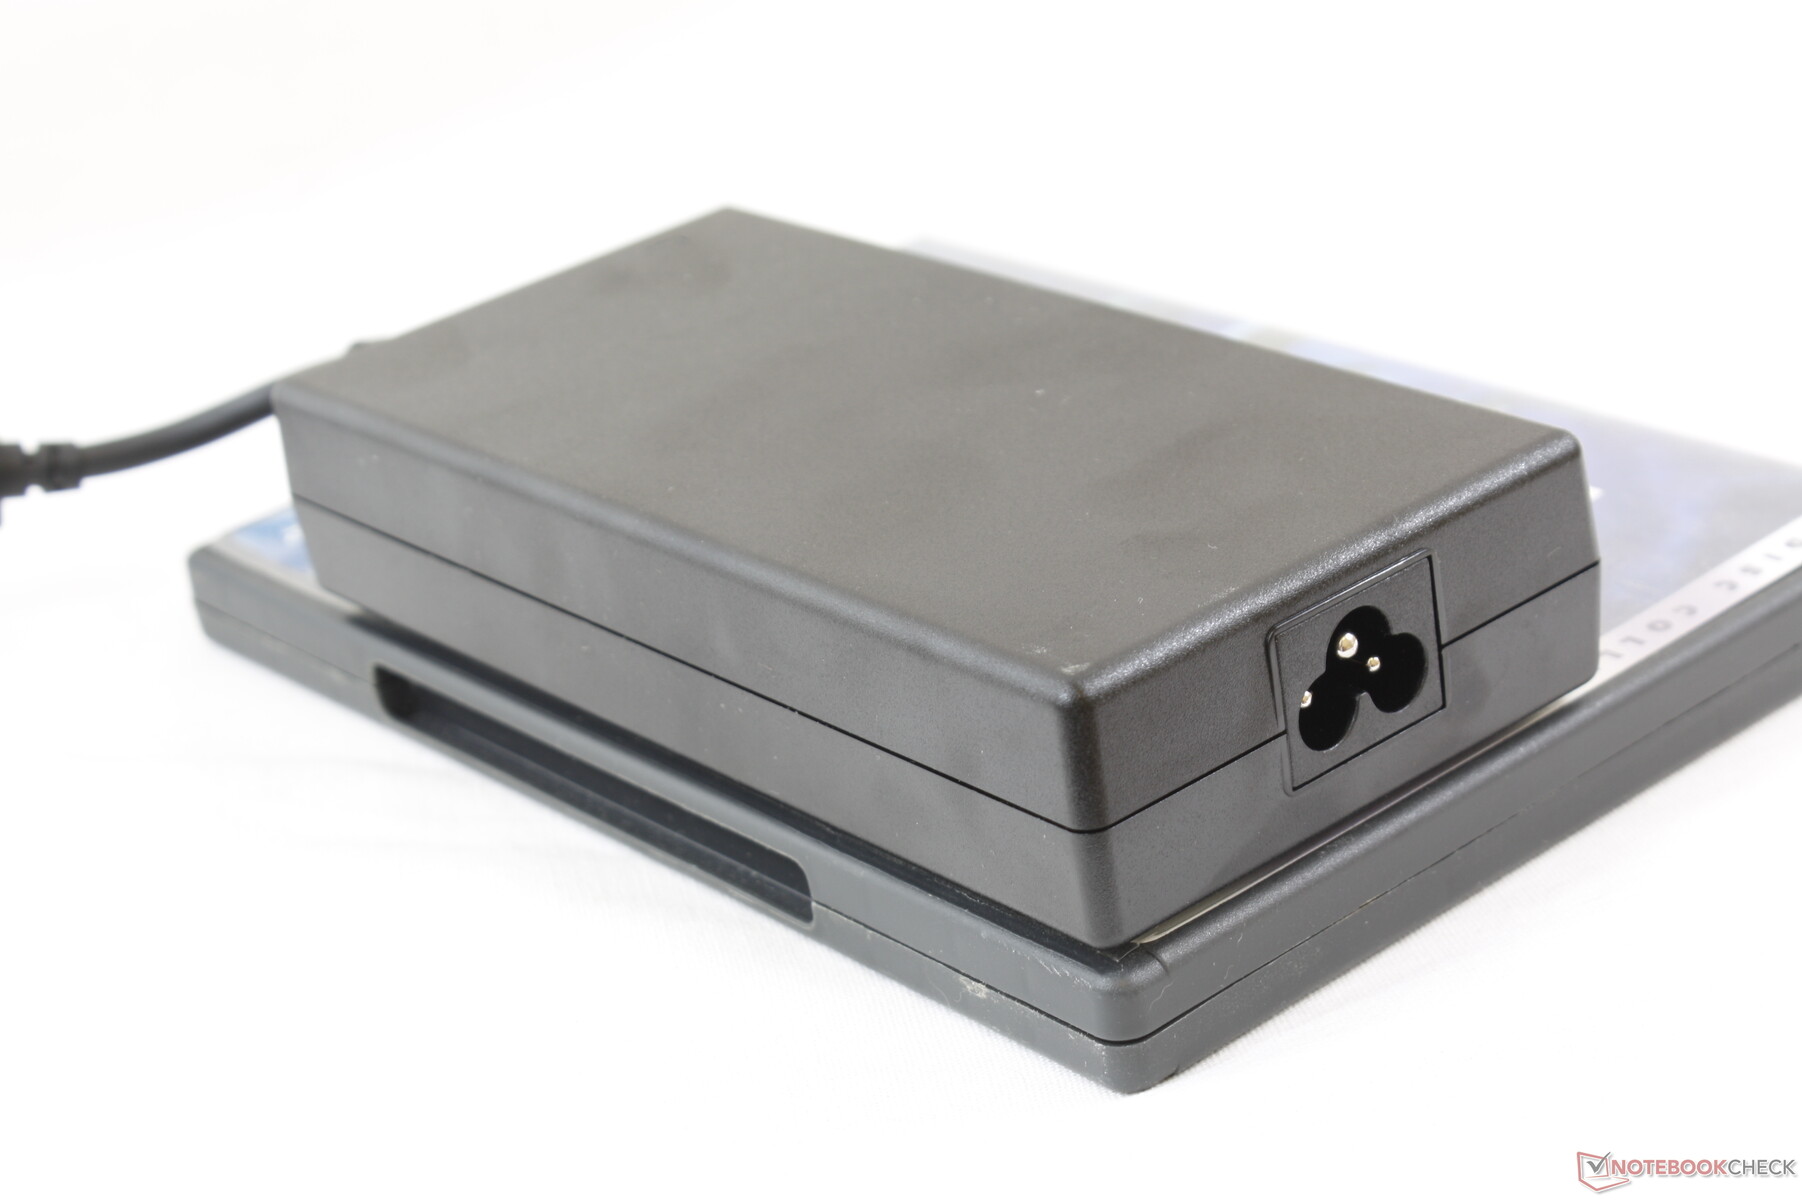
We're able to measure a maximum consumption of 182 W from the medium-sized (~15.5 x 7.5 x 2.8 cm) 180 W AC adapter. The system will actually maintain this consumption rate to suggest that Dell should have considered shipping with a higher capacity 200 W AC adapter instead. Running at 100 percent utilization will slow recharge rate significantly.
| Off / Standby | |
| Idle | |
| Load |
|
Key:
min: | |
| Dell G7 7590 i7-9750H, GeForce RTX 2060 Mobile, Toshiba BG3 KBG30ZMS256G, IPS, 1920x1080, 15.6" | Alienware m15 R2 P87F i7-9750H, GeForce RTX 2080 Max-Q, 2x Toshiba XG6 KXG60ZNV512G (RAID 0), IPS, 1920x1080, 15.6" | Razer Blade 15 GTX 1660 Ti i7-9750H, GeForce GTX 1660 Ti Mobile, Samsung SSD PM981 MZVLB256HAHQ, IPS, 1920x1080, 15.6" | Alienware 15 R3 Max-Q i7-7820HK, GeForce GTX 1080 Max-Q, LiteOn CX2-8B256, IPS, 1920x1080, 15.6" | Lenovo Legion Y7000P-1060 i7-8750H, GeForce GTX 1060 Mobile, Samsung SSD PM981 MZVLB256HAHQ, IPS, 1920x1080, 15.6" | MSI GL65 9SEK i7-9750H, GeForce RTX 2060 Mobile, WDC PC SN520 SDAPNUW-512G, IPS, 1920x1080, 15.6" | |
|---|---|---|---|---|---|---|
| Power Consumption | -49% | -22% | -22% | 32% | -75% | |
| Idle Minimum * (Watt) | 11.2 | 19 -70% | 18.7 -67% | 22 -96% | 4.9 56% | 41 -266% |
| Idle Average * (Watt) | 16.3 | 40.5 -148% | 30.7 -88% | 26 -60% | 8.1 50% | 45.3 -178% |
| Idle Maximum * (Watt) | 46.2 | 52 -13% | 33.9 27% | 33 29% | 16.5 64% | 47.1 -2% |
| Load Average * (Watt) | 123.3 | 132.3 -7% | 93.4 24% | 86 30% | 109.2 11% | 94.9 23% |
| Witcher 3 ultra * (Watt) | 135.6 | 183.3 -35% | 158.9 -17% | 159 -17% | 124.6 8% | 149.4 -10% |
| Load Maximum * (Watt) | 181.5 | 217.2 -20% | 195.3 -8% | 215 -18% | 175.2 3% | 214.2 -18% |
* ... smaller is better
Battery Life
Dell has increased the battery capacity from 56 Wh on the last generation G7 15 7588 to 60 Wh on the G7 15 7590. Even so, we're only able to record a runtime of approximately 4.5 hours on this latest system compared to 7.5 hours on the G7 15 7588 when subjected to similar WLAN loads and Balanced system settings. High levels of background activity or poor power consumption management are likely responsible for the discrepancy.
Recharging from empty to full capacity takes about 2 hours with the included AC adapter. Charging the laptop via USB Type-C will not work.
| Dell G7 7590 i7-9750H, GeForce RTX 2060 Mobile, 60 Wh | Lenovo Legion Y740-15ICHg i7-8750H, GeForce RTX 2070 Max-Q, 57 Wh | HP Omen X 2S 15-dg0075cl i7-9750H, GeForce RTX 2070 Max-Q, 72 Wh | Asus Strix Scar III G531GW-AZ062T i7-9750H, GeForce RTX 2070 Mobile, 66 Wh | Dell G3 3590 i5-9300H, GeForce GTX 1650 Mobile, 51 Wh | Alienware m15 R2 P87F i7-9750H, GeForce RTX 2080 Max-Q, 76 Wh | |
|---|---|---|---|---|---|---|
| Battery runtime | -53% | -49% | 22% | 15% | -19% | |
| Reader / Idle (h) | 11.1 | 3.9 -65% | 3.7 -67% | 13.5 22% | 9.2 -17% | |
| WiFi v1.3 (h) | 4.6 | 2.8 -39% | 2.2 -52% | 5.6 22% | 6.7 46% | 5.5 20% |
| Load (h) | 1.8 | 0.8 -56% | 1.3 -28% | 1.4 -22% | 0.7 -61% |
Pros
Cons
Verdict
The G7 15 7590 is positioned at an interesting spot. It houses similar Core i9, GeForce RTX, and IPS/OLED options as the higher-end Alienware m15 R2 but for a lower starting price. If you want the power of an Alienware laptop but are otherwise turned off by the gaudy Alienware designs, then the more unpretentious and visually basic G7 15 7590 can save you money without sacrificing chassis quality or performance.
There is a lot of room for improvement. While CPU Turbo Boost performance is above average and servicing is easy, the Toshiba SSD is slow for an NVMe drive, bass reproduction is middling, and the display is poorly calibrated out of the box. These shortcomings are easier to forgive on entry-level gaming machines like those in the Dell G3 or G5 series, but there's no excuse for systems in the mid-range G7 series. The lid could be stiffer and fan noise when gaming is also quite loud even for its category as competitors like the Lenovo Legion Y740 or HP Pavilion 15 Gaming are noticeably quieter.
Dell's G7 15 7590 is an excellent alternative to the Alienware m15 R2 especially since it offers upgradeable RAM and the same CPU, GPU, and display options. CPU Turbo Boost sustainability is one of the best we've seen on any gaming laptop of this size and category; just be prepared for the very loud fans when gaming.
Dell G7 7590
- 05/15/2020 v7 (old)
Allen Ngo
Price comparison
