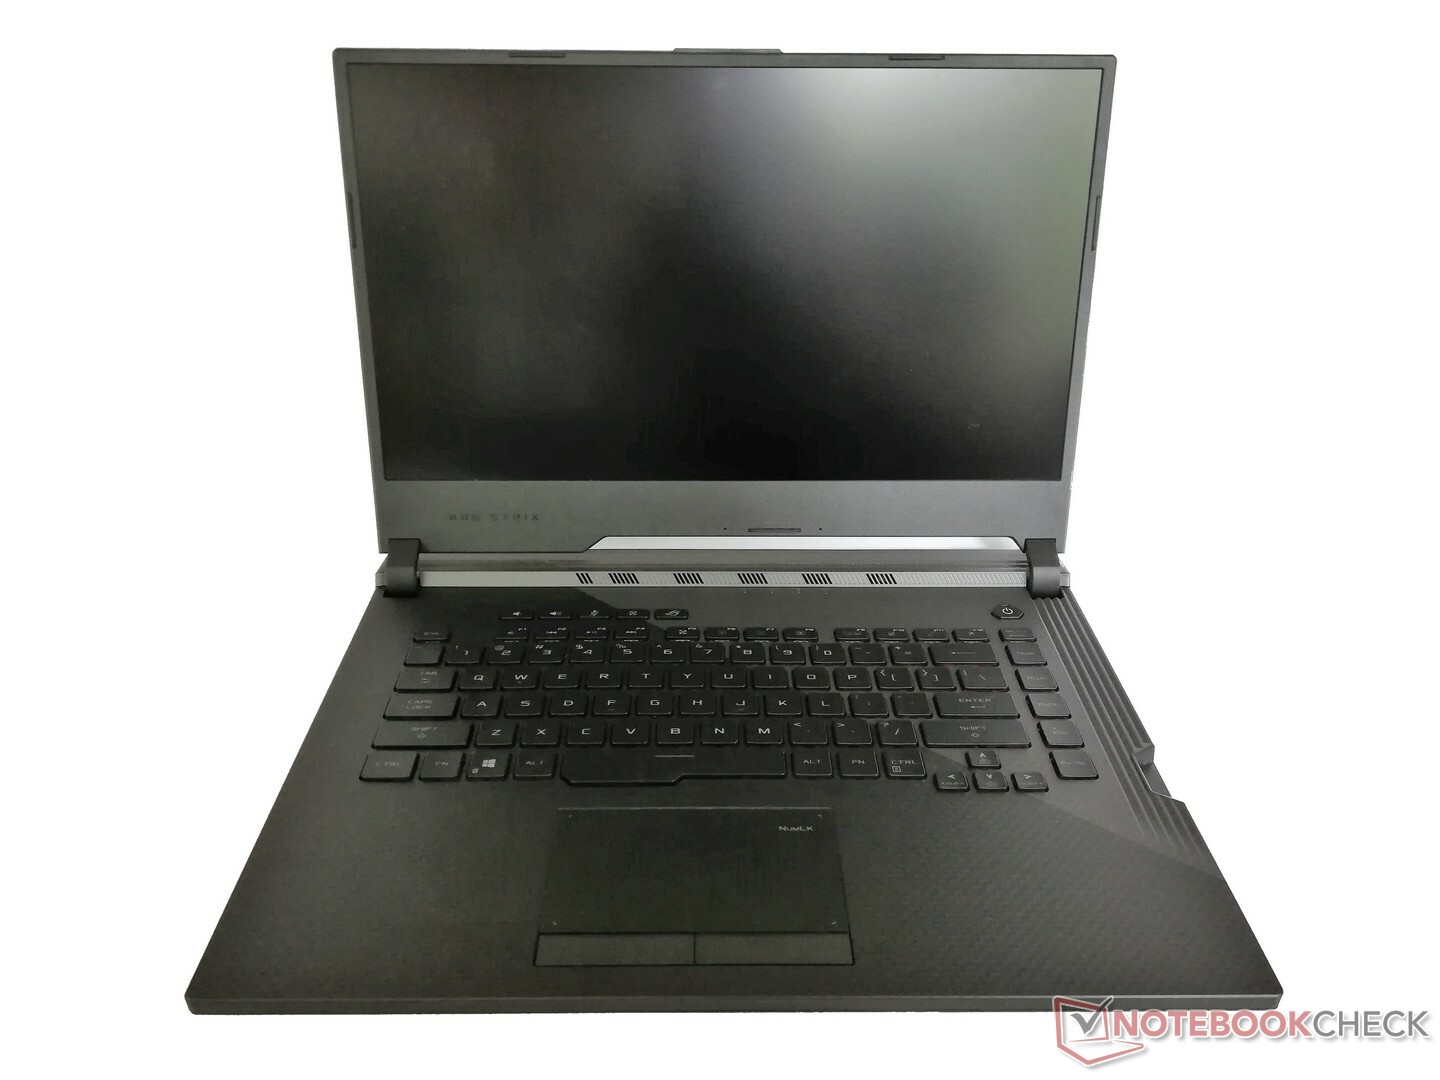
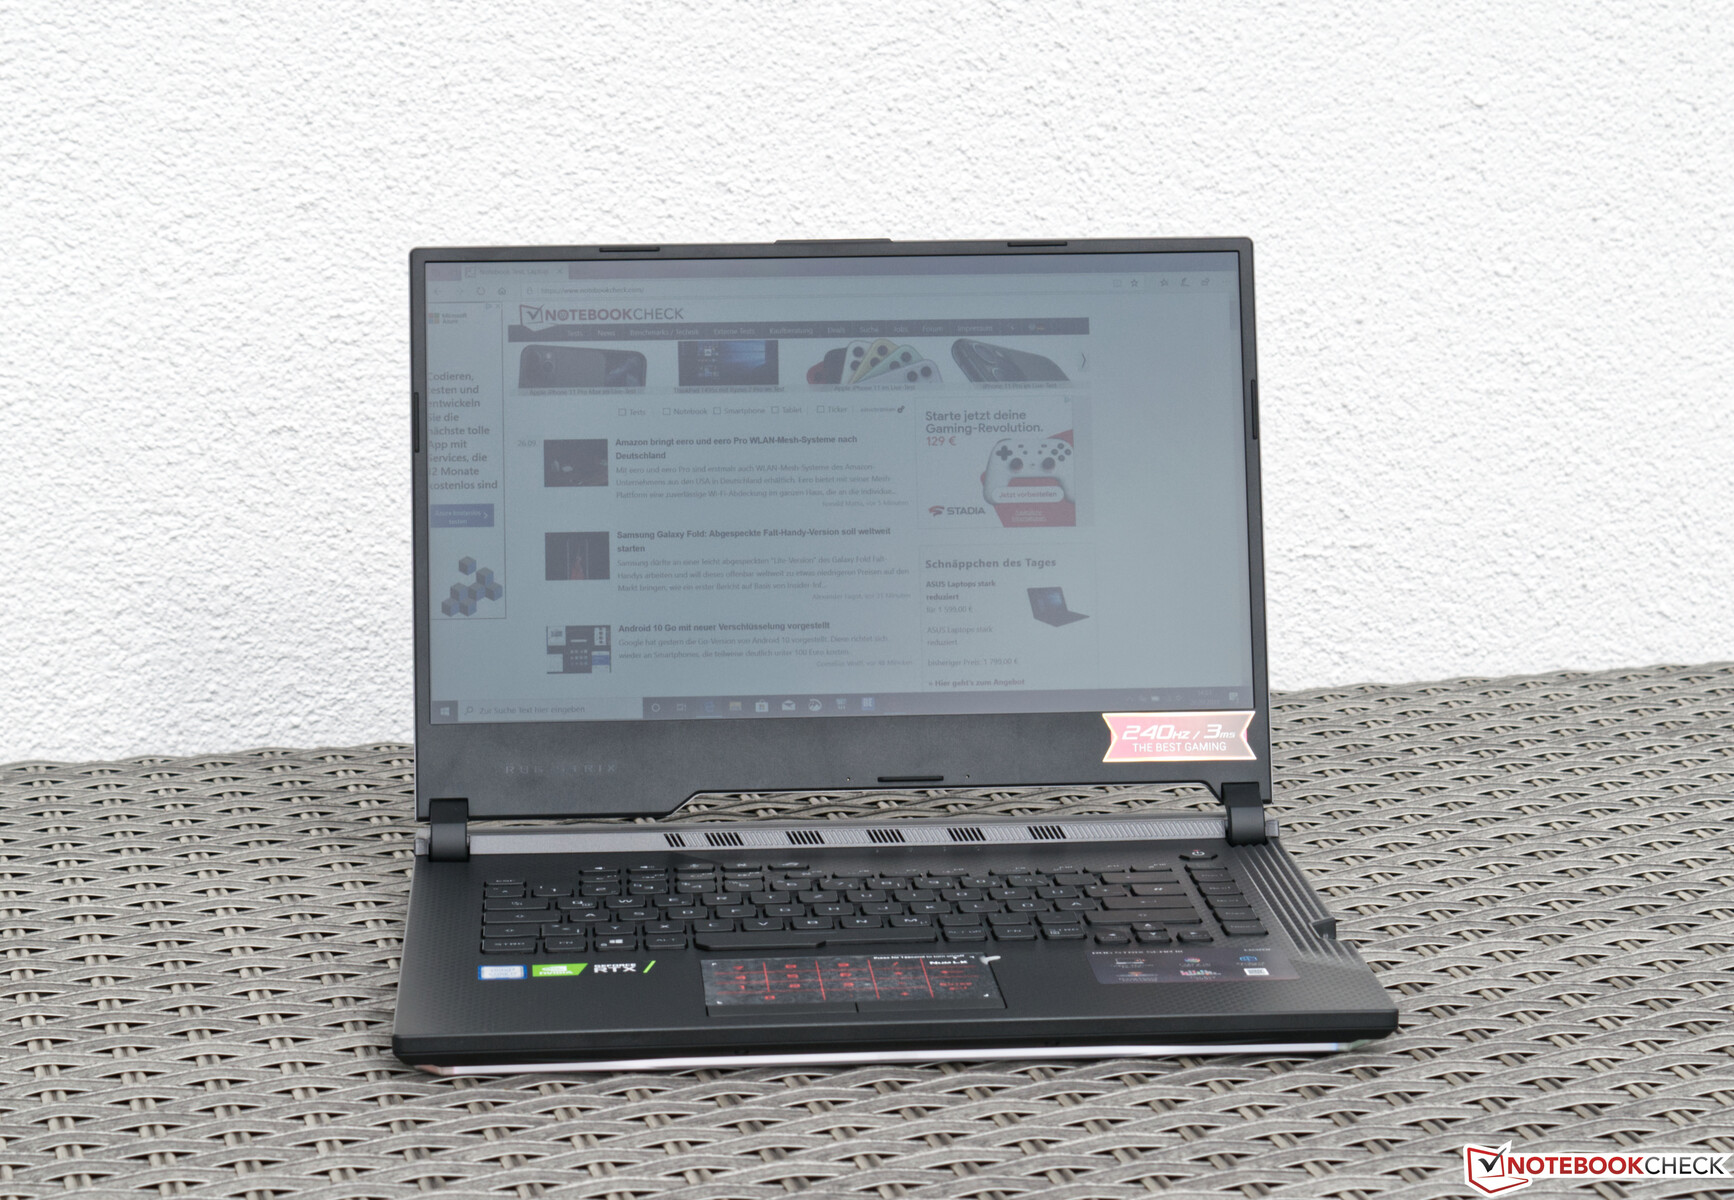
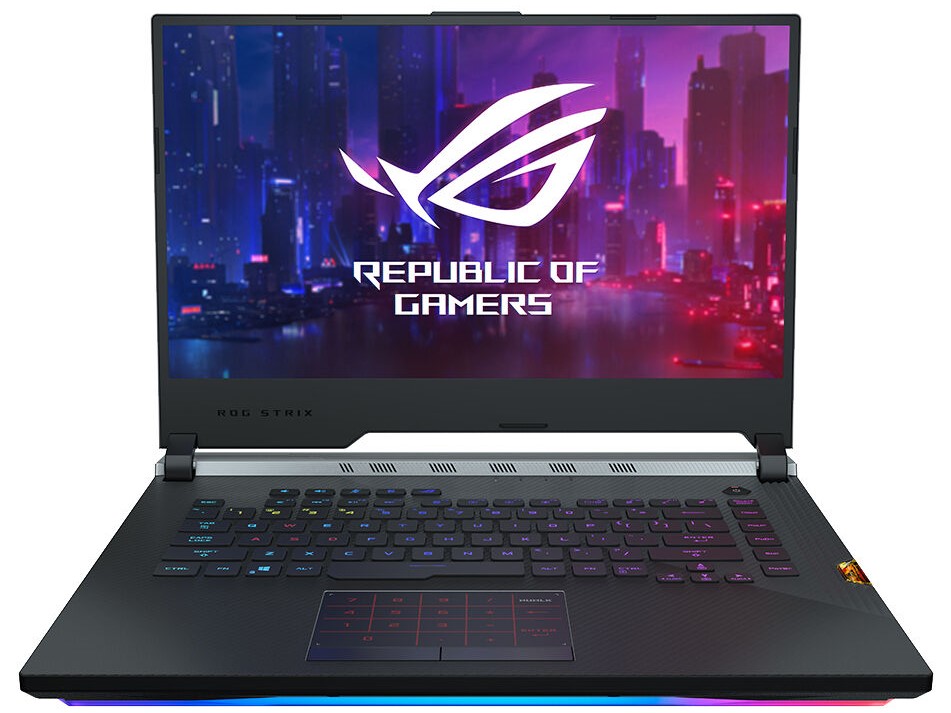
Asus ROG Strix Scar III G531GW Review: With a fast 240-Hz display

Under the label ROG (Republic of Gamers), Asus offers gaming laptops in almost any price range. At around 2400 Euros (~$2635; $2240 in the US with a 1-TB SSD), our test unit is in the middle of the field. For this price, the ROG Strix Scar III 531GW offers quite a lot. The case offers a high recognition value and is covered by RGB elements. Besides it being a feast for the eyes, the Intel Core i7-9750H together with the Nvidia GeForce RTX 2070 ensure high frame rates. In addition, all the contents are displayed on the 240-Hz panel, which represents a completely new experience. Furthermore, users do not need to forgo any storage space, since a 512 GB SSD and a 1 TB hard drive are also on board. Compared to the version based on the Intel Core i9-9880H that we have already tested, our current test unit offers only 16 GB of DDR4 RAM, but this should still be plenty.
As a competitor, there is of course its larger sibling with the Core i9, in order to directly compare whether our Core-i7 model is still able to keep up. In addition, we have also selected the Lenovo Legion Y740 and the Acer Predator Triton 500. With the Intel Core i7-9750H, both of them offer the same CPU. However, they both only offer the Max-Q version of the GeForce RTX 2070. With the Origin PC Evo16, we have also selected a strong device with the GeForce RTX 2080, but this is also the slightly weaker Max-Q version. We will find out later in our test, how well the GeForce RTX 2070 of our ROG Strix Scar III 531GW is able to keep up here.
Connection Equipment
Display - A fast 240-Hz panel


In terms of the display, Asus has equipped the ROG Strix Scar III 531GW with a 240 Hz panel that makes pro-gamers' hearts beat faster. But in regular operation, this also can be positively noticed. The resolution is 1920x1080 pixels, which is completely sufficient for the size of 15.6 inches.
In our measurements, the display does not deliver any top values with an average brightness of 284 cd/m², but it is still sufficient for second place. Only the display of the Lenovo Legion Y740 is significantly brighter (431 cd/m²). However, our test unit is struggling with a relatively high black value, which results in a weak contrast ratio.
With clouding and PWM, our ROG Strix Scar III 531GW does not accumulate any positive points. However, overall the clouding is only minimal, and in terms of PWM, we can also almost give the all-clear signal, since according to our measurements, it only occurs at a brightness of 20 percent and below.
| |||||||||||||||||||||||||
Brightness Distribution: 88 %
Center on Battery: 309 cd/m²
Contrast: 736:1 (Black: 0.42 cd/m²)
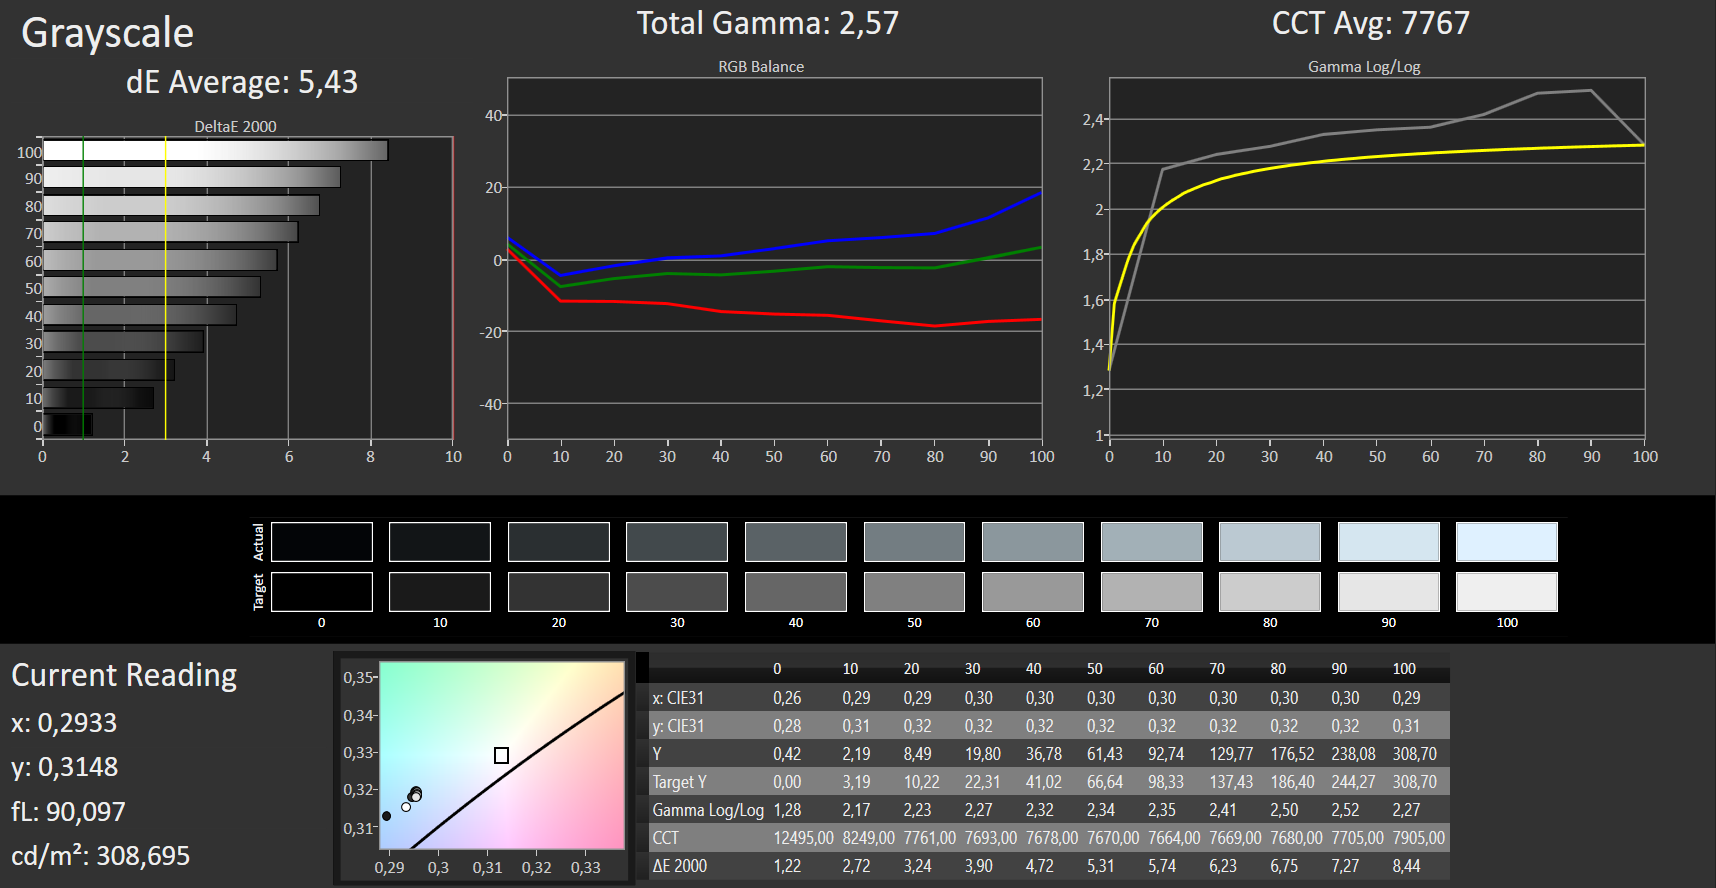
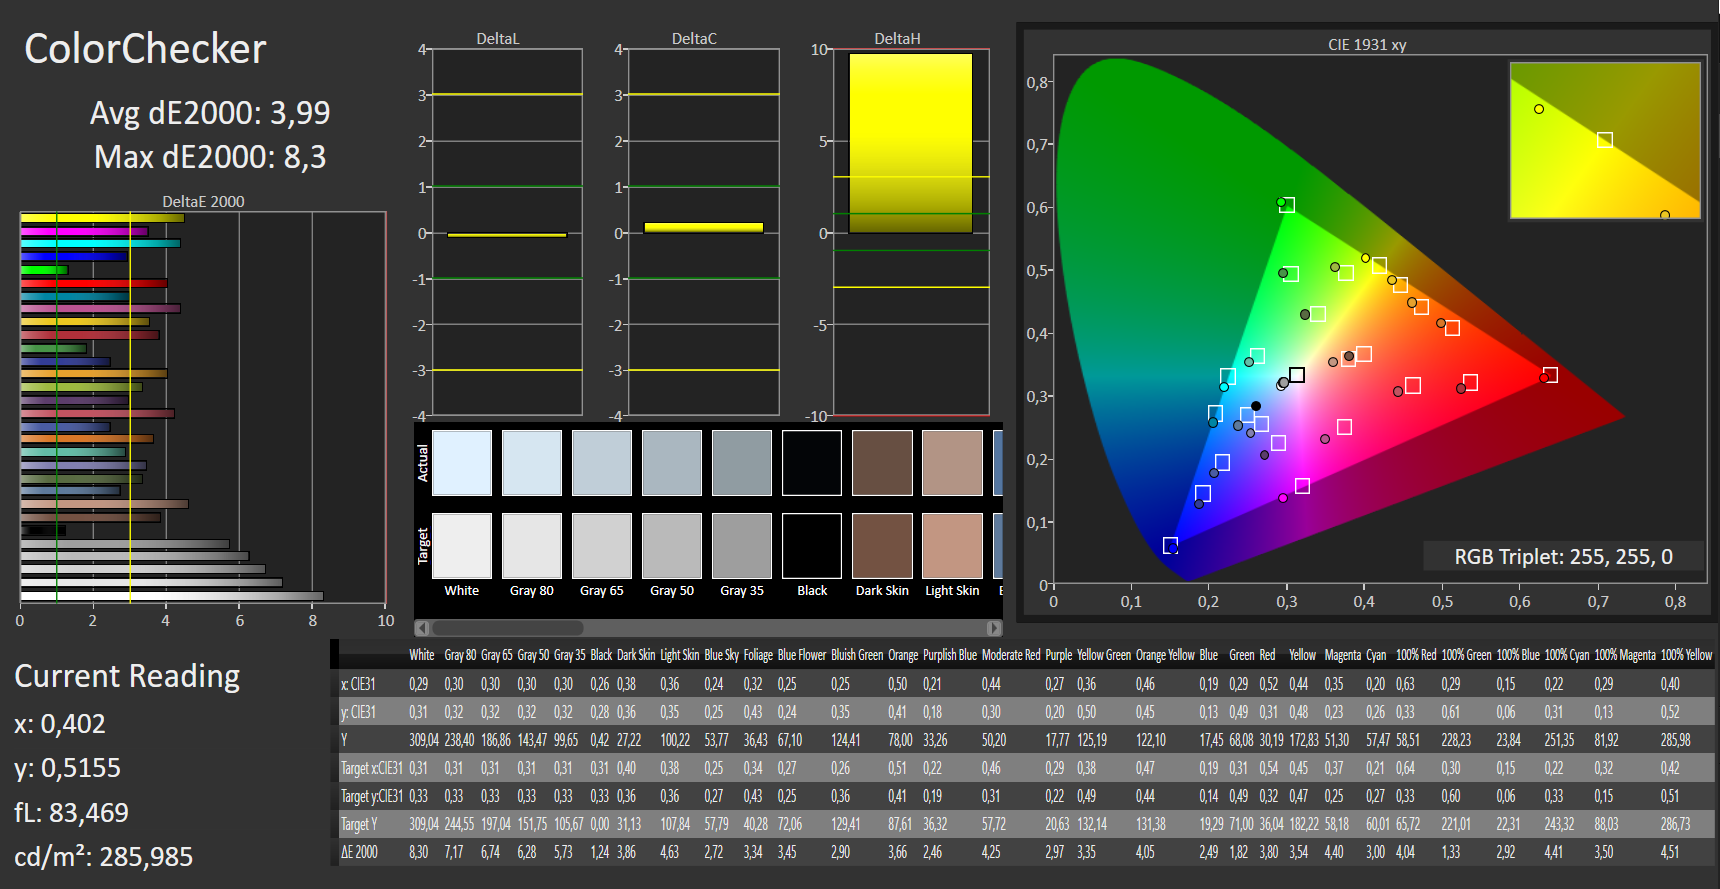
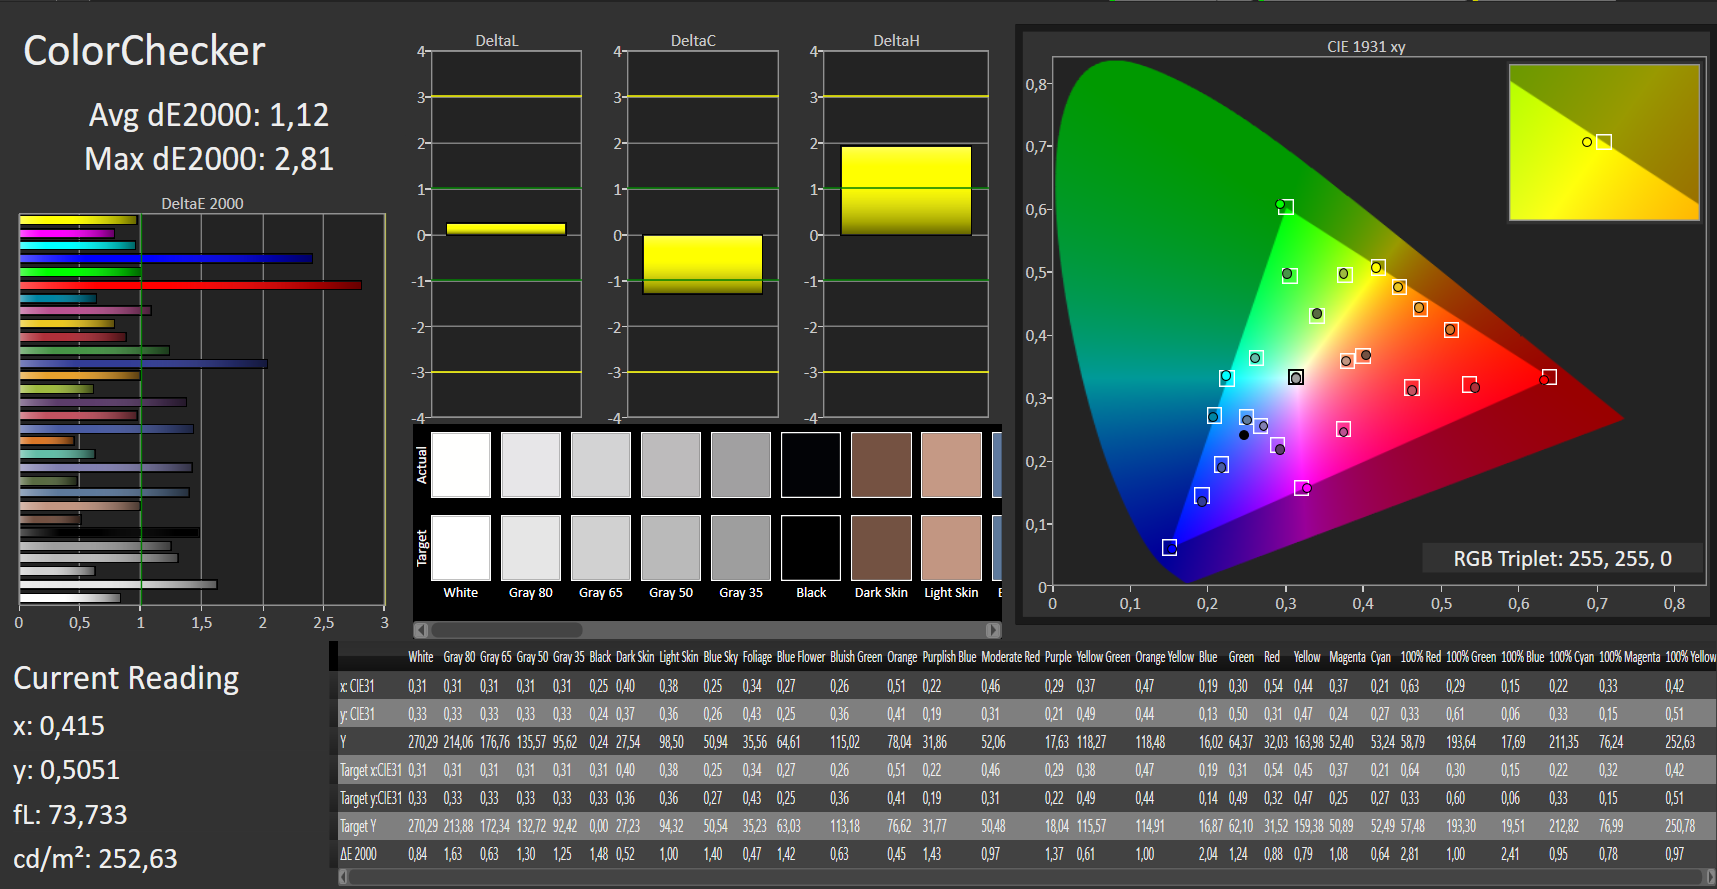
ΔE ColorChecker Calman: 3.99 | ∀{0.5-29.43 Ø4.71}
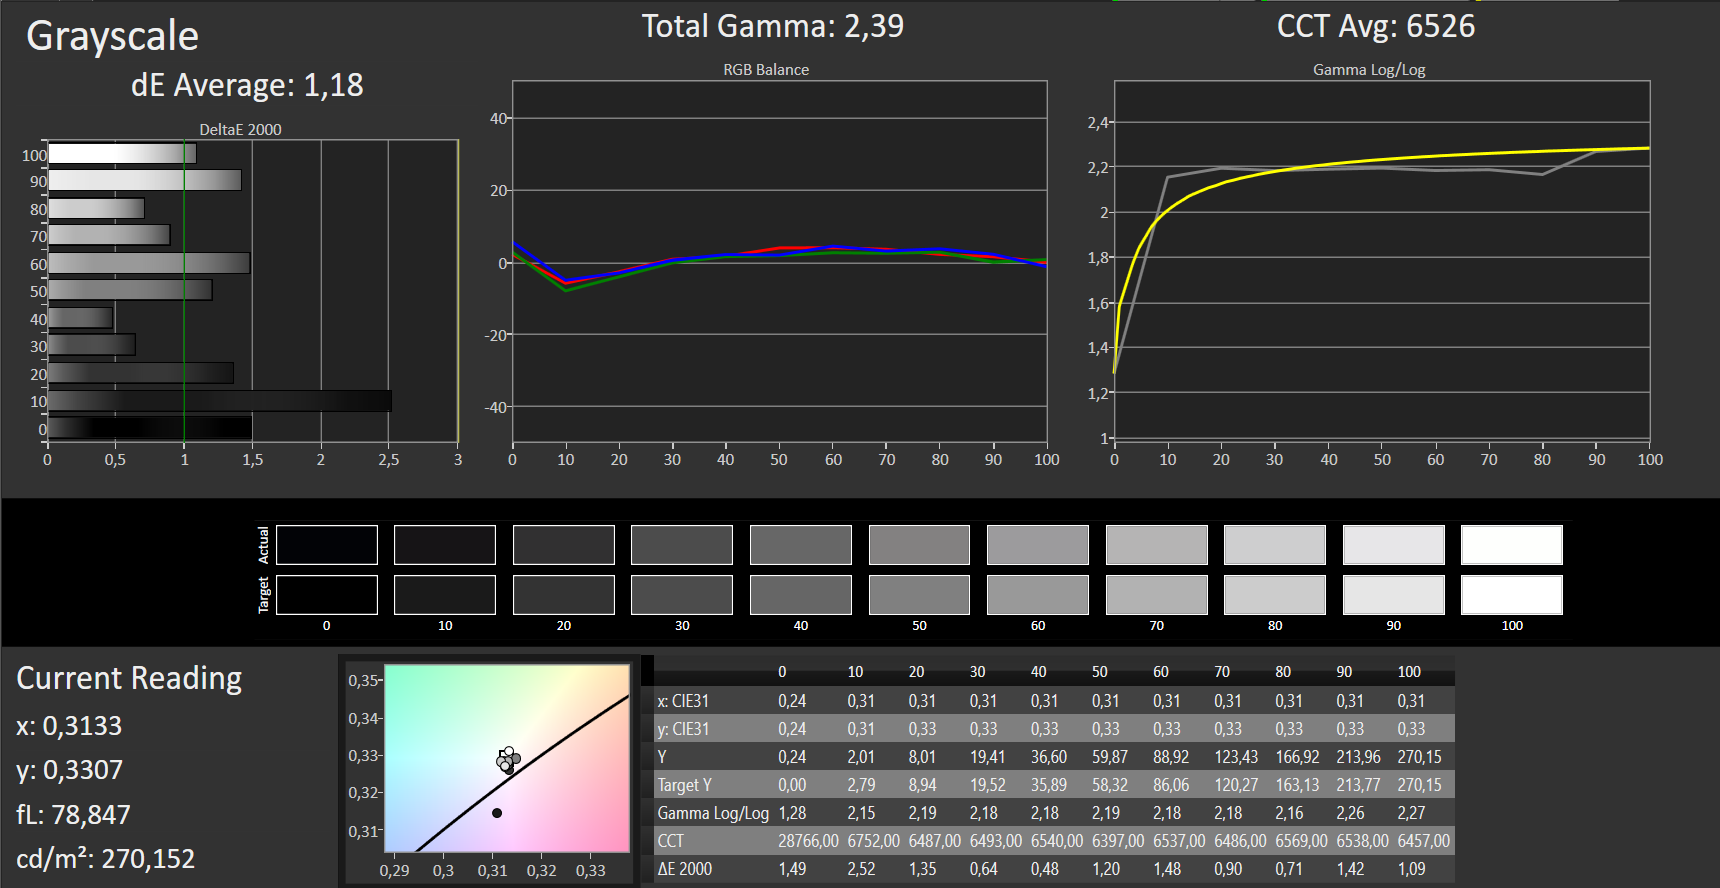
calibrated: 1.12
ΔE Greyscale Calman: 5.43 | ∀{0.09-98 Ø4.96}
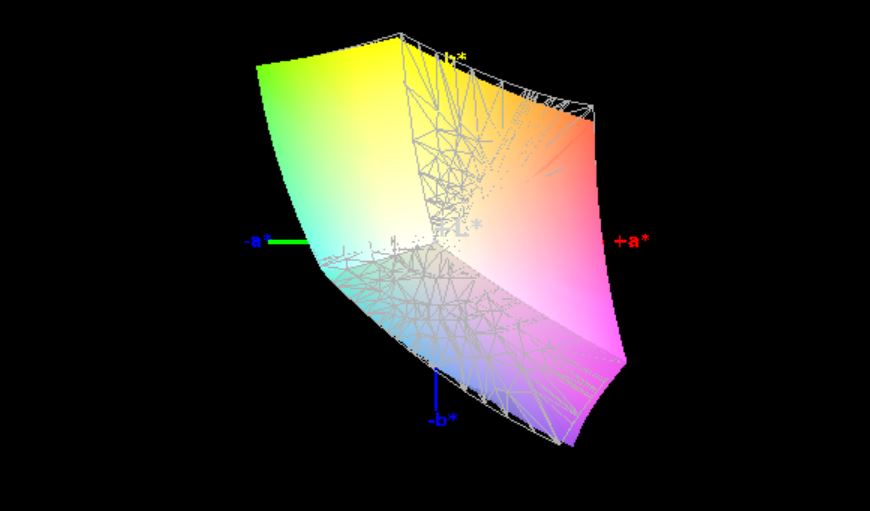
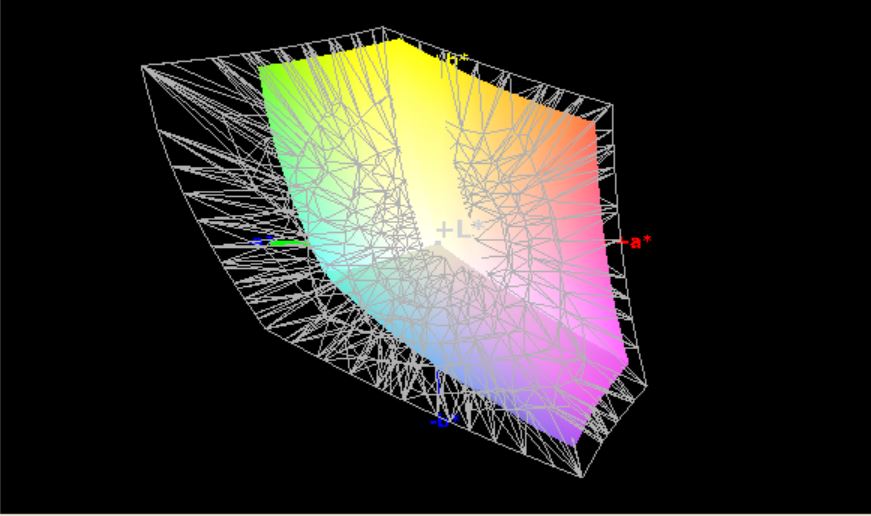
97% sRGB (Argyll 1.6.3 3D)
63% AdobeRGB 1998 (Argyll 1.6.3 3D)
67.6% AdobeRGB 1998 (Argyll 3D)
97.1% sRGB (Argyll 3D)
66.2% Display P3 (Argyll 3D)
Gamma: 2.57
CCT: 7767 K
| Asus Strix Scar III G531GW-AZ062T Sharp LQ156M1JW09 (SHP14D3), IPS, 1920x1080, 15.6" | Asus Strix Scar III G531GW Sharp LQ156M1JW09 (SHP14D3), IPS, 1920x1080, 15.6" | Lenovo Legion Y740-15ICHg BOE NV156FHM-N4J, IPS, 1920x1080, 15.6" | Acer Predator Triton 500 PT515-51-71PZ NV156FHM-N4K (BOE082A), IPS, 1920x1080, 15.6" | Origin PC EVO16-S i7-9750H RTX 2080 Max-Q Chi Mei CMN N161HCA-GA1, IPS, 1920x1080, 16.1" | |
|---|---|---|---|---|---|
| Display | -0% | -2% | -3% | -5% | |
| Display P3 Coverage (%) | 66.2 | 66.2 0% | 67.7 2% | 64.6 -2% | 62.3 -6% |
| sRGB Coverage (%) | 97.1 | 96.5 -1% | 91.6 -6% | 92.6 -5% | 93.3 -4% |
| AdobeRGB 1998 Coverage (%) | 67.6 | 67.5 0% | 67.1 -1% | 66 -2% | 64 -5% |
| Response Times | -20% | -19% | 21% | -2% | |
| Response Time Grey 50% / Grey 80% * (ms) | 15 ? | 17.2 ? -15% | 19 ? -27% | 5.2 ? 65% | 14.4 ? 4% |
| Response Time Black / White * (ms) | 9 ? | 11.2 ? -24% | 10 ? -11% | 11.2 ? -24% | 9.6 ? -7% |
| PWM Frequency (Hz) | 250 ? | 24040 ? | 25510 ? | ||
| Screen | 20% | 31% | 13% | -1% | |
| Brightness middle (cd/m²) | 309 | 266 -14% | 477 54% | 288 -7% | 278 -10% |
| Brightness (cd/m²) | 284 | 252 -11% | 431 52% | 265 -7% | 259 -9% |
| Brightness Distribution (%) | 88 | 88 0% | 84 -5% | 84 -5% | 89 1% |
| Black Level * (cd/m²) | 0.42 | 0.27 36% | 0.175 58% | 0.22 48% | 0.41 2% |
| Contrast (:1) | 736 | 985 34% | 2726 270% | 1309 78% | 678 -8% |
| Colorchecker dE 2000 * | 3.99 | 1.81 55% | 4.17 -5% | 3.22 19% | 2.93 27% |
| Colorchecker dE 2000 max. * | 8.3 | 3.23 61% | 6.97 16% | 6.26 25% | 7.12 14% |
| Colorchecker dE 2000 calibrated * | 1.12 | 1.03 8% | 2.51 -124% | 1.5 -34% | 1.49 -33% |
| Greyscale dE 2000 * | 5.43 | 2.44 55% | 3.49 36% | 3.43 37% | 4.5 17% |
| Gamma | 2.57 86% | 2.42 91% | 2.5 88% | 2.41 91% | 2.17 101% |
| CCT | 7767 84% | 7005 93% | 7076 92% | 7290 89% | 5767 113% |
| Color Space (Percent of AdobeRGB 1998) (%) | 63 | 62 -2% | 60 -5% | 60 -5% | 59.2 -6% |
| Color Space (Percent of sRGB) (%) | 97 | 97 0% | 91 -6% | 93 -4% | 93.2 -4% |
| Total Average (Program / Settings) | 0% /
11% | 3% /
19% | 10% /
11% | -3% /
-2% |
* ... smaller is better
Display Response Times
| ↔ Response Time Black to White | ||
|---|---|---|
| 9 ms ... rise ↗ and fall ↘ combined | ↗ 5 ms rise | 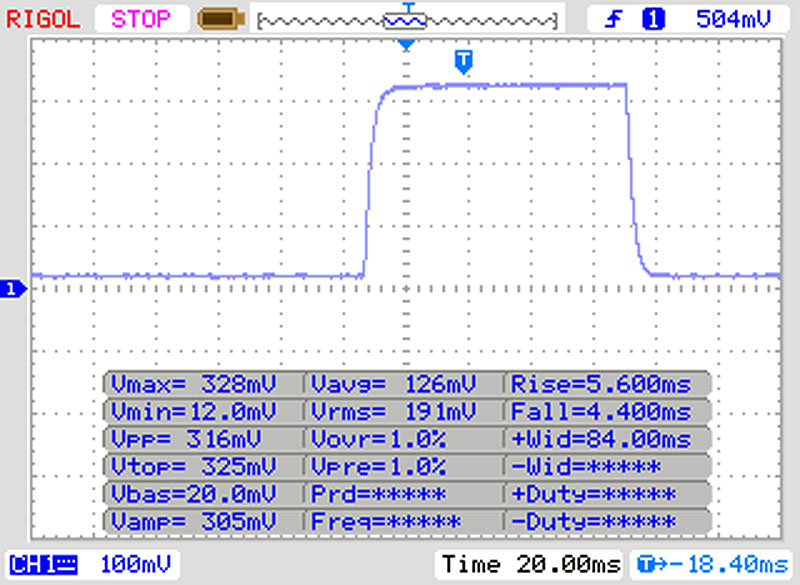 |
| ↘ 4 ms fall | ||
| The screen shows fast response rates in our tests and should be suited for gaming. In comparison, all tested devices range from 0.1 (minimum) to 240 (maximum) ms. » 25 % of all devices are better. This means that the measured response time is better than the average of all tested devices (19.8 ms). | ||
| ↔ Response Time 50% Grey to 80% Grey | ||
| 15 ms ... rise ↗ and fall ↘ combined | ↗ 8 ms rise | 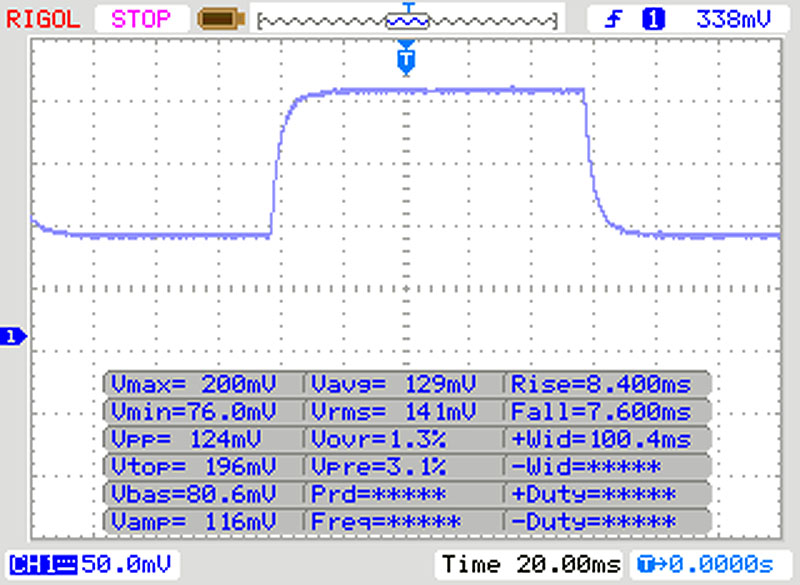 |
| ↘ 7 ms fall | ||
| The screen shows good response rates in our tests, but may be too slow for competitive gamers. In comparison, all tested devices range from 0.165 (minimum) to 636 (maximum) ms. » 29 % of all devices are better. This means that the measured response time is better than the average of all tested devices (30.9 ms). | ||
Screen Flickering / PWM (Pulse-Width Modulation)
| Screen flickering / PWM detected | 250 Hz | ≤ 20 % brightness setting | 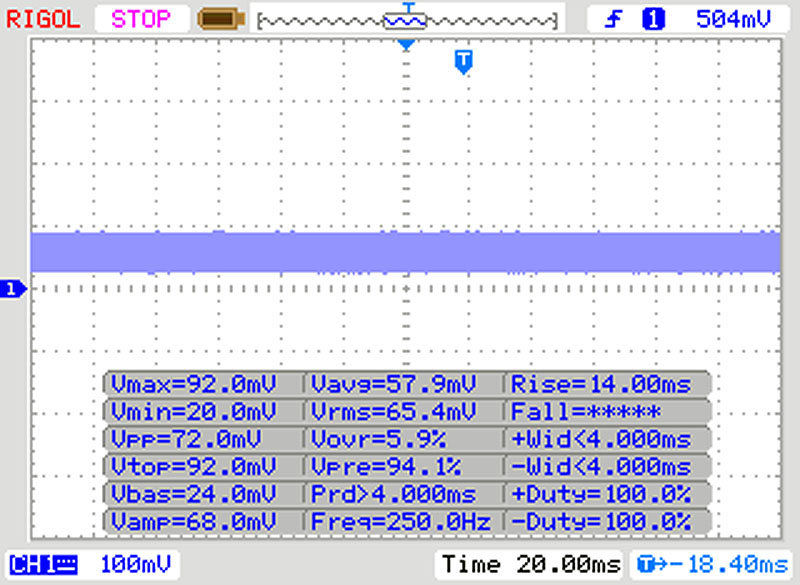 |
The display backlight flickers at 250 Hz (worst case, e.g., utilizing PWM) Flickering detected at a brightness setting of 20 % and below. There should be no flickering or PWM above this brightness setting. The frequency of 250 Hz is relatively low, so sensitive users will likely notice flickering and experience eyestrain at the stated brightness setting and below. In comparison: 52 % of all tested devices do not use PWM to dim the display. If PWM was detected, an average of 7744 (minimum: 5 - maximum: 343500) Hz was measured. | |||
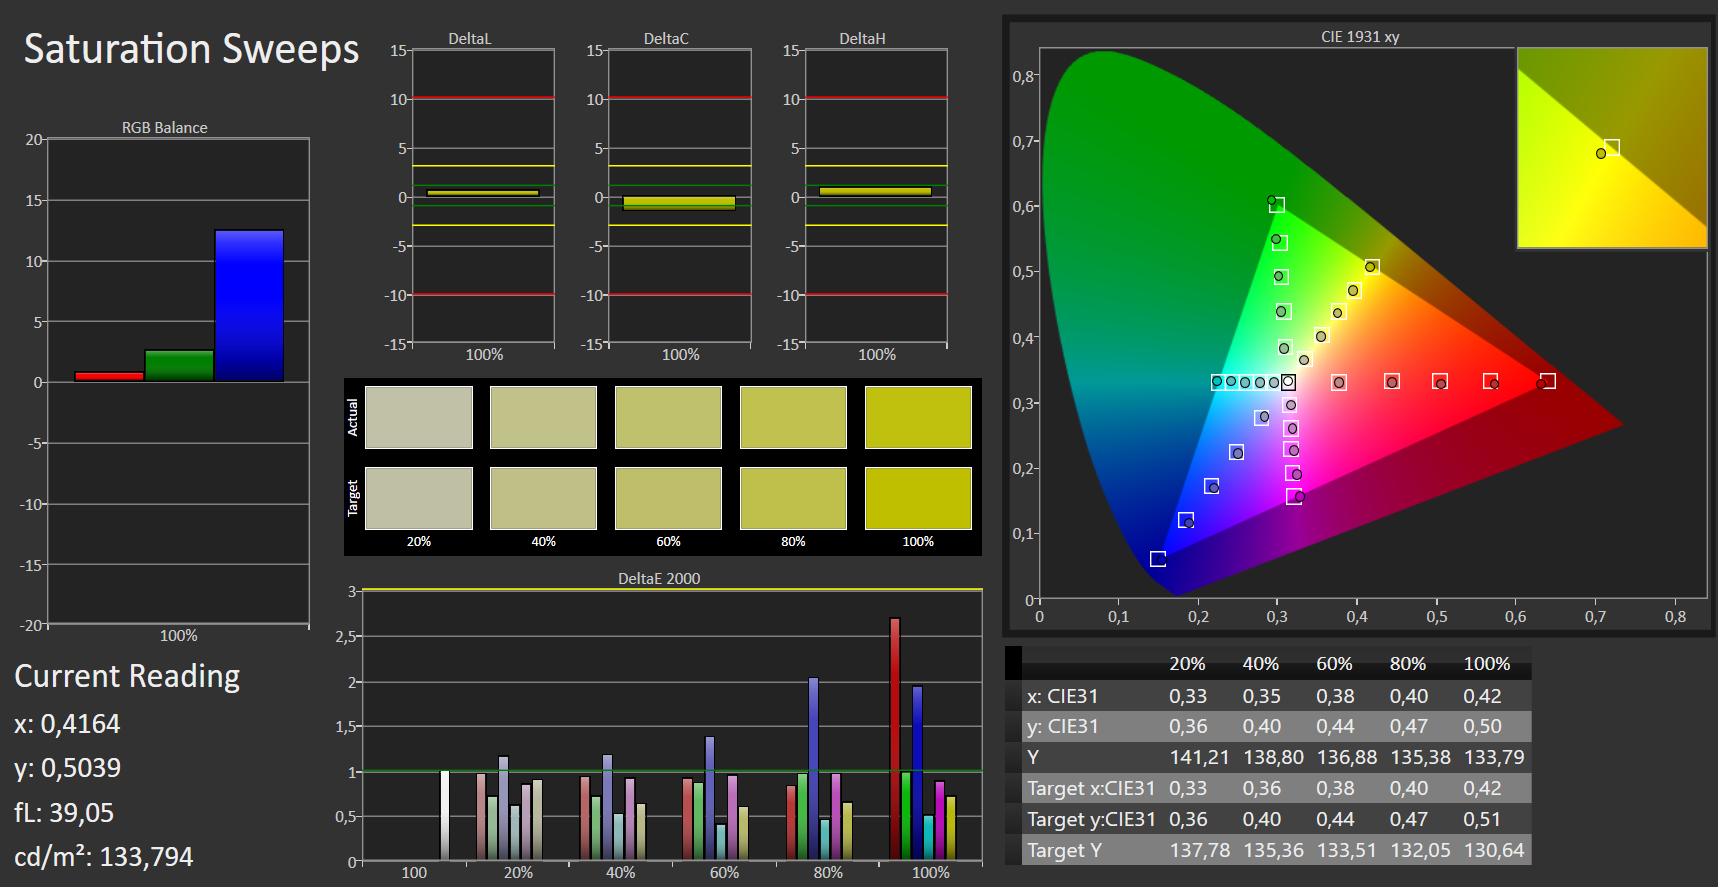
Despite the low contrast ratio, the image quality is decent. However, black areas can be considered more gray and colors are not reproduced very vibrant. In the state of delivery, the color deviations are only slightly elevated compared to the sRGB color space. On the other hand, the display in the similar ROG Strix Scar III 531GW with a Core i9 CPU delivers better values. We also noticed a blue tint. However, with our calibration, these values could be improved considerably, and the slight blue tint was also reduced. We have linked the corresponding ICC profile of our test unit, and you can find the download above our comparison chart.
In terms of the color reproduction, the ROG Strix Scar III 531GW does a very good job and achieves the best values in our comparison. We note an sRGB color space coverage of 97% and AdobeRGB coverage of 63%. While these values are not suitable for photography, the color space coverage is completely sufficient for gaming.
The matte display surface does not limit usage in bright surroundings, since annoying reflections are prevented. With a better display brightness, the ROG Strix Scar III 531GW would have been able to do better here. In terms of the viewing angle stability, we are seeing the result of a good IPS panel here. Even the usual problematic corner images are only covered by a very weak gray veil. This was significantly stronger in the other competitors.

Performance - A good performance in the Asus gaming laptop
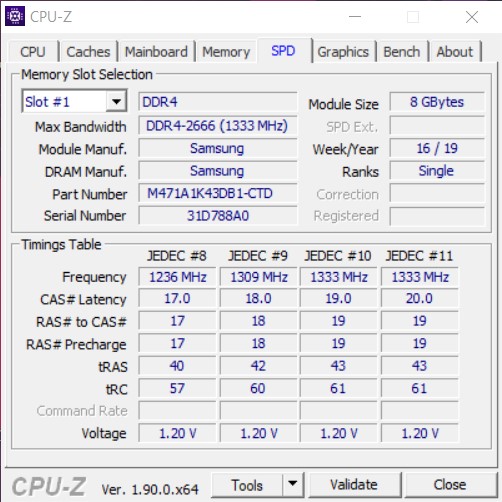
Asus has equipped the ROG Strix III with gaming hardware for gamers. With the Intel Core i7-9750H, our test unit offers a fast hexa-core processor, and an Nvidia GeForce RTX 2070 is responsible for the graphics performance. With 16 GB, the working memory is sufficient, and the storage solution of a combined SSD and HDD also offers sufficient reserves. As alternatives, interested buyers can also choose models with the Nvidia GeForce RTX 2060 or GTX 1650 and 1660 Ti as well as with the Core i5-9300H and Core i9-9880H Intel processors.
All the hardware variations are designed for gaming at a high level. However, users should think beforehand about whether they want to use a 4K monitor, for example, or whether they often want to play games with ray-tracing and DLSS features.
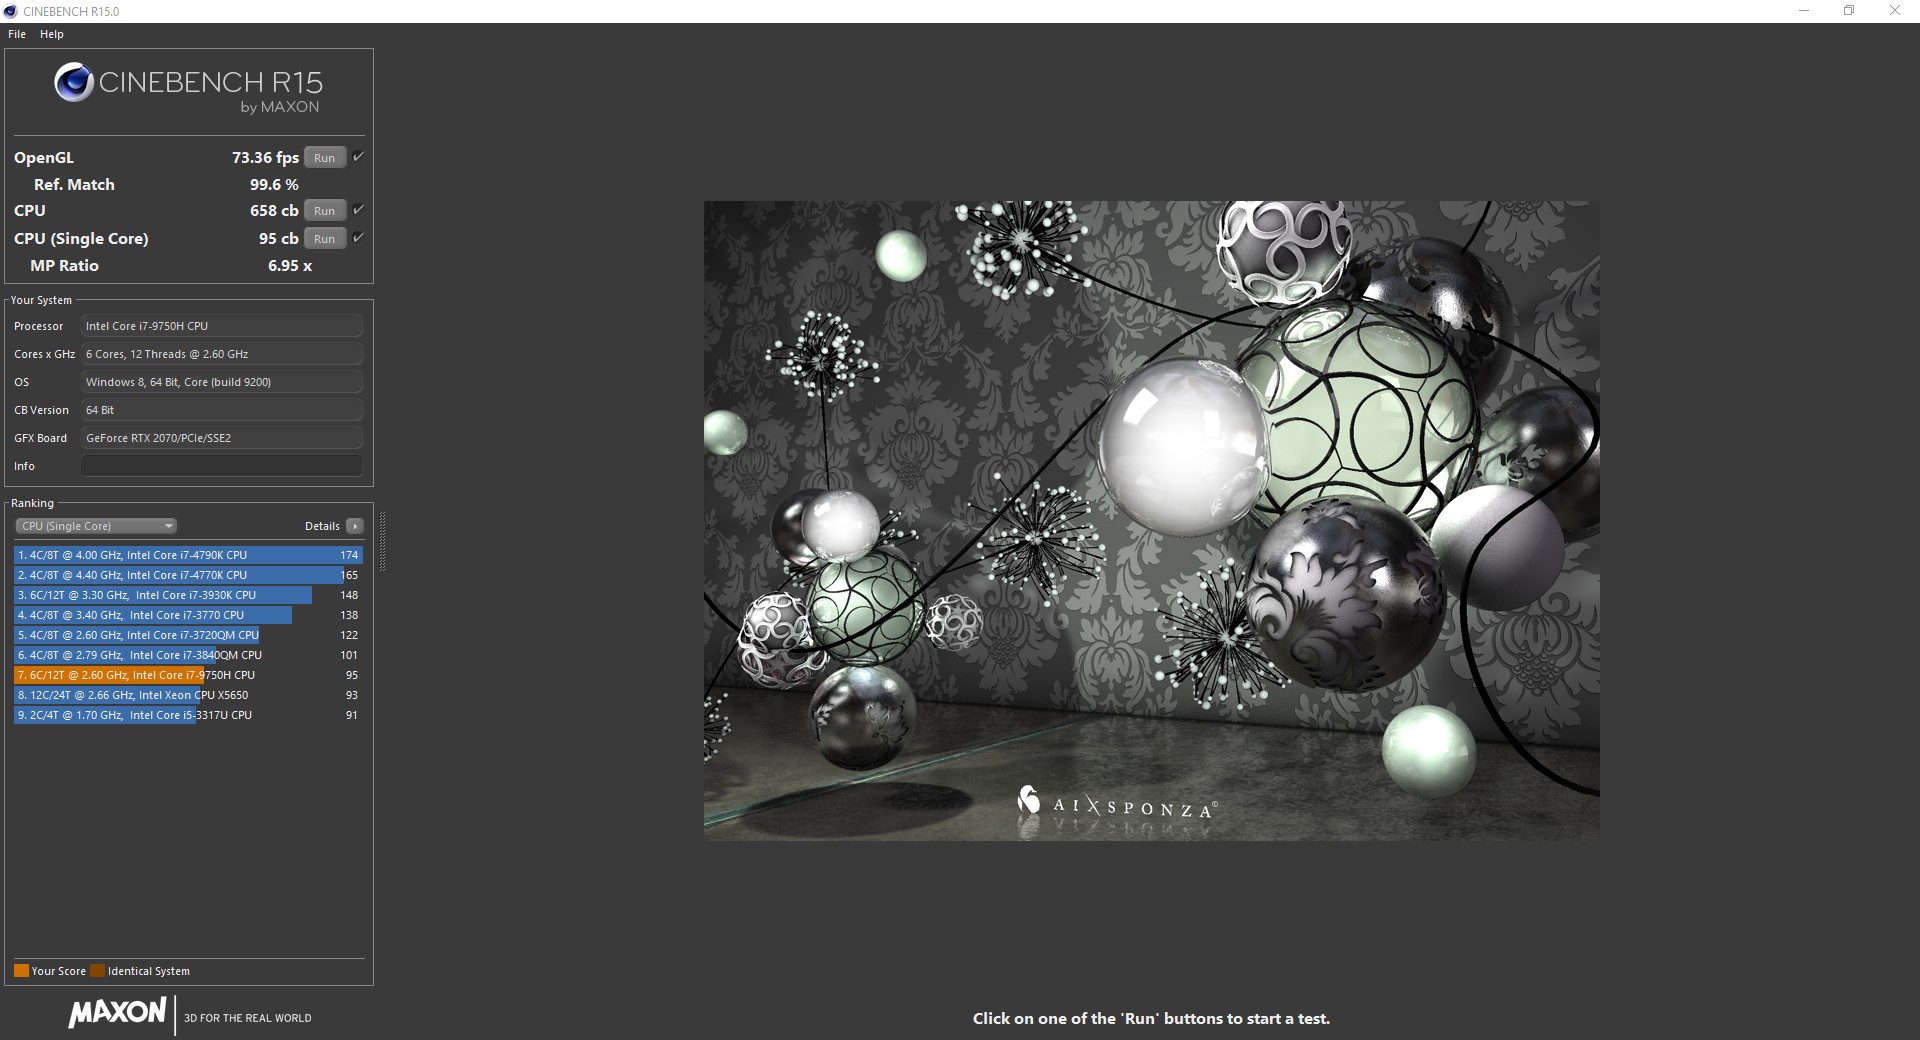
Processor
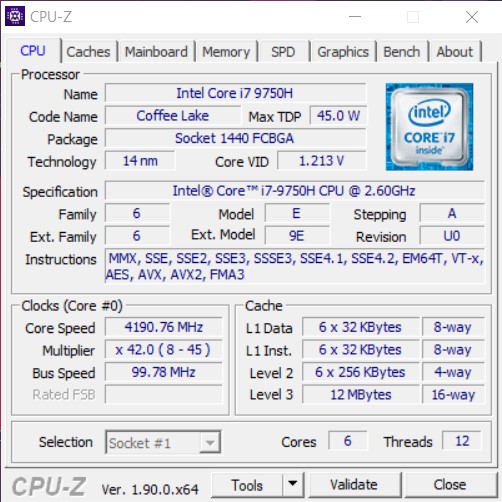
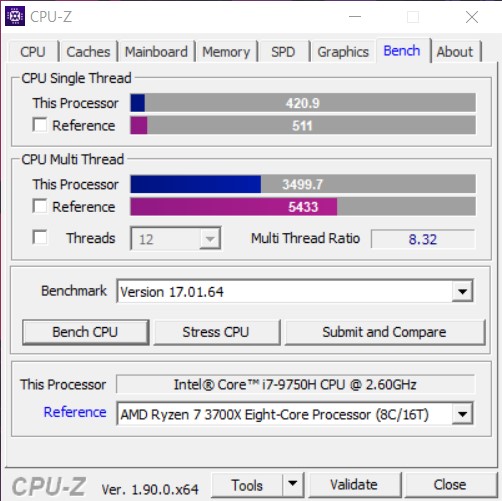
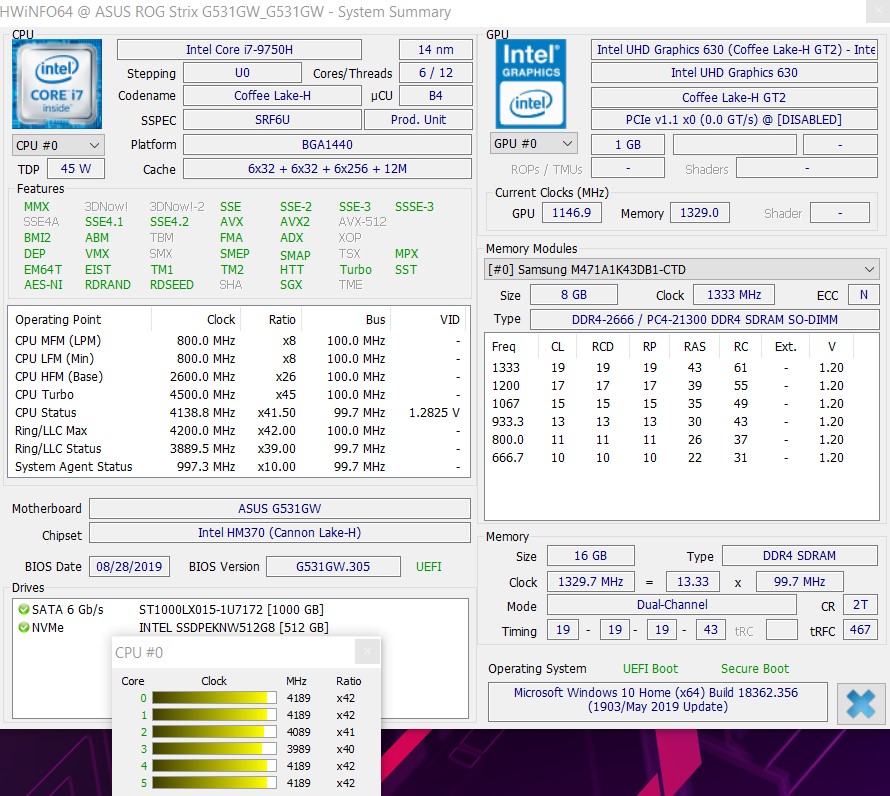
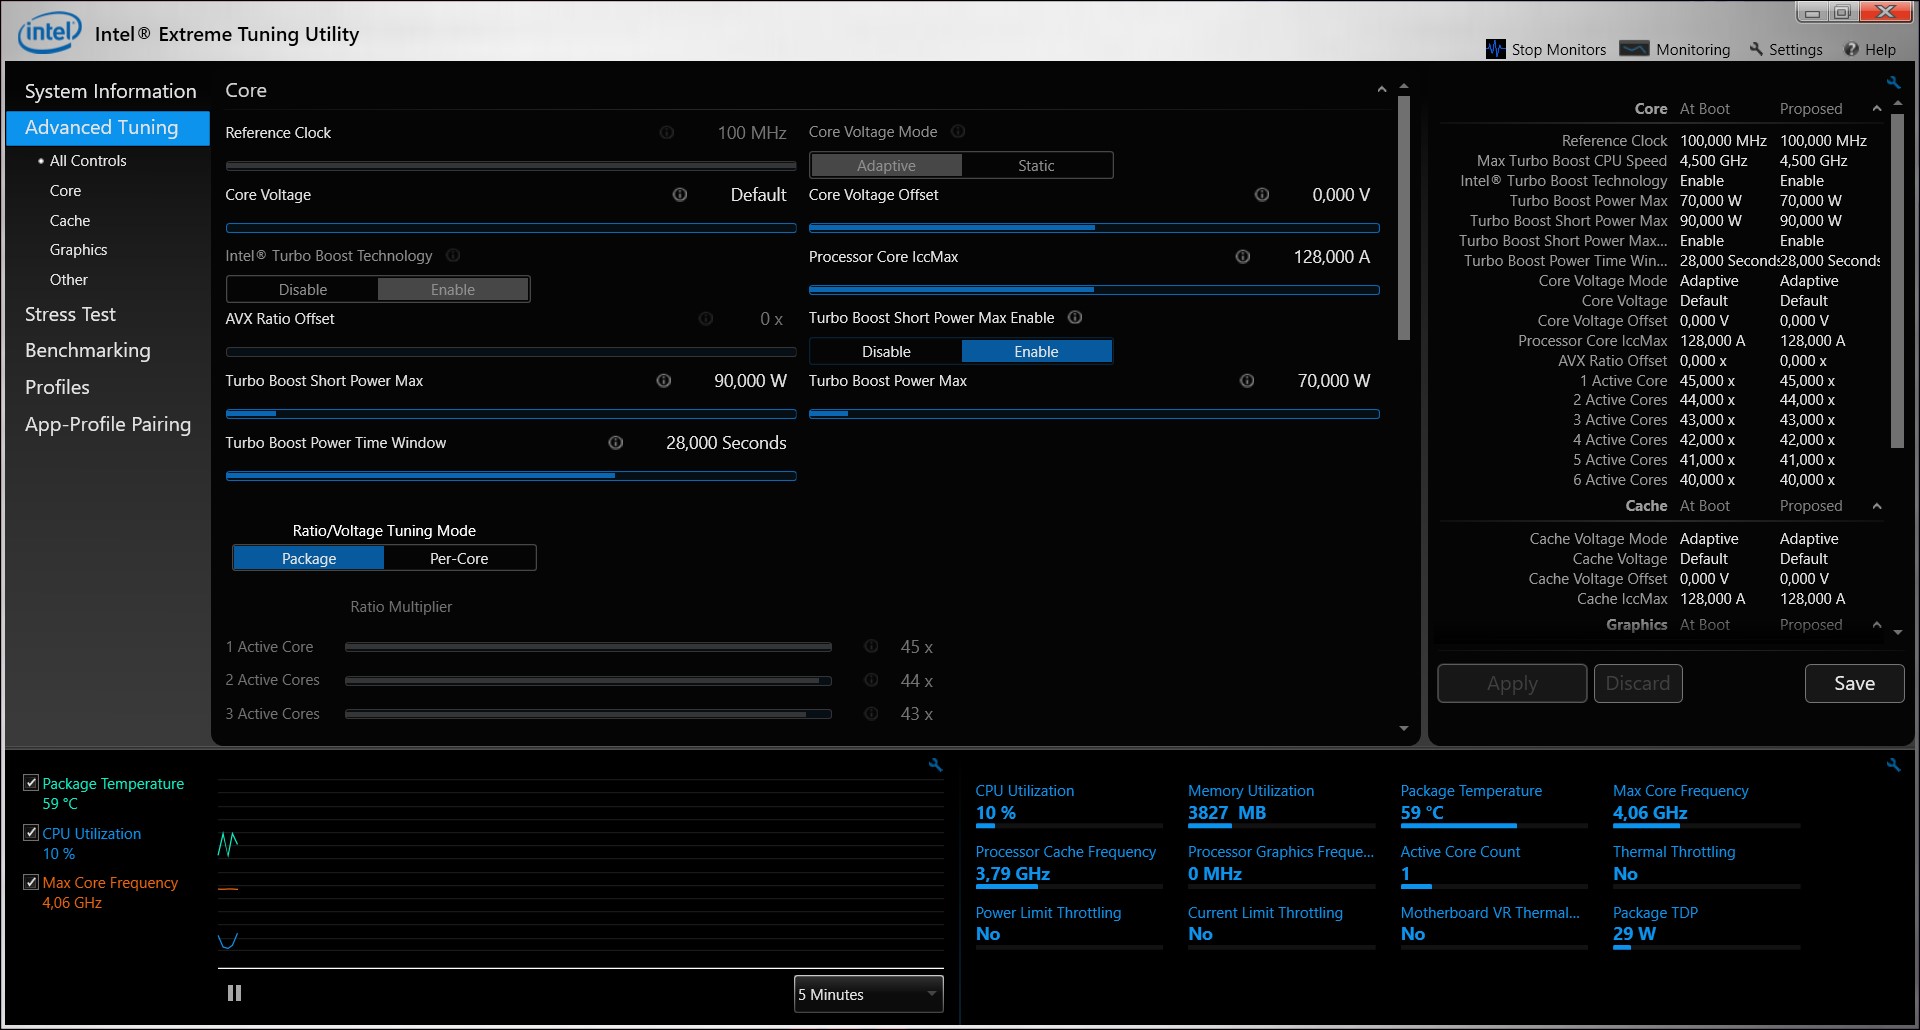
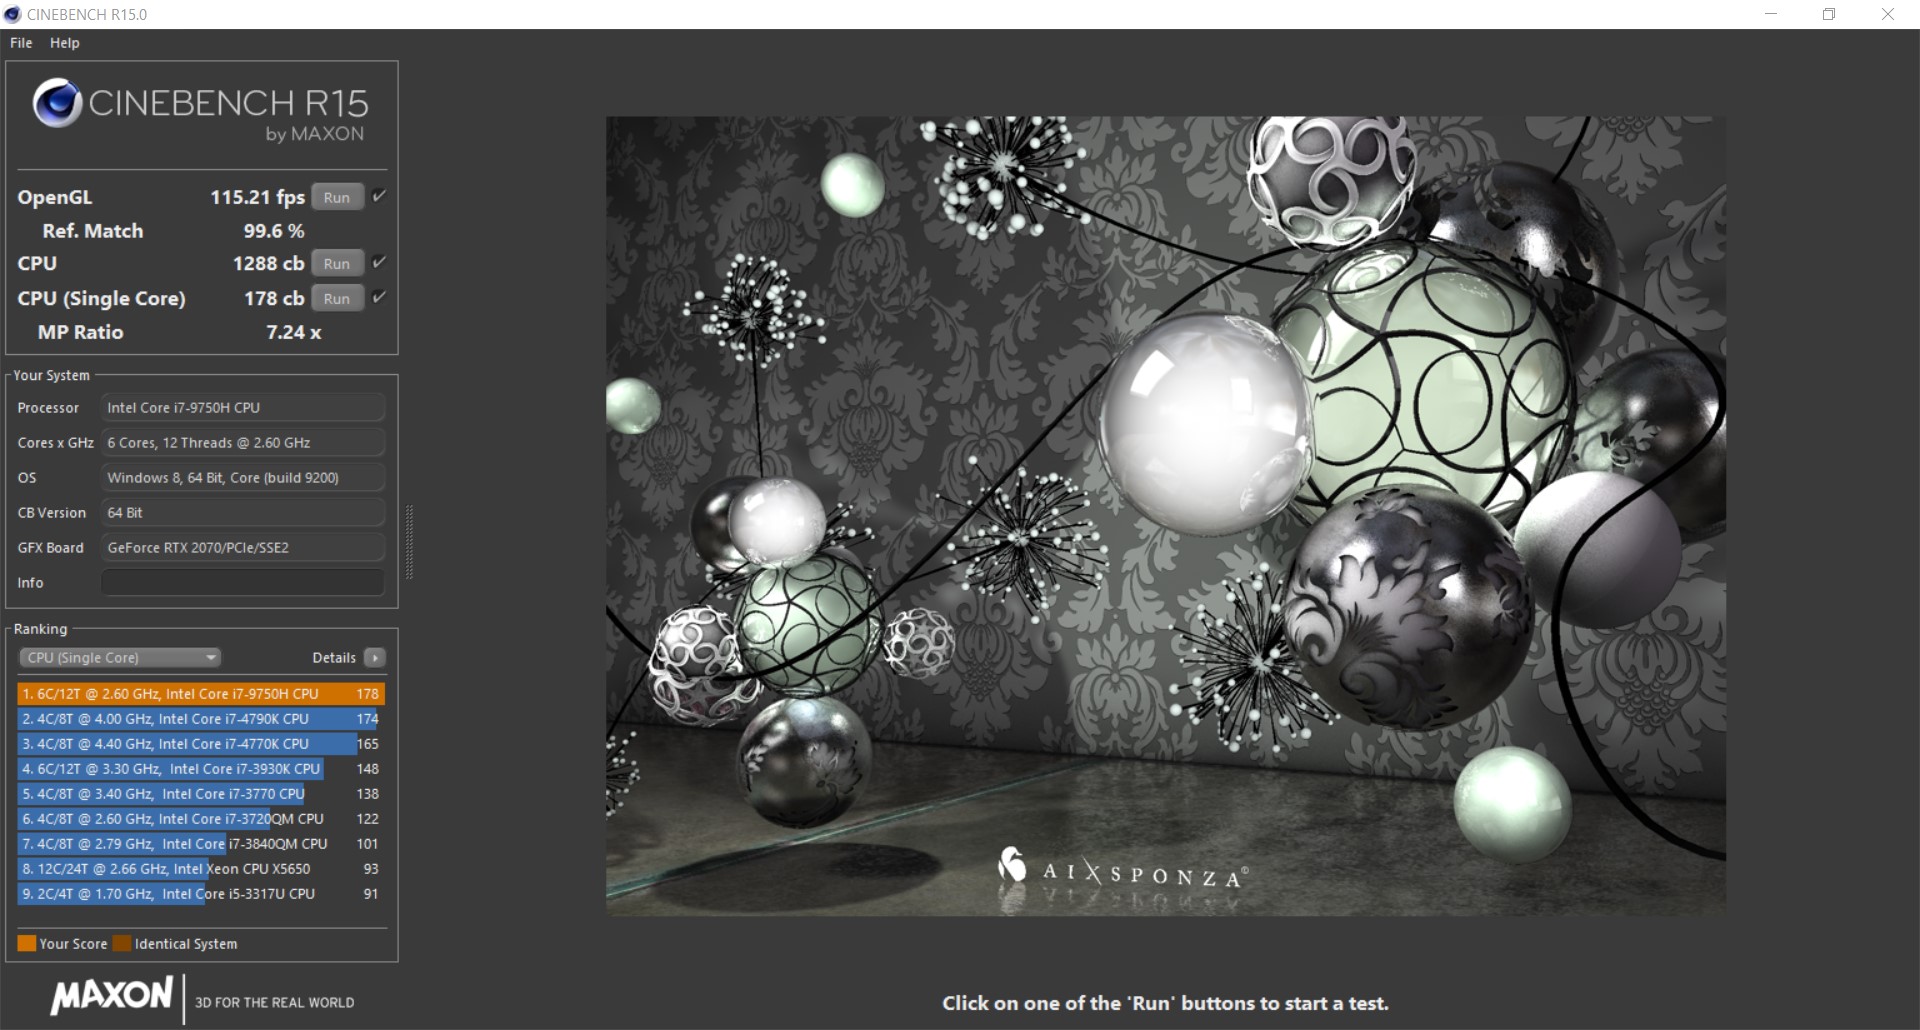
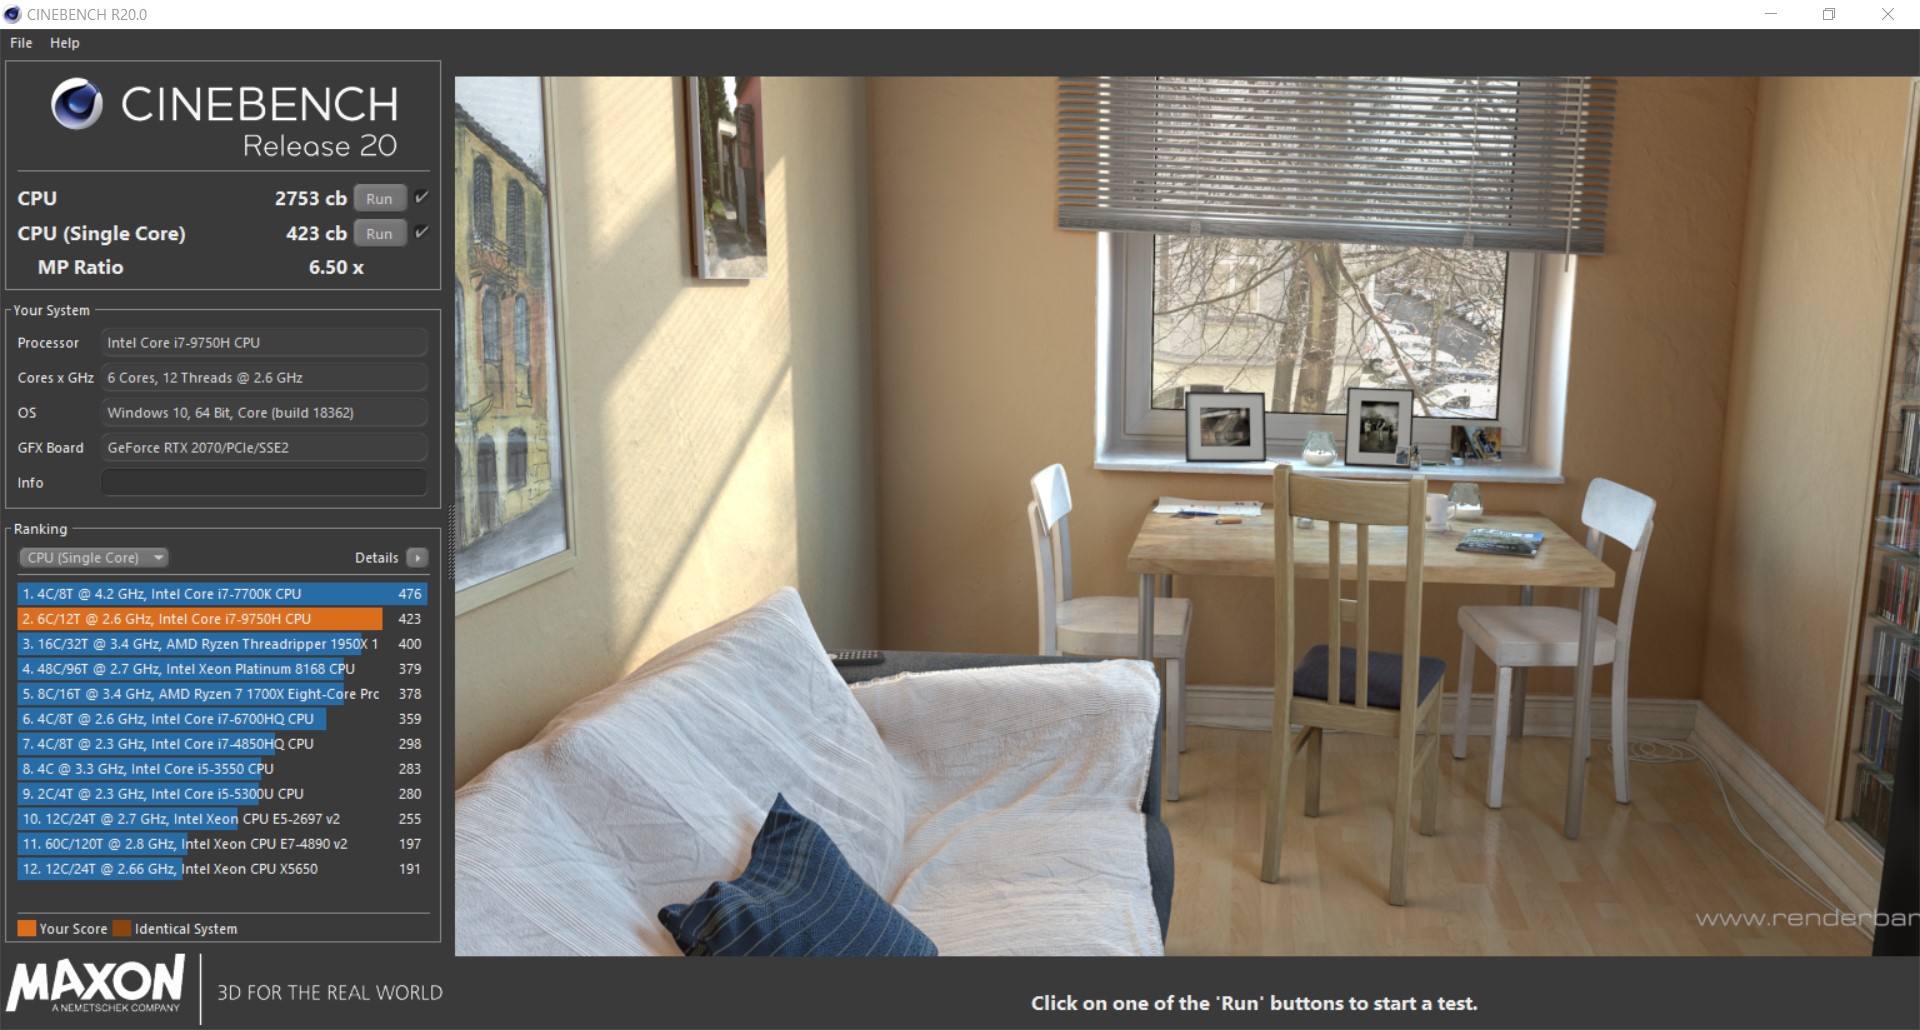
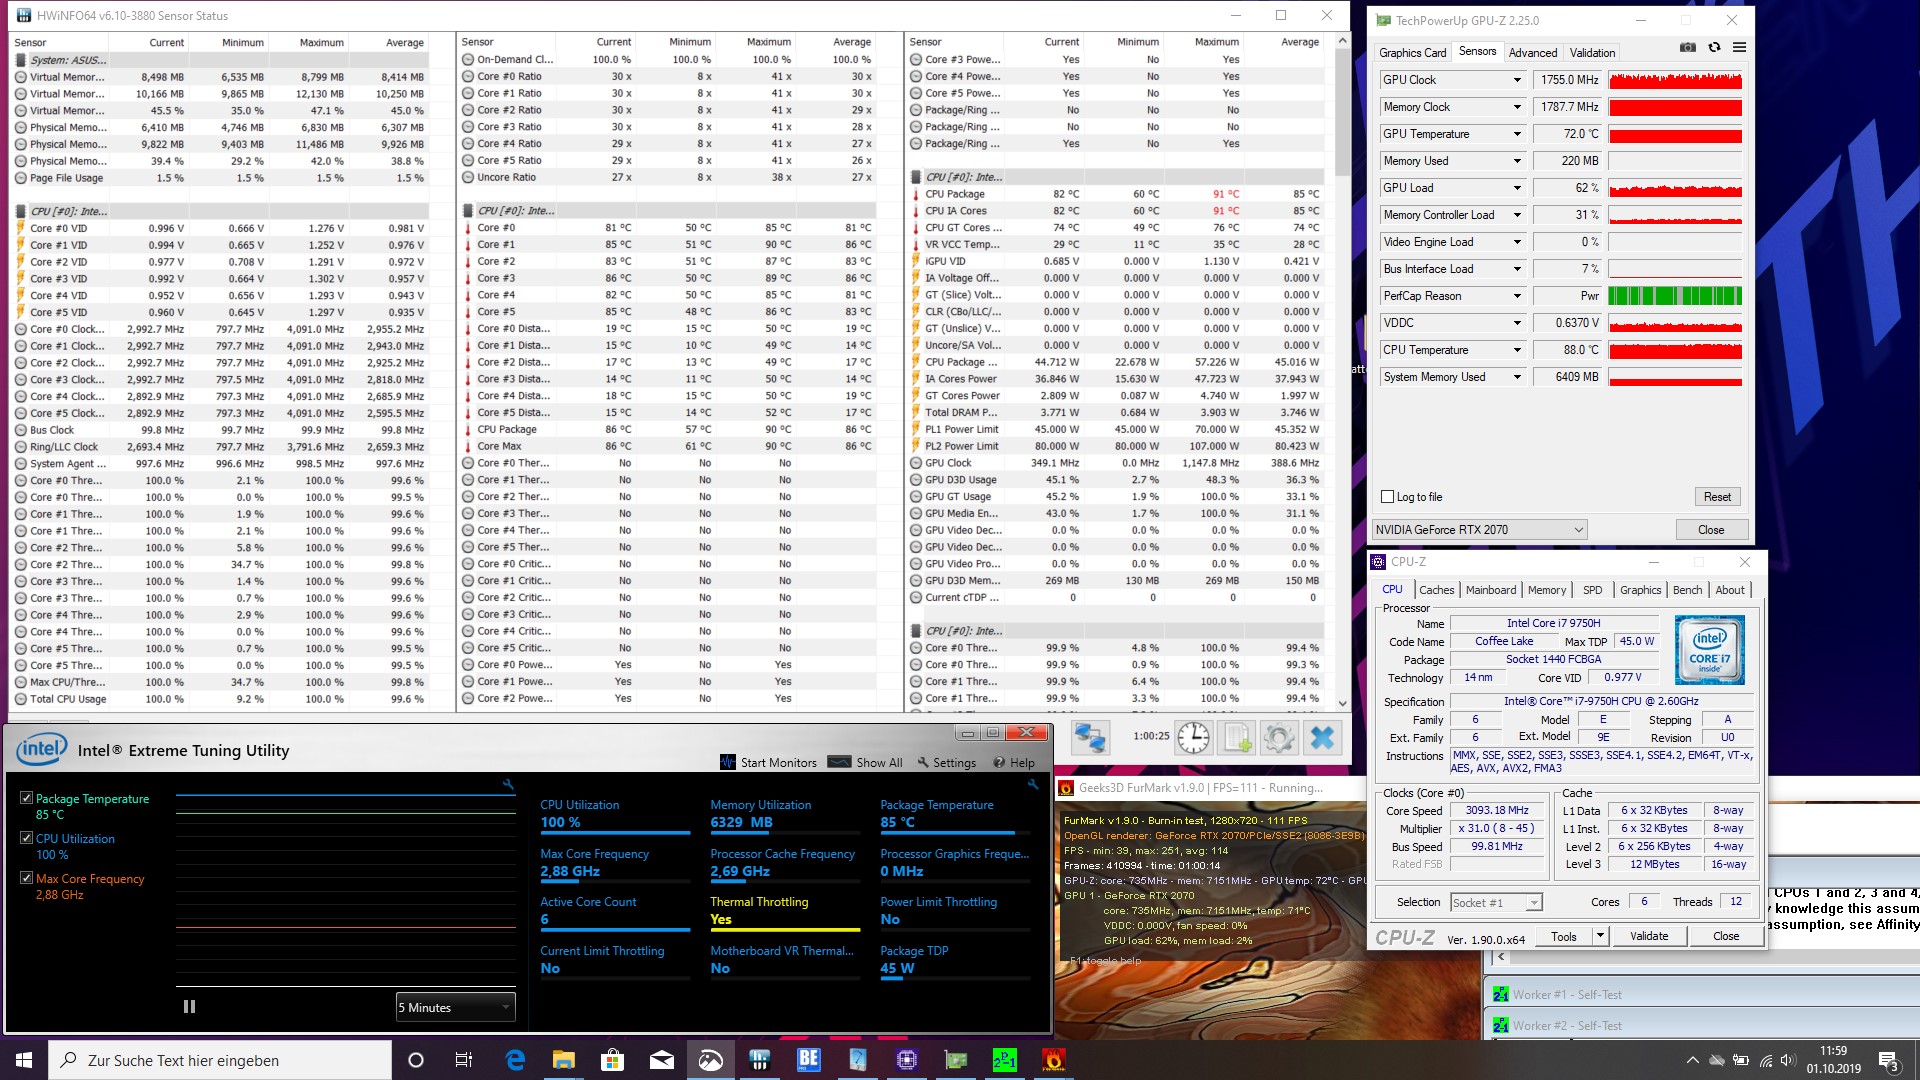
The Intel Core i7-9750H is a 6-core processor and in the ROG Strix Scar III 531GW the second fastest model behind the Intel Core i9-9880H, which has 8 cores. The Intel Core i7-9750H offers a basic core speed of 2.6 GHz. In Turbo, the SoC is able to achieve up to 4.5 GHz under optimal conditions. However, this only applies to the load of two cores. When all 6 cores are used, it is limited to only 4.0 GHz.
However, in the test our test unit remains behind the competitors in the single-core performance. The distance to the other competitors is about 3 to 6 percent. Things look different in the multi-core test, and our ROG Strix Scar III 531GW advances to second place. Compared to the ROG Strix Scar III based on the Core i9-9880H, the difference is 9 percent.
For additional comparisons and benchmarks, we refer to our CPU comparison chart.
In the stress test with the Cinebench-R15 multi-loop, the ROG Strix Scar III 531GW does fairly well and is able to achieve a better result on average than the comparison devices with the same CPU. The ROG Strix Scar III had already achieved good values based on the Core i9 processor, so that we were already expecting a good result.
| Blender - v2.79 BMW27 CPU | |
| Average Intel Core i7-9750H (342 - 495, n=21) | |
| Asus Strix Scar III G531GW-AZ062T | |
| Lenovo Legion Y740-15ICHg | |
| Geekbench 4.4 | |
| 64 Bit Single-Core Score | |
| Asus Strix Scar III G531GW-AZ062T | |
| Lenovo Legion Y740-15ICHg | |
| Average Intel Core i7-9750H (4440 - 5511, n=27) | |
| 64 Bit Multi-Core Score | |
| Asus Strix Scar III G531GW-AZ062T | |
| Lenovo Legion Y740-15ICHg | |
| Average Intel Core i7-9750H (17054 - 25043, n=27) | |
* ... smaller is better

System Performance
In the PCMark-10 benchmarks, our ROG Strix Scar III 531GW is unable to come through, and the comparison devices are faster almost throughout. The PCMark 8 is handled better by our test unit, and it is able to place second.
Subjectively, the system performance of our ROG Strix Scar III is very good and we did not encounter any problems during the time of our testing.
| PCMark 8 Home Score Accelerated v2 | 4860 points | |
| PCMark 8 Creative Score Accelerated v2 | 7937 points | |
| PCMark 8 Work Score Accelerated v2 | 5697 points | |
| PCMark 10 Score | 5625 points | |
Help | ||
Storage Solution
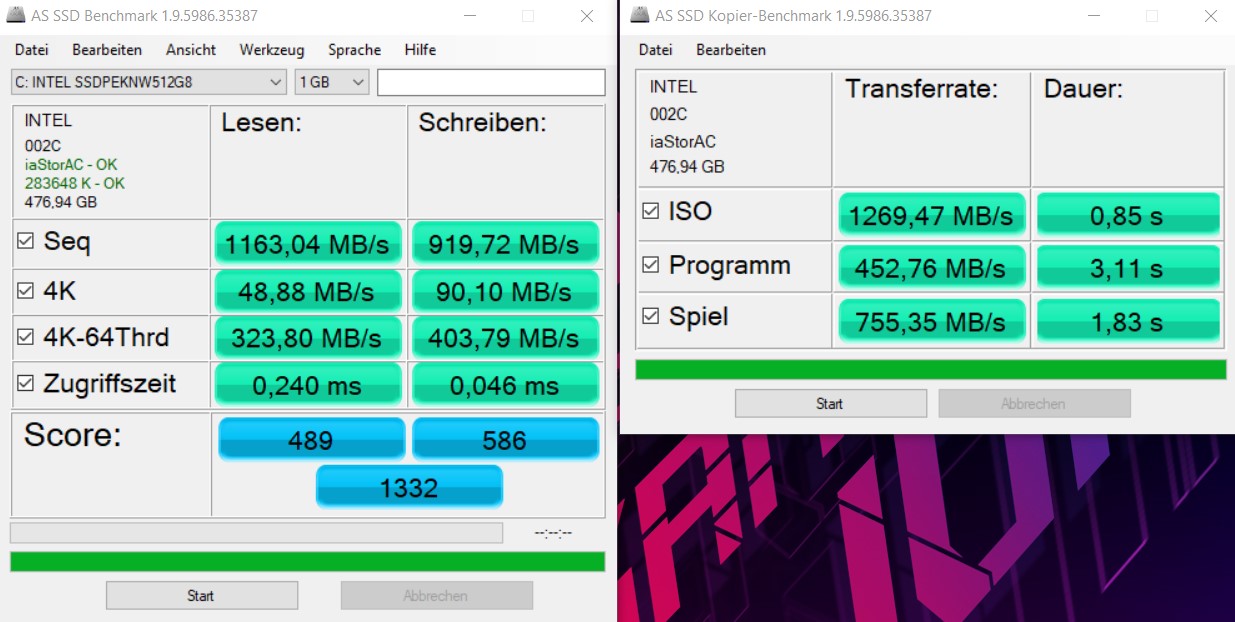
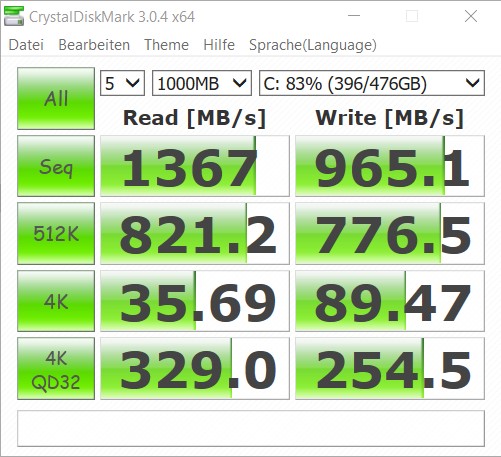
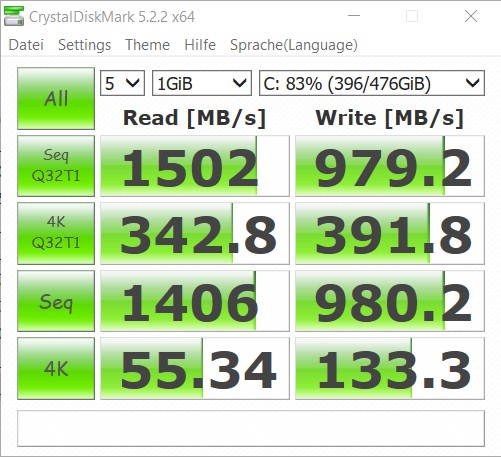
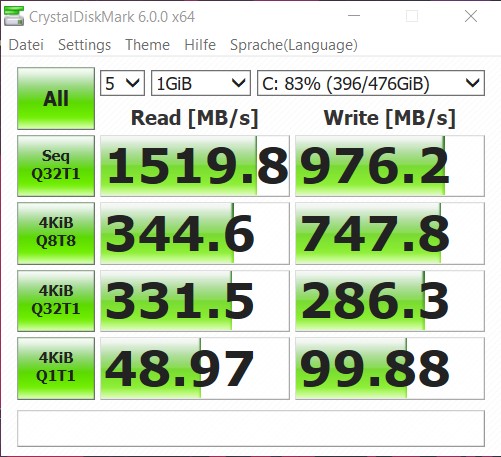
Asus has equipped our ROG Strix Scar III with a 512-GB SSD from Intel that achieves values in the middle of the field in our storage benchmark. The measured access rates are typical for SSDs, so that users do not have to expect any wait times.
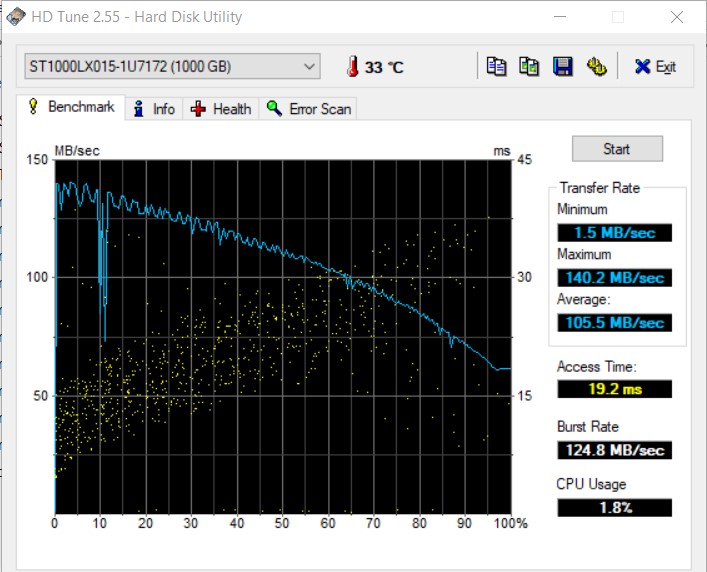
As a second storage module, the gaming notebook offers a hybrid hard drive with 1 TB of storage space. However, with an average transfer rate of 105 MB/s, the HDD only delivered average values.
For additional comparisons and benchmarks, we refer to our comparison chart.
| Asus Strix Scar III G531GW-AZ062T Intel SSD 660p SSDPEKNW512G8 | Asus Strix Scar III G531GW Intel SSD 660p 1TB SSDPEKNW010T8 | Lenovo Legion Y740-15ICHg WDC PC SN520 SDAPMUW-128G | Acer Predator Triton 500 PT515-51-71PZ WDC PC SN720 SDAPNTW-512G | Origin PC EVO16-S i7-9750H RTX 2080 Max-Q Samsung SSD 970 EVO Plus 500GB | Average Intel SSD 660p SSDPEKNW512G8 | Average of class Gaming | |
|---|---|---|---|---|---|---|---|
| AS SSD | 38% | -8% | 179% | 170% | 16% | 268% | |
| Seq Read (MB/s) | 1163 | 1574 35% | 1372 18% | 2888 148% | 2172 87% | 1423 ? 22% | 5592 ? 381% |
| Seq Write (MB/s) | 919 | 1591 73% | 746 -19% | 2374 158% | 2760 200% | 828 ? -10% | 3960 ? 331% |
| 4K Read (MB/s) | 48.88 | 26.79 -45% | 35.42 -28% | 42.95 -12% | 54.6 12% | 51.3 ? 5% | 71.1 ? 45% |
| 4K Write (MB/s) | 90.1 | 105.1 17% | 99.9 11% | 143.6 59% | 145.8 62% | 128.9 ? 43% | 215 ? 139% |
| 4K-64 Read (MB/s) | 323.8 | 583 80% | 302.1 -7% | 1272 293% | 1234 281% | 326 ? 1% | 1623 ? 401% |
| 4K-64 Write (MB/s) | 403.8 | 603 49% | 191.4 -53% | 1546 283% | 2431 502% | 721 ? 79% | 2938 ? 628% |
| Access Time Read * (ms) | 0.24 | 0.128 47% | 0.132 45% | 0.038 84% | 0.09003 ? 62% | 0.06395 ? 73% | |
| Access Time Write * (ms) | 0.046 | 0.043 7% | 0.037 20% | 0.026 43% | 0.07378 ? -60% | 0.03797 ? 17% | |
| Score Read (Points) | 489 | 768 57% | 475 -3% | 1604 228% | 1506 208% | 519 ? 6% | 2253 ? 361% |
| Score Write (Points) | 586 | 867 48% | 366 -38% | 1927 229% | 2853 387% | 932 ? 59% | 3548 ? 505% |
| Score Total (Points) | 1332 | 2033 53% | 1065 -20% | 4329 225% | 5169 288% | 1708 ? 28% | 6881 ? 417% |
| Copy ISO MB/s (MB/s) | 1269 | 1062 -16% | 2728 115% | 1109 ? -13% | 3192 ? 152% | ||
| Copy Program MB/s (MB/s) | 452.8 | 426 -6% | 570 26% | 468 ? 3% | 989 ? 118% | ||
| Copy Game MB/s (MB/s) | 755 | 650 -14% | 1434 90% | 760 ? 1% | 2134 ? 183% |
* ... smaller is better

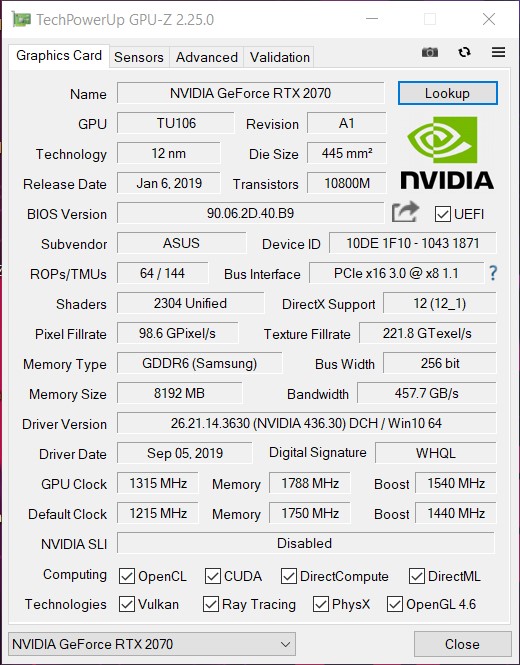
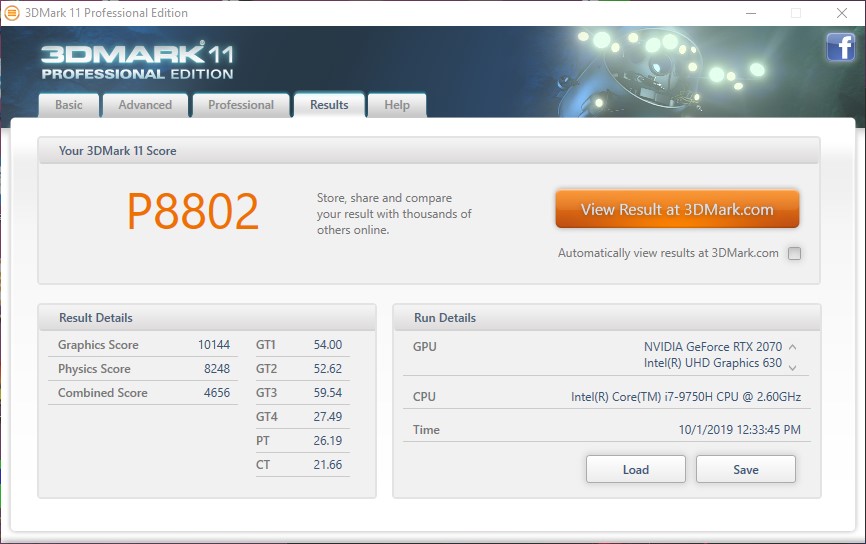
Graphics Card
In a gaming laptop, the CPU and GPU are the key components to enable smooth gaming. The combination of a Core i7-9750H and GeForce RTX 2070 shows that the two work very well together in our test unit. In the synthetic benchmarks, our ROG Strix Scar III is able to place second behind the Origin PC EVO16, which is equipped with the slightly stronger GeForce RTX 2080 Max-Q. However, the biggest surprise was the better result compared to the ROG Strix Scar III with the Core i9 SoC, where the two additional cores are unable to ensure a better performance.
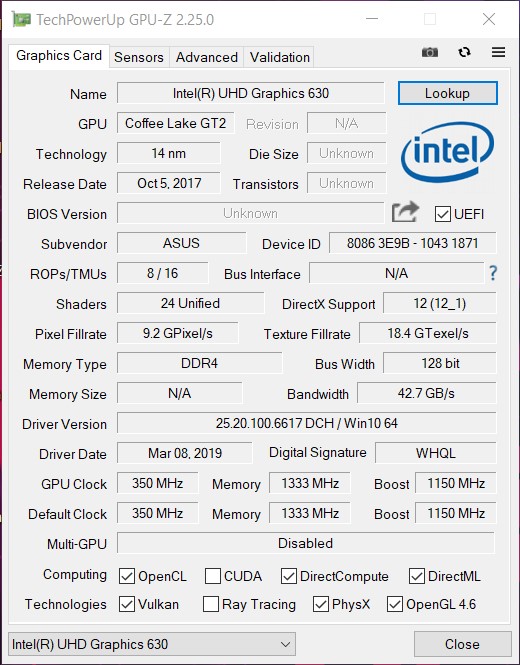
In addition to the dedicated graphics card, the ROG Strix Scar III also offers an energy efficient graphics adapter for 2D operation with the Intel UHD Graphics 620. The switching via Nvidia Optimus works without any problems and without the user noticing anything.
For additional comparisons and benchmarks, we refer to our GPU comparison chart.
| 3DMark 11 Performance | 20072 points | |
| 3DMark Ice Storm Standard Score | 122334 points | |
| 3DMark Cloud Gate Standard Score | 39054 points | |
| 3DMark Fire Strike Score | 17384 points | |
| 3DMark Fire Strike Extreme Score | 8991 points | |
| 3DMark Time Spy Score | 7568 points | |
Help | ||
Gaming Performance
During the gaming tests, the Asus ROG Strix Scar III has no trouble in delivering smoothly playable frame rates to the screen. Even "Metro Exodus" is still very well playable in the Ultra Preset at 53 frames per second.
As with the Cinebench-R15 multi-loop, we use our "The Witcher 3" load test to evaluate whether there is a performance drop during gaming. There is no noticeable drop in performance in our test unit. At an average of 60 frames per second ("The Witcher 3" Ultra Preset), smooth gaming pleasure is possible even in long-lasting gaming sessions.
| The Witcher 3 - 1920x1080 Ultra Graphics & Postprocessing (HBAO+) | |
| Average of class Gaming (104.7 - 240, n=7, last 2 years) | |
| Origin PC EVO16-S i7-9750H RTX 2080 Max-Q | |
| Average NVIDIA GeForce RTX 2070 Mobile (64 - 82.1, n=21) | |
| Asus Strix Scar III G531GW-AZ062T | |
| Asus Strix Scar III G531GW | |
| Acer Predator Triton 500 PT515-51-71PZ | |
| Lenovo Legion Y740-15ICHg | |
| low | med. | high | ultra | |
|---|---|---|---|---|
| The Witcher 3 (2015) | 258 | 208 | 130 | 72 |
| Dota 2 Reborn (2015) | 137.3 | 127.2 | 104.1 | 98.4 |
| X-Plane 11.11 (2018) | 103 | 85 | 76 | |
| Shadow of the Tomb Raider (2018) | 111 | 92 | 90 | 80 |
| Metro Exodus (2019) | 98 | 87 | 66 | 53.3 |
| Control (2019) | 180 | 93 | 68 |
Emissions - The noise cannot be ignored
In the last few years, we have seen again and again that a powerful gaming device cannot be silent. This is also the case with the Asus ROG Strix Scar III. However, compared to the Core i9 version, our current i7 model is minimally quieter and the case temperatures also remain lower. We were able to see a huge difference in the power consumption. Our test unit now uses 69 percent less power than the more expensive Core-i9 device. The biggest difference can be seen during idle operation. Asus appears to have made some significant improvements here.
Noise Emissions
Noise level
| Idle |
| 30.6 / 30.6 / 37.7 dB(A) |
| Load |
| 36.5 / 48.1 dB(A) |
 | ||
30 dB silent 40 dB(A) audible 50 dB(A) loud |
||
min: | ||
| Asus Strix Scar III G531GW-AZ062T GeForce RTX 2070 Mobile, i7-9750H, Intel SSD 660p SSDPEKNW512G8 | Asus Strix Scar III G531GW GeForce RTX 2070 Mobile, i9-9880H, Intel SSD 660p 1TB SSDPEKNW010T8 | Lenovo Legion Y740-15ICHg GeForce RTX 2070 Max-Q, i7-9750H, WDC PC SN520 SDAPMUW-128G | Acer Predator Triton 500 PT515-51-71PZ GeForce RTX 2070 Max-Q, i7-9750H, WDC PC SN720 SDAPNTW-512G | Origin PC EVO16-S i7-9750H RTX 2080 Max-Q GeForce RTX 2080 Max-Q, i7-9750H, Samsung SSD 970 EVO Plus 500GB | |
|---|---|---|---|---|---|
| Noise | -12% | 3% | -5% | -5% | |
| off / environment * (dB) | 30 | 29 3% | 30 -0% | 30 -0% | 28.5 5% |
| Idle Minimum * (dB) | 30.6 | 30 2% | 31.3 -2% | 30 2% | 30.4 1% |
| Idle Average * (dB) | 30.6 | 37 -21% | 31.3 -2% | 33 -8% | 30.4 1% |
| Idle Maximum * (dB) | 37.7 | 39 -3% | 31.3 17% | 39 -3% | 31.5 16% |
| Load Average * (dB) | 36.5 | 54 -48% | 42 -15% | 45 -23% | 50 -37% |
| Witcher 3 ultra * (dB) | 52.1 | 54 -4% | 42.1 19% | 49 6% | 55.3 -6% |
| Load Maximum * (dB) | 48.1 | 54 -12% | 46.5 3% | 51 -6% | 55.5 -15% |
* ... smaller is better
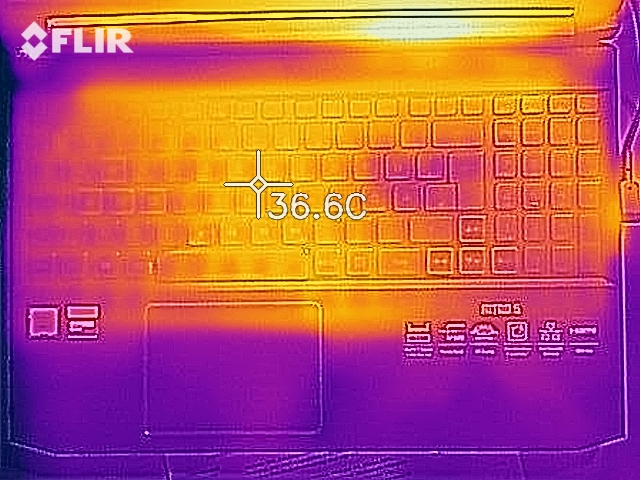
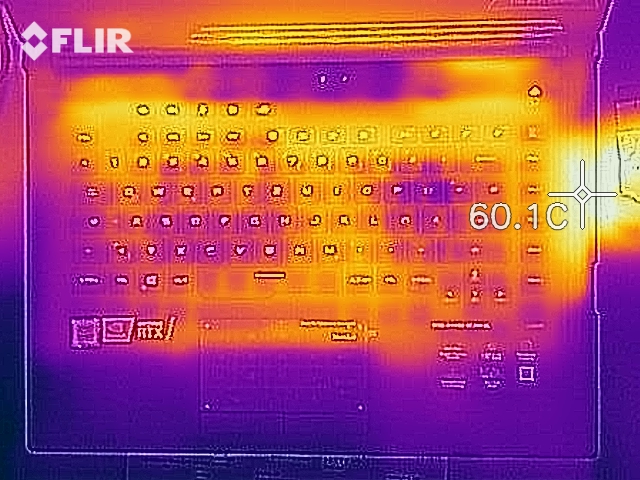
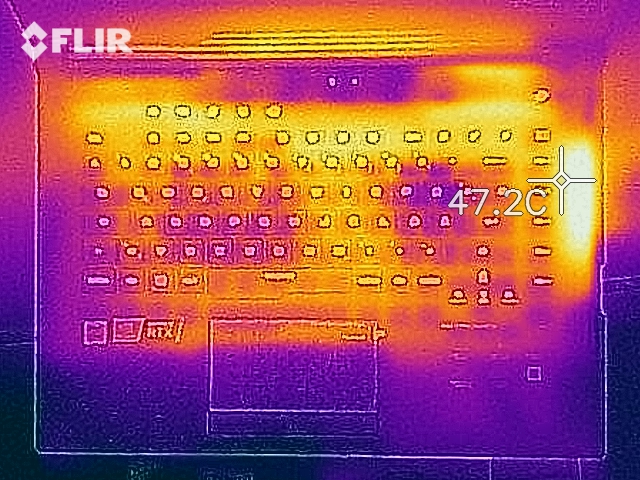
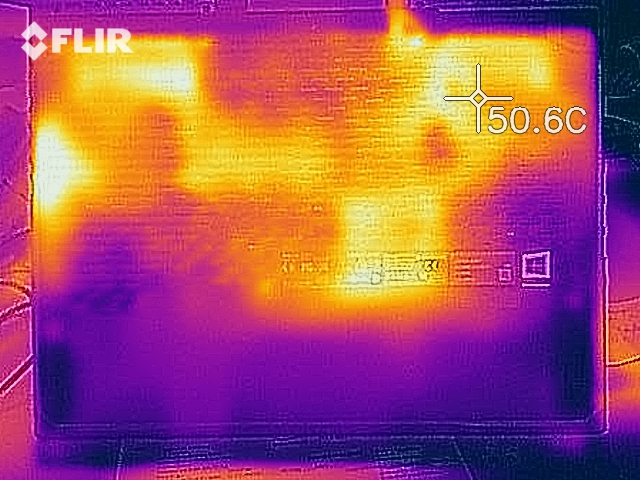
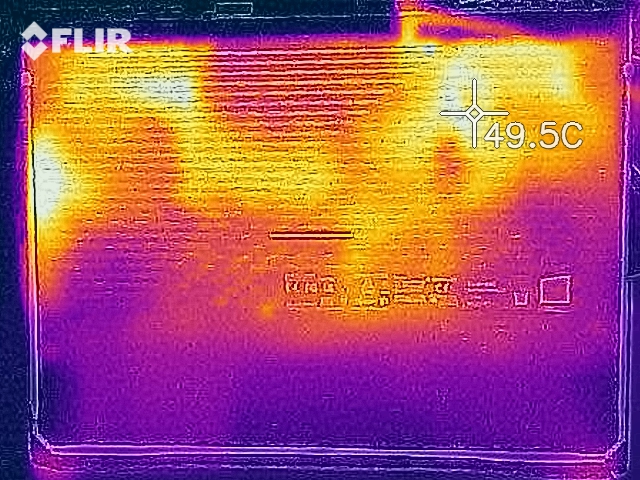
Temperature
(-) The maximum temperature on the upper side is 45.6 °C / 114 F, compared to the average of 40.4 °C / 105 F, ranging from 21.2 to 68.8 °C for the class Gaming.
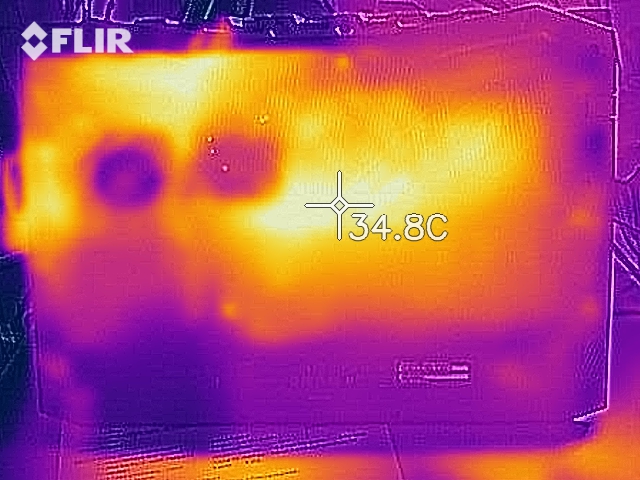
(-) The bottom heats up to a maximum of 55.5 °C / 132 F, compared to the average of 43.2 °C / 110 F
(+) In idle usage, the average temperature for the upper side is 29.8 °C / 86 F, compared to the device average of 33.9 °C / 93 F.
(±) Playing The Witcher 3, the average temperature for the upper side is 32.8 °C / 91 F, compared to the device average of 33.9 °C / 93 F.
(+) The palmrests and touchpad are cooler than skin temperature with a maximum of 29 °C / 84.2 F and are therefore cool to the touch.
(±) The average temperature of the palmrest area of similar devices was 28.8 °C / 83.8 F (-0.2 °C / -0.4 F).
Speakers
Asus Strix Scar III G531GW-AZ062T audio analysis
(-) | not very loud speakers (68.3 dB)
Bass 100 - 315 Hz
(±) | reduced bass - on average 9.9% lower than median
(±) | linearity of bass is average (13.2% delta to prev. frequency)
Mids 400 - 2000 Hz
(+) | balanced mids - only 2.6% away from median
(+) | mids are linear (3.5% delta to prev. frequency)
Highs 2 - 16 kHz
(+) | balanced highs - only 2.2% away from median
(+) | highs are linear (4.6% delta to prev. frequency)
Overall 100 - 16.000 Hz
(+) | overall sound is linear (13.6% difference to median)
Compared to same class
» 20% of all tested devices in this class were better, 7% similar, 73% worse
» The best had a delta of 6%, average was 18%, worst was 132%
Compared to all devices tested
» 15% of all tested devices were better, 4% similar, 81% worse
» The best had a delta of 4%, average was 23%, worst was 134%
Acer Predator Triton 500 PT515-51-71PZ audio analysis
(±) | speaker loudness is average but good (80 dB)
Bass 100 - 315 Hz
(±) | reduced bass - on average 12.2% lower than median
(±) | linearity of bass is average (12.6% delta to prev. frequency)
Mids 400 - 2000 Hz
(+) | balanced mids - only 4.5% away from median
(+) | mids are linear (4.7% delta to prev. frequency)
Highs 2 - 16 kHz
(+) | balanced highs - only 2.2% away from median
(+) | highs are linear (3.2% delta to prev. frequency)
Overall 100 - 16.000 Hz
(+) | overall sound is linear (14.8% difference to median)
Compared to same class
» 29% of all tested devices in this class were better, 7% similar, 63% worse
» The best had a delta of 6%, average was 18%, worst was 132%
Compared to all devices tested
» 20% of all tested devices were better, 4% similar, 76% worse
» The best had a delta of 4%, average was 23%, worst was 134%
Power Consumption
| Off / Standby | |
| Idle | |
| Load |
|
Key:
min: | |
| Asus Strix Scar III G531GW-AZ062T i7-9750H, GeForce RTX 2070 Mobile, Intel SSD 660p SSDPEKNW512G8, IPS, 1920x1080, 15.6" | Asus Strix Scar III G531GW i9-9880H, GeForce RTX 2070 Mobile, Intel SSD 660p 1TB SSDPEKNW010T8, IPS, 1920x1080, 15.6" | Lenovo Legion Y740-15ICHg i7-9750H, GeForce RTX 2070 Max-Q, WDC PC SN520 SDAPMUW-128G, IPS, 1920x1080, 15.6" | Acer Predator Triton 500 PT515-51-71PZ i7-9750H, GeForce RTX 2070 Max-Q, WDC PC SN720 SDAPNTW-512G, IPS, 1920x1080, 15.6" | Origin PC EVO16-S i7-9750H RTX 2080 Max-Q i7-9750H, GeForce RTX 2080 Max-Q, Samsung SSD 970 EVO Plus 500GB, IPS, 1920x1080, 16.1" | |
|---|---|---|---|---|---|
| Power Consumption | -69% | -31% | 17% | 12% | |
| Idle Minimum * (Watt) | 11.4 | 29 -154% | 22.2 -95% | 7 39% | 7.5 34% |
| Idle Average * (Watt) | 13.5 | 32 -137% | 24.9 -84% | 12 11% | 11.6 14% |
| Idle Maximum * (Watt) | 21.6 | 37 -71% | 30.6 -42% | 22 -2% | 21 3% |
| Load Average * (Watt) | 106 | 157 -48% | 101 5% | 86 19% | 91.3 14% |
| Witcher 3 ultra * (Watt) | 186 | 173 7% | 143 23% | 144 23% | 165.1 11% |
| Load Maximum * (Watt) | 196 | 217 -11% | 186 5% | 177 10% | 208.9 -7% |
* ... smaller is better
Battery Life
Pros
Cons
Verdict - Some cool features make this an interesting device
The Asus ROG Strix Scar III was able to achieve a solid result in the test. The combination of the Intel Core i7-9750H and Nvidia GeForce RTX 2070 works very well, and all the current games can be played without any problems. Many games can even be enjoyed in UHD or WQHD, but you will need an external display to do that, since the ROG Strix Scar III is only available with an FHD panel. However, we should mention that this is not just any display, since at 240 Hz, the screen is suited for fast shooters.
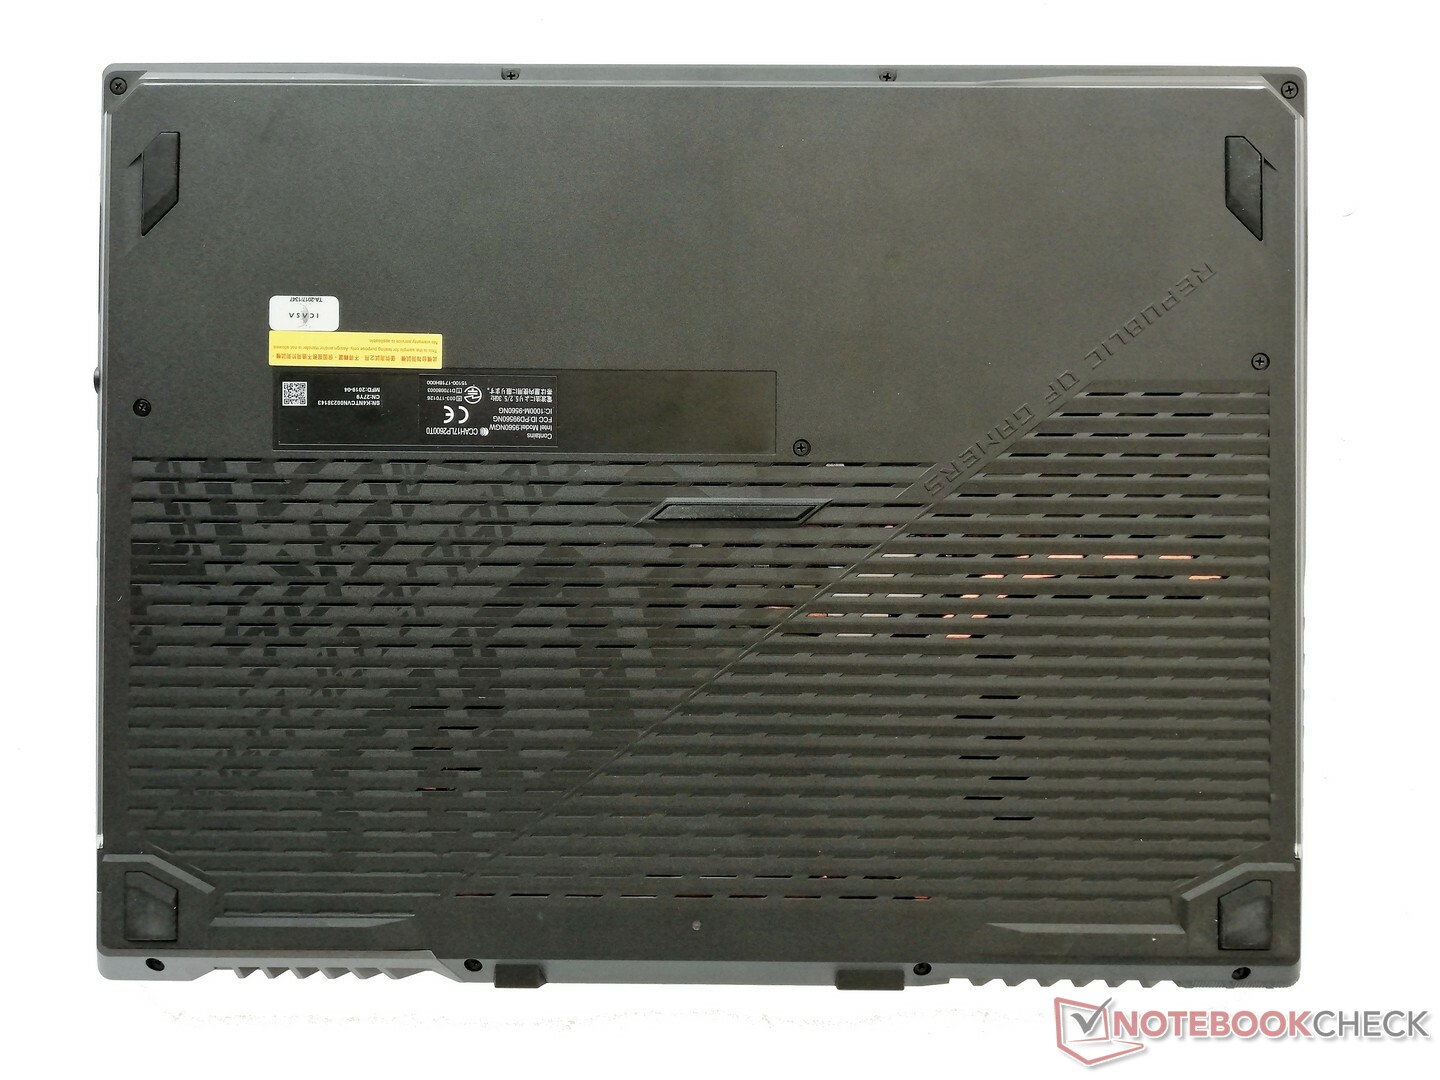
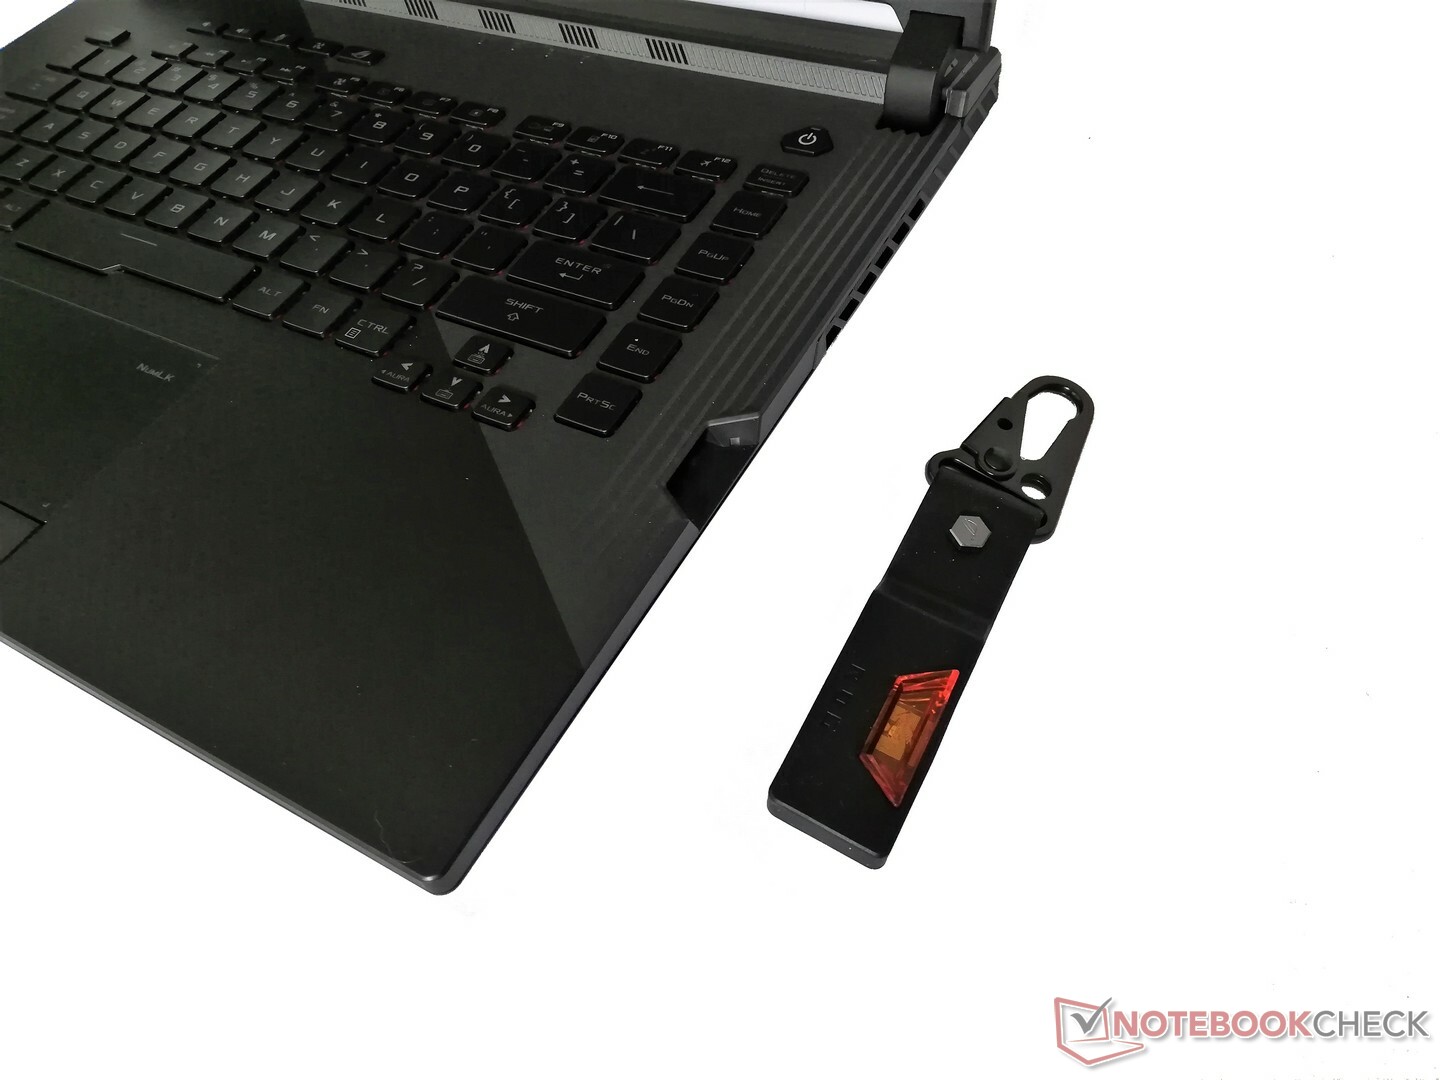
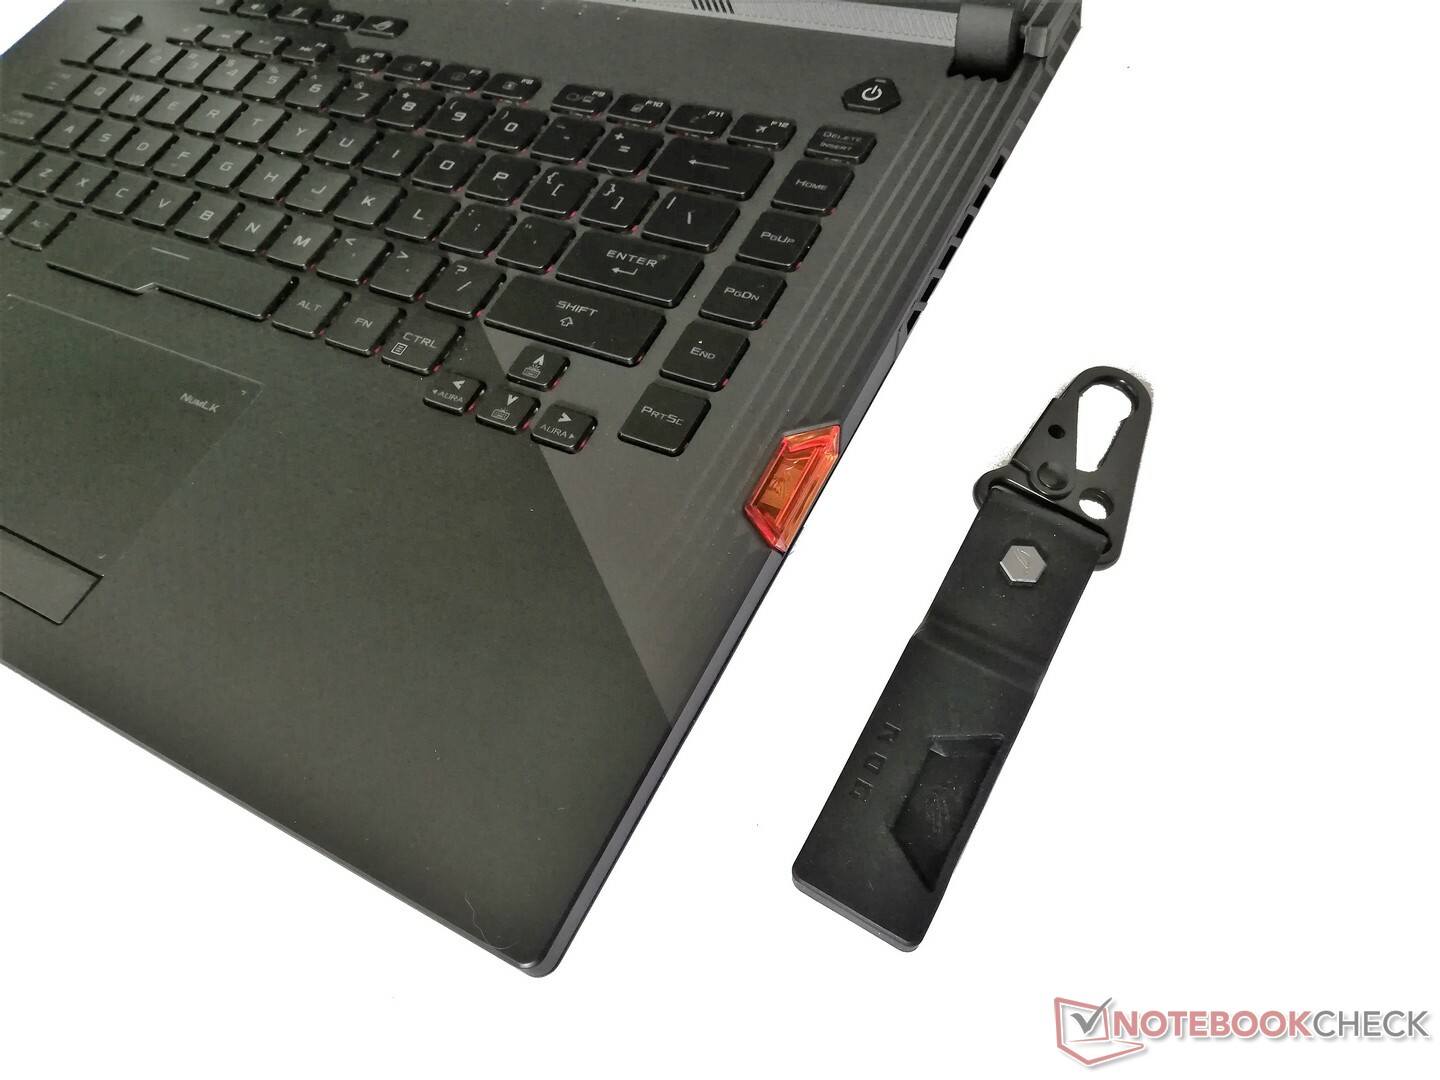
Offering good maintenance options, the device can be upgraded easily in terms of the RAM, SSD, or HDD. With good features such as Stonekey and a number block that can be displayed on the touchpad, Asus scores some additional positive points.
The Asus ROG Strix Scar III convinces with a good performance, and the RGB illumination attracts many eyes. However, under load the device is more suited for users who do not mind noise.
Overall, the Asus ROG Strix Scar III with the Intel Core i7 offers a similarly good and in parts even better performance than the similar model based on the Core i9. Currently, many games do not benefit from 8 cores, so that the 6-core laptop can be the better alternative in some circumstances. In addition, our test model is slightly quieter under load, even if it still does not win any prizes in this regard. The device is still very loud under load.
Asus Strix Scar III G531GW-AZ062T
- 05/14/2020 v7 (old)
Sebastian Bade
Price comparison

